
Articles | Volume 15, issue 24
https://doi.org/10.5194/gmd-15-9015-2022
© Author(s) 2022. This work is distributed under
the Creative Commons Attribution 4.0 License.
the Creative Commons Attribution 4.0 License.
https://doi.org/10.5194/gmd-15-9015-2022
© Author(s) 2022. This work is distributed under
the Creative Commons Attribution 4.0 License.
the Creative Commons Attribution 4.0 License.
Model description paper
| 
16 Dec 2022
Model description paper |
| 16 Dec 2022
| 16 Dec 2022
Predicting peak daily maximum 8 h ozone and linkages to emissions and meteorology in Southern California using machine learning methods (SoCAB-8HR V1.0)
Ziqi Gao
CORRESPONDING AUTHOR
School of Civil and Environmental Engineering, Georgia Institute of
Technology, Atlanta, GA 30332, USA
Yifeng Wang
School of Civil and Environmental Engineering, Georgia Institute of
Technology, Atlanta, GA 30332, USA
Petros Vasilakos
School of Civil and Environmental Engineering, Georgia Institute of
Technology, Atlanta, GA 30332, USA
Cesunica E. Ivey
Department of Chemical and Environmental Engineering, University of
California, Riverside, Riverside, CA 92521, USA
now at: Department of Civil and Environmental Engineering,
University of California, Berkeley, Berkeley, CA 94720, USA
Khanh Do
Department of Chemical and Environmental Engineering, University of
California, Riverside, Riverside, CA 92521, USA
Center for Environmental Research and Technology, University of
California, Riverside, Riverside, CA 92521,
USA
Armistead G. Russell
School of Civil and Environmental Engineering, Georgia Institute of
Technology, Atlanta, GA 30332, USA
Related authors
No articles found.
T. Nash Skipper, Christian Hogrefe, Barron H. Henderson, Rohit Mathur, Kristen M. Foley, and Armistead G. Russell
Geosci. Model Dev., 17, 8373–8397, https://doi.org/10.5194/gmd-17-8373-2024, https://doi.org/10.5194/gmd-17-8373-2024, 2024
Short summary
Short summary
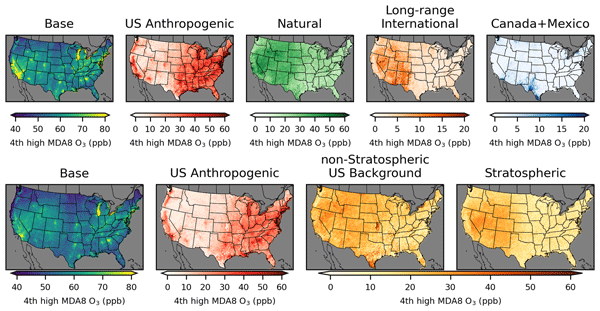
Chemical transport model simulations are combined with ozone observations to estimate the bias in ozone attributable to US anthropogenic sources and individual sources of US background ozone: natural sources, non-US anthropogenic sources, and stratospheric ozone. Results indicate a positive bias correlated with US anthropogenic emissions during summer in the eastern US and a negative bias correlated with stratospheric ozone during spring.
Cited articles
Agarwal, R. and Sen, S.: Creators of Mathematical and Computational
Sciences, https://doi.org/10.1007/978-3-319-10870-4, 2014.
Ainsworth, E. A., Yendrek, C. R., Sitch, S., Collins, W. J., and Emberson,
L. D.: The Effects of Tropospheric Ozone on Net Primary Productivity and
Implications for Climate Change, Annu. Rev. Plant Biol., 63,
637–661, https://doi.org/10.1146/annurev-arplant-042110-103829, 2012.
Aldrin, M. and Haff, I.: Generalised additive modelling of air pollution,
traffic volume and meteorology, Atmos. Environ., 39, 2145–2155,
https://doi.org/10.1016/j.atmosenv.2004.12.020, 2005.
Alduchov, O. A. and Eskridge, R. E.: Improved Magnus Form Approximation of
Saturation Vapor Pressure, J. Appl. Meteorol., 35, 601–609,
https://doi.org/10.1175/1520-0450(1996)035<0601:imfaos>2.0.co;2, 1996.
Aw, J. and Kleeman, M. J.: Evaluating the first-order effect of intraannual
temperature variability on urban air pollution, J. Geophys.
Res., 108, 4365, https://doi.org/10.1029/2002jd002688, 2003.
Banta, J. E.: Sir William Petty: Modern epidemiologist (1623–1687), J. Commun. He., 12, 185–198, https://doi.org/10.1007/bf01323480, 1987.
Benirschke, K.: Francis Galton: Pioneer of Heredity and Biometry, J.
Heredity, 95, 273–273, https://doi.org/10.1093/jhered/esh039, 2004.
Blanchard, C. L., Hidy, G. M., and Tanenbaum, S.: Ozone in the southeastern
United States: An observation-based model using measurements from the SEARCH
network, Atmos. Environ., 88, 192–200, https://doi.org/10.1016/j.atmosenv.2014.02.006, 2014.
Blanchard, C. L., Shaw, S. L., Edgerton, E. S., and Schwab, J. J.: Emission
influences on air pollutant concentrations in New York State: I. ozone,
Atmos. Environ. X, 3, 100033, https://doi.org/10.1016/j.aeaoa.2019.100033, 2019.
Camalier, L., Cox, W., and Dolwick, P.: The effects of meteorology on ozone
in urban areas and their use in assessing ozone trends, Atmos.
Environ., 41, 7127–7137, https://doi.org/10.1016/j.atmosenv.2007.04.061, 2007.
CARB: Air Quality and Meteorological Information System (AQMIS), https://www.arb.ca.gov/aqmis2/aqdselect.php,
last access: 27 May 2020.
Chang, C.-C. and Lin, C.-J.: LIBSVM, ACM Transactions on Intelligent Systems
and Technology, 2, 1–27, https://doi.org/10.1145/1961189.1961199, 2011.
Cox, P., Delao, A., Komorniczak, A., and Weller, R.: The California Almanac of Emissions and Air Quality – 2009 edition, Planning and Technical Support Division California Air Resources Board,
2009.
Cox, P., Delao, A., and Komorniczak, A.: The California Almanac of Emissions and Air Quality – 2013 edition, Air Quality Planning and Science Division California Air Resources Board,
2013.
Drucker, H., Burges, C. J. C., Kaufman, L., Smola, A., and Vapnik, V.:
Support vector regression machines, Proceedings of the 9th International
Conference on Neural Information Processing Systems, Denver, Colorado, 1996.
Fan, R.-E., Chen, P.-H., and Lin, C.-J.: Working Set Selection Using Second
Order Information for Training Support Vector Machines, J. Mach. Learn.
Res., 6, 1889–1918, 2005.
Fisher, R. A.: On the mathematical foundations of theoretical statistics,
Philos. T. Roy. Soc. Lond. A, 222, 309–368,
https://doi.org/10.1098/rsta.1922.0009, 1922.
Flynn, M. T., Mattson, E. J., Jaffe, D. A., and Gratz, L. E.: Spatial
patterns in summertime surface ozone in the Southern Front Range of the U.S.
Rocky Mountains, Elementa: Science of the Anthropocene, 9, 00104,
https://doi.org/10.1525/elementa.2020.00104, 2021.
Friedman, J. H.: Multivariate Adaptive Regression Splines, Ann.
Stat., 19, 1–67, https://doi.org/10.1214/aos/1176347963, 1991.
Friedman, J. H. and Silverman, B. W.: Flexible Parsimonious Smoothing and
Additive Modeling, Technometrics, 31, 3–21, https://doi.org/10.2307/1270359, 1989.
Galton, F.: Co-Relations and Their Measurement, Chiefly from Anthropometric
Data, P. Roy. Soc. Lond., 45, 135–145, 1888.
Galton, F. S.: Natural inheritance, Macmillan, London, https://doi.org/10.5962/bhl.title.32181, 1889.
Gao, Z.: Predicting peak daily maximum 8-hour ozone, and linkages to emissions and meteorology, in Southern California using machine learning methods, Zenodo [code], https://doi.org/10.5281/zenodo.6892066, 2022a.
Gao, Z.: Predicting peak daily maximum 8-hour ozone, and linkages to emissions and meteorology, in Southern California using machine learning methods, Zenodo [data set], https://doi.org/10.5281/zenodo.6892062, 2022b.
Gao, Z., Ivey, C. E., Blanchard, C. L., Do, K., Lee, S.-M., and Russell, A.
G.: Separating emissions and meteorological impacts on peak ozone
concentrations in Southern California using generalized additive modeling,
Environ. Pollut., 307, 119503, https://doi.org/10.1016/j.envpol.2022.119503, 2022.
García Nieto, P. J. and Álvarez Antón, J. C.: Nonlinear air
quality modeling using multivariate adaptive regression splines in Gijón
urban area (Northern Spain) at local scale, Appl. Math.
Comput., 235, 50–65, https://doi.org/10.1016/j.amc.2014.02.096, 2014.
Gong, X., Kaulfus, A., Nair, U., and Jaffe, D. A.: Quantifying O3 Impacts in
Urban Areas Due to Wildfires Using a Generalized Additive Model,
Environ. Sci. Technol., 51, 13216–13223,
https://doi.org/10.1021/acs.est.7b03130, 2017.
Gong, X., Hong, S., and Jaffe, D. A.: Ozone in China: Spatial Distribution
and Leading Meteorological Factors Controlling O3 in 16 Chinese Cities,
Aerosol Air Qual. Res., 18, 2287–2300, https://doi.org/10.4209/aaqr.2017.10.0368,
2018.
Gorai, A. K., Tuluri, F., Tchounwou, P. B., and Ambinakudige, S.: Influence
of local meteorology and NO2 conditions on ground-level ozone concentrations
in the eastern part of Texas, USA, Air Quality, Atmos. He., 8,
81–96, https://doi.org/10.1007/s11869-014-0276-5, 2015.
Harrell, F. E.: General Aspects of Fitting Regression Models, Springer
International Publishing, 13–44, https://doi.org/10.1007/978-3-319-19425-7_2,
2015.
Hastie, T.: Generalized additive models, Chapter 7, in: Statistical Models in S, edited by: Chambers, J. M. and Hastie,
T. J., Wadsworth & Brooks/Cole, 1991.
Hastie, T. and Tibshirani, R.: Generalized Additive Models, Stat.
Sci., 1, 297–310, https://doi.org/10.1214/ss/1177013604, 1986.
Hastie, T. and Tibshirani, R.: Generalized additive models, Chapman &
Hall/CRC, London, 1990.
Hastie, T. and Tibshirani, R.: Discriminant Analysis by Gaussian Mixtures,
J. Roy. Stat. Soc. B, 58,
155–176, 1996.
Hastie, T., Tibshirani, R., and Friedman, J. H.: The elements of statistical
learning: data mining, inference, and prediction, 2nd edn.,
Springer, New York, 2009.
Henneman, L. R. F., Holmes, H. A., Mulholland, J. A., and Russell, A. G.:
Meteorological detrending of primary and secondary pollutant concentrations:
Method application and evaluation using long-term (2000–2012) data in
Atlanta, Atmos. Environ., 119, 201–210, https://doi.org/10.1016/j.atmosenv.2015.08.007, 2015.
Hogrefe, C., Rao, S. T., Zurbenko, I. G., and Porter, P. S.: Interpreting
the Information in Ozone Observations and Model Predictions Relevant to
Regulatory Policies in the Eastern United States, B. Am.
Meteorol. Soc., 81, 2083–2106, https://doi.org/10.1175/1520-0477(2000)081<2083:itiioo>2.3.co;2, 2000.
Hong, C., Mueller, N. D., Burney, J. A., Zhang, Y., AghaKouchak, A., Moore,
F. C., Qin, Y., Tong, D., and Davis, S. J.: Impacts of ozone and climate
change on yields of perennial crops in California, Nature Food, 1, 166–172,
https://doi.org/10.1038/s43016-020-0043-8, 2020.
Hu, C., Kang, P., Jaffe, D. A., Li, C., Zhang, X., Wu, K., and Zhou, M.:
Understanding the impact of meteorology on ozone in 334 cities of China,
Atmos. Environ., 248, 118221, https://doi.org/10.1016/j.atmosenv.2021.118221, 2021.
Huang, X. G., Shao, T. J., Zhao, J. B., Cao, J. J., and Lü, X. H.:
Influencing Factors of Ozone Concentration in Xi'an Based on Generalized
Additive Models, Huan Jing Ke Xue, 41, 1535–1543,
https://doi.org/10.13227/j.hjkx.201906067, 2020.
Jeong, Y., Lee, H. W., and Jeon, W.: Regional Differences of Primary
Meteorological Factors Impacting O3 Variability in South Korea, Atmosphere,
11, 74, https://doi.org/10.3390/atmos11010074, 2020.
Jin, L., Loisy, A., and Brown, N. J.: Role of meteorological processes in
ozone responses to emission controls in California's San Joaquin Valley,
J. Geophys. Res.-Atmos., 118, 8010–8022,
https://doi.org/10.1002/jgrd.50559, 2013.
Keller, C. A. and Evans, M. J.: Application of random forest regression to the calculation of gas-phase chemistry within the GEOS-Chem chemistry model v10, Geosci. Model Dev., 12, 1209–1225, https://doi.org/10.5194/gmd-12-1209-2019, 2019.
Kelley, M. C., Brown, M. M., Fedler, C. B., and Ardon-Dryer, K.: Long Term
Measurements of PM2.5 Concentrations in Lubbock, Texas, Aerosol Air
Qual. Res., 20, 1306–1318, https://doi.org/10.4209/aaqr.2019.09.0469, 2020.
Kleeman, M. J.: A preliminary assessment of the sensitivity of air quality
in California to global change, Clim. Change, 87, 273–292,
https://doi.org/10.1007/s10584-007-9351-3, 2008.
Lawrence, M. G.: The Relationship between Relative Humidity and the Dewpoint
Temperature in Moist Air: A Simple Conversion and Applications, B.
Am. Meteorol. Soc., 86, 225–234, https://doi.org/10.1175/BAMS-86-2-225,
2005.
Leathwick, J. R., Elith, J., and Hastie, T.: Comparative performance of
generalized additive models and multivariate adaptive regression splines for
statistical modelling of species distributions, Ecol. Model., 199,
188–196, https://doi.org/10.1016/j.ecolmodel.2006.05.022, 2006.
Liaw, A. and Wiener, M.: Classification and Regression by randomForest, R
News, 2, 18–22, 2002.
Ling, Z. H., Guo, H., Zheng, J. Y., Louie, P. K. K., Cheng, H. R., Jiang,
F., Cheung, K., Wong, L. C., and Feng, X. Q.: Establishing a conceptual
model for photochemical ozone pollution in subtropical Hong Kong,
Atmos. Environ., 76, 208–220, https://doi.org/10.1016/j.atmosenv.2012.09.051, 2013.
Liu, B.-C., Binaykia, A., Chang, P.-C., Tiwari, M. K., and Tsao, C.-C.:
Urban air quality forecasting based on multi-dimensional collaborative
Support Vector Regression (SVR): A case study of
Beijing-Tianjin-Shijiazhuang, PLOS ONE, 12, e0179763,
https://doi.org/10.1371/journal.pone.0179763, 2017.
Liu, T., Li, T. T., Zhang, Y. H., Xu, Y. J., Lao, X. Q., Rutherford, S.,
Chu, C., Luo, Y., Zhu, Q., Xu, X. J., Xie, H. Y., Liu, Z. R., and Ma, W. J.:
The short-term effect of ambient ozone on mortality is modified by
temperature in Guangzhou, China, Atmos. Environ., 76, 59–67,
https://doi.org/10.1016/j.atmosenv.2012.07.011, 2013.
Lu, R. and Turco, R. P.: Ozone distributions over the los angeles basin:
Three-dimensional simulations with the smog model, Atmos. Environ.,
30, 4155–4176, https://doi.org/10.1016/1352-2310(96)00153-7, 1996.
Lu, X., Zhang, L., and Shen, L.: Meteorology and Climate Influences on
Tropospheric Ozone: a Review of Natural Sources, Chemistry, and Transport
Patterns, Current Pollut. Rep., 5, 238–260, https://doi.org/10.1007/s40726-019-00118-3, 2019.
Luna, A. S., Paredes, M. L. L., De Oliveira, G. C. G., and Corrêa, S.
M.: Prediction of ozone concentration in tropospheric levels using
artificial neural networks and support vector machine at Rio de Janeiro,
Brazil, Atmos. Environ., 98, 98–104, https://doi.org/10.1016/j.atmosenv.2014.08.060,
2014.
Ma, Y., Ma, B., Jiao, H., Zhang, Y., Xin, J., and Yu, Z.: An analysis of the
effects of weather and air pollution on tropospheric ozone using a
generalized additive model in Western China: Lanzhou, Gansu, Atmos.
Environ., 224, 117342, https://doi.org/10.1016/j.atmosenv.2020.117342, 2020.
Mahmud, A., Hixson, M., Hu, J., Zhao, Z., Chen, S.-H., and Kleeman, M. J.: Climate impact on airborne particulate matter concentrations in California using seven year analysis periods, Atmos. Chem. Phys., 10, 11097–11114, https://doi.org/10.5194/acp-10-11097-2010, 2010.
McClure, C. D. and Jaffe, D. A.: Investigation of high ozone events due to
wildfire smoke in an urban area, Atmos. Environ., 194, 146–157,
https://doi.org/10.1016/j.atmosenv.2018.09.021, 2018.
McGlynn, D., Mao, H., Sive, B., and Sharac, T.: Understanding Long-Term
Variations in Surface Ozone in United States (U.S.) National Parks,
Atmosphere, 9, 125, https://doi.org/10.3390/atmos9040125, 2018.
Menne, M. J., Durre, I., Korzeniewski, B., McNeal, S., Thomas, K., Yin, X.,
Anthony, S., Ray, R., Vose, R. S., Gleason, B. E., and Houston, T. G.:
Global Historical Climatology Network - Daily (GHCN-Daily), Version 3,
https://doi.org/10.7289/V5D21VHZ, 2012a.
Menne, M. J., Durre, I., Vose, R. S., Gleason, B. E., and Houston, T. G.: An
Overview of the Global Historical Climatology Network-Daily Database,
J. Atmos. Ocean. Tech., 29, 897–910,
https://doi.org/10.1175/jtech-d-11-00103.1, 2012b.
Milborrow, S.: Regression Splines,
FIM Forecast Model: 500 mb Wind Speed and 500 mb Height Contours – Real-time:
https://CRAN.R-project.org/package=earth (last access: 13 November 2021),
R program [code], 2021.
NOAA: FIM Forecast Model: 500 mb Wind Speed and 500 mb Height Contours – Real-time, https://sos.noaa.gov/datasets/fim-forecast-model-500mb-wind-speed-and-500mb-height-contours-real-time/ (last access: 23 May 2021), 2020.
Oduro, S. D., Metia, S., Duc, H., Hong, G., and Ha, Q. P.: Multivariate
adaptive regression splines models for vehicular emission prediction,
Visualization in Engineering, 3, 13, https://doi.org/10.1186/s40327-015-0024-4, 2015.
Oman, L. D., Ziemke, J. R., Douglass, A. R., Waugh, D. W., Lang, C.,
Rodriguez, J. M., and Nielsen, J. E.: The response of tropical tropospheric
ozone to ENSO, Geophys. Res. Lett., 38, 13706, https://doi.org/10.1029/2011GL047865, 2011.
Oman, L. D., Douglass, A. R., Ziemke, J. R., Rodriguez, J. M., Waugh, D. W.,
and Nielsen, J. E.: The ozone response to ENSO in Aura satellite
measurements and a chemistry-climate simulation, J. Geophys. Res.-Atmos., 118, 965–976,
https://doi.org/10.1029/2012jd018546, 2013.
Pearce, J. L., Beringer, J., Nicholls, N., Hyndman, R. J., and Tapper, N.
J.: Quantifying the influence of local meteorology on air quality using
generalized additive models, Atmos. Environ., 45, 1328–1336,
https://doi.org/10.1016/j.atmosenv.2010.11.051, 2011.
Pernak, R., Alvarado, M., Lonsdale, C., Mountain, M., Hegarty, J., and
Nehrkorn, T.: Forecasting Surface O3 in Texas Urban Areas Using Random
Forest and Generalized Additive Models, Aerosol Air Qual. Res., 9,
2815–2826, https://doi.org/10.4209/aaqr.2018.12.0464, 2019.
Pope, P. T. and Webster, J. T.: The Use of an F-Statistic in Stepwise
Regression Procedures, Technometrics, 14, 327–340, 1972.
Porter, T. M.: Social Interests and Statistical Theory: Statistics in
Britain, 1865–1930, Science, 214, 784–784,
https://doi.org/10.1126/science.214.4522.784.a, 1981.
Porter, T. M.: Trust in Numbers, Princeton University Press, ISBN 9780691208411, 1995.
Rao, S. T., Zurbenko, I. G., Neagu, R., Porter, P. S., Ku, J. Y., and Henry,
R. F.: Space and Time Scales in Ambient Ozone Data, B. Am.
Meteorol. Soc., 78, 2153–2166, https://doi.org/10.1175/1520-0477(1997)078<2153:satsia>2.0.co;2, 1997.
Rodríguez-Pérez, R., Vogt, M., and Bajorath, J.: Support Vector
Machine Classification and Regression Prioritize Different Structural
Features for Binary Compound Activity and Potency Value Prediction, ACS
Omega, 2, 6371–6379, https://doi.org/10.1021/acsomega.7b01079, 2017.
Roy, S. S., Pratyush, C., and Barna, C.: Predicting Ozone Layer
Concentration Using Multivariate Adaptive Regression Splines, Random Forest
and Classification and Regression Tree, Springer International
Publishing, 140–152, https://doi.org/10.1007/978-3-319-62524-9_11, 2018.
Rybarczyk, Y. and Zalakeviciute, R.: Machine Learning Approaches for Outdoor
Air Quality Modelling: A Systematic Review, Appl. Sci., 8, 2570,
https://doi.org/10.3390/app8122570, 2018.
Schölkopf, B. and Smola, A. J.: Learning with Kernels: Support Vector
Machines, Regularization, Optimization, and Beyond, MIT Press, ISBN 9780262536578, 2001.
Seinfeld, J. H. and Pandis, S. N.: Atmospheric Chemistry and Physics: From
Air Pollution to Climate Change, Wiley, ISBN 978-1-118-94740-1, 2016.
Smola, A. J. and Schölkopf, B.: A tutorial on support vector regression,
Stat. Comput., 14, 199–222, https://doi.org/10.1023/b:stco.0000035301.49549.88,
2004.
Sotomayor-Olmedo, A., Aceves-Fernández, M. A., Gorrostieta-Hurtado, E.,
Pedraza-Ortega, C., Ramos-Arreguín, J. M., and Vargas-Soto, J. E.:
Forecast Urban Air Pollution in Mexico City by Using Support Vector
Machines: A Kernel Performance Approach, International Journal of
Intelligence Science, 03, 126–135, https://doi.org/10.4236/ijis.2013.33014, 2013.
Stafoggia, M., Johansson, C., Glantz, P., Renzi, M., Shtein, A., De Hoogh,
K., Kloog, I., Davoli, M., Michelozzi, P., and Bellander, T.: A Random
Forest Approach to Estimate Daily Particulate Matter, Nitrogen Dioxide, and
Ozone at Fine Spatial Resolution in Sweden, Atmosphere, 11, 239,
https://doi.org/10.3390/atmos11030239, 2020.
Stephen, M. S.: Gauss and the Invention of Least Squares, Ann.
Stat., 9, 465–474, https://doi.org/10.1214/aos/1176345451, 1981.
Sun, L., Xue, L., Wang, Y., Li, L., Lin, J., Ni, R., Yan, Y., Chen, L., Li, J., Zhang, Q., and Wang, W.: Impacts of meteorology and emissions on summertime surface ozone increases over central eastern China between 2003 and 2015, Atmos. Chem. Phys., 19, 1455–1469, https://doi.org/10.5194/acp-19-1455-2019, 2019.
Tin Kam, H.: Random decision forests, Proceedings of 3rd International
Conference on Document Analysis and Recognition, 14–16 August 1995,
271, 278–282, https://doi.org/10.1109/ICDAR.1995.598994, 1995.
U.S. EPA:
Trends in Ozone Adjusted for Weather Conditions, https://www.epa.gov/air-trends/trends-ozone-adjusted-weather-conditions (last access: 13 November 2021),
U.S. EPA, 2016.
U.S. EPA: Integrated Science Assessment (ISA) for Ozone and Related Photochemical Oxidants (Final Report, Apr 2020), U.S. Environmental Protection Agency, Washington, D.C., EPA/600/R-20/012, 2020.
Vong, C.-M., Ip, W.-F., Wong, P.-K., and Yang, J.-Y.: Short-Term Prediction
of Air Pollution in Macau Using Support Vector Machines, J. Control
Sci. Eng., 2012, 1–11, https://doi.org/10.1155/2012/518032, 2012.
Wells, B., Dolwick, P., Eder, B., Evangelista, M., Foley, K., Mannshardt,
E., Misenis, C., and Weishampel, A.: Improved estimation of trends in U.S.
ozone concentrations adjusted for interannual variability in meteorological
conditions, Atmos. Environ., 248, 118234,
https://doi.org/10.1016/j.atmosenv.2021.118234, 2021.
Wikipedia Contributors: Multivariate adaptive regression spline, https://en.wikipedia.org/w/index.php?title=Multivariate_adaptive_regression_spline&oldid=1083057440, last access: 19 April 2022.
Wood, S. N.: Fast stable restricted maximum likelihood and marginal
likelihood estimation of semiparametric generalized linear models, J. Roy. Statist. Soc. B, 73,
3–36, https://doi.org/10.1111/j.1467-9868.2010.00749.x, 2011.
Wood, S. N.: Generalized Additive Models: An Introduction with R, 2nd edn.,
Chapman and Hall/CRC, ISBN 9781315370279, https://doi.org/10.1201/9781315370279, 2017.
Xu, L., Yu, J.-Y., Schnell, J. L., and Prather, M. J.: The Seasonality and
Geographic Dependence of ENSO Impacts on US Surface Ozone Variability, Geophys. Res. Lett.,
44, 3420–3428,
https://doi.org/10.1002/2017gl073044, 2017.
Zhan, Y., Luo, Y., Deng, X., Grieneisen, M. L., Zhang, M., and Di, B.:
Spatiotemporal prediction of daily ambient ozone levels across China using
random forest for human exposure assessment, Environ. Pollut., 233,
464–473, https://doi.org/10.1016/j.envpol.2017.10.029, 2018.
Short summary
While the national ambient air quality standard of ozone is based on the 3-year average of the fourth highest 8 h maximum (MDA8) ozone concentrations, these predicted extreme values using numerical methods are always biased low. We built four computational models (GAM, MARS, random forest and SVR) to predict the fourth highest MDA8 ozone in Southern California using precursor emissions, meteorology and climatological patterns. All models presented acceptable performance, with GAM being the best.
While the national ambient air quality standard of ozone is based on the 3-year average of the...


