the Creative Commons Attribution 4.0 License.
the Creative Commons Attribution 4.0 License.
 | 12 May 2025
Estimation of aerosol and cloud radiative heating rate in the tropical stratosphere using a radiative kernel method
Jie Gao
Jonathon S. Wright
Qiurun Yu
A layer of aerosols has been identified in the upper troposphere and lower stratosphere above the Asian summer monsoon (ASM) region, typically referred to as the Asian Tropopause Aerosol Layer (ATAL). This layer is fed by atmospheric pollutants over southern and eastern Asia lifted to the upper troposphere by deep convection in summer. The radiative effects of this aerosol layer change local temperature, influence thermodynamic stability, and modulate the efficiency of air mass vertical transport near the tropopause. However, quantitative understanding of these effects is still very poor. To estimate aerosol radiative effects in the upper troposphere and above, a set of radiative kernels is constructed for the tropical upper troposphere and stratosphere to reduce the computational expense of decomposing the different contributions of atmospheric components to anomalies in radiative fluxes. The prototype aerosol kernels in this work are among the first to target vertically resolved heating rates, motivated by the linearity and separability of scattering and absorbing aerosol effects in the ATAL. Observationally derived lower boundary conditions and satellite observations of cloud ice within the upper troposphere and stratosphere are included and simplified in our Tropical Upper Troposphere–Stratosphere Model (TUTSM). Separate sets of kernels are derived and tested for the effects of absorbing aerosols, scattering aerosols, and cloud ice particles on both shortwave (solar) and longwave (thermal) radiative fluxes and heating rates. The results indicate that the kernels can reproduce aerosol radiative effects in the ATAL well. Similarly, these aerosol kernels could be used to simulate radiative effects of biomass burning and volcanic eruption above the troposphere. This approach substantially reduces computational expense while achieving good consistency with direct radiative transfer model calculations, and it can be applied to models that do not require high precision but have strict requirements for computing speed and storage space.
- Article
(3904 KB) - Full-text XML
-
Supplement
(1463 KB) - BibTeX
- EndNote


As one of the most uncertain and complicated factors in atmospheric simulation and climate projection, aerosol plays an important role in the atmospheric radiation budget (Kuniyal and Guleria, 2019; IPCC, 2021). To analyze heat balance and temperature changes, researchers often need to simulate the radiation effects of aerosols (Brühl et al., 2018; Ge et al., 2022). A radiative kernel approach (Soden et al., 2008; Shell et al., 2008; Zelinka et al., 2012; Sanderson and Shell, 2012; Huang et al., 2017, 2024) could help to facilitate sensitivity studies on the direct radiative effects of aerosols.
Soden and Held (2006) defined a radiative kernel method that relates the expected changes in radiative fluxes to standardized changes in a radiatively relevant constituent or property. Radiative kernels thus represent the leading term or terms in a Taylor series expansion of the radiative response to a perturbation from a given reference state. They have been demonstrated to be useful for understanding the sensitivity of the Earth's radiative balance to changes in atmospheric composition and other radiative forcing factors, including aerosols. Kernels consist of precomputed sensitivities that relate changes in atmospheric constituents to changes in radiative fluxes. Assuming these radiatively relevant factors are mutually independent, radiative kernels make it possible to separate the total climate feedback into distinct components (e.g., Zelinka et al., 2012). This decomposition approach provides a powerful framework for identifying the spatiotemporal characteristics of climate feedbacks and diagnosing the reasons for intermodel discrepancies in feedback strength (Soden et al., 2008). With these usages, radiative kernels are often used to calculate climate feedbacks in coupled model simulations, under the assumption that the radiative response to changes in the variable of interest is linear (Sanderson et al., 2009; Jonko et al., 2012). When aggregated globally, these radiative effects of different factors can be approximated by radiative kernel functions with an accuracy of ±5 % at greatly reduced computational costs relative to direct radiative transfer calculations (Soden and Held, 2006; Soden et al., 2008).
Matus et al. (2019) used aerosol radiative kernels based on observations to estimate anthropogenic aerosol radiative forcing. Their aerosol kernels, which assumed a simple linear relationship between changes in aerosols and changes in radiative flux, produced results in reasonably good agreement with CMIP5 simulations. Thorsen et al. (2020) proposed a set of top-of-atmosphere (TOA) shortwave aerosol radiative kernels to reduce uncertainty in remote sensing calculations. They calculated kernels based on aerosol extinction coefficient, single-scattering albedo (SSA), and asymmetry factor, under the assumption that aerosol direct radiative effects are linear and can be approximated without additional radiative transfer calculations. The aerosol radiative kernels are calculated by perturbing each variable to validate the linear assumption. After simplifying the vertical structure of aerosol scattering properties, they estimated the deviation of clear-sky aerosol radiative kernels to be globally, increasing to under all-sky conditions. The radiative kernel based on extinction coefficient was more than 30 times larger than those based on single-scattering albedo or asymmetry factor. Moreover, thin cloud layers were found to have larger influences on aerosol radiative effects than thick cloud layers. Aerosol kernels calculated from the Modern-Era Retrospective analysis for Research and Applications, Version 2 (MERRA-2), were also compared with observations of Clouds and the Earth's Radiant Energy System (CERES) by Kramer et al. (2021). The results showed similar spatial patterns, with differences resulting mainly from different trends in aerosol optical depth (AOD). These results establish the viability of aerosol radiative kernels for TOA fluxes under the linear assumption.
Previous applications of the radiative kernel method have focused almost exclusively on TOA and surface radiative fluxes, ignoring aerosol radiative effects in the upper troposphere and stratosphere, which can be important in some regions. The upper troposphere and lower stratosphere above the Asian summer monsoon (ASM) contain higher concentrations of aerosols and other tropospheric pollutants compared with other regions at similar latitudes (Dethof et al., 1999; Randel and Park, 2006; Park et al., 2007; Brunamonti et al., 2018). Much of the air within this region can be traced back to the boundary layer over southern and eastern Asia (Bergman et al., 2013; Orbe et al., 2015; Vogel et al., 2016; Zhang et al., 2020), where abundant emissions of aerosols and aerosol precursors contribute to the formation of an Asian Tropopause Aerosol Layer (ATAL) (Neely et al., 2014; Yu et al., 2015; Vernier et al., 2018; Bian et al., 2020). As an important pathway for air mass exchange between the troposphere and stratosphere (Pan et al., 2016; Yan et al., 2019; Bian et al., 2020), the ASM contributes up to 10 % of annual global mass transport upward across the tropopause (Ploeger et al., 2017; Shi et al., 2018; Yan et al., 2019). As radiative heating contributes to variations in both local temperature and vertical motion, accurate estimates of radiative heating in the upper troposphere and stratosphere are essential to understand mass transport above the ASM. Enhanced aerosol concentrations in the upper troposphere and lower stratosphere can alter radiative heating at the tropopause level both directly through their interactions with radiative fluxes (Toohey et al., 2014; Vernier et al., 2015; Yu et al., 2015; Fadnavis et al., 2017, 2019) and indirectly through their interactions with clouds (Su et al., 2011; Dong et al., 2019; Fadnavis et al., 2019). However, the practical impacts of these aerosol effects depend in large part on the composition and vertical structure of the aerosol layer (Gao et al., 2023), both of which are highly variable (Hanumanthu et al., 2020) and poorly constrained (Bian et al., 2020). A flexible method for estimating aerosol effects on radiative heating in this region is thus highly desirable.
Assessments of troposphere-to-stratosphere mass exchange in the ASM region are typically based on Lagrangian models driven by reanalysis products (Fueglistaler et al., 2005; Wright et al., 2011; Ploeger et al., 2017; Nützel et al., 2019; Yan et al., 2019). However, even the few reanalysis products that include interactive aerosols omit cloud–aerosol interactions near the tropopause. Because kernel coefficients are pre-calculated, aerosol radiative kernels would permit rapid estimates of aerosol effects on radiative heating and fluxes under different distributions and compositions of the ATAL and would reduce reliance on the reanalysis products. The main goal of this work is to construct a set of aerosol radiative kernels focused on radiative heating in the upper troposphere and stratosphere (UTS), which can quantify the local radiative effects of the ATAL and other high-altitude aerosol layers. Extension of the kernel framework to vertically resolved radiative fluxes and heating rates is one of the main novelties of this work, requiring extensive validation (see also Huang et al., 2024).
The data and the radiative and transfer model used in this paper are introduced in Sect. 2. The development of the kernels, including key assumptions and feasibility tests, is described in Sect. 3. The reference state, kernel distributions, and validation of both shortwave and longwave kernels are presented in Sect. 4. The radiative kernels calculated in this work are applied to the ATAL in Sect. 5, followed by a summary and discussion of the results in Sect. 6.
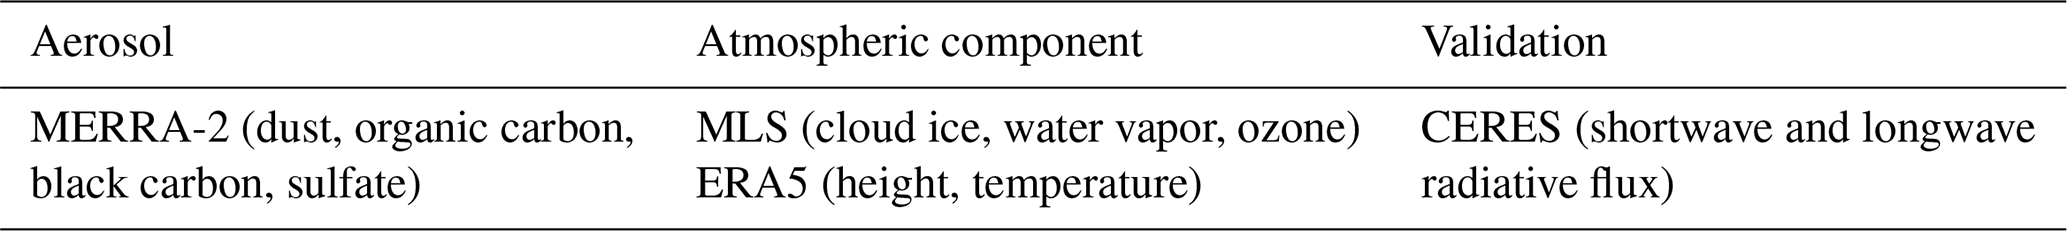
The kernels are calculated by applying radiative transfer model with reanalysis data as input. For feasibility testing, input data are taken exclusively from the Modern-Era Retrospective analysis for Research and Applications, Version 2 (MERRA-2), for convenience. However, when calculating the prototype kernels for application, several variables are taken from Aura microwave limb sounder (MLS) observations and from the European Centre for Medium-Range Weather Forecasts (ECMWF) Reanalysis v5 (ERA5) to account for known biases in MERRA-2 ozone, water vapor, and temperature (Davis et al., 2017; Wright et al., 2020; Manney et al., 2021; Fujiwara et al., 2022). For the final calculations, we use aerosol concentrations from MERRA-2; water vapor, ozone, and ice water content from the MLS; and temperature and height from ERA5. Near-tropopause temperature profiles from ERA5 are in good agreement with radio occultation measurements (Tegtmeier et al., 2020). All inputs to the Rapid Radiative Transfer Model for General Circulation Models (RRTMG) are interpolated to the MLS vertical levels (Waters et al., 2006). The longwave and shortwave radiative fluxes from Clouds and the Earth's Radiant Energy System (CERES) satellite data are also used for the validation test. The datasets included in this work are listed in Table 1.
2.1 Reanalysis products
MERRA-2 is produced by the National Aeronautics and Space Administration (NASA) Global Modeling and Assimilation Office (GMAO) to cover the satellite era (1980–present) (Randles et al., 2017). The Goddard Chemistry Aerosol Radiation and Transport (GOCART) model is used to simulate aerosols in MERRA-2 by integrating meteorological and aerosol observation data into the global assimilation system (Randles et al., 2017). Aerosols in MERRA-2 are affected by assimilating aerosol optical depth (AOD) from the Advanced Very High Resolution Radiometer (AVHRR), the Moderate Resolution Imaging Spectroradiometer (MODIS), the multi-angle imaging spectroradiometer (MISR), and the Aerosol Robotic Network (AERONET), but they are not directly coupled with cloud or convection parameterizations (Buchard et al., 2015, 2017). Only two-dimensional AOD is assimilated in MERRA-2 so that the vertical profiles and composition of aerosols are dominated by the model. To construct the kernels, we use three-dimensional aerosol mixing ratios with 14 aerosol type and size classes. We convert these three-dimensional fields to vertical profiles of layer AOD with the MERRA-2 lookup table to calculate vertically resolved radiative kernels. MERRA-2 is the only current meteorological reanalysis in which aerosols interact with radiation calculations (other reanalyses prescribe climatological distributions or omit aerosol entirely; Fujiwara et al., 2022), providing an additional way to validate radiative transfer model output.
The fifth-generation ECMWF atmospheric reanalysis (ERA5) is a state-of-the-art global atmospheric reanalysis produced by the European Centre for Medium-Range Weather Forecasts (ECMWF). It provides a comprehensive view of the atmosphere by assimilating vast amounts of observations, including surface and satellite measurements, radiosonde soundings, and aircraft measurements (Bell et al., 2021). ERA5 compares favorably with other recent reanalyses, such as MERRA-2, ERA-Interim, and the Japanese 55-year Reanalysis (JRA-55) (Hersbatch et al., 2020), better representing the vertical structure of temperature, ozone, and water vapor profiles near the tropopause relative to MERRA-2 (Fujiwara et al., 2022). We therefore use ERA5 to set the atmospheric background state for kernel calculations.
2.2 Observations
The microwave limb sounder (MLS) is an instrument on board the NASA Aura satellite that uses passive microwave radiometry to measure the concentration of trace gases, such as ozone, water vapor, and methane, along with temperature and cloud ice (Waters et al., 2006). MLS data coverage extends from August 2004 to the present and spans the upper troposphere, stratosphere, and mesosphere. The original objective of the MLS was to detect chlorine monoxide (ClO), which is emitted by industrial activity and can contribute to ozone loss (Manney et al., 2020), but the products have become enormously valuable for studying chemical and physical processes in the middle and upper atmosphere.
The Clouds and the Earth's Radiant Energy System (CERES) instruments on the Terra and Aqua spacecraft have provided measurements of global TOA fluxes since March 2000. Filtered broadband fluxes measured by CERES span the spectral range from 0.3–11.8 µm and include both shortwave (0.3–5 µm) and window (8.1–11.8 µm) regions. This study uses version 4.3 of the CERES synoptic 1° (SYN1deg), which uses calibrated TOA fluxes from geostationary satellites and model simulations to fill gaps in the diurnal cycle not measured by Terra or Aqua CERES instruments (Doelling et al., 2016). The CERES SYN1deg product includes observed and simulated TOA fluxes, simulated surface fluxes, and simulated fluxes at selected vertical levels, along with cloud properties and aerosols from MODIS. The data are provided on a 1°×1° horizontal grid at temporal resolutions ranging from hourly to monthly.
2.3 Radiation model
We adopt the Rapid Radiative Transfer Model for GCMs (RRTMG) to calculate the radiative kernels. RRTMG uses a correlated-k approach to calculate radiative fluxes and heating rates (Mlawer et al., 1997). Shortwave and longwave radiative transfer are simulated using two separate tools, RRTMG_SW and RRTMG_LW, with respective spectral ranges of 825–50 000 cm−1 (0.2–12.2 µm for wavelength) and 10–3250 cm−1 (3.08–1000 µm for wavelength). The models account for absorption, emission, and scattering of radiation by atmospheric gases, aerosols, and clouds, including water vapor, CO2, ozone, N2O, methane, and some common halocarbons (Mlawer et al., 1997).
RRTMG has been implemented in a variety of atmospheric models, including the GEOS-Chem chemical transport model (Heald et al., 2014), the Weather Research and Forecasting (WRF) Model (Skamarock and Klemp, 2008), and the Community Earth System Model (CESM; Hurrell et al., 2013). As a result, RRTMG is a well-validated radiative transfer model that has contributed significantly to our understanding of the Earth's energy balance and climate system. Input data required by RRTMG include basic conditions (such as solar zenith angle, insolation, surface emissivity, and temperature), concentrations of some atmospheric components (such as CO2, H2O, O3, and N2O), aerosol and cloud concentrations, and optical properties.
In addition to aerosols, cloud ice also has important impacts on the radiative balance near the tropopause. Ice clouds that form in the upper troposphere due to convective detrainment or cooling during slow ascent impact the upward fluxes of shortwave and longwave radiation in the stratosphere. We therefore evaluate the potential for cirrus cloud radiative kernels to represent the radiative effects of cloud ice near the tropopause in comparison to aerosols. To do this, we describe cirrus cloud ice using an aerosol-type input file that specifies optical depth, single-scattering albedo, and asymmetry factor. These optical properties of cirrus cloud ice are parameterized following the equations suggested by Fu (1996) and Fu et al. (1998).
3.1 Linearity assumptions
Radiative kernels can be regarded as sensitivity parameters or functions that encode the response of radiative fluxes to a standardized perturbation of a specific radiatively active component relative to a reference condition. Although nonlinear kernels can be constructed (Bani Shahabadi and Huang, 2014; Huang and Huang, 2021), most kernels assume that the perturbations of interest can be linearized (Soden and Held, 2006; Soden et al., 2008; Shell et al., 2008; Kramer et al., 2019). Linear kernels have previously been used to represent the sensitivity of radiative fluxes to aerosol types and concentrations (Thorsen et al., 2020). Key motivations for using the linear assumption include simplicity and convenience, as well as reduced computational cost. Moreover, linear kernels have proven to be accurate across many applications.
The aerosol radiative kernels proposed in this work are calculated based on the following equation (Huang et al., 2017):
in which kx is the precomputed kernel sensitivity parameter for the radiative component x and R is the radiative flux or radiative heating rate. In this work, x represents aerosol optical depth (AOD). It should be noted that aerosol radiative kernels defined in this way only encode the direct radiative forcing due to aerosol and that they do not include any corresponding variations in clouds or albedo. Kernels are used to estimate changes in radiative forcing relative to a reference state. The perturbed radiative flux or heating rate can be calculated by the linear kernel as kxΔx, where Δx represents the difference in variable x relative to the reference state.
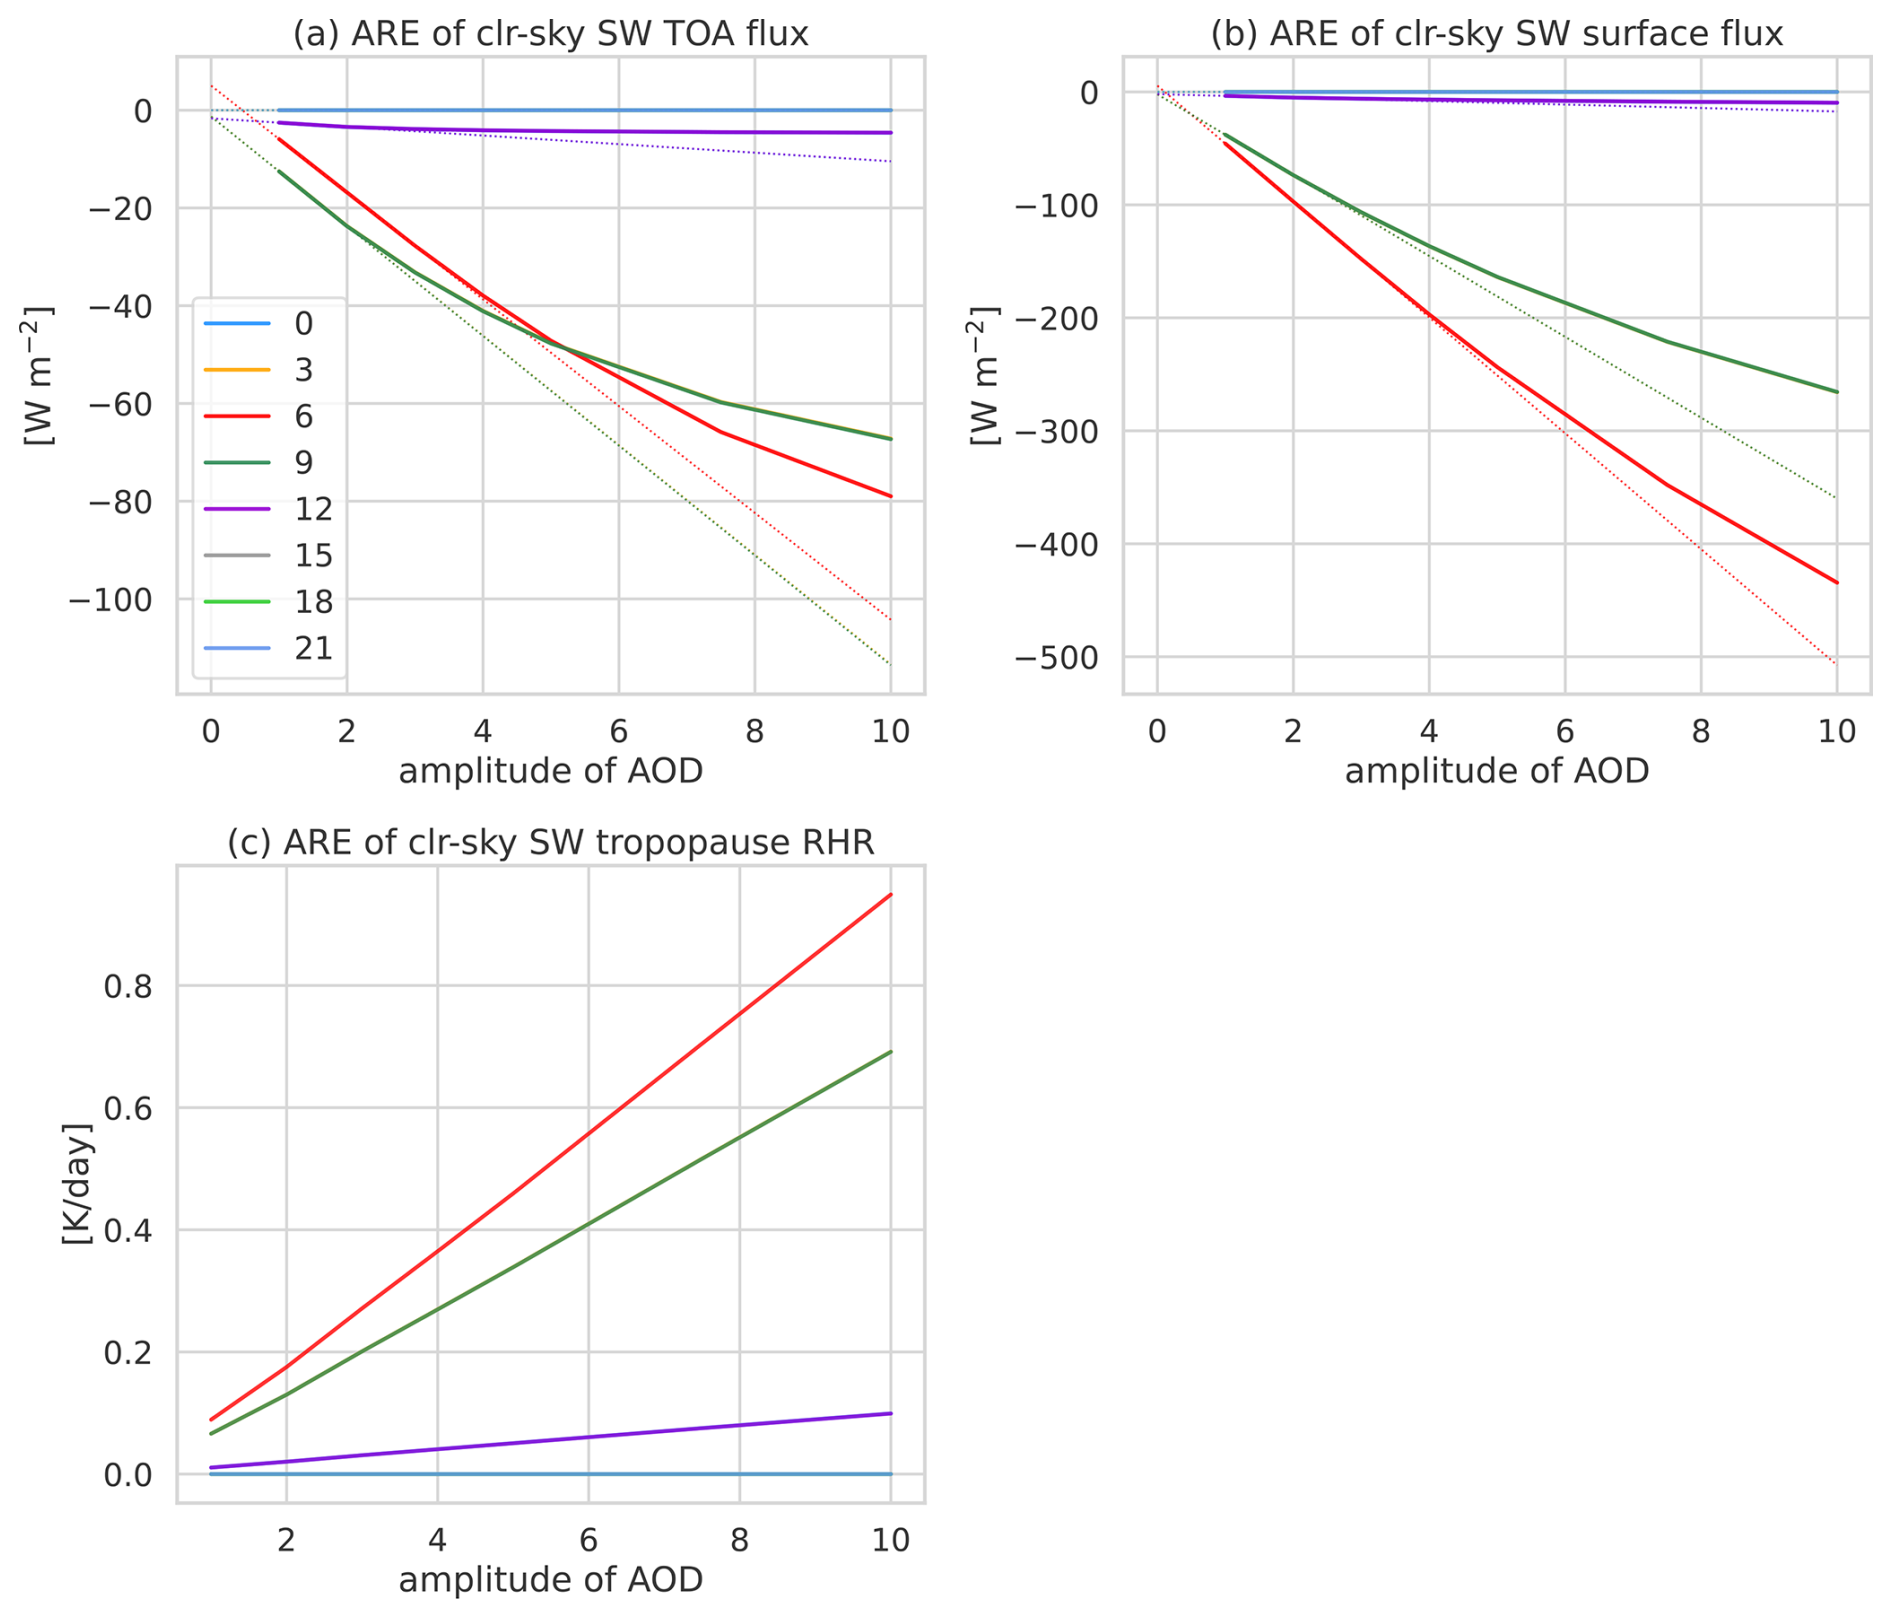
Figure 1Variations in clear-sky shortwave aerosol radiative effects based on different amplitudes of total AOD (100 %–1000 %) at 22.5–25° N, 87.5–90° E for (a) TOA flux, (b) surface flux, and (c) heating rate at the tropopause (100 hPa) at eight times of day (time in UTC). Dotted lines show linear trends extrapolated from the 10 % change between 100 % and 110 % of total AOD. Perturbations to AOD are uniform within the column.
To evaluate the linearity of aerosol radiative effects, we test the sensitivity by increasing the total column aerosol optical depth in the core region of the ATAL (20–25° N, 85–90° E), where the aerosol concentration is large, incrementally from its average value to 10 times its average value. The corresponding variations in net flux at the TOA, net flux at the surface, and heating rate at the tropopause above the ASM are shown for clear-sky conditions in Fig. 1 and all-sky conditions in Fig. S1 in the Supplement. The solar zenith angle has a large impact on aerosol radiative effects on fluxes at the surface and TOA (Gao et al., 2023). We therefore evaluate shortwave aerosol radiative effects at eight times of day separated by 3 h intervals. The hours listed in Figs. 1 and S1 are reported as UTC times, which are 6 h earlier than local solar times (UTC+6). Under clear-sky conditions, radiative effects are strong only at 03:00 UTC (obscured by the result for 09:00 UTC), 06:00 UTC, and 09:00 UTC (09:00, 12:00, and 15:00 local time). However, the aerosol effects on TOA and surface radiative fluxes are not well represented by linear extrapolation when the radiative effects are large. Aerosol radiative effects on TOA and surface fluxes during midday hours with small solar zenith angles fit the linear model only when AOD is within a factor of 2 (at 03:00 UTC and 09:00 UTC) or 4 (at 06:00 UTC) of its reference state. When AOD is increased beyond this threshold, the linear assumption results in large overestimates of the radiative effect because the shading effect of aerosols is close to saturation. Essentially, most radiation that can be scattered or absorbed has already been affected by existing aerosol particles, diminishing the intensity of SW radiation available for newly added aerosol particles to attenuate. As a result, aerosol effects on radiative fluxes no longer follow a linear relationship with AOD. Similar results are found for all-sky TOA and surface fluxes, where large AOD can even reverse the sign of the surface flux (Fig. S1). By contrast, aerosol effects on heating near the tropopause are well represented by a linear model throughout the range of AOD tested in these simulations, up to 10 times the average value.
In summary, the linearity assumption breaks down for aerosol effects on surface and TOA fluxes when AOD perturbations exceed twice the reference value. Therefore, linear kernels are unsuitable for reconstructing these effects when perturbations are large. By contrast, linear kernels show excellent potential for representing aerosol effects on heating at the tropopause even when perturbations are very large.
3.2 Kernel calculation methodology
Having established the linearity of the aerosol effects and its limits, there remain many other parameters that can influence the accuracy of the kernels. We calculate shortwave clear-sky kernels under different aerosol settings to evaluate these sensitivities. The ASM core region (22.5–25° N, 87.5–90° E) is chosen as the reference. The atmospheric reference state is taken as the July 2019 average from MERRA-2, and the target state is taken as the July 2020 average.
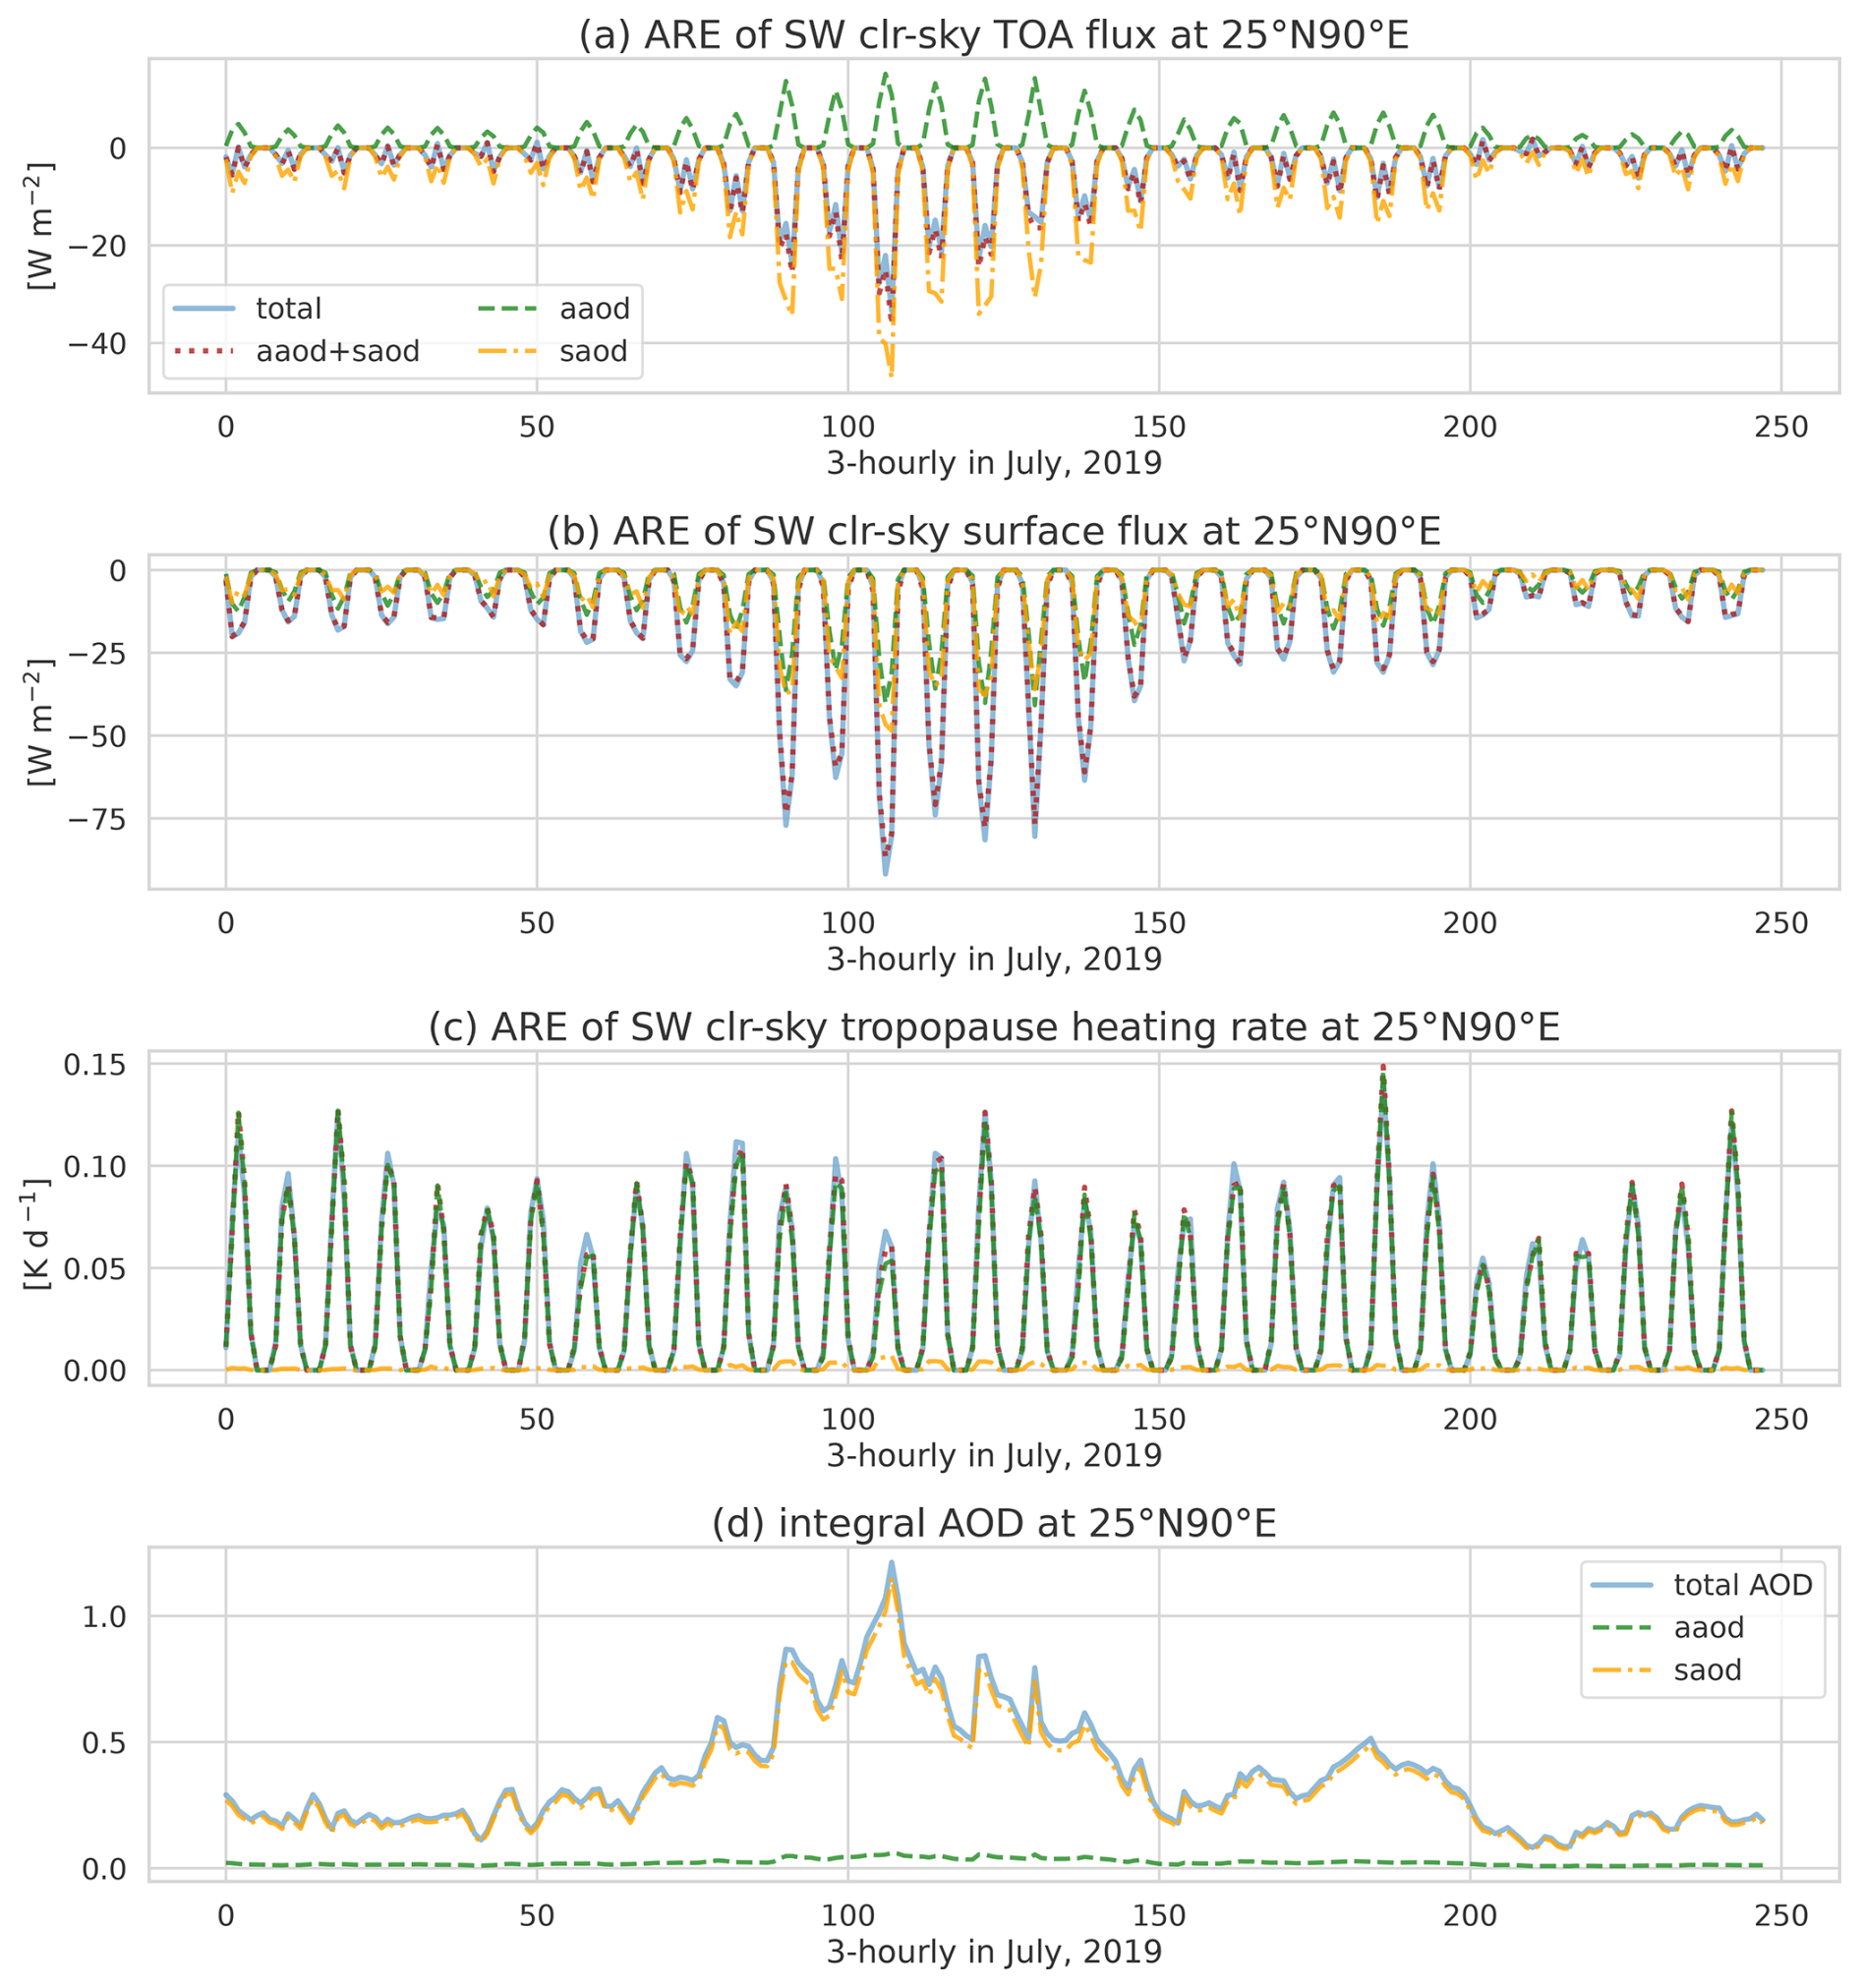
Figure 2The shortwave radiative effects of aerosol on (a) TOA shortwave radiative flux, (b) surface shortwave radiative flux, and (c) heating rate at the tropopause attributed to absorbing aerosol optical depth (AAOD; dashed green lines), scattering aerosol optical depth (SAOD; dashed orange lines), absorbing and scattering aerosol optical depth (total; solid blue lines), and the sum of AAOD and SAOD radiative effects (dotted red lines). Panel (d) shows time series of the vertically integrated AAOD, SAOD, and total AOD. All panels are based on 3 hourly data from July 2019 in the ASM core region.
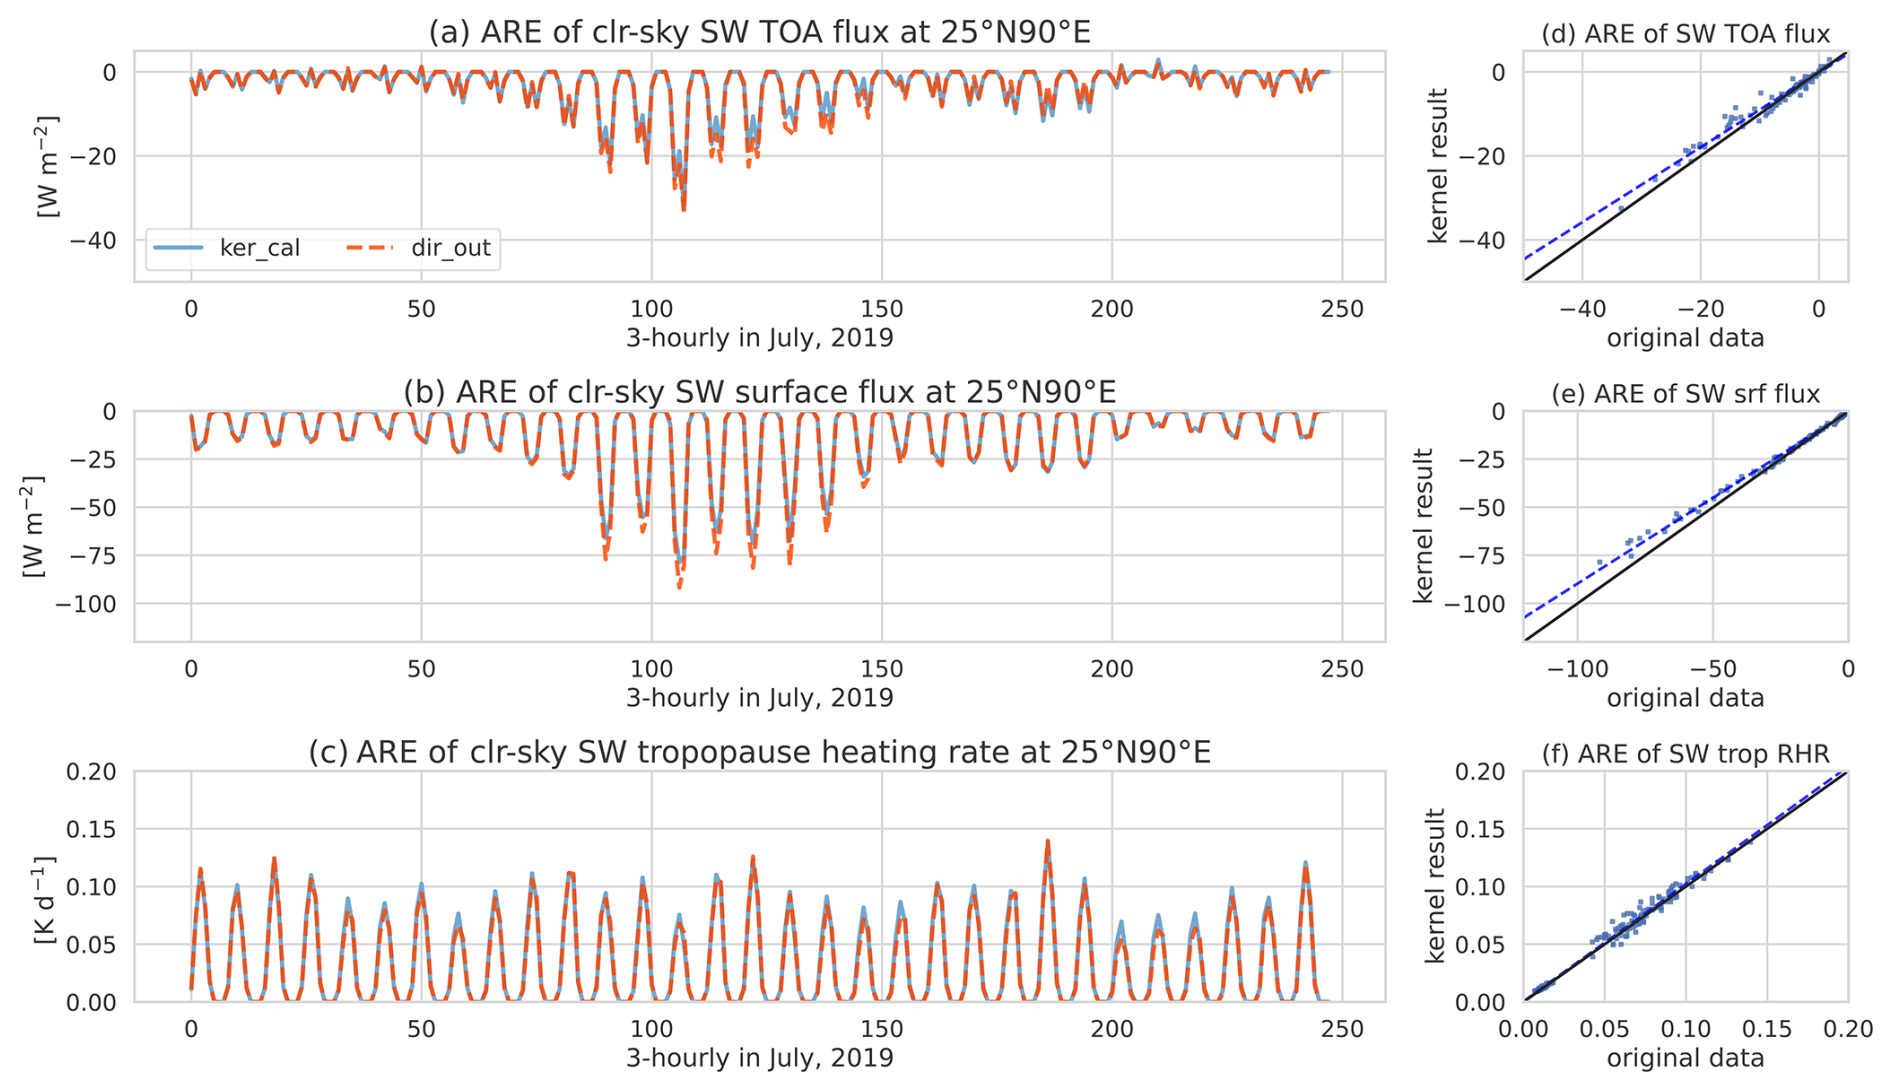
Figure 3The left column shows time series of the sum of absorbing and scattering aerosol radiative effects on (a) TOA radiative fluxes (positive upward), (b) surface radiative fluxes (positive downward), and (c) tropopause heating. Dashed orange lines are for aerosol radiative fluxes calculated directly from model outputs, and solid blue lines are for aerosol radiative fluxes calculated using diurnal resolved monthly aerosol kernels based on AAOD and SAOD as in Eq. (3). The right column shows scatter plots of direct (x axis) and kernel-based (y axis) aerosol radiative effects on (d) TOA fluxes, (e) surface fluxes, and (f) tropopause heating.
To separate the radiative effects of absorbing and scattering aerosols, Thorsen et al. (2020) proposed that aerosol direct radiative effects could be reconstructed using separate kernels for AOD, SSA, and asymmetry factor. However, SSA and asymmetry factor are less widely used than AOD, and their results indicated that the influences of these parameters are relatively small. We therefore test a different approach, constructing kernels based on absorbing aerosol optical depth (AAOD) and scattering aerosol optical depth (SAOD). To test the linear separability of the total AOD effect into AAOD and SAOD components, changes in TOA radiative fluxes, surface fluxes, and tropopause heating associated with differences in AAOD, SAOD, and total AOD in July 2019 are plotted in Fig. 2. Because variations in the relative ratio of AAOD, SAOD, and cloud optical depth (COD) are small within individual months (Figs. S2–S4), results are similar for other months. Although AAOD accounts for a small proportion of the total AOD, it contributes almost all of the aerosol effect on radiative heating at the tropopause and makes substantial contributions to aerosol effects on TOA and surface fluxes as well. Changes in SAOD, which accounts for 90 % of total AOD, exert substantial effects on TOA and surface fluxes; however, these effects are similar in both sign and magnitude. SAOD has little impact on heating at the tropopause. The significant difference in the impact of absorbing and scattering aerosols on the radiative heating rate results from the ability of absorbing aerosols to directly absorb radiation and convert that absorption into thermal energy, thereby heating the surrounding atmosphere. While absorption increases the convergence of radiant energy, scattering only changes the direction of radiation propagation and thus contributes little to local radiative heating. The aerosol effect on downward TOA radiative flux represents a competition between the positive effect of absorbing aerosol and the negative effect of scattering aerosol, as illustrated in Fig. S1a. The sum of AAOD and SAOD radiative effects is in good agreement with the radiative effect of total AOD, indicating that it is feasible to reconstruct the total radiative effect from separate kernel representations of AAOD and SAOD effects. Since our formulation regards cirrus ice particles as aerosols, the radiative effects of cirrus clouds also conform to this conclusion.
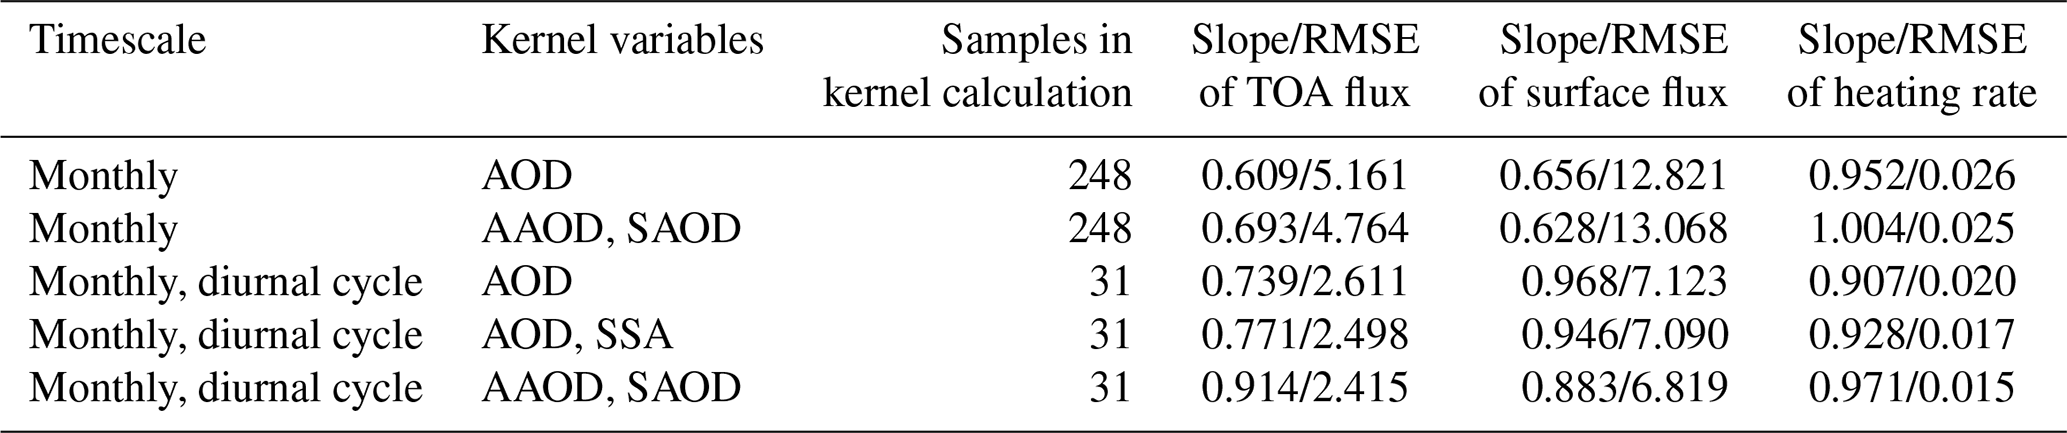
For convenience, aerosols are perturbed by increasing concentrations by 10 % at each level simultaneously when testing the accuracy of various kernel methods. We change the timescale and independent variables to calculate kernel; therefore the parameters of the fitting line in the scatter plot with original values on the x axis and the calculated kernel values on the y axis are changed (e.g., Fig. 3d–f), as shown in Table 2. The closer the slope is to 1, the better the kernel method is. We first calculate monthly kernels of AOD but find they have a low consistency with direct model output. As shortwave radiation is largely influenced by insolation and solar zenith angle, kernels for each time step are needed, but that method can easily be influenced by specific features of the reference state. It is therefore necessary to refine the shortwave kernel calculation method, such as by using carefully selected time or spatial averages to set the reference state.
In Fig. 3, we apply monthly mean AAOD and SAOD kernels to calculate the total radiative effect. Each kernel is calculated as
in which the subscript t indicates the 3 h time step relative to 0 UTC and the subscript ref indicates the reference state (i.e., years 2011–2020). τt,ref is the integrated aerosol optical depth and may be either AAOD or SAOD. kτ,t is the radiative kernel for AOD, R1.1τ is the radiative flux following a 10 % increase in AOD, and Rτ is the radiative flux for the reference state AOD. The kernel for each time step is first calculated and then averaged monthly, but diurnal variation remains. Noting that we use in the denominator, the total radiative effect at the target time can be reconstructed as
in which kA and kS are the monthly AAOD and SAOD kernels, respectively, and and are the monthly averaged AAOD and SAOD radiative effects for the reference state relative to no-aerosol conditions.
The shortwave kernel and reference aerosol radiative effects are averaged across different days but retain variations associated with the diurnal cycle. The 3 h resolution of the reference state thus yields eight sets of kernels per month and the requirement that values during local night be manually set to zero. The agreement in radiative fluxes using this method is high, and the agreement in heating rate is the best, with the strong agreement indicated by a regression slope of 0.971 and a small root-mean-square error (RMSE) of 0.015. However, for longwave aerosol kernel, scattering aerosol is not included in RRTMG, so only AAOD kernel is calculated.
4.1 Assumptions
The reference state of our upper troposphere–stratosphere aerosol kernel is based on monthly zonal-mean profiles of atmospheric temperature and trace gases. These choices are justified by relatively small zonal variations in the mean state and a weak sensitivity of aerosol effects to background conditions. As outlined in Sect. 2, aerosol concentrations are from MERRA-2; temperature, height, and surface albedo are from ERA5; and ozone, water vapor, and cloud ice water content within the UTS are from the Aura MLS. The monthly diurnal cycle is resolved at 3 h intervals when computing the shortwave kernels. The diurnal cycle is not considered when computing the longwave kernels.
Kernels are constructed for latitude bands at 5° intervals in the tropics (30° S–30° N), with 200 hPa as the lower boundary when running RRTMG. This Tropical Upper Troposphere–Stratosphere Model (TUTSM) is schematically illustrated in Fig. 4. The troposphere is regarded as an entirety responsible only for setting the albedo and longwave upward radiative flux at the 200 hPa lower boundary (orange band and red arrows in Fig. 4). Cirrus cloud ice in the UTS (gray dots) is treated as a separate class of aerosol (brown dots).
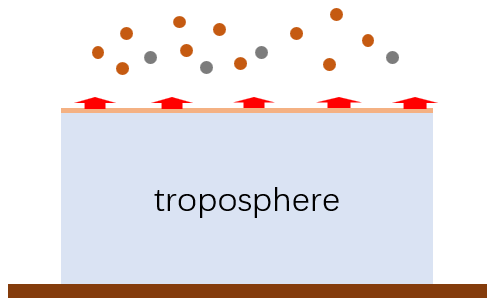
Figure 4Diagram of the UTS domain for which kernels are constructed. The troposphere (blue box) is considered only with respect to setting the lower boundary conditions at 200 hPa (orange band above troposphere). Red arrows indicate upward fluxes of reflected shortwave or emitted longwave radiation from the troposphere. Orange and gray dots represent aerosols and cloud ice in the UTS, and the latter is also treated as aerosol when running the model.
With these assumptions, it is necessary to define the 200 hPa albedo for shortwave radiation along with an effective tropospheric emission temperature based on the upward flux of longwave radiation at that level. The albedo at 200 hPa is calculated as the ratio of shortwave upward flux to downward flux at 200 hPa, written as
Because of the small optical depth for reflected shortwave radiation in the stratosphere, the albedo calculated at 200 hPa is almost the same as that calculated at the TOA, as shown in Fig. S5. Therefore, the TOA albedo can be roughly used instead of 200 hPa albedo in applications. The emission temperature is calculated from longwave upward fluxes according to the Stefan–Boltzmann law:
where Te is the emission temperature, ELW,up,200 hPa is the upward longwave flux at 200 hPa, and is the Stefan–Boltzmann constant.
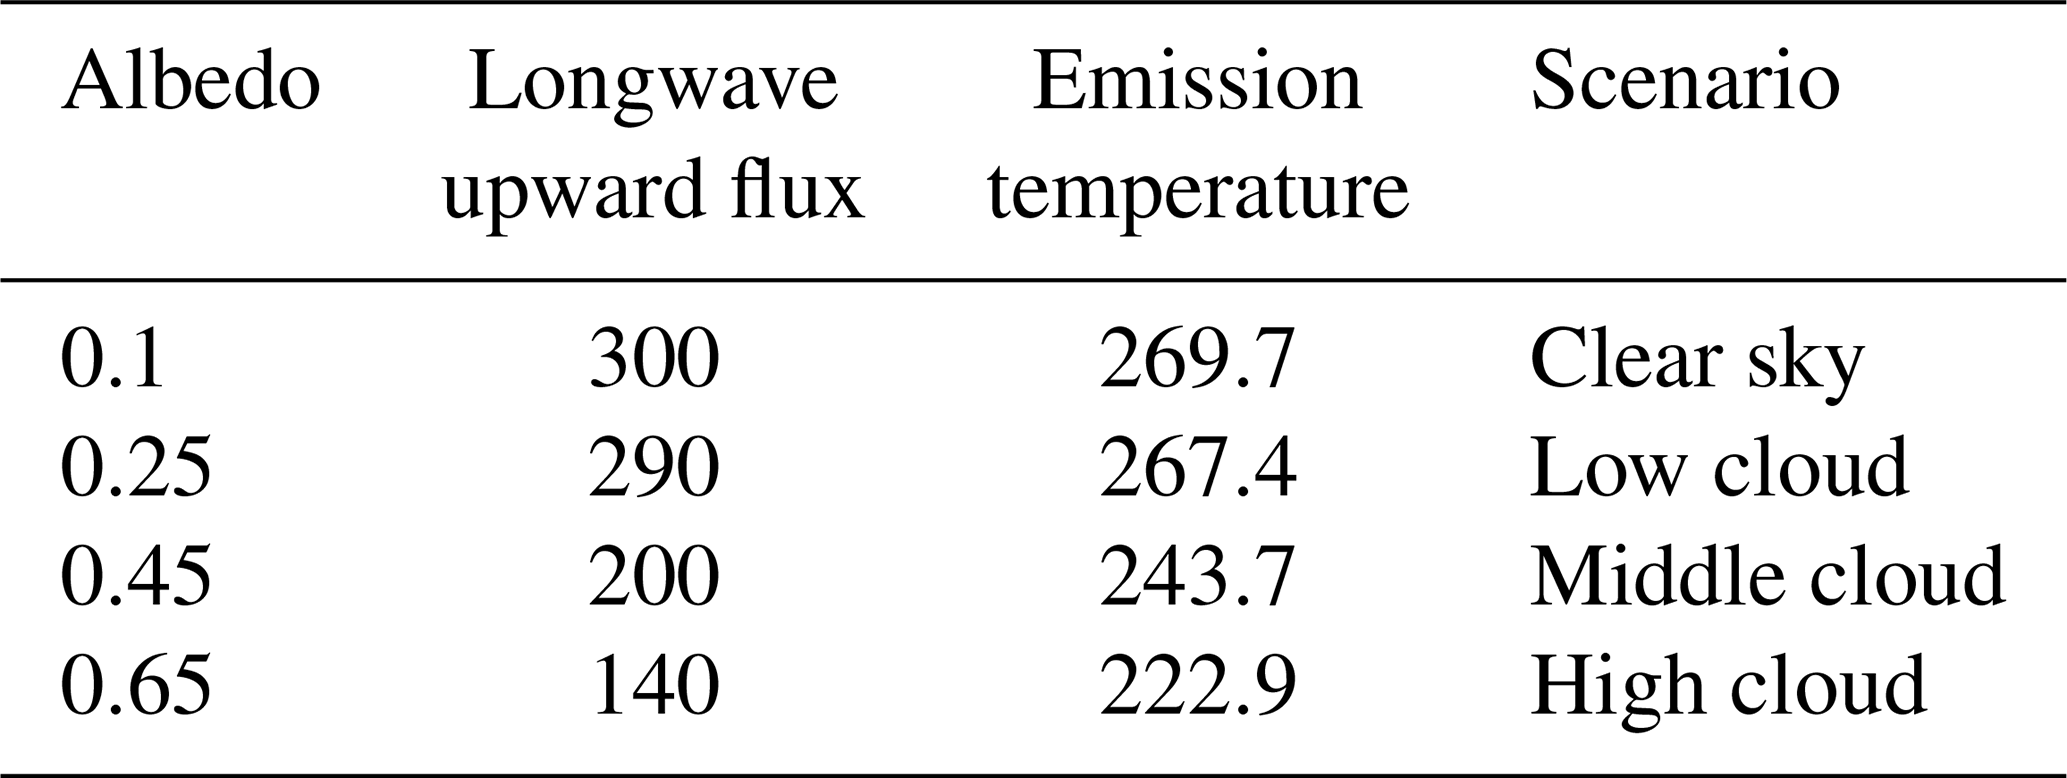
By analyzing joint plots of shortwave and longwave radiative flux at 200 hPa within 30° S–30° N (only Fig. S6 shown here as a 30° S example), we identify four representative points with relatively high frequency between 30° S–30° N (four red stars in Fig. S6). The albedo and emission temperatures calculated from 200 hPa radiative flux are listed in Table 3 and can be regarded as four reference-state boundary conditions. Four different albedos could broadly represent four different types of cloud cover in the underlying troposphere, namely clear sky, low cloud, middle cloud, and high cloud. The upper troposphere–lower stratosphere aerosol kernels are based on these four scenarios, with the frequency decreasing sequentially.
Table 3200 hPa boundary conditions for the four representative tropospheric scenarios.
It should be noted that the shortwave radiation is largely influenced by time and latitude because of different insolation and solar zenith angle. However, the longwave upward radiation is independent of those factors. The radiative flux above 200 hPa is strongly positively correlated with boundary conditions, namely emission temperature at 200 hPa for longwave, and the correlation coefficients calculated from CERES are all beyond 0.99 between 30° S–30° N, which highlights the latitude independence of UTS longwave radiation. Based on this analysis, differently to shortwave, the longwave kernels are calculated without distinguishing between time and location.
In summary, the assumptions of the kernel calculations and applications include the following:
-
The aerosol radiative effect varies linearly within a range of aerosol optical depth.
-
Due to the fact that the changes in radiatively active components like water vapor and ozone do not significantly affect aerosol radiative effects, they are assumed to have no large variations in UTS.
-
The total radiative effect of aerosols at each level can be represented as a linear sum of radiative effects associated with absorbing aerosol optical depth (AAOD), scattering aerosol optical depth (SAOD), and cloud optical depth (COD).
-
Cirrus cloud ice above the lower boundary (200 hPa) can be represented as aerosol for radiation calculation.
-
Stratospheric components can be well represented by their zonal and monthly means.
-
Tropospheric radiative effects can be represented as a boundary condition.
-
The selected value pairs of 200 hPa albedo and emission temperature can adequately represent clear-sky, low-cloud, middle-cloud, and high-cloud tropospheric scenarios.
-
Time and location have no influence on longwave radiation above 200 hPa.
4.2 Validations
To validate the assumption of the TUTSM, we compare the UTS simulation results with adjusted CERES fluxes at 200 hPa and TOA and the results from radiative transfer model simulations that include the troposphere. The radiative transfer simulations are conducted assuming a clear, clean troposphere (no aerosol and no cloud) to reduce the confounding influence of inhomogeneities in aerosols and clouds. To account for longitudinal differences in atmospheric components and their impacts on radiation, we extract the CERES radiative fluxes at the 10th, 50th, and 90th percentiles for the corresponding latitude and time of day.
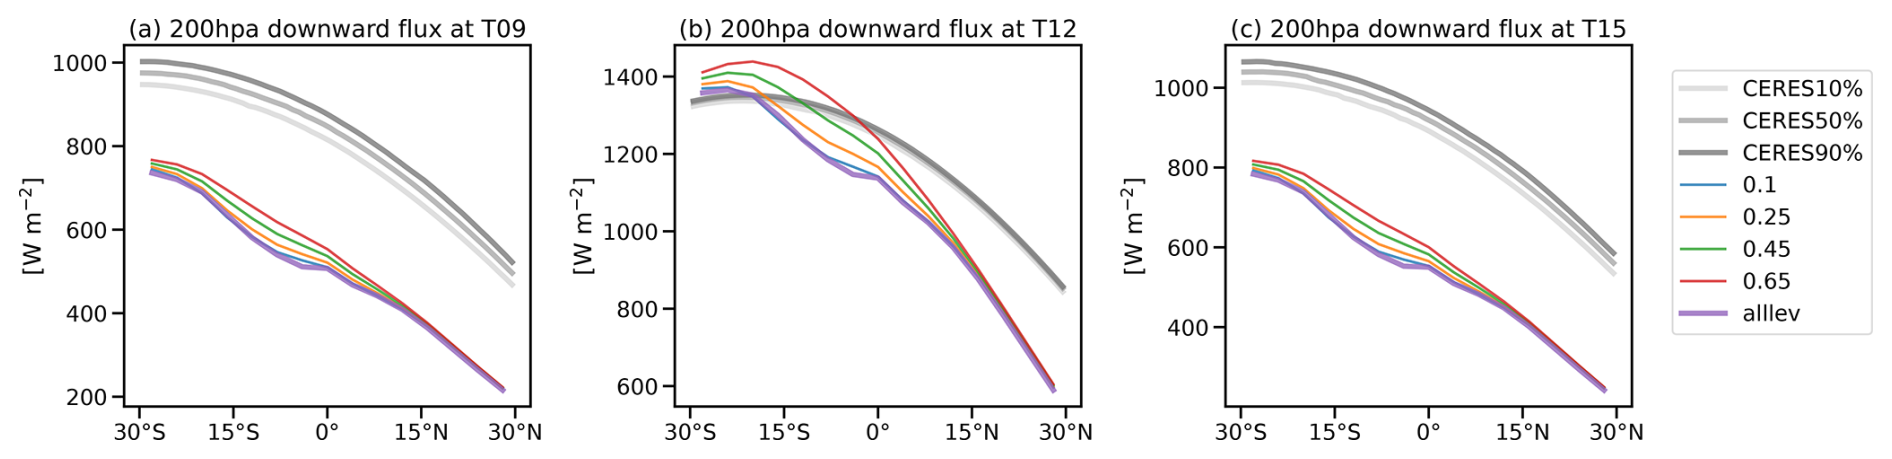
Figures 5 and 6 show comparisons of 200 hPa upward and downward shortwave fluxes for all-sky conditions in CERES (gray lines), for whole-column simulations (purple lines), and for the four UTS scenarios at three different local solar times. We choose the local solar times with the largest fluxes, between 09:00–15:00 LT. During this period, the upward flux for simulations that resolve the clear, clean troposphere (purple lines) falls between the UTS simulations with albedo values of 0.1 (blue lines) and 0.45 (green lines) of stratospheric simulation. The CERES upward fluxes are also broadly consistent, generally falling within the range of albedo we defined. The highest albedo scenario (0.65) falls outside the 90th percentile, as may be expected given the relative rarity of deep convection. The 200 hPa albedo is smaller at 12:00 LT, and the CERES data are mostly within 0.1–0.45, meaning that 0.65 is not needed for this time. Deviations in these simulations with CERES scenarios occur near 15° N–30° N, which represents zonal-mean surface albedo being larger at those latitudes. Our assumptions for the representative scenarios are therefore reasonable in the sense that these four reference states span the range of possible boundary conditions.
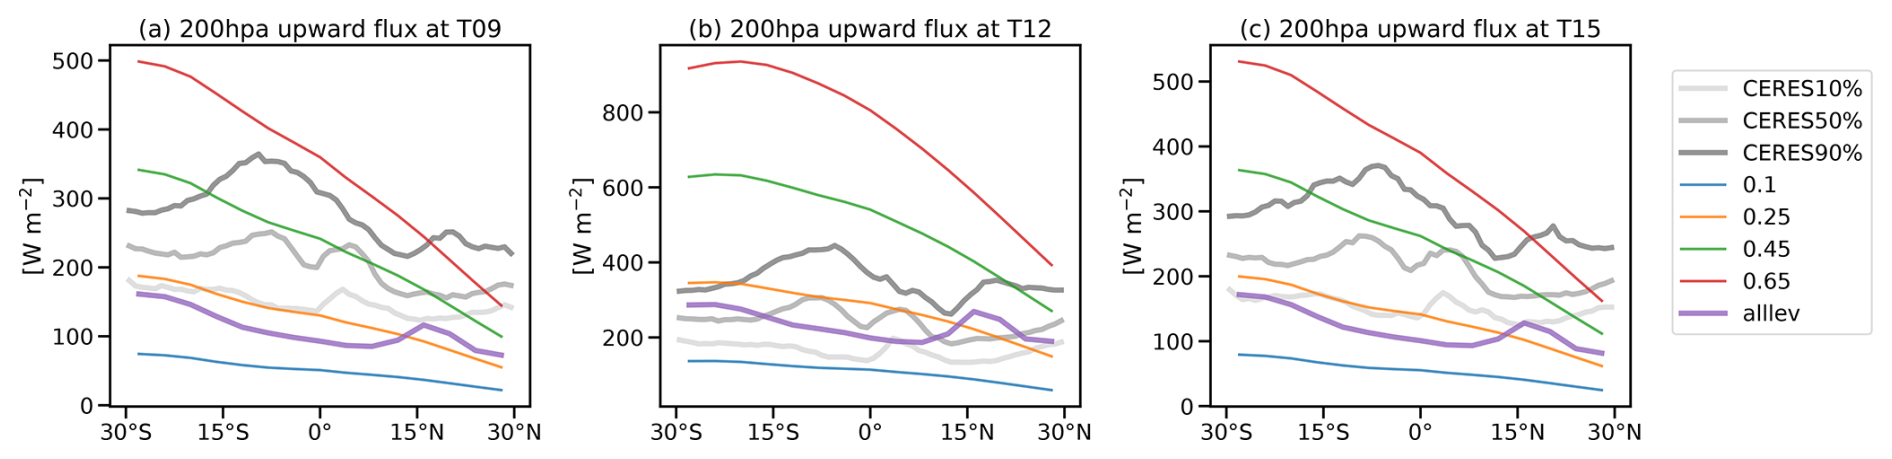
Figure 5Upward shortwave fluxes at (a) 09:00, (b) 12:00, and (c) 15:00 local solar time from all-sky UTS simulations (with AAOD, SAOD, and COD) for 200 hPa albedo equal to 0.1 (blue lines), 0.25 (yellow lines), 0.45 (green lines), and 0.65 (red lines). Purple lines show the 200 hPa upward flux from atmospheric simulations that resolve a clear, clean troposphere; gray lines are the 10th (light-gray lines), 50th (medium-gray lines), and 90th (dark-gray lines) percentiles of 200 hPa upward fluxes from CERES SYN1deg for the corresponding latitude and approximate local solar time. The simulated results are based on monthly zonal-mean reference states for January 2011–2020. The CERES data are from January 2011–2020.
Unlike the large differences in upward flux at 200 hPa between the different scenarios of upward flux, the tropospheric state has little impact on downward shortwave flux at 200 hPa. The total column simulation results are almost identical to the albedo=0.1 TUTSM scenario, consistent with this scenario representing a clear, clean troposphere. The model simulations are within the range of CERES data at 12:00 LT but smaller than CERES-based fluxes at 09:00 and 15:00 LT.
For validation of the longwave reference states, we ignore time of day and show both clear-sky and all-sky upward and downward longwave fluxes at 200 hPa. Results are shown in Fig. 7. As we use the same four 200 hPa effective emission temperatures at all latitudes, the set of reference longwave upward fluxes in the UTS simulations is the same for each latitude, while the CERES-based and total column simulations show variations across latitudes. Under clear-sky conditions, the total column results and CERES data are close to the scenarios with 269.7 and 267.4 K emission temperatures, consistent with the lack of clouds. For all-sky upward fluxes, these results fall mainly between the 267.4 and 243.7 K emission temperature scenarios, rarely consistent with deep convection (222.9 K emission temperature). For the all-sky downward flux, the CERES fluxes are much smaller than the simulations between 30° S–15° N. The simulations use the zonal-mean MLS to define trace gases and cloud fields for input to RRTMG_LW above 200 hPa. The use of zonal-mean cloud fields means that the simulations are more representative of clear-sky than all-sky conditions.
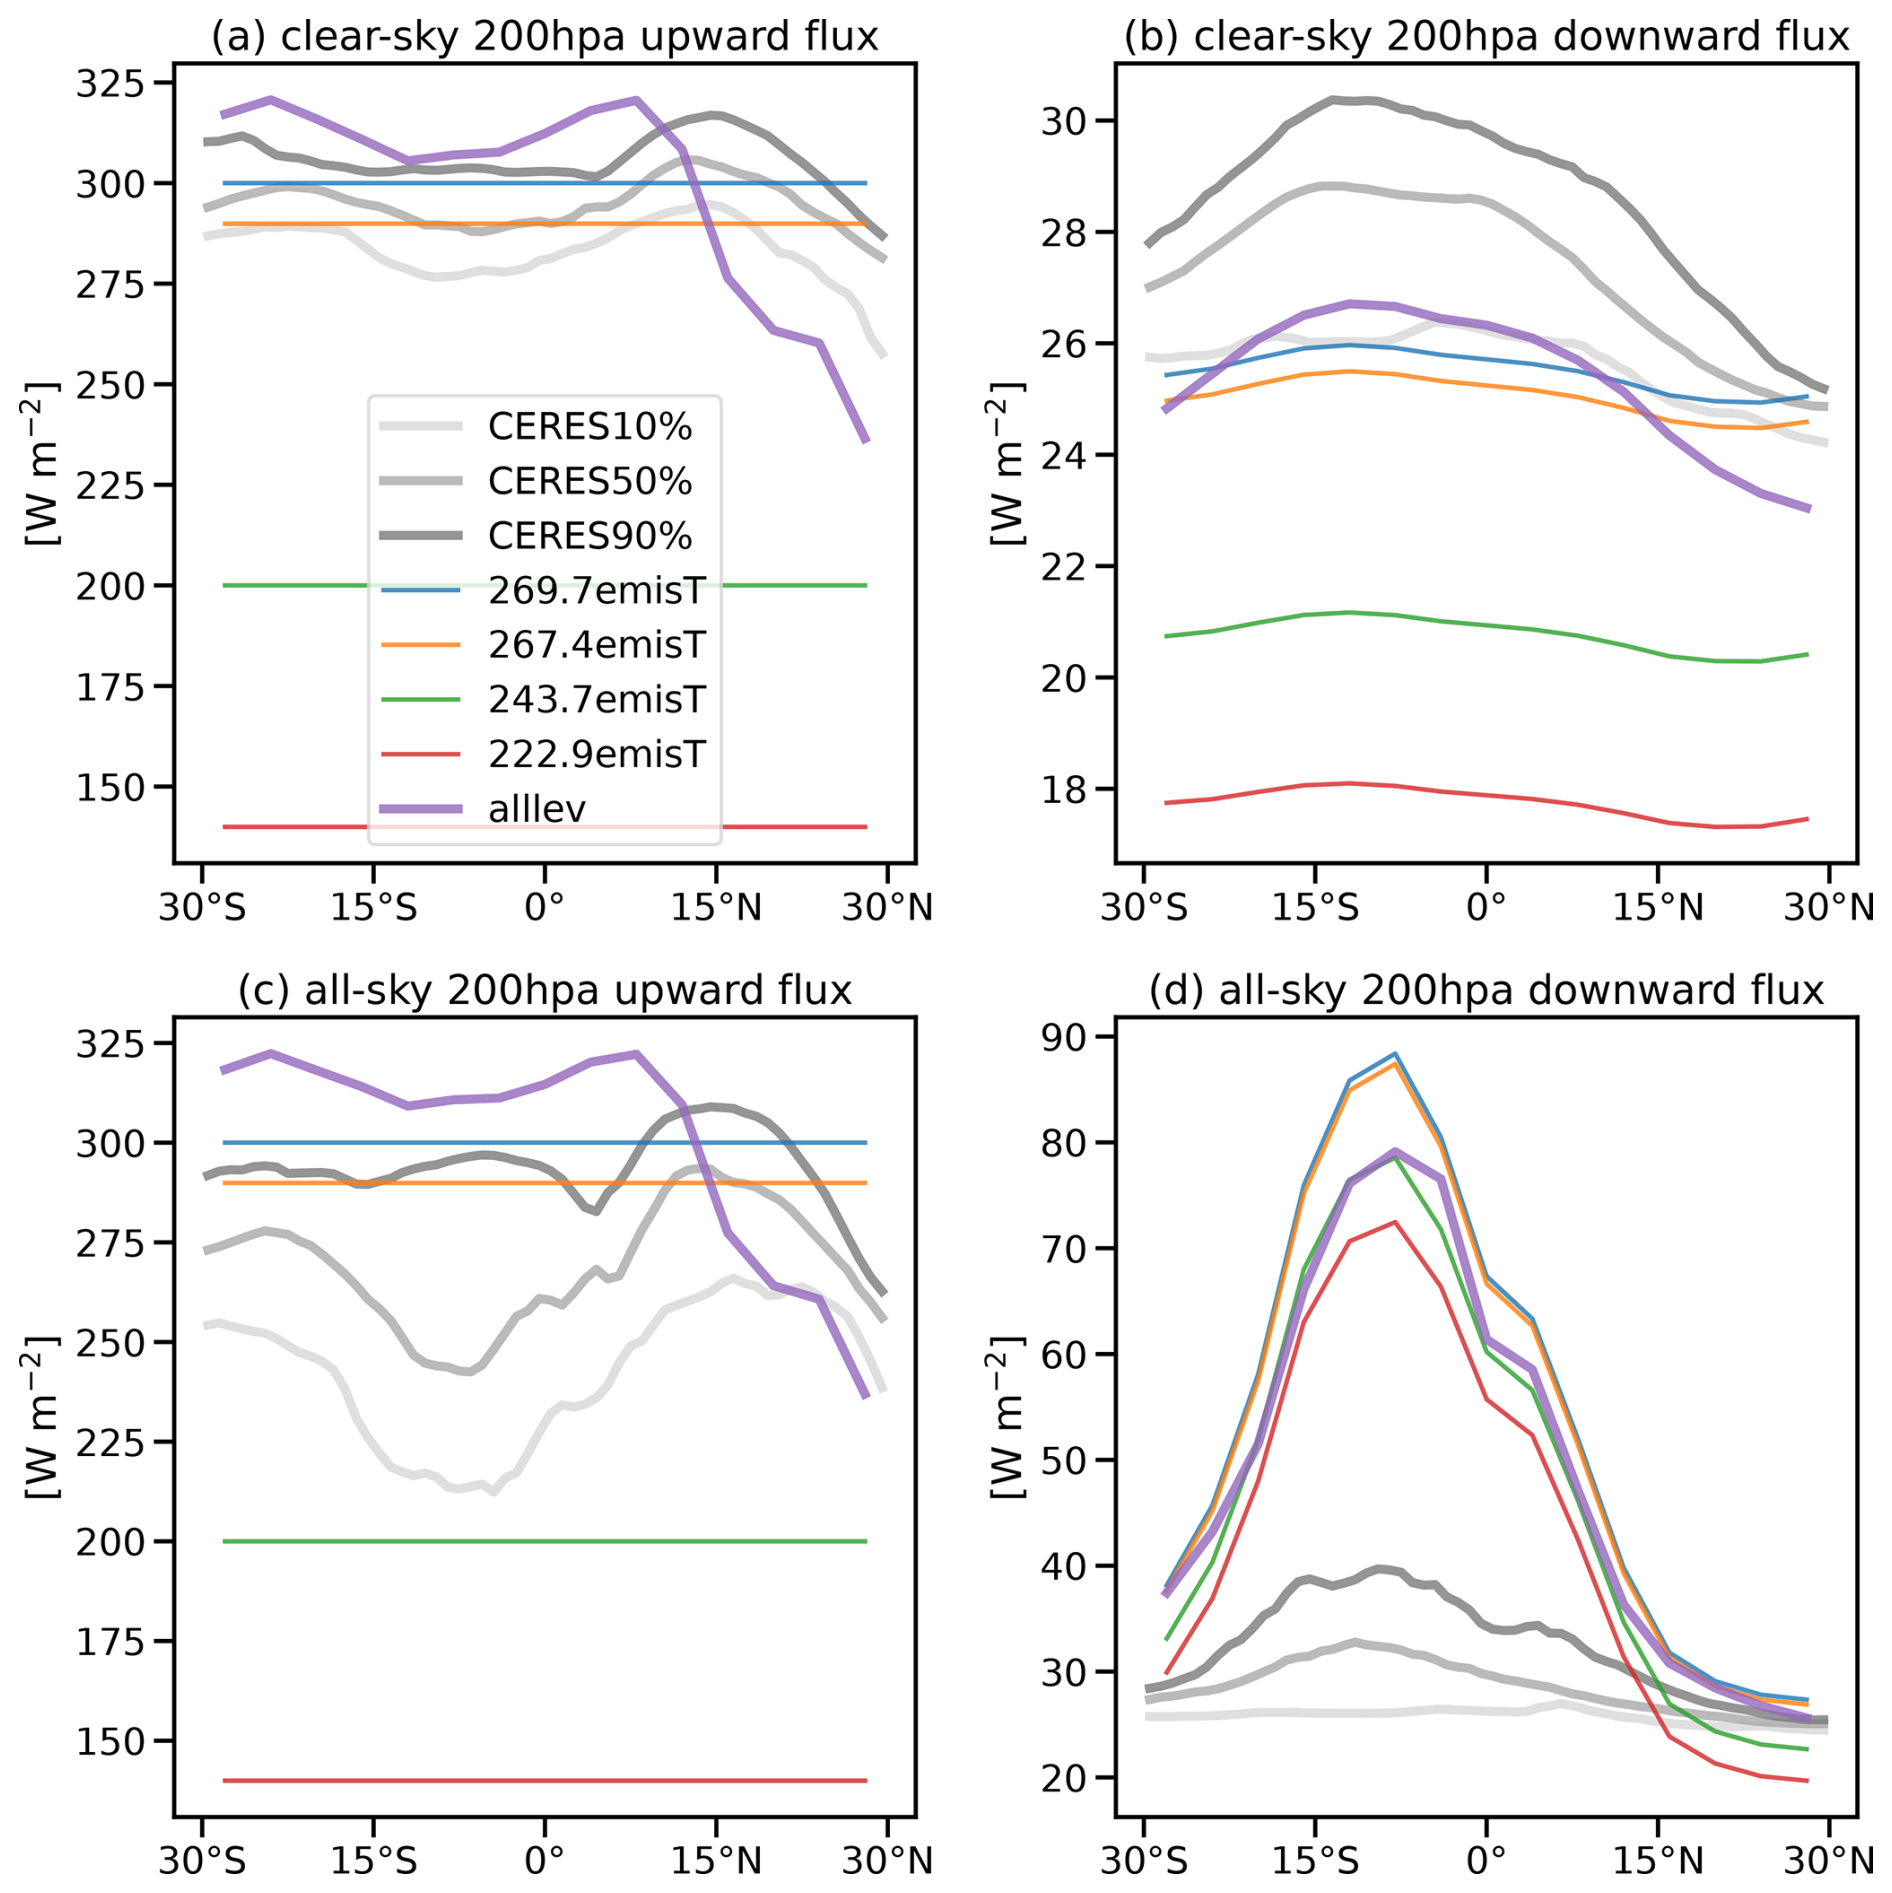
Figure 7(a) Upward longwave fluxes at 200 hPa for clear-sky and (c) all-sky conditions based on UTS simulations, with 200 hPa emission temperatures equal to 269.7 K (blue lines), 267.4 K (yellow lines), 243.7 K (green lines), and 222.9 K (red lines); whole-atmosphere simulations (including the troposphere; purple lines); and the 10th (light-gray lines), 50th (medium-gray lines), and 90th (dark-gray lines) percentiles of CERES SYN1deg data. (b, d) Same as the left-hand panels but for downward longwave fluxes at 200 hPa. All results are for January 2011–2020.
In conclusion, differences between the UTS-only simulations and CERES-based estimates or total atmosphere simulations are generally small. Even in situations where differences are not small, it meets expectations. These results therefore support the use of 200 hPa albedo (or planetary albedo, as they are almost the same in Fig. S5) and 200 hPa emission temperature as a simplification of the tropospheric lower boundary conditions. This simplification ensures reproducibility while greatly reducing the number of computations required to produce a representative set of kernels. However, it also eliminates any band or wavelength dependence of upward fluxes on conditions in the troposphere and may therefore alter the simulated influences of aerosols and trace gases and radiative fluxes at the TOA and radiative heating in the UTS.
4.3 Description of TUTSM radiation
4.3.1 Shortwave radiation
Based on the structure and assumptions in Sect. 4.1, we conduct radiative transfer simulations for UTS aerosols and cloud ice under the four representative scenarios (Table 3). We then use the results of these simulations to construct aerosol and cloud kernels at each level for the UTS region. Distributions of optical depth, shortwave net flux, and shortwave heating at 12:00 UTC in August are shown in Fig. S7 under the scenario corresponding to a cloud-free troposphere (i.e., 200 hPa albedo of 0.1). In August, deep convection associated with the ASM and the northward-shifted Intertropical Convergence Zone (ITCZ) injects relatively large amounts of aerosol and cloud ice in the northern part of the tropical UTS. The absorbing component of this aerosol leads to negative effects on shortwave net flux at altitudes with high concentrations and positive effects on net flux above these aerosol layers. By contrast, the effects of scattering aerosols and cloud ice on shortwave net flux have almost no vertical variations. Scattering aerosol produces positive upward perturbations in shortwave flux above layers with high concentrations of scattering aerosols while reducing the downward flux below (not shown). This compensation between changes in upward and downward flux induced by scattering aerosols results in a near-constant vertical distribution. The effects of cirrus cloud ice are similar. Compared with the strong radiative heating effect of absorbing aerosol, the effects of scattering aerosols on radiative heating can be ignored. However, cloud effects on heating can be substantial in the upper troposphere when optical depths are relatively large. Cloud ice also induces a secondary effect on heating in the upper stratosphere due to absorption of reflected shortwave radiation by ozone.
For perturbing aerosols in each layer, we originally planned to use 10 % increments in average optical depth at each level as in the illustrations above; however, 10 % of the mean values of AAOD (at all levels) and SAOD (at high levels) are smaller than the accuracy limit (10−5) in RRTMG. We therefore perturb the optical depth by 10−5 for those levels, so the τ×10 % in Eq. (2) should be changed to 10−5 for the situations above.
4.3.2 Longwave radiation
We plot the optical depth at 10 µm in Fig. S8 as representative of aerosol and cloud interactions with longwave radiation. Only the absorption effects of aerosols and cloud ice are considered in RRTMG_LW, as aerosol scattering effects are ignored in this model and cloud ice is treated as a separate aerosol type. Compared with the 550 nm optical depth in Fig. S7, the absorbing aerosol optical depth at 10 µm is smaller by about a factor of 2. Decreases in cloud optical depth relative to the shortwave result from both spectral variations and the omission of longwave scattering by cloud ice. Although cloud longwave effects are similar to cloud shortwave effects, the effects of absorbing aerosols on net flux are quite different. Aerosols only induce negative changes in fluxes above the perturbation layer, and the absorbing aerosol effect on longwave heating is about 1 order of magnitude smaller than that on shortwave heating, affirming the relative weakness of aerosol effects in the longwave part of the spectrum.
Kernels serve the purpose of estimating radiative effects at a reduced computational cost in a simple way, as outlined by Huang et al. (2007). When employing kernels, the initial step involves calculating the differences between the target status and reference state, denoted as Δτ. A new reference state can also be defined with the difference in aerosol concentrations. Additionally, it is essential to consider either assuming a 200 hPa albedo (or utilizing TOA albedo instead) or determining the tropospheric cloud coverage to select the appropriate kernel set, as detailed in Table 2. Similarly to Eq. (3), the aerosol (or cloud) radiative effect can then be calculated as follows:
where l is the atmospheric level. A vertical one-dimensional kernel is calculated for the disturbance of aerosol at each layer, and the total aerosol radiative effect is the sum of that at each layer. If only radiation increments (reductions) are needed, just ignore the last term of Eq. (6).
With the application method, there are some potential applications for our UTS aerosol kernels, including aerosol effects associated with the ATAL, deep smoke plumes associated with biomass burning, volcanic eruptions, and geoengineering.
5.1 ATAL effects
The radiative effects of ATAL aerosols can be reconstructed by combining the AAOD and SAOD radiative kernels derived using Eq. (3). The kernels further allow the added context of aerosol longwave radiative effects based only on absorbing aerosol and under different tropospheric scenarios. The results are shown in Fig. 8. To facilitate comparison with the largest aerosol radiative effect of the ATAL, the shortwave aerosol optical depth and kernel for 12:00 local solar time in August are selected.
The left panel of Fig. 8 shows AAOD profiles for the zonal-mean reference state (orange line) and in the ASM core region (22.5–25° N, 87.5–90° E; blue line) in August. Below 80 hPa, AAOD concentration is about 2 times larger in the core region than the zonal mean. Figure 8 also shows aerosol effects on shortwave and longwave radiative heating in the core region under different tropospheric scenarios. The shortwave aerosol heating rate computed for clear-sky conditions (Gao et al., 2023; Fig. 5) is therefore best compared with the kernel for a 200 hPa albedo of 0.1. Between 110–180 hPa, the kernel indicates an aerosol effect of about 0.15 K d−1, quite similar to that result; however, the shortwave heating effect above 80 hPa is close to 0, smaller than the previous result. This difference may be explained by a combination of the difference in reference states (zonal mean as opposed to pristine) and radiative transfer models (RRTMG as opposed to libRadtran; Fig. S9). The aerosol effect on longwave heating weakens with decreasing emission temperature and even becomes negative for the smallest 200 hPa emission temperature of 222.9 K. A similar effect has been found for thin cirrus overlying deep convection (Hartmann et al., 2001; Fueglistaler and Fu, 2006). The time-mean 200 hPa albedo in the core region is about 0.24, so the 200 hPa albedo of 0.25 can roughly represent the all-sky scenario. When considering typical tropospheric cloud cover, the ATAL aerosol effect on shortwave radiative heating in this region is about 0.03 K d−1 larger than the estimates for clear-sky conditions.
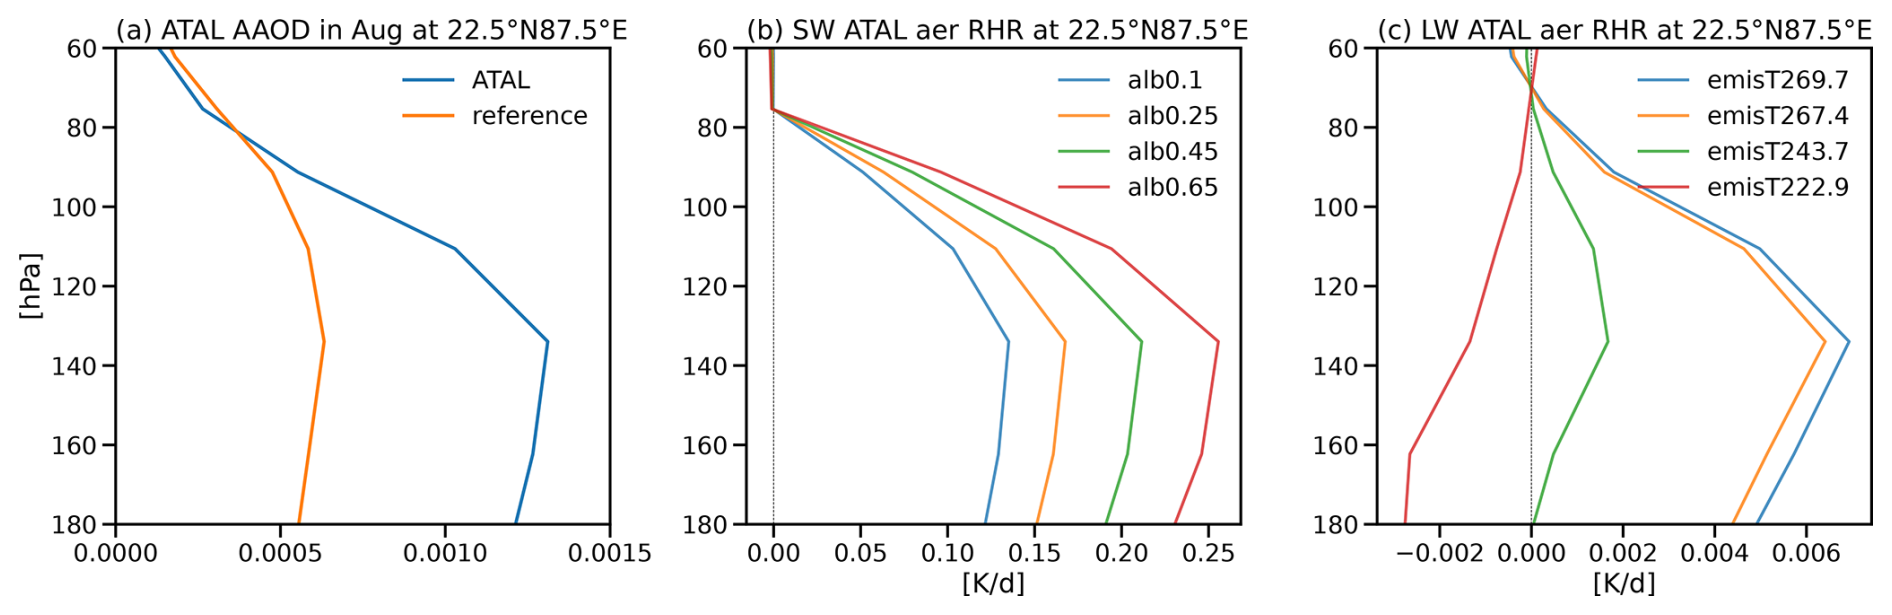
Figure 8(a) 550 nm AAOD in the zonal-mean reference profile (orange) and at 22.5° N, 50–120° E (blue) within 180–60 hPa, both averaged for August 2011–2020. (b) The ATAL aerosol effect on shortwave heating at 22.5° N, 87.5° E with 200 hPa albedo set to 0.1 (blue), 0.25 (orange), 0.45 (green), and 0.65 (red) in August at 12:00 local solar time. (c) The ATAL aerosol effect on longwave heating at the same location with 200 hPa emission temperature set to 269.7 K (blue), 267.4 K (orange), 243.7 K (green), and 222.9 K (red).
5.2 Other potential applications
It is difficult to draw firm conclusions about radiative forcing by stratospheric aerosols associated with extreme events or contingency plans. The uncertain duration and composition, fragmented distribution, complex characteristics, and broad spatial distributions of aerosols during those events increase the difficulty and computational cost of simulating aerosol radiative effects directly using radiative transfer models. Radiative kernels provide a convenient and flexible alternative to estimating these effects, their impacts, and associated uncertainties. This is particularly helpful for the understanding of emergent extreme events (e.g., extreme wildfires).
For example, the large wildfires that occurred in southeastern Australia during 2019–2020 resulted in a near-tripling of the maximum AOD and substantially larger aerosol concentrations in the stratosphere (Khaykin et al., 2020; van der Velde et al., 2021). In MERRA-2, only the aerosol data from 10 January show this event, on which the 550 nm AOD at 200 hPa reached 0.005, plotted in Fig. 9a. The SW aerosol radiative effect caused by wildfire is about 10 times larger than that of LW both for radiative flux and radiative heating rate. This wildfire event caused the radiative flux decrease from 0.1 to but also caused the radiative heating rate increase to 0.1 K d−1 near tropopause. Smoke aerosols associated with large and persistent fires can reach high altitudes with large fractions of carbonaceous aerosols (Yang et al., 2021). Volcanic eruptions can also inject aerosols and aerosol precursors directly into the stratosphere. In addition to natural events, certain geoengineering strategies for solar radiation management are based on injecting aerosols or aerosol precursors into the stratosphere. Intended to mitigate global warming, proposals for stratospheric aerosol geoengineering (SAG; MacMartin et al., 2016) include the Stratospheric Particle Injection for Climate Engineering (SPICE; Pidgeon et al., 2013). The possible side effects of such strategies are not yet fully resolved.
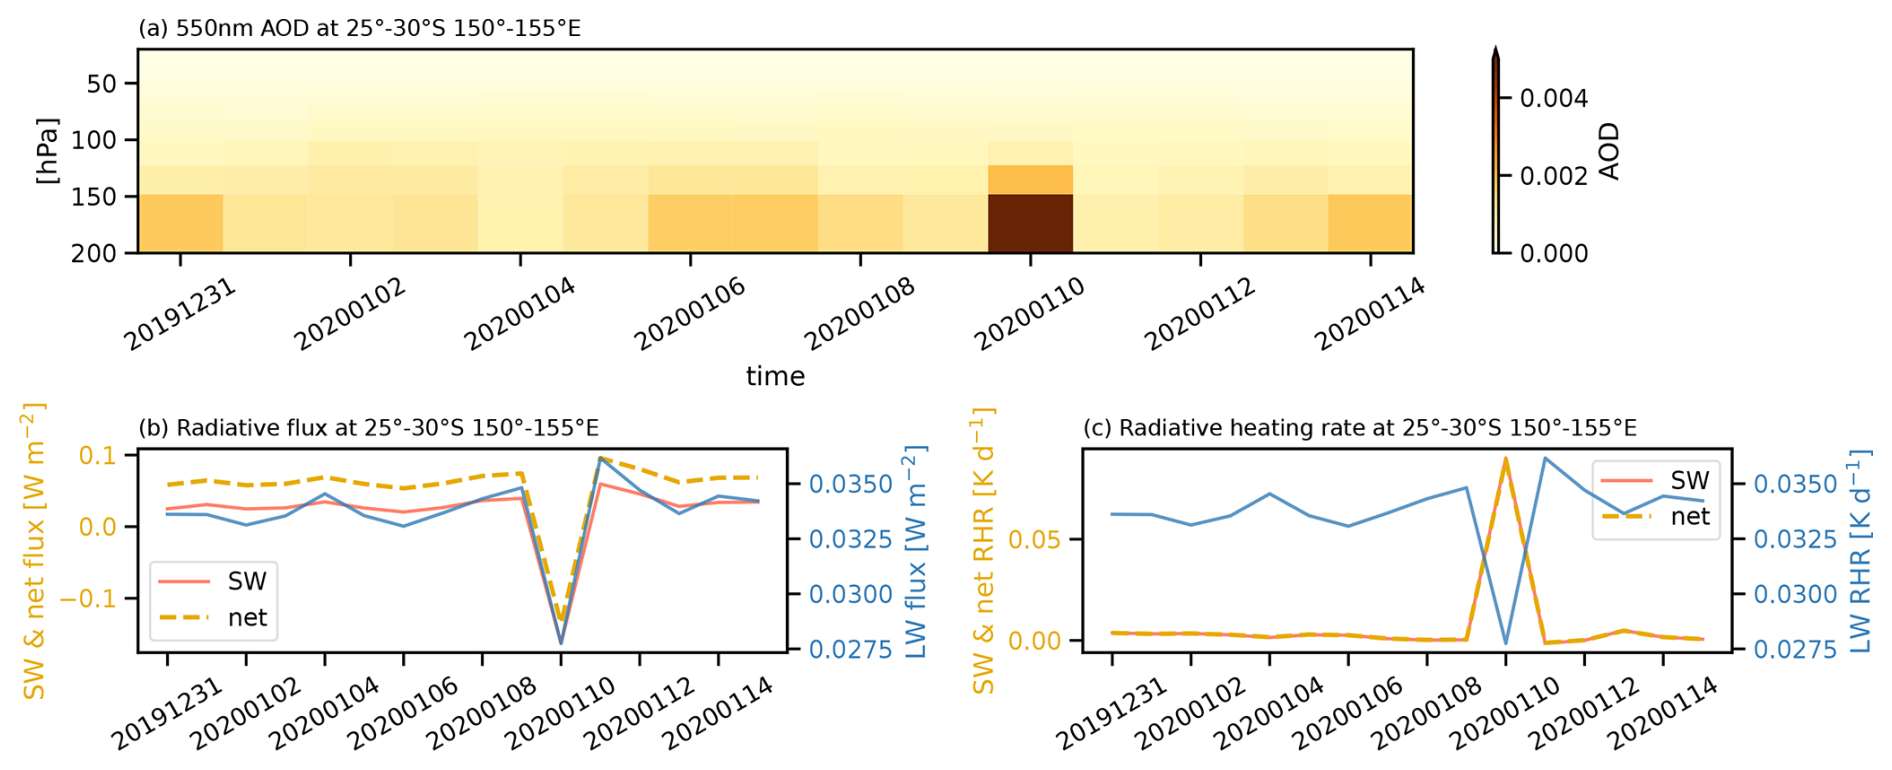
Figure 9(a) 550 nm AOD averaged at 25–30° S, 150–155° E during 31 December 2019–14 January 2020. (b) The radiative flux effect of shortwave (solid red line with y axis on the left), longwave (solid blue line with y axis on the right), and net (dashed yellow line with y axis on the left) around 200 hPa at 25–30° S, 150–155° E during 31 December 2019–14 January 2020. (c) Same as panel (b) but for radiative heating rate.
As previous studies have demonstrated the feasibility of simulating aerosol effects on radiative fluxes by using radiative kernels (Matus et al., 2019; Thorsen et al., 2020; Kramer et al., 2021), we extend this approach to aerosol effects on radiative heating. Tests indicate that linear kernels can be used to represent aerosol effects on radiative fluxes for changes in aerosol optical depth (AOD) up to twice the reference state AOD. Aerosol effects on radiative heating can be represented by linear kernels for the full range of tested perturbations, up to at least 10 times the reference state AOD. For the sake of data availability, convenience, and accuracy, we construct kernels based on absorbing AOD (AAOD) and scattering AOD (SAOD). Separate sets of shortwave kernels are constructed for each month and retain diurnal variations at 3-hourly intervals; longwave kernels are independent with time.
To simplify the model, we construct UTS aerosol and cloud ice kernels in latitude bands relative to zonal-mean reference states. The lower boundary conditions of the radiative transfer model are set at 200 hPa to roughly represent the state of the underlying troposphere. The radiative impact of the tropospheric state is represented by 200 hPa albedo in shortwave simulations and emission temperature in longwave simulations, with kernels calculated for four scenarios: clear sky, low cloud, middle cloud, and high cloud. Cirrus clouds in the UTS (p≤200 hPa) are treated as aerosols. Our calculations produce AAOD, SAOD, and cloud optical depth (COD) shortwave kernels and AOD and COD longwave kernels (RRTMG_LW does not include aerosol scattering effects).
The absorbing aerosol shortwave net flux kernel is positive above the perturbed layer and negative below. As 200 hPa albedo increases, the positive kernel above strengthens and the negative kernel below weakens. The scattering aerosol and cloud shortwave net flux have no vertical variations because of competing effects on upward and downward fluxes, but their negative kernels weaken as albedo increases because the effects of scattering saturate. The absorbing aerosol shortwave radiative heating kernel is much larger than those for scattering aerosol or cloud because the small concentrations of absorbing aerosol are small. Given the same size of perturbation, the aerosol radiative kernels are stronger for perturbations at higher altitudes.
The aerosol net longwave flux kernels are uniformly negative, with larger values above the perturbation level and smaller values below. These effects weaken as the 200 hPa emission temperature decreases. Cloud ice kernels likewise show smaller negative impacts on fluxes below and larger negative impacts on fluxes above. Unlike the shortwave kernels, the longwave radiative heating kernels are not always positive. Effects on heating weaken when the upward longwave flux from the troposphere decreases and change sign to local cooling for the smallest upward fluxes (corresponding to a 200 hPa emission temperature of 222.9 K). As the precision of AOD in RRTMG_SW and RRTMG_LW is 10−5, the small amount of stratospheric aerosol means that its representation in models is limited by numerical accuracy, an important source of uncertainty in these and other simulations based on RRTMG.
Inclusion of a clear, clean troposphere in the model simulations results in 200 hPa fluxes that fall within the four scenarios used for the simulations bounded by 200 hPa. Our results match CERES-based fluxes at 200 hPa well for both longwave and shortwave within 09:00–15:00 local solar time. Estimated high cloud fractions are larger in CERES than indicated by the MLS, causing our simulations of all-sky 200 hPa downward flux to exceed that based on CERES.
Our tropical kernels are intended to reconstruct the radiative effects of aerosol events in the upper troposphere and stratosphere. In particular, we show that the kernels can reliably reproduce the ATAL aerosol effects on clear-sky shortwave heating, thus providing an initial validation of the proposed kernels. These kernels can provide a more flexible and less computationally expensive means of estimating the radiative effects of the ATAL and other sources of UTS aerosols, including volcanic eruptions, smoke plumes from large fires, and possible strategies for geoengineering through solar radiation management. Datasets including three-dimensional aerosol concentration or cloud optical depth data could use this radiative kernel, choosing the corresponding month and local time to estimate stratospheric radiative effects.
However, many aspects of the tropical stratospheric aerosol radiative kernels remain to be improved. Firstly, large variations in stratospheric aerosol loading can influence the accuracy of the kernel. For example, the kernels overestimate aerosol effects on radiative fluxes for values of AOD more than 2 times larger than the reference AOD. Kernel-based estimates of radiative heating are much less sensitive to this problem. Secondly, there are uncertainties associated with our selection of representative lower boundary conditions, particularly in the distribution of the net longwave flux across individual bands. For example, while a real-world clear-sky scenario would involve a larger effective emission temperature in the window region than in the CO2 or water vapor bands, we assume a single effective emission temperature across all bands. These limitations will be addressed in future versions of the kernels.
Both MERRA-2 reanalysis data and MLS observation data are available and can be accessed through the NASA Goddard Earth Sciences Data and Information Services Center (GES DISC): https://doi.org/10.5067/LTVB4GPCOTK2 (GMAO, 2023). The ERA5 products are publicly provided by ECMWF: https://cds.climate.copernicus.eu/#!/search?text=ERA5&type=dataset (C3S, 2023). The CERES data used in this study can be found in the NASA Langley Research Center CERES Data and Information Archive: https://ceres.larc.nasa.gov/data (NASA, 2025). RRTMG is available at https://doi.org/10.5281/zenodo.14357597 (AER, 2016) (official website http://rtweb.aer.com/rrtm_frame.html, AER, 2025); the license can be found at the beginning of the instruction file.
The codes for running RRTMG and calculating radiative kernels are available at https://doi.org/10.5281/zenodo.14359763 (Gao, 2024a). The calculated aerosol and cirrus cloud radiative kernels are available at https://doi.org/10.5281/zenodo.14913495 (Gao, 2024b).
The supplement related to this article is available online at https://doi.org/10.5194/gmd-18-2569-2025-supplement.
JG downloaded data, ran the model, conducted the validation test, created figures, and wrote the paper. YH guided model usage, helped with technical choices, and designed the methodology. JSW conceived the project, conducted the validation test, and helped to revise the paper. KL provided and advised on kernel application and revised the paper. TG helped with project development and helped to revise the paper. QY helped to design the methodology, provided data, and revised the paper.
The contact author has declared that none of the authors has any competing interests.
Publisher's note: Copernicus Publications remains neutral with regard to jurisdictional claims made in the text, published maps, institutional affiliations, or any other geographical representation in this paper. While Copernicus Publications makes every effort to include appropriate place names, the final responsibility lies with the authors.
We appreciate Yiran Peng and Ying Zhang for their help on aerosol optical property calculations and running RRTMG, each person in Yi Huang's team for suggestions on radiation, and Wenju Cai for his support and constructive comments.
This research has been supported by the Department of Science and Technology of Shandong Province (grant no. ZR2024QD136); the Ministry of Science and Technology of the People's Republic of China; the National Natural Science Foundation of China (grant no. 2017YFC1501404); and the Natural Sciences and Engineering Research Council of Canada, RES'EAU-WaterNET (grant-no. RGPIN-2019-04511).
This paper was edited by Simone Marras and reviewed by Hua Zhang and one anonymous referee.
AER – Atmospheric and Environmental Research: Rapid Radiative Transfer Model for GCMs, ShortWave (RRTMG_SW), Rapid Radiative Transfer Model for GCMs, LongWave (RRTMG_LW), Zenodo [code], https://doi.org/10.5281/zenodo.14357597, 2016.
AER – Atmospheric and Environmental Research: RRTM (Stand-Alone Model)/RRTMG (GCM Applications), AER, http://rtweb.aer.com/rrtm_frame.html (last access: 30 April 2025), 2025.
Bani Shahabadi, M. and Huang, Y.: Logarithmic radiative effect of water vapor and spectral kernels, J. Geophys. Res.-Atmos., 119, 6000–6008, https://doi.org/10.1002/2014jd021623, 2014.
Bell, B., Hersbach, H., Simmons, A., Berrisford, P., Dahlgren, P., Horányi, A., Muñoz-Sabater, J., Nicolas, J., Radu, R., Schepers, D., Soci, C., Villaume, S., Bidlot, J. R., Haimberger, L., Woollen, J., Buontempo, C., and Thépaut, J. N.: The ERA5 global reanalysis: Preliminary extension to 1950, Q. J. Roy. Meteor. Soc., 147, 4186–4227, https://doi.org/10.1002/qj.4174, 2021.
Bergman, J. W., Fierli, F., Jensen, E. J., Honomichl, S., and Pan, L. L.: Boundary layer sources for the Asian anticyclone: Regional contributions to a vertical conduit, J. Geophys. Res.-Atmos., 118, 2560–2575, https://doi.org/10.1002/jgrd.50142, 2013.
Bian, J., Li, D., Bai, Z., Li, Q., Lyu, D., and Zhou, X.: Transport of Asian surface pollutants to the global stratosphere from the Tibetan Plateau region during the Asian summer monsoon, Natl. Sci. Rev., 7, 516–533, https://doi.org/10.1093/nsr/nwaa005, 2020.
Brühl, C., Schallock, J., Klingmüller, K., Robert, C., Bingen, C., Clarisse, L., Heckel, A., North, P., and Rieger, L.: Stratospheric aerosol radiative forcing simulated by the chemistry climate model EMAC using Aerosol CCI satellite data, Atmos. Chem. Phys., 18, 12845–12857, https://doi.org/10.5194/acp-18-12845-2018, 2018.
Brunamonti, S., Jorge, T., Oelsner, P., Hanumanthu, S., Singh, B. B., Kumar, K. R., Sonbawne, S., Meier, S., Singh, D., Wienhold, F. G., Luo, B. P., Boettcher, M., Poltera, Y., Jauhiainen, H., Kayastha, R., Karmacharya, J., Dirksen, R., Naja, M., Rex, M., Fadnavis, S., and Peter, T.: Balloon-borne measurements of temperature, water vapor, ozone and aerosol backscatter on the southern slopes of the Himalayas during StratoClim 2016–2017, Atmos. Chem. Phys., 18, 15937–15957, https://doi.org/10.5194/acp-18-15937-2018, 2018.
Buchard, V., da Silva, A. M., Colarco, P. R., Darmenov, A., Randles, C. A., Govindaraju, R., Torres, O., Campbell, J., and Spurr, R.: Using the OMI aerosol index and absorption aerosol optical depth to evaluate the NASA MERRA Aerosol Reanalysis, Atmos. Chem. Phys., 15, 5743–5760, https://doi.org/10.5194/acp-15-5743-2015, 2015.
Buchard, V., Randles, C. A., da Silva, A. M., Darmenov, A., Colarco, P. R., Govindaraju, R., Ferrare, R., Hair, J., Beyersdorf, A. J., Ziemba, L. D., and Yu, H.: The MERRA-2 Aerosol Reanalysis, 1980 Onward, Part II: Evaluation and Case Studies, J. Climate 30, 6851–6872, https://doi.org/10.1175/jcli-d-16-0613.1, 2017.
C3S – Copernicus Climate Change Service: ERA5: Fifth generation of ECMWF atmospheric reanalyses of the global climate, CDS – Copernicus Climate Change Service Climate Data Store [data set]. https://cds.climate.copernicus.eu/#!/search?text=ERA5&type=dataset (last access: 30 April 2025), 2023.
Davis, S. M., Hegglin, M. I., Fujiwara, M., Dragani, R., Harada, Y., Kobayashi, C., Long, C., Manney, G. L., Nash, E. R., Potter, G. L., Tegtmeier, S., Wang, T., Wargan, K., and Wright, J. S.: Assessment of upper tropospheric and stratospheric water vapor and ozone in reanalyses as part of S-RIP, Atmos. Chem. Phys., 17, 12743–12778, https://doi.org/10.5194/acp-17-12743-2017, 2017.
Dethof, A., O'Neill, A., Slingo, J. M., and Smit, H. G. J.: A mechanism for moistening the lower stratosphere involving the Asian summer monsoon., Q. J. Roy. Meteor. Soc., 125, 1079–1106, https://doi.org/10.1002/qj.1999.49712555602, 1999.
Doelling, D. R., Sun, M., Nguyen, L. T., Nordeen, M. L., Haney, C. O., Keyes, D. F., and Mlynczak, P. E.: Advances in Geostationary-Derived Longwave Fluxes for the CERES Synoptic (SYN1deg) Product, J. Atmos. Ocean. Tech., 33, 503–521, https://doi.org/10.1175/jtech-d-15-0147.1, 2016.
Dong, B., Wilcox, L. J., Highwood, E. J., and Sutton, R. T.: Impacts of recent decadal changes in Asian aerosols on the East Asian summer monsoon: roles of aerosol–radiation and aerosol–cloud interactions, Clim. Dynam., 53, 3235–3256, https://doi.org/10.1007/s00382-019-04698-0, 2019.
Fadnavis, S., Kalita, G., Kumar, K. R., Gasparini, B., and Li, J.-L. F.: Potential impact of carbonaceous aerosol on the upper troposphere and lower stratosphere (UTLS) and precipitation during Asian summer monsoon in a global model simulation, Atmos. Chem. Phys., 17, 11637–11654, https://doi.org/10.5194/acp-17-11637-2017, 2017.
Fadnavis, S., Müller, R., Kalita, G., Rowlinson, M., Rap, A., Li, J.-L. F., Gasparini, B., and Laakso, A.: The impact of recent changes in Asian anthropogenic emissions of SO2 on sulfate loading in the upper troposphere and lower stratosphere and the associated radiative changes, Atmos. Chem. Phys., 19, 9989–10008, https://doi.org/10.5194/acp-19-9989-2019, 2019.
Fu, Q.: An Accurate Parameterization of the Solar Radiative Properties of Cirrus Clouds for Climate Models., J. Climate, 9, 2058–2082, https://doi.org/10.1175/1520-0442(1996)009<2058:AAPOTS>2.0.CO;2, 1996.
Fu, Q., Yang, P., and Sun, W. B.: An Accurate Parameterization of the Infrared Radiative Properties of Cirrus Clouds for Climate Models, J. Climate, 11, 2223–2237, https://doi.org/10.1175/1520-0442(1998)011<2223:AAPOTI>2.0.CO;2, 1998.
Fueglistaler, S. and Fu, Q.: Impact of clouds on radiative heating rates in the tropical lower stratosphere, J. Geophys. Res.-Atmos., 111, D23202, https://doi.org/10.1029/2006jd007273, 2006.
Fueglistaler, S., Bonazzola, M., Haynes, P. H., and Peter, T.: Stratospheric water vapor predicted from the Lagrangian temperature history of air entering the stratosphere in the tropics, J. Geophys. Res.-Atmos., 110, D08107, https://doi.org/10.1029/2004jd005516, 2005.
Fujiwara, M., Manney, G. L., Gray, L. J., Wright, J. S., Tegtmeier, S., Ivanciu, I., and Pilch Kedzierski, R.: SPARC Reanalysis Intercomparison Project (S-RIP) Final Report R 296-5785, https://www.researchgate.net/publication/358305540_SPARC_Reanalysis_Intercomparison_Project_S-RIP_Final_Report (last access: 10 November 2023), 2022.
Gao, J.: Codes for “Estimation of aerosol and cloud radiative heating rate in tropical stratosphere using radiative kernel method”, Zenodo [code], https://doi.org/10.5281/zenodo.14359763, 2024a.
Gao, J.: Aerosol and cirrus cloud radiative kernels in upper troposphere and stratosphere, Zenodo [code], https://doi.org/10.5281/zenodo.14913495, 2024b.
Gao, J., Huang, Y., Peng, Y., and Wright, J. S.: Aerosol effects on clear‐sky shortwave heating in the Asian monsoon tropopause layer, J. Geophys. Res.-Atmos., 128, e2022JD036956, https://doi.org/10.1029/2022JD036956, 2023.
Ge, W., Liu, J., Xiang, S., Zhou, Y., Zhou, J., Hu, X., Ma, J., Wang, X., Wan, Y., Hu, J., Zhang, Z., Wang, X., and Tao, S.: Improvement and Uncertainties of Global Simulation of Sulfate Concentration and Radiative Forcing in CESM2, J. Geophys. Res.-Atmos., 127, e2022JD037623, https://doi.org/10.1029/2022jd037623, 2022.
GMAO – Global Modeling and Assimilation Office: inst3_3d_aer_Nv: MERRA-2 3D IAU State, Meteorology Instantaneous 3-hourly (p-coord, 0.625×0.5L42), version 5.12.4, GSFC DAAC – Goddard Space Flight Center Distributed Active Archive Center [data set], https://doi.org/10.5067/LTVB4GPCOTK2, 2023.
Hanumanthu, S., Vogel, B., Müller, R., Brunamonti, S., Fadnavis, S., Li, D., Ölsner, P., Naja, M., Singh, B. B., Kumar, K. R., Sonbawne, S., Jauhiainen, H., Vömel, H., Luo, B., Jorge, T., Wienhold, F. G., Dirkson, R., and Peter, T.: Strong day-to-day variability of the Asian Tropopause Aerosol Layer (ATAL) in August 2016 at the Himalayan foothills, Atmos. Chem. Phys., 20, 14273–14302, https://doi.org/10.5194/acp-20-14273-2020, 2020.
Hartmann, D. L., Holton, J. R., and Fu, Q.: The heat balance of the tropical tropopause, cirrus, and stratospheric dehydration, Geophys. Res. Lett., 28, 1969–1972, https://doi.org/10.1029/2000gl012833, 2001.
Heald, C. L., Ridley, D. A., Kroll, J. H., Barrett, S. R. H., Cady-Pereira, K. E., Alvarado, M. J., and Holmes, C. D.: Contrasting the direct radiative effect and direct radiative forcing of aerosols, Atmos. Chem. Phys., 14, 5513–5527, https://doi.org/10.5194/acp-14-5513-2014, 2014.
Hersbach, H., Bell, B., Berrisford, P., Hirahara, S., Horányi, A., Muñoz-Sabater, J., Nicolas, J., Peubey, C., Radu, R., Schepers, D., Simmons, A., Soci, C., Abdalla, S., Abellan, X., Balsamo, G., Bechtold, P., Biavati, G., Bidlot, J., Bonavita, M., De Chiara, G., Dahlgren, P., Dee, D., Diamantakis, M., Dragani, R., Flemming, J., Forbes, R., Fuentes, M., Geer, A., Haimberger, L., Healy, S., Hogan, R. J., Hólm, E., Janisková, M., Keeley, S., Laloyaux, P., Lopez, P., Lupu, C., Radnoti, G., de Rosnay, P., Rozum, I., Vamborg, F., Villaume, S., and Thépaut, J.: The ERA5 global reanalysis, Q. J. Roy. Meteorol. Soc., 146, 1999–2049, 2020.
Huang, H. and Huang, Y.: Nonlinear Coupling Between Longwave Radiative Climate Feedbacks, J. Geophys. Res.-Atmos., 126, e2020JD033995, https://doi.org/10.1029/2020jd033995, 2021.
Huang, H., Huang, Y., Wei, Q., and Hu, Y.: Band-by-band spectral radiative kernels based on the ERA5 reanalysis, Sci. Data, 11, 237, https://doi.org/10.1038/s41597-024-03080-y, 2024.
Huang, Y., Ramaswamy, V., and Soden, B.: An investigation of the sensitivity of the clear-sky outgoing longwave radiation to atmospheric temperature and water vapor, J. Geophys. Res.-Atmos., 112, D05104, https://doi.org/10.1029/2005jd006906, 2007.
Huang, Y., Xia, Y., and Tan, X.: On the pattern of CO2 radiative forcing and poleward energy transport, J. Geophys. Res.-Atmos., 122, 10578–10593, https://doi.org/10.1002/2017jd027221, 2017.
Hurrell, J. W., Holland, M. M., Gent, P. R., Ghan, S., Kay, J. E., Kushner, P. J., Lamarque, J. F., Large, W. G., Lawrence, D., Lindsay, K., Lipscomb, W. H., Long, M. C., Mahowald, N., Marsh, D. R., Neale, R. B., Rasch, P., Vavrus, S., Vertenstein, M., Bader, D., Collins, W. D., Hack, J. J., Kiehl, J., and Marshall, S.: The Community Earth System Model: A Framework for Collaborative Research, B. Am. Meteorol. Soc., 94, 1339–1360, https://doi.org/10.1175/bams-d-12-00121.1, 2013.
IPCC: Climate Change 2021: The Physical Science Basis, in: Contribution of Working Group I to the Sixth Assessment Report of the Intergovernmental Panel on Climate Change, edited by: Masson-Delmotte, V., Zhai, P., Pirani, A., Connors, S. L., Péan, C., Berger, S., Caud, N., Chen, Y., Goldfarb, L., Gomis, M. I., Huang, M., Leitzell, K., Lonnoy, E., Matthews, J. B. R., Maycock, T. K., Waterfield, T., Yelekçi, O., Yu, R., and Zhou, B., Cambridge University Press, https://doi.org/10.1017/9781009157896, 2021.
Jonko, A. K., Shell, K. M., Sanderson, B. M., and Danabasoglu, G.: Climate feedbacks in CCSM3 under changing CO2 forcing. Part I: Adapting the linear radiative kernel technique to feedback calculations for a broad range of forcings, J. Climate, 25, 5260–5272, https://doi.org/10.1175/JCLI-D-11-00524.1, 2012.
Khaykin, S., Legras, B., Bucci, S., Sellitto, P., Isaksen, L., Tencé, F., Bekki, S., Bourassa, A., Rieger, L., Zawada, D., Jumelet, J., and Godin-Beekmann, S.: The 2019/20 Australian wildfires generated a persistent smoke-charged vortex rising up to 35 km altitude, Commun. Earth Environ., 1, 22, https://doi.org/10.1038/s43247-020-00022-5, 2020.
Kramer, R. J., Matus, A. V., Soden, B. J., and L'Ecuyer, T. S.: Observation-Based Radiative Kernels From CloudSat/CALIPSO, J. Geophys. Res.-Atmos., 124, 5431–5444, https://doi.org/10.1029/2018jd029021, 2019.
Kramer, R. J., He, H., Soden, B. J., Oreopoulos, L., Myhre, G., Forster, P. M., and Smith, C. J.: Observational Evidence of Increasing Global Radiative Forcing, Geophys. Res. Lett., 48, e2020GL091585, https://doi.org/10.1029/2020gl091585, 2021.
Kuniyal, J. C. and Guleria, R. P.: The current state of aerosol-radiation interactions: A mini review, J. Aerosol Sci., 130, 45–54, https://doi.org/10.1016/j.jaerosci.2018.12.010, 2019.
MacMartin, D. G., Kravitz, B., Long, J. C. S., and Rasch, P. J.: Geoengineering with stratospheric aerosols: What do we not know after a decade of research?, Earths Future, 4, 543–548, https://doi.org/10.1002/2016ef000418, 2016.
Manney, G. L., Livesey, N. J., Santee, M. L., Froidevaux, L., Lambert, A., Lawrence, Z. D., Millán, L. F., Neu, J. L., Read, W. G., Schwartz, M. J., and Fuller, R. A.: Record-Low Arctic Stratospheric Ozone in 2020: MLS Observations of Chemical Processes and Comparisons With Previous Extreme Winters, Geophys. Res. Lett., 47, e2020GL089063, https://doi.org/10.1029/2020gl089063, 2020.
Manney, G. L., Santee, M. L., Lawrence, Z. D., Wargan, K., and Schwartz, M. J.: A moments view of climatology and variability of the Asian summer monsoon anticyclone, J. Climate, 34, 7821–7841, https://doi.org/10.1175/JCLI-D-20-0729.1, 2021.
Matus, A. V., L'Ecuyer, T. S., and Henderson, D. S: New estimates of aerosol direct radiative effects and forcing from A-train satellite observations, Geophys. Res. Lett., 46, 8338–8346, https://doi.org/10.1029/2019GL083656, 2019.
Mlawer, E. J., Taubman, S. J., Brown, P. D., Iacono, M. J., and Clough, S. A.: Radiative transfer for inhomogeneous atmospheres: RRTM, a validated correlated-k model for the longwave, J. Geophys. Res.-Atmos., 102, 16663–16682, https://doi.org/10.1029/97jd00237, 1997.
NASA: CERES Data Products, NASA, https://ceres.larc.nasa.gov/data (last access: 30 April 2025), 2025.
Neely, R. R., Yu, P., Rosenlof, K. H., Toon, O. B., Daniel, J. S., Solomon, S., and Miller, H. L.: The contribution of anthropogenic SO2 emissions to the Asian tropopause aerosol layer, J. Geophys. Res.-Atmos., 119, 1571–1579, https://doi.org/10.1002/2013jd020578, 2014.
Nützel, M., Podglajen, A., Garny, H., and Ploeger, F.: Quantification of water vapour transport from the Asian monsoon to the stratosphere, Atmos. Chem. Phys., 19, 8947–8966, https://doi.org/10.5194/acp-19-8947-2019, 2019.
Orbe, C., Waugh, D. W., and Newman, P. A.: Air-mass origin in the tropical lower stratosphere: The influence of Asian boundary layer air, Geophys. Res. Lett., 42, 4240–4248, https://doi.org/10.1002/2015gl063937, 2015.
Pan, L. L., Honomichl, S. B., Kinnison, D. E., Abalos, M., Randel, W. J., Bergman, J. W., and Bian, J.: Transport of chemical tracers from the boundary layer to stratosphere associated with the dynamics of the Asian summer monsoon, J. Geophys. Res.-Atmos., 121, 14159–14174, https://doi.org/10.1002/2016jd025616, 2016.
Park, M., Randel, W. J., Gettelman, A., Massie, S. T., and Jiang, J. H.: Transport above the Asian summer monsoon anticyclone inferred from Aura Microwave Limb Sounder tracers, J. Geophys. Res.-Atmos., 112, D16309, https://doi.org/10.1029/2006jd008294, 2007.
Pidgeon, N., Parkhill, K., Corner, A., and Vaughan, N.: Deliberating stratospheric aerosols for climate geoengineering and the SPICE project, Nat. Clim. Change, 3, 451–457, https://doi.org/10.1038/nclimate1807, 2013.
Ploeger, F., Konopka, P., Walker, K., and Riese, M.: Quantifying pollution transport from the Asian monsoon anticyclone into the lower stratosphere, Atmos. Chem. Phys., 17, 7055–7066, https://doi.org/10.5194/acp-17-7055-2017, 2017.
Randel, W. J. and Park, M.: Deep convective influence on the Asian summer monsoon anticyclone and associated tracer variability observed with Atmospheric Infrared Sounder (AIRS), J. Geophys. Res.-Atmos., 111, D12314, https://doi.org/10.1029/2005jd006490, 2006.
Randles, C. A., Da Silva, A. M., Buchard, V., Colarco, P. R., Darmenov, A., Govindaraju, R., Smirnov, A., Holben, B., Ferrare, R., Hair, J., Shinozuka, Y., and Flynn, C. J.: The MERRA-2 Aerosol Reanalysis, 1980–onward, Part I: System Description and Data Assimilation Evaluation, J. Climate, 30, 6823–6850, https://doi.org/10.1175/JCLI-D-16-0609.1, 2017.
Sanderson, B. M. and Shell, K. M.: Model-Specific Radiative Kernels for Calculating Cloud and Noncloud Climate Feedbacks, J. Climate, 25, 7607–7624, https://doi.org/10.1175/jcli-d-11-00726.1, 2012.
Sanderson, B. M., Shell, K. M., and Ingram, W.: Climate feedbacks determined using radiative kernels in a multi-thousand member ensemble of AOGCMs, Clim. Dynam., 35, 1219–1236, https://doi.org/10.1007/s00382-009-0661-1, 2009.
Shell, K. M., Kiehl, J., and Shields, C.: Using the radiative kernel technique to calculate climate feedbacks in NCAR's Community Atmospheric Model, J. Climate, 21, 2269–2282, https://doi.org/10.1175/2007JCLI2044.1, 2008.
Shi, C.-H., Chang, S.-J., Guo, D., Xu, J.-J., and Zhang, C.-X.: Exploring the relationship between the cloud-top and tropopause height in boreal summer over the Tibetan Plateau and its adjacent region, Atmospheric and Oceanic Science Letters, 11, 173–179, https://doi.org/10.1080/16742834.2018.1438738, 2018.
Skamarock, W. C. and Klemp, J. B.: A time-split nonhydrostatic atmospheric model for weather research and forecasting applications, J. Comput. Phys., 227, 3465–3485, https://doi.org/10.1016/j.jcp.2007.01.037, 2008.
Soden, B. J. and Held, I. M.: An Assessment of Climate Feedbacks in Coupled Ocean–Atmosphere Models, J. Climate, 19, 3354–3360, https://doi.org/10.1175/JCLI3799.1, 2006.
Soden, B. J., Held, I. M., Colman, R., Shell, K. M., Kiehl, J. T., and Shields, C. A.: Quantifying Climate Feedbacks Using Radiative Kernels, J. Climate, 21, 3504–3520, https://doi.org/10.1175/2007jcli2110.1, 2008.
Su, H., Jiang, J. H., Liu, X., Penner, J. E., Read, W. G., Massie, S., Schoeberl, M. R., Colarco, P., Livesey, N. J., and Santee, M. L.: Observed increase of TTL temperature and water vapor in polluted clouds over Asia, J. Climate, 24, 2728–2736, https://doi.org/10.1175/2010JCLI3749.1, 2011.
Tegtmeier, S., Anstey, J., Davis, S., Dragani, R., Harada, Y., Ivanciu, I., Pilch Kedzierski, R., Krüger, K., Legras, B., Long, C., Wang, J. S., Wargan, K., and Wright, J. S.: Temperature and tropopause characteristics from reanalyses data in the tropical tropopause layer, Atmos. Chem. Phys., 20, 753–770, https://doi.org/10.5194/acp-20-753-2020, 2020.
Thorsen, T. J., Ferrare, R. A., Kato, S., and Winker, D. M.: Aerosol Direct Radiative Effect Sensitivity Analysis, J. Climate, 33, 6119–6139, https://doi.org/10.1175/jcli-d-19-0669.1, 2020.
Toohey, M., Krüger, K., Bittner, M., Timmreck, C., and Schmidt, H.: The impact of volcanic aerosol on the Northern Hemisphere stratospheric polar vortex: mechanisms and sensitivity to forcing structure, Atmos. Chem. Phys., 14, 13063–13079, https://doi.org/10.5194/acp-14-13063-2014, 2014.
van der Velde, I. R., van er Werf, G. R., Houweling, S., Maasakkers, J. D., Borsdorff, T., Landgraf, J., Tol, P., van Kempen, T., van Hees, R., Hoogeveen, R., Veefkind, J. P., and Aben, I.: Vast CO2 release from Australian fires in 2019–2020 constrained by satellite, Nature, 597, 366–369, https://doi.org/10.1038/s41586-021-03712-y, 2021.
Vernier, J. P., Fairlie, T. D., Natarajan, M., Wienhold, F. G., Bian, J., Martinsson, B. G., Crumeyrolle, S., Thomason, L. W., and Bedka, K. M.: Increase in upper tropospheric and lower stratospheric aerosol levels and its potential connection with Asian pollution, J. Geophys. Res.-Atmos., 120, 1608–1619, https://doi.org/10.1002/2014JD022372, 2015.
Vernier, J. P., Fairlie, T. D., Deshler, T., Venkat Ratnam, M., Gadhavi, H., Kumar, B. S., Natarajan, M., Pandit, A. K., Akhil Raj, S. T., Hemanth Kumar, A., Jayaraman, A., Singh, A. K., Rastogi, N., Sinha, P. R., Kumar, S., Tiwari, S., Wegner, T., Baker, N., Vignelles, D., Stenchikov, G., Shevchenko, I., Smith, J., Bedka, K., Kesarkar, A., Singh, V., Bhate, J., Ravikiran, V., Durga Rao, M., Ravindrababu, S., Patel, A., Vernier, H., Wienhold, F. G., Liu, H., Knepp, T. N., Thomason, L., Crawford, J., Ziemba, L., Moore, J., Crumeyrolle, S., Williamson, M., Berthet, G., Jégou, F., and Renard, J. B.: BATAL: The Balloon Measurement Campaigns of the Asian Tropopause Aerosol Layer, B. Am. Meteorol. Soc., 99, 955–973, https://doi.org/10.1175/bams-d-17-0014.1, 2018.
Vogel, B., Günther, G., Müller, R., Grooß, J.-U., Afchine, A., Bozem, H., Hoor, P., Krämer, M., Müller, S., Riese, M., Rolf, C., Spelten, N., Stiller, G. P., Ungermann, J., and Zahn, A.: Long-range transport pathways of tropospheric source gases originating in Asia into the northern lower stratosphere during the Asian monsoon season 2012, Atmos. Chem. Phys., 16, 15301–15325, https://doi.org/10.5194/acp-16-15301-2016, 2016.
Waters, J. W., Froidevaux, L., Harwood, R. S., Jarnot, R. F., Pickett, H. M., Read, W. G., Siegel, P. H., Cofield, R. E., Filipiak, M. J., Flower, D. A., Holden, J. R., Lau, G. K., Livesey, N. J., Manney, G. L., Pumphrey, H. C., Santee, M. L., Wu, D. L., Cuddy, D. T., Lay, R. R., Loo, M. S., Perun, V. S., Schwartz, M. J., Stek, P. C., Thurstans, R. P., Boyles, M. A., Chandra, K. M., Chavez, M. C., Gun-Shing, C., Chudasama, B. V., Dodge, R., Fuller, R. A., Girard, M. A., Jiang, J. H., Yibo, J., Knosp, B. W., LaBelle, R. C., Lam, J. C., Lee, K. A., Miller, D., Oswald, J. E., Patel, N. C., Pukala, D. M., Quintero, O., Scaff, D. M., Van Snyder, W., Tope, M. C., Wagner, P. A., and Walch, M. J.: The Earth observing system microwave limb sounder (EOS MLS) on the aura Satellite, IEEE T. Geosci. Remote, 44, 1075–1092, https://doi.org/10.1109/tgrs.2006.873771, 2006.
Wright, J. S., Fu, R., Fueglistaler, S., Liu, Y. S., and Zhang, Y.: The influence of summertime convection over Southeast Asia on water vapor in the tropical stratosphere, J. Geophys. Res., 116, D12302, https://doi.org/10.1029/2010jd015416, 2011.
Wright, J. S., Sun, X., Konopka, P., Krüger, K., Legras, B., Molod, A. M., Tegtmeier, S., Zhang, G. J., and Zhao, X.: Differences in tropical high clouds among reanalyses: origins and radiative impacts, Atmos. Chem. Phys., 20, 8989–9030, https://doi.org/10.5194/acp-20-8989-2020, 2020.
Yan, X., Konopka, P., Ploeger, F., Podglajen, A., Wright, J. S., Müller, R., and Riese, M.: The efficiency of transport into the stratosphere via the Asian and North American summer monsoon circulations, Atmos. Chem. Phys., 19, 15629–15649, https://doi.org/10.5194/acp-19-15629-2019, 2019.
Yang, X., Zhao, C., Yang, Y., Yan, X., and Fan, H.: Statistical aerosol properties associated with fire events from 2002 to 2019 and a case analysis in 2019 over Australia, Atmos. Chem. Phys., 21, 3833–3853, https://doi.org/10.5194/acp-21-3833-2021, 2021.
Yu, P., Toon, O. B., Neely, R. R., Martinsson, B. G., and Brenninkmeijer, C. A.: Composition and physical properties of the Asian Tropopause Aerosol Layer and the North American Tropospheric Aerosol Layer, Geophys. Res. Lett., 42, 2540–2546, https://doi.org/10.1002/2015GL063181, 2015.
Zelinka, M. D., Klein, S. A., and Hartmann, D. L.: Computing and Partitioning Cloud Feedbacks Using Cloud Property Histograms. Part I: Cloud Radiative Kernels, J. Climate, 25, 3715–3735, https://doi.org/10.1175/jcli-d-11-00248.1, 2012.
Zhang, J., Wu, X., Bian, J., Xia, X., Bai, Z., Liu, Y., Cai, Z., Huo, J., and Lyu, D.: Aerosol variations in the upper troposphere and lower stratosphere over the Tibetan Plateau, Environ. Res. Lett., 15, 094068, https://doi.org/10.1088/1748-9326/ab9b43, 2020.
- Abstract
- Introduction
- Data and model
- Kernel feasibility and testing
- Kernel in Tropical Upper Troposphere–Stratosphere Model (TUTSM)
- Applications of the UTS aerosol kernels
- Summary and discussion
- Code and data availability
- Author contributions
- Competing interests
- Disclaimer
- Acknowledgements
- Financial support
- Review statement
- References
- Supplement