the Creative Commons Attribution 4.0 License.
the Creative Commons Attribution 4.0 License.
 | 22 Jun 2026
Benchmarking photolysis rates with Socrates (24.11): species for Earth and exoplanets
Sophia M. Adams
James Manners
Nathan Mayne
Mei Ting Mak
Éric Hébrard
Using the Socrates photolysis scheme, we present newly calculated photolysis rates under modern Earth atmospheric conditions for species directly relevant to Earth and species relevant to different atmospheric compositions. We compare to a previous photolysis comparison exercise, namely PhotoComp 2011. Overall, we find good agreement between our results and previous work, with discrepancies usually caused by the implementation of temperature or pressure dependent quantum yields and updated cross-section data. We provide a new set of benchmark photolysis rates for additional species both for Solar irradiance and when irradiated by an M dwarf host star. In general, the higher actinic flux at far-UV and shorter wavelengths of the M dwarf compared to the Sun drives increased photolysis rates for reactions with high threshold energies. This work provides an updated set of benchmark results for further studies of photolysis in the Earth's atmosphere and that of other planets.
- Article
(12813 KB) - Full-text XML
- BibTeX
- EndNote


Photochemistry is chemistry driven directly by light, and, in the context of studying planetary atmospheres, by stellar irradiation. High energy photons, typically within the ultraviolet (UV) wavelength range, can break down molecules in the upper atmosphere and initiate various chemical reactions and pathways. This process, photolysis, is the degradation of a reactant molecule into constituent product atoms or molecules initiated by the absorption of a photon. Photochemistry plays an important role in the atmospheres of Earth, both modern and early, and potentially for exoplanets (planets orbiting stars other than the Sun) that may have a similar composition.
On Earth, the Chapman cycle generates and maintains the ozone layer at an altitude of ∼25 km, which is the primary atmospheric absorber of UV radiation. The Chapman cycle also interacts with other photochemical cycles, such as those of NOx and HOx species, further impacting the amount of ozone and therefore the transmittance of UV radiation through the atmosphere. At the surface UV irradiation has implications for both prebiotic chemistry and extant life (Ranjan et al., 2017; Rimmer et al., 2018, 2021; Eager-Nash et al., 2024). There are also many other trace gases, such as organic molecules, in the Earth's atmosphere that can undergo photolysis. Photochemistry is therefore likely to play an important role in shaping the habitability of planets. In particular, for Earth-like exoplanets orbiting M-dwarfs, high levels of stellar activity can drive frequent and powerful emission of short-wavelength flux. Work exploring the cycling of ozone has been performed which demonstrated features such as formation of secondary ozone layers, and shielding from flaring caused by ozone build–up from previous flares (Chen et al., 2019; Yates et al., 2020; Braam et al., 2022, 2024; Ridgway, 2023). Photolysis also likely played a key role in the formation of haze, potentially acting to shield the surface from UV radiation to some extent, during the Earth's Archean era, when life was first present (Arney et al., 2016; Mak et al., 2023; Eager-Nash et al., 2024).
In order to calculate photolysis rates, we need information on the absorption cross section of the species involved, the quantum yield of the reactions (i.e. the branching ratio indicating which particular photolysis pathway is most probable), the spectrum of the incoming irradiance from the star at the top of the atmosphere and a treatment of the radiative transfer to determine the resultant actinic flux at a given atmospheric layer. Cross sections and quantum yield data are measured in laboratory experiments or predicted from quantum calculations, with their subsequent recommended values collated in various literature sources. Photolysis models have been used to perform detailed 1D intercomparison studies and provide benchmark photolysis rates, given the input data, in the context of Earth, such as that of CCMVal PhotoComp 2011 (Chipperfield et al., 2010, hereafter termed “PhotoComp”).
The two-stream radiation scheme within Socrates (Suite-Of Community RAdiative Transfer codes based on Edwards and Slingo, 1996) includes calculation of both radiative heating rates and, more recently, photolysis rates (Manners, 2024) within a simulated atmosphere. The Socrates scheme is routinely used for calculation of radiative heating rates within the Met Office climate model, the Unified Model (UM), to simulate the climate and weather of Earth (Walters et al., 2019), as well as that of the Archean Earth (e.g Eager-Nash et al., 2023; Mak et al., 2023), Mars (e.g McCulloch et al., 2023), terrestrial exoplanets (e.g. Mak et al., 2024) and a class of gaseous exoplanets termed “hot Jupiters” (e.g Zamyatina et al., 2024). Socrates provides the radiation scheme for LFRic (named after Lewis Fry Richardson), the next-generation climate model of the Met Office (Adams et al., 2019), which is still in development, and has also been coupled to other Global Circulation Models (GCMs), such as ROCKE-3D and the University of Exeter's Isca model. Photolysis calculations within the UM have generally used the Fast-JX scheme (Wild and Prather, 2000; Bian and Prather, 2002; Neu et al., 2007) as part of UKCA (Archibald et al., 2020) for Earth photochemistry (see for example Braam et al., 2022; Bednarz et al., 2019), where only wavelengths down to 177 nm are considered as it is primarily for the study of the troposphere and stratosphere where shorter wavelengths have been largely attenuated (Telford et al., 2013; Braam et al., 2022). The implementation within Socrates allows both extension of the model to higher parts of Earth's atmosphere, by including additional short-wavelength flux, and flexibility regarding the input stellar spectrum allowing application to planets and scenarios other than modern Earth. The inclusion of a photolysis scheme within Socrates was motivated by efforts to model the effects of space weather in a version of the UM that extended from the surface to the lower thermosphere (Jackson et al., 2020). Inclusion of the mesosphere and lower thermosphere requires a treatment of far UV (FUV, 121–200 nm) and extreme UV (EUV, <121 nm) wavelengths where absorption by O2, N2 and O become important. The treatment of photolysis needs to be considered within the general treatment of radiation transport as, particularly at these wavelengths, it is important to partition the absorbed energy between photolysis and direct heating which the Socrates scheme will do. The aim of this work is to benchmark the photolysis capabilities of this new scheme, for applications to both Earth and exoplanets.
The atmospheric compositions of terrestrial exoplanets are poorly constrained by current observations, so studies have focused on either adopting the atmospheric composition, sometimes simplified, of the modern Earth (e.g. Boutle et al., 2017; Cooke et al., 2023; Bhongade et al., 2024), or the Archean Earth (e.g. Eager-Nash et al., 2023; Mak et al., 2023) where the focus is on habitability. However, for the early-Earth and exoplanets, species in addition to those benchmarked in PhotoComp are required, such as H2O, CH4, CO2 and many others.
In this work we benchmark Socrates photolysis rates in a high-resolution configuration (see Sect. 2.1.1) for species relevant to Earth and exoplanet atmospheres, validating against PhotoComp where possible, and extending to the study of new species and different stellar spectra. We collate up-to-date recommended cross-section and quantum yield sources, which were incorporated into the Socrates scheme, and extend on the low-resolution benchmarking previously preformed by Ridgway (2023) which only included the species O3 and O2. Specifically, we calculate photolysis rates for all our target species under Earth-like atmospheric structures, and under irradiation from a Solar or M dwarf spectrum.
The rest of this paper is structured as follows: Sect. 2 details the Socrates photolysis scheme. In Sect. 3, we summarise our data sources for the cross sections, the quantum yields and our Solar spectrum. Section 4 presents our results and is split into two parts. The first part, Sect. 4.1, presents the rates calculated for Earth and compared with PhotoComp, categorised by type, namely: Ox, HOx, NOx and organic. Then, in Section 4.2, using the same atmospheric profile but using Proxima Centauri's stellar spectrum (the host star of a nearby, potentially “Earth-like” exoplanet, Anglada-Escudé et al., 2016), we compare the rates yielded from this spectrum with those yielded by the Solar spectrum, again separated into the categories used for Earth. Extra species relevant to exoplanets, such as H2O and other hydrocarbon molecules like C2H2, are included in an extra category in Sect. 4.2.6. Finally, in Sect. 5 we provide our conclusions and indicate directions for future work.
In this section, we detail the new Socrates photolysis scheme (Manners, 2024), describing how the rates are calculated alongside an overview of the radiative transfer calculation. Our specific configuration and setup are provided alongside the reasoning behind our choices.
2.1 Socrates photolysis scheme
The radiative transfer is calculated using the two-stream scheme within Socrates, solving for the radiative fluxes and heating rates within the atmosphere using the absorption and scattering coefficients, and the input stellar/Solar spectrum. A pseudo-spherical approximation is used whereby the plane-parallel approximation of the atmosphere is replaced by spherical shells (see Manners et al., 2024; Jackson et al., 2020; Christie et al., 2022, for details). This provides a more accurate calculation of the path for the direct beam and allows for illumination under twilight conditions.
The correlated-k method is used for computational efficiency. The wavelengths within a spectral band are reordered in terms of increasing strength of absorption. Within a new cumulative probability space, as opposed to wavelength space, the wavelengths are binned so that similar coefficients are grouped together. Therefore, radiative flux calculations are performed for each absorption bin, or k-term.
However, for photolysis calculations a higher resolution is generally needed because within an interval the strength of absorption, actinic flux and quantum yield can all vary independently. To remedy this, the information on the wavelength regions that each k-term represents is retained within the scheme. The calculated flux for each k-term can then be mapped back to spectral sub-bands that represent contiguous wavelength regions sampled by each k-term. This results in a variable resolution flux spectrum with the highest resolution in wavelength regions where the variations in absorption are the greatest.
The actinic flux (A) is the integrated radiative intensity (I) over all directions (ω), where dω is the solid angle. This is given by
A representative value of the actinic flux across a model layer is calculated from the two-stream fluxes using
where ΔF is the total flux divergence and τvert is the vertical optical depth to absorption. The actinic flux is calculated per k-term in units of W m−2 (FA) and then it is mapped back to the sub-bands. The flux is converted to units of photons m−2 s−1 (A) by dividing by the energy of a photon with wavenumber of the midpoint of the sub-band. Given that the sub-bands are very narrow, the central frequency is used, as opposed to using the flux distribution within the band to determine where the photon energy originates from.
The photolysis rate, J with units s−1, is calculated using,
where σ is the absorption cross section of the molecule, Q is the quantum yield or branching ratio which is the number of molecules undergoing a photochemical event per absorbed photon, and A is the actinic flux. In Socrates the equation takes the form
where m is the molecular weight of the absorbing species, NA is Avogadro's number (mol−1), h is Planck's constant (J s), c is the speed of light, FA is the actinic flux in W m−2, kabs is the mass absorption coefficient (m2 kg−1) of the species undergoing photolysis, Q is the quantum yield, λ is wavelength (m) and w is the fraction of the actinic flux in the sub-band, or the sub-band weight. The proportion of the flux divergence used for photolysis can be immediately released for atmospheric heating or can be removed from the radiative heating rates diagnosed by the scheme. This allows for later exothermic release of the absorbed energy by an external chemistry scheme. More details and descriptions of these processes can be found in Manners (2024).
This photolysis scheme has the capabilities to account for temperature and pressure dependencies of the cross sections and temperature dependencies of the quantum yields, which is needed for Earth applications as well as exoplanets. The photolysis scheme in Socrates is not intrinsically tied to the Solar spectrum thereby allowing different input spectra, and the fraction of flux within the sub-band can alter accordingly. For Socrates, a configuration file, known as a “spectral file”, contains all the relevant information allowing for calculation of the radiative fluxes and therefore heating rates, as well as the photolysis rates. These files contain information on spectral band wavelength ranges, gaseous absorption coefficients (k-terms), aerosol/cloud properties, photolysis reactions and their quantum yields, and the stellar spectrum. In the following section we detail the spectral file configuration constructed for this work.
2.1.1 2000 band configuration
For this study we have constructed a high resolution 2000 band spectral file. The first 1000 bands are 1 nm wide (0.9 nm for the first band) and cover the wavelength range 0.1–1000 nm. The number of sub-bands over this range is 13 799, providing the resolution used for photolysis which can be seen in the spectral plots in Sect. 4. Bands 1001–2000 have a resolution of 10 cm−1 and cover the range 1000 nm–0.01 m. Note that 1 nm resolution is equal to 10 cm−1 resolution at 1000 nm. The switch from wavelength to wavenumber resolution is done so that the entire spectrum can be covered in a practical number of bands. This wide range allows for complete coverage of stellar and thermal radiative transfer. However, for the calculation of the photolysis rates, only wavelengths less than 1100 nm were considered. The absorption coefficients (k-terms) are calculated from the relevant input cross sections. These cross sections are taken from the sources described in Sect. 3, and listed in Table A1, alongside the photolysis reactions and branching ratios we adopted. The number of k-terms varies up to a maximum of 22 per band for the major gases.
In this study we include species that are important for Earth's stratosphere and were also part of PhotoComp. These species fall broadly into the categories: Ox, NOx and HOx, and organic species relevant to Earth. These selected species were chosen to compare with the output of the radiative transfer code Fast-JX (Wild and Prather, 2000; Bian and Prather, 2002; Neu et al., 2007) used for the Regional Air Quality (RAQ) mechanism (Savage et al., 2013; Mynard et al., 2023). For the purpose of the intercomparison and as there are no sources of opacity in the infrared in our calculations, any contribution to photolysis longward of 1100 nm is neglected. The species in addition to those within PhotoComp that we have added for exoplanets align with the high temperature network of Venot et al. (2012) which is designed for hot hydrogen-dominated exoplanets, such as hot Jupiters as this is intended for future studies of these objects. Species such as H2O and hydrocarbon species such as CH4 also have relevance for early-Earth-like exoplanets.
We incorporate Rayleigh scattering from O2 and N2 (air) down to 175 nm. This limit coincides with the threshold for photolysis. It is assumed that most of the absorbed flux from shorter wavelengths is used for dissociation and the atmospheric regions where the absorption occurs will have a significant atomic oxygen and nitrogen content. Rather than formulate a separate scheme that includes O and N scattering we assume absorption will dominate below 175 nm and any Rayleigh scattering can be neglected.
A full list of our data sources is presented in the Appendix A as Table A1. The primary data sources for absorption cross sections and quantum yields are the recommendations from the JPL 19-5 report (Burkholder et al., 2020) and the IUPAC recommendations (Atkinson et al., 2004). Where these are unavailable we use data collated within the recent literature or cross-sections that are a mean fit to available data from the literature (Éric Hébrard, personal communication, 2022). Many of the recommended sources were retrieved from the MPI-UV/Vis database (Keller-Rudek et al., 2013). We also make use of the HITRAN database (Gordon et al., 2022) for O3 and the ExoMol database (Tennyson et al., 2016) for NO as indicated in Table A1. Photoelectron enhancement factors are included following the parametrisation presented in Solomon and Qian (2005). Photoionisation can free energetic electrons which induce more reactions. The photoelectron factors represent this additional contribution to the effective quantum yield which can then exceed one. This process comes into effect for EUV wavelengths < 65 nm and was only required for O2 of the species considered here.
For the species relevant to exoplanets, much of the data was taken from Venot et al. (2012). Other exoplanet species data coincided with what we used for the Earth species and are detailed in Table A1.
The Solar spectrum we use for this work is the CMIP6 recommendation from Matthes et al. (2017) averaged over solar cycle 23 from September 1996 to December 2008. For wavelengths shorter than 10 nm, the spectrum used by Solomon and Qian (2005) was included. The spectrum we use for Proxima Centauri is the same used in the work of Ridgway (2023). This spectrum is a combination of two sources: the MUSCLES survey (France et al., 2016; Youngblood et al., 2016; Loyd et al., 2016; Ribas et al., 2017).
In this section we first present a comparison between our calculations and those presented in PhotoComp. Firstly, we outline the setup (Sect. 4.1.1) and present our calculated Solar actinic flux (Sect. 4.1.2), before presenting rates for our different categories of species; namely Ox, HOx, NOx and organic. We then move to an input spectrum of Proxima Centauri (Sect. 4.2), again presenting the calculated actinic flux (Sect. 4.2.1) and comparing the rates against those calculated for a Solar spectrum grouping species by the same categories as used for Earth, but including an additional section for those species added for later applications to exoplanets (Sect. 4.2.6).
Note that the spectra for photolysis rates calculated with Socrates are displayed only for the Ox reactions in Sect. 4.1. The photolysis spectra for all reactions can be found in Sect. 4.2 to provide a comparison for Solar and Proxima Centauri stellar irradiance.
4.1 Benchmarking: PhotoComp
4.1.1 Setup
The Chemistry-Climate Model Validation, Stratosphere-troposphere Processes And their Role in Climate Evaluation (SPARC) CCMVal-2, was a climate model intercomparison initiative, which included an element on the benchmarking of photolysis models, PhotoComp 2008. The results were produced in the subsequent report (Chipperfield et al., 2010). Initially conducted in 2008 using JPL 2006 data (Sander et al., 2006), PhotoComp was repeated in 2011 (Chipperfield et al., 2013) with predominantly JPL 2010 data (Sander et al., 2011). The primary goal of this photolysis intercomparison was to evaluate how different models calculated the photolysis rates in the stratosphere and troposphere. Part 1a of their experimental set-up was used for the comparisons in this paper. This consists of a clear sky with no aerosols, a Solar Zenith Angle (SZA) of 15° over the ocean, an albedo of 0.10 (Lambertian), an incoming Solar irradiance at top-of-atmosphere of 1365 W m−2 and the inclusion of Rayleigh scattering. The pressure-temperature profile used by PhotoComp, and adopted here is shown in Fig. 1. The PhotoComp study also included tests of the accuracy of the actinic flux calculations for different atmospheric compositions. However, the accuracy of the Socrates radiative transfer calculations has been extensively validated previously for both Earth (Pincus et al., 2020) and exoplanets (Amundsen et al., 2014), therefore we restrict our work here to benchmarking the photolysis rates only.
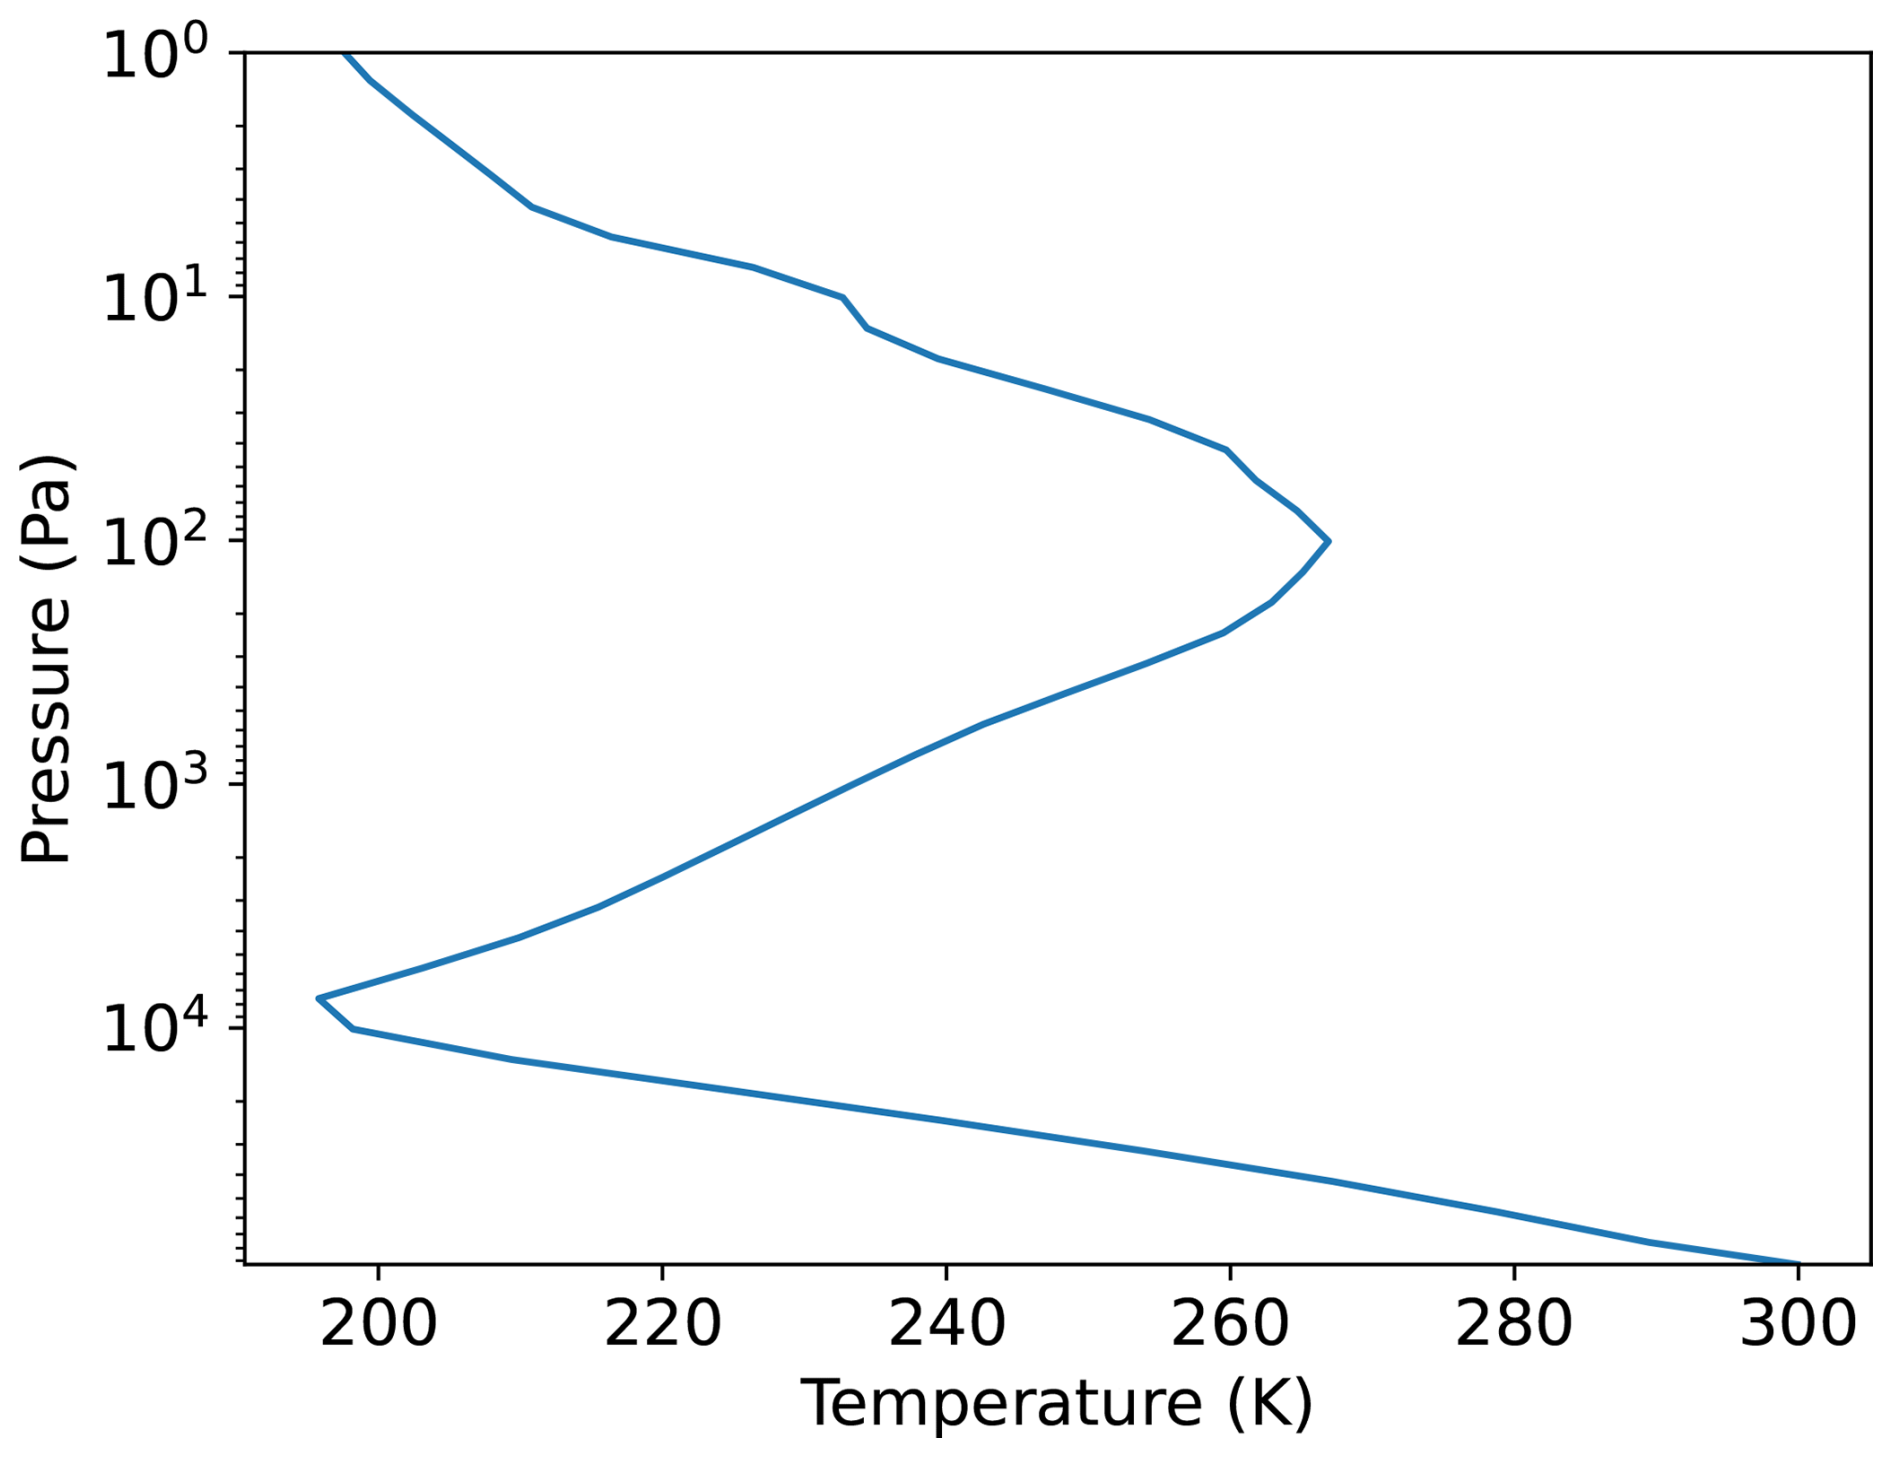
Figure 1The pressure (Pa) − temperature (K) atmospheric profile from Chipperfield et al. (2010) adopted in this work.
The two reference models from PhotoComp we compare with1 are: the UCI reference model (hereafter, UCI-ref, Prather, 1974; Wild and Prather, 2000; Bian and Prather, 2002) and Fast-JX as implemented and run by UCI (hereafter, UCI-Jxr, Prather, 1974; Wild and Prather, 2000; Bian and Prather, 2002). The UCI-ref model is a photochemical 1D box model that implements 77 wavelength bins and 3–6 sub-bins. The UCI-Jxr model utilises 18 wavelengths bins and uses version 6.2 of Fast-JX, another 1D photochemical model. Both reference models are valid to an altitude of ∼64 km or ∼10 Pa 2. The Solar spectrum used in the UCI reference models is the Solar Ultraviolet Spectral Irradiance Monitor (SUSIM) spectrum and is an average of two high and low points within the solar cycle which occurred on 29 March 1992 and 11 November 1994. For our comparison of the photolysis rates (Sect. 4.1.3–4.1.6) in most cases the UCI-ref and UCI-Jxr results are indiscernible, therefore we only show the former, but present both models in cases where they differ.
For our calculations, we adopt the O3 abundance used in PhotoComp, and an O2 abundance of Earth's atmosphere as sourced from Anderson et al. (1986). The region of interest for these photolysis rates is primarily the stratosphere extending into the mesosphere. At this point in the atmosphere, ozone and oxygen are the main absorbers in the UV/visible range. Therefore, it is their abundance that is the main determinant of the actinic flux available for all the species undergoing photolysis.
The PhotoComp reference calculations extend to a shortest wavelength of 177.4 nm, thereby omitting Lyman-α absorption. However, for our results we use cross section data that includes shorter wavelengths in the FUV and EUV range, which also requires inclusion of N2 (Anderson et al., 1986), O and N (MSISE-903) abundances as these are the main absorbers at EUV wavelengths, shortward of 100 nm. Additionally, the photolysis of NO and its absorption are affected by the interplay with O2 absorption in the Schumann Runge bands. Therefore, we include an abundance of NO in our calculations using a value for Earth's atmosphere (Anderson et al., 1986), for the calculation of the relevant photolysis rates. We include two additional atmospheric layers (taking the total to 42) at the top of the model domain containing O, N and N2 in order to account for the attenuation of shorter (EUV) wavelengths that occurs at high altitudes. However, we only present results up to a model level of 40 for comparisons to PhotoComp throughout this work. To test the impact of these additional layers and wavelengths, we performed calculations where fluxes at wavelengths shorter than 177 nm were omitted from the calculations as well as only including O3 and O2, to better match the PhotoComp setup. This revealed a negligible impact on the results for most species, but is noted where relevant.
4.1.2 Actinic flux
As photolysis is driven by short-wavelength flux, species and bands that absorb UV and visible light have a direct impact on the resulting photolysis rates as they dictate the actinic flux. The gases O2 and O3 are the main absorbers in this regime, and their absorption cross sections are shown in Fig. 2. The major bands for O3 are the Hartley bands (200–300 nm), which predominantly absorb in the stratosphere, with additional absorption longward of 300 nm through, for example, the Huggins (∼300–370 nm) and Chappuis bands (∼370–790 nm). For O2, absorption is mainly via the Schumann Runge bands (175 to 205 nm) and continuum (130 to 175 nm), as well as absorption of Solar Lyman-α emission (121.45 to 121.7 nm).
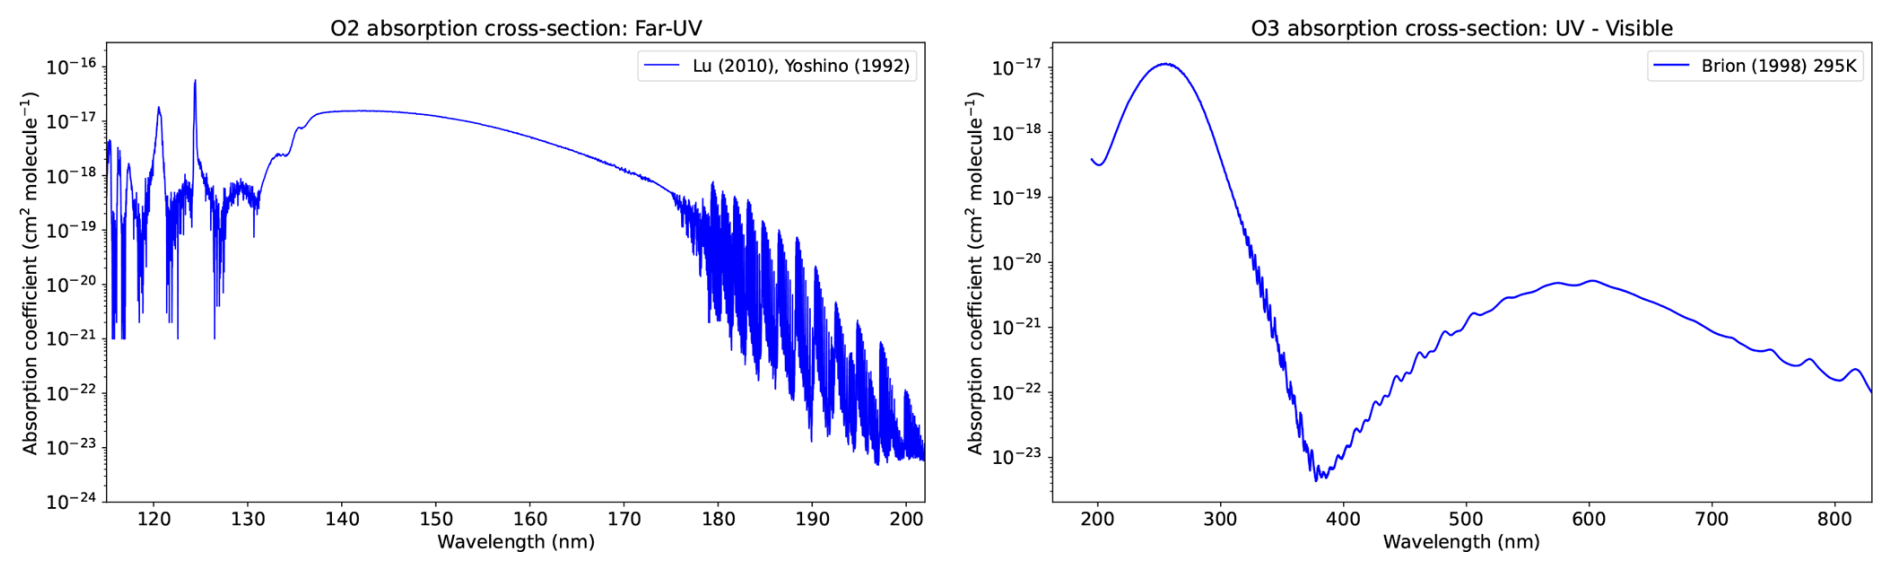
Figure 2Absorption cross section (cm2 molec.−1) against wavelength (nm) for the UV/visible range for O2 and O3 (left and right panels, respectively). The illustrative data are from Lu et al. (2010) and Yoshino et al. (1992) for O2, and Brion et al. (1998) for O3 (see Table A1 for our full list of data sources).
Figure 3 shows the actinic flux, as calculated by Socrates using Eq. (2) and detailed in Sect. 2.1, at the top-of-atmosphere (TOA, solid blue line), upper mid-atmosphere (at a pressure of 1 Pa) which represents the top model level specified by PhotoComp as used by the UCI-ref model (green line), and the lower mid-atmosphere (at a pressure of ∼2400 Pa) corresponding to the ozone layer (magenta line). The dominant absorption feature between 220–290 nm in the lower/mid-atmosphere is due to ozone absorption within the Hartley bands.
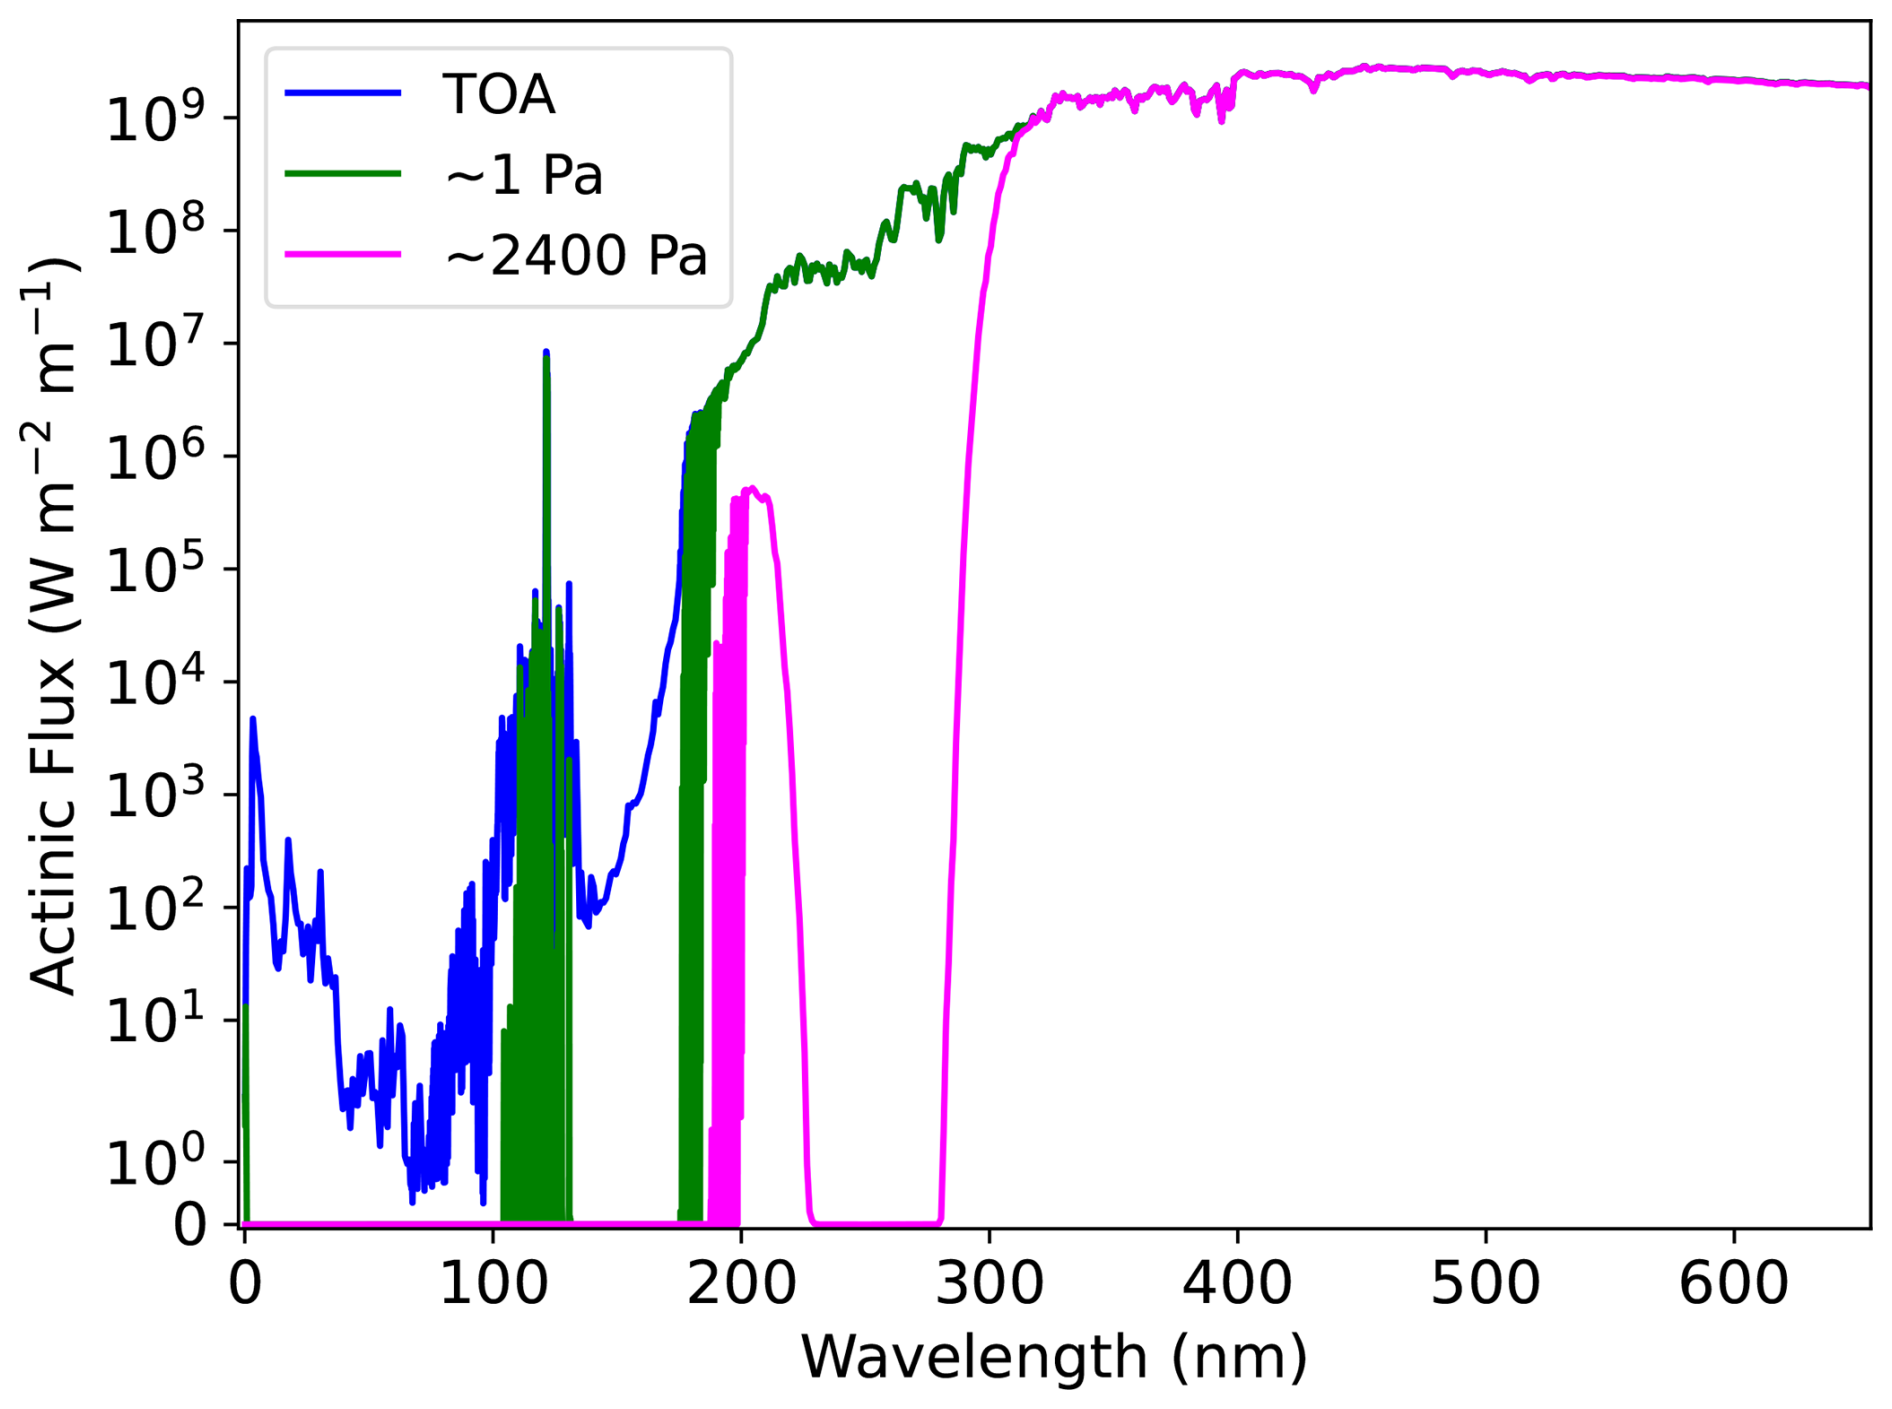
Figure 3Actinic flux (W m−2 m−1) from Socrates as a function of wavelength nm) at three different levels, the top-of-atmosphere, upper mid-atmosphere (a pressure of 1 Pa) and lower mid-atmosphere (at a pressure of ∼2400 Pa) corresponding to the ozone layer, shown by the solid blue, green, and magenta lines, respectively.
4.1.3 Ox
Temperature dependent ozone cross-sections used in this work have been compiled based on recommendations from the JPL 19-5 report (Burkholder et al., 2020) augmented by more recent HITRAN 2020 data (Gordon et al., 2022) for the Hartley and Huggins bands between 244–346 nm. For wavelengths 110–244 and 346–830 nm the JPL recommended cross-sections have been used from the MPI-UV/Vis database (Keller-Rudek et al., 2013). The cross-sections are extended to 1100 nm using data from Serdyuchenko et al. (2011). Temperature dependent quantum yields are from Matsumi et al. (2002) following the JPL 19-5 recommendation using data at 6 temperatures from the MPI-UV/Vis database.
Figure 4 shows the rates calculated for two possible dissociation reactions for ozone, namely , and as the left and right columns, respectively, and as functions of pressure and wavelength as the top and bottom rows, respectively. Note that O(3P) refers to the ground state of the atom and O(1D) the first excited state. The top row of Fig. 4 shows the rates from UCI-ref (dashed orange line) and this work (solid blue line), demonstrating excellent agreement apart from a slight difference towards the top-of-atmosphere (TOA). At the TOA the photolysis rate is independent of the model radiative transfer and is governed by a simple convolution of the absorption cross section, quantum yield and stellar spectrum. The UCI-ref model is based on JPL recommended cross-sections from 2010 while Socrates is using an updated temperature dependent cross-section from HITRAN 2020 (Gordon et al., 2022). The Socrates model will also have finer sub-band resolution. These differences are likely to be the main cause of the observed discrepancy although without access to the UCI-ref model and data it cannot be reliably determined. The bottom row of Fig. 4 shows the rates at the TOA and ∼100 Pa which approximately corresponds to the point where the models begin to disagree. The Socrates rates were also recalculated without contributions from wavelengths shorter than 177 nm. This had a negligible impact on the results, indicating that the inclusion of Lyman-α emission is not significant.
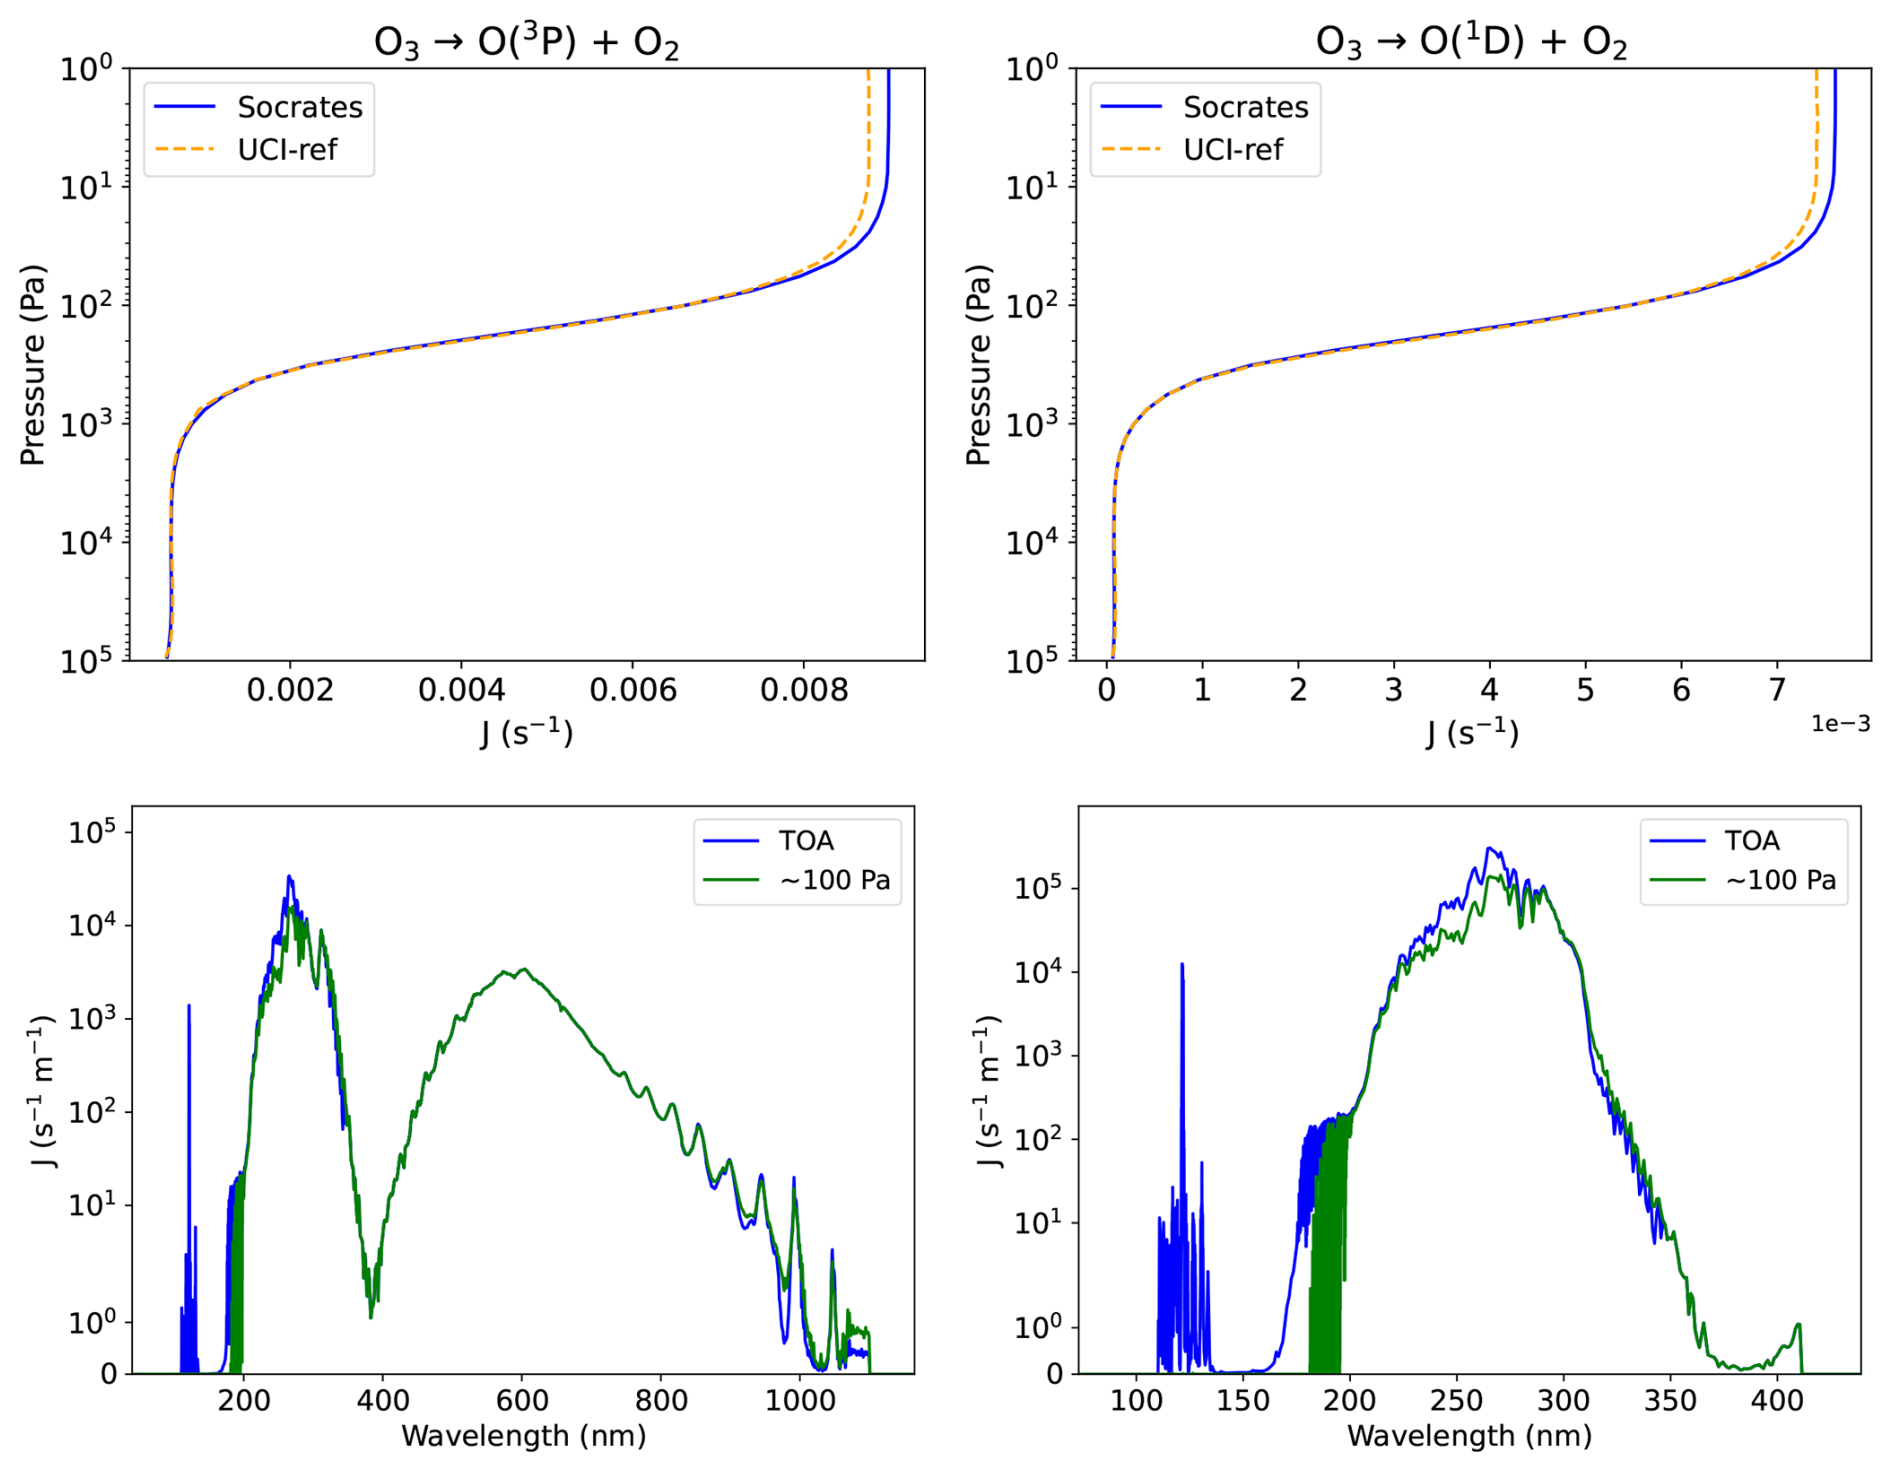
Figure 4O3 photolysis rates (J) as a function of atmospheric pres panels) for the reactions: (left column panels) and (right column panels), where O(3P) is the ground state of atomic oxygen and O(1D) the first excited state. The rates from the UCI-ref model (Chipperfield et al., 2010) and Socrates (this work) are shown as the dashed orange, and solid blue lines, respectively (top row panels). The photolysis spectra (bottom row panels) are shown for Socrates at TOA (blue) and at ∼100 Pa (green).
For oxygen, the JPL 19-5 recommended cross-sections are used for wavelengths > 205 nm. Over the Schumann Runge bands (179.2–202.6 nm) we use high-resolution cross-sections from Yoshino et al. (1992). In the Schumann Runge continuum and the Lyman-α region (115–179 nm) we use data from Lu et al. (2010). At shorter wavelengths down to 0.04 nm cross-sections are compiled from the data listed in Table A1. The cross-sections used are independent of temperature and pressure.
For the reaction we take the quantum yield to be 1 from the threshold at 242.3 nm down to 175 nm. Below 175 nm we take the quantum yield to be 1 for the reaction apart from the region around Lyman-α (121.35–122 nm) where the quantum yield is partitioned according to Lacoursiere et al. (1999). In the EUV shortward of 102 nm the quantum yield falls below 1 using data from Fennelly and Torr (1992) with photoelectron enhancement effectively increasing the quantum yield shortward of 65 nm using data from Solomon and Qian (2005).
Figure 5 shows the total dissociation rate for for both the UCI-ref (orange dashed line) and our work (solid blue line) as a function of pressure (Pa) in the top left panel, as well as the separate Socrates rates for the dissociations and (solid green and blue lines respectively) in the top right panel. In the bottom panels the rates are shown as a function of wavelength for the separate reactions. The top left panel of Fig. 5 again shows excellent agreement between the rates calculated using Socrates and the UCI-ref values. The divergence in the rates near the surface occurs for values less than s−1 and is likely due to the use of different O2 cross-sections within the absorption window at wavelengths around 200 nm. There is also a slight departure at very low pressures (∼10 Pa, or above ∼64 km) where the UCI-ref model is no longer valid as it does not include EUV wavelengths (see discussion in Sect. 4.1.1). The top right panel shows that the reaction is the main contributor to the total dissociation rate, while the reaction only contributes for wavelengths below the threshold at 175 nm (spectrum, bottom left panel). Repeating this comparison while omitting flux at wavelengths < 177 nm reduces the low-pressure disparity between the Socrates and UCI-ref results to negligible levels (not shown).
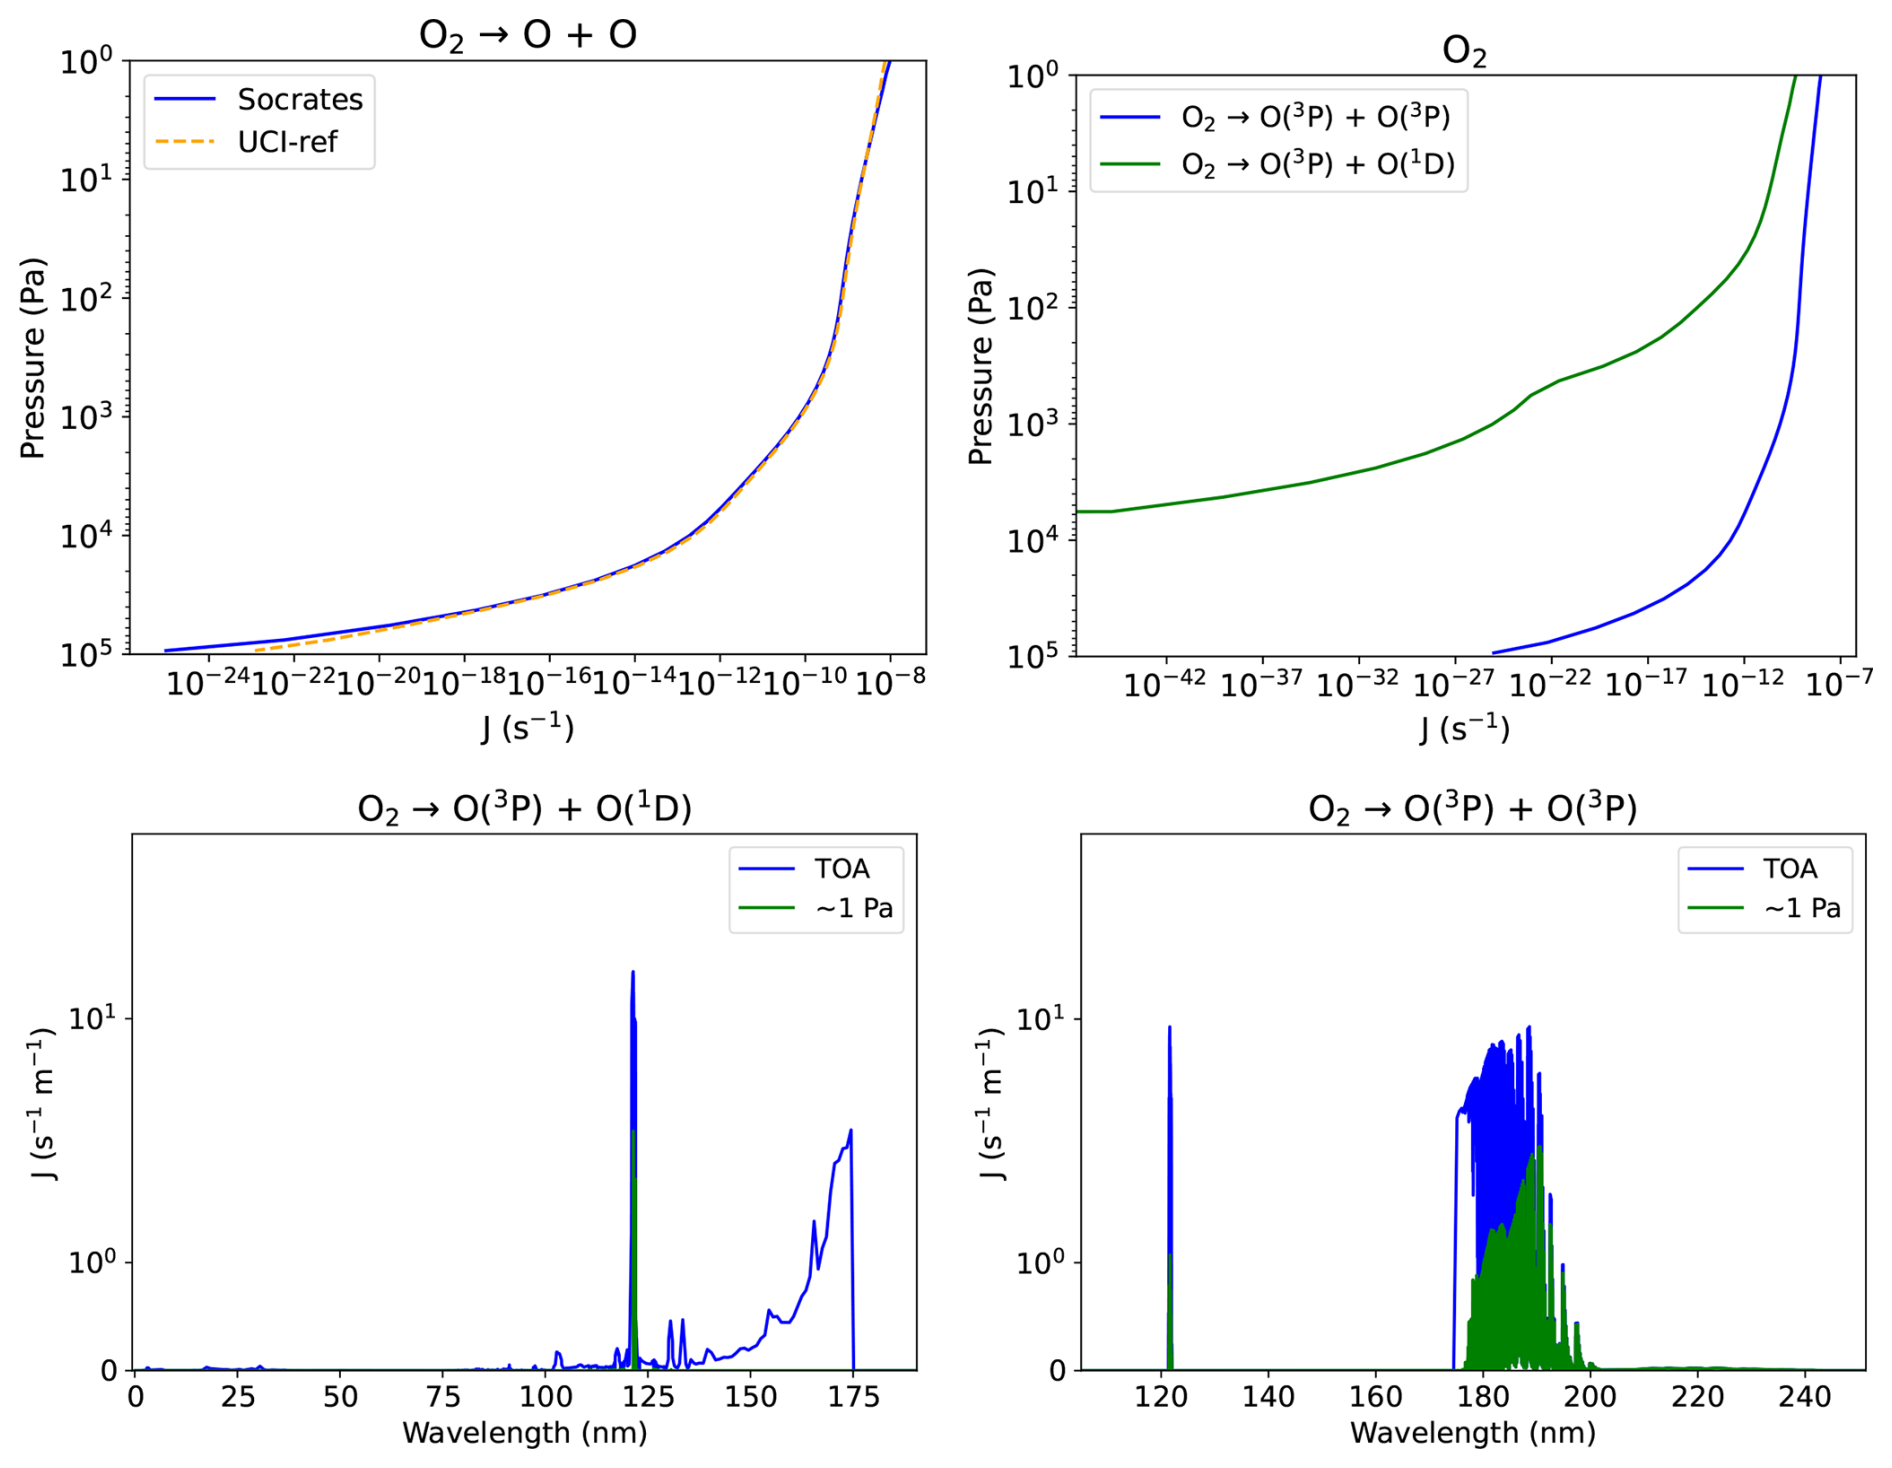
Figure 5O2 photolysis rates (J) as a function of atmospheric pressure (Pa, top row panels) and as a function of wavelength (nm, bottom row panels). Total photolysis rate of O2 into two atomic O (top left panel) is shown for comparison of Socrates (blue) to the UCI-ref model (dashed orange). Separate rates for the reactions (green) and (blue) are shown for Socrates (top right panel). The bottom panels show the rates for (bottom left panel) and (bottom right panel) as a function of wavelength (nm) at the TOA (blue) and for a pressure of ∼1 Pa (green) which corresponds to PhotoComp's TOA.
4.1.4 HOx
Absorption cross-sections for hydrogen peroxide (H2O2) follow the JPL 19-5 recommendations between 190–350 nm. Between 260–350 nm this includes the calculation of temperature dependent cross-sections at 7 temperatures between 200 and 320 K using the formulation from Nicovich and Wine (1988). FUV cross-sections between 106–190 nm are taken from Suto and Lee (1983). Cross-sections between 353–410 nm are taken from Kahan et al. (2012). Data from both of these sources was obtained from the MPI-UV/Vis database (Keller-Rudek et al., 2013) and extend the JPL recommended data without significant discontinuities.
Figure 6 shows the photolysis rate for the reaction as a function of pressure (Pa). Photolysis spectra for this reaction can be seen in Fig. 16 (bottom row). Photolysis occurs below the threshold wavelength of 557 nm with a quantum yield of 1 recommended by JPL 19-5 for wavelengths > 230 nm. The quantum yield at 193 nm is recommended to be 0.85. We use a simple step down to this value at the mid-point wavelength of 211.5 nm.
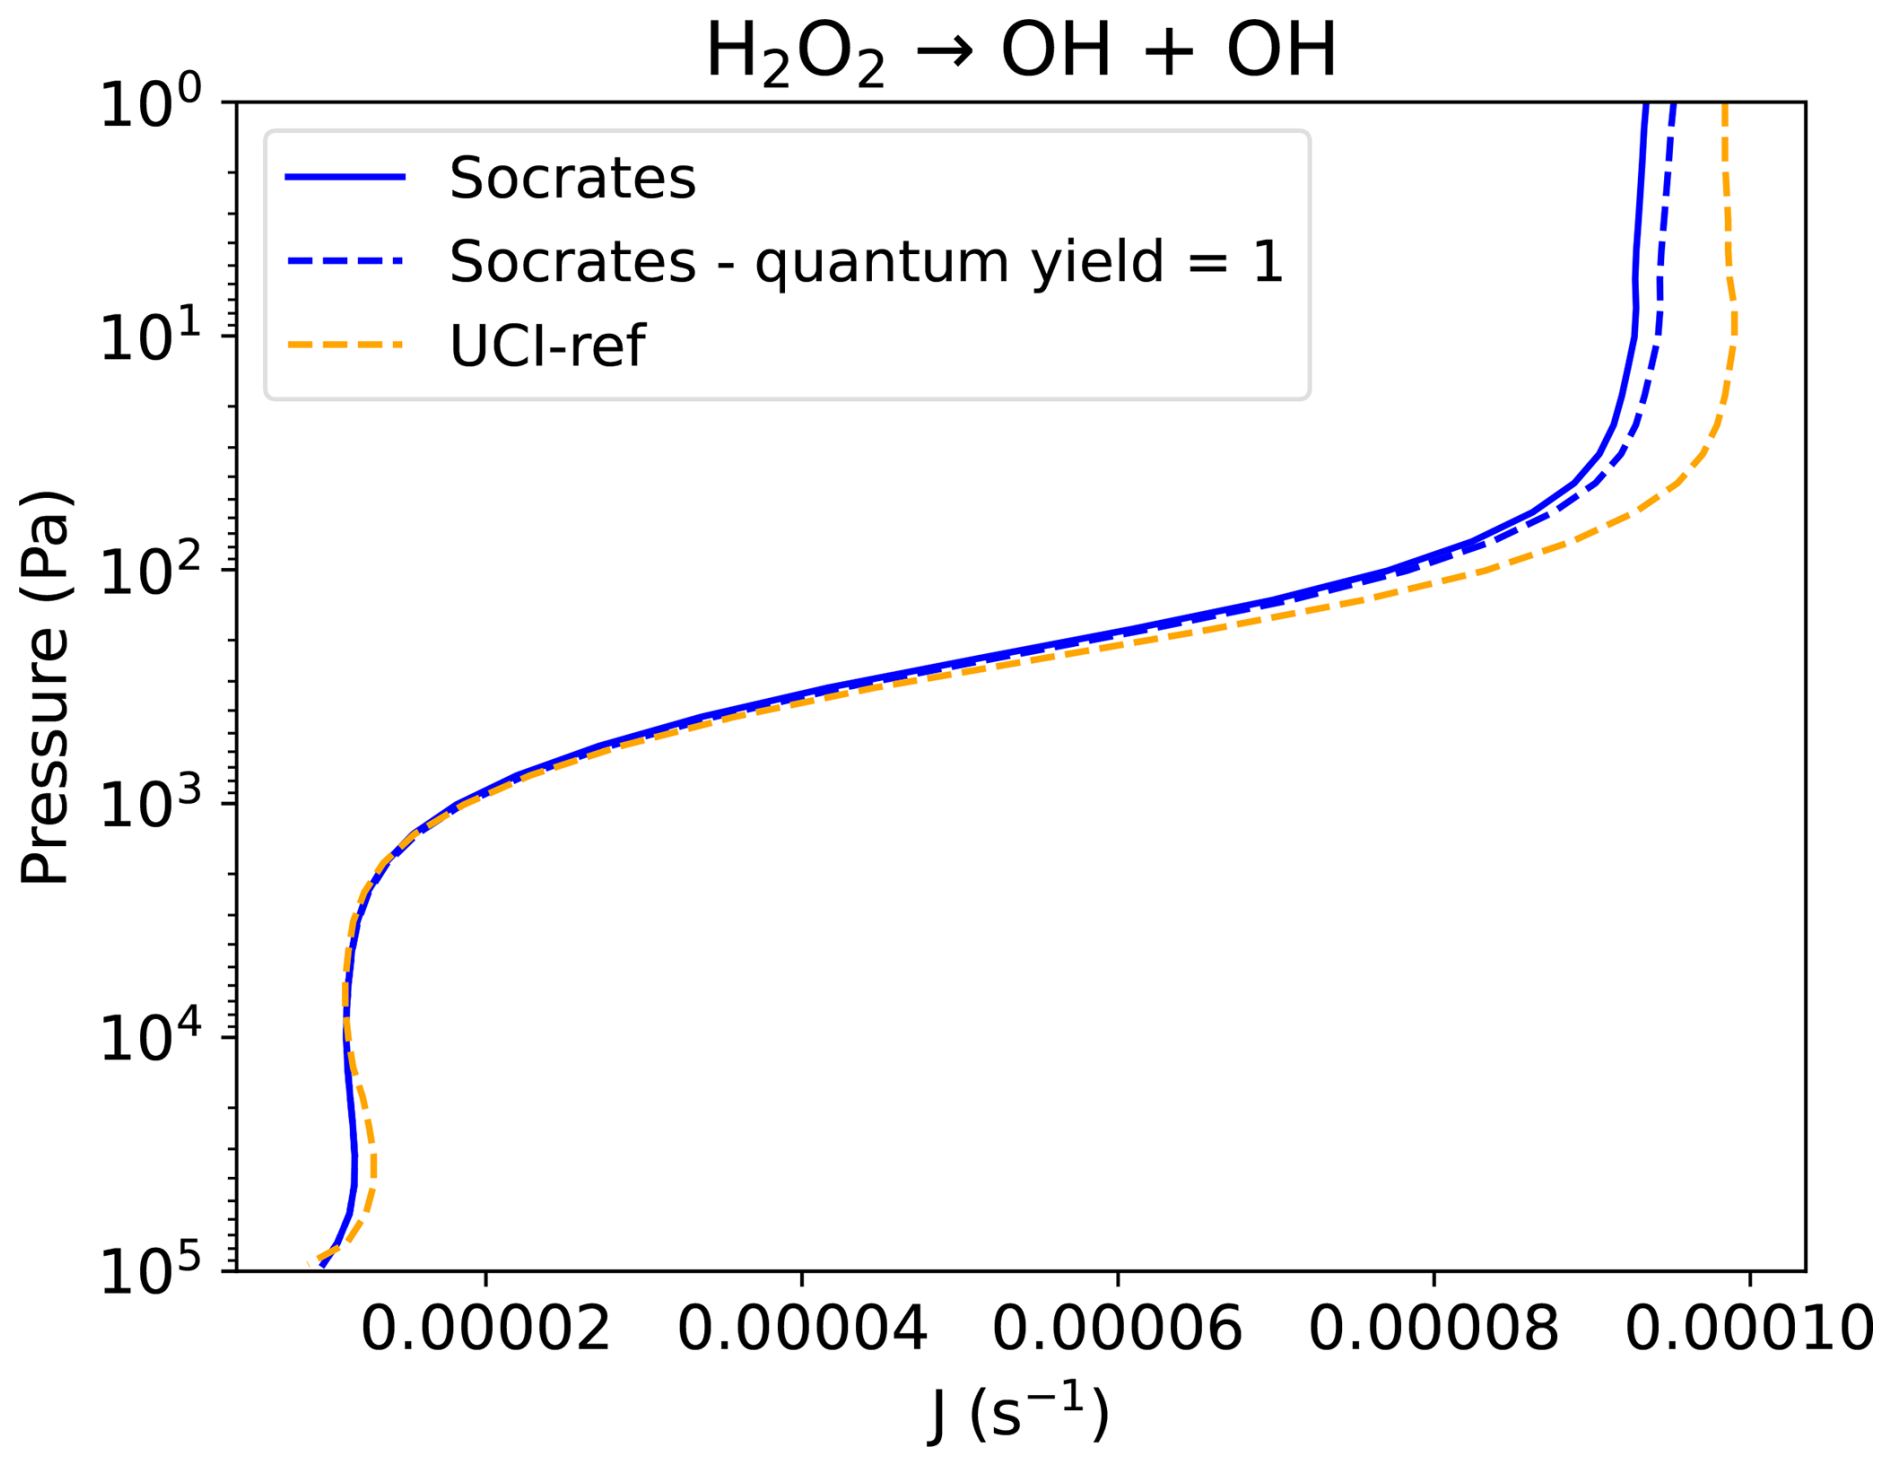
Figure 6Photolysis rates for the reaction as a function of atmospheric pressure (Pa). Socrates rates are shown using the recommended quantum yields (solid blue line) and when a quantum yield of 1 is used for all wavelengths (dashed blue), compared with rates for the UCI-ref model (dashed orange).
Photolysis is most significant at wavelengths coinciding with the Hartley bands of ozone (220–290 nm). This leads to a distinct drop in the photolysis rate across the ozone layer in the mid-atmosphere where the actinic flux is correspondingly reduced (see Fig. 3). In the lower atmosphere the variation in photolysis rate with height is predominantly due to the temperature dependence of the H2O2 absorption cross-section. The photolysis rate profile calculated with Socrates matches the UCI-ref profile well with a slight departure towards lower pressures. This difference is significantly reduced if a quantum yield of 1 is used in the Socrates calculations below 211.5 nm.
4.1.5 NOx
Figure 7 shows the photolysis rates for the reactions , as a function of pressure. Photolysis spectra for these reactions can be seen in Fig. 17.
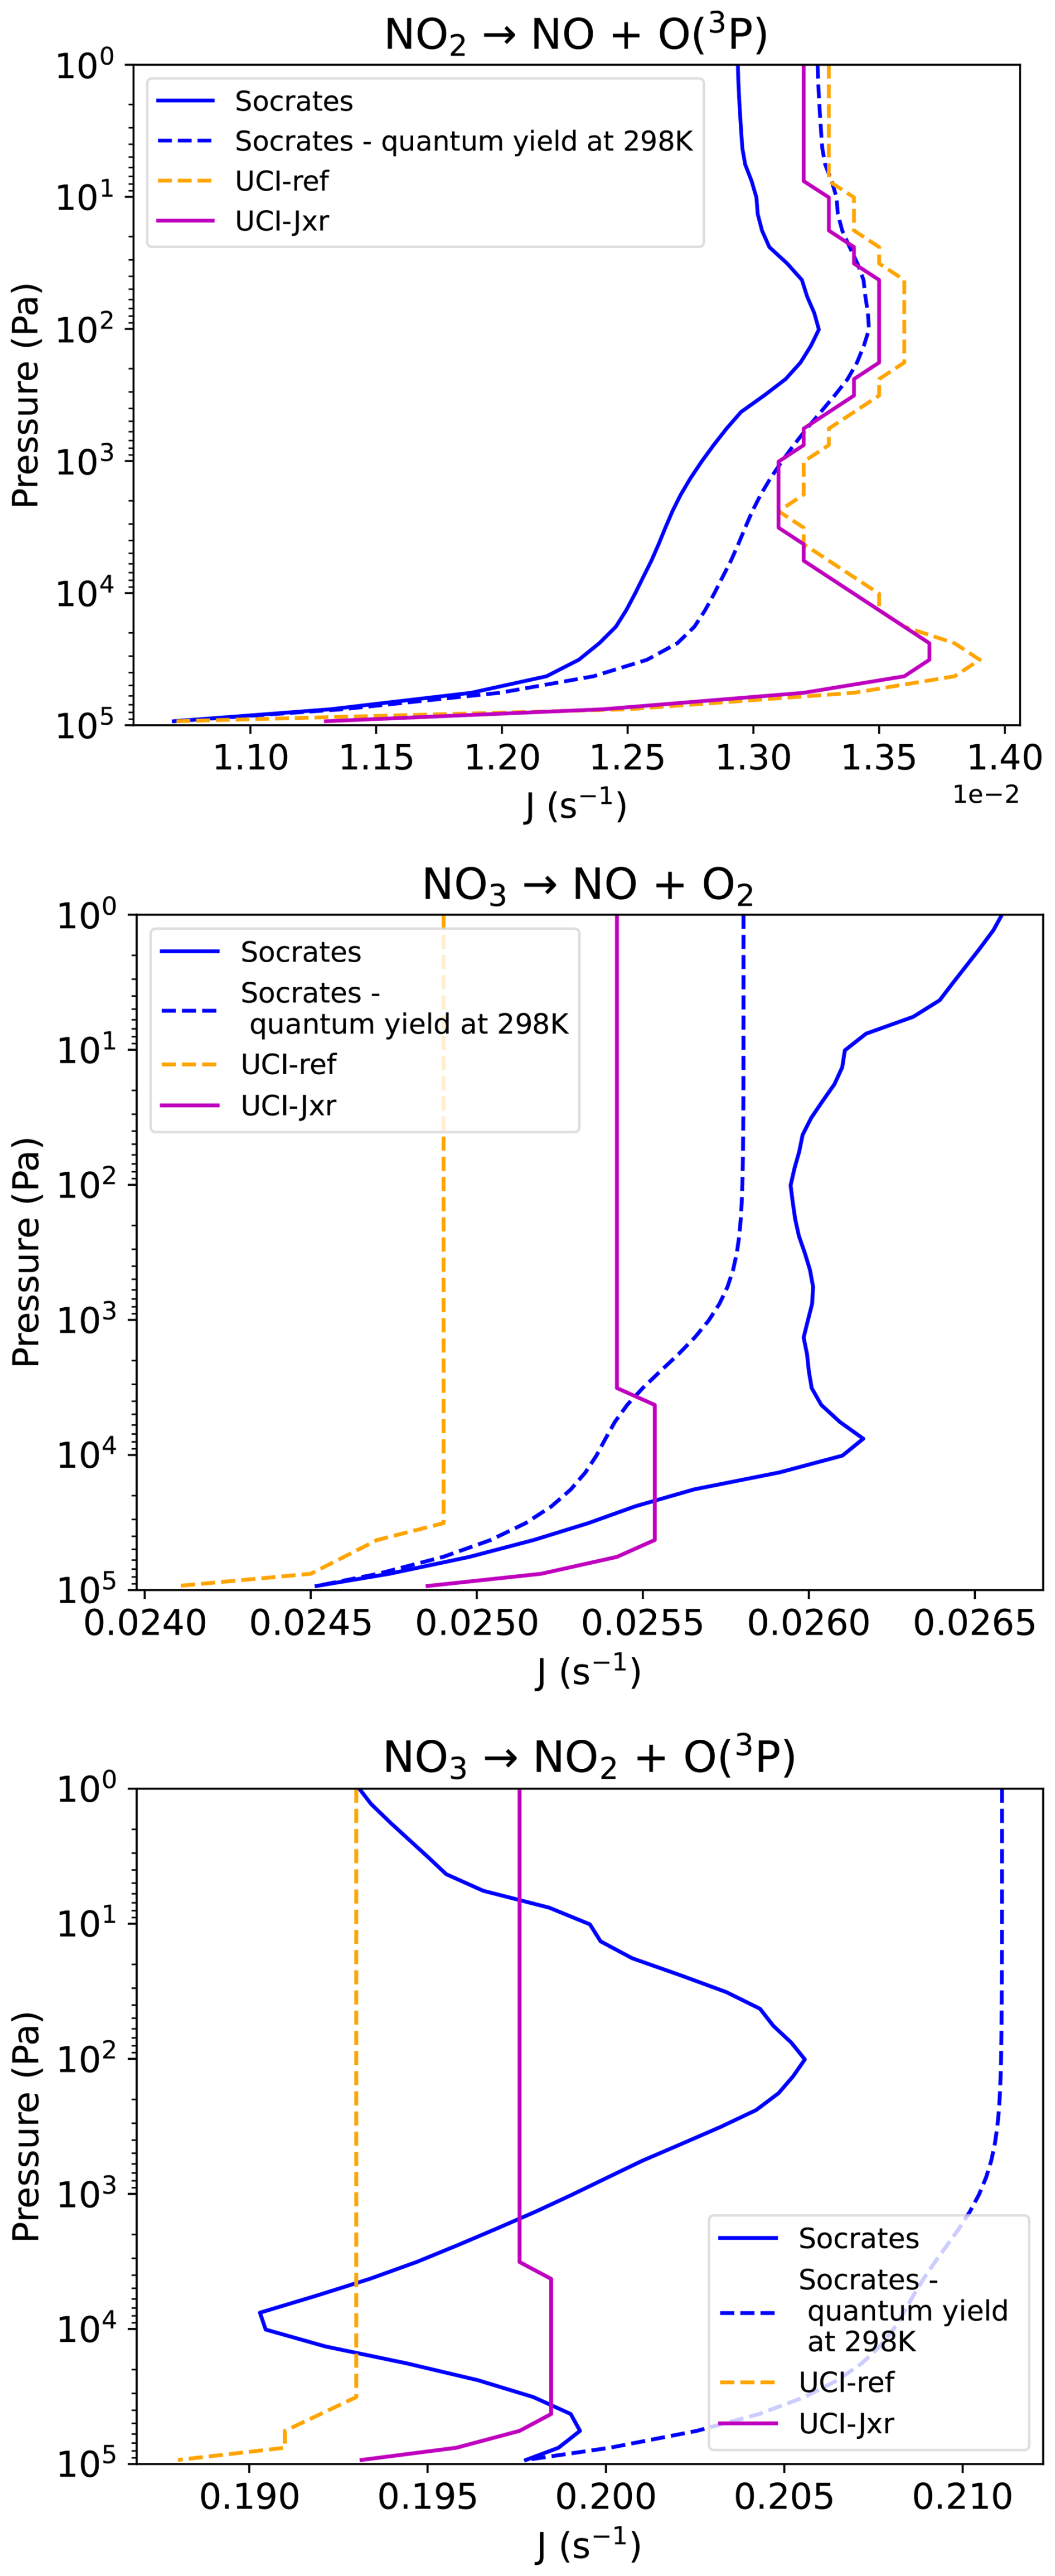
Figure 7Photolysis rates for NO2 and NO3 as a function of atmospheric pressure (Pa). Socrates rates (blue) are compared with the UCI-ref (dashed orange) and UCI-Jxr (purple) models. Socrates rates are also shown using quantum yield values for 298 K without the temperature dependence (dashed blue).
NO2 cross-sections are based on the recommendations of the JPL 19-5 report between 238 nm and 667 nm using data from Vandaele et al. (1998) at 220 and 298 K. We use the original high-resolution cross-sections obtained from the MPI-UV/Vis database (Keller-Rudek et al., 2013) rather than the band means reported in JPL 19-5. We also extend the cross-sections into the FUV and EUV using the data reported in Table A1.
For the reaction we use the temperature dependent quantum yields recommended in JPL 19-5 which are 1 up to the dissociation threshold wavelength of 398 nm and then rapidly decrease to zero for wavelengths > 422 nm. The photolysis rates from Socrates and UCI-ref in Fig. 7 (top) generally match to within a few percent. The match is particularly good at pressures less than ∼103 Pa where there has yet to be any significant absorption of the actinic flux over the wavelength region > 300 nm where significant photolysis occurs. Note, the match is improved further if quantum yields for 298 K are used (blue dashed line) without the temperature dependence.
The overall shape of the profile is predominantly governed by the temperature dependent cross-sections which introduce variations that mirror the temperature structure of the atmosphere shown in Fig. 1. The Socrates rates are further affected by absorption of the actinic flux at pressures higher than ∼103 Pa and begin to decrease, whilst the UCI-ref values only show evidence of absorption from Pa. This difference is likely due to the use of updated ozone absorption cross-sections in Socrates from HITRAN 2020 (see Table A1). We also use high-resolution cross-section data for NO2 which may contribute to the differences as there is fine structure in the near-UV region where photolysis occurs (Akimoto, 2016).
For NO3 the recommended cross-sections from JPL 19-5 for 298 K are used without a temperature dependence. The JPL report notes there is uncertainty in the absolute cross-section with reported values ranging by around a factor of 2. Quantum yields for the NO3 photolysis reactions have a strong dependence on both wavelength and temperature. We have used the recommended values from JPL 19-5 including the temperature dependence.
For the reaction , the second row of Fig. 7, the reference and Socrates calculated rates match to within around 5 %. The reference models show very little variation in photolysis rate with pressure and we note the match with Socrates is improved if we use the quantum yields for 298 K without a temperature dependence (blue dashed line). For the reaction , the third row of Fig. 7, the opposite is true. The Socrates rates match the reference to within ∼5 % when temperature dependent quantum yields are used even though the shape of the profile with pressure differs significantly. When the quantum yields for 298 K are used the offset is more significant. It is important to note that between 400–640 nm, where photolysis for this reaction occurs, there are no significant sources of absorption of actinic flux. The difference in the rates as a function of pressure between our calculations and that of the reference, mimics the pressure-temperature profile, Fig. 1, and is almost solely due to the temperature dependent quantum yield.
Figure 8 shows the photolysis rates for the reactions and , with N(4S) being the ground state of the nitrogen atom.
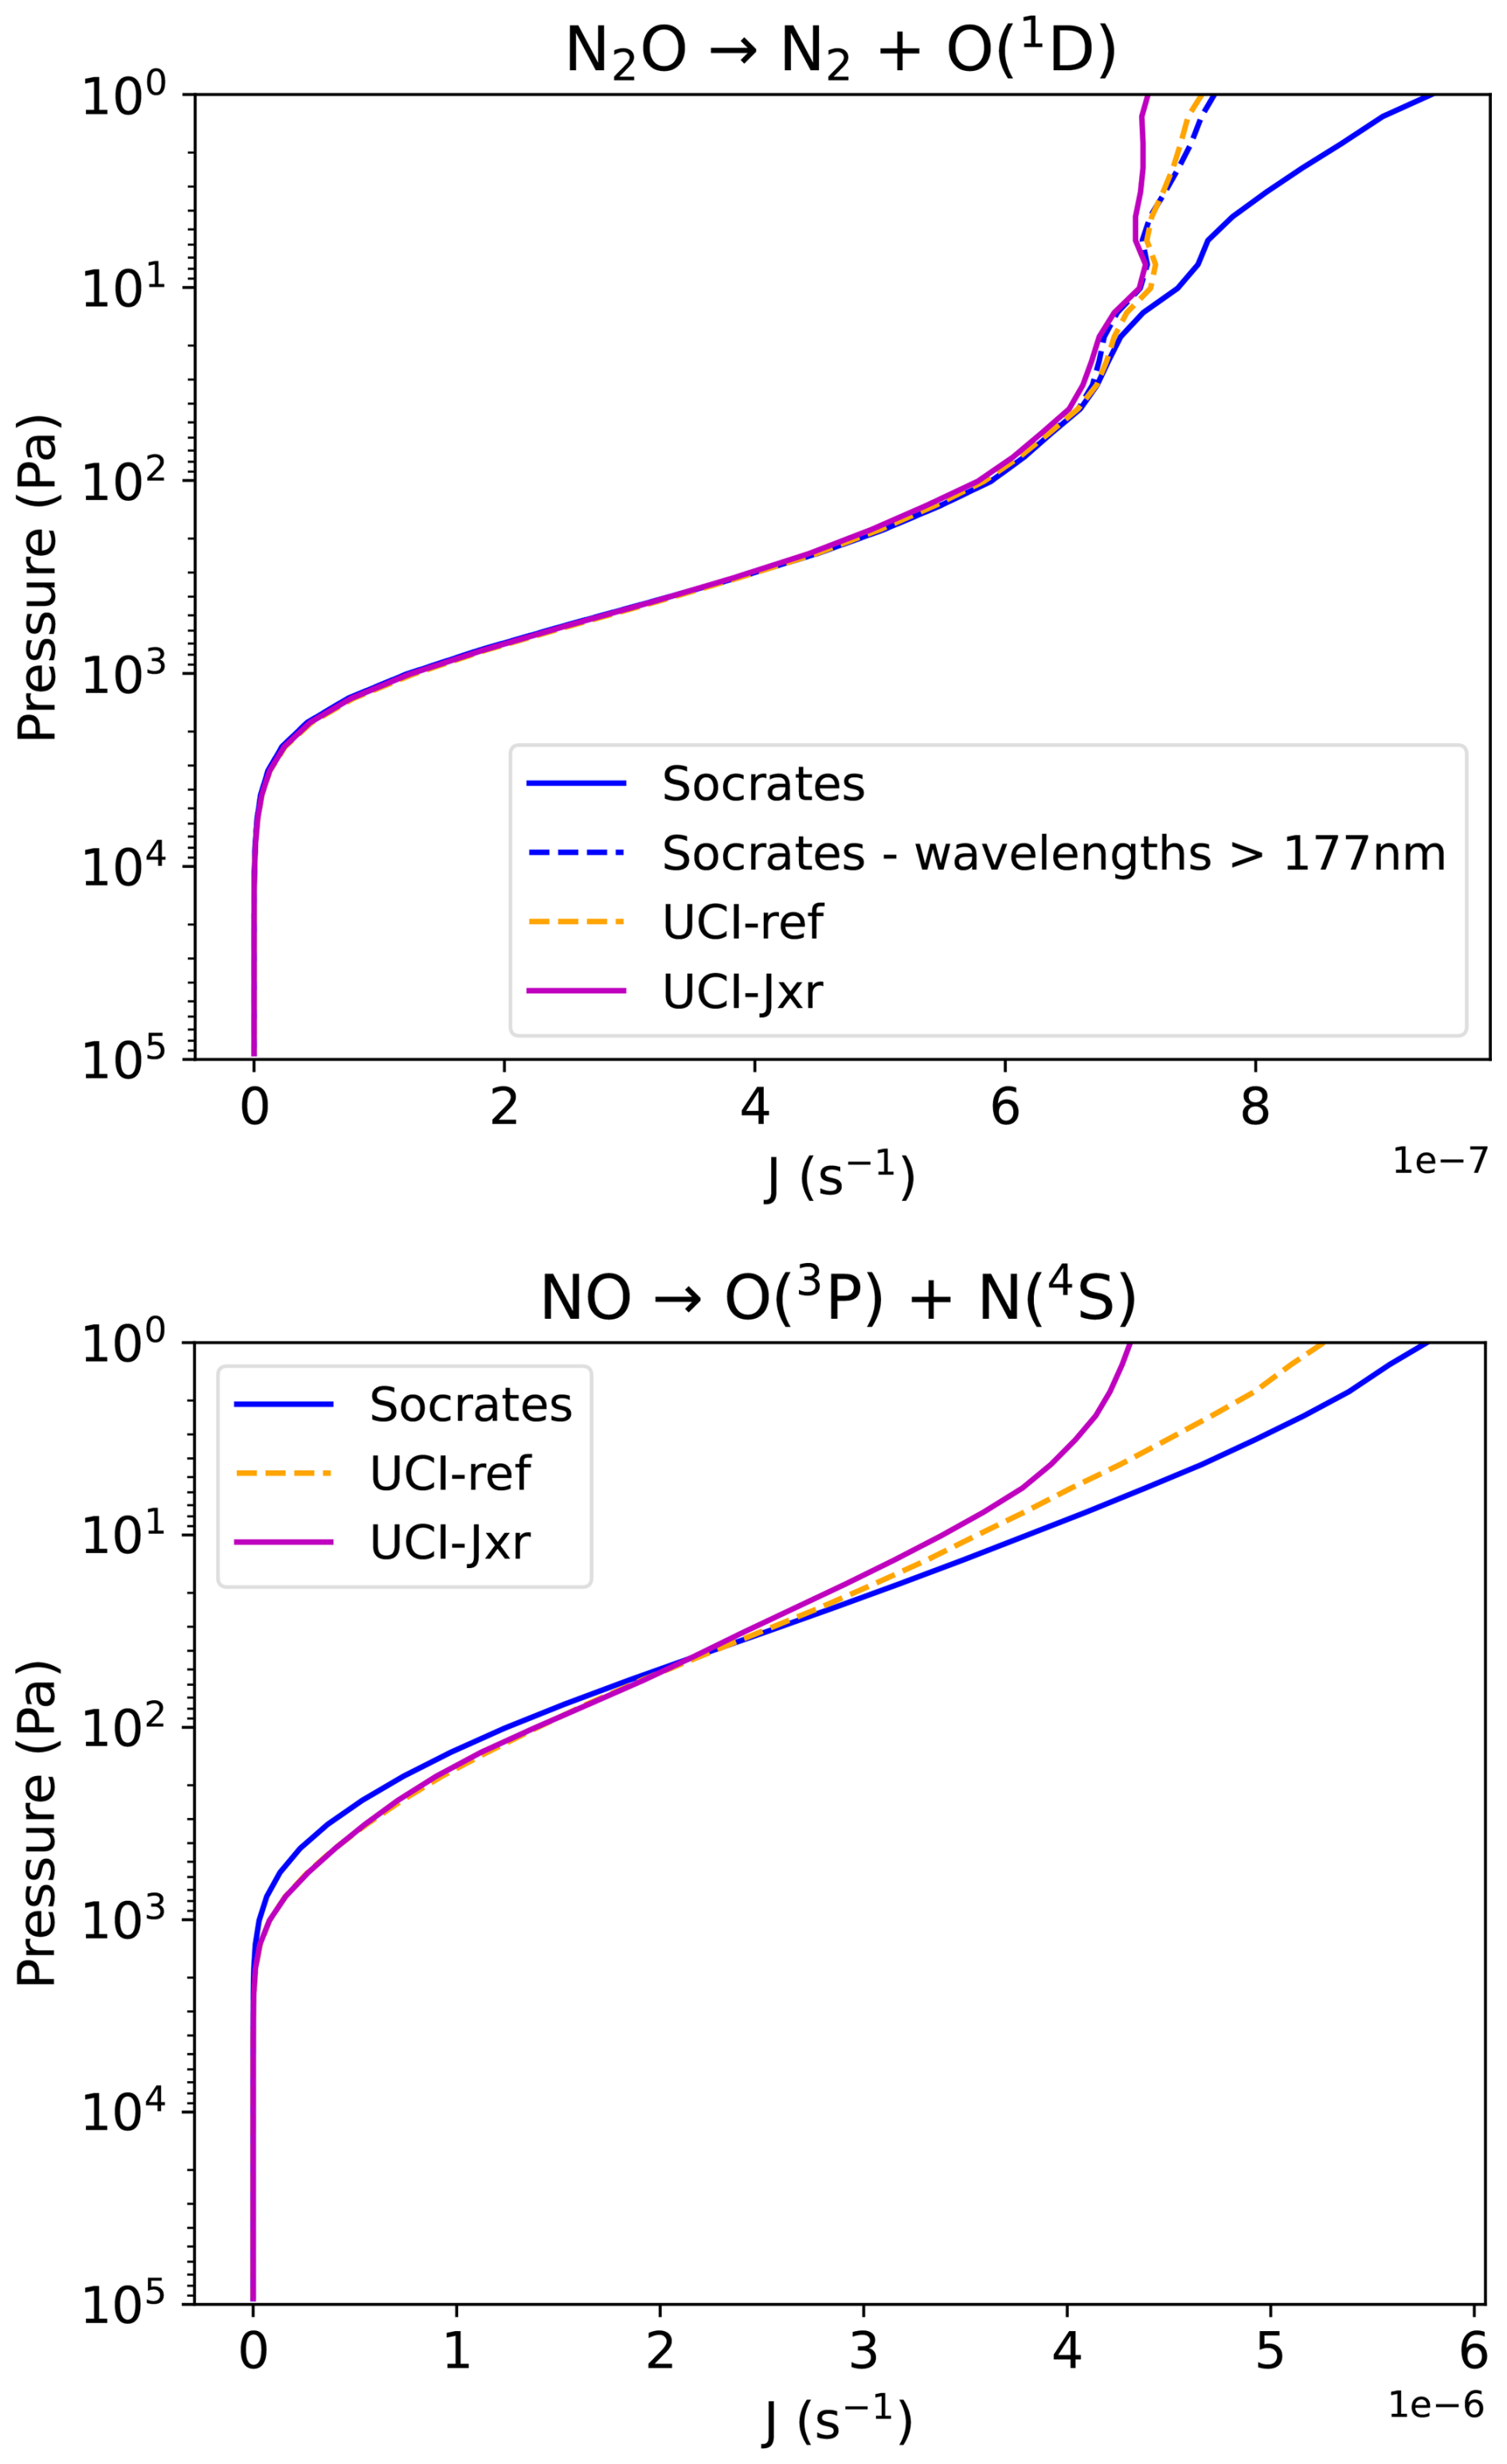
Figure 8Photolysis rates for N2O and NO as a function of atmospheric pressure (Pa). Socrates rates (blue) are compared with the UCI-ref (dashed orange) and UCI-Jxr (purple) models. Socrates rates for N2O are also shown with only wavelengths > 177 nm included (dashed dark blue line).
For N2O we use the recommended cross-sections from JPL 19-5 including the temperature dependence between 173–240 nm from Selwyn et al. (1977). We extend the cross-sections into the FUV and EUV using the data reported in Table A1.
Socrates photolysis rates for the reaction match the UCI-ref values closely at pressures higher than ∼10 Pa. However Socrates rates continue to increase towards lower pressures while the UCI-ref rates do not. The quantum yield for this reaction is taken to be 1 for all wavelengths below the threshold at 336 nm. High TOA rates at FUV wavelengths, particularly around Lyman-α, are displayed in the photolysis spectrum shown in Fig. 17. If we only consider wavelengths > 177 nm in the Socrates calculations the rates near the TOA are reduced and more closely match the reference.
The photoabsorption cross section of NO gas features fine band structures. Fluorescence occurs, except within the “delta” bands δ(0-0) and δ(1-0), which correspond to the wavelengths 189.4–191.6 and 181.3–183.5 nm respectively (Akimoto, 2016; Mayor et al., 2007). It is in these narrow regions that photolysis occurs with a quantum yield of unity. These regions coincide with the O2 Schumann Runge bands where there is also fine structure in the O2 absorption spectrum and therefore in the acintic flux. For these reasons an accurate rotational line list is needed for NO and this was sourced from the line list “XABC”, from Exomol (Tennyson et al., 2016; Wong et al., 2017). Absorption cross-sections at high-resolution were determined from the line parameters with a pressure and temperature dependence based on Voigt line profiles.
The photolysis spectrum calculated by Socrates for the NO dissociation shows the narrow photolysis regions have been clearly resolved (see Fig. 17). The rates calculated by Socrates match the reference values reasonably well, as shown in Fig. 7 with slightly higher values at pressures below 50 Pa and slightly lower values for higher pressures. Note that an NO mass mixing ratio was included in the calculation of the photolysis rates as discussed in Sect. 4.1.1 which contributes to absorption of the actinic flux in these narrow bands and acts to reduce the photolysis rates at higher pressures.
For N2O5 we use the recommended cross-sections from JPL 19-5 between 200–420 nm including the temperature dependence from Harwood et al. (1993) between 260–410 nm. We extend the cross-sections at short wavelengths down to 152 nm using data from Osborne et al. (2000).
For the reaction we use the quantum yields from JPL 19-5 and IUPAC which recommend a value of 1 above 300 nm then stepping down to 0.85, 0.79, 0.62 and 0.08 in wavelength bins centred at 289, 287, 266 and 248 nm respectively. Figure 9 shows the photolysis rates yielded from this reaction which match the UCI-ref values reasonably well in the lower atmosphere. The differences in the upper atmosphere are likely attributable to the treatment of the quantum yield below 300 nm. The actinic flux at these wavelengths is attenuated by ozone in the stratosphere and so does not affect the photolysis rates in the lower atmosphere. If we repeat the Socrates calculations using a quantum yield of 1 at all wavelengths the photolysis rates closely match the UCI-ref values throughout the profile.
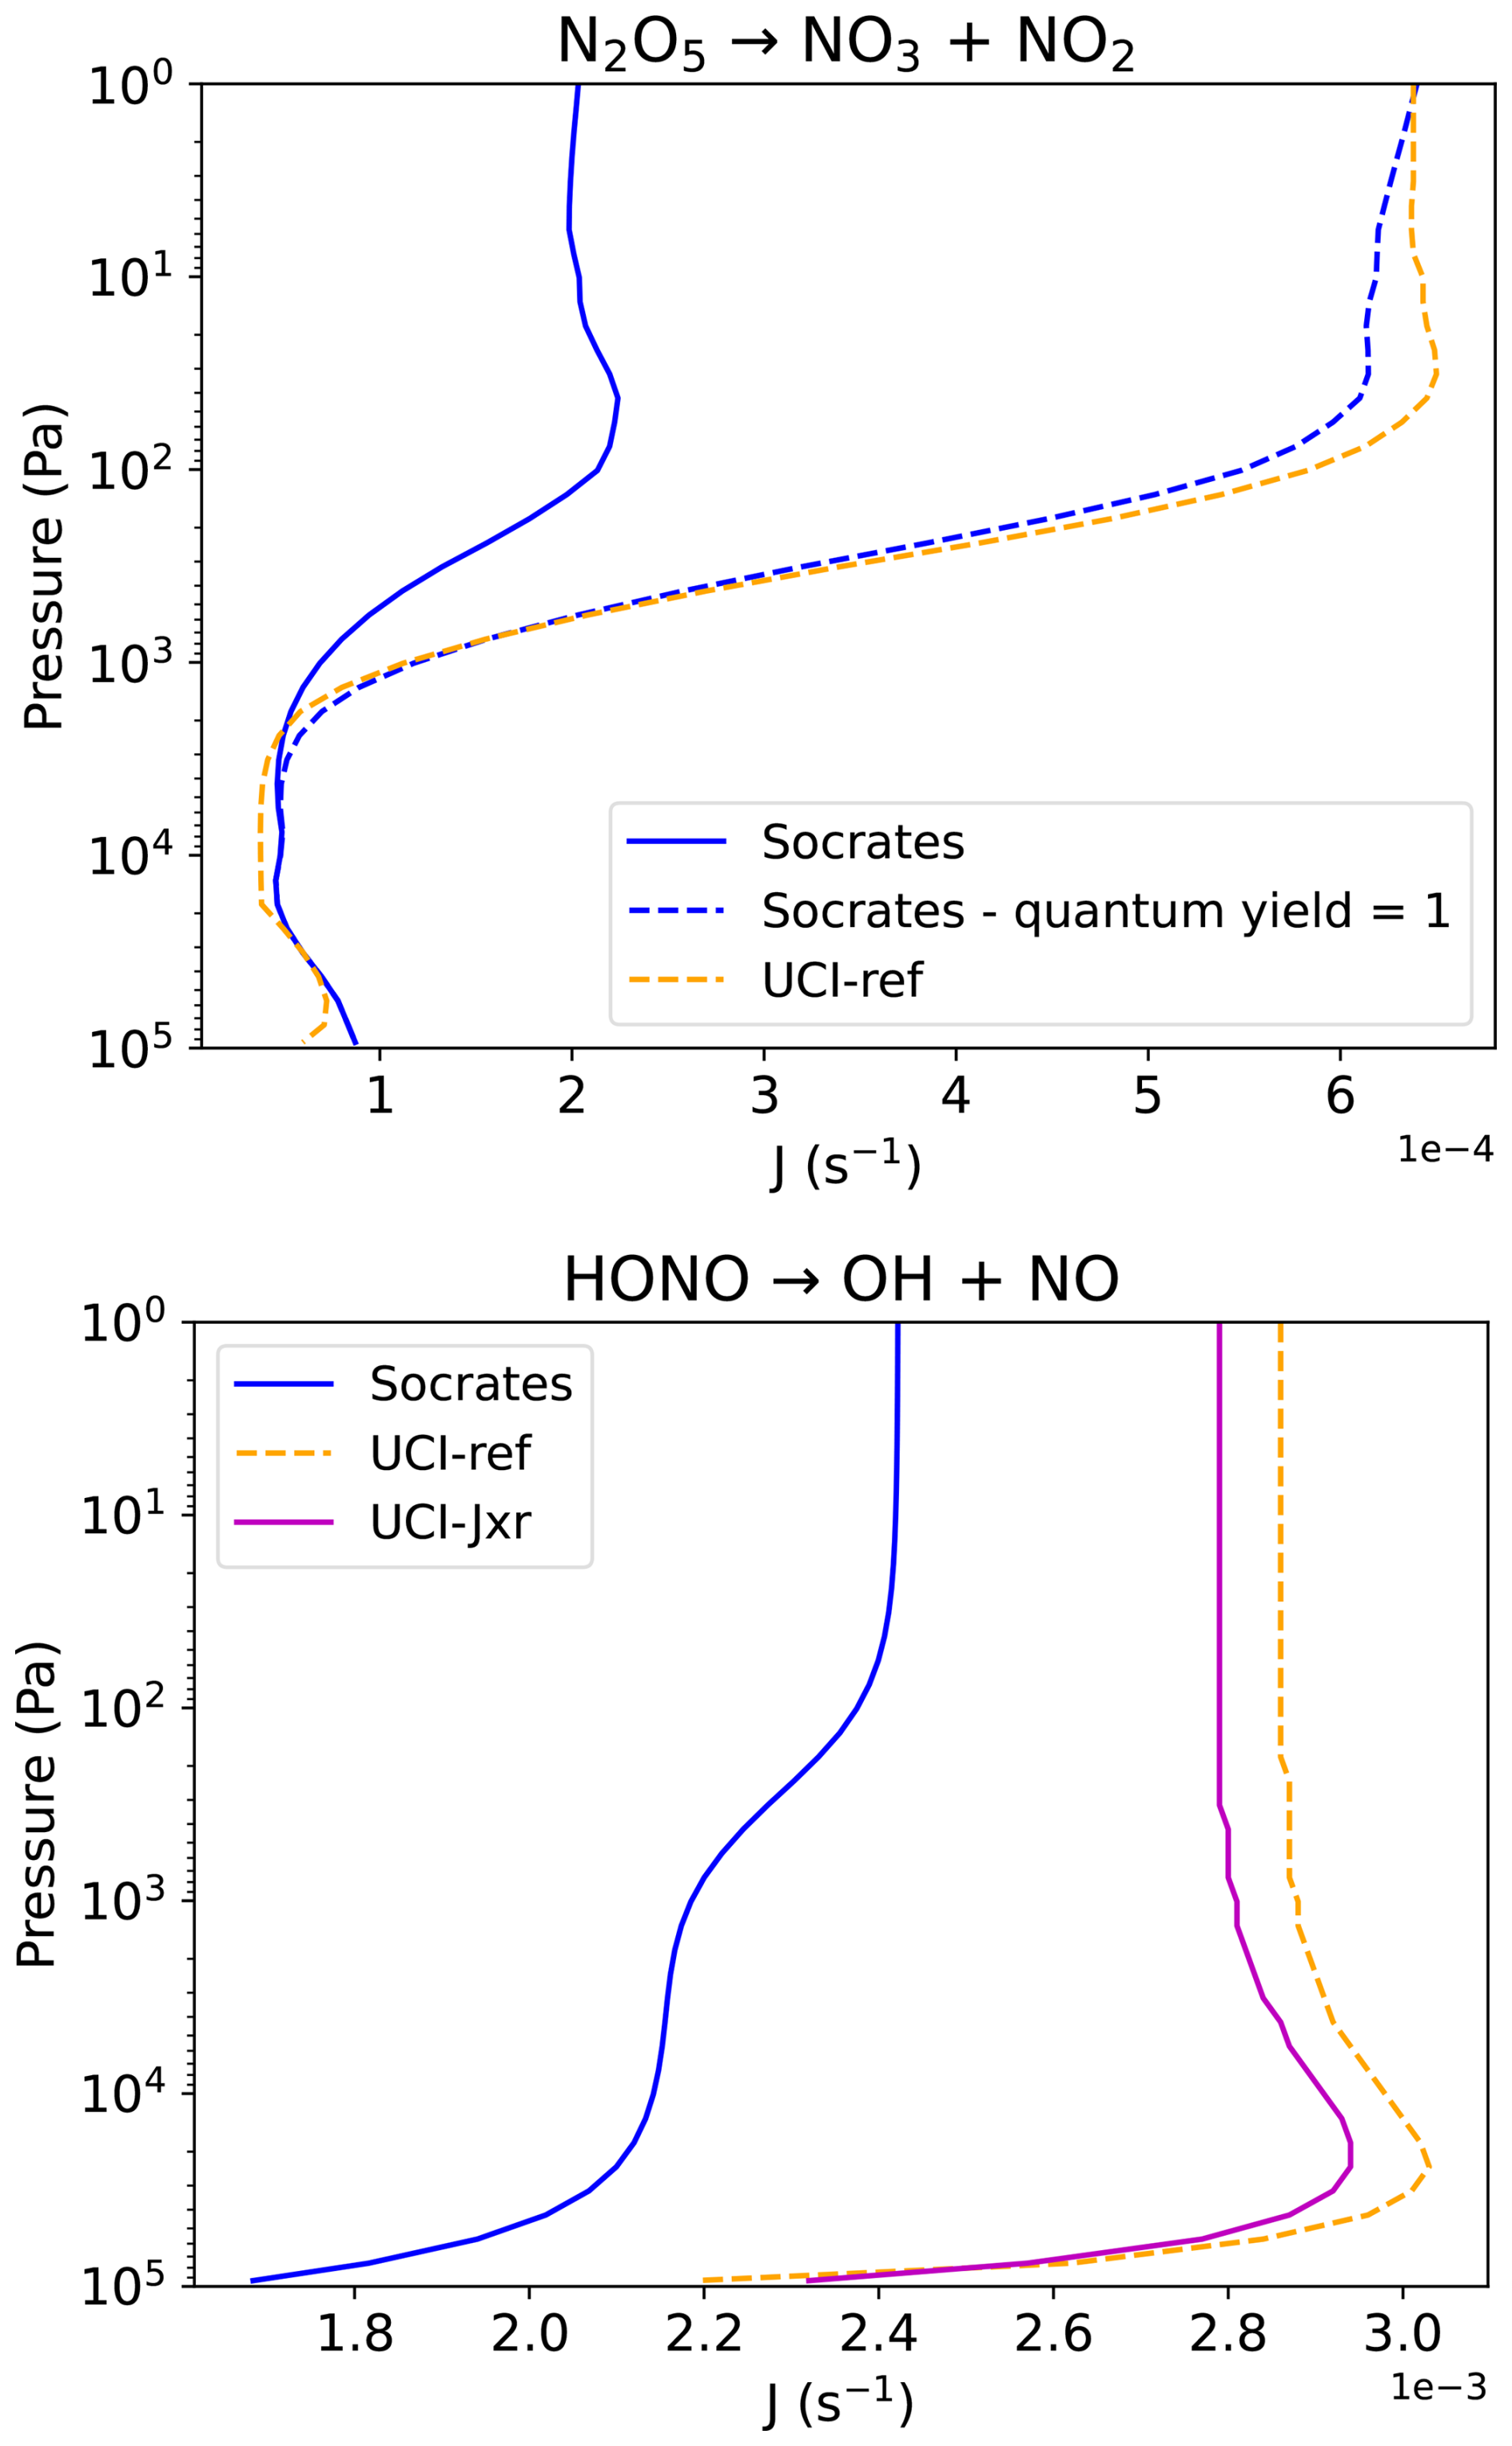
Figure 9Photolysis rates for N2O5 and HONO as a function of atmospheric pressure (Pa). Socrates rates (blue) are compared with the UCI-ref model (dashed orange) and, for HONO, the UCI-Jxr model (purple). Socrates rates for the reaction are also shown using a quantum yield of 1 for all wavelengths (dashed blue).
For HONO we use the recommended cross-section from JPL 19-5 between 184–396 nm extended to 400 nm using the 0.5 nm resolution data of Stutz et al. (2000). The JPL 19-5 cross-section contains a gap between 274–296 nm which we fill using the Stutz et al. (2000) 0.5 nm resolution data between 292–296 nm and an interpolation in the logarithm of the cross-sections between 274–292 nm. The quantum yield for the reaction is taken to be unity following the JPL 19-5 recommendation. The Socrates photolysis rates shown in Fig. 9 are found to be ∼15 % lower than UCI-ref at TOA indicating differences in the HONO cross-section used between the models. Towards higher pressures the Socrates photolysis rates decrease due to absorption of actinic flux in the ozone Huggins bands above 300 nm. We use updated HITRAN 2020 ozone cross-sections in this region compared to UCI-ref which displays less absorption.
For HNO3 we use the JPL 19-5 recommended temperature dependent absorption cross-sections. Between 240–315 K we use the data measured by Burkholder et al. (1993). We extend the temperature dependence to 200 K using the recommended temperature coefficients from Burkholder et al. (1993). Quantum yields for the reaction are reported by JPL 19-5 without a specific recommendation so we adopt the recommended values from IUPAC of 0.97 above 248 nm, 0.9 between 200–248 nm and 0.33 below 200 nm. The resultant photolysis rates from Socrates in Fig. 10 are significantly lower than those of UCI-ref. We note that a quantum yield of 1 for wavelengths > 200 nm is consistent with the range of reported values in JPL 19-5. If we use a quantum yield of 1 for all wavelengths (blue dashed line) the photolysis rates match the UCI-ref values very well.
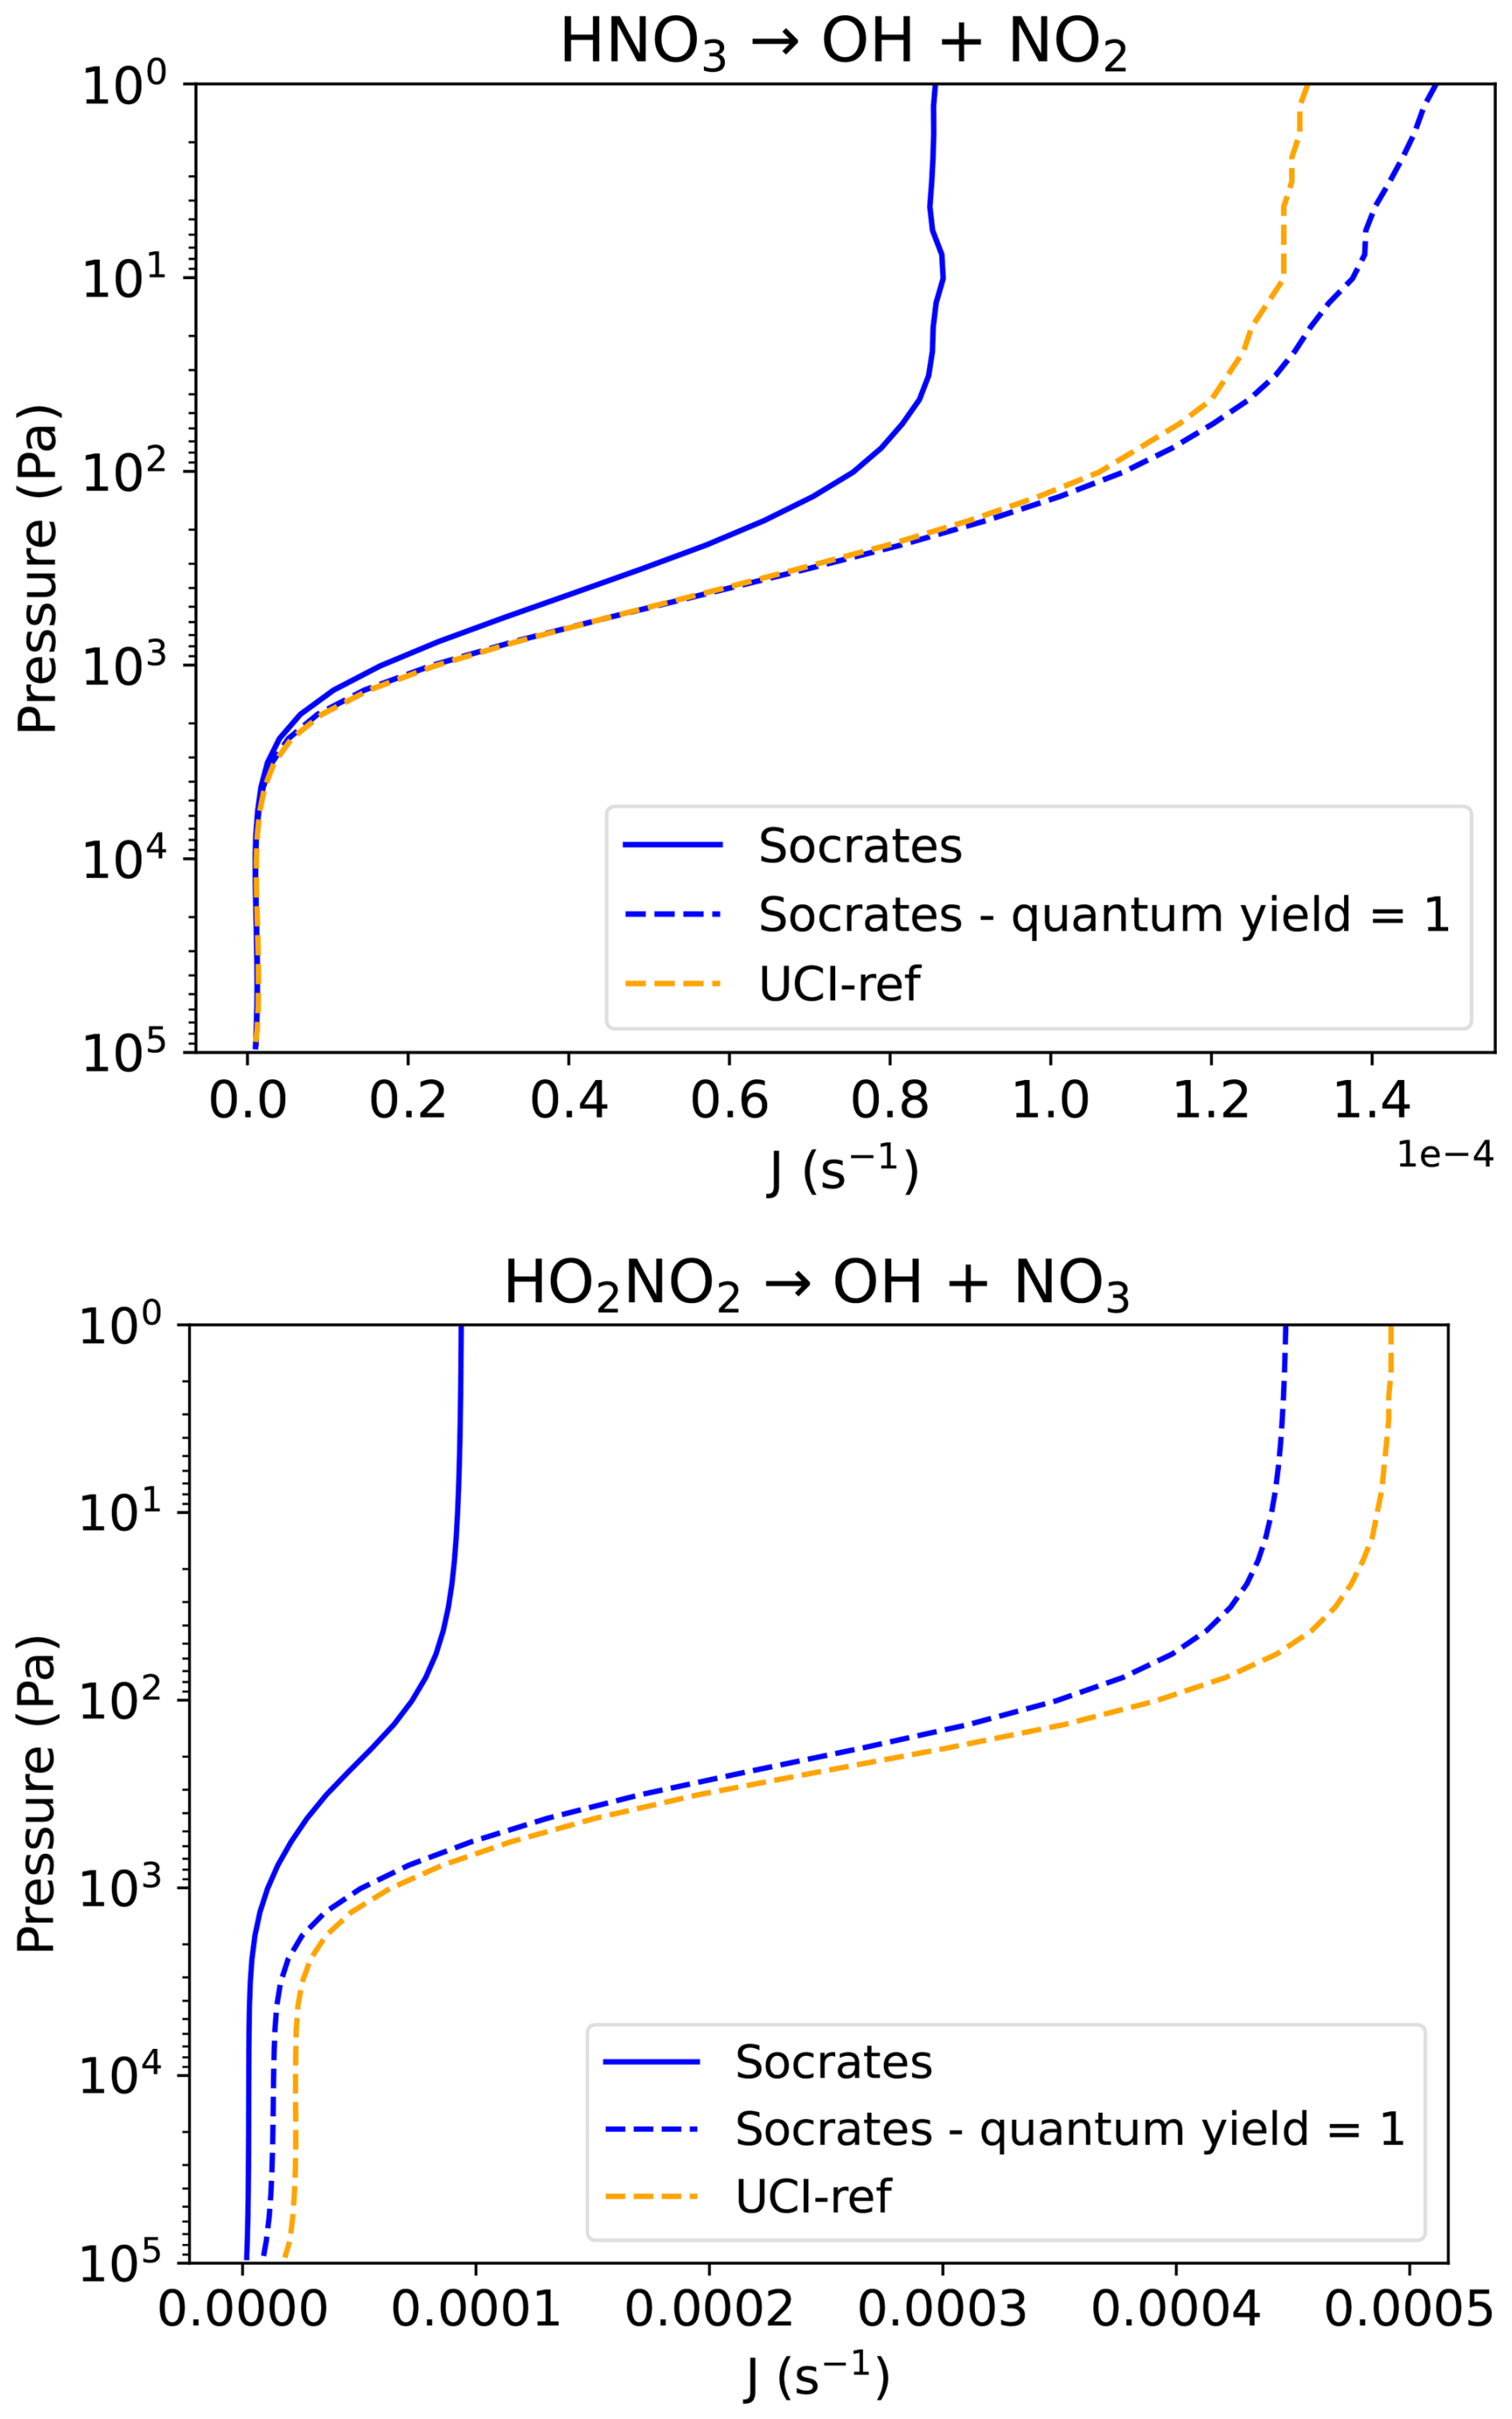
Figure 10Photolysis rates for HNO3 and HO2NO2 as a function of atmospheric pressure (Pa). Socrates rates (blue) are compared with the UCI-ref model (dashed orange). Socrates rates are also shown using a quantum yield of 1 for all wavelengths (dashed blue).
For HO2NO2 we use the JPL 19-5 recommended cross-sections between 190–350 nm in the UV. For this comparison we ignore photodissociation in the overtone and combination bands in the infra-red. For the reaction we use the JPL 19-5 recommended quantum yields of 0.3 at wavelengths < 200 nm and 0.2>200 nm. The photolysis rates shown in Fig. 10 are significantly lower than UCI-ref. However, if we again use a quantum yield of 1 at all wavelengths (blue dashed line) the rates match the UCI-ref values reasonably well, indicating the reference results may actually be for the total HO2NO2 photolysis rate rather than the particular channel specified for PhotoComp.
4.1.6 Organic
Figure 11 shows the photolysis rates for the reactions , and , where S(3P) is the ground state of the sulphur atom.
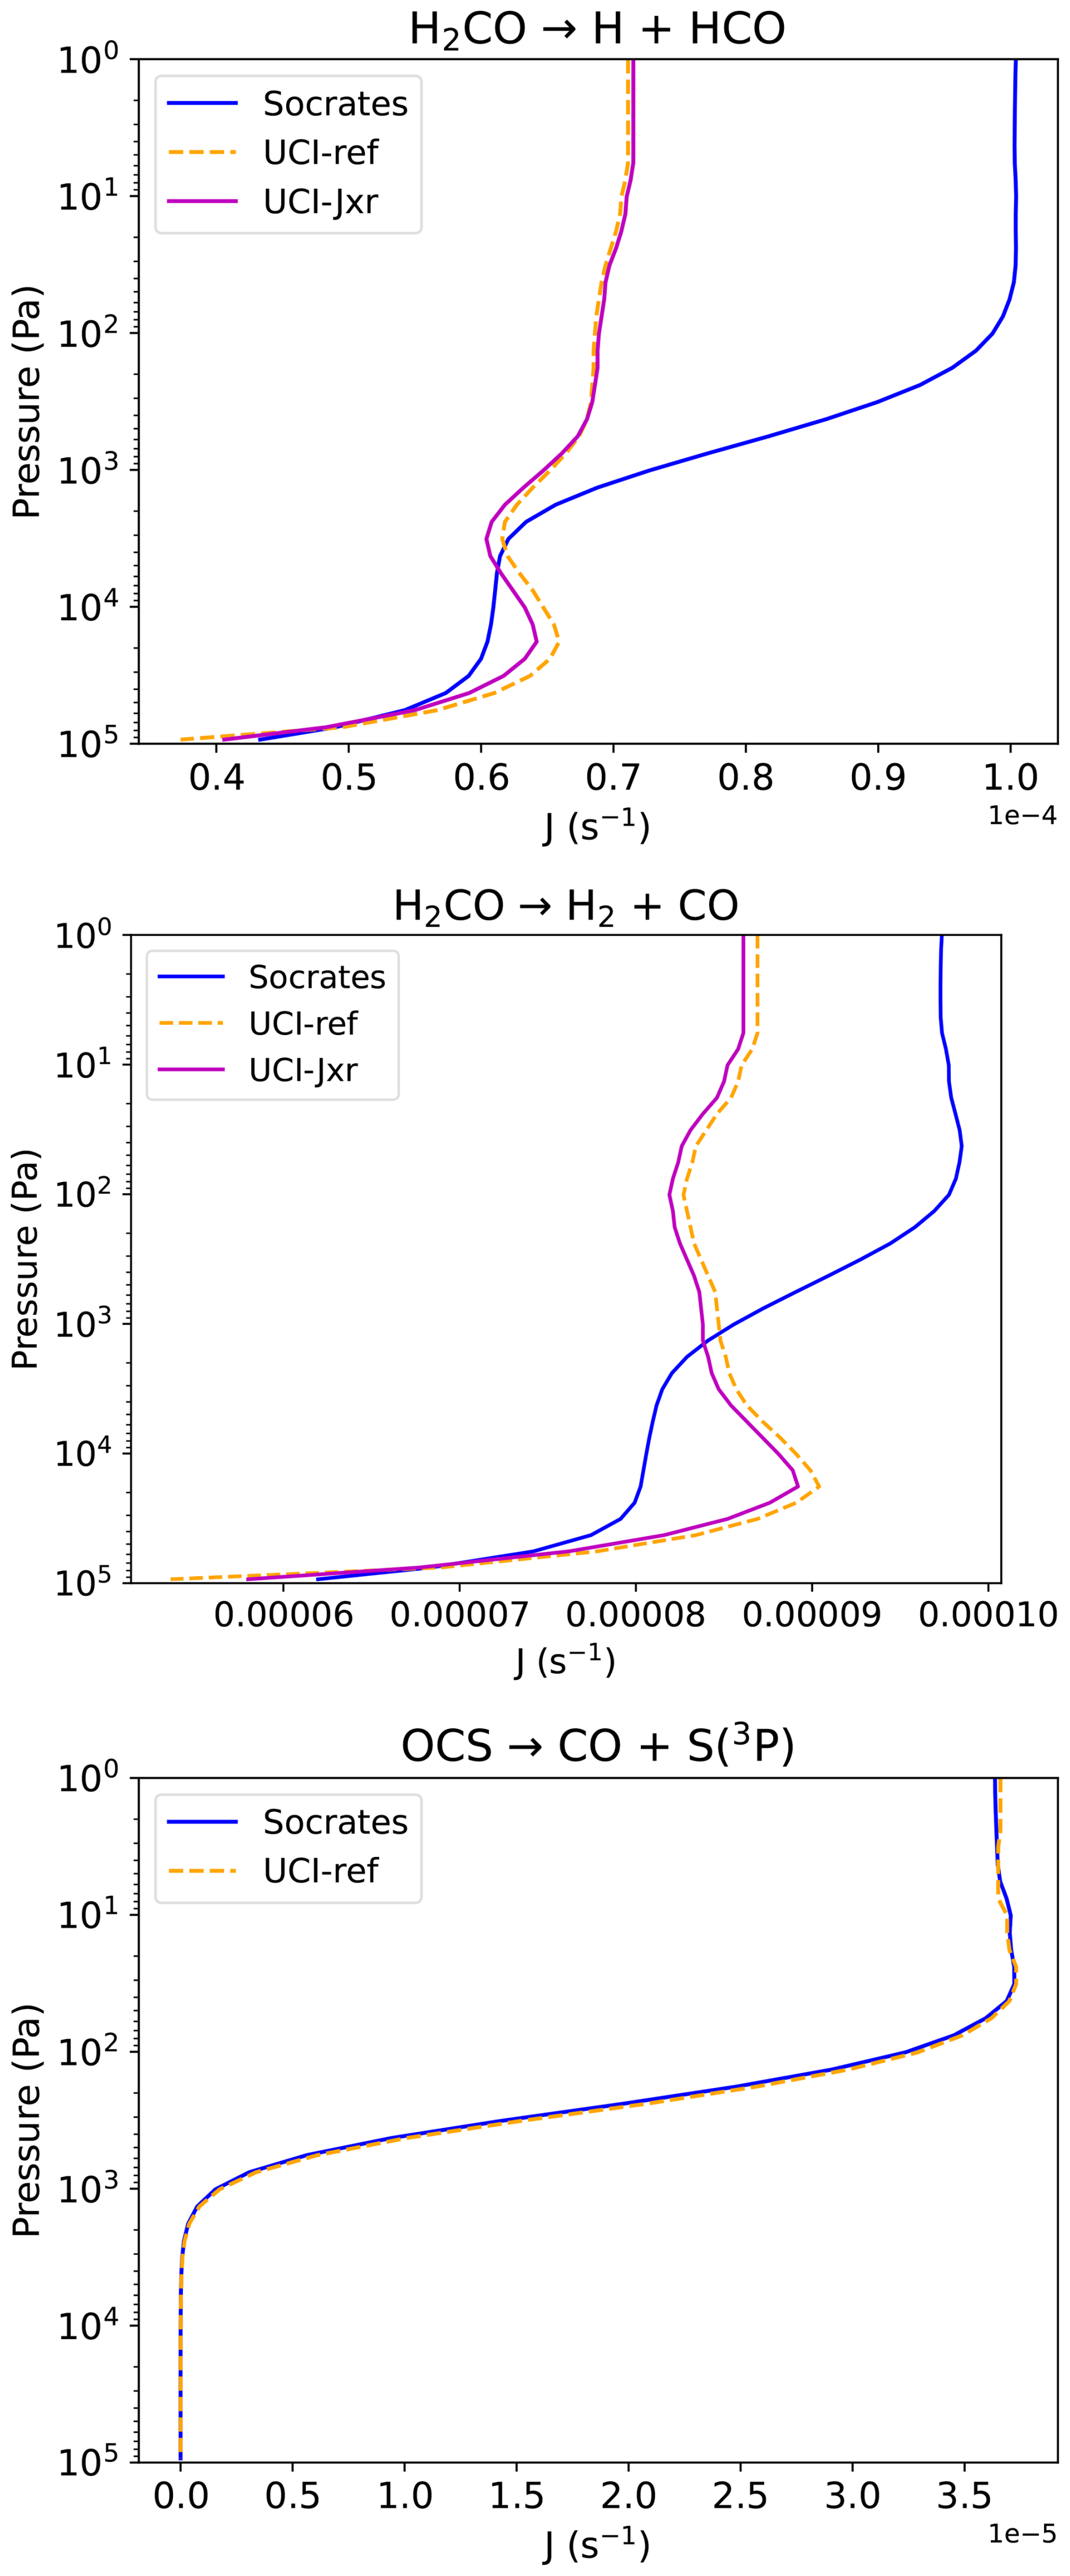
Figure 11Photolysis rates for H2CO and OCS as a function of atmospheric pressure (Pa). Socrates rates (blue) are compared with the UCI-ref model (dashed orange) and, for H2CO, the UCI-Jxr model (purple).
For formaldehyde, H2CO, the Socrates photolysis rates are of similar magnitude to the UCI-ref values but differ in the shape of the profile, with a particular increase towards lower pressures not seen in the reference models. As formaldehyde features fine structure within its cross section as a function of wavelength, we have adopted high resolution data as indicated in Table A1. We have implemented quantum yields for standard pressure (1 atmosphere) and 300 K from the JPL 19-5 report (Burkholder et al., 2020). However, for both the reactions and the quantum yield has a strong dependence on both pressure and temperature which we have not taken into account as the functionality to incorporate a pressure dependence has not yet been included in Socrates. This is likely to be the main cause of the discrepancy with the UCI-ref model values.
Figure 11 shows that for carbonyl sulphide, OCS, the Socrates rates and those of the reference agree very well. We use the temperature dependent cross-sections recommended by JPL 19-5 together with a quantum yield of 1 for all wavelengths.
Figure 12 displays the photolysis rates for the remaining organic species considered, namely CH3OOH, CH3CHO, PAN, CH3COCH3, CHOCHO, CH3ONO2, CH3COCHO and HOCH2CHO as a function of pressure (Pa). For the first reaction pathway of CH3C(O)OONO2 (polyacrylonitrile, or PAN), the Socrates rates match the reference particularly well, whereas for the second PAN reaction and CH3COCH3 there is a significant discrepancy. The quantum yields adopted for our calculations of the rates for PAN and CH3COCH3 (based on the JPL recommendations) could be the source of this discrepancy. The quantum yields are temperature and pressure dependent for CH3COCH3, however we currently only have the functionality to represent the temperature dependence. To account for the pressure dependence we used an appropriate tropospheric pressure in the formulation to calculate the quantum yields for the four temperatures in the look-up table (see Table A1). Future work is needed to properly incorporate the pressure dependence and this could be a contributing source of the difference with the reference model for CH3COCH3 as well as some other organic species (e.g. formaldehyde).
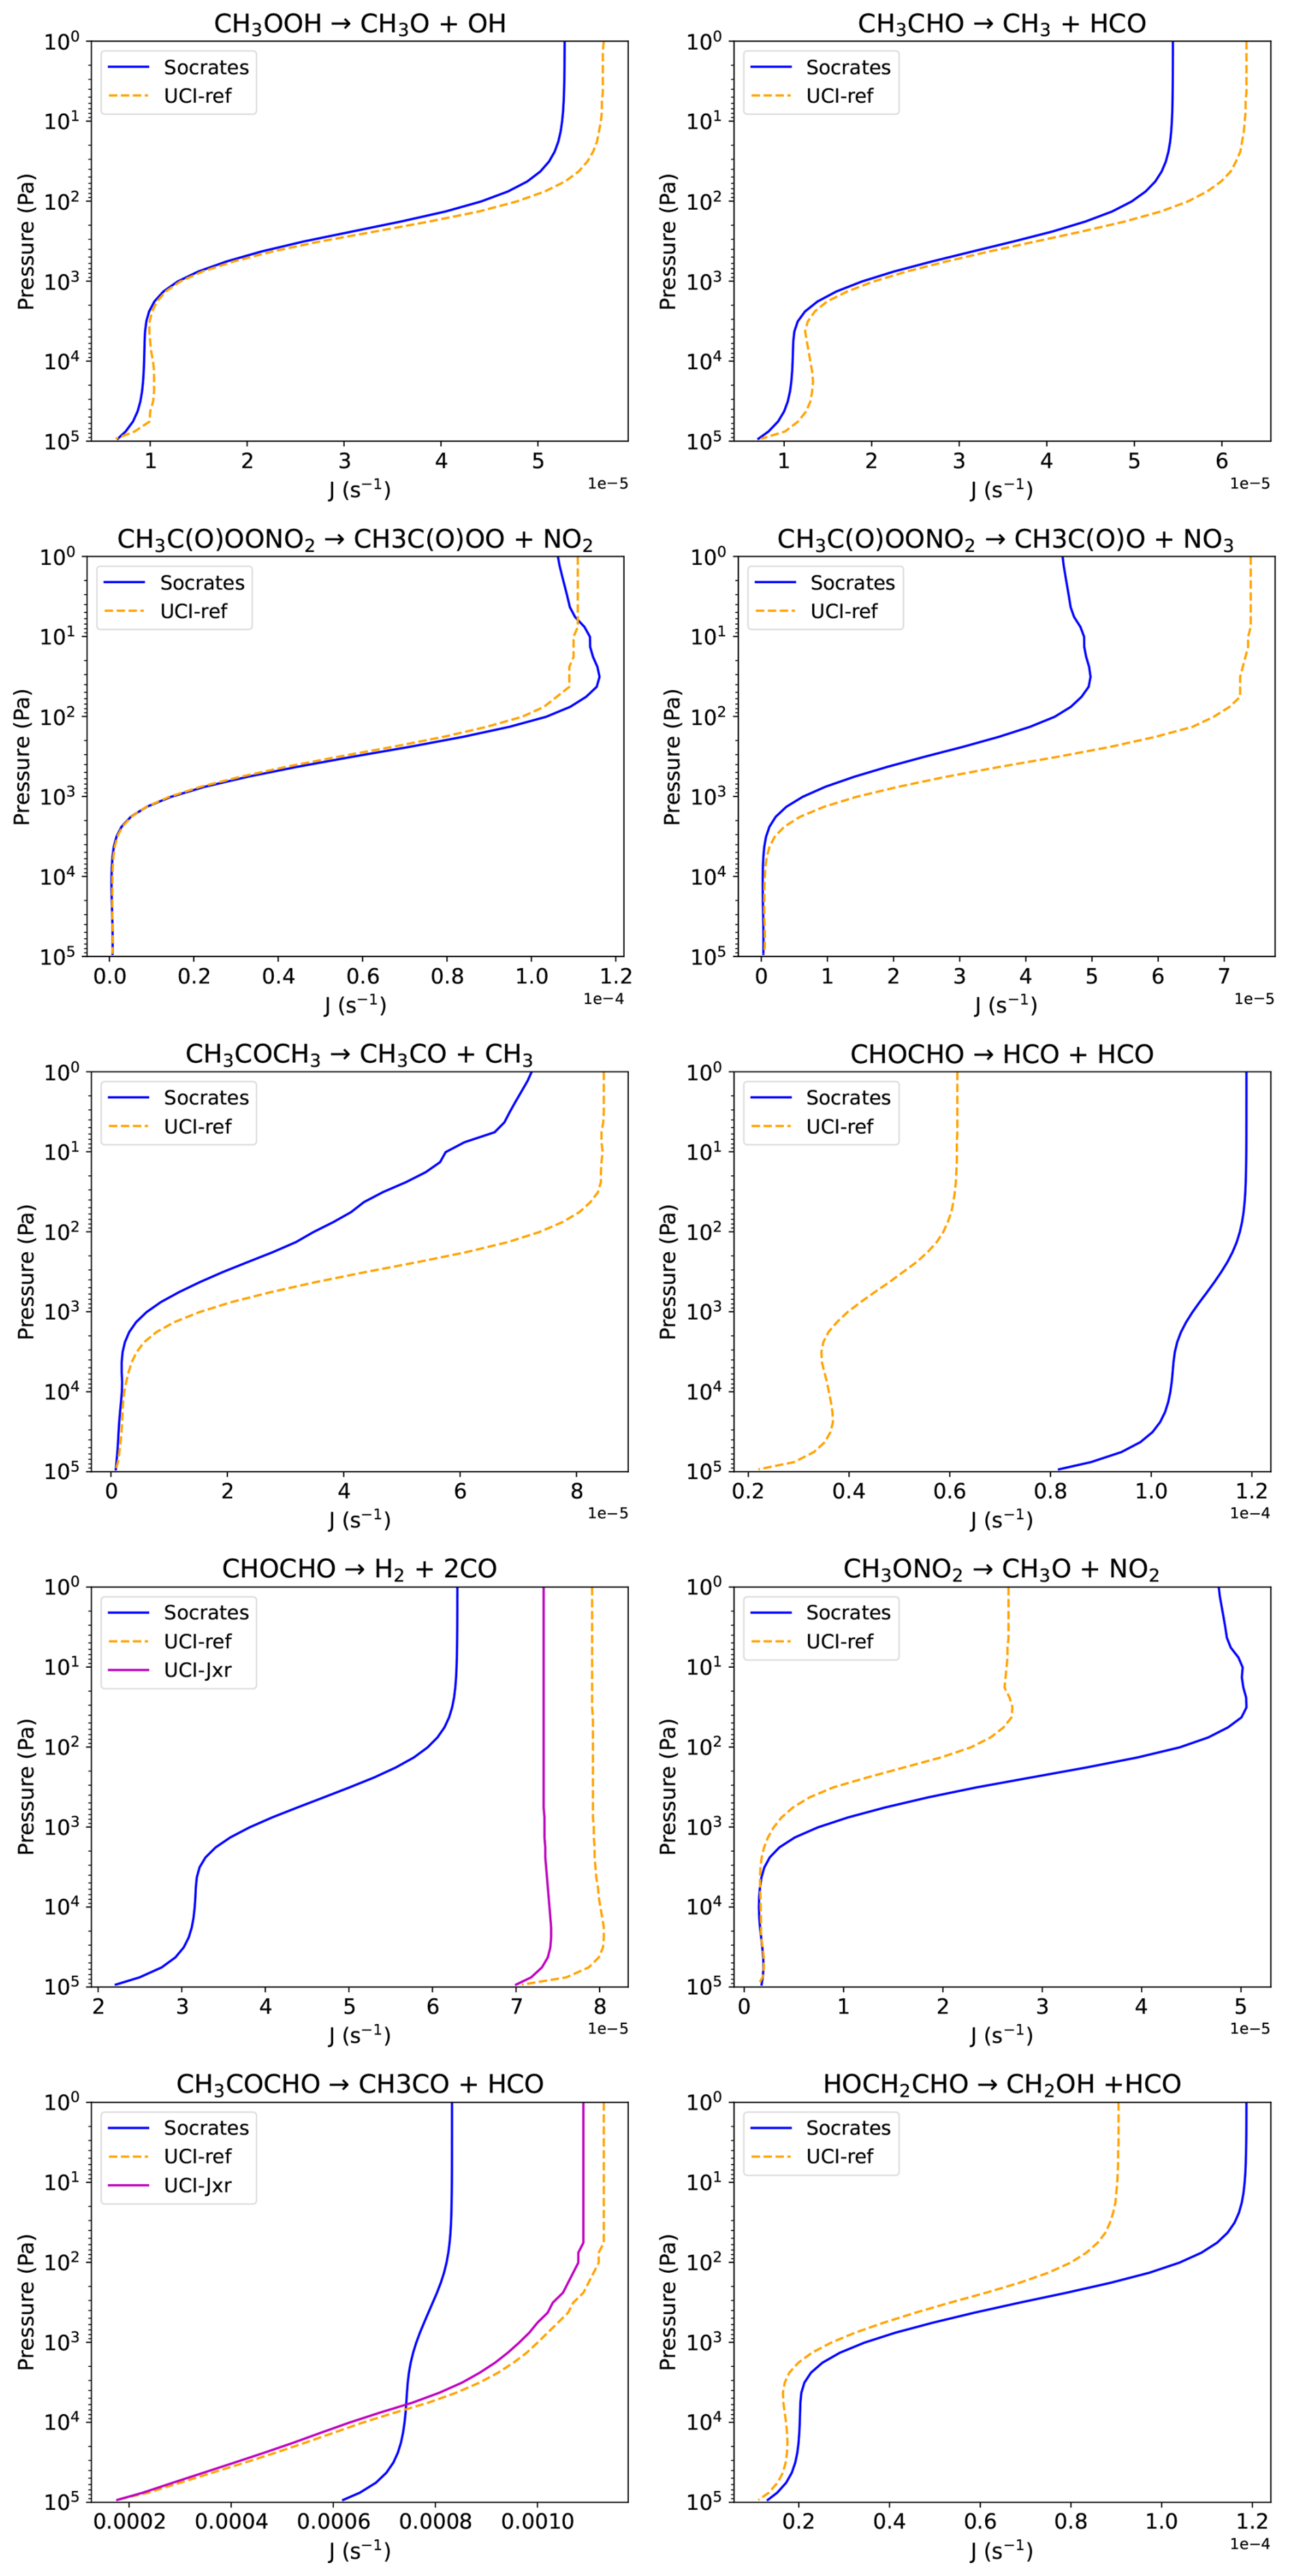
Figure 12Photolysis rates for the organic species CH3OOH, CH3CHO, CH3C(O)OONO2 (PAN), CH3COCH3, CHOCHO, CH3ONO2, CH3COCHO and HOCH2CHO as a function of atmospheric pressure (Pa). Socrates rates (blue) are compared with the UCI-ref model (dashed orange) and the UCI-Jxr model (purple) where it differs significantly from UCI-ref.
There are even more significant differences between our rates and those of the reference for other organic species, namely, CHOCHO (glyoxal), CH3ONO2 (methyl nitrate) and CH3COCHO (methylglyoxal). For the first reaction of CHOCHO our Socrates rates are higher than those of the reference, while for the second they are lower. The quantum yields for CHOCHO again have a significant pressure dependence that we have not included which is likely to be the main cause of the discrepancy. Similarly, the quantum yields for CH3COCHO have a pressure dependence that we have not included leading to the marked difference in shape between the photolysis rate profiles of Socrates and the reference models.
The rates calculated by Socrates for CH3ONO2 match the UCI-ref values well in the lower atmosphere but are significantly higher than the references within and above the ozone layer. The JPL 19-5 report does not provide recommended values of the quantum yield but reports conflicting values measured at particular wavelengths. We use a quantum yield of 1 for wavelengths > 248 nm, 0.91 for wavelengths 241–248 nm and 0.7 for wavelengths < 241 nm. However the chosen limits are fairly arbitrary and likely to be the cause of the discrepancy between the Socrates and UCI-ref photolysis rates.
4.2 Comparison with M Dwarf spectra
Many M dwarf stars have been shown to host potentially Earth-like planets (Tuomi et al., 2019). For such planets, photolysis is likely to play an important role in determining the climate. Previous studies have explored the impact of both the quiescent stellar irradiation and the impact of flares on the atmospheres of planets orbiting M dwarfs (e.g Ridgway, 2023). However, such studies have focused on limited photochemical reactions and have not been extensively benchmarked. In this work, we perform calculations using Socrates with the same Earth-like atmosphere described in Sect. 4.1.1 but with the Solar irradiation replaced with the irradiation of an M dwarf. This provides a set of initial benchmark rates for the major species and photolysis reactions.
Our nearest star, Proxima Centauri has also been shown to host a potentially Earth-like exoplanet (Anglada-Escudé et al., 2016). Therefore, we adopt the spectrum of Proxima Centauri from Ridgway (2023), which is a combination of data from the MUSCLES survey (France et al., 2016; Youngblood et al., 2016; Loyd et al., 2016) and Ribas et al. (2017). However, we maintain the same total TOA incoming flux at 1365 W m−2 as used for the Solar calculations in Sect. 4.1 to make comparison between the resulting rates easier. This is an appropriate total incoming flux for a planet in the habitable zone around Proxima Centauri. Note that for planets at different orbital distances the TOA flux will change according to the inverse square law, while the photolysis rates will scale linearly with the TOA flux. The Proxima Centauri and Solar spectra used are shown in Fig. 13. As noted by Ridgway (2023) the spectrum of Proxima Centauri has a higher proportion of far-UV (FUV) to X-ray flux than the Solar spectrum, particularly below ∼125 nm with the Proxima Centauri flux for Lyman-α emission ∼121.6 nm being significantly higher than the Solar flux. This has implications for the photolysis rates of certain species, where the threshold wavelengths of the photolysis reactions are close to this point, as will be discussed in Sect. 4.2.2–4.2.6 below.
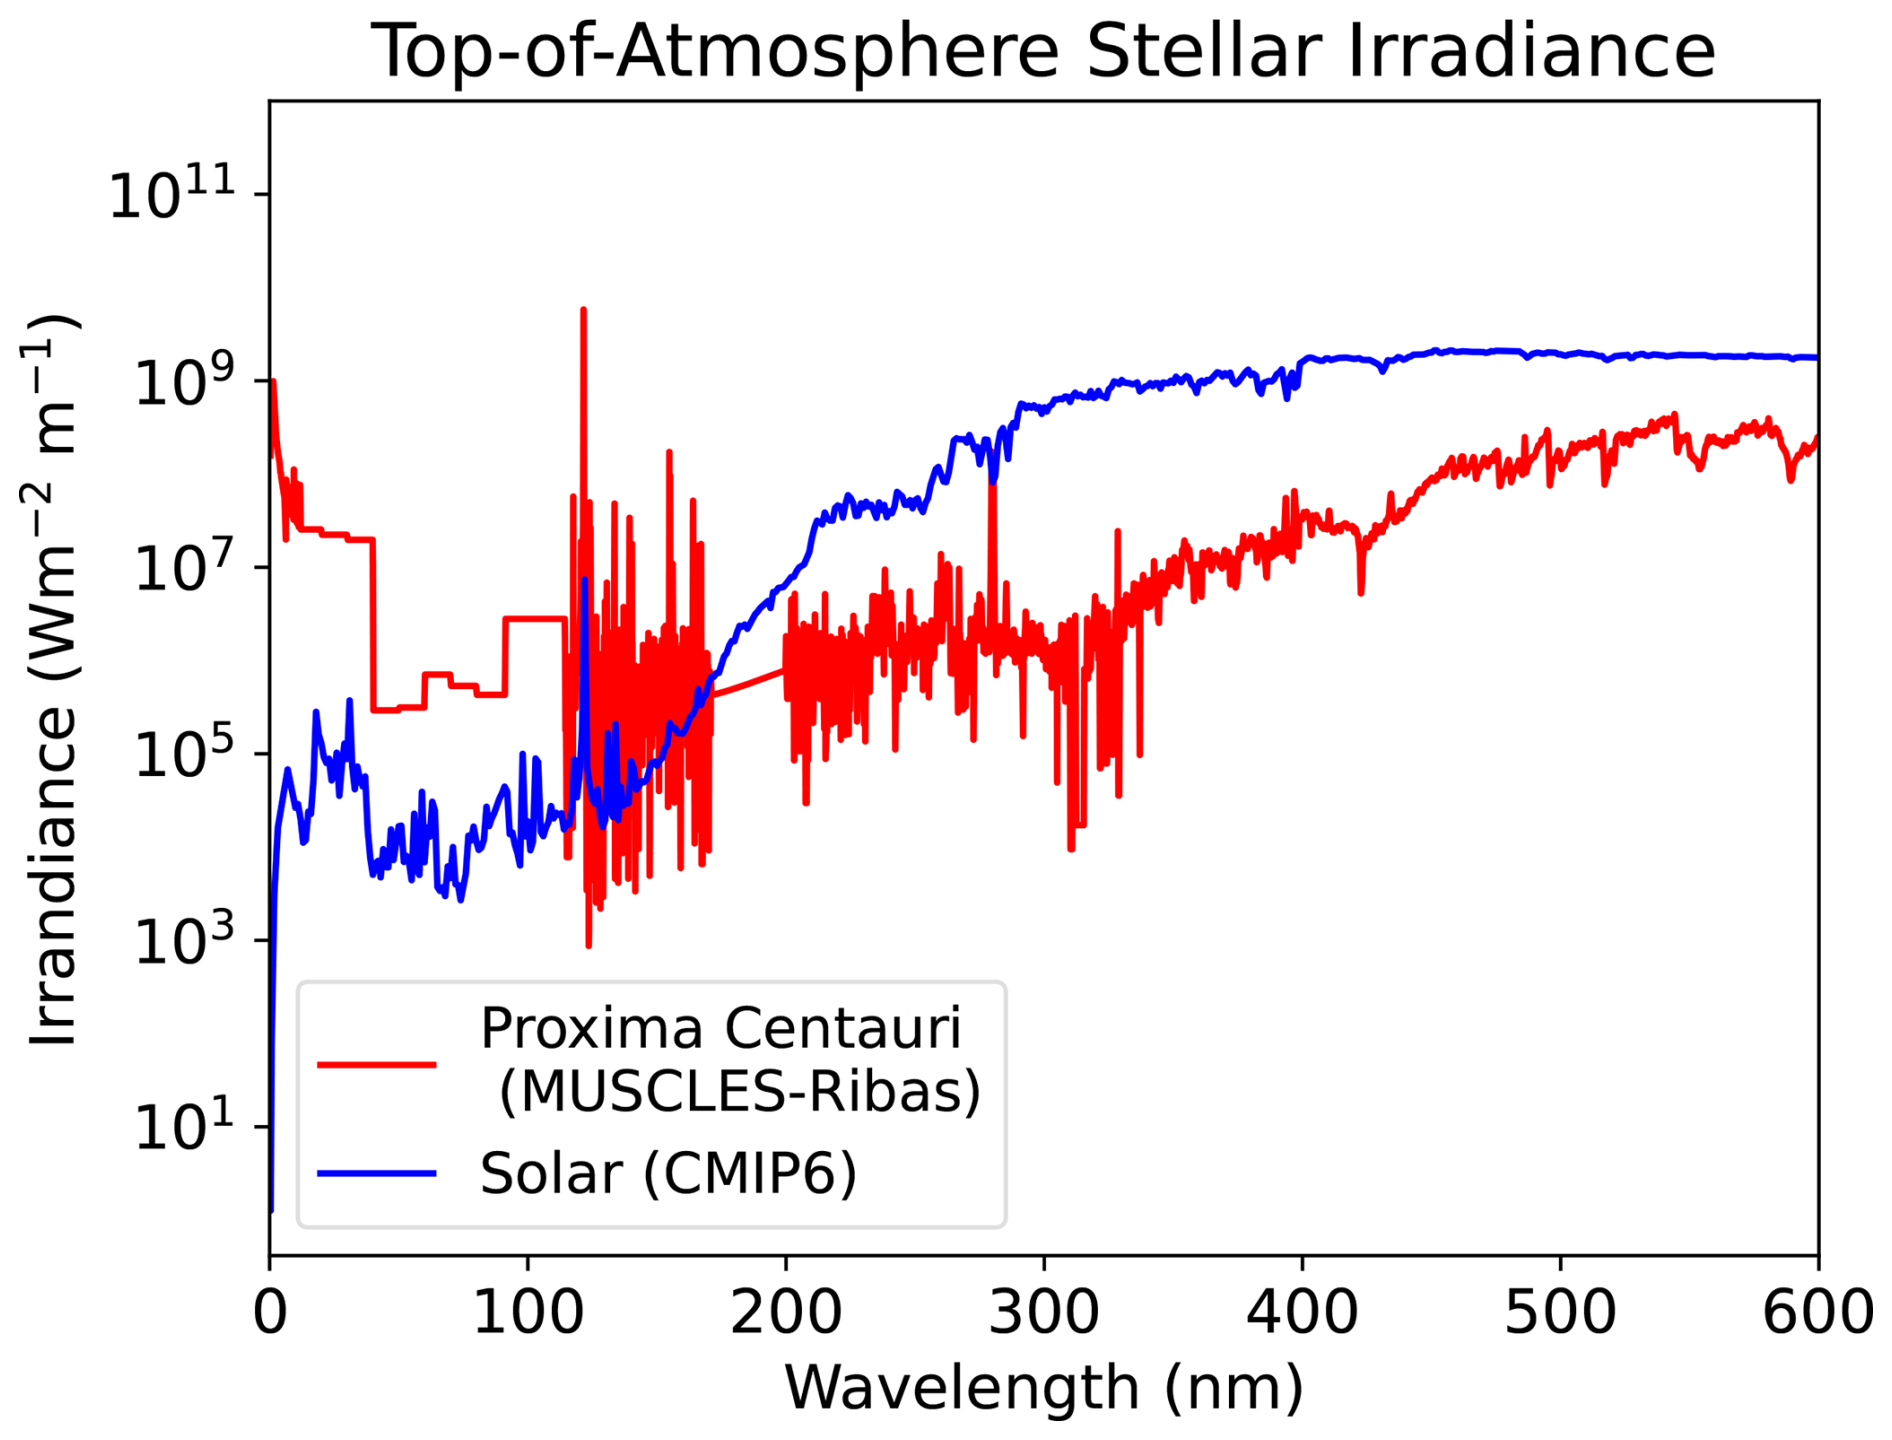
Figure 13Top-of-atmosphere stellar irradiance for the Solar CMIP6 spectrum at 1 AU, compared with the combined MUSCLES-Ribas Proxima Centauri spectrum from Ridgway (2023) at ∼0.02 AU. The value of 0.02 AU was selected to provide a total incoming flux of 1365 W m−2, consistent with the Solar spectrum.
4.2.1 Actinic flux
The higher levels of FUV and EUV flux for Proxima Centauri, compared to the Solar spectrum, shown in Fig. 13, result in a greater availability of actinic flux to drive photolysis below ∼175 nm. Figure 14 shows the actinic flux at three different atmospheric pressure levels, namely the TOA (blue), ∼20 Pa (upper mid-atmosphere, green) and ∼2400 Pa (lower mid-atmosphere, corresponding to the location of the ozone layer, magenta line) for both the Solar and Proxima Centauri spectra as the top and bottom panels, respectively. Figure 14 shows that below 175 nm, there is about an order of magnitude higher actinic flux for the Proxima Centauri spectrum compared to the Solar case, whilst at wavelengths greater than 175 nm there is significantly more actinic flux from the Solar spectrum.
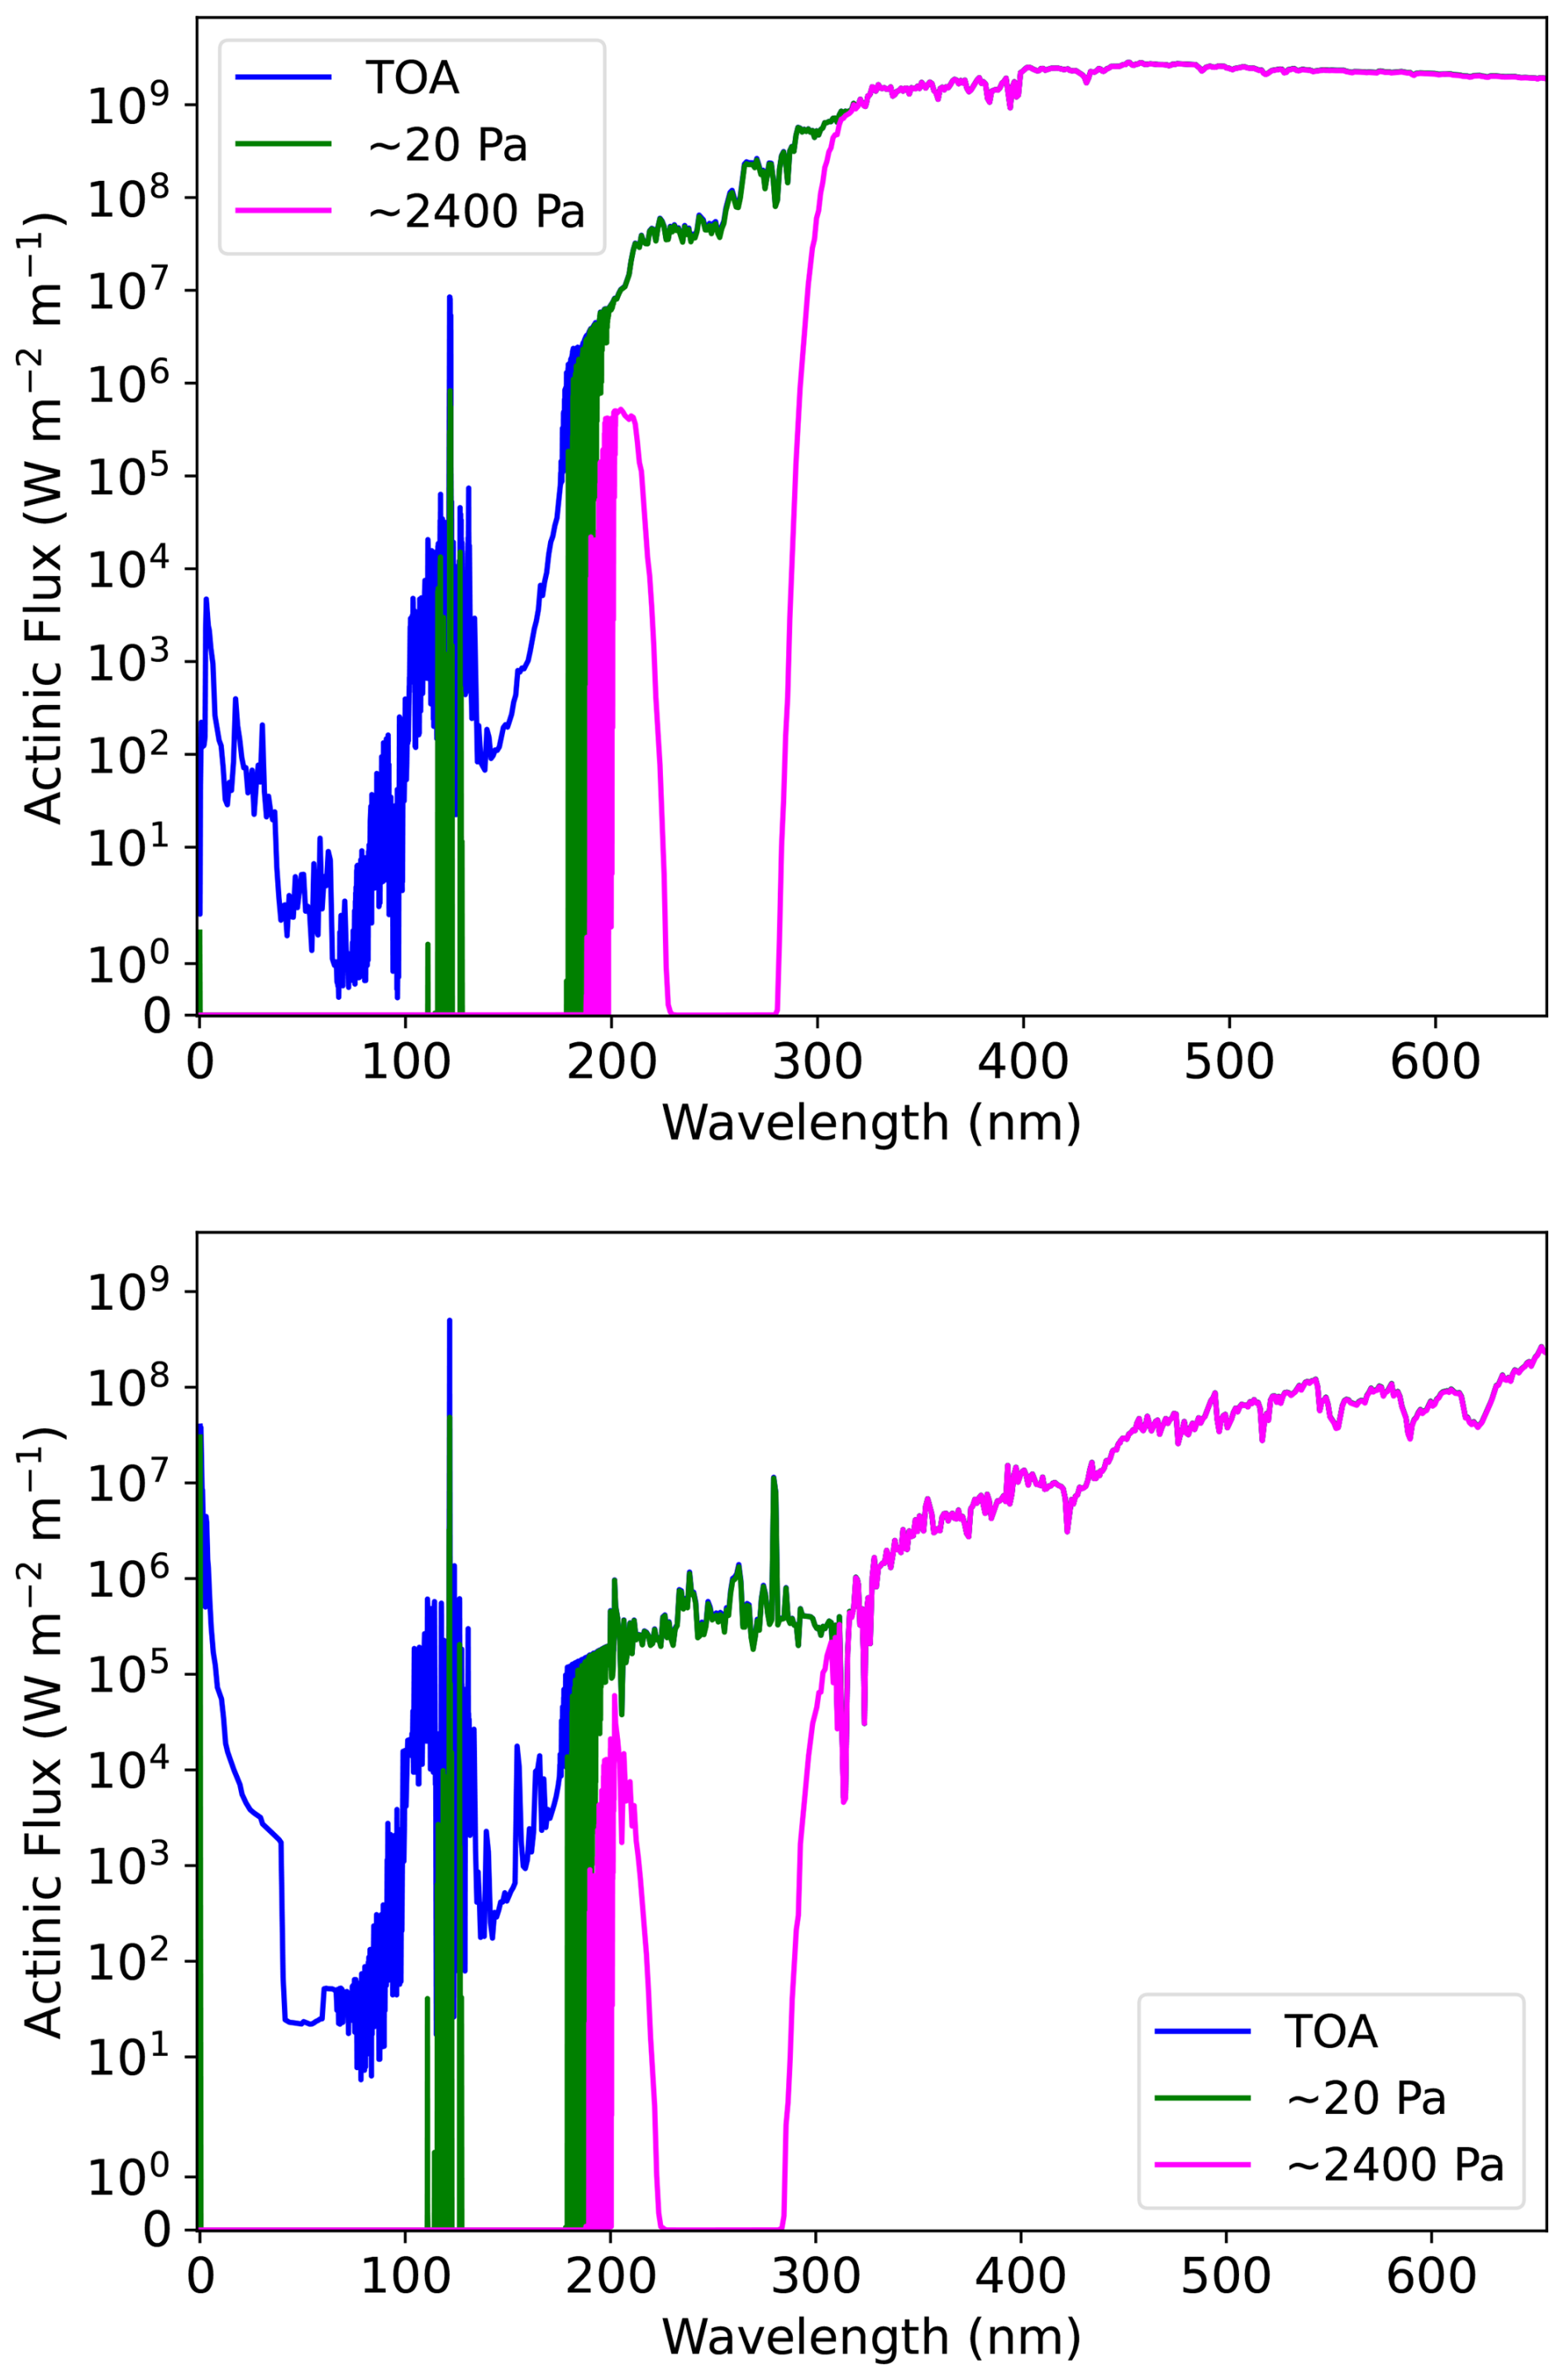
Figure 14Actinic flux (W m−2m−1) as a function of wavelength (nm) at three different levels, the top-of-atmosphere, upper mid-atmosphere (a pressure of ∼20 Pa) and lower mid-atmosphere (at a pressure of ∼2396 Pa) corresponding to the ozone layer, shown by the solid blue, green, and magenta lines, respectively for both the Solar spectrum (top panel) and Proxima Centauri spectrum, (bottom panel).
4.2.2 Ox
Figure 15 shows the photolysis rates for the reactions , , and , on a log scale as a function of pressure (left panel) and as a function of wavelength for the Solar spectrum (middle panel) and Proxima Centauri spectrum (right panel). For ozone, O3, the Proxima Centauri photolysis rates are significantly lower than the Solar case due to the lower stellar irradiance in the region 200 - 300 nm coinciding with the strong Hartley absorption bands of ozone (compare Figs. 2 and 13). Proxima Centauri is a much cooler star than the Sun with a spectrum that peaks further towards the red, with significantly more power in the visible than the near-UV. For the reaction this means there is a larger relative contribution from the weak Chappuis absorption bands beyond 400 nm than from the Hartley bands. These weak bands do not have a significant effect on the actinic flux in the visible region and as a result the photolysis rates do not experience the sharp decline across the ozone layer that is seen with the Solar case. In contrast, the reaction has a threshold wavelength of 411 nm so there is no contribution from the Chappuis bands. For both reactions there is a more significant contribution from Lyman-α wavelengths for Proxima Centauri. This contribution falls off quickly in the upper atmosphere due to absorption of the actinic flux by oxygen.
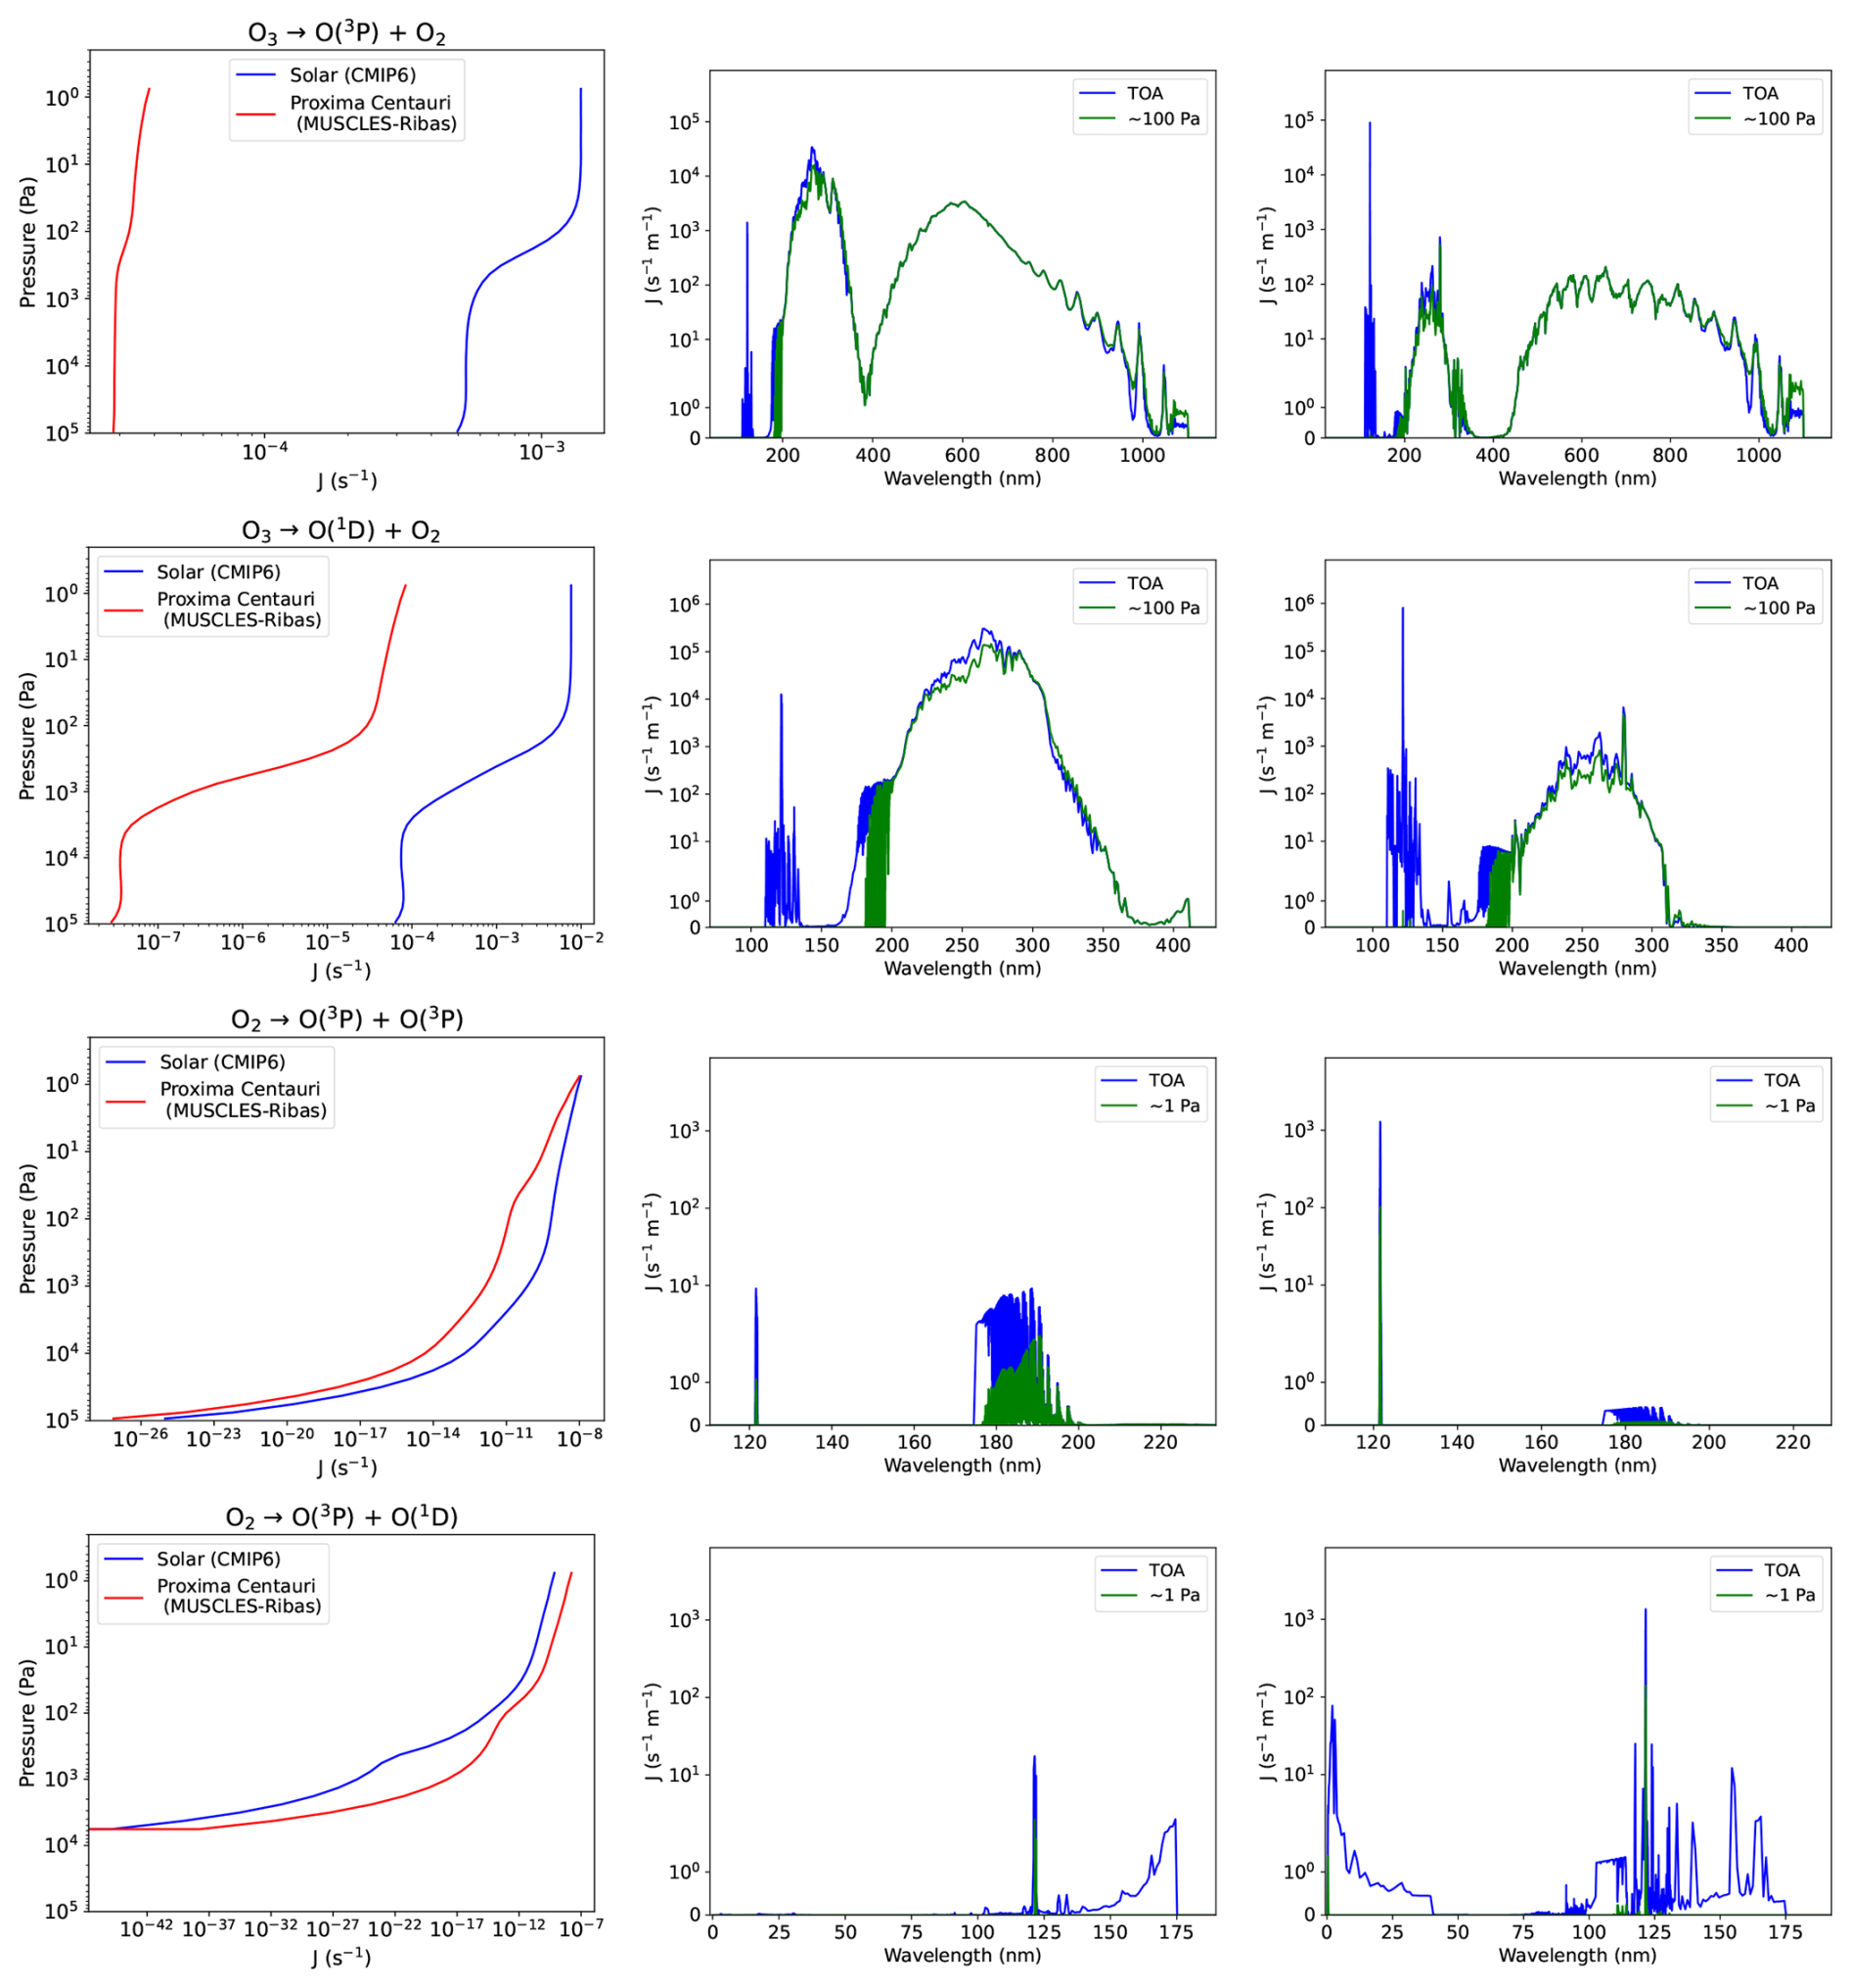
Figure 15Photolysis rates for Ox species O3 and O2 as yielded by the Solar and Proxima Centauri spectra (blue and red lines respectively) against pressure (Pa) on a log scale (left column panels), and as a function of wavelength (nm) for the Solar case (middle column panels and Proxima Centauri case (right column panels) at the TOA (blue), ∼100 Pa (green) for O3 reactions and ∼1 Pa for O2 reactions.
The Proxima Centauri rates for are much higher than Solar (by about an order of magnitude) in agreement with Ridgway (2023). All contributions to the rates for this reaction originate from wavelengths below the threshold at 175 nm where the Proxima Centauri actinic flux is greater. For the quantum yield is zero below 175 nm except for a small region around Lyman-α where both dissociation reactions occur. For the Solar case, the major contribution is from the Schumann Runge absorption bands at wavelengths > 175 nm while for Proxima Centauri there is a much larger contribution from Lyman-α wavelengths. This leads to approximately equal total photolysis rates for at TOA. However the rates for Proxima Centauri decrease much more rapidly towards higher pressures due to stronger attenuation of Lyman-α wavelengths.
4.2.3 HOx
As an example of photolysis of HOx species, we focus on the dissociations of H2O, and specifically the reactions: where OH(X2Π) is the ground state, , and . Figure 16 shows the rates for these dissociations as yielded by the Solar and Proxima Centauri spectra (blue and red lines respectively) against pressure on a log scale (left column), and as a function of wavelength for the Solar case (middle column) and Proxima Centauri case (right column) at the TOA (blue) and ∼20 Pa (green). The dissociation is also displayed in Fig. 16 for reference.
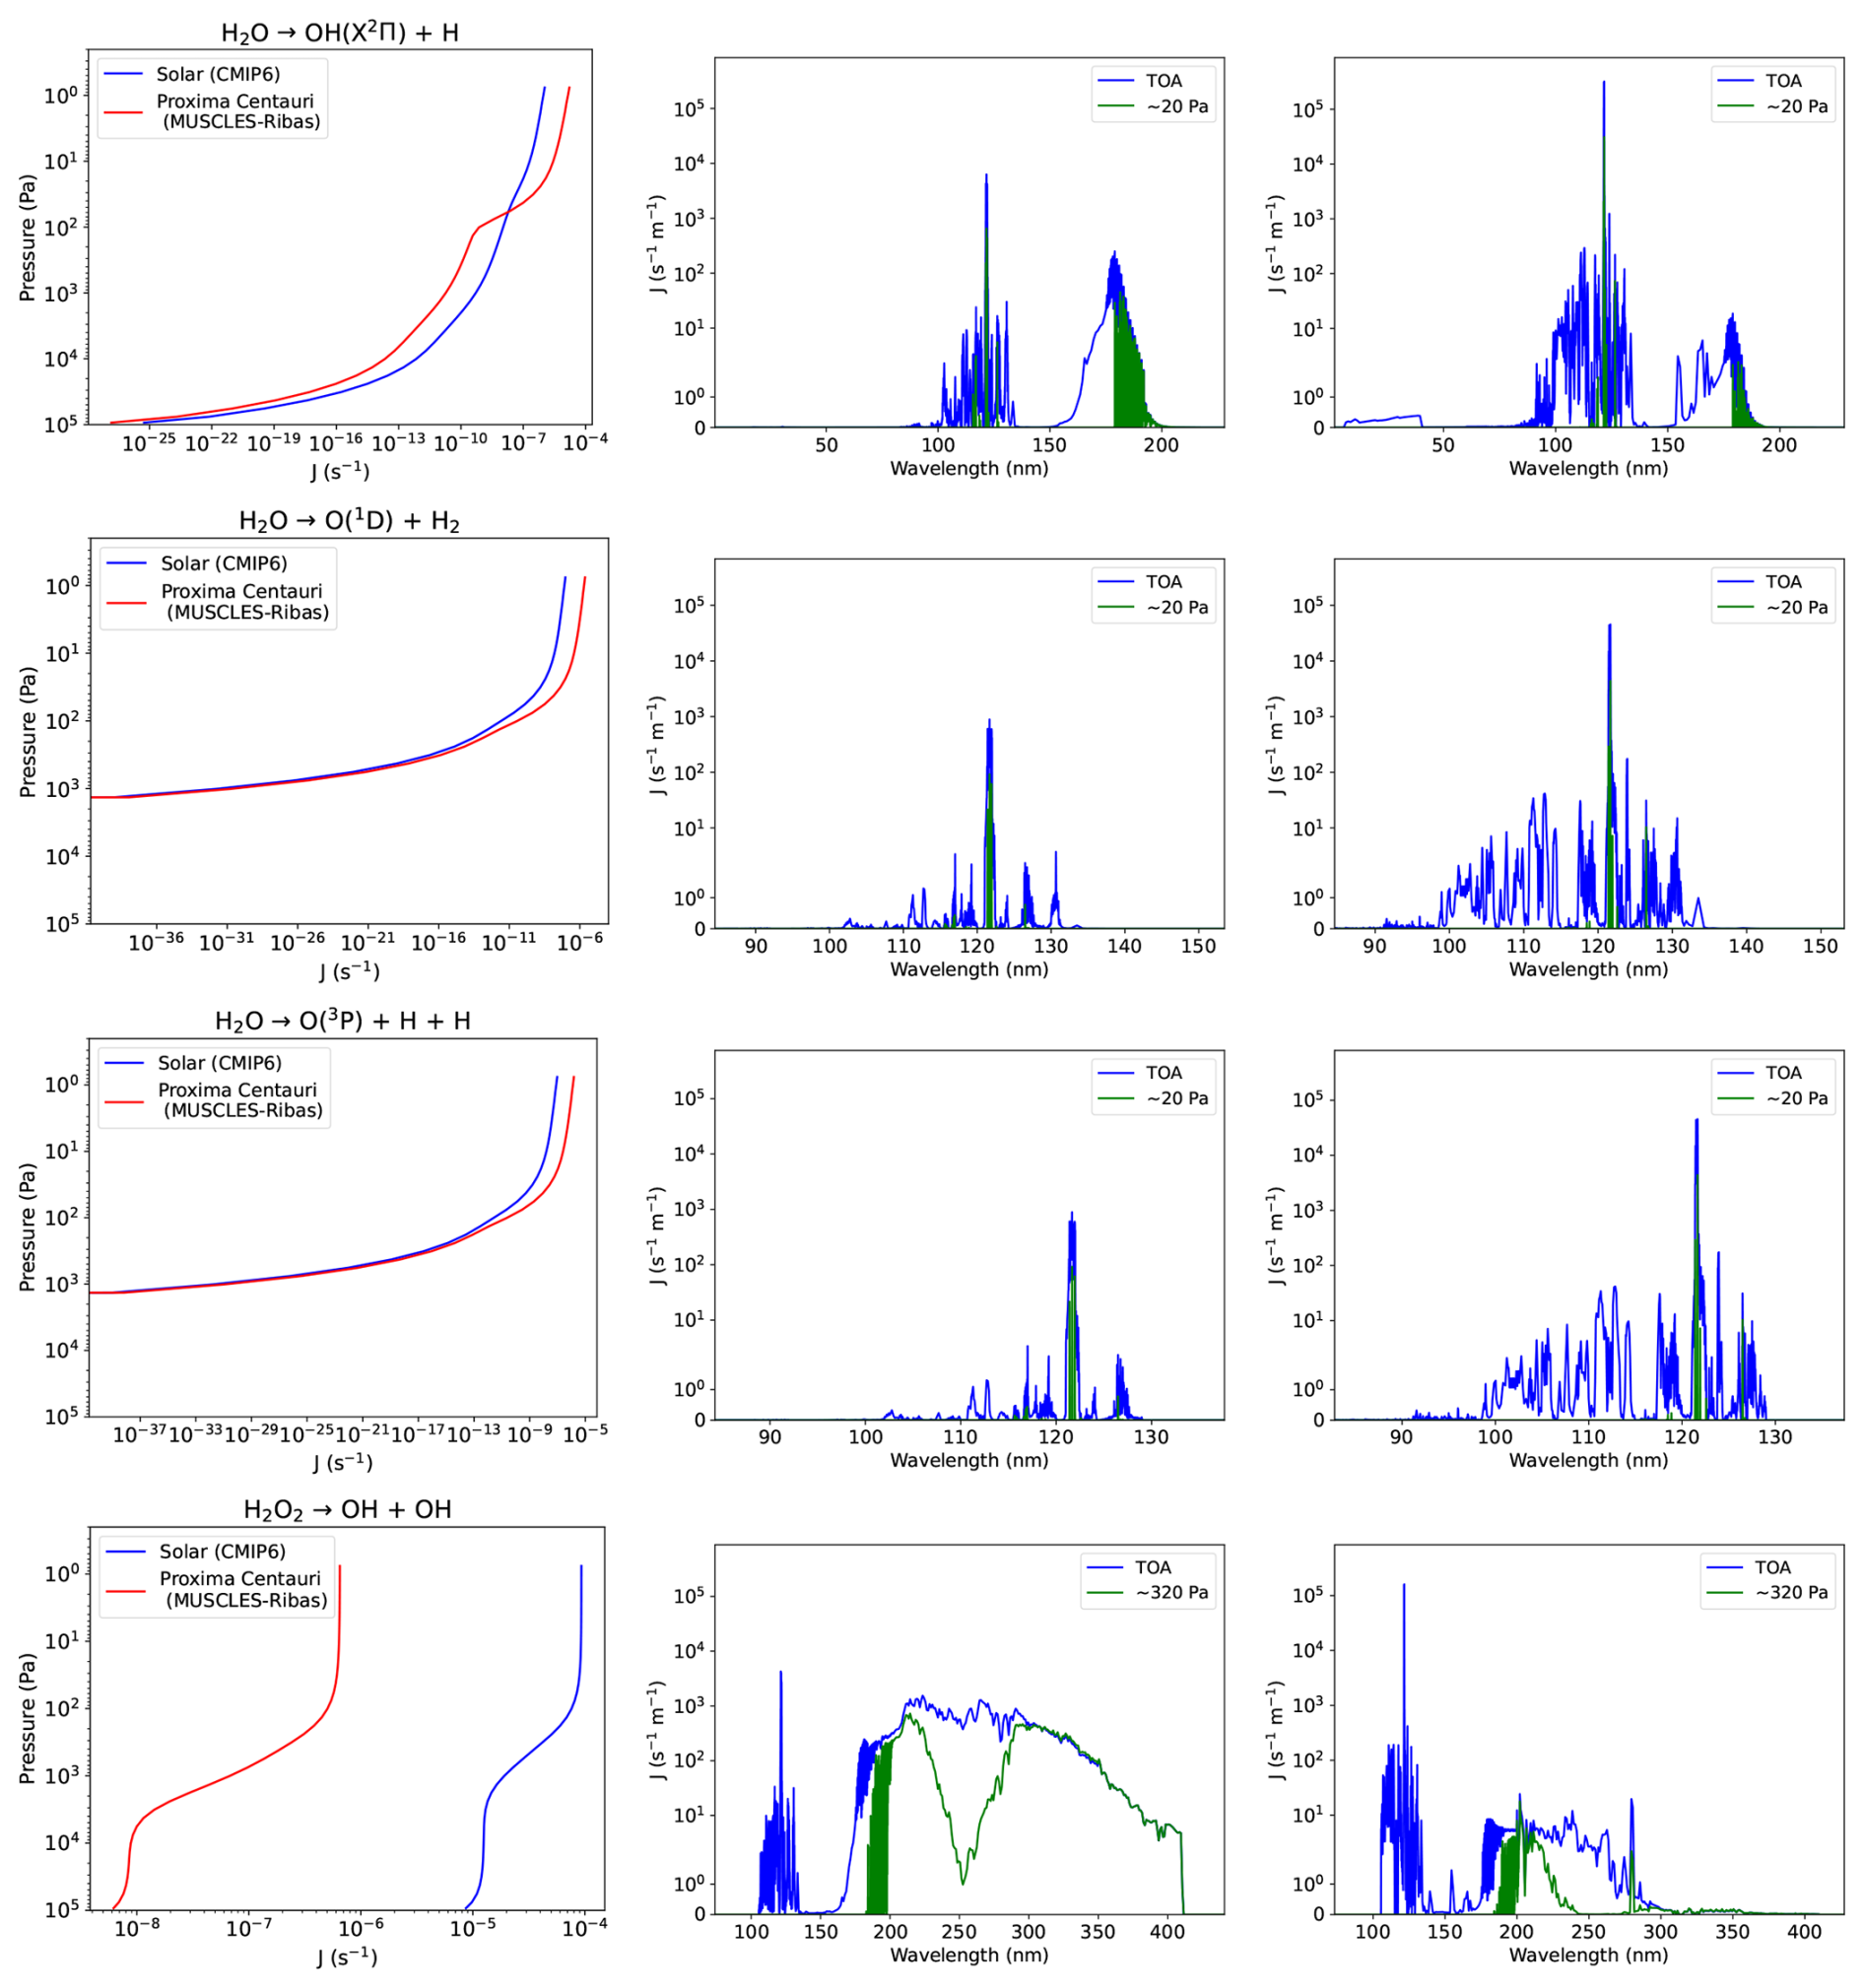
Figure 16Photolysis rates for the HOx species H2O and H2O2 as yielded by the Solar and Proxima Centauri spectra (blue and red lines respectively) against pressure (Pa) on a log scale (left column panels), and as a function of wavelength (nm) for the Solar case (middle column panels) and Proxima Centauri case (right column panels at the TOA (blue) and ∼20 Pa (green) for H2O and TOA (blue) and ∼320 Pa (green) for H2O2.
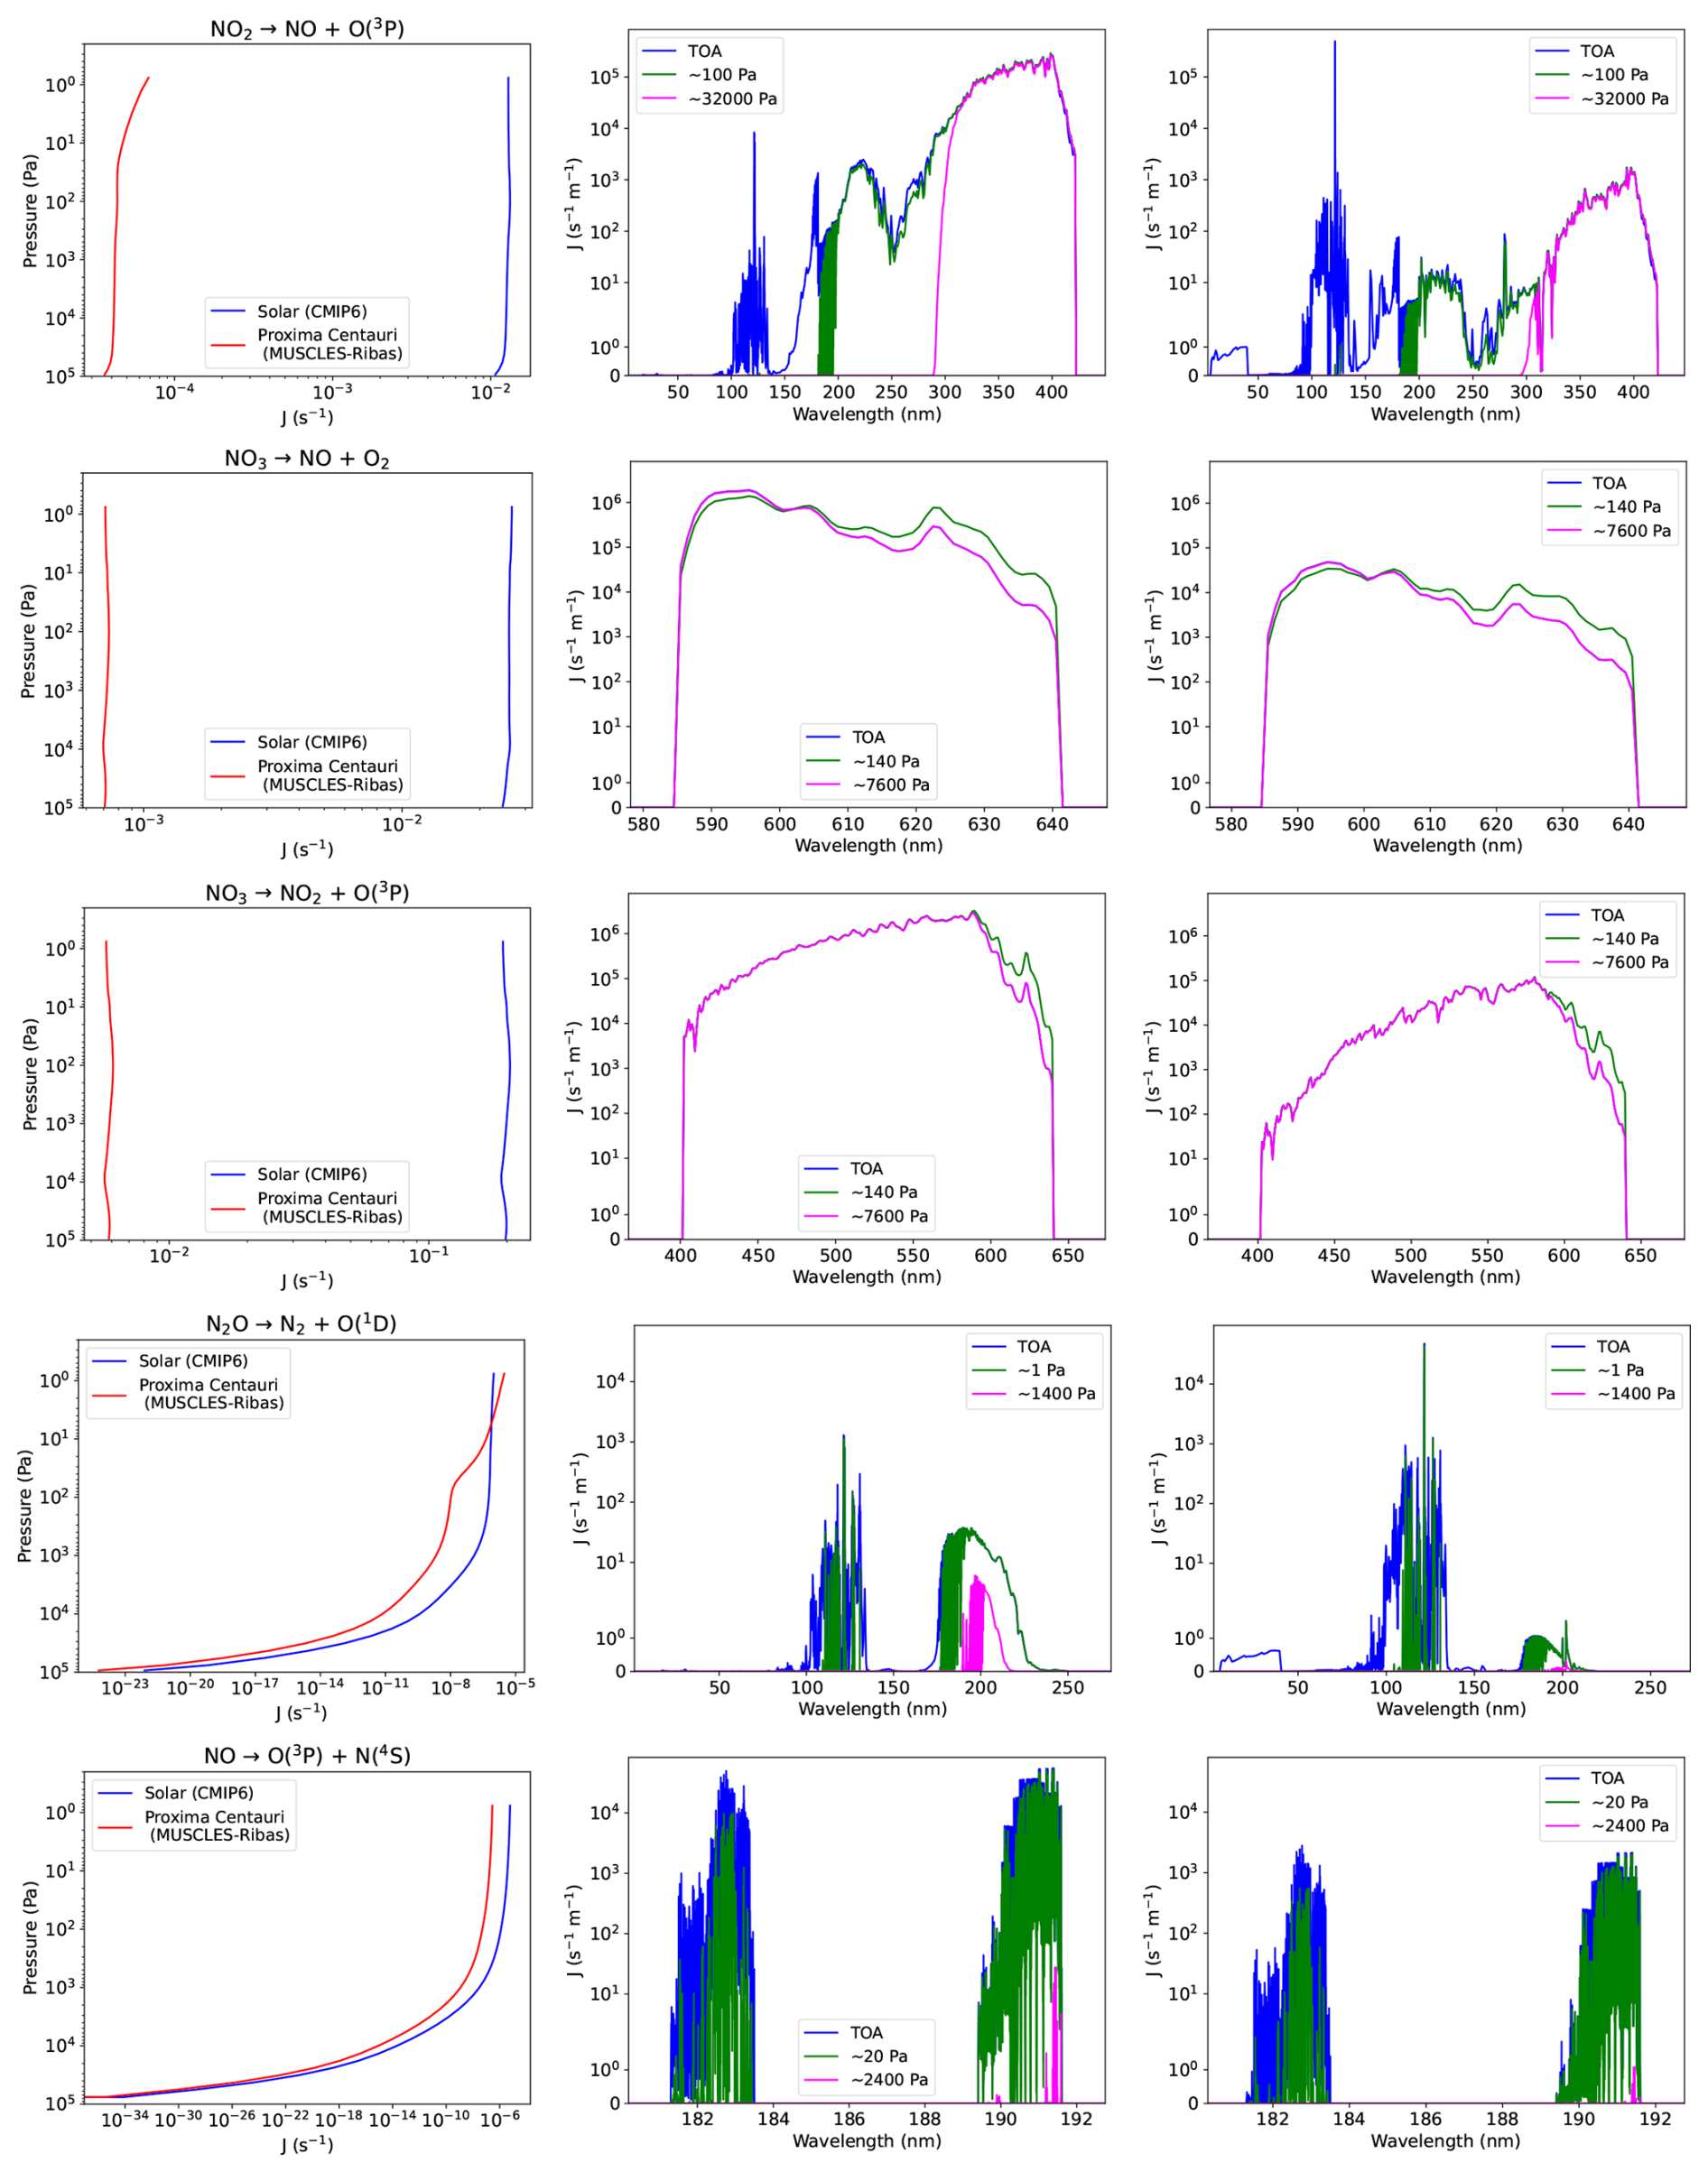
Figure 17Photolysis rates for the NOx species NO2, NO3, N2O and NO as yielded by the Solar and Proxima Centauri spectra (blue and red lines respectively) against pressure (Pa) on a log scale (left column panels) and Proxima Centauri case (right column panels).
The absorption spectrum of H2O in the FUV consists of a broad continuum centred around 165 nm reducing to a minimum in absorption around 145 nm with increasing and more structured absorption towards shorter wavelengths. Based on values reported in the JPL 19-5 report, the quantum yield for the reaction is taken to be 1 for the broad continuum beyond 147 nm, while the quantum yield for the reaction rises to 0.11 at wavelengths shorter than 147 nm. The reaction is taken to have a quantum yield of 0.11 below its threshold wavelength of 129 nm.
Towards TOA the Proxima Centauri rates for all the H2O reactions are an order of magnitude higher than those of the Solar case due to the strong contribution from the Lyman-α region where the Proxima Centauri stellar irradiance is higher. For the reactions , and where all the photolysis occurs <147 nm, the photolysis rates reduce to effectively zero by the mid-atmosphere due to attenuation of the actinic flux.
For the reaction there is a significant contribution from wavelengths > 175 nm where the Solar irradiance is higher than Proxima Centauri. The Schumann Runge absorption bands of O2 decrease in strength towards longer wavelengths between 175–200 nm with less attenuation of the actinic flux allowing photolysis to occur much lower in the atmosphere. This explains the difference in the photolysis rate profiles where the Proxima Centauri rates are higher near TOA due to the contribution around Lyman-α while the Solar rates are higher in the lower atmosphere where the Lyman-α wavelengths have attenuated and the dominant contribution is from wavelengths beyond 175 nm.
4.2.4 NOx
For photolysis of the NOx species, Fig. 17 shows the rates for the dissociation of , , , and as yielded by the Solar and Proxima Centauri spectra (blue and red lines respectively) against pressure (Pa) on a log scale (left column), and as a function of wavelength for the Solar case (middle column) and Proxima Centauri case (right column). Figure 18 shows the single plots of the dissociation rates of and as yielded by the Proxima Centauri spectrum only (red line) on a linear scale against pressure (Pa).
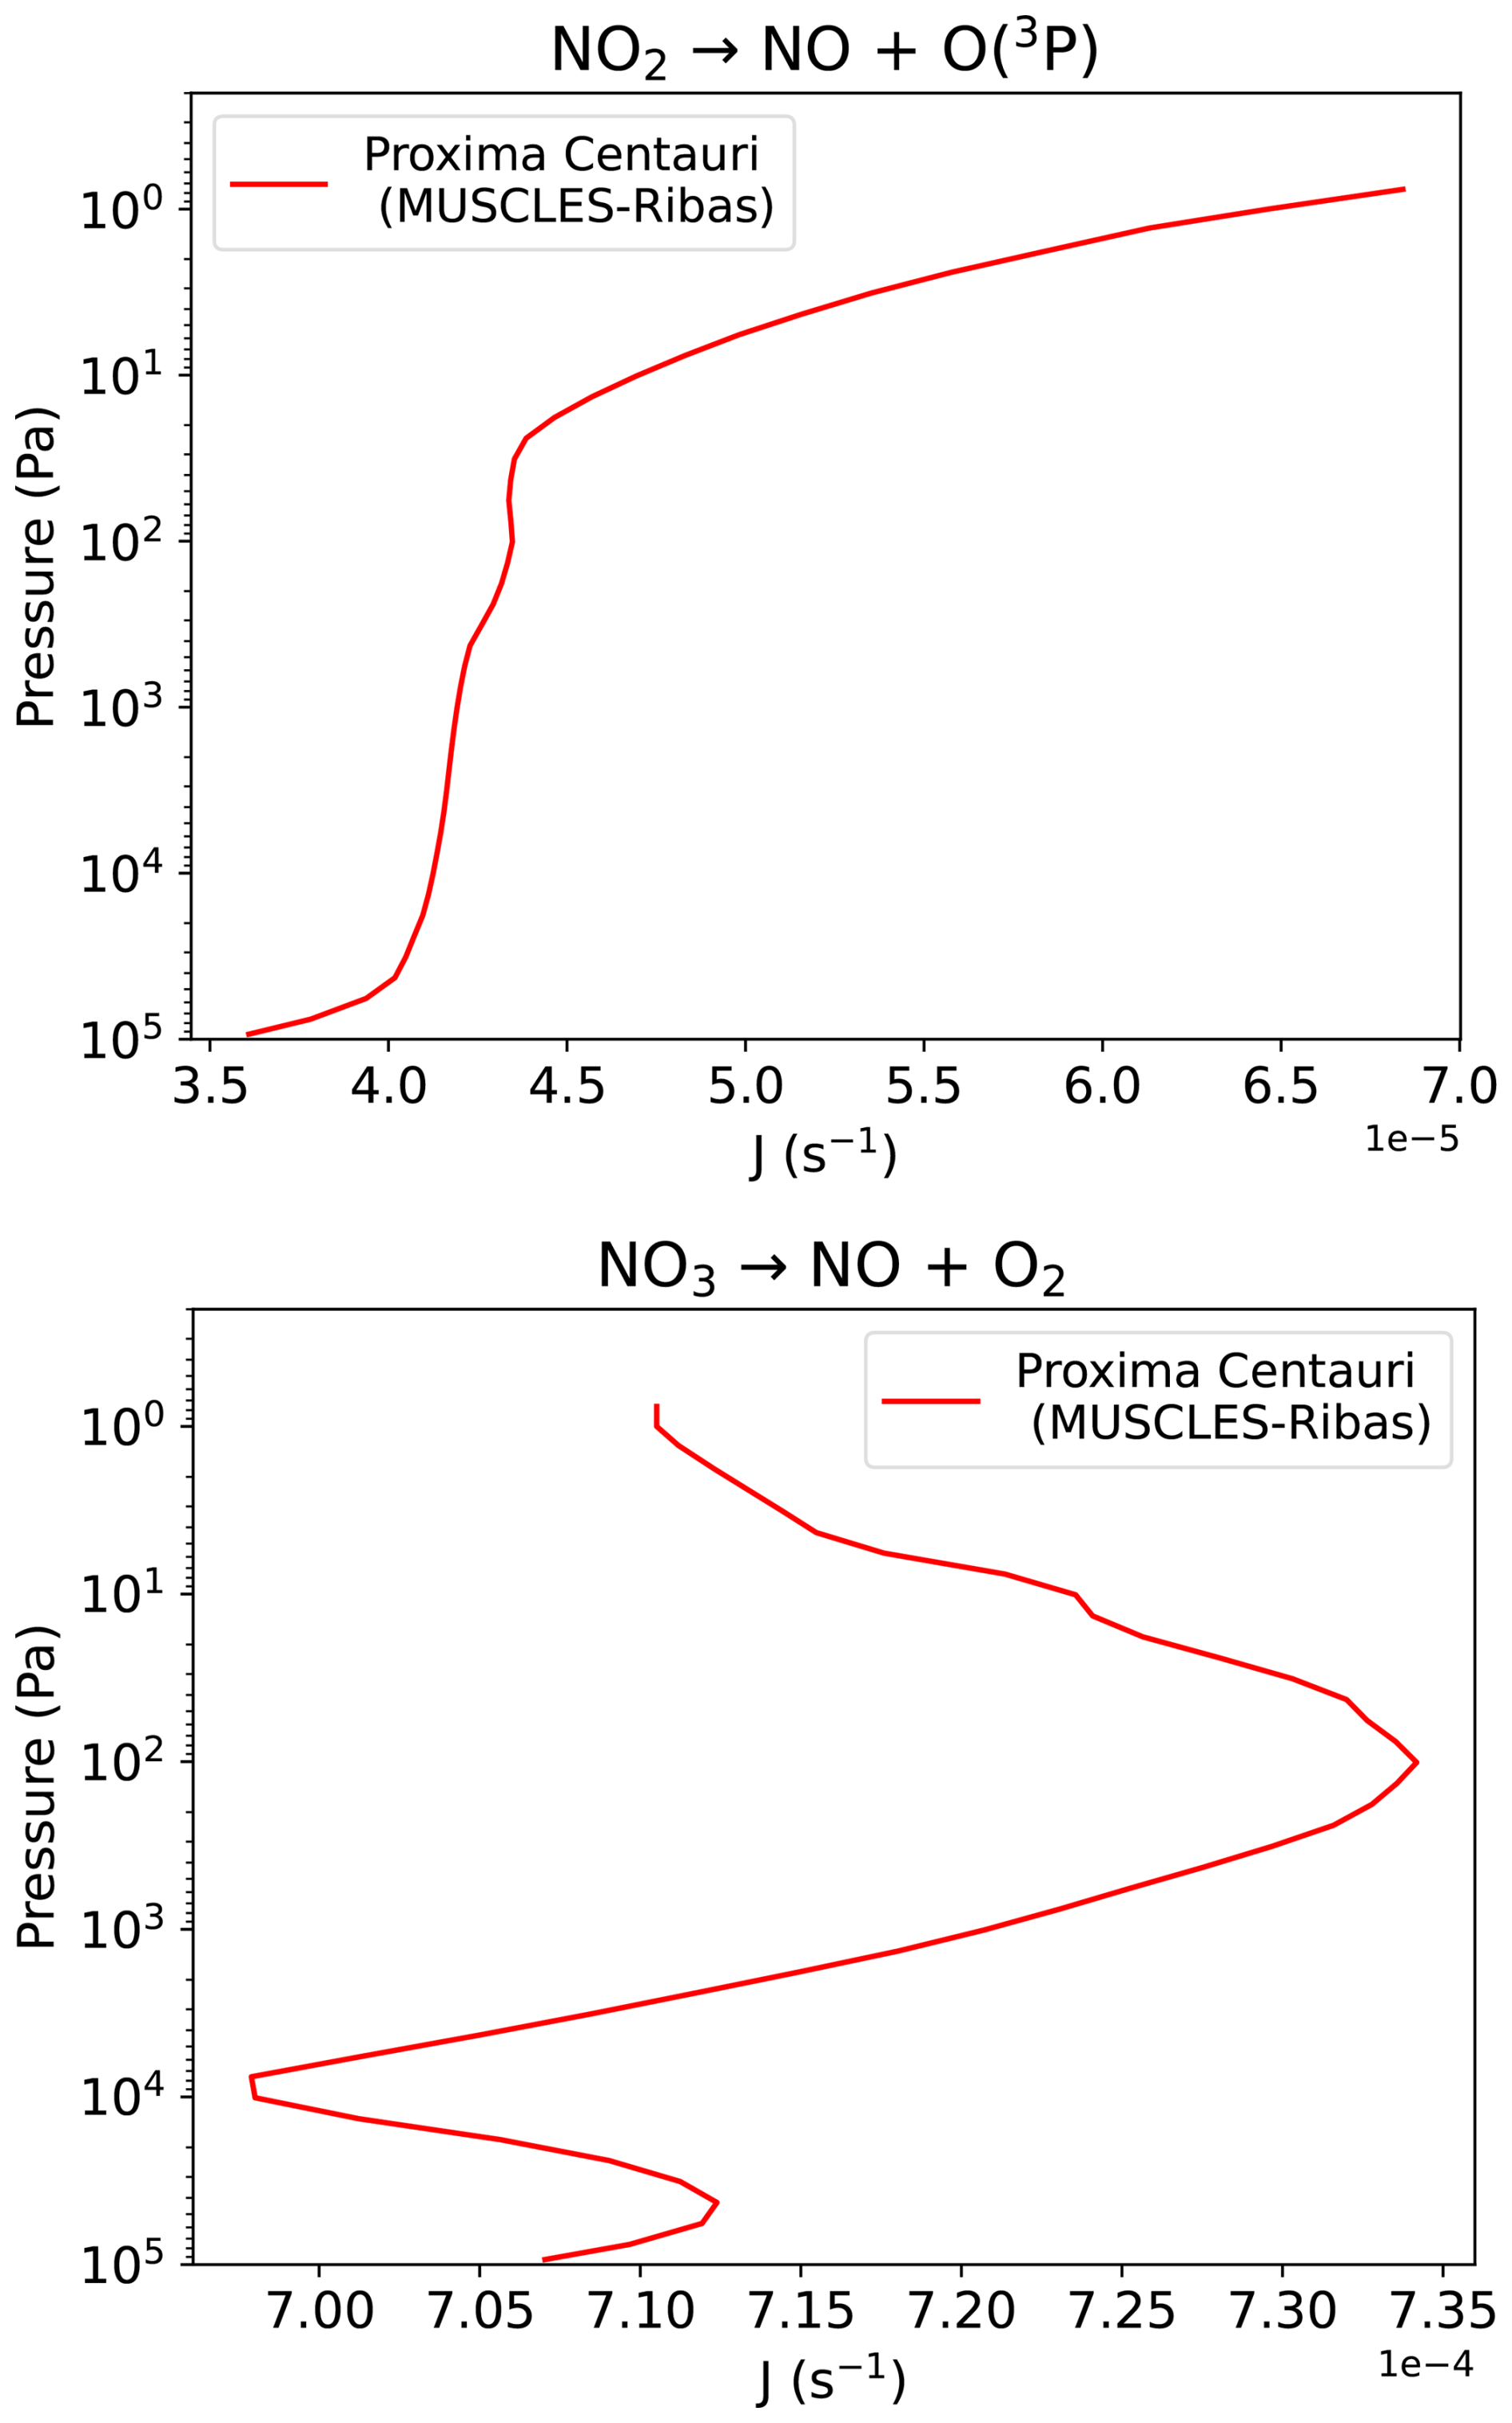
Figure 18Photolysis rates for and as yielded by the Proxima Centauri spectra only (red line) on a linear scale against pressure (Pa).
For the reaction the photolysis rates are much lower at all pressures for the Proxima Centauri case. The top right panels show the photolysis rates at the TOA (blue), upper-mid atmosphere ∼100 Pa (green) and lower-mid atmosphere ∼32 000 Pa (magenta) indicating the dominant contribution between 300–400 nm is significantly reduced for the Proxima Centauri case with a greater contribution from shorter wavelengths around Lyman-α at the TOA compared to the Solar case. For the Proxima Centauri case, oxygen absorption at these shorter wavelengths impacts the photolysis higher up in the atmosphere resulting in the steep decline of photolysis rates with increasing pressures that is not seen in the Solar case. Figure 18, top panel, shows a zoom-in on the Proxima Centauri profile for this case. The small increase in rates at ∼102 Pa coincides with a peak in the temperature dependence of the cross section, which comes into effect at the longer UV wavelengths.
Interestingly for the reaction , in the Proxima Centauri case, Fig. 18 (bottom panel) shows the rates changing as a function of pressure in a noticeably different way to that of the Solar case (see Fig. 7). The spectra of the rates as a function of pressure for wavelengths between 580-640 nm are shown at the TOA (blue), ∼140 Pa (green) and ∼7600 Pa (magenta) in the second row right panels of Fig. 17. As there is very little absorption at these wavelengths, the spectral changes for different pressures are almost entirely due to the temperature dependence of the quantum yield. The TOA and 7600 Pa lines are essentially on top of each other because the temperature is about the same at these levels. The difference in the pressure dependence of the Solar and Proxima Centauri rates is due to the wavelength variation of this temperature dependence. Essentially, for shorter wavelength flux the quantum yield decreases as the temperature increases. Whereas, towards longer wavelengths the quantum yield increases as the temperature increases. As it is a lower temperature star, Proxima Centauri has a higher fraction of its flux at longer wavelengths and rates are therefore increased as the temperature increases. Whereas, for the Solar case, there is a larger fraction of the flux at shorter wavelengths leading to cancellation of the overall temperature dependence and a more muted effect on the shape of the photolysis rate profile.
Figure 19 shows the comparison of Solar and Proxima Centauri rates for the remaining NOx species. These rates are dominated by wavelengths > 200 nm and are therefore significantly higher in the Solar case.
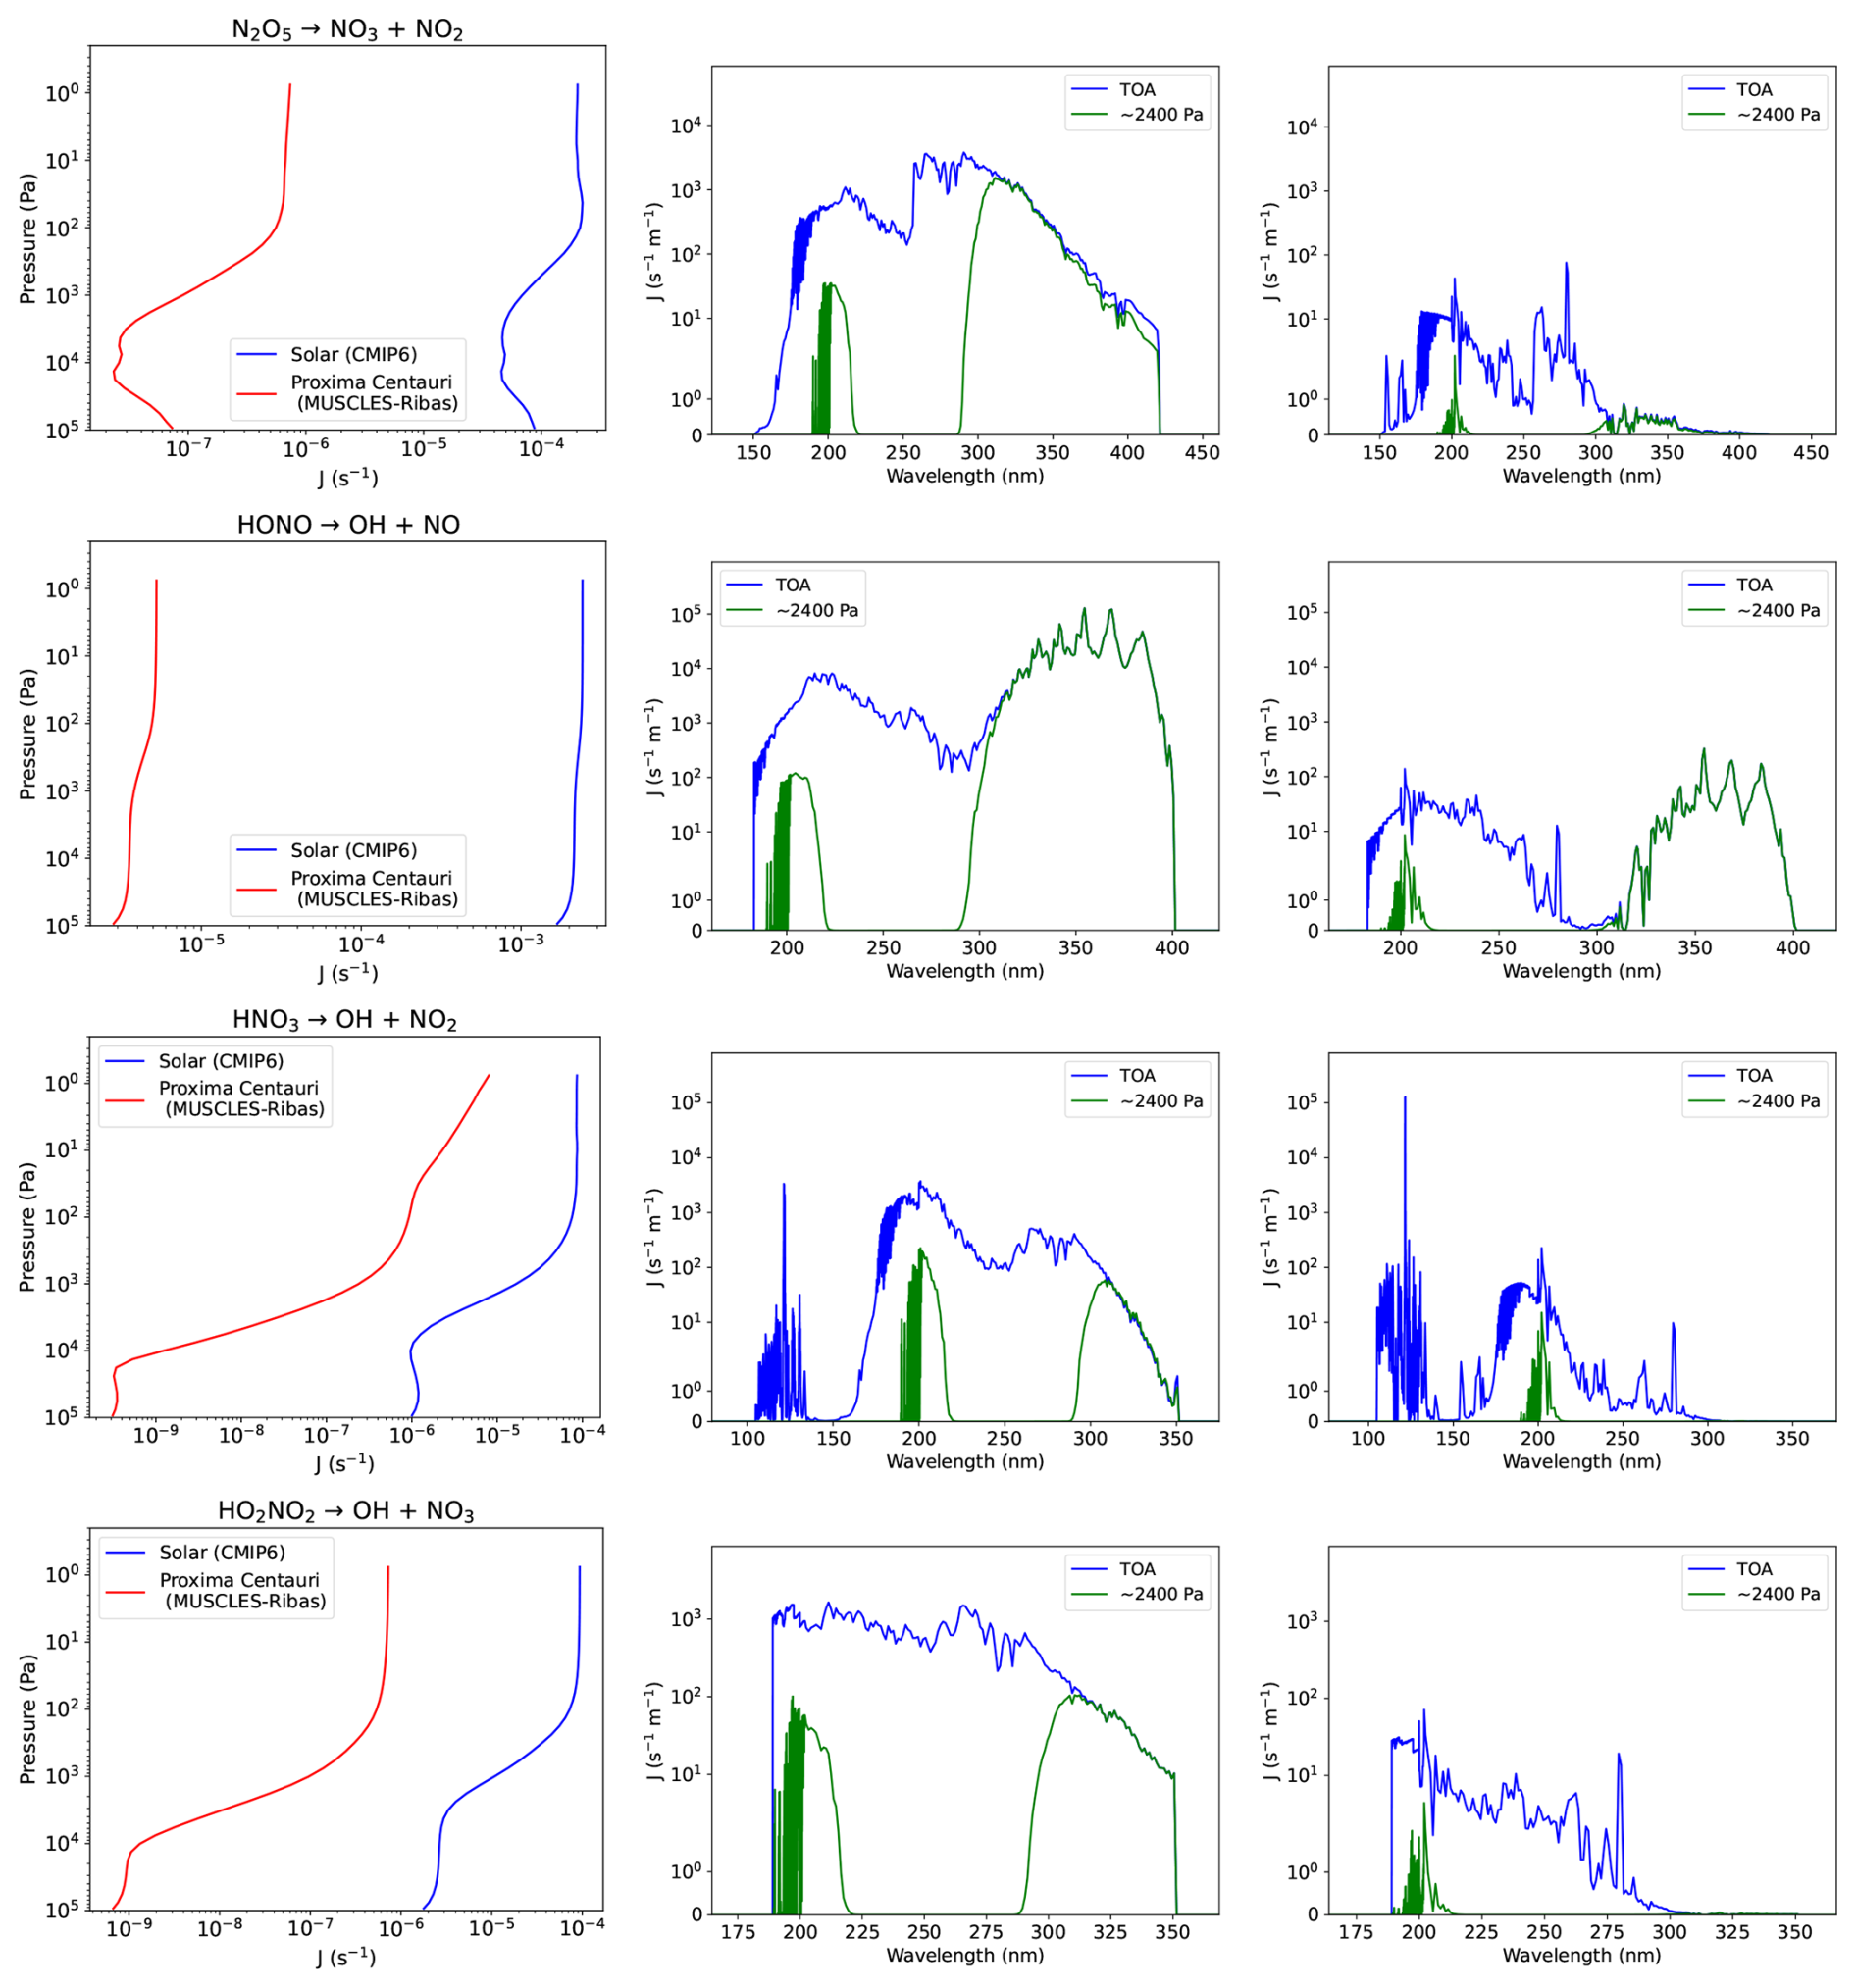
Figure 19Photolysis rates for the NOx species N2O5, HONO, HNO3 and HO2NO2 as yielded by the Solar and Proxima Centauri spectra (blue and red lines respectively) against pressure (Pa) on a log scale (left column panels), and as a function of wavelength (nm) for the Solar case (middle column panels) and Proxima Centauri case (right column panels) at the TOA (blue) and ∼2400 Pa (green).
4.2.5 Organic
Figure 20 shows rates for the dissociation of formaldehyde, (top row), (middle row) and (bottom row) as yielded by the Solar and Proxima Centauri spectra (blue and red lines respectively) against pressure on a log scale (left column), and as a function of wavelength for the Solar case (middle column) and Proxima Centauri case (right column) at the TOA (blue) and ∼320 Pa (green).
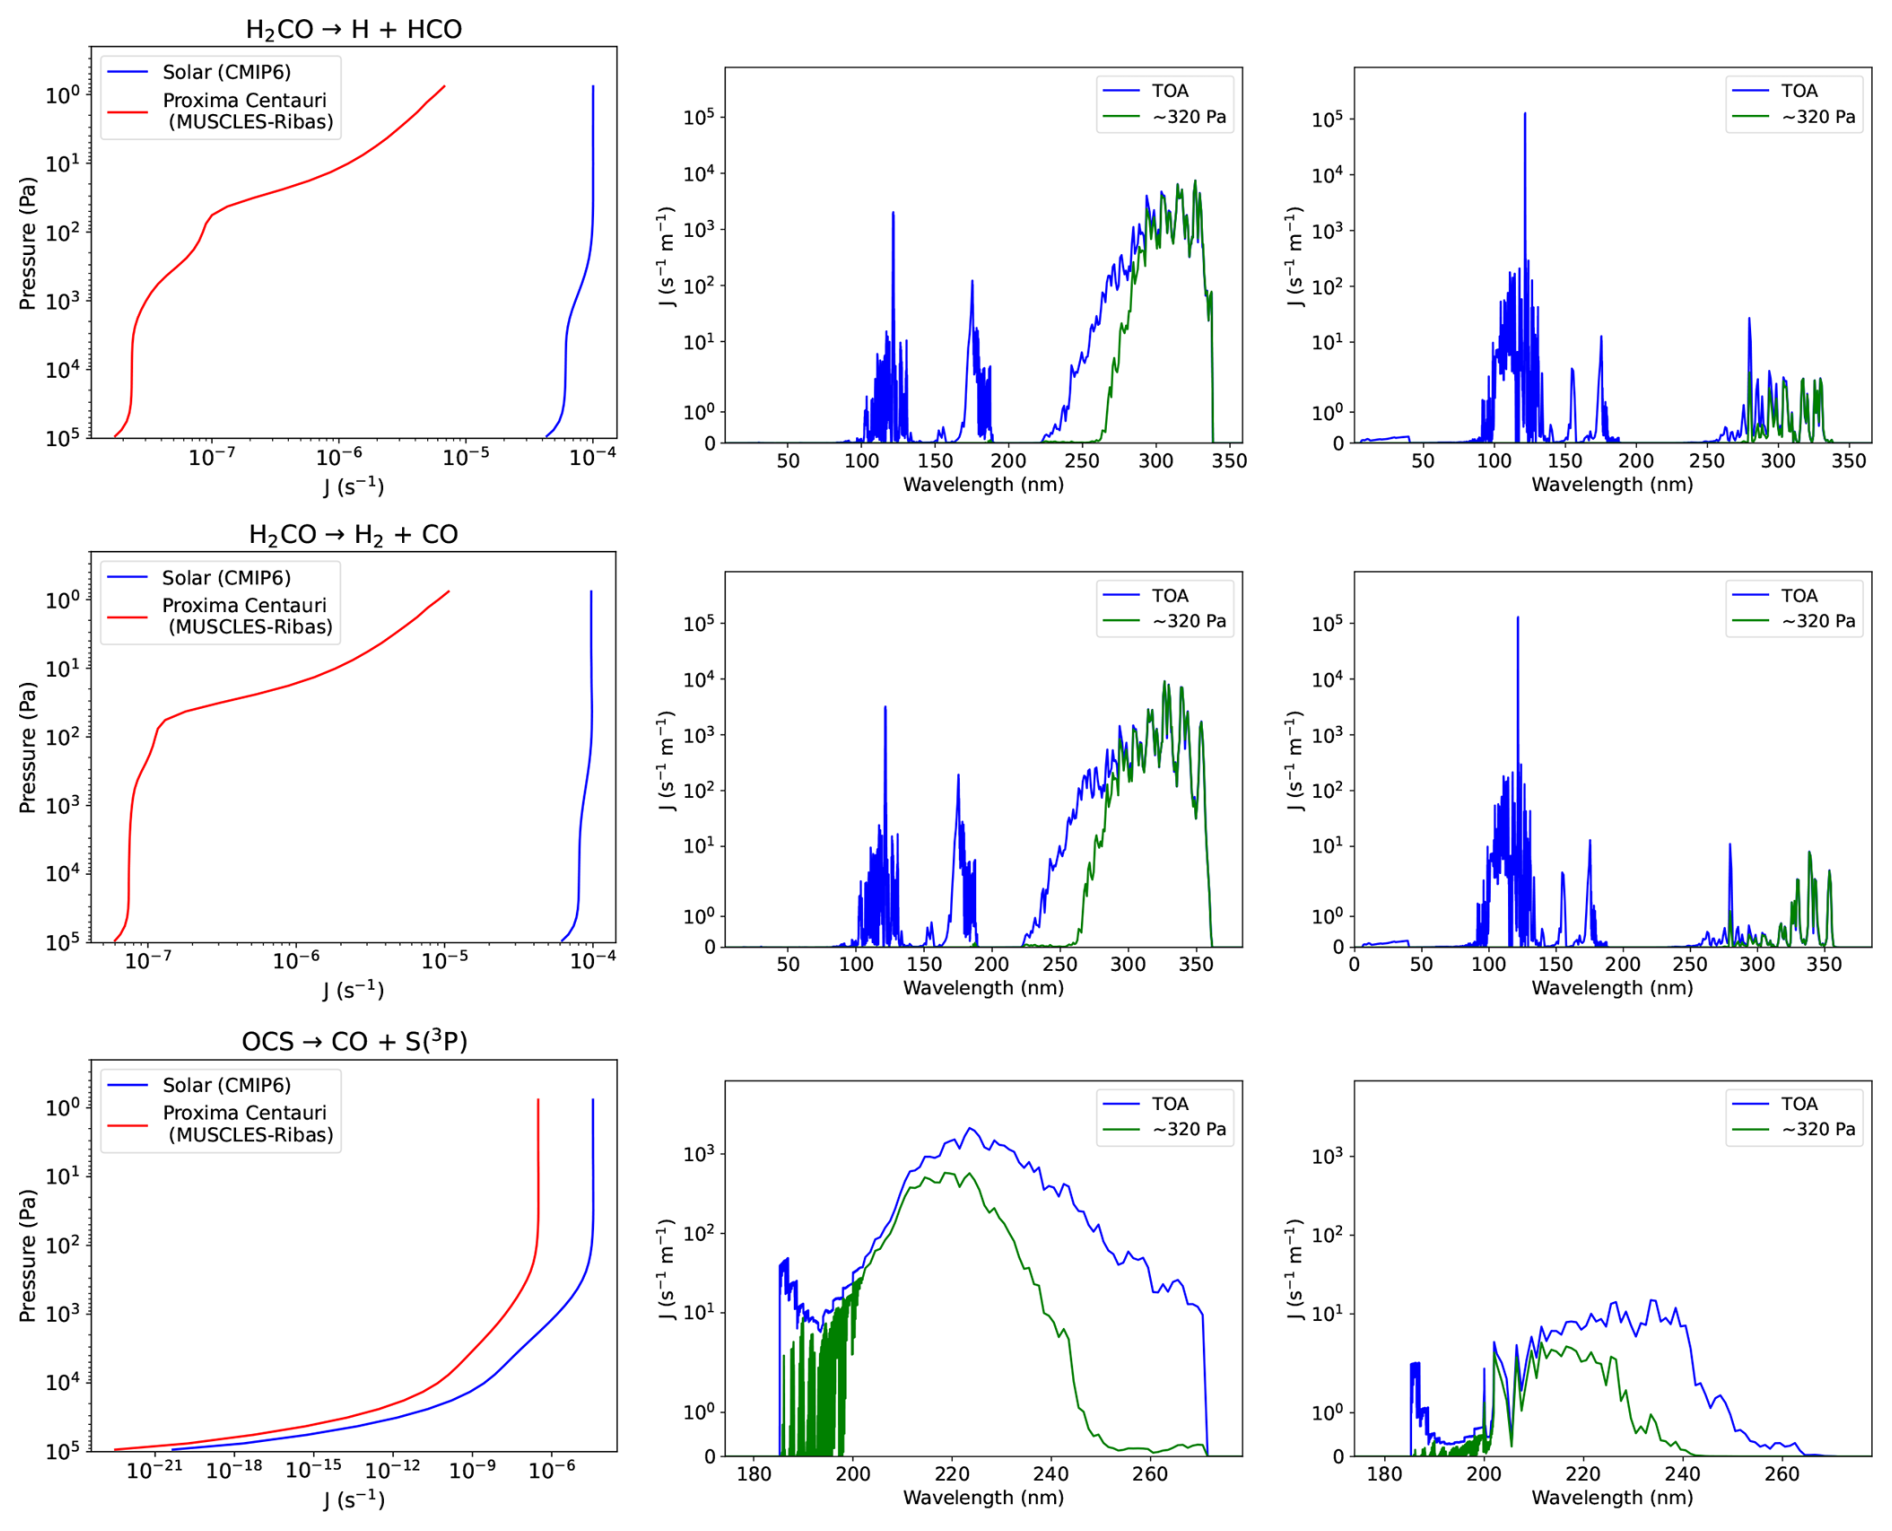
Figure 20Photolysis rates for H2CO and OCS as yielded by the Solar and Proxima Centauri spectra (blue and red lines respectively) against pressure on a log scale (left column panels), and as a function of wavelength (nm) for the Solar case (middle column panels) and Proxima Centauri case (right column panels) at TOA (blue) and ∼320 Pa (green).
When examining H2CO, the photolysis rates are significantly lower for Proxima Centauri due to the lower contribution from near-UV (NUV, ∼200–400 nm) fluxes. The higher contribution in the FUV compared to the Solar case leads to the observed difference in the shape of the rate profiles. Oxygen absorption of FUV fluxes in the upper atmosphere leads to a sharp decrease in rates with pressure for Proxima Centauri, similar to behaviour displayed in the NO2 case in Fig. 17. The rates as a function of wavelength shown in the right panels of Fig. 20 display a similar structure to the corresponding data for NO2.
The photolysis rates for OCS as a function of wavelength, bottom row of Fig. 20, show contributions from wavelengths greater than 180 nm where the Solar spectrum is stronger than Proxima Centauri. Also evident in these spectra is the effect of the noisy structure of the Proxima Centauri irradiance spectrum in the NUV leading to the commensurate noise in the photolysis spectrum across this range, particularly around ∼200–210 nm.
Figure 21 shows the calculated rates as a function of pressure for the reaction (top row) and four dissociation rates of CH4. Note that CH2(1) is the methylene group where (1) refers to the excited singlet state. The methyl radical, CH3, has extremely limited data available (see Appendix A, Table A1), and only covered one band centred on 215.5 nm with zero rates elsewhere.
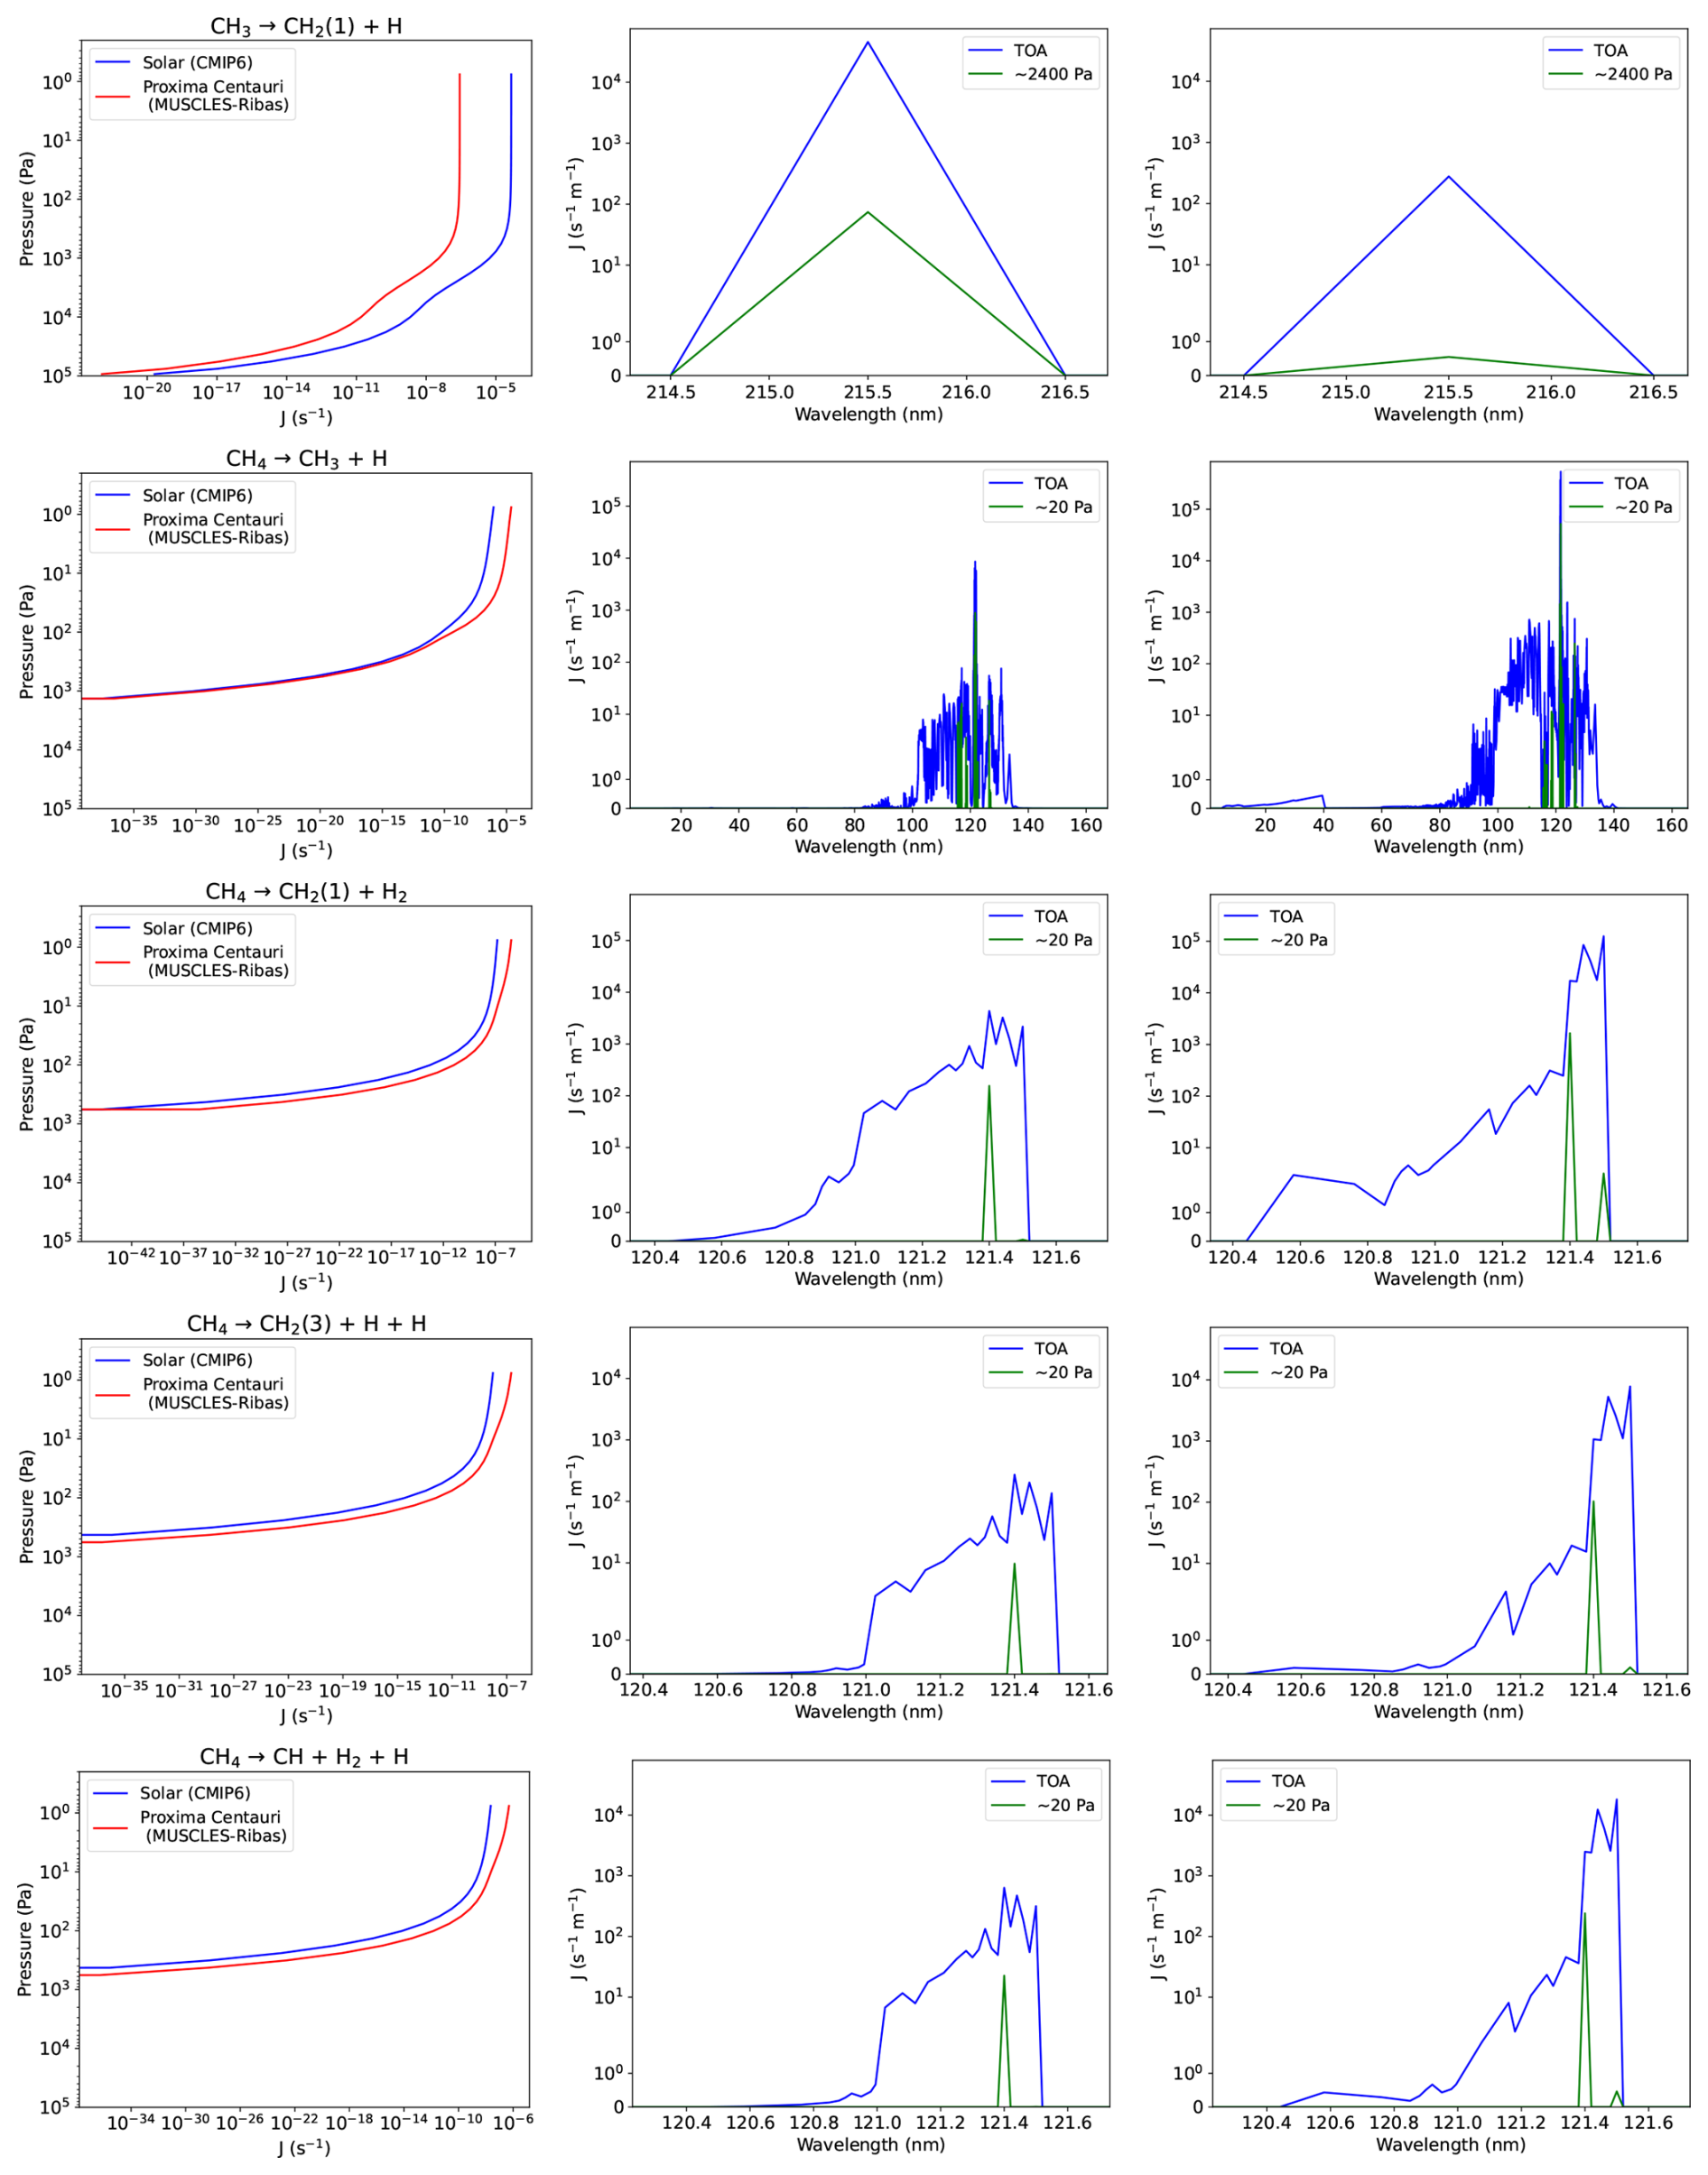
Figure 21Photolysis rates for CH3 and CH4 as yielded by the Solar and Proxima Centauri spectra (blue and red lines respectively) against pressure (Pa) on a log scale (left column panels), and as a function of wavelength (nm) for the Solar case (middle column panels) and Proxima Centauri case (right column panels) at the TOA (blue), ∼2400 Pa (green) for CH3 and ∼20 Pa (green) for CH4.
Figures 22 and 23 display the dissociation rates of the same organic species displayed in Fig. 12 for the Solar and Proxima Centauri spectra. The photolysis rates as produced by the Proxima Centauri spectrum for the species CH3CHO, CHOCHO, CH3COCH3, HOCH2CHO all display similar trends to that of OCS (see Fig. 20).
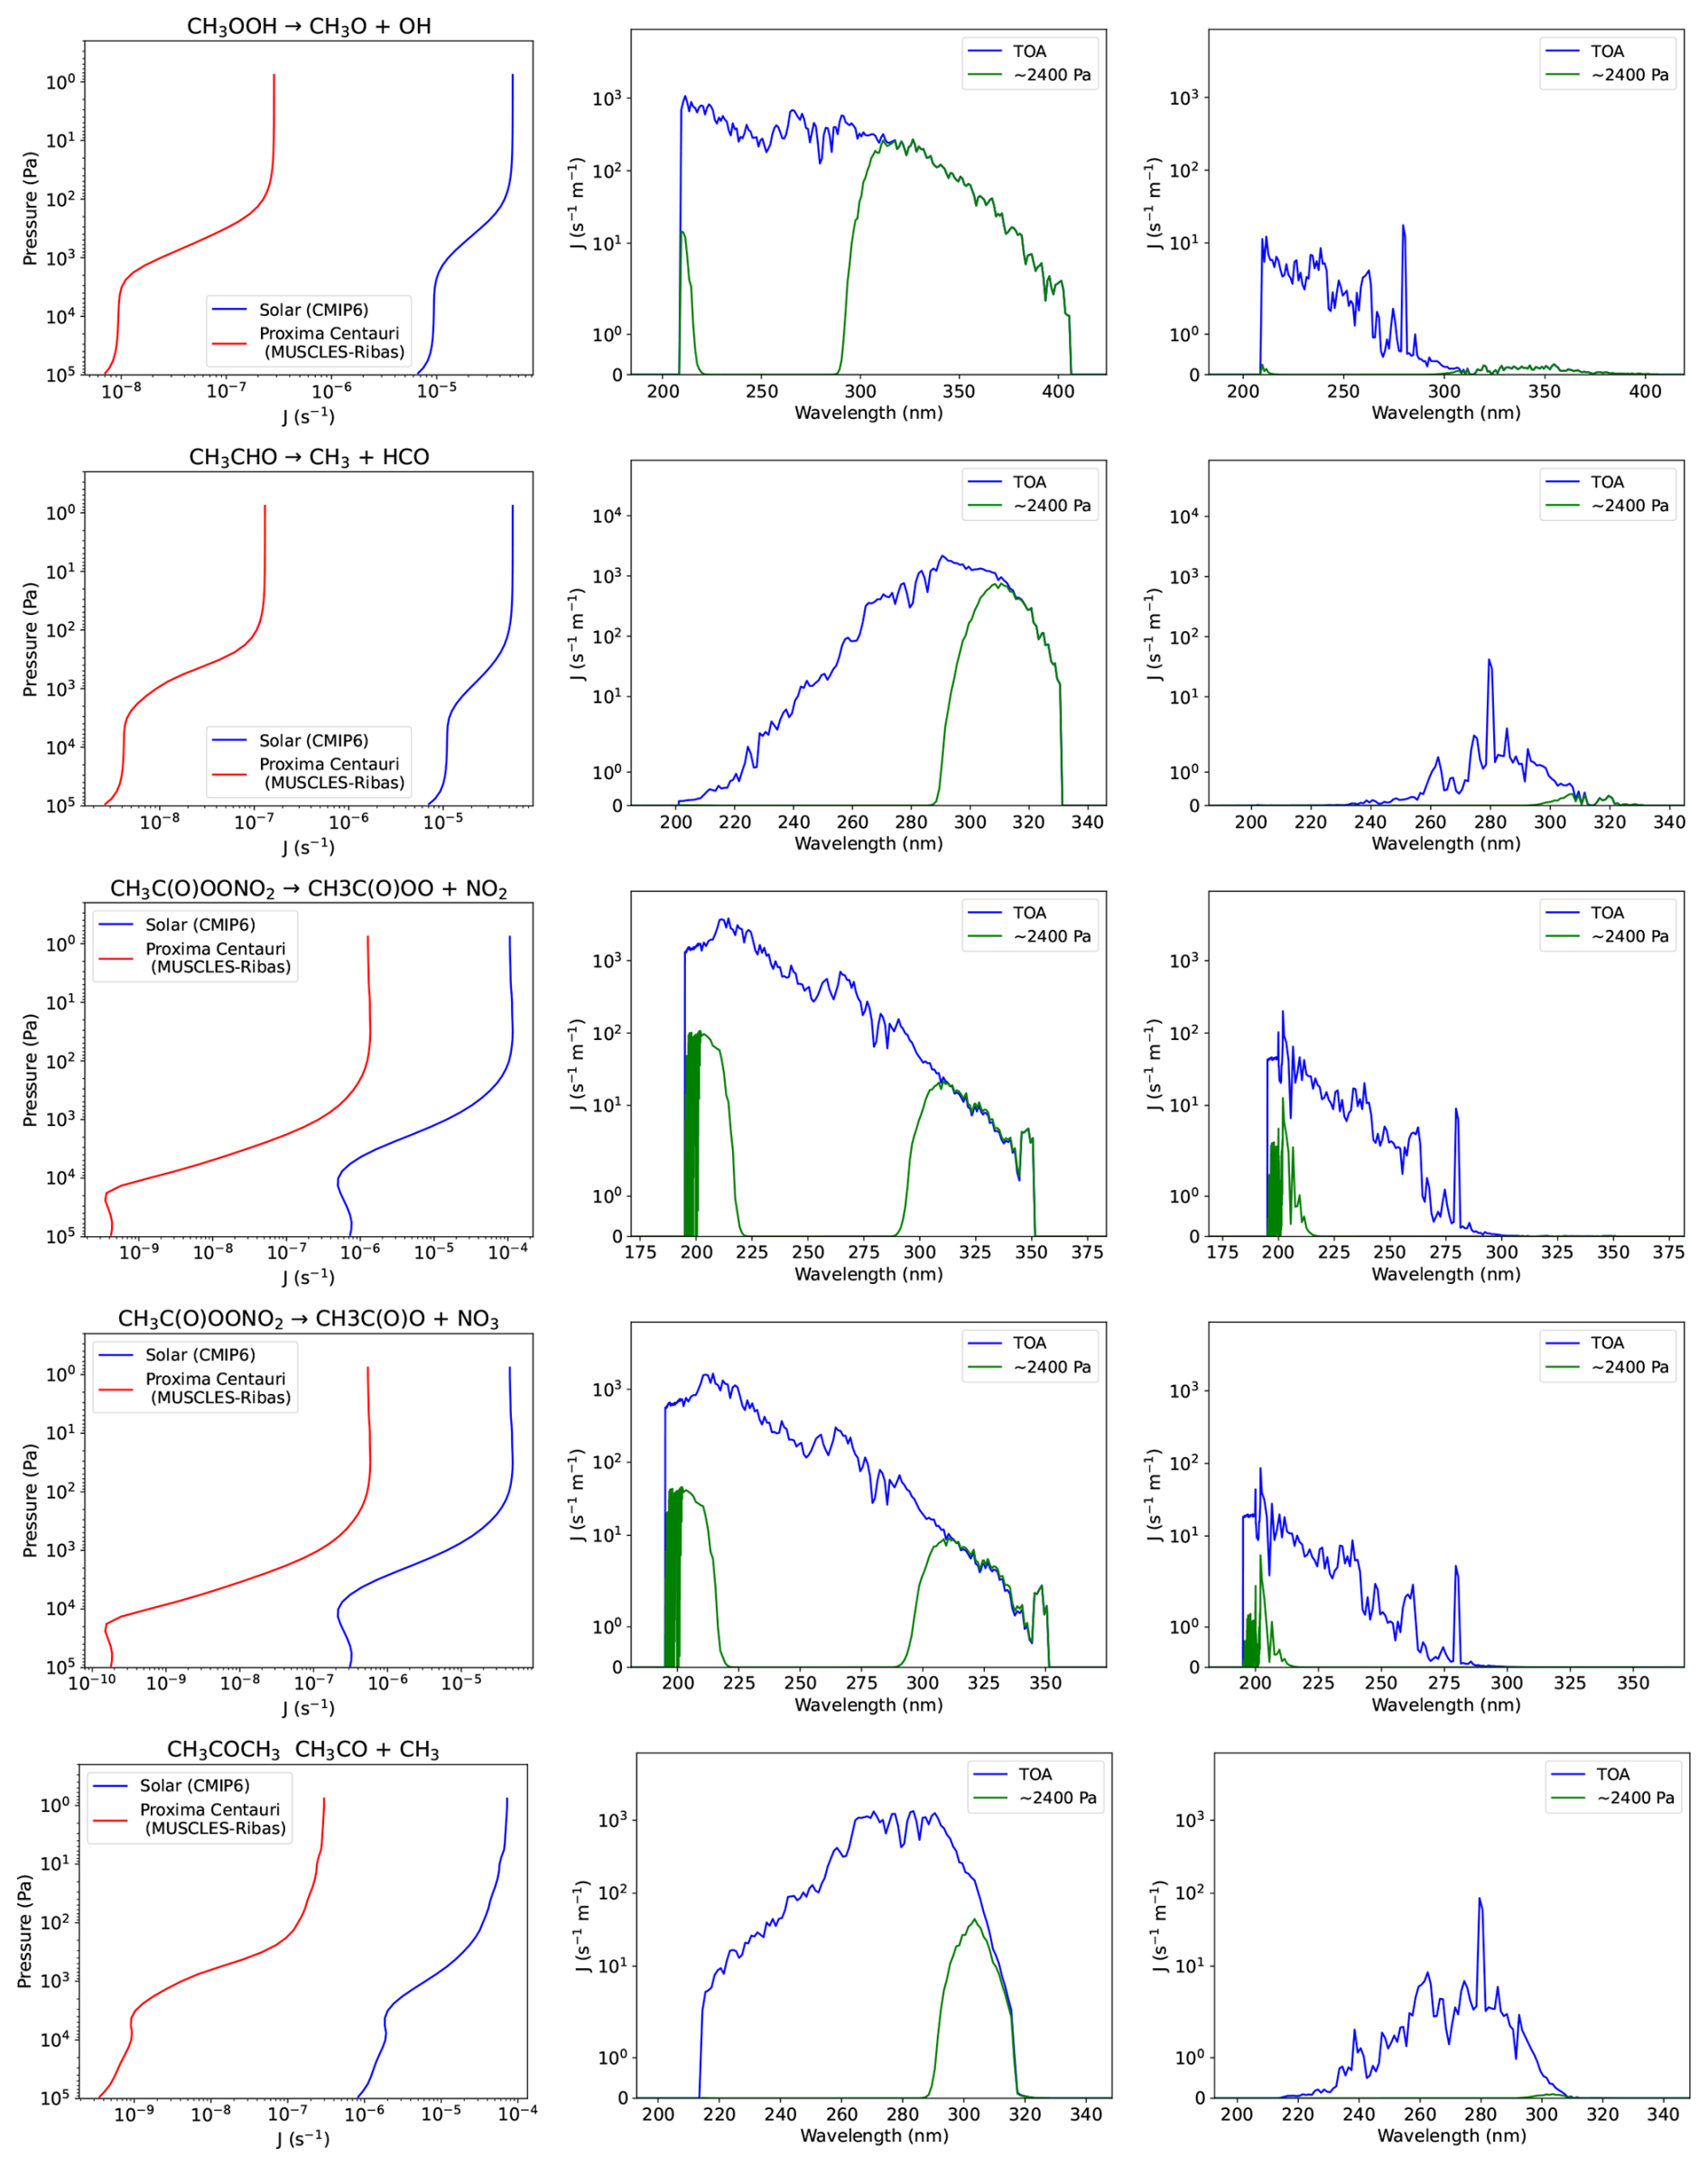
Figure 22Photolysis rates for the organic species CH3OOH, CH3CHO, CH3C(O)OONO2 (PAN) and CH3COCH3 as yielded by the Solar and Proxima Centauri spectra (blue and red lines respectively) against pressure (Pa) on a log scale (left column panels), and as a function of wavelength (nm) for the Solar case (middle column panels) and Proxima Centauri case (right column panels) at the TOA (blue) and ∼2400 Pa (green).
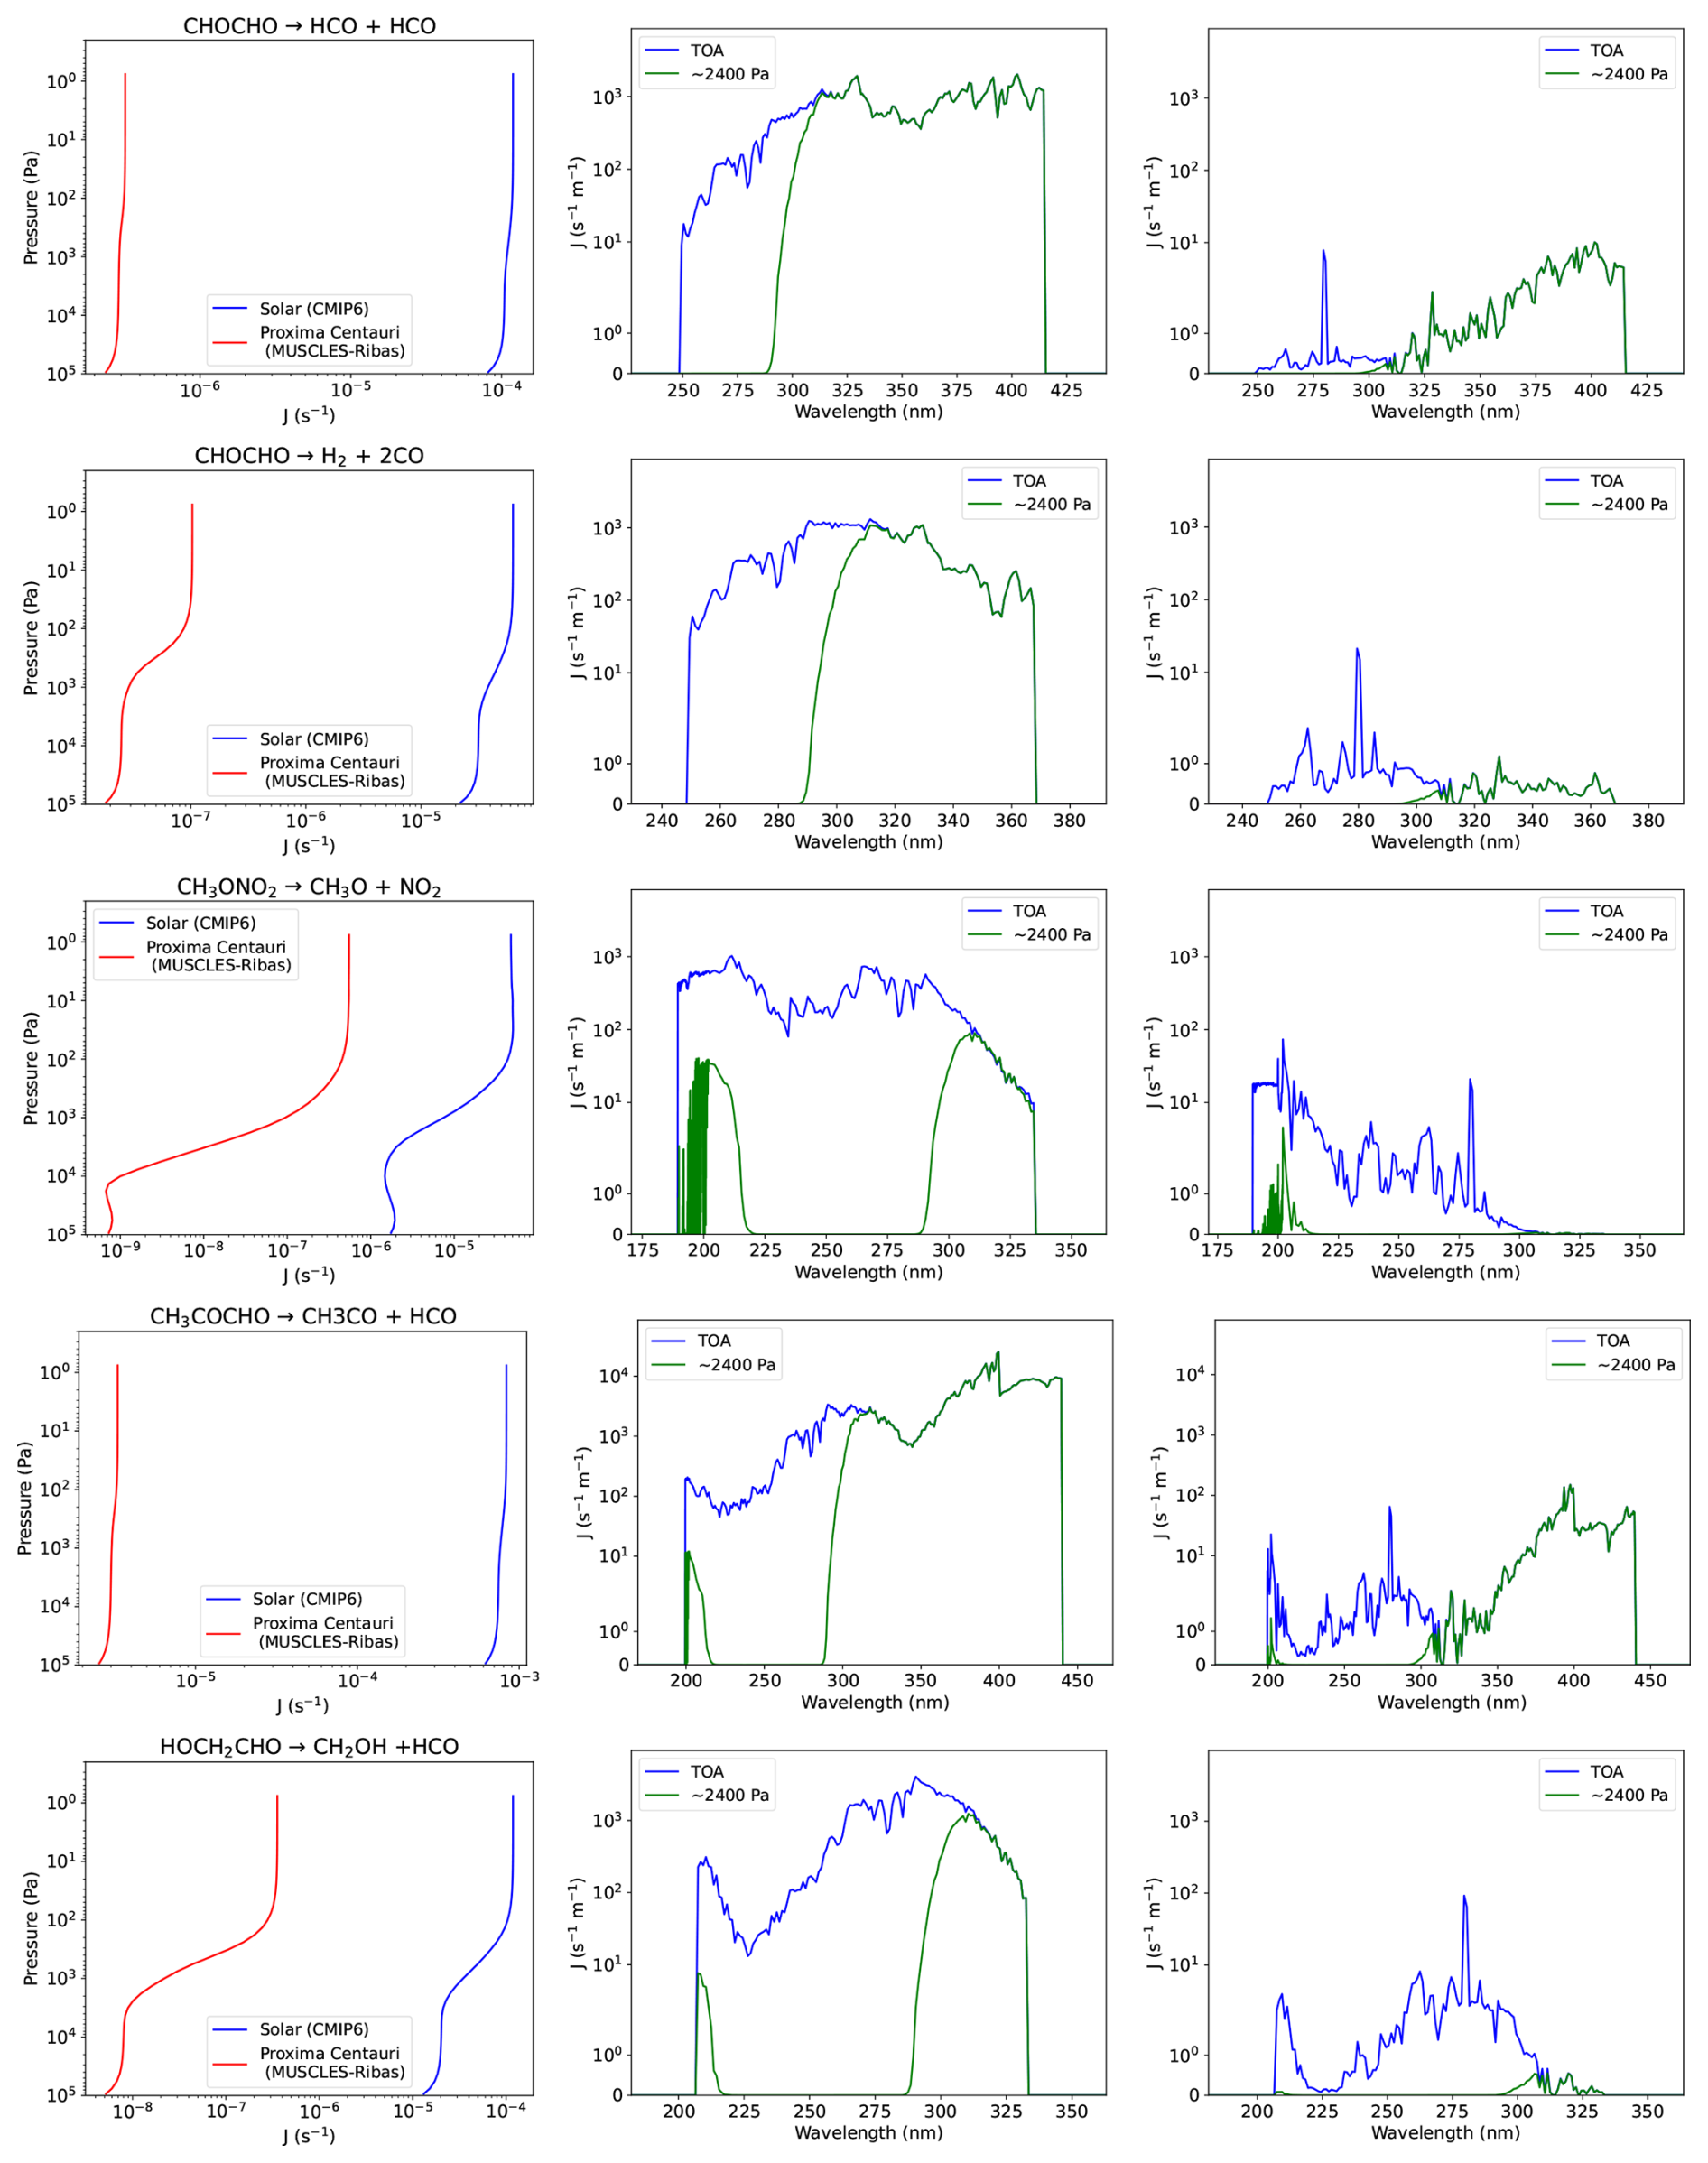
Figure 23Photolysis rates for the organic species CHOCHO, CH3ONO2, CH3COCHO and HOCH2CHO as yielded by the Solar and Proxima Centauri spectra (blue and red lines respectively) against pressure (Pa) on a log scale (left column panels), and as a function of wavelength (nm) for the Solar case (middle column panels) and Proxima Centauri case (right column panels) at the TOA (blue) and ∼2400 Pa (green).
Figure 24 shows the rates for photolysis reactions of C2H2, C2H3 and C2H4 as yielded by the Solar and Proxima Centauri spectra. For both C2H2 and C2H4, the photolysis rates for Proxima Centauri are higher than Solar at the top of atmosphere due to the greater contribution from Lyman-α wavelengths. At lower altitudes the contribution from the NUV dominates and Solar rates are higher than for Proxima Centauri.
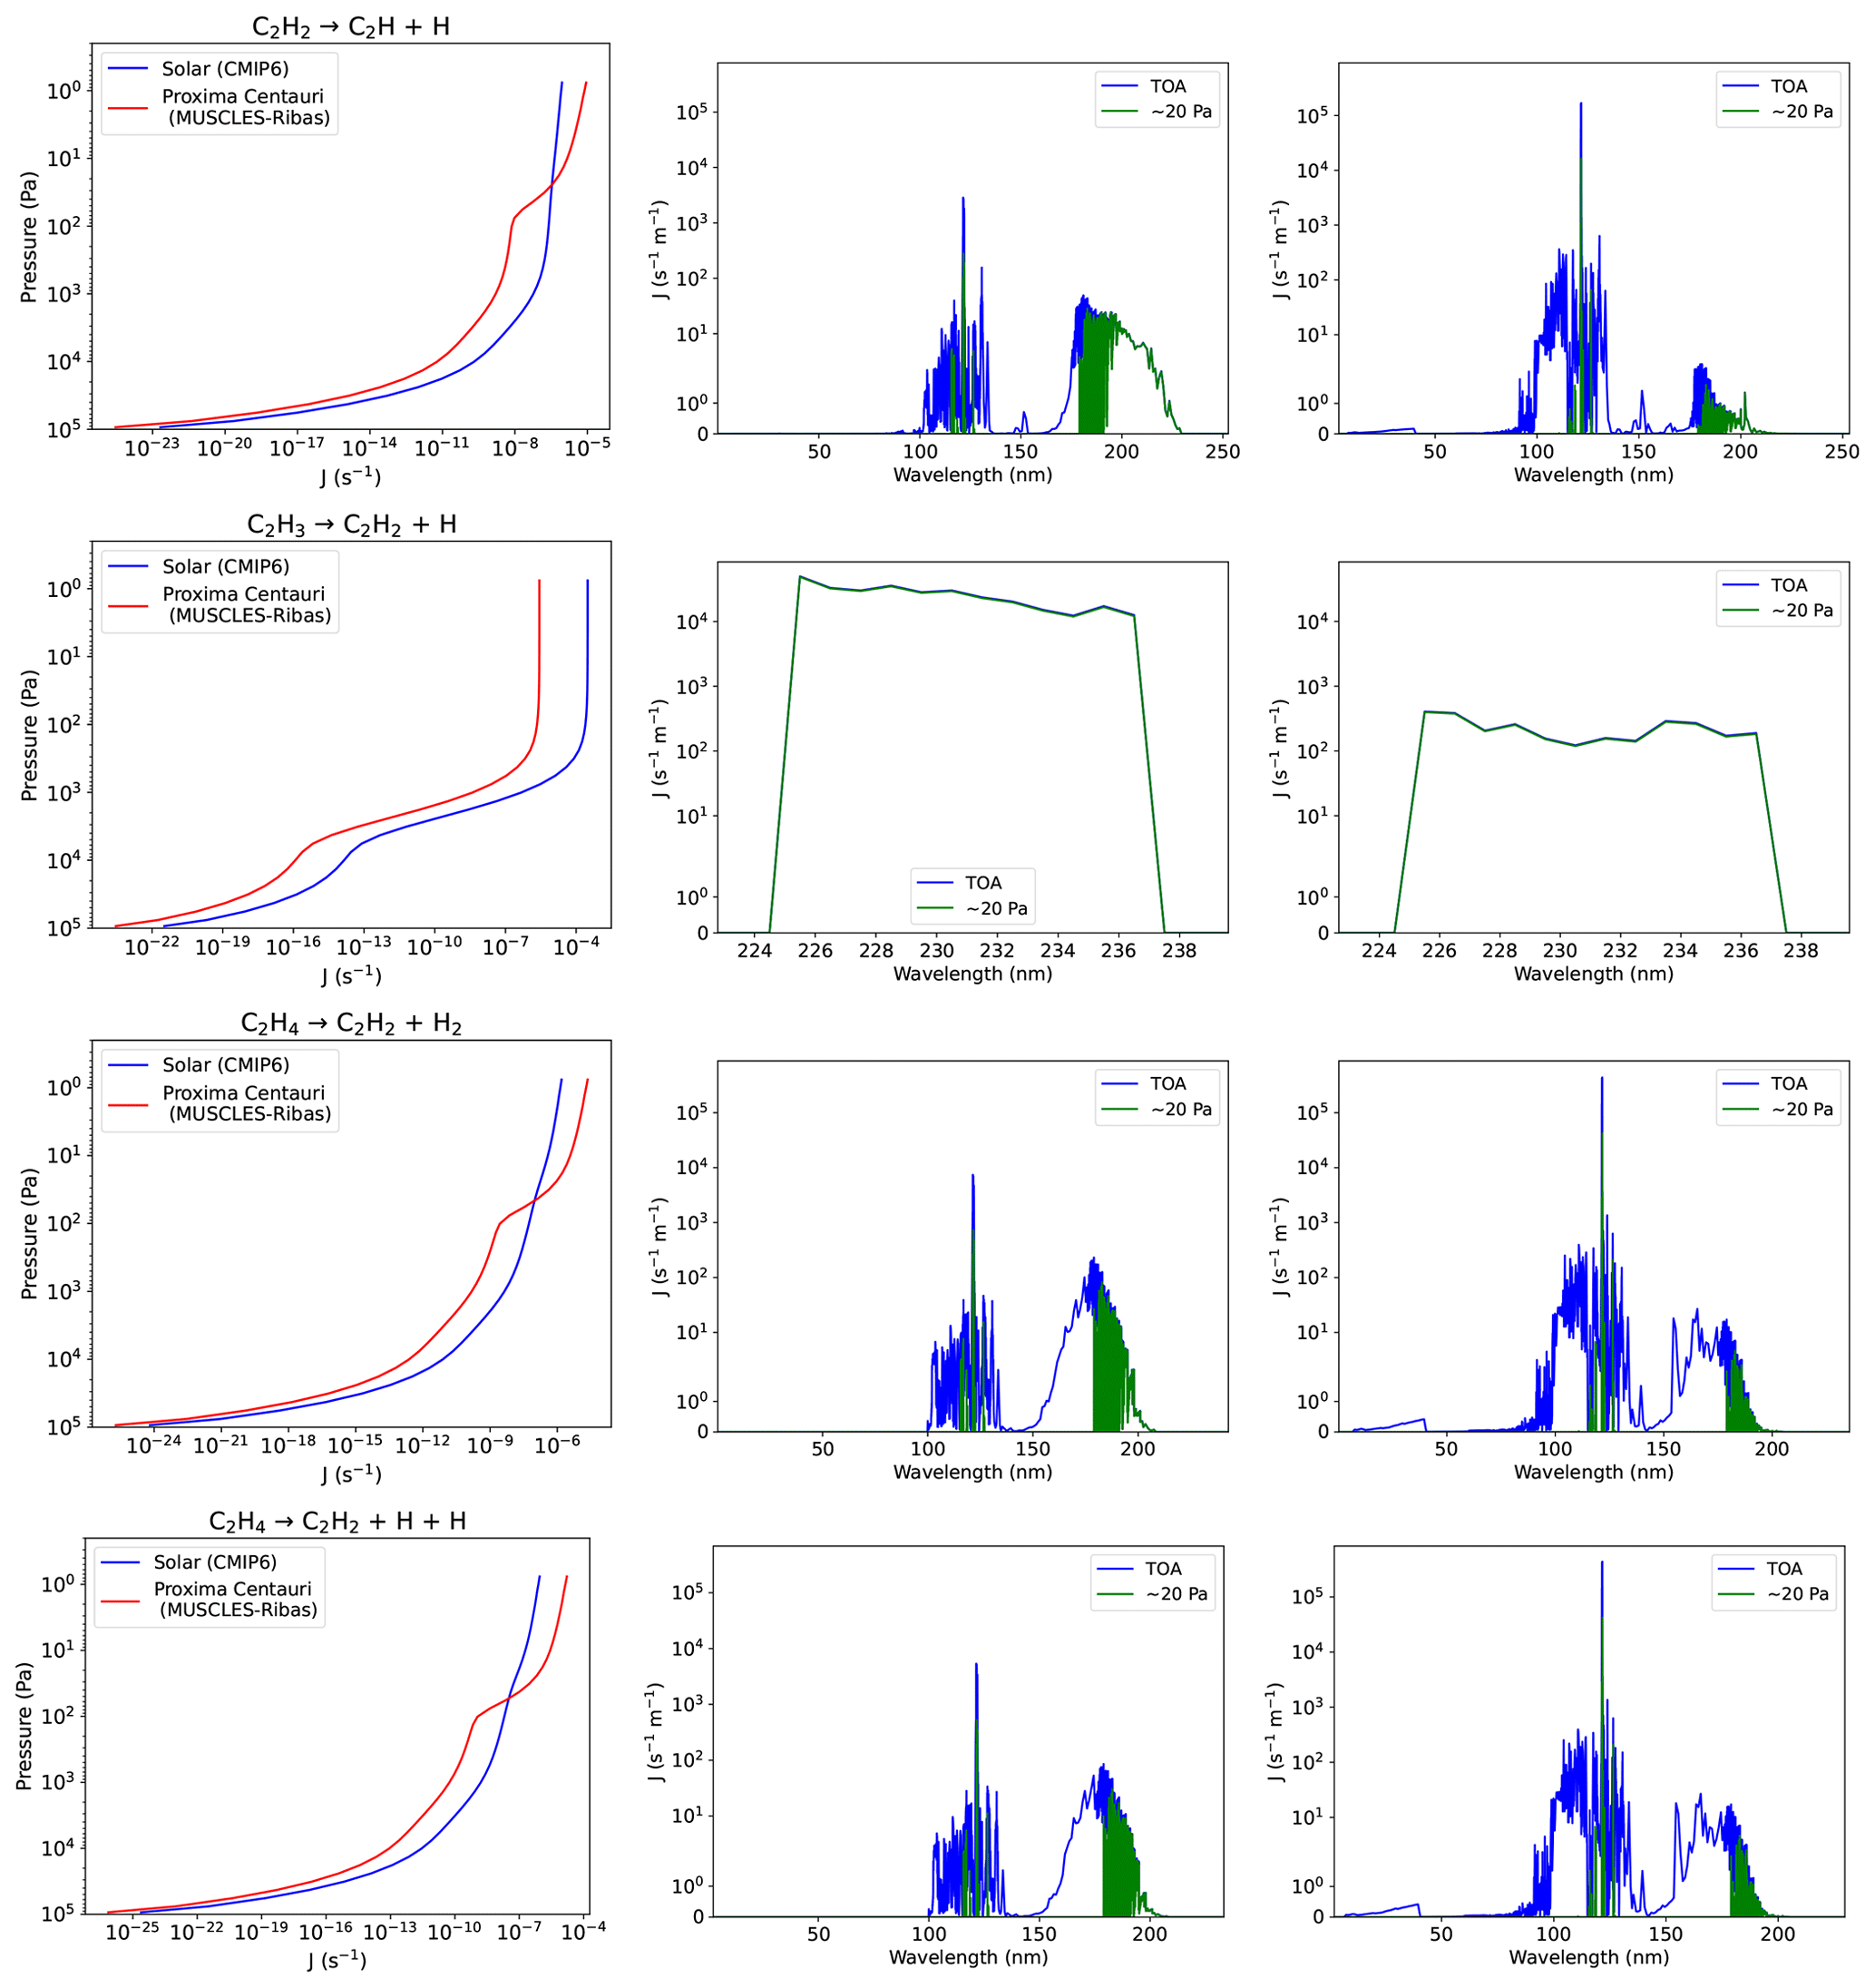
Figure 24Photolysis rates for C2H2, C2H3 and C2H4 as yielded by the Solar and Proxima Centauri spectra (blue and red lines respectively) against pressure (Pa) on a log scale (left column panels), and as a function of wavelength (nm) for the Solar case (middle column panels) and Proxima Centauri case (right column panels) at the TOA (blue) and ∼20 Pa (green).
Figure 25 shows the rates for photolysis reactions of C2H6 as yielded by the Solar and Proxima Centauri spectra. These reactions are dominated by wavelengths around Lyman-α and are correspondingly higher for Proxima Centauri.
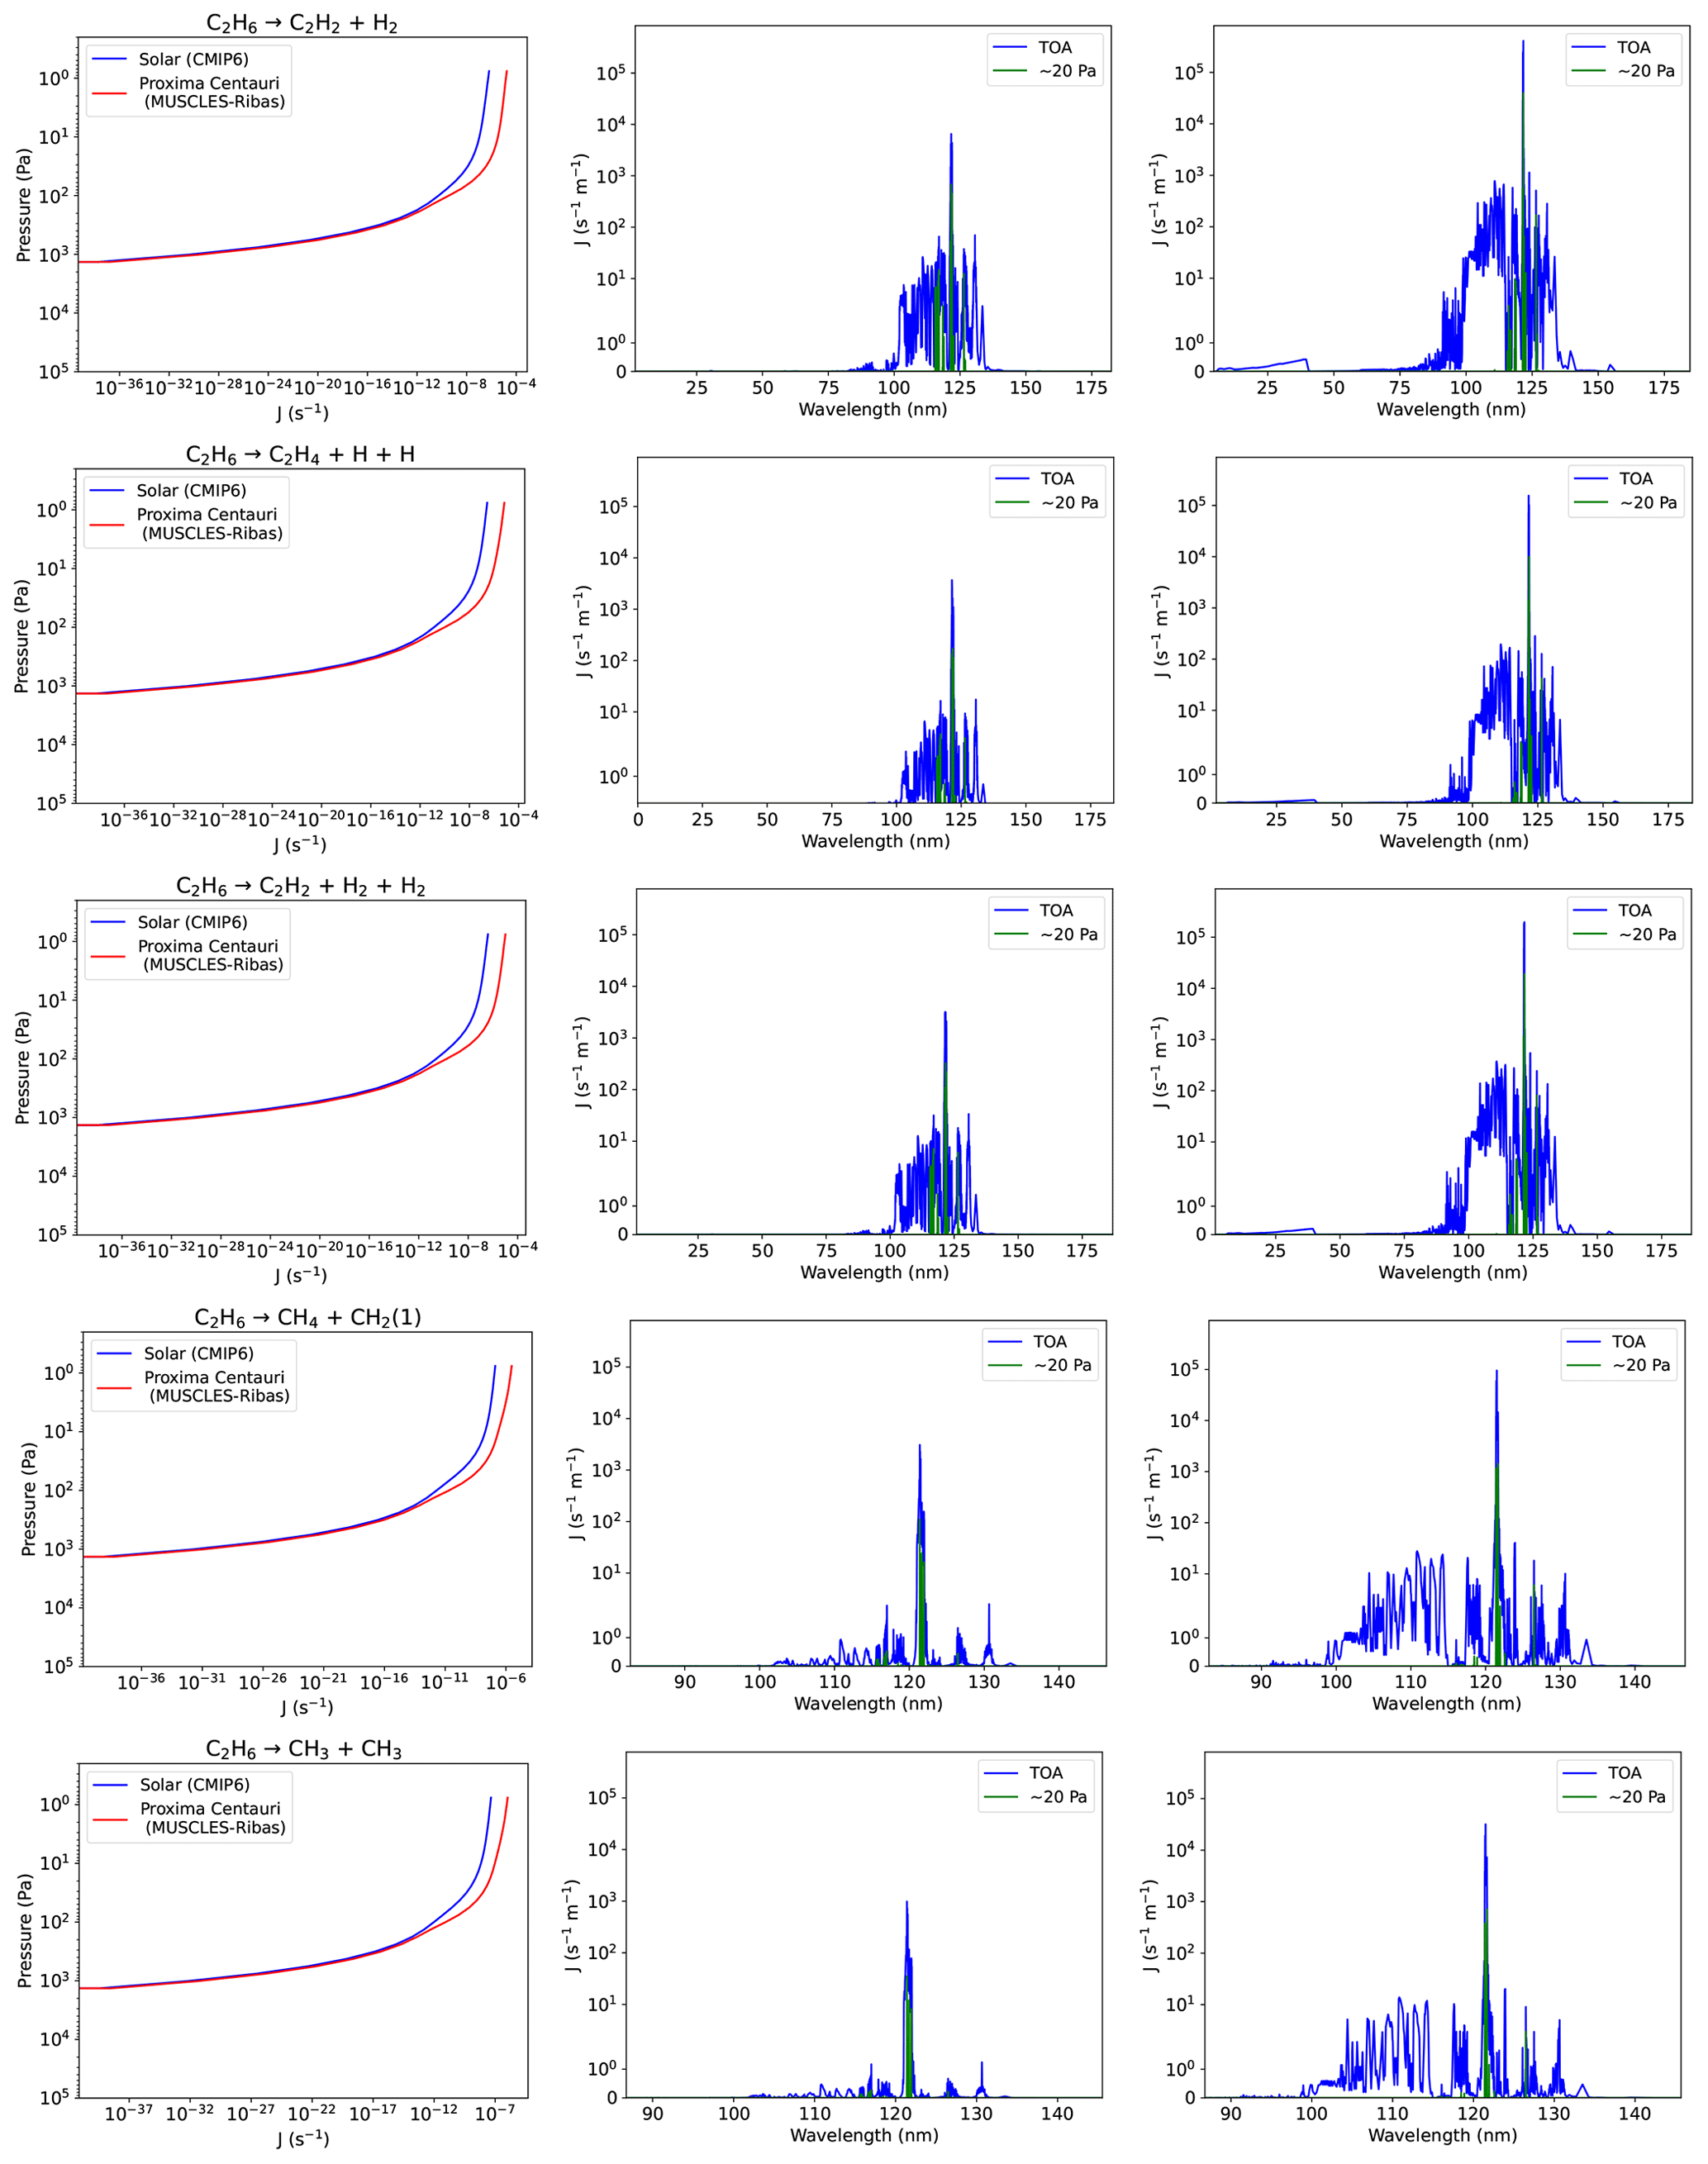
Figure 25Photolysis rates for C2H6 as yielded by the Solar and Proxima Centauri spectra (blue and red lines respectively) against pressure (Pa) on a log scale (left column panels), and as a function of wavelength (nm) for the Solar case (middle column panels) and Proxima Centauri case (right column panels) at the TOA (blue) and ∼20 Pa (green).
4.2.6 Other exoplanet species
In addition to the species already explored, some additional species are required for exoplanets where comparison rates under an Earth-like O3 profile are not available in PhotoComp, including H2O which is detailed in Sect. 4.2.3. Therefore, in this section we simply provide our calculated rates as a reference for future studies. Figure 26 shows the rates for the dissociation of , , , and as yielded by the Solar and Proxima Centauri spectra (blue and red lines respectively) against pressure on a log scale (left column), and as a function of wavelength for the Solar case (middle column) and Proxima Centauri case (right column) at the TOA (blue) and ∼20 Pa (green).
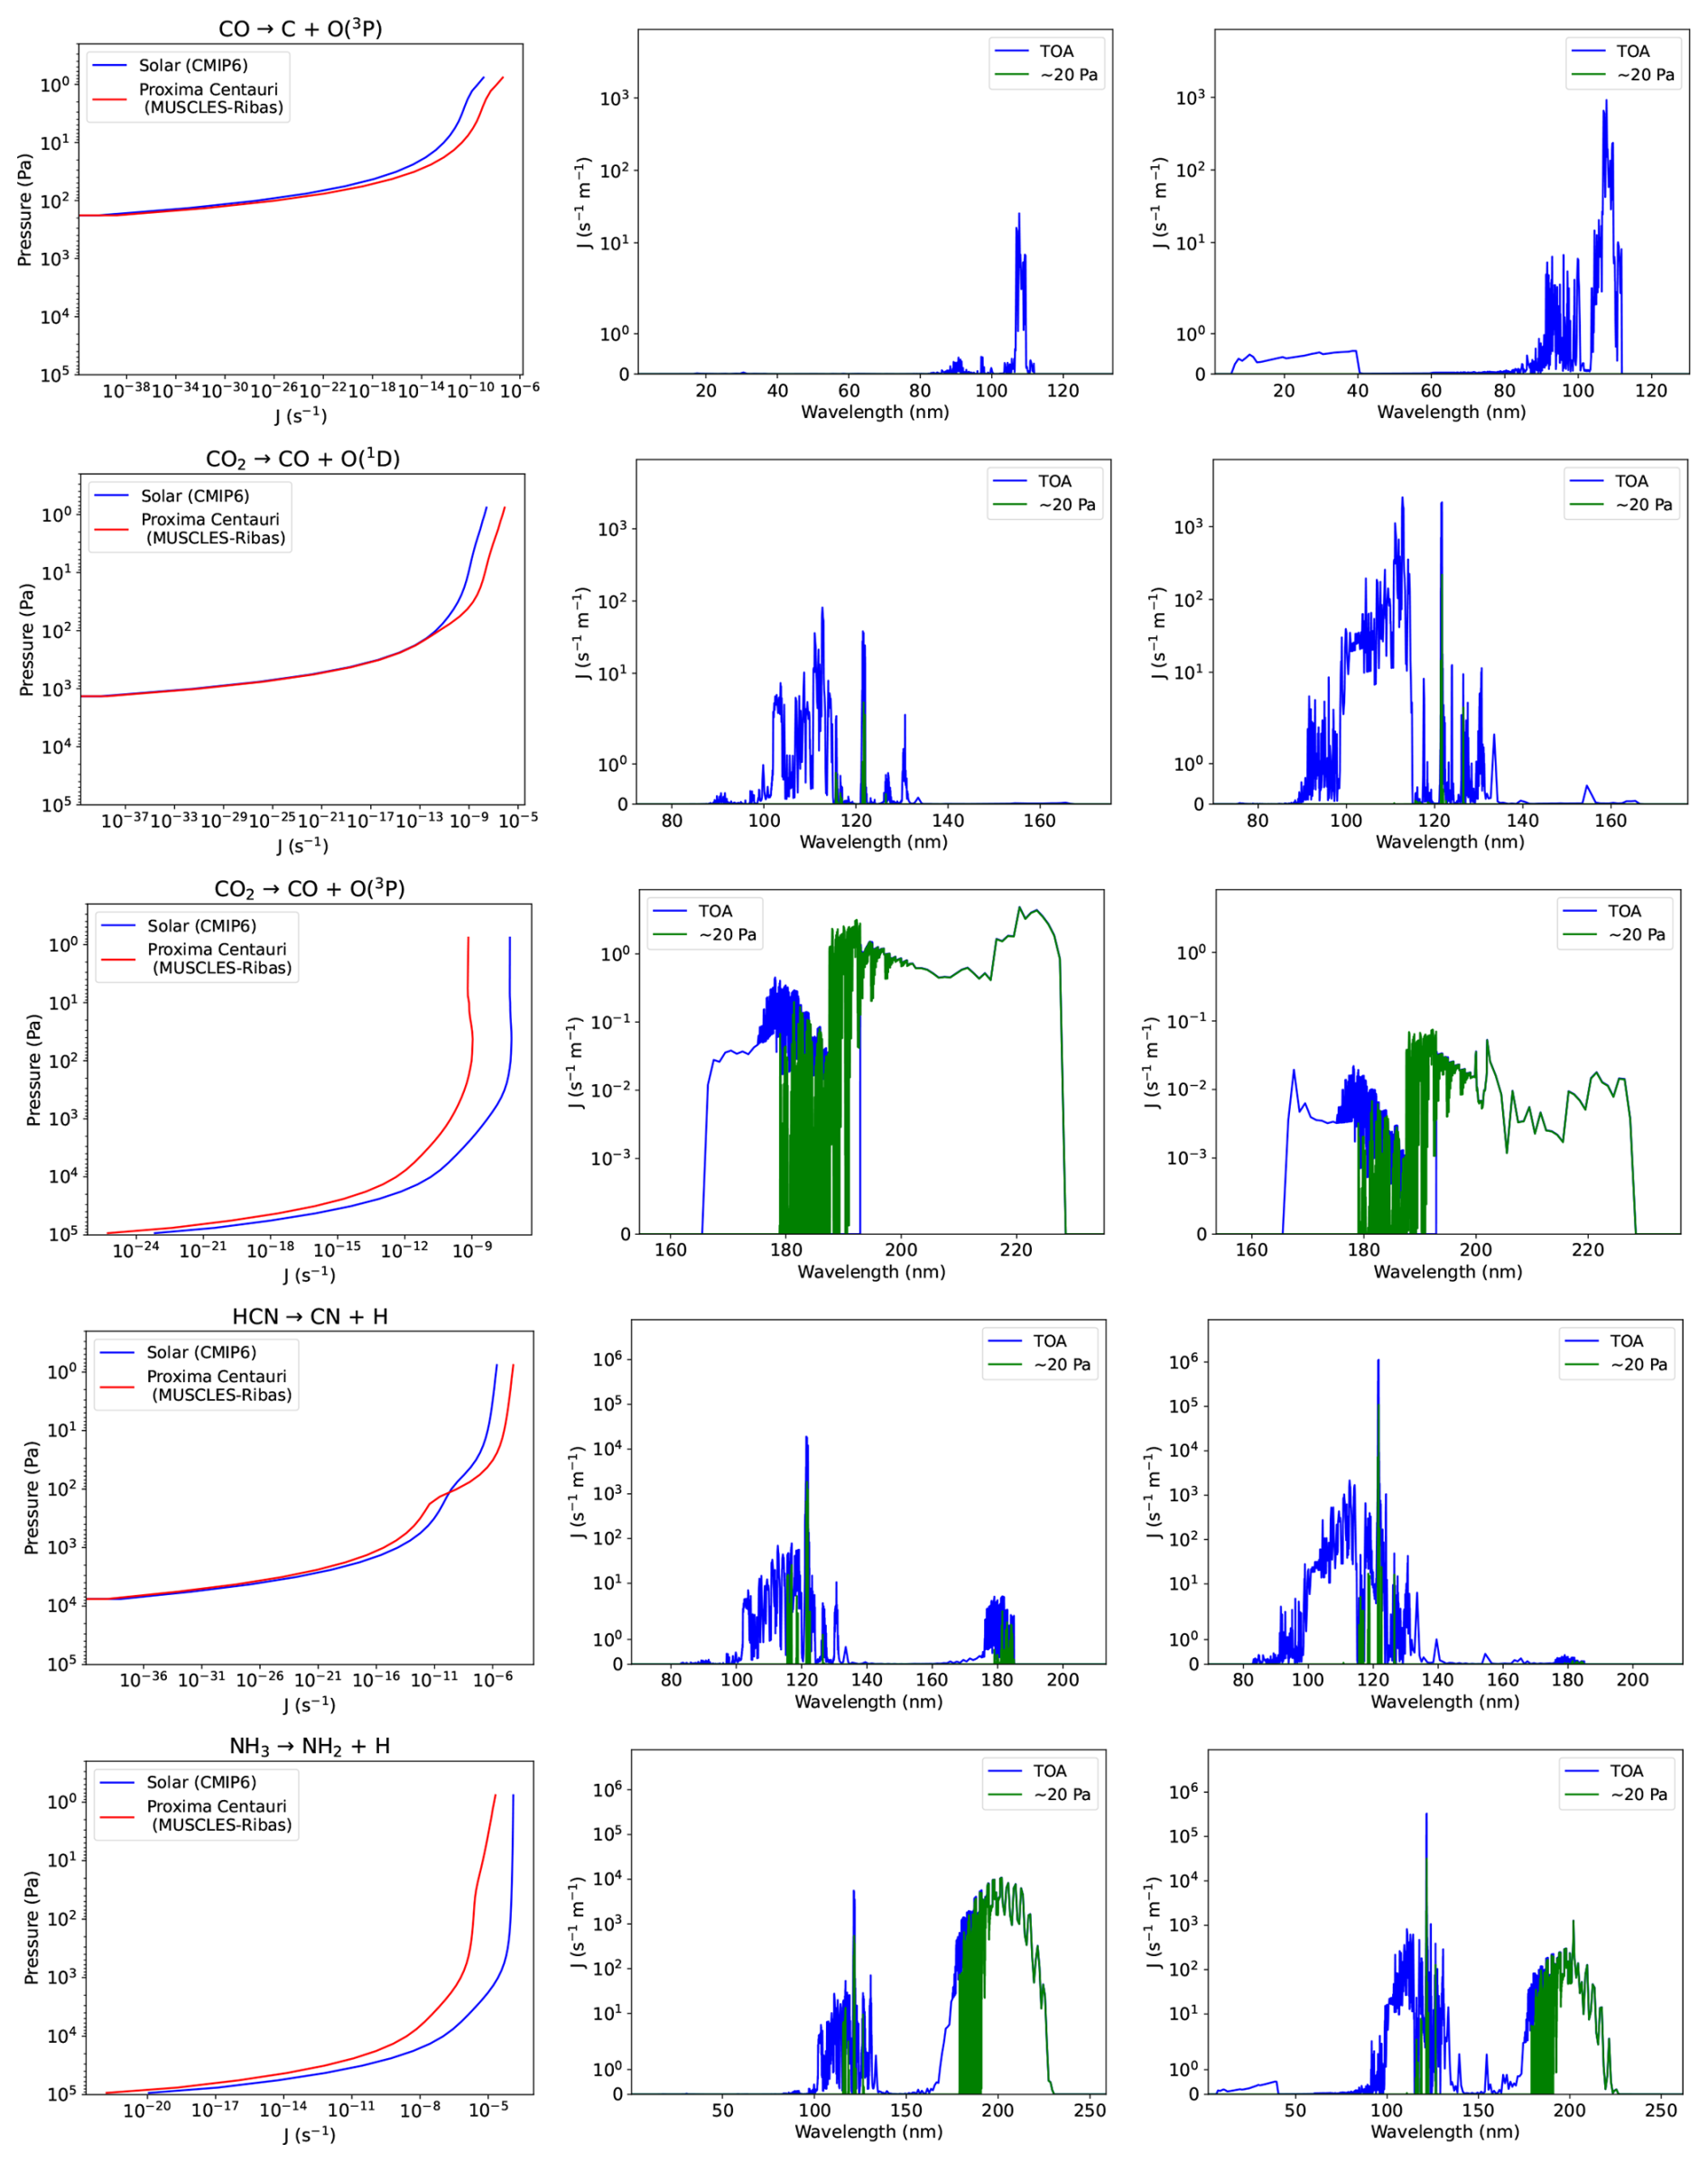
Figure 26Photolysis rates for CO, CO2, HCN and NH3 as yielded by the Solar and Proxima Centauri spectra (blue and red lines respectively) against pressure (Pa) on a log scale (left column panels), and as a function of wavelength (nm) for the Solar case (middle column panels) and Proxima Centauri case (right column panels) at the TOA (blue) and ∼20 Pa (green).
The cross sections of CO2 have a temperature dependence (see Table A1) and the effect of this is evident for where we see a protrusion indicating an increase in rates around ∼100 Pa. The Proxima Centauri rates for are higher than the Solar rates due to the contribution around Lyman-α. The short wavelengths are attenuated before arriving at ∼100 Pa which is why we do not see a similar peak. The threshold for the production of O(1D) is 167 nm and the quantum yield is zero below 50 nm, therefore the flux supplied in the relevant wavelength range would be higher for Proxima Centauri than that provided by the Solar spectrum. Similar reasoning can be applied to CO while HCN and NH3 both have contributions from the NUV where the Solar flux is larger. For HCN the Lyman-α and NUV rates are balanced with Lyman-α dominating towards the top of the atmosphere and the NUV dominating below ∼100 Pa (similar to C2H2 and C2H4).
For ammonia (NH3) similar to the case of H2CO and NO2, as detailed in Sect. 4.2.4 and 4.2.5, the longer UV wavelength contribution is smaller for Proxima Centauri than when the Solar spectrum is used. For the rates calculated with the Proxima Centauri spectrum the shape of the rates as a function of pressure is mainly due to oxygen absorption of FUV flux at the top of the atmosphere, particularly around Lyman-α. The photolysis rates calculated with the Solar spectrum are dominated by the NUV where ozone absorption lower in the atmosphere is the most significant factor.
Photochemistry is an important process in the atmospheres of planets, and therefore accurate photolysis schemes in models are essential. In this paper, we first benchmark and test the Socrates photolysis scheme against the results of PhotoComp (Chipperfield et al., 2010) under an Earth atmosphere profile. The Socrates photolysis scheme generally compares well with the PhotoComp reference calculations. However, we also find the following:
-
Significant differences can be present due to the adoption (or non-adoption) of temperature-dependent cross sections, e.g. NO2, or quantum yields, e.g. NO3. This can alter how the photolysis rates change through the vertical extent of the atmosphere according to the temperature structure.
-
For some species, such as O2 and N2O, differences are caused by the inclusion or omission of FUV wavelengths altering rates towards the top-of-atmosphere. Within many of the spectra we see contributions from these shorter wavelengths which are particularly important around the strong Lyman-α emission line in the stellar spectra.
-
The treatment of quantum yields is often the largest source of uncertainty in the calculation of photolysis rates. Many reported measurements are done at particular wavelengths and the arbitrary treatment of quantum yield as a function of wavelength between reported measurements can lead to large differences in calculated rates.
-
Fairly large discrepancies were found between Socrates and the reference models for the photolysis rates of organic species. The main contributing factor is likely to be the treatment of pressure dependencies of the quantum yields which are significant for many organic species. Further work is needed to introduce the functionality into Socrates to allow a pressure dependence in the quantum yields.
In Sect. 4.2, we then changed the input stellar spectrum to an M dwarf spectrum, but retained the same Earth-like atmospheric conditions and total incoming TOA flux as used for the calculations in Sect. 4.1. We find that the differences between the rates yielded from the Solar spectrum versus the Proxima Centauri spectrum are accounted for generally by the higher levels of actinic flux below around 175 nm, and lower levels at longer wavelengths in the Proxima Centauri spectrum depending on where the threshold of the photolysis reaction occurs within this wavelength region. In this sense, our results match the findings of Ridgway (2023). The variation as a function of wavelength of the input stellar spectra also affects the rates as a function of pressure through the atmosphere. For a number of species we find that the Proxima Centauri rates change more quickly as a function of pressure in the upper atmosphere due to a large contribution from FUV wavelengths sensitive to oxygen absorption. In contrast, rates from the Solar spectrum have a larger contribution from longer UV wavelengths which are sensitive to ozone absorption lower down in the stratosphere.
With the advent of new stellar input spectra including good coverage of the UV range via computational modelling alongside observations (e.g. Wilson et al., 2024; Linsky and Redfield, 2024), Socrates's ability to easily interchange the input stellar spectrum will be vital for exoplanet studies.
Future work
A specific subset of species have been benchmarked and tested in this work. However, the ability to include other species such as halogenated species for Earth, as well as other species important for exoplanets and early Earth-like environments, such as sulphur and other hydrocarbon species, will be important for future studies.
We are currently performing a similar benchmarking exercise for species and conditions relevant to hot Jupiters. Hot Jupiters are Jovian planets in short-period orbits where tidal interactions lead to synchronised orbital and rotation periods, producing a dayside receiving constant and intense levels of irradiation (Showman and Guillot, 2002). Although there has been extensive work on the thermal chemistry of hot Jupiter atmospheres (Drummond et al., 2016; Zamyatina et al., 2024), there are very few benchmarks that exist for the photolysis rates of the relevant species under hot Jupiter atmospheric conditions. Different planet environments covering different temperature regimes will require a careful treatment of pressure and temperature dependent quantum yields and cross sections. This will be an evolving area as new data, especially high-temperature data for exoplanets, become available (e.g. Ni et al., 2025).
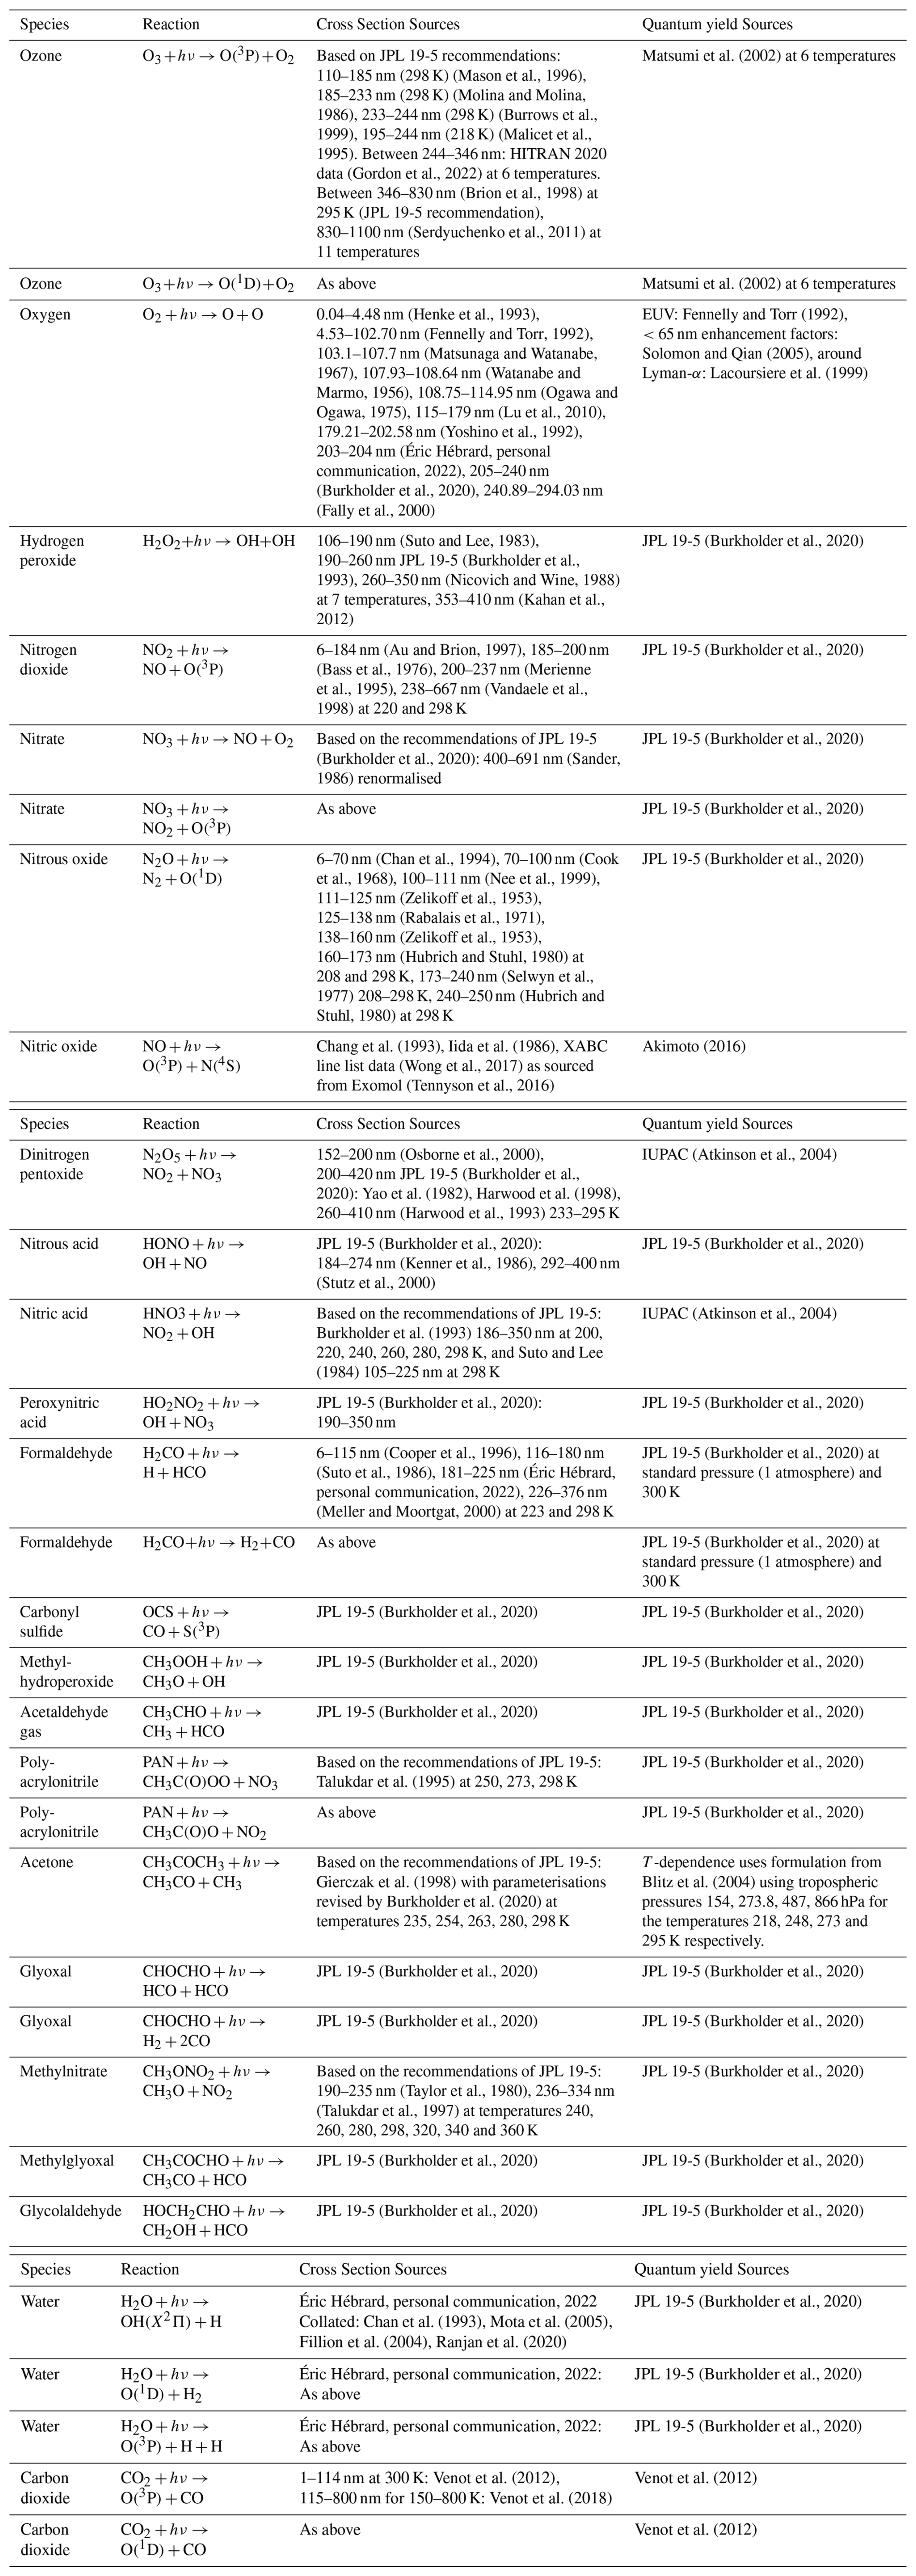
Details of the reactions and species used in our calculations, including our data sources for the absorption cross sections and quantum yields are shown in Table A1. This covers all the reactions for the PhotoComp intercomparison plus details of the data sources for H2O and CO2 reactions. The additional species: CH3, CH4, C2H2, C2H3, C2H4, C2H6, CO, HCN and NH3 use the same cross sections and quantum yields as Venot et al. (2012).
(Mason et al., 1996)(Molina and Molina, 1986)(Burrows et al., 1999)(Malicet et al., 1995)(Gordon et al., 2022)(Brion et al., 1998)(Serdyuchenko et al., 2011)Matsumi et al. (2002)Matsumi et al. (2002)(Henke et al., 1993)(Fennelly and Torr, 1992)(Matsunaga and Watanabe, 1967)(Watanabe and Marmo, 1956)(Ogawa and Ogawa, 1975)(Lu et al., 2010)(Yoshino et al., 1992)(Burkholder et al., 2020)(Fally et al., 2000)Fennelly and Torr (1992)Solomon and Qian (2005)Lacoursiere et al. (1999)(Suto and Lee, 1983)(Burkholder et al., 1993)(Nicovich and Wine, 1988)(Kahan et al., 2012)(Burkholder et al., 2020)(Au and Brion, 1997)(Bass et al., 1976)(Merienne et al., 1995)(Vandaele et al., 1998)(Burkholder et al., 2020)(Burkholder et al., 2020)(Sander, 1986)(Burkholder et al., 2020)(Burkholder et al., 2020)(Chan et al., 1994)(Cook et al., 1968)(Nee et al., 1999)(Zelikoff et al., 1953)(Rabalais et al., 1971)(Zelikoff et al., 1953)(Hubrich and Stuhl, 1980)(Selwyn et al., 1977)(Hubrich and Stuhl, 1980)(Burkholder et al., 2020)Chang et al. (1993)Iida et al. (1986)(Wong et al., 2017)(Tennyson et al., 2016)Akimoto (2016)(Osborne et al., 2000)(Burkholder et al., 2020)Yao et al. (1982)Harwood et al. (1998)(Harwood et al., 1993)(Atkinson et al., 2004)(Burkholder et al., 2020)(Kenner et al., 1986)(Stutz et al., 2000)(Burkholder et al., 2020)Burkholder et al. (1993)Suto and Lee (1984)(Atkinson et al., 2004)(Burkholder et al., 2020)(Burkholder et al., 2020)(Cooper et al., 1996)(Suto et al., 1986)(Meller and Moortgat, 2000)(Burkholder et al., 2020)(Burkholder et al., 2020)(Burkholder et al., 2020)(Burkholder et al., 2020)(Burkholder et al., 2020)(Burkholder et al., 2020)(Burkholder et al., 2020)(Burkholder et al., 2020)Talukdar et al. (1995)(Burkholder et al., 2020)(Burkholder et al., 2020)Gierczak et al. (1998)Burkholder et al. (2020)Blitz et al. (2004)(Burkholder et al., 2020)(Burkholder et al., 2020)(Burkholder et al., 2020)(Burkholder et al., 2020)(Taylor et al., 1980)(Talukdar et al., 1997)(Burkholder et al., 2020)(Burkholder et al., 2020)(Burkholder et al., 2020)(Burkholder et al., 2020)(Burkholder et al., 2020)Chan et al. (1993)Mota et al. (2005)Fillion et al. (2004)Ranjan et al. (2020)(Burkholder et al., 2020)(Burkholder et al., 2020)(Burkholder et al., 2020)Venot et al. (2012)Venot et al. (2018)Venot et al. (2012)Venot et al. (2012)Table A1Species, reactions and data sources for the absorption cross-sections and quantum yields of all the reactions for the PhotoComp intercomparison. Details are also included for the species H2O and CO2, while all other reactions considered for exoplanets use cross-sections and quantum yields from Venot et al. (2012).
Current and previously released versions of Socrates are available from https://github.com/MetOffice/socrates (last access: 26 September 2025) under a BSD 3-clause licence. The configuration of the model used to produce the results in this paper is built on Socrates version 24.11 and is available via Zenodo at https://doi.org/10.5281/zenodo.15941222 (Adams et al., 2025), as are input data and scripts to run the model and produce the plots for all the simulations presented in this paper.
SA led the work, collated the input data and performed the calculations as well as leading the writing of the manuscript. JM supported the development of the input files and calculations using Socrates, as well as aiding in scientific analysis and the development of the manuscript. NM provided overall guidance, supervision and resources for the work, and aided in the scientific analysis and development of the manuscript. MTM provided direct support with development of optical properties and the use of Socrates, alongside helping with the scientific analysis. EH provided expertise and guidance in the collation of the input data and photolysis reactions.
The contact author has declared that none of the authors has any competing interests.
Publisher's note: Copernicus Publications remains neutral with regard to jurisdictional claims made in the text, published maps, institutional affiliations, or any other geographical representation in this paper. The authors bear the ultimate responsibility for providing appropriate place names. Views expressed in the text are those of the authors and do not necessarily reflect the views of the publisher.
We would like to acknowledge Martyn Chipperfield for providing data for this work. Sophia Adams was supported by a Black British Researchers Scholarship at the University of Exeter (REF: 4727), made possible through generous alumni donations. This research was supported by a (UKRI) Future Leaders Fellowship MR/T040866/1 and a Small Award from the Science and Technology Facilities Council for Astronomy Observation and Theory [ST/Y00261X/1]. Material produced using Met Office Software. We acknowledge use of the Monsoon2 system, a collaborative facility supplied under the Joint Weather and Climate Research Programme, a strategic partnership between the Met Office and the Natural Environment Research Council. Mei Ting Mak acknowledges funding from the Bell Burnell Graduate Scholarship Fund, administered and managed by the Institute of Physics (BB005), and the Croucher Foundation. For the purpose of open access, the author has applied a Creative Commons Attribution (CC BY) licence to any Author Accepted Manuscript version arising from this submission.
This research has been supported by the University of Exeter (Black British Researchers Scholarship at the University of Exeter, REF: 4727), the UK Research and Innovation (UKRI, Future Leaders Fellowship MR/T040866/1), the Science and Technology Facilities Council (Small Award from the Science and Technology Facilities Council for Astronomy Observation and Theory [ST/Y00261X/1]), and the Institute of Physics ( Bell Burnell Graduate Scholarship Fund, administered and managed by the Institute of Physics, BB005).
This paper was edited by Tatiana Egorova and reviewed by two anonymous referees.
Adams, S., Ford, R., Hambley, M., Hobson, J., Kavčič, I., Maynard, C., Melvin, T., Müller, E., Mullerworth, S., Porter, A., Rezny, M., Shipway, B., and Wong, R.: LFRic: Meeting the challenges of scalability and performance portability in Weather and Climate models, J. Parall. Distrib. Comput., 132, 383–396, https://doi.org/10.1016/j.jpdc.2019.02.007, 2019. a
Adams, S., Manners, J., Mayne, N., Mak, M. T., and Hébrard, E.: Benchmarking Photolysis Rates, Zenodo [code and data set], https://doi.org/10.5281/zenodo.15941222, 2025. a
Akimoto, H.: Atmospheric reaction chemistry, Springer, https://doi.org/10.1007/978-4-431-55870-5, 2016. a, b, c
Amundsen, D. S., Baraffe, I., Tremblin, P., Manners, J., Hayek, W., Mayne, N. J., and Acreman, D. M.: Accuracy tests of radiation schemes used in hot Jupiter global circulation models, Astron. Astrophys., 564, A59, https://doi.org/10.1051/0004-6361/201323169, 2014. a
Anderson, G. P., Clough, S. A., Kneizys, F., Chetwynd, J. H., and Shettle, E. P.: AFGL atmospheric constituent profiles (0.120 km), Environmental research papers 964, https://apps.dtic.mil/sti/html/tr/ADA175173 (last access: 23 July 2025), 1986. a, b, c
Anglada-Escudé, G., Amado, P. J., Barnes, J., Berdiñas, Z. M., Butler, R. P., Coleman, G. A. L., de La Cueva, I., Dreizler, S., Endl, M., Giesers, B., Jeffers, S. V., Jenkins, J. S., Jones, H. R. A., Kiraga, M., Kürster, M., López-González, M. J., Marvin, C. J., Morales, N., Morin, J., Nelson, R. P., Ortiz, J. L., Ofir, A., Paardekooper, S.-J., Reiners, A., Rodríguez, E., Rodríguez-López, C., Sarmiento, L. F., Strachan, J. P., Tsapras, Y., Tuomi, M., and Zechmeister, M.: A terrestrial planet candidate in a temperate orbit around Proxima Centauri, Nature, 536, 437–440, https://doi.org/10.1038/nature19106, 2016. a, b
Archibald, A. T., O'Connor, F. M., Abraham, N. L., Archer-Nicholls, S., Chipperfield, M. P., Dalvi, M., Folberth, G. A., Dennison, F., Dhomse, S. S., Griffiths, P. T., Hardacre, C., Hewitt, A. J., Hill, R. S., Johnson, C. E., Keeble, J., Köhler, M. O., Morgenstern, O., Mulcahy, J. P., Ordóñez, C., Pope, R. J., Rumbold, S. T., Russo, M. R., Savage, N. H., Sellar, A., Stringer, M., Turnock, S. T., Wild, O., and Zeng, G.: Description and evaluation of the UKCA stratosphere–troposphere chemistry scheme (StratTrop vn 1.0) implemented in UKESM1, Geosci. Model Dev., 13, 1223–1266, https://doi.org/10.5194/gmd-13-1223-2020, 2020. a
Arney, G., Domagal-Goldman, S. D., Meadows, V. S., Wolf, E. T., Schwieterman, E., Charnay, B., Claire, M., Hébrard, E., and Trainer, M. G.: The pale orange dot: the spectrum and habitability of hazy Archean Earth, Astrobiology, 16, 873–899, https://doi.org/10.1089/ast.2015.1422, 2016. a
Atkinson, R., Baulch, D. L., Cox, R. A., Crowley, J. N., Hampson, R. F., Hynes, R. G., Jenkin, M. E., Rossi, M. J., and Troe, J.: Evaluated kinetic and photochemical data for atmospheric chemistry: Volume I-gas phase reactions of Ox, HOx, NOx and SOx species, Atmos. Chem. Phys., 4, 1461–1738, https://doi.org/10.5194/acp-4-1461-2004, 2004. a, b, c
Au, J. W. and Brion, C.: Absolute oscillator strenghts for the valence-shell photoabsorption (2–200 eV) and the molecular and dissociative photoionization (11–80 eV) of nitrogen dioxide, Chem. Phys., 218, 109–126, https://doi.org/10.1016/S0301-0104(97)00065-7, 1997. a
Bass, A. M., Ledford Jr., A. E., and Laufer, A. H.: Extinction coefficients of NO2 and N2O4, J. Res. Natl. Bureau Standard. Sect. A, 80, 143, https://doi.org/10.6028/jres.080A.017, 1976. a
Bednarz, E. M., Maycock, A. C., Telford, P. J., Braesicke, P., Abraham, N. L., and Pyle, J. A.: Simulating the atmospheric response to the 11-year solar cycle forcing with the UM-UKCA model: the role of detection method and natural variability, Atmos. Chem. Phys., 19, 5209–5233, https://doi.org/10.5194/acp-19-5209-2019, 2019. a
Bhongade, A., Marsh, D. R., Sainsbury-Martinez, F., and Cooke, G.: Asymmetries in the Simulated Ozone Distribution on TRAPPIST-1e due to Orography, Astrophys. J., 977, 96, https://doi.org/10.3847/1538-4357/ad8f2f, 2024. a
Bian, H. and Prather, M. J.: Fast-J2: Accurate simulation of stratospheric photolysis in global chemical models, J. Atmos. Chem., 41, 281–296, https://doi.org/10.1023/A:1014980619462, 2002. a, b, c, d
Blitz, M., Heard, D., Pilling, M., Arnold, S., and Chipperfield, M.: Pressure and temperature-dependent quantum yields for the photodissociation of acetone between 279 and 327.5 nm, Geophys. Res. Lett., 31, https://doi.org/10.1029/2003GL018793, 2004. a
Boutle, I. A., Mayne, N. J., Drummond, B., Manners, J., Goyal, J., Lambert, F. H., Acreman, D. M., and Earnshaw, P. D.: Exploring the climate of Proxima b with the Met Office Unified Model, Astron. Astrophys., 601, A120, https://doi.org/10.1051/0004-6361/201630020, 2017. a
Braam, M., Palmer, P. I., Decin, L., Ridgway, R. J., Zamyatina, M., Mayne, N. J., Sergeev, D. E., and Abraham, N. L.: Lightning-induced chemistry on tidally-locked Earth-like exoplanets, Mon. Notic. Roy. Astron. Soc., 517, 2383–2402, https://doi.org/10.1093/mnras/stac2722, 2022. a, b, c
Braam, M., Palmer, P. I., Decin, L., Mayne, N. J., Manners, J., and Rugheimer, S.: Earth-like exoplanets in spin-orbit resonances: climate dynamics, 3D atmospheric chemistry, and observational signatures, arXiv [preprint], arXiv:2410.19108, https://doi.org/10.3847/PSJ/ad9565, 2024. a
Brion, J., Chakir, A., Charbonnier, J., Daumont, D., Parisse, C., and Malicet, J.: Absorption spectra measurements for the ozone molecule in the 350–830 nm region, J. Atmos. Chem., 30, 291–299, https://doi.org/10.1023/A:1006036924364, 1998. a, b
Burkholder, J., Sander, S., Abbatt, J., Barker, J., Cappa, C., Crounse, J., Dibble, T., Huie, R., Kolb, C., and Kurylo, M.: Chemical Kinetics and Photochemical Data for Use in Atmospheric Studies; Evaluation Number 19, Tech. rep., JPL Publication 19-5, Jet Propulsion Laboratory, Pasadena, http://jpldataeval.jpl.nasa.gov (last access: 3 August 2025), 2020. a, b, c, d, e, f, g, h, i, j, k, l, m, n, o, p, q, r, s, t, u, v, w, x, y, z, aa, ab, ac, ad, ae, af, ag, ah, ai, aj, ak, al
Burkholder, J. B., Talukdar, R. K., Ravishankara, A., and Solomon, S.: Temperature dependence of the HNO3 UV absorption cross sections, J. Geophys. Res.-Atmos., 98, 22937–22948, https://doi.org/10.1029/93JD02178, 1993. a, b, c, d
Burrows, J. P., Richter, A., Dehn, A., Deters, B., Himmelmann, S., Voigt, S., and Orphal, J.: Atmospheric remote-sensing reference data from GOME–2. Temperature-dependent absorption cross sections of O3 in the 231–794 nm range, J. Quant. Spectrosc. Ra., 61, 509–517, https://doi.org/10.1016/S0022-4073(98)00037-5, 1999. a
Chan, W., Cooper, G., and Brion, C.: The electronic spectrum of water in the discrete and continuum regions. Absolute optical oscillator strengths for photoabsorption (6–200 eV), Chem. Phys., 178, 387–400, https://doi.org/10.1016/0301-0104(93)85078-M, 1993. a
Chan, W., Cooper, G., and Brion, C.: Discrete and continuum photoabsorption oscillator strengths for the electronic spectrum of nitrous oxide (5.5–203 eV), Chem. Phys., 180, 77–88, https://doi.org/10.1016/0301-0104(93)E0386-A, 1994. a
Chang, W., Cooper, G., and Brion, C.: Absolute optical oscillator strengths for the photoabsorption of nitric oxide (5–30 eV) at high resolution, Chem. Phys., 170, 111–121, https://doi.org/10.1016/0301-0104(93)80097-S, 1993. a
Chen, H., Wolf, E. T., Zhan, Z., and Horton, D. E.: Habitability and spectroscopic observability of warm M-dwarf exoplanets evaluated with a 3D chemistry-climate model, Astrophys. J., 886, 16, https://doi.org/10.3847/1538-4357/ab4f7e, 2019. a
Chipperfield, M., Kinnison, D., Eyring, V., Shepherd, T., and Waugh, D.: CCMVal-2 report on the evaluation of chemistry-climate models – Chapter 6, Stratospheric Chemistry, SPARC Report on the Evaluation of Chemistry-Climate Models, https://aparc-climate.org/publications/sparc-report-no-5/ (last access: 3 August 2025), 2010. a, b, c, d, e, f
Chipperfield, M., Liang, Q., Engel, A., Newman, P., Ko, M., Reimann, S., Strahan, S., Atlas, E., Burkholder, J., and Plumb, R.: SPARC, 2013: SPARC Report on the Lifetimes of Stratospheric Ozone-Deleting Substances, Their Replacements, and Related Species – Chapter 5: Model Estimates of Lifetimes, WCRP-15, 6 pp., https://aparc-climate.org/publications/sparc-report-no-6/ (last access: 9 August 2025), 2013. a
Christie, D., Mayne, N., Gillard, R., Manners, J., Hébrard, E., Lines, S., and Kohary, K.: The impact of phase equilibrium cloud models on GCM simulations of GJ 1214b, Mon. Notic. Roy. Astron. Soc., 517, 1407–1421, https://doi.org/10.1093/mnras/stac2763, 2022. a
Cook, G. R., Metzger, P. H., and Ogawa, M.: Photoionization and Absorption Coefficients of N2O, J. Opt. Soc. Am., 58, 129–136, https://doi.org/10.1364/JOSA.58.000129, 1968. a
Cooke, G., Marsh, D., Walsh, C., and Youngblood, A.: Degenerate Interpretations of O3 Spectral Features in Exoplanet Atmosphere Observations Due to Stellar UV Uncertainties: A 3D Case Study with TRAPPIST-1 e, Astrophys. J., 959, 45, https://doi.org/10.3847/1538-4357/ad0381, 2023. a
Cooper, G., Anderson, J. E., and Brion, C.: Absolute photoabsorption and photoionization of formaldehyde in the VUV and soft X-ray regions (3–200 eV), Chemi. Phys., 209, 61–77, https://doi.org/10.1016/0301-0104(96)00079-1, 1996. a
Drummond, B., Tremblin, P., Baraffe, I., Amundsen, D. S., Mayne, N. J., Venot, O., and Goyal, J.: The effects of consistent chemical kinetics calculations on the pressure-temperature profiles and emission spectra of hot Jupiters, Astron. Astrophys., 594, A69, https://doi.org/10.1051/0004-6361/201628799, 2016. a
Eager-Nash, J. K., Mayne, N. J., Nicholson, A. E., Prins, J. E., Young, O. C., Daines, S. J., Sergeev, D. E., Lambert, F. H., Manners, J., Boutle, I. A., Wolf, E. T., Kamp, I. E., Kohary, K., and Lenton, T. M.: 3D climate simulations of the Archean find that methane has a strong cooling effect at high concentrations, J. Geophys. Res.-Atmos., 128, e2022JD037544, https://doi.org/10.1029/2022JD037544, 2023. a, b
Eager-Nash, J. K., Daines, S. J., McDermott, J. W., Andrews, P., Grain, L. A., Bishop, J., Rogers, A. A., Smith, J. W. G., Khalek, C., Boxer, T. J., Mak, M. T., Ridgway, R. J., Hébrard, E., Lambert, F. H., Lenton, T. M., and Mayne, N. J.: Simulating biosignatures from pre-oxygen photosynthesizing life on TRAPPIST-1e, Mon. Notic. Roy. Astron. Soc., 531, 468–494, https://doi.org/10.1093/mnras/stae1142, 2024. a, b
Edwards, J. and Slingo, A.: Studies with a flexible new radiation code. I: Choosing a configuration for a large-scale model, Q. J. Roy. Meteorol. Soc., 122, 689–719, https://doi.org/10.1002/qj.49712253107, 1996. a
Fally, S., Vandaele, A. C., Carleer, M., Hermans, C., Jenouvrier, A., Mérienne, M.-F., Coquart, B., and Colin, R.: Fourier transform spectroscopy of the O2 Herzberg bands. III. Absorption cross sections of the collision-induced bands and of the Herzberg continuum, J. Molec. Spectrosc., 204, 10–20, https://doi.org/10.1006/jmsp.2000.8204, 2000. a
Fennelly, J. and Torr, D.: Photoionization and photoabsorption cross sections of O, N2, O2, and N for aeronomic calculations, Atom. Data Nucl. Data Tabl., 51, 321–363, https://doi.org/10.1016/0092-640X(92)90004-2, 1992. a, b, c
Fillion, J.-H., Ruiz, J., Yang, X.-F., Castillejo, M., Rostas, F., and Lemaire, J.-L.: High resolution photoabsorption and photofragment fluorescence spectroscopy of water between 10.9 and 12 eV, J. Chem. Phys., 120, 6531–6541, https://doi.org/10.1063/1.1652566, 2004. a
France, K., Loyd, R. P., Youngblood, A., Brown, A., Schneider, P. C., Hawley, S. L., Froning, C. S., Linsky, J. L., Roberge, A., Buccino, A. P., Davenport, J. R., Fontenla, J. M., Kaltenegger, L., Kowalski, A. F., Mauas, P. J., Miguel, Y., Redfield, S., Rugheimer, S., Tian, F., Vieytes, M. C., Walkowicz, L. M., and Weisenburger, K. L.: The MUSCLES treasury survey. I. Motivation and overview, Astrophys. J., 820, 89, https://doi.org/10.3847/0004-637X/820/2/89, 2016. a, b
Gierczak, T., Burkholder, J. B., Bauerle, S., and Ravishankara, A.: Photochemistry of acetone under tropospheric conditions, Chem. Phys., 231, 229–244, https://doi.org/10.1016/S0301-0104(98)00006-8, 1998. a
Gordon, I. E., Rothman, L. S., Hargreaves, R., Hashemi, R., Karlovets, E. V., Skinner, F., Conway, E. K., Hill, C., Kochanov, R. V., and Tan, Y.: The HITRAN2020 molecular spectroscopic database, J. Quant. Spectrosc. Ra., 277, 107949, https://doi.org/10.1016/j.jqsrt.2021.107949, 2022. a, b, c, d
Harwood, M., Jones, R., Cox, R., Lutman, E., and Rattigan, O.: Temperature-dependent absorption cross-sections of N2O5, J. Photochem. Photobiol. A, 73, 167–175, https://doi.org/10.1016/1010-6030(93)90001-2, 1993. a, b
Harwood, M. H., Burkholder, J. B., and Ravishankara, A.: Photodissociation of BrONO2 and N2O5: Quantum yields for NO3 production at 248, 308, and 352.5 nm, J. Phys. Chem. A, 102, 1309–1317, https://doi.org/10.1021/jp9729829, 1998. a
Henke, B. L., Gullikson, E. M., and Davis, J. C.: X-ray interactions: photoabsorption, scattering, transmission, and reflection at E=50–30,000 eV, Z=1–92, Atom. Data Nucl. Data Tabl., 54, 181–342, https://doi.org/10.1006/adnd.1993.1013, 1993. a
Hubrich, C. and Stuhl, F.: The ultraviolet absorption of some halogenated methanes and ethanes of atmospheric interest, J. Photochem., 12, 93–107, https://doi.org/10.1016/0047-2670(80)85031-3, 1980. a, b
Iida, Y., Carnovale, F., Daviel, S., and Brion, C.: Absolute oscillator strengths for photoabsorption and the molecular and dissociative photoionization of nitric oxide, Chem. Phys., 105, 211–225, https://doi.org/10.1016/0301-0104(86)80070-2, 1986. a
Jackson, D. R., Bruinsma, S., Negrin, S., Stolle, C., Budd, C. J., Gonzalez, R. D., Down, E., Griffin, D. J., Griffith, M. J., Kervalishvili, G., Lubián Arenillas, D., Manners, J., Matzka, J., Shprits, Y. Y., Vasile, R., and Zhelavskaya, I. S.: The space weather atmosphere models and indices (SWAMI) project: Overview and first results, J. Space Weather Space Clim., 10, 18, https://doi.org/10.1051/swsc/2020019, 2020. a, b
Kahan, T. F., Washenfelder, R. A., Vaida, V., and Brown, S. S.: Cavity-Enhanced Measurements of Hydrogen Peroxide Absorption Cross Sections from 353 to 410 nm, J. Phys. Chem. A, 116, 5941–5947, https://doi.org/10.1021/jp2104616, 2012. a, b
Keller-Rudek, H., Moortgat, G. K., Sander, R., and Sörensen, R.: The MPI-Mainz UV/VIS spectral atlas of gaseous molecules of atmospheric interest, Earth Syst. Sci. Data, 5, 365–373, https://doi.org/10.5194/essd-5-365-2013, 2013. a, b, c, d
Kenner, R., Rohrer, F., and Stuhl, F.: OH (A) production in the 193-nm photolysis of HONO, J. Phys. Chem., 90, https://doi.org/10.1021/j100403a015, 1986. a
Lacoursiere, J., Meyer, S., Faris, G., Slanger, T., Lewis, B., and Gibson, S.: The O (1D) yield from O2 photodissociation near H Lyman-α (121.6 nm), J. Chem. Phys., 110, 1949–1958, https://doi.org/10.1063/1.477852, 1999. a, b
Linsky, J. L. and Redfield, S.: Inferring Intrinsic Stellar EUV and Lyman-Alpha Fluxes and Their Effects on Exoplanet Atmospheres, Space Sci. Rev., 220, 32, https://doi.org/10.1007/s11214-024-01064-3, 2024. a
Loyd, R. P., France, K., Youngblood, A., Schneider, C., Brown, A., Hu, R., Linsky, J., Froning, C. S., Redfield, S., Rugheimer, S., and Tian, F.: The MUSCLES Treasury Survey. III. X-ray to infrared spectra of 11 M and K stars hosting planets, Astrophys. J., 824, 102, https://doi.org/10.3847/0004-637X/824/2/102, 2016. a, b
Lu, H.-C., Chen, H.-K., Chen, H.-F., Cheng, B.-M., and Ogilvie, J.: Absorption cross section of molecular oxygen in the transition at 38 K, Astron. Astrophys., 520, A19, https://doi.org/10.1051/0004-6361/201013998, 2010. a, b, c
Mak, M., Mayne, N., Sergeev, D., Manners, J., Eager-Nash, J., Arney, G., Hébrard, E., and Kohary, K.: 3D simulations of the Archean Earth including photochemical haze profiles, J. Geophys. Res.-Atmos., 128, e2023JD039343, https://doi.org/10.1029/2023JD039343, 2023. a, b, c
Mak, M. T., Sergeev, D. E., Mayne, N., Banks, N., Eager-Nash, J., Manners, J., Arney, G., Hébrard, É., and Kohary, K.: 3D simulations of TRAPPIST-1e with varying CO2, CH4, and haze profiles, Mon. Notic. Roy. Astron. Soc., 529, 3971–3987, https://doi.org/10.1093/mnras/stae741, 2024. a
Malicet, J., Daumont, D., Charbonnier, J., Parisse, C., Chakir, A., and Brion, J.: Ozone UV spectroscopy. II. Absorption cross-sections and temperature dependence, J. Atmos. Chem., 21, 263–273, https://doi.org/10.1007/BF00696758, 1995. a
Manners, J.: A fast and flexible scheme for photolysis and radiative heating of the whole atmosphere, in: AIP Conference Proceedings, vol. 2988, AIP Publishing, https://doi.org/10.1063/5.0185476, 2024. a, b, c
Manners, J., Edwards, J. M., Hill, P., and Thelen, J.-C.: Socrates Technical Guide: Suite Of Community RAdiative Transfer codes based on Edwards and Slingo, Tech. rep., Met Office, Exeter, UK, https://github.com/MetOffice/socrates/releases/download/um13.7/socrates_techguide.pdf (last access: 18 July 2025), 2024. a
Mason, N., Gingell, J., Davies, J., Zhao, H., Walker, I., and Siggel, M.: VUV optical absorption and electron energy-loss spectroscopy of ozone, J. Phys. B, 29, 3075, https://doi.org/10.1088/0953-4075/29/14/019, 1996. a
Matsumi, Y., Comes, F., Hancock, G., Hofzumahaus, A., Hynes, A., Kawasaki, M., and Ravishankara, A.: Quantum yields for production of O (1D) in the ultraviolet photolysis of ozone: Recommendation based on evaluation of laboratory data, J. Geophys. Res.-Atmos., 107, ACH-1, https://doi.org/10.1029/2001JD000510, 2002. a, b, c
Matsunaga, F. and Watanabe, K.: Total and photoionization coefficients and dissociation continua of O2 in the 580–1070 Åregion, Sci. Light, 16, 31–42, 1967. a
Matthes, K., Funke, B., Andersson, M. E., Barnard, L., Beer, J., Charbonneau, P., Clilverd, M. A., Dudok de Wit, T., Haberreiter, M., Hendry, A., Jackman, C. H., Kretzschmar, M., Kruschke, T., Kunze, M., Langematz, U., Marsh, D. R., Mayock, A. C., Misios, S., Rodger, C. J., Scaife, A. A., Seppälä, A., Shangguan, M., Sinnhuber, M., Tourpali, K., Usoskin, I., van de Kamp, M., Verronen, P. T., and Versick, S.: Solar forcing for CMIP6 (v3.2), Geosci. Model Dev., 10, 2247–2302, https://doi.org/10.5194/gmd-10-2247-2017, 2017. a
Mayor, E., Velasco, A., and Martin, I.: Photodissociation of the δ(0,0) and δ(1,0) bands of nitric oxide in the stratosphere and the mesosphere: A molecular-adapted quantum defect orbital calculation of photolysis rate constants, J. Geophys. Res.-Atmos., 112, https://doi.org/10.1029/2007JD008643, 2007. a
McCulloch, D., Sergeev, D. E., Mayne, N., Bate, M., Manners, J., Boutle, I., Drummond, B., and Kohary, K.: A modern-day Mars climate in the Met Office Unified Model: dry simulations, Geosci. Model Dev., 16, 621–657, https://doi.org/10.5194/gmd-16-621-2023, 2023. a
Meller, R. and Moortgat, G. K.: Temperature dependence of the absorption cross sections of formaldehyde between 223 and 323 K in the wavelength range 225–375 nm, J. Geophys. Res.-Atmos., 105, 7089–7101, https://doi.org/10.1029/1999JD901074, 2000. a
Merienne, M., Jenouvrier, A., and Coquart, B.: The NO2 absorption spectrum. I: Absorption cross-sections at ambient temperature in the 300–500 nm region, J. Atmos. Chem., 20, 281–297, https://doi.org/10.1007/BF00694498, 1995. a
Molina, L. and Molina, M.: Absolute absorption cross sections of ozone in the 185-to 350-nm wavelength range, J. Geophys. Res.-Atmos., 91, 14501–14508, https://doi.org/10.1029/JD091iD13p14501, 1986. a
Mota, R., Parafita, R., Giuliani, A., Hubin-Franskin, M.-J., Lourenco, J., Garcia, G., Hoffmann, S., Mason, N., Ribeiro, P., Raposo, M., and Limão-Vieira, P.: Water VUV electronic state spectroscopy by synchrotron radiation, Chem. Phys. Lett., 416, 152–159, https://doi.org/10.1016/j.cplett.2005.09.073, 2005. a
Mynard, A., Kent, J., Smith, E. R., Wilson, A., Wivell, K., Nelson, N., Hort, M., Bowles, J., Tiddeman, D., Langridge, J. M., Drummond, B., and Steven, A. J.: Long-term airborne measurements of pollutants over the United Kingdom to support air quality model development and evaluation, Atmos. Meas. Tech., 16, 4229–4261, https://doi.org/10.5194/amt-16-4229-2023, 2023. a
Nee, J. B., Yang, J. C., Lee, P. C., Wang, X. Y., and Kuo, C. T.: Photoabsorption cross sections of N2O in 100–220 nm, Chinese J. Phys., 172–180, https://doi.org/10.6122/CJP, 1999. a
Neu, J. L., Prather, M. J., and Penner, J. E.: Global atmospheric chemistry: Integrating over fractional cloud cover, J. Geophys. Res.-Atmos., 112, https://doi.org/10.1029/2006JD008007, 2007. a, b
Ni, Q., Hill, C., Yurchenko, S., Pezzella, M., Fateev, A., Qin, Z., Venot, O., and Tennyson, J.: ExoPhoto: A database of temperature dependent photodissociation cross sections, RAS Tech. Instr., https://doi.org/10.1093/rasti/rzaf020, 2025. a
Nicovich, J. M. and Wine, P. H.: Temperature-dependent absorption cross sections for hydrogen peroxide vapor, J. Geophys. Res.-Atmos., 93, 2417–2421, https://doi.org/10.1029/JD093iD03p02417, 1988. a, b
Ogawa, S. and Ogawa, M.: Absorption Cross Sections of O2 (a1Δg) and O2 (X3Σg−) in the Region from 1087 to 1700 Å, Can. J. Phys., 53, 1845–1852, https://doi.org/10.1139/p75-236, 1975. a
Osborne, B. A., Marston, G., Kaminski, L., Jones, N. C., Gingell, J. M., Mason, N., Walker, I. C., Delwiche, J., and Hubin-Franskin, M.-J.: Vacuum ultraviolet spectrum of dinitrogen pentoxide, J. Quant. Spectrosc. Ra., 64, 67–74, https://doi.org/10.1016/S0022-4073(99)00104-1, 2000. a, b
Pincus, R., Buehler, S. A., Brath, M., Crevoisier, C., Jamil, O., Franklin Evans, K., Manners, J., Menzel, R. L., Mlawer, E. J., Paynter, D., Pernak, R. L., and Tellier, Y.: Benchmark calculations of radiative forcing by greenhouse gases, J. Geophys. Res.-Atmos., 125, e2020JD033483, https://doi.org/10.1029/2020JD033483, 2020. a
Prather, M.: Solution of the inhomogeneous Rayleigh scattering atmosphere, Astrophys. J., 192, 787, https://doi.org/10.1086/153117, 1974. a, b
Rabalais, J. W., McDonald, J. M., Scherr, V., and McGlynn, S. P.: Electronic spectroscopy of isoelectronic molecules. II. Linear triatomic groupings containing sixteen valence electrons, Chem. Rev., 73–108, https://doi.org/10.1021/cr60269a004, 1971. a
Ranjan, S., Wordsworth, R., and Sasselov, D. D.: The surface UV environment on planets orbiting M dwarfs: implications for prebiotic chemistry and the need for experimental follow-up, Astrophys. J., 843, 110, https://doi.org/10.3847/1538-4357/aa773e, 2017. a
Ranjan, S., Schwieterman, E. W., Harman, C., Fateev, A., Sousa-Silva, C., Seager, S., and Hu, R.: Photochemistry of anoxic abiotic habitable planet atmospheres: impact of new H2O cross sections, Astrophys. J., 896, 148, https://doi.org/10.3847/1538-4357/ab9363, 2020. a
Ribas, I., Gregg, M. D., Boyajian, T. S., and Bolmont, E.: The full spectral radiative properties of Proxima Centauri, Astron. Astrophys., 603, A58, https://doi.org/10.1063/5.0185476, 2017. a, b
Ridgway, R. J.: Simulating the impact of stellar flares on the climate and habitability of terrestrial Earth-like exoplanets, University of Exeter, Exeter, UK, https://doi.org/10.1093/mnras/stac3105, 2023. a, b, c, d, e, f, g, h, i
Rimmer, P. B., Xu, J., Thompson, S. J., Gillen, E., Sutherland, J. D., and Queloz, D.: The origin of RNA precursors on exoplanets, Sci. Adv., 4, eaar3302, https://doi.org/10.1126/sciadv.aar3302, 2018. a
Rimmer, P. B., Thompson, S. J., Xu, J., Russell, D. A., Green, N. J., Ritson, D. J., Sutherland, J. D., and Queloz, D. P.: Timescales for prebiotic photochemistry under realistic surface ultraviolet conditions, Astrobiology, 21, 1099–1120, https://doi.org/10.1089/ast.2020.2335, 2021. a
Sander, S., Friedl, R., Golden, D., Kurylo, M., Moortgat, G., Wine, P., Ravishankara, A., Kolb, C., Molina, M., and Finlayson-Pitts, B.: Chemical Kinetics and Photochemical Data for Use in Atmospheric Studies; Evaluation Number 15, Tech. rep., JPL Publication 06-2, Jet Propulsion Laboratory, Pasadena, http://jpldataeval.jpl.nasa.gov (last access: 24 July 2025), 2006. a
Sander, S., Abbatt, J., Barker, J., Burkholder, J., Friedl, R., Golden, D., Huie, R., Kolb, C., Kurylo, M., Moortgat, G., Orkin, V., and Wine, P.: Chemical Kinetics and Photochemical Data for Use in Atmospheric Studies; Evaluation Number 17, Tech. rep., JPL Publication 10-6, Jet Propulsion Laboratory, Pasadena, http://jpldataeval.jpl.nasa.gov (last access: 1 August 2025), 2011. a
Sander, S. P.: Temperature dependence of the nitrogen trioxide absorption spectrum, J. Phys. Chem., 90, 4135–4142, https://doi.org/10.1021/j100408a060, 1986. a
Savage, N., Agnew, P., Davis, L., Ordóñez, C., Thorpe, R., Johnson, C., O'Connor, F., and Dalvi, M.: Air quality modelling using the Met Office Unified Model (AQUM OS24-26): model description and initial evaluation, Geosci. Model Dev., 6, 353–372, https://doi.org/10.5194/gmd-6-353-2013, 2013. a
Selwyn, G., Podolske, J., and Johnston, H. S.: Nitrous oxide ultraviolet absorption spectrum at stratospheric temperatures, Geophys. Res. Lett., 4, 427–430, https://doi.org/10.1029/GL004i010p00427, 1977. a, b
Serdyuchenko, A., Gorshelev, V., Weber, M., and Burrow, J. P.: New broadband high-resolution ozone absorption cross-sections, Spectroscopy Europe, 23, 14, https://www.spectroscopyworld.com/article/new-broadband-high-resolution-ozone-absorption-cross-sections (last access: 17 July 2025), 2011. a, b
Showman, A. P. and Guillot, T.: Atmospheric Circulation and Tides of “51Peg b-like” Planets, arXiv [preprint], https://doi.org/10.48550/arXiv.astro-ph/0202236, 2002. a
Solomon, S. C. and Qian, L.: Solar extreme-ultraviolet irradiance for general circulation models, J. Geophys. Res.-Space, 110, https://doi.org/10.1029/2005JA011160, 2005. a, b, c, d
Stutz, J., Kim, E., Platt, U., Bruno, P., Perrino, C., and Febo, A.: UV-visible absorption cross sections of nitrous acid, J. Geophys. Res.-Atmos., 105, 14585–14592, https://doi.org/10.1029/2000JD900003, 2000. a, b, c
Suto, M. and Lee, L.: OH() yield from photodissociation of H2O2 at 106–193 nm, Chem. Phys. Lett., 98, 152–156, https://doi.org/10.1016/0009-2614(83)87118-8, 1983. a, b
Suto, M. and Lee, L.: Photoabsorption and photodissociation of HONO2 in the 105–220 nm region, J. Chem. Phys., 81, 1294–1297, https://doi.org/10.1063/1.447816, 1984. a
Suto, M., Wang, X., and Lee, L.: Fluorescence from VUV excitation of formaldehyde, J. Chem. Phys., 85, 4228–4233, https://doi.org/10.1063/1.451793, 1986. a
Talukdar, R., Burkholder, J., Gilles, M., Roberts, J., and Ravishankara, A. R.: Atmospheric fate of several alkyl nitrates Part 2UV absorption cross-sections and photodissociation quantum yields, J. Chem. Soc., Faraday Transact., 93, 2797–2805, https://doi.org/10.1039/A701781B, 1997. a
Talukdar, R. K., Burkholder, J. B., Schmoltner, A.-M., Roberts, J. M., Wilson, R. R., and Ravishankara, A.: Investigation of the loss processes for peroxyacetyl nitrate in the atmosphere: UV photolysis and reaction with OH, J. Geophys. Res.-Atmos., 100, 14163–14173, https://doi.org/10.1029/95JD00545, 1995. a
Taylor, W., Allston, T., Moscato, M., Fazekas, G., Kozlowski, R., and Takacs, G.: Atmospheric photodissociation lifetimes for nitromethane, methyl nitrite, and methyl nitrate, Int. J. Chem. Kinet., 12, 231–240, https://doi.org/10.1002/kin.550120404, 1980. a
Telford, P., Abraham, N., Archibald, A., Braesicke, P., Dalvi, M., Morgenstern, O., O'Connor, F., Richards, N., and Pyle, J.: Implementation of the Fast-JX Photolysis scheme (v6.4) into the UKCA component of the MetUM chemistry-climate model (v7.3), Geosci. Model Dev., 6, 161–177, https://doi.org/10.5194/gmd-6-161-2013, 2013. a
Tennyson, J., Yurchenko, S. N., Al-Refaie, A. F., Barton, E. J., Chubb, K. L., Coles, P. A., Diamantopoulou, S., Gorman, M. N., Hill, C., Lam, A. Z., Lodi, L., McKemmish, L. K., Yueqi, N., Owens, A., Polyanski, O. L., Rivlin, T., Sousa-Silva, C., Underwood, D. S., Yachmenev, A., and Zak, E.: The ExoMol database: Molecular line lists for exoplanet and other hot atmospheres, J. Molec. Spectrosc., 327, 73–94, https://doi.org/10.1016/j.jms.2016.05.002, 2016. a, b, c
Tuomi, M., Jones, H. R. A., Butler, R. P., Arriagada, P., Vogt, S. S., Burt, J., Laughlin, G., Holden, B., Shectman, S. A., Crane, J. D., Thompson, I., Keiser, S., Jenkins, J. S., Berdiñas, Z., Diaz, M., Kiraga, M., and Barnes, J. R.: Frequency of planets orbiting M dwarfs in the Solar neighbourhood, arXiv [preprint], arXiv:1906.04644, https://doi.org/10.48550/arXiv.1906.04644, 2019. a
Vandaele, A. C., Hermans, C., Simon, P. C., Carleer, M., Colin, R., Fally, S., Merienne, M.-F., Jenouvrier, A., and Coquart, B.: Measurements of the NO2 absorption cross-section from 42 000 cm−1 to 10 000 cm−1 (238–1000 nm) at 220 K and 294 K, J. Quant. Spectrosc. Ra., 59, 171–184, https://doi.org/10.1016/S0022-4073(97)00168-4, 1998. a, b
Venot, O., Hébrard, E., Agúndez, M., Dobrijevic, M., Selsis, F., Hersant, F., Iro, N., and Bounaceur, R.: A chemical model for the atmosphere of hot Jupiters, Astron. Astrophys., 546, A43, https://doi.org/10.1051/0004-6361/201219310, 2012. a, b, c, d, e, f, g
Venot, O., Bénilan, Y., Fray, N., Gazeau, M.-C., Lefèvre, F., Es-sebbar, E., Hébrard, E., Schwell, M., Bahrini, C., Montmessin, F., Lefèvre, M., and Waldman, I. P.: VUV-absorption cross section of carbon dioxide from 150 to 800 K and applications to warm exoplanetary atmospheres, Astron. Astrophys., 609, A34, https://doi.org/10.1051/0004-6361/201731295, 2018. a
Walters, D., Baran, A. J., Boutle, I., Brooks, M., Earnshaw, P., Edwards, J., Furtado, K., Hill, P., Lock, A., Manners, J., Morcrette, C., Mulcahy, J., Sanchez, C., Smith, C., Stratton, R., Tennant, W., Tomassini, L., Van Weverberg, K., Vosper, S., Willet, M., Browse, J., Bushell, A., Carslaw, K., Dalvi, M., Essery, R., Gedney, N., Hardiman, S., Johnson, B., Johnson, C., Jones, A., Mann, G., Milton, S., Rumbold, H., Sellar, A., Ujiie, M., Whitall, M., Williams, K., and Zerroukat, M.: The Met Office Unified Model global atmosphere 7.0/7.1 and JULES global land 7.0 configurations, Geosci. Model Dev., 12, 1909–1963, https://doi.org/10.5194/gmd-12-1909-2019, 2019. a
Watanabe, K. and Marmo, F.: Photoionization and total absorption cross section of gases. II. O2 and N2 in the region 850–1500 A, J. Chem. Phys., 25, 965–971, https://doi.org/10.1063/1.1743151, 1956. a
Wild, O. and Prather, M. J.: Excitation of the primary tropospheric chemical mode in a global three-dimensional model, J. Geophys. Res.-Atmos., 105, 24647–24660, https://doi.org/10.1029/2000JD900399, 2000. a, b, c, d
Wilson, D. J., Froning, C. S., Duvvuri, G. M., Youngblood, A., France, K., Brown, A., Schneider, P. C., Berta-Thompson, Z., Buccino, A. P., Linsky, J., Parke Loyd, R. O., Miguel, Y., Newton, E., Pineda, S., Redfield, S., Roberge, A., Rugheimer, S., and Vieyte, M. C.: The Mega-MUSCLES Treasury Survey: X-ray to infrared Spectral Energy Distributions of a representative sample of M dwarfs, Astrophys. J., 978, 85, https://doi.org/10.3847/1538-4357/ad9251, 2024. a
Wong, A., Yurchenko, S. N., Bernath, P., Müller, H. S., McConkey, S., and Tennyson, J.: Exomol line list – XXI. Nitric oxide (NO), Mon. Notic. Roy. Astron. Soc., 470, 882–897, https://doi.org/10.1093/mnras/stx1211, 2017. a, b
Yao, F., Wilson, I., and Johnston, H.: Temperature-dependent ultraviolet absorption spectrum for dinitrogen pentoxide, J. Phys. Chem., 86, 3611–3615, https://doi.org/10.1021/j100215a023, 1982. a
Yates, J. S., Palmer, P. I., Manners, J., Boutle, I., Kohary, K., Mayne, N., and Abraham, L.: Ozone chemistry on tidally locked M dwarf planets, Mon. Notic. Roy. Astron. Soc., 492, 1691–1705, https://doi.org/10.1093/mnras/stz3520, 2020. a
Yoshino, K., Esmond, J., Cheung, A.-C., Freeman, D., and Parkinson, W.: High resolution absorption cross sections in the transmission window region of the Schumann-Runge bands and Herzberg continuum of O2, Planet. Space Sci., 40, 185–192, https://doi.org/10.1016/0032-0633(92)90056-T, 1992. a, b, c
Youngblood, A., France, K., Loyd, R. P., Linsky, J. L., Redfield, S., Schneider, P. C., Wood, B. E., Brown, A., Froning, C., Miguel, Y., Rugheimer, S., and Walkowicz, L.: The MUSCLES Treasury Survey. II. Intrinsic Lyα and extreme ultraviolet spectra of K and M dwarfs with exoplanets, Astrophys. J., 824, 101, https://doi.org/10.3847/0004-637X/824/2/101, 2016. a, b
Zamyatina, M., Christie, D. A., Hébrard, E., Mayne, N. J., Radica, M., Taylor, J., Baskett, H., Moore, B., Lils, C., Sergeev, D. E., Ahrer, E.-M., Manners, J., Kohary, K., and Feinstein, A. D.: Quenching-driven equatorial depletion and limb asymmetries in hot Jupiter atmospheres: WASP-96b example, Mon. Notic. Roy. Astron. Soc., stae600, https://doi.org/10.1093/mnras/stae600, 2024. a, b
Zelikoff, M., Watanabe, K., and Inn, E. C. Y.: Absorption Coefficients of Gases in the Vacuum Ultraviolet. Part II. Nitrous Oxide, J. Chem. Phys., 21, 1643–1647, https://doi.org/10.1063/1.1698636, 1953. a, b
Data provided by Martyn Chipperfield and retrieved from https://homepages.see.leeds.ac.uk/~lecmc/sparcj (last access: 27 July 2025).
Retrieved from the accompanying notes/directories from https://homepages.see.leeds.ac.uk/~lecmc/sparcj (last access: 27 July 2025) (Chipperfield et al., 2010)
Taken from the Community Coordinated Modeling Center VITMO ModelWeb Browser Results, MSISE-90 model listing database.