the Creative Commons Attribution 4.0 License.
the Creative Commons Attribution 4.0 License.
 | 22 Feb 2024
New model ensemble reveals how forcing uncertainty and model structure alter climate simulated across CMIP generations of the Community Earth System Model
Marika M. Holland
Cecile Hannay
John Fasullo
Alexandra Jahn
Jennifer E. Kay
Michael Mills
Isla R. Simpson
William Wieder
Peter Lawrence
Erik Kluzek
David Bailey
Climate simulation uncertainties arise from internal variability, model structure, and external forcings. Model intercomparisons (such as the Coupled Model Intercomparison Project; CMIP) and single-model large ensembles have provided insight into uncertainty sources. Under the Community Earth System Model (CESM) project, large ensembles have been performed for CESM2 (a CMIP6-era model) and CESM1 (a CMIP5-era model). We refer to these as CESM2-LE and CESM1-LE. The external forcing used in these simulations has changed to be consistent with their CMIP generation. As a result, differences between CESM2-LE and CESM1-LE ensemble means arise from changes in both model structure and forcing. Here we present new ensemble simulations which allow us to separate the influences of these model structural and forcing differences. Our new CESM2 simulations are run with CMIP5 forcings equivalent to those used in the CESM1-LE. We find a strong influence of historical forcing uncertainty due to aerosol effects on simulated climate. For the historical period, forcing drives reduced global warming and ocean heat uptake in CESM2-LE relative to CESM1-LE that is counteracted by the influence of model structure. The influence of the model structure and forcing vary across the globe, and the Arctic exhibits a distinct signal that contrasts with the global mean. For the 21st century, the importance of scenario forcing differences (SSP3–7.0 for CESM2-LE and RCP8.5 for CESM1-LE) is evident. The new simulations presented here allow us to diagnose the influence of model structure on 21st century change, despite large scenario forcing differences, revealing that differences in the meridional distribution of warming are caused by model structure. Feedback analysis reveals that clouds and their impact on shortwave radiation explain many of these structural differences between CESM2 and CESM1. In the Arctic, albedo changes control transient climate evolution differences due to structural differences between CESM2 and CESM1.
- Article
(7472 KB) - Full-text XML
-
Supplement
(819 KB) - BibTeX
- EndNote


Model intercomparison projects such as the Coupled Model Intercomparison Project (CMIP; Eyring et al., 2016) have enabled considerable advances in our understanding of the climate system. Central to CMIP is the adoption of the same external forcing by multiple modeling centers. For historical and future simulations, this includes both natural (volcanic and solar) and anthropogenic (greenhouse gas, ozone, sulfate aerosol, and carbon aerosol) forcings. The availability of coordinated simulations from different centers run with the same external forcing allows for the quantification of model structural uncertainty, the inter-model contrast that arises from differences in resolution, physical parameterizations, and other specified or emergent model attributes. The advantage of using the same external forcing in model experiments is also relevant for coordinated projects outside of CMIP. For example, comparing the recent publicly available single-model large ensembles (Deser et al., 2020) enables the separation of model structure and internal variability uncertainty. This separation cannot be accurately done from CMIP simulations alone because of typically small-ensemble sizes from individual models. Single-model large ensembles of historical conditions also enable comparison to the observed record within the context of internal variability. While the broad use of common external forcing is important, inherent in the assessment of climate simulation fidelity with observations is that the applied historical external forcings are credible.
While CMIP has enabled consistent historical external forcing to be applied across independently developed models, the influence of forcing uncertainty about historical climate simulations can be considerable, especially for aerosols (e.g., Wang et al., 2021). For example, recent work using the Community Earth System Model 2 (CESM2) has shown that uncertainties in biomass burning emissions affect historical warming (Fasullo et al., 2022), Arctic sea ice loss (DeRepentigny et al., 2022), and the hydrologic cycle (Heyblom et al., 2022). These studies found that interannual variability in the prescribed biomass burning emissions affect climate through nonlinear cloud–aerosol interactions. The interannual variability in the biomass burning is not well known prior to satellite estimates beginning in 1997. Because of this, prescribed biomass burning emissions either have a discontinuity in variability in 1997, as done for CMIP6, or omit the post-1997 observed interannual variability, as done for CMIP5. Uncertainties in other prescribed aerosol forcings also affect historical simulations. For example, Fyfe et al. (2021) showed that differences in volcanic aerosol and anthropogenic aerosol forcing between CMIP5 and CMIP6 influence the surface air temperature evolution in Canadian Earth System Model (CanESM5) simulations. These studies highlight that forcing uncertainty can complicate the attribution of differences between models and observations.
Forcing uncertainty for both historical conditions and future projections (often called “scenario uncertainty”; Hawkins and Sutton, 2009) can also cause challenges when comparing across climate model generations. Ideally, the availability of large initial-condition ensemble simulations with different generations of the same model would allow us to quantify the influence of new model developments on the simulated transient climate evolution and climate variability. Comparing multiple models across various phases of CMIP would also ideally allow for assessment of how models as a group are performing relative to observations. However, model forcing protocols change with the phases of CMIP. This forcing change is well recognized for future model projections. For example, in the transition from Representative Concentration Pathway scenarios (RCPs; Van Vuuren et al., 2011) used in CMIP5 to the Shared Socioeconomic Pathway scenarios (SSPs; Meinshausen et al., 2020) used in CMIP6. Perhaps it is less well understood that historical forcings are also revised between CMIP phases and that these changes to the historical forcing impact simulated historical climate.
Here, we present simulations which enable quantification of the influence of external forcing uncertainty and model structural uncertainty of transient climate within a single modeling system: the Community Earth System Model (CESM). This work builds on large initial-condition ensemble simulations that have been performed for CESM1, using CMIP5 forcing protocols (CESM1-LE; Kay et al., 2015), and CESM2, using CMIP6 forcing protocols (CESM2-LE; Rodgers et al., 2021). These simulations have been very well utilized by the research community to investigate many aspects of the climate system. Work by this broad research community includes comparisons between the CESM1-LE and CESM2-LE to understand differences between them. However, the differences between these two ensembles arise from both model structural changes (i.e., CESM1 to CESM2) and external forcing changes (i.e., CMIP5 to CMIP6), prohibiting the attribution of simulation differences to model structure alone. Thus, to enable the separation of model structure and forcing influences, we have performed a set of CESM2 simulations with external forcings that are CMIP5-based and equivalent to those used in the CESM1-LE simulations. We provide information on the experimental design of these simulations, including the model version, external forcing, and tuning. Through comparison with CESM1-LE and CESM2-LE, these CESM2–CMIP5 simulations enable us to separate forcing uncertainty and model uncertainty within the context of the CESM large ensembles, all while accounting for internal climate variability. Here, we present the experimental design of these CESM2–CMIP5 simulations and use them to disentangle the influence of model structure and external forcing on global and regional climate warming. Note that several previous studies have used subsets of these simulations to explore some specific aspects of the climate system (e.g., Schneider et al., 2022; DeRepentigny et al., 2022). The overarching goal is that these publicly available community experiments will allow researchers to further investigate the influence of the CESM model structure and CMIP forcing uncertainty about numerous aspects of simulated Earth system variability and change. Given the computational expense required to perform these simulations, they serve as a valuable community resource.
Both CESM1 (Hurrell et al., 2013) and CESM2 (Danabasoglu et al., 2020) are comprehensive global climate models that include atmosphere, ocean, land, and sea ice components. Both models are run at a nominal 1∘ horizontal resolution. There were changes across all component models in the transition from CESM1 to CESM2. Some notable changes in the atmosphere include updated cloud microphysics (MG2; Gettelman and Morrison, 2015); the inclusion of an additional aerosol mode in the Modal Aerosol Model (MAM4; Liu et al., 2016); and the inclusion of the Cloud Layers Unified By Binormals (CLUBB) unified turbulence scheme (Golaz et al., 2002; Larson, 2017). In the ocean model, CESM2 includes a new Langmuir mixing parameterization (Li et al., 2016) and the mixing effects of estuaries (Sun et al., 2019). Prognostic salinity (Turner and Hunke, 2015) and an updated melt pond scheme (Hunke et al., 2013) are included within the CESM2 sea ice component. Within the land model, numerous new processes and parameterizations are included within CESM2 that have improved the realism of hydrological and ecological processes (Lawrence et al., 2019). Many studies have compared the CESM1 and CESM2 versions to document differences in simulated climate variability and transient climate evolution (e.g., CESM2 special collection, https://agupubs.onlinelibrary.wiley.com/doi/toc/10.1002/(ISSN)1942-2466.CESM2, last access: 13 February 2024). CESM2 has a considerably higher-equilibrium climate sensitivity than CESM1 (Gettelman et al., 2019a; Bacmeister et al., 2020), although the transient climate response is similar in the two models (Danabasoglu et al., 2020).
To enable the study of climate change and internal climate variability, large ensembles have been performed with both CESM versions. For the CESM1-LE (Kay et al., 2015), the simulations used forcing protocols from CMIP5 (e.g., Lamarque et al., 2010; Meinshausen et al., 2011), with the exception of ozone concentrations, which were obtained from a CESM1 simulation using the Whole Atmosphere Community Climate Model (WACCM) with active chemistry (Marsh et al., 2013). RCP8.5 scenario forcing is used for 2006–2100. Here we refer to the forcing used in the CESM1-LE simulations as CMIP5 forcing, although we recognize that other RCP scenarios are available under the CMIP5 forcing protocol. CESM1-LE simulations included a multi-century pre-industrial control, a single member run from 1850–1920 and 40 members from 1920–2100. The 40 members were initialized with the same conditions in 1920 but with a micro-perturbation equivalent to a random round-off level (order of 10−13 K) perturbation applied to the air temperature field. For many climate properties, initial-condition memory can persist for several years to a decade, and so the initial 1920 decade of simulated conditions is not considered to be independent. Note that for some properties, like Southern Ocean surface climate, the initial-condition influence can persist longer (Singh et al., 2023).
The CESM2-LE (Rodgers et al., 2021) includes 100 ensemble members, with the first 50 members and second 50 members differing in the prescribed biomass burning emissions as discussed below. In the first 50 members of the CESM2-LE, forcing data provided by CMIP6 (Eyring et al., 2016) were used apart from stratospheric ozone; stratospheric aerosols; H2O production rates, due to methane oxidation in the stratosphere; and nitrogen deposition to the land and ocean components. These non-CMIP6 provided forcings were obtained from CESM2(WACCM6) simulations with active chemistry (Gettelman et al., 2019b), which applied CMIP6-provided forcings but calculated the chemical and aerosol constituents. The CESM2-LE simulations cover 1850–2100 and use scenario forcing from SSP3–7.0 for 2015–2100. We refer to this as CMIP6 forcing, although we acknowledge that it is just one of the scenarios used for CMIP6 and is not necessarily representative of the other SSPs. Indeed, relative to other SSP scenarios, SSP3–7.0 maintains high sulfur and black carbon emissions throughout the 21st century (Gidden et al., 2019). The CESM2-LE ensemble members are initialized with a mix of micro-perturbations similar to the CESM1-LE and macro-perturbations in which initialization is taken from different years of a CESM2 multi-century pre-industrial control simulation. As documented by Fasullo et al. (2022) and DeRepentigny et al. (2022), the CMIP6 biomass burning emissions exhibit a large increase in variability during 1997–2014 with the incorporation of satellite-based emission data. This influences the simulated early 21st century transient climate, particularly in the Northern Hemisphere extratropics. Given that these variable biomass burning emissions are used in the first 50 members of the CESM2-LE, we refer to this 50-member subset as CESM2-LEvbb. In the second 50 members of the CESM2-LE (referred to here as CESM2-LEsmbb), the prescribed biomass burning emissions were smoothed. This largely affects conditions from 1990–2020. These CESM2-LEsmbb simulations are used to provide an estimate of the influence of the changing biomass burning emission variability on the simulated change.
Large-ensemble simulations (and the simulations performed here) require extensive computational resources, limiting the ability to perform simulations with multiple forcing scenarios. The scenario forcing used in the two CESM large ensembles are different both in their details and in the approximate level of radiative forcing reached in 2100 (8.5 W m−2 for RCP8.5 used in CESM1-LE; 7.0 W m−2 for SSP3–7.0 used in CESM2-LE). The new CESM2–CMIP5 simulations performed for this study enable us to explicitly assess the role of model structure in differences between the simulated 21st century change in CESM1-LE and CESM2-LE, despite the significant scenario forcing differences. Importantly, the forcing used in the historical simulations also differs considerably from CMIP5 to CMIP6, with implications for historical change simulated in these large ensembles.
To enable the separation of the role of forcing versus model structure in the differences between CESM1-LE and CESM2-LE, we have performed an additional set of CESM2–CMIP5 simulations in which CESM2 uses forcing from CMIP5, consistent with that used in CESM1-LE. Changing the forcing in CESM2 led to a slight radiative imbalance at the top of the model of approximately −0.35 W m−2 in the first 10 years of our initial pre-industrial control simulation. This is likely due to different background volcanic aerosol emissions. This model imbalance can result in a long spin-up adjustment. For example, as shown in Fyfe et al. (2021), in similar pre-industrial control experiments performed with the CanESM5 model, the inclusion of background aerosol emissions results in a multi-century cooling drift in global mean surface temperature. To avoid a long spin-up adjustment, it is important to achieve a low model imbalance in control simulations. The CESM project uses a criterion of <0.1 W m−2 for the absolute imbalance at the top of the model (Danabasoglu et al., 2020). Given this, to achieve a radiative balance within the 0.1 W m−2 criteria and prevent temperature drifts over time in the pre-industrial control simulation, we applied a small adjustment to a tuning parameter (clubb_gamma_coef = 0.318 in the CESM2–CMIP5 runs versus clubb_gamma_coef = 0.308 in the CESM2-LE runs). This parameter controls the probability density function (PDF) of subgrid vertical velocity within the CLUBB scheme and increasing clubb_gamma_coef decreases the stratiform nature of the clouds, which darkens them. For the first 10 years of pre-industrial control simulations, this tuning resulted in a top-of-model imbalance of −0.1 W m−2. It led to a change in global average shortwave cloud forcing from −48.5 W m−2 with the original clubb_gamma_coef to −48.0 W m−2 with the tuned clubb_gamma_coef (with the largest changes in the tropics; see Fig. S1 in the Supplement). The influence on global-averaged longwave cloud forcing was minimal. Since the tuning applied is small, we expect the influence on the simulated transient climate response to be small relative to the CMIP5 versus CMIP6 forcing differences. The same parameter value of clubb_gamma_coef was used in the pre-industrial, historical, and RCP8.5 runs for the CESM2–CMIP5 simulations.
This CESM2–CMIP5 set of simulations includes a 500-year pre-industrial control that is initialized at year 501 of the CESM2-LE pre-industrial control and has static 1850 forcing, a single member from 1850–1920 that is initialized from year 250 of the pre-industrial control, and 15 members from 1920–2100. Model simulation drift in the pre-industrial control run for simulation properties assessed here is small at the time of historical run initialization (Fig. S2) and does not qualitatively affect our results. Similar to the CESM1-LE, we use a micro-perturbation method to initialize the ensemble simulations in 1920. For the historical period prior to 2006, CMIP5 historical forcings were used, and then in the 2006–2100 period, the RCP8.5 scenario forcing was used, as in CESM1-LE. All of the experimental design information for these simulations can be found on the GitHub repository (https://github.com/NCAR/CESM2-CMIP5, last access: 14 February 2024). In CESM2, aerosols are treated using a four-mode version of the Modal Aerosol Model (MAM4; Liu et al., 2016). Relative to the three-mode version (MAM3) used in CESM1, MAM4 includes an additional primary carbon mode. As such, the amount of particulate organic matter (POM) and black carbon (BC) emissions used in the CESM2–CMIP5 simulations was the same as that in CESM1-LE, but they were put in the primary carbon mode available in MAM4. This additional primary carbon mode allows for an explicit treatment of the aging of primary carbonaceous aerosols. While the aerosols are in this mode, they are hydrophobic and are not removed by wet deposition, leading to an overall lengthening of the lifetime of carbonaceous aerosols within MAM4 and a substantial increase in particulate organic matter and black carbon burdens in some regions (Liu et al., 2016). The inclusion of this mode could influence the model sensitivity to differences in carbonaceous aerosol emissions.
The time evolution of global anthropogenic and biomass burning emissions used in the simulations is shown in Fig. 1. The time resolution of the specified emissions data varies between the CMIP5-based forcing, which used a linear interpolation of decadal means, and CMIP6-based forcing, which used annual values for the historical period and a linear interpolation of decadal means for the scenario forcing. Additionally, the emission magnitudes differ between CMIP5 and CMIP6. This emission difference is expected for much of the 21st century, as the RCP8.5 scenario used in the CESM1-LE runs differs from the SSP3–7.0 scenario used in CESM2-LE. However, the emissions also differ, sometimes substantially, for the historical period.
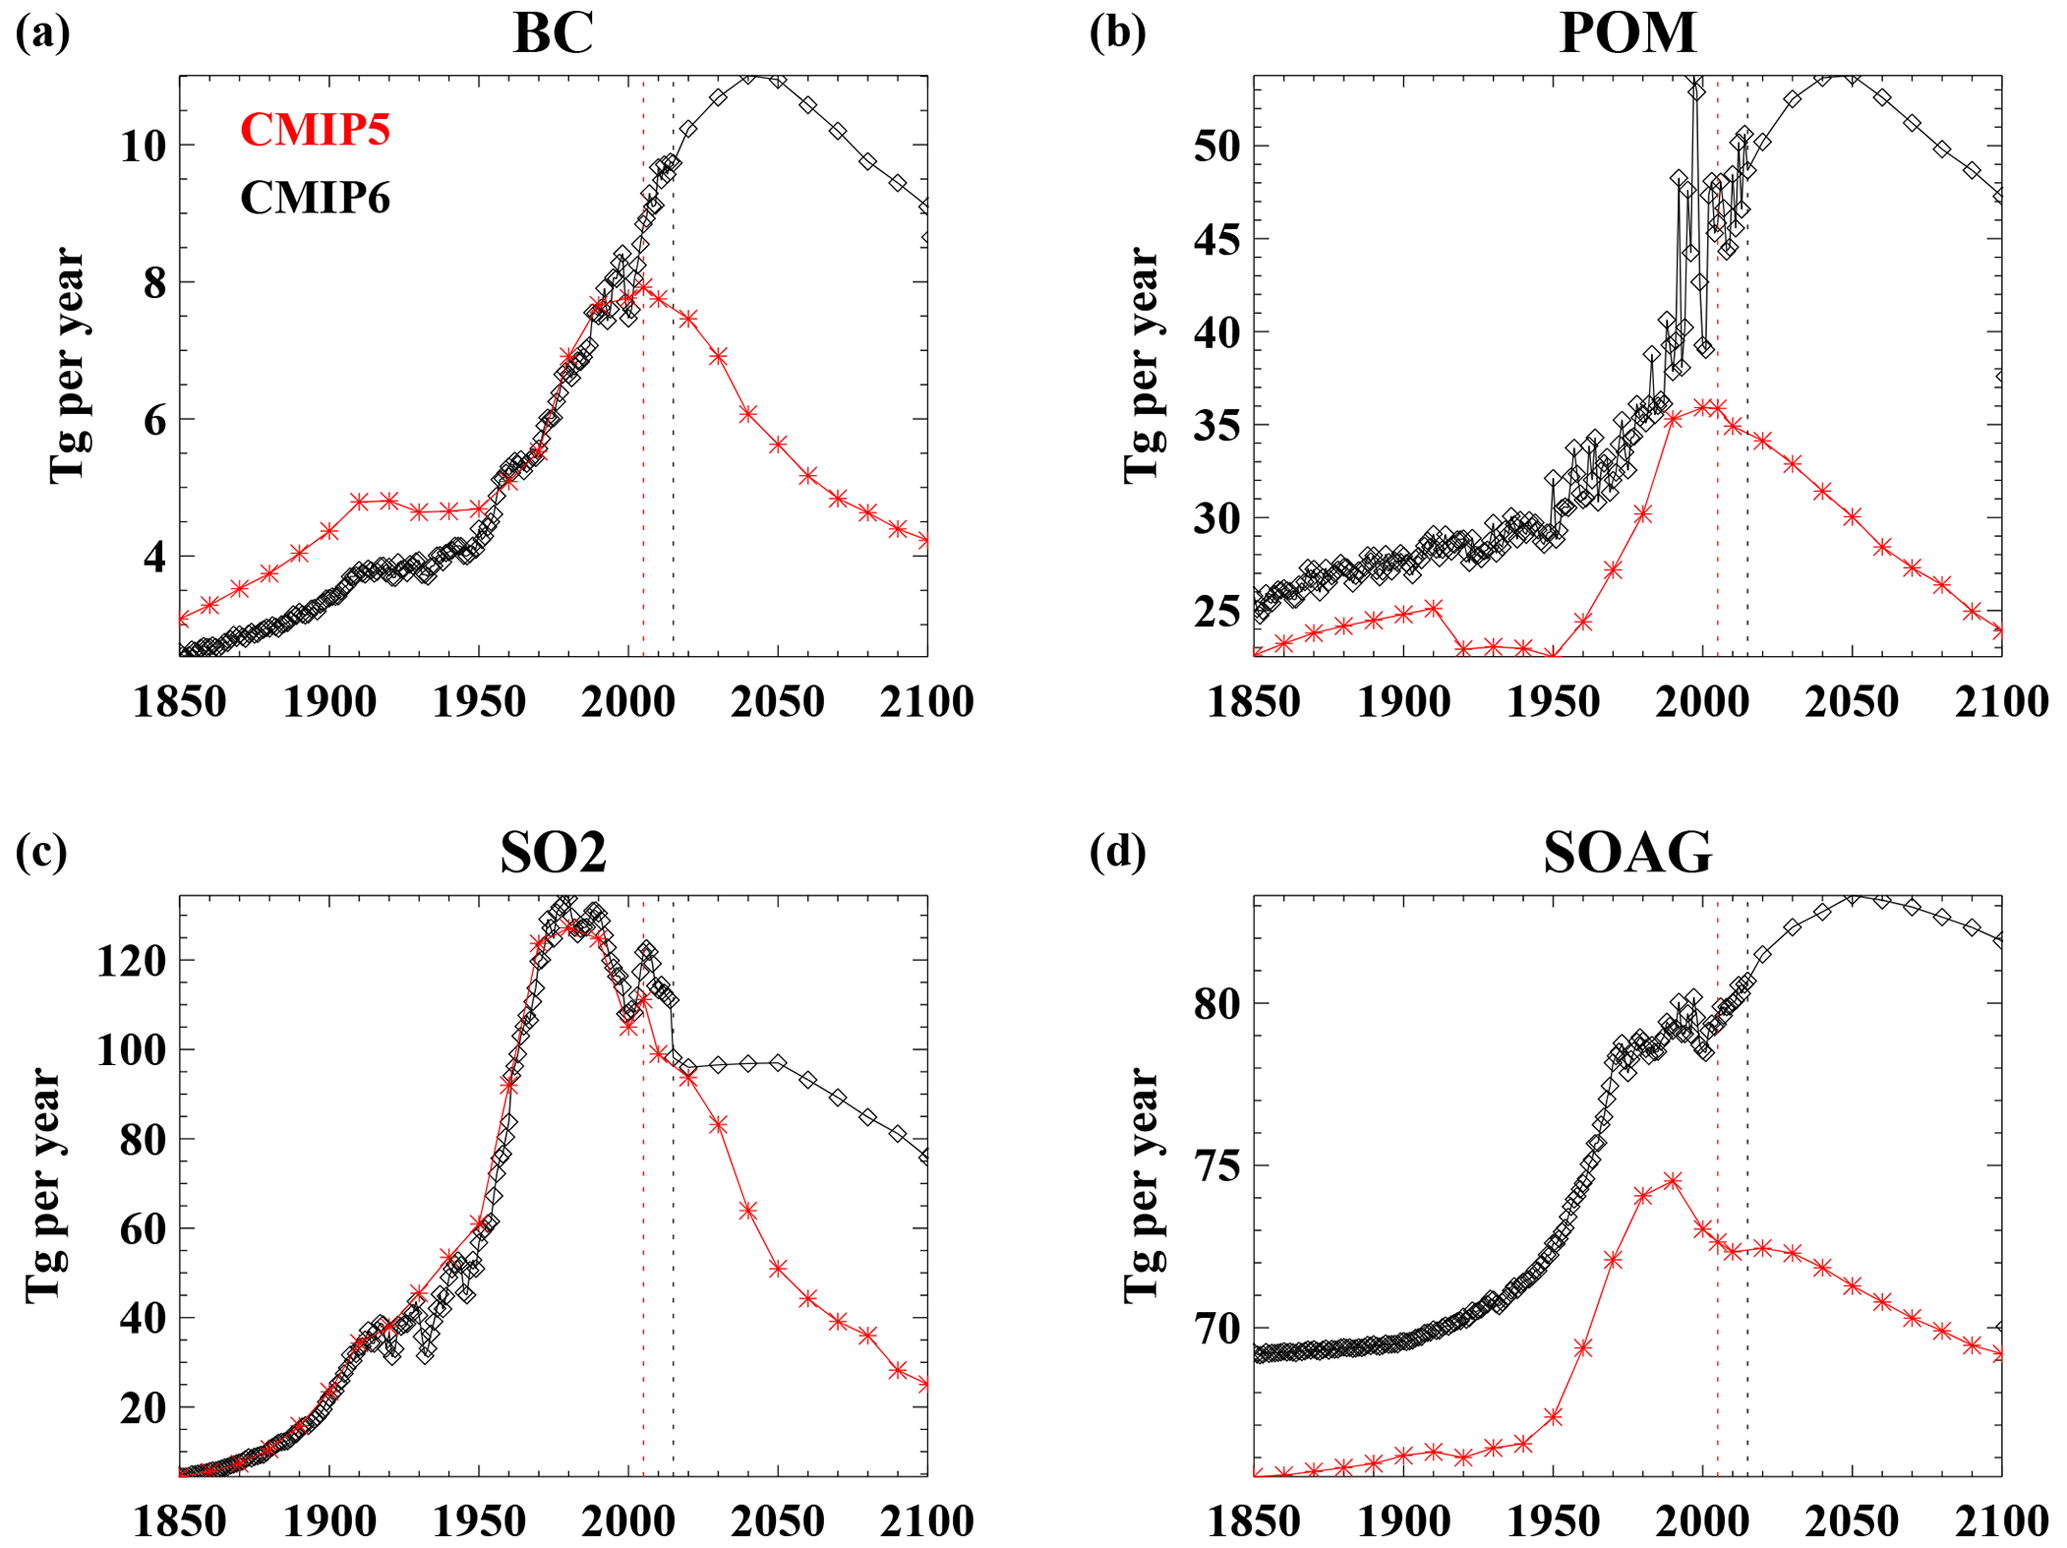
Figure 1Emissions of global anthropogenic and biomass burning emissions, including (a) black carbon (BC), (b) primary organic matter (POM), (c) sulfur dioxide, and (d) gas-phase condensable sources of secondary organic aerosols (SOAGs) for CMIP5 (red) and CMIP6 (black) forcings.
Volcanic forcing also differs throughout the simulations (Fig. 2). In CMIP5, there are no background stratospheric aerosols prescribed in the simulations. In contrast, a background-averaged volcanic forcing was applied in the pre-industrial control, historical, and SSP scenario integrations for CMIP6. Fyfe et al. (2021) found that this difference in background volcanic forcing influenced the control climate state with consequences for 20th century warming. The aerosols associated with specific eruptions throughout the historical period also differ from CMIP5 to CMIP6. Unfortunately, the volcanic aerosol burden is not available from both model simulations. However, a comparison of the volcanic aerosol burden in CESM1-LE with the stratospheric aerosol optical depth in CESM2-LE indicates that CMIP6 generally includes more eruptions and that the relative forcing magnitude between specific eruptions differs between the CESM1-LE and CESM2-LE simulations (Fig. 2). In contrast to the prescribed aerosols, the prescribed concentrations of greenhouse gases (Fig. 3) are nearly identical for the historical period and the early-21st century but start to diverge at around 2040, given the different RCP8.5 and SSP3–7.0 scenarios used for the CMIP5-based versus CMIP6-based simulations.
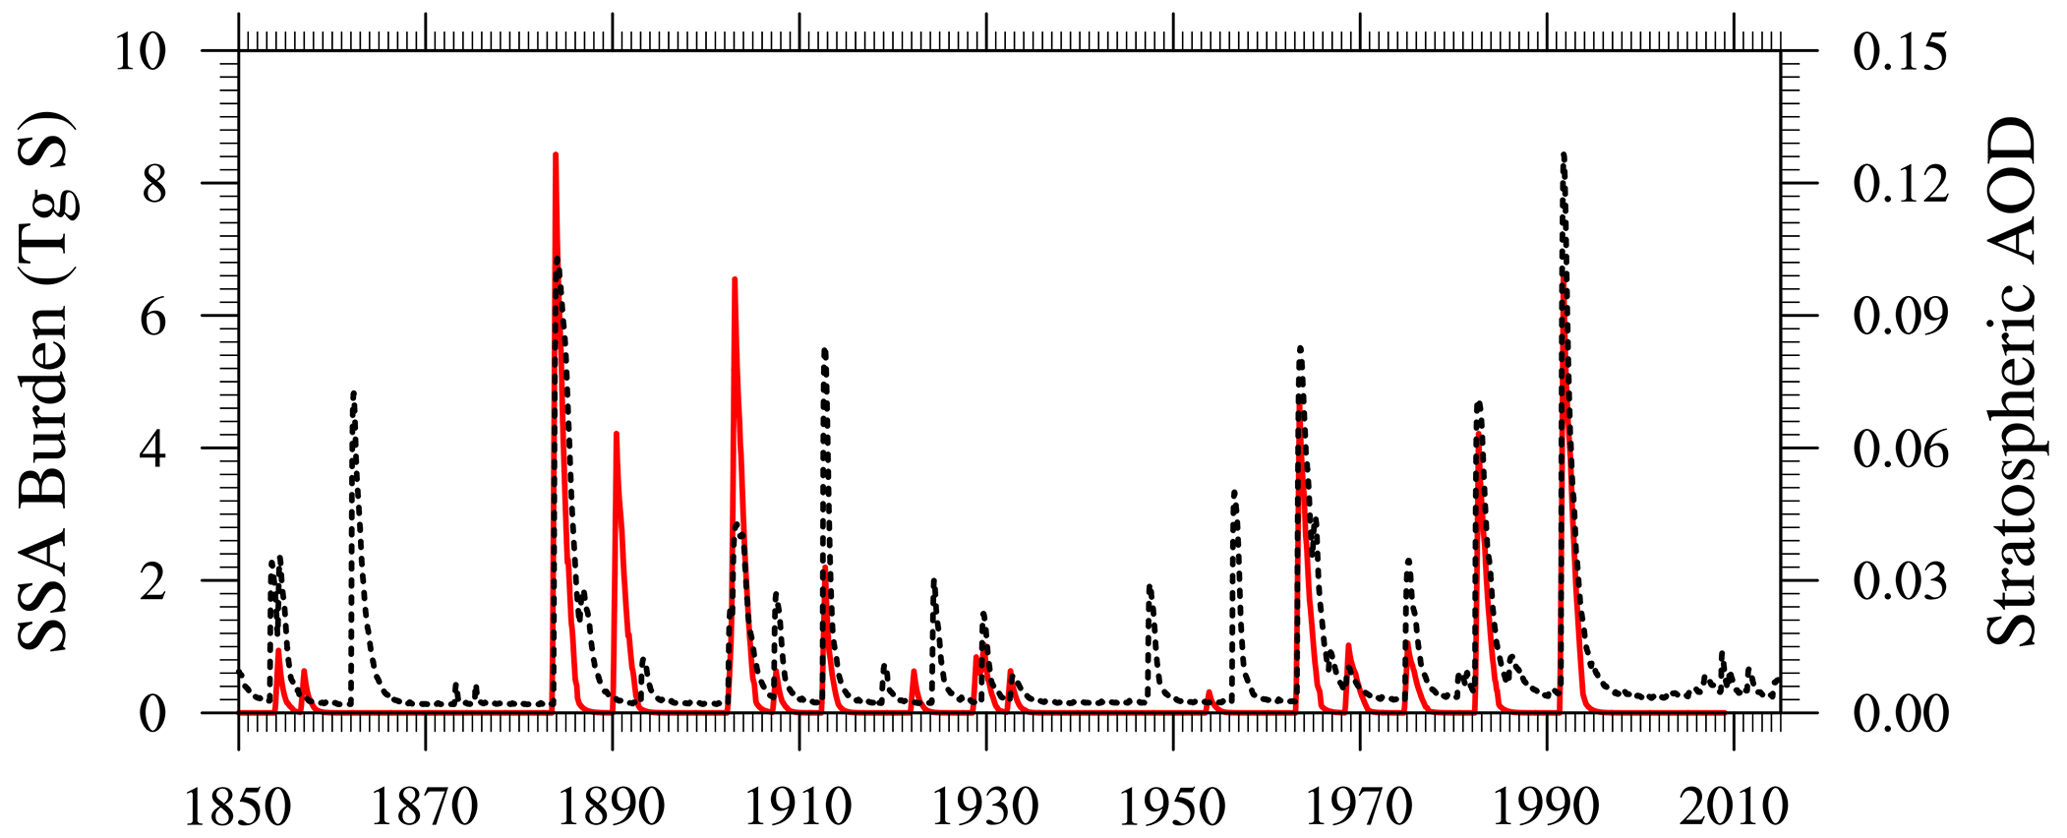
Figure 2Proxy measures of the volcanic forcing in CESM1-LE and CESM2-LE simulations, including the stratospheric sulfate aerosol (SSA) burden in CESM1-LE (red; left axis) and the stratospheric aerosol optical depth (AOD) from CESM2-LE (dashed black; right axis).
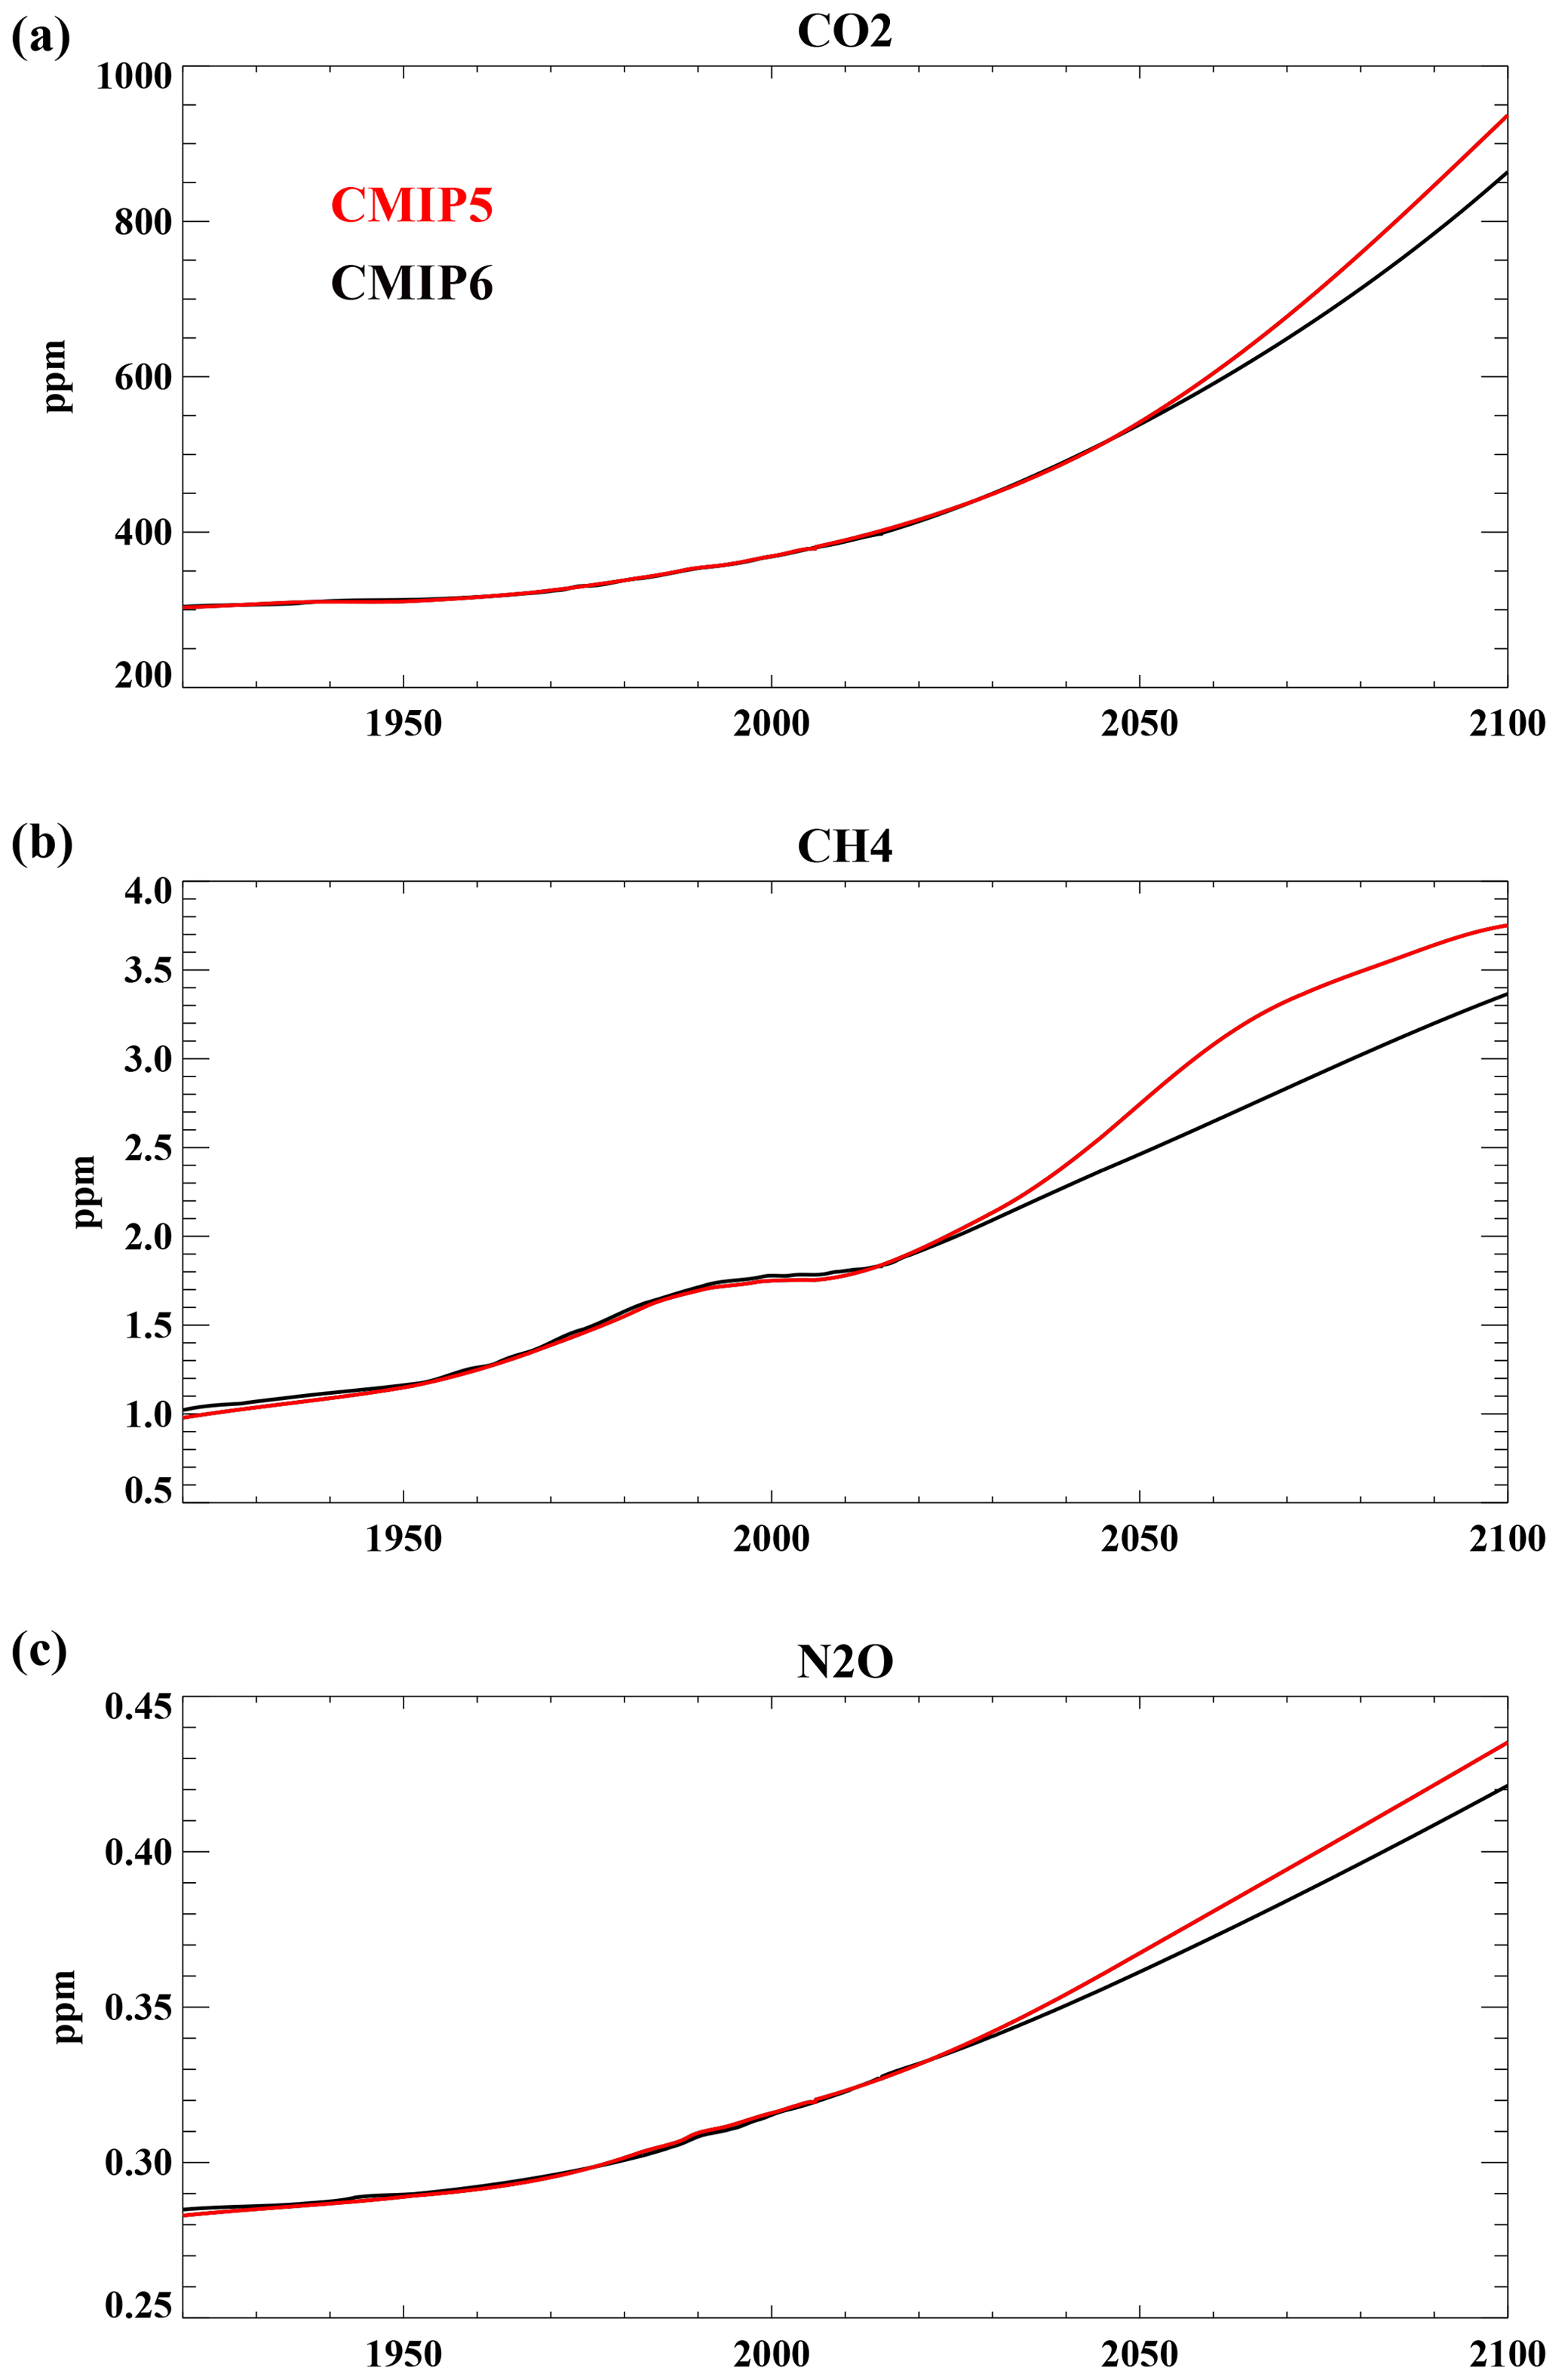
Figure 3Prescribed concentrations of greenhouse gases, including (a) CO2, (b) CH4, and (c) N2O for CMIP5 (red) and CMIP6 (black) forcings.
We present global and regional climate metrics to determine factors driving differences in 20th and 21st century warming between CESM1-LE and CESM2-LE. We focus on the forced climate response, and so assess the ensemble mean properties. We attribute differences between CESM1-LE and CESM2-LE to the influence of differences in model structure and differences in model forcing using the following:
As identified in previous studies (Fasullo et al., 2022; DeRepentigny et al., 2022; van Marle et al., 2017), the CMIP6 forcing used in CESM2-LEvbb applies biomass burning emissions at the end of the historical period based on satellite data. This leads to an increase in the high-frequency variability in the biomass burning emissions from 1997–2015 relative to earlier and later periods. This change in emission variability has been shown to influence the simulation of a number of changes within the climate system (Fasullo et al., 2022; DeRepentigny et al., 2022; Heyblom et al., 2022) and could account for some of the forcing influence quantified using Eq. (2), since CMIP5 forcing uses smooth biomass burning emissions throughout. To investigate this, we also use the CESM2-LE simulations to quantify the response to highly variable biomass burning in the CMIP6 forcing using
If this term is near-zero, then the changing variability in biomass burning that is present in the standard CMIP6 forcing has little influence relative to smoothed biomass burning emissions. Notably, other changes are present in the biomass burning emissions between CMIP6 and CMIP5, and so the analysis of biomass burning forcing influence quantified here only reflects the influence of emission variability within CMIP6.
All anomalies discussed below are relative to the 1930–1950 period when both CESM2 and CESM1 have large-ensemble simulations available. Given the large number of ensemble members in the CESM1-LE, CESM2-LEvbb, and CESM2-LEsmbb, the ensemble mean quite robustly characterizes the forced climate response for these cases. However, because of computational constraints, only 15 members are available for the CESM2–CMIP5 simulations. To quantify the effect of this smaller sample size on our results, we apply bootstrapping in the computation of the model and forcing influence metrics. We resample, with replacement, the members from the CESM1-LEvbb and CESM2-LE to produce bootstrapped ensembles with the same ensemble size as the CESM2–CMIP5 and calculate the model influence and forcing influence, as per Eqs. (1) and (2). We repeat this 1000 times and present information showing the 2.5th–97.5th percentile of bootstrapped estimates. Because the biomass burning forcing uncertainty (Eq. 3) is based on a difference in ensemble means for CESM2-LEvbb and CESM2-LEsmbb, which both have 50 members, no bootstrapping is performed.
4.1 Global change
For the 2000–2020 average, the globe warms modestly more in CESM2-LEvbb (0.81 ∘C, with a standard deviation of 0.07 ∘C across members) than in CESM1-LE (0.70 ∘C, with a standard deviation of 0.06 ∘C across members) (Fig. 4a), although the ensembles overlap. Model structural changes consistently result in more surface warming in CESM2-LE than in CESM1-LE over the 20th and 21st centuries (Fig. 4b). This warming difference is counteracted by differences in the external forcing, except from 2000–2010 when the total forcing influence is neutral. Uncertainty associated with biomass burning emission variability results in less warming for the 2000–2010 period and may explain some of the total forcing influence. Taken together, the compensation between model structure and forcing leads to the relatively similar 20th century warming in CESM1-LE and CESM2-LE. Later in the 21st century, the forcing differences associated with the different scenarios dominate and lead to less global warming in CESM2-LE than in CESM1-LE by 2100.
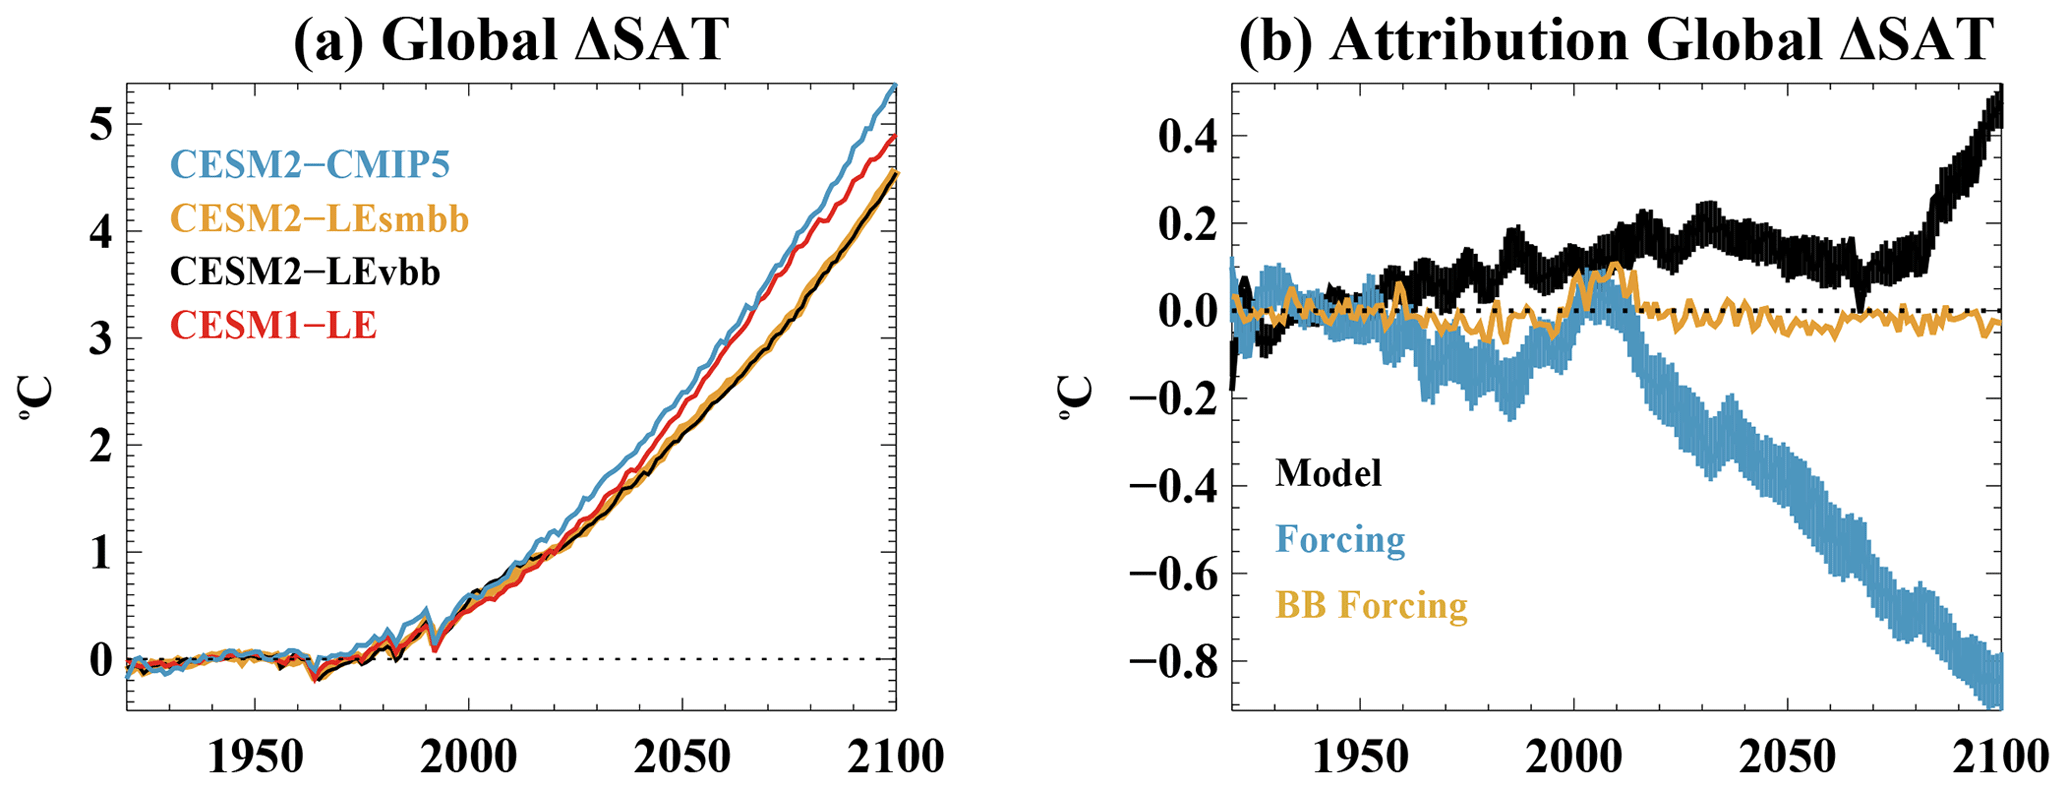
Figure 4The 1920–2100 time series of (a) the change in global ensemble mean surface air temperature relative to the 1930–1950 average, and (b) the attribution of CESM2-LE versus CESM1-LE differences in air temperature change to structural model differences and forcing differences, as defined in Sect. 3. As described in Sect. 3, the range shown for the model and forcing attribution in panel (b) represents the 2.5th–97.5th percentile of 1000 bootstrapped samples.
Simulation differences in the global temperature change evolution (Fig. 4) strongly correspond to changes in the global net top of atmosphere (TOA) shortwave (SW) flux (Fig. 5a). The sign convention is such that fluxes are positive downward. Thus, the increase in net SW values is associated with a lower planetary albedo and more shortwave radiation retained in the Earth system. Over the 20th century, all simulations show a decline in net SW, indicating a higher global planetary albedo. This largely results from emissions of anthropogenic sulfate aerosols. Consistent with previous work (Trenberth and Fasullo, 2009), the net SW changes then reverse sign, increasing in the early 21st century and leading to more SW warming of the globe. Compared to CESM1-LE, CESM2-LE has smaller net SW reductions in the 20th century but reaches a similar net SW increase by 2100. The time-varying differences between CESM2-LE and CESM1-LE are due to a relative compensation of the influence of model structure and forcing that changes over time. Model structure consistently drives a relative increase in net SW anomalies in CESM2 compared to CESM1 throughout the 20th and 21st centuries (Fig. 5b). However, the CMIP6 forcing counteracts this structural difference, except for 2000–2020, when the forcing has little impact. In the latter part of the 21st century, this forcing influence is particularly large, which is consistent with the different scenario forcing. By 2100, the influence of external forcing and model structure nearly balances, and the 2100 net SW change is similar in CESM2-LE and CESM1-LE.
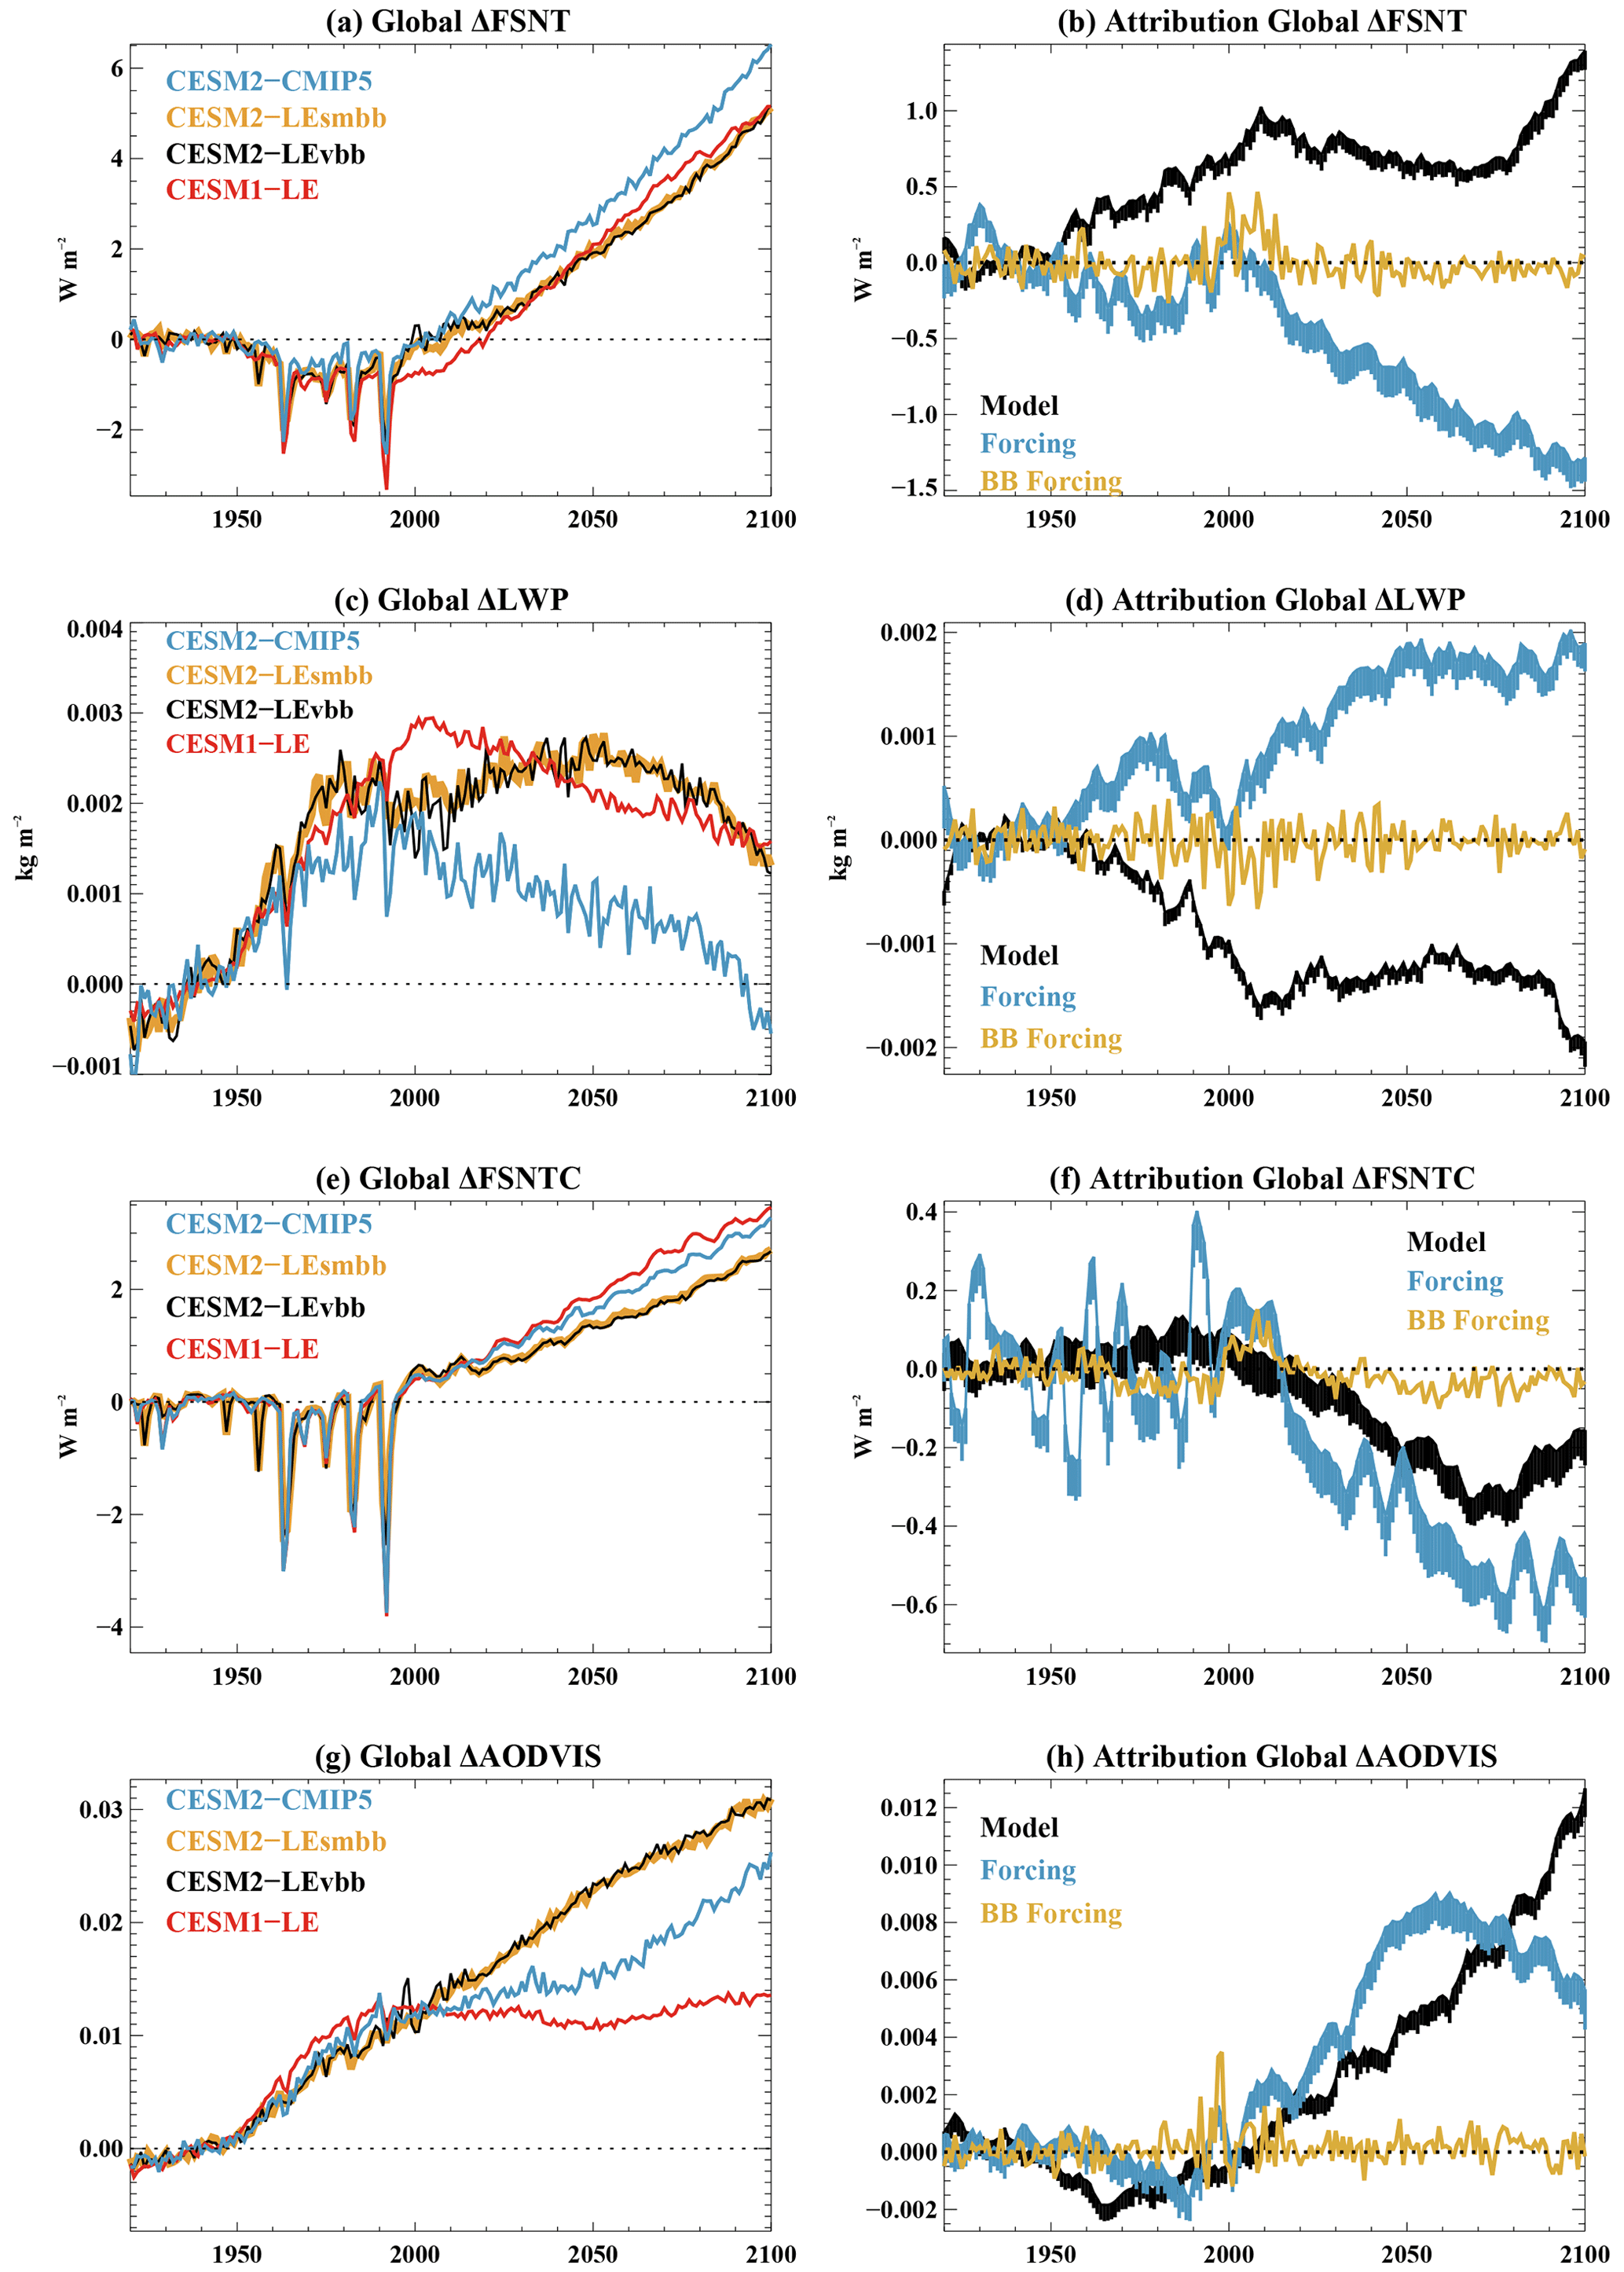
Figure 5(a) Change in global ensemble mean net TOA SW. (b) Attribution of differences in CESM2-LE versus CESM1-LE simulated net TOA SW change to model and forcing uncertainty. (c) As in panel (a) but for global cloud liquid water path. (d) As in panel (b) but for global cloud liquid water path. (e) As in panel (a) but for net TOA clear-sky SW. (f) As in panel (b) but for net TOA clear-sky SW. (g) As in panel (a) but for global aerosol optical depth. (h) As in panel (b) but for global aerosol optical depth. As described in Sect. 3, the ranges shown for the model and forcing attributions represent the 2.5th–97.5th percentile of 1000 bootstrapped samples.
Changes in the net SW flux can be associated with both clear- and cloudy-sky conditions. An analysis of the cloud liquid water path (LWP) suggests that many of the simulated differences in the global average net SW flux between CESM2-LE and CESM1-LE are associated with clouds. The global average LWP increases in the 20th century and then generally stays elevated in CESM1-LE and CESM2-LE through 2100, relative to the 1930–1950 average (Fig. 5c). The influence of model structure and forcing on changing LWP (Fig. 5d) bears a striking resemblance to the analysis of the net SW flux (Fig. 5b) (although with an opposite sign, consistent with the influence of LWP on cloud albedo). Model structure causes smaller 20th century global LWP increases in CESM2 relative to CESM1, with these differences then being retained through the 21st century. In contrast, the CMIP6 model forcing contributes to larger increases in LWP throughout the 20th and 21st centuries. This compensation between model structure and model forcing leads to only small LWP changes in the CESM2–CMIP5 simulations by 2100.
An analysis of the clear-sky net SW flux (Fig. 5e) suggests that, in the 20th century, model structure has limited influence on differences between CESM2-LE and CESM1-LE. The 20th century forcing differences also have a modest influence, although differences in episodic volcanic forcing are evident (Fig. 5f), with implications for episodic reductions in air temperature. In the 21st century, both model structure and external forcing reduce the clear-sky net SW flux in CESM2-LE relative to CESM1-LE. This reduction is consistent with changes in aerosol optical depth (Fig. 5g and h) that result from higher sustained aerosol emissions (Fig. 1) and model structural changes. It is also affected by a cryospheric albedo contribution, as discussed further below.
The changing planetary heat budget is consistent with the changing global ocean heat content, as indicated by global depth-averaged ocean temperature (Fig. 6). Model structure leads to more ocean heat uptake in CESM2 relative to CESM1 throughout the 20th–21st centuries. This heat uptake difference is counteracted by the forcing differences, with the historical CMIP6 and SSP3–7.0 scenario resulting in less heat uptake. The variable biomass burning forcing influence on global ocean heat content is small, although it does influence other aspects of the ocean simulation, as documented in Yamaguchi et al. (2023). As a result of the compensation between model structure and forcing, the change in ocean heat content by 2100 is quite similar between the CESM2-LE and CESM1-LE. This is consistent with the surface air temperature and SW budget analysis above.
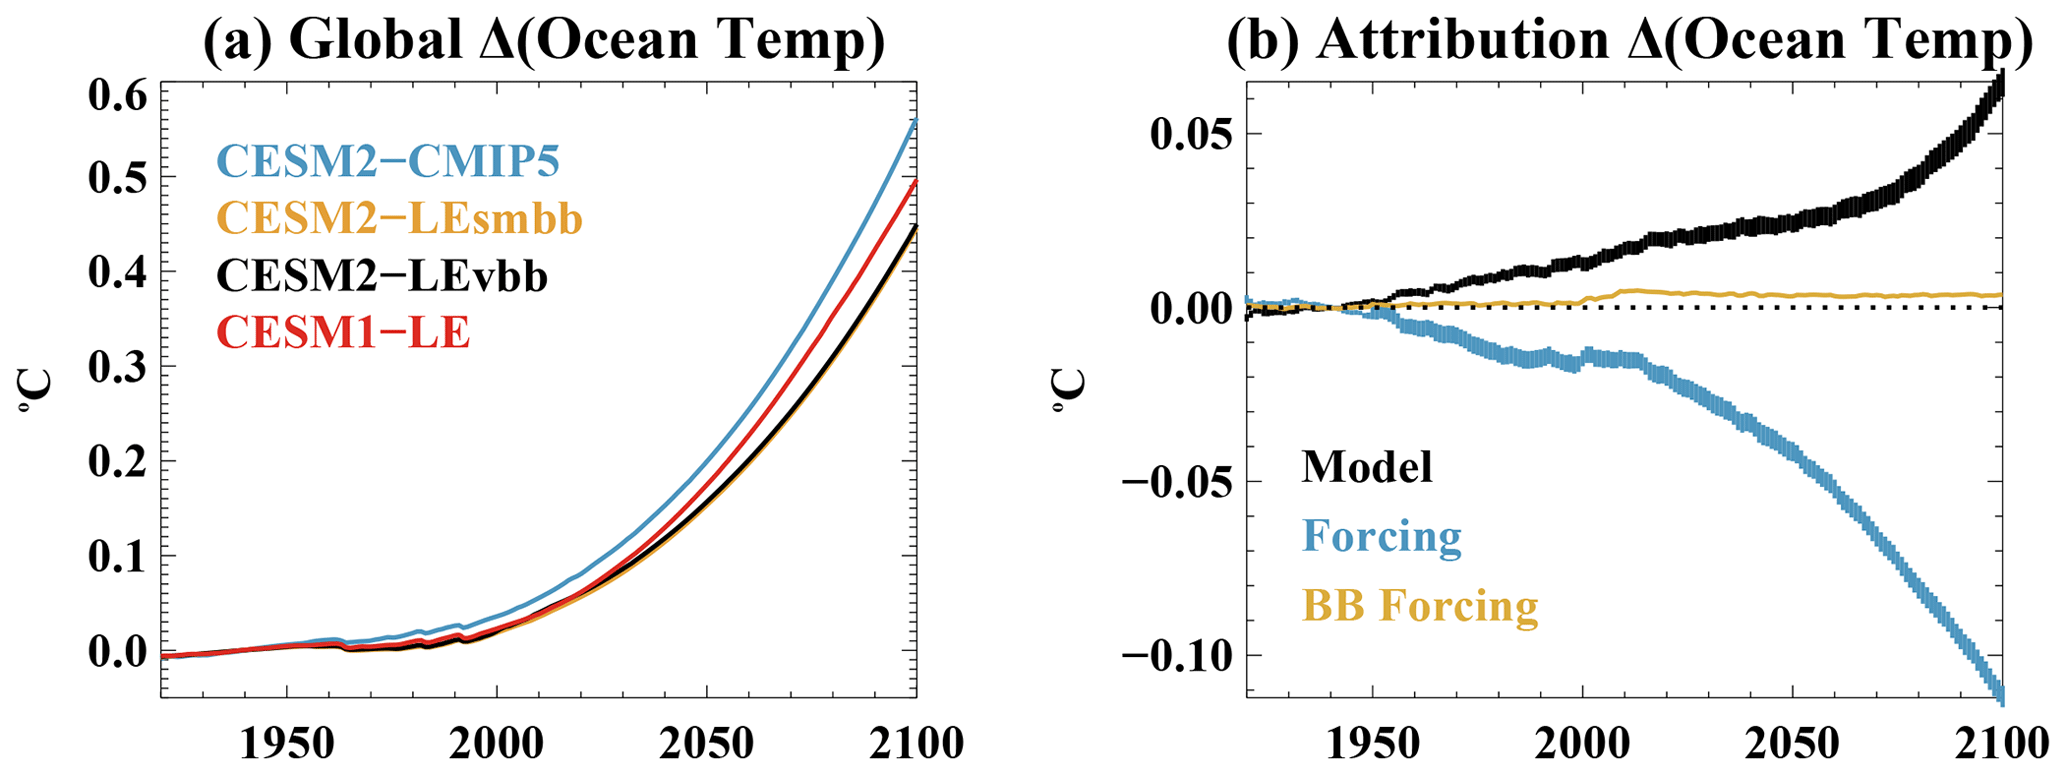
Figure 6(a) Change in global ensemble mean depth-averaged ocean temperature. (b) Attribution of differences in CESM2-LE versus CESM1-LE simulated ocean temperature change to model and forcing uncertainty. As described in Sect. 3, the ranges shown for the model and forcing attribution in panel (b) represent the 2.5th–97.5th percentile of 1000 bootstrapped samples.
4.2 Zonal average change
The impact of changes in cloud properties and aerosol optical depth can vary by location. Additionally, the global average metrics can mask compensating regional changes. For example, while model structure causes more 20th–21st century global warming in CESM2 relative to CESM1 (Fig. 4), the influence of model structure on climate varies considerably by latitude (Fig. 7). In particular, throughout the 21st century, model structural differences result in more CESM2 warming in the tropics but less in the high northern latitudes (Fig. 7c, d, e). From 1980–2010, the CMIP6 forcing enhances Arctic warming (Fig. 7f). This is related in part to biomass burning variability, as revealed by a comparison of CESM2-LEvbb and CESM2-LEsmbb (Fig. 7c; Fasullo et al., 2022; DeRepentigny et al., 2022), although this is only a fraction of the total CMIP6 versus CMIP5 effect (Fig. 7c). Through the remainder of the 21st century, from 2020–2100, forcing reduces warming at all latitudes in CESM2-LE, with the largest influence in the Arctic. This is consistent with the lower greenhouse gas concentrations and higher aerosol emissions in SSP3–7.0 as compared to RCP8.5. However, in spite of the lower approximate radiative forcing represented by the SSP3–7.0 scenario, a similar tropical warming is present by 2100 in CESM2-LE and CESM1-LE, due to the compensating effect of model structural differences.
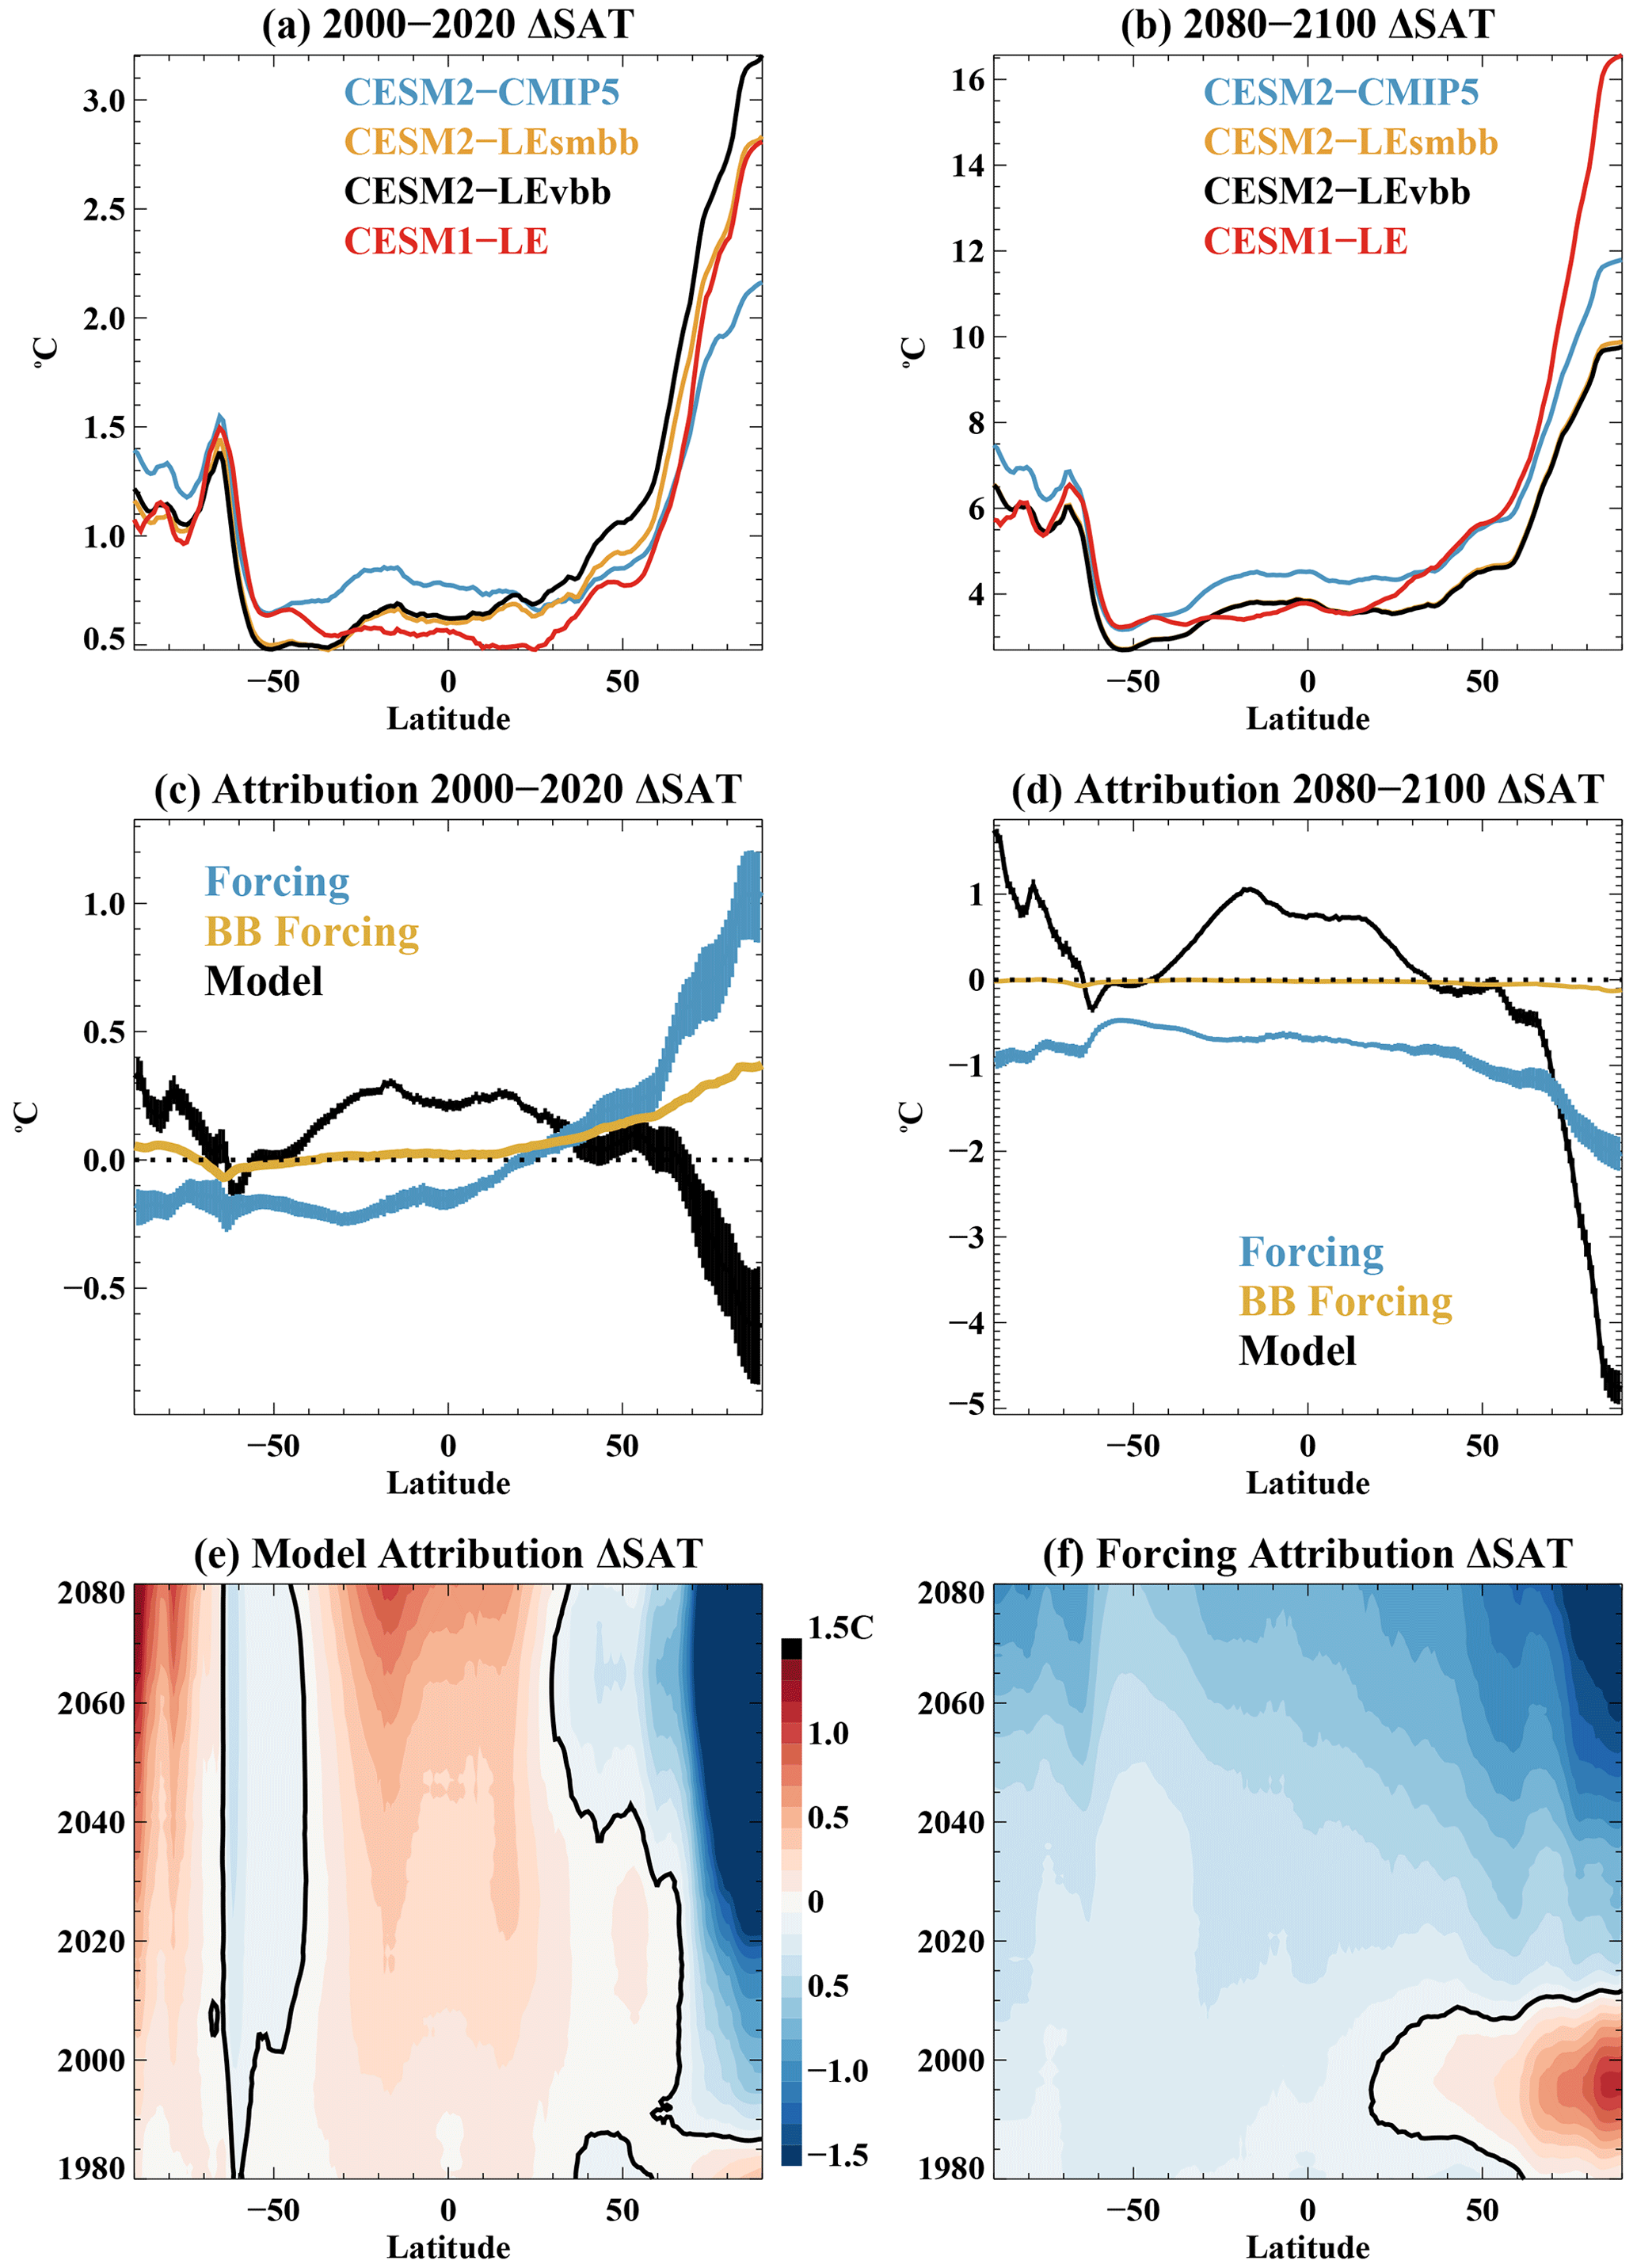
Figure 7Zonally averaged surface air temperature change relative to the 1930–1950 average. (a) 2000–2020 ensemble mean change. (b) 2080–2100 ensemble mean change. (c) Attribution of CESM2-LE versus CESM1-LE differences in the 2000–2020 change to model and forcing uncertainty. (d) Attribution of differences in the 2080–2100 change to model and forcing uncertainty. (e) Attribution of differences in the running 10-year average ensemble mean change to model uncertainty. (f) Attribution of differences in the running 10-year average ensemble mean change to forcing uncertainty. For panels (e) and (f), the same color bar is used, and the solid black contour denotes the 0 ∘C line.
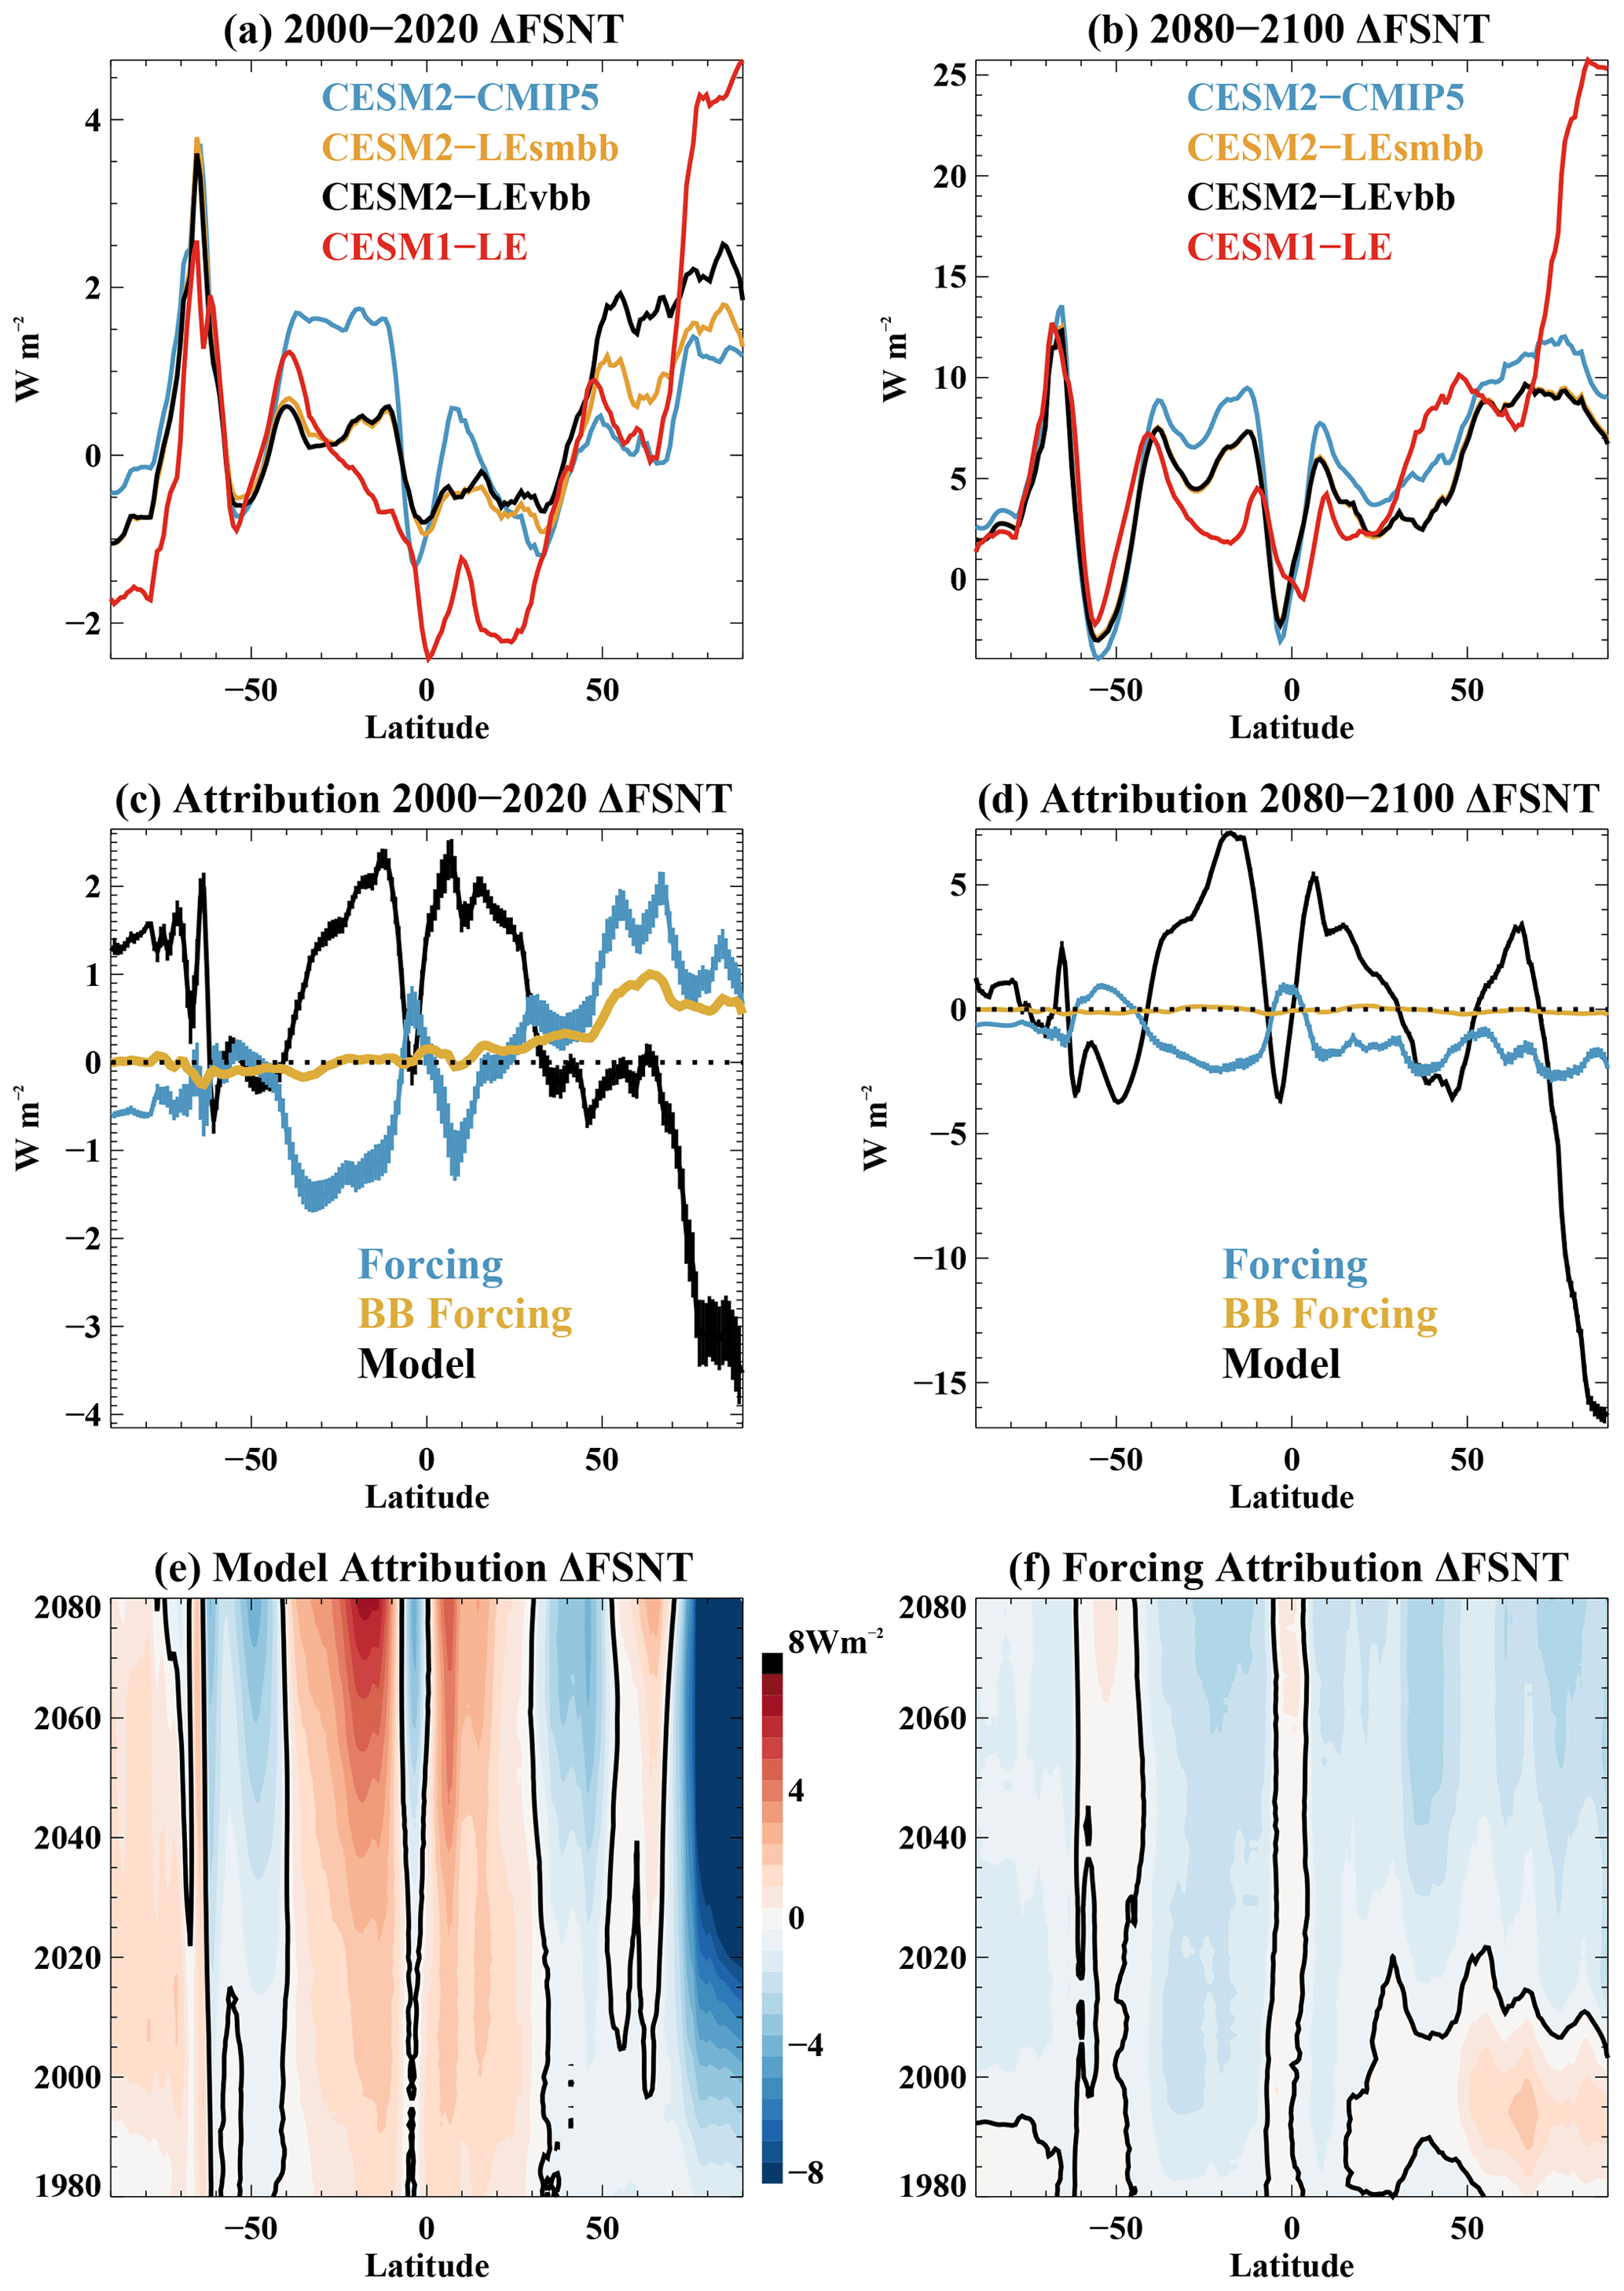
Previous work indicates that shortwave cloud forcing and feedbacks differ between CESM2 and CESM1 (Danabasoglu et al., 2020; Gettelman et al., 2019; Bacmeister et al., 2020; Schneider et al., 2022) and have a distinct meridional structure. Given this, we assess the latitudinal structure of the change in the net top-of-atmosphere shortwave fluxes and the influence of model structure and forcing differences in driving changes over the 21st century (Fig. 8). These are generally consistent with the surface air temperature change analysis (Fig. 7), suggesting a causal link in which regional SW changes drive regional changes in air temperature. By 2100, the net shortwave increases at nearly all latitudes in all simulations (Fig. 8b), indicating more shortwave heating and a lower planetary albedo. This decreased planetary albedo is consistent with a decrease in total cloud cover everywhere, except at the high latitudes (not shown), where a cryospheric response to warming plays a role, as discussed further below. The influence of structural model differences has a quite consistent spatial pattern through the 21st century, resulting in a generally larger SW increase in the tropics in CESM2 but a smaller Arctic change (Fig. 8e). The importance of external forcing changes over time. In the early 21st century, the forcing counteracts the structural model differences at most latitudes (Fig. 8c). However, by 2100, the CMIP6 forcing drives lower net SW increases nearly everywhere (Fig. 8d), which is consistent with the higher aerosol emissions and lower greenhouse gases in the SSP3–7.0, as compared to the RCP8.5. Notably, even with the considerably different scenario forcing by 2100, on a regional basis, the forcing influence is small relative to the influence of the model structure. As such, the model structural influence largely explains the different patterns of zonal SW heating in 2100.
The net SW changes result from changing aerosols, cloud cover, cloud properties, and surface albedo. We assess these factors using an approximate partial radiative perturbation (APRP) method (Taylor et al., 2007) that enables us to separate the SW cloud feedback and the surface albedo feedback. An assessment of the SW cloud feedback (Fig. 9) suggests that over the 21st century, clouds explain much of the SW signal shown in Fig. 8, although there are some discrepancies in high latitudes. In all simulations by 2100, clouds drive less SW reflection (and so a positive feedback) for much of the 50∘ N–50∘ S region (Fig. 9b). In high latitudes, the models simulate a negative feedback, indicating that clouds drive more SW reflection for the 2080–2100 period, although the models differ in the magnitude and exact location of this response in the Arctic. The influence of model structure and external forcing on differences in the SW cloud feedback between CESM2-LE and CESM1-LE (Fig. 9c and d) bears a strong resemblance to the net SW analysis (Fig. 8c and d) for most of the globe. For both the early- and late-21st century changes, model structure causes a more positive SW cloud feedback in CESM2 over most of the tropics. This indicates a decreased tropical cloud brightening in CESM2 relative to CESM1, consistent with the model structural influence on net SW (Fig. 8). However in high latitudes, it is less clear that cloud feedbacks are responsible for the differences in the net SW between the CESM2-LE and CESM1-LE. For example, in the Arctic, model structure leads to a large reduction in net SW in CESM2 for both the early and late 21st century (Fig. 8c and d) that appears much smaller than the cloud feedback influence (Fig. 9c and d). Analysis of the surface albedo feedback (Fig. 10) helps to explain this discrepancy. In particular, the model structure results in a much weaker albedo feedback in CESM2 relative to CESM1 for both the early and late 21st century.
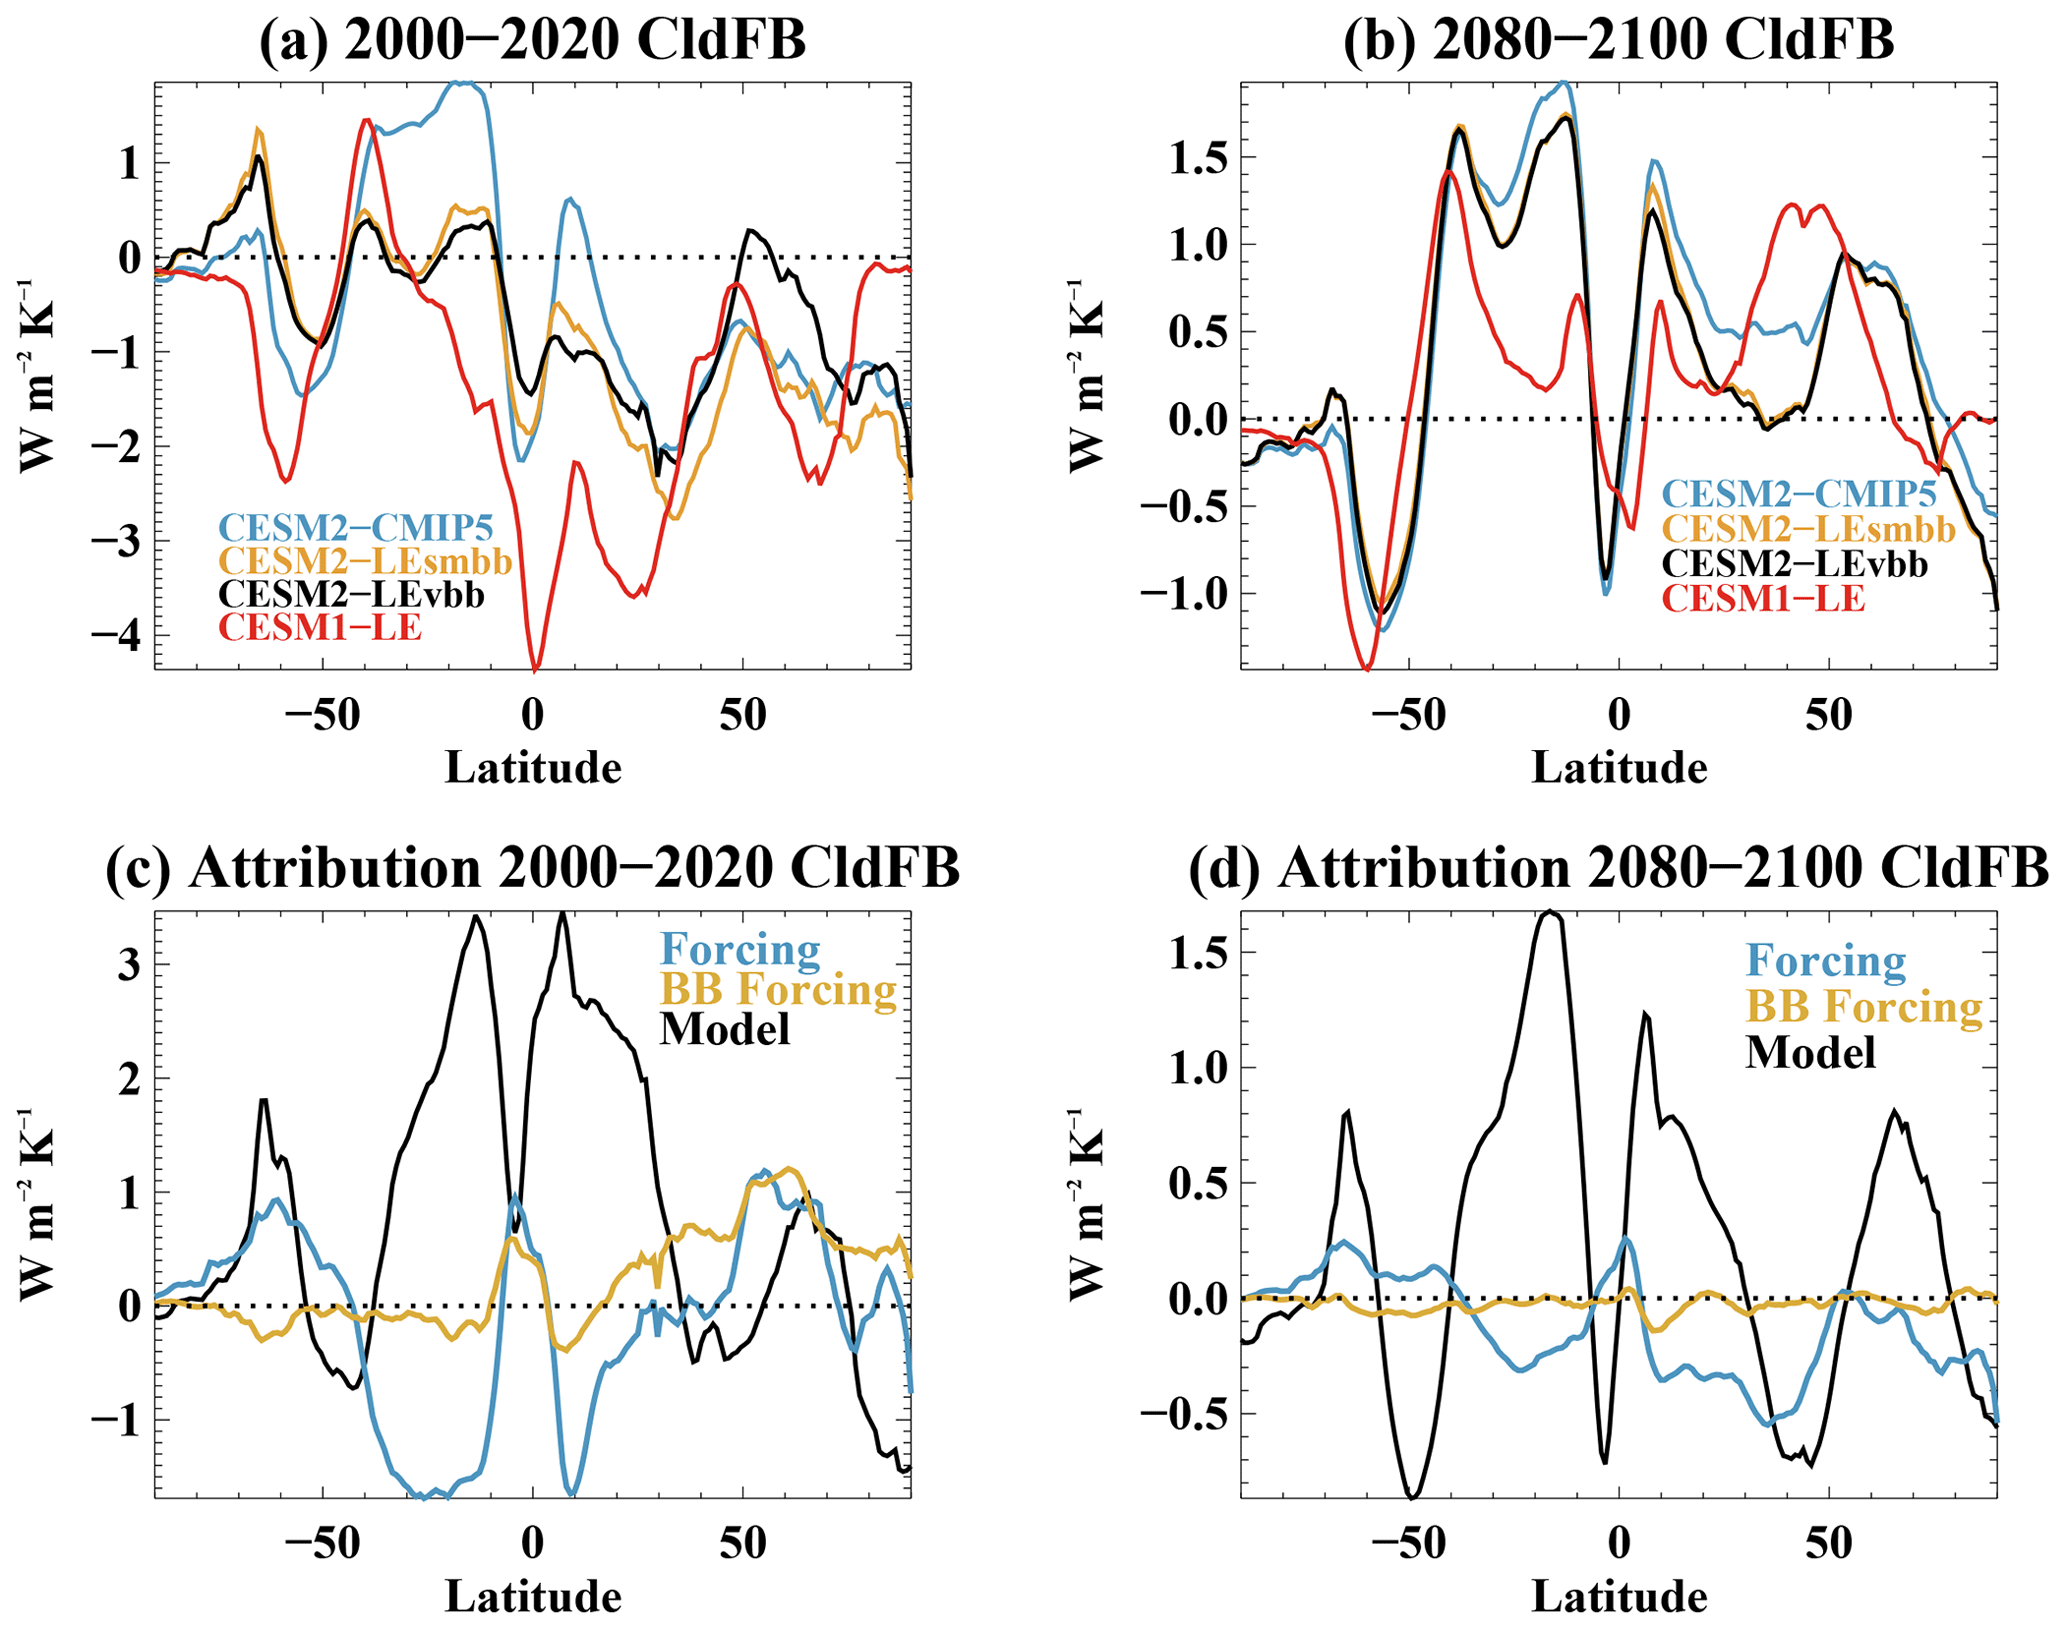
Figure 9The zonal mean SW cloud feedback estimated from the APRP method for (a) the 2000–2020 average, (b) the 2080–2100 average, and the attribution of differences in the SW cloud feedback in CESM2-LE versus CESM1-LE to model and forcing uncertainty for the (c) 2000–2020 average feedback and (d) the 2080–2100 average feedback.
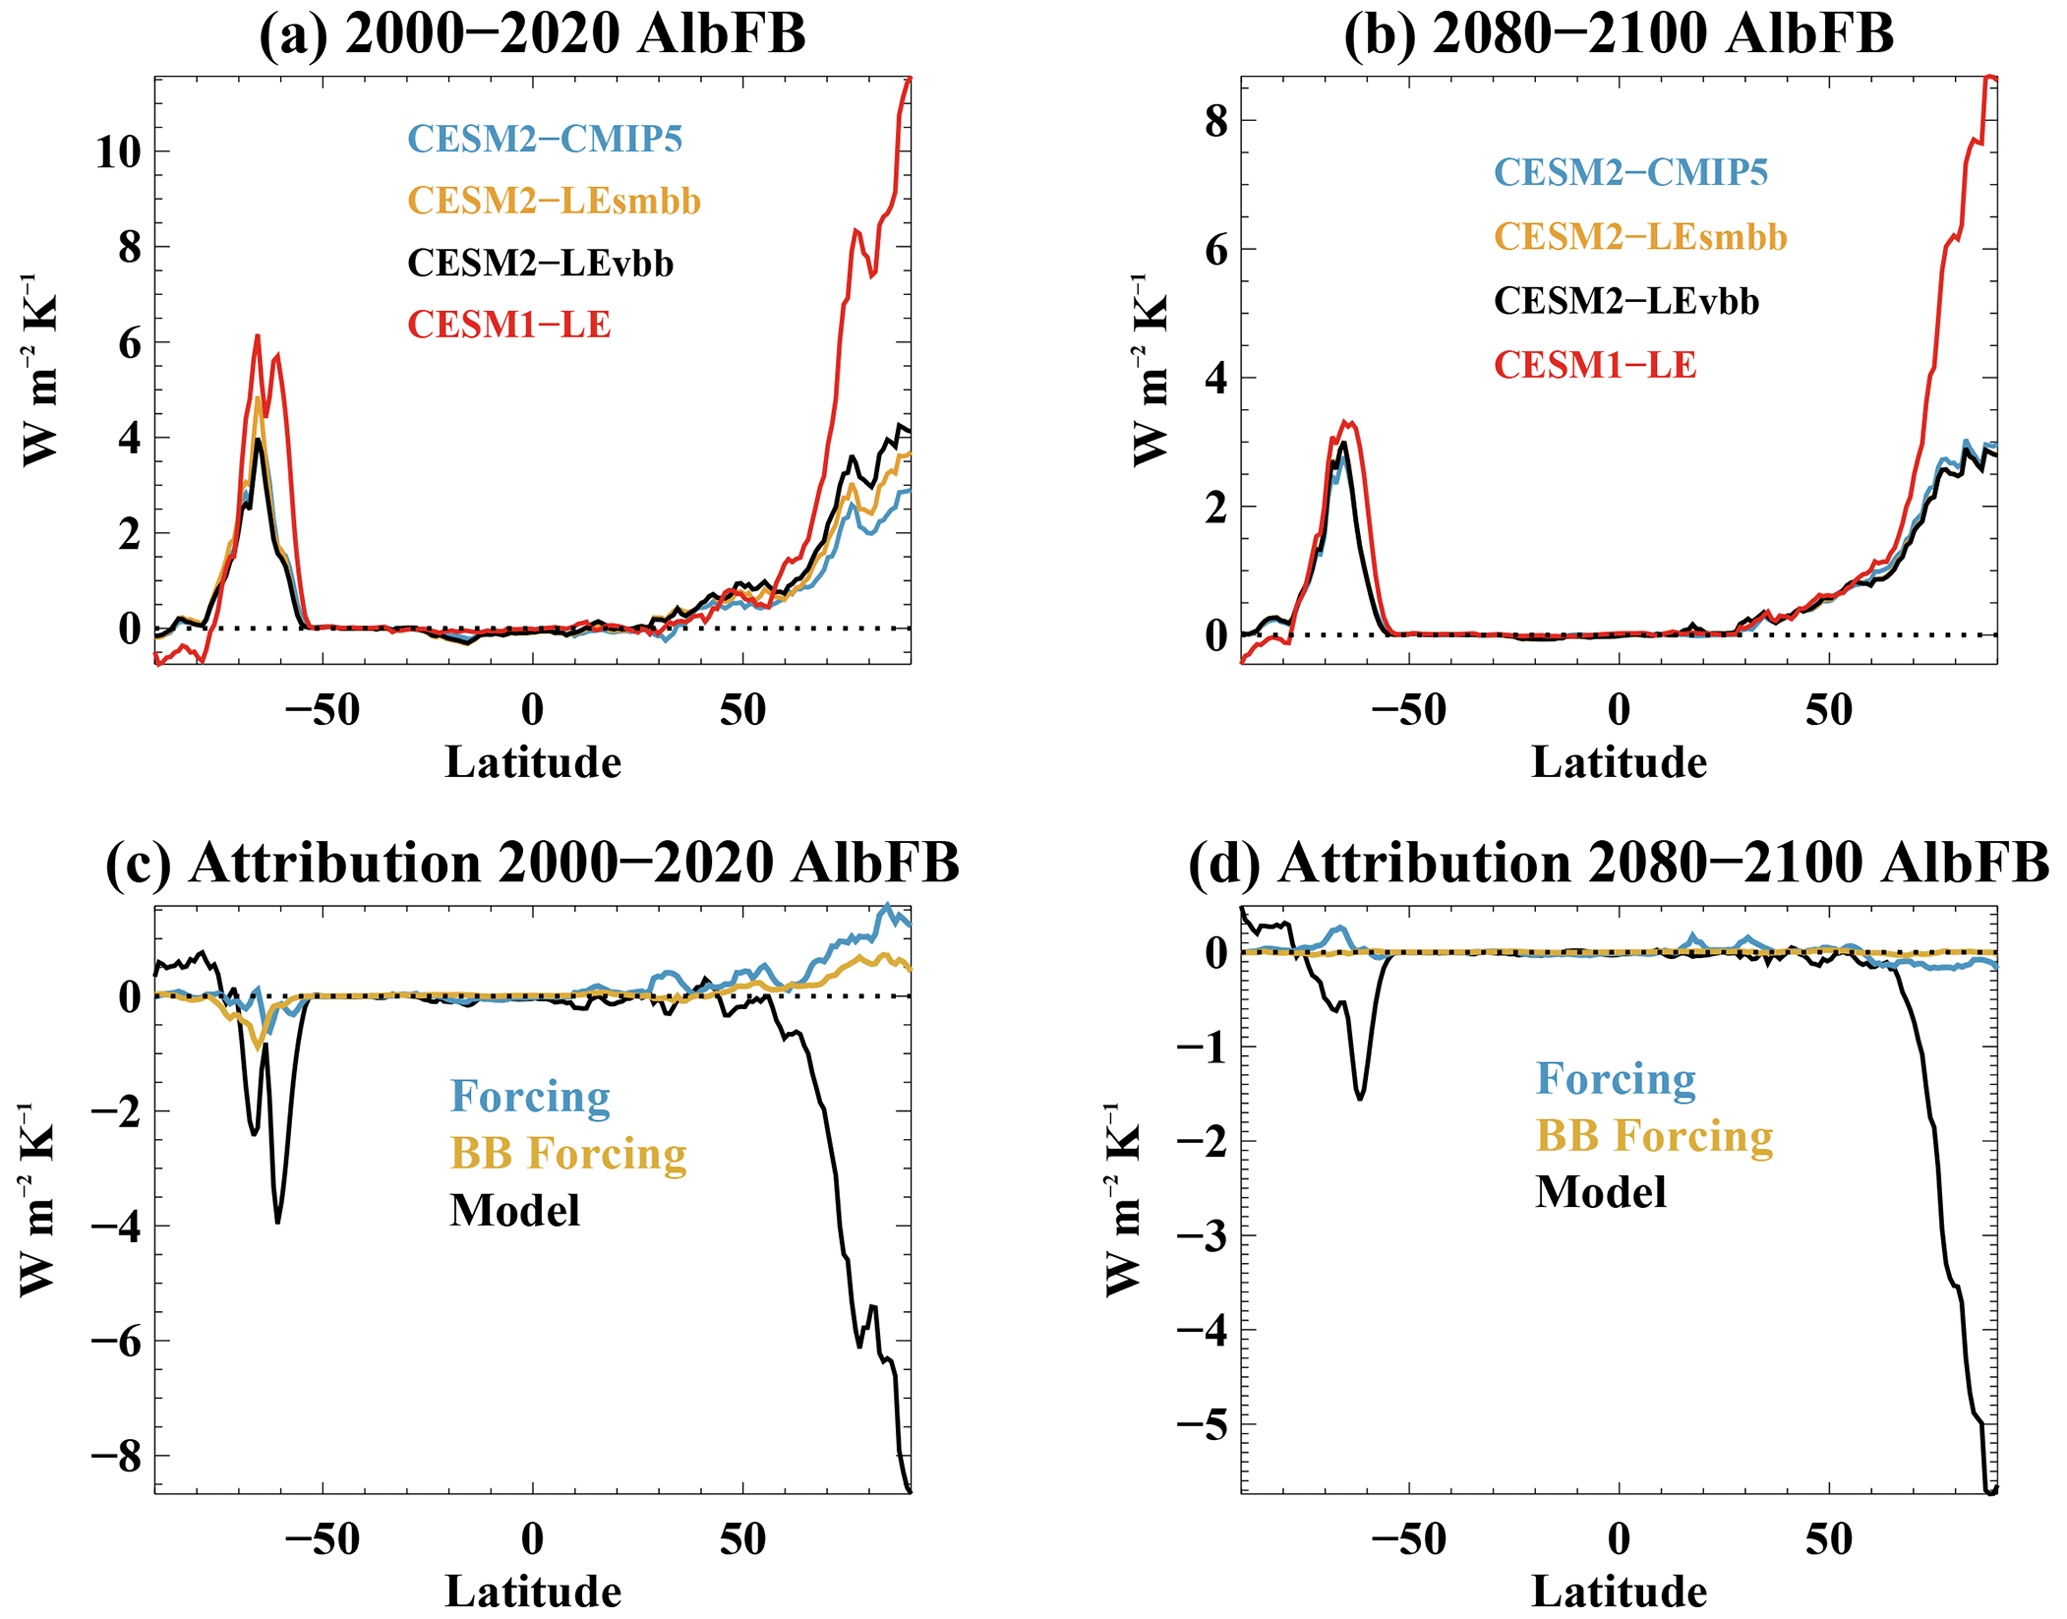
Figure 10The zonal mean surface albedo feedback estimated from the APRP method for (a) the 2000–2020 average and (b) the 2080–2100 average and the attribution of differences in the surface albedo feedback in CESM2-LE versus CESM1-LE to model and forcing uncertainty for the (c) 2000–2020 average feedback and (d) the 2080–2100 average feedback.
4.3 Arctic change
The zonal average comparison points to large changes in the Arctic between CESM2-LE and CESM1-LE in which the attribution to model structure, external forcing, and the relative compensation of the two, changes over time. Additionally, the net SW analysis implicates Arctic cryospheric changes. As such, we assess differences in Arctic amplification and sea ice across the simulations.
The Arctic amplification (AA) factor, defined as the surface air temperature change for 70–90∘ N divided by the global surface air temperature change, is shown in Fig. 11. Results are shown for 10-year running average changes. As discussed by Holland and Landrum (2021), AA typically emerges from background climate noise around 2000 (see also England et al., 2021), and model simulations often exhibit transient changes in AA over the 21st century. At the beginning of the 21st century, CESM2-LE simulates higher AA than CESM1-LE, consistent with the larger CMIP6-driven Arctic warming (Fig. 7). The AA in CESM2-LE declines rapidly in the 21st century, reaching values lower than that of CESM1-LE after 2020. Throughout the 21st century, model structure drives this reduced AA in CESM2 relative to CESM1, consistent with its influence on Arctic warming. From the mid-21st century onwards, forcing differences play a minimal role in the AA differences in the CESM2-LE and CESM1-LE simulations. This indicates that while the forcing is quite different during this period, with effects on the absolute warming, it has limited influence on the amplification of global warming in the Arctic.
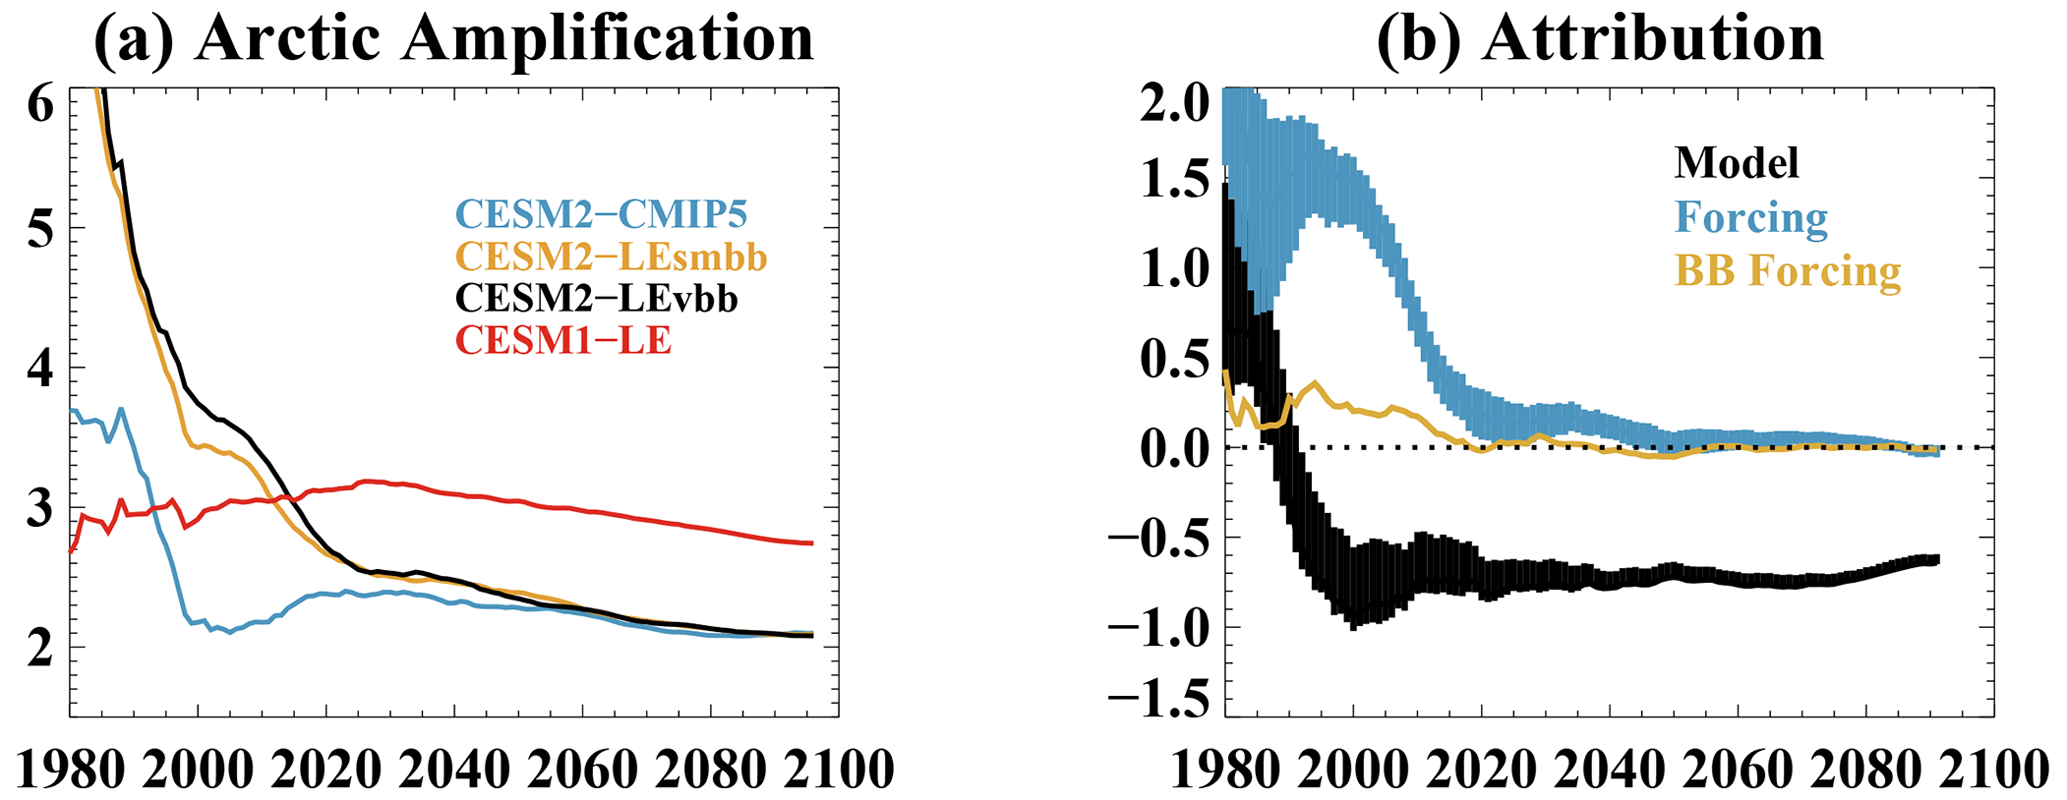
Figure 11The (a) simulated ensemble mean Arctic amplification (AA) factor and (b) attribution of differences in the AA factor in CESM2-LE versus CESM1-LE to model structure and forcing differences. As described in Sect. 3, the ranges shown for the model and forcing attributions represent the 2.5th–97.5th percentile of 1000 bootstrapped samples.
In September, CESM2-LE has a lower ice area throughout the 20th century relative to CESM1-LE (Fig. 12a) (see also DeRepentigny et al., 2020; DuVivier et al., 2020). This sea ice difference between the two models is a consequence of the model structure (Fig. 12b). All the simulations reach near-ice-free conditions in September by mid-21st century. There is a larger loss of ice area in CESM1-LE than in CESM2-LE, which contributes to the larger surface albedo feedback in that model (Fig. 10; see also Schneider et al., 2022, their Fig. 3). Surface characteristics of the sea ice also likely influence model differences in the early 21st century albedo feedback. For example, the higher CESM1-LE feedback is consistent with thicker and more extensive snow cover on the sea ice (Webster et al., 2020) and a higher initial surface albedo. The influence of forcing uncertainty on the September sea ice area is relatively small, except for the 2000–2020 period when CMIP6 forcing leads to more rapid sea ice loss. A comparison of the CESM2-LEvbb and CESM2-LEsmbb simulations indicates that the changing variability in biomass burning emissions, highlighted as an important driver of September ice loss in DeRepentigny et al. (2022), is about half the magnitude of the total influence of the CMIP6 versus CMIP5 forcing difference.
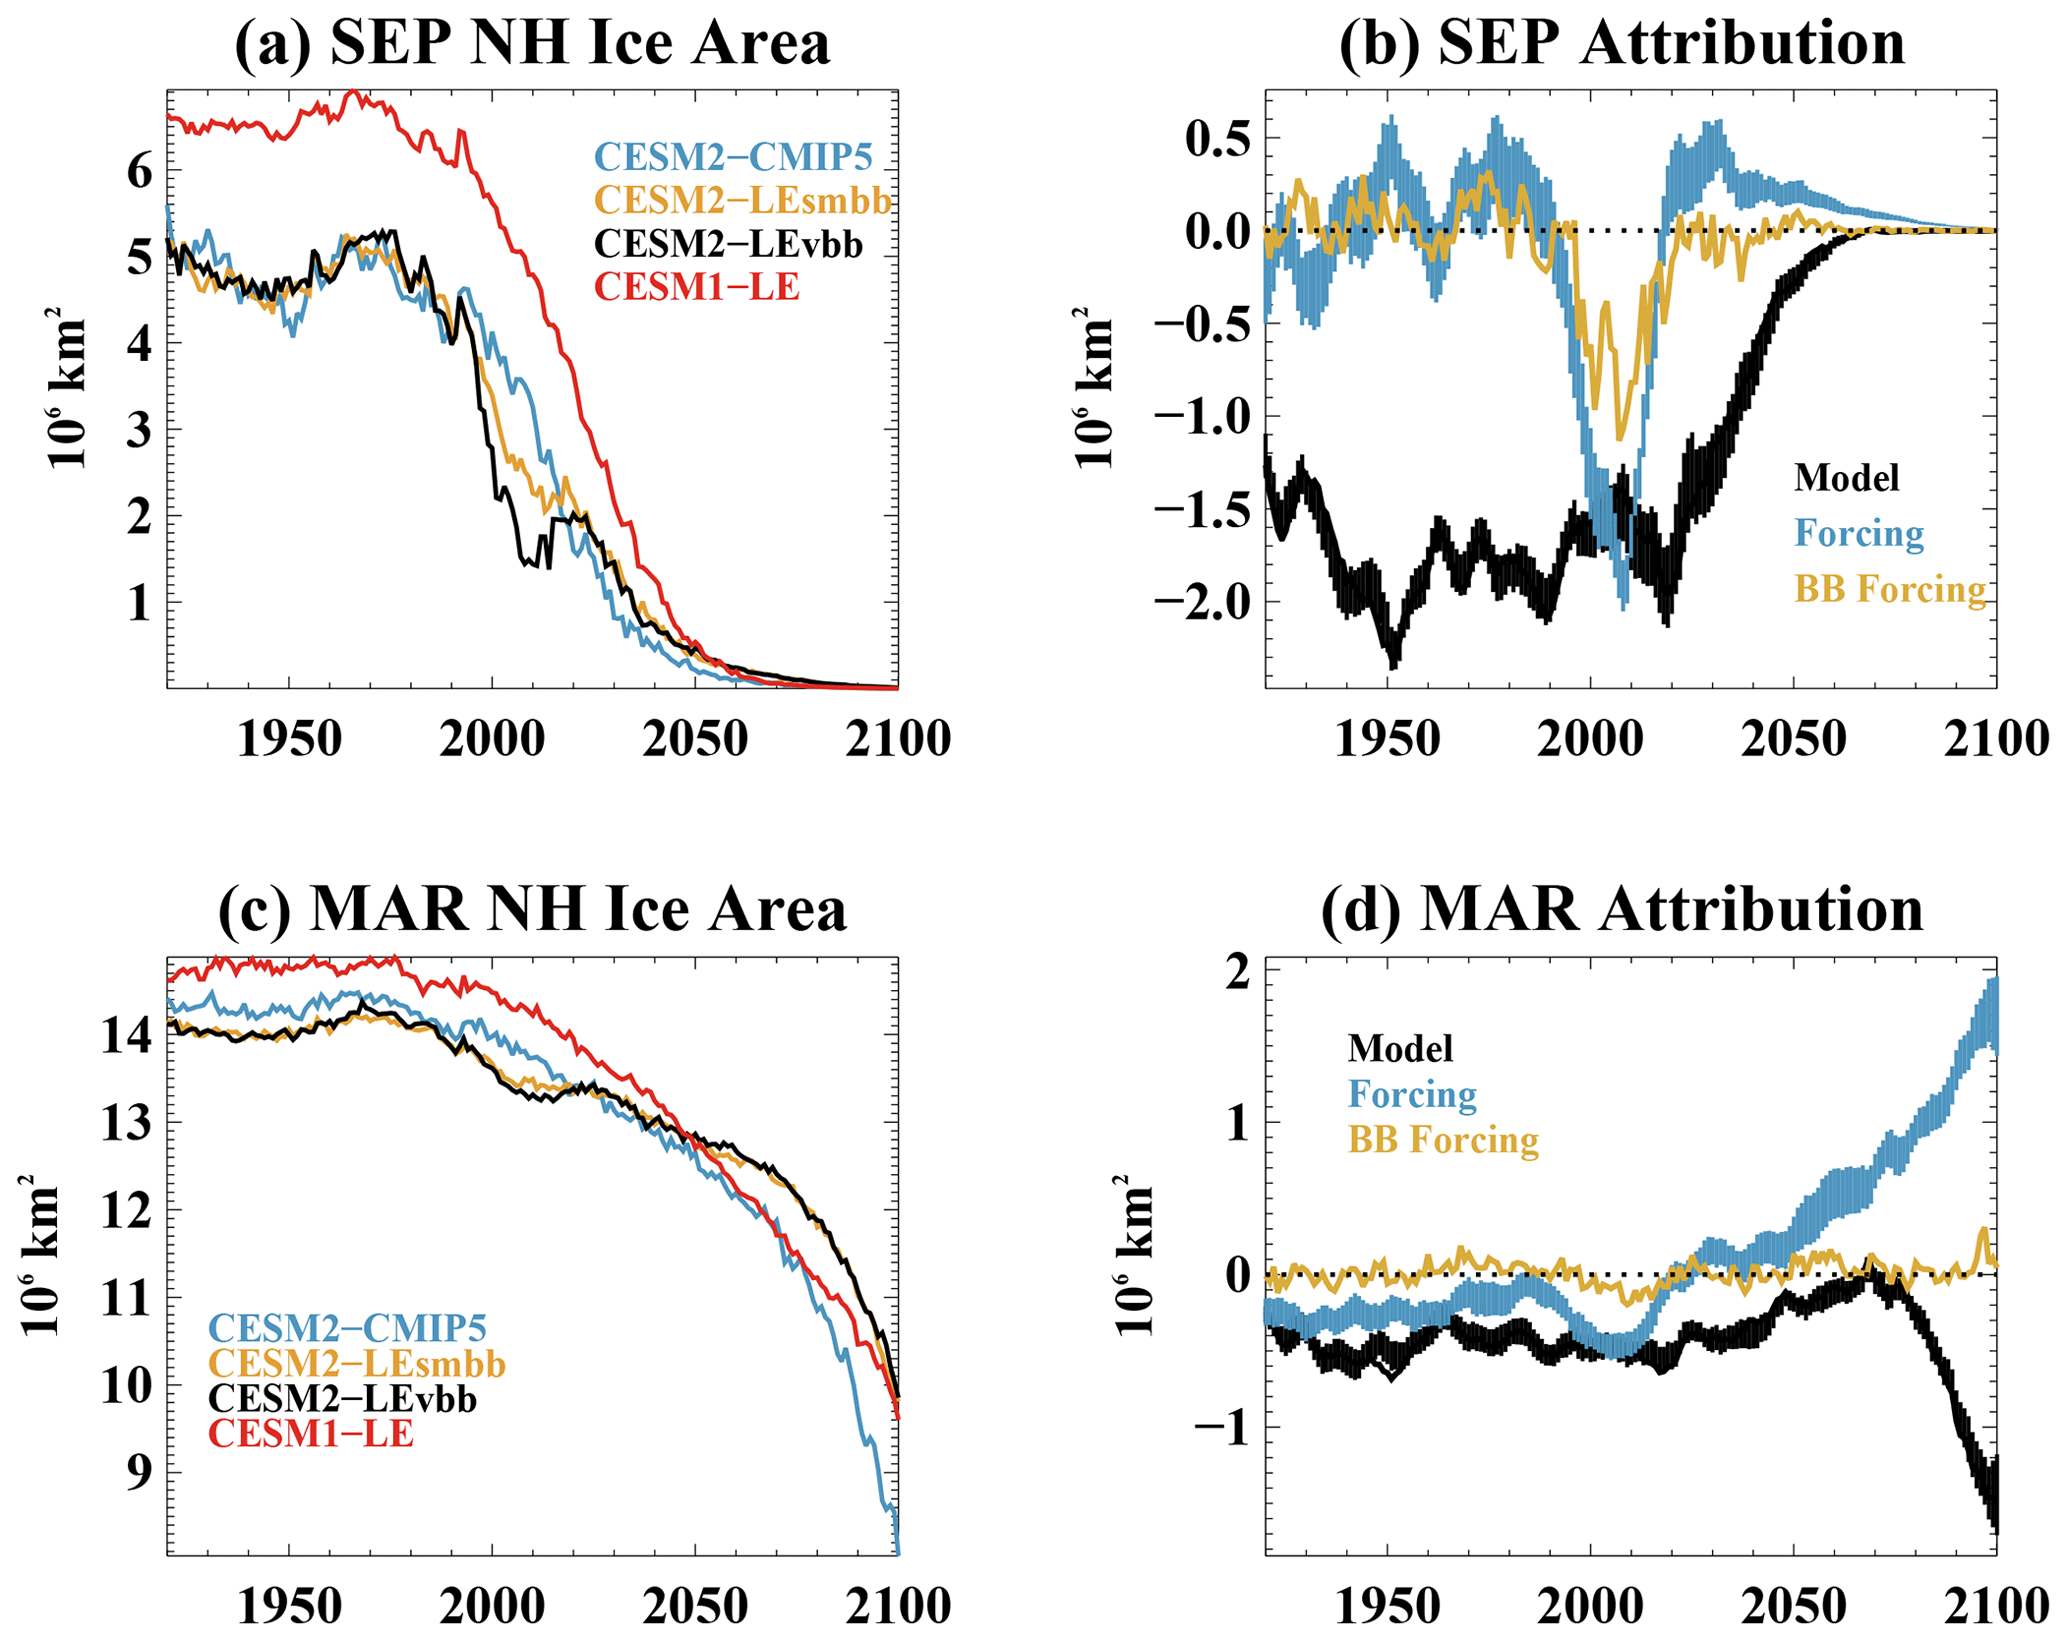
Figure 12The time series of Northern Hemisphere (a) September sea ice area. (b) Attribution of CESM2-LE versus CESM1-LE September ice area differences to model and forcing uncertainty. (c) March sea ice area. (d) Attribution of CESM2-LE versus CESM1-LE March ice area differences to model and forcing uncertainty. As described in Sect. 3, the ranges shown for the model and forcing attributions represent the 2.5th–97.5th percentile of 1000 bootstrapped samples.
As compared to CESM1-LE, CESM2-LE has a lower March Arctic sea ice cover through the mid-21st century (Fig. 12c). Both model structure and external forcing contribute to the lower 20th century sea ice, with model structure playing a larger role (Fig. 12d). Starting around the mid-21st century, CMIP6 forcing leads to reduced loss of the March sea ice area, as compared to the CMIP5 forcing, consistent with the SSP3–7.0 forcing relative to RCP8.5. However, after 2070, the model structure enhances the CESM2 March sea ice area loss. As a result, CESM2-LE and CESM1-LE obtain a similar March sea ice area in 2100, despite a weaker winter sea ice area loss in CESM2-LE prior to 2070.
There are multiple sources of uncertainty in climate model simulations including internal variability, model structural uncertainty, and external forcing uncertainty, the latter of which is typically called scenario uncertainty for future projections (e.g., Hawkins and Sutton, 2009). Large initial-condition ensemble simulations enable the separation of internal variability from forced changes in climate properties and generally allow for a more robust comparison to observations (although this can depend on how well the internal variability is simulated). Ideally, comparisons of large ensembles across model generations or phases of CMIP could provide insight into model improvements over time. However, in addition to structural model changes, the external forcing used in progressive phases of CMIP changes for both historical aerosol emissions and the future scenario forcing of aerosols and greenhouse gases. Here we present CESM community simulations that, together with the existing large ensembles of CESM1 (a CMIP5-era model) and CESM2 (a CMIP6-era model), enable us to quantify the relative importance of the model structure versus forcing uncertainty within the context of the CESM large ensembles. This is useful for both the historical period, when uncertainties in aerosol emissions and other forcings play a role, and for the 21st century, where considerably different scenarios applied in CESM1-LE and CESM2-LE limit the ability to attribute differences in their 21st century climate response to model structural differences. These new CESM2–CMIP5 simulations use the CESM2 model but subject to the CMIP5 forcing used in CESM1-LE. They are available for community use, which will enable further exploration of the relative importance of model structure and forcing uncertainty for simulated climate characteristics.
For the historical period, we find that the forcing uncertainty inherent in the CMIP5 to CMIP6 differences can be as sizable as the CESM1 to CESM2 model physics differences. On the global mean, the CMIP6 forcing drives a reduced ocean heat uptake, and global surface air temperature change relative to the CMIP5 forcing. Model structural changes between CESM2 and CESM1 counteract this and drive the larger global average warming in CESM2. This is largely a consequence of the differences in changing cloud conditions and their role in shortwave radiation budgets. Because of the compensating effects of forcing and model structure, the CESM2-LE and CESM1-LE models simulate a similar historical global warming.
The influences of model and forcing uncertainty in the CESM2-LE to CESM1-LE differences are not uniform across the globe. For the 2000–2020 average, the Arctic region exhibits a distinct signal that contrasts with the global mean, with CMIP6 forcing driving increased historical warming that is counteracted by the CESM2 model structure. Some fraction of this Arctic response may be due to the influence of changing variability in biomass burning emissions that is present in CMIP6 but not in CMIP5 (Fasullo et al., 2022; DeRepentigny et al., 2022). However, biomass burning variability typically accounts for less than half of the difference that is attributable to the CMIP6 versus CMIP5 forcing. Feedback analysis suggests that the historical differences in regional warming and their attribution to model and forcing uncertainty largely arise from the influence of changing cloud properties on global shortwave budgets, with surface albedo changes also playing a role in high latitudes. Given the interactions with clouds, our analysis suggests that not only do the total emissions matter but also that their spatial and seasonal distributions are important and can be an important source of uncertainty in historical climate simulations.
In the 21st century projections, the lower greenhouse gases and higher aerosol emissions of the CMIP6 SSP3–7.0 scenario relative to the CMIP5 RCP8.5 scenario is evident and decreases warming for all latitudes. Note that there are specifics of the individual SSP scenarios, and in particular, the SSP3–7.0 scenario used here is a high-aerosol-emission scenario; so the results presented here are not broadly representative of an RCP versus SSP difference but are instead specific to these individual scenarios. The simulations presented here enable us to quantify the role of model structure in 21st century change simulated by CESM2-LE and CESM1-LE, despite the very different scenario forcing that was used. This influence of model structure is generally consistent for changing climate conditions across the 20th and 21st centuries. In the 21st century, model structural differences are responsible for a different meridional pattern of warming. In particular, the CESM2 model structure causes more tropical warming but less Arctic warming relative to CESM1. Feedback analysis reveals that in the tropics this is largely associated with the influence of clouds on shortwave radiation, whereas in the Arctic the surface albedo feedback plays an important role. This is consistent with differences in shortwave cloud feedbacks between the model versions, as identified in previous work (e.g., Gettelman et al., 2019; Bacmeister et al., 2020; Schneider et al., 2022). As a result of the different meridional structure of warming, the Arctic amplification in CESM2-LE is considerably smaller than in CESM1-LE by 2100.
Our study illustrates that forcing uncertainty plays an important role in simulations of both historical and future conditions. Notably, for many of the climate properties assessed here, the historical forcing uncertainty is comparable to the structural uncertainty associated with different model generations within the same model family. Fyfe et al. (2021) document a similar finding for results from the Canadian Earth System Model (CanESM). There are fundamental differences across all components of CESM2 relative to CESM1, making them considerably different models. The availability of simulations that enables a robust comparison across different climate model generations, such as the CESM2–CMIP5 simulations presented here, is valuable for disentangling the sources of uncertainty in historical and future simulations. A better quantification of historical forcing uncertainty provides a useful context for model assessments that rely on comparisons to the observational record. Future intercomparison projects should seek to better quantify the role of historical forcing uncertainty for simulated climate; for example, through dedicated experiments with forcing used in earlier CMIP phases. Exploring forcing uncertainty within multiple models and for multiple forcing sets is important, given that the simulated response to various forcings is dependent on model structure and can be non-linear, due to a state dependence of climate feedbacks. Note that the availability of similar simulations for the CanESM (Fyfe et al., 2021) currently allows for a multi-model investigation of some of the high-level findings shown here, such as whether the compensation of model structure and forcing uncertainty is a general characteristic of climate simulations or is instead specific to the CESM family of models. Additionally, given the many differences in climate variability and change simulated by CESM2-LE and CESM1-LE, the publicly available CESM2–CMIP5 simulations will enable future work diagnosing the role of model structure and external forcing on these simulated properties.
The model code needed to run the CESM2–CMIP5 simulations and information on case setups are available from https://doi.org/10.5281/zenodo.8169925 (Hannay and Holland, 2023). Data from the CESM1-LE are available through the National Center for Atmospheric Research (NCAR) Climate Data Gateway and instructions for data access are available from https://doi.org/10.5065/d6j101d1 (Kay and Deser, 2016). Data from the CESM2-LE are also available from NCAR's Climate Data Gateway, with instructions for access at https://doi.org/10.26024/kgmp-c556 (CESM2_LE_OUTPUT, 2024). The CESM2–CMIP5 simulations presented here are available from the Climate Data Gateway at https://doi.org/10.26024/4zgv-rt74 (Holland and Hannay, 2024) (https://www.earthsystemgrid.org/dataset/ucar.cgd.cesm2.cmip5.forcing.html, last access: 14 February 2024). The post-processed data files used for this article, including global mean and zonal mean time series of various quantities and feedback analyses, are available as a child dataset from the Climate Data Gateway (https://doi.org/10.26024/4zgv-rt74, Holland and Hannay, 2024).
The supplement related to this article is available online at: https://doi.org/10.5194/gmd-17-1585-2024-supplement.
MMH and CH designed the experiments. CH and DB performed the runs. WW, PL, and EK aided in the simulation setup. JF, IRS, AJ, and JEK provided analysis in support of the study. MMH wrote the paper, with input from all authors.
The contact author has declared that none of the authors has any competing interests.
Publisher’s note: Copernicus Publications remains neutral with regard to jurisdictional claims made in the text, published maps, institutional affiliations, or any other geographical representation in this paper. While Copernicus Publications makes every effort to include appropriate place names, the final responsibility lies with the authors.
The CESM project has been supported primary by the National Science Foundation. This material is based on work supported by the National Center for Atmospheric Research, which is a major facility sponsored by the National Science Foundation (NSF; under cooperative agreement no. 1852977). Computing and data storage resources, including the Cheyenne supercomputer (https://doi.org/10.5065/D6RX99HX, Computational and Information Systems Laboratory, 2019), were provided by the Computational and Information Systems Laboratory at NCAR. We thank all the scientists, software engineers, and administrators who contributed to the development and availability of CESM. We thank Simone Tilmes and Louisa Emmons for their help with emissions forcing datasets. The efforts of John Fasullo in this work have been supported by NASA Awards (grant nos. 80NSSC17K0565 and 80NSSC22K0046) and by the Regional and Global Model Analysis (RGMA) component of the Earth and Environmental System Modeling Program of the U.S. Department of Energy's Office of Biological and Environmental Research (BER) via National Science Foundation (IA 1947282). Alexandra Jahn acknowledges support from NSF CAREER award (OPP – 1847398).
This research has been supported by the Directorate for Geosciences, Division of Atmospheric and Geospace Sciences (grant no. 1852977), the Directorate for Geosciences, Office of Polar Programs (grant nos. 1847398 and 2138788), and NASA (grant nos. 80NSSC17Ko565 and 80NSSC22K0046).
This paper was edited by Po-Lun Ma and reviewed by two anonymous referees.
Bacmeister, J. T., Hannay, C., Medeiros, B., Gettelman, A., Neale, R., Fredriksen, H. B., Lipscomb, W. H., Simpson, I., Bailey, D. A., Holland, M., Lindsay, K., and Otto-Bliesner, B.: CO2 increase experiments using the CESM: Relationship to climate sensitivity and comparison of CESM1 to CESM2, J. Adv. Model. Earth Sy., 12, e2020MS002120, https://doi.org/10.1029/2020MS002120, 2020.
CESM2_LE_OUTPUT: Model output for CESM2-LE presented in Rodgers et al., 2021, UCAR [data set], https://doi.org/10.26024/kgmp-c556, 2024.
Computational and Information Systems Laboratory: Cheyenne: HPE/SGI ICE XA System (NCAR Community Computing), Boulder, CO, National Center for Atmospheric Research, https://doi.org/10.5065/D6RX99HX, 2019.
Danabasoglu, G., Lamarque, J.-F., Bacmeister, J., Bailey, D. A., DuVivier, A. K., Edwards, J., Emmons, L. K., Fasullo, J., Garcia, R., Gettelman, A., Hannay, C., Holland, M. M., Large, W. G., Lauritzen, P. H., Lawrence, D. H., Lenaerts, J. T. M., Lindsay, K., Lipscomb, W. H., Mills, M. J., Neale, R., Oleson, K. W., Otto-Bliesner, B., Phillips, A. S., Sacks, W., Tilmes, S., van Kampenhout, L., Vertenstein, M., Bertini, A., Dennis, J., Deser, C., Fischer, C., Fox-Kemper, B., Kay, J. E., Kinnison, D., Kushner, P., Larson, V. E., Long, M. C., Mickelson, S., Moore, J. K., Nienhouse, E., Polvani, L., Rasch, P. J., and Strand, W. G.: The Community Earth System Model Version 2 (CESM2), J. Adv. Model. Earth Sy., 12, e2019MS001916, https://doi.org/10.1029/2019MS001916, 2020.
DeRepentigny, P., Jahn, A., Holland, M. M., and Smith, A.: Arctic sea ice in two congiruations of the CESM2 during the 20th and 21st centuries, J. Geophys. Res.-Oceans, https://doi.org/10.1029/2020JC016133, 2020.
DeRepentigny, P., Jahn, A., Holland, M. M., Kay, J. E., Fasullo, J. T., Lamarque, J.-F., Hannay, C., Mills, M. J., Bailey, D. A., Tilmes, S., and Barrett, A.: Enhanced simulated early 21st century Arctic sea ice loss due to CMIP6 biomass burning emissions, Science Advances, 8, eabo2405, https://doi.org/10.1126/sciadv.abo2405, 2022.
Deser, C., Lehner, F., Rodgers, K. B., Ault, T., Delworth, T. L., DiNezio, P. N., Fiore, A., Frankignoul, C., Fyfe, J. C., Horton, D. E., Kay, J. E., Knutti, R., Lovenduski, N. S., Marotzke, J., McKinnon, K. A., Minobe, S., Randerson, J., Screen, J. A., Simpson, I. R., and Ting, M.: Insights from Earth system model initial-condition large ensembles and future prospects, Nat. Clim. Change, 10, 277–286, https://doi.org/10.1038/s41558-020-0731-2, 2020.
DuVivier, A. K., Holland, M. M., Kay, J. E., Tilmes, S., Gettelman, A., and Bailey, D.: Arctic and Antarctic sea ice state in the Community Earth System Model Version 2, J. Geophys. Res.-Oceans, 125, e2019JC015934, https://doi.org/10.1029/2019JC015934, 2020.
England, M. R., Eisenman, I., Lutsko, N. J., and Wagner, T. J. W.: The recent emergence of Arctic amplification, Geophys. Res. Lett., 48, e2021GL094086, https://doi.org/10.1029/2021GL094086, 2021.
Eyring, V., Bony, S., Meehl, G. A., Senior, C. A., Stevens, B., Stouffer, R. J., and Taylor, K. E.: Overview of the Coupled Model Intercomparison Project Phase 6 (CMIP6) experimental design and organization, Geosci. Model Dev., 9, 1937–1958, https://doi.org/10.5194/gmd-9-1937-2016, 2016.
Fasullo, J. T., Lamarque, J.-F., Hannay, C., Rosenbloom, N., Tilmes, S., DeRepentigny, P., Jahn, A., and Deser, C.: Spurious late historical-era warming in CESM2 driven by prescribed biomass burning emissions, Geophys. Res. Lett., 49, e2021GL097420, https://doi.org/10.1029/2021GL097420, 2022.
Fyfe, J. C., Kharin, V. V., Santer, B. D., Cole, J. N. S., and Gillett, N. P.: Significant impact of forcing uncertainty in a large ensemble of climate model simulations, P. Natl. Acad. Sci. USA, 118, e2016549118, https://doi.org/10.1073/pnas.2016549118, 2021.
Gettelman, A. and Morrison, H.: Advanced two-moment bulk microphysics for global models. Part 2: Off-line tests and comparison with other schemes, J. Climate, 28, 1268–1287, 2015.
Gettelman, A., Hannay, C., Bacmeister, J. T., Neale, R. B., Pendergrass, A. G., Danabasoglu, G., Lamarque, J.-F., Fasullo, J. T., Bailey, D. A., Lawrence, D. M., and Mills, M. J.: High climate sensitivity in the Community Earth System Model Version 2 (CESM2), Geophys. Res. Lett., 46, 8329–8337, https://doi.org/10.1029/2019GL083978, 2019a.
Gettelman, A., Mills, M. J., Kinnison, D. E., Garcia, R. R., Smith, A. K., Marsh, D. R., Tilmes, S., Vitt, F., Bardeen, C. G., McInerny, J., Liu, H.-L., Solomon, S. C., Polvani, L. M., Emmons, L. K., Lamarque, J.-F., Richter, J. H., Glanville, A. S., Bacmeister, J. T., Phillips, A. S., Neale, R. B., Simpson, I. R., DuVivier, A. K., Hodzic, A., and Randel, W. J.: The Whole Atmosphere Community Climate Model Version6 (WACCM6), J. Geophys. Res.-Atmos., 124, 12380–12403, https://doi.org/10.1029/2019JD030943, 2019b.
Gidden, M. J., Riahi, K., Smith, S. J., Fujimori, S., Luderer, G., Kriegler, E., van Vuuren, D. P., van den Berg, M., Feng, L., Klein, D., Calvin, K., Doelman, J. C., Frank, S., Fricko, O., Harmsen, M., Hasegawa, T., Havlik, P., Hilaire, J., Hoesly, R., Horing, J., Popp, A., Stehfest, E., and Takahashi, K.: Global emissions pathways under different socioeconomic scenarios for use in CMIP6: a dataset of harmonized emissions trajectories through the end of the century, Geosci. Model Dev., 12, 1443–1475, https://doi.org/10.5194/gmd-12-1443-2019, 2019.
Golaz, J.-C., Larson, V. E., and Cotton, W. R.: A PDF-based model for boundary layer clouds. Part I: Method and model description, J. Atmos. Sci., 59, 3540–3551, 2002.
Hannay, C. and Holland, M: NCAR/CESM2-CMIP5: CESM2-CMIP5 experiments (v1.1) (CESM2-CMIP1-v1.1), Zenodo [code], https://doi.org/10.5281/zenodo.8169925, 2023.
Hawkins, E. and Sutton, R.: The potential to narrow uncertainty in regional climate predictions, B. Am. Meteorol. Soc., 90, 1095–1108, 2009.
Heyblom, K. B., Singh, H. A., Rasch, P. J., and DeRepentigny, P.: Increased variability of biomass burning emissions in CMIP6 amplifies hydrologic cycle in the CESM2 large ensemble, Geophys. Res. Lett., 49, e2021GL096868, https://doi.org/10.1029/2021GL096868, 2022.
Holland, M. and Hannay, C.: CESM2-CMIP5 Forcing, NCAR [data set], https://doi.org/10.26024/4zgv-rt74, 2024.
Holland, M. M. and Landrum, L.: The emergence and transient nature of Arctic amplification in coupled climate models, Frontiers, 9, 719024, https://doi.org/10.3389/feart.2021.719024, 2021.
Hunke, E. C., Hebert, D. A., and Lecomte, O.: Level-ice melt ponds in the Los Alamos sea ice model, CICE, Ocean Model., 71, 26–42, 2013.
Hurrell, J. W., Holland, M. M., Gent, P. R., Ghan, S., Kay, J. E., Kushner, P. J., Lamarque, J.-F., Large, W. G., Lawrence, D., Lindsay, K., Lipscomb, W. H., Long, M. C., Mahowald, N., Marsh, D. R., Neale, R. B., Rasch, P., Vavrus, S., Vertenstein, M., Bader, D., Collins, W. D., Hack, J. J., Kiehl, J., and Marshall, S.: The Community Earth System Model: A Framework for Collaborative Research, B. Am. Meteorol. Soc., 94, 1339–1360, 2013.
Kay, J. and Deser, C.: The Community Earth System Model (CESM) Large Ensemble Project, UCAR/NCAR Climate Data Gateway [data set], https://doi.org/10.5065/d6j101d1, 2016.
Kay, J. E., Deser, C., Phillips, A., Mai, A., Hannay, C., Strand, G., Arblaster, J. M., Bates, S. C., Danabasoglu, G., Edwards, J., Holland, M., Kushner, P., Lamarque, J.-F., Lawrence, D., Lindsay, K., Middleton, A., Munoz, E., Neale, R., Oleson, K., Polvani, L., and Vertenstein, M.: The Community Earth System Model (CESM) Large Ensemble Project, B. Am. Meteorol. Soc., 96, 1333–1349, 2015.
Lamarque, J.-F., Bond, T. C., Eyring, V., Granier, C., Heil, A., Klimont, Z., Lee, D., Liousse, C., Mieville, A., Owen, B., Schultz, M. G., Shindell, D., Smith, S. J., Stehfest, E., Van Aardenne, J., Cooper, O. R., Kainuma, M., Mahowald, N., McConnell, J. R., Naik, V., Riahi, K., and van Vuuren, D. P.: Historical (1850–2000) gridded anthropogenic and biomass burning emissions of reactive gases and aerosols: methodology and application, Atmos. Chem. Phys., 10, 7017–7039, https://doi.org/10.5194/acp-10-7017-2010, 2010.
Larson, V. E.: CLUBB-SILHS: A parameterization of subgrid variability in the atmosphere, arXive [preprint], https://doi.org/10.48550/arXiv.1711.03675, 2017.
Lawrence, D. M., Fisher, R. A., Koven, C. D., Oleson, K. W., Swenson, S. C., Bonan, G., Collier, N., Ghimire, B., van Kampenhout, L., Kennedy, D., Kluzek, E., Lawrence, P. J., Li, F., Li, H., Lombardozzi, D., Riley, W. J., Sacks, W. J., Shi, M., Vertenstein, M., Wider, W. R., Xu, C., Ali, A. A., Badger, A. M., Bisht, G., van den Broeke, M., Brunke, M. A., Burns, S. P., Buzan, J., Clark, M., Craig, A., Dahlin, K., Drewniak, B., Fisher, J. B., Flanner, M., Fox, A. M., Gentine, P., Hoffman, F., Keppel-Aleks, G., Knox, R., Kumar, S., Lenaerts, J., Leung, L. R., Lipscomb, H. W., Lu, Y., Pandey, A., Pelletier, J. D., Perket, J., Randerson, J. T., Ricciuto, D. M., Sanderson, B. M., Slater, A., Subin, Z. M., Tang, J., Thomas, R. W., Martin, M. V., and Zeng, X.: The Community Land Model, version 5: Description of new features, benchmarking and impact of forcing uncertainty, J. Adv. Model. Earth Sy., 11, 4245–4287, 2019.
Li, Q., Webb, A., Fox-Kemper, B., Craig, A., Danabasoglu, G., Large, W. G., and Vertenstein, M.: Langmuir mixing effects on global climate: WAVEWATCH III in CESM, Ocean Model., 103, 145–160, 2016.
Liu, X., Ma, P.-L., Wang, H., Tilmes, S., Singh, B., Easter, R. C., Ghan, S. J., and Rasch, P. J.: Description and evaluation of a new four-mode version of the Modal Aerosol Module (MAM4) within version 5.3 of the Community Atmosphere Model, Geosci. Model Dev., 9, 505–522, https://doi.org/10.5194/gmd-9-505-2016, 2016.
Marsh, D. R., Mills, M. J., Kinnison, D. E., Lamarque, J.-F., Calvo, N., and Polvani, L. M.: Climate change from 1850 to 2005 simulated in CESM1(WACCM), J. Climate, 26, 7372–7391, https://doi.org/10.1175/JCLI-D-12-00558.1, 2013.
Meinshausen, M., Smith, S. J., Calvin, K., Daniel, J. S., Kainuma, M. L. T., Lamarque, J.-F., Matsumoto, K., Montzka, S. A., Raper, S. C. B., Riahi, K., Thomson, A., Velders, G. J. M., and van Vuuren, D. P. P.: The RCP greenhouse gas concentrations and their extensions from 1765 to 2300, Climatic Change, 109, 213–241, 2011.
Meinshausen, M., Nicholls, Z. R. J., Lewis, J., Gidden, M. J., Vogel, E., Freund, M., Beyerle, U., Gessner, C., Nauels, A., Bauer, N., Canadell, J. G., Daniel, J. S., John, A., Krummel, P. B., Luderer, G., Meinshausen, N., Montzka, S. A., Rayner, P. J., Reimann, S., Smith, S. J., van den Berg, M., Velders, G. J. M., Vollmer, M. K., and Wang, R. H. J.: The shared socio-economic pathway (SSP) greenhouse gas concentrations and their extensions to 2500, Geosci. Model Dev., 13, 3571–3605, https://doi.org/10.5194/gmd-13-3571-2020, 2020.
Rodgers, K. B., Lee, S.-S., Rosenbloom, N., Timmermann, A., Danabasoglu, G., Deser, C., Edwards, J., Kim, J.-E., Simpson, I. R., Stein, K., Stuecker, M. F., Yamaguchi, R., Bódai, T., Chung, E.-S., Huang, L., Kim, W. M., Lamarque, J.-F., Lombardozzi, D. L., Wieder, W. R., and Yeager, S. G.: Ubiquity of human-induced changes in climate variability, Earth Syst. Dynam., 12, 1393–1411, https://doi.org/10.5194/esd-12-1393-2021, 2021.
Schneider, D. P., Kay, J. E., and Hannay, C.: Cloud and surface albedo feedbacks reshape 21st century warming in successive generations of an earth system model, Geophys. Res. Lett., 49, e2022GL100653, https://doi.org/10.1029/2022GL100653, 2022.
Sun, Q., Whitnew, M. M., Bryan, F. O., and Tseng, Y.-H.: Assessing the skill of the improved treatment of riverine freshwater in the Community Earth System Model (CESM) relative to a new salinity climatology, J. Adv. Model. Earth Sy., 11, 1189–1206, https://doi.org/10.1029/2018MS001349, 2019.
Taylor, K. E., Crucifix, M., Praconnot, P., Hewitt, C. D., Doutriaux, C., Broccoli, A. J., Mitchell, J. F. B., and Webb, M. J.: Estimating shortwave radiative forcing and response in climate models, J. Climate, 20, 2530–2543, https://doi.org/10.1175/JCLI4143.1, 2007.
Trenberth, K. E. and Fasullo, J. T.: Global warming due to increasing absorbed solar radiation, Geophys. Res. Lett., 36, L07706, https://doi.org/10.1029/2009GL037527, 2009.
Turner, A. K. and Hunke, E. C.: Impacts of a mushy-layer thermodynamic approach in global sea-ice simulations using the CICE sea ice model, J. Geophys. Res.-Oceans, 120, 1253–1275, https://doi.org/10.1002/2014JC010358, 2015.
van Marle, M. J. E., Kloster, S., Magi, B. I., Marlon, J. R., Daniau, A.-L., Field, R. D., Arneth, A., Forrest, M., Hantson, S., Kehrwald, N. M., Knorr, W., Lasslop, G., Li, F., Mangeon, S., Yue, C., Kaiser, J. W., and van der Werf, G. R.: Historic global biomass burning emissions for CMIP6 (BB4CMIP) based on merging satellite observations with proxies and fire models (1750–2015), Geosci. Model Dev., 10, 3329–3357, https://doi.org/10.5194/gmd-10-3329-2017, 2017.
van Vuuren, D. P., Edmonds, J., Kainuma, M., Riahi, K., Thomson, A., Hibbard, K., Hurtt, G. C., Kram, T., Krey, V., Lamarque, J.-F., Masui, T., Meinshausen, M., Nakicenovic, N., Smith, S. J., and Rose, S. K.: The representative concentration pathways: an overview, Climatic Change, 109, 5–31, https://doi.org/10.1007/s10584-011-0148-z, 2011.
Singh, H. K. A, Goldenson, N., Fyfe, J. C., and Polvani, L. M.: Uncertainty in preindustrial global ocean initialization can yield irreducible uncertainty in southern ocean surface climate, J. Climate, 36, 383–403, https://doi.org/10.1175/JCLI-D-21-0176.1, 2023.
Wang, Z., Lin, L., Xu, Y., Che, H., Zhang, X., Zhang, H., Dong, W., Wang, C., Gui, K., and Xie, B.: Incorrect Asian aerosols affecting the attribution and projection of regional climate change in CMIP6 models, npj Clim. Atmos. Sci., 4, 2, https://doi.org/10.1038/s41612-020-00159-2, 2021.
Webster M. A., DuVivier A. K., Holland M. M., and Bailey D. A.: Snow on Arctic sea ice in a warming climate as simulated in CESM2, J. Adv. Model. Earth Sy., 126, e2020JC016308, https://doi.org/10.1029/2020JC016308, 2020.
Yamaguchi, R., Kim, J.-E., Rodgers, K. B., Stein, K., Timmermann, A., Lee, S.-S., Huang, L., Stuecker, M. F., Fasullo, J. T., Danabasoglu, G., Deser, C., Lamarque, J.-F., Rosenbloom, N. A., and Edwards, J.: Persistent ocean anomalies as a response to northern hemisphere heating induced by biomass burning variability, J. Climate, 36, 8225–8241, https://doi.org/10.1175/JCLI-D-23-0090.1, 2023.