the Creative Commons Attribution 4.0 License.
the Creative Commons Attribution 4.0 License.
 | 09 Jul 2020
Calculating human thermal comfort and thermal stress in the PALM model system 6.0
Dominik Fröhlich
Andreas Matzarakis
In the frame of the project “MOSAIK – Model-based city planning and application in climate change”, a German-wide research project within the call “Urban Climate Under Change” ([UC]2) funded by the German Federal Ministry of Education and Research (BMBF), a biometeorology module was implemented into the Parallelized Large-Eddy Simulation Model (PALM) system. The new biometeorology module is comprised of methods for the calculation of UV-exposure quantities, a human–biometeorologically weighted mean radiant temperature (Tmrt), as well as for the estimation of human thermal comfort or stress. The latter is achieved through the implementation of the three widely used thermal indices: perceived temperature (PT), Universal Thermal Climate Index (UTCI), as well as physiologically equivalent temperature (PET). Comparison calculations were performed for the PT, UTCI and PET indices based on the SkyHelios model and showing PALM calculates higher values in general. This is mostly due to a higher radiational gain leading to higher values of mean radiant temperature. For a more direct comparison, the PT, PET and UTCI indices were calculated by the biometeorology module, as well as the programs provided by the attachment to Verein Deutscher Ingenieure (VDI) guideline 3787, as well as by the RayMan model based on the very same input dataset. Results show deviations below the relevant precision of 0.1 K for PET and UTCI and some deviations of up to 2.683 K for PT caused by repeated unfavorable rounding in very rare cases (0.027 %).
- Article
(1786 KB) - Full-text XML
- BibTeX
- EndNote


Urban areas show slightly different diurnal variability in air temperature (Ta) compared to their surroundings (e.g., Oke, 1995; Helbig et al., 1999). This is mostly due to modifications in the radiation budget caused by ground sealing, different surface materials and many vertical surfaces (Oke, 1995, p. 276ff). Additionally, many of them have high heat storage capacities (Oke, 1995, p. 284) reducing nighttime cooling. The two effects contribute to a phenomenon that is called the urban heat island (UHI; Oke, 1995, p. 288ff). Another increase in urban temperatures is caused by the local impact of global climate change. For example, for Freiburg (southwest Germany), an increase of days with heat stress by up to 5 % is expected (Matzarakis and Endler, 2010).
Health and well-being of the growing urban population is already an important issue in present urban planning (e.g., Helbig et al., 1999). A number of studies have been carried out in the last years that show a strong correlation between health, as well as mortality on the one side and urban biometeorology on the other side. Especially heat stress during the summer months seems to lead to an increase in mortality (e.g., Koppe et al., 2004; Conti et al., 2005; Muthers et al., 2010, 2017; Nastos and Matzarakis, 2012).
To allow for counteracting malicious effects through urban planning measures, e.g., by a modification in the building configuration (Lin et al., 2010a), surface materials (Lin et al., 2010b) or urban green (Shashua-Bar et al., 2011; Charalampopoulos et al., 2015), decision makers depend on spatially resolved thermal perception information that can be best provided through maps (Matzarakis, 2001; Nouri et al., 2018).
Thermal comfort can be assessed by calculating thermal indices, e.g., the predicted mean vote (PMV; Fanger, 1972), physiologically equivalent temperature (PET; Höppe, 1993, 1999), the perceived temperature (PT; Staiger et al., 2012) or the Universal Thermal Climate Index (UTCI; Jendritzky et al., 2012), combining several aspects to approximate the thermal perception of a standardized sample human being, taking into account many meteorological and physiological parameters (Fanger, 1972; Höppe, 1999; Staiger et al., 2012, 2019). To facilitate the identification of hotspots and the assessment of potential for the reduction of thermal stress, the program “Urban Climate Under Change” ([UC]2) is funded by the German Federal Ministry of Education and Research (BMBF). It “aims at the development, validation and application of an innovative urban climate model for entire cities” (Todo: UC2 homepage). Part of the [UC]2 program is the German-wide research project “MOSAIK – Model-based city planning and application in climate change”. During the course of MOSAIK, PALM (Parallelized Large-Eddy Simulation Model; Raasch and Schröter, 2001; Maronga et al., 2015, 2019b; Hellsten et al., 2018) is extended by several modules to become a comprehensive urban climate model (e.g., an urban surface module by Resler et al., 2017). One of the new modules is the biometeorology module capable of calculating the static thermal PT, UTCI and PET indices (Maronga et al., 2019b).
Humans are unable to directly sense individual meteorological quantities, e.g., Ta. However, they do feel the thermal effect of their environment caused by several meteorological parameters integrally through the skin and the blood temperature in the thermoregulatory system of the hypothalamus (Tromp, 1980; Höppe, 1993). Thermal comfort therefore cannot be described by individual parameters but needs to be approximated through thermal comfort indices considering all relevant conditions. The more sophisticated indices are based on the approach of equivalent temperatures and are relying on the evaluation of the human energy balance or heat flux models (e.g., Fanger, 1972; Gagge et al., 1986; Höppe, 1993; Błażejczyk et al., 2012).
From the meteorological side, comprehensive thermal indices usually do require input for the meteorological parameters air temperature (Ta), vapor pressure (VP), wind speed (WS) and the mean radiant temperature (Tmrt), defined as the temperature of a perfectly black environment causing thermal radiation only, that leads to the same radiational gain or loss as the actual environment (Fanger, 1972; Thorsson et al., 2007). All input conditions are required at the very location the index is calculated for at a height of 1.1 m, representing the gravimetric center of an average human body (Fanger, 1972). Due to the discrete design of PALM, the biometeorology module can only obtain information at cell centers. It therefore calculates thermal indices for the vertical cell level with the height of the cell center closest to 1.1 m above ground level.
The estimation of Tmrt does require radiational input data that are provided by one of the two radiation schemes available in PALM, the simple clear-sky model (Maronga et al., 2019a) or the more complex Rapid Radiative Transfer Model (RRTM) (Mlawer et al., 1997; Pincus et al., 2003; Clough et al., 2005; Maronga et al., 2019a). The simple clear-sky model generates radiation data based on astronomic calculations, namely the solar constant assumed as 1368 W m−2 as well as the losses by the transmissivity of the atmosphere estimated through geometrical calculations of the solar position only. The impact of clouds, moisture and atmospheric variations is ignored (please refer to Maronga et al., 2019a, Sect. 3.6.1).
The more complex and more precise estimation of radiation data is derived from incorporating the RRTM for GCMs (RRTMG) model. It does, e.g., allow for the consideration of clouds and other weather effects (Mlawer et al., 1997). However, both models only provide radiation fluxes at one energy transfer surface and are therefore insufficient for the estimation of the mean radiant temperature in urban areas.
For complex environments, PALM-4U 6.0 contains the radiative transfer module that is driven by the clear-sky model or RRTMG at the upper model border to estimate radiation fluxes within the canopy layer. It incorporates a building surface model and a land surface model to consider the effects of buildings and vegetation on the short- and longwave radiation fluxes at individual grid cells (please refer to Maronga et al., 2019a, Sect. 4.4).
2.1 Perceived temperature
PT is a thermal comfort index for outdoor environments using the concept of an equivalent temperature. The thermal impact of the environment is evaluated through the “Klima-Michel” model (Jendritzky et al., 1990), an energy balance model for human beings (Staiger et al., 2012). PT is defined to be “the air temperature of a reference environment in which the thermal perception would be the same as in the actual environment” (Staiger et al., 2012).
PT is a steady-state model by design to keep runtime at a reasonable level. The target for PT is a standardized sample human (the Klima-Michel; Jendritzky et al., 1990) with a height of 1.75 m, an age of 35 years, a weight of 75 kg, an internal heat production of 135 W m−2, walking at a speed of 4 km h−1 (Staiger et al., 2012). This allows for a simplification of the human heat balance equation after ASHRAE (2001, p. 134):
The energy gain caused by metabolic processes within the body M reduced by the portion of mechanical work “Wo” (the fraction of the body's energy that is not converted to heat but to mechanical workforce) is compared to the combined latent and sensible heat fluxes from or to the environment. The components of the equation represent energy transfer by sensible heat C, radiation R and latent heat E. Equation (1) distinguishes between fluxes from or to the skin (sk), the core (cr) and through the respiratory system (res). The heat storage components (S) are considered to equal 0 W, constantly assuming a steady state. The unit of all parameters is W.
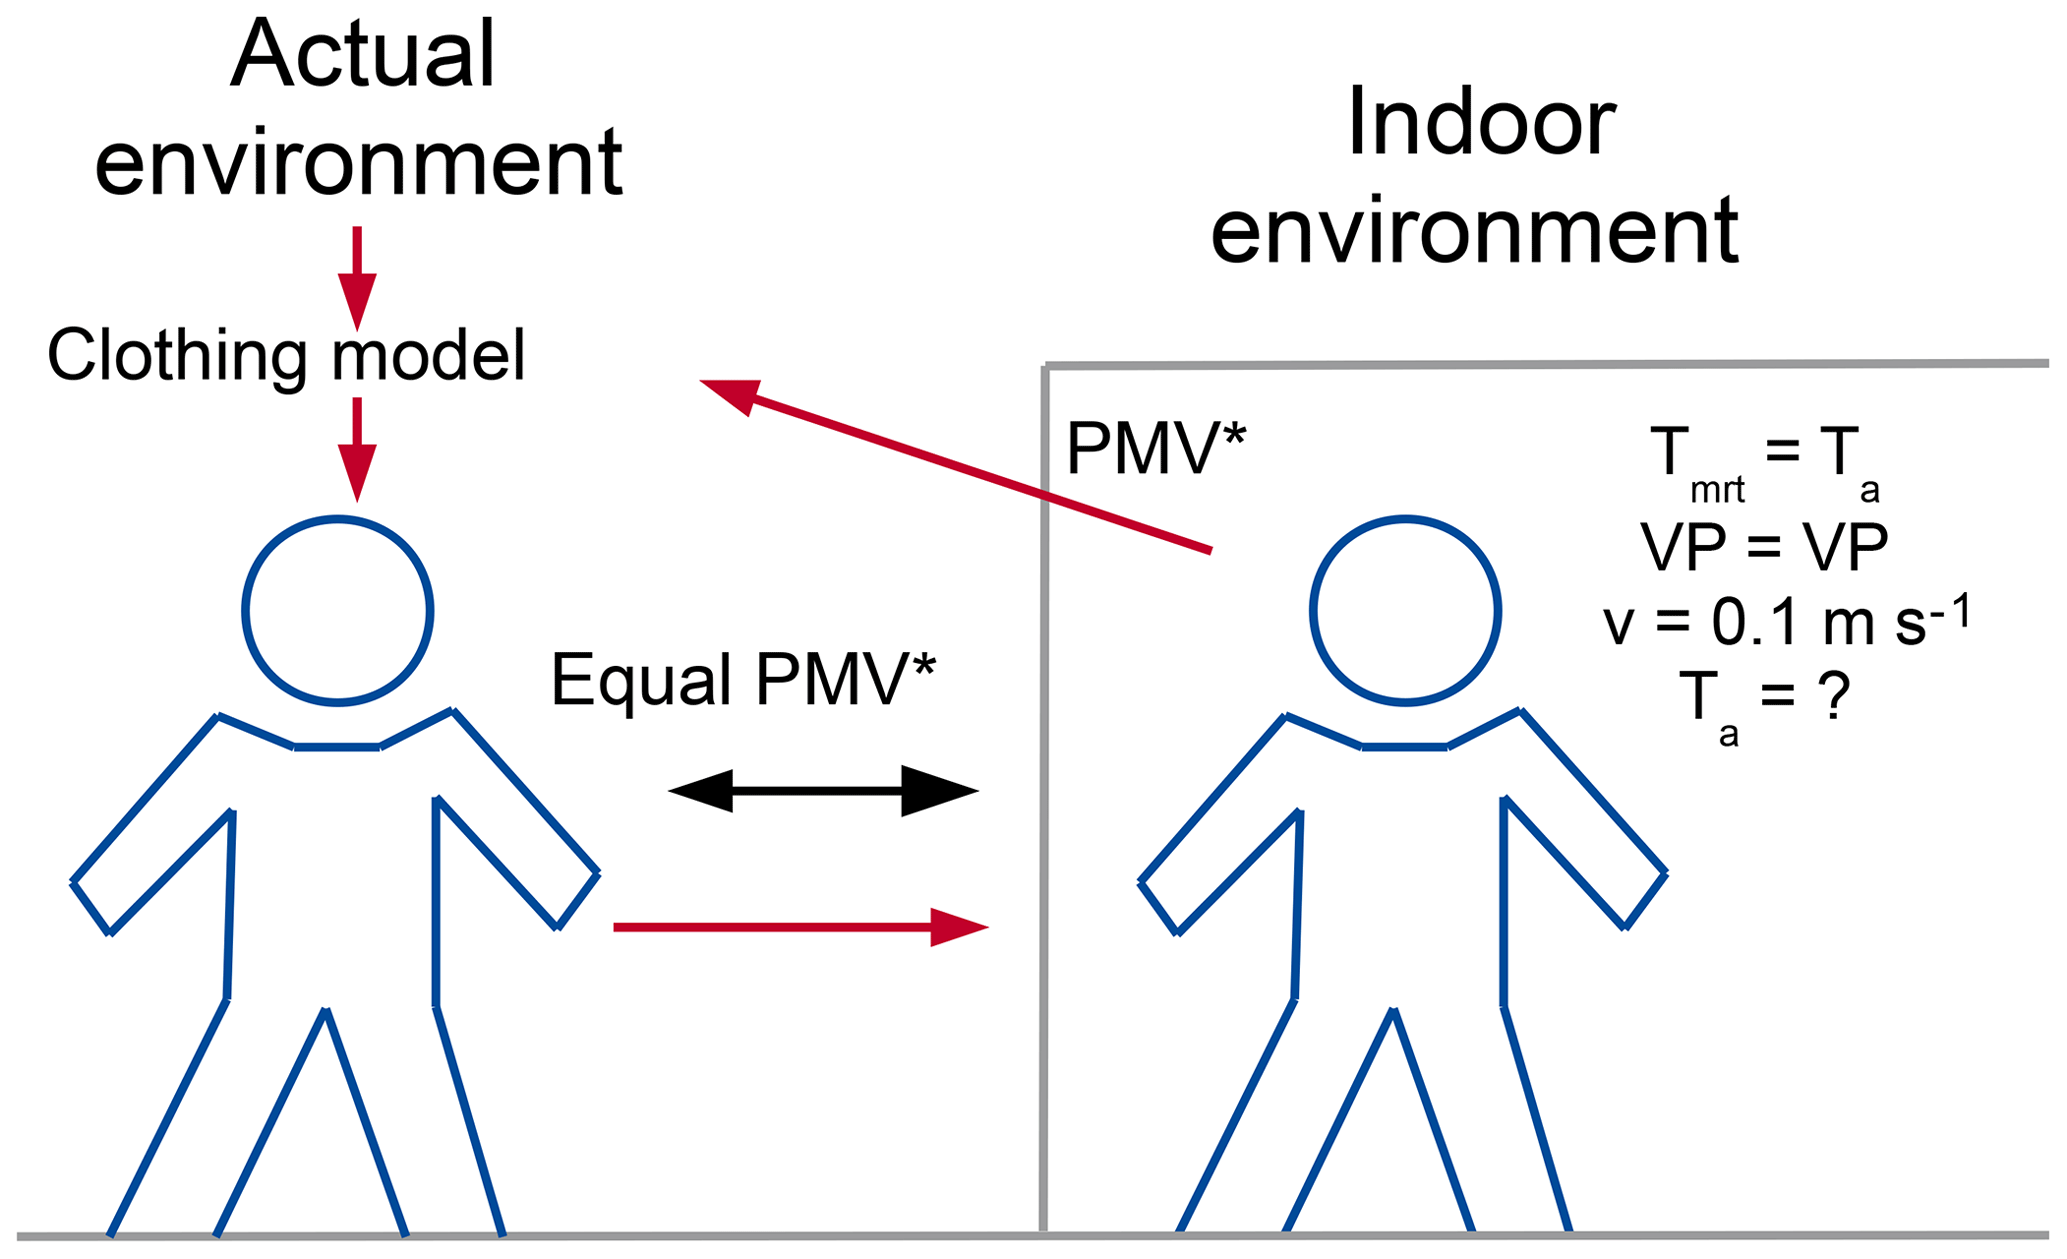
Figure 1Schematic overview of the comparison of adjusted predicted mean vote (PMV) between the actual prevailing environment and a virtual indoor environment for the estimation of the perceived temperature. The sample human is standardized by the “Klima-Michel” model.
All of the physiological parameters are defined by the Klima-Michel model and the clothing model is self-adapting. PT can therefore be estimated exclusively based on the meteorological parameters air temperature (Ta, ∘C), wind speed (v, m s−1), vapor pressure (VP, hPa) and mean radiant temperature (Tmrt, ∘C). All of the energy gained or lost by the Klima-Michel is compared to that of an “indoor” reference environment (compare to Fig. 1). This is done based on a modified version of the predicted mean vote (PMV) basic thermal index after Fanger (1972); Gagge et al. (1986). The reference environment is defined with parameters Tmrt=Ta (no radiational impact), v=0.1 m s−1 (auto-convection only) and VP equal to VP of the actual environment. If the actual environment would lead to warm and humid conditions, VP is set to a value matching a relative humidity of 50 % (Staiger et al., 2012). The comparison is balanced by the air temperature of the “indoor” environment that is modified until the thermal stress in terms of PMV is the same as in the actual environment.
The PMV index does consider energy exchange based on a two-node body model (a skin and a core node). It allows for latent and sensible heat transfer from or to the skin (considering sweating) and by respiration (Fanger, 1972; Staiger et al., 2012).
PT comprises a clothing model that is automatically selecting the most appropriate value for the clothing index (clo) according to the prevailing meteorological conditions (Staiger et al., 2012). It primarily attempts to maintain thermal comfort by adapting to hot or cold conditions. Only if this cannot be achieved, thermal stress is computed (Fanger, 1972; Staiger et al., 2012). The clothing model is supported in reducing thermal strain by parameterizations of shivering in cold conditions (PMV at clo of 1.75) and sweating under hot conditions (PMV > 0.5 at clo of 0.5; Staiger et al., 2012).
Table 1The thermo-physiological meaning of PT results for central Europe as defined by Staiger et al. (2012).

To facilitate the interpretation of PT results in central Europe Staiger et al. (2012) published a perception table translating the PT values into thermal perception or the extent of thermo-physiological stress (Table 1).
2.1.1 Universal Thermal Climate Index
UTCI is “the isothermal air temperature of the reference condition that would elicit in the same dynamic response (strain) of the physiological model” as the actual environment Jendritzky et al. (2012).
Like most complex thermal indices (e.g., PT or PET), UTCI is an equivalent temperature. The thermal effect of the prevailing meteorological conditions is compared to the one of a standardized reference “indoor” environment with a fixed 50 % relative humidity, calm air (0.1 m s−1) and Tmrt equal to Ta (Jendritzky et al., 2012). The environments are compared by a heat transfer model introduced by Fiala et al. (2012).
For performance reasons, UTCI can only be approximated using a regression equation abbreviated from sample calculations performed by computing centers (Jendritzky et al., 2012; Bröde et al., 2012). It allows for a computationally cheap and highly performant determination of UTCI. However, it also causes a limited range of input parameters it can deal with. The regression equation supports Ta in the range of −50.0 to +50.0 ∘C, a relative humidity from 0 % to 100 %, wind speed of at least 0.5 and up to 17.0 m s−1, as well as a difference between Tmrt and Ta (Tmrt−Ta) of −30.0 to +70.0 ∘C. In the event that the local meteorological conditions are out of bounds, specific workarounds after Bröde et al. (2012) are implemented.
In contrast to other indices, UTCI is determined based on wind speed in 10 m above ground level instead of 1.1 m (Bröde et al., 2012). This is because UTCI was designed for use with meteorological station data as well as weather prediction models that usually provide wind speed at that level (Jendritzky et al., 2012). For use with the biometeorology module, however, this would cause imprecision because the wind speed at 10 m above ground level is hardly representative at street level. Furthermore, wind speed for 1.1 m height is determined within the UTCI calculations based on a power-law profile (Havenith et al., 2012) that can hardly be assumed valid within the urban canopy. As the profile is part of the regression equation and cannot be removed, the biometeorology module does apply the very same profile to extrapolate wind speed at 1.1 m height to obtain the input wind speed in 10 m height. This removes imprecision caused by the invalid profile as well as issues arising from obstacles above the target height (e.g., bridges or trees).
Due to the evaluation by the regression equation, physiological parameters cannot be modified in UTCI and are considered to be static. UTCI does assume a permanent walking speed of 4 km h−1 (1.11 m s−1) resulting in an internal heat production of 135 W m−2 (Jendritzky et al., 2012) and the clothing insulation to be self-adapting according to the environmental conditions (Havenith et al., 2012).
As long as all input conditions are in range for the regression equation, UTCI is quite sensitive to wind speed (Chen and Matzarakis, 2018; Fröhlich and Matzarakis, 2016) but also to Ta and Tmrt (Chen and Matzarakis, 2018; Fröhlich and Matzarakis, 2016).
Table 2Thermal stress classification for UTCI. Modified after Błażejczyk et al. (2013).
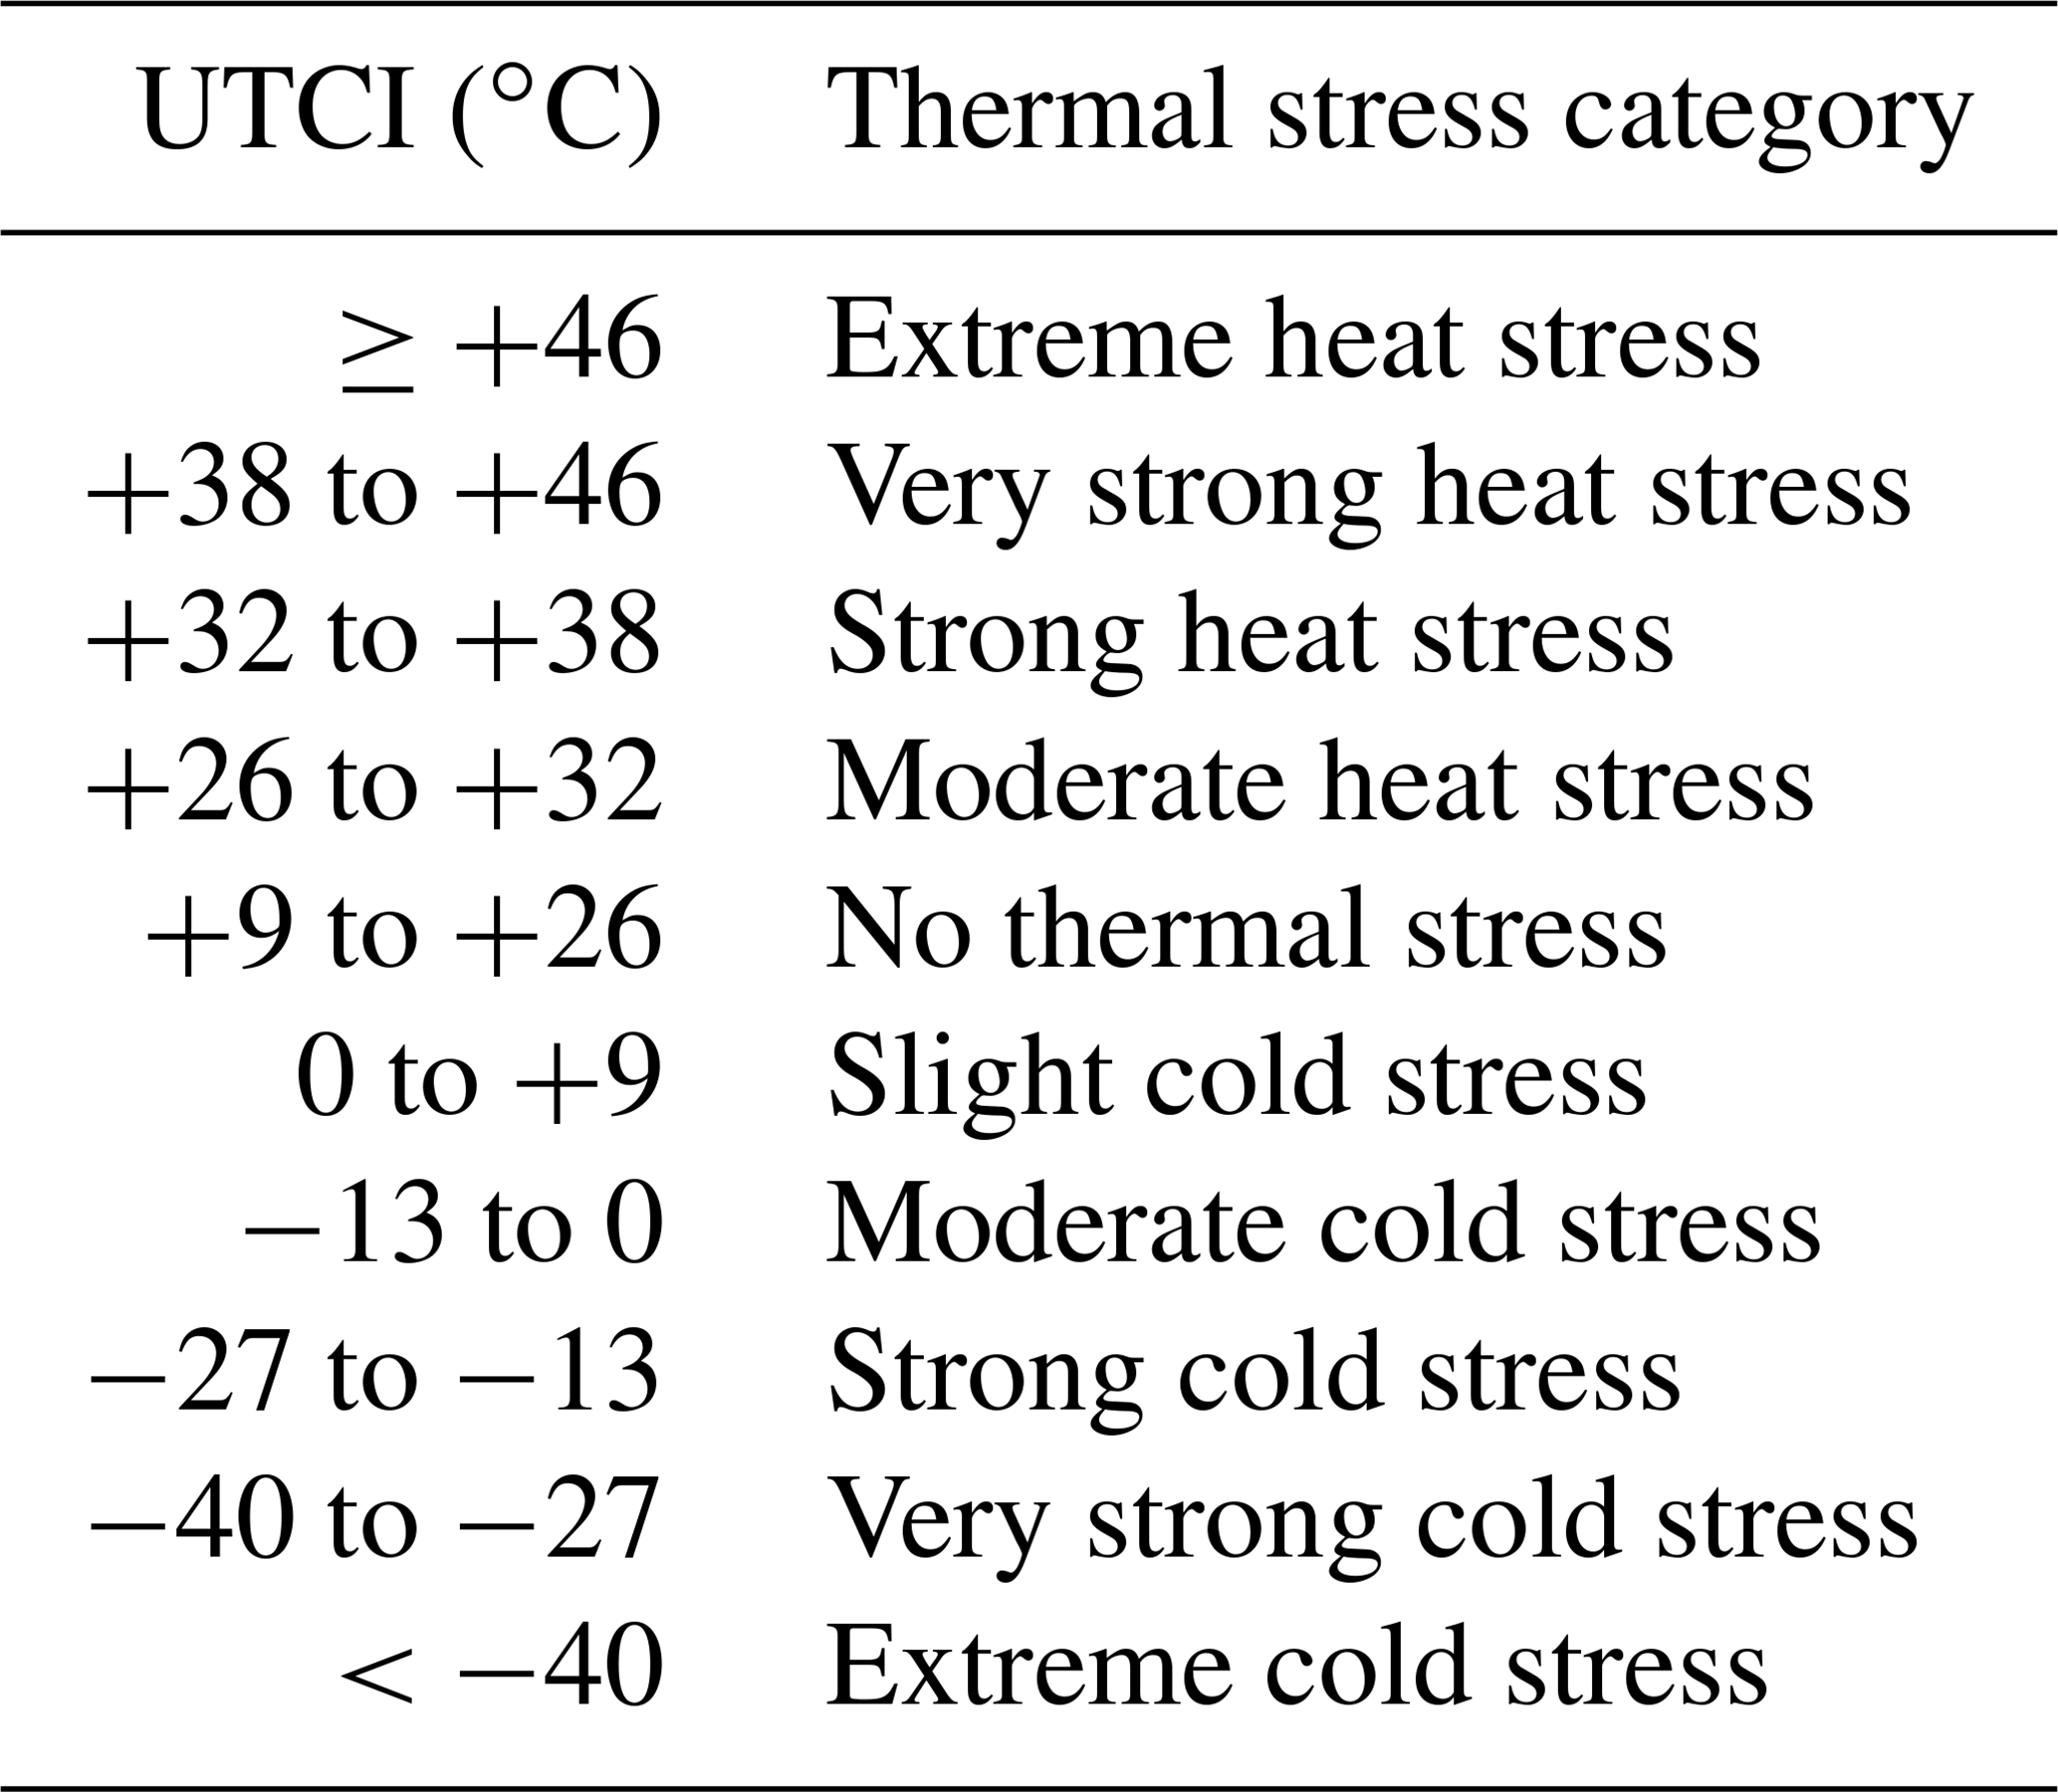
Błażejczyk et al. (2013) published a thermal stress classification for central Europe allowing for the interpretation of UTCI results (Table 2). In contrast to the assessment tables for PT (Table 1) and PET (e.g., Table 3), the UTCI assessment table is a thermal stress classification (Błażejczyk et al., 2013) rather than a thermal comfort evaluation.
2.1.2 Physiologically equivalent temperature
PET can be considered to be one of the most popular thermal indices and is widely used for the assessment of human thermal comfort. Höppe (1999) defines PET as “the air temperature at which, in a typical indoor setting (without wind and solar radiation), the energy budget of the human body is balanced with the same core and skin temperature as under the complex outdoor conditions to be assessed” (Mayer and Höppe, 1987; Höppe, 1999, compare to Fig. 2). PET evaluates heat load based on a simplified human energy balance model by Höppe (1984), the Munich Energy Balance Model for Individuals (MEMI; Höppe, 1984). PET does not comprise a self-adapting clothing model but is entirely dependent on the user input. It therefore does not include any behavioral components, making PET “a real climatic index describing the thermal environment in a thermo-physiologically weighted way” (Höppe, 1999).
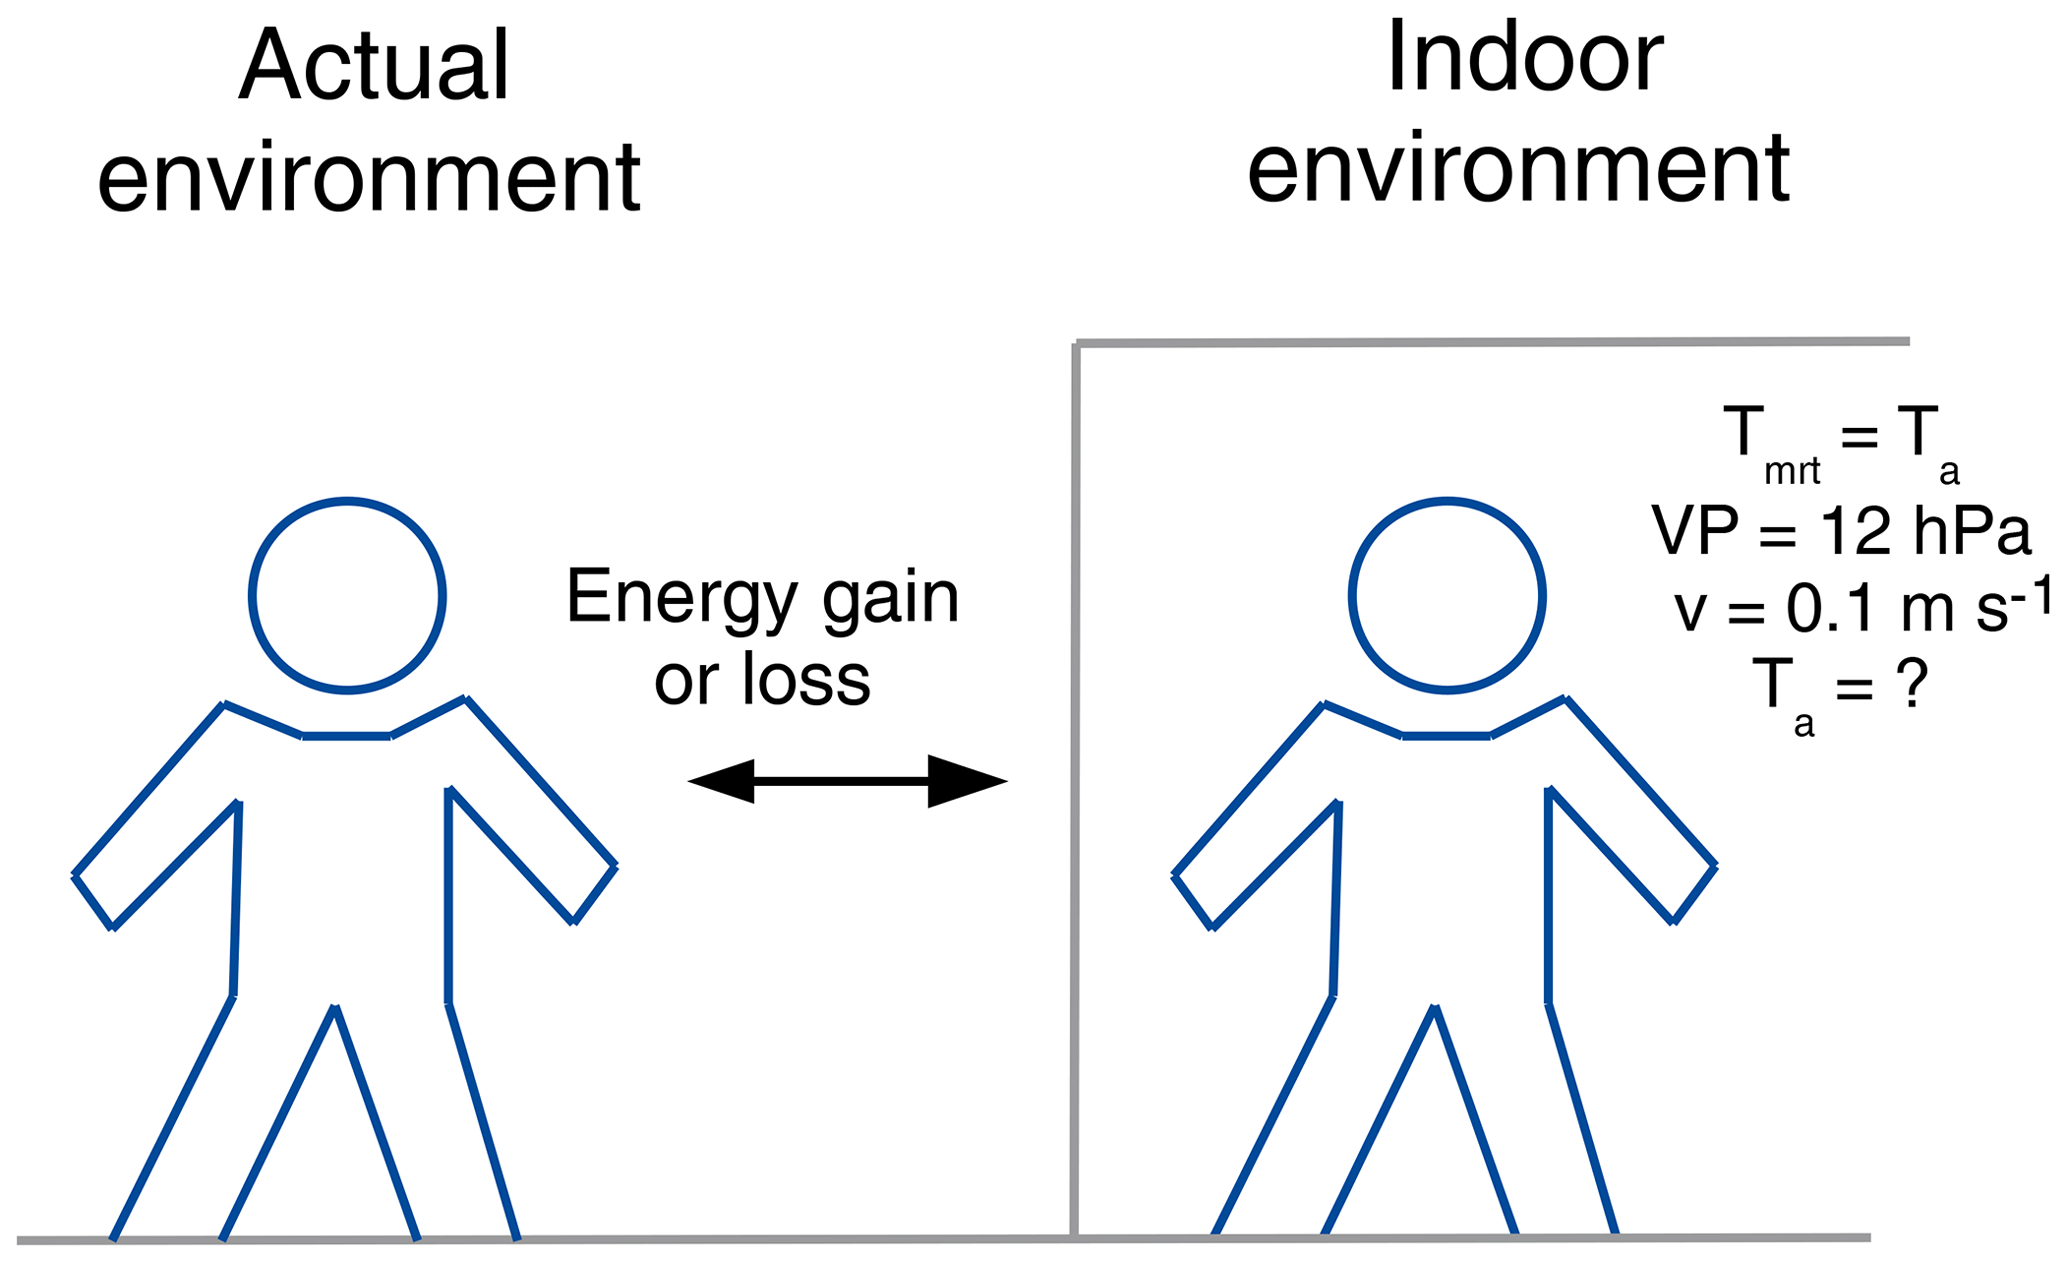
Figure 2Schematic overview of the comparison of the energy gain or loss in the heat balance equation between the actual prevailing environment and a virtual indoor environment for the estimation of the physiologically equivalent temperature. The sample human is represented by the MEMI model.
PET is very sensitive to the input parameter Tmrt (∘C; Charalampopoulos et al., 2013; Chen and Matzarakis, 2018). It does also respond strongly to modifications in wind speed (v) and Ta (∘C). Air humidity in terms of vapor pressure (hPa) must be provided as input but only shows very weak impact on PET (e.g., Chen and Matzarakis, 2018; Fröhlich and Matzarakis, 2016).
The thermal environment is evaluated by the human energy balance equation (Eq. 2; Höppe, 1999).
It does consider the metabolic heat production (M), the mechanical workload (“Wo”), radiational heat flux (R), sensible heat flux (C), as well as latent heat (E). E is thereby separated in the components from or to the skin (sk), by sweating (sw) and by the respiratory system (res). The unit of all components of Eq. (2) is W. Heat storage (S) must permanently equal to 0 W to maintain a steady state.
The energy gain or loss by the prevailing thermal environment is compared to that of an virtual “indoor” environment without radiational impact (Tmrt=Ta), calm air (v=0.1 m s−1) and static humidity in terms of VP of 12 hPa (Höppe, 1999). Ta of the indoor environment is then modified until the indoor environment is causing the same thermal load than the actual environment. The Ta of that indoor environment then is returned as PET (Höppe, 1999).
Table 3Thermal sensation classes for human beings in central Europe (with an internal heat production of 80 W and a heat transfer resistance of the clothing of 0.9 clo (clothing value)) modified after Matzarakis and Mayer (1996).
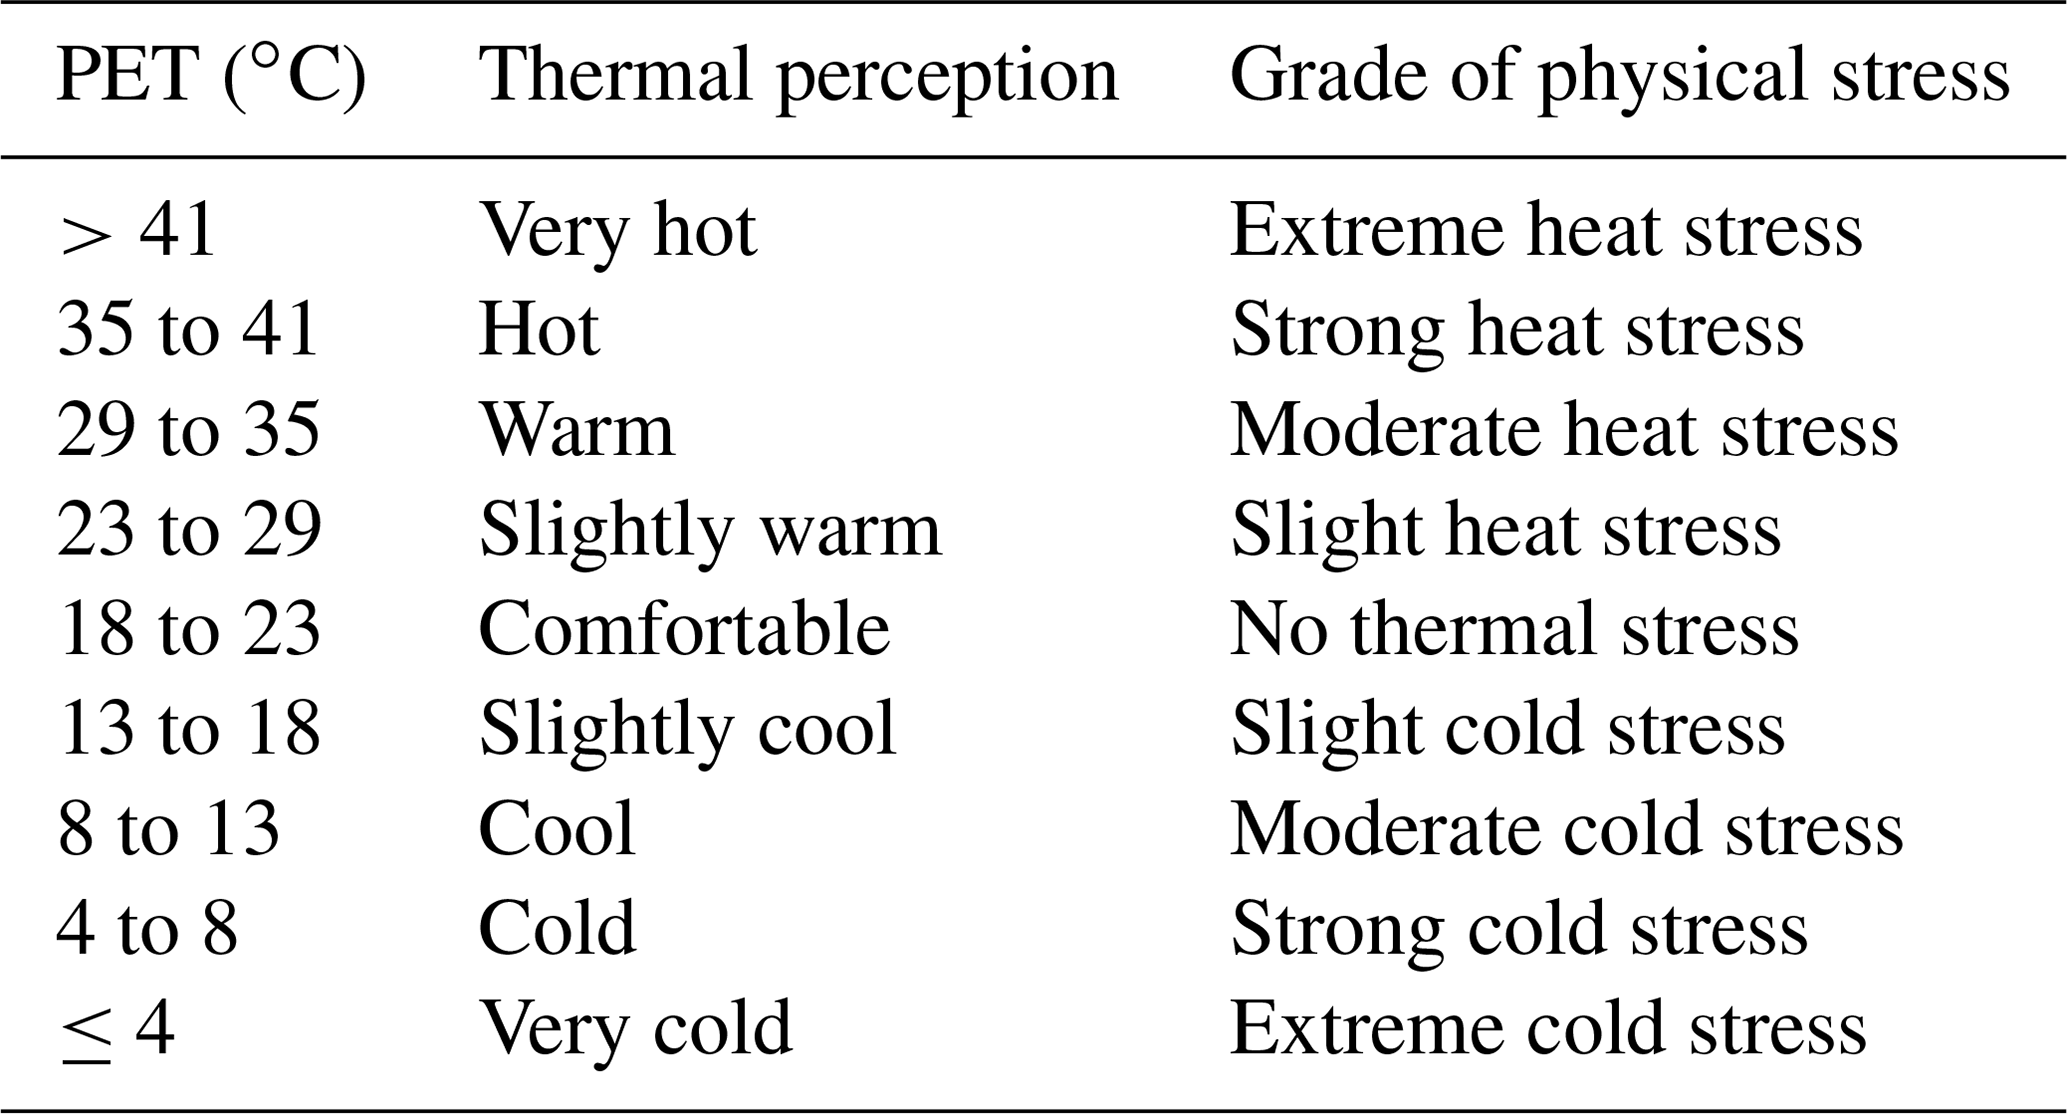
PET results can be interpreted using classification tables for the region in question. For central Europe, a classification with nine classes of thermal perception (Table 3) was introduced by Matzarakis and Mayer (1996).
2.2 Test case
The thermal comfort part of the biometeorology module was tested based on the generic urban crossroad test case “test_urban” located in Hanover (Germany) (Fröhlich, 2019, compare to Fig. 3). It consists of a grid domain with a grid spacing of m. In the corners of the domain, there are buildings with different heights of 10 to 40 m. Two streets in between are forming a crossroads. In the northeast of the domain, shading is provided by two deciduous trees.
Radiation data for the test case are generated by PALM's clear-sky scheme providing minimal radiation input based on astronomic calculations assuming a perfectly clear sky without any clouds or obstructions. Please see Sect. 3.5.1 in Maronga et al. (2019a) for details.
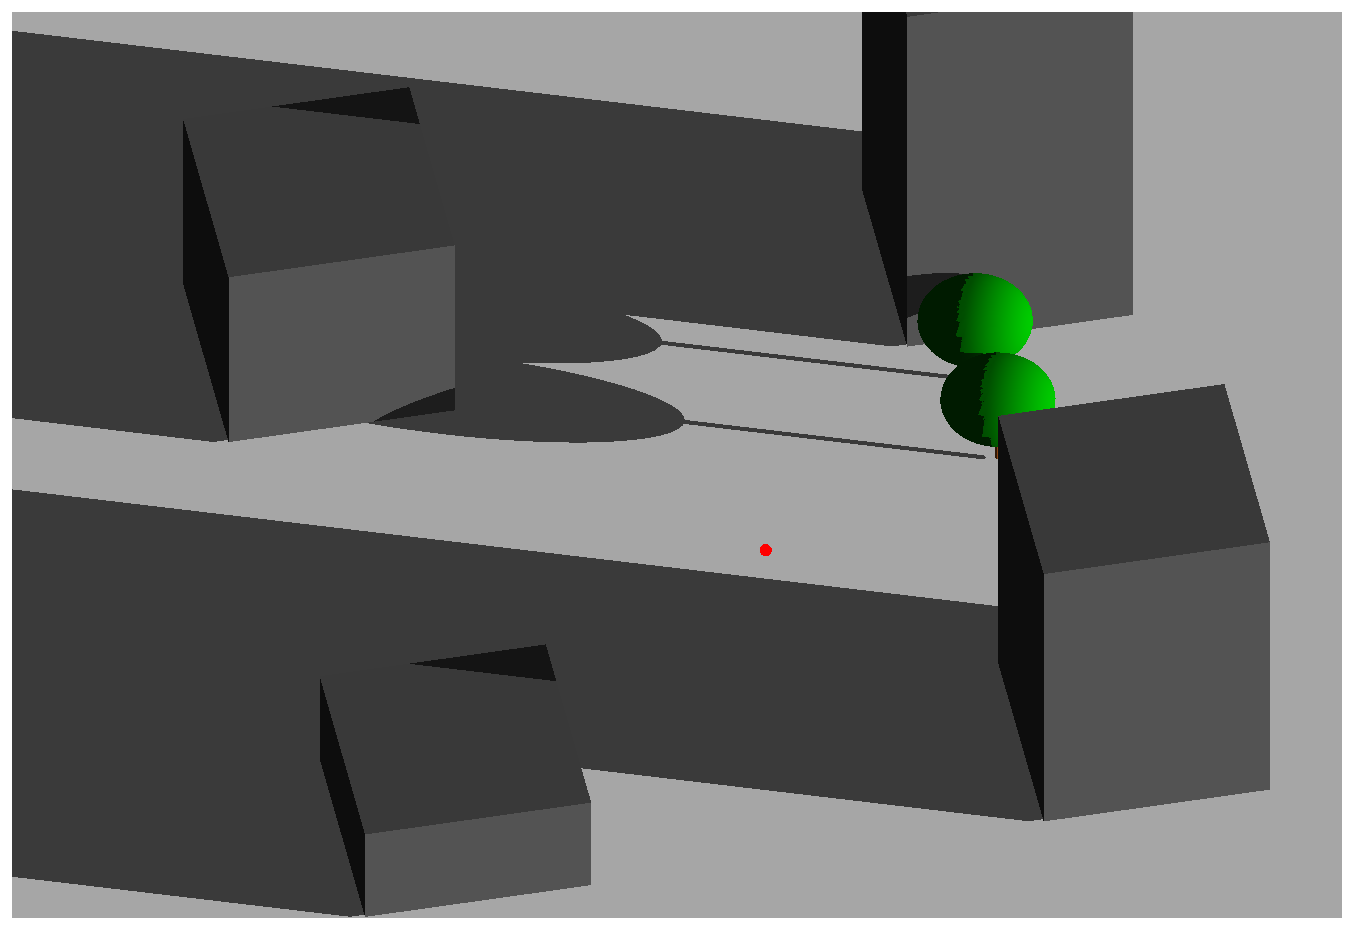
Figure 3The site “test_urban” with shading as shown by the SkyHelios model seen from south–southwest at 07:00 UTC (shortly after sunrise) on 6 March.
To run the test setup with the thermal comfort part of the biometeorology module, the input file “test_urban_p3d” was slightly modified (Fröhlich, 2019, please see “test_urban_v2.zip/INPUT/test_urban_p3d”). The date was set to 6 March to obtain less extreme conditions. The initial potential temperature was adjusted respectively to better meet typical conditions in March. It was set to 5.0 ∘C at the surface at startup. The meteorological initial conditions can be found in Table 4.
Table 4Overview over the meteorological initial conditions to run the test cases in PALM.

For the assessment of the quality of the results, comparison calculations were performed for 07:00 and 13:00 UTC of 6 March using the well-known and frequently applied SkyHelios model (Fröhlich and Matzarakis, 2018; Fröhlich, 2017; Matzarakis and Matuschek, 2011). Therefore, a similar test domain was created for the SkyHelios model (see Fig. 3). To increase comparability, the test calculations were driven by the average air temperature calculated by PALM.
2.3 Meteorological data
For a direct comparison based on the very same input, the thermal indices provided by the biometeorology module were calculated for a meteorological dataset recorded by a urban climate station on top of the high-rise chemistry building of the University of Freiburg. The dataset does cover the time span from 1 September 1999, 00:00 LST, to 30 April 2010, 23:00 LST, in 10 min resolution and provides the parameters Ta, VP, v and global radiation, which were used to estimate Tmrt by the RayMan model. The general statistics of the dataset are provided by Table 5. The output generated by the biometeorology module was then compared to the output by the programs in the attachment to Verein Deutscher Ingenieure (VDI) guideline 3787, part II (VDI, 2008) and to the output by the RayMan model (Matzarakis et al., 2007, 2010).
In order to keep the paper at a reasonable length, only two examples are presented here. However, the entire dataset with input and output is published along with the paper and can be found at https://doi.org/10.5281/zenodo.3433720.
Looking at the perceived temperature (Fig. 4), the day starts quite warm with a PT of 10.2 to 15.6 ∘C in the sun and 8.0 to 11.1 ∘C in shaded areas shortly after sunrise at 07:00 UTC. The differences within the shaded or sunny areas thereby are mostly caused by wind speed. The longwave emissions of the walls, even if they are exposed to direct radiation, which can nicely be seen on the eastern side of the building in the lower left of Fig. 4, are weak because surface temperatures are lower than the air temperature. The warm conditions for early spring are caused by a relatively high air temperature of 10.3–12.2 ∘C that also leads to quite a high mean radiant temperature of 11.4–14.5 ∘C in shaded areas and 20.1–35.4 ∘C in the sun. Wind speed is rather low throughout the model domain, ranging from less than 0.1 to 0.5 m s−1.
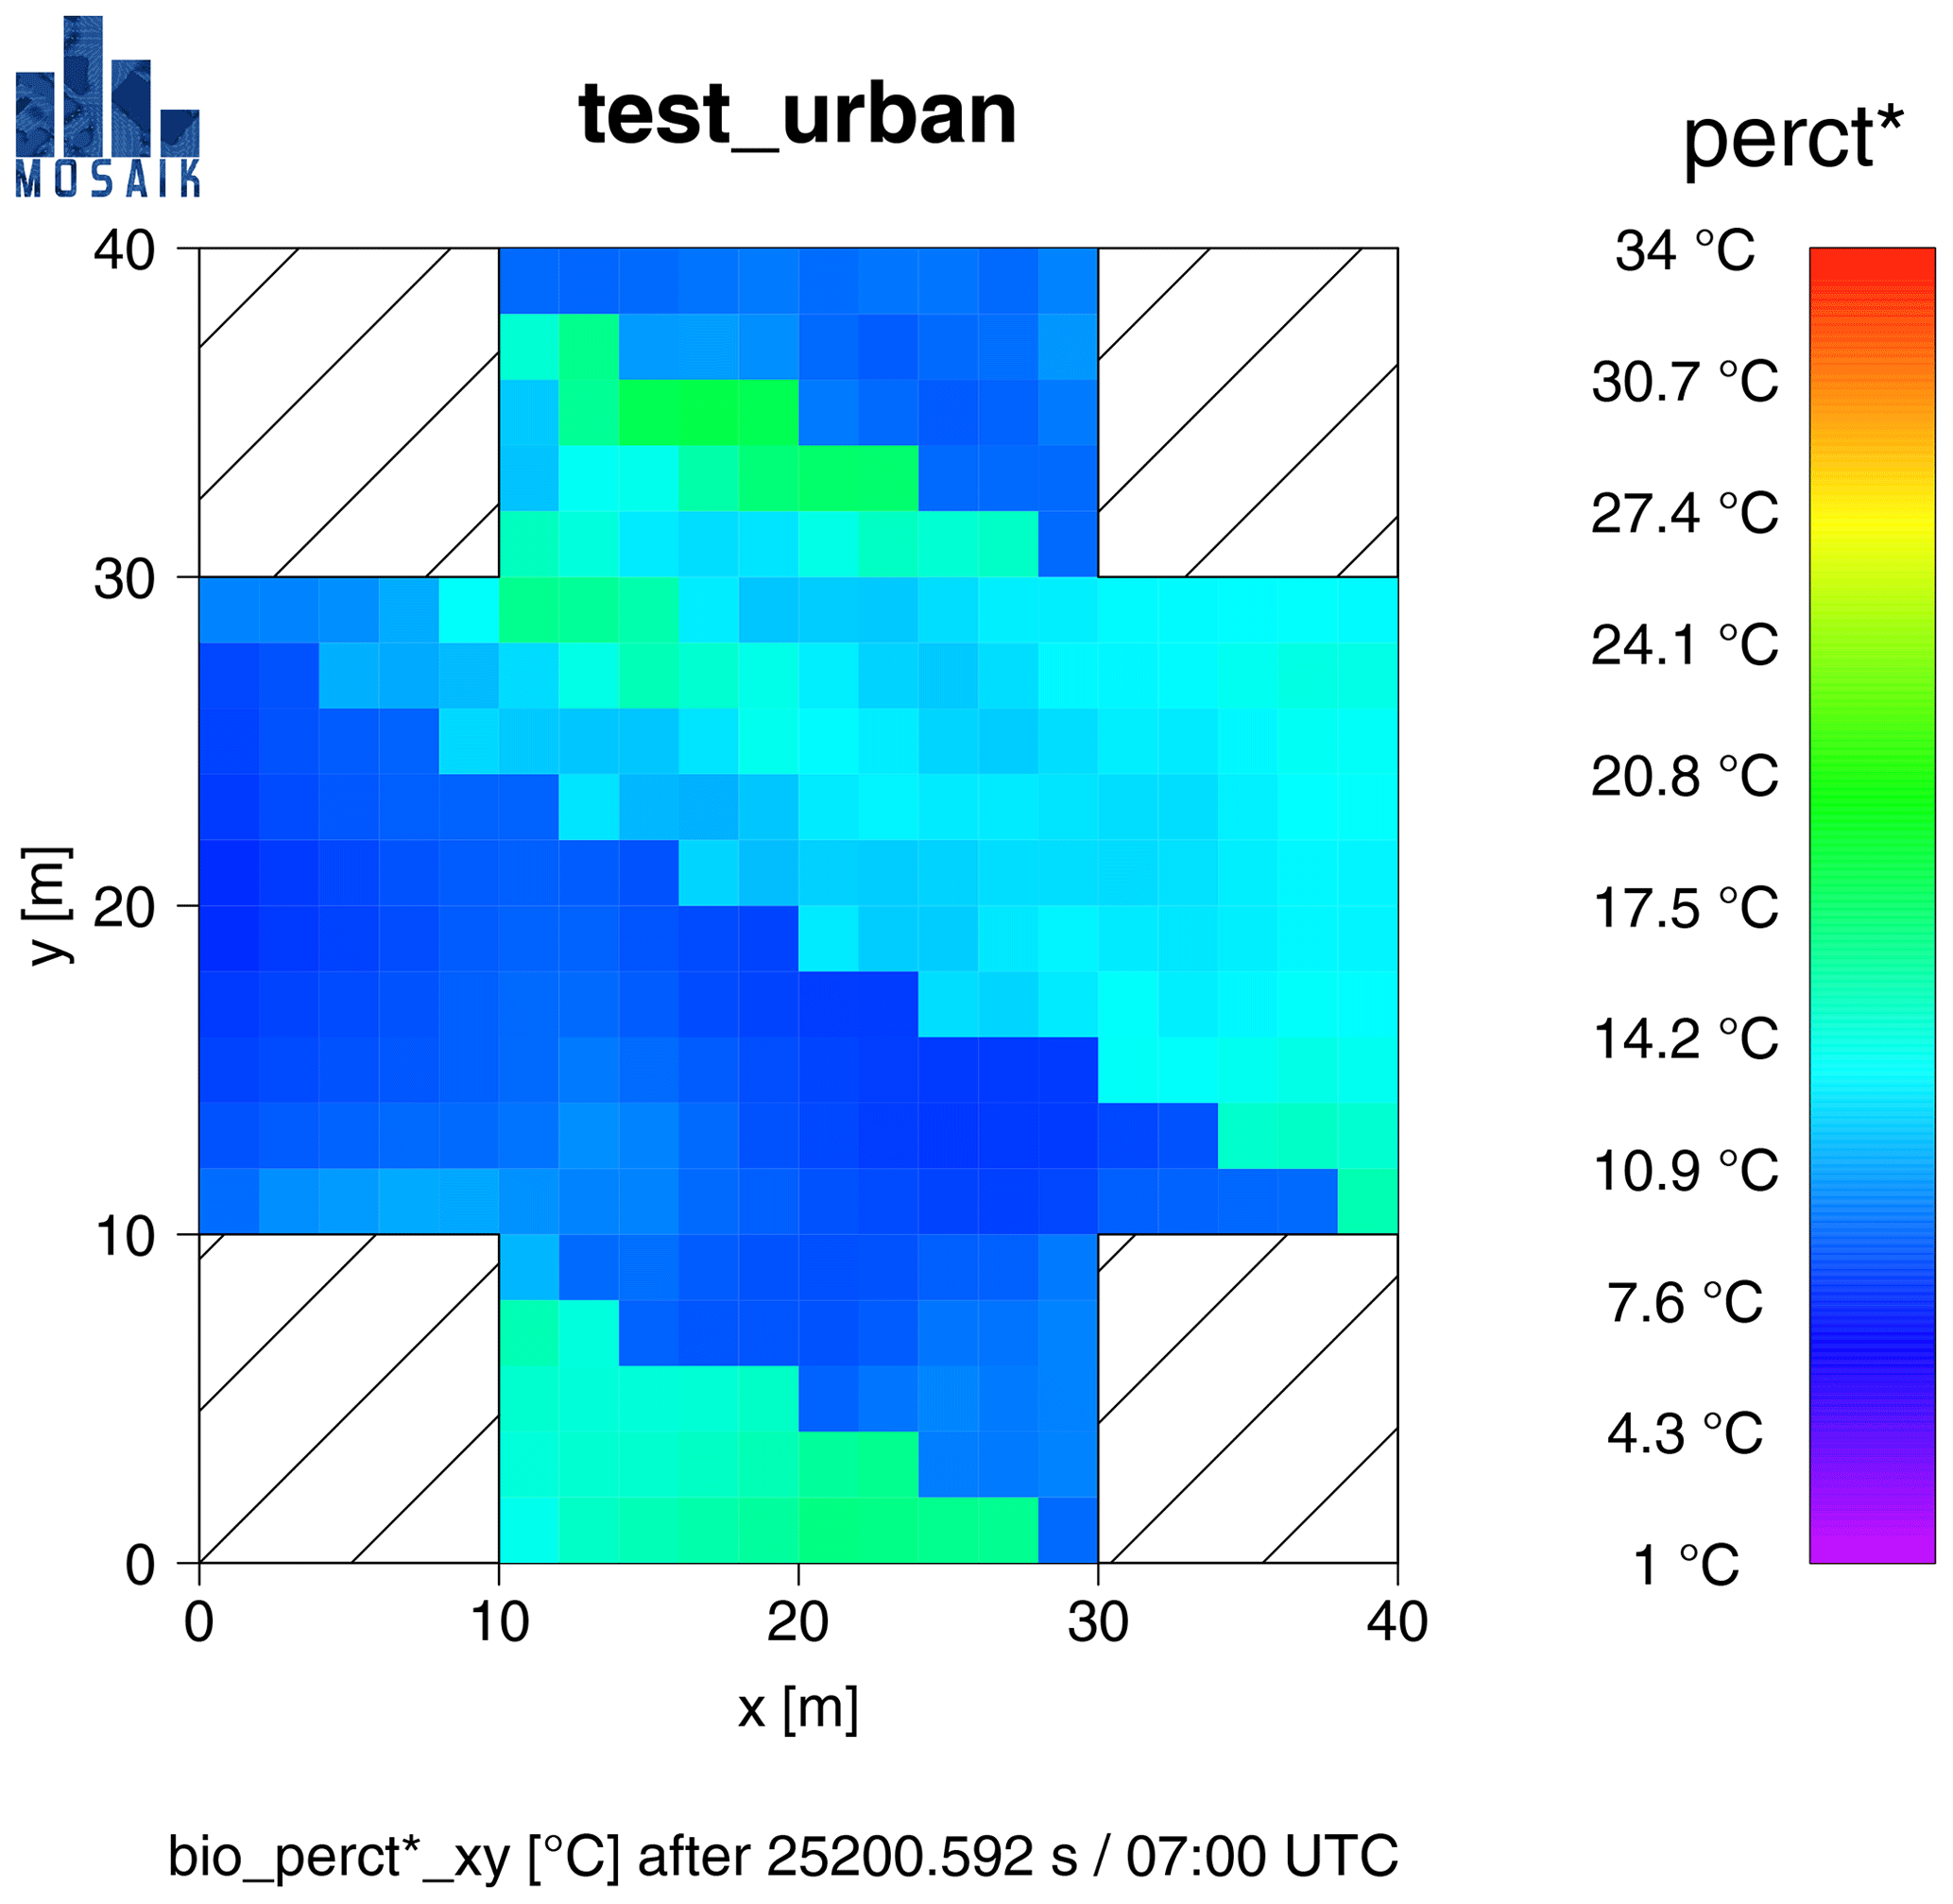
Figure 4PT (perct* in PALM) for the test case “test_urban” at 07:00 UTC (shortly after sunrise) on 6 March. Incident wind is from 270∘ with 1.0 m s−1.
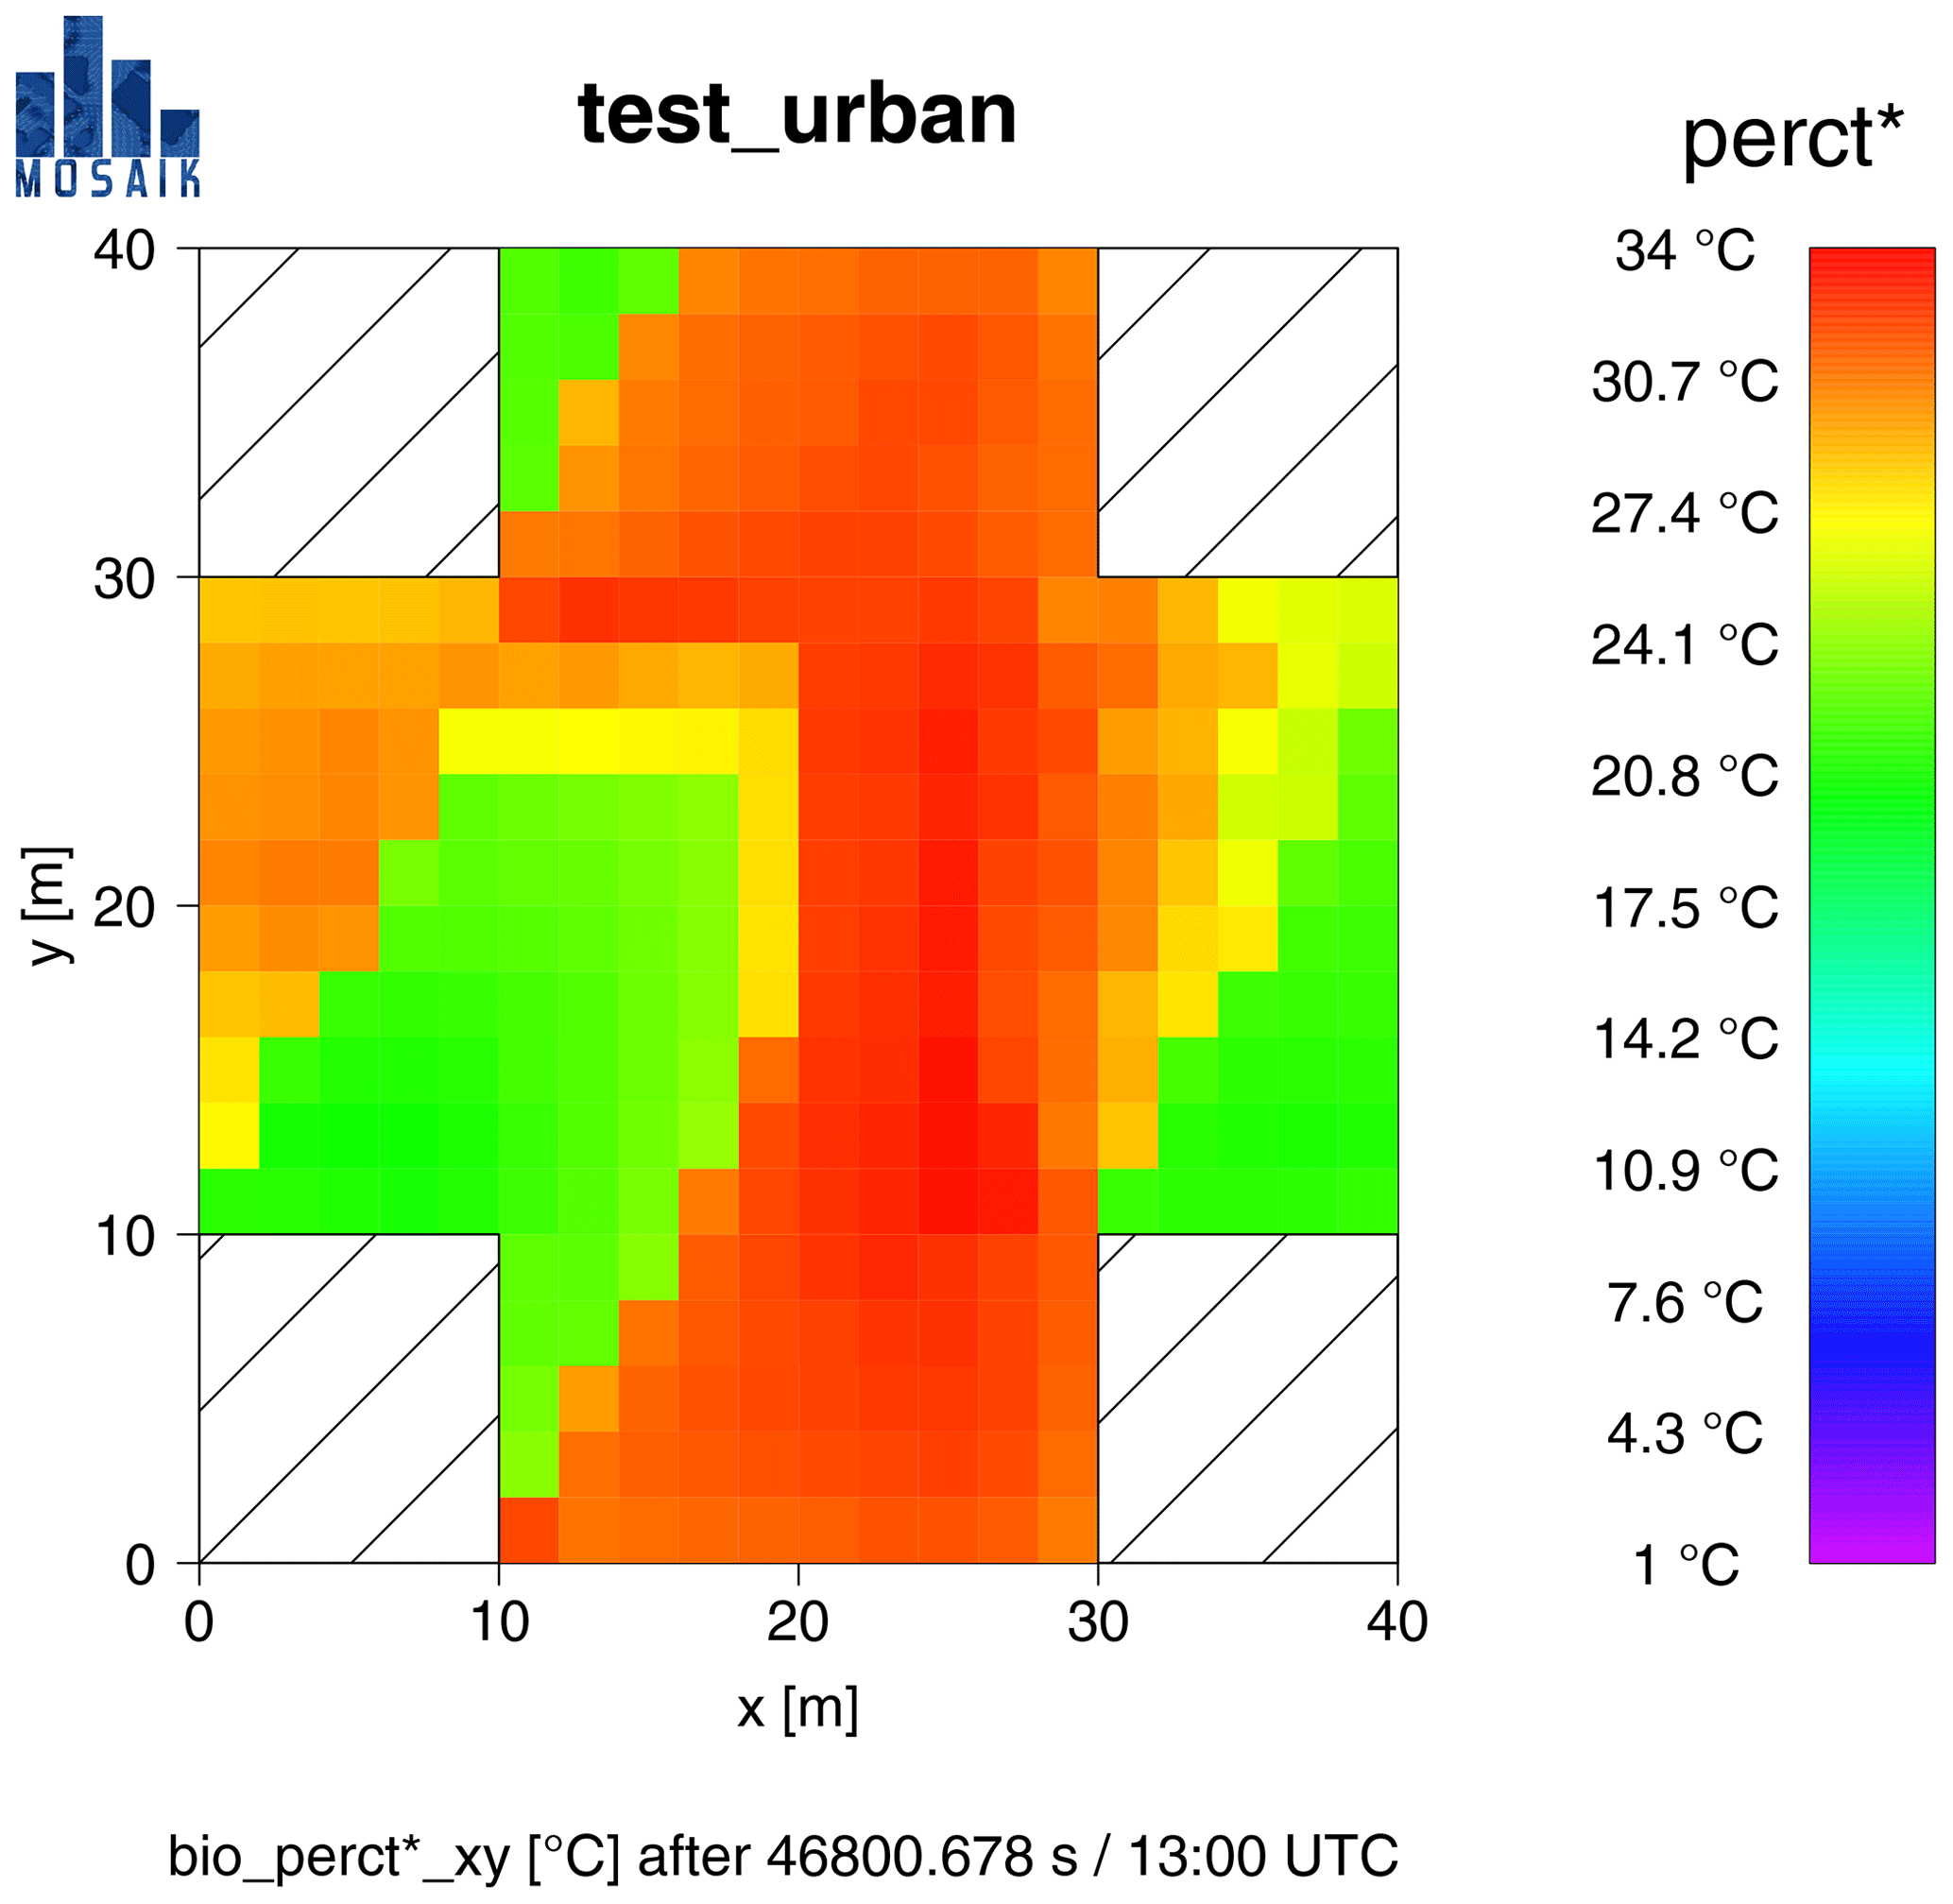
Figure 5PT (perct* in PALM) for the test case “test_urban” at 13:00 UTC (close to midday) on 6 March. Incident wind is from 270∘ with 1.0 m s−1.
The thermo-physiological consequences for a sample human passing through the model domain are indifferent. According to the thermal perception table for central Europe, Table 1, all readings are within the class 0 to 20 ∘C and thus can be perceived as comfortable if appropriate clothing is selected. This holds for both shaded areas as well as areas exposed to direct radiation.
The same scenario looks entirely different after midday at 13:00 UTC (see Fig. 5). The model's “clear-sky” radiation scheme causes the air temperature to rise to values of 20.8 ∘C close to the northern wall of the lower right building to 24.3 ∘C at the western side of the lower right obstacle. Wind speed is little decreased compared to 07:00 UTC and ranges from less than 0.1 to 0.4 m s−1 at 13:00 UTC. Both lead to a quite high mean radiant temperature of 25.7–32.7 ∘C in shaded areas and a very high Tmrt of 44–51.7 ∘C in areas exposed to direct radiation.
A sample human roaming within the model domain would experience wider range of thermal perception. While shaded areas are quite comfortable with PT of 20.0–23.4 ∘C, which translates to “slightly warm” perception according to Table 1, the high Tmrt in unshaded areas also causes high values for PT of 24.4–30.9 ∘C. According to the thermo-physiological perception classification by Staiger et al. (2012, Table 1), the sample person would experience “slightly warm” to “warm” conditions causing slight to moderate heat stress.
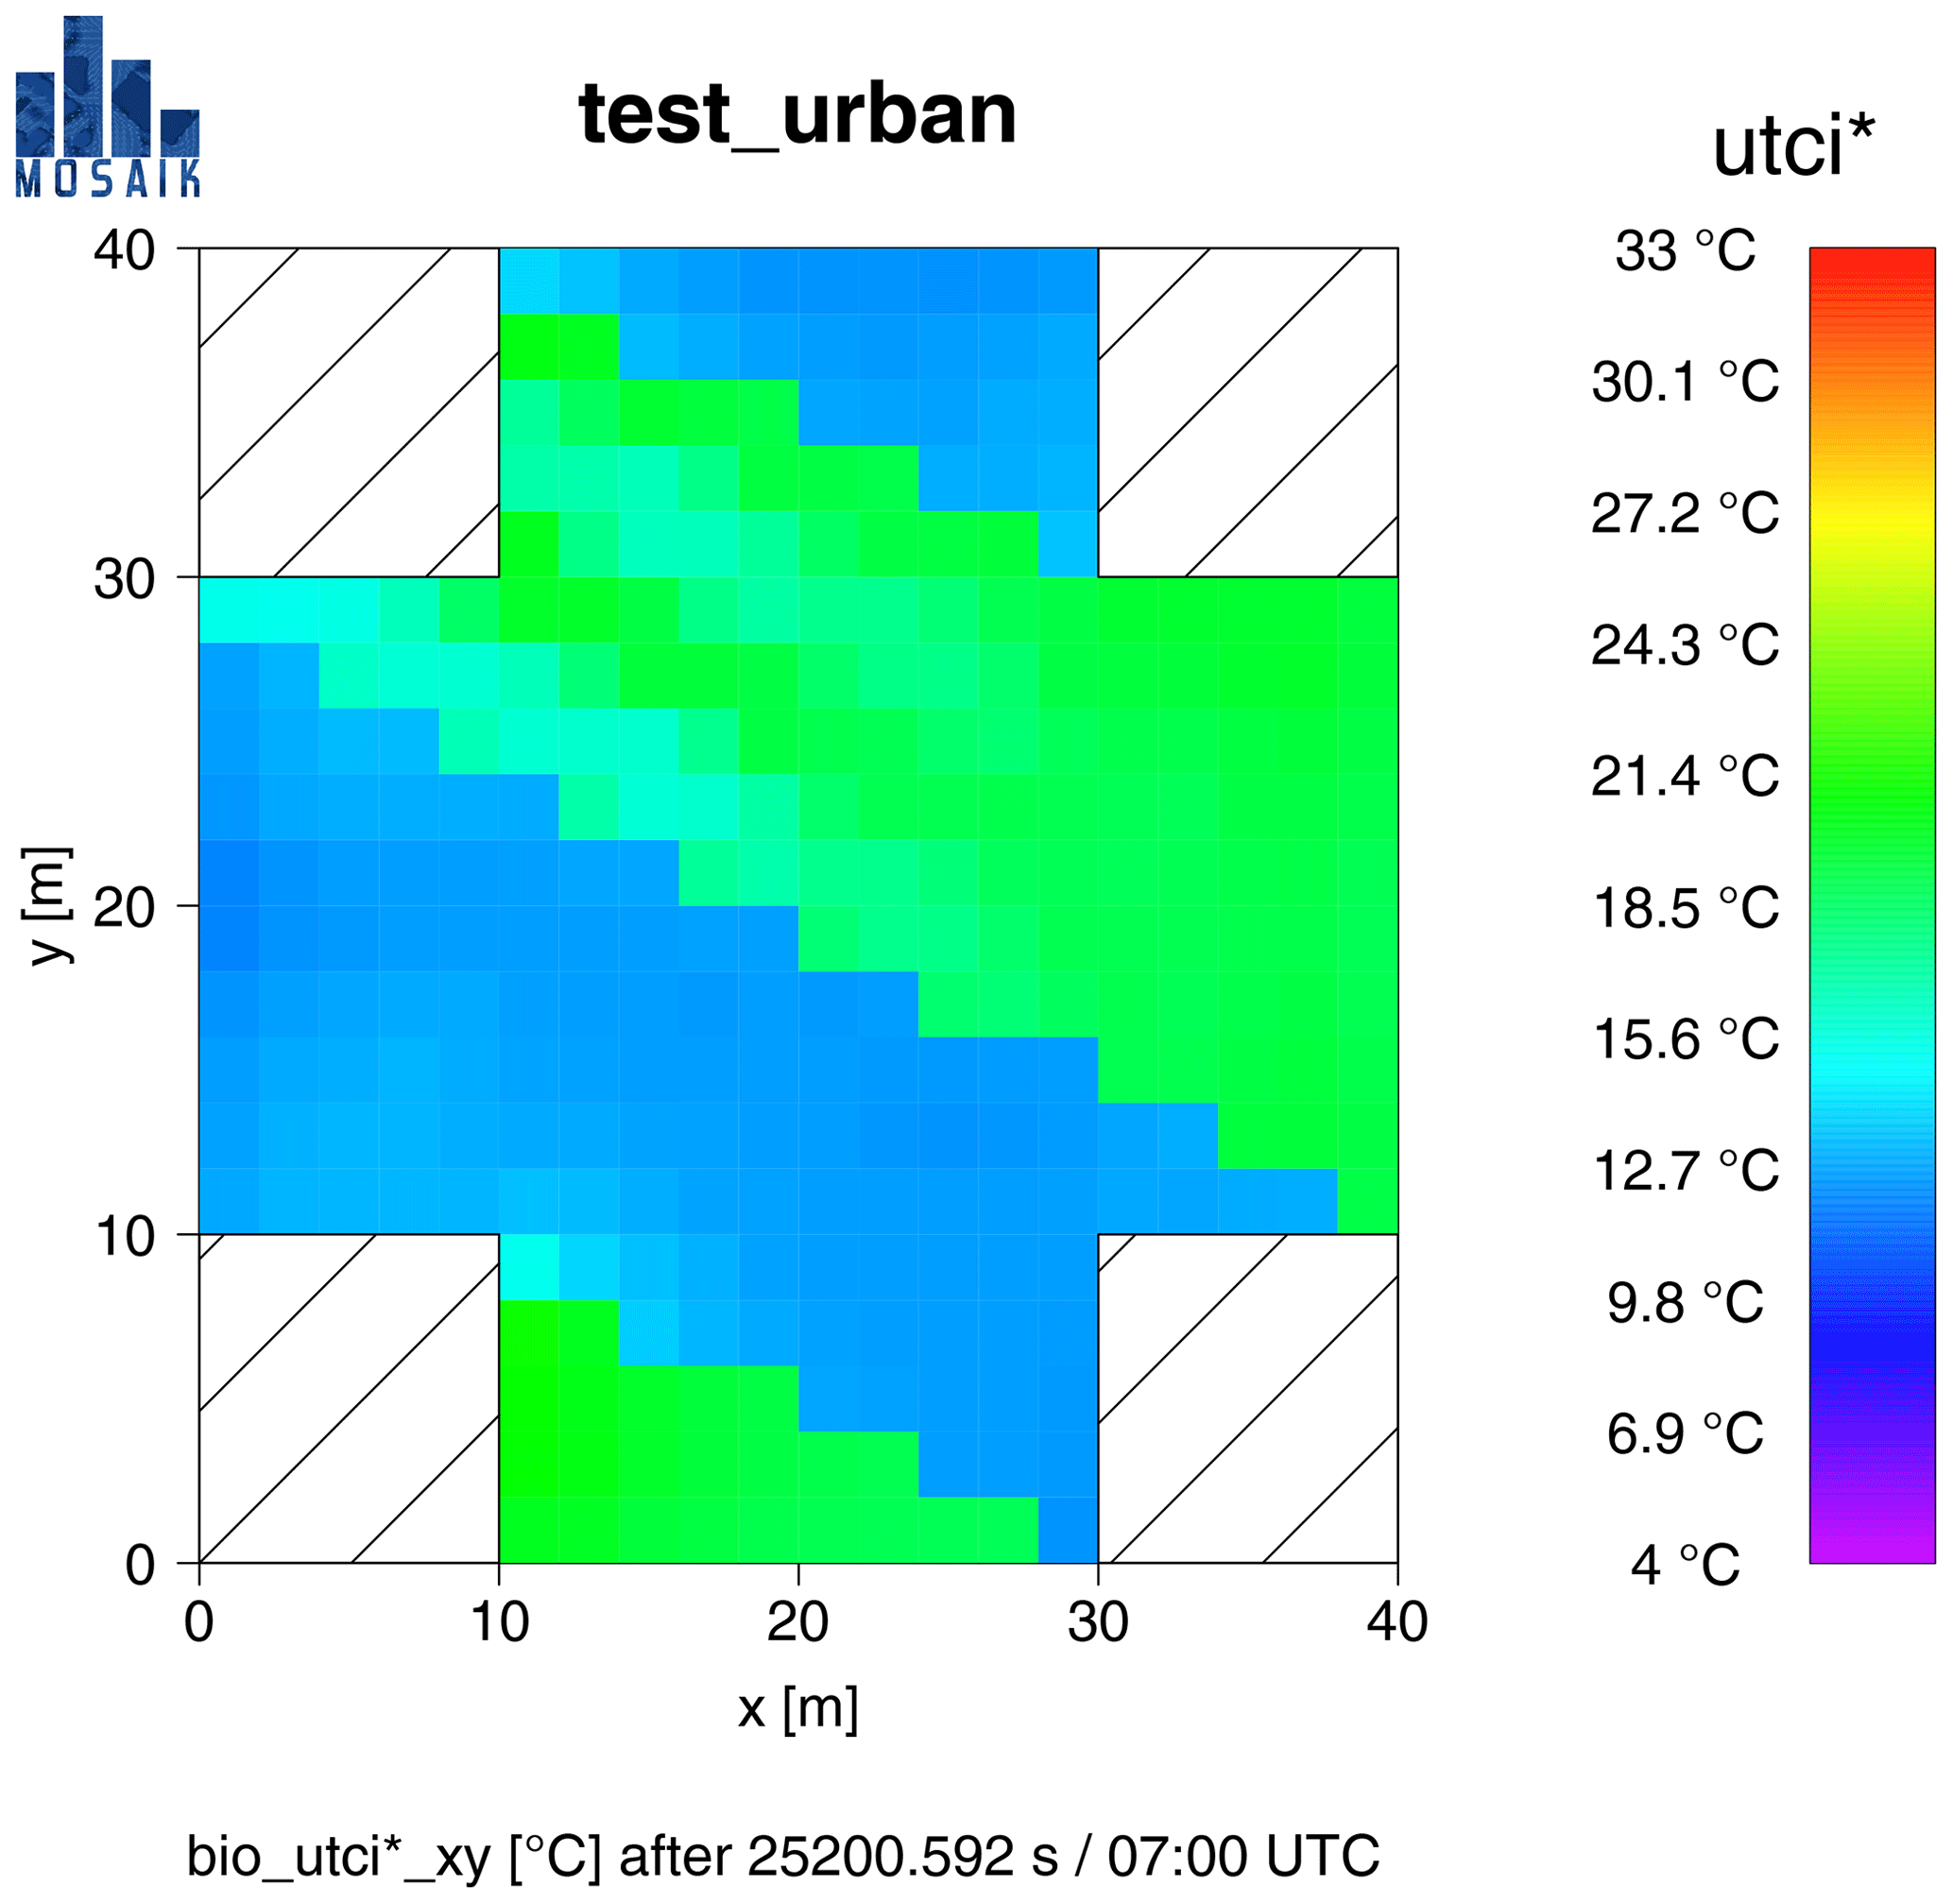
Figure 6UTCI (utci* in PALM) for the test case “test_urban” at 07:00 UTC (shortly after sunrise) on 6 March.
The same scenario can also be analyzed targeting thermal stress using the UTCI thermal index (see Sect. 2.1.1). For 07:00 UTC, UTCI calculates quite similar values to PT (compare Figs. 4 and 6). The absolute numbers for UTCI are way higher than those for PT, with 11.5–14.4 ∘C (UTCI) in the shade and 15.7–19.2 ∘C (UTCI) in sunlit areas. This, however, translates to comfortable conditions without thermal stress throughout the entire model domain (compare to Table 2) and therefore is in good agreement with the results for PT.
Taking a closer look at Fig. 6, one can see that the results for UTCI appear to be more homogeneous in some areas than those for PT (compare to Fig. 4). One of those areas can be found in between the buildings on the right, with UTCI of 18.1–18.3 ∘C. They are mostly caused by wind speed going below the valid range for wind speed to the UTCI regression equation (see Sect. 2.1.1).
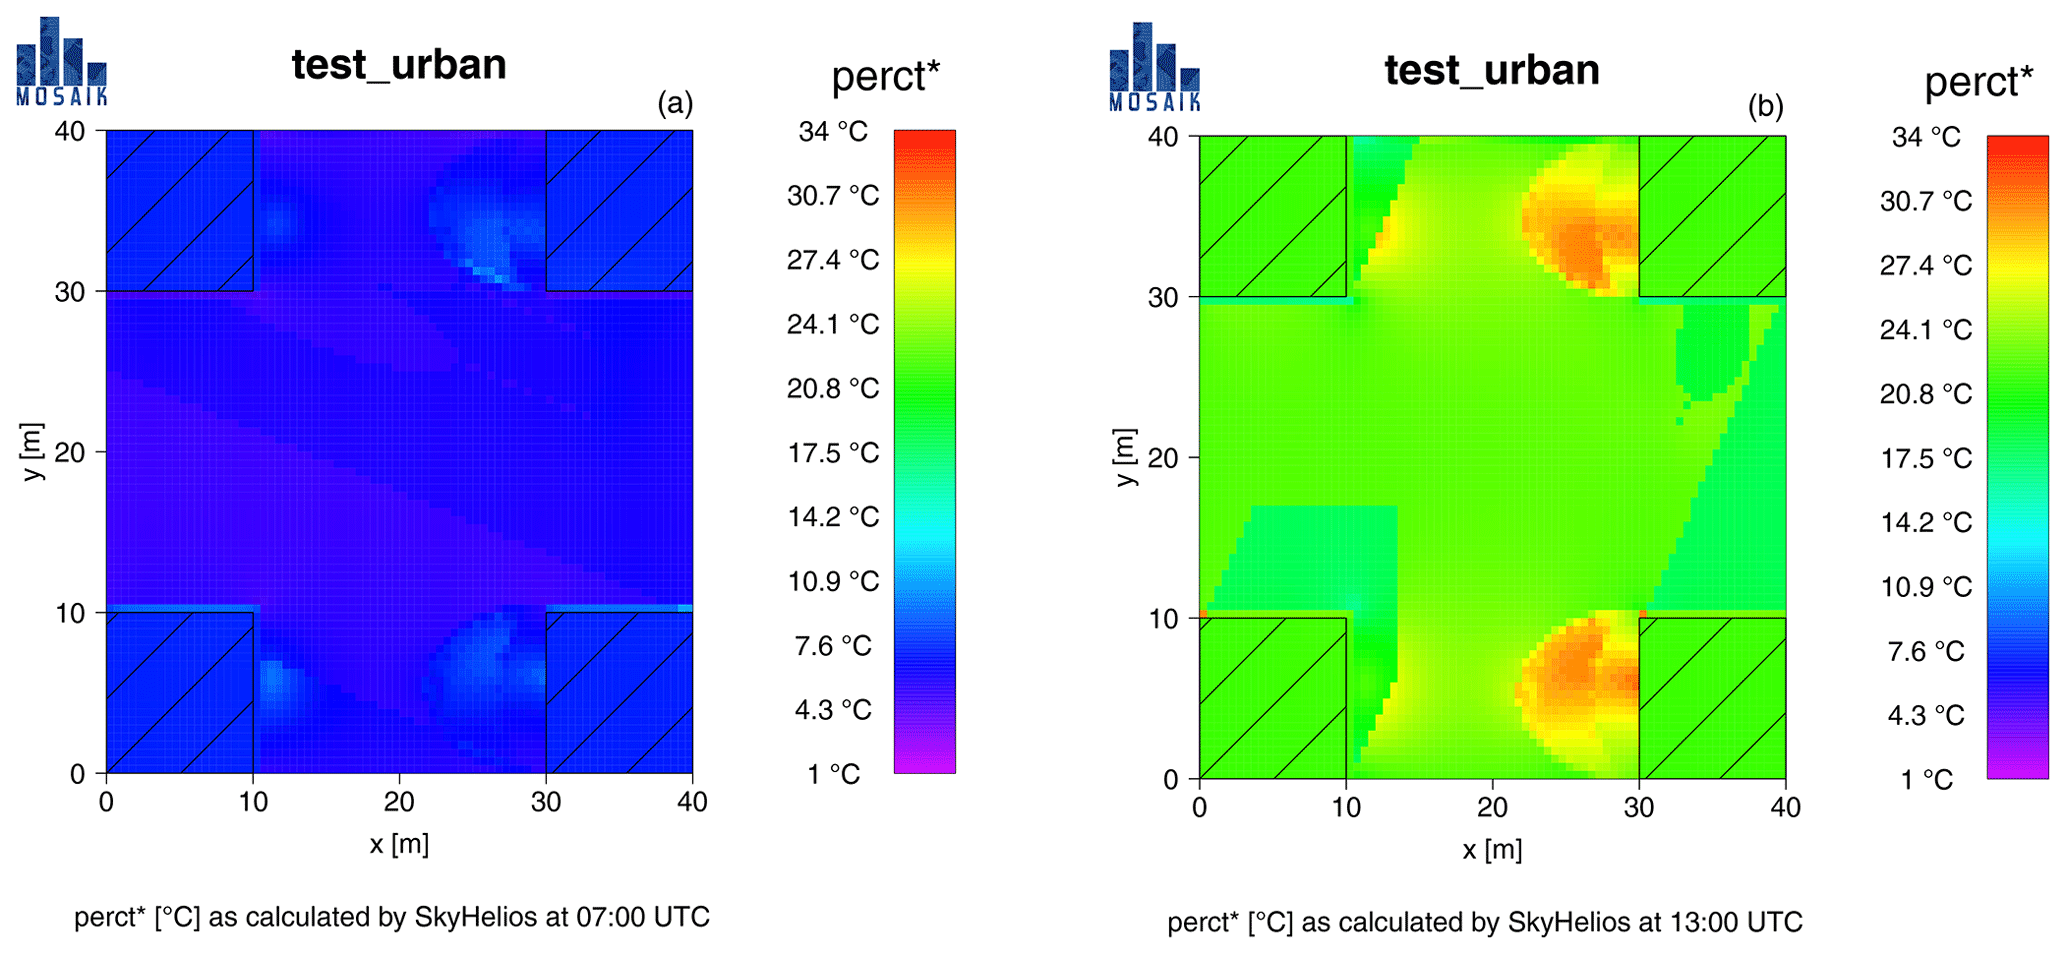
Figure 7PT (perct* in PALM) for the test case “test_urban” at 07:00 UTC (a) and 13:00 UTC (b) on 6 March as calculated by the SkyHelios model.
3.1 Comparison with SkyHelios
A similar model domain was created for the SkyHelios model (Fröhlich and Matzarakis, 2018; Fröhlich, 2017; Matzarakis and Matuschek, 2011) and a run with similar input parameters was performed. Results for the PT (see Fig. 7) show overall cooler conditions compared to the results by PALM (compare to Figs. 4 and 5).
Comparing the results for 07:00 UTC on 6 March (Figs. 4 and 7a) the SkyHelios results generally look more homogeneous. This can be explained by air temperature and air humidity being considered static throughout the model domain in this comparison. Also the diagnostic wind model in SkyHelios generates more homogeneous wind fields in the absence of nearby obstacles. However, the results for PT are not only more homogeneous but also significantly lower than calculated by SkyHelios than those by PALM. PT after SkyHelios ranges from 5.2 ∘C in the shade to a maximum of 11.4 ∘C in the sun in areas with very low wind speed (e.g., at the southwestern corner of the upper right building). This is way less than the PT calculated by PALM ranging from 10.2 to 15.6 ∘C in the sun and 8.0 to 11.1 ∘C in shaded areas. For the SkyHelios results, even the third quantile of the PT results at 07:00 UTC of 7.9 ∘C is lower than the minimum value calculated by PALM.
A similar pattern can be found for the PT results at 13:00 UTC. Comparing Figs. 4 and 7a, one can see once again that the SkyHelios results are more homogeneous for the reasons described above. However, the results calculated by SkyHelios are again significantly lower than those calculated by PALM. For the time of 13:00 UTC, PT calculated by SkyHelios ranges from 16.6 ∘C in shaded areas to a maximum of 30.5 ∘C. The latter, however, is only reached in wind-sheltered areas (west of the upper and lower right obstacles) that are exposed to direct radiation at the same time. Areas without the wind-sheltering effect (e.g., in the central area of the domain) are significantly cooler (around 22.5 ∘C) even if they are exposed to direct radiation. PALM calculates way higher values of PT of 20.0–23.4 ∘C in the shade and 24.4–30.9 ∘C in the sun (see above).
Both the differences at 07:00 UTC as well as at 13:00 UTC can be explained by rather strong disagreement in the mean radiant temperature. While SkyHelios estimates mean radiant temperature of 4.7 ∘C in the shade to a maximum of 14.5 ∘C in the sun for the 07:00 UTC scenario, the same values range from 11.4 to 35.4 ∘C in PALM. For the 13:00 UTC situation, the disagreement is a little lower: while SkyHelios does calculate Tmrt of 25.0 to 47.5 ∘C, PALM results in the range of 25.7 up to 51.7 ∘C.
3.2 Comparison to VDI versions and RayMan results
To get insight on the precision of the results obtained from the biometeorology module, a direct comparison of results by the thermal index programs published in VDI guideline 3787 (VDI, 2008), as well as by the RayMan model, was performed based on the same input data (please refer to Sect. 2.3 for details). The result for each index calculated by the biometeorology module for a set of data was subtracted by the respective VDI and RayMan version. An overview over the deviations is provided by Table 6.
Table 6Statistical overview over the comparison of the results generated by the module for the PT, PET and UTCI thermal indices to those by the respective versions published in VDI guideline 3787 (VDI, 2008) and by the RayMan model. The last row provides the fail value count (“NAs”).
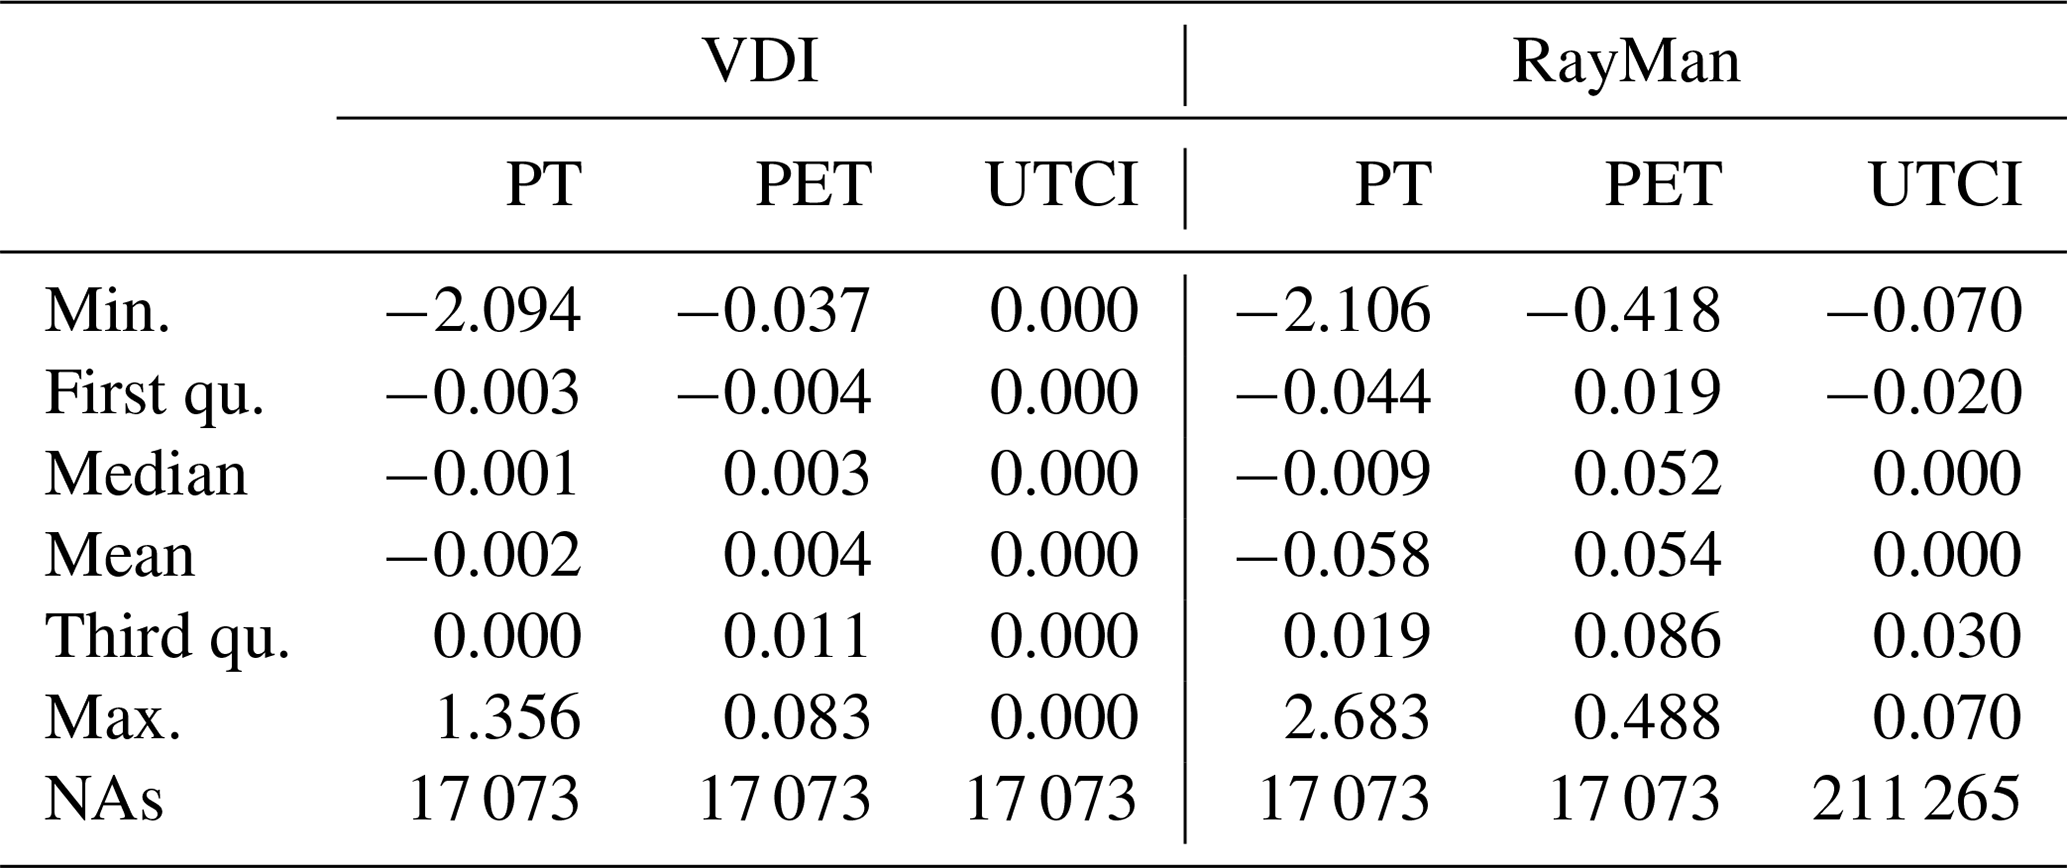
The comparison between the results for PT calculated by the biometeorology module and the VDI version reveals some deviation of up to 2.094 K in rare cases (deviation of 0.1 K or more in 0.027 % of all cases tested in this study). The average deviations are found to be very low (0.002 K).
For the PET index, the deviation between the results by the biometeorology module and the VDI version of the index is slightly higher in average (0.004 K) but does never reach a relevant level of 0.1 K (maximum of 0.083 K). Small deviations are to be expected due to rounding errors in the iterative PET calculations.
For UTCI, no deviation can be found between the results generated by the biometeorology module and the VDI version of the index at all. This can be explained through UTCI is determined by the regression equation in both cases and thus is the least complex index in the comparison (no iterations).
The deviations to the results of the RayMan model are slightly higher for all indices. For PT, the deviation is up to 2.683 K, for PET the maximum deviation is 0.488 K, while there is only a slight deviation of up to 0.07 K for the UTCI. The higher deviations, however, can easily be explained by RayMan running on lower precision and rounding results to 0.1 K.
The implementation of the PT, UTCI and PET thermal indices as a part of the newly developed biometeorology module does allow for a quantitative assessment of thermal comfort and thermal stress (e.g., Staiger et al., 2019) using the PALM-4U model (Maronga et al., 2019b). Results show that the human thermal comfort part of the biometeorology module can generate reliable and plausible results for either of the indices in grid resolution for the vertical cell layer closest to 1.1 m above ground level.
In the current version, the most important indices for Germany are included. However, the module is open source and can easily be extended by the user's favorite thermal index, e.g., the COMFA model (Brown and Gillespie, 1986). The results presented in this study might seem quite high for the date of the case study (6 March). However, with an air temperature ranging from 3.9 ∘C shortly after midnight to 23.9 ∘C in the afternoon, the values are to be expected in this region. Another reason for the hot conditions is the large radiational gain generated by the “clear-sky” scheme, which causes the mean radiant temperature to rise from −0.1 ∘C prior to sunrise to a maximum of 52.0 ∘C in the early afternoon. Furthermore, considering the overall low wind speed, hot conditions as presented here are to be expected (e.g., Fröhlich et al., 2019).
Comparing the results calculated by the biometeorology module to those calculated by the SkyHelios model, the ones by SkyHelios appear to be significantly lower. This is, as described above, mostly due to differences in the mean radiant temperature. Also wind speed calculated by SkyHelios for an incident surface wind speed of 1.0 m s−1 from 270∘ is higher (around 0.1 to 0.9 m s−1) than the wind speed calculated by PALM (less than 0.1 to 0.5 m s−1 at 07:00 UTC).
Both issues might be arising from the grid resolution used in the test calculations. With a grid resolution of m, the grid used for the PALM run is rather coarse. While this is required to keep the computational effort in reasonable scale for a complex model like PALM (Maronga et al., 2015), it decreases precision of the results (Fröhlich and Matzarakis, 2018). This definitely holds for the radiation calculations where the rather coarse obstacles throw stair-like shadows (Fröhlich and Matzarakis, 2018), but also for wind speed in the target height of 1.1 m. As 1.1 m is within the lowest possible layer of cells, ground friction might be overestimated in the wind input to the biometeorology module. The SkyHelios model, in contrast, does perform radiation calculations in a vector-based model domain, while the lower computational effort allows for higher target resolutions (Fröhlich and Matzarakis, 2018). To minimize the negative effects of the rasterized calculations in PALM, a high resolution of, e.g., 1.0×1.0 m horizontally, as well as even higher vertical resolutions (e.g., with telescoping and nesting as proposed by Hellsten et al., 2018), is recommended by the authors.
The quality of the output of the biometeorology module is directly dependent on the input provided by PALM. Any uncertainties in the input values will be present in the thermal indices and therefore must be considered. PALM is a widely applied model that has been used for various studies (e.g., Kanani et al., 2014; Kanani-Sühring and Raasch, 2015; Gronemeier et al., 2017; Wang et al., 2017). Major imprecision therefore is unlikely. While the complexity of the model makes it difficult to assess the precision of the model as a whole, many modules were tested extensively in the past.
Most studies published about PALM concentrate on wind speed and turbulence (e.g., Raasch and Schröter, 2001; Maronga et al., 2015). However, there are also some studies available on other parts of the model. The RRTM radiation scheme was described and assessed by Clough et al. (2005). Also the urban surface model was evaluated by Resler et al. (2017). They found a slight overestimation in air temperature of 2 ∘C in the morning but overall good agreement to their measurements as well as a “reasonably well” reproduced diurnal cycle (Resler et al., 2017). Resler et al. (2017) also compared building wall and street surface temperatures to measurements and found generally good agreement.
Considering the same input to the biometeorology module in terms of air temperature, moisture, wind velocity and mean radiant temperature, the output for PT, UTCI and PET does agree very well (considering the usual rounding effects) to reference calculations by the VDI version of the respective index as well as to results by the RayMan model (Matzarakis et al., 2007, 2010).
The new functionality implemented in the biometeorology module is intended to facilitate the consideration of several aspects of human thermal comfort and stress for various applications and user groups. This allows for the replacement of older and potentially less comprehensive models and methods not only in biometeorological research applications (e.g., Reis and Lopes, 2019; Nouri et al., 2018). It can be used by architects and municipalities to analyze the effect of their design on human thermal perception and health (e.g., Conti et al., 2005; Lin et al., 2010b; Fröhlich and Matzarakis, 2013) to improve their concepts, e.g., fighting the local effect of global climate change or the urban heat island (Reis and Lopes, 2019).
The specific version of PALM applied is provided in the SOURCE folder of Fröhlich (2019). In general, the PALM model system is free software. It can be redistributed and/or modified under the terms of the GNU General Public License (v3). We kindly request that you cite PALM in all your publications. It is available online as described in the PALM installation instructions: https://palm.muk.uni-hannover.de/trac/wiki/doc/install (last access: 27 June 2020).
The modified “test_urban” input dataset along with the results and the respective model source is available online along with Fröhlich (2019). It is a modification of the generic PALM test case “test_urban” provided at https://palm.muk.uni-hannover.de/mosaik/wiki/internal/testing (last access: 19 June 2019).
The paper was conceptualized by DF. The data were prepared equally by AM and DF, both of whom also worked on the applied model. Both authors were not held responsible for the analysis and investigation, while AM provided resources and (internal) funding.
The authors declare that they have no conflict of interest.
This study is part of the MOSAIK project (https://palm.muk.uni-hannover.de/mosaik, last access: 17 June 2020), a part of the [UC]2 program (http://www.uc2-program.org/index.php/en?page=structure_partner&lan=en, last access: 17 June 2020) and is funded by the German Federal Ministry of Education and Research (BMBF).
The publication cost is covered by DWD internal funds that have been made available by Andreas Matzarakis.
This paper was edited by Leena Järvi and reviewed by two anonymous referees.
ASHRAE: Fundamentals, chap. 8, in: Thermal comfort, Tech. rep., American Society of Heating and Air-Conditioning Engineers, Atlanta, 2001. a
Błażejczyk, K., Epstein, Y., Jendritzky, G., Staiger, H., and Tinz, B.: Comparison of UTCI to selected thermal indices, Int. J. Biometeorol., 56, 515–535, https://doi.org/10.1007/s00484-011-0453-2, 2012. a
Błażejczyk, K., Jendritzky, G., Bröde, P., Fiala, D., Havenith, G., Epstein, Y., Psikuta, A., and Kampmann, B.: An introduction to the Universal Thermal Climate Index (UTCI), Geographia Polonica, 86, 5–10, 2013. a, b, c
Bröde, P., Fiala, D., Błażejczyk, K., Holmér, I., Jendritzky, G., Kampmann, B., Tinz, B., and Havenith, G.: Deriving the operational procedure for the Universal Thermal Climate Index (UTCI), Int. J. Biometeorol., 56, 481–494, https://doi.org/10.1007/s00484-011-0454-1, 2012. a, b, c
Brown, R. D. and Gillespie, T. J.: Estimating outdoor thermal comfort using a cylindrical radiation thermometer and an energy budget model, Int. J. Biometeorol., 30, 43–52, https://doi.org/10.1007/BF02192058, 1986. a
Charalampopoulos, I., Tsiros, I., Chronopoulou-Sereli, A., and Matzarakis, A.: Analysis of thermal bioclimate in various urban configurations in Athens, Greece, Urban Ecosyst., 16, 217–233, https://doi.org/10.1007/s11252-012-0252-5, 2013. a
Charalampopoulos, I., Tsiros, I., Chronopoulou-Sereli, A., and Matzarakis, A.: A note on the evolution of the daily pattern of thermal comfort-related micrometeorological parameters in small urban sites in Athens, Int. J. Biometeorol., 59, 1223–1236, https://doi.org/10.1007/s00484-014-0934-1, 2015. a
Chen, Y.-C. and Matzarakis, A.: Modified physiologically equivalent temperature–basics and applications for western European climate, Theor. Appl. Climatol., 132, 1275–1289, https://doi.org/10.1007/s00704-017-2158-x, 2018. a, b, c, d
Clough, S. A., Shephard, M. W., Mlawer, E. J., Delamere, J. S., Iacono, M. J., Cady-Pereira, K., Boukabara, S., and Brown, P. D.: Atmospheric radiative transfer modeling: a summary of the AER codes, J. Quant. Spectrosc. Ra., 91, 233–244, https://doi.org/10.1016/j.jqsrt.2004.05.058, 2005. a, b
Conti, S., Meli, P., Minelli, G., Solimini, R., Toccaceli, V., Vichi, M., Beltrano, C., and Perini, L.: Epidemiologic study of mortality during the Summer 2003 heat wave in Italy, Environ. Res., 98, 390–399, https://doi.org/10.1016/j.envres.2004.10.009, 2005. a, b
Fanger, P.: Thermal comfort, McGraw-Hill, New York, 1972. a, b, c, d, e, f, g, h
Fiala, D., Havenith, G., Broede, P., Kampmann, B., and Jendritzky, G.: UTCI-Fiala multi-node model of human heat transfer and temperature regulation, Int. J. Biometeorol., 56, 429–441, https://doi.org/10.1007/s00484-011-0424-7, 2012. a
Fröhlich, D.: Development of a microscale model for the thermal environment in complex areas, PhD thesis, Albert-Ludwigs-Universität, Freiburg, https://doi.org/10.6094/UNIFR/11614, 2017. a, b
Fröhlich, D.: Modified “test_urban” dataset for thermal comfort in PALM, Zenodo, https://doi.org/10.5281/zenodo.3567814, 2019. a, b, c, d
Fröhlich, D. and Matzarakis, A.: Thermal bioclimate and urban planning in Freiburg – Examples based on urban spaces, Theoretical and Applied Climatology, 111, 547–558, 2013. a
Fröhlich, D. and Matzarakis, A.: A quantitative sensitivity analysis on the behaviour of common thermal indices under hot and windy conditions in Doha, Qatar, Theor. Appl. Climatol., 124, 179–187, https://doi.org/10.1007/s00704-015-1410-5, 2016. a, b, c
Fröhlich, D. and Matzarakis, A.: Spatial Estimation of Thermal Indices in Urban Areas-Basics of the SkyHelios Model, Atmosphere, 9, 209, https://doi.org/10.3390/atmos9060209, 2018. a, b, c, d, e
Fröhlich, D., Gangwisch, M., and Matzarakis, A.: Effect of radiation and wind on thermal comfort in urban environments – Application of the RayMan and SkyHelios model, Urban Climate, 27, 1–7, https://doi.org/10.1016/j.uclim.2018.10.006, 2019. a
Gagge, A., Fobelets, A., and Berglund, L.: A standard predictive index of human response to the thermal environment, ASHRAE Transactions, 14, 709–731, 1986. a, b
Gronemeier, T., Kanani-Sühring, F., and Raasch, S.: Do Shallow Cumulus Clouds have the Potential to Trigger Secondary Circulations Via Shading?, Bound.-Lay. Meteorol., 162, 143–169, https://doi.org/10.1007/s10546-016-0180-7, 2017. a
Havenith, G., Fiala, D., Błazejczyk, K., Richards, M., Bröde, P., Holmér, I., Rintamaki, H., Benshabat, Y., and Jendritzky, G.: The UTCI-clothing model, Int. J. Biometeorol., 56, 461–470, https://doi.org/10.1007/s00484-011-0451-4, 2012. a, b
Helbig, A., Baumüller, J., and Kerschgens, M. J.: Stadtklima und Luftreinhaltung: 2., vollständig überarbeitete und ergänzte Auflage mit 200 Abbildungen und 79 Tabellen, Springer-Verlag, Berlin, Heidelberg, 2nd edn., 1999. a, b
Hellsten, A., Ketelsen, K., Barmpas, F., Tsegas, G., Moussiopoulos, N., and Raasch, S.: Nested Multi-scale System in the PALM Large-Eddy Simulation Model, in: Air Pollution Modeling and its Application XXV, edited by: Mensink, C. and Kallos, G., Springer International Publishing, Cham, 287–292, https://doi.org/10.1007/978-3-319-57645-9_45, 2018. a, b
Höppe, P.: Die Energiebilanz des Menschen, Berichte des Meteorologischen Instituts Nr. 49, Ludwigs-Maximilians-Universität, München, 1984. a, b
Höppe, P. R.: Heat balance modelling, Experientia, 49, 741–746, https://doi.org/10.1007/BF01923542, 1993. a, b, c
Höppe, P. R.: The physiological equivalent temperature – a universal index for the biometeorological assessment of the thermal environment, Int. J. Biometeorol., 43, 71–75, 1999. a, b, c, d, e, f, g, h
Jendritzky, G., Menz, H., Schirmer, H., and Schmidt-Kessen, W.: Methodik zur raumbezogenen Bewertung der thermischen Komponente im Bioklima des Menschen (Fortgeschriebenes Klima-Michel-Modell), Beitr. Akad. Raumforsch Landesplan, 1990. a, b
Jendritzky, G., de Dear, R., and Havenith, G.: UTCI-Why another thermal index?, Int. J. Biometeorol., 56, 421–428, 2012. a, b, c, d, e, f
Kanani, F., Träumner, K., Ruck, B., and Raasch, S.: What determines the differences found in forest edge flow between physical models and atmospheric measurements? An LES study, Meteorol. Z., 23, 33–49, https://doi.org/10.1127/0941-2948/2014/0542, 2014. a
Kanani-Sühring, F. and Raasch, S.: Spatial Variability of Scalar Concentrations and Fluxes Downstream of a Clearing-to-Forest Transition: A Large-Eddy Simulation Study, Bound.-Lay. Meteorol., 155, 1–27, https://doi.org/10.1007/s10546-014-9986-3, 2015. a
Koppe, C., Kovats, S., Jendritzky, G., and Menne, B.: Heat-waves: risks and responses, vol. 2, World Health Organization, Copenhagen, 2004. a
Lin, T.-P., Matzarakis, A., and Hwang, R.-L.: Shading effect on long-term outdoor thermal comfort, Build. Environ., 45, 213–221, https://doi.org/10.1016/j.buildenv.2009.06.002, 2010a. a
Lin, T.-P., Matzarakis, A., Hwang, R.-L., and Huang, Y.-C.: Effect of pavements albedo on long-term outdoor thermal comfort, in: Proceedings of the 7th Conference on Biometeorology, Ber. Meteorol. Inst. Univ. Freiburg, Freiburg, 20, 498–504, 2010b. a, b
Maronga, B., Gryschka, M., Heinze, R., Hoffmann, F., Kanani-Sühring, F., Keck, M., Ketelsen, K., Letzel, M. O., Sühring, M., and Raasch, S.: The Parallelized Large-Eddy Simulation Model (PALM) version 4.0 for atmospheric and oceanic flows: model formulation, recent developments, and future perspectives, Geosci. Model Dev., 8, 2515–2551, https://doi.org/10.5194/gmd-8-2515-2015, 2015. a, b, c
Maronga, B., Banzhaf, S., Burmeister, C., Esch, T., Forkel, R., Fröhlich, D., Fuka, V., Gehrke, K. F., Geletič, J., Giersch, S., Gronemeier, T., Groß, G., Heldens, W., Hellsten, A., Hoffmann, F., Inagaki, A., Kadasch, E., Kanani-Sühring, F., Ketelsen, K., Khan, B. A., Knigge, C., Knoop, H., Krč, P., Kurppa, M., Maamari, H., Matzarakis, A., Mauder, M., Pallasch, M., Pavlik, D., Pfafferott, J., Resler, J., Rissmann, S., Russo, E., Salim, M., Schrempf, M., Schwenkel, J., Seckmeyer, G., Schubert, S., Sühring, M., von Tils, R., Vollmer, L., Ward, S., Witha, B., Wurps, H., Zeidler, J., and Raasch, S.: Overview of the PALM model system 6.0, Geosci. Model Dev., 13, 1335–1372, https://doi.org/10.5194/gmd-13-1335-2020, 2020a. a, b, c, d, e
Maronga, B., Gross, G., Raasch, S., Banzhaf, S., Forkel, R., Heldens, W., Kanani-Sühring, F., Matzarakis, A., Mauder, M., Pavlik, D., Pfafferott, J., Schubert, S., Seckmeyer, G., Sieker, H., and Winderlich, K.: Development of a new urban climate model based on the model PALM – Project overview, planned work, and first achievements, Meteorol. Z., 28, 105–119, https://doi.org/10.1127/metz/2019/0909, 2019b. a, b, c
Matzarakis, A.: Die thermische Komponente des Stadtklimas, no. 6 in Berichte des Meteorologischen Institutes der Universität Freiburg, 2001. a
Matzarakis, A. and Endler, C.: Climate change and thermal bioclimate in cities: impacts and options for adaptation in Freiburg, Germany, Int. J. Biometeorol., 54, 479–483, https://doi.org/10.1007/s00484-009-0296-2, 2010. a
Matzarakis, A. and Matuschek, O.: Sky view factor as a parameter in applied climatology rapid estimation by the SkyHelios model, Meteorol. Z., 20, 39–45, 2011. a, b
Matzarakis, A. and Mayer, H.: Another kind of environmental stress: Thermal stress, WHO Newsletter, 18, 7–10, 1996. a, b
Matzarakis, A., Rutz, F., and Mayer, H.: Modelling radiation fluxes in simple and complex environments – application of the RayMan model, Int. J. Biometeorol., 51, 323–334, https://doi.org/10.1007/s00484-006-0061-8, 2007. a, b
Matzarakis, A., Rutz, F., and Mayer, H.: Modelling radiation fluxes in simple and complex environments: basics of the RayMan model, Int. J. Biometeorol., 54, 131–139, https://doi.org/10.1007/s00484-009-0261-0, 2010. a, b
Mayer, H. and Höppe, P.: Thermal Comfort of Man in Different Urban Environments, Theor. Appl. Climatol., 38, 43–49, 1987. a
Mlawer, E., Taubman, S., Brown, P., Iacono, M., and Clough, S.: RRTM, a validated correlated-k model for the longwave, J. Geophys. Res., 16, 663–682, 1997. a, b
Muthers, S., Matzarakis, A., and Koch, E.: Summer climate and mortality in Vienna – a human-biometeorological approach of heat-related mortality during the heat waves in 2003, Wien. Klin. Wochenschr., 122, 525–531, https://doi.org/10.1007/s00508-010-1424-z, 2010. a
Muthers, S., Laschewski, G., and Matzarakis, A.: The Summers 2003 and 2015 in South-West Germany: Heat Waves and Heat-Related Mortality in the Context of Climate Change, Atmosphere, 8, 224, https://doi.org/10.3390/atmos8110224, 2017. a
Nastos, P. and Matzarakis, A.: The effect of air temperature and Physiologically Equivalent Temperature on mortality in Athens, Greece, Theor. Appl. Climatol., 108, 591–599, 2012. a
Nouri, A. S., Fröhlich, D., Silva, M. M., and Matzarakis, A.: The Impact of Tipuana tipu Species on Local Human Thermal Comfort Thresholds in Different Urban Canyon Cases in Mediterranean Climates: Lisbon, Portugal, Atmosphere, 9, 12, https://doi.org/10.3390/atmos9010012, 2018. a, b
Oke, T. R.: Boundary layer climates, 2nd edition, Routledge, London, New York, 1995. a, b, c, d
Pincus, R., Barker, H. W., and Morcrette, J.-J.: A fast, flexible, approximate technique for computing radiative transfer in inhomogeneous cloud fields, J. Geophys. Res.-Atmos., 108, 4376, https://doi.org/10.1029/2002JD003322, 2003. a
Raasch, S. and Schröter, M.: PALM – A large-eddy simulation model performing on massively parallel computers, Meteorol. Z., 10, 363–372, https://doi.org/10.1127/0941-2948/2001/0010-0363, 2001. a, b
Reis, C. and Lopes, A.: Evaluating the Cooling Potential of Urban Green Spaces to Tackle Urban Climate Change in Lisbon, Sustainability, 11, 2480, https://doi.org/10.3390/su11092480, 2019. a, b
Resler, J., Krč, P., Belda, M., Juruš, P., Benešová, N., Lopata, J., Vlček, O., Damašková, D., Eben, K., Derbek, P., Maronga, B., and Kanani-Sühring, F.: PALM-USM v1.0: A new urban surface model integrated into the PALM large-eddy simulation model, Geosci. Model Dev., 10, 3635–3659, https://doi.org/10.5194/gmd-10-3635-2017, 2017. a, b, c, d
Shashua-Bar, L., Pearlmutter, D., and Erell, E.: The influence of trees and grass on outdoor thermal comfort in a hot-arid environment, Int. J. Climatol., 31, 1498–1506, https://doi.org/10.1002/joc.2177, 2011. a
Staiger, H., Laschewski, G., and Graetz, A.: The perceived temperature – a versatile index for the assessment of the human thermal environment. Part A: scientific basics, Int. J. Biometeorol., 56, 165–176, https://doi.org/10.1007/s00484-011-0409-6, 2012. a, b, c, d, e, f, g, h, i, j, k, l, m
Staiger, H., Laschewski, G., and Matzarakis, A.: Selection of Appropriate Thermal Indices for Applications in Human Biometeorological Studies, Atmosphere, 10, 18, https://doi.org/10.3390/atmos10010018, 2019. a, b
Thorsson, S., Lindberg, F., Eliasson, I., and Holmer, B.: Different methods for estimating the mean radiant temperature in an outdoor urban setting, Int. J. Climatol., 27, 1983–1993, https://doi.org/10.1002/joc.1537, 2007. a
Tromp, S.: Biometeorology – The impact of the weather and climate on humans and their environment (animals and plants), Heyden & Son Ltd, London, Philadelphia, Rheine, 1980. a
VDI: VDI Guideline 3787, Part 2: Environmental Meteorology. Methods for the human biometeorological evaluation of climate and air quality for urban and regional planning at regional level. Part I: Climate, Tech. Rep. 1b, VDI, 2008. a, b, c, d
Wang, W., Ng, E., Yuan, C., and Raasch, S.: Large-eddy simulations of ventilation for thermal comfort – A parametric study of generic urban configurations with perpendicular approaching winds, Urban Climate, 20, 202–227, https://doi.org/10.1016/j.uclim.2017.04.007, 2017. a