
the Creative Commons Attribution 4.0 License.
the Creative Commons Attribution 4.0 License.
 | 12 Oct 2026
Process-based evaluation of green roof models for assessment of heat mitigation efficacy in WRF (v4.3.1) and EnergyPlus (v8.6.0)

Alireza Saeedi
James A. Voogt
E. Scott Krayenhoff
Green roofs mitigate urban heat, but to fully assess their impact, green roof models must be integrated into urban climate models, where they provide critical surface boundary conditions. Ensuring their reliability requires evaluation, yet such efforts remain limited in the literature. This study addresses that gap by evaluating two configurations of EcoRoof, the green roof module from EnergyPlus (ERo for the original version of the model, and ERm for a modified version), and a multilayer green roof parametrization for WRF (WRF-MLGR) (Heusinger et al., 2018; Sailor, 2008; Zonato et al., 2021). These models were tested against field observations from a monitored green roof in London, Ontario, focusing on latent heat flux (Qe), surface temperature (Tsurf), soil heat flux (Qg) and substrate water content (SWC). Model performance varied by variable. The two EcoRoof versions showed similar performance, with mean RMSE across study periods of approximately 56–60 W m−2 for Qe, 3–4 °C for Tsurf, 22 W m−2 for Qg, and 0.03 m3 m−3 for SWC. Performance for Qe was comparable across models; however, WRF-MLGR exhibited much larger errors for Qg (with mean RMSE exceeding 100 W m−2) and SWC (0.06 m3 m−3), along with higher Tsurf deviations (∼5 °C). Overall, EcoRoof provided a more consistent representation of the daytime energy balance, whereas WRF-MLGR showed structural biases in surface heating. These findings highlight the importance of process-level evaluation for urban climate applications and underscore the need for continued model development to address the structural limitations in green roof parametrizations.
- Article
(6809 KB) - Full-text XML
-
Supplement
(1675 KB) - BibTeX
- EndNote


Green roofs have emerged as a promising technology to enhance urban resilience. They consist of vegetation on the rooftops of buildings and offer numerous environmental benefits, such as mitigating urban heat, reducing building energy use, reducing stormwater runoff and contributing to biodiversity and urban livability (Berardi et al., 2014; Oberndorfer et al., 2007; Shafique et al., 2018). Their ability to influence the surface energy balance makes them particularly valuable as an urban heat adaptation strategy. Vegetation and moist growing media redirect energy into the latent heat flux through evapotranspiration, thereby reducing sensible heat flux to the atmosphere, while the substrate's thermal mass dampens diurnal temperature extremes (Li et al., 2014) and acts as a layer of insulation providing year round benefit to the host building.
To capture these effects at the city scale, green roofs must be incorporated into urban canopy models, where reliable parameterizations can provide critical surface boundary conditions for simulations of urban climate adaptation. Rigorous evaluation of their underlying energy-balance schemes is essential for reliable integration into city-scale applications (Krayenhoff et al., 2021). While many studies include green roofs as an adaptation measure (Berardi, 2016; He et al., 2020; Heusinger and Weber, 2017; Jaffal et al., 2012; Kim et al., 2024; Krayenhoff et al., 2003; Liu and Minor, 2005; Martens et al., 2008; Seo et al., 2023; Silva et al., 2016; Zheng et al., 2022), most rely on parameterizations without thoroughly assessing model performance. Furthermore, when evaluation is performed, it usually focuses on outcome variables such as surface or substrate temperature. Krayenhoff et al. (2021) emphasize that evaluating surface energy fluxes (i.e., the physical processes) offers a more robust insight and is essential to ensure accurate and dependable results.
As part of ongoing efforts to improve green-roof representation in urban canopy models (Siddiqui et al., 2022), we evaluate two existing green-roof models: EcoRoof included in EnergyPlus (Sailor, 2008) and a green roof model coupled in the multi-layer urban canopy model BEP-BEM (Martilli et al., 2002) within the Weather and Research Forecasting model (WRF), hereafter referred to as WRF-MLGR (Zonato et al., 2021). These models were selected based on their availability, exportability, and potential integration into the GEM-TEB urban climate modelling framework. They represent contrasting levels of structural complexity and are embedded within widely used building and atmospheric modelling systems, making them strong candidates for comparative assessment.
Despite their widespread use, both models have rarely been subject to comprehensive evaluation. For EcoRoof, the original development by Sailor (2008) reported validation against substrate temperatures with RMSE values around 4 °C and a tendency to overestimate substrate temperatures. Subsequent applications have primarily focused on thermal behavior, with limited evaluation (e.g. Cascone et al., 2018; Zheng and Weng, 2020; Costanzo et al., 2016). Studies that do include some form of evaluation do not explicitly assess surface energy fluxes. For example, Silva et al. (2016) reported RMSE values below 2 °C for indoor and surface temperatures and noted a positive bias under high radiation conditions, while Karachaliou et al. (2016) found good agreement between modeled and observed surface temperatures with differences below 1.3 K.
Similarly, WRF-MLGR was first introduced by Zonato et al. (2021) within the WRF-BEP-BEM framework (Martilli et al., 2002; Salamanca et al., 2010), and its implementation rather than evaluation was emphasized. Some subsequent studies have applied this framework to urban mitigation analyses. For instance, Brousse et al. (2024) used WRF-BEP-BEM with the Zonato et al. (2021) green roof scheme to simulate the cooling effects of green and cool roofs on urban air temperatures but did not validate model outputs. Similarly, Chen et al. (2023) applied a WRF configuration based on Zonato et al. (2021), to study rooftop mitigation strategies in China and evaluated air temperature, wind speed, and relative humidity, reporting maximum RMSE values of 4.13 °C, 1.63 m s−1, and 21.69 %, respectively. However, no energy balance components or surface fluxes were evaluated. Overall, while WRF has been widely used to simulate the impacts of green roofs, rigorous validation – especially of surface energy balance components and green roof-specific processes – remains limited. Many applications using alternative WRF configurations (e.g., SLUCM, BEP-BEM, PUCM) have similarly omitted validation or relied primarily on atmospheric variables without assessing surface fluxes or roof-level temperatures (Imran et al., 2018; Kalogeri et al., 2023; Khan et al., 2023; Sun et al., 2016).
Taken together, these examples highlight a common trend in literature: while these models are widely applied to estimate cooling potential, energy performance or inform design and policy decisions, their predictive accuracy is rarely scrutinized. This underscores the need for systematic evaluation of green roof models. To address this gap, we evaluate EcoRoof and WRF-MLGR against observations from a green roof test array. Specifically, we ask: (a) how well does each model reproduce fluxes (Qe, Qg) and Tsurf during multi-month periods? (b) How does model performance change across different moisture regimes and radiative forcing conditions? and (c) how accurately do they simulate substrate water content dynamics during and after precipitation events?
2.1 Site and experimental setup
The study site for this research is a green roof located on the rooftop of the Talbot College building, at Western University, London, Ontario, Canada. The green roof plot is composed of individual modules placed side by side, with dimensions of 0.3×0.3 m and depths of 0.10 and 0.15 m. The green roof does not completely cover the roof area; Fig. 1 shows a photograph of the green roof setting. It has three different types of vegetation: Sedum spurium, Aquilegia canadensis, and Sporobolus heterolepis.

Figure 1The green roof test array on Talbot College at Western University. Photo credit: J. Voogt.
For this study, the observational data comes from a central array within the green roof which is elevated from the roof surface to allow the installation of lysimeters. The array consists of modules planted exclusively with Sedum spurium. The growing media was previously characterized by Perelli (2014) and was constructed as a homogeneous 0.15 m layer, with no intentional vertical differentiation in material composition. For analysis purposes, however, the substrate was treated analytically as a 2.5 cm surface layer and a 12.5 cm subsurface layer, reflecting sensor placement and root distribution rather than distinct physical layers within the growing medium.
2.2 Data collection and observed variables
This research uses observational data from the summer and fall seasons of 2014, collected from 1 July to 31 October 2014. Details about the measured variables and instrumentation used can be found in Sect. S1 of the Supplement and on Kurukulaarachchi (2017). The variables analyzed in this study are Qe, Qg, Tsurf and SWC; while the sensible heat flux (Qh) was determined as the residual of the surface energy balance and is therefore not included in the model performance evaluation. Energy-balance components and microclimate variables were sampled at 1 s intervals and subsequently averaged and stored at 5 min resolution, lysimeters, rain gauges and drainage units were averaged (or totaled, as appropriate) over 1 min intervals. A conceptual diagram of the green roof instrumentation set up is shown in Fig. 2.
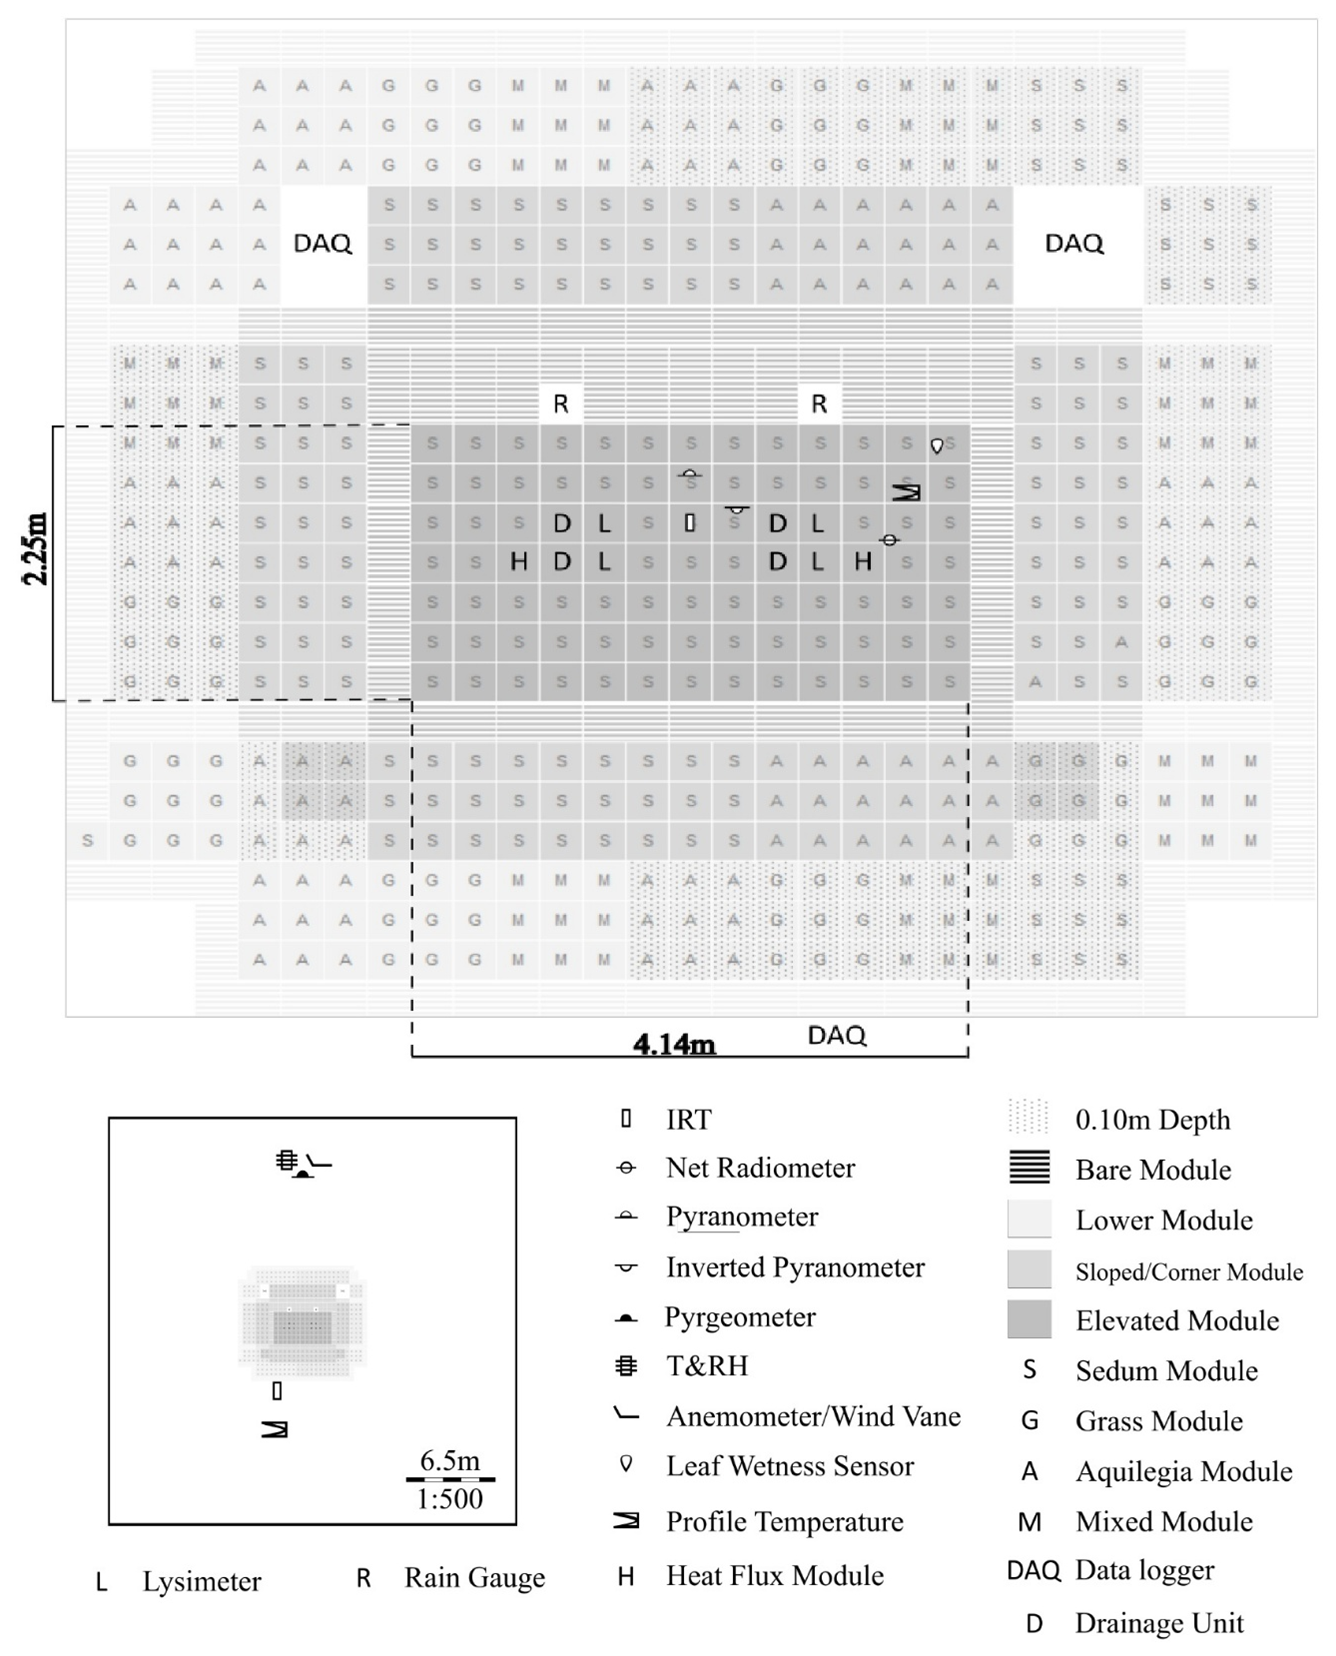
Figure 2Green roof conceptual diagram (Kurukulaarachchi, 2017).
2.3 Selection of study periods and evaluation criteria
2.3.1 Selection of analysis periods
To evaluate model performance, two analysis periods of 62 d were selected, each encompassing multiple precipitation events interspersed with drying intervals. Period selection was guided by a monthly stratification of the dataset, for which summary statistics (mean, standard deviation, and 25th, 50th, and 75th percentiles) were computed for net radiation, air temperature, vapor pressure deficit (VPD), and wind speed. Based on similarities in these environmental characteristics, July–August was grouped as “summer” and September–October as “fall”. These labels are used only for descriptive convenience and do not correspond to full meteorological seasons.
Two additional subsets were defined to isolate model performance under contrasting environmental conditions: dry versus rainy days and low versus high net radiation (Q*). For the moisture-based classification, a daily rainfall threshold of >5 mm was used to identify rainy days, while dry days were defined as having <0.2 mm of rainfall on the target day and during the preceding 2 d. This classification yielded 15 rainy days in summer and 11 in fall, and 13 dry days in summer and 14 in fall.
For the radiation-based classification, high- and low-net radiation days were identified using percentile thresholds: days below the 25th percentile of daytime mean net radiation were classified as low-net radiation conditions, and days above the 75th percentile were classified as high-net radiation conditions. This procedure resulted in 31 low-net radiation days and 31 high-net radiation days across the analysis periods.
2.3.2 Evaluation criteria and data exclusions
Although the model simulates energy balance continuously, the focus of the evaluation is not on the accuracy of fluxes during precipitation itself, but rather on how well the model responds to rainfall inputs over time. To isolate this response, time steps with active precipitation (rainfall > 0.2 mm) were excluded at the analysis stage. This approach is consistent with the study objectives, as Qe cannot be reliably estimated from lysimeters measurements during rainfall and moreover, evapotranspiration is minimal under these conditions due to high humidity and reduced vapor pressure gradients.
The evaluation was restricted to daytime conditions (), when surface energy exchanges are dominated by radiative forcing and turbulent fluxes are most pronounced. In addition, time steps affected by instrument malfunction, calibration activities, or missing data were removed. All exclusions were applied only to the observed and modeled outputs used for evaluation; the simulations themselves were performed using the complete forcing datasets.
2.4 Observed energy balance: framework and assumptions
The experimental green roof used in this study occupies only a portion of the roof surface (Fig. 1), surrounded by conventional roofing material, introducing potential for advective effects, as thermal gradients between the vegetated and bare roof surfaces may influence heat exchange. Kurukulaarachchi (2017) analyzed selected drying periods from 2014 and found that only 2.8 % of the data showed possible signs of advection, with strong evidence present in just 1.2 % of the cases. Advection in that study was diagnosed using four separate case definitions based on diagnostic criteria including periods when Qe exceeded the available energy, the presence of near-surface temperature inversions over the green roof, and wind directions and roof-surface temperature differences consistent with flow across a long, warmer conventional-roof fetch. These diagnostics were used to flag periods when warm, dry air was likely being advected over the vegetated modules and enhancing evaporation.
Based on these findings, advective influences were considered limited, affecting only a small fraction of the present dataset. Accordingly, the observational surface energy balance is formulated under the assumption of negligible horizontal energy fluxes, and is expressed as:
Before calculating observed Qe and Qg, the raw data underwent processing steps to ensure physical consistency and compatibility among variables. These steps included computing lysimeter weight changes, converting precipitation and drainage data into equivalent depths, deriving substrate water content from lysimeter measurements, and estimating a substrate heat capacity that accounts for changes in moisture. Observed Qe was taken as the average of the two lysimeter-derived (northeast and southeast) estimates, whereas Qg was derived from one module only (west module) due to extensive missing data in the other module. In addition, the radiative measurement of Tsurf was corrected using an emissivity of 0.96 (Kurukulaarachchi, 2017), and the measured incident longwave radiation to represent kinetic temperature. Detailed derivations and processing steps for all variables are provided in Sect. S2 of the Supplement.
2.5 Green Roof Energy Balance Models
2.5.1 Comparison of Model Approaches
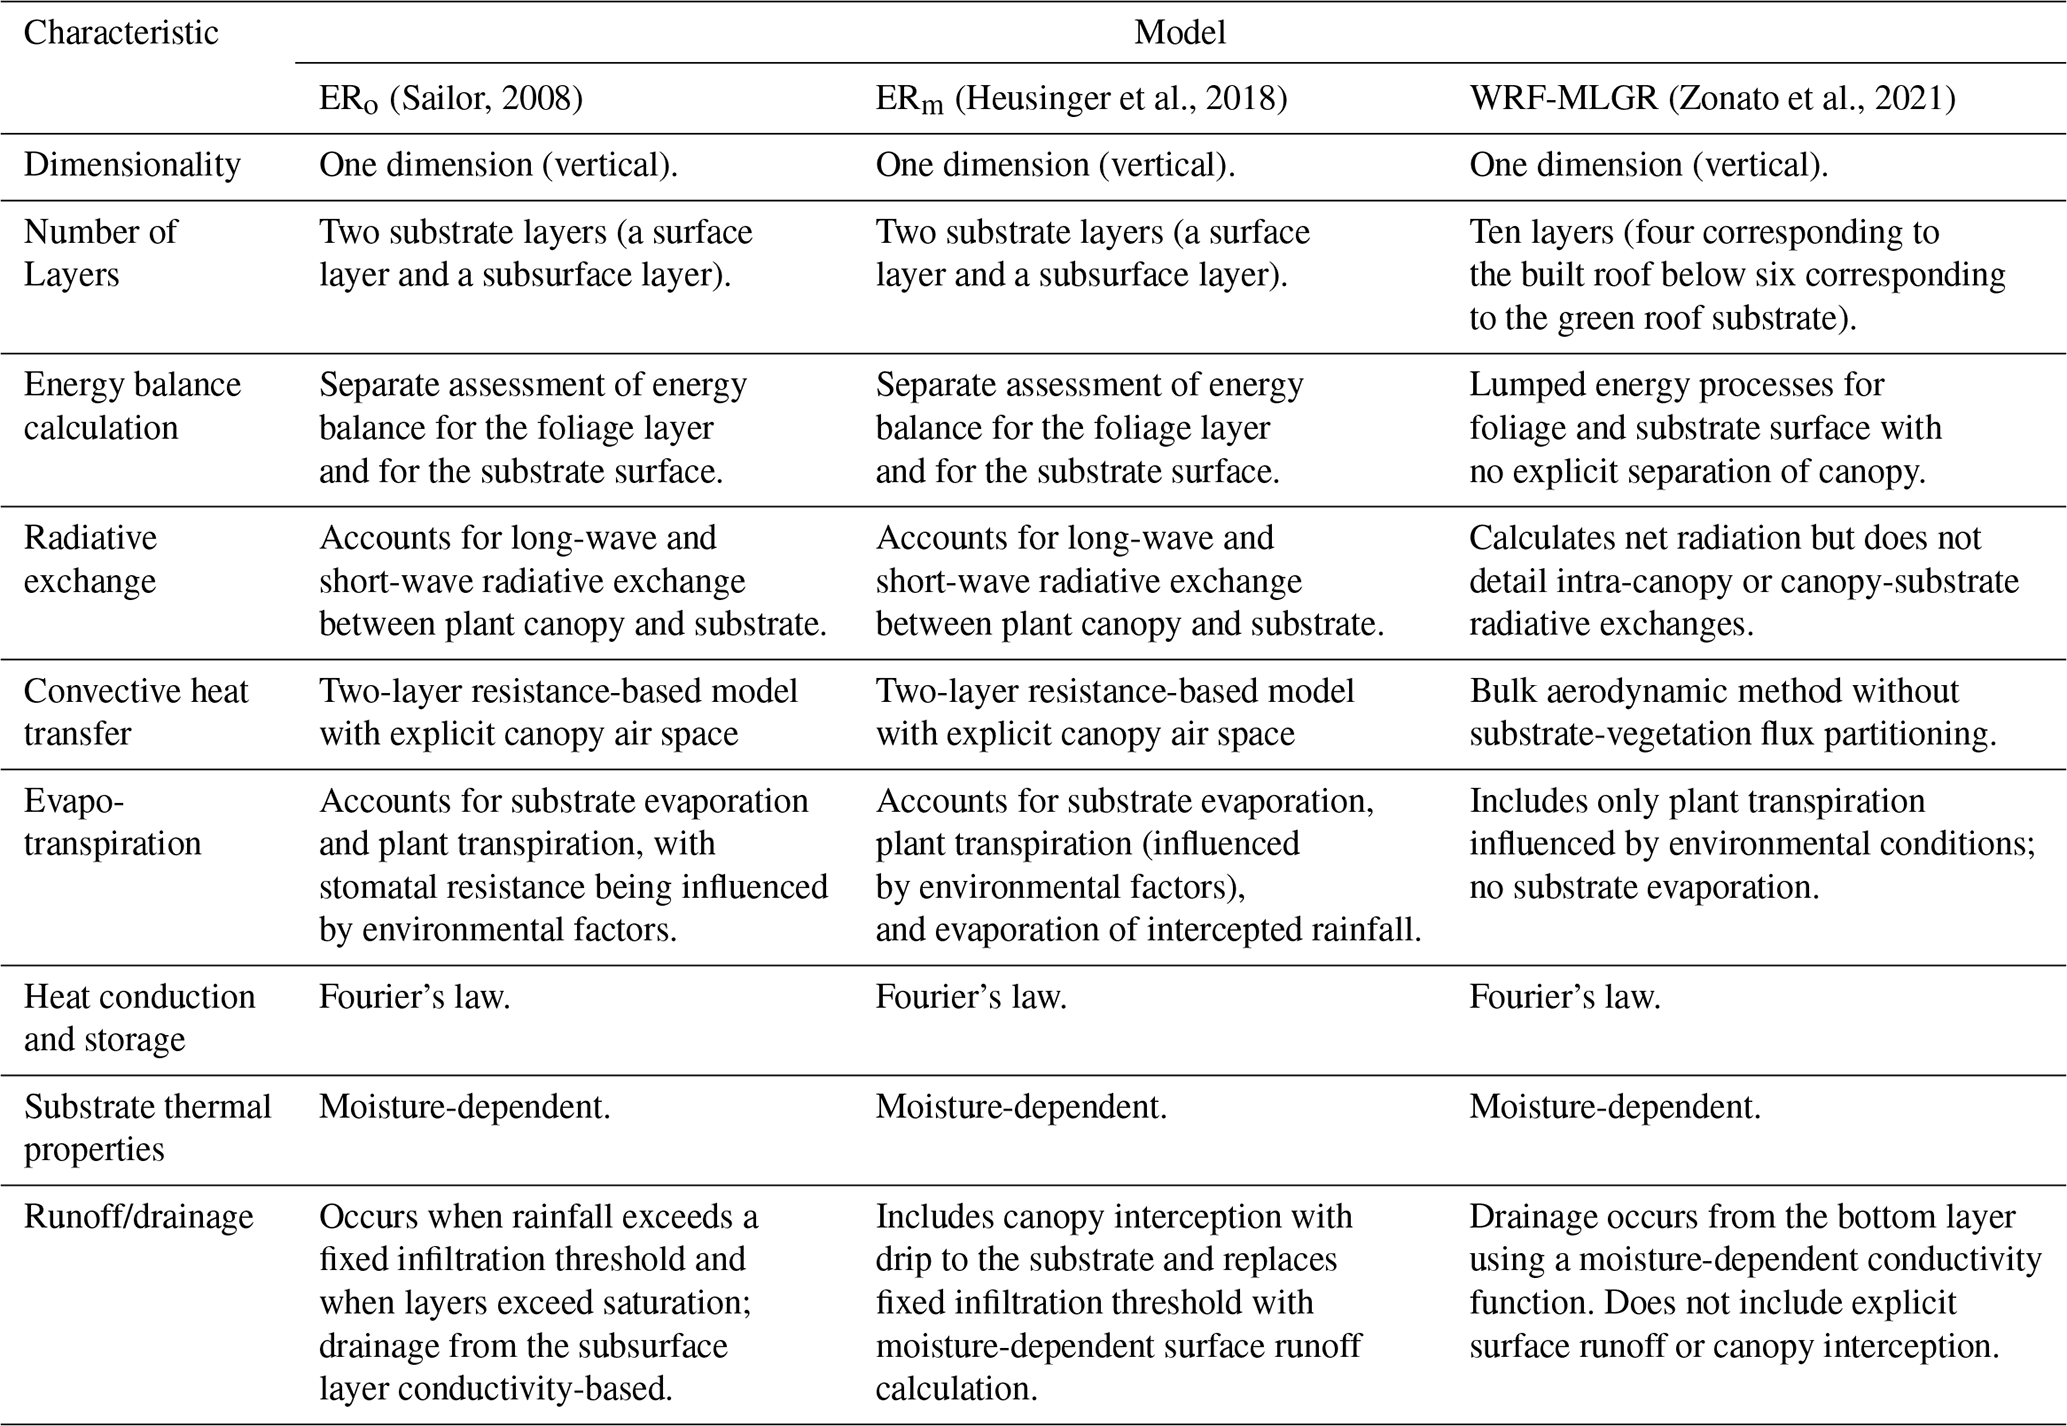
The models to be compared are stand-alone versions of ER – an original version of the model, as found withing EnergyPlus v8.6.0 (Sailor, 2008), and a modified configuration following Heusinger et al. (2018) – and a stand-alone version of the green roof parametrization embedded in WRF v.4.3.1 (Zonato et al., 2021). Table 1 provides an overview of each model.
2.5.2 Model set up
In addition to input parameters, which need to be specified in the program, the models require an input file with atmospheric forcing data, which is common to both models. It consists of time series measurements of eight variables: incoming solar radiation, incoming longwave radiation, wind speed, air temperature, humidity, precipitation, air pressure and irrigation. Most variables were directly measured on site, except air pressure, which was retrieved from London A weather station (WMO ID: 71623), located at London International Airport.
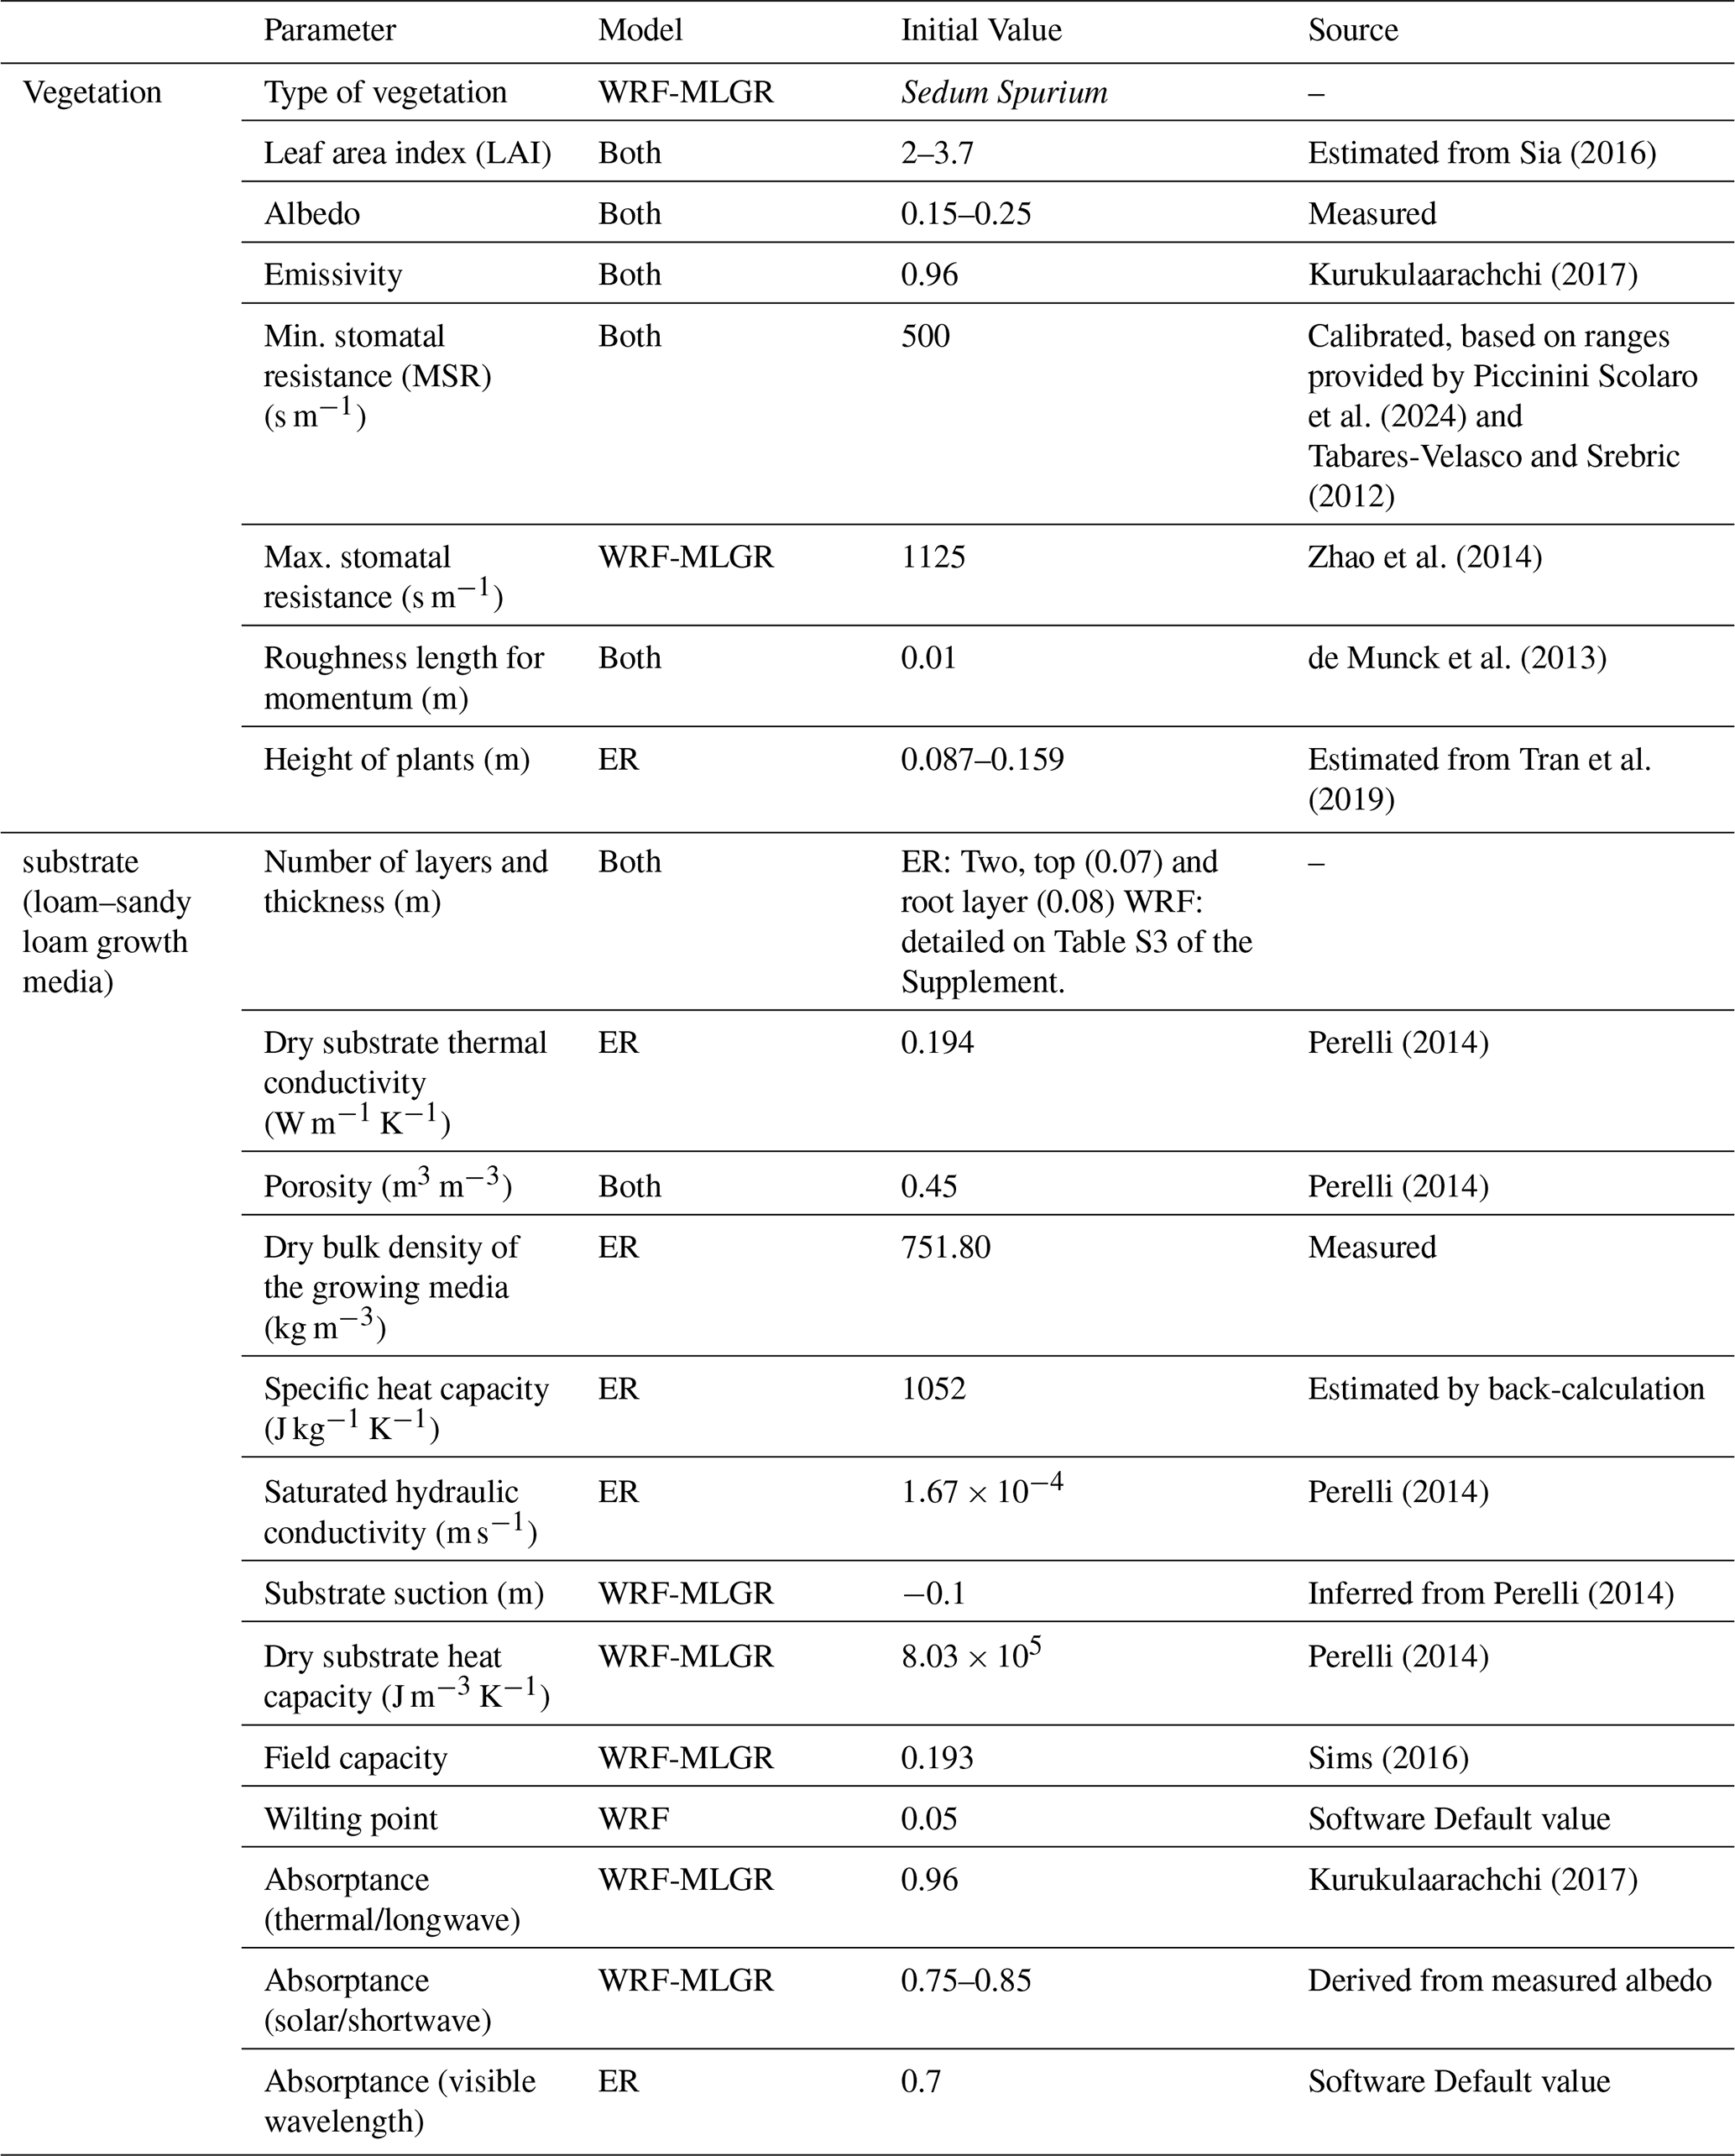
Both models also require prescribed vegetation and substrate parameters, as well as initialization variables specific to each model. Key model input parameters and prescribed values are summarized in Table 2. Additional details are provided in Sect. S5 of the Supplement. Some parameters such as LAI, and vegetation height, may vary seasonally; however, continuous time series measurements were not available. Therefore, representative values appropriate for each study period were selected based on available measurements and previous studies conducted on the green roof. Although albedo was measured continuously, period-specific values were used to provide a single representative parameter value for each simulation period.
The models are initialized (forcing file starts) at 03:00 LT on the first day of the period and end at 23:00 LT on the last day of the period. The timesteps are 5 min long and the values used for the initialization correspond to the value at the 03:00 time step for all variables except albedo, which is an average.
2.6 Evaluation metrics
For the model evaluation a quantitative analysis was performed to compare modeled and observed values. The statistical metrics calculated are Mean Absolute Error (MAE), Mean Bias Error (MBE) and Root Mean Square Error (RMSE); along with the statistical method for model evaluation outlined by Willmott (1982) and Willmott et al. (1985, 2012). This includes the separation of RMSE into its systematic (RMSEs), and unsystematic (RMSEu) components, and the Index of agreement. For this study the refined version of the Index of agreement (dr) is used (Eqs. 2 and 3), given that it includes improvements from the original version.
where n is the number of observations of y, yi is the ith observation, is the mean, represents the modeled value and C is a constant, equal to 2. The improvements of this version include an index range that is double of the original (range from −1 to 1), which provides greater separation when comparing models that perform relatively well, and the use of absolute rather than squared differences, which makes the index less sensitive to outliers (Willmott et al., 2012). The better performing green roof model should have lower values of RMSE and higher RMSEu relative to RMSEs; and a dr value closer to 1 (Comer et al., 2000; Willmott et al., 2012).
3.1 Weather conditions
During the summer period (DOY 182–243), conditions show persistently high daytime mean incoming shortwave radiation and relatively stable daily mean incoming longwave radiation. Daily mean air and surface temperatures remain elevated throughout the period, with surface temperatures consistently exceeding air temperatures, and exhibiting a relatively wide daytime temperature range as indicated by the min–max envelopes. Specific humidity shows moderate variability, with lower daily mean values generally coinciding with warmer, clearer days. Daily mean wind speeds remain low to moderate and vary mainly from day-to-day, indicating variability driven by changing synoptic conditions. Precipitation occurs on a limited number of days, with most events near 10 mm (Fig. 3).
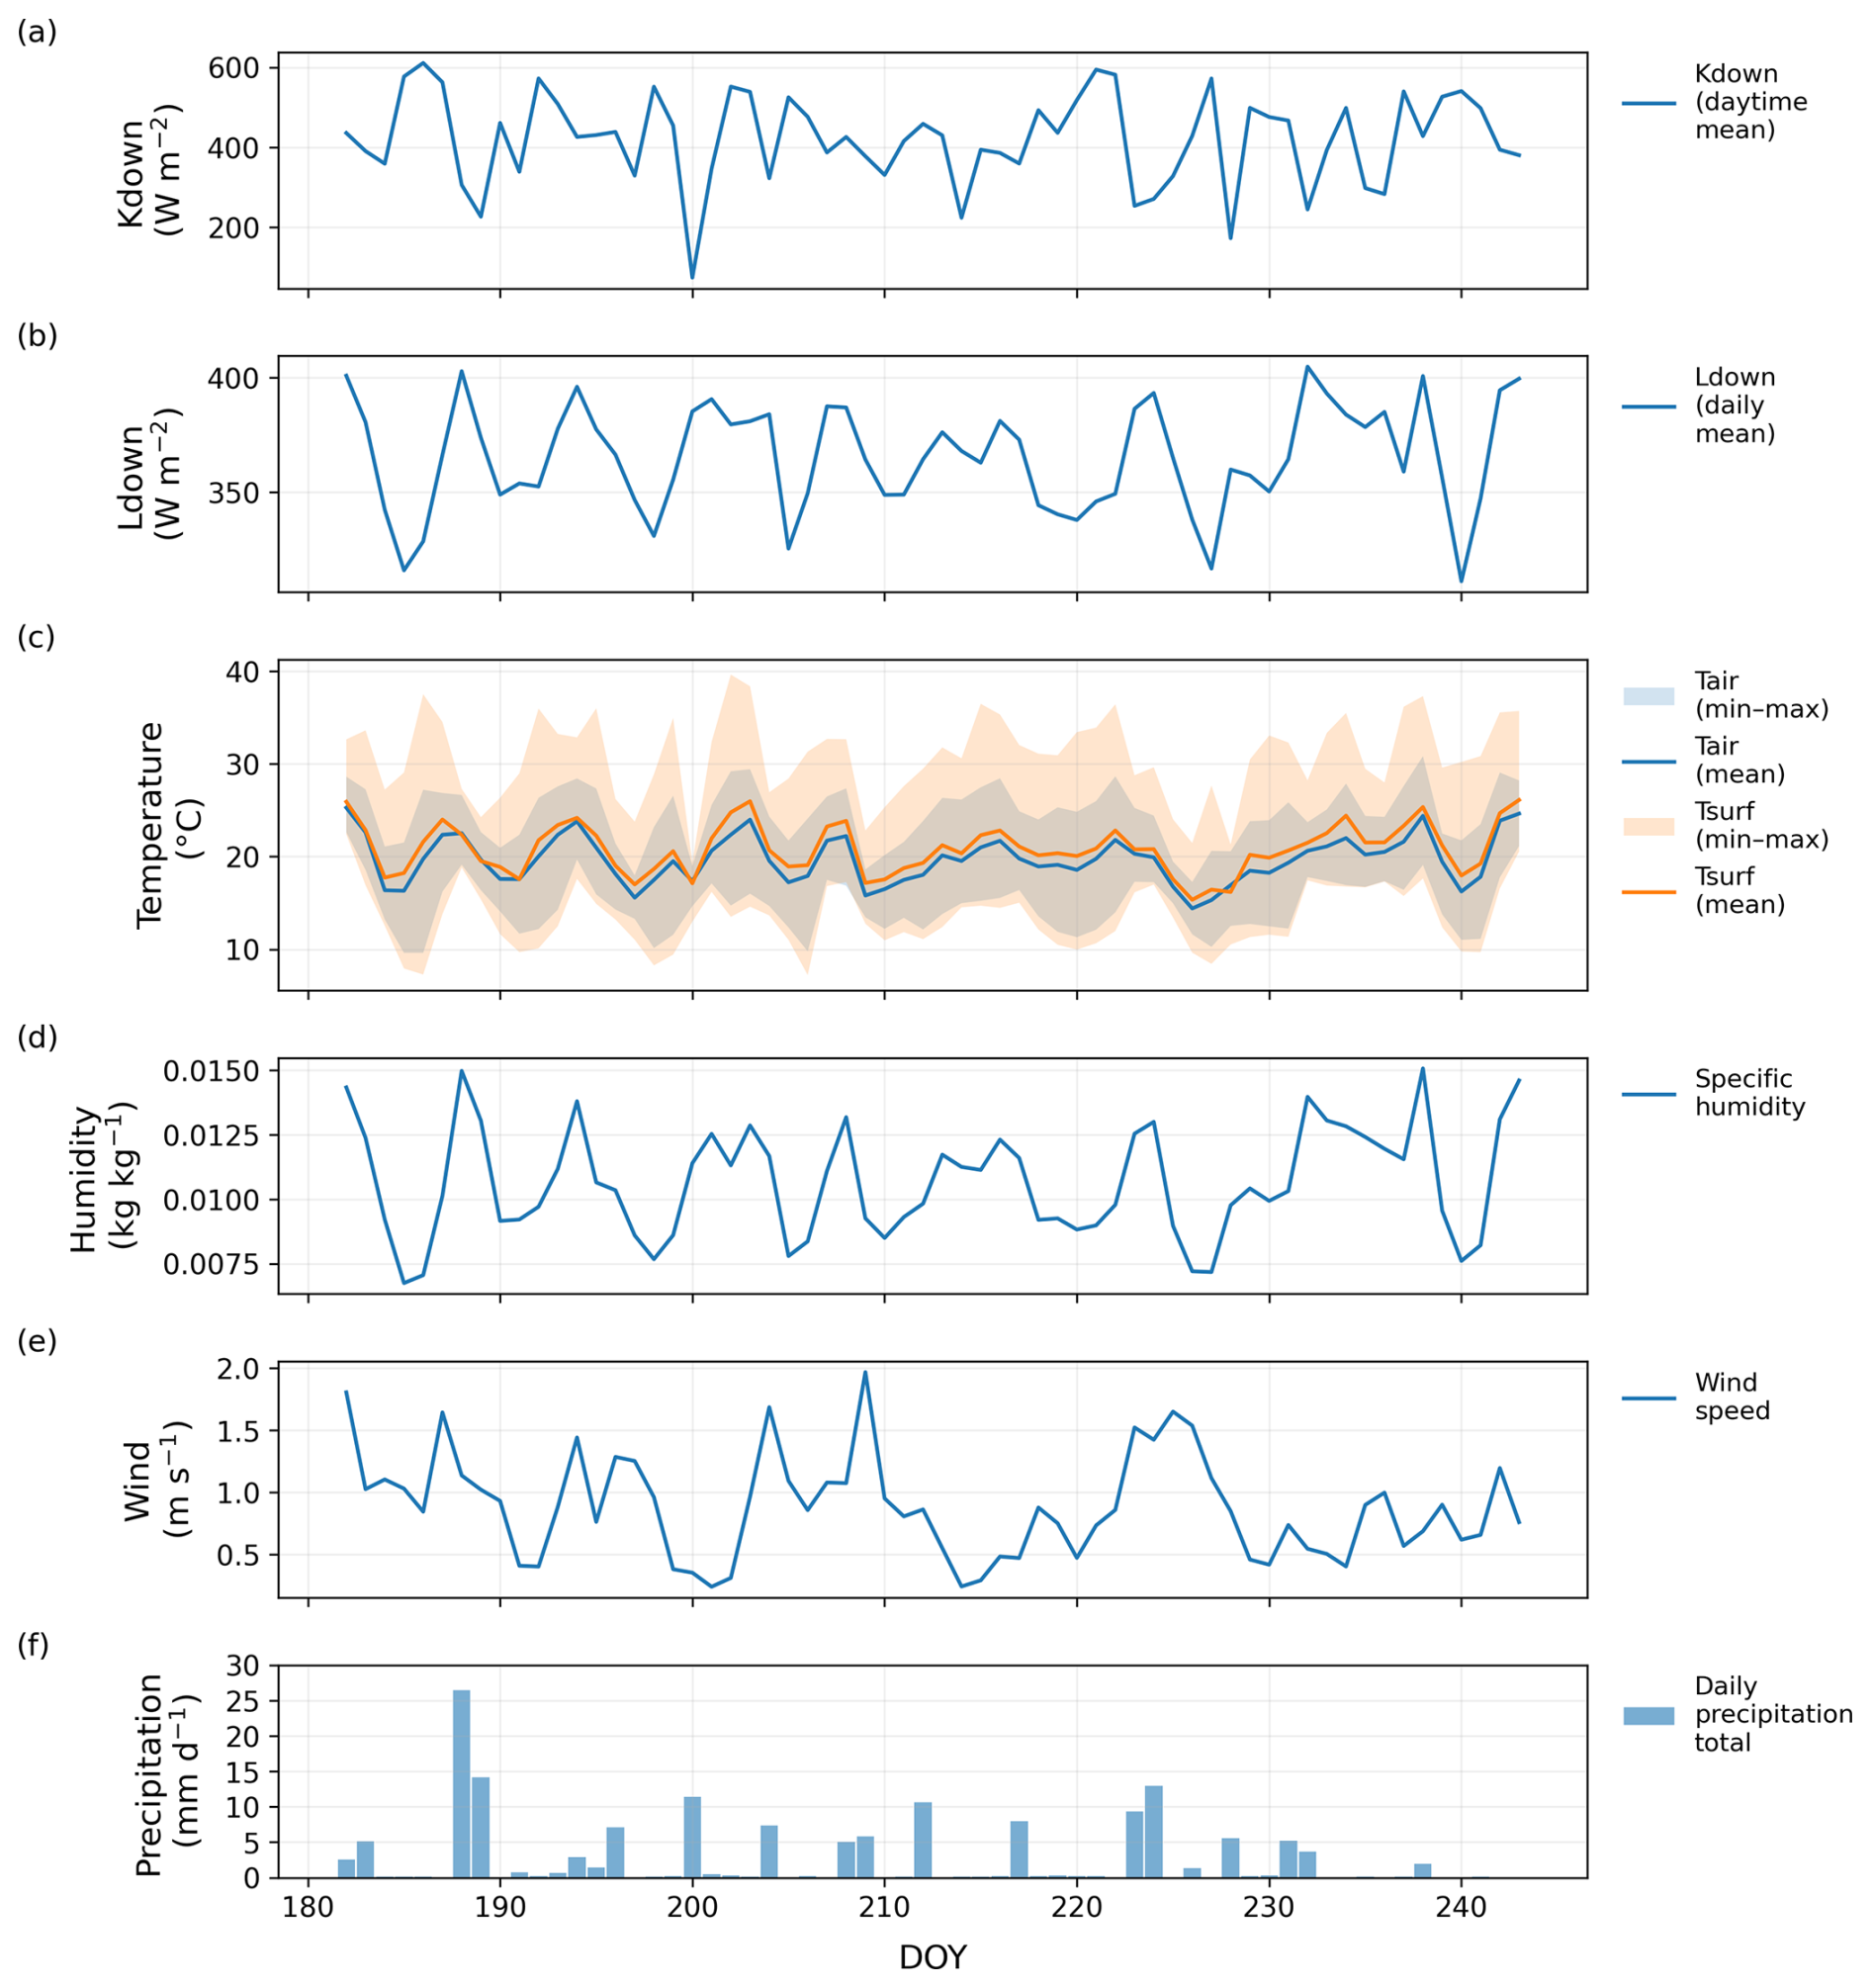
Figure 3Weather conditions during the summer period. Panels (a) and (b) show daytime mean incoming shortwave (Kdown) and daily mean longwave (Ldown) radiation, respectively; panel (c) shows daily mean air and surface temperatures with shaded envelopes indicating the daily minimum–maximum temperature range; panel (d) shows daily mean specific humidity; panel (e) shows daily mean wind speed; and panel (f) shows daily precipitation totals.
During the fall period (DOY 244–304), daytime mean incoming shortwave radiation decreases relative to summer and shows greater day-to-day variability, while daily mean incoming longwave radiation remains comparatively stable. Daily mean air and surface temperatures decline over the period, and the daily temperature range becomes narrower. Daily mean specific humidity is generally lower than during summer, consistent with cooler atmospheric conditions, while daily mean wind speeds show increased day-to-day variability. Precipitation occurs on a similar number of days as in summer, with most events below 10 mm and two significant larger rainfall events (Fig. 4).
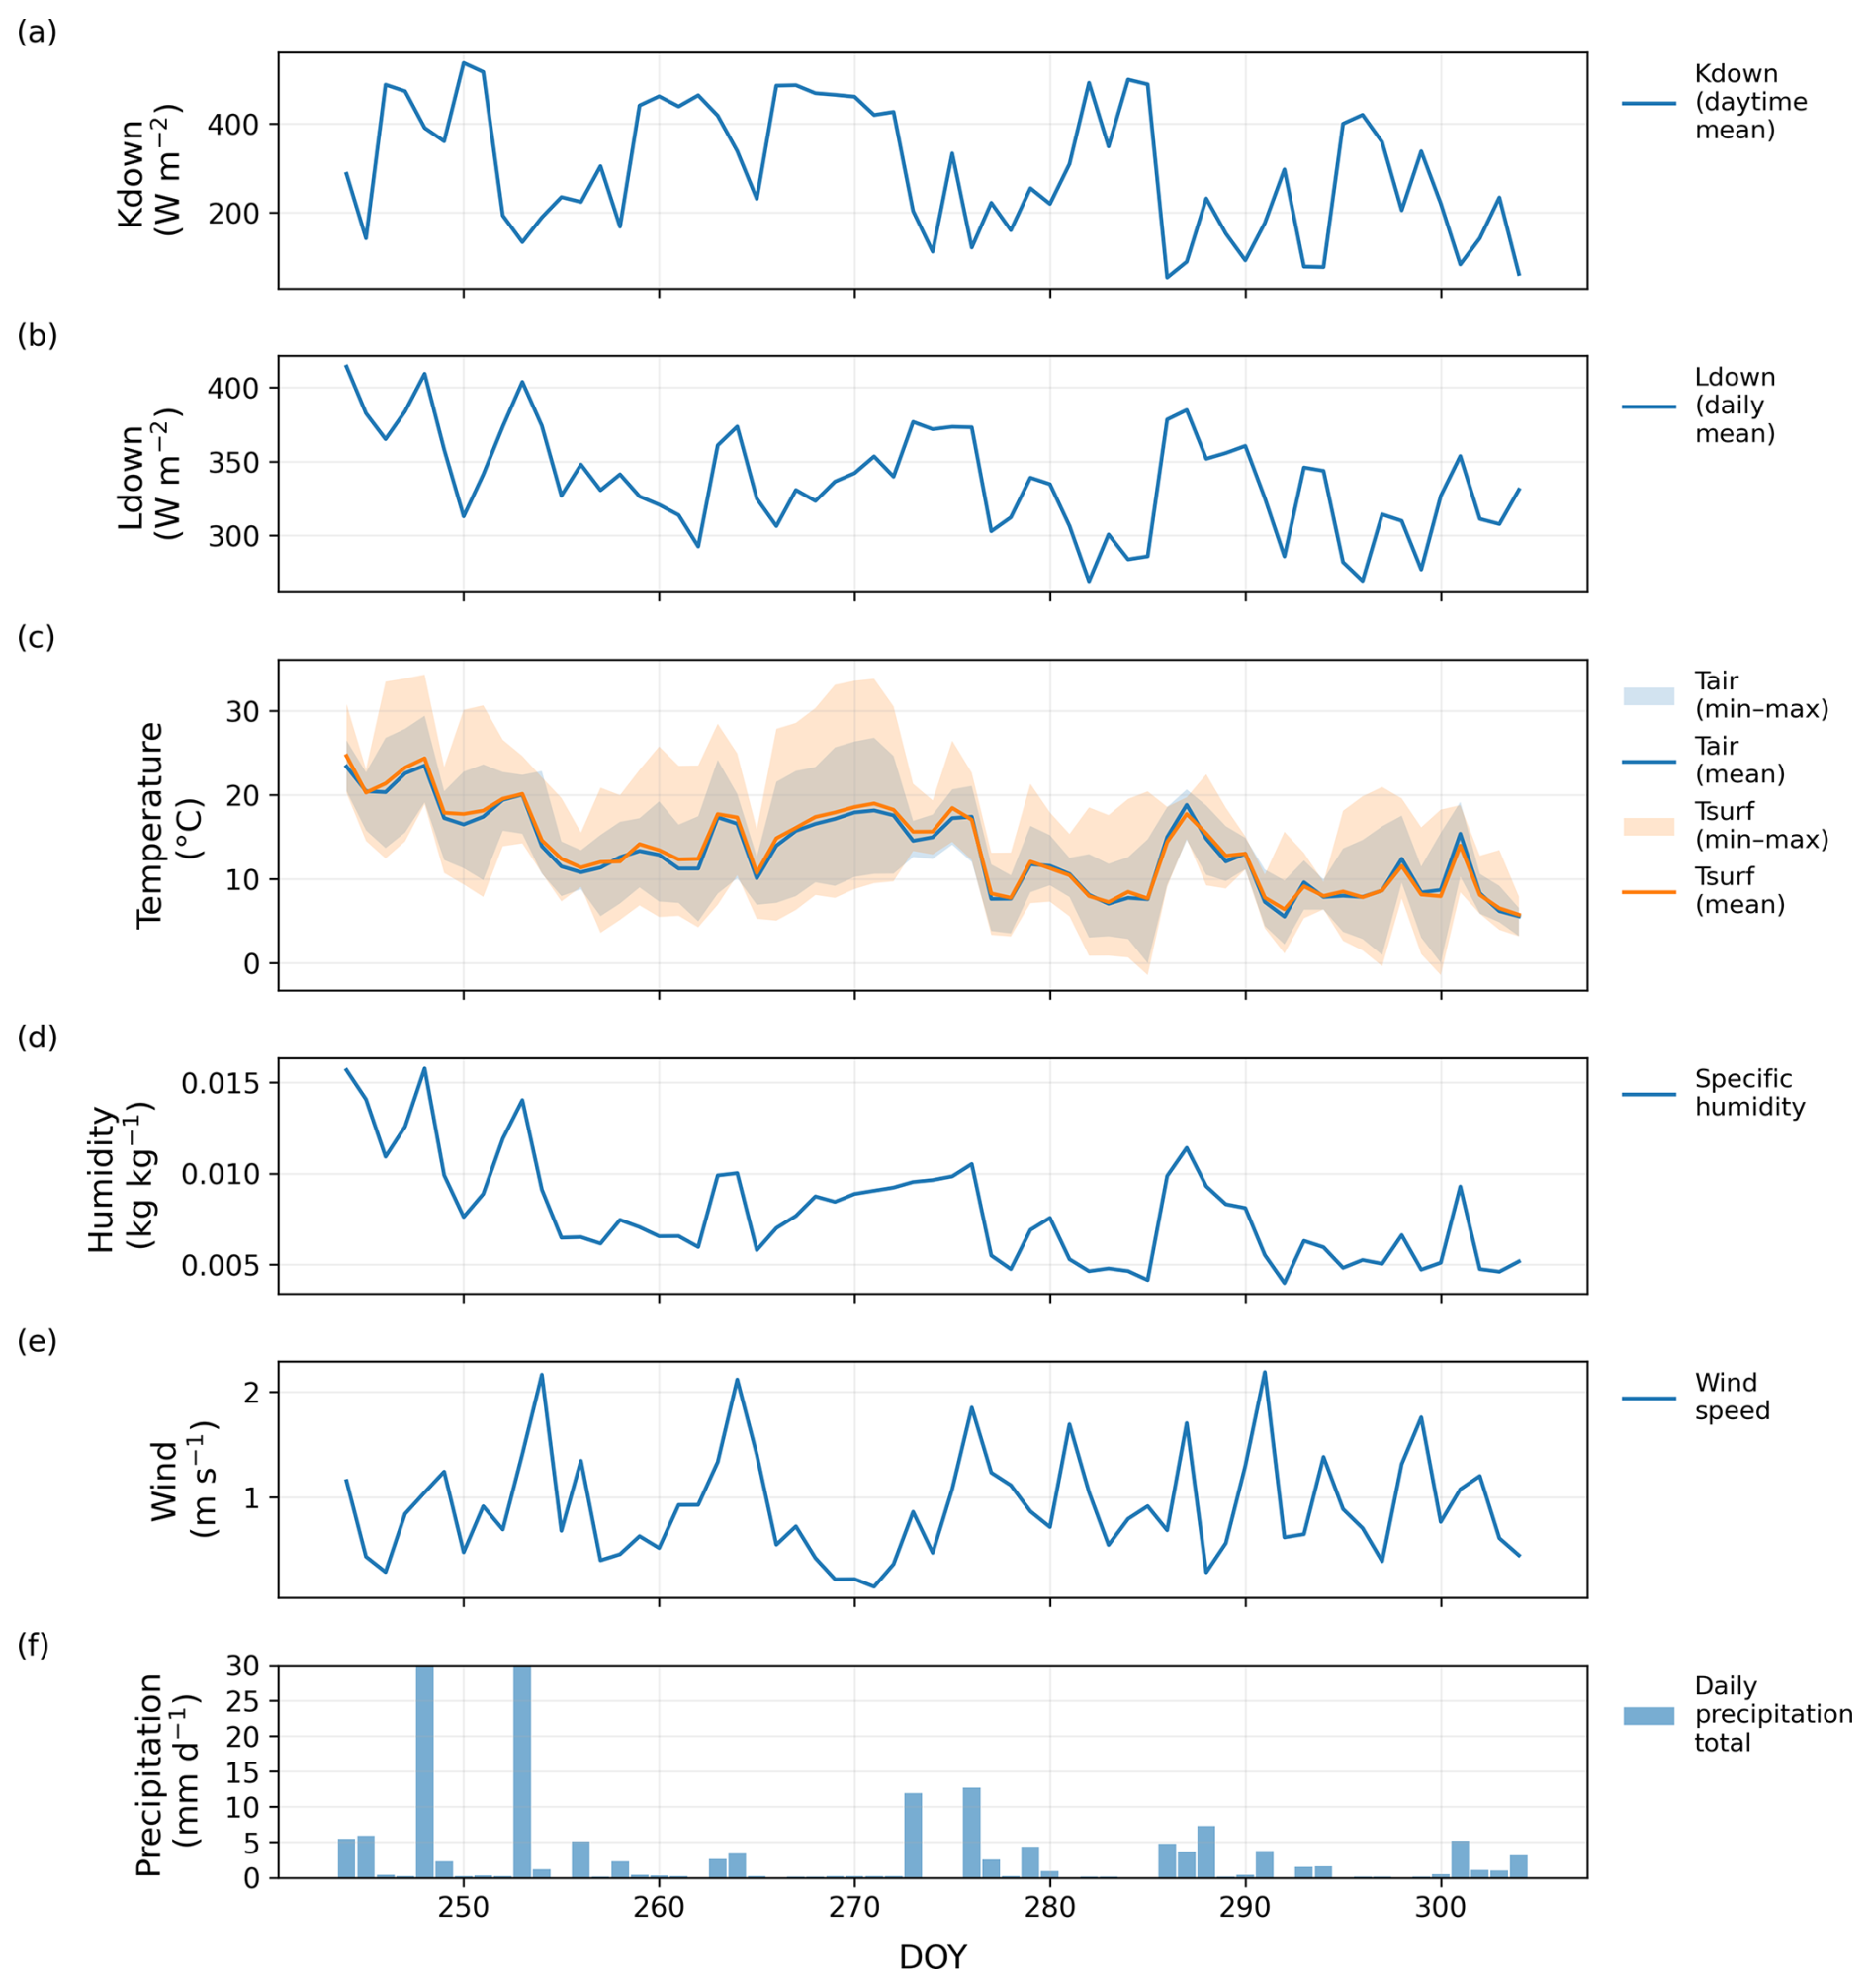
Figure 4Weather conditions during the fall period. Panels (a) and (b) show daytime mean incoming shortwave (Kdown) and daily mean longwave (Ldown) radiation, respectively; panel (c) shows daily mean air and surface temperatures with shaded envelopes indicating the daily minimum–maximum temperature range; panel (d) shows daily mean specific humidity; panel (e) shows daily mean wind speed; and panel (f) shows daily precipitation totals.
3.2 Observed energy balance
To characterize the surface energy exchange at the study site, we first examined the observed energy balance (Fig. 5). The hourly composites show a similar overall structure. In summer (Fig. 5a) mean Q* peaks around ∼450 W m−2 and is partitioned primarily into Qh – approximately 50 %, estimated as the residual of the energy balance, and therefore potentially including minor contributions from advection and other unmeasured terms –, while Qe accounts for 46 % of daytime energy and Qg for roughly 4 %. Tsurf peaks near ∼30 °C. In fall (Fig. 5b), all components decrease seasonally: midday mean Q* is ∼300 W m−2, Qe represents 41 % of the energy and Qg contributes 7 % of the energy. Tsurf peaks around 20 °C. Figure 5 illustrates how the green-roof energy balance evolves between periods, providing a reference framework for the subsequent model evaluation.
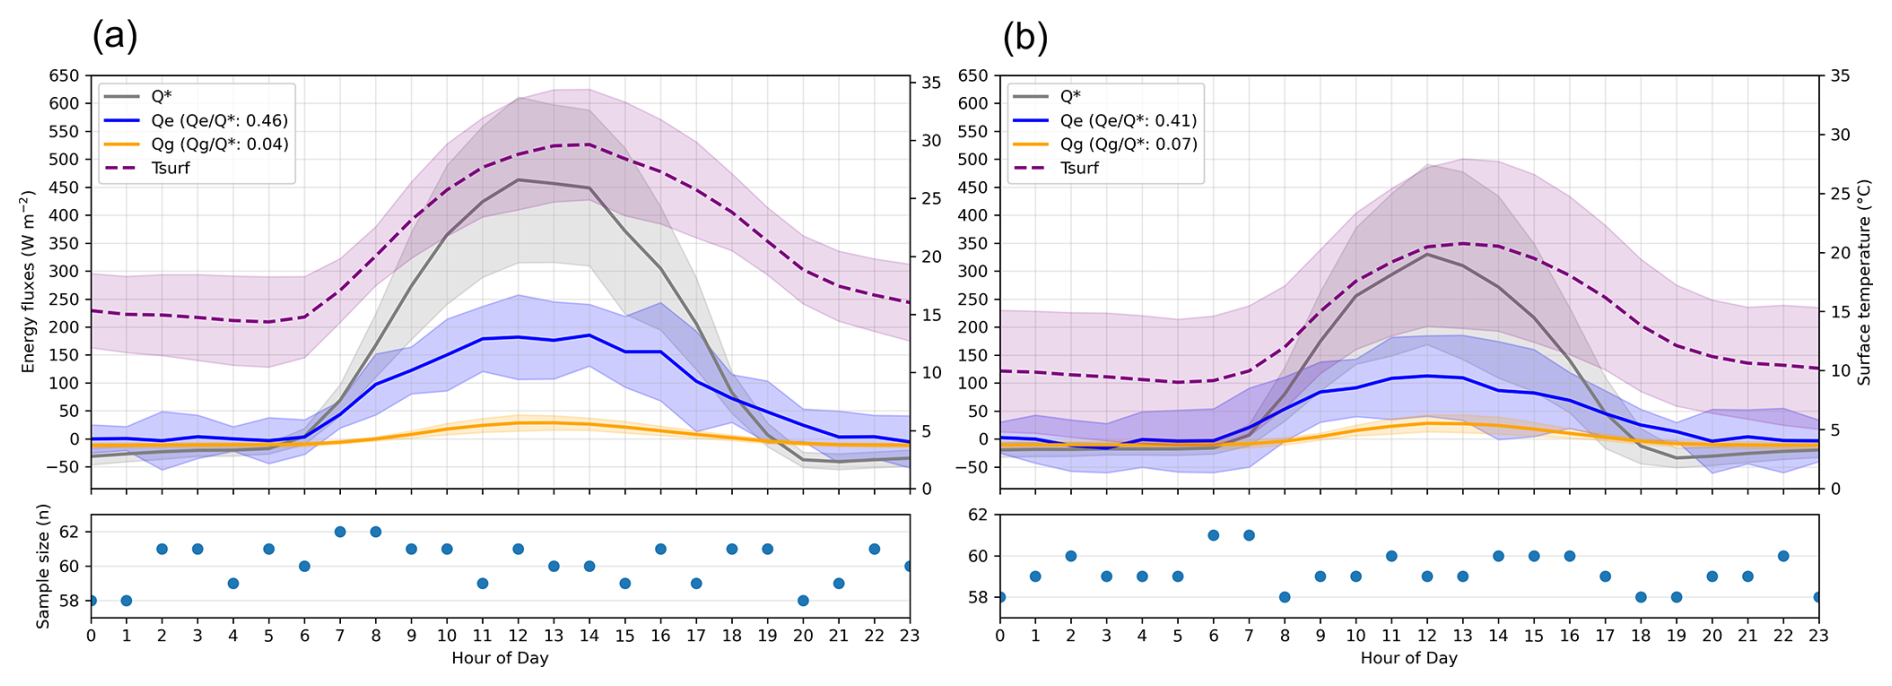
Figure 5(a) Hourly composite diurnal cycle of the observed energy balance components for the summer period (July–August), and (b) the fall period (September–October), lower panels indicate the number of samples contributing to each hourly mean.
To assess the influence of the green roof configuration on the conductive heat flux, one heat flux module (Fig. 2) was temporarily relocated to a location on the roof where it was in direct contact with the roof surface, and Qg was then measured over a short period in October (Fig. 6).

Figure 6Hourly composite diurnal cycle of the observed soil heat flux (Qg) for the elevated green roof on-deck configurations, data ranges from 11 to 21 October for both 2014 and 2025. Solid lines show the mean Qg, while the shaded bands indicate ±1 standard deviation.
Under these conditions, the daytime mean Qg increased to a daytime mean of 23 W m−2, compared to 13 W m−2 measured under the elevated configuration during the same season. Although this relocation experiment was conducted over a relatively short period in fall, the results suggest that the elevated configuration of our modules reduces conductive heat transfer.
Observed uncertainties for the surface energy balance fluxes were quantified using standard error propagation methods (Taylor, 1997), yielding mean daytime uncertainties of ±39 W m−2 for Qe and ±14 W m−2 for Qg. This helps contextualize the significance of the model–observation differences discussed below. Further details on the uncertainty propagation are provided in Sects. S3 and S4 of the Supplement.
3.3 Comparative model evaluation
3.3.1 Latent heat flux
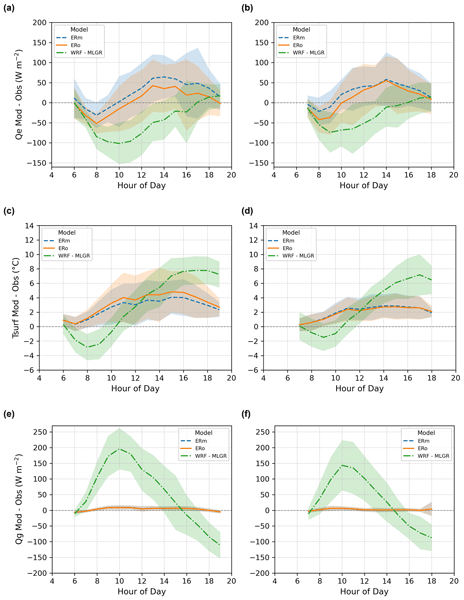
The hourly composites (Fig. 7) show the two ER configurations (ERo and ERm) exhibiting early-morning underestimations and an afternoon positive bias, peaking around ∼50 W m−2. In contrast, WRF-MLGR consistently underestimates Qe during the morning, and most of the afternoon, with biases reaching 100 W m−2, later in the afternoon the model switches to overestimations. The shaded envelopes show larger variability for ER than for WRF-MLGR. In the summer period (Fig. 7a), ERo shows stronger early-morning underestimations but smaller midday overestimation that ERm, while WRF-MLGR maintains its predominantly negative bias, particularly in the morning. In the fall period (Fig. 7b) all models show reduced amplitudes, but the same general patterns persist: ER transitions from morning underestimation to afternoon overestimation and WRF-MLGR remains negatively biased.

Figure 7Hourly composite of the difference between modeled and observed Qe for (a) the summer period and (b) the fall period.
Figure 8 presents the composite differences between modeled and observed Qe – during daytime hours without active precipitation –, separated into dry days (<0.2 mm of rainfall on the target day and during the preceding 2 d; Fig. 8a) and rainy days (daily rainfall > 5 mm; Fig. 8b). On dry days, model behavior closely resembles that of the full-period composites and shows relatively small variability. In contrast, rainy days exhibit substantially larger variability across all models. The ER configurations retain the morning-to-afternoon bias reversal but with less consistent timing and a wider spread, whereas WRF-MLGR shows strong and persistent underestimation accompanied by a pronounced spread. Figure 8 summarizes the hourly mean bias for each moisture regime, whereas the supplementary scatter plots (Fig. S6, panels a and b) show all hourly model–observation pairs and reveal tighter clustering around the 1:1 line under dry conditions and greater dispersion during rainy periods.

Figure 8Hourly composite of the difference between modeled and observed Qe for (a) dry days and (b) rainy days.
Days with high net radiation (Fig. 9a) reproduce the full-period diurnal pattern, with both ER configurations showing slightly larger mean differences, and all models exhibiting a relatively narrow spread. In contrast, low net radiation days (Fig. 9b) display a markedly different behavior, characterized by substantially increased variability and much smaller mean biases across all models.

Figure 9Hourly composite of the difference between modeled and observed Qe for (a) high net radiation days and (b) low net radiation days.
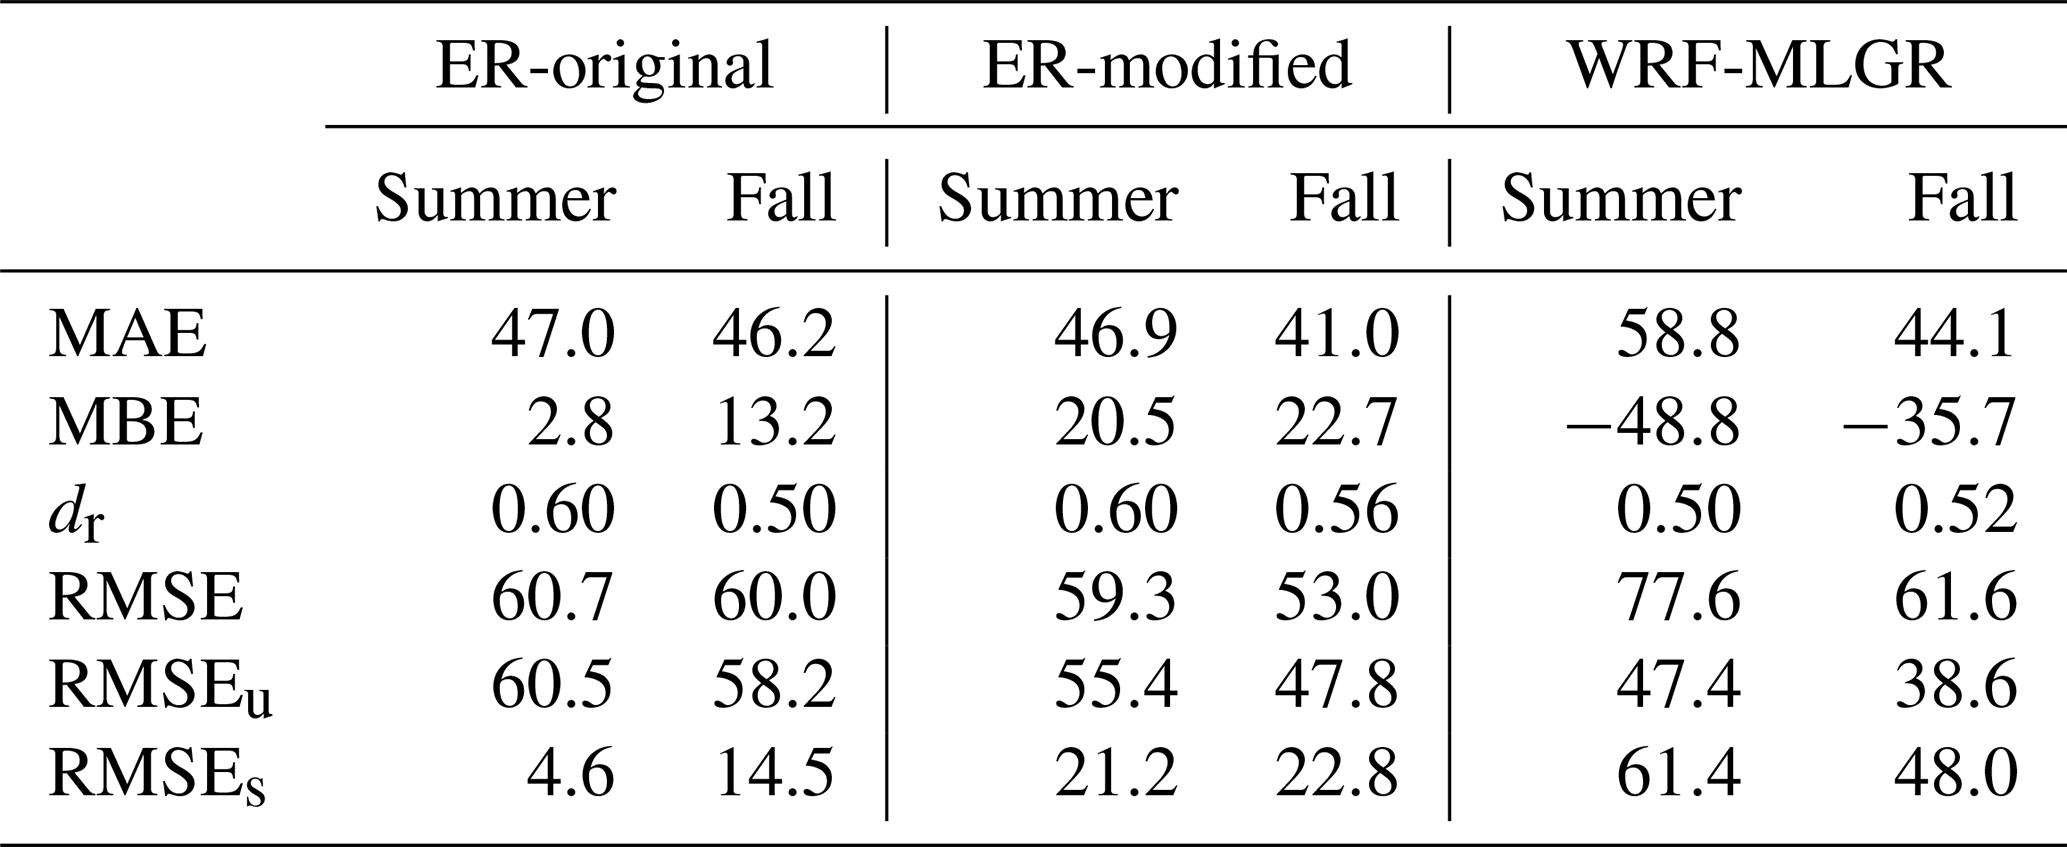
The statistical metrics (Table 3) are consistent with these patterns. ER shows slightly superior performance during the summer period: both ER versions retain positive MBE yet achieve marginally lower MAE than WRF-MLGR and higher dr values (both ERo and ERm≈0.60 vs. 0.50). For the fall season MAE and dr are very similar between ERo and WRF-MLGR, while ERm shows slightly lower MAE and higher dr. RMSE decomposition shows that ER errors are dominated by unsystematic errors. WRF-MLGR shows the opposite behavior, with systematic underestimation dominating.
Table 3Statistical evaluation metrics for the Qe for ERo, ERm, and WRF-MLGR models. Metrics include the Mean Absolute Error (MAE), Mean Bias Error (MBE), Root Mean Squared Error (RMSE), its unsystematic (RMSEu) and systematic (RMSEs) components, all in W m−2 and refined index of agreement (dr).
3.3.2 Surface temperature
Both ER configurations show a persistent warm bias throughout the day, with the largest differences occurring in the afternoon. In contrast, WRF-MLGR shows a different pattern, characterized by morning underestimation followed by substantial afternoon overestimation. During the summer period both ER configurations maintain this warm bias and exhibit greater day-to-day variability than WRF-MLGR, particularly during the warmest hours. In the fall period, bias magnitudes are reduced for all models and variability decreases for ER, reflecting the overall weaker radiative forcing and more moderate surface temperatures (see Fig. S2 of the Supplement).
Mean surface temperature biases are generally amplified under dry conditions and reduced on rainy days. This contrast is modest for the ER configurations, which maintain a similar warm bias across both moisture regimes, but is much more pronounced for WRF-MLGR. Under wetter conditions, bias magnitudes and diurnal range are dampened, and variability decreases (see Fig. S3 of the Supplement). The supplementary scatter plots reinforce this pattern at the point scale, showing a narrower spread under rainy conditions and a somewhat broader dispersion under dry conditions, together with slightly larger bias magnitudes (Fig. S6, panels c and d of the Supplement).
High net radiation conditions (Fig. 10a) accentuate both diurnal temperature biases and variability. Under these conditions, ER exhibits increased daytime variability, while WRF-MLGR shows a comparatively narrower spread. Mean bias magnitudes remain comparable to those of the full evaluation periods, although morning underestimation in WRF-MLGR is slightly enhanced under strong radiative forcing. In contrast, low net-radiation conditions (Fig. 10b) are characterized by substantially reduced mean temperature differences for all models, most notably for WRF-MLGR. While variability in WRF-MLGR increases slightly under low net radiation conditions, the ER configurations show more stable behavior.
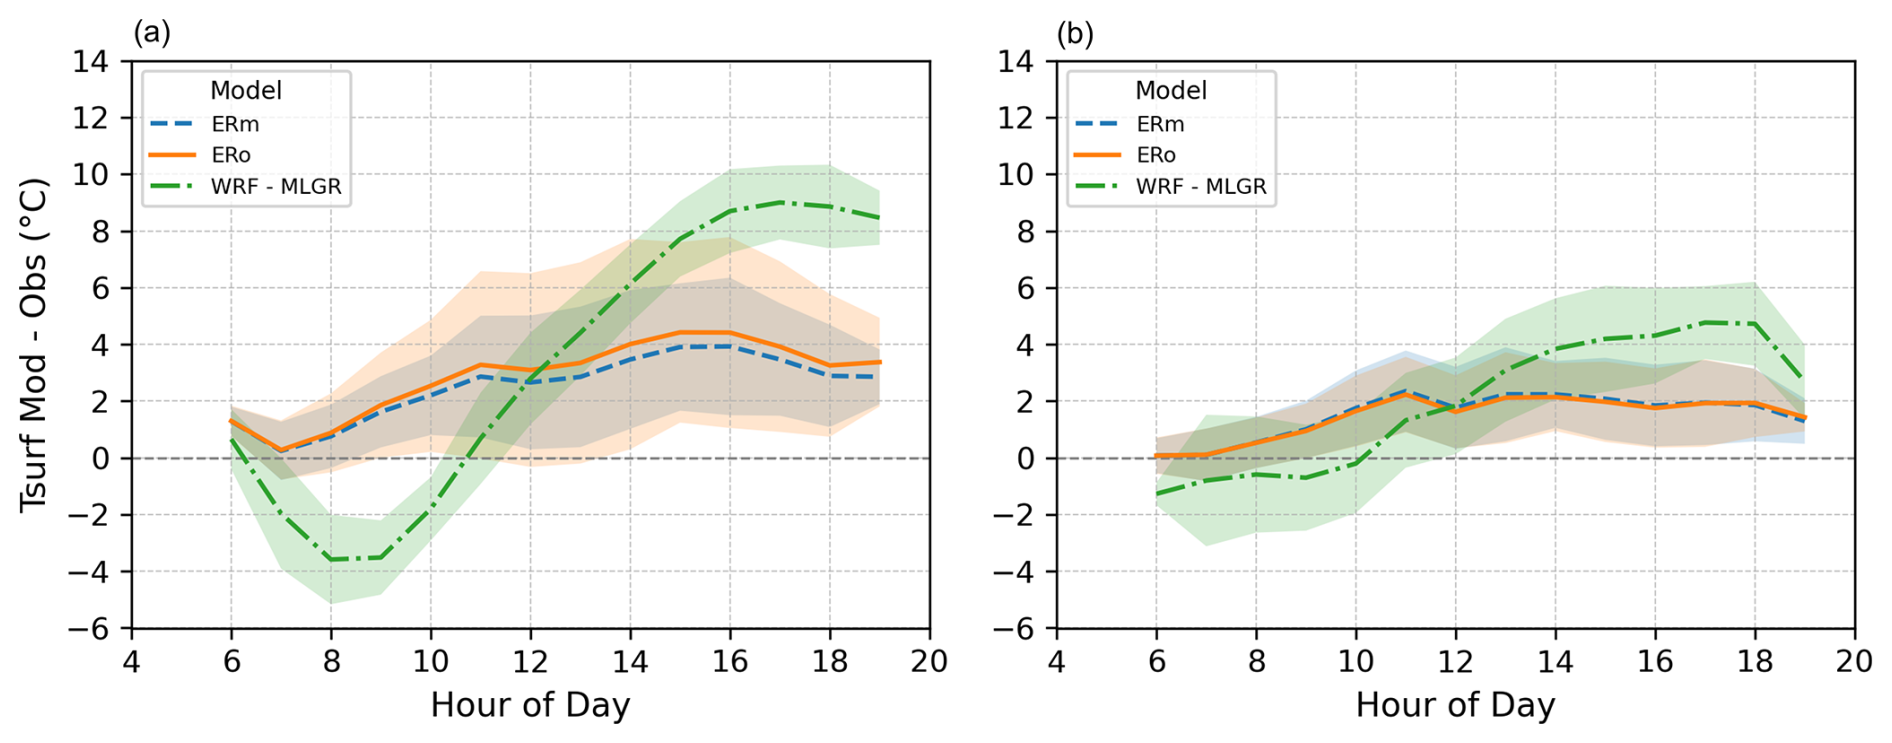
Figure 10Hourly composite of the difference between modeled and observed Tsurf for (a) high net radiation days and (b) low net radiation days.
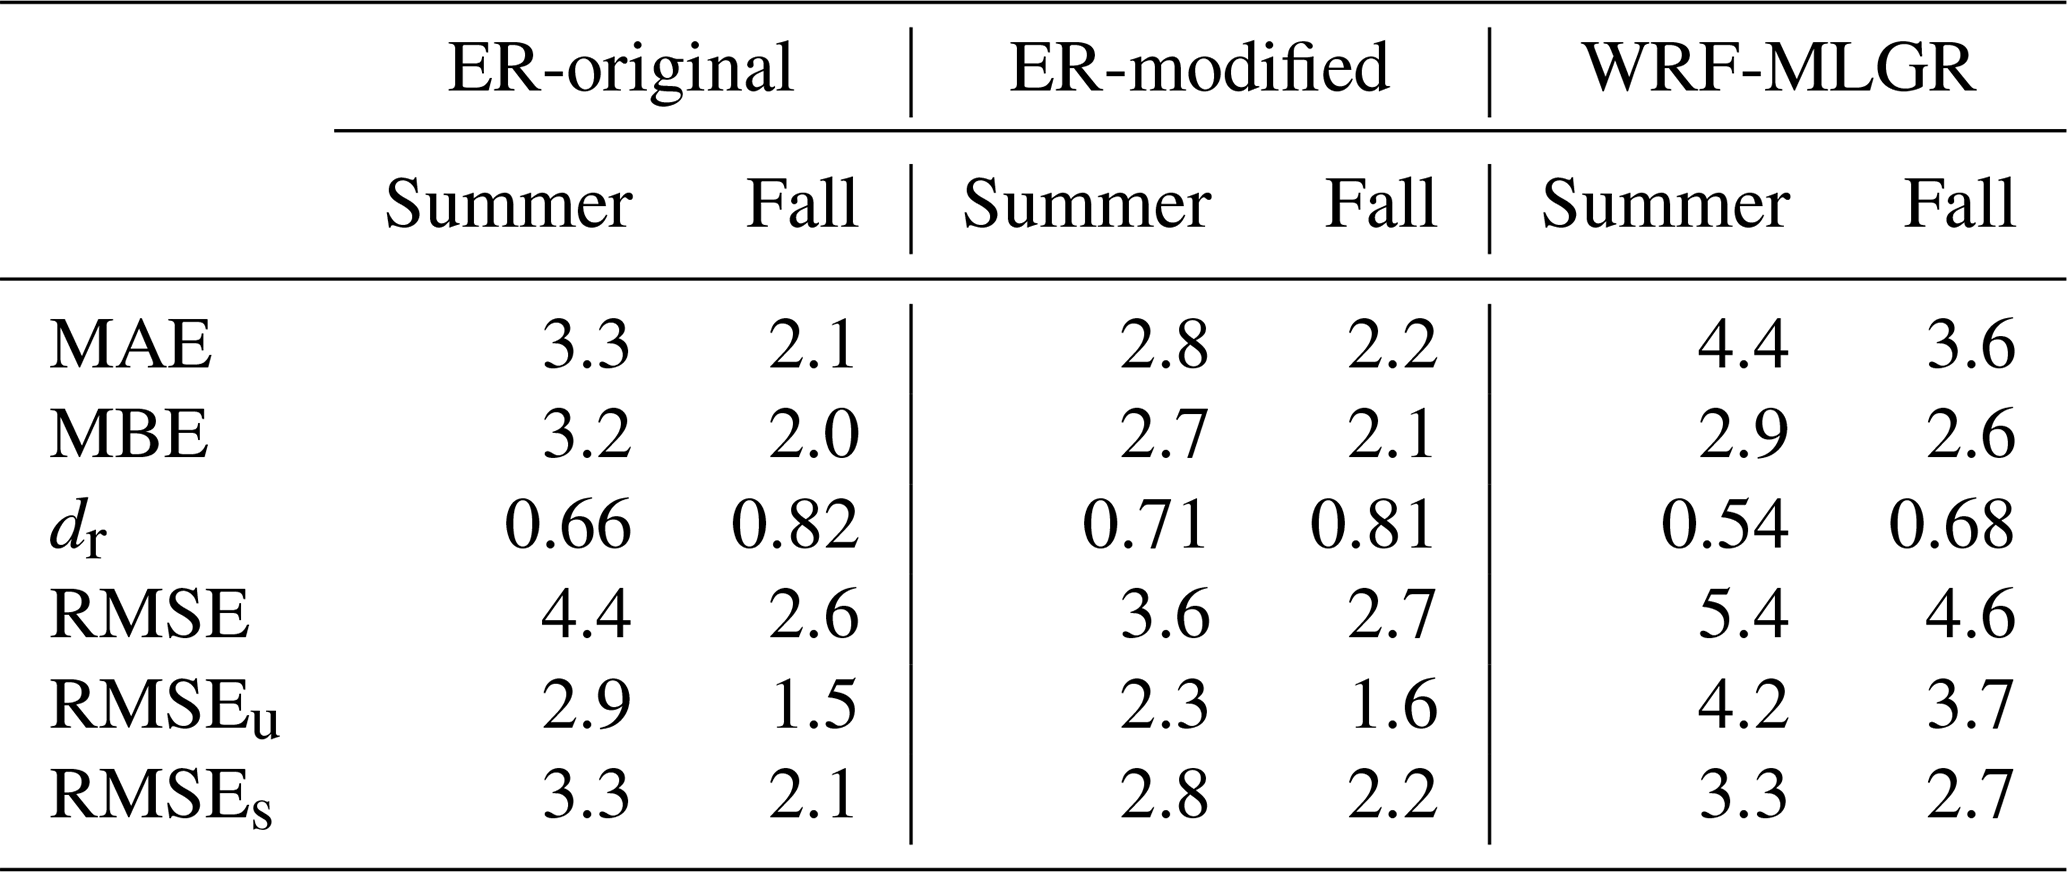
Table 4 summarizes the statistical metrics for Tsurf and reinforces the patterns seen in the diurnal composites. All models exhibit positive MBE, confirming Tsurf warm biases. ER shows lower MAE values and higher dr than WRF-MLGR in both periods, indicating smaller overall deviations from observations. The RMSE decomposition shows that ER's errors are dominated by their systematic component, consistent with the stable warm bias seen in the diurnal plots. WRF-MLGR, in contrast, exhibits a greater contribution from the unsystematic component. However, this statistical partitioning should not be interpreted as random variability. Rather, it reflects the consistent shift from morning underestimation to afternoon overestimation within the daytime period. These opposing biases partly offset each other in the MBE but remain large in magnitude, leading to elevated RMSE. Therefore, the large error components in WRF-MLGR indicate a structural timing and magnitude error in surface heating rather than random variability.
Table 4Statistical evaluation metrics for Tsurf for ERo, ERm, and WRF-MLGR models. Metrics include the Mean Absolute Error (MAE), Mean Bias Error (MBE), Root Mean Squared Error (RMSE), its unsystematic (RMSEu) and systematic (RMSEs) components, all in °C, and refined index of agreement (dr).
3.3.3 Soil Heat Flux
Qg exhibits the largest model–observation discrepancies for WRF-MLGR in both evaluation periods. Bias magnitudes are substantially larger than for the ER configurations, with peak overestimations exceeding 200 W m−2, followed by a reversal to substantial underestimation in the late afternoon. In contrast, both ER configurations remain close to observations, with small consistently positive biases and low variability. Seasonal differences are modest: WRF-MLGR errors are larger in summer, while ER shows similarly stable behavior across both seasons, with reduced variability during fall (see Fig. S4 of the Supplement).
Mean Qg differences are generally reduced during rainy days relative to dry conditions. Under rainy conditions, the ER configurations remain close to zero throughout the day, while WRF-MLGR shows a marked reduction in bias magnitude but a substantially wider spread, indicating increased variability and less consistent timing (see Fig. S5 of the Supplement). The supplementary scatter plots (Fig. S6, panels e and f) further illustrate these differences, with ER configurations clustered close to the 1:1 line and WRF-MLGR exhibiting a much larger vertical spread and weaker correspondence with observations.
High net-radiation conditions (Fig. 11a) strongly amplify Qg biases, particularly for WRF-MLGR, which exhibits large midday overestimations that peak near ∼250 W m−2 and a relatively narrow spread. In contrast, the ER configurations remain close to observations with limited variability. Under low net radiation conditions (Fig. 11b) the magnitude of Qg biases decreases for all models. For WRF-MLGR, mean differences are substantially reduced, however, the spread widens substantially, reflecting increased day-to-day variability under weaker radiative forcing.
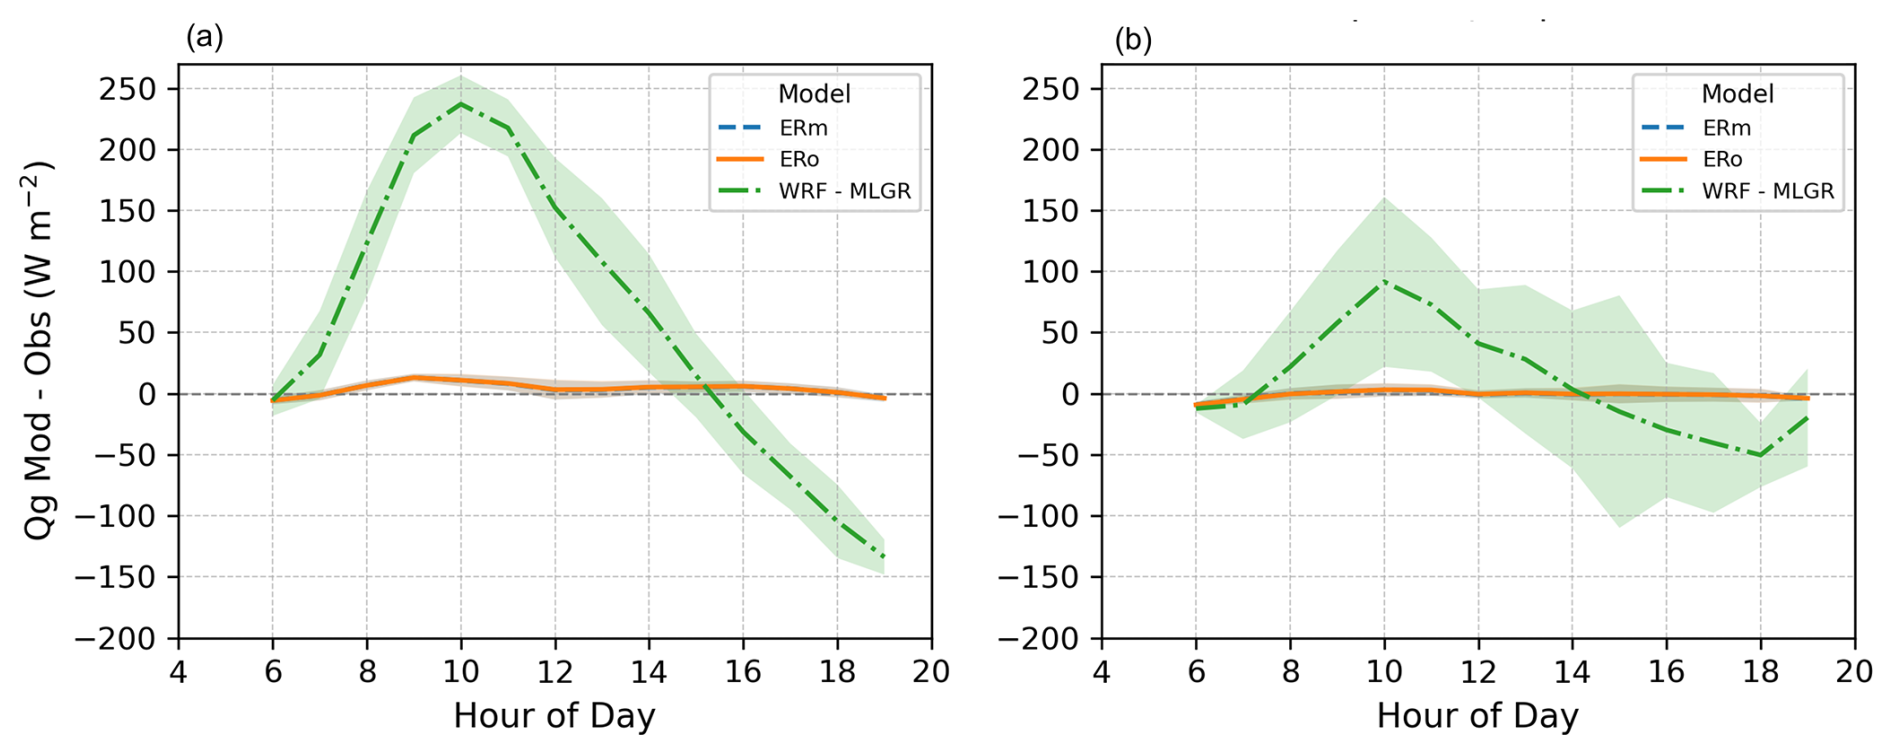
Figure 11Hourly composite of the difference between modeled and observed Qg for (a) high net radiation days and (b) low net radiation days.
Table 5 reinforces these contrasts. ER performs well, with both configurations showing nearly the same performance during both seasons, in the fall they show modest MAE values (∼7 W m−2), relatively high RMSE (∼35 W m−2) and high index of agreement (dr=0.77 for ERo and 0.78 for ERm). The summer period shows a small MAE for both configurations (∼7 W m−2) and relatively low RMSE (∼9 W m−2), these errors were dominated by the systematic component during the fall period, and by the unsystematic component during the summer period.
Table 5Statistical evaluation metrics for the Qg for ERo, ERm, and WRF-MLGR models. Metrics include the Mean Absolute Error (MAE), Mean Bias Error (MBE), Root Mean Squared Error (RMSE), its unsystematic (RMSEu) and systematic (RMSEs) components all in W m−2, and refined index of agreement (dr).
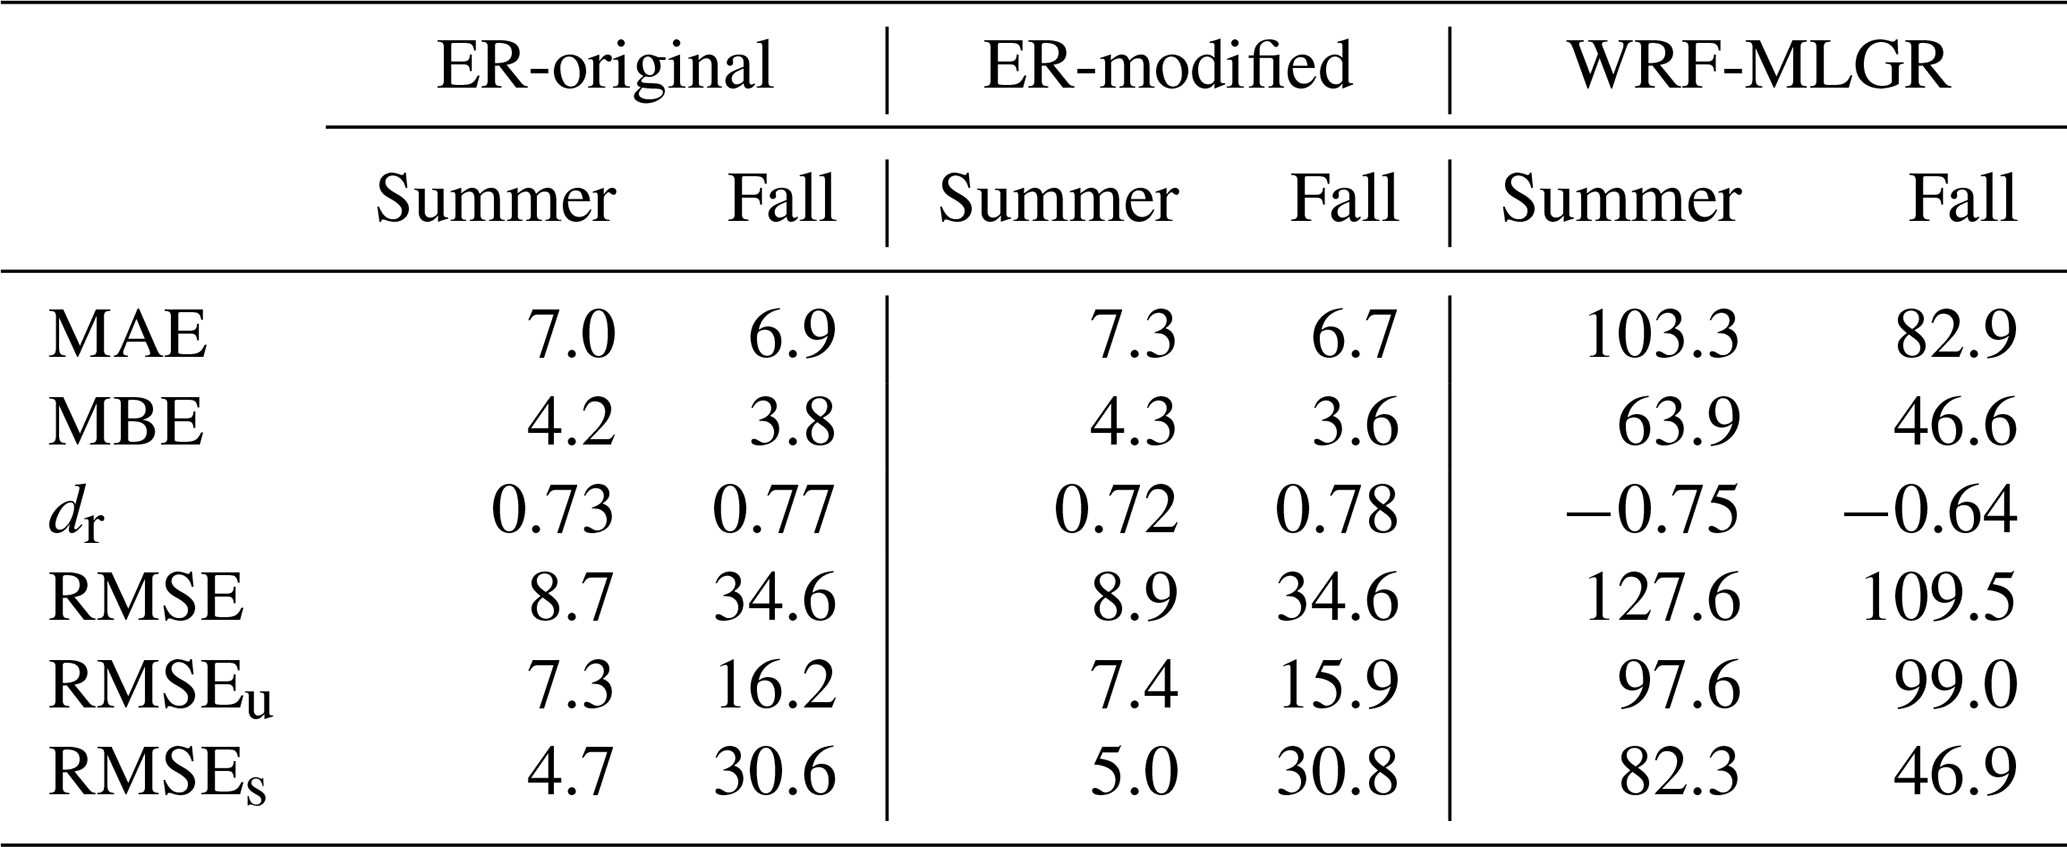
In contrast, WRF-MLGR performs very poorly, showing very large MAE (83 W m−2 for the fall and 103 W m−2 for the summer), RMSE (110 and 128 W m−2), and strongly negative dr values (−0.64 and −0.75), indicating poor temporal agreement. As observed for Tsurf, the RMSE decomposition attributes a large portion of the error to the unsystematic component; however, the diurnal composites display a consistent phase pattern. The large error magnitudes in WRF-MLGR therefore reflect a systematic mismatch in the timing and magnitude of Qg rather than random variability.
3.3.4 Moisture content
Figure 12 shows the evolution of observed and modeled water content throughout summer (Fig. 12a) and fall (Fig. 12b). All models reproduce the timing of rainfall events, showing sharp increases in SWC after precipitation. However, the magnitude of these responses differs substantially across models.
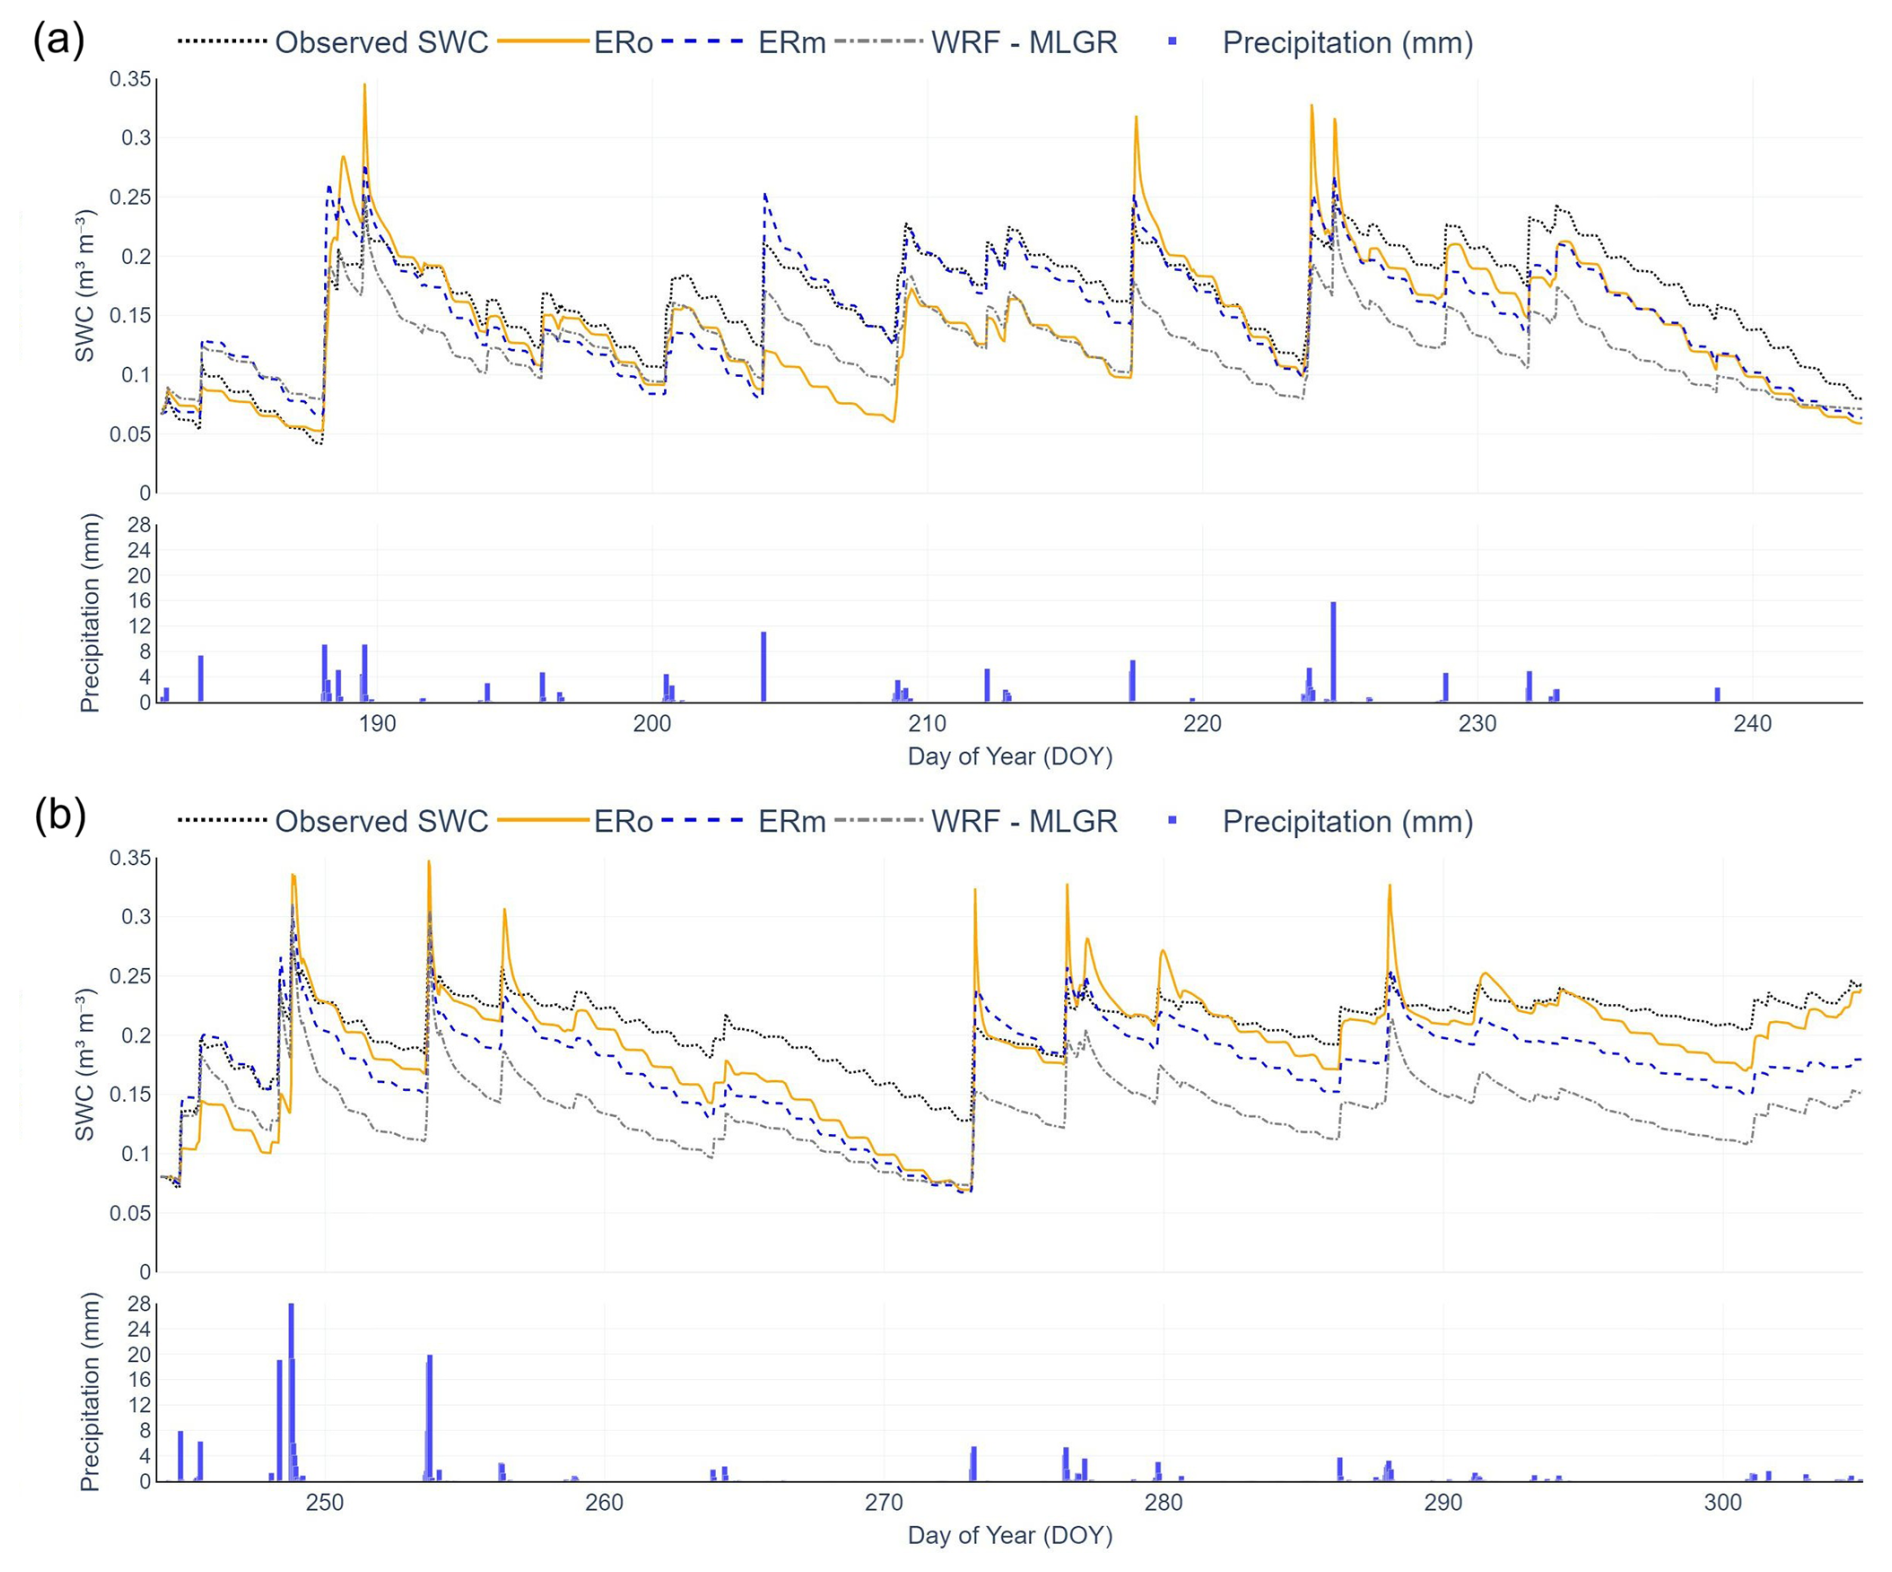
Figure 12Time series of observed and modeled water content, with precipitation for (a) the summer period and (b) the fall period. Model simulations are shown as solid (ERo), dashed (ERm), and dash-dotted (WRF-MLGR) lines, while observations are shown as a dotted line, and blue bars indicate precipitation.
During the summer period (Fig. 12a), ERm shows the closest agreement with the observed peaks and subsequent dry-down trajectories. ERo responds well to rainfall but generally produces larger peak values and drains more rapidly, leading to underestimation between events. WRF-MLGR consistently underpredicts SWC, with peak magnitudes consistently lower than observed and with faster post-rainfall declines.
In the fall period (Fig. 12b), the two ER configurations converge, producing very similar dynamics, with ERo slightly closer to observations, particularly during the later part of the dry-downs. WRF-MLGR continues to reproduce the correct timing of wetting and drying but maintains well below observed magnitude.
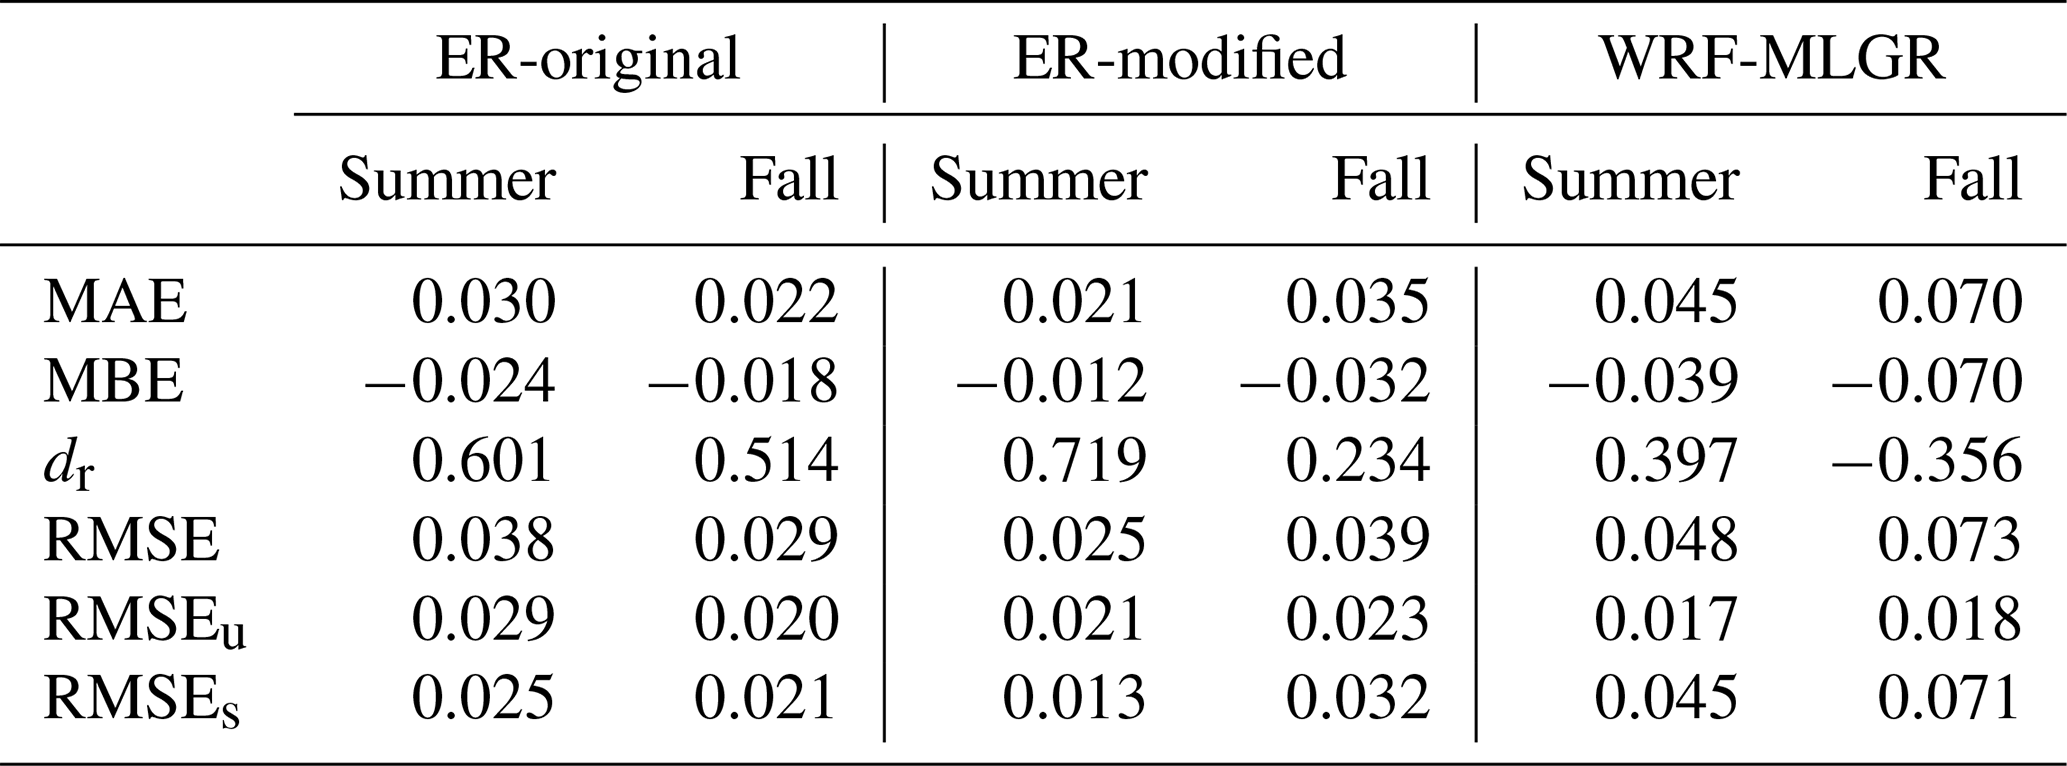
Table 6 highlights the contrast in model performance for water content. All models show negative MBE, confirming overall underestimation. The MAE values for the ER configurations are relatively small (0.030 m3 m−3 in the summer and 0.022 m3 m−3 in the fall for ERo; 0.021 m3 m−3 in the summer and 0.035 m3 m−3 in the fall for ERm), when compared with WRF-MLGR, which shows larger errors, with MAE reaching 0.045 m3 m−3 in the summer and 0.070 in the fall. Model agreement follows the same trend: ER achieves moderate dr values, with the original configuration performing more consistently. In contrast, WRF-MLGR yields dr values near zero (or negative), indicating poor agreement in magnitude despite reproducing event timing; its strong systematic dry bias (relatively large negative MBE) and damped storage response dominate the agreement score. RMSE values also favor ER (0.038 m3 m−3 and 0.029 for ERo; 0.025 m3 m−3 and 0.039 for ERm) over WRF-MLGR (0.048 and 0.073 m3 m−3). For ERo, RMSE reflects a balance of systematic and unsystematic components, while ERm shows larger unsystematic errors during summer but larger systematic errors in the fall. WRF-MLGR errors are dominated by systematic underestimation, consistent with its low storage representation.
Table 6Statistical evaluation metrics for the moisture content for ERo, ERm, and WRF-MLGR models. Metrics include the Mean Absolute Error (MAE), Mean Bias Error (MBE), Root Mean Squared Error (RMSE), its unsystematic (RMSEu) and systematic (RMSEs) components all in m3 m−3 and refined index of agreement (dr).
4.1 Green roof observed energy balance
Relatively few studies report all surface energy balance components for green roofs simultaneously; however, many report individual components. As a result, reported observational energy balance values span a wide range, reflecting differences in climate, vegetation type, substrate moisture conditions, roof configuration, and measurement approach.
Qe and/or evapotranspiration rate, is the most frequently evaluated component in the green-roof literature, given it plays an important role in the cooling potential and hydrology of green roofs. At our study site, Qe represents approximately 46 % of the net radiation during the summer period and 41 % during fall. These fractions correspond to a daily mean of 71 W m−2 for the summer, and 36 W m−2 in the fall. These values are comparable in magnitude to those reported by in other green roof studies. Marasco et al. (2015), for example, observed daily mean Qe values of approximately 44–55 W m−2 for two full-scale extensive Sedum roofs in New York City, averaged over multiple years. Gößner et al. (2025) similarly reported daily mean evapotranspiration rates equivalent to a Qe of approximately 49 W m−2 for ground-level extensive green roof systems in southern Germany, based on two years of observations. Despite differences in climate and experimental setup, the similarity in daily mean Qe magnitudes across studies indicates that the observed fluxes at our site are consistent with those reported for green roofs elsewhere. The seasonal separation applied in the present study likely explains the higher summer and lower fall daily means relative to the multi-year averages reported in these studies. In contrast, other studies report higher Qe for systems with denser vegetation or garden-style rooftops, such as the rooftop garden examined by Dong et al. (2025) where daily mean Qe reached approximately 209 W m−2.
Observational estimates of Qg for green roof surfaces are less commonly reported. Heusinger and Weber (2017), who evaluated the surface energy balance of a full-scale extensive Sedum roof, reported a daytime mean Qg values of 36 W m−2 during June–August and 19 W m−2 during September–November. In contrast, our measurements indicate lower daytime mean Qg – 12 W m−2 in the summer (July–August) and 13 W m−2 in the fall (September–October). This difference is likely related to the configuration of our green roof system, which is elevated above the rooftop surface, creating an air gap between the module and the roof deck that acts as an additional insulating layer (Fig. 6).
4.2 Physical behavior of the models
Because the two ER configurations (ERo and ERm) produced very similar results, the discussion focuses on the general physical behavior of the ER model rather than on version-specific differences. The refinements introduced in the modified version did not fundamentally alter the model's energy-partitioning behavior. As a result, the dominant contrasts in model performance arise not between the ER versions but between ER and WRF-MLGR, which differ structurally in vegetation representation, stomatal and aerodynamic resistance formulations, and substrate hydrology. Thus, the discussion refers to “ER” generically when examining the physical basis of model behavior.
4.2.1 Latent heat flux
ER consistently overestimated Qe, whereas WRF-MLGR produced negative deviations. The ER bias can be traced to the model's simplified representation of vegetation controls on transpiration. Because ER computes latent heat flux as the sum of substrate evaporation, transpiration – and evaporation of intercepted water, in the case of ERm – transpiration dominates under vegetated conditions and is strongly scaled by LAI. The relatively high LAI observed led ER to treat Sedum as fully active, despite the fact that CAM species typically maintain low transpiration rates through conservative stomatal regulation even under favorable environmental conditions (Gravatt and Martin, 1992; Huang et al., 2024).
The ER model's stomatal resistance formulation does not capture this conservative behavior. In ER, minimum stomatal resistance is adjusted only by radiation-, moisture-, and VPD-based stress functions, which allows stomata to remain relatively open until VPD becomes high. CAM plants, however, exhibit earlier stomatal closure, responding directly to atmospheric demand through a “feed-forward” mechanism that is not represented in the model (Males and Griffiths, 2017). As a result, ER overestimates transpiration during conditions under which Sedum would physiologically restrict water loss.
Overall, the results of this study suggest that vegetation physiological parameterization plays an important role in representing latent heat flux in Sedum-based green roofs within the ER model framework. In this model, calibration of MSR improved performance (see Sect. S5 of the Supplement), highlighting the sensitivity of Qe to transpiration-related parameters. Additional one-at-a-time sensitivity analyses further support this (see Sect. S6 of the Supplement), indicating a strong influence of vegetation parameters on ER performance. To our knowledge, CAM-specific parameterizations have not yet been implemented in green roof surface energy balance models. Given the distinctive physiological characteristics of CAM vegetation, incorporating CAM-specific formulations could potentially improve the representation of transpiration dynamics and surface energy partitioning, particularly in models where vegetation controls play a dominant role, such as ER.
WRF-MLGR represents latent heat flux solely through transpiration, as the current version does not include a substrate evaporation term. This structural limitation causes systematic underestimation of Qe. In addition, WRF-MLGR places greater emphasis on aerodynamic resistance and applies strong atmospheric controls on stomatal resistance, including air temperature. While this yields behavior more consistent with the conservative water-use strategy of CAM vegetation, it can also amplify the underestimations by suppressing transpiration prematurely under rising temperature and VPD, reinforcing the negative biases seen in the statistical evaluation. Thus, although WRF-MLGR represents Sedum's conservative stomatal behavior more realistically than ER, the absence of a substrate evaporation component and the strong atmospheric regulation of stomatal resistance contribute to underestimations over the diurnal cycle.
4.2.2 Surface temperature and soil heat flux
Both models overestimate daytime Tsurf and Qg, though for different reasons and with different magnitudes. ER shows a modest but systematic warm bias (≈1–3 °C), possibly because the model lacks vegetation heat capacity and therefore cannot buffer short-term fluctuations in net radiation. Combined with small energy misallocations among Qe, Qh, and Qg, this causes excess energy to accumulate at the surface, producing a consistent warm bias despite the model's tendency to overestimate latent heat flux. Correspondingly, ER produces small but systematic overestimations of Qg, which primarily stem from biases in the near-surface temperature gradient. Although the model includes a moisture-dependent conductivity formulation, this representation does not fully capture the observed variation in k for the studied substrate (Perelli, 2014). Nevertheless, retaining the original formulation results in realistic Qg magnitudes because the smaller conductivity partially offsets the warm bias in the simulated surface and shallow substrate temperatures. As a result, the residual errors in Qg remain modest and consistent throughout the day, as reflected in the small RMSE values and the relatively flat diurnal difference curves for both ER versions.
In contrast, WRF-MLGR exhibits a much larger positive bias in Tsurf, particularly during the afternoon, along with very large Qg errors, and failure to reproduce the observed Qg diurnal cycle. The most likely reason for this bias is the lack of vegetation radiative representation, meaning all shortwave and longwave radiation is absorbed at the “combined substrate-vegetation” surface, with effectively no shading of the substrate surface, canopy heat storage, or radiative interactions to moderate surface warming. As a result, incoming radiation is applied directly to the substrate rather than to the vegetation that shades the substrate. Because the substrate has a much higher thermal admittance than foliage, a large fraction of the radiative forcing is initially stored as ground heat, leading to elevated morning values of Qg as the energy accumulates in the upper substrate layers. This stored energy governs the subsequent evolution of Tsurf and delays the development of Qh and Qe, causing Qg to dominate the diurnal partitioning of surface fluxes. This behavior contrasts with real vegetated surfaces, where the vegetation enables rapid adjustment of sensible and latent heat fluxes under increasing radiative forcing (Curtis, 1936; Tadeu et al., 2021). As part of the experimental green roof system tests, an unvegetated module was also instrumented and installed to monitor Qg. Figure 13 illustrates how, as a consequence of this substrate-dominated energy storage, the modeled Qg presents a diurnal pattern that is more consistent with that of a bare substrate than with observations from the vegetated module.
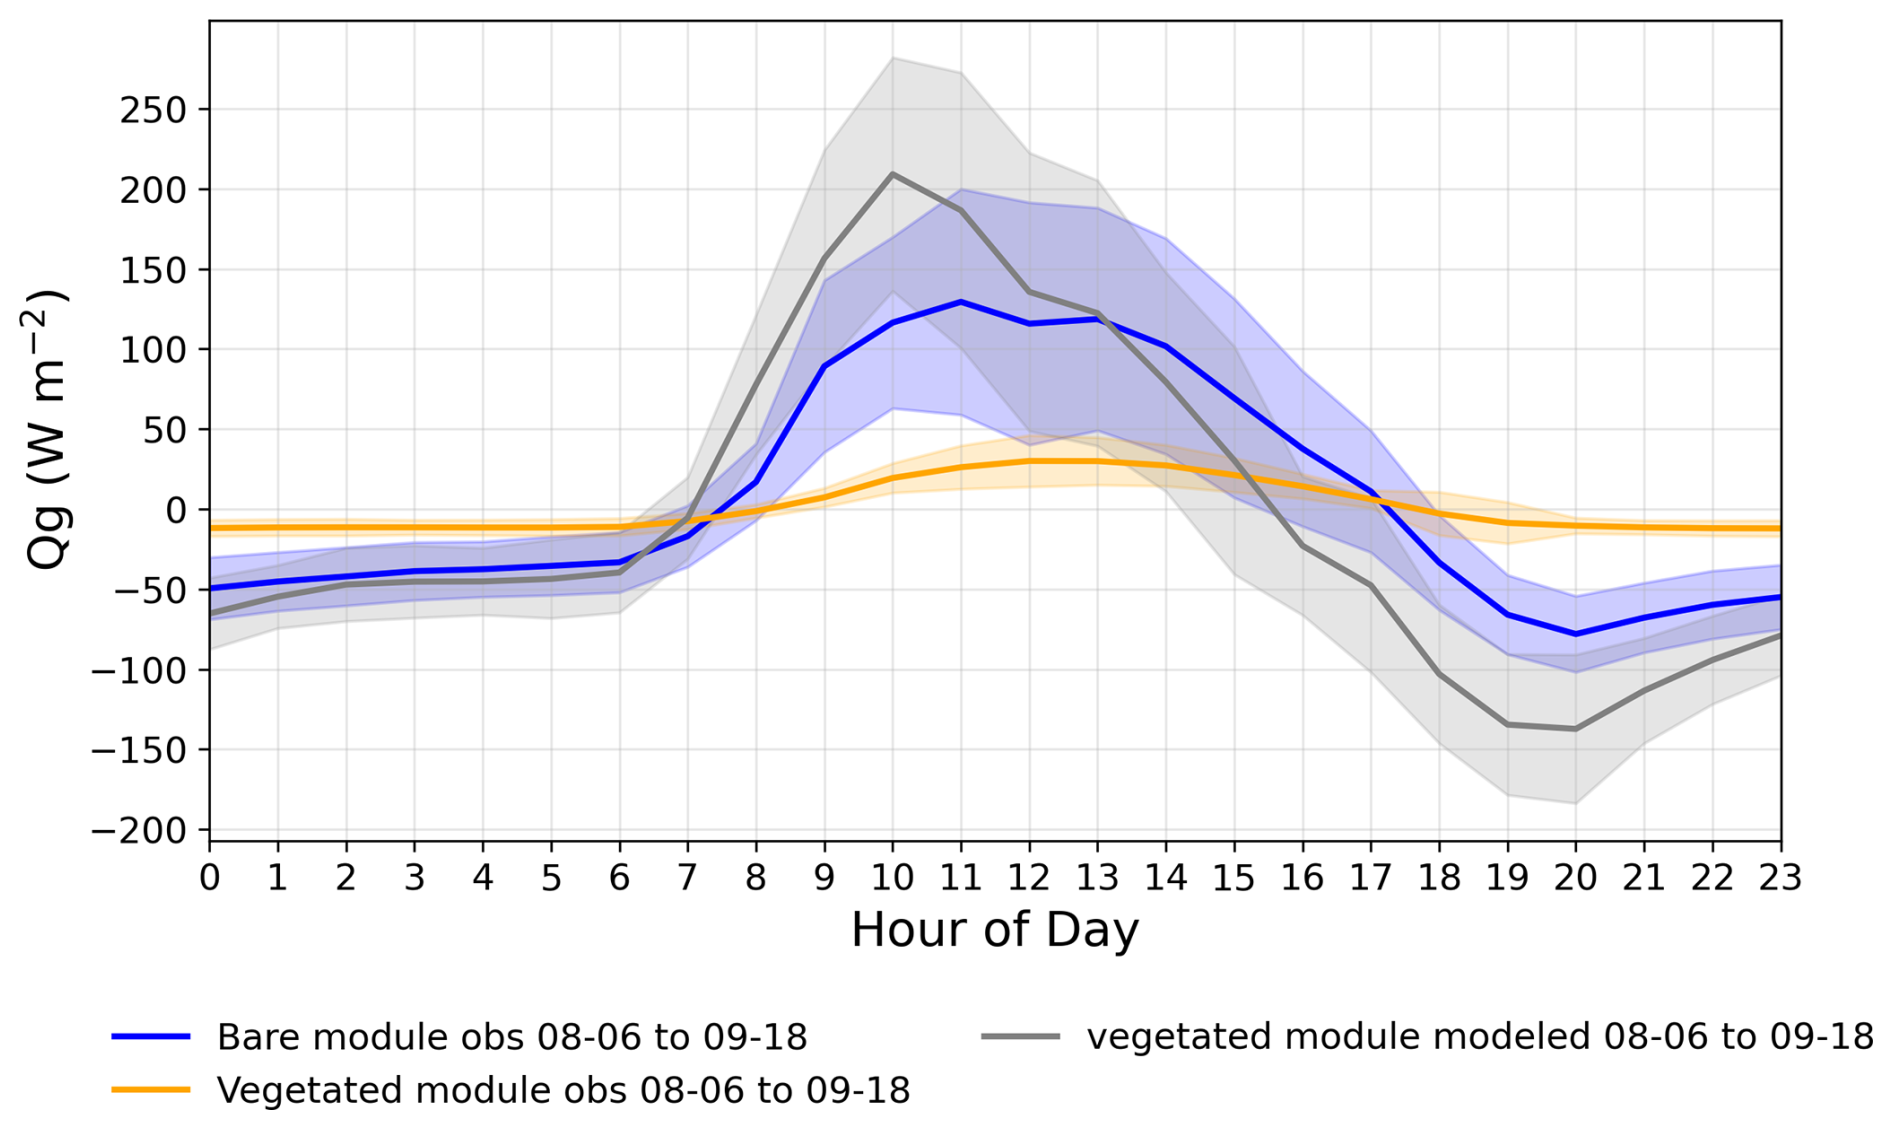
Figure 13Hourly composite of the observed bare (non-vegetated) module (blue), observed vegetated module (yellow) and modeled vegetated module from WRF-MLGR (gray) Qg. Solid lines represent the mean value and the shaded areas represent ±1 standard deviation. Legend also includes the plotted dates.
4.2.3 Moisture Content
ERo captures the timing of rainfall inputs but often produces larger post-rain increases in water content and a faster early decline than observed. This reflects the model structure in which precipitation is applied directly to the surface layer, producing an immediate increase in SWC in the upper layer. These peaks are followed by a rapid initial decline driven as internal redistribution transfers water from the surface layer to the subsurface layer, where it becomes available for gravitational drainage and transpiration. Redistribution also contributes directly to an early decrease in the depth-averaged water content by relaxing the unrealistically high surface-layer moisture. Although evapotranspiration is overestimated by the model, the early post-rain decrease is dominated by redistribution and drainage rather than an immediate enhancement of Qe. Once substrate moisture decreases, modeled and observed drying rates become more similar, however ERo remains persistently drier because early post-rain redistribution and drainage reduce stored water more rapidly than in the observed system.
ERm alters the water balance primarily through canopy interception and a moisture-dependent runoff formulation. A fraction of rainfall is temporarily stored on the foliage and evaporated directly, so only the remaining drip reaches the substrate. This dampens the sharp post-rain increases in substrate water content seen in ERo and, for many events, brings the modeled peaks closer to observations. The new runoff parameterization also removes water from the surface layer as a function of saturation, providing an explicit drainage pathway when the substrate is wet. Together, these changes reduce the magnitude of storage peaks and promote faster loss of excess water, so ERm tracks the observed dry-down more closely but often remains slightly drier than ERo between rainfall events.
In WRF-MLGR, the substrate hydraulic parameters and free-drain bottom boundary allow water to percolate out of the substrate column very efficiently when the profile is wet. Hydraulic conductivity in the deeper substrate exhibits a strong nonlinear dependence on substrate moisture, and the multilayer diffusion scheme rapidly transfers infiltrated water downward toward this drainage sink. As a result, the deeper layers tend to dry quickly following precipitation. Because these lower layers represent a substantial fraction of the total substrate depth and the simulated bulk water content is computed as a depth-weighted average across all layers, their rapid drying strongly influences the overall column moisture. Consequently, the model exhibits a persistent dry bias relative to the lysimeter-derived bulk water content.
4.3 Model performance under different moisture regimes and radiative forcing conditions
4.3.1 Influence of moisture regime
Model performance exhibits a clear sensitivity to moisture regime across all evaluated variables. Under dry conditions, model behavior is generally more stable, with limited variability in all variables and more consistent biases in Tsurf and Qg. These conditions correspond to a moisture-limited regime in which surface energy partitioning is more predictable. In contrast, during the dry daytime hours of rainy days, mean differences are reduced for some variables, but variability increases markedly, particularly for Qe and Qg; Tsurf shows a smaller but still evident change in spread and bias magnitude. The scatter plots (Fig. S6) further demonstrate this effect, showing broader model–observation dispersion under rainy conditions, especially for Qe, indicating less consistent model performance following rainfall events. This indicates that elevated substrate moisture and residual surface wetness likely increase the complexity of surface–atmosphere exchanges and introduce greater uncertainty in modeled fluxes and temperatures.
4.3.2 Influence of radiative forcing
Separating days by net radiation shows that radiative forcing primarily scales existing model biases rather than altering their structure. Under high net radiation, biases in Qe, Tsurf and Qg are amplified, as greater available energy intensifies the expression of errors associated with each model's representation of vegetation and substrate processes, leading to more consistent error patterns. Under low net radiation, error magnitudes are reduced but become more variable, as limited energy availability constrains fluxes and increases sensitivity to day-to-day atmospheric variability. These results indicate that radiative forcing does not introduce new sources of error but instead governs how strongly underlying model assumptions are expressed.
4.4 Implications for modeling and research
The findings of this study suggest that past applications of ER and WRF-MLGR should be interpreted with some caution. For ER, the systematic overestimation of Qe implies that earlier studies may have overstated the evaporative cooling potential of green roofs, especially under high radiation and low moisture availability. Nevertheless, ER performed comparatively well in simulating Qg and Tsurf, indicating that it may be more reliable for studies focused on subsurface thermal dynamics or building-energy performance.
In contrast, WRF-MLGR exhibits structural limitations across all major components of the surface energy balance. Although the model shows an overall moderate agreement for Qe, the lack of a substrate evaporation term, means Qe is represented solely through transpiration, leading to persistent underestimations. The absence of an explicit vegetation canopy also allows incoming radiation to interact directly with the substrate, increasing the radiative load on this (relatively) high thermal admittance surface (instead of the low thermal admittance vegetation) and amplifying surface heat storage and release. Tsurf, which is tightly coupled to Qg, consequently exhibits pronounced daytime warm biases. Taken together, these highlight areas where WRF-MLGR would benefit from further refinement to improve its suitability for green roof applications. Our team has further developed this model to address these main limitations and its performance against observations is much improved, particularly for Qg (Saeedi et al., 2026).
More broadly, this study underscores the importance of rigorous, process-level evaluation in modeling of green roofs and of urban heat adaptation strategies more generally (Krayenhoff et al., 2021). Users of ER or WRF-MLGR should be aware of each model's structural assumptions and characteristic biases and should evaluate outputs against local green roof energy balance observations whenever possible. Accurate representation of the surface energy balance is essential for credible assessments of green roof performance. Ultimately, selecting an appropriate model – and clearly acknowledging its limitations – will be key to producing robust, policy-relevant assessments of green roof performance in urban environments.
This research presented a detailed evaluation of two green roof energy balance models – EcoRoof (EnergyPlus) and WRF-MLGR – using observational data collected from a Sedum-covered green roof test array. By comparing simulated and observed values of Qe, Qg, and Tsurf across multiple environmental conditions, this study provided insights into model behavior, limitations, and applicability. The results revealed that both models exhibit biases, though for different reasons rooted in their structure and assumptions. EcoRoof consistently and modestly overestimated Qe and Tsurf, partly due to vegetation parameter sensitivity and simplified representations of surface–atmosphere exchanges. In contrast, WRF-MLGR underestimated Qe, and strongly overestimated Tsurf and Qg, likely due to its lack of an explicit vegetation layer and consequent primary site of radiation exchange being a hybrid “substrate-vegetation” layer with substantial thermal admittance.
Beyond reporting performance metrics, this study highlights the importance of comprehensive, process-level model evaluation – an aspect often lacking in prior green roof modeling studies – and underscores the need for future model developments that ensure physically consistent flux formulations. In particular, vegetation-specific physiology, canopy and substrate heat storage, radiative absorption, and the distinct evaporation and transpiration pathways. These findings are particularly relevant for the integration of green roof schemes into urban canopy and building energy models, where accurate representation of surface energy partitioning is critical for assessing heat mitigation potential and informing strategies to improve urban climate resilience.
The exact stand-alone versions of the green roof model configurations used to produce the results presented in this study are archived in a persistent public repository at Zenodo: https://doi.org/10.5281/zenodo.18688590 (Martinez Mendoza et al., 2026). The archived release corresponds to the precise versions of the codes, input forcing data, observational datasets and post processing scripts used in this research, ensuring reproducibility of the results.
The stand-alone WRF-MLGR implementations are derived from the WRF source code and are distributed under the GNU General Public License v2.0 or later (GPL v2+). The stand-alone EcoRoof implementations (original configuration ERo and modified configuration ERm), derived from EnergyPlus, are distributed under the BSD 3-Clause License. The observational datasets and post-processing scripts are distributed under the Creative Commons Attribution 4.0 International (CC BY 4.0) license.
The ER model is based on the green roof module originally described by Sailor (2008) and implemented within EnergyPlus; the modified ER configuration follows the developments described by Heusinger et al. (2018) and the WRF-MLGR green roof parameterization is based on the scheme described by Zonato et al. (2021). The observed data used for the evaluation were collected as part of a long-term field experiment conducted at Western University, London, ON, Canada.
The supplement related to this article is available online at https://doi.org/10.5194/gmd-19-9729-2026-supplement.
MMM designed and implemented the evaluation methodology, performed all simulations, conducted all analyses, interpreted results and prepared the manuscript. AS extracted and implemented the green roof models, adapting components originally embedded within larger modeling frameworks. JAV supervised the work, assisted with the interpretation of results, suggested additional analyses, and reviewed and edited the manuscript. ESK contributed to the acquisition and implementation of the model codes, assisted with the interpretation of results, and reviewed and edited the manuscript.
The contact author has declared that none of the authors has any competing interests.
Publisher's note: Copernicus Publications remains neutral with regard to jurisdictional claims made in the text, published maps, institutional affiliations, or any other geographical representation in this paper. The authors bear the ultimate responsibility for providing appropriate place names. Views expressed in the text are those of the authors and do not necessarily reflect the views of the publisher.
We gratefully acknowledge Sylvie Leroyer for her guidance in the selection of the models; Dimuth Kurukulaarachchi for his extensive work on the green roof; the 2014 green roof research team, led by Dennis O'Carroll, for collecting the observational data used in this study; and Natasha MacBean for her support, feedback, and encouragement throughout this research.
This research was funded by the Climate Action and Awareness Fund, administered by Environment and Climate Change Canada.
The article processing charges for this open-access publication were covered in part by Western Libraries, the University of Western Ontario.
This paper was edited by Jason Williams and reviewed by two anonymous referees.
Berardi, U.: The outdoor microclimate benefits and energy saving resulting from green roofs retrofits, Energ. Buildings, 121, 217–229, https://doi.org/10.1016/j.enbuild.2016.03.021, 2016.
Berardi, U., GhaffarianHoseini, A., and GhaffarianHoseini, A.: State-of-the-art analysis of the environmental benefits of green roofs, Appl. Energ., 115, 411–428, https://doi.org/10.1016/j.apenergy.2013.10.047, 2014.
Brousse, O., Simpson, C., Zonato, A., Martilli, A., Taylor, J., Davies, M., and Heaviside, C.: Cool Roofs Could Be Most Effective at Reducing Outdoor Urban Temperatures in London (United Kingdom) Compared With Other Roof Top and Vegetation Interventions: A Mesoscale Urban Climate Modeling Study, Geophys. Res. Lett., 51, https://doi.org/10.1029/2024gl109634, 2024.
Cascone, S., Catania, F., Gagliano, A., and Sciuto, G.: A comprehensive study on green roof performance for retrofitting existing buildings, Build. Environ., 136, 227–239, https://doi.org/10.1016/j.buildenv.2018.03.052, 2018.
Chen, B., Wang, W., You, Y., Zhu, W., Dong, Y., Xu, Y., Chang, M., and Wang, X.: Influence of rooftop mitigation strategies on the thermal environment in a subtropical city, Urban Climate, 49, 101450, https://doi.org/10.1016/j.uclim.2023.101450, 2023.
Comer, N. T., Lafleur, P. M., Roulet, N. T., Letts, M. G., Skarupa, M., and Verseghy, D.: A test of the Canadian land surface scheme (class) for a variety of wetland types, Atmos. Ocean, 38, 161–179, https://doi.org/10.1080/07055900.2000.9649644, 2000.
Costanzo, V., Evola, G., and Marletta, L.: Energy savings in buildings or UHI mitigation? Comparison between green roofs and cool roofs, Energ. Buildings, 114, 247–255, https://doi.org/10.1016/j.enbuild.2015.04.053, 2016.
Curtis, O. F.: Leaf Temperatures and the Cooling of Leaves By Radiation, Plant Physiol., 11, 343–364, https://doi.org/10.1104/pp.11.2.343, 1936.
de Munck, C. S., Lemonsu, A., Bouzouidja, R., Masson, V., and Claverie, R.: The GREENROOF module (v7.3) for modelling green roof hydrological and energetic performances within TEB, Geosci. Model Dev., 6, 1941–1960, https://doi.org/10.5194/gmd-6-1941-2013, 2013.
Dong, X., Feng, X., and He, B.-J.: Dual potential of Garden Rooftop Farms for heat island mitigation and spatial productivity, Build. Environ., 274, 112768, https://doi.org/10.1016/j.buildenv.2025.112768, 2025.
Gößner, D., Kunle, M., and Mohri, M.: Green roof performance monitoring: Insights on physical properties of 4 extensive green roof types after 2 years of microclimatic measurements, Build. Environ., 269, 112356, https://doi.org/10.1016/j.buildenv.2024.112356, 2025.
Gravatt, D. A. and Martin, C. E.: Comparative ecophysiology of five species of Sedum (Crassulaceae) under well-watered and drought-stressed conditions, Oecologia, 92, 532–541, https://doi.org/10.1007/bf00317845, 1992.
He, Y., Yu, H., Ozaki, A., and Dong, N.: Thermal and energy performance of green roof and cool roof: A comparison study in Shanghai area, J. Clean. Prod., 267, 122205, https://doi.org/10.1016/j.jclepro.2020.122205, 2020.
Heusinger, J. and Weber, S.: Surface energy balance of an extensive green roof as quantified by full year eddy-covariance measurements, Sci. Total Environ., 577, 220–230, https://doi.org/10.1016/j.scitotenv.2016.10.168, 2017.
Heusinger, J., Sailor, D. J., and Weber, S.: Modeling the reduction of urban excess heat by green roofs with respect to different irrigation scenarios, Build. Environ., 131, 174–183, https://doi.org/10.1016/j.buildenv.2018.01.003, 2018.
Huang, J., Kong, F., Yin, H., Middel, A., Green, J. K., and Liu, H.: Green roof plant physiological water demand for transpiration under extreme heat, Urban For. Urban Gree., 98, 128411, https://doi.org/10.1016/j.ufug.2024.128411, 2024.
Imran, H. M., Kala, J., Ng, A. W. M., and Muthukumaran, S.: Effectiveness of green and cool roofs in mitigating urban heat island effects during a heatwave event in the city of Melbourne in southeast Australia, J. Clean. Prod., 197, 393–405, https://doi.org/10.1016/j.jclepro.2018.06.179, 2018.
Jaffal, I., Ouldboukhitine, S.-E., and Belarbi, R.: A comprehensive study of the impact of green roofs on building energy performance, Renew. Energ., 43, 157–164, https://doi.org/10.1016/j.renene.2011.12.004, 2012.
Kalogeri, C., Spyrou, C., Koukoula, M., Saviolakis, P. M., Pappa, A., Loupis, M., Masouras, C., and Katsafados, P.: Modeling the Impact of the Green Roofs as a Nature-Based Solution to Mitigate the Urban Heat Island Effects over Attica, Greece, in: 16th International Conference on Meteorology, Climatology and Atmospheric Physics–COMECAP 2023, International Conference on Meteorology, Climatology and Atmospheric Physics, Basel Switzerland, 174, https://doi.org/10.3390/environsciproc2023026174, 2023.
Karachaliou, P., Santamouris, M., and Pangalou, H.: Experimental and numerical analysis of the energy performance of a large scale intensive green roof system installed on an office building in Athens, Energ. Buildings, 114, 256–264, https://doi.org/10.1016/j.enbuild.2015.04.055, 2016.
Khan, A., Khorat, S., Doan, Q., Khatun, R., Das, D., Hamdi, R., Carlosena, L., Santamouris, M., Georgescu, M., and Niyogi, D.: Exploring the Meteorological Impacts of Surface and Rooftop Heat Mitigation Strategies Over a Tropical City, J. Geophys. Res.-Atmos., 128, https://doi.org/10.1029/2022jd038099, 2023.
Kim, S. H., Park, C. Y., Choi, J. Y., and Park, C.: Exploring maladaptive patterns of small-scale green roofs through evaluation in a capacity of heat mitigation: A case study in seoul, Build. Environ., 266, 112052, https://doi.org/10.1016/j.buildenv.2024.112052, 2024.
Krayenhoff, E. S., Martilli, A., Bass, B., and Stull, R. B.: Mesoscale simulation of urban heat mitigation strategies in Toronto, Canada, paper presented at the Fifth International Conference on Urban Climate, Lodz, Poland, 1–5 September 2003.
Krayenhoff, E. S., Broadbent, A. M., Zhao, L., Georgescu, M., Middel, A., Voogt, J. A., Martilli, A., Sailor, D. J., and Erell, E.: Cooling hot cities: a systematic and critical review of the numerical modelling literature, Environ. Res. Lett., 16, 053007, https://doi.org/10.1088/1748-9326/abdcf1, 2021.
Kurukulaarachchi, D. C.: Temporal Variability In The Daytime Green Roof Energy Balance During Drying Periods, MSc Thesis, The University of Western Ontario, https://hdl.handle.net/20.500.14721/27407 (last access: 22 August 2025), 2017.
Li, D., Bou-Zeid, E., and Oppenheimer, M.: The effectiveness of cool and green roofs as urban heat island mitigation strategies, Environ. Res. Lett., 9, 055002, https://doi.org/10.1088/1748-9326/9/5/055002, 2014.
Liu, K. and Minor, J.: Performance Evaluation of an Extensive Green Roof, NRCC-48204, National Research Council Canada, 2005.
Males, J. and Griffiths, H.: Stomatal Biology of CAM Plants, Plant Physiol., 174, 550–560, https://doi.org/10.1104/pp.17.00114, 2017.
Marasco, D. E., Culligan, P. J., and McGillis, W. R.: Evaluation of common evapotranspiration models based on measurements from two extensive green roofs in New York City, Ecol. Eng., 84, 451–462, https://doi.org/10.1016/j.ecoleng.2015.09.001, 2015.
Martens, R., Bass, B., and Alcazar, S. S.: Roof–envelope ratio impact on green roof energy performance, Urban Ecosyst., 11, 399–408, https://doi.org/10.1007/s11252-008-0053-z, 2008.
Martilli, A., Clappier, A., and Rotach, M. W.: An Urban Surface Exchange Parameterisation for Mesoscale Models, Bound.-Lay. Meteorol., 104, 261–304, https://doi.org/10.1023/A:1016099921195, 2002.
Martinez Mendoza, M., Saeedi, A., Voogt, J. A., and Krayenhoff, E. S.: Stand-alone EcoRoof (ERo, ERm) and WRF-MLGR model codes and evaluation datasets for “Process-based evaluation of green roof models for assessment of heat mitigation efficacy in WRF (v4.3.1) and EnergyPlus (v8.6.0)”, Zenodo [code and data set], https://doi.org/10.5281/zenodo.18688590, 2026.
Oberndorfer, E., Lundholm, J., Bass, B., Coffman, R. R., Doshi, H., Dunnett, N., Gaffin, S., Köhler, M., Liu, K. K. Y., and Rowe, B.: Green Roofs as Urban Ecosystems: Ecological Structures, Functions, and Services, BioScience, 57, 823–833, https://doi.org/10.1641/B571005, 2007.
Perelli, G. A.: Characterization of the Green Roof Growth Media, MSc Thesis, The University of Western Ontario, https://hdl.handle.net/20.500.14721/35037 (last access: 2 December 2025), 2014.
Piccinini Scolaro, T., Ghisi, E., and Silva, C. M.: Assessing the impact of evapotranspiration from green roofs on reducing surface temperatures, Journal of Building Engineering, 95, 110095, https://doi.org/10.1016/j.jobe.2024.110095, 2024.
Saeedi, A., Martinez Mendoza, M., Krayenhoff, E. S., Voogt, J., Zonato, A., Leroyer, S., and Wagner-Riddle, C.: Process-based upgrades to the WRF multi-layer green-roof scheme (WRF-MLGR v2.0) and evaluation against field observations, EGUsphere [preprint], https://doi.org/10.5194/egusphere-2026-984, 2026.
Sailor, D. J.: A green roof model for building energy simulation programs, Energ. Buildings, 40, 1466–1478, https://doi.org/10.1016/j.enbuild.2008.02.001, 2008.
Salamanca, F., Krpo, A., Martilli, A., and Clappier, A.: A new building energy model coupled with an urban canopy parameterization for urban climate simulations – part I. formulation, verification, and sensitivity analysis of the model, Theor. Appl. Climatol., 99, 331–344, https://doi.org/10.1007/s00704-009-0142-9, 2010.
Seo, Y., Kwon, Y., Hwang, J. S., and Woo, D. K.: A Comparative Experimental Study of Green Roofs Based on Radiation Budget and Surface Energy Balance, KSCE J. Civ. Eng., 27, 1866–1880, https://doi.org/10.1007/s12205-023-1491-0, 2023.
Shafique, M., Kim, R., and Rafiq, M.: Green roof benefits, opportunities and challenges – A review, Renewable and Sustainable Energy Reviews, 90, 757–773, https://doi.org/10.1016/j.rser.2018.04.006, 2018.
Sia, M. E.: Evapotranspiration from extensive green roofs: influence of climatological conditions, vegetation type, and substrate depth, MSc Thesis, The University of Western Ontario, https://hdl.handle.net/20.500.14721/34186 (last access: 26 June 2025), 2016.
Siddiqui, K., Way, D., Bisuamlak, G., Peerhossaini, H., Voogt, J., Grolinger, K., Cechetto, L., Capretz, M., Aliabadi, A., Krayenhoff, S., Hangan, H., and Moffatt, M.: Improved multi-scale GHG emissions modeling from urban environments to enhance mitigation strategies, Environment and Climate Change Canada, Advancing Climate Change Science and Technology 2021/2022, project description (2022–2026), 2022.
Silva, C. M., Gomes, M. G., and Silva, M.: Green roofs energy performance in Mediterranean climate, Energ. Buildings, 116, 318–325, https://doi.org/10.1016/j.enbuild.2016.01.012, 2016.
Sims, A. W.: Stormwater Management Performance of Green Roofs, MSc Thesis, The University of Western Ontario, https://hdl.handle.net/20.500.14721/35793 (last access: 14 January 2026), 2016.
Sun, T., Grimmond, C. S. B., and Ni, G.: How do green roofs mitigate urban thermal stress under heat waves?, J. Geophys. Res.-Atmos., 121, 5320–5335, https://doi.org/10.1002/2016jd024873, 2016.
Tabares-Velasco, P. C. and Srebric, J.: A heat transfer model for assessment of plant based roofing systems in summer conditions, Build. Environ., 49, 310–323, https://doi.org/10.1016/j.buildenv.2011.07.019, 2012.
Tadeu, A., Škerget, L., Almeida, J., and Simões, N.: Canopy contribution to the energy balance of a building's roof, Energ. Buildings, 244, 111000, https://doi.org/10.1016/j.enbuild.2021.111000, 2021.
Taylor, J. R.: An Introduction to Error Analysis. The Study of Uncertainties in Physical Measurements, 2nd edn., University Science Books, Sausalito, California, USA, 1997.
Tran, S., Lundholm, J. T., Staniec, M., Robinson, C. E., Smart, C. C., Voogt, J. A., and O'Carroll, D. M.: Plant survival and growth on extensive green roofs: A distributed experiment in three climate regions, Ecol. Eng., 127, 494–503, https://doi.org/10.1016/j.ecoleng.2018.09.027, 2019.
Willmott, C., Ackleso, S., Davis, O., Feddema, J., Klink, K., Legate, D., and Rowe, A.: Statistics for the Evaluation and Comparison of Models, J. Geophys. Res., 90, 8995–9005, 1985.
Willmott, C. J.: Some Comments on the Evaluation of Model Performance, B. Am. Meteorol. Soc., 63, 1309–1313, https://doi.org/10.1175/1520-0477(1982)063<1309:SCOTEO>2.0.CO;2, 1982.
Willmott, C. J., Robeson, S. M., and Matsuura, K.: A refined index of model performance, Int. J. Climatol., 32, 2088–2094, https://doi.org/10.1002/joc.2419, 2012.
Zhao, M., Tabares-Velasco, P. C., Srebric, J., Komarneni, S., and Berghage, R.: Effects of plant and substrate selection on thermal performance of green roofs during the summer, Build. Environ., 78, 199–211, https://doi.org/10.1016/j.buildenv.2014.02.011, 2014.
Zheng, X., Yang, Z., Yang, J., Tang, M., and Feng, C.: An experimental study on the thermal and energy performance of self-sustaining green roofs under severe drought conditions in summer, Energ. Buildings, 261, 111953, https://doi.org/10.1016/j.enbuild.2022.111953, 2022.
Zheng, Y. and Weng, Q.: Modeling the Effect of Green Roof Systems and Photovoltaic Panels for Building Energy Savings to Mitigate Climate Change, Remote Sens., 12, 2402, https://doi.org/10.3390/rs12152402, 2020.
Zonato, A., Martilli, A., Gutierrez, E., Chen, F., He, C., Barlage, M., Zardi, D., and Giovannini, L.: Exploring the Effects of Rooftop Mitigation Strategies on Urban Temperatures and Energy Consumption, J. Geophys. Res.-Atmos., 126, e2021JD035002, https://doi.org/10.1029/2021JD035002, 2021.