
the Creative Commons Attribution 4.0 License.
the Creative Commons Attribution 4.0 License.
 | 07 Oct 2026
Benchmarking a new urban scheme in the ORCHIDEE 2.2 land surface model
Morgane Lalonde

Sophie Bastin
Ludovic Oudin
Pedro Felipe Arboleda-Obando
Agnès Ducharne
Urban areas change natural surface energy and water balances, yet some land surface models still represent cities as natural surfaces. In this study, we present the development of a one-tile urban scheme for the ORCHIDEE land surface model, designed to improve the representation of urban processes, particularly for high-resolution applications. The scheme incorporates key urban parameters such as albedo, building height, thermal properties, and imperviousness. We propose a novel physically-based approach for representing imperviousness, by modifying saturated hydraulic conductivity to account for both surface and subsurface impacts. Off-line simulations across 20 urban flux tower sites show improved performance in sensible and latent heat fluxes with the new urban scheme, compared to the original baresoil representation. Mean absolute error (MAE) evaluation confirms improved model skill, aligning with benchmark results from the Urban-PLUMBER intercomparison. The scheme also captures expected urban hydrological signatures, such as increased surface runoff, though some reductions in subsurface runoff may be less consistent with observed urban recharge patterns. This work lays the foundation for applying ORCHIDEE at the basin scale and in high-resolution convection-permitting simulations for urban hydroclimate studies. Perspectives include refining thermal parameter choices, integrating anthropogenic heat fluxes, and conducting high-resolution simulations to assess hydrological performances using observed streamflow data.
- Article
(2547 KB) - Full-text XML
-
Supplement
(600 KB) - BibTeX
- EndNote


Land Surface Models (LSMs) simulate surface processes such as the surface energy and water budgets and are designed to be coupled to atmospheric models, with an emphasis on robust land–atmosphere exchanges across diverse environments (Blyth et al., 2021). Historically, their development followed two pathways shaped by the application scale. GCM-oriented LSMs, such as ORCHIDEE, CLM, and JSBACH, operate on coarse grids (tens to hundreds of kilometers; e.g. Fisher and Koven, 2020) and focus on global water and carbon cycles (Krinner et al., 2005; Lawrence et al., 2019; Raddatz et al., 2007). By contrast, LSMs used in mesoscale and limited-area models, such as Noah-MP, TERRA, and ISBA-SURFEX, have long used finer resolutions, favoring more accurate landscape representation and parameterizations relevant at kilometer scale over restricted domains or shorter periods (Doms et al., 2011; Masson et al., 2013; Niu et al., 2011), but neglecting groundwater processes (Barlage et al., 2021). Increasing computing power is now blurring this distinction, as GCMs move toward kilometer-scale grid spacing (Prein et al., 2026; Segura et al., 2025; Stevens et al., 2019), and mesoscale models increasingly run in climate-mode over large domains and long periods (Lucas-Picher et al., 2021; Schär et al., 2020). This convergence highlights the need for scalable, efficient parameterizations valid across a wide range of environments. Urban land cover exemplifies this challenge: while explicitly represented for decades in mesoscale models (e.g., Masson, 2000), it remains relatively new in GCM-oriented LSMs where coarse grids previously limited its relevance. The shift toward kilometer-scale modeling and rapid urban expansion (Güneralp et al., 2020; Seto et al., 2012), motivate the development of physically based urban schemes in these models. Yet, urban processes are still insufficiently represented in GCM-oriented LSMs despite their strong influence on land–atmosphere (Langendijk et al., 2024; Michau et al., 2025) and land–subsurface interactions (Bhaskar et al., 2016; Oudin et al., 2018).
To reproduce the characteristic signatures of the urban surface energy budget, an urban representation must account for several key surface properties and fluxes that differ markedly from natural areas: (1) radiative properties, particularly albedo and longwave-radiation trapping; (2) aerodynamic properties, including surface roughness and urban geometry; (3) thermal properties, especially heat capacity and thermal conductivity; (4) vegetation cover, imperviousness, and water availability; and (5) anthropogenic heat emissions. First, cities modify the absorbed shortwave radiation through changes in the effective urban canopy albedo relative to surrounding rural areas because of the materials used in cities and the geometry of buildings and streets (Kotopouleas et al., 2021; Qin, 2015). Urban geometry also affects longwave exchanges by trapping infrared radiation within the canopy. Together with the high heat capacity and thermal conductivity of urban materials, these radiative effects contribute to increased heat storage and often higher urban surface temperatures. The sensible heat is modified by cities buildings, which alter wind speed (depending on the street geometries can either increase or decrease), and increase surface roughness (Sun et al., 2024). The sensible heat is also modified by the different surface temperatures (usually higher than surrounding natural areas) of urban materials which change the temperature gradient between the surface and the air (Barlow, 2014). By reducing the vegetation cover, and by increasing impervious surfaces, cities typically decrease the latent heat flux (Loridan and Grimmond, 2012). This reduction in latent heat leaves more available energy at the surface to be dissipated as sensible heat. In urban environments, ground heat flux has been estimated to account for 30 %–40 % of net radiation, in contrast to just 10 % in rural areas (Rigo and Parlow, 2007). This larger heat storage results from both the higher heat capacity and thermal conductivity of urban materials and the greater surface area available for heat exchange and storage within the urban canopy (Bernabé et al., 2015; Johra, 2021; Wonorahardjo et al., 2020). This refers to what is typically called the storage heat in urban climate studies, with urban materials storing significant heat during the day and releasing it at night (Lindberg et al., 2020). Even if not explored within this manuscript, the anthropogenic heat flux (QF) is a term typically added to urban surface energy budgets. It refers to anthropogenic heat emissions from buildings, from domestic and non-domestic sources (human activities such as heating, cooling, transportation, and industrial processes), with diurnal, seasonal, and regional patterns (Hamilton et al., 2009).
Urban representations in LSMs began to evolve in the early 2000s, moving from simple to increasingly process-based descriptions. Early approaches treating urban surfaces as natural land covers failed to capture distinct urban radiative, momentum, and heat fluxes at higher spatial resolutions (Lipson et al., 2024). The first step toward explicitly representing cities in LSMs was the introduction of urban bulk schemes (Myrup, 1969; Oke, 1988), in which grid cell properties such as albedo, roughness length, and surface thermal characteristics were adjusted to reflect urban conditions while still treating the surface as a single homogeneous entity. To improve the representation of the urban energy balance, and to address street scale climate questions, canyon-based models were implemented in LSMs. The Town Energy Budget (TEB; Masson, 2000) implemented an explicit urban canyon geometry within a LSM, distinguishing roofs, walls, and roads and allocating separate energy budgets to each surface. This was followed by multi-layer configurations, such as the Building Effect Parametrization (BEP; Martilli et al., 2002), which added vertical discretization of urban elements and enabled more refined exchanges of heat, momentum, and moisture. The most recent classification of geometries of urban schemes (Lipson et al., 2024) places them on a continuum: (i) non-urban representations (bare soil, vegetation), (ii) one-tile “slab” schemes that aggregate urban surfaces, (iii) two-tile schemes distinguishing between roofs and roads, (iv) canyon-based schemes resolving roofs, walls, and roads separately usually with multi-layers in the canyon, and (v) more complex three-dimensional approaches.
Beyond morphology, urban schemes in LSMs diverge in the processes and fluxes they represent. Comparisons have shown that latent heat flux is often the least well represented, and historically even neglected, under the assumption that vegetation and water availability are minimal in cities (Best and Grimmond, 2015). Over the last decade, however, evidence has emphasized the importance of vegetation for correctly simulating latent heat fluxes and model performance during wet conditions. Current urban schemes differ in how vegetation is represented: it may be excluded entirely, handled through a sub-tile vegetation fraction with separate energy and water budgets, or integrated directly into the canyon geometry (Krayenhoff et al., 2014; Lemonsu et al., 2012; Redon et al., 2020).
On top of vegetation, hydrology has also been shown as a key element to capture correctly latent heat fluxes. Urbanization modifies surface and subsurface hydrological pathways by increasing soil sealing, compaction, changing preferential flow pathways, and through water use infrastructures (Bhaskar et al., 2016; Fletcher et al., 2013). These changes generally increase surface runoff and shorten hydrological response times, while their effects on soil moisture, groundwater recharge, low flows, and evapotranspiration depend on local soil properties, vegetation, water use, drainage connectivity, and sewer or stormwater networks (Bhaskar et al., 2016; Fletcher et al., 2013; Oudin et al., 2018; Saadi et al., 2020). This complexity is partly reflected in the use of the term “imperviousness”, which is not unique in urban hydrology. Depending on the modeling and spatial context, it can refer to the total impervious surface fraction, the fraction effectively connected to the drainage network, or an effective hydrological control on infiltration and surface runoff generation (Jacobson, 2011; Saadi et al., 2020). This distinction is important for ULSMs because urban hydrology influences not only surface runoff, but also soil water availability and evapotranspiration, which directly links the water and energy budgets.
In ULSMs, urban hydrology has been introduced progressively through several modelling choices. Early urban canopy schemes primarily focused on radiative, thermal, and aerodynamic exchanges, while hydrological processes were absent or simplified, with artificial surfaces commonly represented as impervious and water exchange mainly limited to surface interception, evaporation from wet sealed surfaces, and runoff (Kusaka et al., 2001; Martilli et al., 2002; Masson, 2000). Later developments introduced more explicit hydrological distinctions between urban surface types. One direction was to distinguish hydrological behaviour between pervious and impervious urban fractions, for example through pervious and impervious canyon-floor fractions in CLM-U (Oleson et al., 2008). TEB-related developments add infiltration through artificial surfaces, and connected rainfall interception on roofs and roads toward a soil component (Lemonsu et al., 2007). Other schemes refined the representation of water stored on impervious surfaces and its evaporation after rainfall, as in TERRA-URB (Wouters et al., 2015). Hydro-microclimate approaches further extended urban hydrology to include subsoil beneath built surfaces, lateral water transfer between pervious and impervious tiles, sewer drainage, and irrigation, as in TEB-Hydro (Stavropulos-Laffaille et al., 2021, 2018). Despite these advances, recent intercomparison work shows that urban water-balance representation remains uncertain in ULSMs, especially regarding water-balance closure, storage dynamics, and runoff parameterization (Jongen et al., 2024). Progress is also constrained by observations, because urban sites providing turbulent fluxes do not provide all water-balance terms needed to evaluate runoff, irrigation, drainage, and storage changes consistently at the same spatial scale (Jongen et al., 2024).
The Urban-PLUMBER intercomparison project (Lipson et al., 2024) demonstrated that simpler models in terms of morphology, when evaluated as a group, often outperformed more complex ones in simulating local-scale fluxes for large-scale applications such as regional or global climate modeling. The results from the Urban-PLUMBER intercomparison also indicate that model performance is not strictly linked to geometric complexity: schemes that represent hydrology, vegetation, and imperviousness realistically, regardless of whether they are slab, two-tile, or canyon, can perform well across turbulent heat fluxes, whereas complex schemes often underperform when these elements are simplified (Lipson et al., 2024). These findings underscore that accurately representing water availability, imperviousness, and vegetation may be as important as the level of geometric detail.
In its current configuration, the ORCHIDEE (Organising Carbon and Hydrology In Dynamic Ecosystems) land surface model represents urban areas as natural surfaces, more specifically, as bare soil. This simplification limits the model's ability to capture key urban processes, including sensible and latent heat flux partitioning and urban runoff generation. As ORCHIDEE is increasingly applied at fine spatial resolutions, including in convection-permitting coupled simulations below 3 km (Shahi et al., 2022), the absence of an explicit urban representation becomes a critical limitation. ORCHIDEE already includes a detailed and physically based hydrological scheme and a sub-tile vegetation representation through plant functional types (PFTs). However, because urban areas are currently treated as bare soil, ORCHIDEE lacks a mechanism to represent impervious surfaces and to assign surface parameters that reflect urban form and materials.
To address the limited representation of urban processes in ORCHIDEE, particularly the effects on energy and water surface budgets, we propose the development of a one-tile urban scheme within the model. This approach builds on advancements in urban parameterizations already implemented in other land surface models. Our goal is to design a scheme that can readily incorporate urban characteristics datasets while remaining computationally efficient. Our objectives are twofold. First, we design an urban one-tile scheme that captures the dominant controls on the urban surface energy and water budgets while remaining consistent with ORCHIDEE's existing structure and computational constraints. We parameterize key urban characteristics (e.g., albedo, thermal conductivity, heat capacity, building height) such that they can be assigned from global or local urban datasets. Second, we introduce a parsimonious, physically motivated, representation of imperviousness. Rather than resolving separate water budgets for pervious and impervious urban sub-tiles, the proposed approach preserves the existing ORCHIDEE soil hydrology with an urban soil tile where imperviousness is represented through its effect on the hydraulic properties of the soil column. Specifically, imperviousness modifies saturated hydraulic conductivity as a function of depth, allowing it to influence infiltration, surface runoff generation, soil water storage, and vertical water transfer. This formulation is designed for one-tile, kilometer-scale and coarser LSM applications, where the objective is to represent their aggregate effect on the water budget and surface fluxes feedback to the atmosphere. We evaluate the new scheme at urban and suburban flux tower sites, compare its performance to existing ORCHIDEE configurations, and assess the relative importance of imperviousness-related hydrological processes for urban energy and water fluxes. Section 2 describes the model and the new developments. Section 3 presents the experimental setup and evaluation strategy. Section 4 provides the results, Sect. 5 discusses their implications, and Sect. 6 summarizes the conclusions and perspectives.
2.1 ORganizing Carbon and Hydrology In Dynamic EcosystEms (ORCHIDEE)
ORCHIDEE is the Land Surface Model developed at IPSL (Institut Pierre-Simon Laplace) and used in global and regional climate models, as well as in standalone mode. It simulates coupled water, energy, and carbon fluxes between the land surface and the atmosphere (Boucher et al., 2020; Krinner et al., 2005). This study uses ORCHIDEE version 2.2, revision 8133; further details and access information are provided in the Code and data availability section.
As shown in Fig. 1, land cover is represented within each grid cell as a mosaic of plant functional types (PFTs). The standard configuration includes up to 15 PFTs: one bare-soil PFT, eight high-vegetation PFTs (forest types), and six low-vegetation PFTs (including grasslands and croplands). Each PFT is associated with its own radiative, morphological, physiological, and phenological characteristics. Water and energy fluxes associated with vegetation and natural soils including transpiration, evaporation of water intercepted by the vegetation canopy, and soil evaporation, are computed at the PFT level and are then aggregated to the grid cell scale using a flux-aggregation approach (calculated separately for each PFT and then aggregated to the grid-cell scale as area-weighted fluxes). In contrast, energy fluxes associated with radiative and aerodynamic parameters (e.g., albedo, roughness length) are directly calculated at grid-cell scale using PFT-weighted parameters.
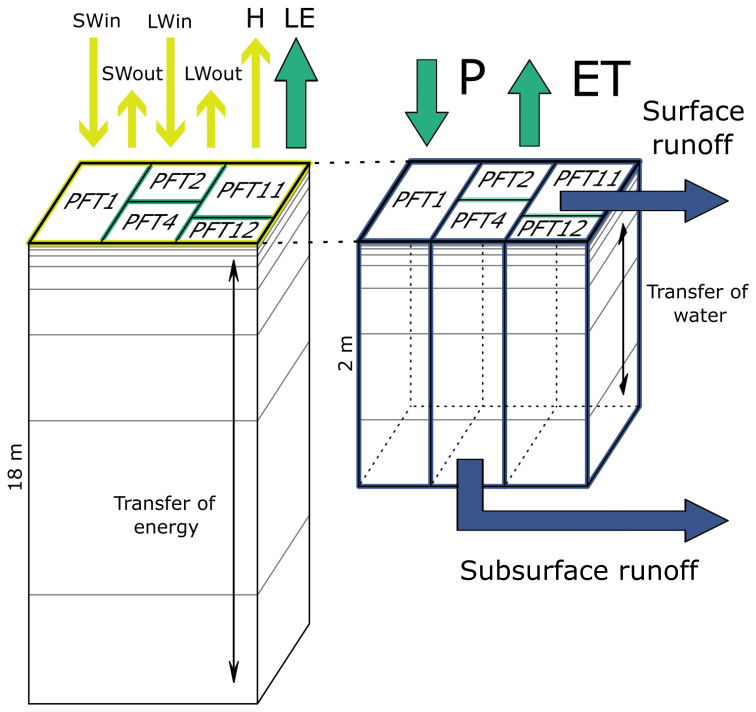
Figure 1Schematic representation of the energy- and water-budget calculations in ORCHIDEE for a single grid cell, its plant functional types (PFTs), and the three associated soil columns representing bare soil, high vegetation, and low vegetation. Yellow arrows denote fluxes calculated directly at the grid-cell scale, green arrows denote fluxes calculated separately for each PFT and subsequently aggregated to the grid-cell scale, and dark-blue arrows denote fluxes calculated independently for each soil column. For example, sensible heat flux (H) is calculated at the grid-cell scale, evapotranspiration (ET) at the PFT scale, and surface runoff and subsurface runoff at the soil-column scale. Each soil column is discretized into 12 hydrological layers extending to a depth of 2 m, while the thermal discretization extends to 18 m. Abbreviations: P, precipitation; ET, evapotranspiration; H, sensible heat flux; SW, shortwave radiation; LW, longwave radiation; PFT, plant functional type.
Each grid cell contains three soil columns, one for bare soil, one for high vegetation, and one for low vegetation. These columns have the same depth, vertical discretization, soil texture, and texture-dependent hydraulic properties. They differ in their vegetation-related processes: the high- and low-vegetation columns have distinct rooting profiles and root-water uptake, whereas the bare-soil column has no root extraction. Their soil-moisture states and water budgets therefore evolve independently. Each soil column is vertically discretized (12 layers, down to a depth of 2 m for hydrology, and 18 m for soil temperature computation), allowing the model to simulate temperature and moisture transfer through the soil profile. For each soil column, ORCHIDEE calculates the surface runoff, and subsurface runoff, representing gravitational outflow at the bottom of the soil column. The organization of the PFT mosaic and associated soil columns, together with the spatial scale at which the different fluxes are calculated, is summarized in Fig. 1.
2.1.1 Representation of the energy fluxes and surface energy budget
The surface energy budget is often described as:
where Rnet is the net radiation, representing the total balance between incoming shortwave (SW) and longwave (LW) radiation and their respective outgoing components, H is the sensible heat flux, LE is the latent heat flux, and G is the ground heat flux. The heat stored and released by the soil or urban substrate is not neglected, but is represented through (G), which is used as the upper boundary condition of the one-dimensional heat diffusion equation for the soil temperature profile. Thus, no additional storage term is introduced in the surface energy budget.
ORCHIDEE computes these terms following its internal energy budget formulation. Building upon previous PhD and accreditation to supervise research (HDR) theses (Arboleda-Obando, 2023; Arjdal, 2023; Chéruy, 2018), we summarize here only the components relevant to the development of an urban one-tile scheme. For clarity, snow-covered conditions and floodplain processes, although represented in ORCHIDEE, are omitted from the description below because they are not relevant to the urban one-tile developments presented here. At each time step, at the grid cell scale, ORCHIDEE computes a surface temperature that is consistent with the radiative, turbulent, and conductive fluxes. This surface temperature is then used to compute the surface energy fluxes at the current time step and is carried forward, together with the updated soil temperature profile, as part of the thermal state used at the following time step.
The net radiation term is computed as:
where α is the albedo (unitless); σ is the Stefan–Boltzmann constant ( W m−2 K−4); ϵ (unitless) is the surface longwave emissivity, fixed to 1 in these simulations, corresponding to a blackbody approximation in the thermal infrared; and Tsurf is the surface temperature (K). Equation (2) therefore defines the radiative term of Eq. (1). It is not independent from the other fluxes because Tsurf also controls the turbulent and conductive fluxes.
Each vegetation PFT has its own value of albedo (αleaf), and the value of albedo for baresoil (αMODIS) is read from MODIS (Moderate Resolution Imaging Spectroradiometer) data (Lurton et al., 2020). The use of MODIS-derived bare-soil albedo fields accounts for the spatial variability of soil reflectance resulting from heterogeneities in soil composition, moisture, and texture. Unlike vegetation, where albedo can be more homogeneously modeled based on physiological properties, bare soil requires an empirical approach. MODIS satellite data provides precise measurements of these variations, ensuring that local differences in soil reflectance are accurately captured. The resulting albedo of a grid cell is a mean of albedos of bare soil and of the PFTs constituting the grid cell, weighted by the fractional areas of the PFTs of the grid cell:
where is the baresoil fraction of the grid cell; is the PFTi (vegetation PFTs) fraction of the grid cell; is the albedo of each vegetated PFT.
For each grid cell at each time step, ORCHIDEE solves the energy budget equations based on a bulk-diffusion approach (Barella-Ortiz et al., 2013). It allows the calculation of the sensible and latent heat fluxes exchanged between the land surface and the atmosphere accounting for the various components of the latent heat flux: soil evaporation, plant transpiration, evaporation of water intercepted by the vegetation canopy (interception loss), snow sublimation. The sensible and latent heat fluxes are calculated respectively thanks to Eqs. (4) and (5).
where ρ is air density (kg m−3); v is the horizontal wind speed (m s−1); Cd is the drag coefficient (unitless); cp is the specific heat capacity of dry air (1004.675 J kg−1 K−1); Levap is the latent heat of evaporation or sublimation (2.5008×10⁶ or 2.8345×10⁶ J kg−1); β is the limiting factor of potential total evapotranspiration (unitless); Tsurf and Tair are the surface and air temperature respectively (K); and qsurf and qair are the specific moisture at the surface and in the air (kg kg−1), respectively. Equations (4) and (5) define the H and LE terms of Eq. (1). They are linked to Eq. (2) through Tsurf as the same surface temperature controls outgoing longwave radiation, the surface–air temperature gradient, and the saturation humidity entering the latent heat flux calculation.
Turbulent transfer of the fluxes between the surface and the atmosphere, is represented thanks to the drag coefficient Cd. For each PFT in the standalone version of ORCHIDEE, Cd which can also be expressed as , where u is the wind speed and rah the aerodynamic resistance, is calculated as follows:
where k is the Von Karman constant; zlev is the height of the first atmospheric layer (10 m in standalone simulations); hPFT is the height of the canopy of the considered PFT (fixed) and z0 is the dimensionless roughness-length-to-height ratio and is fixed to 0.0625 (, default value in ORCHIDEE for all PFTs in standalone simulations). Thus, the product hPFT⋅z0 in Eq. (6) corresponds to the aerodynamic roughness length. The aerodynamic roughness length is therefore not prescribed as an additional independent parameter but is diagnosed from the PFT height. For the urban PFT, hPFT corresponds to the prescribed site-specific building height; consequently, its aerodynamic roughness varies among sites. Because ORCHIDEE calculates a single energy budget per grid cell, the PFT-level drag coefficients are subsequently aggregated to the grid-cell scale using the corresponding land-cover fractions.
The remaining term in Eq. (1) is the ground heat flux G. It is computed from the thermal gradient between the surface and the upper soil or substrate layer:
where λ (W m−1 K−1) and Cp (J kg−1 K−1) are respectively the soil thermal conductivity and the soil heat capacity.
This expression constitutes the upper boundary condition of the one-dimensional heat diffusion equation used to compute the evolution of soil temperature along the vertical profile. The lower boundary condition is a zero-heat-flux condition at the bottom of the soil column (18 m), following the standard ORCHIDEE configuration. Soil temperature is prognostically calculated by solving the Fourier heat diffusion equation:
where T is the soil temperature (K).
Finally, the soil thermal properties also change according to the soil water content of each soil layer:
where, λs and λw are the heat conductivities for solid soil and water, respectively (W m−1 K−1); λdry is the heat conductivity of dry soil (W m−1 K−1); S is the total soil saturation degree (m3 m−3); Cdry and Cwet are respectively the dry and saturated soil heat capacity (kJ m−3 K−1). The hydrological and thermal discretizations are identical in the upper 2 m of the soil column. Within this common domain, hydrological soil-moisture variables are transferred to the thermal grid, including interpolation of volumetric water content to the thermal-layer interfaces. Below 2 m, soil moisture is not prognostically simulated. Instead, the volumetric water content is assumed to be vertically uniform and equal to that of the deepest hydrological layer. The total water content assigned to each thermal layer therefore scales with its thickness. This assumption is consistent with the gravitational-drainage boundary condition at the bottom of the hydrological column.
2.1.2 Representation of water fluxes at the grid cell scale
The description of the computation of the water budget and its different fluxes is detailed in the technical documentation “The hydrol module of ORCHIDEE” (Ducharne et al., 2018), as well as in PhD theses using the ORCHIDEE model (Campoy, 2013; d'Orgeval, 2006). The following sections take up the description of this report and these PhD theses, focusing on the relevant information for the development of an urban one-tile scheme.
The surface water budget reflects the balance between water inputs and outputs at the surface. In ORCHIDEE, it is defined by the partitioning of precipitation into evapotranspiration, surface and subsurface runoff, and a change in soil moisture. Each grid cell contains three soil columns for water budget calculations: one for bare soil, one for high vegetation, and one for low vegetation. These columns are 2 m deep and discretized into 12 layers whose thickness increases with depth. The vertical redistribution of soil moisture, here volumetric water content θ (m3 m−3), in these columns follows a diffusion-based scheme that relies on the Richards equation (De Rosnay et al., 2002), with surface and subsurface runoff acting as the upper and lower boundary conditions, respectively and is stated as:
where z is depth below the soil surface (m), t is time (s), J is the flux field (m s−1), and s is the sink term (m3 m−3 s−1). The flux J follows Darcy's law (Darcy, 1856), later extended to unsaturated soils by Buckingham (1907).
where K(θ) and D(θ) are the hydraulic conductivity and diffusivity (in m s−1 and m2 s−1 respectively). The relationships between K, D, and θ are given by the Mualem (1976)–Van Genuchten (1980) model:
where Ks is the saturated hydraulic conductivity (m s−1), μ (m−1) corresponds to the inverse of the air entry suction, m is a dimensionless parameter, related to the classical Van Genuchten parameter n, by ; θr is the residual water content (m3 m−3), and θf the relative humidity (m3 m−3) defined as , with θs the saturated water content (m3 m−3).
In version 2.2 of ORCHIDEE, the vertical profile of saturated hydraulic conductivity Ks(z) is prescribed as a function of depth. Its value at any depth z results from three components:
- i.
Reference saturated hydraulic conductivity () at the depth zlim = 0.30 m, derived from the dominant USDA (U.S. Department of Agriculture) soil texture of the grid cell (12-class texture classification). Each grid cell's dominant soil texture influences soil transfer (Ducharne et al., 2018; Tafasca et al., 2020).
- ii.
An exponential decrease with depth, controlled by the dimensionless factor FK(z). This decrease applies from zlim to the bottom of the soil column (2 m).
- iii.
A root-induced enhancement in the upper soil layers, represented by a factor FKroots(z,c), where c denotes the soil-column index. This enhancement is applied only to vegetated soil columns, whereas FKroots(z,c) is set to 1 for the bare soil column, which therefore retains a constant Ks over the first 30 cm (d'Orgeval et al., 2008; De Rosnay et al., 2002).
The resulting expression for the saturated hydraulic conductivity profile is:
where FK(z) controls the exponential decrease with depth:
Apart from the texture-dependent , the other three parameters (zlim, f, ) are constants, i.e. they do not depend on the PFT, the soiltile, and the soil texture. The depth zlim is set to 0.30 m, the decay factor f is set to 2 m−1, and the dimensionless parameter is set to 10. Therefore, FK(z) cannot be smaller than .
Infiltration is computed using a Green–Ampt type approach (Green and Ampt, 1911). When precipitation exceeds the infiltration capacity at the surface, the non-infiltrated fraction becomes surface runoff (Horton or infiltration-excess runoff). Surface runoff is computed independently for each soil column, and the grid cell surface runoff is obtained by summing the contributions from the three columns. At the bottom of the 2 m soil column, ORCHIDEE applies a free gravitational drainage boundary condition by default. This means that water leaves the soil whenever hydraulic conductivity at the bottom layer is nonzero. This downward flux is referred to as subsurface runoff. As for surface runoff, grid cell subsurface runoff is the sum of the subsurface runoff from the three soil columns. The total runoff is the sum of subsurface runoff and surface runoff. There are no subsurface lateral fluxes between adjacent soil grid cells in the model.
In the ORCHIDEE model, evapotranspiration includes evaporation from soil, and vegetation canopy, along with plant transpiration. Evapotranspiration (Etotal) is the link between the energy balance and the water balance, and can be written as:
and:
The actual evapotranspiration Etotal (kg m−2 s−1) is thus calculated from a potential evapotranspiration Epot (kg m−2 s−1), and a stress function βET (unitless). This stress function βET has its own value for each type of evaporation:
where β1, β2 and β3 are the individual stress functions on interception loss, transpiration and bare soil evaporation respectively, and Av, Ag and AL are the fractions of vegetated fraction, bare soil fraction, and total land area, respectively. β1 = 1, since the local evaporation flux from the intercepted water proceeds at its potential rate. The local stress functions β2 and β3 are ≤1, and become closer to zero as soil moisture gets limiting.
Once the latent heat flux is calculated with Eqs. (5) and (17), ORCHIDEE calculates the different terms contributing to total evapotranspiration:
with each term depending on the different β previously mentioned, with for instance the Esoil being calculated as:
with Levap the latent heat of vaporization.
2.2 New urban parametrization for ORCHIDEE v2.2
2.2.1 Adding an Urban PFT with prescribed albedo and height
The first step in implementing the urban one-tile scheme was to introduce an Urban PFT into ORCHIDEE's land-cover representation. Urban-specific parameter values are prescribed for this PFT. For the energy budget, we assign urban values of albedo, and height of roughness elements. For the water budget, the key input parameter is the impervious surface fraction, ranging from 0 to 1. In this study, this fraction is not used to define separate pervious and impervious hydrological sub-tiles, nor does it represent the fraction directly connected to the drainage network. Instead, it is converted into an effective hydrological parameter that modifies saturated hydraulic conductivity as a function of depth, thereby affecting infiltration, runoff generation, soil-water storage, and vertical water transfer within the ORCHIDEE soil columns. All other PFT attributes remain identical to those of the bare-soil PFT, consistent with the slab-scheme assumption of no vegetation within the urban tile.
In ORCHIDEE, albedo is first computed at the PFT level and then aggregated to the grid cell scale by weighting each PFT contribution by its fractional cover (Eq. 3). For the bare-soil PFT, albedo is prescribed from MODIS, whereas vegetation PFTs use prescribed leaf albedo values ranging from 0.18 to 0.34, depending on vegetation type. For the new Urban PFT, albedo is handled in a flexible manner: it can either be prescribed as a single constant value specified by the user in the simulation namelist or read from an external urban-albedo dataset that ORCHIDEE interpolates onto the model grid. The same structure applies to the parameter controlling effective urban height, which influences aerodynamic roughness and turbulent fluxes. Urban height can correspond to a uniform value defined by the user or be derived from a gridded dataset describing building height or urban morphology. This approach ensures that the urban representation remains compatible with large-scale climate simulations while allowing the use of more detailed datasets when available.
2.2.2 Adding an urban soil column with imperviousness-dependent hydraulic conductivity
In a second step, we introduce a dedicated soil column associated with the Urban PFT, enabling soil water and heat processes to be represented separately from those of bare soil, high vegetation, and low vegetation. Water transfers into the soil depend on several factors, including the saturated hydraulic conductivity Ks (Eqs. 13 and 15). To represent the effects of imperviousness, Ks is reduced to limit water transfer into the soil column. To represent imperviousness within the urban soil column, we modify Eq. (15) by replacing the vegetation root factor FKroots(z,c) with a constant urban factor Furb, which does not depend on depth:
When Furb equals 1, the original profile of Ks for bare soil remains unmodified. The lowest value assigned to Furb is 0.1, as a value of 0 would imply no water transfer within the column, and values lower than 0.1 would result in unrealistically low saturated hydraulic conductivities for certain soil textures (typically with clay). To define the new factor Furb, two options are considered. Option “Urban1” considers Furb as a constant (same over all urban soil column), while in option “Urban2” Furb depends on the imperviousness. The Urban1 option states Furb equal to 0.1 to have reduced to 10 % of its original value:
While the Urban2 option calculates Furb as follows:
where fimp is the value of imperviousness of the urban column and ranges from 0 to 1, so Ks(z) decreases proportionally to fimp. When site-specific information is unavailable, the modeler may prescribe a representative value. For example, the Copernicus Urban Atlas distinguishes discontinuous medium-density urban fabric (), discontinuous dense urban fabric (), and continuous urban fabric (fimp>0.80; European Environment Agency, 2020).
These two options are illustrated in Fig. 2, which represents the saturated hydraulic conductivity for a loam soil over the 2 m soil column. The orange line presents the original values from the baresoil column. The purple line presents the saturated hydraulic conductivity for the Urban1 hypothesis. The Urban1 hypothesis is designed to represent a very impervious conceptualization of cities. The pink line presents the saturated hydraulic conductivity for the Urban2 hypothesis, considering an imperviousness equal to 55 %.
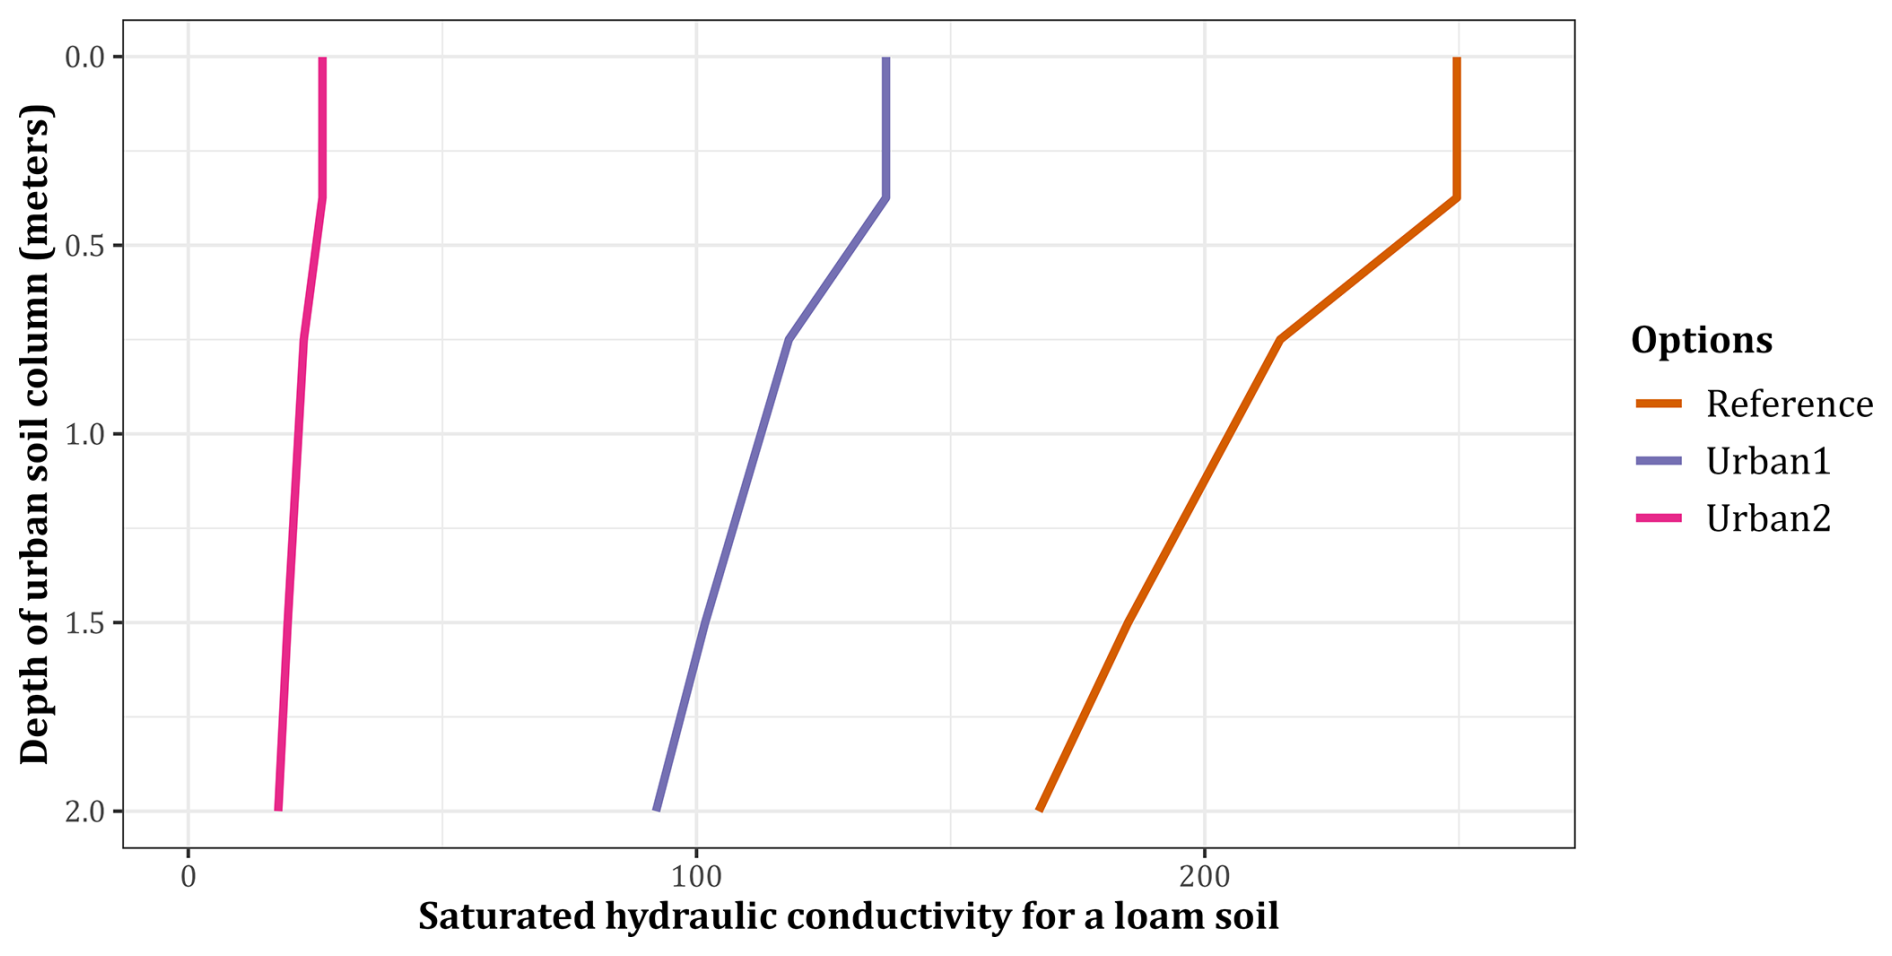
Figure 2Example profiles of saturated hydraulic conductivity for a reference loam soil (in orange) modified by the two options of imperviousness for an imperviousness equal to 0.55, and a reference saturated hydraulic conductivity of 249.6 mm d−1, values as in Ducharne et al. (2018).
2.2.3 Assigning urban thermal properties to urban-dominated grid cells
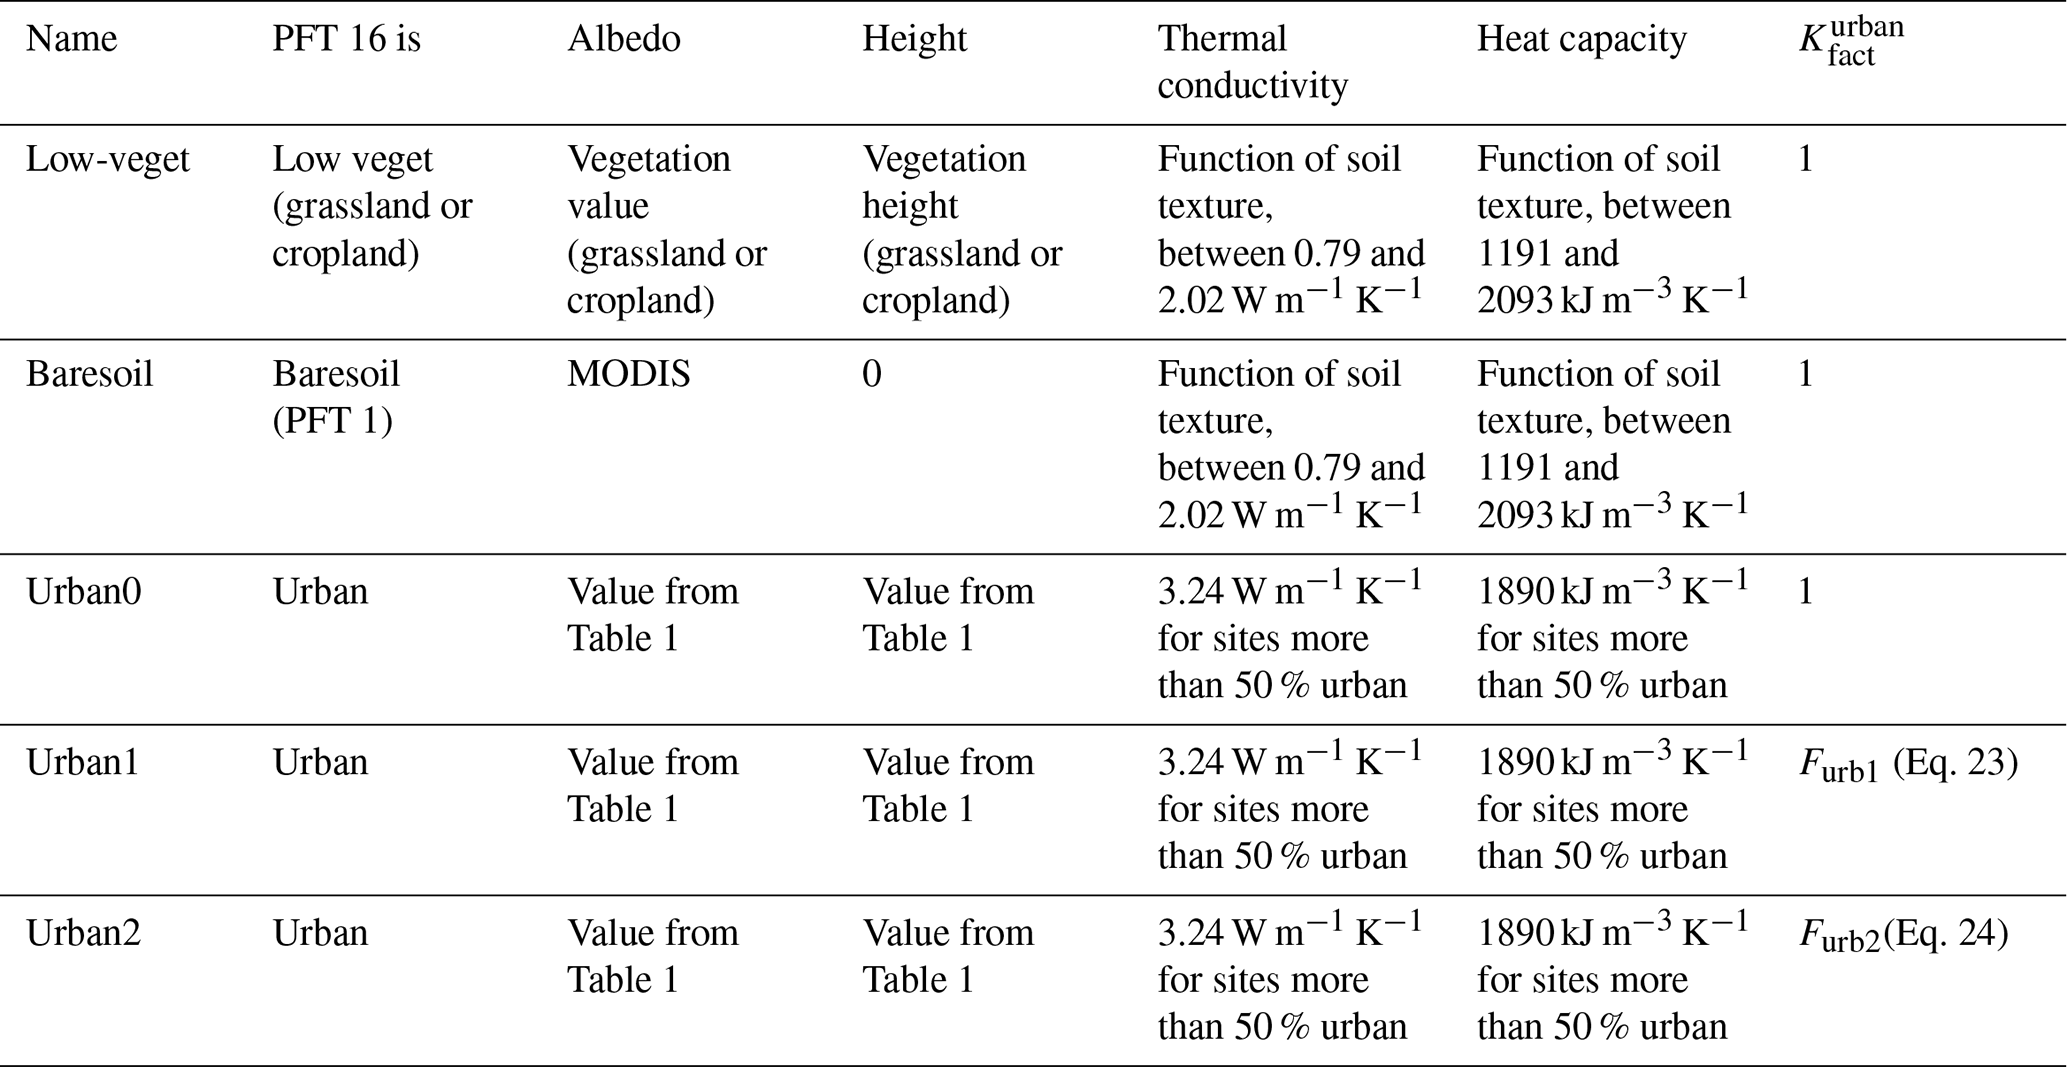
The thermal conductivity (λ) and heat capacity (Cp) of the soil are calculated based on soil textures and soil water content (Eqs. 9 and 10), and are defined at the grid cell scale; they do not depend on PFTs. To take into account the specific urban thermal conductivity and heat capacity, we change the values of λ and Cp for the grid cells where urban areas cover 50 % or more of the grid cell. In grid cells where the urban fraction is below 50 %, the standard ORCHIDEE values calculated from soil texture and soil moisture are retained. This straightforward binary approach (where the grid cell is assigned either fixed urban values for thermal properties, or retains its initial values) was chosen because these variables are defined at the grid cell scale, rather than at the PFT or soil tile scale. The new prescribed values for urban areas are taken from the Noah-MP land surface model (He et al., 2023): thermal conductivity is set to 3.24 W m−1 K−1 and the heat capacity to 1890 kJ m−3 K−1. These fixed values are not adjusted according to urban typology, building morphology, or surface-area density. In comparison, the range of values for grid cells with less than 50 % of urban cover is between 0.79 and 2.02 W m−1 K−1 with a median value of 1.20 W m−1 K−1 for thermal conductivity, and between 1191 and 2093 kJ m−3 K−1 with a median value of 1632 kJ m−3 K−1 for heat capacity. Urban areas therefore exhibit thermal conductivities that exceed those of most other soil textures.
3.1 Experiments
To evaluate the performance of the ORCHIDEE land surface model with the new urban parameterization, including urban albedo, building height, thermal conductivity, heat capacity, and imperviousness, a comprehensive series of 1D standalone simulations is conducted. These simulations are designed to systematically assess the model's sensitivity to these urban parameters in varying climatic and land-use contexts. The simulations are performed across 20 urban flux tower sites (Table 1), sourced from the harmonized gap-filled dataset of Lipson et al. (2022b), part of the Urban-PLUMBER project. For each site, the dataset provides all atmospheric forcing variables needed to force a one-dimensional land surface model, as well as site-level information on urban parameters and land use cover. These sites span 13 different countries and encompass a diverse range of climate zones: 11 sites are in temperate climates, 7 in continental climates, 1 in a tropical climate, and 1 in a dry climate. The Supplement provides a world map of these flux tower sites, including their climates and observed periods (Lipson et al., 2022b). Beyond climatic diversity, these urban sites also represent a wide spectrum of land-use characteristics, ranging from highly urbanized areas to low-density urban zones with significant vegetation cover (e.g., trees, grasslands, or croplands). Table 1 also provides a detailed breakdown of site-specific land-use characteristics. The Minneapolis station features two distinct datasets due to differing dominant wind influences, each capturing different land-cover compositions.
Table 1Sites description with their sites land use and land cover characteristics and soil texture (Lipson et al., 2022b). The surfaces of the Urban, Tree, Low Veget, Bare soil, and Water land covers are expressed in land surface fraction. Clay and sand are expressed as soil-texture fractions, with the remaining fraction corresponding to silt. Building height is expressed in meters, and latitude (Lat) and longitude (Lon) are expressed in decimal degrees (°).

The numerical framework consists of multiple simulations for each urban site, each serving a specific purpose in the model evaluation process. The simulations are categorized into benchmark runs and urban parameterization experiments, as outlined in Table 2. The benchmark simulations are Baresoil and Lowveget. In all simulations, the observed non-urban land-cover fractions of each site, including trees, low vegetation, bare soil, and water, are retained. Only the fraction classified as urban is represented differently among the experiments. In Baresoil, the urban fraction is assigned bare-soil properties, corresponding to the default treatment of urban areas in ORCHIDEE. In Lowveget, the urban fraction is assigned the properties of the dominant low-vegetation type in the surrounding area, either grassland or cropland, providing a non-urban baseline. Three distinct urban configurations are also tested, all incorporating the newly developed urban albedo, building height, thermal conductivity, and heat capacity parameters. The key difference among them lies in the treatment of imperviousness: Urban0 which overlooks the influence of imperviousness on Ks to isolate the influence of energy-related parameters; Urban1 which incorporates the first imperviousness option (Urban1); and Urban2 which implements the second option (Urban2) for comparative assessment. Further details on grid cell albedo and building height used across all simulations and sites are provided in Table S1 in the Supplement. These values correspond to the parameter-aggregated approach described for albedo in Eq. (3). For each site, the model is first spun up for 40 years, using repeated cycles of 10 years of meteorological forcing provided by Urban-PLUMBER, until soil moisture and temperature reach equilibrium. The subsequent simulation period covers 12–16 years depending on the station (excluding spin-up). Fluxes are computed and saved on a 30 min time-step.
3.2 Evaluation strategy
To evaluate the impact of the new urban parameterizations in ORCHIDEE, we compare simulated grid cell averaged fluxes with observed fluxes measured at urban flux tower sites from the Urban-PLUMBER intercomparison (Lipson et al., 2022b). Following the Urban-PLUMBER protocol, the AU-Preston site in Melbourne, Australia, is used as a reference station for detailed evaluation (Lipson et al., 2024). In addition to evaluating the diurnal cycle at AU-Preston, we extend the analysis to 20 urban sites spanning a range of climates and urban fractions. For these sites, we analyse the distribution of daily maximum and minimum fluxes across summer and winter seasons to assess the robustness of model behaviour under contrasting energy balance conditions.
Model performance is quantified using two complementary metrics: bias and mean absolute error (MAE). The bias is defined as the mean difference between simulated and observed fluxes (sim − obs), providing information on systematic over- or underestimation. The MAE is defined as the mean of the absolute differences between simulated and observed fluxes, thereby measuring the overall magnitude of deviations regardless of sign. Bias is computed for sensible heat flux (H), latent heat flux (LE), and net radiation (Rnet), and MAE is computed for sensible and latent heat fluxes. Ground heat flux (G) is also analysed in the model outputs, although no observational data are available for evaluation.
No additional statistical tests are applied, as the focus is on systematic model–observation differences across multiple years of flux tower data. By comparing results across climates and varying degrees of imperviousness, we assess the consistency of model improvements and identify the conditions under which the new scheme performs best.
4.1 Energy budget
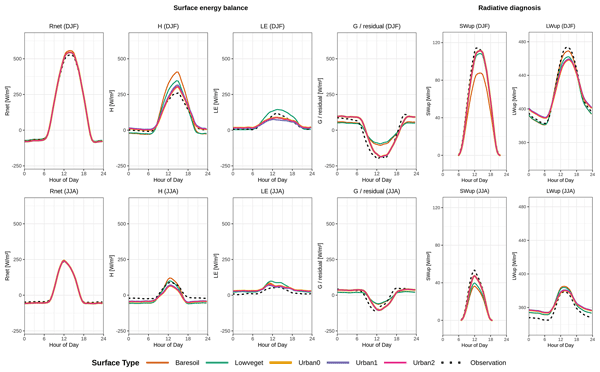
Even without the three-dimensional effects of buildings and the source of anthropogenic heat fluxes, urban areas significantly alter the surface energy budget compared to natural landscapes, typically modifying net radiation, increasing nocturnal sensible heat due to building material, and modifying the partitioning between sensible, latent and ground heat fluxes. To assess whether our model developments accurately capture these differences, we first compare simulated fluxes with observations from the AU-Preston station in Melbourne, Australia (Fig. 3), the reference site used in both Urban-PLUMBER intercomparisons (Best et al., 2015; Lipson et al., 2024).
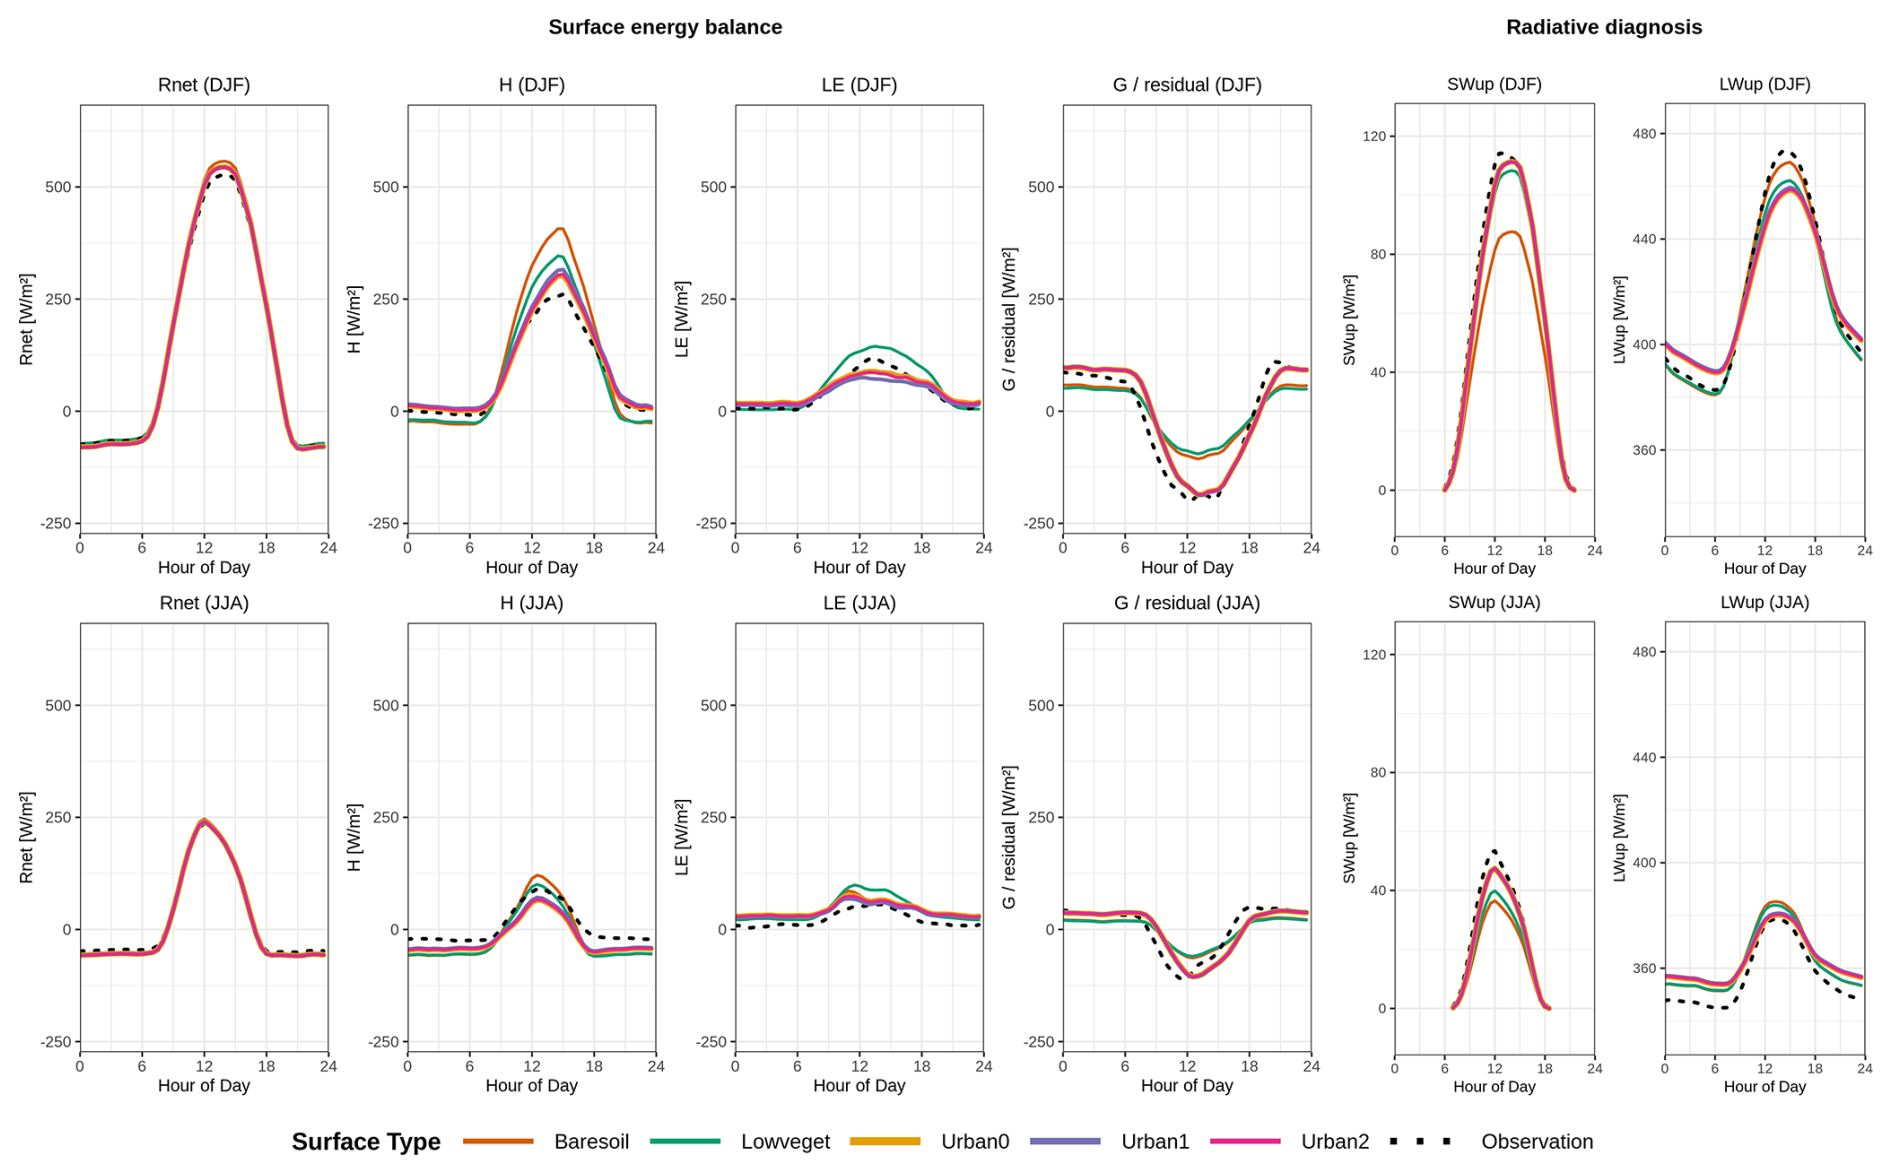
Figure 3Diurnal cycle of net radiation (Rnet), sensible heat (H), latent heat (LE), and ground heat flux (G) during summer months (DJF – first row), and winter months (JJA – second row) of observational period August 2003–November 2004 over the station AU-Preston in Melbourne, Australia, the reference station for the Urban-PLUMBER intercomparison projects. The black line represents the observations at the station, while the coloured lines represent the simulations outputs. G was not measured directly; the observational estimate shown here was diagnosed as the surface energy-balance residual, .
The simulations show small differences in net radiation in both summer and winter (Fig. 3). However, looking at upwelling shortwave (SWup) and longwave (LWup) components reveals compensating differences among the configurations. The grid-cell albedo increases from 0.110 in Baresoil and 0.131 in Lowveget to 0.141 in Urban0, Urban1, and Urban2. The albedo values discussed here correspond to the effective grid-cell albedo used to calculate net radiation, rather than to the albedo assigned to an individual PFT. The grid-cell albedo is calculated as the land-cover-fraction-weighted mean of the PFT-level albedos. Because of this increase, the urban configurations reflect more shortwave radiation than the benchmark simulations: Baresoil produces the lowest SWup, Lowveget intermediate values, and the three urban configurations the highest values. The urban configurations also modify the diurnal cycle of upwelling longwave radiation. Relative to Baresoil and Lowveget, they emit less longwave radiation around midday and more during the night, particularly in summer. This pattern indicates a reduced diurnal amplitude of surface radiative temperature and is consistent with the greater effective thermal inertia resulting from the changes in heat capacity and thermal conductivity. For the ground heat flux, urban simulations exhibit lower negative daytime values (more heat entering the column) and higher nighttime values (more heat released). More specifically, the Baresoil and Lowveget simulations produce overlapping curves, and the three urban configurations (Urban0, Urban1, and Urban2) likewise lie nearly on top of each other. These changes in LE, H and G, can be interpreted as a result of increasing heat storage capacity and thermal conductivity of urban surfaces. A higher Cp tends to reduce G, as it increases the amount of energy required to raise the temperature of the soil, leading to slower energy transfer into the ground. However, higher λ increases the rate at which heat is conducted into the ground, thereby increasing G. This increase in G consequently reduces the portion of energy available for sensible and latent heat fluxes at the surface, leading to lower energy partitioning towards atmospheric processes. Additionally, the three urban scenarios exhibit negligible differences, indicating that the representation of imperviousness has limited influence on the energy budget at AU-Preston.
When evaluated against the observations, all simulations slightly overestimate Rnet around midday in summer. The radiative decomposition indicates that the urban albedo parameterization corrects most of the shortwave contribution to this bias; in the urban configurations, the remaining positive Rnet bias is therefore mainly associated with an underestimation of upwelling longwave radiation around midday. However, the three urban scenarios (Urban0, Urban1, and Urban2) better reproduce the observed summer sensible heat flux, both at night (close to zero) and during the day. Despite this improvement, they still overestimate daytime sensible heat flux, which is likely related to the overestimation of Rnet. These three urban scenarios still underestimate daytime sensible heat flux in winter. The comparable negative bias in H and positive bias in LE suggests that the main issue lies in the simulated partitioning of available energy between sensible and latent heat fluxes. Latent heat fluxes are reduced during the day but enhanced at night in urban simulations, with stronger imperviousness further reducing daytime values due to limited water availability. This diurnal contrast arises because, during the day, available energy is high but evaporation is limited by water availability, whereas at night, the release of heat stored in urban materials maintains relatively warm surface temperatures, allowing residual moisture to evaporate, which enhances the latent heat flux compared to natural surfaces. However, this effect is minor compared to other flux modifications. In winter, all simulations overestimate latent heat, though these discrepancies remain small relative to other energy fluxes. In summer, Baresoil and Lowveget underestimate the magnitude of daytime heat storage, as their simulated G values are less negative than the observational energy-balance residual. The urban configurations reproduce the observed daytime magnitude more closely, although their slightly more negative values indicate an overestimation of heat storage. At night, the urban configurations also agree more closely with the observational residual, but their more positive values suggest that nocturnal heat release is overestimated. This comparison remains qualitative because the colored curves represent the ground heat flux explicitly calculated by ORCHIDEE (Eq. 7), whereas the black curve is an energy-balance residual rather than a direct observation of G. The observational residual may additionally include contributions from unaccounted anthropogenic heat and net horizontal advective transport, as well as errors associated with measurement uncertainty.
To extend the analysis beyond a single location and assess whether the findings at AU-Preston are representative of broader conditions, we now examine 20 stations spanning different climates and urban covers. This allows us to evaluate whether the sign and magnitude of the model biases identified at AU-Preston (Fig. 3) are consistent across sites. Figure 4 presents the distribution of biases between maximum and minimum daily values of simulated and observed net radiation, sensible heat, and latent heat for winter and summer, two seasons with contrasting surface energy dynamics over the 20 urban sites. For each site, simulation, season, and flux, the daily simulated-minus-observed differences are calculated using only matching model–observation timestamps and are then averaged over all valid days. Each site therefore contributes one value to each boxplot, so that all sites are weighted equally regardless of the length of their observational record. Because the characteristic magnitudes differ among fluxes and between daytime maxima and nighttime minima, the absolute bias magnitudes should not be interpreted as a direct ranking of relative model performance across panels. The comparisons below focus primarily on differences among model configurations within each diagnostic. This approach highlights model performance during both daytime and nighttime phases of the diurnal cycle.
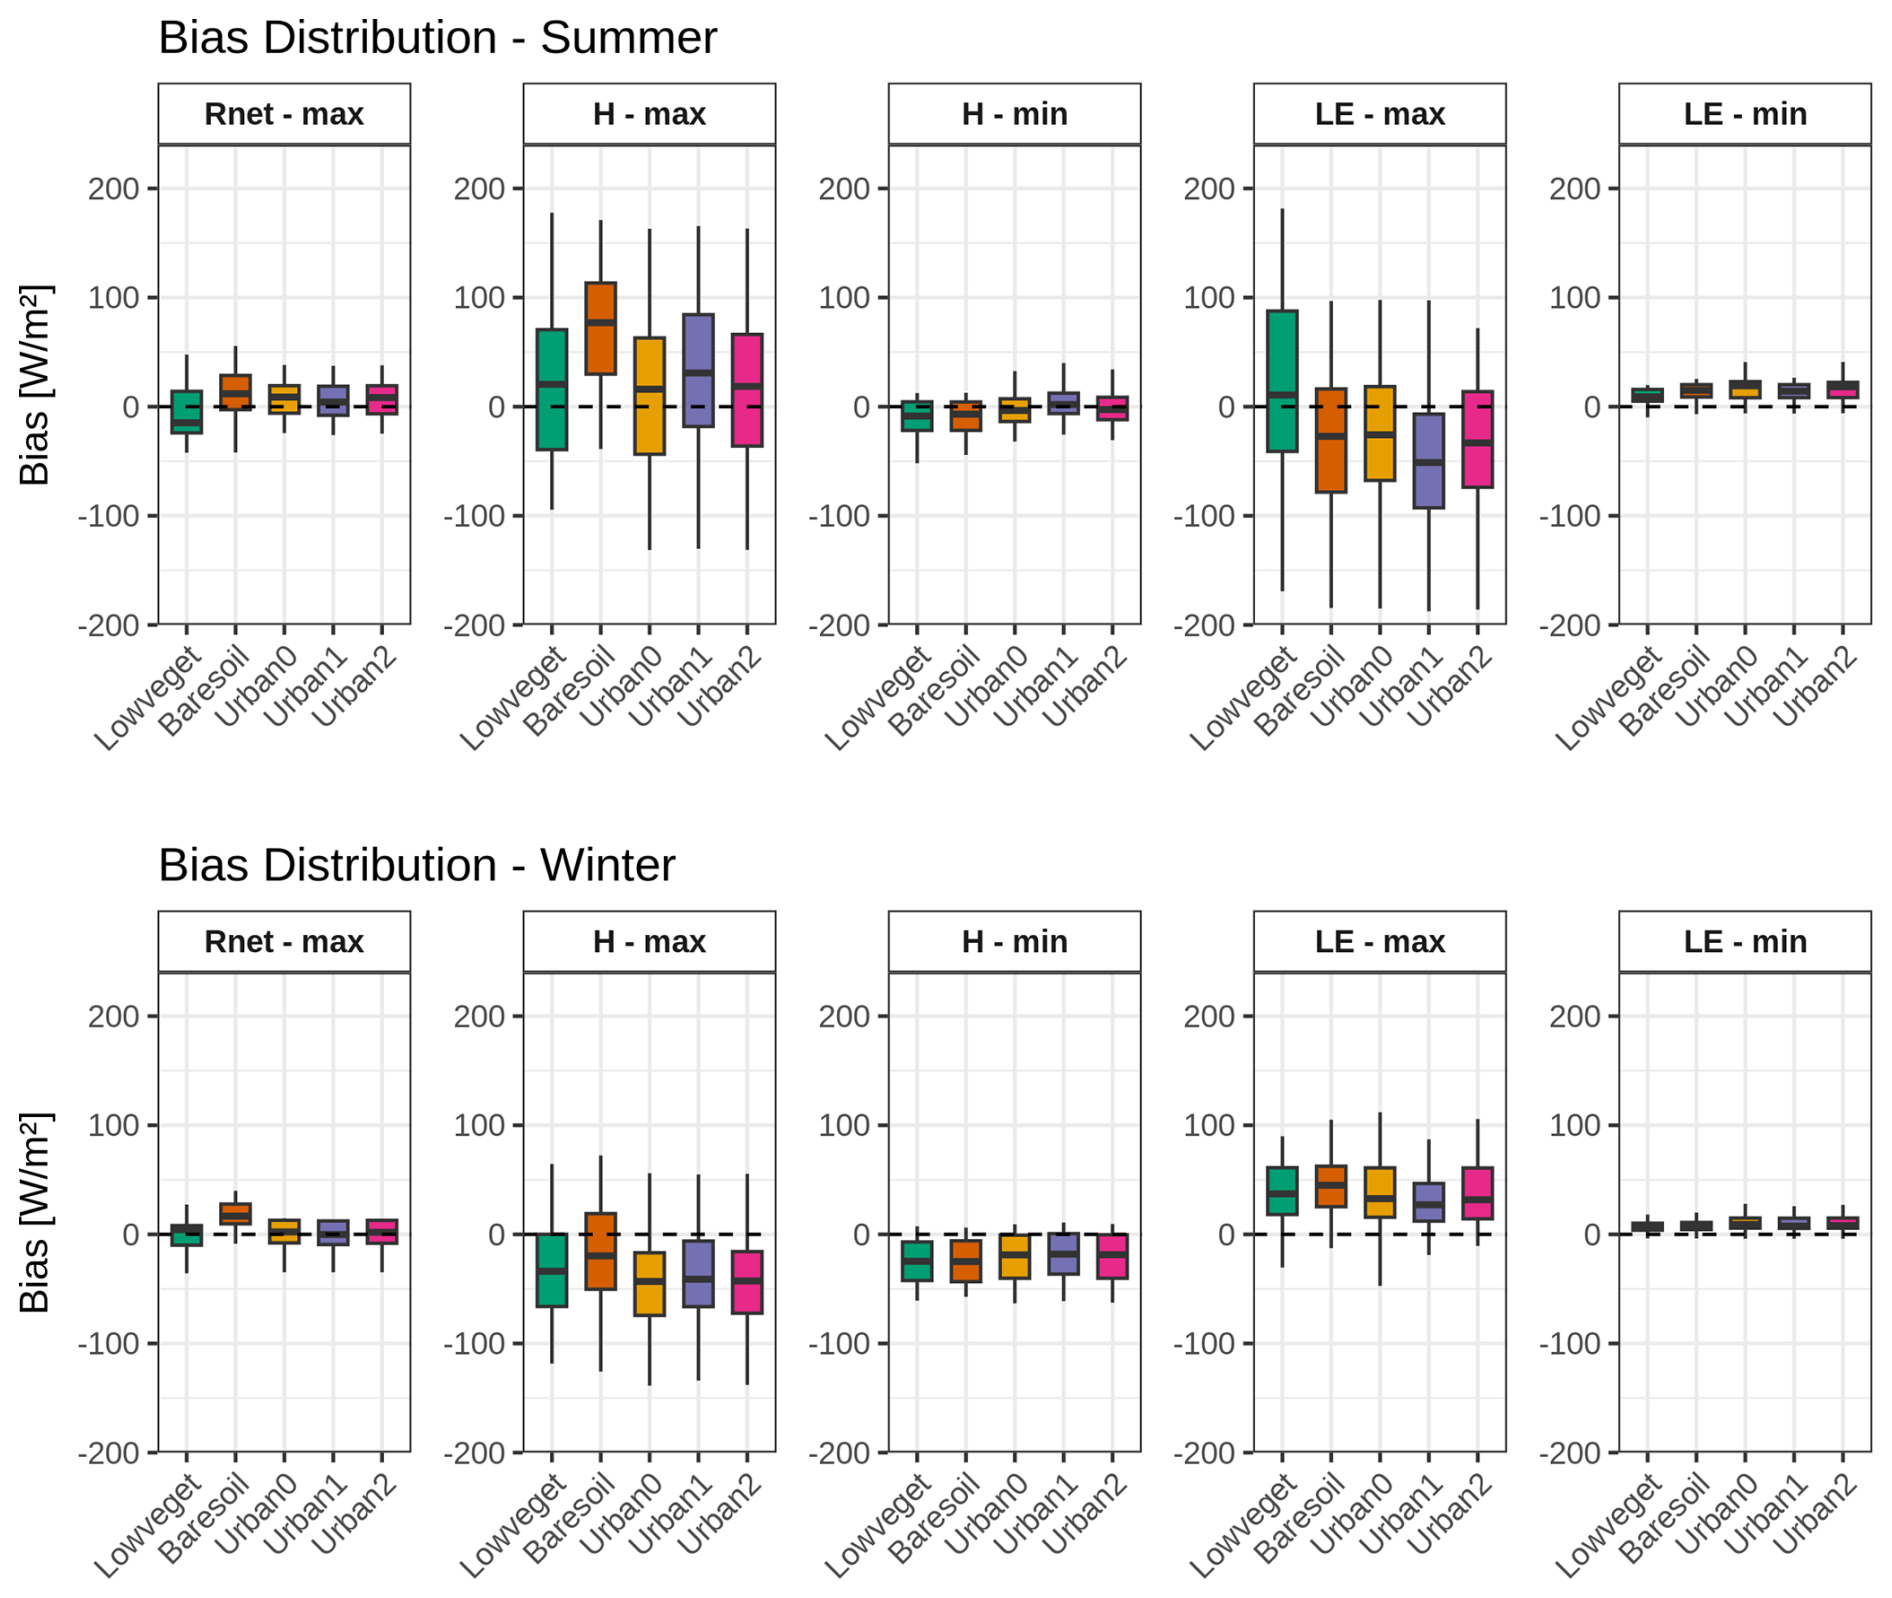
Figure 4Distribution of mean bias in simulated daily maximum and minimum surface energy fluxes (sensible heat H, latent heat LE, and maximum net radiation Rnet) during summer (first row) and winter (second row) months (DJF/JJA based on hemisphere) across the 20 urban sites. For each boxplot, the central horizontal line indicates the median, the lower and upper edges of the box indicate the 25th and 75th percentiles, respectively, and the whiskers extend to the most extreme values within 1.5 times the interquartile range (IQR). The dashed horizontal line indicates zero bias.
For maximum daily net radiation, the Urban simulations exhibit less bias across the stations, indicating an improvement brought by specifying the observed urban albedo (see Supplement for grid cell albedo differences across the stations and simulations). In contrast, the Baresoil and Lowveget simulations show biases with more variability, with an overestimation by Baresoil simulations in winter and an underestimation by Lowveget simulations in summer.
The different parameterizations used in the model configurations lead to the largest differences for the maximum daily sensible heat flux. During the summer, the Baresoil simulations have a more pronounced overestimation compared to the urban simulations, showing a median bias close to 77 W m−2. In contrast, the Urban0 and Urban2 simulations have a bias distribution centered closer zero (respectively having a median bias of 14 and 18 W m−2), and 50 % of biases between 66 and −36 W m−2. The substantial change in simulated sensible heat is due to increased thermal conductivity in urban simulations, as already seen in Fig. 3. However, many simulations do not match the maximum daily observed sensible heat as closely as for AU-Preston, although the biases are significantly reduced. The Urban2 simulation introduces only minor changes compared to the Urban0 simulation for sensible heat. Urban1, on the other hand, increases the bias compared to Urban0 and Urban2 during summer, but still brings improvement compared to Baresoil. Still, all simulations tend to overestimate sensible heat, the bias exceeding 150 W m−2 at some stations. The largest summer sensible heat flux biases are common across the Baresoil, Lowveget, and Urban simulations. Additional sensitivity experiments indicate that they are partly related to underestimated ground heat uptake associated with the representation of soil thermal properties: prescribing higher thermal conductivity and heat capacity substantially reduces the biases at most affected sites, all of which have urban fractions below 50 %, highlighting the soil thermal parameterization as an important target for future ORCHIDEE development (Verhoef et al., 2026). In winter, maximum daily sensible heat is generally underestimated across the simulations. Baresoil has the least negative bias, although its bias distribution remains relatively broad, while Lowveget and the Urban simulations show similarly negative biases. This similarity suggests that the winter underestimation of sensible heat cannot be primarily attributed to the increased thermal conductivity introduced in the urban configurations. At the same time, all simulations show a positive bias in maximum latent heat flux, indicating that excessive partitioning of the available energy toward latent heat may contribute to the negative sensible heat bias. The absence of anthropogenic heat fluxes from the simulations may additionally contribute to the underestimation at some highly urbanized sites. For example, Urban-PLUMBER reports mean anthropogenic heat fluxes of 78.5 W m−2 at UK-KingsCollege and 92.7 W m−2 at KR-Jungnang.
Minimum sensible heat flux, which corresponds to the nocturnal sensible heat flux, is generally higher in cities than in natural areas due to the release of stored heat accumulated during the day and the persistence of heat transfer by convection at night. As expected, both in winter and summer, Baresoil and Lowveget simulations exhibit a negative bias, meaning they simulate nocturnal sensible heat that is too low. The Urban0, Urban1, and Urban2 simulations lead to improvements in the simulation of nocturnal sensible heat flux. Furthermore, the Urban1 simulation, which includes stronger imperviousness, further improves the representation of nocturnal sensible heat during both seasons. Still, Urban0, Urban1, and Urban2 show negative bias in minimum sensible heat fluxes in winter. This underestimation is unlikely to be primarily explained by latent heat flux, for which nighttime biases remain comparatively small. It may instead partly reflect an insufficient release of stored heat at night, as well as missing anthropogenic heat fluxes at highly urbanized sites.
Looking at maximum latent heat flux, Fig. 4 shows a clear seasonal contrast. In winter, biases are positive for all simulations, indicating an overestimation of daytime latent heat flux. In summer, biases are instead generally negative, indicating an underestimation of maximum latent heat flux, although the distributions remain broad and span both positive and negative values across stations. The summer underestimation may partly result from an insufficient representation of active vegetation and from the absence of irrigation in the model. This interpretation is supported by the Lowveget simulation, whose median summer bias is close to zero and which also shows a maximum sensible heat flux bias centered around zero. However, the distribution of Lowveget latent heat biases remains very broad across stations, suggesting that highly local factors such as vegetation characteristics, vegetation management, and irrigation, which are not explicitly represented by the model configuration, strongly influence latent heat flux. The Urban0 and Urban2 simulations show only limited differences compared with Baresoil. In contrast, Urban1, with stronger imperviousness and therefore lower water availability for evapotranspiration, further increases the summer underestimation while reducing the winter overestimation. Biases in minimum latent heat flux are comparatively small but consistently positive in both seasons across all simulations, indicating an overestimation of nocturnal latent heat flux.
Overall, the urban configurations improve the representation of the surface energy balance through both a better simulation of net radiation and changes in energy partitioning. In summer, the large overestimation of maximum sensible heat flux in Baresoil appears to arise from combined biases: net radiation is imperfectly represented, while both daytime heat storage and latent heat flux are underestimated, leaving too much of the available energy to be transferred as sensible heat. The Urban configurations improve net radiation and substantially improve the representation of daytime heat storage, which strongly reduces the sensible heat bias. Maximum latent heat flux, however, remains generally underestimated, suggesting that evapotranspiration, including the representation of local vegetation characteristics and irrigation, is an important remaining source of error. In contrast, the Urban configurations do not improve sensible heat in winter, they exhibit a systematic underestimation of maximum sensible heat, consistent with an overestimation of maximum latent heat flux. Despite this limitation, the urban configurations systematically improve nocturnal sensible heat in both seasons relative to Baresoil and Lowveget.
4.2 Mean Absolute Errors of latent and sensible heat fluxes over the 20 urban flux towers
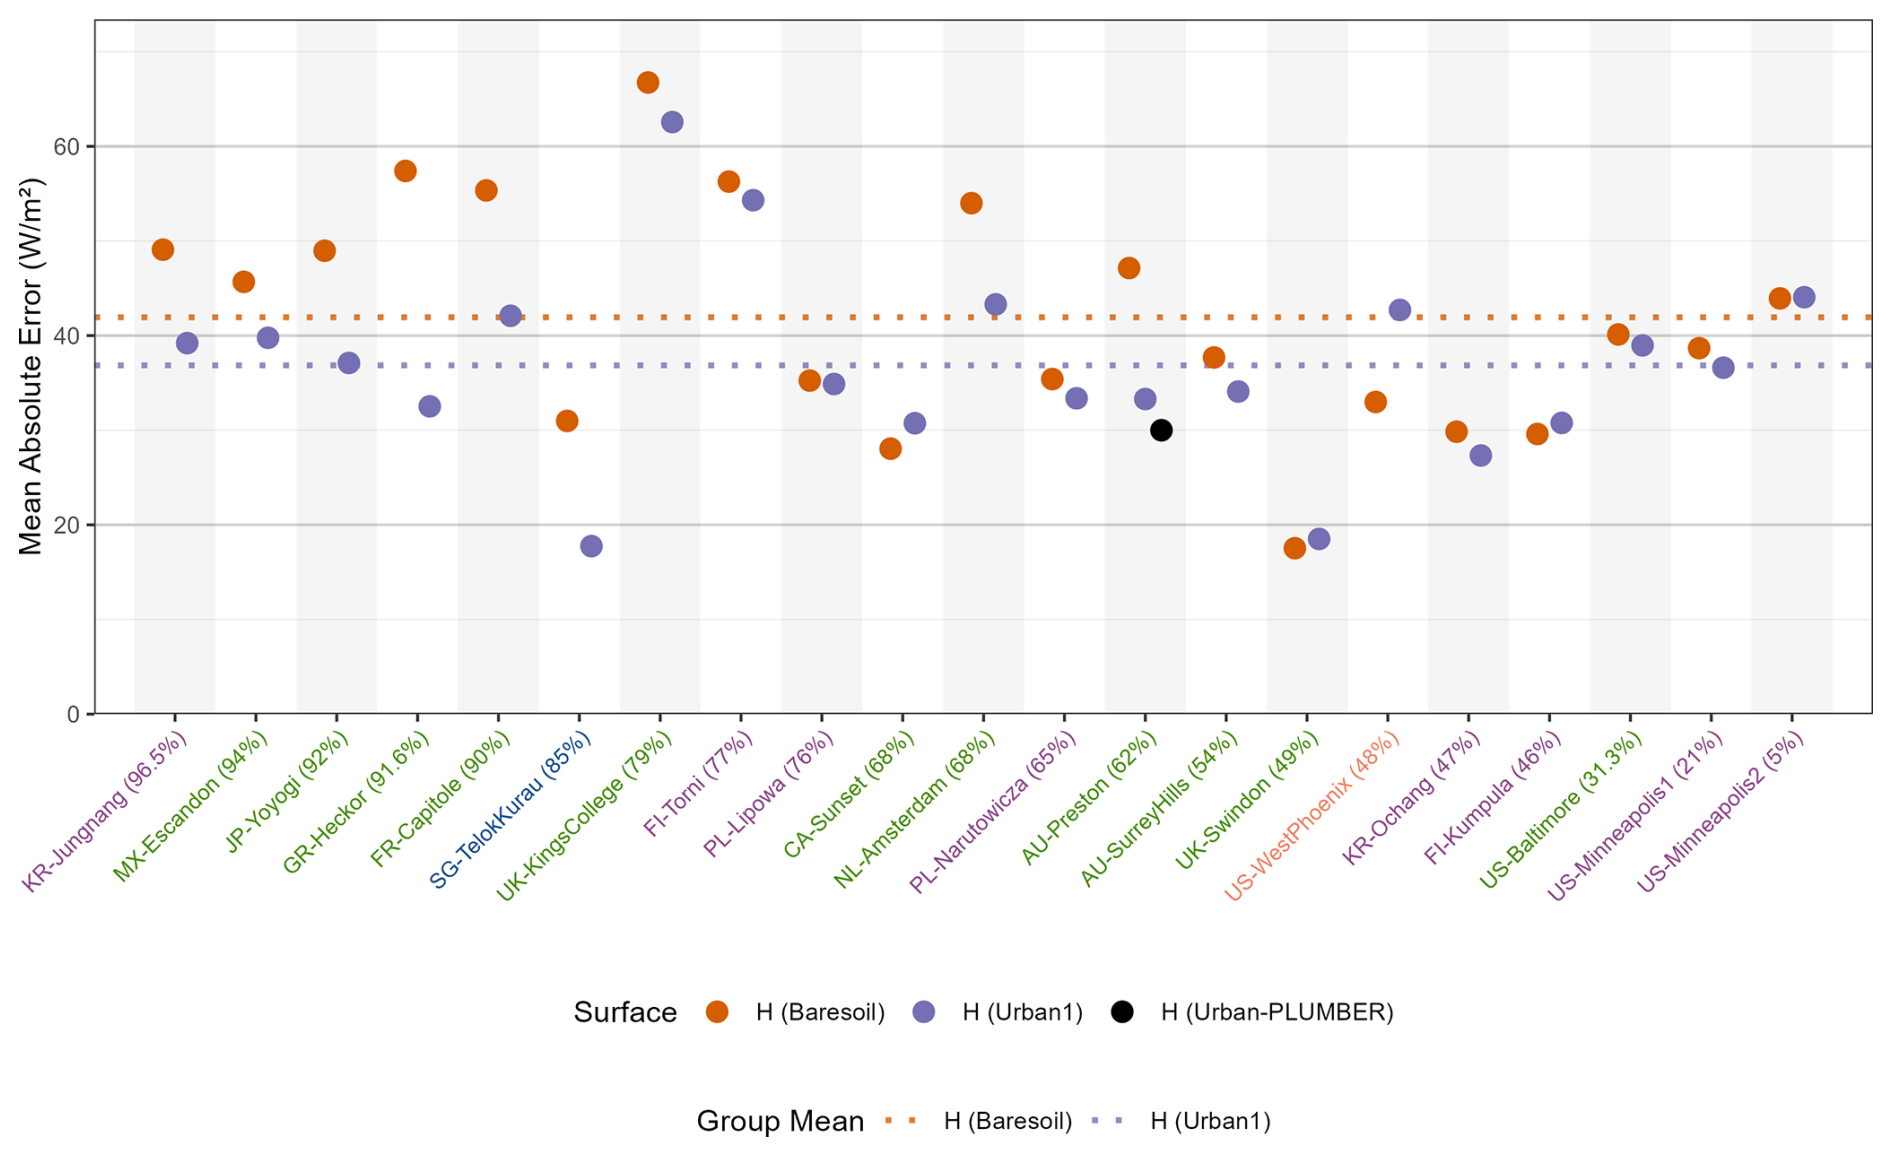
Following the Urban-PLUMBER intercomparisons (Best et al., 2015; Lipson et al., 2024), we evaluate model performance using the mean absolute error (MAE), which quantifies the average deviation between simulated and observed fluxes. We compare the MAE of the Baresoil simulation (representing the original, non-urbanized version of ORCHIDEE) with that of the Urban1 simulation, which incorporates the new urban parameterizations based on findings from the previous sections. Figures 5 and 6 present the MAE for latent and sensible heat fluxes respectively across the 20 urban flux tower sites for both simulations. On average across all sites, the Urban1 simulation outperforms the Baresoil simulation for both latent heat (by 2.9 W m−2) and sensible heat (by 5.1 W m−2). At the individual station level, Urban1 improves the MAE for latent heat at all sites. For sensible heat, improvements are also seen at nearly all sites, except for CA-Sunset, US-WestPhoenix, UK-Swindon, and FI-Kumpula, where performance is slightly degraded. Detailed analysis suggests that these degradations arise from site-specific changes in energy partitioning. At FI-Kumpula and US-WestPhoenix, improvements in net radiation are not accompanied by sufficient partitioning toward latent heat and/or heat storage, resulting in increased sensible heat flux. Their urban fractions (46 % and 48 %, respectively) lie just below the 50 % threshold used to activate the prescribed urban thermal conductivity and heat capacity. Consequently, the urban configurations modify the radiative and aerodynamic properties at these sites without activating the corresponding increase in substrate thermal inertia, which may contribute to insufficient daytime heat storage and the degradation in sensible-heat-flux performance. The new urban developments significantly improve performance at previously poorly performing sites, such as GR-Heckor (−25 W m−2), Au-Preston (−14 W m−2), and FR-Capitole (−13 W m−2) for sensible heat, and SG-TelokKurau (−15 W m−2) for latent heat. However, substantial biases remain at some locations, such as SG-TelokKurau and UK-KingsCollege, where sensible heat remains underestimated in both the Baresoil and Urban1 simulations. Including anthropogenic heat fluxes in future model versions may help to address these biases. Figures 5 and 6 also display the mean MAE values for sensible and latent heat from the latest Urban-PLUMBER intercomparison (Lipson et al., 2024) at AU-Preston, representing ensemble model performance using site-specific information. The results show that ORCHIDEE, with the new urban developments, achieves performance comparable to Urban-PLUMBER models for sensible heat flux, whereas further improvements are needed to reach comparable performance for latent heat flux.
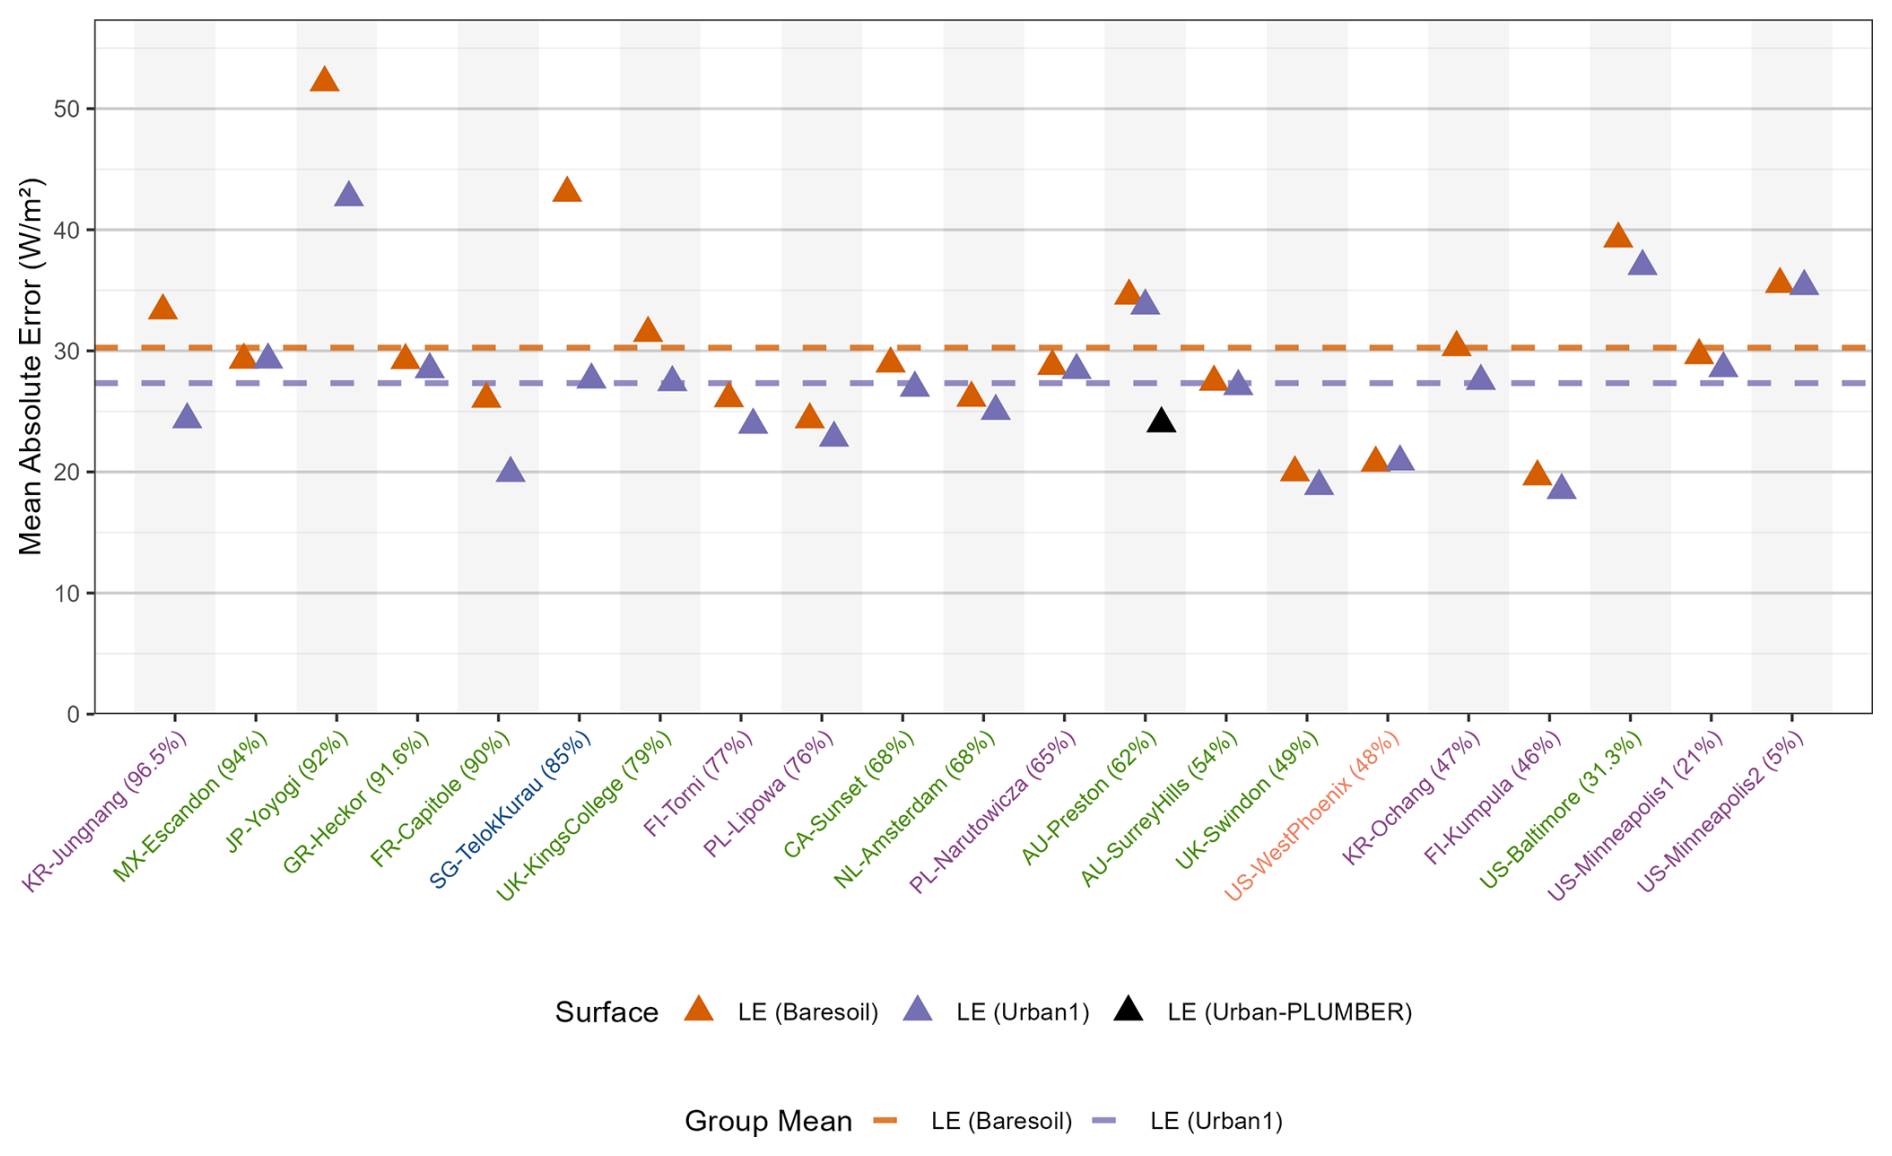
Figure 5Mean Absolute Error (MAE) of latent heat fluxes (LE) over the 20 urban tower fluxes for the Baresoil and Urban1 simulations. The Urban-PLUMBER value (one black triangle) corresponds to the median Mean Absolute Error of latent heat flux from the “all – detailed” experiment shown in Fig. 6 of Lipson et al. (2024). The colours of the station's labels along the x-axis indicate the climate of station: green for Temperate, purple for Continental, orange for Dry, and blue for Tropical. The percentage in these labels indicates the urban fraction around the station. The dashed horizontal lines indicate the mean MAE across all stations, shown in orange for Baresoil and in purple for Urban1.
4.3 Annual water budget
In addition to altering the surface energy budget, urban areas also modify the surface water budget. Most notably, urbanization tends to increase surface runoff and decrease evapotranspiration, as reflected in the reduced latent heat fluxes discussed in the previous section. While 1D simulations are valuable for comparing simulated fluxes with tower-based flux observations from the Urban-PLUMBER dataset, there are no corresponding observations of soil moisture or runoff available at these stations. Therefore, we limit our analysis to a comparison of the mean annual water budget between the natural surface simulations (Lowveget and Baresoil) and the Urban simulations that include impervious surfaces (Urban1 and Urban2). Figure 7 presents the mean annual water budget across the 20 stations for the four simulations. In addition to climate, initial soil textures and the total amount of annual precipitation (visible in Fig. 7 as the sum of evapotranspiration, surface runoff, and subsurface runoff) and the precipitation characteristics (not visible in Fig. 7, e.g., short intense events vs. long-duration low-intensity rainfall, convective vs. stratiform) also influence differences in the annual water budget between stations. Because runoff and subsurface-runoff observations are unavailable at these sites, this analysis should be interpreted as a sensitivity assessment rather than a validation of hydrological performance. Evaluating the simulated runoff would require spatially distributed simulations over instrumented urban catchments and comparison with observed streamflow, which is beyond the scope of this study.
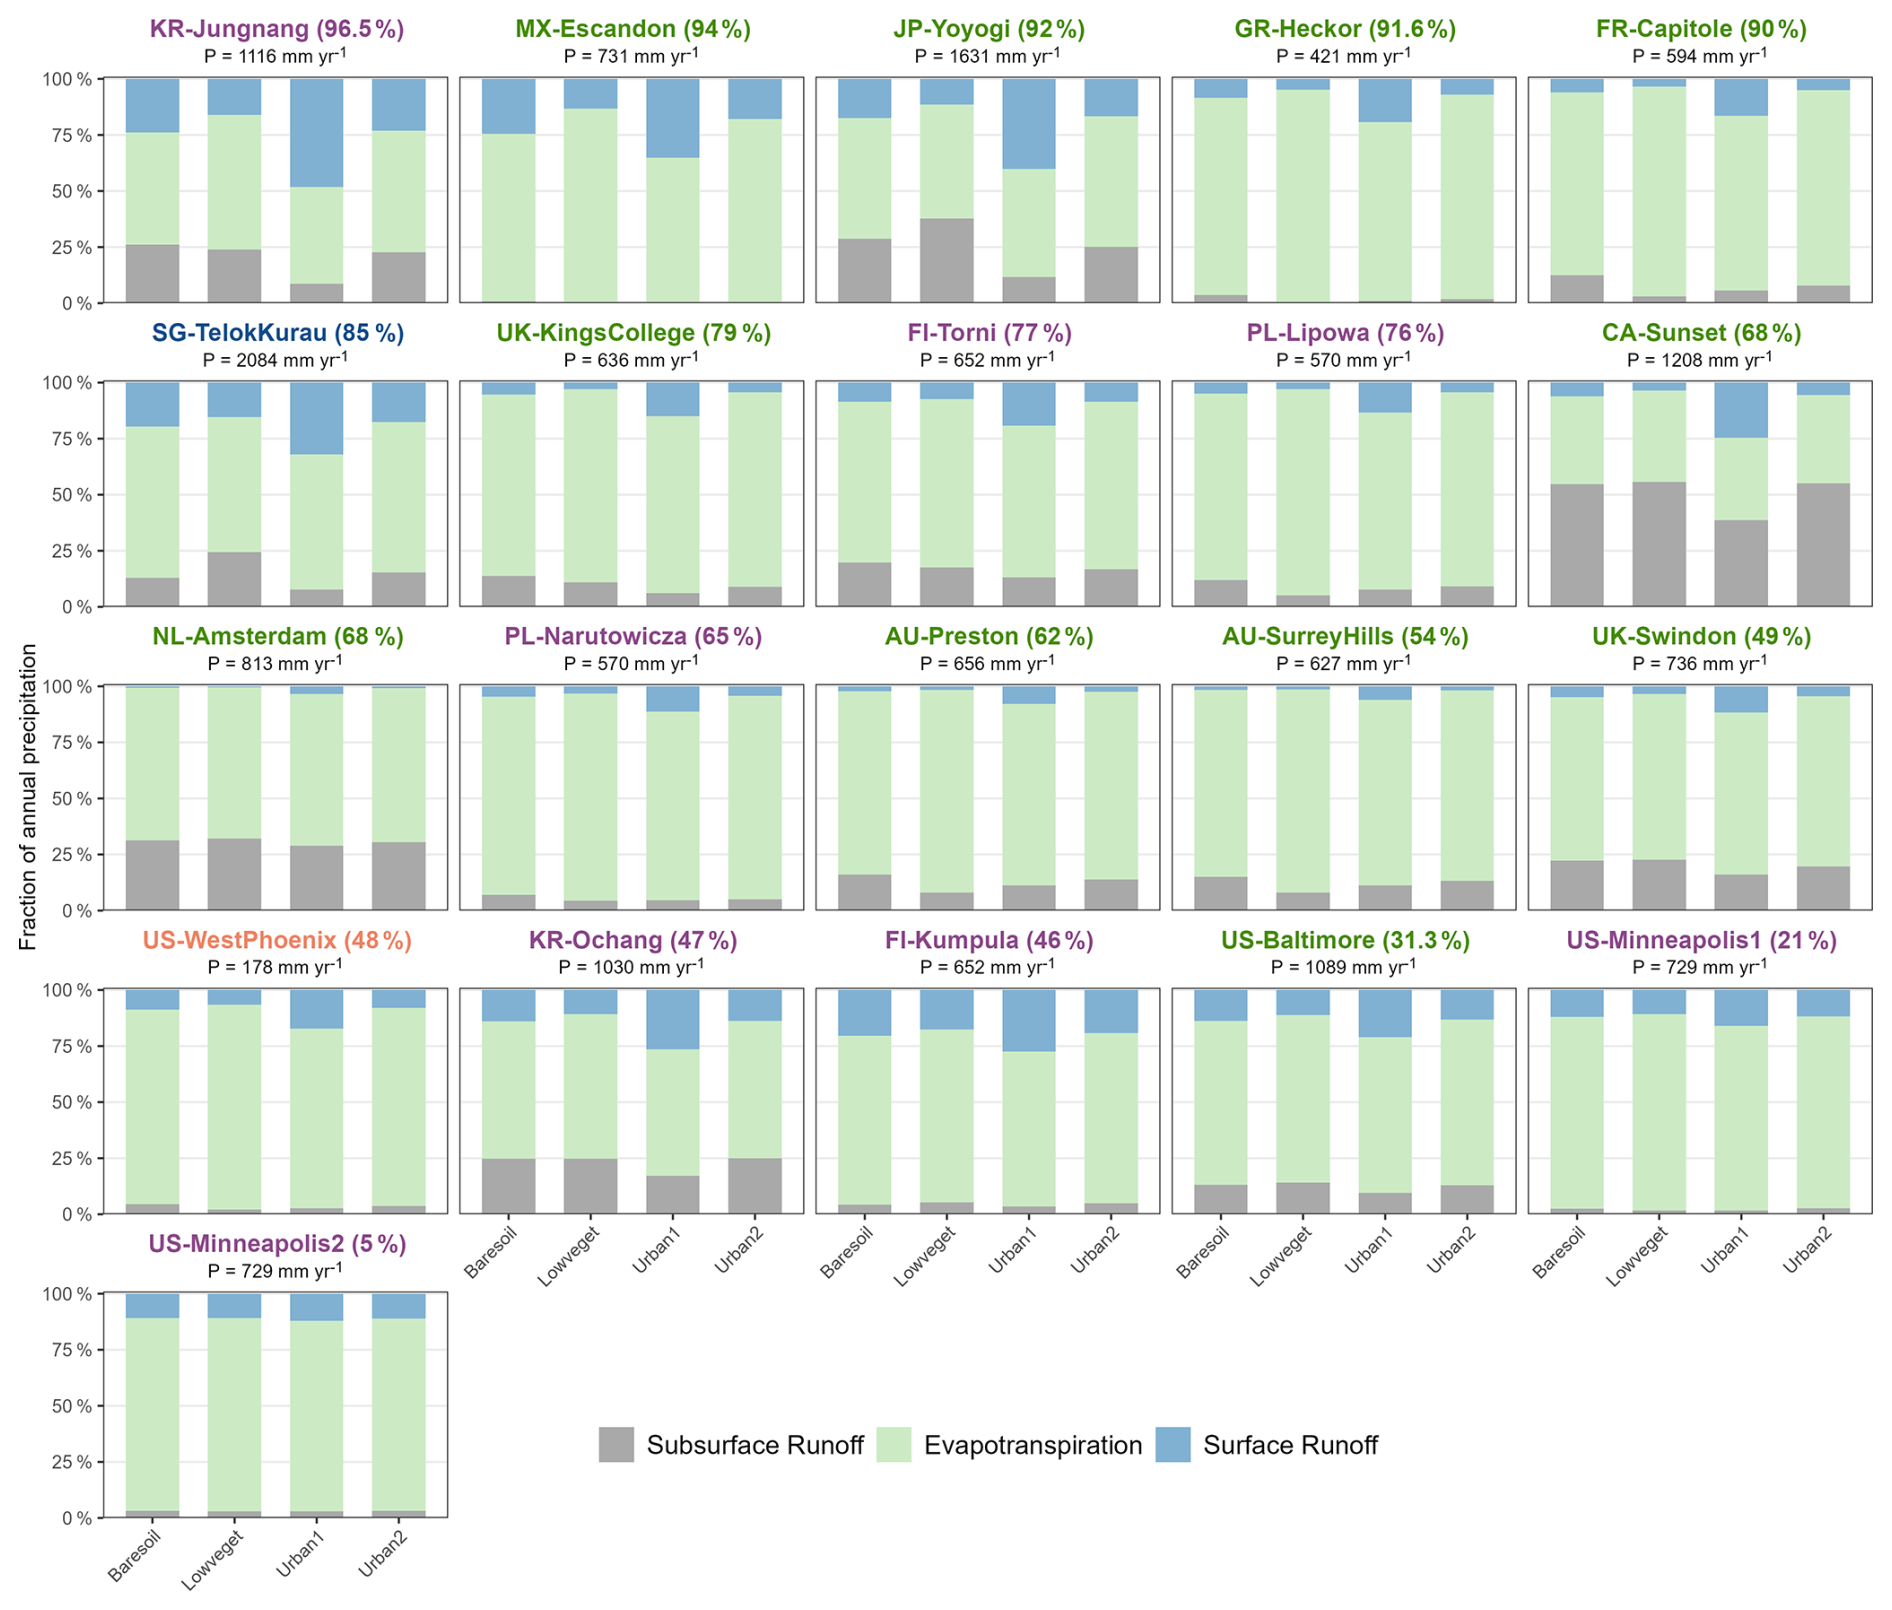
Figure 7Mean annual partitioning of precipitation into evapotranspiration, surface runoff, and subsurface runoff for each site and simulation. Each stacked bar represents the three components as fractions of mean annual precipitation. Mean annual precipitation is indicated above each panel. Simulated years depend on station (12–16 years). Titles' colours indicate the climate of station: green for Temperate, purple for Continental, orange for Dry and blue for Tropical. Percentage in title indicates the urban coverage around the station.
Looking at the natural land cover simulations (Baresoil and Lowveget), most stations show a water budget dominated by evapotranspiration, except in Canada, where subsurface runoff dominates. This is likely due to energy limitations rather than water availability, which constrains evapotranspiration at that site. In the Urban2 simulation, evapotranspiration is generally not changed compared to the Baresoil simulation (+1.1 %), but slight increases are observed at some stations (e.g., JP-Yoyogi and FI-Torni), while a decrease is found at the tropical site SG-TelokKurau. The small increases may be linked to enhanced nocturnal latent heat flux, as discussed in the previous section, where redistributed energy from deeper soil column during the night can contribute to evaporation.
The Urban1 simulation, which includes a higher degree of imperviousness, consistently shows a reduction in evapotranspiration (−7.6 %) compared to the Baresoil simulation across all stations. However, the dominant changes in the annual water balance introduced by the Urban simulations are not related to evapotranspiration, but rather to surface and subsurface runoff. In the natural land cover simulations, subsurface runoff exceeds surface runoff at more than half of the stations (11 out of 20), while the remaining stations (9) show higher surface than subsurface runoff. The Urban1 simulation, which assumes higher imperviousness, reverses this ratio by significantly reducing subsurface runoff and increasing surface runoff. Only five stations under this scenario still show subsurface runoff exceeding surface runoff. In addition to altering the ratio, Urban1 doubles the annual surface runoff at most stations. The Urban2 simulation, which represents a more moderate reduction in saturated hydraulic conductivity, generally increases surface runoff and decreases subsurface runoff, although the magnitude of these changes is much smaller than in Urban1. However, the response is not consistent across all sites: Urban2 slightly increases subsurface runoff at KR-Ochang and SG-TelokKurau and decreases surface runoff at FI-Torni and FI-Kumpula. These site-dependent changes indicate that the annual water-budget response to a moderate conductivity reduction is not necessarily monotonic. Although saturated hydraulic conductivity is scaled linearly with imperviousness, the resulting water-budget response may be nonlinear because runoff generation and vertical water transfer depend on infiltration thresholds, rainfall intensity, antecedent soil moisture, soil texture, evapotranspiration, and changes in soil-water storage. These results suggest that representing saturated hydraulic conductivity as a function of imperviousness yields physically consistent outputs only when conductivity is strongly reduced, as in the Urban1 hypothesis, but not when the reduction is moderate, as in Urban2.
This work represents a first step in integrating urban areas into the ORCHIDEE Land Surface Model. By introducing several key developments, this research has laid the foundation for more accurate urban representation within the model, thereby advancing our ability to simulate urban-climate interactions. In terms of surface energy budgets, the new developments produced increased night-time sensible heat flux, decreased day-time sensible heat flux, reduced latent heat flux, and increased ground heat flux with heat released at night, leading to higher night surface temperatures. This is consistent with the established urban surface-energy-balance framework (Loridan and Grimmond, 2012; Oke, 1988). These changes, together with the reduced biases relative to observations at urban flux-tower sites, confirm that the new urban scheme provides a more realistic representation of turbulent fluxes. The Urban-PLUMBER intercomparison similarly found that relatively simple slab schemes can perform well when vegetation, water availability, and imperviousness are adequately represented, indicating that model skill is not determined by geometric complexity alone (Lipson et al., 2024). In the water budget, the influence on total evapotranspiration and total runoff remains modest; however, the scheme substantially modifies the partitioning between surface and subsurface runoff. This shift is particularly important in urban environments, where enhanced surface runoff and reduced subsurface runoff are key drivers of rapid hydrological responses.
Despite the implemented urban developments, the simulations exhibit persistent seasonal biases. Most notably, during summer, urban simulations show an overestimation of daily sensible heat flux and an underestimated latent heat flux, indicating that too much of the available energy is partitioned into sensible rather than latent heat. This high-sensible-heat, low-latent-heat bias is a recognized limitation of urban land-surface models and has been associated with the omission or insufficient representation of urban vegetation and water availability (Best and Grimmond, 2015). Indeed, latent heat flux remains underestimated by many current urban models (Lipson et al., 2024). In winter, the daytime bias reverses, with an underestimated sensible heat and an overestimated latent heat. The absence of anthropogenic heat in the current scheme may contribute to the winter underestimation of sensible heat, as its representation has been identified as important for simulating wintertime urban energy budgets (Hertwig et al., 2020; Jin et al., 2021; Karsisto et al., 2016). Future work will test whether prescribing anthropogenic heat fluxes from observation-based gridded datasets can reduce this bias in kilometer-scale simulations. On the contrary, the winter overestimated latent heat is not consistently reported across other models (Lipson et al., 2024) and may therefore reflect ORCHIDEE-specific seasonal controls on evaporation and water availability. At night, sensible heat also remains underestimated in winter, while latent heat exhibits smaller positive biases in both seasons. The bias pattern displayed by this new urban representation therefore suggests that evaporation is insufficient in summer, when urban vegetation and irrigation are most active, but insufficiently constrained in winter and at night. A potential development for ORCHIDEE would therefore be to embed an active vegetated fraction, including seasonal phenology, directly within the urban PFT. This would allow urban vegetation, and potentially irrigation, to enhance transpiration during the summer while limiting vegetation-related evaporation during winter.
These biases should also be considered alongside the inherent uncertainties in flux-tower measurements, which often include some degree of energy-balance non-closure (Mauder et al., 2020). This context helps frame, though does not fully explain, the model–observation differences. Several avenues for improving the one-tile urban scheme developed here emerge thus as clear perspectives. First, the evaluation of ground heat flux (G) revealed strong sensitivity to parameter choices, specifically the thermal conductivity, highlighting G as a key, yet often underrepresented component of the urban surface energy balance. For instance, G was absent from the Urban-PLUMBER harmonized gap-filled datasets for 20 urban flux tower sites used in this study (Lipson et al., 2022b). Our current thermal conductivity value (3.24 W m−1 K−1), taken from the Noah-MP land-surface model (He et al., 2023), is substantially higher than values commonly used in CLM (Lawrence et al., 2019) for example, 0.767 W m−1 K−1 in its original urban implementation (Loridan and Grimmond, 2012) or 1.55 W m−1 K−1 in the later SURY configuration (Wouters et al., 2016), and may therefore require further refinement. Future work could focus on calibrating thermal conductivity and heat capacity based on observed or region-specific data. While no global database of urban thermal properties was identified during this study, using measured values where available would likely improve realism. Another planned improvement is to update thermal conductivity and heat capacity not only in grid cells where urban cover exceeds a threshold (here 50 %), but by applying a weighted average of natural and urban values based on the actual urban fraction.
A more refined representation of urban hydrology could also help address the above biases. Urban land surface models use a range of runoff strategies, from routing a fixed fraction of rainfall directly to runoff to more process-based formulations accounting for infiltration capacity, soil saturation, surface-water storage, and transfers between pervious and impervious tiles. The simpler formulations may be insensitive to rainfall intensity, antecedent soil moisture, and site characteristics (Jongen et al., 2024). The present study introduces a novel physically based representation of imperviousness by linking it to saturated hydraulic conductivity, thereby affecting infiltration, subsurface water transfer, and runoff generation. This development directly addresses the weak sensitivity of runoff to imperviousness found in 7 of the 18 models evaluated by Jongen et al. (2026). Nevertheless, Jongen et al. (2026) also found that 10 models omitted at least one major runoff-generation mechanism. Future developments should therefore represent surface ponding and interception storage, irrigation, drainage connectivity, and water transfers between urban and vegetated tiles. These processes should ultimately be evaluated against hydrological observations, because the present sensitivity analysis alone cannot establish whether the simulated water partitioning is realistic. Importantly, advancing the hydrological realism of the model should not be guided by latent heat performance alone, but by a comprehensive evaluation of the full water balance (Jongen et al., 2024). However, such evaluation is currently limited by a lack of observational data for key hydrological variables (e.g., runoff and soil moisture) at the urban flux tower sites used in this study (Jongen et al., 2026, 2024). This underscores the need for coordinated efforts to collect hydrological data in urban environments to support model development and validation.
The developments presented here were carried out to enable future simulations for which ORCHIDEE, now including an urban representation, is coupled with an atmospheric model to investigate climate–urban interactions. One key perspective of this work is to conduct high-resolution, convection-permitting simulations over Paris to investigate urban effects on temperature, precipitation, and catchment water balance. As ORCHIDEE is used at various spatial resolutions, from coarse to convection-permitting high resolution (< 3 km), the development undertaken here is a one-tile scheme which can fit both uses. As highlighted by Zhao et al. (2021), despite the impact of urban areas on climate, most state-of-the-art Earth system models and general circulation models participating in the CMIP do not account for urban regions. This is due to the limited impact of urban areas at coarse resolutions (100–200 km). Although constructing multi-model ensembles is considered best practice for providing robust and well-characterized climate projections, relying on non-urban projections for assessing climate-related risks in built environments is inadequate due to their bias regarding urban impacts. To bridge this gap, recent efforts have focused on two approaches: physically downscaling climate projections from one or two GCMs using regional climate models with urban land schemes or directly incorporating urban representation into GCMs. Our development aligns with both approaches. At convection-permitting high resolution, the representation of urban areas becomes even more critical, as cities are explicitly resolved at this scale, and an inaccurate urban energy balance can lead to incorrect atmospheric feedbacks. The CORDEX Flagship Pilot Study URB-RCC is currently investigating how different urban schemes influence simulations of urban temperature and precipitation. Results from the Urban-PLUMBER intercomparison (Lipson et al., 2024) have already shown that performance in resolving the surface energy budget is comparable between one-tile and canyon-type urban schemes. For this reason, the development of a one-tile scheme offers a robust and computationally efficient option for representing urban surfaces in convection-permitting simulations, while remaining scalable for large-scale or global applications. Still, questions related to operational actions such as urban greening, depaving, or planning strategies require insights from more complex schemes that resolve the street canyon, which our urban scheme in ORCHIDEE won't be able to provide.
This study presents a first step in implementing urban areas in the ORCHIDEE land surface model. By moving from a baresoil representation of cities to a one-tile urban scheme, we introduce key urban surface properties and propose a novel imperviousness parameterization that links saturated hydraulic conductivity to urban land cover. The new Urban1 scheme improves the simulation of surface energy fluxes across the 20 urban sites of the Urban-PLUMBER intercomparison project, as reflected by reduced MAE in both latent and sensible heat compared to the Baresoil version. Across all stations, mean MAE (mean absolute error) decreases from 30.3 to 27.3 W m−2 for latent heat and from 41.9 to 36.9 W m−2 for sensible heat. At sites with more than 50 % impervious cover, the improvements are even larger, with latent heat decreasing from 31.5 to 27.7 W m−2 and sensible heat from 46.3 to 38.2 W m−2. Performance at AU-Preston is closer to the benchmark range of the Urban-PLUMBER ensemble. For sensible heat, where Urban-PLUMBER mean benchmarks typically achieve MAE between 18.6 and 26.1 W m−2, the original Baresoil representation had an MAE of 47.1 W m−2, while the new urban scheme (Urban1) reduced it to 33.3 W m−2. For latent heat, where the Urban-PLUMBER mean benchmarks are 18.5–32.9 W m−2, the Baresoil scheme produced 34.5 W m−2 compared to 33.7 W m−2 with the new scheme. In addition, the updated representation modifies local hydrology as expected by increasing surface runoff and decreasing evapotranspiration. While these developments improve several aspects of urban energy and water balances, some limitations remain. In particular, the simulated reduction in subsurface runoff raises questions about the representation of urban recharge, which can be found to increase in observational studies (Bhaskar et al., 2016). The lack of urban runoff or soil moisture observations at the evaluated sites currently limits direct hydrological validation. Future work should address these gaps by running high-resolution 3D simulations at the urban catchment scale, enabling evaluation against streamflow observations. Additional developments, such as spatially and temporally varying urban parameters (e.g., from WUDAPT), interception of rainfall on urban structures, refinement of thermal properties, and the inclusion of anthropogenic heat fluxes, will further enhance the performances of this scheme. Together, these improvements will support the use of ORCHIDEE in studying urban climate processes and feedback from city to regional scales.
A perspective of this work is to conduct high-resolution ORCHIDEE simulations over large urban areas with a river routing scheme. These simulations would allow the evaluation of the urban module in which urban parameters such as albedo, building height, and imperviousness can vary both spatially and temporally. In the present 1D experiments, these parameters were prescribed for each site. However, the scheme developed here is capable of reading and interpolating urban data maps (e.g., LCZ maps or datasets describing imperviousness, albedo, and building heights), although this functionality was not demonstrated in the 1D framework. Using spatially distributed inputs would enable the model to take advantage of, and remain consistent with, comprehensive urban datasets such as the WUDAPT database (Ching et al., 2018). Including urban catchments within the simulation domain would also create opportunities to evaluate the model developments against streamflow measurements, which are generally more available than runoff or soil moisture observations. Further consideration could be given to whether additional processes, such as subsurface water lateral fluxes should be included in high-resolution climate simulations to assess urban water resources.
The initial version of the ORCHIDEE LSM used for this study corresponds to tag 2.2, revision 8133 and is freely available from https://forge.ipsl.jussieu.fr/orchidee/browser/branches/ORCHIDEE_2_2?rev=8133 (last access: 1 November 2023). It is provided under a CeCILL-C license (French equivalent to the LGPL license). The version of the ORCHIDEE LSM with the urban developments described in this paper is archived on Zenodo (Lalonde et al., 2026c) and is available at https://doi.org/10.5281/zenodo.18413342. Atmospheric forcing data and observations (Data for “Harmonized gap-filled dataset from 20 urban flux tower sites” for the Urban-PLUMBER project) are available at https://doi.org/10.5281/zenodo.7104984 (Lipson et al., 2022a). The simulation outputs are available at https://doi.org/10.5281/zenodo.22894416 (Lalonde et al., 2026a). The scripts to process the data and plot the figures are available at https://doi.org/10.5281/zenodo.22934329 (Lalonde et al., 2026b).
The supplement related to this article is available online at https://doi.org/10.5194/gmd-19-9463-2026-supplement.
Morgane Lalonde: conceptualization, investigation, software, and writing – original draft preparation. Sophie Bastin: conceptualization, funding acquisition, supervision, and writing – review and editing. Ludovic Oudin: conceptualization, supervision, and writing – review and editing. Pedro Felipe Arboleda-Obando: conceptualization, methodology, and writing – review and editing. Agnès Ducharne: conceptualization, methodology, and writing – review and editing.
The contact author has declared that none of the authors has any competing interests.
Publisher's note: Copernicus Publications remains neutral with regard to jurisdictional claims made in the text, published maps, institutional affiliations, or any other geographical representation in this paper. The authors bear the ultimate responsibility for providing appropriate place names. Views expressed in the text are those of the authors and do not necessarily reflect the views of the publisher.
We gratefully acknowledge the support of the LEFE program from INSU/CNRS, the Urban theme of the EUR IPSL-Climate Graduate School (IPSL-CGS), which receives government funding administered by the National Research Agency (ANR) under the Investments for the Future program, reference number ANR-11-IDEX-0004 – 17-EURE-0006, and the Graduate School “Géosciences, Climat, Environnement, Planètes” of Université Paris-Saclay for contributing to the funding of this research. We also thank the ESPRI mesocenter of IPSL for providing computational resources and data access. We thank Lluis Fita, Jan Polcher, and Romain Pennel for their insightful discussions on the ORCHIDEE model. We also thank Cathy Li and the two anonymous reviewers for their constructive comments, which helped improve the manuscript.
This research has been supported by the LEFE program from INSU/CNRS, the Urban theme of the EUR IPSL-Climate Graduate School (IPSL-CGS), supported by the French National Research Agency (ANR) under the Investments for the Future program (ANR-11-IDEX-0004 – 17-EURE-0006), and the Graduate School “Géosciences, Climat, Environnement, Planètes” of Université Paris-Saclay.
This paper was edited by Donghui Xu and reviewed by Cathy Li and two anonymous referees.
Arboleda-Obando, P. F.: Feedback from groundwater and irrigation on past and future climate simulated by the IPSL climate model, PhD, Sorbonne Université, Paris, France, https://theses.hal.science/tel-04079831 (last access: 30 September 2026), 2023.
Arjdal, K.: Modeling the surface-atmosphere coupling in the Moroccan semi-arid plains in the context of climate change, PhD, Institut Polytechnique de Paris et Université Mohammed VI Polytechnique, Benguerir, Marocco, https://theses.hal.science/tel-04601815 (last access: 30 September 2026), 2023.
Barella-Ortiz, A., Polcher, J., Tuzet, A., and Laval, K.: Potential evaporation estimation through an unstressed surface-energy balance and its sensitivity to climate change, Hydrol. Earth Syst. Sci., 17, 4625–4639, https://doi.org/10.5194/hess-17-4625-2013, 2013.
Barlage, M., Chen, F., Rasmussen, R., Zhang, Z., and Miguez-Macho, G.: The Importance of Scale-Dependent Groundwater Processes in Land-Atmosphere Interactions Over the Central United States, Geophys. Res. Lett., 48, e2020GL092171, https://doi.org/10.1029/2020GL092171, 2021.
Barlow, J. F.: Progress in observing and modelling the urban boundary layer. Urban Climate, ICUC8: The 8th International Conference on Urban Climate and the 10th Symposium on the Urban Environment, 10, 216–240, https://doi.org/10.1016/j.uclim.2014.03.011, 2014.
Bernabé, A., Bernard, J., Musy, M., Andrieu, H., Bocher, E., Calmet, I., Kéravec, P., and Rosant, J.-M.: Radiative and heat storage properties of the urban fabric derived from analysis of surface forms, Urban Climate, 12, 205–218, https://doi.org/10.1016/j.uclim.2015.04.001, 2015.
Best, M. J., Abramowitz, G., Johnson, H. R., Pitman, A. J., Balsamo, G., Boone, A., Cuntz, M., Decharme, B., Dirmeyer, P. A., Dong, J., Ek, M., Guo, Z., Haverd, V., Van Den Hurk, B. J. J., Nearing, G. S., Pak, B., Peters-Lidard, C., Santanello, J. A., Stevens, L., and Vuichard, N.: The Plumbing of Land Surface Models: Benchmarking Model Performance, J. Hydrometeorol., 16, 1425–1442, https://doi.org/10.1175/JHM-D-14-0158.1, 2015.
Best, M. J. and Grimmond, C. S. B.: Key Conclusions of the First International Urban Land Surface Model Comparison Project, B. Am. Meteorol. Soc., 96, 805–819, https://doi.org/10.1175/BAMS-D-14-00122.1, 2015.
Bhaskar, A. S., Beesley, L., Burns, M. J., Fletcher, T. D., Hamel, P., Oldham, C. E., and Roy, A. H.: Will it rise or will it fall? Managing the complex effects of urbanization on base flow, Freshw. Sci., 35, 293–310, https://doi.org/10.1086/685084, 2016.
Blyth, E. M., Arora, V. K., Clark, D. B., Dadson, S. J., De Kauwe, M. G., Lawrence, D. M., Melton, J. R., Pongratz, J., Turton, R. H., Yoshimura, K., and Yuan, H.: Advances in Land Surface Modelling, Curr. Clim. Change Rep., 7, 45–71, https://doi.org/10.1007/s40641-021-00171-5, 2021.
Boucher, O., Servonnat, J., Albright, A. L., Aumont, O., Balkanski, Y., Bastrikov, V., Bekki, S., Bonnet, R., Bony, S., Bopp, L., Braconnot, P., Brockmann, P., Cadule, P., Caubel, A., Cheruy, F., Codron, F., Cozic, A., Cugnet, D., D'Andrea, F., Davini, P., De Lavergne, C., Denvil, S., Deshayes, J., Devilliers, M., Ducharne, A., Dufresne, J., Dupont, E., Éthé, C., Fairhead, L., Falletti, L., Flavoni, S., Foujols, M., Gardoll, S., Gastineau, G., Ghattas, J., Grandpeix, J., Guenet, B., Guez, L., E., Guilyardi, E., Guimberteau, M., Hauglustaine, D., Hourdin, F., Idelkadi, A., Joussaume, S., Kageyama, M., Khodri, M., Krinner, G., Lebas, N., Levavasseur, G., Lévy, C., Li, L., Lott, F., Lurton, T., Luyssaert, S., Madec, G., Madeleine, J., Maignan, F., Marchand, M., Marti, O., Mellul, L., Meurdesoif, Y., Mignot, J., Musat, I., Ottlé, C., Peylin, P., Planton, Y., Polcher, J., Rio, C., Rochetin, N., Rousset, C., Sepulchre, P., Sima, A., Swingedouw, D., Thiéblemont, R., Traore, A.K., Vancoppenolle, M., Vial, J., Vialard, J., Viovy, N., and Vuichard, N.: Presentation and Evaluation of the IPSL-CM6A-LR Climate Model, J. Adv. Model. Earth Sy., 12, e2019MS002010, https://doi.org/10.1029/2019MS002010, 2020.
Buckingham, E.: Studies on the movement of soil moisture, US Dept. Agic. Bur. Soils Bull., 38, https://archive.org/details/studiesonmovemen38buck/page/n1/mode/2up (last access: 30 September 2026), 1907.
Campoy, A.: Influence de l'hydrologie souterraine sur la modélisation du climat à l'échelle régionale et globale, PhD, Université Pierre et Marie Curie, Paris, France, https://theses.hal.science/tel-00934826 (last access: 30 September 2026), 2013.
Chéruy, F.: Etude par modélisation des interactions surface-atmosphère à l'échelle globale (HDR), Sorbonne Université, Paris, France, 2018.
Ching, J., Mills, G., Bechtel, B., See, L., Feddema, J., Wang, X., Ren, C., Brousse, O., Martilli, A., Neophytou, M., Mouzourides, P., Stewart, I., Hanna, A., Ng, E., Foley, M., Alexander, P., Aliaga, D., Niyogi, D., Shreevastava, A., Bhalachandran, P., Masson, V., Hidalgo, J., Fung, J., Andrade, M., Baklanov, A., Dai, W., Milcinski, G., Demuzere, M., Brunsell, N., Pesaresi, M., Miao, S., Mu, Q., Chen, F., and Theeuwes, N.: WUDAPT: An Urban Weather, Climate, and Environmental Modeling Infrastructure for the Anthropocene, B. Am. Meteorol. Soc., 99, 1907–1924, https://doi.org/10.1175/BAMS-D-16-0236.1, 2018.
Darcy, H.: Les fontaines publiques de la ville de Dijon: exposition et application des principes à suivre et des formules à employer dans les questions de distribution d'eau, Victor Dalmont, Paris, France, https://archive.org/details/bub_gb_zCI4EpPPO1YC (last access: 30 September 2026), 1856.
De Rosnay, P., Polcher, J., Bruen, M., and Laval, K.: Impact of a physically based soil water flow and soil-plant interaction representation for modeling large-scale land surface processes, J. Geophys. Res., 107, https://doi.org/10.1029/2001JD000634, 2002.
Doms, G., Förstner, J., Heise, E., Reinhardt, T., Ritter, B., and Schrodin, R.: A Description of the Nonhydrostatic Regional COSMO-Model, Deutscher Wetterdienst (DWD), Offenbach, Germany, for the Consortium for Small-Scale Modelling (COSMO), https://www.dwd.de/EN/ourservices/cosmo_documentation/pdf_docu_v5_05/2_cosmo_physics_5_05_en.pdf?__blob=publicationFile&v=2 (last access: 30 September 2026), 2011.
d'Orgeval, T.: Impact du changement climatique sur le cycle de l'eau en Afrique de l'Ouest : modélisation et incertitudes, PhD, Université Pierre et Marie Curie, Paris, France, https://primo.sorbonne-universite.fr/permalink/33BSU_INST/1tgv902/alma991002633079806616 (last access: 30 September 2026), 2006.
d'Orgeval, T., Polcher, J., and de Rosnay, P.: Sensitivity of the West African hydrological cycle in ORCHIDEE to infiltration processes, Hydrol. Earth Syst. Sci., 12, 1387–1401, https://doi.org/10.5194/hess-12-1387-2008, 2008.
Ducharne, A., Maignan, F., Vuichard, N., Ghattas, J., Wang, F., Peylin, P., Polcher, J., Guimberteau, M., Maugis, P., Tafasca, S., Tootchi, A., Verhoef, A., and Mizuochi, H.: The hydrol module of ORCHIDEE: scientific documentation, https://forge.ipsl.fr/orchidee/attachment/wiki/Documentation/eqs_hydrol_25April2018_Ducharne.pdf (last access: 30 September 2026), 2018.
European Environment Agency: Copernicus Land Monitoring Service (CLMS): Urban Atlas Land Cover/Land Use and Street Tree Layer 2012 and 2018 – Product User Manual, version 6.3 (No. 6.3.1), https://library.land.copernicus.eu/products/Urban_Atlas_Land_Cover-Land_Use_and_Street_Tree_Layer_2012_and_2018_PUM_v6.pdf (last access: 30 September 2026), 2020.
Fisher, R. A. and Koven, C. D.: Perspectives on the Future of Land Surface Models and the Challenges of Representing Complex Terrestrial Systems, J. Adv. Model. Earth Sy., 12, e2018MS001453, https://doi.org/10.1029/2018MS001453, 2020.
Fletcher, T. D., Andrieu, H., and Hamel, P.: Understanding, management and modelling of urban hydrology and its consequences for receiving waters: A state of the art, Adv. Water Resour., 51, 261–279, https://doi.org/10.1016/j.advwatres.2012.09.001, 2013.
Green, W. H. and Ampt, G. A.: Studies on Soil Phyics, J. Agr. Sci., 4, 1–24, https://doi.org/10.1017/S0021859600001441, 1911.
Güneralp, B., Reba, M., Hales, B. U., Wentz, E. A., and Seto, K. C.: Trends in urban land expansion, density, and land transitions from 1970 to 2010: a global synthesis, Environ. Res. Lett., 15, 044015, https://doi.org/10.1088/1748-9326/ab6669, 2020.
Hamilton, I. G., Davies, M., Steadman, P., Stone, A., Ridley, I., and Evans, S.: The significance of the anthropogenic heat emissions of London's buildings: A comparison against captured shortwave solar radiation, Build. Environ., 44, 807–817, https://doi.org/10.1016/j.buildenv.2008.05.024, 2009.
He, C., Valayamkunnath, P., Barlage, M., Chen, F., Gochis, D., Cabell, R., Schneider, T., Rasmussen, R., Niu, G.-Y., Yang, Z.-L., Niyogi, D., and Ek, M.: The Community Noah-MP Land Surface Modeling System Technical Description Version 5.0, NCAR/UCAR, https://doi.org/10.5065/EW8G-YR95, 2023.
Hertwig, D., Grimmond, S., Hendry, M. A., Saunders, B., Wang, Z., Jeoffrion, M., Vidale, P. L., McGuire, P. C., Bohnenstengel, S. I., Ward, H. C., and Kotthaus, S.: Urban signals in high-resolution weather and climate simulations: role of urban land-surface characterisation, Theor. Appl. Climatol., 142, 701–728, https://doi.org/10.1007/s00704-020-03294-1, 2020.
Jacobson, C. R.: Identification and quantification of the hydrological impacts of imperviousness in urban catchments: A review, J. Environ. Manage., 92, 1438–1448, https://doi.org/10.1016/j.jenvman.2011.01.018, 2011.
Jin, L., Schubert, S., Fenner, D., Meier, F., and Schneider, C.: Integration of a Building Energy Model in an Urban Climate Model and its Application, Bound.-Lay. Meteorol., 178, 249–281, https://doi.org/10.1007/s10546-020-00569-y, 2021.
Johra, H.: Thermal properties of building materials – Review and database. Department of the Built Environment, Aalborg University, https://doi.org/10.54337/aau456230861, 2021.
Jongen, H. J., Lipson, M., Teuling, A. J., Grimmond, S., Baik, J.-J., Best, M., Demuzere, M., Fortuniak, K., Huang, Y., De Kauwe, M. G., Li, R., McNorton, J., Meili, N., Oleson, K., Park, S.-B., Sun, T., Tsiringakis, A., Varentsov, M., Wang, C., Wang, Z.-H., and Steeneveld, G. J.: The Water Balance Representation in Urban-PLUMBER Land Surface Models, J. Adv. Model. Earth Sy., 16, e2024MS004231, https://doi.org/10.1029/2024MS004231, 2024.
Jongen, H. J., Lipson, M., Teuling, A. J., Grimmond, S., Best, M., Baik, J.-J., Demuzere, M., Fortuniak, K., Huang, Y., De Kauwe, M., Meili, N., Park, S.-B., Wang, C., Wang, Z., and Steeneveld, G. J.: Surface Runoff Discrepancy in Urban-PLUMBER Land Surface Models, Geophys. Res. Lett., 53, e2026GL122048, https://doi.org/10.1029/2026GL122048, 2026.
Karsisto, P., Fortelius, C., Demuzere, M., Grimmond, C. S. B., Oleson, K. W., Kouznetsov, R., Masson, V., and Järvi, L.: Seasonal surface urban energy balance and wintertime stability simulated using three land-surface models in the high-latitude city Helsinki, Q. J. Roy. Meteor. Soc., 142, 401–417, https://doi.org/10.1002/qj.2659, 2016.
Kotopouleas, A., Giridharan, R., Nikolopoulou, M., Watkins, R., and Yeninarcilar, M.: Experimental investigation of the impact of urban fabric on canyon albedo using a 1:10 scaled physical model, Sol. Energy, 230, 449–461, https://doi.org/10.1016/j.solener.2021.09.074, 2021.
Krayenhoff, E. S., Christen, A., Martilli, A., and Oke, T. R.: A Multi-layer Radiation Model for Urban Neighbourhoods with Trees, Bound.-Lay. Meteorol., 151, 139–178, https://doi.org/10.1007/s10546-013-9883-1, 2014.
Krinner, G., Viovy, N., de Noblet-Ducoudré, N., Ogée, J., Polcher, J., Friedlingstein, P., Ciais, P., Sitch, S., and Prentice, I. C.: A dynamic global vegetation model for studies of the coupled atmosphere-biosphere system, Global Biogeochem. Cy., 19, https://doi.org/10.1029/2003GB002199, 2005.
Kusaka, H., Kondo, H., Kikegawa, Y., and Kimura, F.: A Simple Single-Layer Urban Canopy Model For Atmospheric Models: Comparison With Multi-Layer And Slab Models, Bound.-Lay. Meteorol., 101, 329–358, https://doi.org/10.1023/A:1019207923078, 2001.
Lalonde, M., Bastin, S., Oudin, L., Arboleda Obando, P. F., and Ducharne, A.: Simulations – Benchmarking a new urban scheme in the ORCHIDEE 2.2 land surface model, Zenodo [data set], https://doi.org/10.5281/zenodo.22894416, 2026a.
Lalonde, M., Bastin, S., Oudin, L., Arboleda Obando, P. F., and Ducharne, A.: Scripts – Benchmarking a new urban scheme in the ORCHIDEE 2.2 land surface model, Zenodo [code], https://doi.org/10.5281/zenodo.22934329, 2026b.
Lalonde, M., Bastin, S., Oudin, L., Arboleda-Obando, P., and Ducharne, A.: Source Code – Benchmarking a new urban scheme in the ORCHIDEE 2.2 land surface model, Zenodo [code], https://doi.org/10.5281/zenodo.18413342, 2026c.
Langendijk, G. S., Halenka, T., Hoffmann, P., Adinolfi, M., Aldama Campino, A., Asselin, O., Bastin, S., Bechtel, B., Belda, M., Bushenkova, A., Campanale, A., Chun, K. P., Constantinidou, K., Coppola, E., Demuzere, M., Doan, Q.-V., Evans, J., Feldmann, H., Fernandez, J., Fita, L., Hadjinicolaou, P., Hamdi, R., Hundhausen, M., Grawe, D., Johannsen, F., Milovac, J., Katragkou, E., Kerroumi, N. E. I., Kotlarski, S., Le Roy, B., Lemonsu, A., Lennard, C., Lipson, M., Mandal, S., Muñoz Pabón, L. E., Pavlidis, V., Pietikäinen, J.-P., Raffa, M., Raluy-López, E., Rechid, D., Ito, R., Schulz, J.-P., Soares, P. M. M., Takane, Y., Teichmann, C., Thatcher, M., Top, S., Van Schaeybroeck, B., Wang, F., and Yuan, J.: Towards better understanding the urban environment and its interactions with regional climate change – The WCRP CORDEX Flagship Pilot Study URB-RCC, Urban Climate, 58, 102165, https://doi.org/10.1016/j.uclim.2024.102165, 2024.
Lawrence, D. M., Fisher, R. A., Koven, C. D., Oleson, K. W., Swenson, S.C., Bonan, G., Collier, N., Ghimire, B., Van Kampenhout, L., Kennedy, D., Kluzek, E., Lawrence, P. J., Li, F., Li, H., Lombardozzi, D., Riley, W. J., Sacks, W. J., Shi, M., Vertenstein, M., Wieder, W. R., Xu, C., Ali, A. A., Badger, A.M., Bisht, G., Van Den Broeke, M., Brunke, M. A., Burns, S. P., Buzan, J., Clark, M., Craig, A., Dahlin, K., Drewniak, B., Fisher, J. B., Flanner, M., Fox, A. M., Gentine, P., Hoffman, F., Keppel-Aleks, G., Knox, R., Kumar, S., Lenaerts, J., Leung, L. R., Lipscomb, W. H., Lu, Y., Pandey, A., Pelletier, J. D., Perket, J., Randerson, J. T., Ricciuto, D. M., Sanderson, B. M., Slater, A., Subin, Z. M., Tang, J., Thomas, R. Q., Val Martin, M., and Zeng, X.: The Community Land Model Version 5: Description of New Features, Benchmarking, and Impact of Forcing Uncertainty, J. Adv. Model. Earth Sy., 11, 4245–4287, https://doi.org/10.1029/2018MS001583, 2019.
Lemonsu, A., Masson, V., and Berthier, E.: Improvement of the hydrological component of an urban soil–vegetation–atmosphere–transfer model, Hydrol. Process., 21, 2100–2111, https://doi.org/10.1002/hyp.6373, 2007.
Lemonsu, A., Masson, V., Shashua-Bar, L., Erell, E., and Pearlmutter, D.: Inclusion of vegetation in the Town Energy Balance model for modelling urban green areas, Geosci. Model Dev., 5, 1377–1393, https://doi.org/10.5194/gmd-5-1377-2012, 2012.
Lindberg, F., Olofson, K. F. G., Sun, T., Grimmond, C. S. B., and Feigenwinter, C.: Urban storage heat flux variability explored using satellite, meteorological and geodata, Theor. Appl. Climatol., 141, 271–284, https://doi.org/10.1007/s00704-020-03189-1, 2020.
Lipson, M., Grimmond, S., Best, M., Chow, W., Christen, A., Chrysoulakis, N., Coutts, A., Crawford, B., Earl, S., Evans, J., Fortuniak, K., Heusinkveld, B. G., Hong, J.-W., Hong, J., Järvi, L., Jo, S., Kim, Y.-H., Kotthaus, S., Lee, K., Masson, V., McFadden, J. P., Michels, O., Pawlak, W., Roth, M., Sugawara, H., Tapper, N., Velasco, E., and Ward, H. C.: Data for “Harmonized gap-filled dataset from 20 urban flux tower sites” for the Urban-PLUMBER project, Zenodo [data set], https://doi.org/10.5281/zenodo.7104984, 2022a.
Lipson, M., Grimmond, S., Best, M., Chow, W. T. L., Christen, A., Chrysoulakis, N., Coutts, A., Crawford, B., Earl, S., Evans, J., Fortuniak, K., Heusinkveld, B. G., Hong, J.-W., Hong, J., Järvi, L., Jo, S., Kim, Y.-H., Kotthaus, S., Lee, K., Masson, V., McFadden, J. P., Michels, O., Pawlak, W., Roth, M., Sugawara, H., Tapper, N., Velasco, E., and Ward, H. C.: Harmonized gap-filled datasets from 20 urban flux tower sites, Earth Syst. Sci. Data, 14, 5157–5178, https://doi.org/10.5194/essd-14-5157-2022, 2022b.
Lipson, M., Grimmond, S., Best, M., Abramowitz, G., Coutts, A., Tapper, N., Baik, J.-J., Beyers, M., Blunn, L., Boussetta, S., Bou-Zeid, E., De Kauwe, M. G., de Munck, C., Demuzere, M., Fatichi, S., Fortuniak, K., Han, B.-S., Hendry, M. A., Kikegawa, Y., Kondo, H., Lee, D.-I., Lee, S.-H., Lemonsu, A., Machado, T., Manoli, G., Martilli, A., Masson, V., McNorton, J., Meili, N., Meyer, D., Nice, K. A., Oleson, K., Park, S.-B., Roth, M., Schoetter, R., Simón-Moral, A., Steeneveld, G.-J., Sun, T., Takane, Y., Thatcher, M., Tsiringakis, A., Varentsov, M., Wang, C., Wang, Z.-H., and Pitman, A. J.: Evaluation of 30 urban land surface models in the Urban-PLUMBER project: Phase 1 results, Q. J. Roy. Meteor. Soc., 150, 126–169, https://doi.org/10.1002/qj.4589, 2024.
Loridan, T. and Grimmond, C. S. B.: Characterization of Energy Flux Partitioning in Urban Environments: Links with Surface Seasonal Properties, J. Appl. Meteorol. Clim., 51, 219–241, https://doi.org/10.1175/JAMC-D-11-038.1, 2012.
Lucas-Picher, P., Argüeso, D., Brisson, E., Tramblay, Y., Berg, P., Lemonsu, A., Kotlarski, S., and Caillaud, C.: Convection-permitting modeling with regional climate models: Latest developments and next steps, WIREs Clim. Change, 12, e731, https://doi.org/10.1002/wcc.731, 2021.
Lurton, T., Balkanski, Y., Bastrikov, V., Bekki, S., Bopp, L., Braconnot, P., Brockmann, P., Cadule, P., Contoux, C., Cozic, A., Cugnet, D., Dufresne, J.-L., Éthé, C., Foujols, M.-A., Ghattas, J., Hauglustaine, D., Hu, R.-M., Kageyama, M., Khodri, M., Lebas, N., Levavasseur, G., Marchand, M., Ottlé, C., Peylin, P., Sima, A., Szopa, S., Thiéblemont, R., Vuichard, N., and Boucher, O.: Implementation of the CMIP6 Forcing Data in the IPSL-CM6A-LR Model, J. Adv. Model. Earth Sy., 12, e2019MS001940, https://doi.org/10.1029/2019MS001940, 2020.
Martilli, A., Clappier, A., and Rotach, M. W.: An Urban Surface Exchange Parameterisation for Mesoscale Models, Bound.-Lay. Meteorol., 104, 261–304, https://doi.org/10.1023/A:1016099921195, 2002.
Masson, V.: A Physically-Based Scheme For The Urban Energy Budget In Atmospheric Models, Bound.-Lay. Meteorol., 94, 357–397, https://doi.org/10.1023/A:1002463829265, 2000.
Masson, V., Le Moigne, P., Martin, E., Faroux, S., Alias, A., Alkama, R., Belamari, S., Barbu, A., Boone, A., Bouyssel, F., Brousseau, P., Brun, E., Calvet, J.-C., Carrer, D., Decharme, B., Delire, C., Donier, S., Essaouini, K., Gibelin, A.-L., Giordani, H., Habets, F., Jidane, M., Kerdraon, G., Kourzeneva, E., Lafaysse, M., Lafont, S., Lebeaupin Brossier, C., Lemonsu, A., Mahfouf, J.-F., Marguinaud, P., Mokhtari, M., Morin, S., Pigeon, G., Salgado, R., Seity, Y., Taillefer, F., Tanguy, G., Tulet, P., Vincendon, B., Vionnet, V., and Voldoire, A.: The SURFEXv7.2 land and ocean surface platform for coupled or offline simulation of earth surface variables and fluxes, Geosci. Model Dev., 6, 929–960, https://doi.org/10.5194/gmd-6-929-2013, 2013.
Mauder, M., Foken, T., and Cuxart, J.: Surface-Energy-Balance Closure over Land: A Review, Bound.-Lay. Meteorol., 177, 395–426, https://doi.org/10.1007/s10546-020-00529-6, 2020.
Michau, Y., Lemonsu, A., Lucas-Picher, P., Bastin, S., Caillaud, C., de Vries, H., Adinolfi, M., Raffa, M., Katragkou, E., and Coppola, E.: Projected evolution of the Urban climate and heatwaves using an ensemble of convection-permitting regional climate models, Climatic Change, 178, 154, https://doi.org/10.1007/s10584-025-03990-9, 2025.
Mualem, Y.: A new model for predicting the hydraulic conductivity of unsaturated porous media, Water Resour. Res., 12, 513–522, https://doi.org/10.1029/WR012i003p00513, 1976.
Myrup, L. O.: A Numerical Model of the Urban Heat Island, J. Appl. Meteorol. Clim., 8, 908–918, https://doi.org/10.1175/1520-0450(1969)008<0908:ANMOTU>2.0.CO;2, 1969.
Niu, G.-Y., Yang, Z.-L., Mitchell, K. E., Chen, F., Ek, M. B., Barlage, M., Kumar, A., Manning, K., Niyogi, D., Rosero, E., Tewari, M., and Xia, Y.: The community Noah land surface model with multiparameterization options (Noah-MP): 1. Model description and evaluation with local-scale measurements, J. Geophys. Res.-Atmos., 116, https://doi.org/10.1029/2010JD015139, 2011.
Oke, T. R.: The urban energy balance, Prog. Phys. Geog., 12, 471–508, https://doi.org/10.1177/030913338801200401, 1988.
Oleson, K., Bonan, G. B., Feddema, J., Vertenstein, M., and Grimmond, C. S. B.: An Urban Parameterization for a Global Climate Model. Part I: Formulation and Evaluation for Two Cities, J. Appl. Meteorol. Clim., 47, 1038–1060, https://doi.org/10.1175/2007JAMC1597.1, 2008.
Oudin, L., Salavati, B., Furusho-Percot, C., Ribstein, P., and Saadi, M.: Hydrological impacts of urbanization at the catchment scale. J. Hydrol., 559, 774–786, https://doi.org/10.1016/j.jhydrol.2018.02.064, 2018.
Prein, A. F., Pothapakula, P. K., Zeman, C., Lalonde, M., Rixen, M., Dipankar, A., Leclair, M., and Jocksch, A.: From single storms to large-scale waves: a multi-year kilometer-scale global simulation, Geosci. Model Dev., 19, 5277–5303, https://doi.org/10.5194/gmd-19-5277-2026, 2026.
Qin, Y.: Urban canyon albedo and its implication on the use of reflective cool pavements, Energ. Buildings, 96, 86–94, https://doi.org/10.1016/j.enbuild.2015.03.005, 2015.
Raddatz, T. J., Reick, C. H., Knorr, W., Kattge, J., Roeckner, E., Schnur, R., Schnitzler, K.-G., Wetzel, P., and Jungclaus, J.: Will the tropical land biosphere dominate the climate–carbon cycle feedback during the twenty-first century?, Clim. Dynam., 29, 565–574, https://doi.org/10.1007/s00382-007-0247-8, 2007.
Redon, E., Lemonsu, A., and Masson, V.: An urban trees parameterization for modeling microclimatic variables and thermal comfort conditions at street level with the Town Energy Balance model (TEB-SURFEX v8.0), Geosci. Model Dev., 13, 385–399, https://doi.org/10.5194/gmd-13-385-2020, 2020.
Rigo, G. and Parlow, E.: Modelling the ground heat flux of an urban area using remote sensing data, Theor. Appl. Climatol., 90, 185–199, 2007.
Saadi, M., Oudin, L., and Ribstein, P.: Crossing the rural–urban boundary in hydrological modelling: How do conceptual rainfall–runoff models handle the specificities of urbanized catchments?, Hydrol. Process., 34, 3331–3346, https://doi.org/10.1002/hyp.13808, 2020.
Schär, C., Fuhrer, O., Arteaga, A., Ban, N., Charpilloz, C., Girolamo, S. D., Hentgen, L., Hoefler, T., Lapillonne, X., Leutwyler, D., Osterried, K., Panosetti, D., Rüdisühli, S., Schlemmer, L., Schulthess, T. C., Sprenger, M., Ubbiali, S., and Wernli, H.: Kilometer-Scale Climate Models: Prospects and Challenges, B. Am. Meteorol. Soc., 101, E567–E587, https://doi.org/10.1175/BAMS-D-18-0167.1, 2020.
Segura, H., Pedruzo-Bagazgoitia, X., Weiss, P., Müller, S. K., Rackow, T., Lee, J., Dolores-Tesillos, E., Benedict, I., Aengenheyster, M., Aguridan, R., Arduini, G., Baker, A. J., Bao, J., Bastin, S., Baulenas, E., Becker, T., Beyer, S., Bockelmann, H., Brüggemann, N., Brunner, L., Cheedela, S. K., Das, S., Denissen, J., Dragaud, I., Dziekan, P., Ekblom, M., Engels, J. F., Esch, M., Forbes, R., Frauen, C., Freischem, L., García-Maroto, D., Geier, P., Gierz, P., González-Cervera, Á., Grayson, K., Griffith, M., Gutjahr, O., Haak, H., Hadade, I., Haslehner, K., ul Hasson, S., Hegewald, J., Kluft, L., Koldunov, A., Koldunov, N., Kölling, T., Koseki, S., Kosukhin, S., Kousal, J., Kuma, P., Kumar, A. U., Li, R., Maury, N., Meindl, M., Milinski, S., Mogensen, K., Niraula, B., Nowak, J., Praturi, D. S., Proske, U., Putrasahan, D., Redler, R., Santuy, D., Sármány, D., Schnur, R., Scholz, P., Sidorenko, D., Spät, D., Sützl, B., Takasuka, D., Tompkins, A., Uribe, A., Valentini, M., Veerman, M., Voigt, A., Warnau, S., Wachsmann, F., Wacławczyk, M., Wedi, N., Wieners, K.-H., Wille, J., Winkler, M., Wu, Y., Ziemen, F., Zimmermann, J., Bender, F. A.-M., Bojovic, D., Bony, S., Bordoni, S., Brehmer, P., Dengler, M., Dutra, E., Faye, S., Fischer, E., van Heerwaarden, C., Hohenegger, C., Järvinen, H., Jochum, M., Jung, T., Jungclaus, J. H., Keenlyside, N. S., Klocke, D., Konow, H., Klose, M., Malinowski, S., Martius, O., Mauritsen, T., Mellado, J. P., Mieslinger, T., Mohino, E., Pawłowska, H., Peters-von Gehlen, K., Sarré, A., Sobhani, P., Stier, P., Tuppi, L., Vidale, P. L., Sandu, I., and Stevens, B.: nextGEMS: entering the era of kilometer-scale Earth system modeling, Geosci. Model Dev., 18, 7735–7761, https://doi.org/10.5194/gmd-18-7735-2025, 2025.
Seto, K. C., Güneralp, B., and Hutyra, L. R.: Global forecasts of urban expansion to 2030 and direct impacts on biodiversity and carbon pools, P. Natl. Acad. Sci., 109, 16083–16088, https://doi.org/10.1073/pnas.1211658109, 2012.
Shahi, N. K., Polcher, J., Bastin, S., Pennel, R., and Fita, L.: Assessment of the spatio-temporal variability of the added value on precipitation of convection-permitting simulation over the Iberian Peninsula using the RegIPSL regional earth system model, Clim. Dynam., 59, 471, https://doi.org/10.1007/s00382-022-06138-y, 2022.
Stavropulos-Laffaille, X., Chancibault, K., Brun, J.-M., Lemonsu, A., Masson, V., Boone, A., and Andrieu, H.: Improvements to the hydrological processes of the Town Energy Balance model (TEB-Veg, SURFEX v7.3) for urban modelling and impact assessment, Geosci. Model Dev., 11, 4175–4194, https://doi.org/10.5194/gmd-11-4175-2018, 2018.
Stavropulos-Laffaille, X., Chancibault, K., Andrieu, H., Lemonsu, A., Calmet, I., Keravec, P., and Masson, V.: Coupling detailed urban energy and water budgets with TEB-Hydro model: Towards an assessment tool for nature based solution performances, Urban Climate, 39, 100925, https://doi.org/10.1016/j.uclim.2021.100925, 2021.
Stevens, B., Satoh, M., Auger, L., Biercamp, J., Bretherton, C. S., Chen, X., Düben, P., Judt, F., Khairoutdinov, M., Klocke, D., Kodama, C., Kornblueh, L., Lin, S.-J., Neumann, P., Putman, W. M., Röber, N., Shibuya, R., Vanniere, B., Vidale, P. L., Wedi, N., and Zhou, L.: DYAMOND: the DYnamics of the Atmospheric general circulation Modeled On Non-hydrostatic Domains, Prog. Earth Planet Sc., 6, 61, https://doi.org/10.1186/s40645-019-0304-z, 2019.
Sun, Y., Zhang, N., Ao, X., and Gao, Y.: Numerical Studies on the Influence of Building Morphology on Urban Canopy Wind Speed, J. Adv. Model. Earth Sy., 16, e2023MS003881, https://doi.org/10.1029/2023MS003881, 2024.
Tafasca, S., Ducharne, A., and Valentin, C.: Weak sensitivity of the terrestrial water budget to global soil texture maps in the ORCHIDEE land surface model, Hydrol. Earth Syst. Sci., 24, 3753–3774, https://doi.org/10.5194/hess-24-3753-2020, 2020.
Van Genuchten, M. T.: A Closed-form Equation for Predicting the Hydraulic Conductivity of Unsaturated Soils, Soil Sci. Soc. Am. J., 44, 892–898, https://doi.org/10.2136/sssaj1980.03615995004400050002x, 1980.
Verhoef, A., Zeng, Y., Agam, N., Best, M., Bonetti, S., Boussetta, S., Chaney, N., Cuntz, M., Edwards, J., Gupta, S., Heitman, J., Huang, M., Jarvis, N., Jiang, S., Kandala, R., Kiałka, F., Lian, T., Mu, M., Nemes, A., Paulus, S. J., Raoult, N., Reddy, K. N., Romano, N., Sabot, M., Vanderborght, J., van der Ploeg, M., van Oevelen, P., Wang, Yong, Wang, Yunquan, Weber, T. K. D., Marthews, T., and Weihermüller, L.: Rethinking Soils in Land Surface Models, B. Am. Meteorol. Soc., 107, E665–E674, https://doi.org/10.1175/BAMS-D-26-0003.1, 2026.
Wonorahardjo, S., Sutjahja, I. M., Mardiyati, Y., Andoni, H., Thomas, D., Achsani, R. A., and Steven, S.: Characterising thermal behaviour of buildings and its effect on urban heat island in tropical areas, Int. J. Energy Environ. Eng., 11, 129–142, https://doi.org/10.1007/s40095-019-00317-0, 2020.
Wouters, H., Demuzere, M., Ridder, K. D., and Van Lipzig, N. P. M.: The impact of impervious water-storage parametrization on urban climate modelling, Urban Climate, 11, 24–50, https://doi.org/10.1016/j.uclim.2014.11.005, 2015.
Wouters, H., Demuzere, M., Blahak, U., Fortuniak, K., Maiheu, B., Camps, J., Tielemans, D., and van Lipzig, N. P. M.: The efficient urban canopy dependency parametrization (SURY) v1.0 for atmospheric modelling: description and application with the COSMO-CLM model for a Belgian summer, Geosci. Model Dev., 9, 3027–3054, https://doi.org/10.5194/gmd-9-3027-2016, 2016.
Zhao, L., Oleson, K., Bou-Zeid, E., Krayenhoff, E. S., Bray, A., Zhu, Q., Zheng, Z., Chen, C., and Oppenheimer, M.: Global multi-model projections of local urban climates, Nat. Clim. Change, 11, 152–157, https://doi.org/10.1038/s41558-020-00958-8, 2021.