
the Creative Commons Attribution 4.0 License.
the Creative Commons Attribution 4.0 License.
 | 17 Sep 2026
Development of the CCPP-based GEFS-aerosols component in the Unified Forecast System for subseasonal prediction (UFS-Chem v1.0)

Haiqin Li
Georg A. Grell
Partha S. Bhattacharjee
Gonzalo A. Ferrada
Benjamin W. Green
Shan Sun
Ligia Bernardet
Anders Jensen
Barry Baker
Jordan Schnell
Ravan Ahmadov
Samuel Trahan
Dustin Swales
Anning Cheng
Fanglin Yang
Rebecca H. Schwantes
Brian C. McDonald
Dominikus Heinzeller
Shobha Kondragunta
The Global Ensemble Forecast System (GEFS) version 12 has been operational at the National Centers for Environmental Prediction since September 2020, with GEFS-Aerosols serving as its global aerosol forecasting member. In 2023, GEFS-Aerosols was upgraded to version 12.3 in operations, incorporating improvements to wet deposition, anthropogenic and biomass burning emissions, aerosol optical depth calculations, and the FENGSHA dust emission scheme. While GEFS-Aerosols provides valuable operational aerosol forecasts on medium-range timescales, its one-way coupling strategy restricts aerosol–atmosphere interactions to prescribed climatological fields, thereby precluding fully interactive aerosol feedbacks for extended-range prediction. To overcome this limitation, we develop the Unified Forecast System coupled with Chemistry (UFS-Chem), which incorporates the Configurable Atmospheric Chemistry (CATChem) library and modeling component to include both aerosol and gas-phase chemistry schemes. In the current UFS-Chem configuration, the aerosol component is based on the operational GEFS-Aerosols v12.3 and implemented using the Common Community Physics Package (CCPP) framework. Relative to GEFS-Aerosols v12.3, UFS-Chem incorporates several enhancements, including inline aerosol radiative feedback, inline large-scale wet deposition, and updated FENGSHA dust scheme. In particular, the integration of inline large-scale wet deposition and aerosol indirect effects through the Thompson aerosol-aware microphysics scheme improves the representation of aerosol–cloud interactions and supports weather and subseasonal-to-seasonal forecasting when fully coupled with ocean, sea ice, land, and wave components. The performance of UFS-Chem in weather and subseasonal prediction is evaluated against reanalysis data, ground-based measurements, and satellite observations. The relative impacts of aerosol radiative and indirect effects on weather and subseasonal predictions are investigated and quantified, advancing our understanding of how aerosol–radiation and aerosol–cloud interactions influence forecast skill across timescales.
- Article
(12901 KB) - Full-text XML
- BibTeX
- EndNote


Aerosols and reactive gases play a fundamental role in the Earth system through their effects on radiation, clouds, precipitation, and atmospheric composition, with consequences for both climate and human health (Boucher et al., 2013; IPCC, 2021). Accurate forecasts of atmospheric composition on weather-to-seasonal timescales are essential for anticipating air quality events, dust outbreaks, and long-range transport of pollution and biomass burning plumes, with direct applications to aviation safety, renewable energy, and public health (Grell and Baklanov, 2011; Zhang et al., 2014). Over the past two decades, substantial progress has been made in operational aerosol and chemistry forecasting, with international systems demonstrating the benefits of coupling atmospheric composition with numerical weather prediction. Notable examples include the National Aeronautics and Space Administration (NASA)'s Goddard Chemistry Aerosol Radiation and Transport (GOCART) model (Chin et al., 2000), which provided one of the first global representations of aerosol processes, and Goddard Earth Observing System Forward Processing (GEOS-FP), a global meteorological analysis and forecasting system that provides the weather fields supporting aerosol and atmospheric composition modeling (Rienecker et al., 2008; Molod et al., 2015). Building upon the GEOS-FP framework, the Goddard Earth Observing System Composition Forecast (GEOS-CF) system was subsequently developed to integrate comprehensive atmospheric chemistry and delivers global operational forecasts of aerosols and atmospheric composition (Colarco et al., 2010; Keller et al., 2021). In Europe, the Copernicus Atmosphere Monitoring Service (CAMS) integrates aerosol and chemistry modules into the ECMWF Integrated Forecasting System, assimilating satellite data to provide skillful composition forecasts (Flemming et al., 2015; Inness et al., 2019). Studies at the German Weather Service (DWD) using the Consortium for Small-scale Modeling – Aerosols and Reactive Trace gases (COSMO-ART) and the ICOsahedral Nonhydrostatic model – Aerosols and Reactive Trace gases (ICON-ART) have demonstrated that accounting for dust direct and indirect effects can improve surface radiation and weather forecasts during Saharan dust outbreaks (Bangert et al., 2012; Rieger et al., 2017). In the United States, the Rapid Refresh Forecast System – Smoke and Dust (RRFS-SD) demonstrated that including smoke aerosol direct feedback improves near-surface temperature, wind speed, and visibility forecasts (Li et al., 2025). These systems underscore the importance of inline aerosol–radiation and aerosol–cloud interactions, as well as data assimilation, for predictive skill.
In the United States, the National Centers for Environmental Prediction (NCEP) implemented GEFS-Aerosols as a member of GEFS v12 operations in September 2020 (Zhang et al., 2022; Bhattacharjee et al., 2023; Li et al., 2024). GEFS-Aerosols represents the second operational global aerosol forecasting capability within NOAA, replacing the NEMS Global Forecast System Aerosol Component version 2 (NGACv2), and supports applications including dust forecasting, wildfire aerosol transport, and the provision of boundary conditions for regional models. With the transition to GEFS-Aerosols v12.3 in 2023, major updates were introduced when compared to GEFS-Aerosols v12, including improved wet deposition processes, anthropogenic and biomass burning emissions, aerosol optical depth (AOD) calculations, and an updated FENGSHA dust emission scheme.
The aerosol component in GEFS-Aerosols is based on the GOCART model, a simplified aerosol scheme that does not include full gas-phase or stratospheric chemistry. To overcome this limitation, we have initiated the development of the Configurable ATmospheric Chemistry (CATChem) library and modeling component that includes comprehensive aerosol and chemistry processes to represent atmospheric composition within the Unified Forecast System (UFS; Jacobs, 2021) framework, named as UFS-Chem. A detailed description of the CATChem framework is provided in He et al. (2026). In CATChem v1, the aerosol component from GEFS-Aerosols v12.3 (GEFS-GOCART) and the gas-phase chemistry from Atmosphere Model version 4.1 (AM4.1) developed by the Geophysical Fluid Dynamics Laboratory (GFDL) have been implemented as configurable options.
In the initial GEFS-Aerosols configuration, atmospheric composition processes were coupled to the dynamical core and physics suite through the National Unified Operational Prediction Capability (NUOPC) framework, in which chemistry and aerosol modules were treated largely as external components. While this approach provided modular flexibility, it resulted in relatively loose coupling between chemistry and physics. Many key aerosol processes – such as emissions, transport, wet and dry deposition, microphysics, and radiation – were executed within the chemistry or aerosol component using parameterizations independent of those in the host atmospheric physics. Most chemistry and aerosol models include their own representations of convective transport, convective wet deposition, planetary boundary layer (PBL) mixing, dry deposition, and large-scale wet removal (e.g., GOCART, Chin et al., 2000; CMAQ, Byun and Schere, 2006; GEOS-Chem, Bey et al., 2001). These parameterizations often differ in numerical formulation, underlying assumptions, and process behavior from the corresponding physics schemes in the host atmospheric model. Consequently, chemical and aerosol tracers may experience transport, scavenging, and removal processes that are inconsistent with those applied to meteorological variables, leading to discrepancies in process coupling, temporal splitting, and physical interpretation. However, atmospheric chemistry and aerosols are inherently interactive and strongly coupled with physical processes. Aerosol emissions depend on land surface conditions and PBL turbulence; chemical tracers are transported by PBL mixing and convective processes; wet scavenging is controlled by cloud microphysics and precipitation; and aerosol–radiation interactions directly modify atmospheric thermodynamics and circulation. Treating these processes separately within standalone chemistry or aerosol components can therefore limit the fidelity of chemistry–physics feedbacks.
To achieve a more physically consistent representation of these interactions, we initiated in 2021 an alternative coupling approach for both global and regional modeling applications, in which the aerosol and chemistry components are decomposed into process-level modules and embedded directly within the physics suite of the host model through the Common Community Physics Package (CCPP) infrastructure (Heinzeller et al., 2023; Bernardet et al., 2024). This coupling approach was first applied in an intermediate configuration, integrating the aerosol emission and GEFS-GOCART aerosol modules from GEFS-Aerosols v12 for weather, and subseasonal to seasonal (S2S) prediction (Li et al., 2024; Sun et al., 2025). The present study builds upon those efforts with a more comprehensive and optimized implementation, coupling the updated GEFS-GOCART module from GEFS-Aerosols v12.3 with GFSv17 physics in UFS-Chem, which incorporates additional enhancements including inline large-scale wet deposition and aerosol indirect effects. Meanwhile, the CCPP coupling infrastructure was used beyond aerosol-only modeling to support the full gas-phase chemistry capability of GFDL's AM4.1, as described in He et al. (2026). At the regional scale, the same approach has been adopted in the development of the RRFS-SD v1, in which smoke plume rise and dust emission modules are embedded as CCPP physics subroutines within the RRFS for convection-allowing smoke and dust prediction over North America (Li et al., 2025). By integrating aerosol and gas-phase chemistry processes as CCPP-compliant physics subroutines, this approach enables emissions, transport, scavenging, and radiative interactions to share the same numerical schemes, time stepping, and state variables as the host model physics, thereby providing tighter and more physically consistent coupling between atmospheric composition and model physics.
While the updates in GEFS-GOCART of GEFS-Aerosols v12.3 enhanced forecast skill, the system remained constrained by its coupling strategy, which permitted only aerosol–radiation feedback of direct and semi-direct effects through prescribed climatological aerosol fields. Interactive aerosol–atmosphere feedbacks – known to be critical for realistic simulations of weather and S2S variability (Benedetti and Vitart, 2018; Freire et al., 2020) – were not represented. To address this limitation, a two-way coupling strategy is required in which the inline-predicted aerosol fields interact with meteorological processes through both radiation and cloud microphysics. Recent studies have made progressive steps toward incorporating aerosol feedback within the UFS framework. Cheng and Yang (2023) demonstrated the impact of aerosol direct radiative effects on numerical weather forecasts by replacing the legacy Optical Properties of Aerosols and Clouds aerosol climatology with second Modern-Era Retrospective Analysis for Research and Applications (MERRA-2) climatological aerosol fields in the GFSv16 physics suite, showing improvements in radiative flux biases, circulation, and precipitation over monsoon regions. Sun et al. (2025) investigated the aerosol radiative feedbacks of direct and semi-direct effects on subseasonal prediction using the UFS with GFSv16 physics, fully coupled with ocean, sea ice, land, and wave components, together with an earlier version of the GEFS-GOCART module based on the operational GEFS-Aerosols v12. Cheng et al. (2026) evaluated aerosol–cloud–radiation interactions by coupling both MERRA-2 climatological and MERRA-2 analysis aerosols with radiation and the Thompson microphysics scheme, enabling the representation of aerosol indirect effects in addition to the direct and semi-direct effects in medium-range weather predictions during a fire event. Their results revealed that the inclusion of aerosol–cloud interactions produces additional net cooling at the top of the atmosphere (TOA) and modifies the vertical distribution of cloud liquid water and ice water content. While these studies have established the individual benefits of aerosol radiative feedback and aerosol indirect effects, a comprehensive assessment of their combined and relative impacts on subseasonal prediction within a fully coupled UFS-Chem framework – using inline-predicted rather than climatological aerosol fields or diagnostic aerosol from MERRA-2 reanalysis data for both radiative and microphysical interactions – has not yet been undertaken. The present study addresses this gap by systematically quantifying the contributions of aerosol radiative feedback and the interactive aerosol–cloud–meteorology coupling associated with aerosol indirect effects, using the improved GEFS-GOCART schemes, both individually and in combination, to weather and subseasonal forecast skill.
The design of UFS-Chem offers several distinct advantages for advancing aerosol-aware prediction across timescales. The CCPP-based coupling infrastructure supports a range of atmospheric composition mechanisms, from the simplified GOCART aerosol scheme to the comprehensive AM4.1 gas-phase chemistry, within a unified framework through the CATChem library and modeling component, providing the flexibility to configure the level of chemical complexity appropriate for different applications. As a modular library, CATChem can also be readily adapted to other host models beyond the UFS, broadening its applicability across the modeling community. This modular design ensures consistency of aerosol–physics coupling across UFS weather, subseasonal, and seasonal applications, avoiding the need for separate development paths at different timescales. Building upon this infrastructure, UFS-Chem enables interactive aerosol direct, semi-direct, and indirect effects through two-way coupling between the inline-predicted aerosol fields and the host model radiation and microphysics schemes.
In the present study, we describe the development of UFS-Chem with the aerosol component from GEFS-Aerosols v12.3 for weather and subseasonal prediction. Section 2 describes the observational, reanalysis, and model data used for evaluation, along with the UFS and GEFS-GOCART configurations and their integration within the CCPP infrastructure. Section 3 shows the improved performance of GEFS-Aerosols v12.3. The implementation of inline large-scale wet deposition into the Thompson microphysics scheme is presented in Sect. 4. Section 5 presents the implementation of aerosol indirect effects through the interactive coupling between GOCART aerosols and the Thompson microphysics scheme. The aerosol radiative feedback and indirect effects in subseasonal prediction are quantified in Sect. 6. A summary, discussion, and future plans are provided in Sect. 7.
2.1 Observational, reanalysis, and ensemble analysis data
A variety of observational datasets, reanalysis and ensemble analysis products are used in this study to evaluate the performance of the model prediction and to provide reference fields for comparison. These datasets are as follows:
-
Total AOD fields from MERRA-2 (Gelaro et al., 2017) are used as the primary atmospheric reanalysis reference in this study. MERRA-2 includes extensive assimilation of aerosol observations and provides time-averaged (1 h) AOD reanalysis products at 0.625° × 0.5° horizontal resolution on 72 vertical levels.
-
Satellite-based AOD observations from the Moderate Resolution Imaging Spectroradiometer (MODIS) are employed for independent evaluation. We use the MODIS Collection 6.1 Level-3 daily and monthly AOD dataset at 1° horizontal resolution from the Aqua satellite (Levy et al., 2013), which is available from NASA Level-1 and Atmosphere Archive and Distribution System (LAADS) Distributed Active Archive Center (DAAC, https://ladsweb.nascom.nasa.gov/, last access: 10 September 2026). Collection 6.1 incorporates refined retrieval algorithms, including the expanded Deep Blue algorithm (Hsu et al., 2013; Sayer et al., 2013), and introduces a merged AOD product that combines retrievals from the Dark Target and Deep Blue algorithms to produce a spatially consistent dataset covering surface types ranging from oceans to bright deserts (Sayer et al., 2014). In this work, the Dark_Target_Deep_Blue_Combined_Mean product at 550 nm is used for quantitative evaluation of model results. The expected errors for Dark Target retrievals at 10 km resolution are ± (0.05 + 15 % AOD) over land and ± (0.03 + 5 % AOD) over ocean. For the Deep Blue retrievals at 10 km resolution over land, the expected errors are approximately ± (0.03 + 21 % AOD) for arid surfaces and ± (0.03 + 18 % AOD) for vegetated surfaces (Levy et al., 2013).
-
Additional satellite AOD observations are obtained from the Visible Infrared Imaging Radiometer Suite (VIIRS) sensor onboard the Suomi National Polar-orbiting Partnership satellite, which provides aerosol environmental data records based on daily global observations (Jackson et al., 2013; Liu et al., 2013). Beginning in 2012, VIIRS provides AOD at 550 nm on a global 0.1° horizontal resolution grid, and the daily gridded data are available from NOAA/NESDIS (https://www.star.nesdis.noaa.gov/atmospheric-composition-training/satellite_data.php, last access: 10 September 2026).
-
Ground-based AOD measurements from the Aerosol Robotic Network (AERONET; Holben et al., 1998) level 1.5 are used for point-based validation. AERONET is a globally distributed network of automated sun-photometer measurements comprising over 700 stations, providing AOD, surface solar flux, and additional radiometric products. The network employs CIMEL sun–sky spectral radiometers, which measure direct sun radiances at eight spectral channels centered at 340, 380, 440, 500, 675, 870, 940, and 1020 nm. AOD uncertainties in the direct sun measurements are within ± 0.01 for wavelengths longer than 440 nm and ± 0.02 for shorter wavelengths (Eck et al., 1999).
-
Global satellite-derived estimates of TOA net radiative flux and cloud fraction were obtained from Edition 4.2 of the Clouds and the Earth's Radiant Energy System (CERES) Energy Balanced and Filled (EBAF) products (Loeb et al., 2018; Kato et al., 2018; NASA/LARC/SD/ASDC, 2023). CERES EBAF data (hereafter simply “CERES data”) are available as monthly means on a 1° × 1° grid.
-
Version 2.1 of the Daily Optimum Interpolation Sea Surface Temperature (OISST; Huang et al., 2021) combines buoy and ship data with satellite measurements to provide a daily record of sea-surface temperature (SST) at 0.25° horizontal resolution. For the purposes of this study, OISST data was converted to monthly averages and regridded to 1° horizontal resolution.
-
The International Cooperative for Aerosol Prediction Multi-Model Ensemble (ICAP-MME; Reid et al., 2011; Sessions et al., 2015; Xian et al., 2019) provides 6-hourly global forecasts of total and dust AOD out to 120 h at 1° horizontal resolution. The total AOD ensemble is derived from four core multi-species models of ECMWF-CAMS, Japan Meteorological Agency Model of Aerosol species in the Global Atmosphere (JMA-MASINGAR), NASA Goddard Earth Observing System Version 5 (GEOS-5) and the Naval Research Lab Navy Aerosol Analysis and Prediction System (NRL-NAAPS), all of which incorporate aerosol data assimilation and satellite-based smoke emissions. Dust-only AOD additionally includes contributions from Barcelona Supercomputer Center Chemical Transport Model (NMMB/BSC-CTM), United Kingdom Met Office Unified Model (UKMO-UM), and NGACv2, although NGACv2 is excluded from the total AOD ensemble mean.
2.2 Key updates in operational GEFS-Aerosols v12.3
Table 1 shows the relationship and comparison of the global aerosol forecast systems: GEFS-Aerosols v12, GEFS-Aerosols v12.3, and UFS-Chem (this study). In the operational GEFS-Aerosols v12 and v12.3 configurations, the aerosol module employs a one-way coupling with the host model (FV3 with GFSv15 physics), whereby the prognostic aerosol fields from the coupled aerosol model do not feed back into the radiation calculations. Instead, MERRA-2 climatological aerosol data are used to compute aerosol radiative effects, including direct and semi-direct effects (Cheng and Yang, 2023). This configuration does not allow aerosol radiative feedback associated with real-time aerosol variability. It is worth noting that even within the NUOPC framework, GEFS-Aerosols v12 and v12.3 already achieves physically consistent aerosol convective transport, wet deposition, and boundary-layer mixing by leveraging the Simplified Arakawa-Schubert (SAS) convection scheme and PBL parameterization within the GFS v15 physics suite (Zhang et al., 2022). While convective transport and PBL mixing benefit from consistent physics in GEFS-Aerosols v12.3, other processes such as aerosol–radiation interactions, dry deposition, emissions coupling, and microphysics-dependent removal are still handled outside the physics suite.
Table 1Linkages and comparison among the global aerosol forecast systems: GEFS-Aerosols v12, GEFS-Aerosols v12.3, and UFS-Chem.

Several key updates were introduced in GEFS-Aerosols v12.3, including (1) an update of anthropogenic emissions from the Community Emissions Data System (CEDS) 2014 inventory to the 2019 version, (2) revised parameterizations for large-scale wet deposition and aerosol scavenging, and (3) fixes to known issues in the AOD calculation and the FENGSHA dust emission scheme. GEFS-Aerosols v12.3 has been implemented operationally since early 2023. Together, these updates aim to improve the representation of aerosol loading and reduce systematic biases in short-range forecasts. These updates have also been incorporated into UFS-Chem.
2.3 CCPP-Based GEFS-Aerosols v12.3
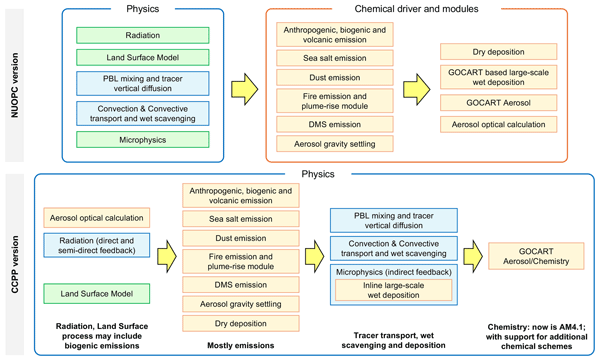
As shown in Table 1, UFS-Chem couples the aerosol model from GEFS-Aerosols v12.3, but it is implemented using the CCPP infrastructure with UFS. Figure 1 illustrates the differences in coupling structure between the NUOPC-based GEFS-Aerosols v12.3 configuration and the CCPP-based implementation adopted in UFS-Chem. In the NUOPC framework, atmospheric physics and chemistry are organized as separate components. Physical parameterizations – including radiation, land surface processes, PBL mixing, convection, and microphysics – are executed within the atmospheric physics component, while emissions, aerosol processes, chemistry, and deposition are handled within a chemistry or aerosol driver. Information exchange between these components occurs through predefined interfaces, resulting in a largely sequential execution of physics and chemistry processes. In contrast, the CCPP-based implementation reorganizes the coupling strategy by embedding chemistry and aerosol processes directly within the physics time step. As shown in Fig. 1, emissions processes of anthropogenic, biogenic, volcanic, dust, sea salt, fire, and dimethyl sulfide sources (DMS), aerosol gravity settling, dry deposition, large-scale wet deposition, and aerosol optical property calculations are treated as physics-aware modules that interact directly with radiation, PBL mixing, convection, and microphysics. Convective scavenging and convective transport continue to be handled by SAS convection scheme. This design allows chemical and aerosol tracers to be transported, mixed, scavenged, and removed using the same physical parameterizations applied to meteorological tracers.

Figure 1Schematic comparison of NUOPC-based coupling in GEFS-Aerosols (top) and the CCPP-based implementation in UFS-Chem (bottom), highlighting the transition from externally coupled chemistry to chemistry and aerosol processes embedded directly within the FV3 physics suite. Color coding indicates process origin: orange denotes original GOCART aerosol processes; blue indicates aerosol-related processes inline-merged into the physics suite; and green represents original physics processes. The box is labelled “GOCART Aerosol/Chemistry” as interactive gas-phase chemistry (AM4.1) is included alongside the GOCART aerosol module.
In the CCPP framework, chemistry and aerosol processes are decomposed into process-level modules and embedded directly within the GFS physics suite, allowing tracer transport, mixing, scavenging, deposition, and aerosol–radiation interactions to be handled within the host physics time step. Under this framework, tracer transport by PBL mixing and convection, convective and stratiform wet scavenging, and microphysics-dependent removal are calculated within the host physics parameterizations rather than being recomputed inside a standalone chemistry or aerosol model. This approach allows aerosols and gases to experience atmospheric processes using the same physical tendencies applied to meteorological fields. In addition, because the meteorological fields required for transport and deposition are already available within the physics suite, there is no need to import or re-diagnose these fields within the chemistry or aerosol component. As a result, redundant calculations may be reduced, and chemistry–physics interactions can be handled inline within the physics workflow. Using the same physics suite and model configuration as GEFS-Aerosols v12.3, the CCPP-based GEFS-Aerosols implementation at the initial stage of development required approximately 22–23 min for a 1 d forecast, compared with approximately 24 min for GEFS-Aerosols v12.3, corresponding to a 4 %–8 % reduction in runtime.
Overall, the CCPP-based GEFS-Aerosols configuration in UFS-Chem provides a tightly coupled and extensible framework for atmospheric composition modeling. This design facilitates the representation of chemistry–physics interactions, supports future expansion to alternative chemical mechanisms, and aligns GEFS-Aerosols with the unified physics architecture of the broader UFS.
2.4 UFS-Chem configuration
The UFS is a fully coupled modeling framework capable of integrating multiple Earth system components for subseasonal prediction (Fu et al., 2024). In this study, the UFS configuration includes the atmospheric model employing the Finite-Volume Cubed-Sphere (FV3) dynamical core (Harris et al., 2021), the GFS v17 physics suite, the ocean model (GFDL Modular Ocean Model version 6, MOM6; Adcroft et al., 2019), the sea-ice model (Los Alamos Sea Ice Model version 6, CICE6), the wave model (WAVEWATCH III, WW3; the WAVEWATCH III Development Group, 2019), and CATChem v1 (He et al., 2026). The atmospheric model is configured with a horizontal grid of C384 (approximately 25 km horizontal resolution) and employs 127 vertical levels, with the model top at 0.01 hPa, providing enhanced vertical resolution in the upper atmosphere. The MOM6 is configured at 25 km horizontal resolution with 75 vertical layers, while CICE6 also operates at a 25 km horizontal resolution. WW3 uses a 50 km horizontal resolution. Key updates in the GFS v17 physics suite include the Thompson microphysics scheme (Thompson et al., 2008; Thompson and Eidhammer, 2014), the Noah-MP land surface model (Niu et al., 2011, He et al., 2023), the addition of non-orographic gravity wave drag, and updates to the scale-aware SAS convection scheme (Han and Pan, 2011, Bengtsson and Han, 2024) and the turbulent kinetic energy–based eddy-diffusivity mass-flux PBL scheme (Han et al., 2022).
For the aerosol model configuration in UFS-Chem, the biomass-burning emissions are prescribed using the NOAA operational Blended Global Biomass Burning Emissions Product version 4 dataset (GBBEPx v4), which has been used for real-time operational applications since 2019. The GBBEPx v4 system provides daily global emissions of particulate matter with aerodynamic diameter ≤ 2.5 µm (PM2.5), black carbon (BC), organic carbon (OC), carbon monoxide (CO), carbon dioxide (CO2), and sulfur dioxide (SO2) (Zhang et al., 2019). A one-dimensional, time-dependent plume-rise module from the High-Resolution Rapid Refresh Smoke (HRRR-Smoke) model has been implemented in UFS-Chem, similar to that in GEFS-Aerosols, to calculate biomass burning emission injection heights and emission rates online (Ahmadov et al., 2017). The scheme is a modified version of the WRF-Chem plume-rise module (Freitas et al., 2007) that uses fire radiative power to estimate fire heat fluxes instead of a lookup table. It is applied with the GBBEPx v4 biomass burning emissions dataset to represent plume-rise processes that vertically distribute biomass burning emissions. Global anthropogenic emissions are taken from the CEDS v2019, which supplies emissions of BC, OC, and SO2 (McDuffie et al., 2020) for GEFS-GOCART aerosols. Compared with CEDS v2014 (Hoesly et al., 2018), this updated dataset extends emissions through 2017 and improves consistency with other widely used global bottom-up inventories. The GEFS-GOCART aerosol mechanism is originally from WRF-Chem GOCART (Zhang et al., 2022), which employs a bulk representation for sulfate, OC, and BC, distinguishing between hydrophilic and hydrophobic components. Dust aerosols are represented using the sectional FENGSHA dust scheme developed by NOAA's Air Resources Laboratory (Zhang et al., 2022). Relative to the version implemented in GEFS-Aerosols v12.3, the dust emission parameterization has been updated by incorporating the Baker–Schepanski map (NOAA EPIC, 2023) and improved surface input datasets. The sea salt scheme uses a five-bin sectional approach based on Gong (2003), with modifications similar to those of Jaeglé et al. (2011). Sea salt emissions are parameterized as a function of near-surface wind speed and do not directly depend on wave model coupling. Similar to GEFS-Aerosols v12.3, aerosol convective transport, wet deposition, and boundary-layer mixing are handled consistently through the SAS convection scheme and PBL parameterization within the GFS v17 physics suite. In this study, the UFS-Chem experiments are configured using the High-Resolution 3 configuration, with details provided in He et al. (2026).
In the current UFS-Chem framework, a two-way inline coupling has been implemented between the GOCART aerosol model and the radiation scheme, enabling aerosol radiative feedback of direct and semi-direct effects from the inline-coupled aerosol simulation. The AOD and aerosol optical parameters are calculated inline within the GFS v17 physics suite using the NASA GOCART look-up table, with aerosol input from either the diagnostic MERRA-2 climatological aerosol fields or the prognostic aerosol concentrations from the coupled aerosol prediction as in Cheng et al. (2026). This capability allows the prognostic aerosol optical properties derived from the inline-predicted aerosol mass concentrations and size distributions to directly influence shortwave and longwave radiative fluxes at each model time step, thereby representing aerosol radiative feedback that is absent in the one-way coupled configuration.
2.5 UFS-Chem model experiments
Experiments were performed using two configurations: (1) a cycling run, in which the atmosphere–aerosol model is initialized every 24 h with Global Data Assimilation System (GDAS) meteorological fields while aerosol fields are recycled from the previous cycle, representing an operational scenario and providing a near–best-case estimate of meteorological conditions for 1 d forecasts; and (2) a subseasonal run, a fully coupled configuration in which the atmosphere–aerosol system is coupled with the ocean, wave, and sea-ice components and initialized only once at the beginning to produce a 1-month prediction. Due to the unavailability of wave initial conditions for long-term simulations, the wave model was uncoupled for the 6-year experiments (2012–2017) to maintain consistency of each year. The atmosphere, ocean, and sea-ice components remained fully coupled; therefore, SST evolution was maintained through atmosphere–ocean coupling. The omission of wave coupling has a minor impact on the calculation of air–sea fluxes but is not expected to substantially affect the conclusions of this study.
The details of UFS-Chem experiment configurations are described in Tables 2 and 3. All subseasonal experiments are initialized using GDAS analyses for the meteorological variables and MERRA-2 reanalysis for the GOCART prognostic aerosol species and tracers. By isolating these two dimensions – feedback complexity and aerosol source – we aim to identify the dominant mechanisms through which interactive aerosol treatment improves subseasonal prediction fidelity. While control run uses radiative feedback from prescribed climatological aerosols, EXP1 is able to assess the impact of replacing MERRA-2 climatological aerosols with inline-predicted aerosols for radiative feedback, and EXP2 further includes aerosol indirect effects through interactive aerosol–cloud coupling using inline-predicted aerosols. Comparing Control and EXP1 isolates the effect of the aerosol radiative source (climatological versus inline-predicted) on forecast biases. Comparing EXP1 and EXP2 further isolates the incremental contribution of aerosol indirect effects, enabling attribution of bias reductions to aerosol–radiation and aerosol–cloud interaction pathways.
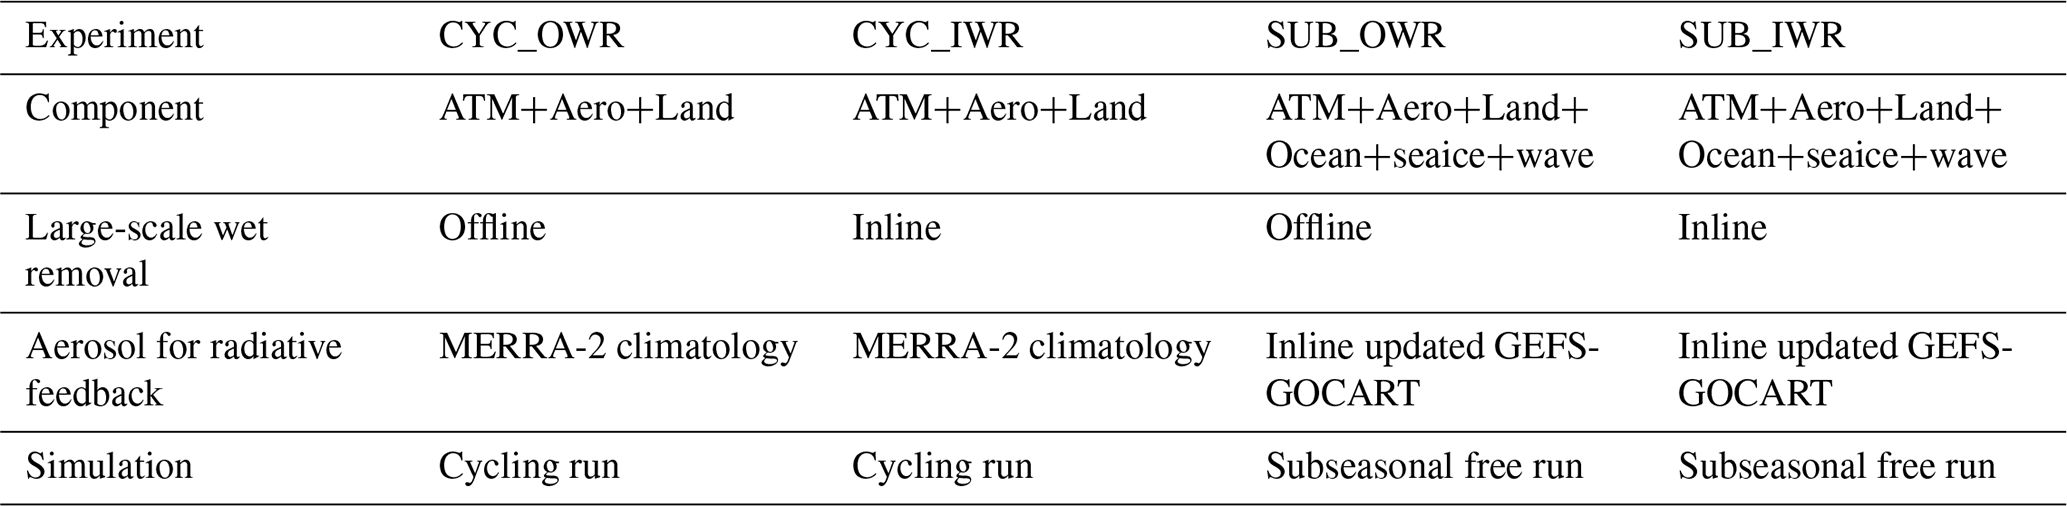
Table 3UFS-Chem subseasonal experiments for aerosol radiative feedback and aerosol indirect effects.

To assess the robustness of the single-case results from August 2016, we also extend the analysis to a 6-year period by conducting subseasonal experiments for each August from 2012 to 2017 in Sect. 5. This study focuses on August, when biomass burning activity and aerosol loading are typically elevated, providing a suitable period for evaluating aerosol–radiation–cloud interactions. Although aerosol direct and indirect effects exhibit seasonal variability, extending the analysis to additional seasons requires substantially greater computational resources and is left for future work.
To provide context for the development of the CCPP-based GEFS-Aerosols (UFS-Chem), the following comparison summarizes the major improvements introduced in the operational GEFS-Aerosols v12.3 relative to GEFS-Aerosols v12. Since UFS-Chem is developed based on the GEFS-Aerosols v12.3 framework and these improvements have not been previously documented in the literature, this comparison in this section is included to establish the baseline capability of GEFS-Aerosols v12.3 rather than to directly evaluate UFS-Chem. The following experiments with both GEFS-Aerosol v12 and GEFS-Aerosol v12.3 are conducted in a cycling configuration consistent with operations. Figure 2 compares the monthly mean Day-1 AOD forecasts at 550 nm over North America for August 2021 from GEFS-Aerosols v12 and v12.3 against MERRA-2 reanalysis, the ICAP-MME, and satellite observations from MODIS and VIIRS. In GEFS-Aerosols v12, AOD values exceeding 1.0 are simulated over extensive regions of the western and central United States, producing a pronounced high bias that is not supported by the reanalysis, the multi-model ensemble, or the satellite retrievals. MERRA-2, ICAP-MME, MODIS, and VIIRS consistently indicate that elevated AOD during this period is largely confined to the Pacific Northwest and northern Great Plains, associated with wildfire smoke transport. GEFS-Aerosols v12.3 shows a substantial reduction in this positive AOD bias, with more spatially confined aerosol plumes and peak magnitudes that are in closer agreement with both the reanalysis products and satellite observations. The excessive westward and southward spread of high AOD values evident in v12 is notably reduced in v12.3, resulting in improved spatial distribution and more realistic AOD maxima. These improvements are primarily associated with the revised large-scale wet removal scheme and the corrected AOD calculation in v12.3, which together improve the representation of both the intensity and spatial extent of aerosol events over North America. OC is one of the dominant aerosol species emitted from wildfires. Comparison of OC AOD with the MERRA-2 reanalysis indicates that improved representation of OC AOD contributes substantially to the reduction of positive total AOD biases in GEFS-Aerosols v12.3 relative to v12 over North America. Figure 3 presents the spatial distribution of the monthly mean Day-1 forecast biases of total AOD and OC AOD for August 2021, defined as GEFS-Aerosols minus MERRA-2, for GEFS-Aerosols v12 and v12.3. In GEFS-Aerosols v12, pronounced positive total AOD biases are evident across much of western and central North America, with particularly large overestimations over the western United States and the downwind regions. The spatial pattern of OC AOD biases in v12 closely resembles that of the total AOD biases, indicating that the overestimation of organic aerosol loading is the major contributor to the high total AOD biases. In contrast, GEFS-Aerosols v12.3 shows a substantial reduction in both total AOD and OC AOD biases across large portions of North America, reflecting improvements associated with the model updates introduced in v12.3. Although the overall positive biases compared to MERRA-2 are largely reduced, weak negative total AOD biases emerge in some regions of the central and eastern United States. These negative biases against MEERA-2 likely reflect the combined effects of carbonaceous aerosols and sulfate aerosols. Overall, the comparison between v12 and v12.3 indicates that updates to fire emissions, wet deposition, and AOD calculations lead to substantial improvements in aerosol simulations across North America, providing a more robust aerosol baseline for the development of UFS-Chem.
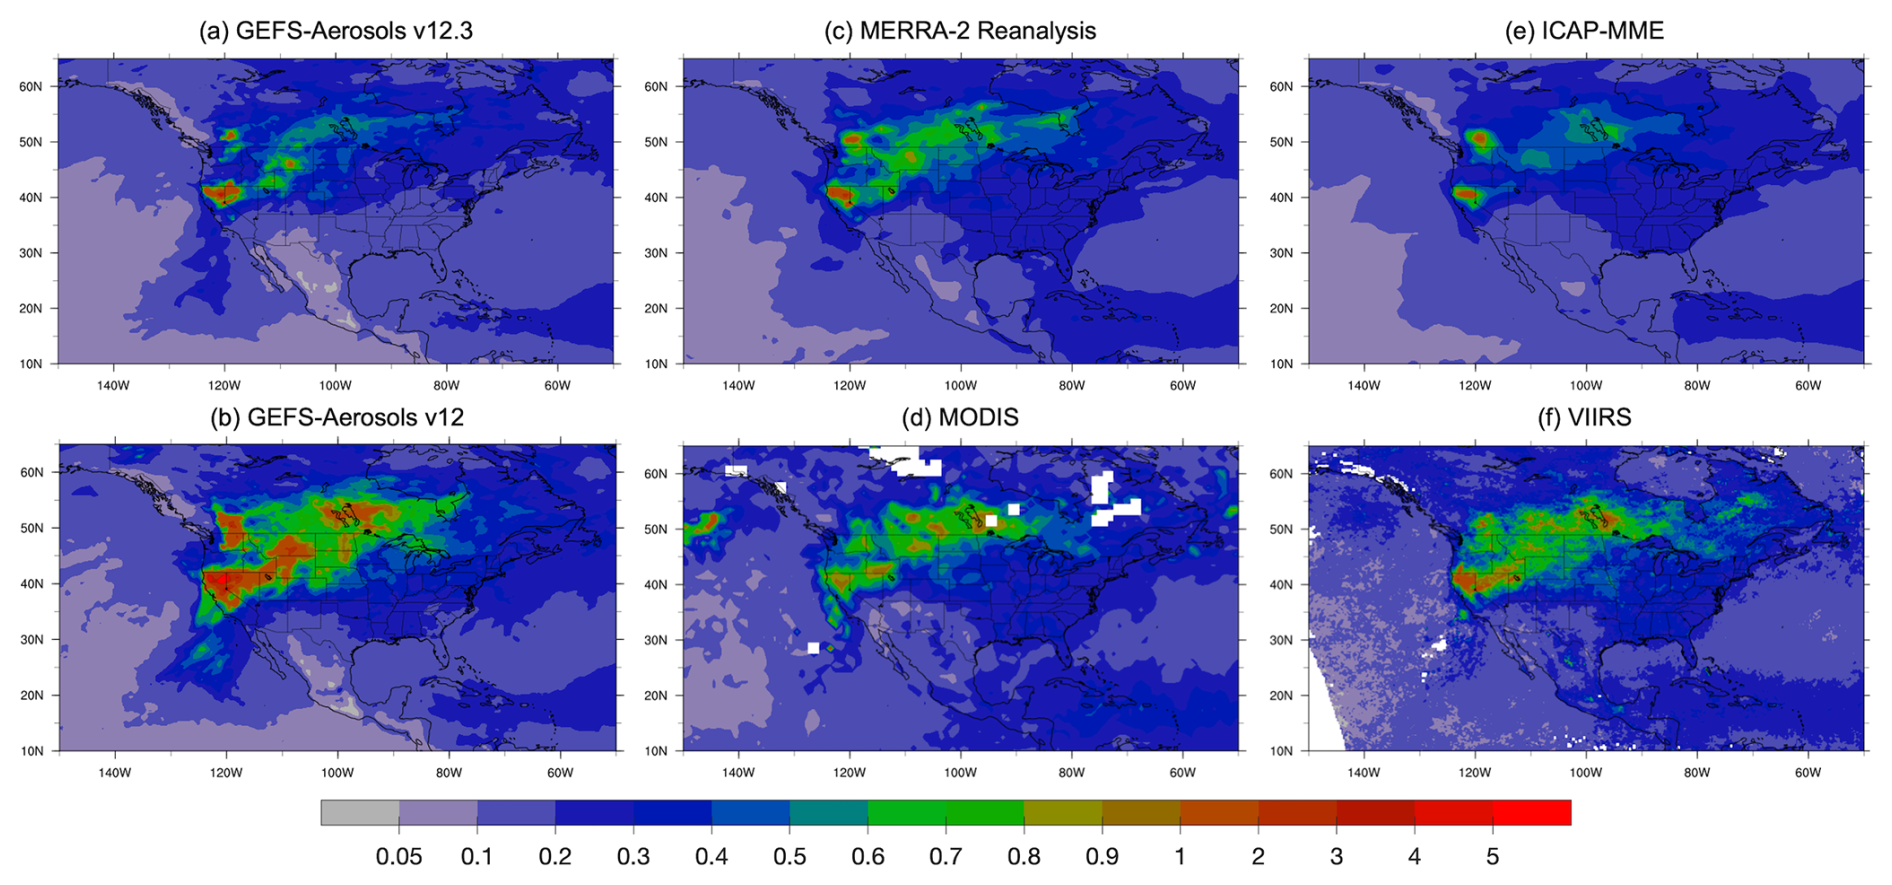
Figure 2Monthly mean Day-1 AOD forecasts for August 2021 over North America from (a) GEFS-Aerosols v12.3, (b) GEFS-Aerosols v12 compared with (c) MERRA-2 reanalysis; (d) MODIS; (e) ICAP multi-model ensemble; and (f) VIIRS observation. All panels show AOD at 550 nm.
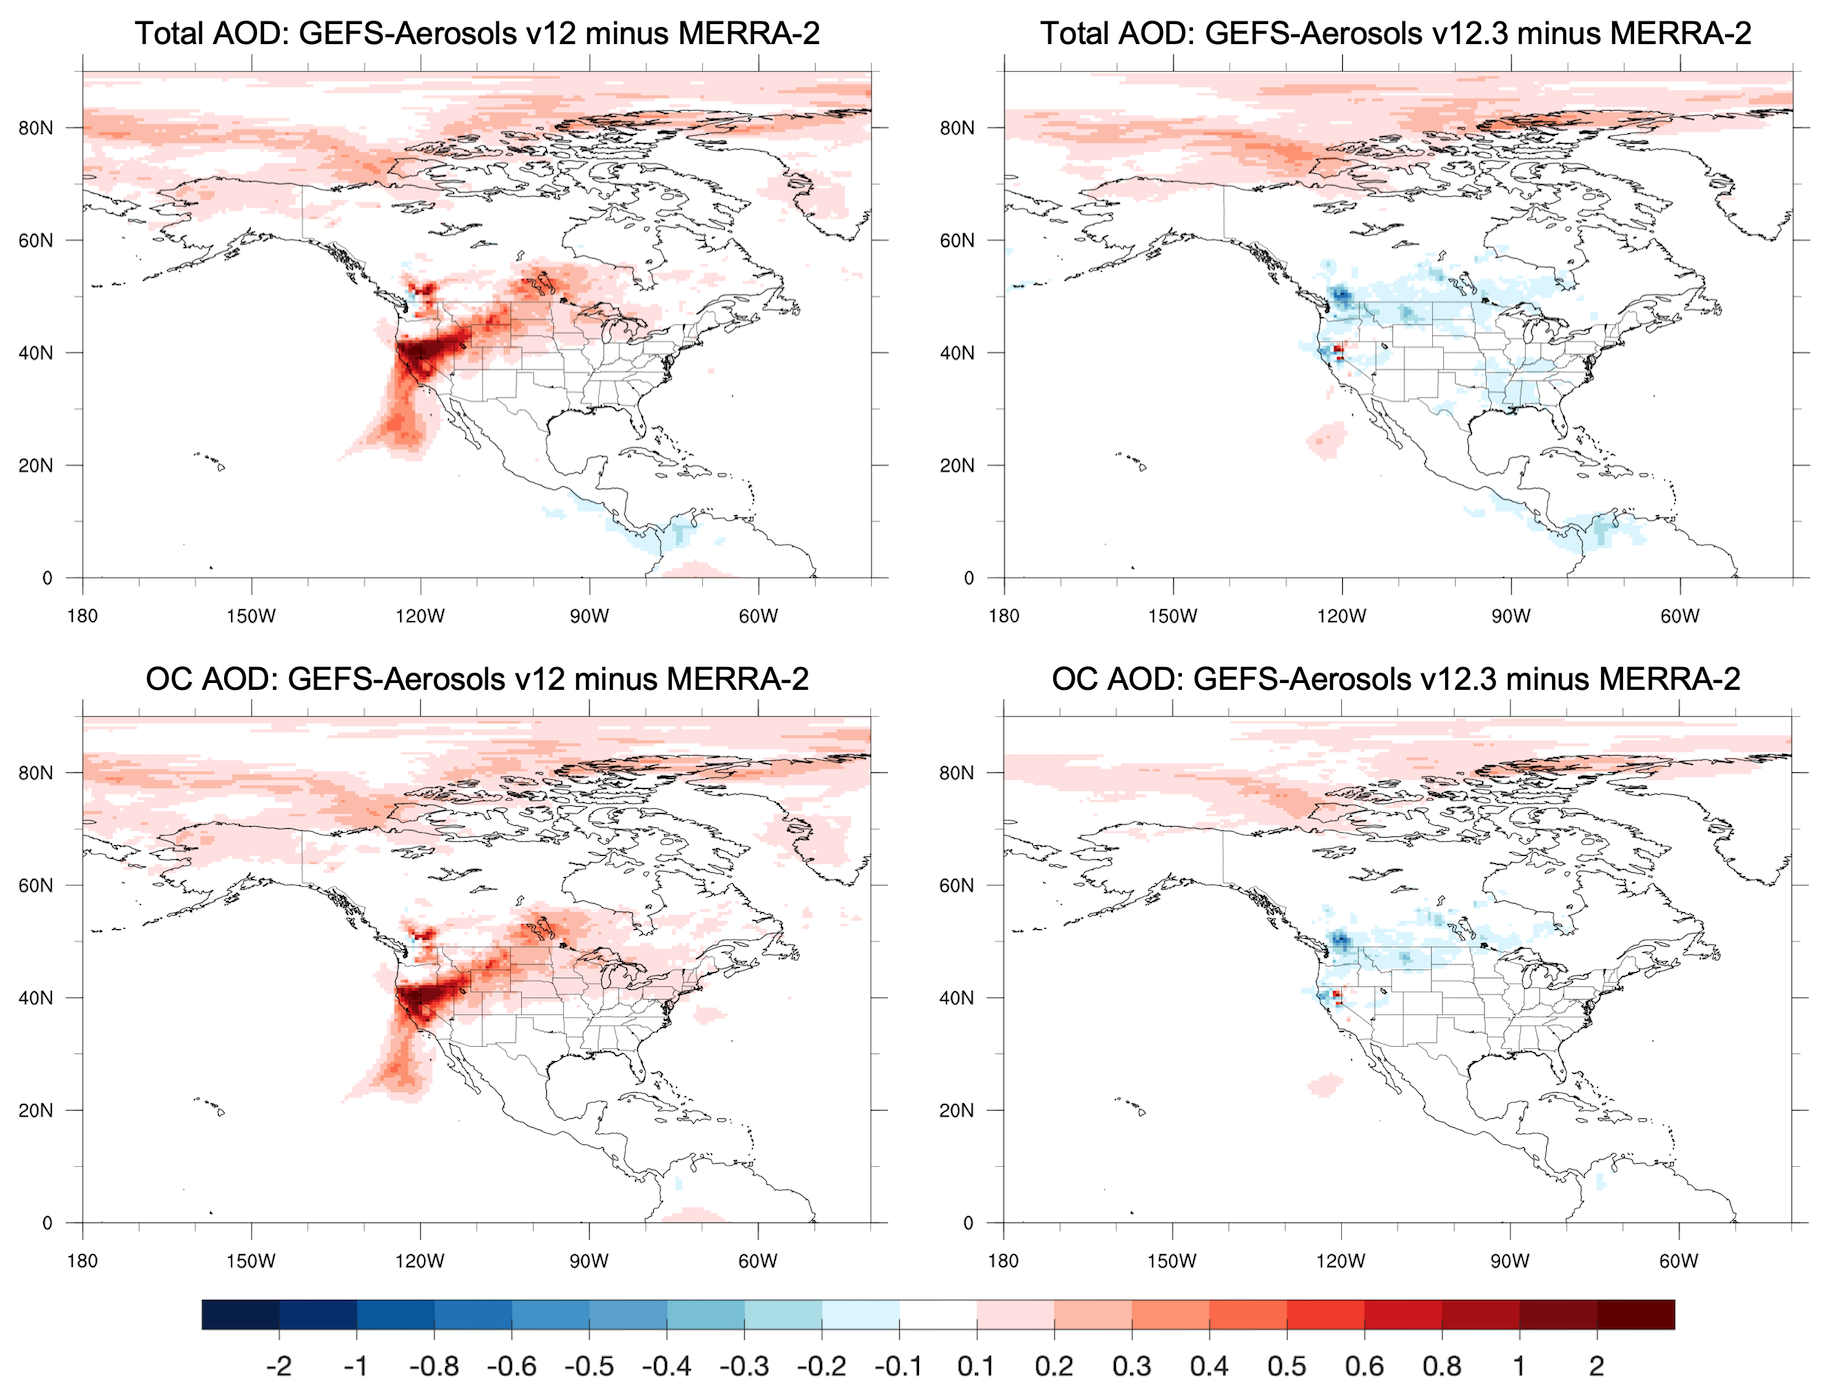
Figure 3Monthly mean Day-1 Total AOD (top) and OC AOD (bottom) forecast biases for August 2021, defined as GEFS-Aerosols minus MERRA-2, for GEFS-Aerosols v12 (left) and v12.3 (right).
In addition to evaluations against MERRA-2 reanalysis and satellite-based products, the performance of GEFS-Aerosols was further assessed using daily AERONET observations for August 2021. Table 4 summarizes the root mean square error (RMSE) and correlation coefficients of Day-1 AOD forecasts from GEFS-Aerosols v12, and v12.3 at approximately 25 AERONET sites located near major wildfire-affected regions across the United States and Canada. Corresponding scatter plots are shown in Fig. A1 in Appendix A. The statistical results indicate substantial improvement in forecast performance in the updated v12.3 configuration. Correlation coefficients show notable improvement in v12.3, indicating better representation of day-to-day AOD variability. At PNNL, the correlation increases from 0.365 to 0.721, an improvement of approximately 97 %. At Railroad Valley, the correlation improves from 0.395 to 0.732, an increase of approximately 85 %, and at Neon Wood, from 0.482 to 0.751, an increase of approximately 56 %. These improvements in correlation are particularly significant at sites where wildfire-driven aerosol variability is most pronounced. For most sites over the western United States, RMSE values are also significantly reduced in v12.3 compared with v12. The most pronounced improvements are again observed at sites heavily influenced by wildfire smoke: at Bozeman, RMSE decreases from 2.19 to 0.49, a reduction of approximately 78 %; and at Rexburg Idaho, from 3.414 to 0.473, a reduction of approximately 86 %. In California, similarly large reductions are evident at Bakersfield (from 1.19 to 0.288, approximately 76 %), and NASA Ames (from 1.64 to 0.32, approximately 80 %). The overall performance improvement is further illustrated in Fig. A1, which compares the correlation coefficients and RMSE values at individual AERONET sites between GEFS-Aerosols v12 and v12.3. Most sites lie above the 1 : 1 line for correlation and below the 1 : 1 line for RMSE, indicating that GEFS-Aerosols v12.3 generally improves AOD forecast skill by increasing correlation and reducing RMSE.
Table 4AERONET site information, the correlation coefficients and RMSE of GEFS-Aerosols v12, GEFS-Aerosols v12.3 and MERRA-2 AOD with respect to that of AERONET observation for the period 1–31 August 2021. The correlation coefficients are statistically significant at the 95 % confidence level.

Although GEFS-Aerosols v12.3 generally improves the AOD forecasts relative to v12, a few AERONET sites exhibit degraded performance. This likely reflects the regional response to multiple model updates, including the transition and updates of fire emissions and anthropogenic emissions, fixes to the dust emissions and AOD calculations, and improvements to wet deposition. These changes improve the overall forecast skill but may not produce uniform improvements at every individual site.
In many chemistry and aerosol modeling systems, large-scale wet removal is treated as an offline process, calculated within the chemistry or aerosol module using meteorological fields (e.g. large-scale precipitation etc.) provided by the host atmospheric model (Grell et al., 2005; Eastham et al., 2018; Appel et al., 2021; Collow et al., 2024). Because each chemistry or aerosol scheme applies its own internal logic for scavenging efficiency, vertical integration, and removal thresholds, this offline approach can produce scheme-dependent differences in aerosol removal – even when identical host model physics and precipitation fields are used as input. Such inconsistencies complicate model intercomparisons, reduce reproducibility, and can lead to divergent aerosol distributions and radiative effects across coupled configurations. To address this limitation, we implement large-scale wet removal inline within the Thompson microphysics scheme used in the GFSv17 physics suite, allowing aerosol scavenging to be handled directly by the physics that governs cloud formation and precipitation. This design is intended to improve consistency between aerosol removal and the host model's cloud and precipitation processes, independent of the specific chemistry or aerosol mechanism employed. In addition, the inline implementation improves computational efficiency by avoiding the need to export meteorological fields to the chemistry or aerosol model for redundant wet-removal calculations. This framework provides a more consistent and extensible treatment of aerosol wet removal within UFS-Chem, facilitating robust application across cycling and fully coupled subseasonal configurations.
When the option for inline large-scale wet removal is enabled in the UFS model namelist, the Thompson microphysics scheme calculates large-scale wet removal of GOCART aerosol species through collection by precipitating hydrometeors. The coupling framework performs a mass-to-number conversion of prognostic GOCART aerosol species at each microphysics time step. The water-friendly aerosol number concentration (NWFA), representing cloud condensation nuclei (CCN), is calculated by summing contributions from sulfate, five sea salt bins, and hydrophilic carbonaceous species of hydrophilic OC. The ice-friendly aerosol number concentration (NIFA), representing ice-nucleating particles (INP), is derived from five dust bins (Cheng and Yang, 2025). Scavenging by rain, snow, and graupel is calculated during the microphysics integration using size-dependent collection efficiencies determined from the Stokes number, particle characteristics, and hydrometeor properties following Slinn (1984), Wang et al. (2010) and Thompson and Eidhammer (2014). The removal rates are computed as the product of an aerosol removal coefficient, collection efficiency, aerosol number concentration, and hydrometeor size-distribution parameters. Each aerosol species has a characteristic diameter used in the collection efficiency calculation, and the removal rate is proportional to the overlap between aerosol and hydrometeor size distributions. The wet-removed aerosol number concentrations are tracked separately for each species and precipitation type. The mass tendencies associated with this wet removal are communicated back to the GOCART model at each physics time step through the chemistry–physics coupling interface. This maintains mass conservation and ensures consistency between the microphysical scavenging and aerosol transport processes.
Figure 4 illustrates the impact of implementing inline large-scale wet removal within the Thompson microphysics scheme on simulated AOD biases in both the 24 h cycling and fully coupled subseasonal configurations for August 2016. The model configurations of these experiments are described in Table 2, and no aerosol indirect effect from inline predicted aerosol is enabled. The CYC_OWR and CYC_IWR experiments represent the 24 h cycling runs with offline and inline large-scale wet removal, respectively, whereas the SUB_OWR and SUB_IWR experiments represent the subseasonal free runs with offline and inline large-scale wet removal, respectively. When the large-scale wet removal process is treated within the aerosol model of GEFS-GOCART scheme, the CYC_OWR and SUB_OWR simulations exhibit markedly different AOD bias patterns, indicating strong sensitivity to the free subseasonal run despite identical host-model physics. These discrepancies reflect inconsistencies between aerosol removal and cloud–precipitation processes when wet scavenging is parameterized independently of atmospheric physics. In practice, achieving relatively small AOD biases in the subseasonal configuration using the offline wet removal scheme tends to worsen the performance in the cycling configuration (CYC_OWR), leading to larger biases there and highlighting the difficulty of maintaining consistent aerosol behavior across forecast configurations. It should be noted that this behavior is not a universal issue with offline wet-removal schemes, but rather reflects characteristics of the specific formulation used in GEFS-GOCART. Other offline wet-removal parameterizations may exhibit better consistency across forecast configurations, depending on the meteorological predictors used and their stability in subseasonal simulations. Using the implementation of inline large-scale wet removal within the Thompson microphysics scheme, the AOD bias patterns become substantially more consistent between the cycling (CYC_IWR) and subseasonal (SUB_IWR) simulations. Both configurations exhibit similar spatial structures and comparable bias magnitudes, indicating that aerosol removal is now governed by the same cloud and precipitation processes across timescales. This result highlights the advantage of implementing large-scale wet removal directly within the host model microphysics scheme. By coupling aerosol scavenging to the same physical processes that produce clouds and precipitation, the inline approach reduces configuration-dependent inconsistencies and provides a more robust framework when coupling different aerosol or chemistry modules that may otherwise employ their own offline wet-removal parameterizations.

Figure 4AOD biases with respect to MERRA-2 for the following experiments in August 2016: (a) CYC_OWR, a 24 h cycling run with offline large-scale wet removal; (b) SUB_OWR, a fully coupled subseasonal run with offline large-scale wet removal; (c) CYC_IWR, a 24 h cycling run with inline large-scale wet removal; and (d) SUB_IWR, a fully coupled subseasonal run with inline large-scale wet removal.
The divergence in AOD bias patterns between offline and inline wet-removal implementations reflects the complex sensitivity of the offline scavenging formulation to multiple interacting model fields, which evolve differently in cycling versus subseasonal configurations. The offline large-scale wet-removal scheme in the updated GEFS-GOCART calculates scavenging coefficient as the ratio of precipitation rate to column-integrated cloud water (including density, vertical velocity, and layer thickness), applying removal only where local cloud condensate exceeds a minimum threshold. This formulation introduces several pathways through which systematic differences between cycling and subseasonal configurations can alter wet-removal efficiency. Even when bulk precipitation amounts remain comparable, subseasonal runs may generate this precipitation through different microphysical pathways – potentially involving reduced column-integrated cloud water, altered vertical velocity distributions, or more efficient autoconversion processes. The layer-by-layer application of the threshold criterion means that configurations producing comparable precipitation from fewer cloud-bearing layers will exhibit systematically reduced wet removal. Furthermore, the denominator's dependence on instantaneous cloud water flux rather than accumulated precipitation creates a fundamental inconsistency: aerosol scavenging becomes coupled to the model's diagnosed cloud state rather than to the precipitation that physically drives the removal process. This dependence on instantaneous cloud state amplifies any systematic biases in cloud microphysics that develop during extended free-running forecasts, providing a mechanistic explanation for the configuration-dependent AOD bias divergence.
In contrast, the inline Thompson implementation couples aerosol removal directly to hydrometeor collection processes within the microphysics calculations. This approach reduces sensitivity to biases in diagnosed cloud condensate and ensures that aerosol scavenging remains consistent with the precipitation physics across both cycling and subseasonal configurations. As a result, the inline implementation provides a more physically consistent and robust treatment of large-scale wet removal within UFS-Chem.
Aerosol–cloud interactions are widely recognized as the most uncertain component of estimates of global radiative forcing (Seinfeld et al., 2016). These interactions occur when aerosols act as CCN or INP, altering cloud microphysical properties such as droplet number concentration and size distribution (IPCC, 2021). Such changes can subsequently influence precipitation processes through cloud lifetime effects, whereby smaller droplets delay the onset of precipitation and may increase cloud spatial extent and liquid water content (Seinfeld et al., 2016; Gordon et al., 2023; Li et al., 2024).
In the baseline Thompson microphysics scheme (Thompson et al., 2008), cloud droplet number concentration is prescribed as a constant – 100 cm−3 over land and 50 cm−3 over ocean – thereby neglecting the spatiotemporal variability in aerosol concentrations and their influence on cloud microphysical properties. Similarly, ice nucleation in the baseline Thompson microphysics scheme relies on an empirical temperature-dependent parameterization (Cooper, 1986) rather than explicitly representing INP populations, preventing the scheme from distinguishing between pristine and aerosol-laden environments. Because cloud radiative properties and autoconversion rates (Berry and Reinhardt, 1974) are governed by these fixed assumptions, the baseline configuration cannot represent aerosol indirect effects such as cloud albedo modification (Twomey, 1977) and precipitation suppression (Albrecht, 1989). This lack of aerosol awareness is particularly limiting for extended-range forecasts, in which episodic events such as dust outbreaks or wildfire (biomass burning) can significantly influence cloud properties and precipitation efficiency.
Building upon the aerosol-aware Thompson–Eidhammer microphysics scheme (Thompson and Eidhammer, 2014), which utilizes climatological aerosol fields as initial conditions and parameterized surface emissions to predict NWFA and NIFA that subsequently act as CCN and INP, respectively, Li et al. (2024) developed an approach incorporating inline emission modules to replace climatological emissions with more realistic and dynamic source terms. In this work, we develop and implement an option within the GFSv17 physics suite of the UFS to enable fully prognostic aerosol–cloud interactions when coupled with the GEFS-GOCART from GEFS-Aerosol v12.3. As illustrated in Fig. 5, this is achieved by coupling the GOCART aerosol model with the Thompson microphysics scheme through a bidirectional framework that integrates inline large-scale wet removal processes. The 15 GOCART aerosol species are used within the coupling framework to support both aerosol–cloud interactions and inline wet scavenging processes. The GOCART aerosol mass mixing ratios are converted to ice-friendly aerosol (IFA) and water-friendly aerosol (WFA) number concentrations following Cheng and Yang (2025). The IFA number concentration is derived from the five dust size bins using the corresponding particle masses based on the bin median radius and particle density. The WFA number concentration is computed from sea salt, sulfate, and hydrophilic organic carbon (OC2) using the prescribed conversion coefficients of the Thompson aerosol-aware microphysics scheme. It should be noted that not all 15 species are mapped to activation proxies for aerosol indirect effects. For the aerosol–cloud interaction component, only a subset of species is mapped to the NWFA and NIFA proxies used by the microphysics activation parameterizations. The remaining aerosol species are not used in the CCN or INP activation calculations but are still fully included in the inline large-scale wet removal processes. As a result, all 15 prognostic GOCART aerosol species participate in the microphysics-based wet scavenging calculations, ensuring consistent aerosol removal across the coupled system.

Figure 5Schematic of the GOCART–Thompson coupling framework for prognostic aerosol–cloud interactions in UFS-Chem. NIFA and NWFA are the ice-friendly aerosol number concentration and water-friendly aerosol number concentration, respectively.
Extending the work of Li et al. (2024) and Cheng et al. (2026), neither of which included inline aerosol–model coupling, this development refines the aerosol–microphysics coupling described in Sect. 4 and integrates inline wet scavenging within the Thompson microphysics scheme. This approach reduces coupling-related biases that can affect aerosol simulations in extended forecasts and enables a more consistent representation of aerosol–cloud interactions across weather and subseasonal prediction timescales. Increased aerosol loading leads to higher cloud droplet number concentrations and smaller mean droplet sizes. This change modifies cloud optical properties through the first indirect effect (Twomey, 1977) and suppresses the autoconversion of cloud water to rain through the second indirect effect (Albrecht, 1989), as illustrated in Fig. 5. In addition, dust aerosols act as INP and facilitate ice formation, with their concentration predicted using the empirical parameterization of DeMott et al. (2010) as a function of temperature and dust particle concentration. Higher concentrations of IFA increase ice crystal number concentrations and influence downstream ice microphysical processes, including depositional growth, aggregation, and riming, commonly referred to as the glaciation indirect effect.
A distinguishing feature of this implementation is the maintenance of physical consistency through mass-conserving aerosol budgets (Fig. 5). As described in Sect. 4, aerosol scavenging by precipitation is calculated inline within the microphysics scheme using size-dependent collection efficiencies. To maintain budget closure, aerosol activation into cloud droplets reduces NWFA proportionally to the diagnosed droplet number, ice nucleation consumes NIFA according to the activated ice crystal number, and wet removal decreases the concentrations of prognostic GOCART aerosol species according to the simulated hydrometeor collection rates. All aerosol tendencies derived from these processes are accumulated and returned to the chemistry component (Fig. 5). This feedback enables multi-day aerosol evolution within the coupled system, which is important for subseasonal prediction. Overall, this closed-loop coupling provides a unified framework in which aerosol emissions, chemistry, transport, wet and dry deposition, and cloud interactions are represented consistently within the host model physics, supporting applications that span weather to subseasonal prediction timescales.
Aerosol–radiation and aerosol–cloud interactions represent key sources of uncertainty in S2S predictions. In many operational S2S systems, aerosol fields are prescribed from climatology, which neglects the radiative feedback of aerosol direct and semi-direct effects from prognostic aerosol variations and their indirect effects on cloud microphysics (Benedetti and Vitart, 2018; Bozzo et al., 2020; Fu et al., 2024).

Figure 6AOD biases relative to MERRA-2 reanalysis for August 2016 in UFS-Chem. (a) Control: aerosol radiative feedback from prescribed MERRA-2 climatological aerosol fields; (b) EXP1: aerosol radiative feedback from inline-predicted aerosols; (c) EXP2: aerosol radiative feedback and aerosol indirect effects from inline-predicted aerosols.
To quantify these aerosol–radiation and aerosol–cloud interaction effects, Fig. 6 presents the total AOD biases relative to MERRA-2 reanalysis across three experiment configurations (Table 3), using August 2016 as a representative case study, a period that also corresponds to the evaluation of inline large-scale wet removal within the Thompson microphysics scheme (Fig. 4). All experiments use the inline large-scale wet removal, with differences arising from how aerosol radiative feedback and aerosol indirect effects are represented. In general, all three experiments show similar biases over broad regions, mostly within −0.1 to 0.1 (Fig. A2). The largest positive biases are mainly associated with wildfire regions over southern Africa and their downwind areas. In contrast, significant negative biases are primarily located over major dust source regions in northern Africa and the Middle East. The Control experiment, which employs MERRA-2 climatological aerosol fields for radiative feedback of direct and semi-direct effects, exhibits substantial positive AOD biases over Northern Hemisphere high latitudes. Replacing the climatological fields with inline-predicted aerosols from GEFS-GOCART (EXP1) reduces these biases considerably at high latitudes. The further inclusion of aerosol indirect effects through interactive coupling with the Thompson aerosol-aware microphysics scheme (EXP2) yields additional bias reductions at high latitudes but introduces increased biases against MERRA-2 over the tropical Atlantic compared to the configuration using only radiative feedback (EXP1). These results suggest that transitioning from climatological to inline-predicted aerosols provides a substantial and widespread improvement in AOD representation, particularly at Northern Hemisphere high latitudes, while the further inclusion of aerosol indirect effects introduces comparatively smaller but mixed regional effects.

Figure 7Six-year averaged (2012–2017) 6-hourly total aerosol optical depth (AOD) and mean AOD bias with respect to MERRA-2 reanalysis forecast period for August in UFS-Chem. Top row: tropical region average (25° S–25° N); bottom row: global average. (a, c) Daily average total AOD; (b, d) mean bias. The black line denotes the MERRA-2 reanalysis. The grey line represents AOD diagnosed from MERRA-2 climatological aerosol. The blue, red, and green lines represent inline-predicted AOD from the Control, EXP1, and EXP2 experiments, respectively.
To assess the robustness of the single-case results from August 2016, we extend the subseasonal analysis to a 6-year average of each August from 2012 to 2017. Figure 7 presents the 6-year averaged 6-hourly evolution of total AOD and mean AOD bias with respect to MERRA-2 reanalysis over forecast period for August in UFS-Chem (Control, EXP1, and EXP2), shown separately for the tropical region (25° S–25° N) and the global average. The black line denotes the MERRA-2 reanalysis, which serves as the verification reference. The grey line (MERRA-2 Clim) represents the AOD diagnosed from the MERRA-2 climatological aerosol fields, which are derived from monthly mean MERRA-2 aerosol data averaged over 2003–2014. These climatological fields are spatially interpolated onto the UFS grid and temporally interpolated at each model time step (Cheng and Yang, 2023). Aerosol optical properties are then computed using the instantaneous relative humidity from the UFS forecast within the GFSv17 physics suite. The aerosol optical properties diagnosed from the MERRA-2 climatological AOD are used to drive the radiative feedback in the Control experiment. Both the tropical and global averages reveal that the MERRA-2 climatological AOD exhibits a persistent negative bias of approximately −0.015 to −0.025 throughout the forecast period, substantially underestimating the aerosol loading relative to the MERRA-2 reanalysis. In contrast, the three GOCART inline-predicted experiments produce AOD values that are considerably more consistent with the MERRA-2 reanalysis, with substantially smaller biases. Both EXP1 and EXP2 use their predicted aerosol fields to drive the radiative feedback. Among the three experiments, EXP2, which includes both aerosol radiative feedback and aerosol indirect effects, exhibits the smallest biases over the full forecast period, followed by EXP1 with radiative feedback only, and the Control without aerosol radiative feedback from the coupled aerosol model. This ordering is consistent across both the tropical and global domains. A notable feature in the bias evolution is the significantly negative bias magnitude during approximately the first 1–7 d of the forecast, followed by a gradual increase. This behavior reflects the aerosol spin-up adjustment period: although the GOCART aerosol mixing ratios are initialized from MERRA-2 reanalysis, they are spatially interpolated onto the UFS grid, and fundamental differences in the dynamical cores and physics parameterizations between the two modeling systems introduce systematic discrepancies in the predicted AOD. These system-dependent differences, including distinct treatments of aerosol sources and sinks, humidity, cloud processes, and radiative transfer, affect the evolution of aerosol mixing ratios and their conversion to optical properties, resulting in the initial negative bias in AOD. As the forecast progresses beyond the spin-up period, the GOCART aerosol fields adjust to the UFS dynamical and physical environment, and the predicted AOD converges toward a more self-consistent state with reduced biases. After the spin-up period, the progressive divergence among the experiments demonstrates the growing importance of aerosol-radiation and aerosol-could interaction effects on subseasonal timescales and confirms that the inclusion of aerosol indirect effects (EXP2) provides a consistent improvement in AOD prediction throughout the extended forecast range.
In terms of spatial distribution, Fig. 8 presents the 6-year averaged (2012–2017) total AOD biases with respect to MERRA-2 reanalysis for August. Compared with the representative single-year case of August 2016 (Fig. 6), the 6-year averaged AOD biases are relatively larger and may also reflect the influence of interannual variability, which helps reveal the underlying systematic error structure of each experiment more clearly. The spatial patterns of the largest positive and negative biases, associated with wildfire and dust source regions, are broadly consistent with those observed in 2016 (Fig. 6). This consistency suggests that these regional biases are more likely related to uncertainties in emission sources rather than interannual variability or aerosol feedback processes. Meanwhile, the inter-experiment differences are smaller than those seen in the individual 2016 case (Figs. A2 and A3), which may be attributable to interannual variability.

Figure 8The same as in Fig. 6, but averaged over the six-year of August (2012–2017).
The Control experiment exhibits a global mean AOD bias of +0.003, with widespread positive biases against MERRA-2 over the Northern Hemisphere high latitudes and central Africa, and negative biases concentrated over the southeastern United States, the Middle East, northern Africa, and South and East Asia. Replacing the climatological aerosol fields with inline-predicted aerosols from GEFS-GOCART (EXP1) shifts the global mean bias to +0.004, while reducing the positive biases against MERRA-2 at high latitudes near the North Pole compared with the Control experiment, but retaining the regional positive biases over major aerosol source regions. The addition of aerosol indirect effects (EXP2) reduces the global mean bias to +0.001, with modest improvements over high latitudes near the North Pole, the tropical Atlantic, and North America. Results across the 6-year period are consistent with the results from the single August 2016 case. The reduction in the global mean bias from +0.003 in the Control experiment and +0.004 in EXP1 to near-zero values in EXP2 indicates that the transition from climatological to inline-predicted aerosols with both aerosol radiative feedback and aerosol indirect effects substantially reduces the dominant systematic bias in AOD, whereas including aerosol radiative feedback alone does not significantly improve the AOD bias. These systematic improvements, which are largely masked by interannual noise in the single-year analysis, underscore the value of multi-year evaluation for quantifying the benefits of interactive aerosol treatment in subseasonal prediction systems. Figure 9 presents the 6-year averaged AOD RMSE with respect to MERRA-2 reanalysis for the three experiments. The Control experiment yields a global mean AOD RMSE of 0.111. Replacing the climatological aerosol fields with inline-predicted aerosols from GEFS-GOCART for radiative feedback (EXP1) slightly increases the global mean RMSE to 0.113, although notable improvements are observed over eastern Europe and Russia. The further inclusion of aerosol indirect effects (EXP2) reduces the global mean RMSE to 0.111 relative to EXP1, with the most pronounced improvements occurring over North America. The overall reduction in AOD RMSE when both aerosol radiative feedback and aerosol indirect effects are included, particularly at regional scales confirms that the progressive activation of aerosol radiative feedback and aerosol indirect effects can improve aerosol prediction fidelity in UFS-Chem on subseasonal timescales.

Figure 9The same as in Fig. 8, but for AOD RMSE.

Figure 10Six-year averaged (2012–2017) TOA net radiative flux bias compared with CERES for August in UFS-Chem for the (a) Control, (b) EXP1, and (c) EXP2 experiments.
Beyond the improvements in AOD representation, the progressive activation of aerosol radiative feedback and aerosol indirect effects also influences key meteorological fields relevant to subseasonal prediction. Figure 10 presents the 6-year averaged (2012–2017) net radiative flux bias at the top of the atmosphere (TOA) for August in UFS-Chem, evaluated against CERES observations. The Control experiment, which uses MERRA-2 climatological aerosols for radiative feedback, exhibits a global mean TOA net radiative flux bias of −3.24 W m−2, with widespread negative biases over tropical and mid-latitude oceans indicating excessive outgoing radiation, and positive biases over parts of the Southern Ocean, the southeastern Pacific, and high-latitude regions. Replacing the climatological aerosol fields with inline-predicted aerosols from GEFS-GOCART for radiative feedback (EXP1) increases the magnitude of the global mean bias to −3.56 W m−2, with enhanced negative biases over the tropical oceans and the North Atlantic. This degradation indicates that the radiative effects associated with inline-predicted aerosols are not fully balanced by other components of the model physics. The further inclusion of aerosol indirect effects (EXP2) substantially reduces the global mean TOA net radiative flux bias to −2.23 W m−2, representing a 37 % improvement relative to EXP1 and a 31 % improvement relative to the Control. Spatially, the bias patterns across the three experiments are broadly similar, although EXP2 shows a notable reduction in negative biases over the Maritime Continent and surrounding regions. These results indicate that while the radiative feedback of direct and semi-direct effects of inline-predicted aerosols alone can slightly degrade the TOA radiation balance, the inclusion of aerosol–cloud microphysical coupling helps reduce the global TOA energy imbalance.
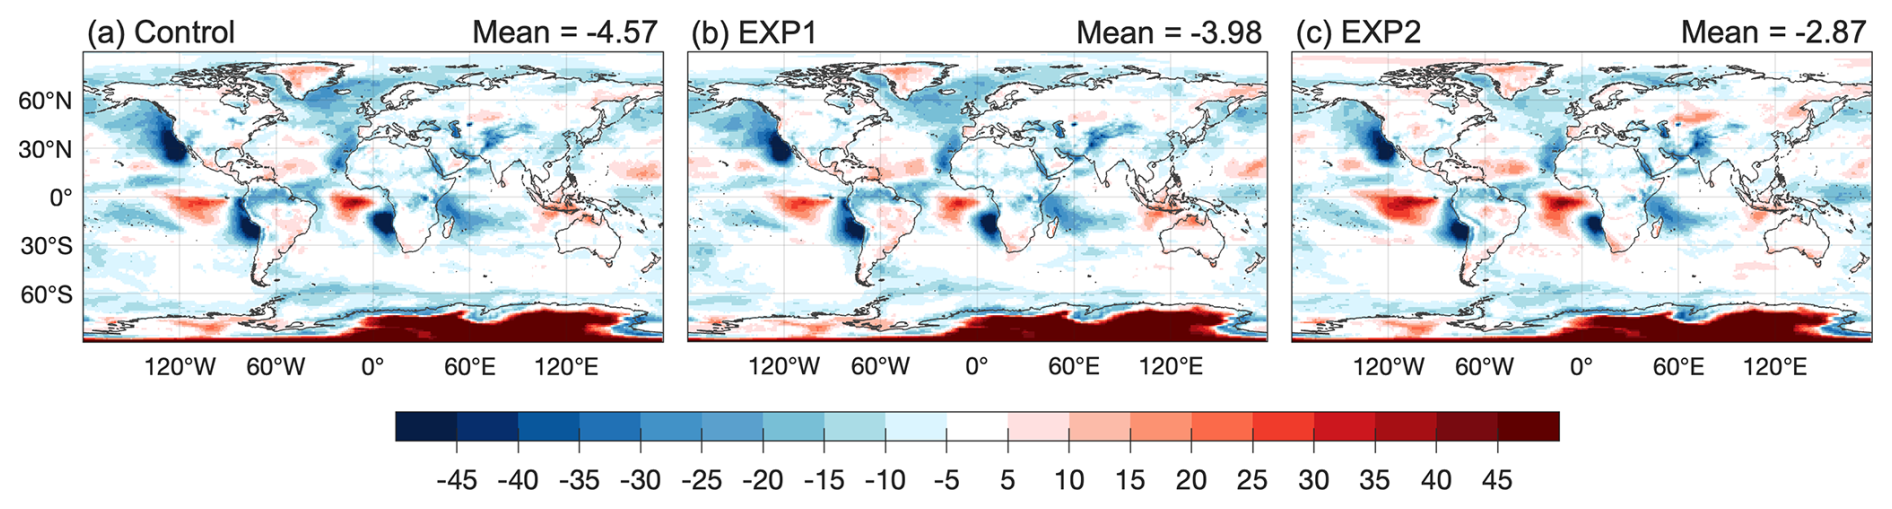
Figure 11Six-year averaged (2012–2017) cloud fraction bias (%) compared with CERES for August in UFS-Chem for the (a) Control, (b) EXP1, and (c) EXP2 experiments.
Figure 11 presents the 6-year averaged (2012–2017) cloud fraction biases against CERES observation for August across the three experiments. The Control experiment, which relies on MERRA-2 climatological aerosols for direct and semi-direct effects, exhibits a global mean cloud fraction bias of −4.57 %, indicating a systematic underestimation of cloudiness. Replacing the climatological fields with inline-predicted aerosols from GEFS-GOCART (EXP1) reduces the global mean cloud fraction bias to −3.98 %, representing an approximately 13 % improvement. However, the spatial patterns of cloud fraction bias remain remarkably similar between the Control and EXP1, with the largest negative biases concentrated off the western coasts of North and South America – regions that do not correspond to the areas of largest AOD bias or RMSE in Fig. 9. This suggests that the modest global mean improvement in cloud fraction between Control and EXP1 is not straightforwardly attributable to regional aerosol–radiation interactions, and that the dominant sources of cloud fraction bias are likely governed by other model physics, such as boundary layer parameterization and large-scale dynamics, rather than aerosol loading alone. The further inclusion of aerosol indirect effects through the Thompson aerosol-aware microphysics scheme (EXP2) achieves an additional substantial reduction in cloud fraction bias to −2.87 %, corresponding to an approximately 28 % further improvement relative to EXP1. This additional gain is most pronounced over the North Atlantic, where the coupling between aerosol concentrations and cloud droplet number concentration directly modifies cloud microphysical properties and lifetime. The interactive aerosol–cloud coupling pathway – through which increased aerosol loading enhances droplet number concentrations, suppresses autoconversion, and prolongs cloud lifetime – introduces microphysical processes that are not represented by radiative feedback of direct and semi-direct effects alone. Consequently, the substantial reduction in systematic AOD biases from EXP1 to EXP2 enables a more realistic representation of aerosol–cloud interactions, leading to larger adjustments in cloud properties, including cloud fraction, and contributing to improvements in the TOA radiation balance.
The SST biases (Fig. 12) compared to OISST further illustrate the downstream impact of aerosol radiative feedback and aerosol indirect effects on the coupled ocean–atmosphere system. The Control and EXP1 experiments produce identical global mean SST biases of −0.11 and −0.12 K, indicating that the transition from climatological to inline-predicted aerosols for direct and semi-direct effects alone does not substantially alter the surface energy balance on subseasonal timescales. However, the inclusion of aerosol indirect effects in EXP2 reduces the global mean SST bias to −0.08 K, with the most notable warming corrections occurring over the North Pacific Ocean. This SST improvement is consistent with the enhanced cloud fraction in EXP2: the aerosol indirect effects increases cloud cover predominantly in regions where the Control and EXP1 experiments underestimate cloudiness, thereby modifying the surface shortwave radiation balance and reducing the cold SST bias. The coherent improvements across AOD, cloud fraction, and SST from Control through EXP1 to EXP2 demonstrate that the benefits of interactive aerosol treatment propagate through the aerosol–radiation–cloud–ocean coupling chain, underscoring the importance of including aerosol radiative feedback and aerosol indirect effects for subseasonal prediction fidelity.
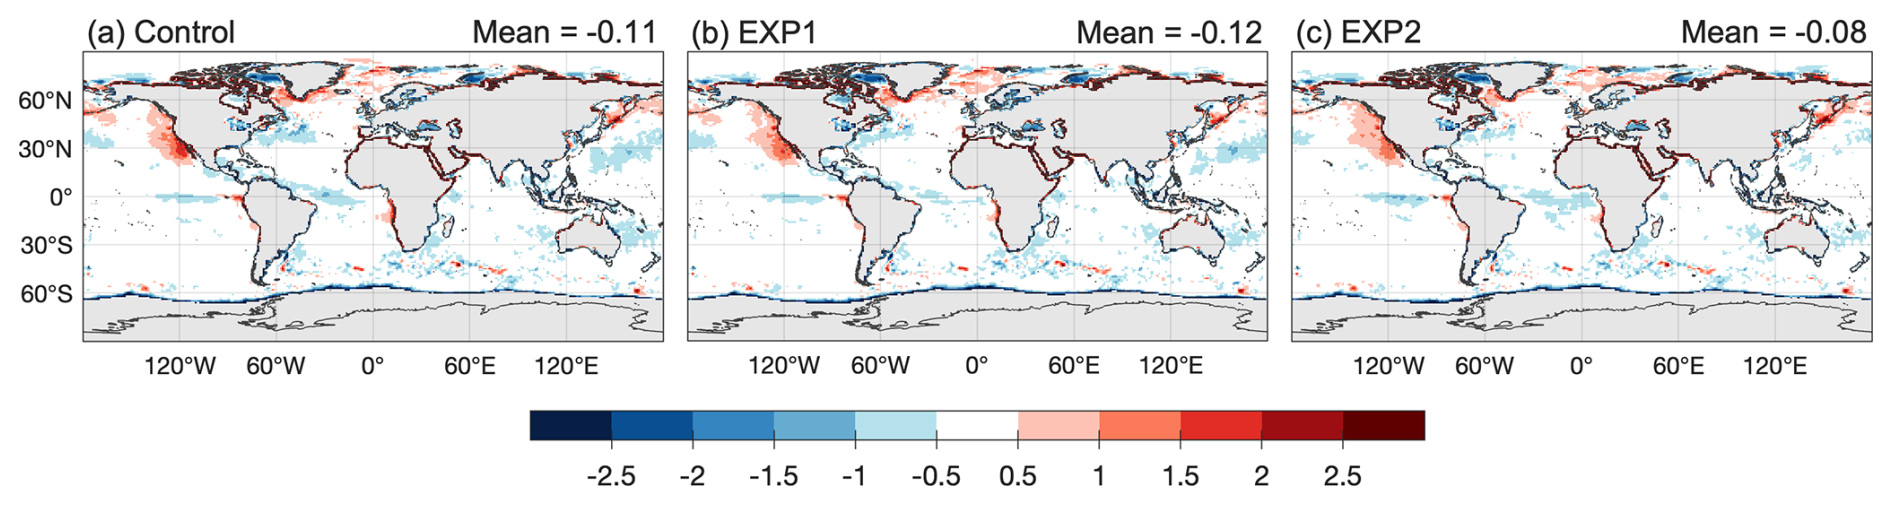
Figure 12Six-year averaged (2012–2017) sea surface temperature (SST) bias (K) compared with OISST for August in UFS-Chem for the (a) Control, (b) EXP1, and (c) EXP2 experiments.

Figure 13Six-year averaged (2012–2017) differences in total precipitation (top row; mm d−1), large-scale precipitation (middle row; mm d−1) and convective precipitation (bottom row; mm d−1) for August in UFS-Chem. (a) Effect of aerosol radiative feedback (EXP1 minus Control). (b) Aerosol indirect effects (EXP2 minus EXP1). (c) Combined effect of aerosol radiative feedback and aerosol indirect effects (EXP2 minus Control).
Figure 13 presents the 6-year averaged (2012–2017) differences in total, large-scale and convective precipitation for August, decomposed into the contributions from aerosol radiative feedback, aerosol indirect effects, and their combination. Enabling aerosol radiative feedback from inline-predicted GOCART aerosols instead of MERRA-2 climatological aerosols (EXP1 minus Control; left column) produces only small and spatially scattered changes in total precipitation, with modest increases over the tropical western Pacific and the Maritime Continent and slight reductions over parts of the tropical Indian Ocean and eastern Pacific. At the process level, changes in large-scale precipitation are minimal and spatially incoherent, while convective precipitation shows the strongest signal over the tropical Indian Ocean through the Maritime Continent to the tropical western Pacific. The differences in aerosol loading between the inline-predicted and climatological fields alter atmospheric shortwave absorption and scattering profiles, modifying atmospheric heating rates, stability, cloud formation, and the large-scale circulation patterns that govern precipitation distribution.
Further enabling the aerosol indirect effects EXP2 minus EXP1; middle column of Fig. 13) produces more pronounced and spatially coherent changes in total precipitation, with widespread enhancements over the tropics, the Maritime Continent, and southeastern Asia, and notable reductions over the tropical central and eastern Pacific and parts of the Southern Ocean (global mean difference of +0.04 mm d−1). At the process level, large-scale precipitation shows widespread enhancements over the tropics and southeastern Asia, with reductions over the tropical central Pacific and parts of the Southern Ocean (global average of −0.01 mm d−1), while convective precipitation drives substantial increases over the tropical western Pacific and the Maritime Continent, with notable decreases over the tropical eastern Pacific and the Indian Ocean (global average of +0.05 mm d−1).
The combined effect of radiative feedback and aerosol indirect effects (EXP2 minus Control; right column) reveals a total precipitation response that is larger and more spatially organized than the radiative feedback alone, with enhanced precipitation concentrated over the tropical western Pacific, the Maritime Continent, and southeastern Asia, and reduced precipitation over the tropical eastern Pacific, parts of the Indian Ocean, and the Southern Ocean (global mean difference of +0.04 mm d−1). At the process level, increased large-scale precipitation is evident over the tropics and southeastern Asia, with reductions over the Southern Ocean (global average of −0.02 mm d−1), while convective precipitation increases are concentrated over the tropical western Pacific and the Maritime Continent, with decreases over the tropical eastern Pacific and the Indian Ocean (global average of +0.06 mm d−1). Notably, precipitation differences in EXP2 minus Control are generally larger and more spatially coherent than those in EXP1 minus Control, particularly for convective precipitation, whereas the response in large-scale precipitation remains relatively weak. This amplification likely occurs because the aerosol indirect effects influences cloud microphysical properties by increasing cloud droplet number concentration, reducing autoconversion efficiency, and prolonging cloud lifetime. These changes can subsequently affect latent heat release, atmospheric stability, and large-scale circulation, leading to adjustments in the distribution of precipitation. The radiative feedback, by contrast, primarily modulates the thermodynamic profile through changes in shortwave absorption and longwave emission, producing a comparatively more modest precipitation response. The spatial coherence between the combined precipitation response and the improvements in AOD (Figs. 8 and 9), cloud fraction, and SST (Fig. 12) demonstrates that the benefits of interactive aerosol treatment propagate through the aerosol–radiation–cloud–precipitation–ocean coupling chain, with the aerosol indirect effects playing the dominant role in reshaping the convective precipitation distribution in subseasonal predictions.
However, the enhanced convective precipitation does not simply coincide spatially with the regions of reduced biases for net radiative flux at the TOA, cloud fraction and SST, indicating that the aerosol indirect effects modifies the precipitation response through complex interactions between cloud microphysical changes and large-scale dynamical adjustments. In regions where the suppression of autoconversion extends cloud lifetime and increases cloud water content, the eventual release of accumulated moisture can enhance convective activity, while in other regions the stabilization of the lower troposphere through increased cloudiness may redistribute convective precipitation spatially.
The development of the CCPP-based GEFS-Aerosols framework within UFS-Chem represents a significant advancement toward a more physically consistent and tightly coupled atmospheric composition modeling system. By embedding aerosol and chemistry processes directly within the atmospheric model physics time step, the CCPP architecture allows vertical tracer transport, mixing, scavenging, deposition, and aerosol–radiation interactions to be handled using the same physical parameterizations that govern meteorological processes. This unified framework reduces inconsistencies inherent in the traditional NUOPC-style separation between physics and chemistry components and avoids redundant calculations by leveraging meteorological fields already available within the host physics suite, thereby improving both physical consistency and computational efficiency. Within this framework, GEFS-GOCART from GEFS-Aerosols v12.3 is adopted as the baseline aerosol module, incorporating updated anthropogenic emissions, revised large-scale wet removal parameterizations, and corrected AOD calculations. Evaluation against MERRA-2 reanalysis, satellite retrievals (MODIS and VIIRS), and AERONET observations shows that these updates substantially reduce the high AOD biases present in the earlier v12 configuration, particularly over wildfire-affected regions of western North America, largely due to improved representation of organic carbon aerosols and more realistic wet removal processes.
To further improve the physical consistency of aerosol–cloud–precipitation interactions, this study implements inline large-scale wet removal within the Thompson microphysics scheme. Unlike traditional offline approaches that diagnose aerosol removal from exported precipitation and cloud fields, the inline implementation couples aerosol scavenging directly with hydrometeor formation and precipitation processes within the microphysics integration. It eliminates redundant diagnostic calculations and ensures that aerosol removal is governed by the same physical processes responsible for cloud and precipitation formation. Model experiments show that this inline treatment substantially improves the consistency of simulated AOD biases between cycling and fully coupled subseasonal configurations, indicating reduced sensitivity of aerosol removal to configuration-dependent cloud water biases. It should be noted that this inconsistency is not a universal limitation of offline wet-removal schemes, but rather reflects characteristics of the specific large-scale wet-removal formulation used here. Other offline parameterizations may exhibit better consistency across forecast configurations, depending on the meteorological predictors used and their stability in subseasonal simulations. These results highlight the advantage of implementing large-scale wet removal directly within the host model microphysics scheme.
In addition, aerosol indirect effects are implemented through inline coupling between the prognostic GOCART aerosol model and the Thompson microphysics scheme. In contrast to the baseline configuration that prescribes fixed cloud droplet concentrations, the new implementation enables aerosol-aware microphysics by mapping GOCART aerosol species to water-friendly and ice-friendly aerosol populations that act as CCN and INP, respectively. Cloud droplet and ice crystal number concentrations are then computed prognostically based on aerosol loading and environmental conditions, allowing aerosols to modify cloud optical properties and precipitation processes through established indirect effects. Together with the implementation of two-way aerosol–radiation coupling in UFS-Chem, which allows prognostic aerosol optical properties to directly influence radiative fluxes, this framework provides a unified and physically consistent representation of aerosol–radiation–cloud interactions. These developments establish a robust and extensible aerosol modeling framework within UFS-Chem that is suitable for applications spanning weather forecasting to S2S prediction and future Earth system modeling.
Sensitivity experiments demonstrate that progressively activating aerosol radiative feedback and aerosol indirect effects in UFS-Chem influences the simulation of aerosols, clouds, radiation, and precipitation on subseasonal timescales. The multi-year evaluation shows that replacing climatological aerosols with inline-predicted aerosols alone does not significantly reduce AOD bias and can slightly increase global AOD RMSE. However, when aerosol indirect effects are included, the global mean AOD bias is reduced to near-zero values and regional RMSE improvements become more evident, particularly over North America. These results indicate that aerosol–cloud microphysical interactions play a key role in improving aerosol prediction fidelity in UFS-Chem, while radiative feedback alone provides limited benefit for correcting systematic AOD errors. Despite these improvements in aerosol representation, the results also highlight an important challenge: more realistic aerosol treatments do not lead to uniform improvements across variables and regions. For example, although the inclusion of interactive aerosols improves cloud fraction and reduces AOD biases in several regions, the radiative feedback alone slightly worsens the TOA net radiative flux bias, and the inclusion of aerosol indirect effects can increase AOD biases over the tropical Atlantic even as cloud properties improve elsewhere. Although the inclusion of aerosol indirect effects improves cloud fraction, TOA radiative fluxes, and SST, the present analysis does not isolate whether these improvements result from a more realistic representation of aerosol–cloud interactions or from a different balance of compensating model errors. Additional evaluations using cloud microphysical properties and process-oriented diagnostics will be needed to further assess the underlying mechanisms. The precipitation response further illustrates this complexity. Enhanced convective precipitation does not spatially coincide with regions of improved cloud fraction or reduced TOA radiation biases, and large-scale precipitation exhibits a net global reduction despite improvements in aerosol and cloud representations. Notably, the magnitude of precipitation differences in EXP2 minus Control is substantially larger than in EXP1 minus Control for total precipitation, which is dominated by convective components, indicating that aerosol indirect effects amplify the precipitation response beyond what radiative feedback alone can produce. These responses likely reflect the fact that the current model physics were tuned to maintain approximate energy balance under climatological aerosol forcing. Introducing more realistic, time-varying aerosol fields perturbs this balance and can expose compensating errors in other components of the model physics. Fully realizing the benefits of interactive aerosol treatment for subseasonal prediction may therefore require coordinated retuning and improved representation of related processes, including radiation, cloud microphysics, convection, and surface energy exchange.
It should be noted that the CCPP-based GEFS-Aerosols implementation is evaluated within the complete UFS-Chem framework. Therefore, the reported performance reflects the combined effects of the UFS-Chem configuration, and the individual contributions of the tight physics–aerosol coupling and other model updates are not isolated. Although some biases remain in UFS-Chem for subseasonal prediction, substantial progress has been made toward improving global aerosol and chemistry simulations within the UFS framework.
Looking ahead, several developments are planned to further enhance the representation of aerosol–radiation–cloud interactions in UFS-Chem v2. Several aerosol species are absent from the present configuration. The bulk GOCART module in GEFS-Aerosols carries no secondary organic aerosol, nitrate, or ammonium, so these contributions are missing from the aerosol fields used here. Volcanic emissions are supported by our configuration but were not activated, as no significant eruption occurred during the simulation periods. Including these species is planned for future development, and applying the same framework to a volcanically perturbed period is a natural extension, given that prognostic volcanic emissions substantially alter simulated aerosol burden and optical properties (Mills et al., 2016) and that the resulting sulfate size distribution is sensitive to the treatment of chemistry and aerosol modes (Hu et al., 2025). Although several aerosol processes have been tightly coupled within the GFSv17 physics suite using CCPP, the dry deposition process remains decoupled from the GFSv17 PBL scheme, as GEFS-GOCART currently uses an independent PBL mixing scheme for this purpose. Fully coupling dry deposition with the GFSv17 PBL scheme represents a planned future development. In the current UFS configuration, several radiatively important gaseous tracers, including CO2 and O3, are prescribed from external datasets or represented using simplified chemistry, which introduces additional uncertainty in the simulated radiative balance. In future development of CATChem v2, these key radiatively active species will be predicted by the comprehensive AM4.1 gas-phase chemistry framework (He et al., 2026) with interactive stratospheric chemistry, rather than remaining prescribed as in the current version. Replacing prescribed radiatively important tracers with fully coupled inline chemistry is expected to improve the consistency between atmospheric composition and radiation calculations and reduce uncertainties in aerosol–radiation feedbacks. The current UFS-Chem framework employs the GOCART aerosol module, which uses a bulk single-moment approach that tracks aerosol mass concentrations but does not explicitly predict aerosol number concentrations. While computationally efficient, this scheme imposes inherent limitations on the representation of aerosol size distributions and aerosol–cloud interactions, as the activation of aerosol particles into cloud droplets cannot be physically constrained without prognostic number concentrations, leading to uncertainties in cloud radiative forcing. To address these limitations, CATChem v2 will introduce a two-moment aerosol scheme that explicitly predicts both aerosol mass and number concentrations, providing a more physically realistic representation of aerosol size distributions and is expected to improve the simulation of cloud droplet activation, precipitation processes, and aerosol indirect radiative effects.
The present study evaluates the impacts of aerosol indirect effects through cloud fraction, top-of-atmosphere radiative fluxes, SST, and cloud liquid water path. The cloud liquid water path comparison further demonstrates enhanced cloud water associated with the inclusion of aerosol indirect effects (Fig. A4), consistent with the findings of the previous study Li et al. (2024). A more comprehensive evaluation of aerosol indirect effects would benefit from additional cloud microphysical diagnostics, such as cloud droplet effective radius, together with comparisons against corresponding observations. As this work represents the first implementation of inline aerosol indirect effects within the tightly coupled UFS-Chem framework, these diagnostics are not yet available in the current system. Expanding the diagnostic output and conducting a comprehensive observational evaluation of aerosol indirect effects will be a focus of future UFS-Chem development. Together, these developments will help establish a more comprehensive Earth system modeling capability within UFS-Chem and support future improvements in S2S prediction.
Figure A1 indicates the scatter comparison of Day-1 AOD forecast performance at approximately 25 AERONET sites over the United States and Canada for August 2021. Figures A2 and A3 show the spatial differences in total AOD for August in UFS-Chem, isolating the aerosol radiative feedback and aerosol indirect effects across the three experimental configurations. Figure A4 shows the cloud liquid water path.

Figure A1Scatter comparison of Day-1 AOD forecast performance at approximately 25 AERONET sites over the United States and Canada for August 2021. (a) Correlation coefficient and (b) root mean square error (RMSE) for GEFS-Aerosols v12.3 versus GEFS-Aerosols v12. The solid diagonal line denotes equal performance between the two model versions.

Figure A2Differences in total AOD for August 2016 in UFS-Chem. (a) Effect of aerosol radiative feedback (EXP1 minus Control). (b) Aerosol indirect effects (EXP2 minus EXP1). (c) Combined effect of aerosol radiative feedback and aerosol indirect effects (EXP2 minus Control).
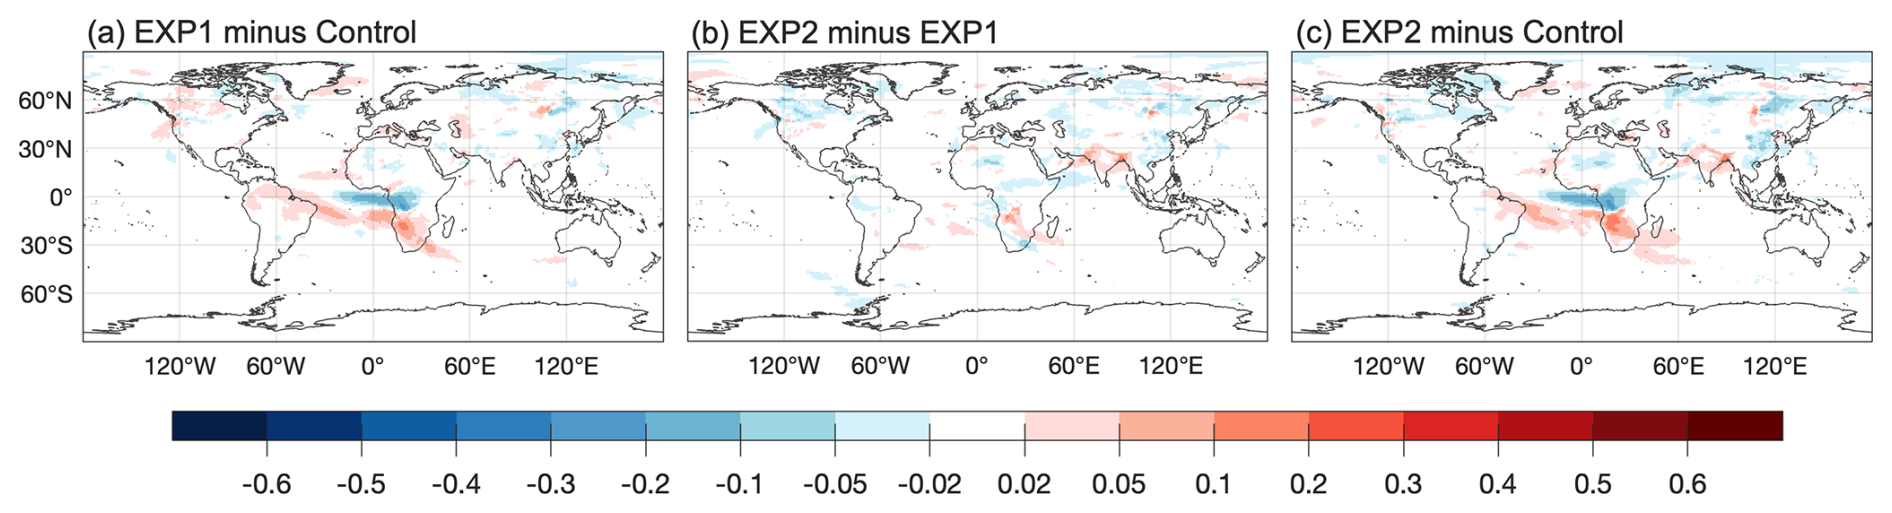
Figure A3Six-year averaged (2012–2017) differences in total AOD for August in UFS-Chem. (a) Effect of aerosol radiative feedback (EXP1 minus Control). (b) Aerosol indirect effects (EXP2 minus EXP1). (c) Combined effect of aerosol radiative feedback and aerosol indirect effects (EXP2 minus Control).

Figure A4Cloud liquid water path for August 2016 in UFS-Chem. (a) Control: aerosol radiative feedback from prescribed MERRA-2 climatological aerosol fields; (b) EXP1: aerosol radiative feedback from inline-predicted aerosols; (c) EXP2: aerosol radiative feedback and aerosol indirect effects from inline-predicted aerosols.
| Acronym/Term | Definition |
| AERONET | Aerosol Robotic Network |
| AM4.1 | GFDL Atmospheric Model version 4.1 |
| AOD | Aerosol Optical Depth |
| BC | Black Carbon |
| CAMS | Copernicus Atmosphere Monitoring Service |
| CATChem | Configurable ATmospheric Chemistry |
| CCPP | Common Community Physics Package |
| CEDS | Community Emissions Data System |
| CERES | Clouds and the Earth's Radiant Energy System |
| CMAQ | Community Multiscale Air Quality model |
| CICE6 | Los Alamos Sea Ice Model version 6 |
| CIMEL | CIMEL Sun–Sky Spectral Radiometer |
| CYC_IWR | 24 h cycling experiment with inline large-scale wet removal |
| CYC_OWR | 24 h cycling experiment with offline large-scale wet removal |
| DAAC | Distributed Active Archive Center |
| DMS | Dimethyl Sulfide |
| Dark Target (DT) | Dark Target aerosol retrieval algorithm |
| Deep Blue (DB) | Deep Blue aerosol retrieval algorithm |
| EBAF | Energy Balanced and Filled |
| ECMWF | European Centre for Medium-Range Weather Forecasts |
| FV3 | Finite-Volume Cubed-Sphere dynamical core |
| GBBEPx | Global Biomass Burning Emissions Product extended (GBBEPx) |
| GEFS | Global Ensemble Forecast System |
| GEFS-Aerosols | Global Ensemble Forecast System Aerosols |
| GEOS | Goddard Earth Observing System |
| GEOS-CF | Goddard Earth Observing System Composition Forecast |
| GEOS-FP | Goddard Earth Observing System Forward Processing |
| GFDL | Geophysical Fluid Dynamics Laboratory |
| GFS | Global Forecast System |
| GOCART | Goddard Chemistry Aerosol Radiation and Transport |
| ICAP-MME | International Cooperative for Aerosol Prediction Multi-Model Ensemble |
| JMA-MASINGAR | Japan Meteorological Agency Model of Aerosol Species in the Global Atmosphere |
| LAADS | Level-1 and Atmosphere Archive and Distribution System |
| MERRA-2 | Modern-Era Retrospective analysis for Research and Applications, Version 2 |
| MODIS | Moderate Resolution Imaging Spectroradiometer |
| MOM6 | GFDL Modular Ocean Model version 6 |
| NAAPS | Navy Aerosol Analysis and Prediction System |
| NASA | National Aeronautics and Space Administration |
| NASA/LARC/SD/ASDC | NASA Langley Research Center Science Directorate Atmospheric Science Data Center |
| NCEP | National Centers for Environmental Prediction |
| NESDIS | National Environmental Satellite, Data, and Information Service |
| NGACv2 | NEMS Global Forecast System Aerosol Component version 2 |
| NMMB/BSC-CTM | Nonhydrostatic Multiscale Model on the B Grid/Barcelona Supercomputing Center Chemical Transport Model |
| NOAA | National Oceanic and Atmospheric Administration |
| NRL | Naval Research Laboratory |
| NUOPC | National Unified Operational Prediction Capability |
| OC | Organic Carbon |
| OC2 | Hydrophilic Organic Carbon |
| OISST | Optimum Interpolation Sea Surface Temperature |
| PBL | Planetary Boundary Layer |
| PM2.5 | Particulate Matter with aerodynamic diameter ≤ 2.5 µm |
| RRFS-SD | Rapid Refresh Forecast System – Smoke and Dust |
| SAS | Simplified Arakawa–Schubert convection scheme |
| SST | Sea Surface Temperature |
| SUB_IWR | Fully coupled subseasonal experiment with inline large-scale wet removal |
| SUB_OWR | Fully coupled subseasonal experiment with offline large-scale wet removal |
| UFS | Unified Forecast System |
| TOA | Top of Atmosphere |
| UFS-Chem | Unified Forecast System coupled with Chemistry |
| UKMO-UM | United Kingdom Met Office Unified Model |
| VIIRS | Visible Infrared Imaging Radiometer Suite |
| WRF-Chem | Weather Research and Forecasting model coupled with Chemistry |
The complete model output generated for this study exceeds 100 TB and is archived in NOAA's High Performance Storage System (HPSS). Owing to the very large data volume and the associated storage and transfer requirements, the full model output has not been deposited in a public data repository. The versions of GEFS-Aerosols v12.3, UFS-Chem v1.0, and the CATChem v1.0 library used to produce the results presented in this paper are archived on Zenodo at https://doi.org/10.5281/zenodo.19262140 (Zhang et al., 2026).
LZ prepared the manuscript with contributions from all co-authors, she was one of the major developers of GEFS-Aerosols and the lead developer of the CCPP-based GEFS-Aerosols (the aerosol component of UFS-Chem v1), including coupling GEFS-GOCART to the UFS/GFSv17 using the CCPP, implementing inline large-scale wet removal and aerosol indirect effects through inline-coupled GEFS-GOCART, and developing the aerosol-related components within the global workflow. HL was one of the major developers of the initial CCPP coupling between GEFS-GOCART and FV3/GFSv15. GAG proposed the original concept of tight coupling between aerosol/chemistry and physics and provided oversight of model development for both GEFS-Aerosols and UFS-Chem. PSB performed model evaluation for GEFS-Aerosols and UFS-Chem. GAF performed data analysis and model evaluation for UFS-Chem. BWG downloaded and post-processed the CERES and OISST datasets and processed model output used in Figs. 10–13. SS provided suggestions for subseasonal studies. LB provided supervision and contributed to the organization of the manuscript. AJ provided suggestions for inline large-scale wet removal and aerosol indirect effects in the Thompson microphysics scheme. BB is the lead developer of the FENGSHA dust scheme. BB and LP assisted with updates and the operational transition of GEFS-Aerosols v12.3. JH assisted with the reconstruction of CATChem v1. JS provided suggestions for implementing inline large-scale wet removal. RA provided suggestions for plume-rise module optimization and supervision. ST assisted with plume-rise module optimization and model debugging. DS provided assistance and suggestions for CCPP coupling. AC and FY provided suggestions for aerosol indirect effects in the Thompson microphysics scheme; FY also provided supervision for the operational transition of GEFS-Aerosols v12.3. RHS and BCM provided suggestions and project management for UFS-Chem. SK developed the GBBEPx v4 dataset. DH assisted with CCPP-related code management during the early stages of development. HL, GAG, PSB, GAF, BWG, SS, LB, AJ, JH, DS, RHS, and BCM provided suggestions to improve the manuscript.
The contact author has declared that none of the authors has any competing interests.
The statements, findings, conclusions, and recommendations are those of the author(s) and do not necessarily reflect the views of NOAA or the U.S. Department of Commerce.
Publisher's note: Copernicus Publications remains neutral with regard to jurisdictional claims made in the text, published maps, institutional affiliations, or any other geographical representation in this paper. The authors bear the ultimate responsibility for providing appropriate place names. Views expressed in the text are those of the authors and do not necessarily reflect the views of the publisher.
The authors would like to thank Hongqing Liu and Amy Huff from NOAA/NESDIS for providing the VIIRS data.
This research was supported in part by the Bipartisan Infrastructure Law (BIL) NA23OAR4050201I, Fire Weather and Precipitation Research and Development in Support of the Disaster Relief Supplemental Appropriations Act (DRSA, NA23OAR4050200D), NOAA Weather Program Office (https://ror.org/01q70bz83, last access: 10 September 2026) under award NA23OAR4590387, and NOAA cooperative agreement NA22OAR4320151, for the Cooperative Institute for Earth System Research and Data Science (CIESRDS).
This paper was edited by Xiaohong Liu and reviewed by Hongyu Liu and one anonymous referee.
Adcroft, A., Anderson, W., Balaji, V., Blanton, C., Bushuk, M., Dufour, C. O., Dunne, J. P., Griffies, S. M., Hallberg, R., Harrison, M. J., Held, I. M., Jansen, M. F., John, J. G., Krasting, J. P., Langenhorst, A. R., Legg, S., Liang, Z., McHugh, C., Radhakrishnan, A., Reichl, B. G., Rosati, T., Samuels, B. L., Shao, A., Stouffer, R., Winton, M., Wittenberg, A. W., Xiang, B., Zadeh, N., and Zhang, R.: The GFDL Global Ocean and Sea Ice Model OM4.0: Model description and simulation features, J. Adv. Model. Earth Sy., 11, 3167–3211, https://doi.org/10.1029/2019MS001726, 2019.
Ahmadov, R., Grell, G., James, E., Csiszar, I., Tsidulko, M., Pierce, B., McKeen, S., Benjamin, S., Alexander, C., Pereira, G., Freitas, S., and Goldberg, M.: Using VIIRS Fire Radiative Power data to simulate biomass burning emissions, plume rise and smoke transport in a real-time air quality modeling system. 2017 Ieee International Geoscience and Remote Sensing Symposium, IEEE International Symposium on Geoscience and Remote Sensing IGARSS, New York, IEEE, 2806–2808, 2017.
Albrecht, B. A.: Aerosols, cloud microphysics, and fractional cloudiness, Science, 245, 1227–1230, https://doi.org/10.1126/science.245.4923.1227, 1989.
Appel, K. W., Bash, J. O., Fahey, K. M., Foley, K. M., Gilliam, R. C., Hogrefe, C., Hutzell, W. T., Kang, D., Mathur, R., Murphy, B. N., Napelenok, S. L., Nolte, C. G., Pleim, J. E., Pouliot, G. A., Pye, H. O. T., Ran, L., Roselle, S. J., Sarwar, G., Schwede, D. B., Sidi, F. I., Spero, T. L., and Wong, D. C.: The Community Multiscale Air Quality (CMAQ) model versions 5.3 and 5.3.1: system updates and evaluation, Geosci. Model Dev., 14, 2867–2897, https://doi.org/10.5194/gmd-14-2867-2021, 2021.
Bangert, M., Nenes, A., Vogel, B., Vogel, H., Barahona, D., Karydis, V. A., Kumar, P., Kottmeier, C., and Blahak, U.: Saharan dust event impacts on cloud formation and radiation over Western Europe, Atmos. Chem. Phys., 12, 4045–4063, https://doi.org/10.5194/acp-12-4045-2012, 2012.
Benedetti, A. and Vitart, F.: Can the direct effect of aerosols improve subseasonal predictability?, Mon. Weather Rev., 146, 3481–3498, https://doi.org/10.1175/MWR-D-17-0282.1, 2018.
Bengtsson, L. and Han, J.: Updates to NOAA's Unified Forecast System's cumulus convection parameterization scheme between GFSv16 and GFSv17, Weather Forecast., 39, 1559–1570, https://doi.org/10.1175/WAF-D-23-0232.1, 2024.
Bernardet, L., Bengtsson, L., Reinecke, P. A., Yang, F., Zhang, M., Hall, K., Doyle, J., Martini, M., Firl, G., and Xue, L.: Common Community Physics Package: Fostering Collaborative Development in Physical Parameterizations and Suites, B. Am. Meteorol. Soc., 105, E1490–E1505, https://doi.org/10.1175/BAMS-D-23-0227.1, 2024.
Berry, E. X. and Reinhardt, R. L.: An analysis of cloud drop growth by collection: Part II. Single initial distributions, J. Atmos. Sci., 31, 1825–1831, https://doi.org/10.1175/1520-0469(1974)031<1825:AAOCDG>2.0.CO;2, 1974.
Bey, I., Jacob, D. J., Yantosca, R. M., Logan, J. A., Field, B. D., Fiore, A. M., Li, Q., Liu, H., Mickley, L. J., and Schultz, M. G.: Global modeling of tropospheric chemistry with assimilated meteorology: Model description and evaluation, J. Geophys. Res.-Atmos., 106, 23073–23095, https://doi.org/10.1029/2001JD000807, 2001.
Bhattacharjee, P. S., Zhang, L., Baker, B., Pan, L., Montuoro, R., Grell, G. A., and McQueen, J. T.: Evaluation of aerosol optical depth forecasts from NOAA's global aerosol forecast model (GEFS-Aerosols), Weather Forecast., 38, 225–249, https://doi.org/10.1175/WAF-D-22-0083.1, 2023.
Boucher, O., Randall, D., Artaxo, P., Bretherton, C., Feingold, G., Forster, P., Kerminen, V.-M., Kondo, Y., Liao, H., Lohmann, U., Rasch, P., Satheesh, S. K., Sherwood, S., Stevens, B., and Zhang, X. Y.: Clouds and aerosols, in: Climate Change 2013: The Physical Science Basis, Contribution of Working Group I to the Fifth Assessment Report of the Intergovernmental Panel on Climate Change, edited by: Stocker, T. F., Qin, D., Plattner, G.-K., Tignor, M., Allen, S. K., Boschung, J., Nauels, A., Xia, Y., Bex, V., and Midgley, P. M., Cambridge University Press, Cambridge, UK and New York, NY, USA, 571–658, https://doi.org/10.1017/CBO9781107415324.016, 2013.
Bozzo, A., Benedetti, A., Flemming, J., Kipling, Z., and Rémy, S.: An aerosol climatology for global models based on the tropospheric aerosol scheme in the Integrated Forecasting System of ECMWF, Geosci. Model Dev., 13, 1007–1034, https://doi.org/10.5194/gmd-13-1007-2020, 2020.
Byun, D. and Schere, K. L.: Review of the governing equations, computational algorithms, and other components of the Models-3 Community Multiscale Air Quality (CMAQ) modeling system, Appl. Mech. Rev., 59, 51–77, https://doi.org/10.1115/1.2128636, 2006.
Cheng, A. and Yang, F.: Direct radiative effects of aerosols on numerical weather forecasts – a comparison of two aerosol datasets in the NCEP GFS, Weather Forecast., 38, 753–772, https://doi.org/10.1175/WAF-D-22-0060.1, 2023.
Cheng, A. and Yang, F.: Aerosol, clouds and radiation interactions in the NCEP Unified Forecast Systems, Meteorology, 4, 14, https://doi.org/10.3390/meteorology4020014, 2025.
Cheng, A., Pan, L., Bhattacharjee, P. S., and Yang, F. Direct and Indirect Effects of Aerosols During the 2023 Canadian Wildfires, Atmosphere, 17, 337, https://doi.org/10.3390/atmos17040337, 2026.
Chin, M., Rood, R. B., Lin, S.-J., Müller, J.-F., and Thompson, A. M.: Atmospheric sulfur cycle simulated in the global model GOCART: Model description and global properties, J. Geophys. Res.-Atmos., 105, 24671–24687, https://doi.org/10.1029/2000JD900384, 2000.
Colarco, P. R., da Silva, A., Chin, M., and Diehl, T.: Online simulations of global aerosol distributions in the NASA GEOS model and comparisons to satellite and ground-based aerosol optical depth, J. Geophys. Res.-Atmos., 115, D14207, https://doi.org/10.1029/2009JD012820, 2010.
Collow, A. B., Colarco, P. R., da Silva, A. M., Buchard, V., Bian, H., Chin, M., Das, S., Govindaraju, R., Kim, D., and Aquila, V.: Benchmarking GOCART-2G in the Goddard Earth Observing System (GEOS), Geosci. Model Dev., 17, 1443–1468, https://doi.org/10.5194/gmd-17-1443-2024, 2024.
Cooper, W. A.: Ice initiation in natural clouds, in: Precipitation Enhancement – A Scientific Challenge, Meteorol. Monogr., 21, 29–32, https://doi.org/10.1175/0065-9401-21.43.29, 1986.
DeMott, P. J., Prenni, A. J., Liu, X., Kreidenweis, S. M., Petters, M. D., Twohy, C. H., Richardson, M. S., Eidhammer, T., and Rogers, D. C.: Predicting global atmospheric ice nuclei distributions and their impacts on climate, P. Natl. Acad. Sci. USA, 107, 11217–11222, https://doi.org/10.1073/pnas.0910818107, 2010.
Eastham, S. D., Long, M. S., Keller, C. A., Lundgren, E., Yantosca, R. M., Zhuang, J., Li, C., Lee, C. J., Yannetti, M., Auer, B. M., Clune, T. L., Kouatchou, J., Putman, W. M., Thompson, M. A., Trayanov, A. L., Molod, A. M., Martin, R. V., and Jacob, D. J.: GEOS-Chem High Performance (GCHP v11-02c): a next-generation implementation of the GEOS-Chem chemical transport model for massively parallel applications, Geosci. Model Dev., 11, 2941–2953, https://doi.org/10.5194/gmd-11-2941-2018, 2018.
Eck, T. F., Holben, B. N., Reid, J. S., Dubovik, O., Smirnov, A., O'Neill, N. T., Slutsker, I., and Kinne, S.: The wavelength dependence of the optical depth of biomass burning, urban and desert dust aerosols, J. Geophys. Res., 104, 31333–31350, https://doi.org/10.1029/1999JD900923, 1999.
Flemming, J., Huijnen, V., Arteta, J., Bechtold, P., Beljaars, A., Blechschmidt, A.-M., Diamantakis, M., Engelen, R. J., Gaudel, A., Inness, A., Jones, L., Josse, B., Katragkou, E., Marecal, V., Peuch, V.-H., Richter, A., Schultz, M. G., Stein, O., and Tsikerdekis, A.: Tropospheric chemistry in the Integrated Forecasting System of ECMWF, Geosci. Model Dev., 8, 975–1003, https://doi.org/10.5194/gmd-8-975-2015, 2015.
Freire, J. L. M., Longo, K. M., Freitas, S. R., Coelho, C. A. S., Molod, A. M., Marshak, J., da Silva, A., and Ribeiro, B. Z.: To what extent biomass burning aerosols impact South America seasonal climate predictions?, Geophys. Res. Lett., 47, e2020GL088096, https://doi.org/10.1029/2020GL088096, 2020.
Freitas, S. R., Longo, K. M., Chatfield, R., Latham, D., Silva Dias, M. A. F., Andreae, M. O., Prins, E., Santos, J. C., Gielow, R., and Carvalho Jr., J. A.: Including the sub-grid scale plume rise of vegetation fires in low resolution atmospheric transport models, Atmos. Chem. Phys., 7, 3385–3398, https://doi.org/10.5194/acp-7-3385-2007, 2007.
Fu, B., Zhu, Y., Guan, H., Sinsky, E., Yang, B., Xue, X., Pegion, P., and Yang, F.: Weather-to-subseasonal prediction from the UFS coupled Global Ensemble Forecast System, Weather and Forecasting,https://doi.org/10.1175/WAF-D-23-0071.1https://doi.org/10.1175/WAF-D-23-0071.1, 2024.
Gelaro, R., McCarty, W., Suárez, M. J., Todling, R., Molod, A., Takacs, L., Randles, C. A., Darmenov, A., Bosilovich, M. G., Reichle, R., Wargan, K., Coy, L., Cullather, R., Draper, C., Akella, S., Buchard, V., Conaty, A., da Silva, A. M., Gu, W., Kim, G., Koster, R., Lucchesi, D. Merkova, J. E., Nielsen, G. Partyka, G., Pawson, S., Putman, W., Rienecker, M., Schubert, S. D., Sienkiewicz, M., and Zhao, B.: The Modern-Era Retrospective Analysis for Research and Applications, Version 2 (MERRA-2), J. Climate, 30, 5419–5454, https://doi.org/10.1175/JCLI-D-16-0758.1, 2017.
Gong, S. L.: A parameterization of sea-salt aerosol source function for sub- and super-micron particles, Global Biogeochem. Cy., 17, 1097, https://doi.org/10.1029/2003GB002079, 2003.
Gordon, H., Glassmeier, F., and McCoy, D. T.: An Overview of Aerosol-Cloud Interactions, in: Clouds and Their Climatic Impacts: Radiation, Circulation, and Precipitation, edited by: Sullivan, S. C. and Hoose, C., Wiley, 15–45, https://doi.org/10.1002/9781119700357.ch2, 2023.
Grell, G. A. and Baklanov, A.: Integrated modeling for forecasting weather and air quality: A call for fully coupled approaches, Atmos. Environ., 45, 6845–6851, https://doi.org/10.1016/j.atmosenv.2011.01.017, 2011.
Grell, G. A., Peckham, S. E., Schmitz, R., McKeen, S. A., Frost, G., Skamarock, W. C., and Eder, B.: Fully coupled “online” chemistry within the WRF model, Atmos. Environ., 39, 6957–6975, https://doi.org/10.1016/j.atmosenv.2005.04.027, 2005.
Han, J. and Pan, H.-L.: Revision of convection and vertical diffusion schemes in the NCEP Global Forecast System, Weather Forecast., 26, 520–533, https://doi.org/10.1175/WAF-D-10-05038.1, 2011.
Han, J., Wang, W., Kwon, Y. C., and Hong, S.-Y.: Implementation of a positive definite mass-flux scheme and a method for removing the negative tracers in the NCEP GFS planetary boundary layer and cumulus convection schemes, NCEP Office Note, 506, https://doi.org/10.25923/5051-3r70, 2022.
Harris, L., Chen, X., Putman, W., Zhou, L., and Chen, H.-L.: A scientific description of the GFDL finite-volume cubed-sphere dynamical core, NOAA Tech. Memo. OAR GFDL-2021(001), 109 pp., https://doi.org/10.25923/6nhs-5897, 2021.
He, C., Valayamkunnath, P., Barlage, M., Chen, F., Gochis, D., Cabell, R., Schneider, T., Rasmussen, R., Niu, G.-Y., Yang, Z.-L., Niyogi, D., and Ek, M.: Modernizing the open-source community Noah with multi-parameterization options (Noah-MP) land surface model (version 5.0) with enhanced modularity, interoperability, and applicability, Geosci. Model Dev., 16, 5131–5151, https://doi.org/10.5194/gmd-16-5131-2023, 2023.
He, J., Zhang, L., Schwantes, R. H., Baker, B., Horowitz, L., Naik, V., Lyu, C., Moon, Z., Grell, G., Ahmadov, R., Schnell, J., Yang, K., Wei, Z., Wang, S., Chang, K.-L., Gorchov Negron, A. M., Zhu, A., Kondragunta, S., Apel, E. C., Bourgeois, I., Commane, R., Hall, S. R., Hills, A., Hornbrook, R. S., Peischl, J., Ullmann, K., González Abad, G., Ayazpour, Z., Nowlan, C., and McDonald, B. C.: Incorporating gas-phase chemistry into the Unified Forecast System (UFS) for global air quality applications, J. Adv. Model. Earth Sy., 18, e2025MS005299, https://doi.org/10.1029/2025MS005299, 2026.
Heinzeller, D., Bernardet, L., Firl, G., Zhang, M., Sun, X., and Ek, M.: The Common Community Physics Package (CCPP) Framework v6, Geosci. Model Dev., 16, 2235–2259, https://doi.org/10.5194/gmd-16-2235-2023, 2023.
Hoesly, R. M., Smith, S. J., Feng, L., Klimont, Z., Janssens-Maenhout, G., Pitkanen, T., Seibert, J. J., Vu, L., Andres, R. J., Bolt, R. M., Bond, T. C., Dawidowski, L., Kholod, N., Kurokawa, J.-I., Li, M., Liu, L., Lu, Z., Moura, M. C. P., O'Rourke, P. R., and Zhang, Q.: Historical (1750–2014) anthropogenic emissions of reactive gases and aerosols from the Community Emissions Data System (CEDS), Geosci. Model Dev., 11, 369–408, https://doi.org/10.5194/gmd-11-369-2018, 2018.
Holben, B. N., Eck, T. F., Slutsker, I., Tanré, D., Buis, J. P., Setzer, A., Vermote, E., Reagan, J. A., Kaufman, Y. J., Nakajima, T., Lavenu, F., Jankowiak, I., and Smirnov, A.: AERONET – A Federated instrument network and data archive for aerosol characterization, Remote Sens. Environ., 66, 1–16, https://doi.org/10.1016/S0034-4257(98)00031-5, 1998.
Hsu, N. C., Jeong, M.-J., Bettenhausen, C., Sayer, A. M., Hansell, R., Seftor, C. S., Huang, J., and Tsay, S.-C.: Enhanced Deep Blue aerosol retrieval algorithm: The second generation, J. Geophys. Res.-Atmos., 118, 9296–9315, https://doi.org/10.1002/jgrd.50712, 2013.
Hu, A., Ke, Z., Liu, X., Wagman, B., Brown, H., Lu, Z., Wu, M., Wang, H., Tang, Q., Bull, D., Peterson, K., and Xie, S.: Size-resolved process understanding of stratospheric sulfate aerosol following the Pinatubo eruption, Atmos. Chem. Phys., 25, 12137–12157, https://doi.org/10.5194/acp-25-12137-2025, 2025.
Huang, B., Liu, C., Banzon, V., Freeman, E., Graham, G., Hankins, B., Smith, T., and Zhang, H.-M.: Improvements of the Daily Optimum Interpolation Sea Surface Temperature (DOISST) Version 2.1, J. Climate, 34, 2923–2939, https://doi.org/10.1175/JCLI-D-20-0166.1, 2021.
Inness, A., Ades, M., Agustí-Panareda, A., Barré, J., Benedictow, A., Blechschmidt, A.-M., Dominguez, J. J., Engelen, R., Eskes, H., Flemming, J., Huijnen, V., Jones, L., Kipling, Z., Massart, S., Parrington, M., Peuch, V.-H., Razinger, M., Remy, S., Schulz, M., and Suttie, M.: The CAMS reanalysis of atmospheric composition, Atmos. Chem. Phys., 19, 3515–3556, https://doi.org/10.5194/acp-19-3515-2019, 2019.
IPCC: Climate Change 2021: The Physical Science Basis, Contribution of Working Group I to the Sixth Assessment Report of the Intergovernmental Panel on Climate Change, Cambridge University Press, Cambridge, UK and New York, NY, USA, https://doi.org/10.1017/9781009157896, 2021.
Jackson, J., Liu, H., Laszlo, I., Kondragunta, S., Remer, L. A., Huang, J., and Huang, H.-C.: Suomi-NPP VIIRS Aerosol Algorithms and Data Products, J. Geophys. Res., 118, 12673–12689, https://doi.org/10.1002/2013jd020449, 2013.
Jacobs, N. A.: Open innovation and the case for community model development, B. Am. Meteorol. Soc., 102, E2002–E2011, https://doi.org/10.1175/BAMS-D-21-0030.1, 2021.
Jaeglé, L., Quinn, P. K., Bates, T. S., Alexander, B., and Lin, J.-T.: Global distribution of sea salt aerosols: new constraints from in situ and remote sensing observations, Atmos. Chem. Phys., 11, 3137–3157, https://doi.org/10.5194/acp-11-3137-2011, 2011.
Kato, S., Rose, F. G., Rutan, D. A., Thorsen, T. E., Loeb, N. G., Doelling, D. R., Huang, X., Smith, W. L., Su, W., and Ham, S.-H.: Surface irradiances of Edition 4.0 Clouds and the Earth's Radiant Energy System (CERES) Energy Balanced and Filled (EBAF) data product, J. Climate, 31, 4501–4527, https://doi.org/10.1175/JCLI-D-17-0523.1, 2018.
Keller, C. A., Knowland, K. E., Duncan, B. N., Liu, J., Anderson, D. C., Das, S., Lucchesi, R. A., Lundgren, E. W., Nicely, J. M., Nielsen, E., Ott, L. E., Saunders, E., Strode, S. A., Wales, P. A., Jacob, D. J., and Pawson, S.: Description of the NASA GEOS Composition Forecast Modeling System GEOS-CF v1.0, J. Adv. Model. Earth Sy., 13, e2020MS002413, https://doi.org/10.1029/2020MS002413, 2021.
Levy, R. C., Mattoo, S., Munchak, L. A., Remer, L. A., Sayer, A. M., Patadia, F., and Hsu, N. C.: The Collection 6 MODIS aerosol products over land and ocean, Atmos. Meas. Tech., 6, 2989–3034, https://doi.org/10.5194/amt-6-2989-2013, 2013.
Li, H., Grell, G. A., Ahmadov, R., Zhang, L., Sun, S., Schnell, J., and Wang, N.: A simple and realistic aerosol emission approach for use in the Thompson–Eidhammer microphysics scheme in the NOAA UFS Weather Model (version GSL global-24Feb2022), Geosci. Model Dev., 17, 607–619, https://doi.org/10.5194/gmd-17-607-2024, 2024.
Li, H., Ahmadov, R., Romero-Alvarez, J., Grell, G. A., Olson, J., Schnell, J., James, E., Trahan, S., Hu, M., and Bhimireddy, S.: Enhancing aerosol direct feedback for numerical weather prediction in NOAA's Rapid Refresh Forecast System–Smoke and Dust (RRFS-SD v1), Geophys. Res. Lett., 52, e2025GL115384, https://doi.org/10.1029/2025GL115384, 2025.
Liu, H., Remer, L. A., Huang, J., Huang, H.-C., Kondragunta, S., Laszlo, I., Oo, M., and Jackson, J. M.: Preliminary Evaluation of Suomi-NPP VIIRS Aerosol Optical Thickness, J. Geophys. Res., 119, 3942–3962, https://doi.org/10.1002/2013jd020360, 2013.
Loeb, N. G., Doelling, D. R., Wang, H., Su, W., Nguyen, C., Corbett, J. G., Liang, L., Mitrescu, C., Rose, F. G., and Kato, S.: Clouds and the Earth's Radiant Energy System (CERES) Energy Balanced and Filled (EBAF) Top-of-Atmosphere (TOA) Edition-4.0 Data Product. J. Climate, 31, 895–918, https://doi.org/10.1175/JCLI-D-17-0208.1, 2018.
McDuffie, E. E., Smith, S. J., O'Rourke, P., Tibrewal, K., Venkataraman, C., Marais, E. A., Zheng, B., Crippa, M., Brauer, M., and Martin, R. V.: A global anthropogenic emission inventory of atmospheric pollutants from sector- and fuel-specific sources (1970–2017): an application of the Community Emissions Data System (CEDS), Earth Syst. Sci. Data, 12, 3413–3442, https://doi.org/10.5194/essd-12-3413-2020, 2020.
Mills, M. J., Schmidt, A., Easter, R., Solomon, S., Kinnison, D. E., Ghan, S. J., Neely III, R. R., Marsh, D. R., Conley, A., Bardeen, C. G., and Gettelman, A.: Global volcanic aerosol properties derived from emissions, 1990–2014, using CESM1(WACCM), J. Geophys. Res.-Atmos., 121, 2332–2348, https://doi.org/10.1002/2015JD024290, 2016.
Molod, A., Takacs, L., Suarez, M., and Bacmeister, J.: Development of the GEOS-5 atmospheric general circulation model: evolution from MERRA to MERRA2, Geosci. Model Dev., 8, 1339–1356, https://doi.org/10.5194/gmd-8-1339-2015, 2015.
NASA/LARC/SD/ASDC: CERES Energy Balanced and Filled (EBAF) TOA and Surface Monthly means data in netCDF Edition 4.2, NASA Langley Atmospheric Science Data Center DAAC [data set], https://doi.org/10.5067/TERRA-AQUA-NOAA20/CERES/EBAF_L3B004.2, 2023.
Niu, G.-Y., Yang, Z.-L., Mitchell, K. E., Chen, F., Ek, M. B., Barlage, M., Kumar, A., Manning, K., Niyogi, D., Rosero, E., Tewari, M., and Xia, Y.: The community Noah land surface model with multiparameterization options (Noah-MP): 1. Model description and evaluation with local-scale measurements, J. Geophys. Res., 116, D12109, https://doi.org/10.1029/2010JD015139, 2011.
NOAA EPIC (Environmental Prediction Innovation Center): FENGSHA in UFS Webinar, https://ufs.epic.noaa.gov/wp-content/uploads/2023/08/FENGSHA_UFS_Webinar.pdf (last access: 7 July 2026), 2023.
Reid, J., Benedetti, A., Colarco, P. R., and Hansen, J. A.: International operational aerosol observability work-shop, B. Am. Meteorol. Soc., 92, ES21–ES24, https://doi.org/10.1175/2010BAMS3183.1, 2011.
Rieger, D., Steiner, A., Bachmann, V., Gasch, P., Förstner, J., Deetz, K., Vogel, B., and Vogel, H.: Impact of the 4 April 2014 Saharan dust outbreak on the photovoltaic power generation in Germany, Atmos. Chem. Phys., 17, 13391–13415, https://doi.org/10.5194/acp-17-13391-2017, 2017.
Rienecker, M. M., Suarez, M. J., Todling, R., Bacmeister, J., Takacs, L., Liu, H.-C., Gu, W., Sienkiewicz, M., Koster, R. D., Gelaro, R., Stajner, I., and Nielsen, J. E.: The GEOS-5 Data Assimilation System – Documentation of Versions 5.0.1, 5.1.0, and 5.2.0, NASA Technical Memorandum NASA/TM-2008-104606, Vol. 27, NASA Goddard Space Flight Center, Greenbelt, MD, USA, 118 pp., 2008.
Sayer, A. M., Hsu, N. C., Bettenhausen, C., and Jeong, M.-J.: Validation and uncertainty estimates for MODIS Collection 6 “Deep Blue” aerosol data, J. Geophys. Res.-Atmos., 118, 7864–7872, https://doi.org/10.1002/jgrd.50600, 2013.
Sayer, A. M., Munchak, L. A., Hsu, N. C., Levy, R. C., Bettenhausen, C., and Jeong M.-J.: MODIS Collection 6 aerosol products: Comparison between Aqua's e-Deep blue, dark target and “merged” data sets and usage recommendations, J. Geophys. Res.-Atmos., 119, 13965–989, https://doi.org/10.1002/2014JD022453, 2014.
Seinfeld, J. H., Bretherton, C. S., Carslaw, K. S., Coe, H., DeMott, P. J., Dunlea, E. J., Feingold, G., Ghan, S. J., Guenther, A. B., Kahn, R. A., Kraucunas, I., Kreidenweis, S. M., Molina, M. J., Nenes, A., Penner, J. E., Prather, K. A., Ramanathan, V., Ramaswamy, V., Rasch, P. J., Ravishankara, A. R., Rosenfeld, D., Stephens, G., and Wood, R.: Improving our fundamental understanding of the role of aerosol–cloud interactions in the climate system, P. Natl. Acad. Sci. USA, 113, 5781–5790, https://doi.org/10.1073/pnas.1514043113, 2016.
Sessions, W. R., Reid, J. S., Benedetti, A., Colarco, P. R., da Silva, A., Lu, S., Sekiyama, T., Tanaka, T. Y., Baldasano, J. M., Basart, S., Brooks, M. E., Eck, T. F., Iredell, M., Hansen, J. A., Jorba, O. C., Juang, H.-M. H., Lynch, P., Morcrette, J.-J., Moorthi, S., Mulcahy, J., Pradhan, Y., Razinger, M., Sampson, C. B., Wang, J., and Westphal, D. L.: Development towards a global operational aerosol consensus: basic climatological characteristics of the International Cooperative for Aerosol Prediction Multi-Model Ensemble (ICAP-MME), Atmos. Chem. Phys., 15, 335–362, https://doi.org/10.5194/acp-15-335-2015, 2015.
Slinn, W. G. N.: Precipitation scavenging, in: Atmospheric Science and Power Production, edited by: Randerson, D., Tech. Inf. Cent., Off. of Sci. and Techn. Inf., U.S. Department of Energy, Washington, DC, USA, 466–532, ISBN 978-0870791260, 1984.
Sun, S., Grell, G. A., Zhang, L., Henderson, J. K., Wang, S., Heinzeller, D., Li, H., Meixner, J., and Bhattacharjee, P. S.: Simulating the effects of aerosol–radiation interactions on subseasonal prediction using the coupled Unified Forecast System and CCPP-Chem: interactive aerosol module versus prescribed aerosol climatology, J. Adv. Model. Earth Sy., 17, e2024MS004392, https://doi.org/10.1029/2024MS004392, 2025.
The WAVEWATCH III Development Group: User manual and system documentation of WAVEWATCH III version 6.07, NOAA/NWS/NCEP/MMAB Technical Note 333, 466 pp., 2019.
Thompson, G. and Eidhammer, T.: A study of aerosol impacts on clouds and precipitation development in a large winter cyclone, J. Atmos. Sci., 71, 3636–3658, https://doi.org/10.1175/JAS-D-13-0305.1, 2014.
Thompson, G., Field, P. R., Rasmussen, R. M., and Hall, W. D.: Explicit forecasts of winter precipitation using an improved bulk microphysics scheme. Part II: Implementation of a new snow parameterization, Mon. Weather Rev., 136, 5095–5115, https://doi.org/10.1175/2008MWR2387.1, 2008.
Twomey, S.: The influence of pollution on the shortwave albedo of clouds, J. Atmos. Sci., 34, 1149–1152, https://doi.org/10.1175/1520-0469(1977)034<1149:TIOPOT>2.0.CO;2, 1977.
Wang, X., Zhang, L., and Moran, M. D.: Uncertainty assessment of current size-resolved parameterizations for below-cloud particle scavenging by rain, Atmos. Chem. Phys., 10, 5685–5705, https://doi.org/10.5194/acp-10-5685-2010, 2010.
Xian, P., Reid, J. S., Hyer, E. J., Sampson, C. R., Rubin, J. I., Ades, M., Asencio, N., Basart, S., Benedetti, A., Bhattacharjee, P. S., Brooks, M. E., Colarco, P. R., da Silva, A. M., Eck, T. F., Guth, J., Jorba, O., Kouznetsov, R., Kipling, Z., Sofiev, M., Garcia-Pando, C. P., Pradhan, Y., Tanaka, T., Wang, J., Westphal, D. L., Yumimoto, K., and Zhang, J.: Current state of the global operational aerosol multi-model ensemble: An update from the International Cooperative for Aerosol Prediction (ICAP), Q. J. Roy. Meteor. Soc., 145, 176–209, https://doi.org/10.1002/qj.3497, 2019.
Zhang, L., Montuoro, R., McKeen, S. A., Baker, B., Bhattacharjee, P. S., Grell, G. A., Henderson, J., Pan, L., Frost, G. J., McQueen, J., Saylor, R., Li, H., Ahmadov, R., Wang, J., Stajner, I., Kondragunta, S., Zhang, X., and Li, F.: Development and evaluation of the Aerosol Forecast Member in the National Center for Environment Prediction (NCEP)'s Global Ensemble Forecast System (GEFS-Aerosols v1), Geosci. Model Dev., 15, 5337–5369, https://doi.org/10.5194/gmd-15-5337-2022, 2022.
Zhang, L., Li, H., Grell, G. A., Bhattacharjee, P. S., Ferrada, G. A., Green, B. W., Sun, S., Bernardet, L., Jensen, A., Baker, B., Pan, L., He, J., Schnell, J., Ahmadov, R., Trahan, S., Swales, D., Cheng, A., Yang, F., Schwantes, R. H., McDonald, B. C., Heinzeller, D., and Kondragunta, S.: Development of the CCPP-Based GEFS-Aerosols Component in the Unified Forecast System for Subseasonal Prediction (UFS-Chem v1.0), Zenodo [code], https://doi.org/10.5281/zenodo.19262140, 2026.
Zhang, X., Kondragunta, S., Da Silva, A., Lu, S., Ding, H., Li, F., and Zhu, Y.: The blended global biomass burning emissions product from MODIS and geostationary satellites (GBBEPx), Version 3.1, NOAA/NESDIS/OSPO, https://ospo.noaa.gov/resources/documents/pdf/GBBEPx_EUM.pdf (last access: 10 September 2026), 2019.
Zhang, Y., Liu, P., Liu, X.-H., Pun, B., Seigneur, C., Jacobson, M. Z., and Wang, W.-X.: Fine-scale modeling of wintertime aerosol mass, number, and size distributions in central California, J. Geophys. Res.-Atmos., 119, 1837–1863, https://doi.org/10.1002/2013JD020258, 2014.
- Abstract
- Introduction
- Data and model
- Improved performance of GEFS-Aerosols v12.3
- Implementing inline large-scale wet deposition into Thompson microphysics scheme for UFS-Chem
- Implementation of aerosol indirect effect in UFS-Chem
- Quantification of aerosol radiative feedback and aerosol indirect effects in subseasonal prediction
- Summary and discussion
- Appendix A
- Appendix B: List of acronyms, abbreviations, and experiment names used in this study
- Code and data availability
- Author contributions
- Competing interests
- Disclaimer
- Acknowledgements
- Financial support
- Review statement
- References
- Abstract
- Introduction
- Data and model
- Improved performance of GEFS-Aerosols v12.3
- Implementing inline large-scale wet deposition into Thompson microphysics scheme for UFS-Chem
- Implementation of aerosol indirect effect in UFS-Chem
- Quantification of aerosol radiative feedback and aerosol indirect effects in subseasonal prediction
- Summary and discussion
- Appendix A
- Appendix B: List of acronyms, abbreviations, and experiment names used in this study
- Code and data availability
- Author contributions
- Competing interests
- Disclaimer
- Acknowledgements
- Financial support
- Review statement
- References