
the Creative Commons Attribution 4.0 License.
the Creative Commons Attribution 4.0 License.
 | 25 Aug 2026
Evaluation of the ALARO1-SFX (CY43T2) regional climate model over Belgium across different resolutions
Hans Van de Vyver
Daan Degrauwe
Rafiq Hamdi
Michiel Van Ginderachter
Bert Van Schaeybroeck
Kwinten Van Weverberg
Kobe Vandelanotte
Steven Caluwaerts
Piet Termonia
Regional climate modelling is essential for providing reliable information to understand localised impacts and guide adaptation strategies in the context of climate change. This study evaluates long-term continuous climate simulations over Belgium performed with the ALARO1-SFX model, a novel version of ALARO-1 that incorporates an advanced surface scheme (SURFEX) and improved physiographic datasets.
A scale-selective evaluation setup is introduced, employing a multi-level dynamical downscaling framework to assess the progressive added value of increasing resolution from the mesoscale to convection-permitting scales. The model's performance is evaluated against a gridded observational dataset and precipitation station measurements, focusing on temperature and precipitation biases, diurnal precipitation cycles, and extreme precipitation statistics.
Results indicate that the higher resolutions (12.5 and 4 km) improve temperature and precipitation biases relative to the 25 km simulation, with the 4 km resolution providing the best representation of hourly extreme precipitation and its diurnal cycle. A dedicated sensitivity experiment isolates the contribution of the SURFEX land-surface scheme from that of resolution, attributing a substantial part of the improvement in near-surface temperature and precipitation to the introduction of SURFEX. However, all simulations exhibit varying degrees of wet and cold biases. The findings underscore the added value of convection-permitting modelling for improving diurnal precipitation cycles. Furthermore, the study provides evidence that increasing model resolution improves the representation of extreme precipitation.
- Article
(10567 KB) - Full-text XML
- BibTeX
- EndNote


As climate change intensifies, the demand for reliable and local climate information has become increasingly critical for understanding localised impacts and guiding effective adaptation strategies (Ranasinghe et al., 2021). To this end, state-of-the-art global circulation models (GCMs) perform simulations within the latest phase of the Coupled Model Intercomparison Project, CMIP6 (Eyring et al., 2016). These models typically run at a horizontal resolution of 50–250 km (Nguyen et al., 2024; IPCC, 2021; Masson-Delmotte et al., 2021). At such resolutions, GCM simulations accurately represent large-scale dynamics and responses to external forcings. However, data at these resolutions are often too coarse for many applications, including local impact models. Additionally, these models fail to account for certain sub-grid characteristics (e.g., complex topography, land-sea contrasts, or land cover heterogeneities) and mesoscale dynamical processes, such as deep convection (Rummukainen, 2016; Giorgi, 2019; Lucas-Picher et al., 2021). These processes are included in GCMs through parameterisation schemes. Global model simulations at higher resolutions would alleviate these problems, but these are rendered unfeasible due to the immense computational cost (Fuhrer et al., 2018).
Regional climate models (RCMs) address this computational cost by simulating only a limited area instead of the entire globe but at a higher resolution (Giorgi, 2019). Thereby, however, lateral boundary conditions need to be provided to RCMs by other datasets. These boundary conditions can originate from GCM simulations or from (global) reanalysis data, such as the ERA5 dataset (Hersbach et al., 2020). Typically, long-term climate simulations with an RCM employ a resolution of 10–50 km. Compared to GCM output, this finer-scale output adds value particularly in regions featuring diverse topography and varying land-cover properties (Rummukainen, 2016; Doblas-Reyes et al., 2021). Nevertheless, at such scales, deep convective processes are still parameterised and not explicitly resolved. This is a well-known source of model uncertainty for precipitation, evident in e.g., excessive light precipitation and a too early peaking diurnal convective cycle (Ban et al., 2014; Fosser et al., 2015; Hohenegger et al., 2008; Kendon et al., 2012; Vergara-Temprado et al., 2020). However, for climate models with resolutions higher than ∼5 km, these processes are in fact (partially) resolved (Prein et al., 2015; Lucas-Picher et al., 2021). Models operating at these scales are referred to as convection-permitting models (CPMs).
CPMs typically turn off their convective parameterisation schemes (Coppola et al., 2020). However, the boundary between convection-permitting and convection-parameterised scales is not well defined. In the so-called “grey zone of convection” (∼4–10 km), deep convection is only partially resolved, making it unclear whether parameterisation is required (Vergara-Temprado et al., 2020). In the grey zone, the explicit and parameterised representations compete with one another, which can result in double counting of convective transport or no counting at all (Gross et al., 2018). This can lead to convection being triggered too late by the parameterisation, leading to spurious grid-scale storms, or to convection being triggered too early, systematically shifting convective onset too early in the day (Gross et al., 2018).
The development of scale-aware convective parameterisation schemes addresses this problem. Rather than simply switching convection on or off, these schemes adapt to the resolution by adjusting their tuning parameters accordingly. Scale awareness can be introduced through several approaches, for example by introducing a prognostic variable for the convective fraction of a grid cell (Gerard et al., 2009), scaling the convective area fraction and mass flux with the grid-box area (Grell and Freitas, 2014; Han et al., 2017), or adjusting scheme parameters explicitly as a function of the grid spacing (Zheng et al., 2016). Therefore, models with these parameterisation schemes can operate at both coarse and fine resolutions and even in the grey zone.
CPMs have been shown to improve some notable limitations associated with the parameterisation of deep convection used in lower resolution models. For instance, they improve the diurnal cycle of precipitation, as demonstrated in studies across Europe, including Belgium (De Troch, 2016; Brisson et al., 2016), and more widely across the continent (Berthou et al., 2020). Furthermore, while RCMs generally underestimate precipitation extremes at sub-daily durations (Berg et al., 2019), these extremes are better represented in long-term CPM simulations, as shown by Coppola et al. (2020) and Fosser et al. (2024), and studies over Belgium (De Troch et al., 2013; Tabari et al., 2016; Van de Vyver et al., 2021) and the Alpine-Mediterranean region (Müller et al., 2023, 2024). This improvement in extreme precipitation was also noted in the evaluation of an ensemble of kilometre-scale simulations over Europe and the Mediterranean (Pichelli et al., 2021; Ban et al., 2021; Ha et al., 2024). While precipitation is often the primary focus of added value studies for CPMs, it has also been found that temperature is better represented due to improved representations of topography, clouds, precipitation, and land cover (Leutwyler et al., 2017; Lucas-Picher et al., 2021; Soares et al., 2022).
Despite these advancements, significant model uncertainties remain, particularly in climate projections. These model uncertainties arise from the inherent limitations of the models themselves, and differ amongst models because of different choices in their architectures. On short time horizons (∼ 30 years), these model uncertainties are often larger than the uncertainty related to the chosen climate scenario (Lehner et al., 2020). While increasing resolution tends to reduce model uncertainties, as suggested by Fosser et al. (2024), they remain substantial even in CPMs. This is because higher resolution alone is not a panacea; e.g., microphysics processes remain parameterised in CPMs, contributing to significant uncertainties (Prein et al., 2015; Lucas-Picher et al., 2021). Therefore, it is crucial to maintain model diversity to reliably estimate these uncertainties (Doblas-Reyes et al., 2021). However, the diversity of RCMs is decreasing, as seen in the current iteration of EURO-CORDEX simulations, due to the high community effort required to develop and maintain such models (Jacob et al., 2020; CORDEX, 2025).
In this study, we present ALARO-1, an updated version of the ALARO-0 regional climate model originally introduced by De Troch et al. (2013), where the surface scheme is now handled by the externalised SURFEX1 platform (Masson et al., 2013; Hamdi et al., 2014) rather than by the built-in ISBA2 scheme (Noilhan and Planton, 1989; Noilhan and Mahfouf, 1996). Within SURFEX, natural land surfaces are still treated by ISBA, but SURFEX additionally introduces a tiled representation of the surface with dedicated schemes for urban areas, lakes, and seas. This is necessary to use ALARO-1 for land-use climate studies. The ALARO model was originally developed for numerical weather prediction (NWP) by the ALADIN3 consortium4, which comprised the national (hydro)meteorological services of 16 European and northern African countries (Termonia et al., 2018a). The ALARO model is one of three canonical model configurations (CMCs) within the ALADIN framework, along with the baseline ALADIN model and the AROME5 model6. For a more detailed description, we refer to Termonia et al. (2018a) and to Sect. 2.
The key feature of the ALARO physics package is the 3MT7 scheme, which handles convection, turbulence, and microphysics (Gerard and Geleyn, 2005; Gerard, 2007; Gerard et al., 2009). The 3MT scheme has a unique scale-aware character, so that it can determine itself which processes are resolved at a specific resolution. This provides a smooth multiscale transition from fully-parameterised mesoscale resolutions over the grey zone to fully convection-resolving scales. This multi-scale feature of the ALARO model is unique with respect to other convection-permitting models and makes it the ideal candidate for a multi-resolution model evaluation from the mesoscale up to the convection-permitting scales. Climate simulations will therefore be evaluated at three different resolutions in this study. Specifically, this evaluation focuses on the climatology of near-surface temperature and precipitation, as well as the representation of precipitation extremes and the diurnal precipitation cycle.
Evaluating models at different resolutions is essential for both practical and scientific reasons. From a practical perspective, the computational demands of high-resolution simulations, particularly at convection-permitting scales, are prohibitive for many research groups. As a result, lower-resolution RCMs remain widely used. Scientifically, examining how model representation of the climate evolves with changing resolution is crucial for improving our understanding and interpretation of simulation results.
In this study, we evaluate long-term climate simulations with the ALARO-1 model at three different resolutions: 25, 12.5, and 4 km. Previous climate simulations with ALARO-0 have been extensively evaluated, particularly over Belgium (De Troch et al., 2013; Hamdi et al., 2014; Giot et al., 2016; Tabari et al., 2016; Berckmans et al., 2017; Top et al., 2021). These studies employed ALARO cycle 36, following the versioning system aligned with the cycles of the global IFS8 and ARPEGE9 models (Termonia et al., 2018a). In contrast, this study utilises a more recent version, ALARO cycle 43t2. Moreover, from cycle 40 onwards, ALARO underwent substantial updates, leading to the development of ALARO-1. It introduced significant advancements, including the ACRANEB2 radiation scheme (Mašek et al., 2016; Geleyn et al., 2017) and the TOUCANS scheme (Ďurán et al., 2014; Marquet and Geleyn, 2013) for turbulence and shallow convection. The use of ALARO-1 at higher resolutions in this study marks a novel contribution. The combination of ALARO-1 with SURFEX v8.0 (as used in this study) will be denoted by ALARO1-SFX. More generally, the term ALARO-1 will refer to the current version of the ALARO model, irrespective of the surface scheme used. The broader term ALARO is used when referring to the model in general or when the specific cycle is clear from the context.
The structure of this paper is as follows. Section 2 provides a discussion of the model and the experimental design. Following this, the observational datasets and verification methods used in this study are described in detail. Section 3 presents the results of the evaluation, highlighting the model's performance across different resolutions and comparing it with observational data. In Sect. 4, these results are discussed and placed in a broader context, comparing them with those from previous ALARO-simulations. Finally, Sect. 5 draws the conclusions, summarising the key findings of the study while addressing the limitations and suggesting directions for future research.
2.1 Model and experimental design
2.1.1 ALARO1-SFX model
Historically, the ALARO model has its roots in the global IFS of the ECMWF10 and the global ARPEGE model of Météo-France. These global models were adapted to run on a limited area, which resulted in ALADIN. The ALADIN model employs the same physical parameterisation schemes as the global ARPEGE model. ALARO is in turn a further development of ALADIN: it shares the dynamical core of ALADIN, but it contains different physics parameterisations.
The dynamical core of ALARO can be run both hydrostatically and non-hydrostatically (Bubnová et al., 1995; Termonia et al., 2018a). In both configurations, the dynamical equations are spatially discretised using a spectral representation of double-Fourier modes. For the time-step algorithm, a semi-implicit semi-Lagrangian scheme is employed. In the vertical dimension, the model uses a hybrid terrain-following pressure coordinate (Simmons and Burridge, 1981; Laprise, 1992).
The ALARO-1 physics package combines several parameterisations. Radiative transfer is treated by the ACRANEB2 scheme (Mašek et al., 2016; Geleyn et al., 2017), a broadband scheme with a single shortwave and a single longwave spectral interval that retains the full cloud–radiation interaction at every time step through a net-exchanged-rate decomposition. Turbulent transport and shallow convection are parameterised by the prognostic-TKE-based TOUCANS scheme (Ďurán et al., 2014; Marquet and Geleyn, 2013), which is valid across the full range of atmospheric stability and represents the effect of moisture and phase changes through a modified moist Brunt–Väisälä frequency, removing the need for a separate shallow-convection scheme. Deep convection is represented by the scale-aware 3MT scheme (Gerard et al., 2009), a mass-flux formulation with prognostic updraught and downdraught properties that abandons the quasi-equilibrium assumption and mimics cloud-resolving behaviour in the convection-permitting limit. The associated stratiform cloud and microphysical processes are treated within the same 3MT framework, ensuring a consistent transition between resolved and subgrid condensation as resolution increases.
ALARO-1 can be coupled to the land-surface model SURFEX, which considers four types of land surface: nature, urban areas, lakes and seas. For every grid box, a fraction is defined for each of these four types in a tiling approach. The interaction with the free atmosphere is then calculated by type-specific schemes: ISBA for nature, TEB11 for urban areas, WATFLUX for lakes and SEAFLUX for seas. The separate variables of each tile are finally aggregated with a weighted average to compute grid-box values.
2.1.2 Experimental design
Firstly, a simulation is run at a resolution of 25 km (see Fig. 1) with the ALARO-1 model using boundary conditions from the ERA5 reanalysis dataset (Hersbach et al., 2020). Next, this simulation data is dynamically downscaled to two higher resolutions with a multi-level nesting strategy: each higher-resolution run is coupled hourly to the previous lower-resolution run at the boundaries. The output of all simulations is stored at an hourly frequency. This downscaling results in simulations at 12.5 and 4 km coupled to, respectively, the 25 and 12.5 km simulations. Henceforth, we will refer to each simulation as ALARO-xkm with x the resolution in kilometres. For the lateral boundary coupling, the Davies relaxation scheme is employed (Davies, 1976), with a coupling zone of 8 points (Termonia et al., 2018a). The coupled prognostic variables are temperature, the horizontal wind components, specific humidity, and surface pressure.
All simulations span a period of 32 years from 1 January 1991 to 31 December 2022. The first year is discarded for each simulation to ensure the model, specifically the soil, reaches an equilibrium state. The simulations are continuous, with monthly updates to certain (otherwise) constant fields including the sea surface temperature, the surface roughness length, surface albedo, surface emissivity, and the vegetation parameters. This monthly update methodology is also applied in Giot et al. (2016) and Top et al. (2021).
The different simulation domains are shown in Fig. 1a. The ALARO-25km and ALARO-12km simulations both cover the EURO-CORDEX domain (Jacob et al., 2020). The ALARO-4km simulation covers a smaller domain due to computational constraints. This domain is the operational NWP domain of the Royal Meteorological Institute of Belgium. It is centred on Belgium and covers parts of Western Europe.
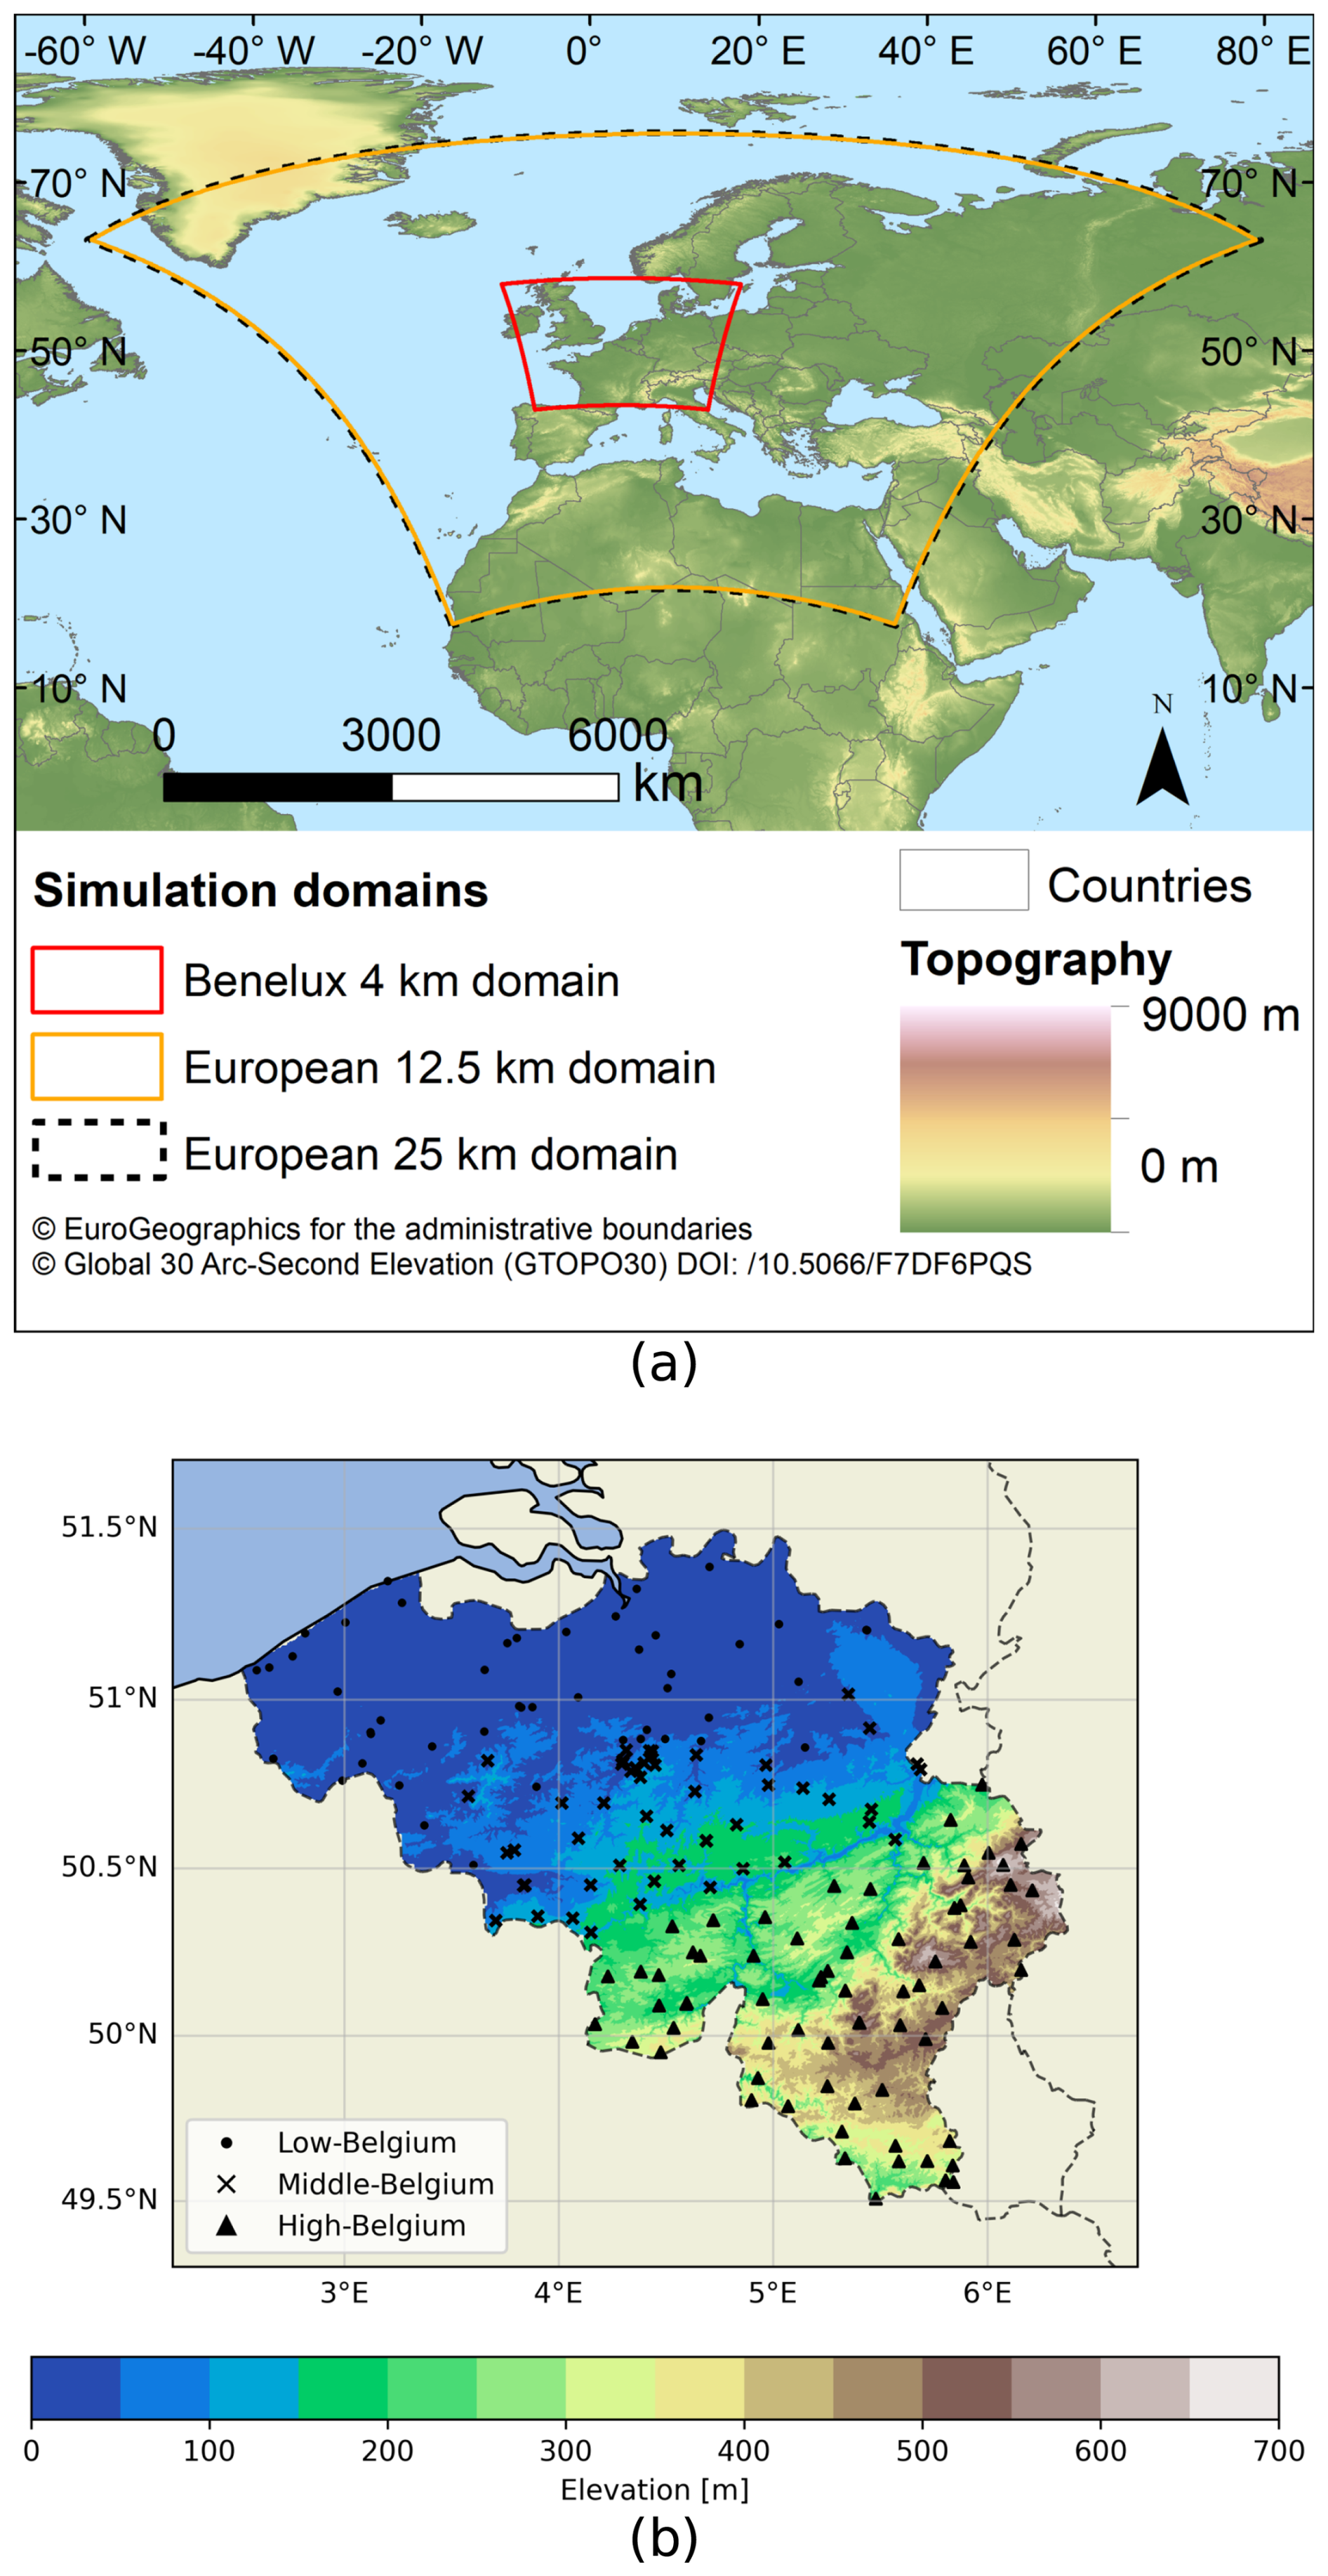
Figure 1(a) Map showing the three simulation domains used in this study, with each domain corresponding to an ALARO-1 simulation at a specific resolution: 25, 12.5, and 4 km, as indicated in the figure legend. (b) Map of Belgium displaying the elevation above sea level, with precipitation measurement stations marked. The marker styles (circles, squares, and triangles) denote the topographic regions each station is assigned to: Low-Belgium (0–50 m), Middle-Belgium (50–200 m), and High-Belgium (> 200 m). © EuroGeographics and © GTOPO30.
The main technical specifications of the simulations are outlined in Table 1. All simulations use the same physics parameterisation framework, including the 3MT scheme for deep convection, which adapts to the model resolution due to its scale-aware nature. Moreover, they all are run with 46 vertical levels and use the hydrostatic dynamical core. Although the 4 km simulation reaches the convection-permitting range, where non-hydrostatic effects can become relevant, we consider the hydrostatic core appropriate at this resolution. For ALARO specifically, Van Ginderachter et al. (2020) compared both dynamical cores at 4 km over a domain of intense deep convection and found that the hydrostatic configuration performed better, as the ALARO physics package, including the scale-aware 3MT deep-convection scheme, is tuned to the hydrostatic core. Retaining the hydrostatic core is moreover consistent with the operational use of ALARO at ∼ 4 km. Finally, it keeps the dynamical core identical across all three resolutions so that resolution effects are not confounded with a change of core.
One significant difference between the simulations concerns the land-surface scheme. SURFEX is not employed for ALARO-25km: instead, the original ISBA scheme is used. The main reason for omitting SURFEX in the 25 km simulation is that urban effects are minimal at this resolution, making its inclusion less relevant. This setup also aligns more closely with the one used in previous simulations from Giot et al. (2016).
The SURFEX land-surface scheme is configured identically in the ALARO-12km and ALARO-4km simulations. Natural land surfaces are represented by the ISBA scheme in its force-restore formulation, which discretises the soil into three layers: a thin surface layer, a root-zone layer, and a deeper sub-root reservoir. Soil hydraulic and thermal properties are derived from the ECOCLIMAP sand and clay fractions (Masson et al., 2003) through the Clapp and Hornberger (1978) pedotransfer relations. The nature tile is treated as a single aggregated patch, and vegetation is prescribed from the ECOCLIMAP climatology without interactive photosynthesis, so that root fractions follow the standard ISBA force-restore profile. Snow is represented by the single-layer force-restore scheme of Douville et al. (1995). Turbulent fluxes over sea and inland water are computed with the direct Charnock method (Charnock, 1955).
Because ALARO-25km and ALARO-12km differ in both resolution and land-surface scheme, the 25 to 12 km change conflates two effects. To isolate the impact of coupling ALARO-1 to SURFEX, we have performed a sensitivity experiment with an additional simulation, ALARO-12km-noSFX, identical to ALARO-12km but retaining the original ISBA scheme. Holding resolution fixed at 12.5 km, any difference between ALARO-12km and ALARO-12km-noSFX is attributable to the land-surface scheme alone. This experiment is analysed separately in Sect. 3.3; all other analyses retain the original set of three simulations.
Table 1Technical specifications of simulations with the ALARO-1 model. This table outlines the main differences between the simulations, while the common features are described in the text. ALARO-12km-noSFX is a sensitivity experiment used only to isolate the effect of SURFEX (Sect. 3.3).

2.2 Observational data
The simulations are evaluated using the CLIMATE-GRID (CG) dataset (Journée et al., 2019), a Belgian 5 km gridded observational dataset based on interpolated station data and developed at the Royal Meteorological Institute of Belgium. The dataset spans the period from 1961 until the present day. It includes daily average temperature and daily total precipitation, which are provided as areal averages over each pixel of the 5 km grid.
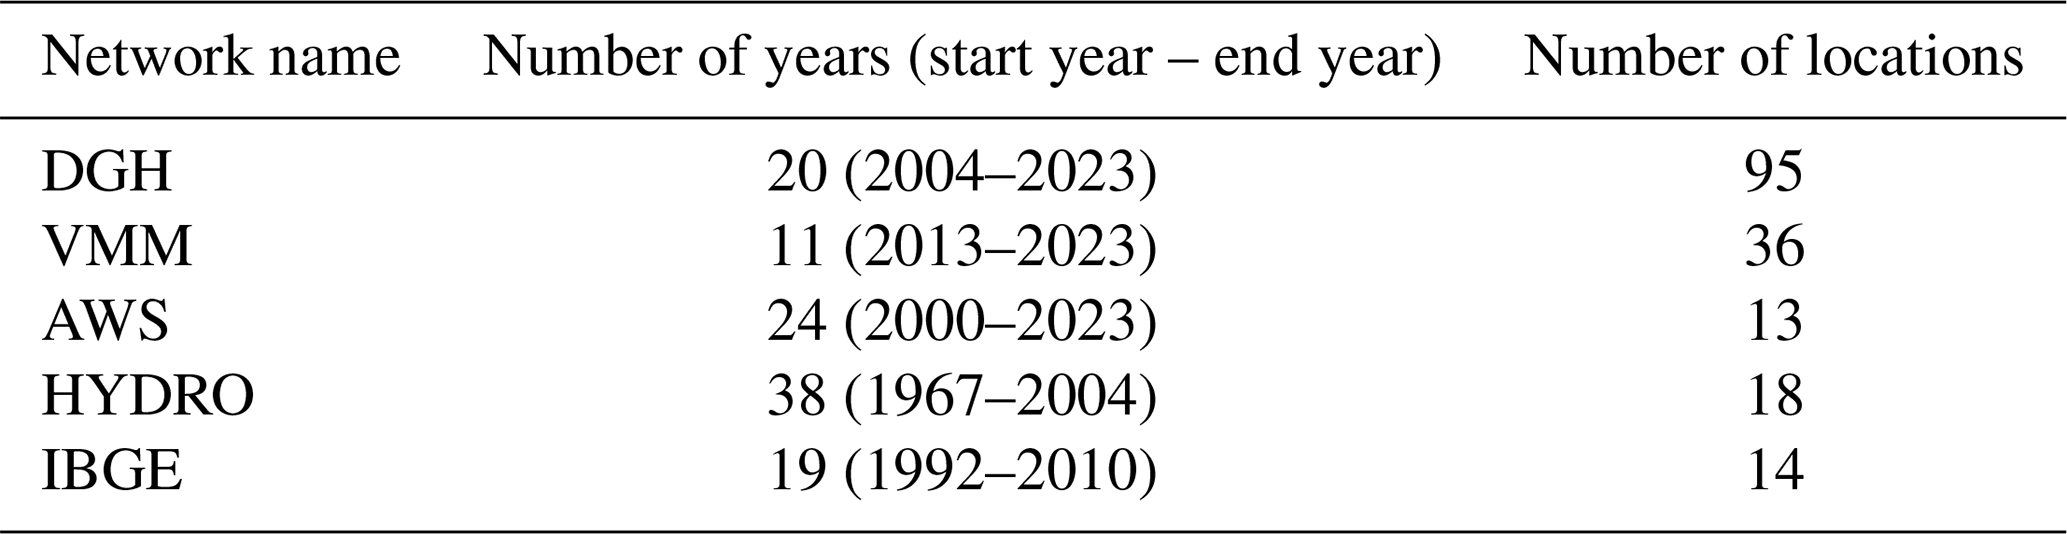
For sub-daily observations of precipitation, we employ station measurements from five measurement networks: VMM in Flanders, DGH in Wallonia, IBGE in Brussels, and the HYDRO and AWS networks covering all of Belgium. The VMM and DGH networks are managed by the Vlaamse Milieumaatschappij and the Direction de la Gestion Hydrologique of SPW Mobilité et Infrastructures, respectively. The IBGE network, established by the Ministry of the Brussels-Capital Region, has been managed by Brussels Environment since 2007 (Dehem et al., 2010; Journée et al., 2014). The AWS and HYDRO networks are operated by the Royal Meteorological Institute of Belgium (Van de Vyver, 2021). The station locations are shown in Fig. 1b, while details about each network are provided in Table C1. Precipitation data from all networks are aggregated to an hourly resolution to align with the temporal resolution of the simulation output.
2.3 Evaluation metrics and data pre-processing
The ALARO-1 simulations are evaluated by calculating the mean bias for near-surface air temperature (simply called temperature from here on) and accumulated precipitation depth on annual, seasonal, and monthly timescales. For an exact mathematical formulation, we refer to Appendix A.
To assess whether the biases are statistically distinguishable from zero, we apply a non-parametric bootstrap at each grid point. For a given field, the 31 years (1992–2022) are resampled with replacement 103 times. The climatological bias (simulation minus observations) is then recomputed for each resample. Next, the 95 % confidence interval is taken as the 2.5th–97.5th percentiles of the resulting distribution. A grid point is deemed significant where this interval excludes zero. Each simulation and the CLIMATE-GRID observations are anchored to the same historical years: the simulations are all originally driven by ERA5 reanalysis over the identical 1992–2022 period. Therefore, the resampling is paired: the same resampled set of years is used for the simulated and observed fields within each iteration. The same paired-bootstrap procedure is applied to the domain-averaged monthly biases, where the bias is first averaged over all grid points before the confidence interval is computed. A month is deemed significant where this interval excludes zero.
To ensure a consistent comparison, all data are regridded to a common latitude-longitude grid with a spacing of 0.07° longitude by 0.045° latitude, which closely aligns with the 5 km resolution of the CG dataset. For precipitation, a conservative remapping is applied to all simulations to preserve the spatially averaged precipitation depth (Jones, 1999). For temperature, the same conservative procedure is used to reproject ALARO-4km. For ALARO-12km and ALARO-25km, another regridding method is employed for temperature. Since low-resolution data are interpolated to a higher resolution, a conservative regridding method would effectively function as a nearest-neighbour approach in such cases. Therefore, a bilinear interpolation procedure is used instead, as it is more suitable for the smooth nature of temperature fields.
2.4 Definition of extreme precipitation
Simulations at convection-permitting scales generally add value through the improved representation of convection and, consequently, of precipitation in general (Prein et al., 2015; Ban et al., 2014; Lucas-Picher et al., 2021; Berthou et al., 2020). Therefore, this evaluation study also focuses on the statistics of extreme precipitation over Belgium. Extreme precipitation events are here defined as the annual maximum (AM) value for a given duration at a specific location or grid point. An advantage of this definition is its simplicity: there is no need to determine an arbitrary threshold. AM values are selected for durations of 1, 2, 3, 6, 12, 24, 48, and 72 h using a rolling-window approach over the hourly precipitation data.
The statistics of these AM values are calculated by fitting a generalised extreme value (GEV) distribution, as defined in Eqs. (B1)–(B2) (Coles, 2001). A GEV distribution is defined by three parameters: the shape ξ, location μ, and scale σ. These parameters are fitted for each duration separately with the L-moments method as defined by Hosking (1990). Consequently, these parameters are used to calculate the return level zd(T), i.e. the d-hourly precipitation intensity expected to be exceeded once every T years, where d is the duration and T the return period. For a mathematical description, we refer to Appendix B.
Next, we apply the regional frequency analysis framework (RFA), as introduced by Hosking and Wallis (1993). The idea behind this framework is to aggregate precipitation data from different locations that share the (presumably) identical underlying distribution. A single fitting procedure is then performed for an entire region instead of fitting a separate distribution in each point, allowing for a more robust fit. Note that the precipitation data are aggregated and not averaged over a region. Recent literature, such as the work by Carreau et al. (2017) and Guerreiro et al. (2024), further supports the use of RFA for improving precipitation extreme estimations.
We subdivide Belgium into three distinct regions based on elevation: Low-Belgium (0–50 m), Middle-Belgium (50–200 m) and High-Belgium (> 200 m), as shown in Fig. 1b. Elevation is used as a discriminatory parameter since it correlates strongly with the annual precipitation totals, which themselves are closely linked to precipitation extremes (Van de Vyver, 2012). This subdivision strikes a balance between reducing uncertainties and maintaining relatively homogeneous climatic conditions within each region, as suggested by Van de Vyver (2012).
Intensity-Duration-Frequency (IDF) statistics jointly characterise the intensity of extreme precipitation as a function of both duration and return period, and are a standard tool for hydrological design and flood-risk assessment (Tabari et al., 2016). The return levels for each region are subsequently presented per return period as a function of the duration to construct these IDF statistics. In order to gauge the return-level uncertainty, we derive the 95 % confidence interval using 104 bootstraps, obtained by resampling yearly data. For each simulation, the observational return levels are compared with their simulated counterparts by calculating the relative error. The error uncertainty is acquired with a pairwise calculation of the error between all observational and simulated bootstrap samples, respectively. This calculation results in a distribution of 108 samples for the relative error.
3.1 Average climatology
Figure 2 shows that ALARO-1 at all three resolutions exhibits a cold temperature bias with respect to the Belgian CLIMATE-GRID observations. This bias is most pronounced in the eastern, more elevated region. Near the coast, all simulations exhibit a small warm bias. The cold bias is statistically significant across almost the entire domain in ALARO-25km, whereas for ALARO-12km and ALARO-4km large parts of the interior are not significantly different from zero (hatched in Fig. 2), consistent with their much smaller domain-mean biases of −0.25 and −0.32 °C. Furthermore, the spatial bias patterns for ALARO-12km and ALARO-4km are very similar. Certain urban areas can be discerned in these simulations presenting themselves as areas with a warm bias.
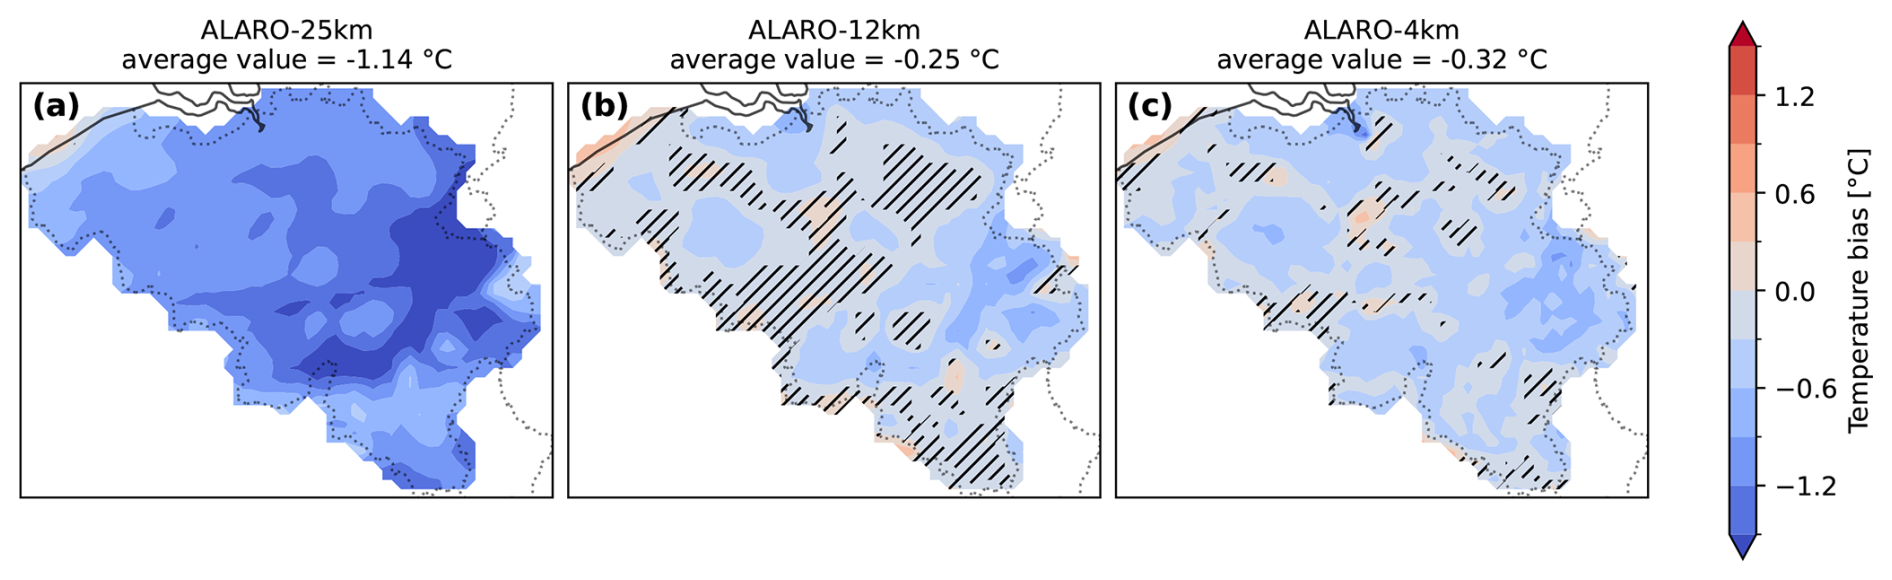
Figure 2Bias in mean annual near-surface air temperature of each simulation with respect to the daily gridded observational CLIMATE-GRID dataset over Belgium, for the period 1992–2022. (a) ALARO-25km, (b) ALARO-12km, (c) ALARO-4km. Hatching indicates grid points where the bias is not significantly different from zero at the 95 % confidence level, based on a paired bootstrap resampling of years.
While the bias difference between ALARO-12km and ALARO-4km is small, a large difference is present between ALARO-25km and ALARO-12km. As outlined in Table 1, apart from the resolution difference, the primary distinction between these two simulations is the inclusion of SURFEX into ALARO-12km. The dedicated ALARO-12km-noSFX experiment (Sect. 3.3) shows that the inclusion of SURFEX, rather than the resolution increase, is the dominant driver of this difference, raising the annual-mean temperature by nearly 1 °C. Overall, ALARO-12km provides the best representation of mean annual temperature.
Considering the annual cycle of the biases, a more complex picture emerges. The spatially averaged biases per month are plotted in Fig. 3, while spatial bias patterns are shown per season in Fig. D1. In each season, ALARO-12km and ALARO-4km perform similarly, except during summer, when both simulations feature a warm bias which is larger in ALARO-12km, particularly in July and August when the bias exceeds 1 °C. This warm bias partially compensates for the cold bias in other seasons on an annual basis. Consequently, ALARO-12km exhibits a smaller annual cold bias than ALARO-4km, despite ALARO-4km performing better in more seasons. Additionally, both ALARO-12km and ALARO-4km strongly underestimate the temperature in spring, which also corresponds to the largest seasonal cold bias for ALARO-25km. The largest negative bias, which is around −1.5 °C, is attained in May. The domain-averaged monthly biases of ALARO-25km are significant year-round except in September, whereas for ALARO-12km and ALARO-4km significance is confined to the seasonal extremes: the spring cold bias (March–May/June), the summer warm bias (August), and a November cold bias (Fig. 3a).
During the seasons with warming sea surface temperatures (SST), spring and summer, there is a cold bias near the coast, while the opposite is true for autumn and winter (see Fig. D1). This may be attributed to the monthly replacement of SST, creating a lag effect. In addition, coastal grid points partly consist of sea: the diagnosed 2 m temperature is the tile-weighted average over the land and sea fractions, so the (lagged) sea surface temperature is directly reflected in the near-surface temperature of these mixed cells.
In terms of significance (Fig. D1), the cold bias of ALARO-25km is significant across the whole domain in every season. For ALARO-12km and ALARO-4km the bias is largely insignificant, except in spring, where the cold bias is significant domain-wide. In summer, ALARO-12km exhibits a significant warm bias over much of the domain, whereas in ALARO-4km this warm bias is weaker and largely insignificant, consistent with its cooler summer near-surface temperature.
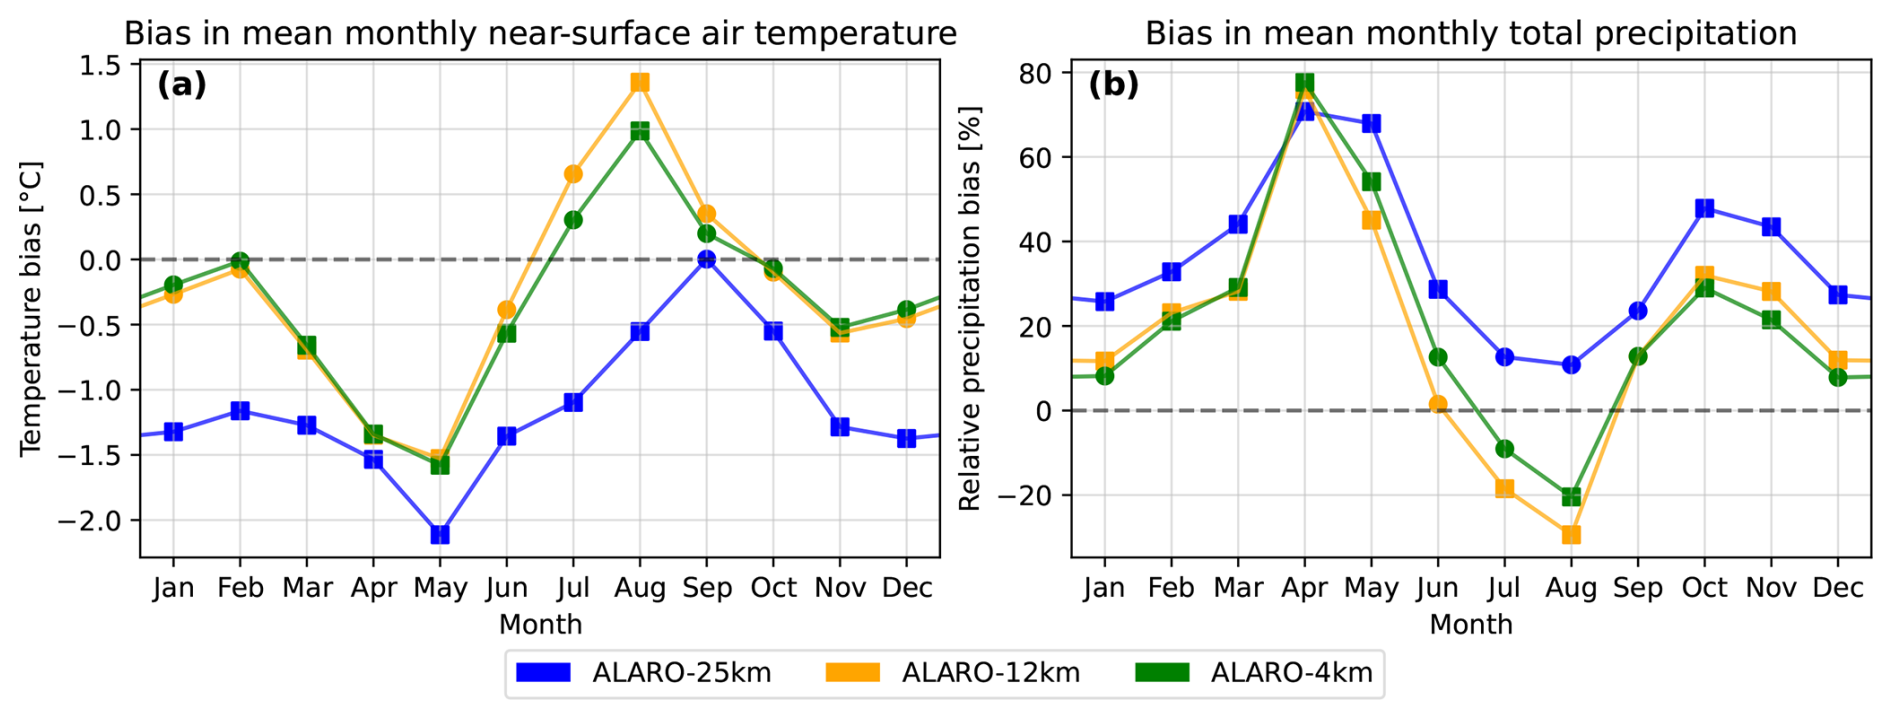
Figure 3The annual cycle of the temperature bias (a) and relative precipitation bias (b) for each simulation (25, 12.5, and 4 km resolutions) with respect to the gridded observational CLIMATE-GRID dataset, averaged over Belgium, for the period 1992–2022. Square markers denote months where the domain-averaged bias is significantly different from zero at the 95 % confidence level (paired bootstrap resampling of years); circular markers denote non-significant months.
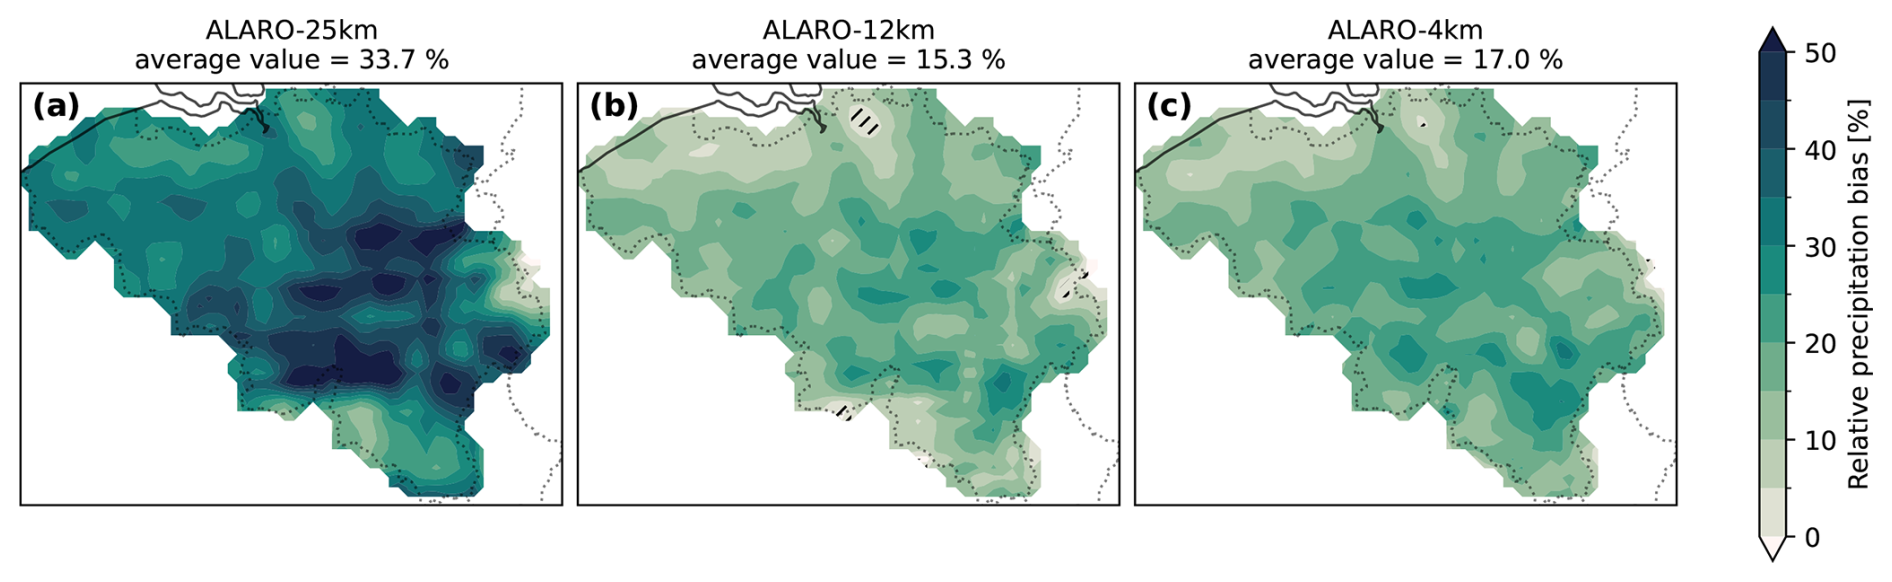
Figure 4Relative bias in mean annual precipitation of each simulation with respect to the daily gridded observational CLIMATE-GRID dataset over Belgium, for the period 1992–2022. (a) ALARO-25km, (b) ALARO-12km, (c) ALARO-4km. Hatching indicates grid points where the bias is not significantly different from zero at the 95 % confidence level, based on a paired bootstrap resampling of years.
ALARO-1, at all three resolutions, features a wet bias both annually (Fig. 4) and across all months (Fig. 3) and seasons (Fig. D2), except for summer (July and August) in ALARO-12km and ALARO-4km, which coincides with a warm bias in these simulations. Similarly to temperature, the bias in annual precipitation is smallest for ALARO-12km. ALARO-4km is slightly wetter, while ALARO-25km features a bias nearly twice as high as ALARO-12km. The wet bias is significant over essentially the whole domain for all three simulations (Fig. 4).
However, once more, ALARO-4km performs best when evaluating the seasons separately. ALARO-12km shows a smaller bias only during springtime. Similarly to temperature, the precipitation bias in spring is substantially larger (in absolute values) compared to the other seasons. Regarding significance (Fig. D2), the wet bias is significant across essentially the whole domain for all three simulations in autumn, winter, and spring. Summer is the exception: ALARO-25km retains a significant wet bias only in the south of the domain, whereas ALARO-12km and ALARO-4km show a significant dry bias in the north. Consistent with its smaller domain-mean dry bias, ALARO-4km shows a significant dry bias over a smaller northern area than ALARO-12km, with the central domain no longer significantly biased.
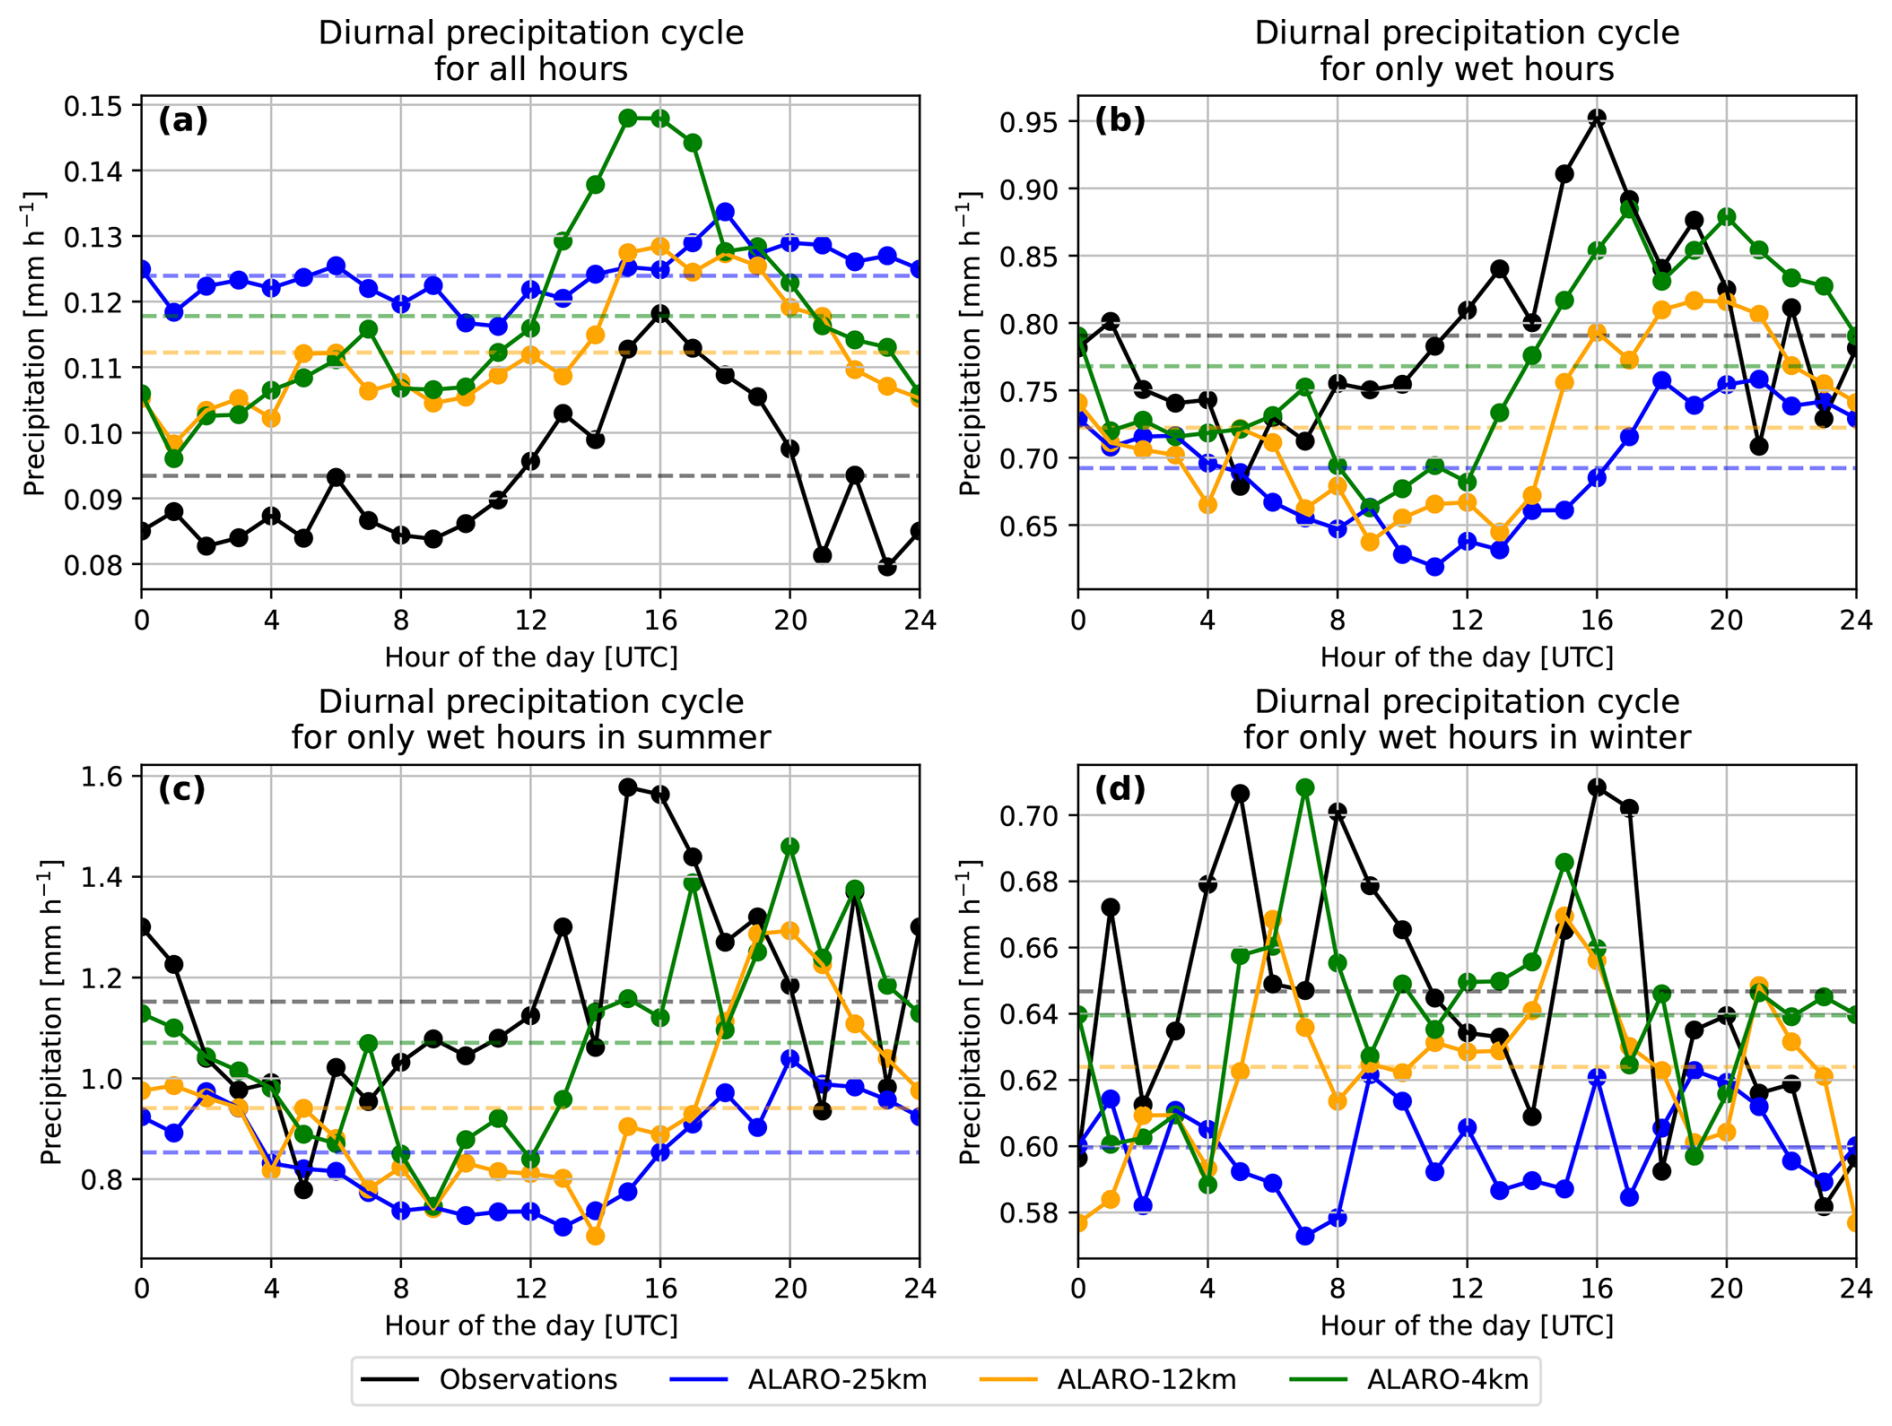
Figure 5Diurnal cycle of precipitation in Uccle, Belgium, for station measurements (observations) and for each simulation (25, 12.5, and 4 km resolutions), for the period 1992–2022. The dashed lines denote the average values over the considered hours. (a) All hours. (b) Only wet hours (>0.1 mm h−1). (c) Only wet hours (>0.1 mm h−1), summer. (d) Only wet hours (>0.1 mm h−1), winter.
Figure 5 shows the diurnal cycle of precipitation in Uccle, Belgium. The diurnal cycle is first analysed across all hours (Fig. 5a). All simulations overestimate precipitation for all hours. Apart from the systematic bias, ALARO-4km neatly reproduces the diurnal precipitation variation. The observed afternoon peak around 16:00 UTC, for instance, is also present in ALARO-4km albeit with a higher intensity. ALARO-12km displays a smaller and slightly delayed peak, while ALARO-25km lacks a clear peak, maintaining roughly uniform precipitation amounts throughout the day. During wet hours (i.e. hours with a precipitation rate > 0.1 mm h−1), on the other hand, there is a dry bias for all models (Fig. 5b). ALARO-4km again aligns most closely with observations, followed by ALARO-12km and ALARO-25km. The afternoon peak at 16:00 UTC remains visible for the observations but is less pronounced and slightly delayed for ALARO-4km. The delay is even larger for ALARO-12km and ALARO-25km, with progressively smaller peaks as resolution decreases. In summer (Fig. 5c), average precipitation values and peak amplitudes are considerably higher, although the simulated peaks occur slightly later and are less intense at lower resolutions. In winter (Fig. 5d), no clear peak is observed, and the average precipitation intensity is approximately half of the summer values.
Table 2Decomposition of the mean hourly precipitation in Uccle into wet hour intensity and frequency contributions, for the period 1992–2022. A wet hour is defined as an hour with a precipitation rate > 0.1 mm h−1. is the mean precipitation over all hours; is the mean intensity during wet hours; is the corresponding frequency of occurrence.
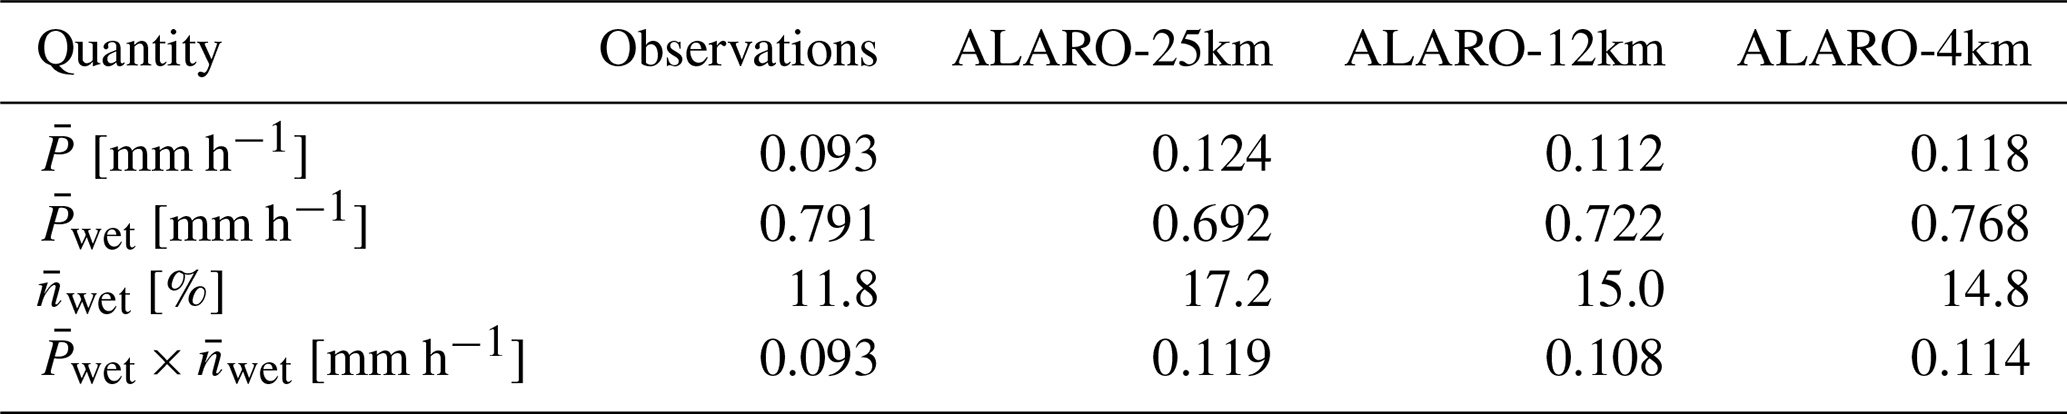
Overall, these results indicate that although the simulations reproduce the timing of the diurnal cycle reasonably well, they overestimate precipitation frequency – raining too often with too little intensity – especially at coarser resolutions. To quantify this, we decompose the mean hourly precipitation into the frequency and intensity contributions from wet hours, defined as hours with a precipitation rate > 0.1 mm h−1 (Table 2). All simulations overestimate the wet-hour frequency (11.8 % observed) while underestimating the wet-hour intensity (0.791 mm h−1 observed), most severely at 25 km (17.2 % and 0.692 mm h−1). Increasing resolution reduces the frequency bias and raises the wet-hour intensity, shifting the simulations from frequent-weak towards less-frequent, more-intense precipitation. This confirms that the mean wet bias arises from a too-high precipitation frequency combined with too-weak wet-hour intensities, rather than from excessive intensity.
3.2 Extreme precipitation
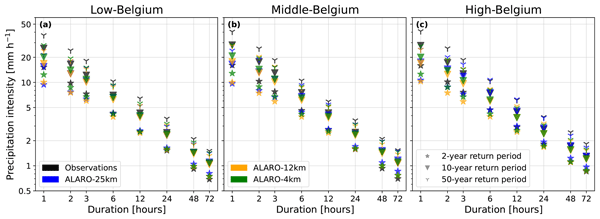
The calculated IDF statistics are presented in Fig. 6 for each topographic region. The difference in observational return levels between the regions is apparent for both sub-daily durations (<6 h) and durations extending beyond one day (≥24 h). In the former case, the values for Middle- and High-Belgium are similar to one another, but those for Low-Belgium are smaller, while in the latter case, the difference between Middle- and Low-Belgium disappears and the return levels over High-Belgium exceed those over the other two regions.
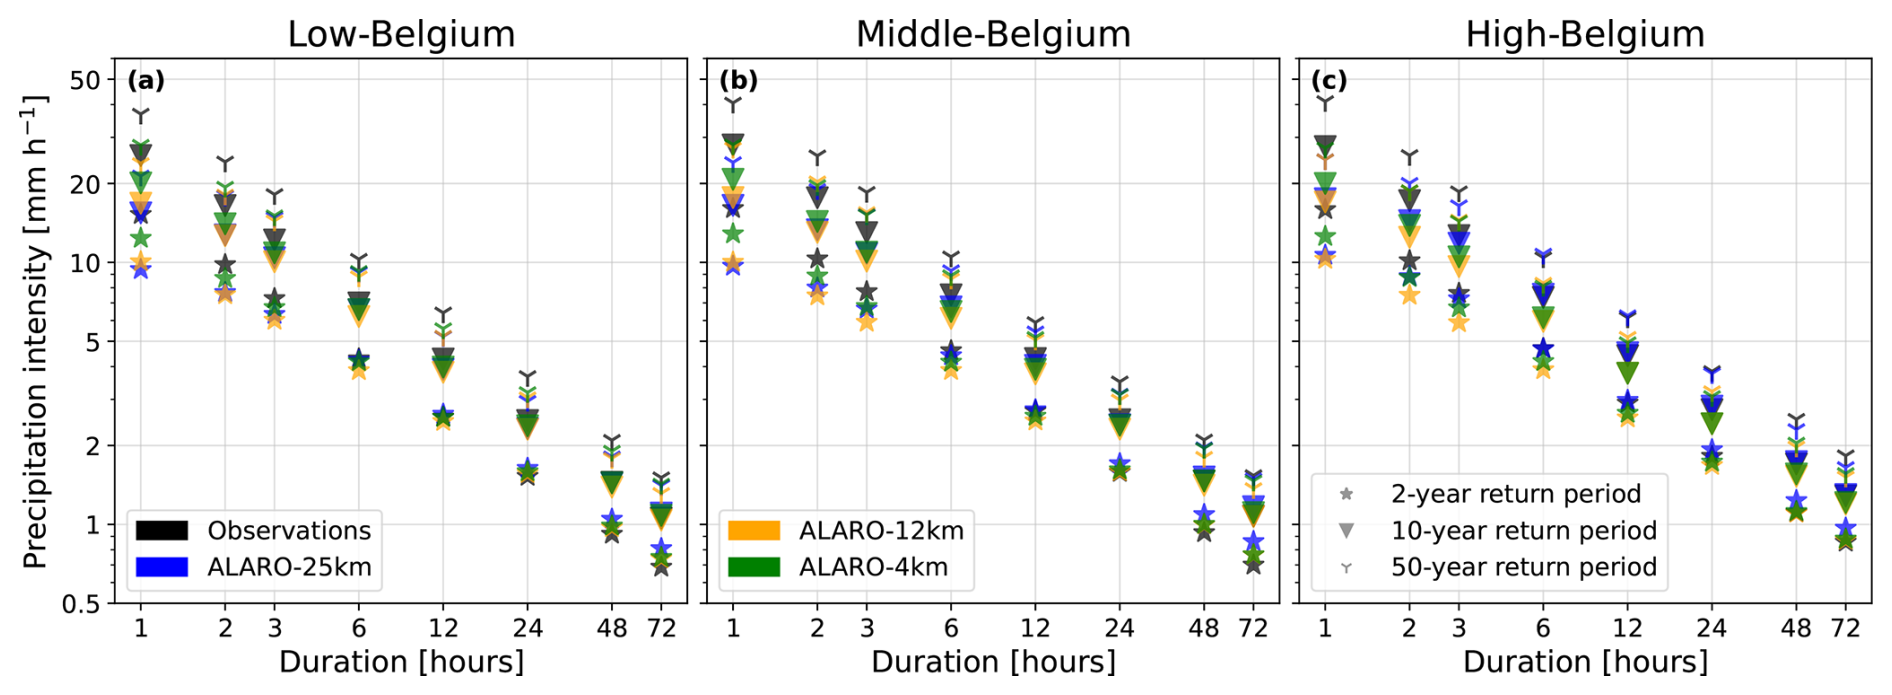
Figure 6Intensity-Duration-Frequency (IDF) statistics for three topographic regions over Belgium, using all available years for each dataset (observational record lengths are given in Table C1; simulations span 1992–2022): (a) Low-Belgium (<50 m), (b) Middle-Belgium (50–200 m), (c) High-Belgium (>200 m). The markers show the return-level precipitation intensities as a function of duration on a log-log scale (both axes), calculated using the Regional Frequency Analysis (RFA) framework. The colours represent the dataset (station observations or simulations), while the marker styles denote the different return periods (2, 10, and 50 years).
The observational return levels decrease approximately linearly with precipitation duration on a log-log scale (Fig. 6), corresponding to the power-law scaling of extreme precipitation. The simulated return levels follow the same linear behaviour for durations of 6 h and longer, but deviate at short durations (<6 h), where they curve downward, away from the observations. To quantify this behaviour, a linear regression of the log-transformed return levels against the log-transformed duration was performed for each dataset, region, and return period. The resulting slopes and coefficients of determination (R2, the fraction of variance in the return levels explained by the linear fit) are shown in Fig. D3; the fitted lines themselves are not overlaid on Fig. 6. The slope is steepest for the observations, followed by the simulations in order of decreasing resolution (ALARO-4km, ALARO-12km, ALARO-25km). The linear fit is also best for the observations (R2 closest to 1), again followed by ALARO-4km, ALARO-12km, and ALARO-25km, reflecting the increasing downward curvature at short durations as resolution decreases. Comparing return periods, longer return periods yield a steeper (more negative) slope but a lower R2.
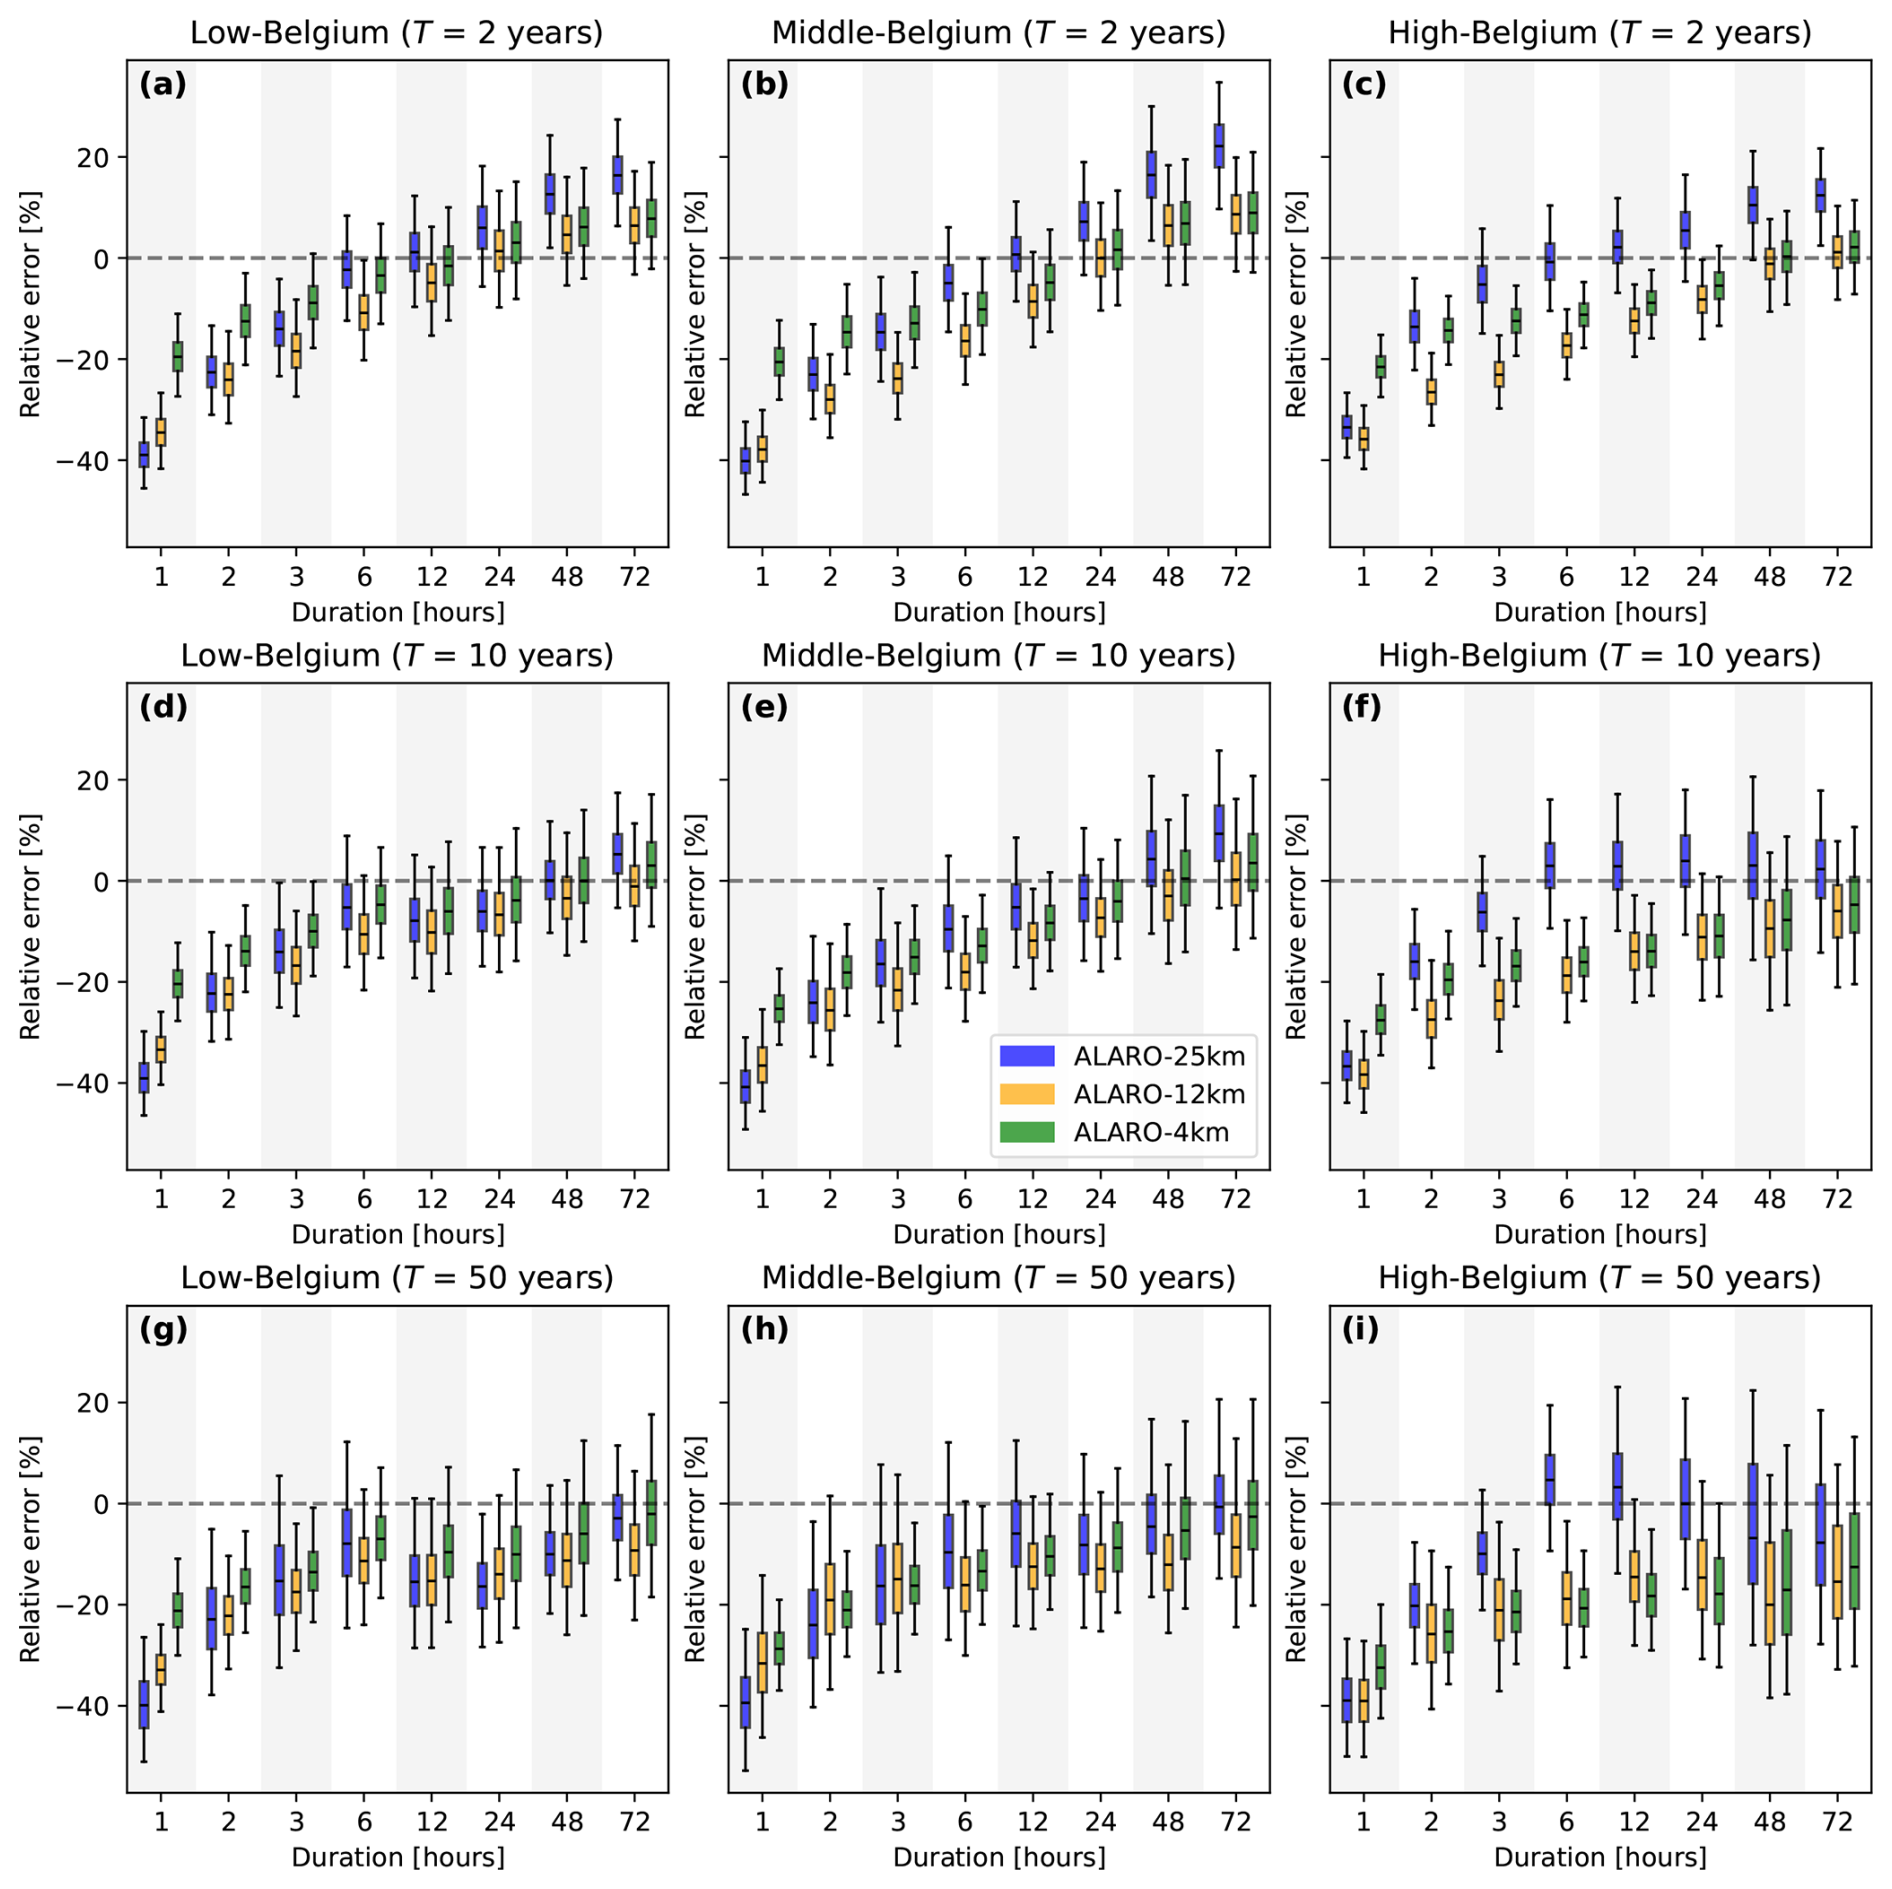
Figure 7Relative error of the return-level intensities for each region (rows: Low-, Middle-, High-Belgium) and return period T (columns: 2, 10, 50 years), using all available years for each dataset (observational record lengths are given in Table C1; simulations span 1992–2022). Panels (a)–(i) are ordered row-wise. Each box plot represents the uncertainty gauged by the bootstrap procedure with 104×104 (=108) samples: the box spans the interquartile range (25th–75th percentile) around the median, and the whiskers span the 95 %-confidence interval (2.5th–97.5th percentile).
Despite its strong wet bias for average precipitation, ALARO-25km underestimates the sub-daily (<6 h) return levels for all regions and return periods, as shown in Fig. 7. For the (multi-)daily (≥24 h) durations, the performance depends on the return period. The least extreme events, i.e. those with the shortest return period, are overestimated, while the events with the longest return period generally tend to be underestimated, although the uncertainty is large. Conversely, ALARO-12km provides smaller return levels than ALARO-25km for sub-daily (<6 h) durations, except for hourly events in Low- and Middle-Belgium (Fig. 7a, d). Hence, the sub-daily extreme precipitation intensities are also underestimated by this simulation. For (multi-)daily (≥24 h) durations, this intensity decrease with higher resolution is also present, especially in High-Belgium (Fig. 7g–i). Finally, for ALARO-4km the hourly return levels are substantially closer to the observational values for a 2-year return period and markedly closer for longer return periods. Generally, the ALARO-4km extremes increase in intensity compared to the ALARO-12km simulation, leading to improvements for some durations and regions, but not universally.
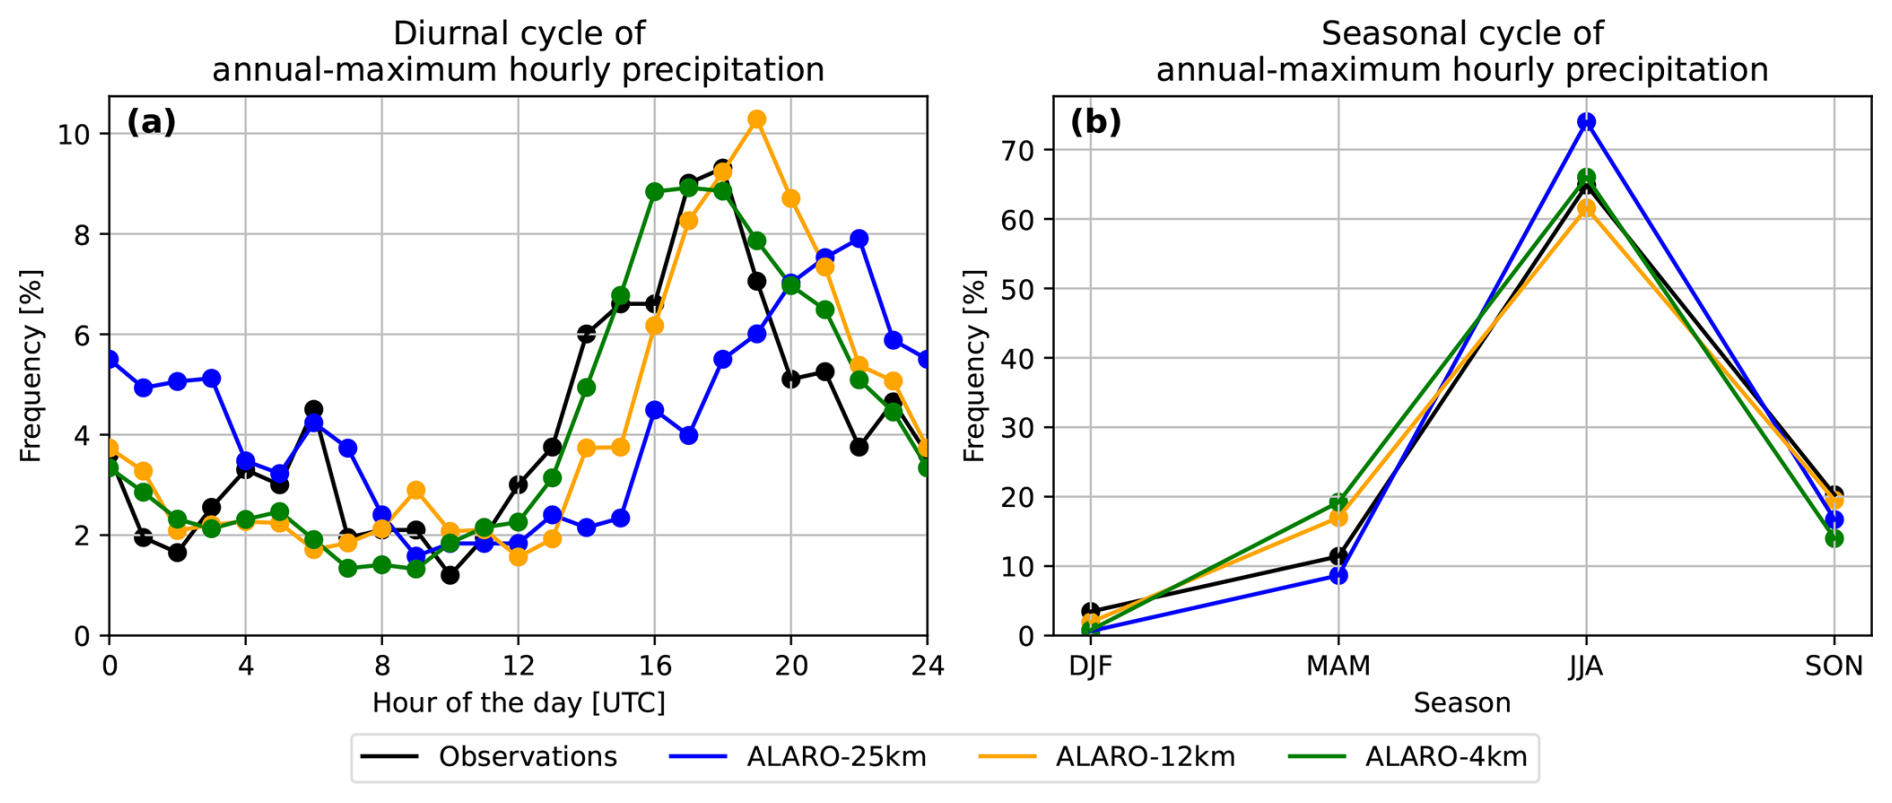
Figure 8Frequency of annual-maximum hourly precipitation intensities over Belgium for hourly station observations (HYDRO network) and for each simulation (25, 12.5, and 4 km resolutions), using all available years for each dataset (observational record lengths are given in Table C1; simulations span 1992–2022). (a) Diurnal cycle: showing the frequency of annual-maximum hourly precipitation intensities for each hour of the day (UTC). (b) Seasonal cycle: showing the frequency of annual-maximum hourly precipitation intensities for each season (winter, spring, summer, autumn).
Figure 8 presents the diurnal and seasonal cycles of the frequency of annual-maximum hourly precipitation intensities over Belgium. In the diurnal cycle, the observations clearly show a primary peak in the afternoon. ALARO-4km captures both the timing and magnitude of this peak with high accuracy. ALARO-12km also reproduces a peak, but it occurs slightly later (i.e. 1–2 h) and with a higher frequency than observed. For ALARO-25km, the peak occurs even later (around 22:00 UTC) and has a lower frequency compared to the observations.
3.3 Effect of SURFEX
Figure 9 shows the annual-mean difference between ALARO-12km and ALARO-12km-noSFX, which isolates the effect of the SURFEX land-surface scheme, as all other components are identical between the two simulations. Both differences are significant across the entire domain (Fig. 9a, b). The temperature difference is roughly constant across the domain, except for some urban areas (e.g., Brussels) where the warming is stronger. On the other hand, the precipitation difference exhibits a clear north-south gradient, with the southern part of Belgium experiencing a stronger reduction in precipitation than the northern part. Moreover, the diurnal cycle of precipitation over Belgium (Fig. 9c) isolates how SURFEX acts on the sub-daily distribution. Both configurations share the same single afternoon peak at 16:00–17:00 UTC. Introducing SURFEX leaves the timing and shape of the cycle essentially unchanged except for a reduction in amplitude, damping the afternoon peak more strongly than the overnight minimum. Therefore, the resolution-dependent shift in peak timing seen in Fig. 5 is not a consequence of the land-surface scheme.
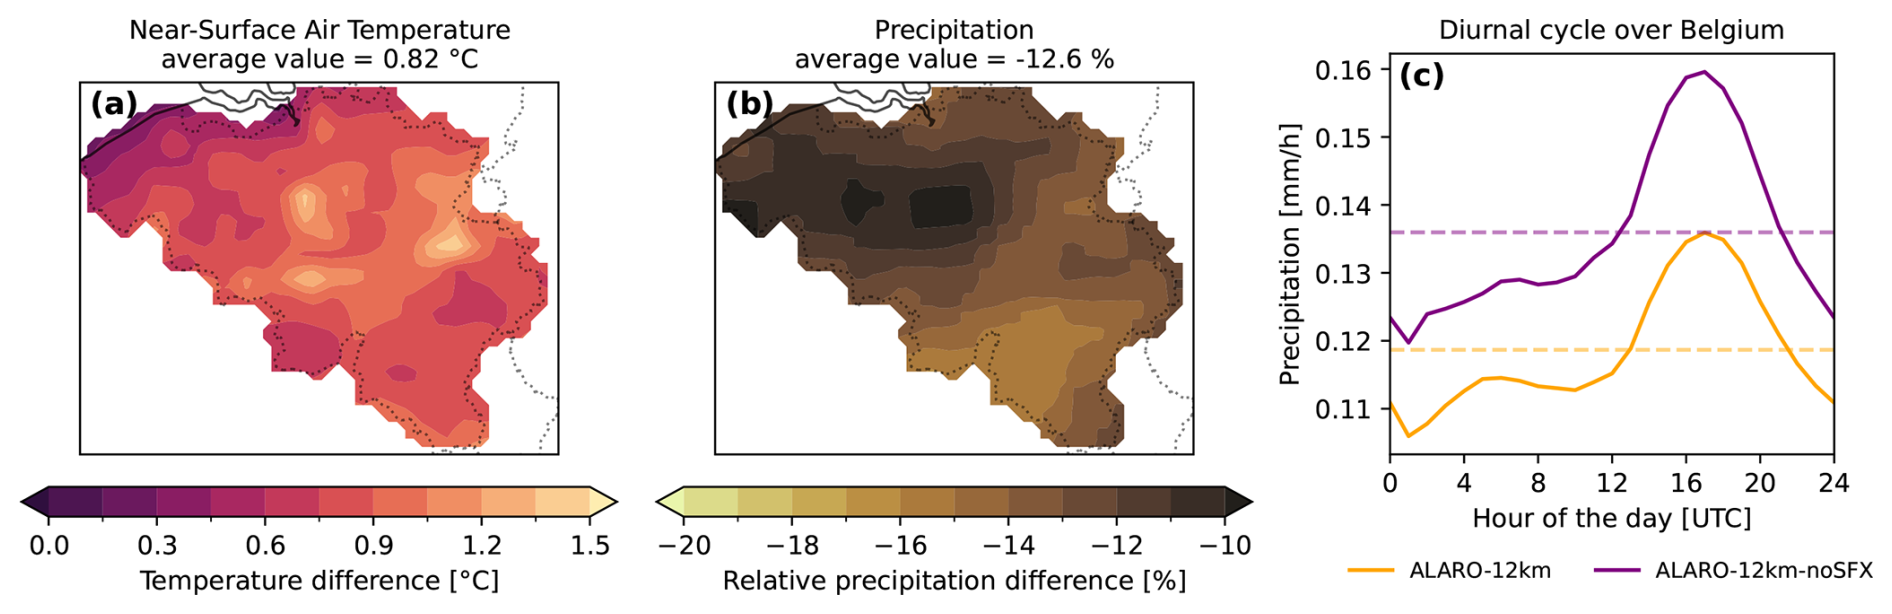
Figure 9Effect of introducing SURFEX at fixed 12.5 km resolution, from the annual-mean difference between ALARO-12km and ALARO-12km-noSFX over Belgium, 1992–2022. (a) Near-surface air temperature difference. (b) Relative precipitation difference. Domain-averaged values reported above each panel. Hatching in (a) and (b) indicates grid points where the difference is not significantly different from zero at the 95 % confidence level, based on a paired bootstrap resampling of years. The difference is significant across the entire domain, so no hatching is visible. (c) Domain-mean diurnal cycle of precipitation (all hours) for the two configurations; dashed lines denote the daily-mean value of each.
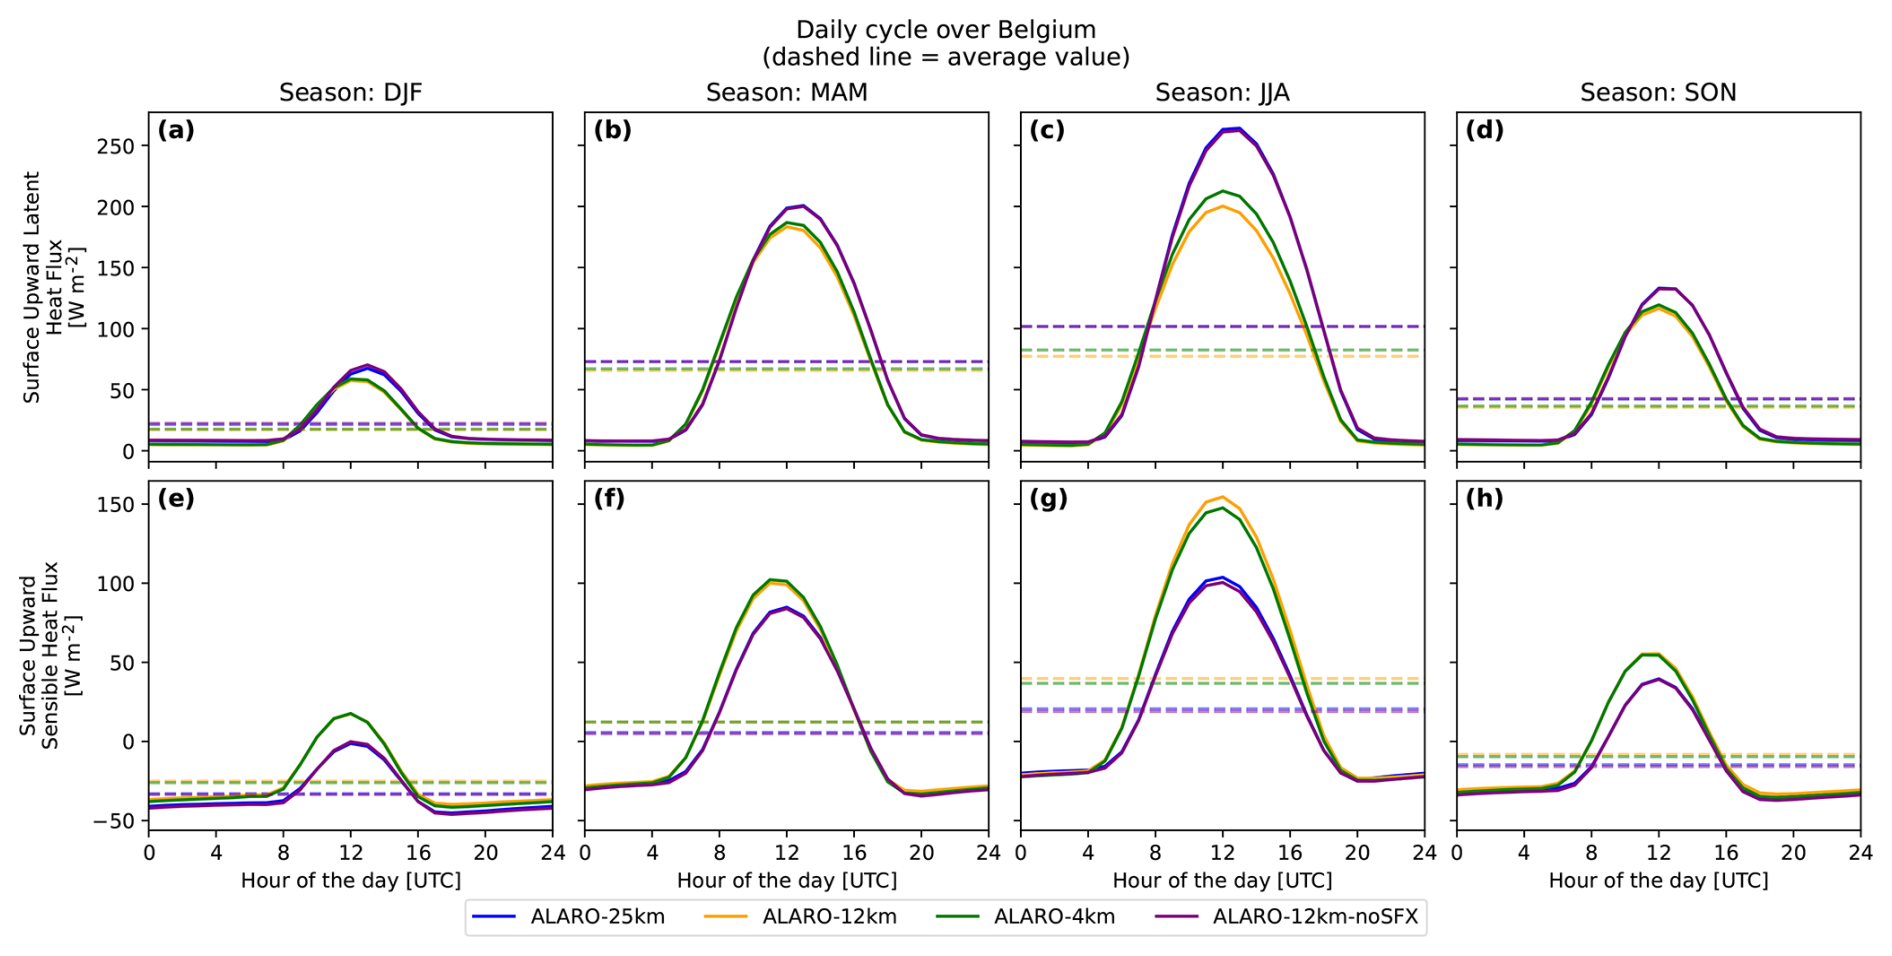
Figure 10Seasonal diurnal cycle of the surface upward latent (a–d) and sensible (e–h) heat fluxes over Belgium for all simulations, 1992–2022. Columns are the four seasons (DJF, MAM, JJA, SON). Dashed lines denote the daily-mean value of each simulation.
To identify the mechanism, we examine the surface energy balance (Fig. 10), showing the seasonal diurnal cycle of the latent (a–d) and sensible (e–h) heat fluxes. The simulations separate by land-surface scheme rather than resolution: ALARO-12km-noSFX closely tracks ALARO-25km, while the SURFEX simulations (ALARO-12km and ALARO-4km) cluster together. Introducing SURFEX reduces the latent heat flux and increases the sensible heat flux, in both cases most strongly in summer, and slightly advances the diurnal peak of each. The net surface radiation is essentially identical across all simulations (Fig. D4), so the available energy at the surface is unchanged. The sum of the latent and sensible heat fluxes is correspondingly near-identical in daily-mean magnitude, but its diurnal cycle is advanced in the SURFEX simulation. This phase shift, together with the shift toward sensible heating, points to a reduced surface thermal inertia, consistent with drier soil responding more rapidly to daytime forcing. This is consistent with the flux differences being driven by the surface state, as the net surface radiation, which sets the total available energy, is essentially unchanged.
As a whole, it is shown that the introduction of SURFEX reduces the latent heat flux and increases the sensible heat flux, especially in summer. This can be partly attributed to the inclusion of urban elements, which contain no moisture and therefore reduce the latent heat flux. However, the effect is also present in non-urban areas, indicating that the difference is not solely due to urbanisation. Although the differing soil discretisations of the two schemes preclude a direct quantitative comparison of soil moisture, the reduced latent heat flux, drier summers, and associated warming are all consistent with reduced soil moisture in the SURFEX configuration. This shift in the partitioning of the surface fluxes is consistent with the observed warming of near-surface air temperature and the reduced precipitation.
4.1 Average climatology
A clear distinction in climatology can be drawn between ALARO-25km on the one hand, and ALARO-12km and ALARO-4km on the other hand, both for near-surface air temperature and accumulated precipitation. The cold bias from ALARO-25km of −1.14 °C over Belgium is significantly improved by about 1 °C in the two simulations with the highest resolutions, as shown in Fig. 2. Furthermore, these simulations both exhibit a reduced wet bias in comparison with ALARO-25km. The difference between ALARO-12km and ALARO-4km is mostly small when compared to ALARO-25km. Aside from the difference in resolution, ALARO-12km employs the land-surface model SURFEX, while ALARO-25km still uses the built-in module ISBA. The dedicated ALARO-12km-noSFX experiment (Sect. 3.3), which holds resolution fixed, shows that this difference in land-surface scheme, rather than the resolution increase, is responsible for the clear distinction between these two sets of simulations.
In Giot et al. (2016) 30-year simulations over Europe were performed with ALARO-0, a previous version of the ALARO model, and the built-in land surface scheme ISBA. These simulations were performed at resolutions of 0.44° (∼50 km) and 0.11° (∼12 km) and contained an area-averaged yearly bias in near-surface air temperature of a little less than −1 °C over the Middle-European sub-region (which covers Belgium, the Netherlands, most of Germany, and parts of neighbouring countries). This result is very similar to the yearly bias of ALARO-25km in this work. The seasonal temperature biases of Giot et al. (2016) over Middle-Europe are also in line with the results of ALARO-25km.
Furthermore, in Berckmans et al. (2017), simulations with ALARO-0 for a 10-year period were carried out in three different configurations, one of which consisted of continuous simulations as performed in this work. It should be noted that, contrary to those of Giot et al. (2016), these simulations were performed with the SURFEX model, albeit a previous version, SURFEXv5. Over Middle-Europe, an average yearly temperature bias of −1.6 °C was found, while for winter and summer a bias of −1.3 °C was presented. This is comparable to the results of Giot et al. (2016) and of ALARO-25km, even though the latter simulations did not use SURFEX.
Lastly, 4 km ALARO-0 simulations without SURFEX were performed in the context of the CORDEX.be I project (Termonia et al., 2018b). In the final report (Termonia et al., 2018c) a cold bias of 1.3 °C in the average yearly temperature over Belgium was presented. This value is in line with the results from Giot et al. (2016), Berckmans et al. (2017), and ALARO-25km, but contrasts with the temperature bias of the here-presented ALARO-12km and ALARO-4km, even though these CORDEX.be I simulations were run at 4 km. This is consistent with our ALARO-12km-noSFX experiment (Sect. 3.3), which directly demonstrates that the use of SURFEX, and not the resolution increase, is responsible for the improved temperature bias, through a shift in the partitioning of the surface heat fluxes.
Evaluation against the CG dataset reveals that all ALARO-1 simulations exhibit a consistent annual wet bias over Belgium, with this bias most pronounced in ALARO-25km. Seasonal analyses confirm a wet bias across all seasons, except for a dry bias in summer in both ALARO-12km and ALARO-4km. Differences between ALARO-12km and ALARO-4km remain insubstantial across seasons. The ALARO-12km-noSFX experiment (Sect. 3.3) confirms that the inclusion of SURFEX, rather than the change in spatial resolution, exerts the dominant influence on average precipitation.
Our results for precipitation (Fig. 4) are now compared to previous continuous simulations from Giot et al. (2016) (resolutions of 50 and 12.5 km). The annual precipitation bias of ALARO-25km (33.7 %) is markedly larger than the annual bias of approximately 20 % over Middle-Europe (ME) reported by Giot et al. (2016) (for both their 50 and 12.5 km simulations), whereas ALARO-12km (15.3%) and ALARO-4km (17.0 %) are somewhat smaller. On the other hand, the annual precipitation bias over ME in Berckmans et al. (2017) (at 20 km resolution) was 15 %, which agrees almost perfectly with the results from ALARO-12km and ALARO-4km. For summer and winter precipitation, the biases of Berckmans et al. (2017) and Giot et al. (2016) are similar to each other and resemble closely those of ALARO-25km. Conversely, the winter, and particularly the summer precipitation totals are much drier in ALARO-12km and ALARO-4km compared to ALARO-25km. The large wet bias in spring, reported in Giot et al. (2016) is also present (and slightly increased) in the simulations in this work. Finally, the large bias in autumn was absent in the simulations of Giot et al. (2016), where the bias was between 0 % and 10 %.
Previous 4 km simulations showed results similar to ALARO-4km. Compared to the HRES-simulations from CORDEX.be I, the bias in winter precipitation was of comparable magnitude (Termonia et al., 2018c). Biases from De Troch et al. (2013) were slightly smaller for summer precipitation than for ALARO-4km: their 4 km simulation showed a bias of only 3 %. Notably, those simulations employed daily restarts, which could have a significant impact–especially in summer, when soil moisture feedbacks tend to play a more important role. There was a difference of roughly 10 percentage points between their 10 km and 4 km simulations in summer precipitation bias, which is also present between ALARO-12km and ALARO-4km but with an opposite sign. Both cases can be interpreted as an improvement in the representation of (convective) precipitation when increasing the resolution.
In De Troch (2016), the multi-scale behaviour of ALARO-0 was investigated by means of the diurnal cycle of precipitation in summer and winter. An identical distinction between all hours and wet hours is made in this work, as shown in Fig. 5. It was shown in De Troch (2016) that in summer the timing and amplitude of the diurnal peak were improved for simulations with ALARO-0 at 10 and 4 km compared to a 40 km simulation, when considering all hours. However, the timing of the afternoon peak as reproduced by the model was still too early. A similar behaviour is evident in this work, although ALARO-4km captures the timing better (later) than in De Troch (2016). For winter precipitation, the 4 km simulation from De Troch (2016) exhibited a weak peak in the early afternoon, which is absent in the observations. Our ALARO-4km simulation reproduces this constant diurnal pattern better than those in De Troch (2016). Since winter precipitation over Belgium is predominantly stratiform, the spurious afternoon peak in their ALARO-0 simulation points to convective triggering when little is expected; its near-absence in ALARO-1 suggests less spurious wintertime triggering, though isolating the responsible change is left for future research.
When considering only wet hours (i.e. hours with a precipitation rate >0.1 mm h−1), the observations show no diurnal variation (regardless of some noise) in winter (Fig. 5d). All simulations in this paper reproduce this pattern, with the mean precipitation increasing towards the observed value as the resolution increases. For wet hours in summer (Fig. 5c), all simulations contain an afternoon/evening peak, with increasing amplitude for higher resolutions, similar to the study of De Troch (2016). The timing of the peak does not significantly differ between ALARO-25km and ALARO-12km, and is slightly earlier for ALARO-4km. However, for all simulations, the summer wet-hour peak occurs later than the observed peak, in contrast with the well-captured peak timing reported by De Troch (2016) for ALARO-0. This contrast reflects the change from ALARO-0 to ALARO-1 and cannot be attributed to the scale-aware 3MT scheme, which is common to both versions, nor to the land-surface scheme, which the ALARO-12km-noSFX experiment shows does not affect the peak timing (Sect. 3.3, Fig. 9c). A further candidate is the difference in experimental setup: the ALARO-0 simulations of De Troch (2016) were reinitialised daily, whereas ours run continuously. Such daily restarts can plausibly influence the phase of the simulated diurnal cycle. However, we cannot isolate the responsible factor from the available output. Overall, for both all-hour (Fig. 5a) and wet-hour (Fig. 5b) precipitation, the diurnal cycles in ALARO-4km are comparable to those in the work of De Troch (2016).
In our analysis of the mean diurnal precipitation cycle, notable differences emerge when comparing simulations at varying resolutions with observational data, as shown in Fig. 5. Specifically, while the “all-hour” precipitation cycle overestimates precipitation relative to observations, the “wet-hour” cycle underestimates it, which Table 2 attributes to an overestimated wet-hour frequency combined with an underestimated wet-hour intensity. This is most pronounced in ALARO-25km and minimised in ALARO-4km, showing that the coarser resolution overestimates precipitation amounts through an overly high precipitation frequency, i.e. a substantial drizzle contribution.
This drizzle bias is a well-known deficiency of regional climate models (Fosser et al., 2015; Berthou et al., 2020). It arises largely because parameterised convection triggers on weak instability and releases it gradually, producing precipitation that is too frequent and too light. The improvement with resolution reflects the sharper humidity and updraught fields at higher resolution, which reduce the widespread simultaneous triggering dominating the coarser runs. The residual bias in ALARO-4km is consistent with 3MT still parameterising part of the convective spectrum in the grey zone.
Furthermore, both the timing and amplitude of the diurnal precipitation peak are best represented at high resolution, as well established for CPMs (Lucas-Picher et al., 2021). Most RCMs exhibit a premature diurnal peak, primarily due to the limited memory of atmospheric instabilities; this behaviour is notably absent here, and at lower resolutions the ALARO peak even occurs later than at higher resolutions. The ALARO-12km-noSFX experiment (Sect. 3.3, Fig. 9c) shows that introducing SURFEX reduces the amplitude of the diurnal cycle but leaves the timing of the peak unchanged, so the resolution-dependent shift in peak timing is not driven by the land-surface scheme. Its origin lies instead in the convection scheme. Conventional mass-flux schemes that close on CAPE remove instability almost as soon as it is generated by surface heating, so that simulated precipitation peaks around local noon, in phase with the surface fluxes, rather than in the late afternoon as observed (Guichard et al., 2004; Bechtold et al., 2004). In contrast, 3MT employs a prognostic closure that retains memory of the updraught mesh fraction and updraught velocity between time steps, with the mesh fraction evolving through the moisture budget. Instability is therefore released gradually over several time steps rather than instantaneously, shifting the peak away from noon; none of our configurations peaks near midday. At coarser resolutions this gradual release appears to be too gradual, delaying the convective peak, and the timing sharpens as explicit convection progressively takes over at higher resolutions. A full attribution of the responsible mechanism would require dedicated sensitivity experiments and is left to future work.
4.2 Extreme precipitation
IDF statistics are presented in Fig. 6 for durations of 1 to 72 h across three distinct topographic regions in Belgium. The regional differences in return levels, with smaller sub-daily (<6 h) values in Low-Belgium and higher (multi-)daily (≥24 h) values in High-Belgium, are consistent with the findings of Van de Vyver (2013). In each case, the return levels scale linearly with duration on a log-log scale, for both observations and simulations. This corresponds to a power-law relationship on a linear scale and reflects the underlying scale invariance and multifractal characteristics of extreme precipitation. These phenomena can be effectively captured using simple scaling techniques, which in turn result in a power-law relationship (Gupta and Waymire, 1990; Veneziano and Furcolo, 2002). However, for short precipitation durations (1–3 h), simulated return levels deviate from this linear trend, curving downward, whereas observational return levels do not exhibit this pattern. This discrepancy arises entirely from model error, as precipitation values from both observations and simulations were first aggregated to an hourly resolution before extracting the annual maxima. As shown in Fig. D3b, the smaller R2-values indicate a less optimal fit for larger spatial scales. The higher (less negative) linear coefficients at these scales may also reflect this underestimation at short durations. However, previous studies have also shown that annual-maximum precipitation at larger spatial scales has a higher linear coefficient with respect to duration than at smaller scales (Innocenti et al., 2019). Next, these linear coefficients can be compared to those from a simple-scaling model by Van de Vyver (2018). In that work, station-specific values in the range of −0.75 and −0.64 were found for 16 stations over Belgium. The observational coefficients depicted in Fig. D3a correspond to this range, although they are slightly more negative.
At durations of 1 to 3 h, lower-resolution simulations increasingly underestimate return levels compared to observational values, highlighting the added value of the convection-permitting ALARO-4km simulation. A similar result was found by Tabari et al. (2016), who also constructed IDF statistics for ALARO-0 simulations at different resolutions. In that study, the 4 and 10 km ALARO-0 simulations accurately captured sub-daily intensities, with a slight underestimation, while ALARO-40km significantly underestimated sub-daily precipitation amounts. For longer durations (>24 h), ALARO-25km tends to overestimate the return levels, particularly for short return periods (Fig. 7a–c). De Troch (2016) reported a similar finding, as all ALARO-0 simulations (4, 10, and 40 km) overestimated the 2-year return level for daily precipitation. Additionally, while De Troch (2016) observed increasing overestimation for longer return periods in the 4 km ALARO-0 simulation, this effect is notably absent – and even reversed – in ALARO-4km.
The scale-aware design of the 3MT scheme provides a smooth transition between parameterised and resolved convection, which would lead one to expect a gradual change of the extreme-precipitation statistics with resolution, as found in previous studies (De Troch, 2016; Tabari et al., 2016). In contrast, the return levels presented in this study display a more abrupt, step-wise change when transitioning from 12 to 4 km resolution. This behaviour is more similar to that observed in other models without a scale-aware convective scheme, where the step-wise shift is typically attributed to the deactivation of the deep convective parameterisation at high resolutions. For 3MT, however, no such deactivation occurs, and the apparent abruptness may be partly an artefact of comparison: the 25 to 12 km change is small, so the 12 to 4 km change stands out as step-wise by contrast. We propose two contributing effects. First, the difference between ALARO-25km and ALARO-12km conflates resolution with the land-surface scheme: the drying effect of SURFEX (Sect. 3.3) reduces precipitation and may partly offset the resolution-driven increase in extreme intensity at 12 km, suppressing the apparent 25 to 12 km change. Second, the step from 12 to 4 km crosses the grey zone of convection (∼4–10 km) (Prein et al., 2015; Vergara-Temprado et al., 2020), where 3MT transitions from a parameterised towards a resolved representation of deep convection. This transition is expected to affect the extreme-precipitation statistics most strongly. Isolating the contributions of these two effects is left to future work.
The diurnal cycle of hourly AM precipitation frequencies is well captured by ALARO-4km (see Fig. 8a). Both the frequency peak amplitude and timing are in agreement between ALARO-4km and the observational data. The peak occurs later in ALARO-12km and is further delayed in ALARO-25km, while the peak amplitude increases in ALARO-12km but decreases in ALARO-25km. This peak delay is also present in 0.11° EURO-CORDEX simulations (Meredith et al., 2021). It should be noted that the relatively large diurnal variation in extreme precipitation frequency of ALARO-25km is quite remarkable, as most models exhibit almost no diurnal variation at similar resolutions (Meredith et al., 2021; Thomassen et al., 2023). The diurnal cycle of extremes from previous ALARO-0 simulations at 12 and 4 km was shown in Van de Vyver et al. (2021). However, they did not find a large difference in the diurnal cycle between both resolutions, in contrast to the simulations of this work. As with the peak-timing differences discussed above, this stronger resolution sensitivity of ALARO-1 relative to ALARO-0 most plausibly reflects the broader physics update between the two versions rather than the scale-aware convection scheme common to both, and is left to future work.
Similarly to the diurnal cycle, the seasonal cycle of hourly extreme-precipitation frequency is well captured by our three simulations, as shown in Fig. 8b. The frequency peak in summer due to the convective nature of hourly extreme precipitation is apparent. This result corresponds to previous simulations from Van de Vyver et al. (2021), who also did not find a difference in the seasonal cycle between 12 and 4 km ALARO-0 simulations. In contrast, Innocenti et al. (2019) reported the slight outperformance of a 12 km RCM simulation compared to a 4 km convection-permitting WRF simulation in capturing the seasonal cycle of hourly AM occurrences over North America.
This study evaluated the performance of the ALARO-1 model, including a scale-aware deep convection parameterisation, over Belgium using a multi-level dynamical downscaling framework at three horizontal resolutions: 25, 12.5, and 4 km. The ALARO-1 model was coupled online to the land-surface model SURFEX v8.0 for ALARO-12km and ALARO-4km. These simulations, spanning a 32-year period (1991–2022), were compared against both a gridded observational dataset (CLIMATE-GRID) and hourly precipitation values from station measurements.
The analysis of average climatology demonstrated that across all resolutions the ALARO-1 model exhibits an annual cold bias between −1.14 and −0.25 °C and an annual wet bias between 15.3 % and 33.7 % over Belgium. Comparing resolutions, ALARO-12km and ALARO-4km outperformed ALARO-25km, which exhibited larger biases in both temperature and precipitation. While ALARO-12km and ALARO-4km provided similar results in terms of average climatology, ALARO-4km captured the diurnal cycle of precipitation better. A dedicated sensitivity experiment (ALARO-12km-noSFX) showed that this improvement relative to ALARO-25km is not attributable to the increase in resolution alone: the coupling to SURFEX accounts for a substantial part of the reduction in the temperature and precipitation biases.
A key focus of this study was the representation of extreme precipitation, evaluated through Intensity-Duration-Frequency statistics derived from annual maximum precipitation. While all simulations followed the expected log-log linear behaviour between return-level precipitation intensity and duration, lower-resolution models underestimated return levels at sub-daily timescales. ALARO-4km significantly improved upon this, producing more realistic hourly return levels and better capturing the diurnal timing of hourly extreme precipitation. These findings provide clear evidence that increasing model resolution enhances the simulation of extreme precipitation.
Despite these improvements, this study has some limitations. The research domain was limited to Belgium due to computational constraints. Another limitation is the absence of simulations at even higher resolutions, which could further improve model accuracy but are currently also constrained by computational demands.
Future research should address these challenges by conducting simulations at resolutions higher than 4 km and applying the ALARO-1 model to regional downscaling of global climate models (GCMs) and climate projections. Additionally, a more detailed investigation of the urban effect on temperature and precipitation, as represented by the TEB model in SURFEX, is warranted. Expanding the application of the ALARO-1 model to other regions would further validate its performance. Finally, given the high computational cost of convection-permitting simulations, future work should explore alternative, more targeted downscaling approaches to reduce computational demands while maintaining or improving model accuracy, specifically for extreme precipitation.
The temperature and precipitation biases are calculated in the following way. Let Xkni be the value of variable X at time k, with , in grid point n, with , and in year i, with . We define the total value of X over a period t as:
The average value over a period t is defined as:
with Kt the number of values in period t:
In this work, we consider three types of periods t:
-
months, denoted as m∈M with M={Jan, Feb, Mar, Apr, May, Jun, Jul, Aug, Sep, Oct, Nov, Dec},
-
seasons, denoted as s∈S with S={DJF, MAM, JJA, SON},
-
years, denoted as y .
The yearly total value of X is related to the seasonal values as:
and the yearly averaged value:
Let now be the temperature averaged over the period t, with . The temperature bias is consequently calculated by taking the difference between the model temperature and the observational temperature with and averaging it over all years i (with I the number of years). The bias in grid point n is hence:
The spatially averaged bias is then acquired by averaging over all grid points (with N the number of grid points):
The seasonal and annual values can be straightforwardly related to each other:
For precipitation, we consider the relative bias. Let now be the total precipitation over the period t with . The relative bias over this period is then calculated as:
The spatially averaged value then becomes:
For the relative bias, there is no straightforward relation between annual and seasonal values:
For ξ≠0, the cumulative GEV distribution function F(x) is given by:
The distribution with ξ=0 is then interpreted as the limit of Eq. (B1) as ξ→0:
GEV distribution functions are constructed for each duration separately. We denote the duration-specific GEV parameters as ξd, μd, and σd. Subsequently, these distribution functions are used to calculate return levels zd(T) for the precipitation intensity. A return level zd(T) (expressed in mm h−1) is specified for a certain return period T and duration d. It is defined as the precipitation intensity which has a probability of of being exceeded in any given year: so on average once every T years. The formula for these return levels can be derived from equations (B1) and (B2):
Table C1Specifications of observational networks used in this study.
D1 Average climatology
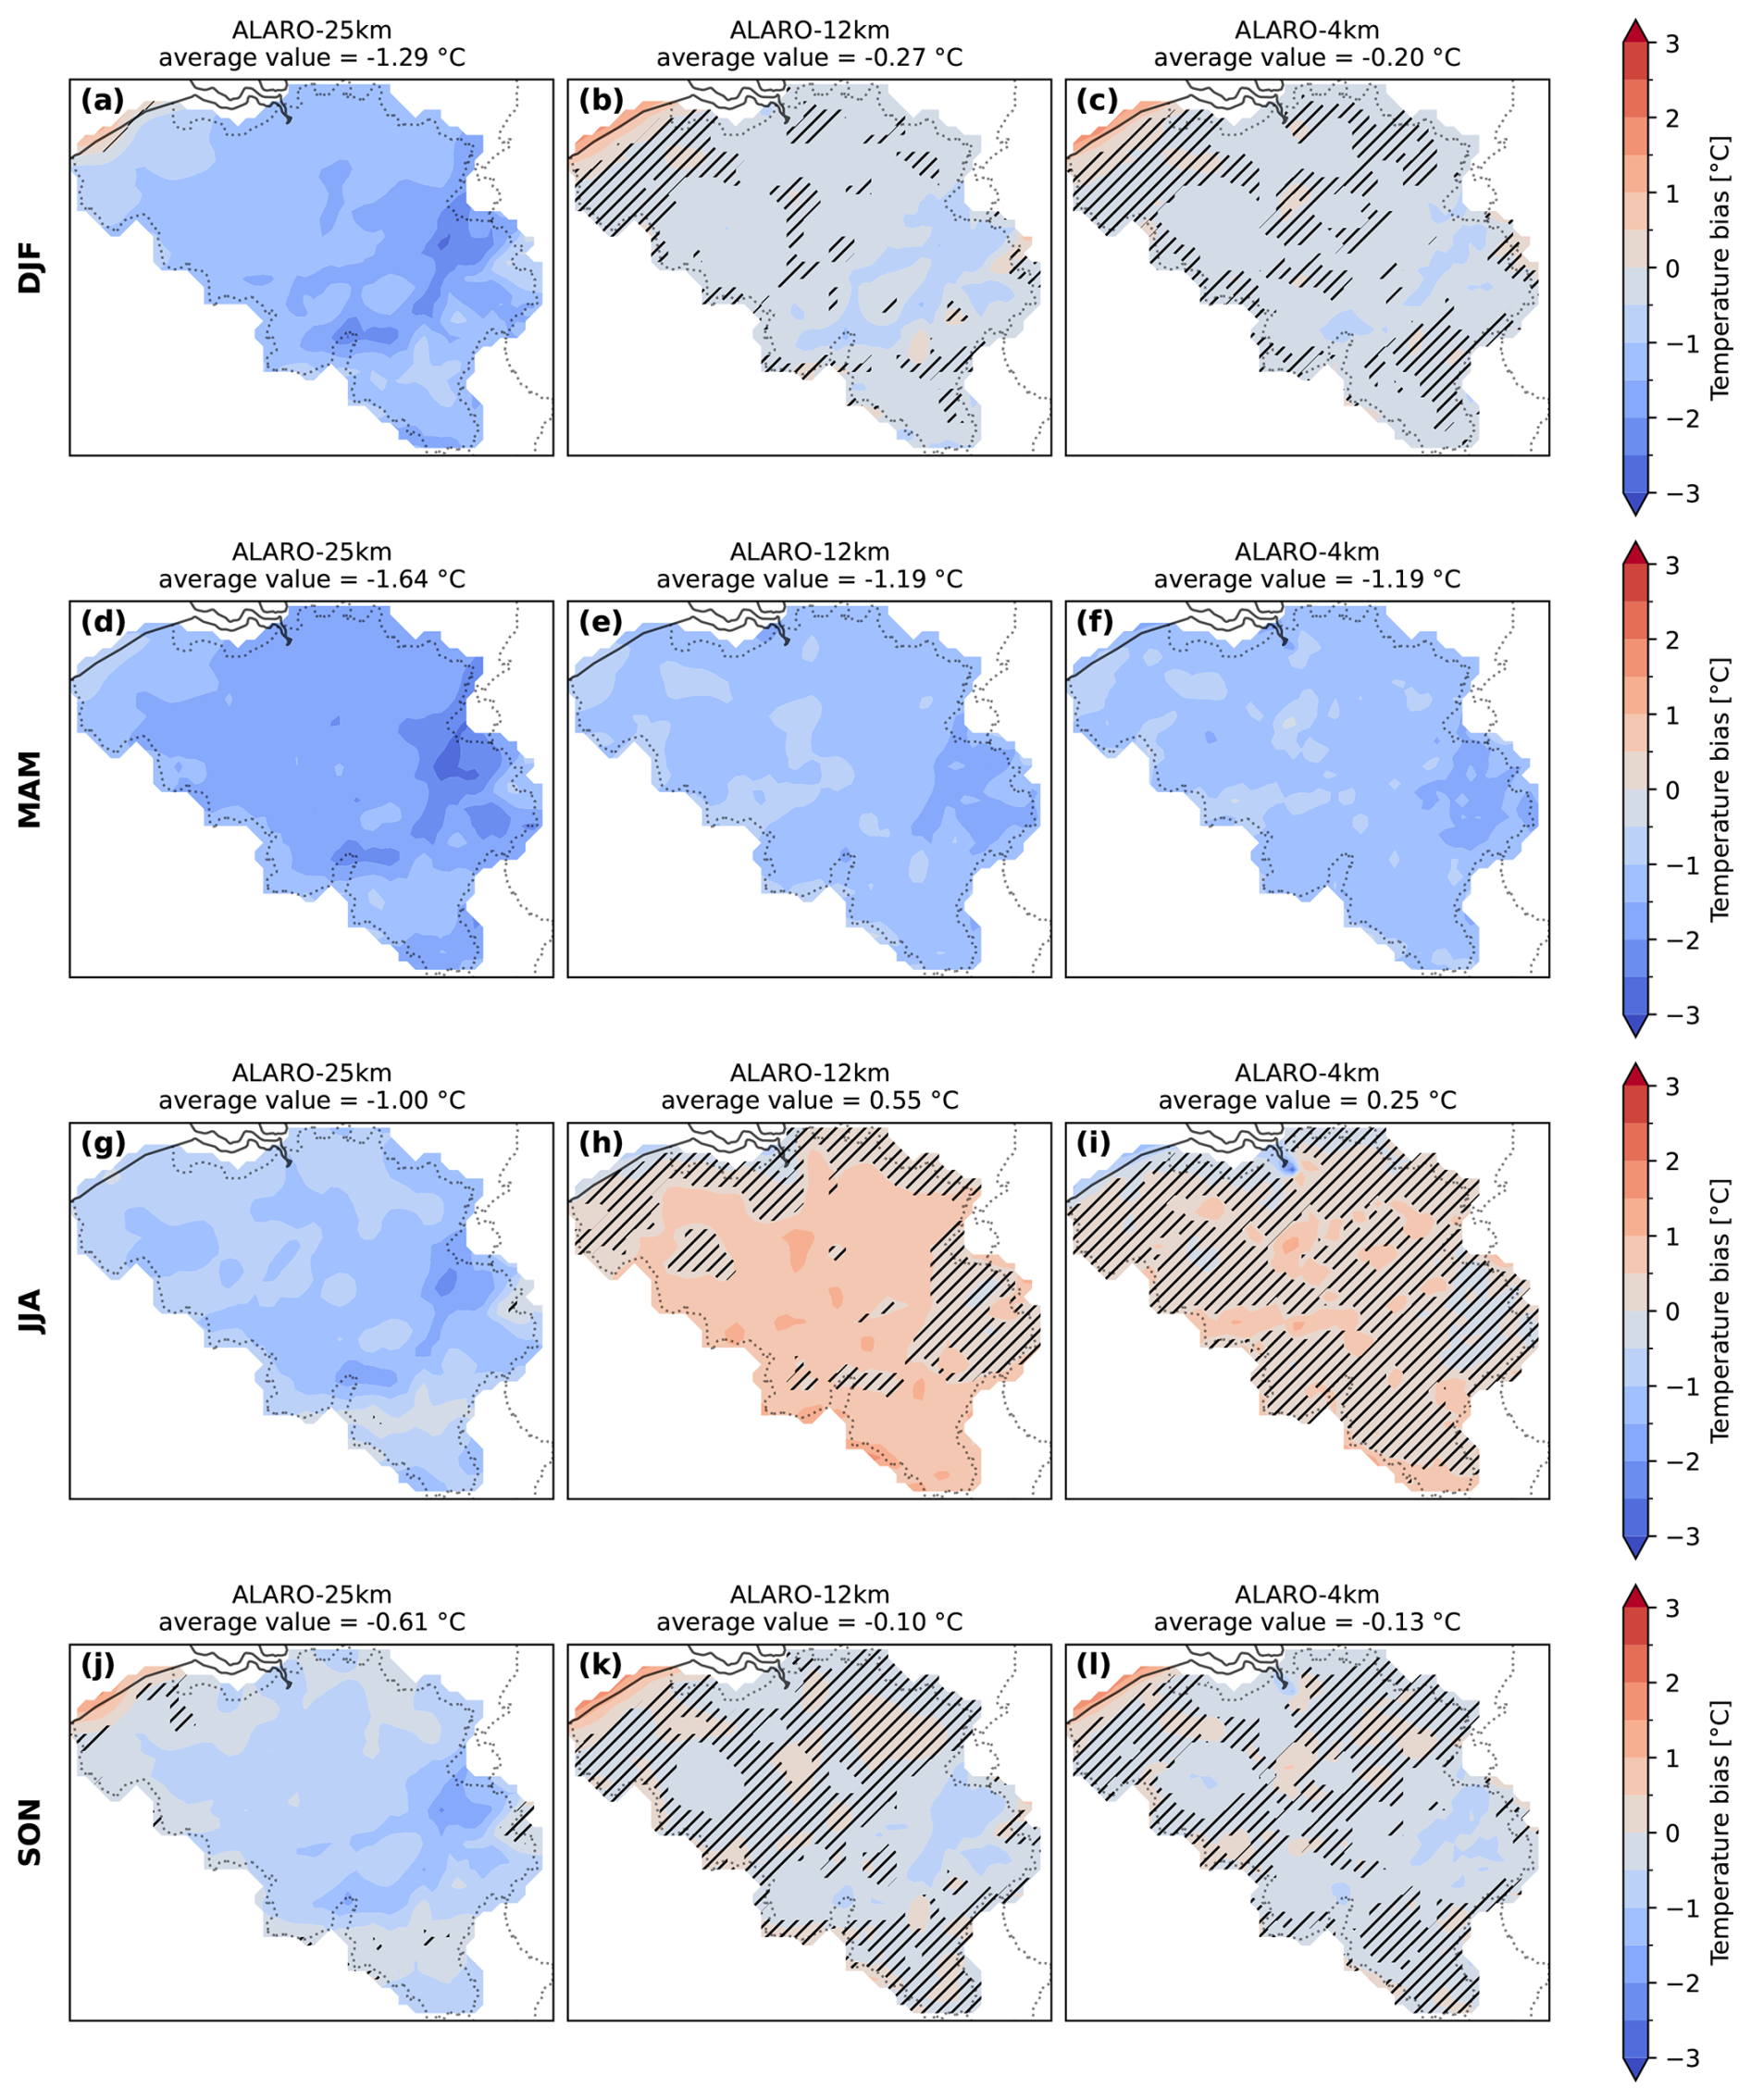
Figure D1Bias in mean seasonal near-surface air temperature of each simulation with respect to the daily gridded observational CLIMATE-GRID dataset over Belgium, for the period 1992–2022. Columns: ALARO-25km (a, d, g, j), ALARO-12km (b, e, h, k), ALARO-4km (c, f, i, l). Rows: winter (DJF; a–c), spring (MAM; d–f), summer (JJA; g–i), autumn (SON; j–l). Hatching indicates grid points where the bias is not significantly different from zero at the 95 % confidence level, based on a paired bootstrap resampling of years.
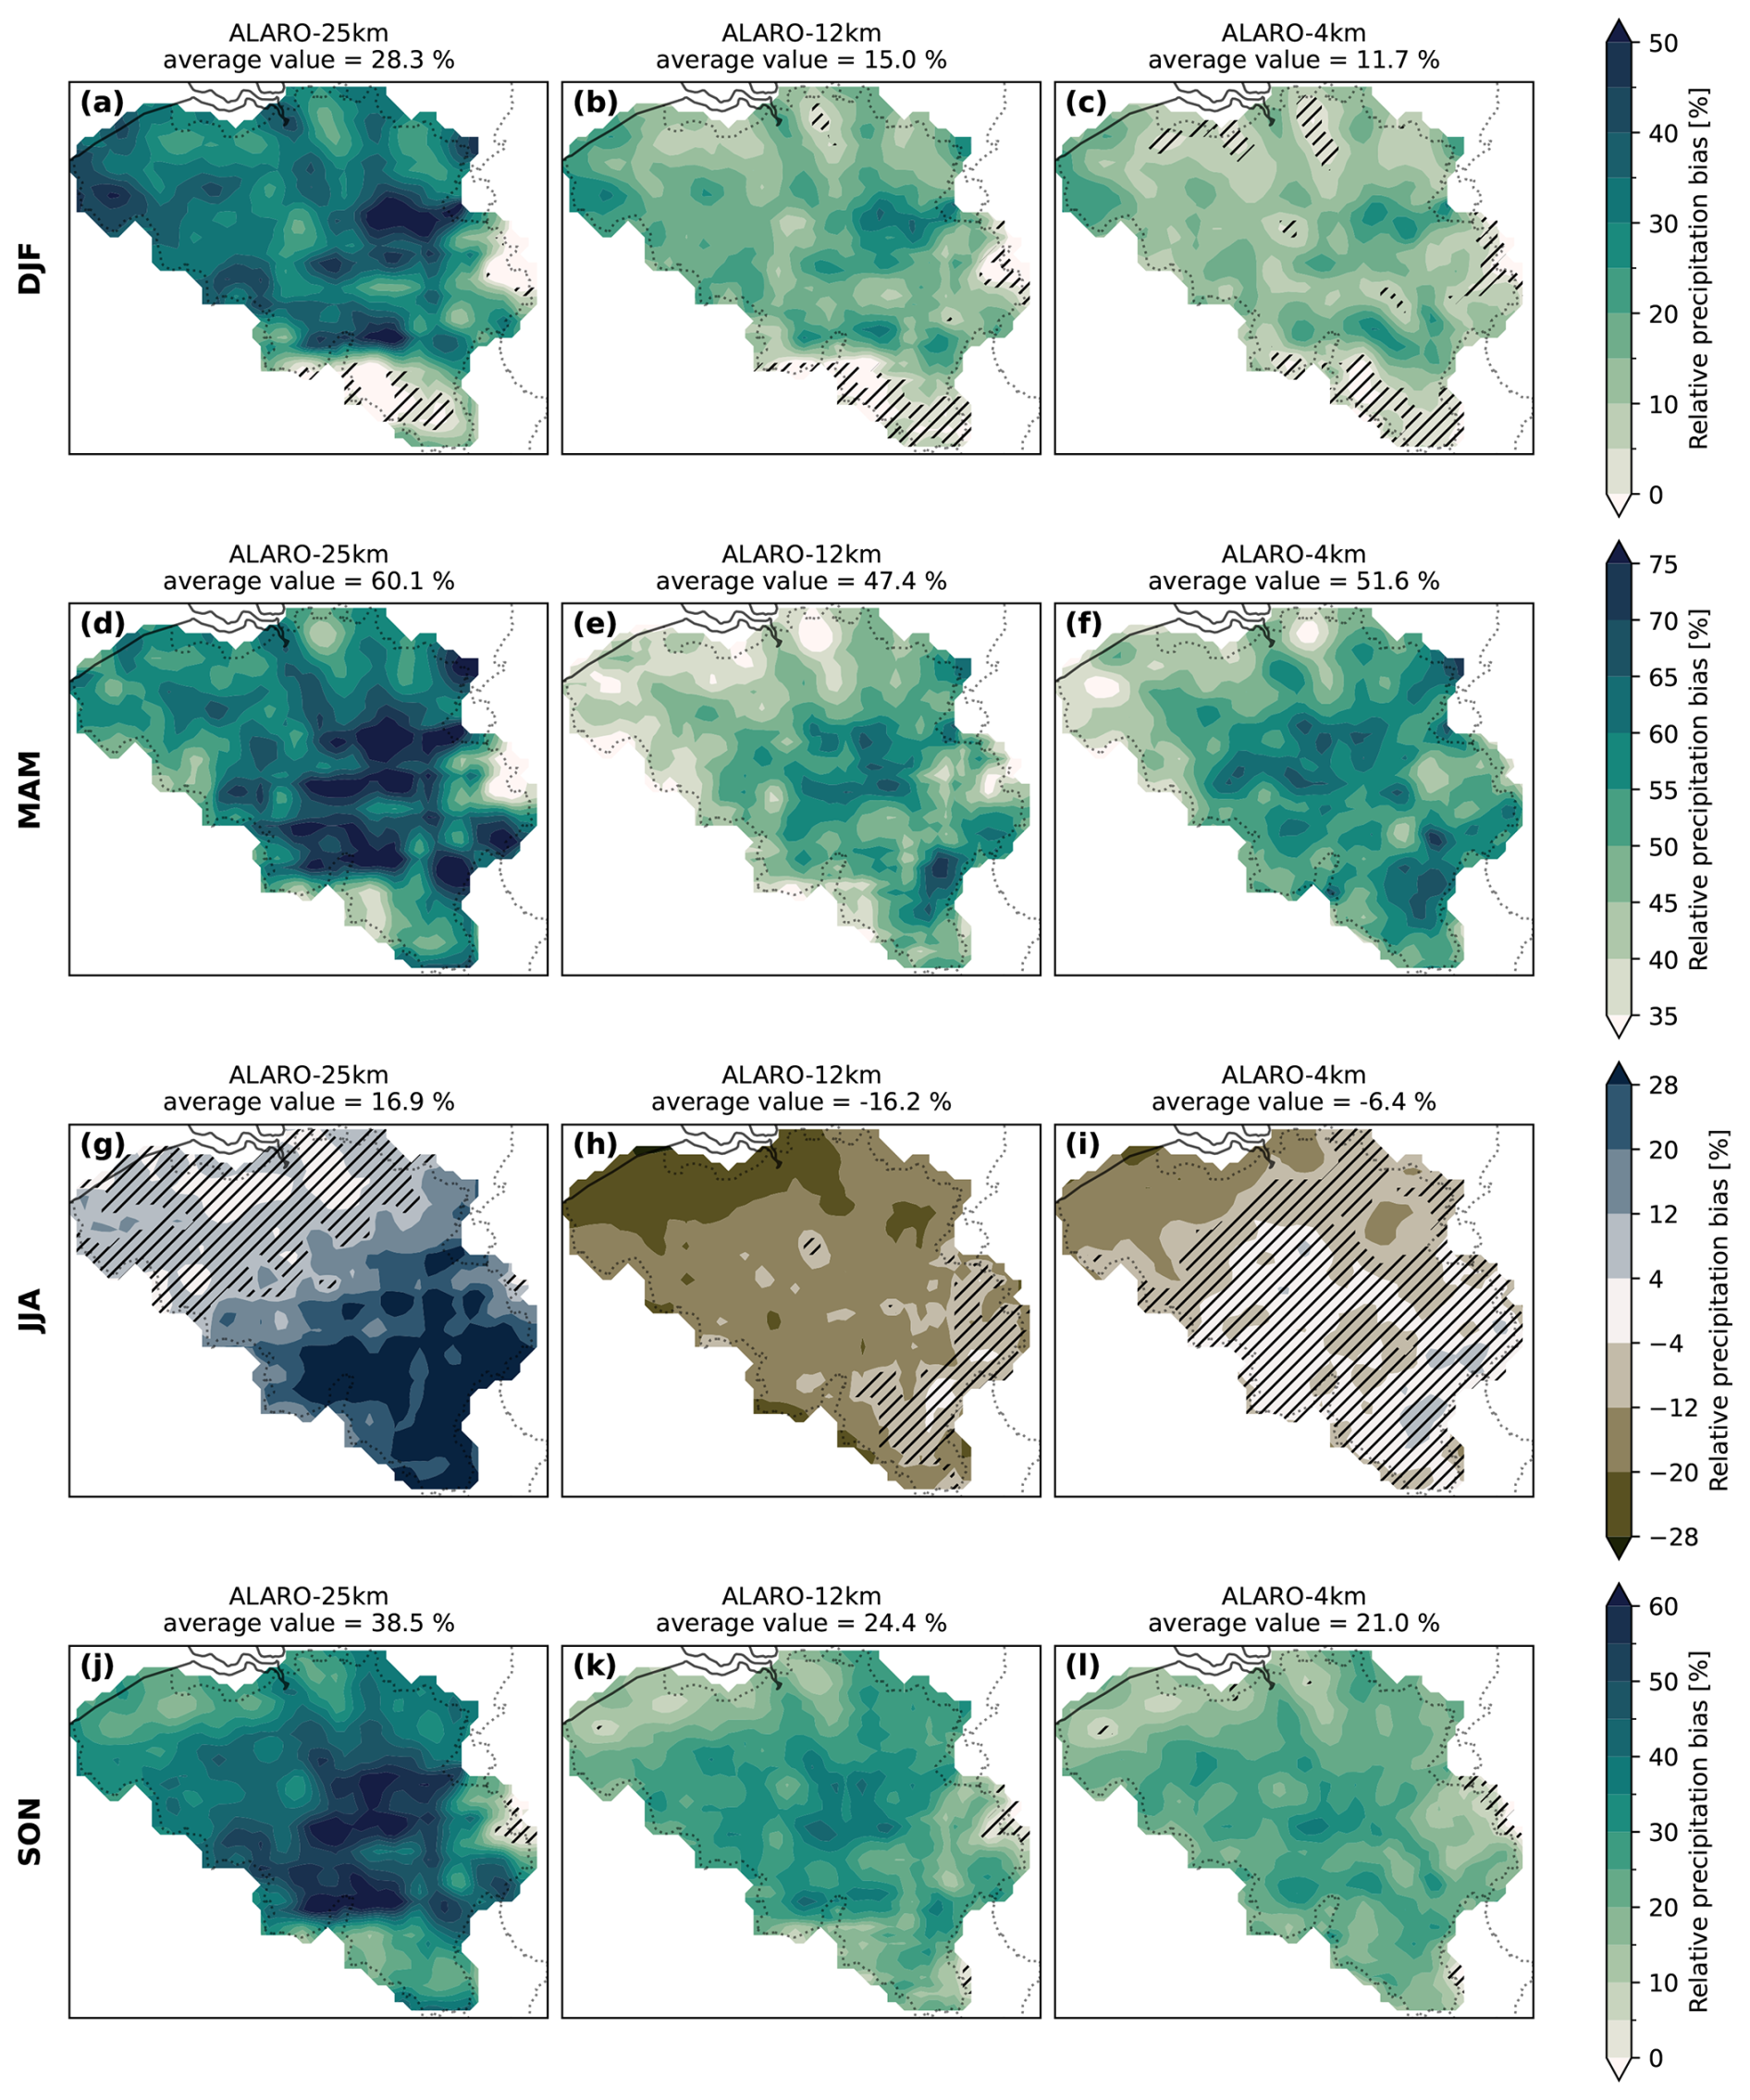
Figure D2Bias in mean seasonal precipitation of each simulation with respect to the daily gridded observational CLIMATE-GRID dataset over Belgium, for the period 1992–2022. Columns: ALARO-25km (a, d, g, j), ALARO-12km (b, e, h, k), ALARO-4km (c, f, i, l). Rows: winter (DJF; a–c), spring (MAM; d–f), summer (JJA; g–i), autumn (SON; j–l). Hatching indicates grid points where the bias is not significantly different from zero at the 95 % confidence level, based on a paired bootstrap resampling of years.
D2 Extreme precipitation
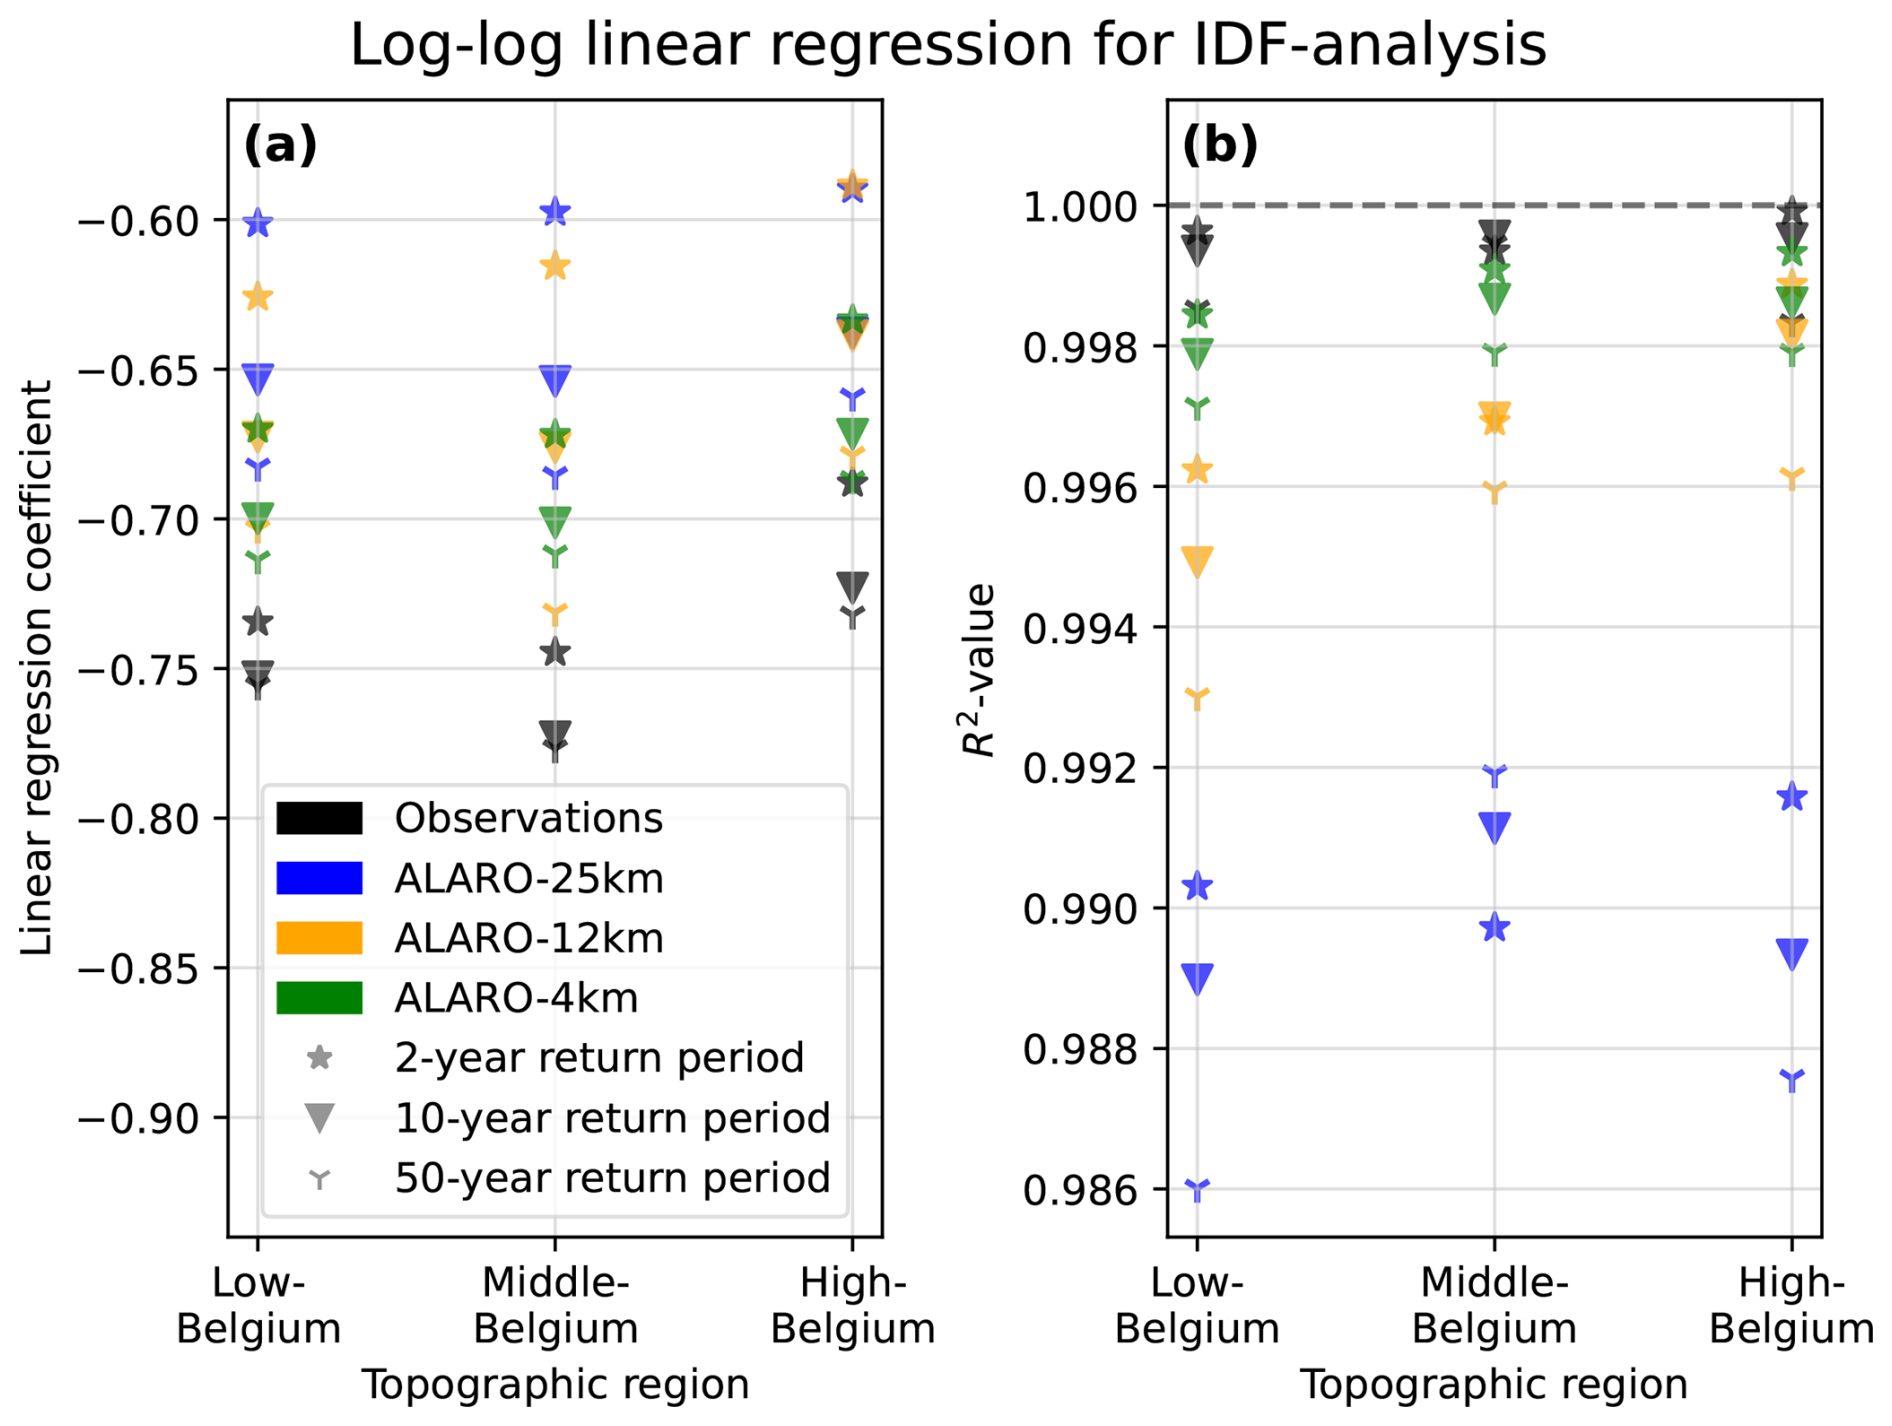
Figure D3Log-log linear regression analysis of the return levels as a function of duration, performed for each dataset (observations and ALARO-simulations), topographic region, and return period separately, using all available years for each dataset (observational record lengths are given in Table C1; simulations span 1992–2022). (a) The linear regression coefficients. (b) The R2-values. The dashed line denotes a value of 1, which corresponds to a perfect fit.
D3 Effect of SURFEX
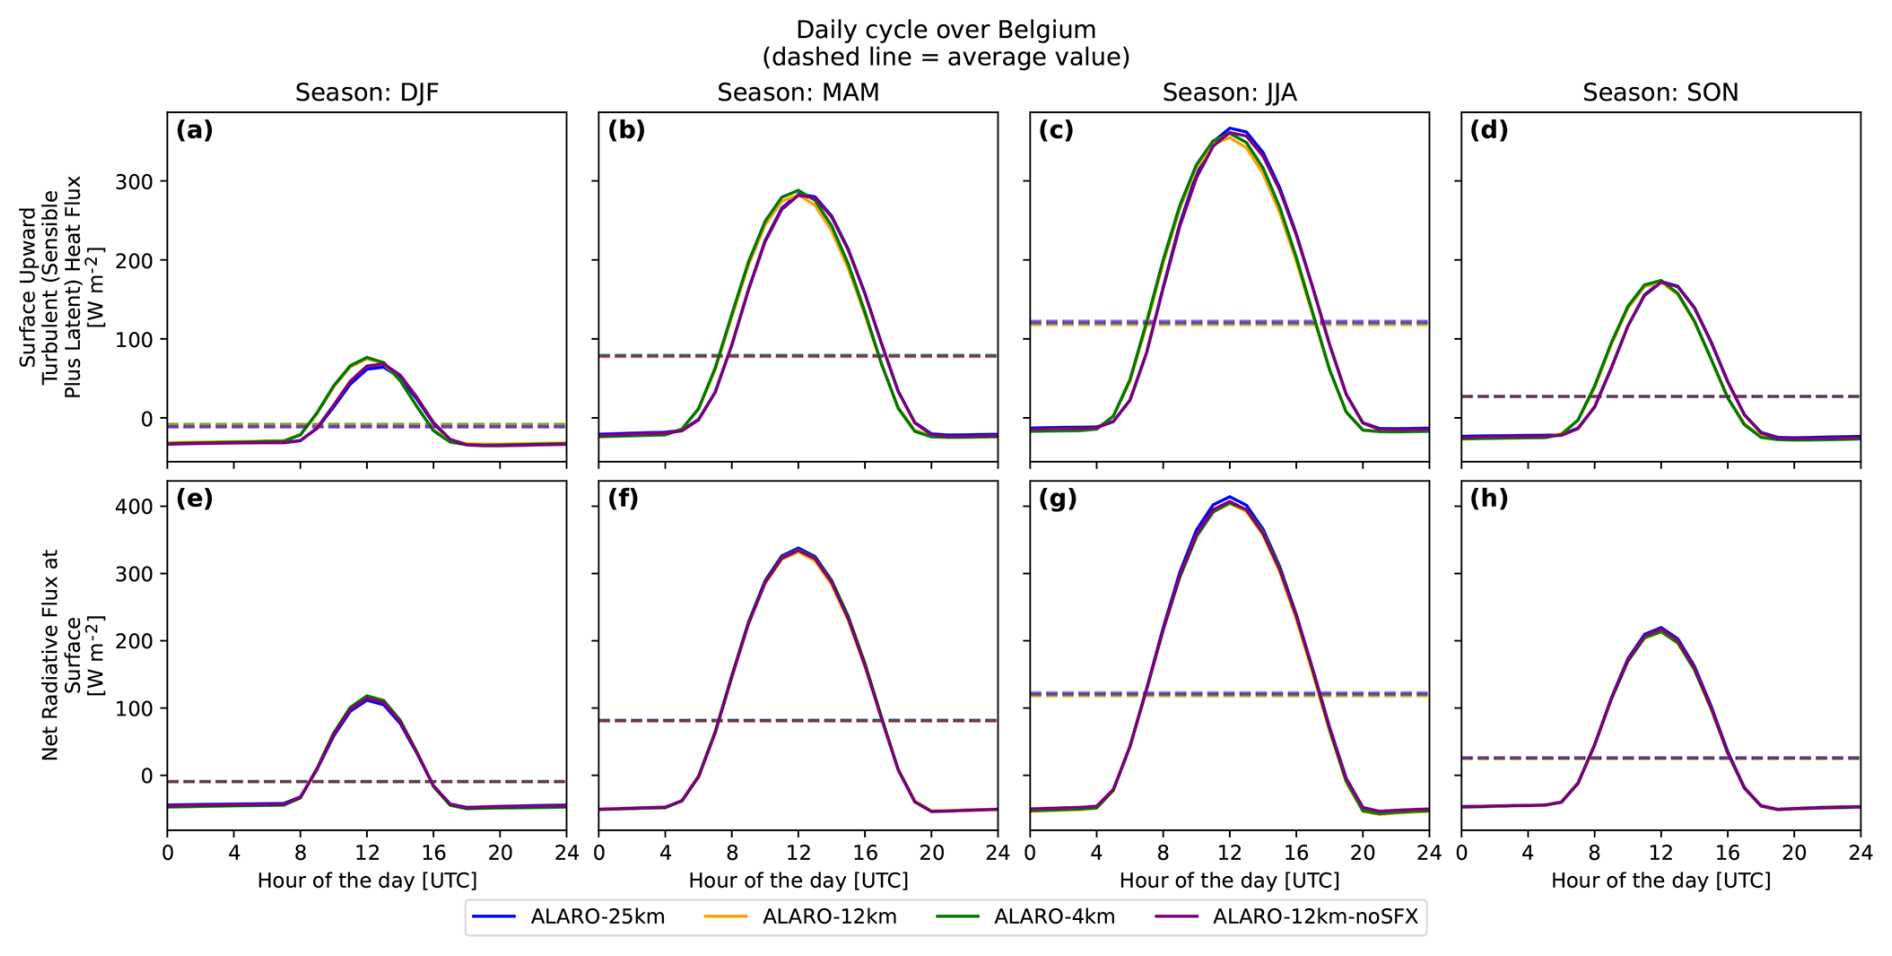
Figure D4Seasonal diurnal cycle over Belgium of the sum of the surface upward latent and sensible heat fluxes (a–d) and the net surface radiative flux (e–h), for all simulations, 1992–2022. Columns are the four seasons (DJF, MAM, JJA, SON). Dashed lines denote the daily-mean value of each simulation.
The Python notebooks used for the analysis are available through https://doi.org/10.5281/zenodo.15791681 (Dewettinck et al., 2025a). The ALARO1-SFX code, along with all its related intellectual property rights, is owned by the members of the ACCORD consortium. Each member of this consortium can license the shared code to academic institutions of their home country for noncommercial research. Access to the codes of the ACCORD system can be obtained by contacting one of the member institutes mentioned in Termonia et al. (2018a) or by submitting a request in the Contact link below the page of the ACCORD website (https://www.umr-cnrm.fr/accord/, last access: 14 August 2026) and the access will be subject to signing a standardised ACCORD license agreement.
The VMM precipitation observations over Flanders are available on https://waterinfo.vlaanderen.be/ (last access: 14 August 2026). The DGH precipitation observations may be requested from the Service public de Wallonie – Mobilité et Infrastructures, Direction de la Gestion hydrologique, PEREX, Rue Del'Grête, 22, 5020 NAMUR (Daussoulx). The IBGE data may be requested at the Bruxelles Environnement (https://environnement.brussels, last access: 14 August 2026). The automatic weather station (AWS) precipitation observations from the Royal Meteorological Institute of Belgium are available on https://opendata.meteo.be/download (last access: 14 August 2026). Annual maxima extracted from the HYDRO-network from the Royal Meteorological Institute of Belgium are available on https://doi.org/10.5281/zenodo.4741177 (Van de Vyver, 2021). Further information about the CLIMATE-GRID dataset can be found on https://opendata.meteo.be/geonetwork/srv/eng/catalog.search#/metadata/RMI_DATASET_GRIDDEDOBS (last access: 14 August 2026), although the data are currently not yet publicly available. The simulation data used in this study is publicly available in a Zenodo repository through https://doi.org/10.5281/zenodo.15296030 (Dewettinck et al., 2025b).
SC and PT conceptualised the study. SC, PT, and WD acquired funding. WD conducted the investigation and performed the formal analysis. WD, KV and MVG were responsible for software implementation. HVdV, DD, RH, BVS, KVW, SC, and PT supervised the research. WD created the visualisations and prepared the original draft. All authors contributed to the review and editing of the manuscript and approved the final version.
The contact author has declared that none of the authors has any competing interests.
Publisher's note: Copernicus Publications remains neutral with regard to jurisdictional claims made in the text, published maps, institutional affiliations, or any other geographical representation in this paper. The authors bear the ultimate responsibility for providing appropriate place names. Views expressed in the text are those of the authors and do not necessarily reflect the views of the publisher.
The authors acknowledge the Flemish Supercomputer Center (VSC) for providing the computational resources and services used to perform the ALARO1-SFX regional climate simulations. The authors also thank the Vlaamse Milieumaatschappij (VMM), the Direction de la Gestion Hydrologique (DGH) of SPW Mobilité et Infrastructures, and Brussels Environment for providing precipitation observations over Flanders, Wallonia, and Brussels, respectively. The authors thank the two anonymous referees and the topic editor for their careful reading and constructive comments, which have substantially improved the manuscript. Finally, we acknowledge the use of AI-assisted tools, which were used exclusively for language refinement and text rewriting. All scientific content was developed and validated by all authors.
This research has been supported by the Research Foundation – Flanders (FWO) (grant no. 1157523N). KV is supported by the Belgian Science Policy (BELSPO) under Contract B2/223/P1/CORDEXbeII. KVW is funded through Belspo grant FED-tWIN2021-prf024 – ARCHWAy. SC is supported by the BELSPO project FED-tWIN 2020-018_AURA.
This paper was edited by Axel Lauer and reviewed by two anonymous referees.
Ban, N., Schmidli, J., and Schär, C.: Evaluation of the convection-resolving regional climate modeling approach in decade-long simulations, J. Geophys. Res.-Atmos., 119, 7889–7907, https://doi.org/10.1002/2014JD021478, 2014. a, b
Ban, N., Caillaud, C., Coppola, E., Pichelli, E., Sobolowski, S., Adinolfi, M., Ahrens, B., Alias, A., Anders, I., Bastin, S., Belušić, D., Berthou, S., Brisson, E., Cardoso, R., Chan, S., Christensen, O., Fernández, J., Fita, L., Frisius, T., and Zander, M.: The first multi-model ensemble of regional climate simulations at kilometer-scale resolution, part I: evaluation of precipitation, Clim. Dynam., 57, https://doi.org/10.1007/s00382-021-05708-w, 2021. a
Bechtold, P., Chaboureau, J.-P., Beljaars, A., Betts, A. K., Köhler, M., Miller, M., and Redelsperger, J.-L.: The Simulation of the Diurnal Cycle of Convective Precipitation over Land in a Global Model, Q. J. Roy. Meteor. Soc., 130, 3119–3137, https://doi.org/10.1256/qj.03.103, 2004. a
Berckmans, J., Giot, O., De Troch, R., Hamdi, R., Ceulemans, R., and Termonia, P.: Reinitialised versus continuous regional climate simulations using ALARO-0 coupled to the land surface model SURFEXv5, Geosci. Model Dev., 10, 223–238, https://doi.org/10.5194/gmd-10-223-2017, 2017. a, b, c, d, e
Berg, P., Christensen, O. B., Klehmet, K., Lenderink, G., Olsson, J., Teichmann, C., and Yang, W.: Summertime precipitation extremes in a EURO-CORDEX 0.11° ensemble at an hourly resolution, Nat. Hazards Earth Syst. Sci., 19, 957–971, https://doi.org/10.5194/nhess-19-957-2019, 2019. a
Berthou, S., Kendon, E. J., Chan, S. C., Ban, N., Leutwyler, D., Schär, C., and Fosser, G.: Pan-European climate at convection-permitting scale: a model intercomparison study, Clim. Dynam., 55, 35–59, https://doi.org/10.1007/s00382-018-4114-6, 2020. a, b, c
Brisson, E., Van Weverberg, K., Demuzere, M., Devis, A., Saeed, S., Stengel, M., and van Lipzig, N. P. M.: How well can a convection-permitting climate model reproduce decadal statistics of precipitation, temperature and cloud characteristics?, Clim. Dynam., 47, 3043–3061, https://doi.org/10.1007/s00382-016-3012-z, 2016. a
Bubnová, R., Hello, G., Bénard, P., and Geleyn, J.-F.: Integration of the Fully Elastic Equations Cast in the Hydrostatic Pressure Terrain-Following Coordinate in the Framework of the ARPEGE/Aladin NWP System, Mon. Weather Rev., https://doi.org/10.1175/1520-0493(1995)123<0515:IOTFEE>2.0.CO;2, 1995. a
Carreau, J., Naveau, P., and Neppel, L.: Partitioning into hazard subregions for regional peaks-over-threshold modeling of heavy precipitation, Water Resour. Res., 53, 4407–4426, https://doi.org/10.1002/2017WR020758, 2017. a
Charnock, H.: Wind stress on a water surface, Q. J. Roy. Meteor. Soc., 81, 639–640, https://doi.org/10.1002/qj.49708135027, 1955. a
Clapp, R. B. and Hornberger, G. M.: Empirical Equations for Some Soil Hydraulic Properties, Water Resour. Res., 14, 601–604, https://doi.org/10.1029/WR014i004p00601, 1978. a
Coles, S.: An Introduction to Statistical Modeling of Extreme Values, Springer Series in Statistics, Springer, London, ISBN 978-1-84996-874-4 978-1-4471-3675-0, https://doi.org/10.1007/978-1-4471-3675-0, 2001. a
Coppola, E., Sobolowski, S., Pichelli, E., Raffaele, F., Ahrens, B., Anders, I., Ban, N., Bastin, S., Belda, M., Belusic, D., Caldas-Alvarez, A., Cardoso, R. M., Davolio, S., Dobler, A., Fernandez, J., Fita, L., Fumiere, Q., Giorgi, F., Goergen, K., Güttler, I., Halenka, T., Heinzeller, D., Hodnebrog, o., Jacob, D., Kartsios, S., Katragkou, E., Kendon, E., Khodayar, S., Kunstmann, H., Knist, S., Lavín-Gullón, A., Lind, P., Lorenz, T., Maraun, D., Marelle, L., van Meijgaard, E., Milovac, J., Myhre, G., Panitz, H.-J., Piazza, M., Raffa, M., Raub, T., Rockel, B., Schär, C., Sieck, K., Soares, P. M. M., Somot, S., Srnec, L., Stocchi, P., Tölle, M. H., Truhetz, H., Vautard, R., de Vries, H., and Warrach-Sagi, K.: A first-of-its-kind multi-model convection permitting ensemble for investigating convective phenomena over Europe and the Mediterranean, Clim. Dynam., 55, 3–34, https://doi.org/10.1007/s00382-018-4521-8, 2020. a, b
CORDEX: CMIP6 Downscaling Plans, https://wcrp-cordex.github.io/simulation-status/CMIP6_downscaling_plans.html, last access: 18 February 2025. a
Davies, H. C.: A lateral boundary formulation for multi-level prediction models, Q. J. Roy. Meteor. Soc., 102, 405–418, https://doi.org/10.1002/qj.49710243210, 1976. a
De Troch, R.: The application of the ALARO-0 model for regional climate modeling in Belgium: extreme precipitation and unfavorable conditions for the dispersion of air pollutants under present and future climate conditions, dissertation, Ghent University, http://hdl.handle.net/1854/LU-7247081 (last access: 14 August 2026), 2016. a, b, c, d, e, f, g, h, i, j, k, l, m
De Troch, R., Hamdi, R., Van de Vyver, H., Geleyn, J.-F., and Termonia, P.: Multiscale Performance of the ALARO-0 Model for Simulating Extreme Summer Precipitation Climatology in Belgium, J. Climate, 26, 8895–8915, https://doi.org/10.1175/JCLI-D-12-00844.1, 2013. a, b, c, d
Dehem, D., Tricot, C., Wylleman, P., and Hamdi, R.: Validation des données du réseau pluviométrique géré par l’IBGE, répartition des précipitations, analyse qualitative des sites de mesure et projet de micro-climatologie en Région bruxelloise, Tech. rep., Institut royal météorologique de Belgique, Bruxelles, Belgique, https://document.environnement.brussels/opac_css/doc_num.php?explnum_id=7249 (last access: 14 August 2026), 2010. a
Dewettinck, W., Van de Vyver, H., Degrauwe, D., Hamdi, R., Van Ginderachter, M., Van Schaeybroeck, B., Van Weverberg, K., Vandelanotte, K., Caluwaerts, S., and Termonia, P.: [SOFTWARE] Validation of the ALARO1-SFX (CY43T2) regional climate model over Belgium across different resolutions, Zenodo [code], https://doi.org/10.5281/zenodo.15791681, 2025a. a
Dewettinck, W., Van de Vyver, H., Degrauwe, D., Hamdi, R., Van Ginderachter, M., Van Schaeybroeck, B., Van Weverberg, K., Vandelanotte, K., Caluwaerts, S., and Termonia, P.: [DATASET] Validation of the ALARO1-SFX (CY43T2) regional climate model over Belgium across different resolutions, Zenodo [data set], https://doi.org/10.5281/zenodo.15296030, 2025b. a
Doblas-Reyes, F., Sörensson, A., Almazroui, M., Dosio, A., Gutowski, W., Haarsma, R., Hamdi, R., Hewitson, B., Kwon, W.-T., Lamptey, B., Maraun, D., Stephenson, T., Takayabu, I., Terray, L., Turner, A., and Zuo, Z.: Linking Global to Regional Climate Change, Cambridge University Press, Cambridge, United Kingdom and New York, NY, USA, 1363–1512, https://doi.org/10.1017/9781009157896.012, 2021. a, b
Douville, H., Royer, J. F., and Mahfouf, J. F.: A New Snow Parameterization for the Météo-France Climate Model, Clim. Dynam., 12, 21–35, https://doi.org/10.1007/BF00208760, 1995. a
Ďurán, I. B., Geleyn, J.-F., and Váňa, F.: A Compact Model for the Stability Dependency of TKE Production–Destruction–Conversion Terms Valid for the Whole Range of Richardson Numbers, J. Atmos. Sci., 71, 3004–3026, https://doi.org/10.1175/JAS-D-13-0203.1, 2014. a, b
Eyring, V., Bony, S., Meehl, G. A., Senior, C. A., Stevens, B., Stouffer, R. J., and Taylor, K. E.: Overview of the Coupled Model Intercomparison Project Phase 6 (CMIP6) experimental design and organization, Geosci. Model Dev., 9, 1937–1958, https://doi.org/10.5194/gmd-9-1937-2016, 2016. a
Fosser, G., Khodayar, S., and Berg, P.: Benefit of convection permitting climate model simulations in the representation of convective precipitation, Clim. Dynam., 44, 45–60, https://doi.org/10.1007/s00382-014-2242-1, 2015. a, b
Fosser, G., Gaetani, M., Kendon, E. J., Adinolfi, M., Ban, N., Belušić, D., Caillaud, C., Careto, J. A. M., Coppola, E., Demory, M.-E., de Vries, H., Dobler, A., Feldmann, H., Goergen, K., Lenderink, G., Pichelli, E., Schär, C., Soares, P. M. M., Somot, S., and Tölle, M. H.: Convection-permitting climate models offer more certain extreme rainfall projections, npj Clim. Atmos. Sci., 7, 1–10, https://doi.org/10.1038/s41612-024-00600-w, 2024. a, b
Fuhrer, O., Chadha, T., Hoefler, T., Kwasniewski, G., Lapillonne, X., Leutwyler, D., Lüthi, D., Osuna, C., Schär, C., Schulthess, T. C., and Vogt, H.: Near-global climate simulation at 1 km resolution: establishing a performance baseline on 4888 GPUs with COSMO 5.0, Geosci. Model Dev., 11, 1665–1681, https://doi.org/10.5194/gmd-11-1665-2018, 2018. a
Geleyn, J., Mašek, J., Brožková, R., Kuma, P., Degrauwe, D., Hello, G., and Pristov, N.: Single interval longwave radiation scheme based on the net exchanged rate decomposition with bracketing, Q. J. Roy. Meteor. Soc., 143, 1313–1335, https://doi.org/10.1002/qj.3006, 2017. a, b
Gerard, L.: An integrated package for subgrid convection, clouds and precipitation compatible with meso-gamma scales, Q. J. Roy. Meteor. Soc., 133, 711–730, https://doi.org/10.1002/qj.58, 2007. a
Gerard, L. and Geleyn, J.-F.: Evolution of a subgrid deep convection parametrization in a limited-area model with increasing resolution, Q. J. Roy. Meteor. Soc., 131, 2293–2312, https://doi.org/10.1256/qj.04.72, 2005. a
Gerard, L., Piriou, J.-M., Brožková, R., Geleyn, J.-F., and Banciu, D.: Cloud and Precipitation Parameterization in a Meso-Gamma-Scale Operational Weather Prediction Model, Mon. Weather Rev., https://doi.org/10.1175/2009MWR2750.1, 2009. a, b, c
Giorgi, F.: Thirty Years of Regional Climate Modeling: Where Are We and Where Are We Going next?, J. Geophys. Res.-Atmos., 124, 5696–5723, https://doi.org/10.1029/2018JD030094, 2019. a, b
Giot, O., Termonia, P., Degrauwe, D., De Troch, R., Caluwaerts, S., Smet, G., Berckmans, J., Deckmyn, A., De Cruz, L., De Meutter, P., Duerinckx, A., Gerard, L., Hamdi, R., Van den Bergh, J., Van Ginderachter, M., and Van Schaeybroeck, B.: Validation of the ALARO-0 model within the EURO-CORDEX framework, Geosci. Model Dev., 9, 1143–1152, https://doi.org/10.5194/gmd-9-1143-2016, 2016. a, b, c, d, e, f, g, h, i, j, k, l, m
Grell, G. A. and Freitas, S. R.: A scale and aerosol aware stochastic convective parameterization for weather and air quality modeling, Atmos. Chem. Phys., 14, 5233–5250, https://doi.org/10.5194/acp-14-5233-2014, 2014. a
Gross, M., Wan, H., Rasch, P. J., Caldwell, P. M., Williamson, D. L., Klocke, D., Jablonowski, C., Thatcher, D. R., Wood, N., Cullen, M., Beare, B., Willett, M., Lemarié, F., Blayo, E., Malardel, S., Termonia, P., Gassmann, A., Lauritzen, P. H., Johansen, H., Zarzycki, C. M., Sakaguchi, K., and Leung, R.: Physics–Dynamics Coupling in Weather, Climate, and Earth System Models: Challenges and Recent Progress, Mon. Weather Rev., 146, 3505–3544, https://doi.org/10.1175/MWR-D-17-0345.1, 2018. a, b
Guerreiro, S. B., Blenkinsop, S., Lewis, E., Pritchard, D., Green, A., and Fowler, H. J.: Unravelling the Complex Interplay Between Daily and Sub-Daily Rainfall Extremes in Different Climates, Weather and Climate Extremes, 100735, https://doi.org/10.1016/j.wace.2024.100735, 2024. a
Guichard, F., Petch, J. C., Redelsperger, J.-L., Bechtold, P., Chaboureau, J.-P., Cheinet, S., Grabowski, W., Grenier, H., Jones, C. G., Köhler, M., Piriou, J.-M., Tailleux, R., and Tomasini, M.: Modelling the Diurnal Cycle of Deep Precipitating Convection over Land with Cloud-Resolving Models and Single-Column Models, Q. J. Roy. Meteor. Soc., 130, 3139–3172, https://doi.org/10.1256/qj.03.145, 2004. a
Gupta, V. K. and Waymire, E.: Multiscaling properties of spatial rainfall and river flow distributions, J. Geophys. Res.-Atmos., 95, 1999–2009, https://doi.org/10.1029/JD095iD03p01999, 1990. a
Ha, M. T., Bastin, S., Drobinski, P., Fita, L., Polcher, J., Bock, O., Chiriaco, M., Belušić, D., Caillaud, C., Dobler, A., Fernandez, J., Goergen, K., Hodnebrog, o., Kartsios, S., Katragkou, E., Lavin-Gullon, A., Lorenz, T., Milovac, J., Panitz, H.-J., Sobolowski, S., Truhetz, H., Warrach-Sagi, K., and Wulfmeyer, V.: Precipitation frequency in Med-CORDEX and EURO-CORDEX ensembles from 0.44° to convection-permitting resolution: impact of model resolution and convection representation, Clim. Dynam., 62, 4515–4540, https://doi.org/10.1007/s00382-022-06594-6, 2024. a
Hamdi, R., Degrauwe, D., Duerinckx, A., Cedilnik, J., Costa, V., Dalkilic, T., Essaouini, K., Jerczynki, M., Kocaman, F., Kullmann, L., Mahfouf, J.-F., Meier, F., Sassi, M., Schneider, S., Váňa, F., and Termonia, P.: Evaluating the performance of SURFEXv5 as a new land surface scheme for the ALADINcy36 and ALARO-0 models, Geosci. Model Dev., 7, 23–39, https://doi.org/10.5194/gmd-7-23-2014, 2014. a, b
Han, J., Wang, W., Kwon, Y. C., Hong, S.-Y., Tallapragada, V., and Yang, F.: Updates in the NCEP GFS Cumulus Convection Schemes with Scale and Aerosol Awareness, Weather Forecast., 32, 2005–2017, https://doi.org/10.1175/WAF-D-17-0046.1, 2017. a
Hersbach, H., Bell, B., Berrisford, P., Hirahara, S., Horányi, A., Muñoz-Sabater, J., Nicolas, J., Peubey, C., Radu, R., Schepers, D., Simmons, A., Soci, C., Abdalla, S., Abellan, X., Balsamo, G., Bechtold, P., Biavati, G., Bidlot, J., Bonavita, M., De Chiara, G., Dahlgren, P., Dee, D., Diamantakis, M., Dragani, R., Flemming, J., Forbes, R., Fuentes, M., Geer, A., Haimberger, L., Healy, S., Hogan, R. J., Hólm, E., Janisková, M., Keeley, S., Laloyaux, P., Lopez, P., Lupu, C., Radnoti, G., de Rosnay, P., Rozum, I., Vamborg, F., Villaume, S., and Thépaut, J.-N.: The ERA5 global reanalysis, Q. J. Roy. Meteor. Soc., 146, 1999–2049, https://doi.org/10.1002/qj.3803, 2020. a, b
Hohenegger, C., Brockhaus, P., and Schär, C.: Towards climate simulations at cloud-resolving scales, Meteorol. Z., 17, 383–394, https://doi.org/10.1127/0941-2948/2008/0303, 2008. a
Hosking, J. R. M.: L-Moments: Analysis and Estimation of Distributions Using Linear Combinations of Order Statistics, J. Roy. Stat. Soc. Ser. B, 52, 105–124, https://www.jstor.org/stable/2345653 (last access: 14 August 2026), 1990. a
Hosking, J. R. M. and Wallis, J. R.: Some statistics useful in regional frequency analysis, Water Resour. Res., 29, 271–281, https://doi.org/10.1029/92WR01980, 1993. a
Innocenti, S., Mailhot, A., Frigon, A., Cannon, A. J., and Leduc, M.: Observed and Simulated Precipitation over Northeastern North America: How Do Daily and Subdaily Extremes Scale in Space and Time?, J. Climate, 32, 8563–8582, https://doi.org/10.1175/JCLI-D-19-0021.1, 2019. a, b
IPCC: Annex II: Models, edited by: Gutiérrez, J. M. and Tréguier, A.-M., Cambridge University Press, Cambridge, United Kingdom and New York, NY, USA, 2087–2138, https://doi.org/10.1017/9781009157896.016, 2021. a
Jacob, D., Teichmann, C., Sobolowski, S., Katragkou, E., Anders, I., Belda, M., Benestad, R., Boberg, F., Buonomo, E., Cardoso, R. M., Casanueva, A., Christensen, O. B., Christensen, J. H., Coppola, E., De Cruz, L., Davin, E. L., Dobler, A., Domínguez, M., Fealy, R., Fernandez, J., Gaertner, M. A., García-Díez, M., Giorgi, F., Gobiet, A., Goergen, K., Gómez-Navarro, J. J., Alemán, J. J. G., Gutiérrez, C., Gutiérrez, J. M., Güttler, I., Haensler, A., Halenka, T., Jerez, S., Jiménez-Guerrero, P., Jones, R. G., Keuler, K., Kjellström, E., Knist, S., Kotlarski, S., Maraun, D., van Meijgaard, E., Mercogliano, P., Montávez, J. P., Navarra, A., Nikulin, G., de Noblet-Ducoudré, N., Panitz, H.-J., Pfeifer, S., Piazza, M., Pichelli, E., Pietikäinen, J.-P., Prein, A. F., Preuschmann, S., Rechid, D., Rockel, B., Romera, R., Sánchez, E., Sieck, K., Soares, P. M. M., Somot, S., Srnec, L., Sørland, S. L., Termonia, P., Truhetz, H., Vautard, R., Warrach-Sagi, K., and Wulfmeyer, V.: Regional climate downscaling over Europe: perspectives from the EURO-CORDEX community, Reg. Environ. Change, 20, 51, https://doi.org/10.1007/s10113-020-01606-9, 2020. a, b
Jones, P. W.: First- and Second-Order Conservative Remapping Schemes for Grids in Spherical Coordinates, Mon. Weather Rev., 127, 2204–2210, https://doi.org/10.1175/1520-0493(1999)127<2204:FASOCR>2.0.CO;2, 1999. a
Journée, M., Ingels, R., and Bertrand, C.: Overview and validation of observational gridded data products for Belgium, in: EMS Annual Meeting Abstracts, vol. 16, EMS2019–99, Copernicus, 2019. a
Journée, M., Tricot, C., Verhumst, K., Hamdi, R., and Dehem, D.: Réseau de pluviomètres : validation des données, répartition des précipitations et projet d'étude « changement climatique et ressources en eau » en Région bruxelloise, Tech. rep., Institut royal météorologique de Belgique, Bruxelles, Belgique, https://document.environnement.brussels/opac_css/elecfile/RAP_ValidationDonneesReseauPluvio2014 (last access: 14 August 2026), 2014. a
Kendon, E. J., Roberts, N. M., Senior, C. A., and Roberts, M. J.: Realism of Rainfall in a Very High-Resolution Regional Climate Model, J. Climate, https://doi.org/10.1175/JCLI-D-11-00562.1, 2012. a
Laprise, R.: The Euler Equations of Motion with Hydrostatic Pressure as an Independent Variable, Mon. Weather Rev., https://journals.ametsoc.org/view/journals/mwre/120/1/1520-0493_1992_120_0197_teeomw_2_0_co_2.xml, 1992. a
Lehner, F., Deser, C., Maher, N., Marotzke, J., Fischer, E. M., Brunner, L., Knutti, R., and Hawkins, E.: Partitioning climate projection uncertainty with multiple large ensembles and CMIP5/6, Earth Syst. Dynam., 11, 491–508, https://doi.org/10.5194/esd-11-491-2020, 2020. a
Leutwyler, D., Lüthi, D., Ban, N., Fuhrer, O., and Schär, C.: Evaluation of the convection-resolving climate modeling approach on continental scales, J. Geophys. Res.-Atmos., 122, 5237–5258, https://doi.org/10.1002/2016JD026013, 2017. a
Lucas-Picher, P., Argüeso, D., Brisson, E., Tramblay, Y., Berg, P., Lemonsu, A., Kotlarski, S., and Caillaud, C.: Convection-permitting modeling with regional climate models: Latest developments and next steps, WIREs Climate Change, 12, e731, https://doi.org/10.1002/wcc.731, 2021. a, b, c, d, e, f
Marquet, P. and Geleyn, J.: On a general definition of the squared Brunt–Väisälä frequency associated with the specific moist entropy potential temperature, Q. J. Roy. Meteor. Soc., 139, 85–100, https://doi.org/10.1002/qj.1957, 2013. a, b
Masson, V., Champeaux, J.-L., Chauvin, F., Meriguet, C., and Lacaze, R.: A Global Database of Land Surface Parameters at 1-Km Resolution in Meteorological and Climate Models, J. Climate, 16, 1261–1282, https://doi.org/10.1175/1520-0442(2003)16<1261:AGDOLS>2.0.CO;2, 2003. a
Masson, V., Le Moigne, P., Martin, E., Faroux, S., Alias, A., Alkama, R., Belamari, S., Barbu, A., Boone, A., Bouyssel, F., Brousseau, P., Brun, E., Calvet, J.-C., Carrer, D., Decharme, B., Delire, C., Donier, S., Essaouini, K., Gibelin, A.-L., Giordani, H., Habets, F., Jidane, M., Kerdraon, G., Kourzeneva, E., Lafaysse, M., Lafont, S., Lebeaupin Brossier, C., Lemonsu, A., Mahfouf, J.-F., Marguinaud, P., Mokhtari, M., Morin, S., Pigeon, G., Salgado, R., Seity, Y., Taillefer, F., Tanguy, G., Tulet, P., Vincendon, B., Vionnet, V., and Voldoire, A.: The SURFEXv7.2 land and ocean surface platform for coupled or offline simulation of earth surface variables and fluxes, Geosci. Model Dev., 6, 929–960, https://doi.org/10.5194/gmd-6-929-2013, 2013. a
Masson-Delmotte, V., Zhai, P., Pirani, A., Connors, S., Péan, C., Berger, S., Caud, N., Chen, Y., Goldfarb, L., Gomis, M., Huang, M., Leitzell, K., Lonnoy, E., Matthews, J., Maycock, T., Waterfield, T., Yelekçi, O., Yu, R., and Zhou, B. (Eds.): Framing, Context, and Methods, Cambridge University Press, Cambridge, United Kingdom and New York, NY, USA, 147–286, https://doi.org/10.1017/9781009157896.003, 2021. a
Mašek, J., Geleyn, J., Brožková, R., Giot, O., Achom, H. O., and Kuma, P.: Single interval shortwave radiation scheme with parameterized optical saturation and spectral overlaps, Q. J. Roy. Meteor. Soc., 142, 304–326, https://doi.org/10.1002/qj.2653, 2016. a, b
Meredith, E. P., Ulbrich, U., Rust, H. W., and Truhetz, H.: Present and future diurnal hourly precipitation in 0.11° EURO-CORDEX models and at convection-permitting resolution, Environ. Res. Commun., 3, 055002, https://doi.org/10.1088/2515-7620/abf15e, 2021. a, b
Müller, S. K., Caillaud, C., Chan, S., de Vries, H., Bastin, S., Berthou, S., Brisson, E., Demory, M.-E., Feldmann, H., Goergen, K., Kartsios, S., Lind, P., Keuler, K., Pichelli, E., Raffa, M., Tölle, M. H., and Warrach-Sagi, K.: Evaluation of Alpine-Mediterranean precipitation events in convection-permitting regional climate models using a set of tracking algorithms, Clim. Dynam., 61, 939–957, https://doi.org/10.1007/s00382-022-06555-z, 2023. a
Müller, S. K., Pichelli, E., Coppola, E., Berthou, S., Brienen, S., Caillaud, C., Demory, M.-E., Dobler, A., Feldmann, H., Mercogliano, P., Tölle, M., and de Vries, H.: The climate change response of alpine-mediterranean heavy precipitation events, Clim. Dynam., 62, 165–186, https://doi.org/10.1007/s00382-023-06901-9, 2024. a
Nguyen, P. L., Alexander, L. V., Thatcher, M. J., Truong, S. C. H., Isphording, R. N., and McGregor, J. L.: Selecting CMIP6 global climate models (GCMs) for Coordinated Regional Climate Downscaling Experiment (CORDEX) dynamical downscaling over Southeast Asia using a standardised benchmarking framework, Geosci. Model Dev., 17, 7285–7315, https://doi.org/10.5194/gmd-17-7285-2024, 2024. a
Noilhan, J. and Mahfouf, J. F.: The ISBA land surface parameterisation scheme, Global Planet. Change, 13, 145–159, https://doi.org/10.1016/0921-8181(95)00043-7, 1996. a
Noilhan, J. and Planton, S.: A Simple Parameterization of Land Surface Processes for Meteorological Models, Mon. Weather Rev., https://doi.org/10.1175/1520-0493(1989)117<0536:ASPOLS>2.0.CO;2, 1989. a
Pichelli, E., Coppola, E., Sobolowski, S., Ban, N., Giorgi, F., Stocchi, P., Alias, A., Belušić, D., Berthou, S., Caillaud, C., Cardoso, R. M., Chan, S., Christensen, O. B., Dobler, A., de Vries, H., Goergen, K., Kendon, E. J., Keuler, K., Lenderink, G., Lorenz, T., Mishra, A. N., Panitz, H.-J., Schär, C., Soares, P. M. M., Truhetz, H., and Vergara-Temprado, J.: The first multi-model ensemble of regional climate simulations at kilometer-scale resolution part 2: historical and future simulations of precipitation, Clim. Dynam., 56, 3581–3602, https://doi.org/10.1007/s00382-021-05657-4, 2021. a
Prein, A. F., Langhans, W., Fosser, G., Ferrone, A., Ban, N., Goergen, K., Keller, M., Tölle, M., Gutjahr, O., Feser, F., Brisson, E., Kollet, S., Schmidli, J., van Lipzig, N. P. M., and Leung, R.: A review on regional convection-permitting climate modeling: Demonstrations, prospects, and challenges, Rev. Geophys., 53, 323–361, https://doi.org/10.1002/2014RG000475, 2015. a, b, c, d
Ranasinghe, R., Ruane, A., Vautard, R., Arnell, N., Coppola, E., Cruz, F., Dessai, S., Islam, A., Rahimi, M., Ruiz Carrascal, D., Sillmann, J., Sylla, M., Tebaldi, C., Wang, W., and Zaaboul, R.: Climate Change Information for Regional Impact and for Risk Assessment, Cambridge University Press, Cambridge, United Kingdom and New York, NY, USA, 1767–1926, https://doi.org/10.1017/9781009157896.014, 2021. a
Rummukainen, M.: Added value in regional climate modeling, WIREs Clim. Change, 7, 145–159, https://doi.org/10.1002/wcc.378, 2016. a, b
Simmons, A. J. and Burridge, D. M.: An Energy and Angular-Momentum Conserving Vertical Finite-Difference Scheme and Hybrid Vertical Coordinates, Mon. Weather Rev., https://doi.org/10.1175/1520-0493(1981)109<0758:AEAAMC>2.0.CO;2, 1981. a
Soares, P., Careto, J., Cardoso, R., Goergen, K., Katragkou, E., Sobolowski, S., Coppola, E., Ban, N., Belušić, D., Berthou, S., Caillaud, C., Dobler, A., Hodnebrog, o., Kartsios, S., Lenderink, G., Lorenz, T., Milovac, J., Feldmann, H., Pichelli, E., and Bastin, S.: The added value of km-scale simulations to describe temperature over complex orography: the CORDEX FPS-Convection multi-model ensemble runs over the Alps, Clim. Dynam., 62, https://doi.org/10.1007/s00382-022-06593-7, 2022. a
Tabari, H., De Troch, R., Giot, O., Hamdi, R., Termonia, P., Saeed, S., Brisson, E., Van Lipzig, N., and Willems, P.: Local impact analysis of climate change on precipitation extremes: are high-resolution climate models needed for realistic simulations?, Hydrol. Earth Syst. Sci., 20, 3843–3857, https://doi.org/10.5194/hess-20-3843-2016, 2016. a, b, c, d, e
Termonia, P., Fischer, C., Bazile, E., Bouyssel, F., Brožková, R., Bénard, P., Bochenek, B., Degrauwe, D., Derková, M., El Khatib, R., Hamdi, R., Mašek, J., Pottier, P., Pristov, N., Seity, Y., Smolíková, P., Španiel, O., Tudor, M., Wang, Y., Wittmann, C., and Joly, A.: The ALADIN System and its canonical model configurations AROME CY41T1 and ALARO CY40T1, Geosci. Model Dev., 11, 257–281, https://doi.org/10.5194/gmd-11-257-2018, 2018a. a, b, c, d, e, f
Termonia, P., Van Schaeybroeck, B., De Cruz, L., De Troch, R., Caluwaerts, S., Giot, O., Hamdi, R., Vannitsem, S., Duchêne, F., Willems, P., Tabari, H., Van Uytven, E., Hosseinzadehtalaei, P., Van Lipzig, N., Wouters, H., Vanden Broucke, S., van Ypersele, J.-P., Marbaix, P., Villanueva-Birriel, C., Fettweis, X., Wyard, C., Scholzen, C., Doutreloup, S., De Ridder, K., Gobin, A., Lauwaet, D., Stavrakou, T., Bauwens, M., Müller, J.-F., Luyten, P., Ponsar, S., Van den Eynde, D., and Pottiaux, E.: The CORDEX.be initiative as a foundation for climate services in Belgium, Climate Services, 11, 49–61, https://doi.org/10.1016/j.cliser.2018.05.001, 2018b. a
Termonia, P., Van Schaeybroeck, B., De Cruz, L., De Troch, R., Hamdi, R., Vannitsem, S., Duchêne, F., Willems, P., Tabari, H., Van Uytven, E., Hosseinzadehtalaei, P., Van Lipzig, N., Wouters, H., Vanden Broucke, S., van Ypersele, J.-P., Marbaix, P., Villanueva-Birriel, C., Fettweis, X., Wyard, C., Scholzen, C., Doutreloup, S., De Ridder, K., Gobin, A., Lauwaet, D., Stavrakou, T., Bauwens, M., Müller, J.-F., Luyten, P., Ponsar, S., and Pottiaux, E.: Combining Regional Downscaling Expertise in Belgium: CORDEX and Beyond, Tech. Rep. CORDEX.be Final Report, Belgian Science Policy Office (BELSPO), Brussels, Belgium, https://www.belspo.be/belspo/brain-be/projects/FinalReports/CORDEXbe_FinRep_AD.pdf (last access: 14 August 2026), 2018c. a, b
Thomassen, E. D., Arnbjerg-Nielsen, K., Sørup, H. J. D., Langen, P. L., Olsson, J., Pedersen, R. A., and Christensen, O. B.: Spatial and temporal characteristics of extreme rainfall: Added benefits with sub-kilometre-resolution climate model simulations?, Q. J. Roy. Meteor. Soc., 149, 1913–1931, https://doi.org/10.1002/qj.4488, 2023. a
Top, S., Kotova, L., De Cruz, L., Aniskevich, S., Bobylev, L., De Troch, R., Gnatiuk, N., Gobin, A., Hamdi, R., Kriegsmann, A., Remedio, A. R., Sakalli, A., Van De Vyver, H., Van Schaeybroeck, B., Zandersons, V., De Maeyer, P., Termonia, P., and Caluwaerts, S.: Evaluation of regional climate models ALARO-0 and REMO2015 at 0.22° resolution over the CORDEX Central Asia domain, Geosci. Model Dev., 14, 1267–1293, https://doi.org/10.5194/gmd-14-1267-2021, 2021. a, b
Van de Vyver, H.: Spatial regression models for extreme precipitation in Belgium, Water Resour. Res., 48, 2011WR011707, https://doi.org/10.1029/2011WR011707, 2012. a, b
Van de Vyver, H.: Practical Return Level Mapping for Extreme Precipitation in Belgium, Scientific and Technical Publication 062, Royal Meteorological Institute of Belgium, https://orfeo.belnet.be/handle/internal/8489 (last access: 14 August 2026), 2013. a
Van de Vyver, H.: A multiscaling‐based intensity–duration–frequency model for extreme precipitation, Hydrol. Process., 32, 1635–1647, https://doi.org/10.1002/hyp.11516, 2018. a
Van de Vyver, H.: Observed Annual Maximum Sub-Daily Precipitation from the Belgian Hydro-Meteorological Network (1967–2004) and Uccle (1898–2007), Zenodo [data set], https://doi.org/10.5281/zenodo.4741177, 2021. a, b
Van de Vyver, H., Van Schaeybroeck, B., De Troch, R., De Cruz, L., Hamdi, R., Villanueva-Birriel, C., Marbaix, P., Van Ypersele, J.-P., Wouters, H., Vanden Broucke, S., Van Lipzig, N. P., Doutreloup, S., Wyard, C., Scholzen, C., Fettweis, X., Caluwaerts, S., and Termonia, P.: Evaluation framework for sub-daily rainfall extremes simulated by regional climate models, J. Appl. Meteorol. Clim., https://doi.org/10.1175/JAMC-D-21-0004.1, 2021. a, b, c
Van Ginderachter, M., Degrauwe, D., Vannitsem, S., and Termonia, P.: Simulating model uncertainty of subgrid-scale processes by sampling model errors at convective scales, Nonlin. Processes Geophys., 27, 187–207, https://doi.org/10.5194/npg-27-187-2020, 2020. a
Veneziano, D. and Furcolo, P.: Multifractality of rainfall and scaling of intensity-duration-frequency curves, Water Resour. Res., 38, 42–1–42–12, https://doi.org/10.1029/2001WR000372, 2002. a
Vergara-Temprado, J., Ban, N., Panosetti, D., Schlemmer, L., and Schär, C.: Climate Models Permit Convection at Much Coarser Resolutions Than Previously Considered, J. Climate, https://doi.org/10.1175/JCLI-D-19-0286.1, 2020. a, b, c
Zheng, Y., Alapaty, K., Herwehe, J. A., Del Genio, A. D., and Niyogi, D.: Improving High-Resolution Weather Forecasts Using the Weather Research and Forecasting (WRF) Model with an Updated Kain–Fritsch Scheme, Mon. Weather Rev., 144, 833–860, https://doi.org/10.1175/MWR-D-15-0005.1, 2016. a
Surface Externalisée.
Interaction Soil Biosphere Atmosphere.
Aire Limitée Adaptation Dynamique Développement International.
The ALADIN consortium merged with the HIRLAM (High Resolution Limited-Area Model) consortium in 2020 to form the ACCORD (A Consortium for COnvection-scale modelling Research and Development) consortium.
Application of Research to Operations at Mesoscale.
The name ALARO stands for ALADIN-AROME.
Modular Multiscale Microphysics and Transport
Integrated Forecasting System.
Action de Recherche Petite Echelle Grande Echelle.
European Centre for Medium-Range Weather Forecasts.
Town Energy Balance
- Abstract
- Introduction
- Data and methods
- Results
- Discussion
- Conclusions
- Appendix A: Definition of bias
- Appendix B: Definition of GEV distribution
- Appendix C: Station data specifications
- Appendix D: Additional figures
- Code availability
- Data availability
- Author contributions
- Competing interests
- Disclaimer
- Acknowledgements
- Financial support
- Review statement
- References
- Abstract
- Introduction
- Data and methods
- Results
- Discussion
- Conclusions
- Appendix A: Definition of bias
- Appendix B: Definition of GEV distribution
- Appendix C: Station data specifications
- Appendix D: Additional figures
- Code availability
- Data availability
- Author contributions
- Competing interests
- Disclaimer
- Acknowledgements
- Financial support
- Review statement
- References