
the Creative Commons Attribution 4.0 License.
the Creative Commons Attribution 4.0 License.
 | 06 Aug 2026
A process-based modeling of soil organic matter physical properties for land surface models – Part 2: Global land surface simulations and mineral soil compactness adjustment
Bertrand Decharme
Diane Tzanos
Lucas Hardouin
Aaron Boone
Marie Minvielle
Patrick Le Moigne
Rémi Gaillard
In the companion paper, Decharme (2025) developed a process-based framework using soil mixture theory to represent the effects of soil organic matter on soil physical properties in land surface models. The present study extends this work by testing the framework in global land surface simulations with the ISBA-CTRIP land surface modeling system. The approach derives the volumetric organic matter fraction and phase-specific densities from soil organic carbon and bulk density using mass volume relationships, and computes hydraulic and thermal parameters using mixing rules consistent with the model physics. We also introduce an optional mineral soil compactness adjustment, under the assumption that texture-based pedotransfer functions define a mineral reference state that is not explicitly constrained by bulk density, whereas gridded bulk density products mostly reflect in situ compactness states. We examine the effects of both developments in multidecadal global offline simulations forced by a standard meteorological dataset and driven by SoilGrids soil inputs. Four configurations are compared, a mineral-only control, a previous empirical scheme, the new process-based scheme, and its variant including the mineral soil compactness adjustment. The evaluation combines site-scale constraints on porosity and hydraulic behavior with large-scale benchmarks of the terrestrial water and energy cycles, including terrestrial water storage variations, river discharge, evapotranspiration, soil temperature, and active layer thickness. Overall, the global experiments suggest that the new process-based scheme produces more consistent large-scale hydrothermal responses than the previous empirical scheme, whereas the mineral soil compactness adjustment plays a secondary role and mainly acts as a local modulator.
- Article
(16626 KB) - Full-text XML
- Companion paper
-
Supplement
(31008 KB) - BibTeX
- EndNote


All physical and chemical exchanges of water, energy, carbon, and momentum between the terrestrial surface and the atmosphere in Earth system models are computed by land surface models (LSMs). These models provide lower boundary conditions for weather and climate simulations and are key components of coupled modeling systems. LSMs resolve processes such as precipitation interception and infiltration, evapotranspiration, runoff generation, snow accumulation and melt, soil heat diffusion, vegetation phenology, photosynthesis, autotrophic and heterotrophic respiration, soil carbon dynamics, etc. Their accuracy directly influences the simulation of land–atmosphere fluxes and the representation of surface climate, hydrology, and biogeochemical cycles across spatial and temporal scales (Bonan and Doney, 2018; Blyth et al., 2021). Accurate representation of soil physical properties in LSMs is essential for correctly simulating the partitioning of water and energy at the land surface. Soil porosity and hydraulic conductivity determine infiltration, runoff and drainage, thermal conductivity and heat capacity affect soil temperature profiles, and water retention properties regulate the availability of moisture to plants and microbial processes. These variables, in turn, influence evapotranspiration, carbon fluxes, and the surface energy balance of the Earth system. Errors in the physical characterization of soils can thus propagate to the simulation of land–atmosphere exchanges and affect the response of LSMs to changes in precipitation, temperature, and radiative forcing. A soil consists of solid particles and pore spaces containing water, ice, or air. The solid phase is made up of a fine earth fraction, which includes both mineral and organic matter, and a coarse fragment fraction composed of rock fragments larger than 2 mm. In line with common practice in LSMs, only the fine earth fraction is considered in this study.
Originally, bulk soil physical properties in LSMs were estimated from soil texture alone, using pedotransfer functions (PTFs) calibrated for mineral soils. Such approaches neglect the presence of organic matter, which influences the physical behavior of soils. Its low bulk density and high porosity tend to increase water retention capacity, while its low thermal conductivity and relatively high specific heat capacity reduce energy transfer through the soil profile (Letts et al., 2000; Lawrence and Slater, 2008; Dankers et al., 2011; Decharme et al., 2016; Gaillard et al., 2025). In surface layers, where organic matter is less decomposed, its structure favors water flow and enhances hydraulic conductivity. At greater depth, increased decomposition and compaction reduce conductivity and enhance water retention (Boelter, 1968, 1969; Liu and Lennartz, 2019). These vertical variations affect soil temperature and moisture, especially in cold or humid regions where SOM-rich soils are common. As reported in the companion paper to this study (Decharme, 2025), the bulk physical properties of soils are directly linked to the volumes occupied by their organic and mineral constituents when coarse fragments are neglected. In the case of porosity, this means that total soil porosity can be calculated as the volumetric-weighted arithmetic mean of the reference porosities of the organic and mineral components, assuming a binary mixture. This expression, analytically demonstrated in Decharme (2025) from soil mixture theory, follows directly from mass–volume relationships, which show that the bulk porosity of the mixture is determined solely by the intrinsic porosities of its constituents and their respective volumetric fractions.
In this context, the role of soil organic matter (SOM) in shaping hydrological and thermal soil processes has received growing attention over the past two decades. Several LSMs have thus introduced empirical parameterizations to account for SOM effects, particularly in cold and humid regions where organic soils are common (Letts et al., 2000; Lawrence and Slater, 2008; Dankers et al., 2011; Chen et al., 2012; Chadburn et al., 2015; Decharme et al., 2016; Chen et al., 2016; Guimberteau et al., 2018; Sun et al., 2021; Chadburn et al., 2022; Gaillard et al., 2025; Cuynet et al., 2025).These approaches typically estimate the SOM volumetric fraction as the ratio between soil organic carbon (SOC) mass per unit soil volume, derived from SOC mass content and soil bulk density, and an a priori prescribed apparent bulk density of organic matter taken from the literature. Such simplifications are conceptually problematic. As discussed in Sect. 2.1.1 of Decharme (2025), some formulations may be formally valid but, in that case, describe only the volumetric fraction of SOC rather than total SOM, thereby neglecting both the SOC-to-SOM conversion and the substantial variability in organic matter density. In other cases, they conflate SOM-based bulk density with a threshold intended for SOC, combining quantities of different physical nature and resulting in definitions inconsistent with soil mixture theory. These inconsistencies propagate to the estimation of bulk soil properties and introduce systematic biases. To address these limitations, Decharme (2025) proposed a physically based framework relying on mass–volume relationships (Stewart et al., 1970; Adams, 1973; Raats, 1987; Rühlmann et al., 2006; Reynolds et al., 2020) and a SOC-to-SOM conversion derived from observational data (Ruehlmann, 2020), accounting for vertical variations in porosity and hydraulic behavior. This framework improves the internal consistency of SOM representation in LSMs without requiring additional inputs or calibration. It has so far been evaluated only in idealized settings, using controlled laboratory experiments and in situ observations. That study demonstrated accurate reproduction of key soil structural properties, such as porosity and thermal conductivity, across a wide range of SOM contents and textures, with improved agreement over existing empirical SOC-based parameterizations, especially for organic-rich soils.
However, two main limitations remain in Decharme (2025). First, the proposed framework has only been evaluated against experimental and in situ datasets and has not yet been tested within a dynamic land surface modeling system. Such an assessment is required to examine how the parameterization behaves when coupled to the full set of surface processes. This is particularly relevant for regions where organic-rich soils are widespread, such as high-latitude peatlands and tropical peat ecosystems (Hardouin et al., 2024). In high-latitude regions, SOM strongly influences the soil thermal regime of the permafrost and the depth of its active layer. Their low bulk density, high porosity and low thermal conductivity produce a marked insulating effect that controls the transfer of energy through the soil column. Several modeling studies have shown that neglecting the specific physical behavior of organic horizons can bias the simulation of the active layer depth (Dankers et al., 2011; Chadburn et al., 2015; Decharme et al., 2016; Guimberteau et al., 2018; Chadburn et al., 2022; Gaillard et al., 2025). Organic soils are also abundant in tropical regions where extensive peatlands store large amounts of carbon and exhibit hydrological and thermal properties that differ strongly from those of mineral soils. An explicit representation of the volumetric organic fraction is therefore required to simulate the behavior of these systems within land surface models. Second, the evaluation performed in Decharme (2025) (cf. Fig. 4) revealed a systematic overestimation of saturated water content for samples with low porosity (≤ 0.4 m3 m−3), generally associated with low SOM content. This deviation does not originate from the soil mixture theory but from the porosity of the mineral reference phase derived from the Cosby et al. (1984) PTF, which never predicts porosity values below 0.4 m3 m−3. This bias is consistent with evidence that texture-only PTFs have limited ability to represent the effects of soil structure, bulk density, and scale on porosity and hydraulic behavior, especially when dense mineral horizons fall outside the structural range represented by their predictor set (Pachepsky and Rawls, 2003; Van Looy et al., 2017; Vereecken et al., 2019; Weber et al., 2024). In addition, when using the dataset of Keller and Håkansson (2010), we applied the recommended conversion factor of 0.83 to derive an empirically adjusted reference bulk density from the measured reference bulk density. This correction allowed us to compare the texture-based reference porosity predicted by the framework of Decharme (2025) with the porosity inferred from the ratio between this empirically adjusted bulk density and the measured particle density, particularly for samples with low organic matter content. This validation strategy remains unsatisfactory, because natural soils are often compacted to varying degrees, and their bulk density and porosity rarely reflect such an idealized low-compactness reference state used in this comparison. Here, compacted does not necessarily mean mechanically compacted, for example by traffic. It refers more generally to an in situ state of compactness, which can result from natural packing, horizon development, pedogenic consolidation, land management, or mechanical compaction.
Compaction is widely documented in soil physics. Increases in packing density arise from machinery traffic, livestock or natural processes, and these changes modify bulk density, porosity, aeration, infiltration and soil strength across a wide range of textures (Batey, 2009; Nawaz et al., 2013; Stolte et al., 2016). Laboratory and field studies show that compaction alters the soil pore-size distribution by reducing structural macroporosity, increasing the proportion of smaller pores, and changing microstructural state variables that control water retention and mechanical behavior (Smith et al., 2001; Richard et al., 2001; Zhang et al., 2006; Dias et al., 2024; Xiao et al., 2022). Compacted horizons thus tend to exhibit higher air-entry suction, steeper water retention curves in the wet range and reduced hydraulic conductivity, although the response of field capacity and available water capacity can depend on texture and the level of soil compactness. These studies also emphasize that compacted horizons are persistent, influence root penetration and water flow, and occur in both agricultural and forest soils under many management and climatic conditions. At continental scales, regional assessments show that many soils are susceptible to high packing density (Jones et al., 2003) and that densely packed mineral horizons are, for instance, common across Europe (Panagos et al., 2024). This susceptibility is often linked to soil texture, with fine-textured and clay-rich soils showing a stronger tendency to compact under moist conditions (Nawaz et al., 2013; Renger et al., 2014; Schjønning et al., 2016). In parallel, several modeling studies have proposed empirical or semi-empirical relationships to represent the effect of bulk density on hydraulic properties, either by relating changes in air-entry pressure and pore-size distribution indices to compaction or by coupling the evolution of pore-size distributions with soil deformation processes to predict time-varying water retention and hydraulic conductivity after tillage (Assouline et al., 1997; Or et al., 2000; Assouline, 2006a, b; Tian et al., 2018, 2019; Peters et al., 2025). These approaches provide useful insight into how soil compactness modifies the soil water retention curve and conductivity, but they are not yet integrated into large-scale land surface parameterizations. These facts indicate that compacted mineral states are widespread and should be accounted for when defining the porosity and, when possible, the corresponding soil water retention and hydraulic conductivity. Consequently, we extend the previous framework by introducing a simple adjustment for mineral soil compactness.
The goal of this study is therefore to evaluate the impact of the physically based SOM parameterization of Decharme (2025) on global land surface simulations. We further examine how representing a mineral soil compactness adjustment within this soil mixture framework affects these simulations. We implement these developments into the ISBA-CTRIP land surface modeling system (Decharme et al., 2019; Delire et al., 2020), developed at the Centre National de Recherches Météorologiques (CNRM) and embedded in the SURFEX version 9.0 numerical platform (Masson et al., 2013). Their performances are evaluated across four configurations consisting of a purely mineral soil, the former ISBA-CTRIP parameterization (Decharme et al., 2016), the new mixture framework (Decharme, 2025), and this mixture framework including mineral soil compactness. ISBA-CTRIP is used in Météo-France's climate modeling chain and serves as the land component of its Earth system model (Decharme and Colin, 2025). It combines the ISBA (Interaction Soil-Biosphere-Atmosphere) LSM with the CTRIP (CNRM version of the Total Runoff Integrating Pathways) river routing model using the OASIS3-MCT coupler (Voldoire et al., 2017). An explicit two-way coupling allows surface hydrology and groundwater dynamics to interact with the soil and atmosphere. Floodplains exchange water with the soil column through infiltration and free-water evaporation, while precipitation interception is also represented. Groundwater dynamics are simulated over 218 of the world's largest unconfined aquifer basins, allowing upward capillary fluxes from the water table to impact near-surface soil moisture and energy fluxes.
To describe the soil properties in ISBA-CTRIP, we use the latest version of the SoilGrids 2.0 database (Poggio et al., 2021). This database provides globally gridded estimates of soil texture, bulk density, and SOC content across six standardized soil horizons down to 2 m depth. Below 2 m, bulk density and SOC content are extrapolated using depth-dependent decay functions consistent with the SoilGrids profile. The model is forced over the 1948–2010 period using the Princeton Global Forcing (PGF) dataset developed by Princeton University (Sheffield et al., 2006). This dataset provides meteorological forcing fields at a spatial resolution of 1°, representative of current-generation climate models. Several simulations with different implementations of the parameterizations describing the physical effects of SOM, including the new physically-based framework, are then analyzed and compared to various observational datasets. A brief description of the ISBA-CTRIP model and a review of the parameterizations used to represent the physical effects of SOM in LSMs are provided in Sect. 2, together with the experimental setup and forcing data. This includes the interpolation of SoilGrids-derived inputs, the vertical discretization of soil properties, and the configuration adopted for the global simulations. The main results are presented in Sect. 3. We analyze the impact of both the revised SOM representation and the mineral soil compactness adjustment on key land surface variables, focusing on soil moisture, soil temperature, evapotranspiration and runoff. The analysis compares simulations using the new physically based framework with those obtained using the standard mineral soil or the empirical SOC-based parameterization. Finally, Sect. 4 provides a brief discussion of the results and outlines the limitations of the current approach, while Sect. 5 summarizes the main conclusions and perspectives of the study.
2.1 Brief review of ISBA-CTRIP
ISBA-CTRIP is the land surface modeling system developed at CNRM over the last decade for use in both standalone and coupled Earth system configurations (Decharme et al., 2019; Voldoire et al., 2019; Delire et al., 2020; Roehrig et al., 2020; Séférian et al., 2019; Decharme et al., 2025; Decharme and Colin, 2025). The CTRIP river routing model routes runoff and drainage produced by ISBA through a global river network at 0.5° resolution to the ocean. It explicitly simulates river discharge, floodplain storage and reinfiltration, and groundwater–surface water exchanges. Groundwater dynamics are represented with a shallow unconfined aquifer fed by deep drainage from the soil column, which contributes to baseflow and interacts laterally with floodplains. CTRIP therefore helps close the continental water cycle in the Météo-France Earth system model and enables direct comparison of simulated discharge with observations to assess large-scale water balance over river basins and continental domains.
ISBA simulates the exchanges of energy and water between the land surface and the atmosphere, as well as soil heat and moisture dynamics, snowpack evolution, and vegetation processes including photosynthesis. For forested areas, the energy balance is computed using the multi-energy balance (MEB) scheme (Boone et al., 2017), which represents separately the canopy, the snow intercepted by the canopy, and the forest floor. Within this scheme, a litter option adds an explicit surface layer above the mineral soil, with prognostic liquid water and ice contents, which influences heat and moisture exchanges at the ground surface (Napoly et al., 2017). In this study, the thermal properties of the litter were adapted to ensure consistency under freezing conditions, since the original litter thermal conductivity neglects ice (Napoly et al., 2017). We therefore compute litter thermal properties using the same process-based formalism as for the soil thermal scheme (Appendix A), treating litter as a purely organic medium (Appendix A2). Carbon uptake is computed from atmospheric CO2 concentration, leaf temperature, and incoming solar radiation using a light-use efficiency approach. This formulation allows the model to simulate plant transpiration through stomatal conductance, which responds to atmospheric conditions and soil moisture (Delire et al., 2020). As a result, the leaf area index (LAI) is prognostic and evolves interactively with climate, as in our Earth system model (Séférian et al., 2019). The hydrological scheme computes infiltration, surface runoff, soil evaporation, transpiration, and drainage. Infiltration includes rainfall reaching the ground, through-fall, and snowmelt. Surface runoff combines saturation-excess (Dunne) and infiltration-excess (Horton) mechanisms. Dunne runoff is computed using a subgrid topography-based TOPMODEL approach (Decharme et al., 2006, 2013). Horton runoff is represented through subgrid-scale parameterizations based on the spatial variability of precipitation intensity and soil infiltration capacity, both described by exponential distributions. Vegetation heterogeneity is represented using a tiling approach with 12 surface types per grid cell (Decharme and Douville, 2006). The model includes a multi-layer snow scheme of intermediate complexity, which represents the physical properties of the snowpack in up to 12 layers (Boone and Etchevers, 2001; Decharme et al., 2016).
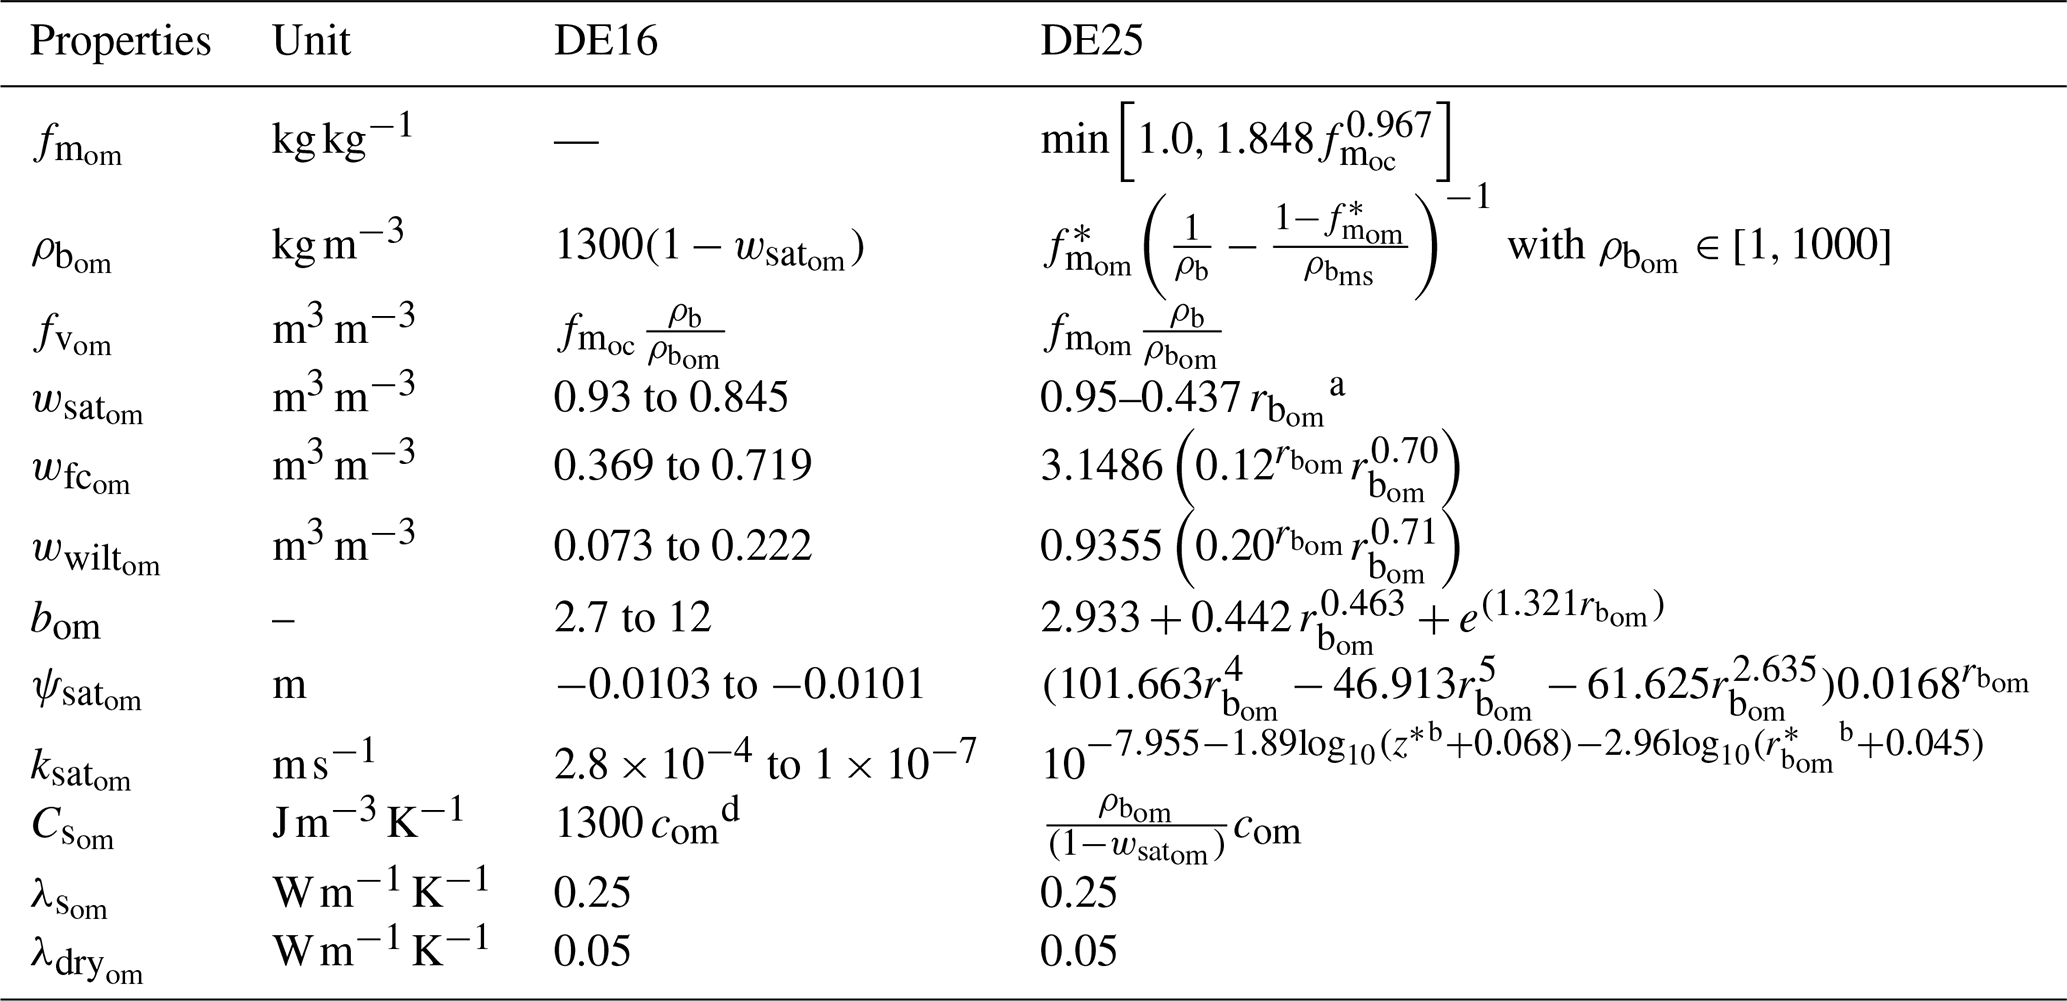
Table 1Summary of the parameterizations used to represent the physical properties of the organic matter component in both formulations: DE16 refers to Decharme et al. (2016), and DE25 to the companion paper (Decharme, 2025) schematized in Fig. 1. Note that is the regularized value of , given by the numerical safeguard in Eq. (3), and used to avoid unphysical values when is very small. All symbols and their respective units are defined in Appendix B.
a , b , , d com = 1972 .
The soil physical processes in ISBA are solved using a multi-layer scheme based on the diffusion of heat and water through the soil column. Soil temperature and moisture profiles are then computed over 14 layers by solving the one-dimensional Fourier and Darcy laws. The thermal scheme spans a total depth of 12 m, with layer interfaces located at 0.01, 0.04, 0.1, 0.2, 0.4, 0.6, 0.8, 1.0, 1.5, 2.0, 3.0, 5.0, 8.0, and 12.0 m. The hydrological scheme is applied on the same vertical grid but is generally limited to the root-zone depth, which typically ranges from about 1 m for bare soils or low vegetation to 8 m in tropical forests. In permafrost regions, however, it is extended to the full 12 m depth to account for freeze–thaw processes (Decharme et al., 2019). Thermal properties are derived following Peters-Lidard et al. (1998), using texture-based parameterizations to estimate the volumetric heat capacity and the thermal conductivity of the bulk soil (Appendix A). Hydraulic properties are estimated from soil texture through four key parameters: the porosity, the air-entry potential, the pore-size distribution index, and the saturated hydraulic conductivity. In this study, these parameters are derived using the Cosby-SC PTF, which relies solely on sand and clay mass fractions (Table 5 of Cosby et al., 1984) and was calibrated for mineral soils only. This PTF was retained because it was identified by Weihermüller et al. (2021) as the most accurate among texture-based PTFs for simulating soil water balance with the Brooks and Corey (1964) model. Finally, these parameters are used within the Brooks and Corey (1964) model to define water retention and unsaturated hydraulic conductivity as functions of soil moisture and water pressure head. This formalism allows ISBA to solve the mixed form of the Richards equation for vertical water movement in a physically consistent way, i.e. the tendency is solved in terms of volumetric water, while the hydraulic gradient is solved in terms of water pressure head (Boone et al., 2000; Decharme et al., 2011, 2013). Soil freezing is explicitly computed in each soil layer by solving the prognostic equation for ice content, including phase changes, sublimation, and the insulating effect of snow and vegetation cover (Boone et al., 2000; Decharme et al., 2016).
2.2 Parameterizations of soil organic matter effects
In this study, we compare the two parameterizations of SOM effects implemented in ISBA-CTRIP: the previous empirical formulation from Decharme et al. (2016) based on the pioneer works of Letts et al. (2000) and Lawrence and Slater (2008), and the new process based formalism from Decharme (2025). They differ in how the volumetric fraction of organic matter is estimated and how hydraulic and thermal properties are assigned to organic layers (Table 1). Only the main features are summarized here, while full details of these formalisms can be found in their respective publications.
2.2.1 The previous parameterization
As proposed by Letts et al. (2000) and Dankers et al. (2011), the initial parameterization by Decharme et al. (2016), hereafter referred to as DE16, prescribes depth-dependent profiles for SOM hydraulic properties relative to the earlier scheme of Lawrence and Slater (2008), whereas SOM thermal properties are kept constant with depth. The hydraulic property profiles follow an idealized power-law function with depth, typically extending over the upper meter of the soil column, to represent the increasing degree of decomposition of SOM with depth. This results in a sharp decrease in porosity and an increase in SOM bulk density from the surface downward, mimicking the structural evolution of peat layers. The range of SOM hydraulic properties in this parameterization is documented in Table 1 and spans from those typical of poorly decomposed fibric peat to those of highly decomposed sapric peat, following previous process-based studies (Boelter, 1968, 1969; Letts et al., 2000).
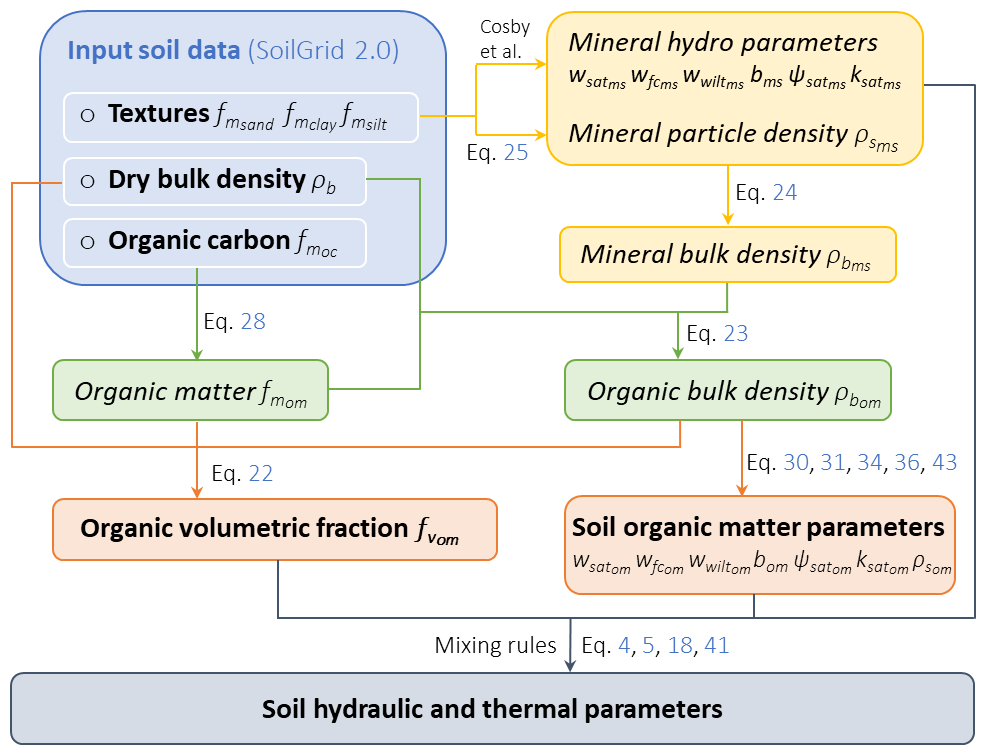
Figure 1Schematic representation of the process-based framework used to derive soil hydraulic and thermal properties from global soil datasets such as SoilGrids 2.0. Soil texture, soil bulk density, and organic carbon mass fraction are used to compute the organic matter mass fraction through a SOC-to-SOM conversion equation, and the organic bulk density and volumetric fraction through mixture theory. Mineral properties (denoted by ms) are estimated using the pedotransfer functions of Cosby et al. (1984), while organic phase properties (denoted by om) are derived following Decharme (2025). Both sets of properties are then combined with mixing rules to obtain effective soil parameters. Equation numbers refer to the companion study Decharme (2025). All symbols and units are defined in Appendix B.
Once the organic properties are determined, the physical properties of the soil are obtained by mixing the mineral and organic components using simple volumetric relationships. Most properties (Xs), including porosity, field capacity, wilting point, the pore size distribution index, the saturated matric potential, and the soil heat capacity, are combined through an arithmetic volumetric average, . In contrast, the saturated hydraulic conductivity and both the saturated and dry thermal conductivities use geometric averaging, , consistent with both theoretical and empirical studies showing that it provides a good approximation of the effective behavior of heterogeneous porous media (Prudic, 1991; Paleologos et al., 1996; Stepanyants and Teodorovich, 2003; Sakaki and Smits, 2015; Rojas et al., 2022; Decharme, 2025).
2.2.2 The new proposed framework
The new proposed framework from Decharme (2025), named hereafter DE25, is summarized in Fig. 1 and Table 1. It estimates the volumetric fraction of SOM, (m3 m−3), from input SOC mass content, (kg kg−1), and dry bulk density, ρb (kg m−3), using mass–volume relationships and a variable SOC-to-SOM conversion factor based on the PTF proposed by Ruehlmann (2020) to compute SOM mass content, (kg kg−1). The derivation of requires an estimate of the apparent bulk density of the organic matter domain, (kg m−3), which is computed from and from the bulk density of the mineral phase, (kg m−3). The latter is obtained using the PTF of Ruehlmann (2020) to compute the particle density of the mineral phase (Eq. (25) in Decharme, 2025), combined with the PTF of Cosby et al. (1984) to determine the porosity of the mineral phase:
where (m3 m−3) is the porosity of the mineral phase and (kg m−3) its particle density. Building on this, the apparent bulk density of the organic matter domain follows from the soil mixture formulation of Decharme (2025):
where (kg kg−1) is a regularized value of .
Indeed, with global input datasets used by LSMs, the analytical form used to compute is a rational function that may exhibit a vertical asymptote for certain parameter combinations. In particular, when ρb approaches and becomes very small, the denominator tends to zero. The function thus behaves as a quasi-hyperbolic expression, both structurally and dynamically, which is numerically unstable. This induces a strongly amplified non-linear response, leading to unphysical negative values of . To prevent such artifacts, a lower bound is applied to in the computation of proposed by the companion study (Decharme, 2025) to avoid divergence. This regularized value, , is defined by the following numerical safeguard:
where ε = 1 × 10⁻⁵ is a small number used to maintain numerical consistency. In addition to producing negative values, the same numerical artifact can also lead to unrealistically high values of , especially when the denominator in the analytical expression becomes very small. To avoid such inconsistencies, is finally constrained to remain above 1 kg m−3 and to not exceed 1000 kg m−3, the latter being the upper limit typically observed in highly decomposed peat layers (e.g., Liu and Lennartz, 2019; Lennartz and Liu, 2019; Liu et al., 2022). These numerical safeguards ensure that remains physically meaningful and avoids unrealistic behavior in low-organic-content soils.
The framework also derives the hydraulic properties of organic soils for use in the Brooks and Corey (1964) model as functions of SOM bulk density. Water retention parameters, including the porosity, the pore-size distribution index and air-entry potential, are estimated from recent empirical relationships fitted to laboratory and field datasets (Liu and Lennartz, 2019; Liu et al., 2022). Saturated hydraulic conductivity is computed using a dedicated PTF calibrated on the dataset of Morris et al. (2022). The mixing rules used in this framework to derive bulk soil hydraulic properties are consistent with DE16, applying arithmetic averaging for most structural and retention parameters and geometric means for saturated hydraulic conductivity.
Regarding the calculation of bulk soil thermal properties, the approach adopted in DE25 differs from previous formulations, as detailed in Appendix A. The dry thermal conductivity is estimated using a geo-harmonic mean weighted by (Appendix A1.3), which better accounts for the large contrast between mineral and organic constituents under dry conditions, as discussed in the companion study. The soil solid heat capacity and thermal conductivity are computed as the arithmetic and geometric means, respectively, of the values for organic and mineral constituents. Each constituent is weighted by its volume fraction within the solid skeleton, excluding pore space, rather than within the bulk soil. The relevant fraction in this mixing rule is thus the SOM volumetric fraction in the solid phase, , which differs from that includes pore space (Johansen, 1977; Balland and Arp, 2005; Cuynet et al., 2025; Decharme, 2025).
2.2.3 Mineral soil compactness adjustment
This new formalism is then extended by introducing a mineral soil compactness adjustment within the soil mixture framework. This adjustment does not simulate dynamic mechanical compaction driven by water-ice phase transitions, temperature, clay swelling, or external loading. It uses the gridded dry bulk density to define a static compactness constraint on the mineral reference state before the land surface simulation. The issue is therefore not the mechanical state of the samples used to derive the PTFs of Cosby et al. (1984), but the fact that the resulting PTFs use texture only and do not include ρb or any compactness index as predictors. Their predicted porosity and hydraulic parameters therefore define a texture-based mineral reference state for which the in situ compactness state is not explicitly represented. As shown in the companion paper (Decharme, 2025), the residual overestimation of saturated water content mainly occurs for low-SOM samples with observed porosities below about 0.4 m3 m−3. This bias was attributed to the texture-based Cosby-SC mineral PTF, which rarely predicts such low mineral saturated water contents, even for dense mineral soils. In contrast, field bulk density measurements represent the dry mass per unit volume of soil sampled in situ and therefore include the resulting compactness state of the soil, irrespective of whether it arises from natural packing, horizon development, pedogenic consolidation, land management, or mechanical compaction. Because global input datasets used in LSMs, such as SoilGrids or HWSD, are largely derived from in situ observations compiled in databases like WoSIS (Batjes et al., 2017, 2024), it is reasonable to assume that these gridded bulk density values also represent in situ compactness states rather than ideal non-compacted reference conditions. Within DE25, this creates a consistency issue because texture-based mineral PTFs provide a reference mineral porosity and particle density, whereas the grid-scale ρb already reflects an in situ compactness state. The proposed adjustment addresses this issue by using gridded dry bulk density as a field compactness constraint to adjust the mineral reference properties before recomputing the mixture variables. Here, compactness refers to the density state reflected by ρb, not necessarily to a specific mechanical process.
To address this mismatch, we first adjust the mineral bulk density before recomputing all mineral properties involved in the DE25 formulation. The soil compactness state of the mineral phase is represented by modifying the texture-based reference bulk density obtained from the Cosby et al. (1984) and Ruehlmann (2020) PTFs. Following the empirical approach of Renger et al. (2014), which has been applied in several studies (Reeve et al., 1973; Jones et al., 2003; Hollis et al., 2015; Schneider and Don, 2019; Panagos et al., 2024; Harbo et al., 2025), the compactness-adjusted mineral bulk density, (kg m−3), depends on the SOM, clay and silt mass fractions and is written as:
where (kg m−3) is obtained through Eq. (1). Renger et al. (2014) discussed that the first relationship was derived mainly from marsh and floodplain soils that often contained more than about 3 % organic matter. They also showed that the original clay coefficient (900) was too high for soils with humus contents below roughly 1 % and provided a reduced formulation that gave a better agreement between estimated and field-assessed bulk densities. This supports the use of this threshold of 0.01 kg kg−1 to switch between the two empirical expressions. Once is determined, the compactness-adjusted mineral porosity follows directly from the inversion of Eq. (1):
where (m3 m−3) is the compactness-adjusted mineral porosity. To ensure physical consistency, the compactness-adjusted mineral bulk density is limited to 90 % of the mineral particle density, which ensures a minimum porosity of 0.1 m3 m−3. This is a conservative choice, since field measurements indicate that total porosity in highly compacted mineral soils can reach these low values (Håkansson and Lipiec, 2000).
Once the compactness-adjusted mineral porosity is obtained, the mineral hydraulic parameters required by ISBA must also be updated. ISBA solves the Richards equation using the soil water retention curve of Campbell (1974), which depends on the air-entry pressure head, and the pore-size distribution index. Because both parameters in their original form correspond to the texture-based mineral reference state defined by the Cosby et al. (1984) PTFs, they must be rescaled to remain consistent with the compactness-adjusted mineral bulk density. The compactness-adjusted values are computed using the relationships proposed by Tian et al. (2018), based on the work of Assouline et al. (1997) and Assouline (2006a), as reported by Peters et al. (2025):
where and bms (–) are the compactness-adjusted and reference pore-size distribution indices of the mineral phase, and and (m) are the corresponding compactness-adjusted and reference air-entry pressure heads.
After updating the soil water retention parameters, the saturated hydraulic conductivity of the mineral phase must also be corrected to remain consistent with the compactness-adjusted porosity. To compute the compactness-adjusted hydraulic conductivity, the reference conductivity at saturation is rescaled using the Or et al. (2000) approach based on the Kozeny–Carman relationship, as reported by Assouline (2006b):
where is the compactness-adjusted saturated hydraulic conductivity and is its reference value from Cosby et al. (1984).
The compactness-adjusted values , , , and are then introduced into the DE25 mixture formalism. Because DE25 computes bulk soil properties from the densities and volume fractions of the organic and mineral phases, correcting the mineral density and updating the associated hydraulic properties directly propagate through the mixture equations. This ensures that the mineral soil compactness adjustment is represented consistently within DE25 without modifying the structure of the soil mixture theory or its mixing rules.
2.3 Experimental design
2.3.1 Land surface parameters
In ISBA-CTRIP, vegetation characteristics are prescribed using the ECOCLIMAP-II database at 1 km resolution (Masson et al., 2003; Faroux et al., 2013). This dataset integrates more than 500 land cover classes, derived from the 100 m Corine Land Cover map over Europe and the Global Land Cover 2000 dataset elsewhere. These detailed land cover types are aggregated into 12 subgrid land tiles at the model resolution, allowing for a representation of land cover heterogeneity within each grid cell. For each tile, root depth is prescribed based on observational data compiled by Canadell et al. (1996). The snow-free surface albedo is derived at global scale for each land cover unit using a 10-year MODIS dataset (2001–2010), processed at 1 km resolution (Carrer et al., 2014). A Kalman filter approach is applied to retrieve mean seasonal cycles at 10 d intervals for visible (0.3–0.7 µm) and near-infrared (0.7–5.0 µm) spectral bands, separately for vegetated and bare surfaces. The resulting albedo corresponds to the snow-free white-sky albedo. The snow-free albedo at the model grid cell scale is then computed as the weighted average of these two components, using the vegetation fraction specified for each subgrid tile. The topographic index used in ISBA to compute Dunne runoff via the TOPMODEL approach is derived from the global dataset of Marthews et al. (2015), based on the HydroSHEDS digital elevation model at 15 arcsec resolution. Within each model grid cell, the subgrid distribution is represented using a three-parameter gamma function fitted to the local mean, standard deviation, and skewness of the original high-resolution values (Decharme et al., 2006). Topographic data used in the CTRIP routing model are extracted from the GMTED2010 global elevation dataset of Danielson and Gesch (2011), available at a spatial resolution of 7.5 arcsec (approximately 250 m). A detailed description of the parameters used to represent river network structure and subsurface hydraulic properties in CTRIP can be found in Decharme et al. (2019).
Soil properties are prescribed using the SoilGrids-2.0 database (Poggio et al., 2021), which provides global estimates at 250 m resolution for sand, silt, and clay mass fractions, dry bulk density, and SOC content. These variables are available over six standard depth layers (0–5, 5–15, 15–30, 30–60, 60–100, and 100–200 cm). To vertically remap SoilGrids profiles onto the ISBA soil levels, a piecewise linear interpolation is first applied. The original SoilGrids profile X(z) is defined at fixed depths , corresponding to the center of the jth SoilGrids horizons (i.e., 2.5, 10, 22.5, 45, 80, and 150 cm), with j ranging from 1 to n=6. The value represents the variable at depth , while zi denotes the center of the i-th ISBA layer. For any zi, the value is interpolated linearly as:
Outside the SoilGrids vertical range, sand and clay contents are simply extended using the shallowest and deepest available values, applied to the top and bottom of the ISBA profile, respectively.
In contrast, an extrapolation is performed for and ρb. For ISBA levels located above the top of the SoilGrids profile (), values are obtained by linear upward extrapolation, using the same expression as in Eq. (8) with the first two SoilGrids levels ( and ). For ISBA levels deeper than the last SoilGrids level ( = 150 cm), an asymptotic extrapolation is applied assuming a power-law decay:
The attenuation coefficient β is estimated from the vertical structure of the original profile. We first compute two ratios to characterize how the SoilGrids profile decreases with depth. The first ratio R1 compares the deepest and shallowest values, the second ratio Rn compares the two deepest layers, and the last ratio represents the average ratio between successive layers, to capture the overall trend across the profile:
The attenuation coefficient β is determined based on the relative shape of the profile. If the profile is nearly constant with depth (R1=1), we simply set β=1. If the profile shows a strong decrease with depth (R1<0.9), we take the smallest of the two local indicators, Rn and . In other cases, β is chosen as the value closest to 1 between Rn and . This procedure ensures a smooth extension of the profile outside the SoilGrids domain, while preserving its vertical structure. It is defined as follows:
In the last case, β is defined using the argmin operator, which selects the element y from the set that minimizes the absolute difference (i.e. the y closest to 1). This ensures a smooth continuation of the profile, while limiting abrupt changes in curvature at the bottom boundary. Note that for ρb, the depth used in the extrapolation is capped at 10 m. Below this depth, ρb remains equal to its value at 10 m, preventing unrealistically high densities. For SOC content (), β is further constrained such that β≤1, preventing any increase with depth. When β=1, Eq. (9) reduces to a constant extension equal to the deepest available value.
2.3.2 Experiments
This study adopts a configuration aligned with earlier offline implementations of the ISBA-CTRIP system (Decharme et al., 2012, 2019, 2025) and in phase with its integration within the CNRM Earth System Model (Voldoire et al., 2019; Séférian et al., 2019; Decharme and Colin, 2025). ISBA is run on a 1° regular latitude-longitude grid with a 15 min time step. CTRIP operates at 0.5° resolution and a 30 min time step. The two components are coupled in a two-way configuration every hour. We conducted four main simulations for the 1948–2010 period:
-
CTL: no representation of SOM effects in ISBA-CTRIP
-
DE16: SOM parameterization based on the SOC formulation of Decharme et al. (2016)
-
DE25: SOM effects are represented using the process-based framework introduced in Decharme (2025)
-
DE25c: Mineral soil compactness adjustment is added to the DE25 framework
A comparative overview of the SOM representation used in the DE16 and DE25 experiments is provided in Table 1.
ISBA-CTRIP is forced with the 3-hourly Princeton Global Forcing (PGF) version 1 dataset (Sheffield et al., 2006), which spans the 1948–2010 period at a 1° spatial resolution. This dataset is used to ensure consistency with previous ISBA-CTRIP applications (Decharme et al., 2012, 2019, 2025). The PGF product originates from the NCEP-NCAR reanalysis, and has been corrected for biases at diurnal, daily, and monthly time scales. These corrections rely on various observational references, including air temperature, radiative fluxes, and precipitation. In particular, the precipitation bias correction was performed to match monthly totals from the Global Precipitation Climatology Centre (GPCC) Full Data Product (Schneider et al., 2011, 2014). All experiments are initialized from a balanced state derived from earlier simulations performed by Decharme et al. (2019), using the same model setup. This initial state was obtained through a 150-year spin-up driven by PGF forcing, cycling the 1948–1957 period to equilibrate slow-varying land surface reservoirs, including deep soil moisture and temperature in permafrost regions, inland glacier snowpack, and groundwater storage. Starting from this state, simulations were run from 1951 to 2010. The first two decades (1951–1970) were used as a secondary spin-up to stabilize faster components of the system, such as snow cover, soil moisture in the root zone, river discharge, floodplains, and artificial reservoirs. Only the 1971–2010 period is retained for evaluation and analysis.
2.3.3 Evaluation data sets
The first stage of the evaluation relies on a subset of the observational datasets used in Decharme (2025), which provide independent information on soil porosity, bulk density, and water retention behavior. These datasets allow an evaluation of both the physical consistency of the mineral soil compactness adjustment and its impact on the predictive skill of the DE25 parameterization. A brief description is given below, and the reader is referred to Decharme (2025) for more details. The first dataset is that of Keller and Håkansson (2010), which contains soil measurements from Nordic agricultural fields and provides paired observations of bulk density, particle density and organic matter content. The second dataset is Arkhangel'skaya (2009), which reports field measurements of thermal and structural properties in Russian soils across a wide range of textures and organic contents. The third dataset is Kristensen et al. (2019), a harmonized compilation of European in situ observations of bulk density, porosity and organic carbon across multiple land uses and depths. In addition, we use the global SoilKsatDB of Gupta et al. (2021) to provide an independent check of the saturated hydraulic conductivity predicted by the compactness-adjusted mineral formulation.
The second stage of the evaluation focuses on large-scale hydrological behavior. It follows a protocol widely used in global assessments of ISBA-CTRIP, both in offline mode (Decharme et al., 2019, 2025) and in coupled Earth system configurations (Decharme, 2025). The datasets listed below constitute the benchmark used in this stage. Terrestrial water storage variations are evaluated using monthly GRACE RL05 solutions from CSR, JPL and GFZ for the period 2002–2010, which provide satellite-derived constraints on continental water mass changes (Swenson, 2012; Landerer, 2021). River discharge is assessed using daily in situ measurements from the Global Runoff Data Centre (GRDC, 2025), complemented by United States Geological Survey data for the Mississippi basin (USGS, 2019), the French HYDRO database for France (OFB, 2025), the HyBAm database for the Amazon basin (Hybam, 2025), and the Antico et al. (2018) data for the Parana river at Rosario. Land surface evaporation is evaluated using three independent global datasets from the evapoRe v2.04 archive (Rahmati Ziveh et al., 2025): BESS (Li et al., 2023), TerraClimate (Abatzoglou et al., 2018) and CAMELS (Li et al., 2024), which provide complementary estimates based on satellite-driven energy balance models, climate-driven reconstructions and catchment-level water balance constraints.
The last stage of the evaluation focuses on land surface thermal behavior based on two datasets providing large-scale constraints. Soil temperature is assessed using the global product of Lembrechts et al. (2022), based on the SoilTemp database, which compiles in situ soil temperature time series with broad global coverage over recent decades. Monthly soil temperatures for the 0–5 cm layer, representing modern mean conditions, are produced at 1 km resolution by modelling soil–air temperature offsets with Random Forest models and combining them with gridded monthly 2 m air temperature fields from ERA5 for 1979–1981 and from ERA5-Land for 1981–2020. Data are regridded to a regular 1° grid using area-weighted averaging. Model results are compared over the 1979–2010 period to ensure consistency with the ERA5-based forcing and to limit interannual variability. To complement this near-surface information with deeper thermal dynamics, annual active-layer thickness is evaluated using observations from the Circumpolar Active Layer Monitoring (CALM) network, which provides long-term measurements of thaw depth across Arctic permafrost regions (Nelson et al., 2021).
Before analyzing the impact of DE16, DE25, and DE25c on the hydrological and thermal variables simulated by ISBA-CTRIP at the global scale, we first evaluate the three parameterizations against the in situ data collected in the companion paper Decharme (2025). Then, we examine the soil input fields used by the model. This analysis focuses on the vertical profiles of soil texture, organic carbon content, and bulk density provided by SoilGrids, and on their implications for the simulated soil physical properties. The objective is to document how these input profiles propagate into the soil property profiles diagnosed by the model under the different parameterization approaches, and to provide a consistent basis for the interpretation of the subsequent hydrological and thermal results.
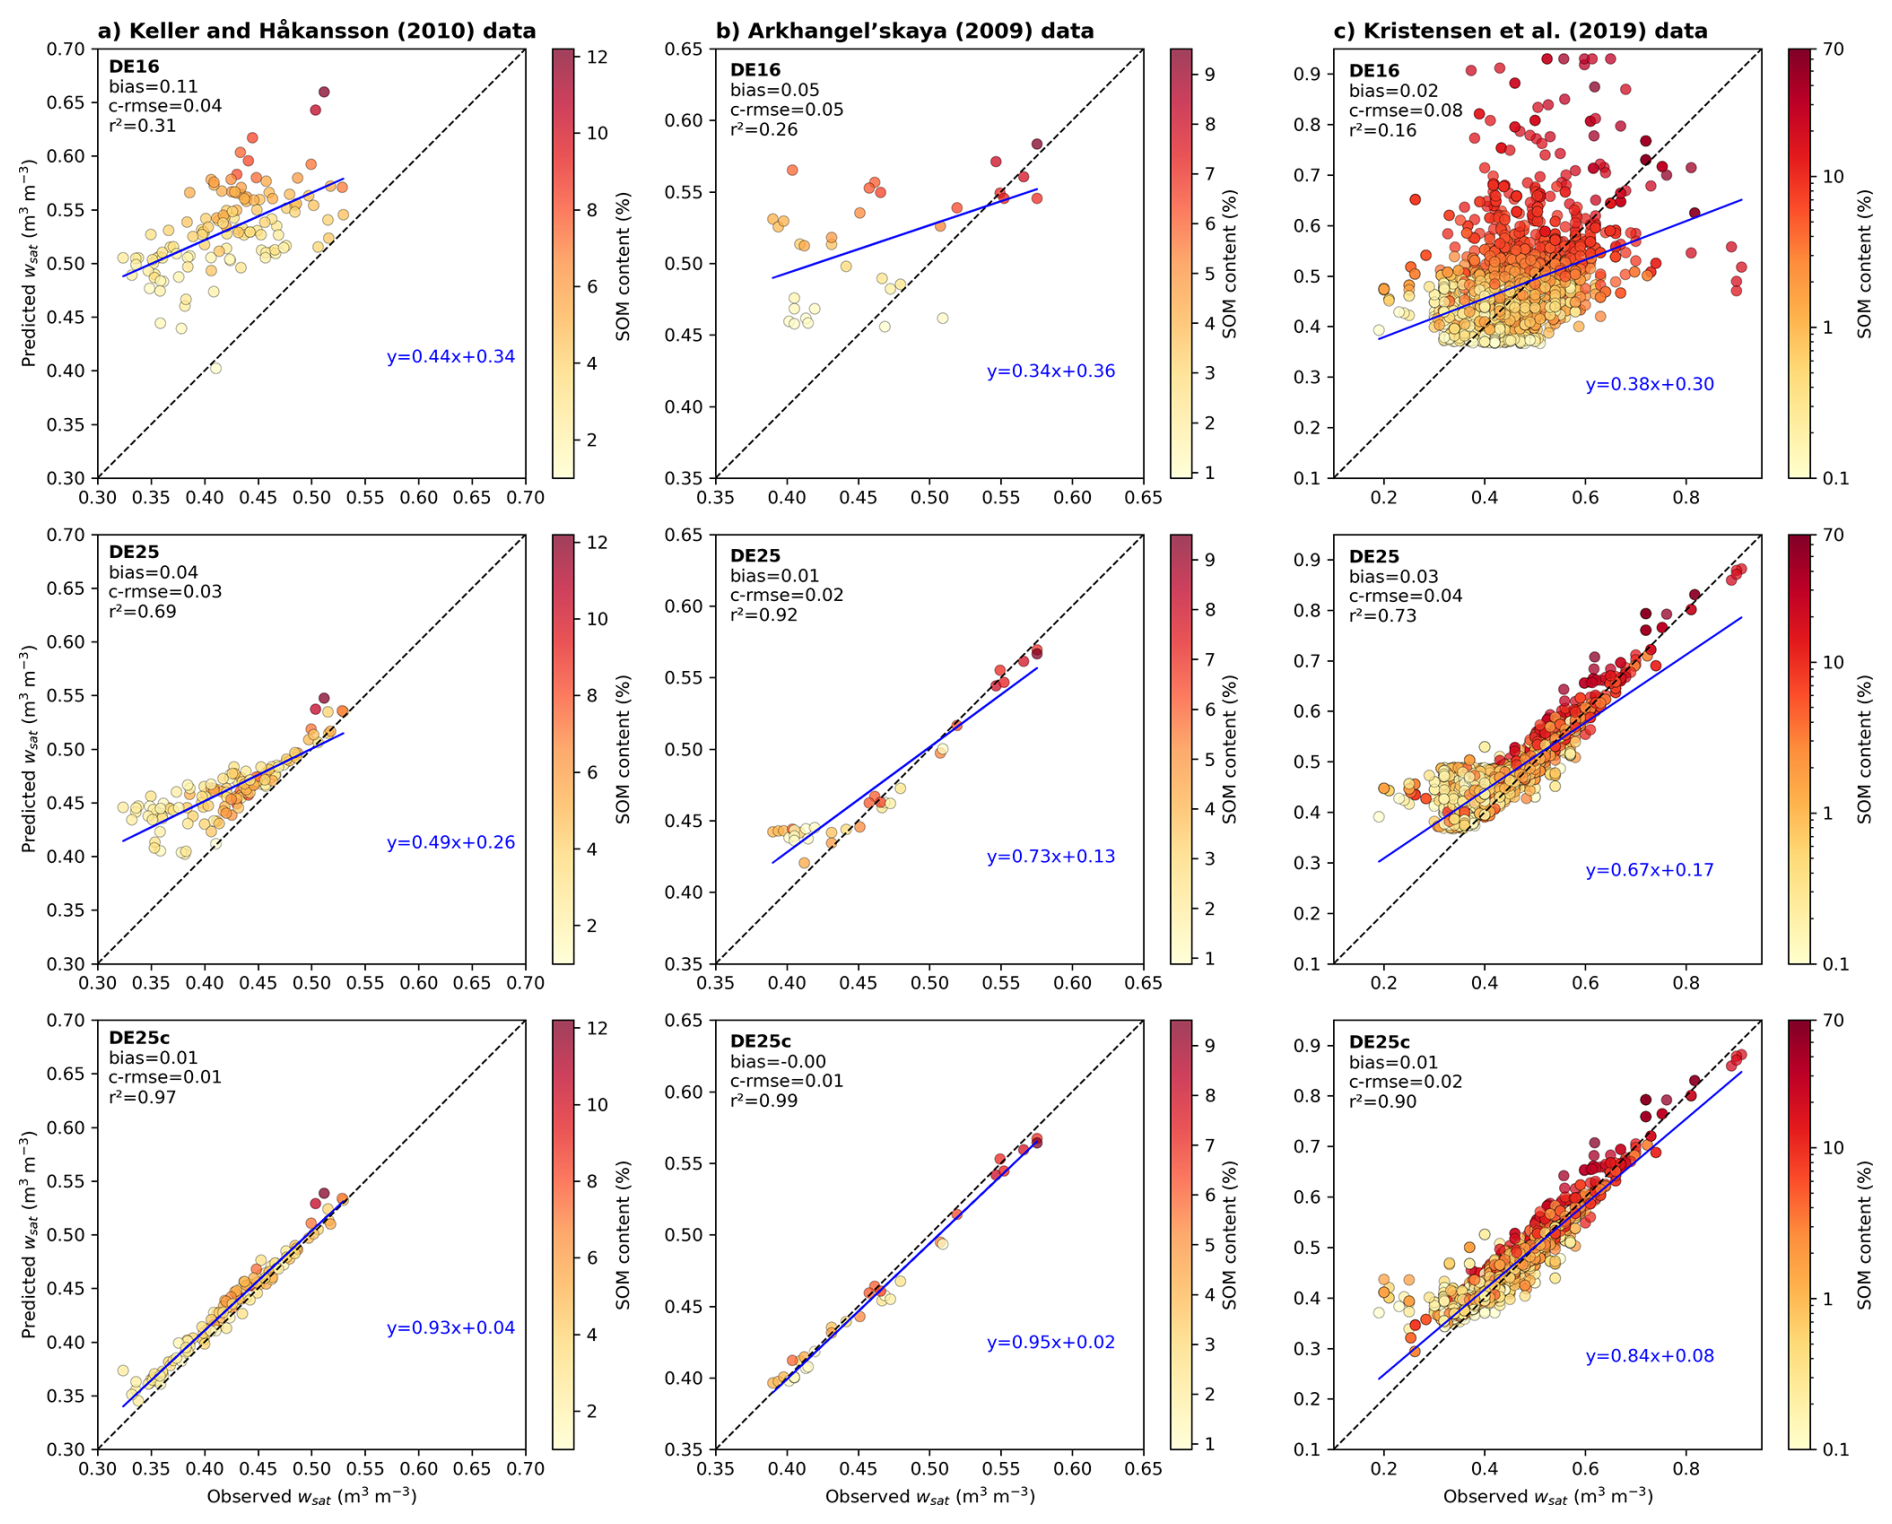
Figure 2Comparison of observed and predicted soil porosity by the three schemes DE16, DE25 and DE25c across the three in situ datasets already used in Decharme (2025): (a) Keller and Håkansson (2010), (b) Arkhangel'skaya (2009), and (c) Kristensen et al. (2019). The 1:1 line is shown in black, and the blue line represents the linear regression between predicted and observed values where its slope and intercept provide an additional measure of agreement. Finally, skill scores (bias, c-rmse and r2) are given for each panel.
3.1 Soil physical properties
3.1.1 Evaluation using porosity of natural soils
Following the approach adopted in Decharme (2025), Fig. 2 evaluates DE16, DE25, and DE25c using observed total porosities from the datasets of Keller and Håkansson (2010), Arkhangel'skaya (2009), and Kristensen et al. (2019). The regression equations together with the bias, c-rmse and r2 scores summarize the performance of each scheme. For DE16 (top row), all three datasets show a clear tendency to overestimate wsat, especially for samples with high SOM content. This confirms that the empirical DE16 approach is not suitable to represent organic soils, as already highlighted in the companion paper with the Lawrence and Slater (2008) scheme from which DE16 is derived.
As already shown in that paper, the DE25 scheme (middle row) substantially reduces these biases across the three datasets. However, a tendency to overestimate wsat remains for low-organic soils with the smallest observed porosities, consistent with the structural bias associated with the texture-based reference mineral porosity derived from the Cosby et al. (1984) PTF. With DE25c (bottom row), the use of gridded ρb as a field compactness constraint largely corrects this bias. The effect is particularly pronounced for samples with low SOM and high bulk density, where the mineral phase controls most of the total pore volume. In contrast, samples rich in organic matter are only weakly affected by this mineral-phase adjustment, which is consistent with a scheme that primarily acts on the mineral reference properties.
Overall, Fig. 2 shows that constraining the mineral reference state with field bulk density within the DE25 framework aligns modeled porosity with observations over a wide range of textures and organic matter contents. In addition, Figs. S1 and S2 in the Supplement, obtained using the same protocol as in the companion paper Decharme (2025), show that the DE25c adjustment also improves the simulation of the soil water retention curve and saturated hydraulic conductivity. These improvements are more modest than for wsat but confirm that the mineral soil compactness adjustment has a systematic positive effect on the representation of soil hydraulic properties. This supports the interpretation of DE25c as an adjustment toward an in situ compactness state for mineral-dominated soils, rather than as an attribution of the density increase to a specific compaction mechanism.
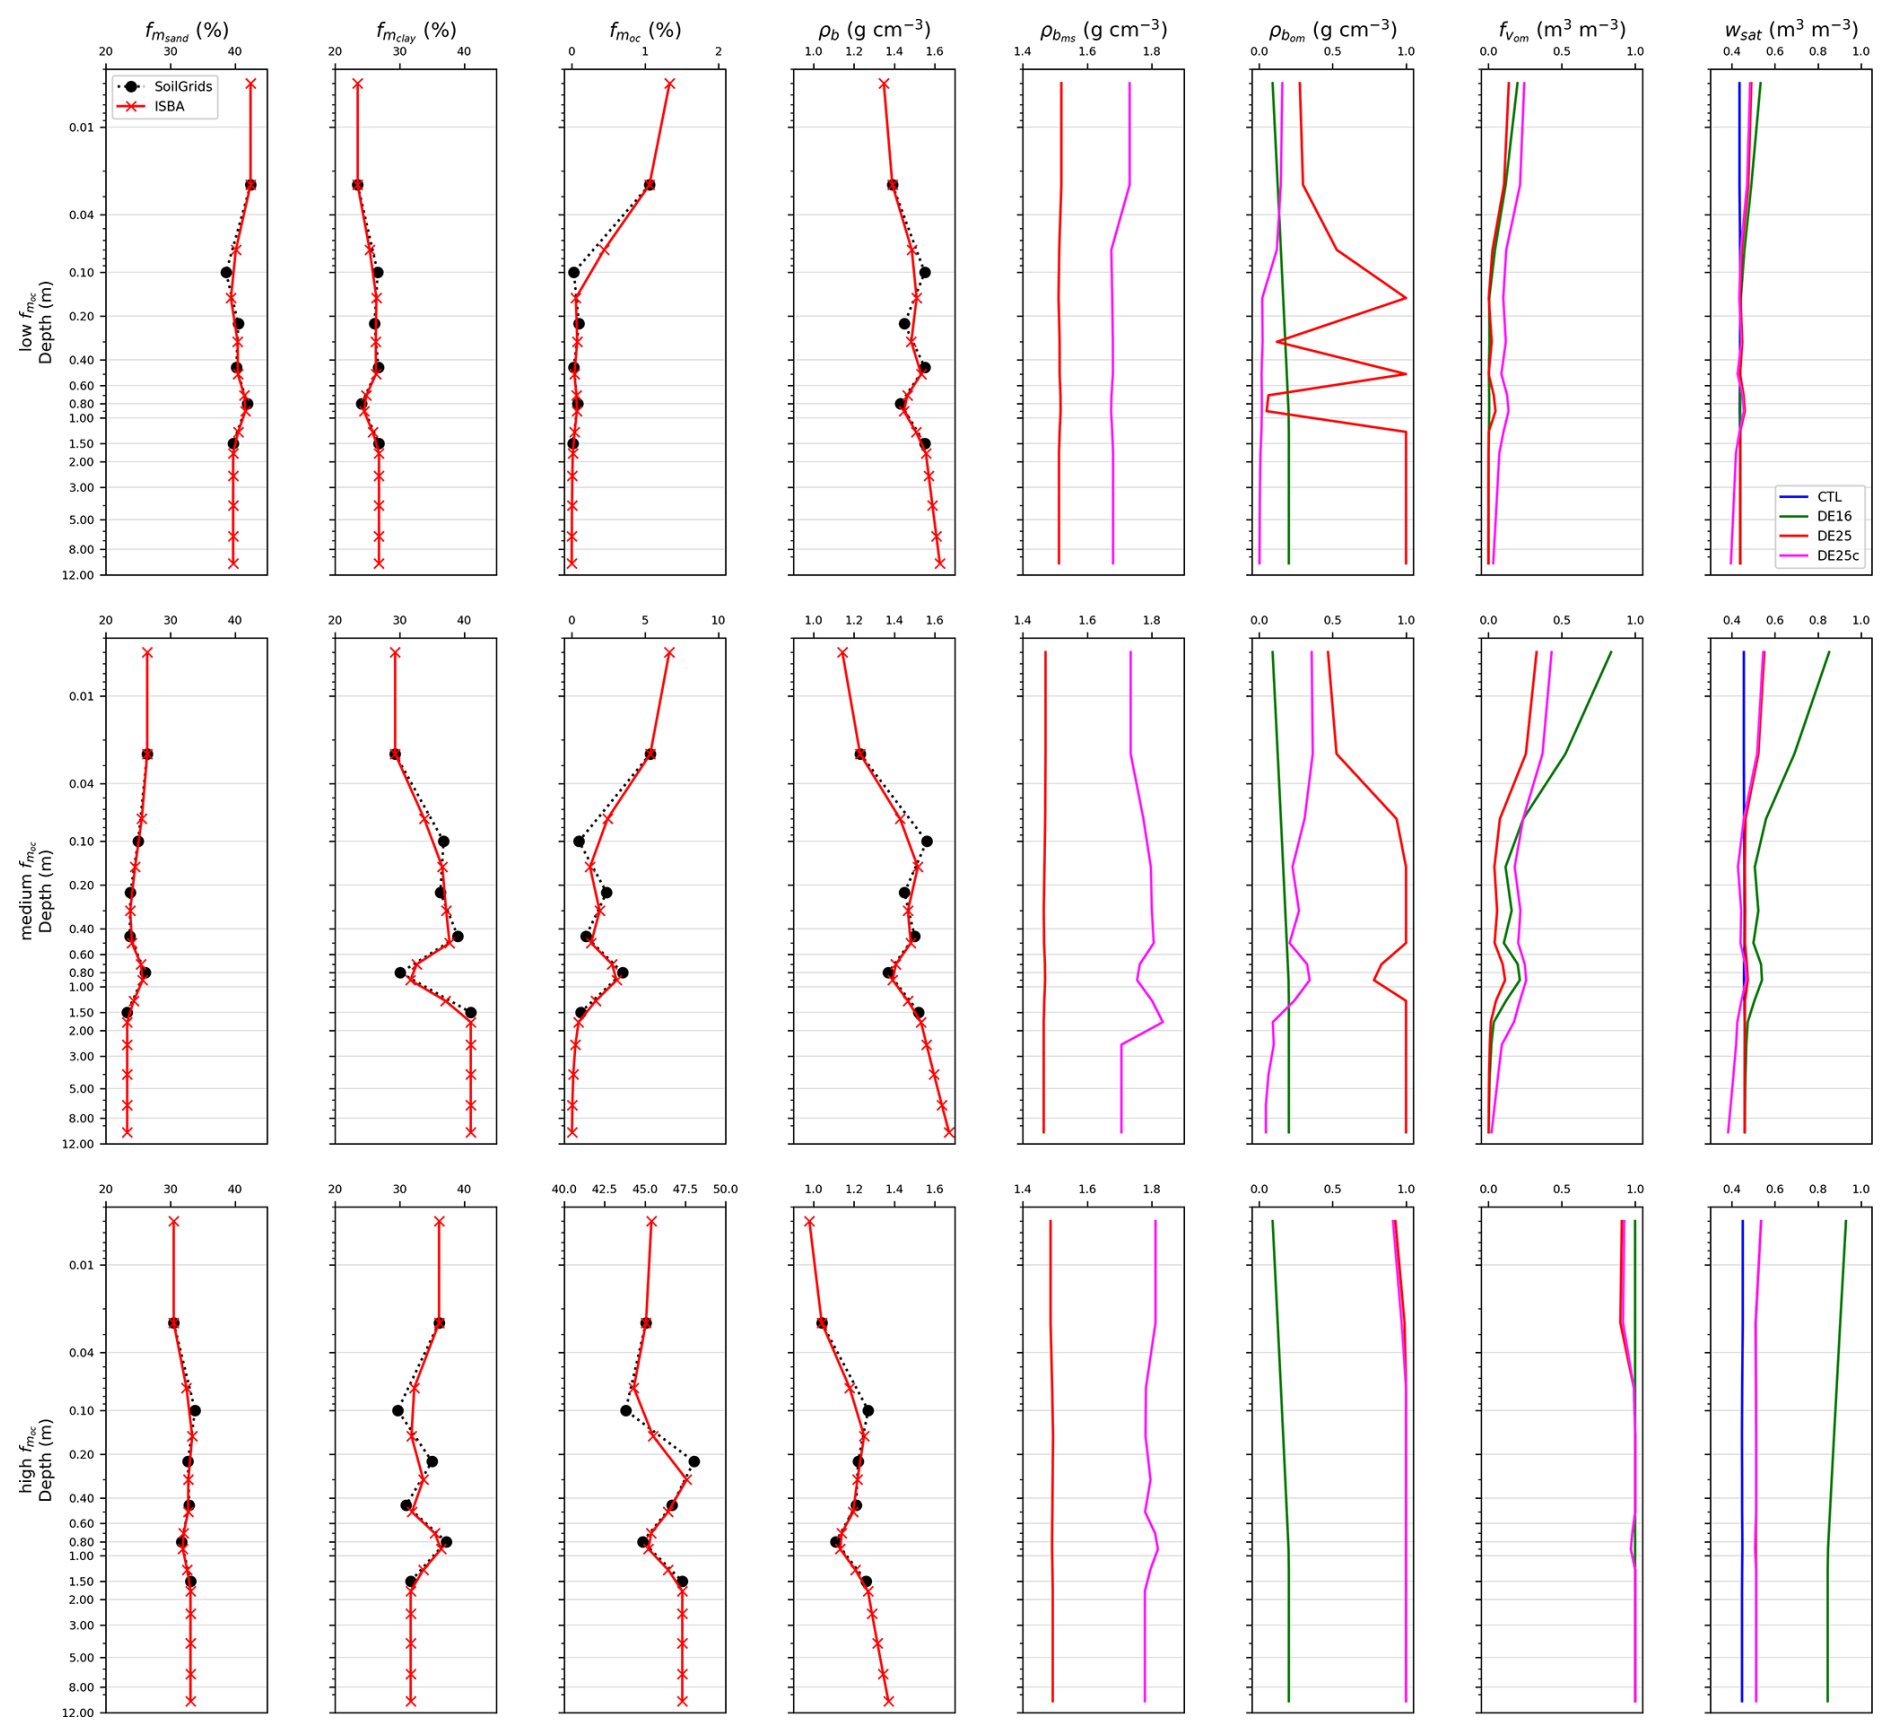
Figure 3Vertical profiles of soil properties derived from SoilGrids (black) and remapped onto the ISBA grid (red) for three representative locations. Each row corresponds to one profile selected to represent low, medium, and high total soil organic carbon content. Columns show the mass fractions (expressed in %) of sand (), clay (), and organic carbon (), as well as the dry bulk density (ρb expressed in g cm−3). SoilGrids values are provided at six standard horizons while the ISBA values are obtained by vertical interpolation and extrapolation onto the 14-layer soil discretization as described by Eqs. (8) and (9). The last four columns present the apparent bulk densities of mineral domain ( in g cm−3) and organic matter ( in g cm−3), the volumetric fraction of organic matter ( in m3 m−3), and the soil porosity (wsat in m3 m−3) profiles calculated for the three experiments CTL (blue), DE16 (green), DE25 (red), and DE25c (magenta).
3.1.2 Remapping of SoilGrids inputs and parameterization responses
After this site-scale evaluation against observed total porosity, we shift to a global perspective and examine how DE16, DE25, and DE25c behave when forced by SoilGrids. We analyze how the SoilGrids inputs control the modeled soil physical properties across the full soil profile. Figure 3 compares soil property profiles from SoilGrids with those interpolated and extrapolated onto the ISBA vertical discretization for three contrasting levels of organic matter content, representing a low-carbon soil, an intermediate soil, and an organic-rich soil. The first four columns show the mass fractions of sand (), clay (), and organic carbon (), together with bulk density (ρb). The texture profiles (sand and clay) largely preserve the structure provided by SoilGrids: the ISBA points (red crosses) fall between the SoilGrids horizon values (black circles) and reproduce the expected contrasts between the three soil types, while reflecting the vertical discretization specific to the model. The lines connecting the points in each dataset should therefore be viewed only as a visual aid. Because the vertical levels of SoilGrids and ISBA do not coincide exactly, the curves do not overlap point by point even when the interpolation is fully consistent. For organic carbon and bulk density, the SoilGrids to ISBA conversion follows the interpolation and extrapolation scheme described in the Land surface parameters section. Above the first SoilGrids level, values are extrapolated linearly to the surface, while at depth they are extended using a simple law that enforces a smooth evolution of the profiles with depth. This treatment produces smooth and physically plausible profiles for and ρb, without any obvious deviation from the input data. However, despite the strong contrasts in across the three profiles, ρb remains relatively similar across these soil types. As a result, the organic-rich profile exhibits bulk densities that are high compared with values commonly reported for organic-rich soils and peat horizons (Boelter, 1968, 1969; Rawls et al., 2003; Liu and Lennartz, 2019). This behavior suggests a limited sensitivity of the SoilGrids bulk density product to organic carbon content, which could bias the representation of organic soils in LSMs.
The next column in Fig. 3 shows mineral-phase bulk densities, and , diagnosed in DE25 and DE25c, respectively. For a given mineral texture, this reference mineral bulk density does not depend on SOM content, and remains similar across the three illustrative profiles. When mineral soil compactness adjustment is activated (DE25c), increases relative to (DE25) through the texture-dependent adjustment in Eq. (4). Consequently, because the low-carbon profile is less clay-rich than the other two profiles, the compactness adjustment seems weaker. However, this mineral-phase adjustment also propagates to the diagnosed organic-phase properties. In the mixing theory (DE25 and DE25c), is inferred from the pair together with through Eq. (2). Therefore, changes in induced by the mineral soil compactness adjustment directly affect the computed and, subsequently, other SOM-related volumetric diagnostics. The corresponding profiles therefore differ fundamentally between parameterizations (DE16, DE25, and DE25c), as shown next in Fig. 3. In DE16, is prescribed as a simple depth-dependent profile, increasing from about 90 to 200 kg m−3 from the surface to deeper layers (Table 1), and is therefore nearly identical for the three soils. In contrast, DE25 and DE25c diagnose from SoilGrids bulk variables, yielding profiles that vary across soils and with depth. For non-negligible organic mass fractions, higher organic carbon content is generally associated with lower diagnosed , whereas low-organic soils exhibit more homogeneous and denser organic-phase profiles. In DE25c, the increase in propagates through Eq. (2) and tends to reduce relative to DE25 for a given pair. It also reduces the frequency with which the numerical safeguard of Eq. (3) is triggered, thereby reducing the occurrence of bound-saturated values. Indeed, for very small , the inversion in Eq. (2) becomes ill-conditioned when ρb approaches (or ), so that analytical values can fall outside physical ranges and are constrained to prescribed bounds (1 and 1000 kg m−3). These saturation cases have negligible impact on bulk soil properties because the organic mass fraction is vanishingly small. For the highly organic profile (bottom row in Fig. 3), large values combined with relatively high ρb can also force Eq. (2) toward high values, sometimes reaching the upper bound, which is not representative of peat horizons. This illustrates how inconsistencies in the pair provided by SoilGrids can propagate into the inferred organic-phase properties.
The diagnosed provides the last ingredient needed to compute the volumetric organic matter fraction, . We therefore examine the resulting vertical profiles derived from the remapped inputs in Fig. 3. All three parameterizations exhibit a common vertical structure, with maximum values near the surface and a progressive decrease with depth, together with clear contrasts between low-, intermediate-, and high-organic soils. This structure is primarily controlled by the SoilGrids and, to a lesser extent, ρb profiles. Systematic differences nevertheless arise from the formulation of each scheme. In DE16, depends on a prescribed empirical profile, which introduces a vertical structure not solely constrained by SoilGrids. For instance, in the middle panel, very low near-surface values can yield values close to 1 m3 m−3 even when remains around 0.06 kg kg−1. By contrast, in DE25, exhibits a vertical structure directly constrained by the input soil properties, which leads to near-surface values that better remain consistent with the initial levels across horizons. In DE25c, the increase in the mineral bulk density implies, through Eq. (2), a decrease in , which translates into systematically larger than in DE25, with a stronger effect in clay-rich horizons. This is consistent with the fact that a denser mineral domain implies a larger inferred organic volumetric contribution for a given bulk density. This compensation is a direct consequence of using the grid-scale ρb as a constraint in the mixture inversion: increasing reduces the mineral pore volume, but it also increases the inferred weight of the organic component in the bulk soil properties.
The rightmost column in Fig. 3 shows the total soil porosity, wsat, resulting from the four parameterizations. In the CTL experiment, soils are purely mineral and wsat follows the texture-driven PTF of Cosby et al. (1984), leading to weak variations with depth and only modest differences between the three profiles. In all mineral–organic mixture experiments, wsat is obtained through an arithmetic mixing of mineral and organic porosities weighted by , so that organic-rich horizons exhibit higher porosity than CTL and wsat decreases with depth as the influence of organic matter weakens. DE16 exhibits the largest increase in wsat in the presence of SOC, whereas DE25 produces more moderate values that remain closer to mineral porosity at depth. In DE16, the increase is amplified by the prescribed low near-surface , which boosts . It is further enhanced by the high prescribed value of (Table 1). This behavior is consistent with the site-scale evaluation against observed total porosity (Fig. 2) and with the results reported in Decharme (2025). When the mineral soil compactness adjustment is included (DE25c), the reduction of mineral porosity tends to lower wsat relative to DE25, especially in fine-textured and organic-poor horizons, while the contrast between organic-rich surface layers and mineral-dominated deeper layers remains similar. However, because the same adjustment also increases the inferred for a prescribed ρb, the net change in bulk wsat can remain limited when the increased organic contribution partly compensates for the lower mineral porosity. For the highly organic profile (bottom row in Fig. 3), DE25 and DE25c yield wsat values that remain close to CTL, which is difficult to reconcile with the high porosities typically associated with peat horizons (Boelter, 1968, 1969; Liu and Lennartz, 2019). This is consistent with the limitations discussed above for the SoilGrids pair , since large combined with relatively high ρb can lead to high diagnosed . In DE25 and DE25c, the organic porosity decreases linearly as increases (Table 1) using the PTF of Liu and Lennartz (2019). Therefore, high implies low organic porosity, which limits the increase in wsat even under organic-rich conditions.
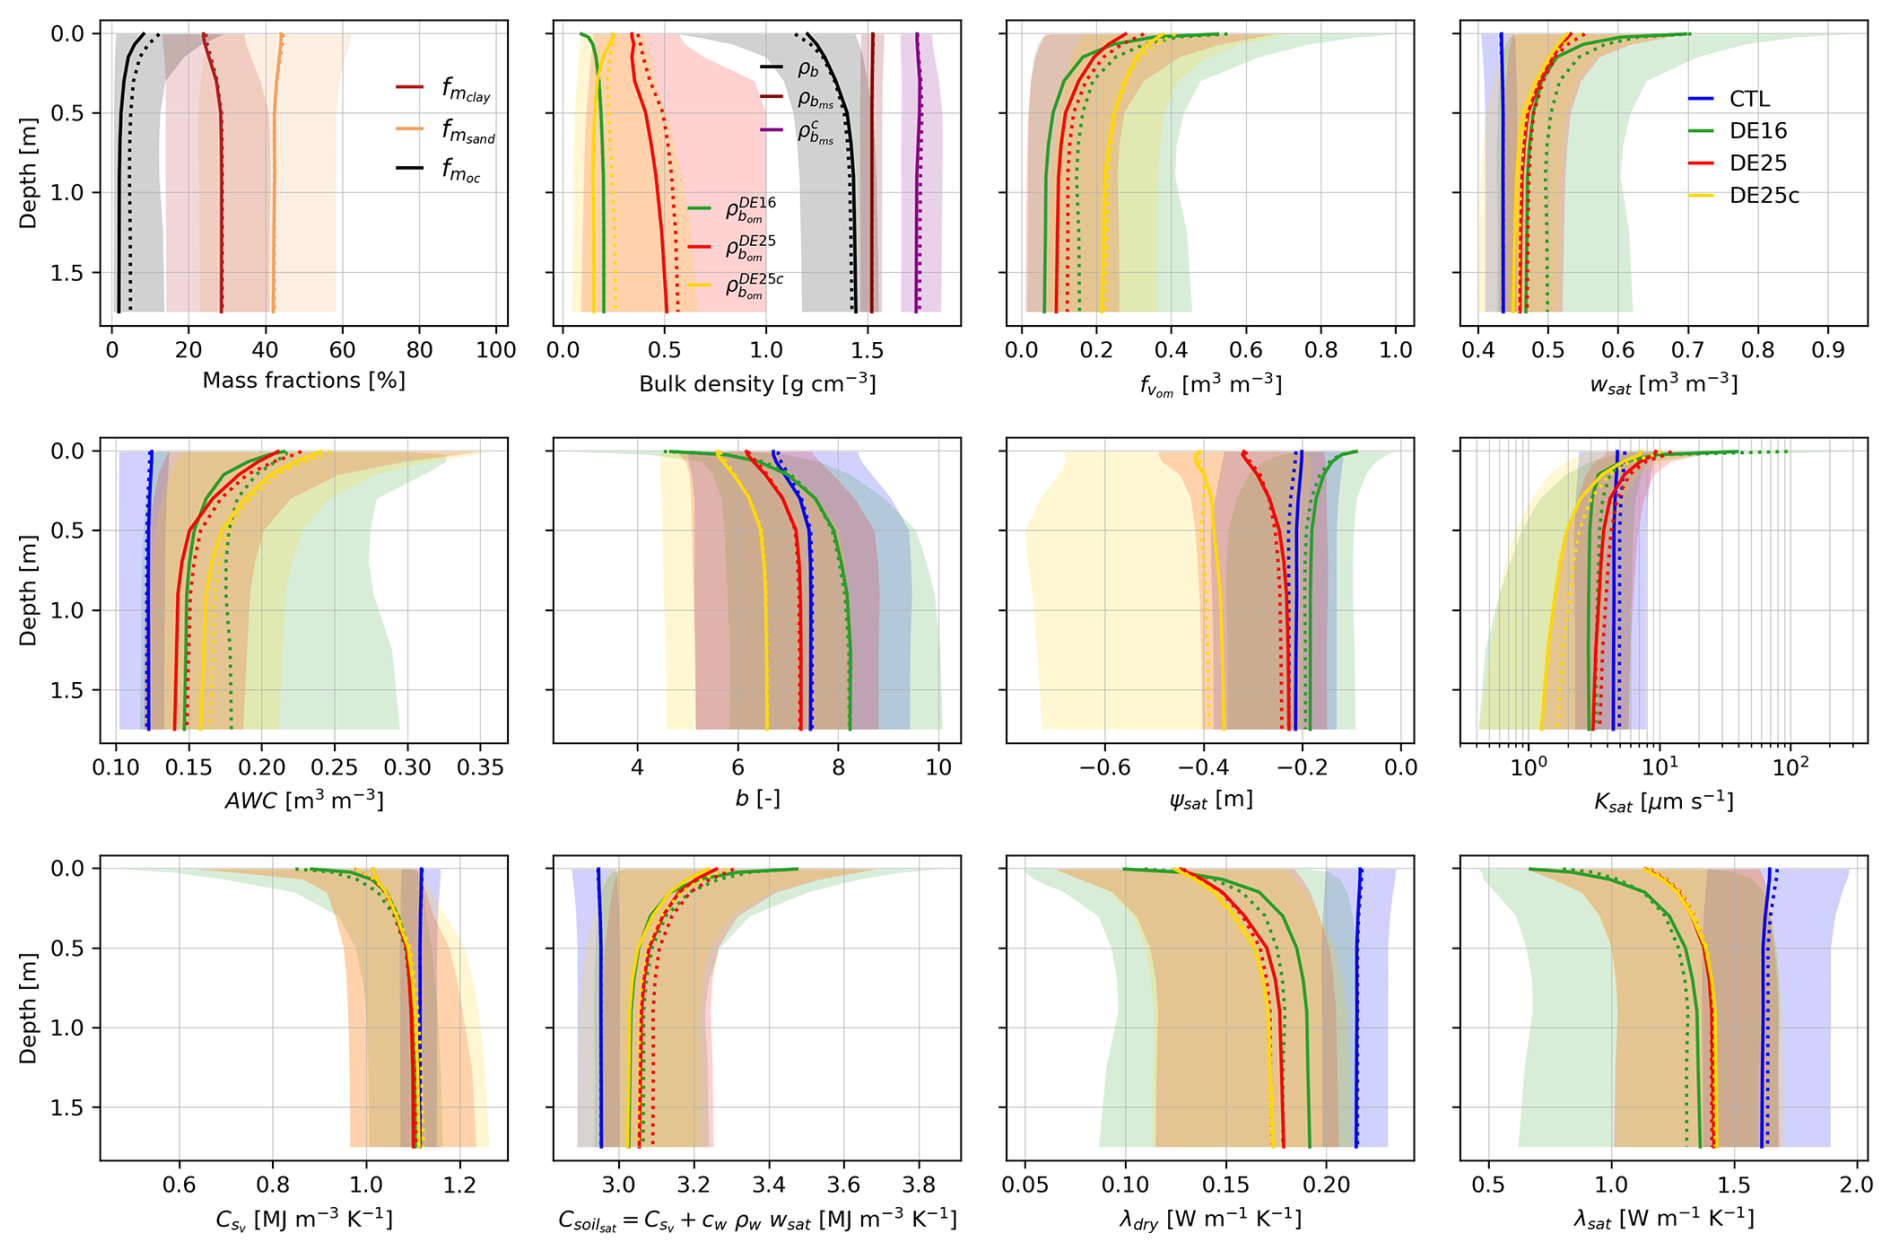
Figure 4Global distributions of vertical profiles over the upper 2 m of the ISBA soil column, showing SoilGrids parameters (, , , and ρb), the derived phase-specific bulk densities (, , and ), and hydrological and thermal variables diagnosed in CTL, DE16, DE25, and DE25c. At each depth (positive downward), shaded envelopes indicate the 10th to 90th percentiles across land grid cells, solid lines show the median, and dashed lines show the mean. Variable definitions are provided in Fig. 3 and Table B1.
3.1.3 Global distributions
Figure 4 shifts from the profile-scale perspective of Fig. 3 to a global view, showing distributions of vertical profiles over the upper 2 m of the ISBA soil column for CTL, DE16, DE25, and DE25c. At each depth, shaded envelopes denote the 10th–90th percentiles across land grid cells, with solid and dashed lines indicating the median and mean, respectively. Global spatial patterns of the SoilGrids input variables at five representative depths are shown in Fig. S3 in the Supplement. Globally, soils are more sand-rich than clay-rich, with sand slightly decreasing and clay increasing downward. The organic carbon mass fraction decreases sharply with depth in the near-surface layers and shows a strongly right-skewed distribution throughout the profile, as indicated by mean values exceeding the median. This reflects the presence of organic-rich hotspots with very high , mainly located in boreal peatlands, permafrost-affected landscapes, and parts of the humid tropics (Fig. S3 in the Supplement). Bulk density ρb shows an opposite vertical tendency to . A pronounced near-surface asymmetry is observed, with mean values lower than the median. This indicates a few grid cells with particularly low surface ρb, coinciding with organic-rich hotspots. With depth, the mean and median converge, the distribution becomes less skewed and more spatially homogeneous, and ρb remains high nearly everywhere (Fig. S3 in the Supplement). Together with the profile-scale analysis in Fig. 3, this persistence of high ρb at depth in organic-rich regions supports the presence of inconsistencies in the SoilGrids pair.
The mineral-phase bulk density , diagnosed from Eq. (1), is systematically higher than the total bulk density ρb, while the organic-phase density is systematically lower, as expected for a two-domain mixture in which a low-density organic fraction lowers ρb relative to the mineral phase. This provides an internal consistency check for the DE25 approach based on the soil mixture theory. shows weak vertical variations and limited spatial variability (Fig. S4 in the Supplement). This reflects its dependence on moderately variable mineral solid-phase densities (Ruehlmann, 2020; Decharme, 2025) and on the limited variability of mineral saturated porosity from the Cosby et al. (1984) PTF, as shown by the CTL wsat distribution. The mineral soil compactness adjustment (DE25c) shifts to higher values and the spread increases slightly compared to . This enhanced variability arises from texture-dependent contrasts in mineral soil compactness, with fine-textured regions with low sand fractions exhibiting the strongest adjustments, as shown by the lowest compactness ratios, (Fig. S4 in the Supplement). Averaged over land, this ratio remains close to 0.87 across depths, corresponding to an average mineral-phase densification of about 13 %. This value is close to reported optimum degrees of compactness (Håkansson, 1990; Håkansson and Lipiec, 2000; Keller and Håkansson, 2010) but the comparison is only indicative because the ratio considered here applies to the mineral reference phase, not to total bulk soil density. It should therefore be interpreted as a qualitative benchmark for the magnitude of the DE25c adjustment, not as a direct estimate of the bulk-soil degree of compactness.
The spatial volumetric signature of organic matter primarily reflects the latitudinal imprint of SoilGrids , with maxima at high northern latitudes (Fig. S5 in the Supplement). Following the mechanisms described in Fig. 3, its amplitude and vertical decay are modulated by the spatial distribution and vertical profiles, which differ across parameterizations. In DE16, is prescribed as an idealized depth-dependent profile and therefore shows no spatial variability. This reflects the empirical, non data-driven nature of the formulation, inherited from the ISBA implementation of the Lawrence and Slater (2008) approach and already discussed in detail in Decharme (2025). It yields very high near-surface and a sharp decrease with depth, together with a broad 10th–90th percentile envelope consistent with persistent localized organic-rich hotspots (Fig. S5 in the Supplement). In DE25, is comparatively high, which directly reduces through the mass volume relationship used in the mixture framework. Its mean increases from about 370 kg m−3 near the surface to nearly 570 kg m−3 at depth, above the ∼ 260 kg m−3 reference value derived by applying the mixing theory to companion in situ observations (Decharme, 2025). This difference mainly reflects very low conditions over large regions, where Eq. (2) may become ill-conditioned and require a numerical safeguard applied to in the computation of (Eq. 3). This safeguard prevents numerical divergence in the diagnostic calculation when the SOM mass fraction tends toward zero. Its influence on effective bulk properties remains limited because the affected grid cells combine low , high ρb, and high or regularized , which yields small through the mass-volume relationship. Indeed, the activation of this numerical safeguard is shown by the hatching in the panels of Fig. S4 in the Supplement and in the resulting panels of Fig. S5 in the Supplement. In DE25, the numerical safeguard affects 0.97 %, 1.88 %, 9.98 %, 14.04 %, and 15.67 % of valid land grid points at 0.5, 7, 50, 90, and 175 cm depth, respectively. In DE25c, the corresponding fractions are 0 %, 0 %, 0.12 %, 1.11 %, and 1.59 %. The affected DE25 grid points are mainly located in desert areas and other low-SOC regions. They are characterized by low SOC contents, with median decreasing from 0.0103 kg kg−1 near the surface to 0.0041 kg kg−1 at 175 cm, and by dense soils, with median ρb close to 1.55 g cm−3 across the selected depths. Together with the high diagnosed , these conditions result in small volumetric organic matter fractions, with median decreasing from 3.45 % to 1.43 %. In DE25c, affected grid points occur only from 50 cm downward, with median values between 0.0027 and 0.0042 kg kg−1 and median ρb values between 1.69 and 1.73 g cm−3, resulting in median values between 1.09 % and 1.59 %. These values confirm that the numerical safeguard is only activated in low-SOC, mineral-dominated conditions, with limited influence on bulk properties. The mineral soil compactness adjustment in DE25c further shifts downward and reduces spatial extremes through weaker activation of the numerical safeguard in Eq. (3), yielding a mean profile of ∼ 250 kg m−3 closer to the expected range. As a result, is slightly higher than in DE25, while its spatial imprint remains largely unchanged. In permafrost-affected landscapes, inconsistencies in the SoilGrids (, ρb) pair, with high and relatively large ρb at depth, yield large diagnosed values in both DE25 and DE25c. As a result, the SOM volumetric imprint vanishes with depth in regions where a more persistent volumetric signature of organic matter would be expected (Fig. S5 in the Supplement).
We now examine on Fig. 4 the response of soil hydrothermal parameters. In pure mineral soil (CTL), the profiles are weakly variable in space and with depth, consistent with PTFs driven by mineral texture only. Accounting for organic matter mainly increases near surface heterogeneity and introduces clearer vertical gradients. The bulk soil porosity wsat and the available water capacity defined as increase in the upper layers over organic rich regions (Figs. S6 and S7 in the Supplement) and their distributions widen, while deeper layers tend to remain closer to CTL. The response of the retention parameters b and ψsat is difficult to generalize because it differs strongly across parameterizations (Figs. S8 and S9 in the Supplement), whereas the saturated hydraulic conductivity ksat shows a more systematic vertical structure, increasing in the upper organic-influenced horizons and becoming lower than CTL in deeper mineral-dominated layers (Fig. S10 in the Supplement). The bulk soil volumetric heat capacity becomes more moisture dependent, with lower values in dry conditions and higher values in wet conditions, mainly near the surface over organic-rich regions (Figs. S11 and S12 in the Supplement). Thermal conductivities decrease across most regions and depths regardless of moisture regime (Figs. S13 and S14 in the Supplement), consistent with the insulating effect of SOM.
DE16 yields the highest near-surface wsat and the broadest global distributions. DE25 shows a more moderate and spatially smoother response. The wsat increase is mainly confined to the near surface and relaxes rapidly toward mineral-like values with depth. These behaviors are consistent with the previously identified contrasts in and , which modulate the computed wsat through the porosity mixing rule. For retention parameters, DE16 produces strong vertical structures with very low near-surface b and ψsat that increase with depth. DE25 shows a more moderate, spatially homogeneous response. b remains close to CTL, with only a slight shift toward lower values. ψsat responds more strongly and with opposite sign to DE16, with more negative near-surface values over organic-rich regions that relax toward mineral-like values with depth. This contrast illustrates the uncertainty associated with empirical SOC-based parameterizations such as DE16, and reflects the difference between prescribed organic hydraulic profiles in DE16 and density-dependent organic hydraulic relationships in DE25. Finally, the mineral soil compactness adjustment (DE25c) has secondary global effects. It reduces mineral porosity and can locally yield lower wsat than CTL in organic-poor regions with low sand fractions and higher fine-particle contents. It also modifies retention parameters, with a small effect on b and a stronger effect on ψsat, owing to the larger exponent in Eq. (6b) than in Eq. (6a). As a result, AWC is slightly higher than in DE25 because these compactness-driven changes affect wwilt more than wfc. ksat is also reduced relative to DE25 through the mineral adjustment in Eq. (7). The decrease is modest near the surface and larger in the deepest layer, indicating that the mineral soil compactness adjustment mainly limits saturated conductivity in fine-textured, organic-poor deep horizons while preserving the large-scale pattern of SOM-driven regional contrasts. The impact of DE25c remains globally secondary for thermal diagnostics, but it can locally increase thermal conductivities in low-sand, low-SOC regions.
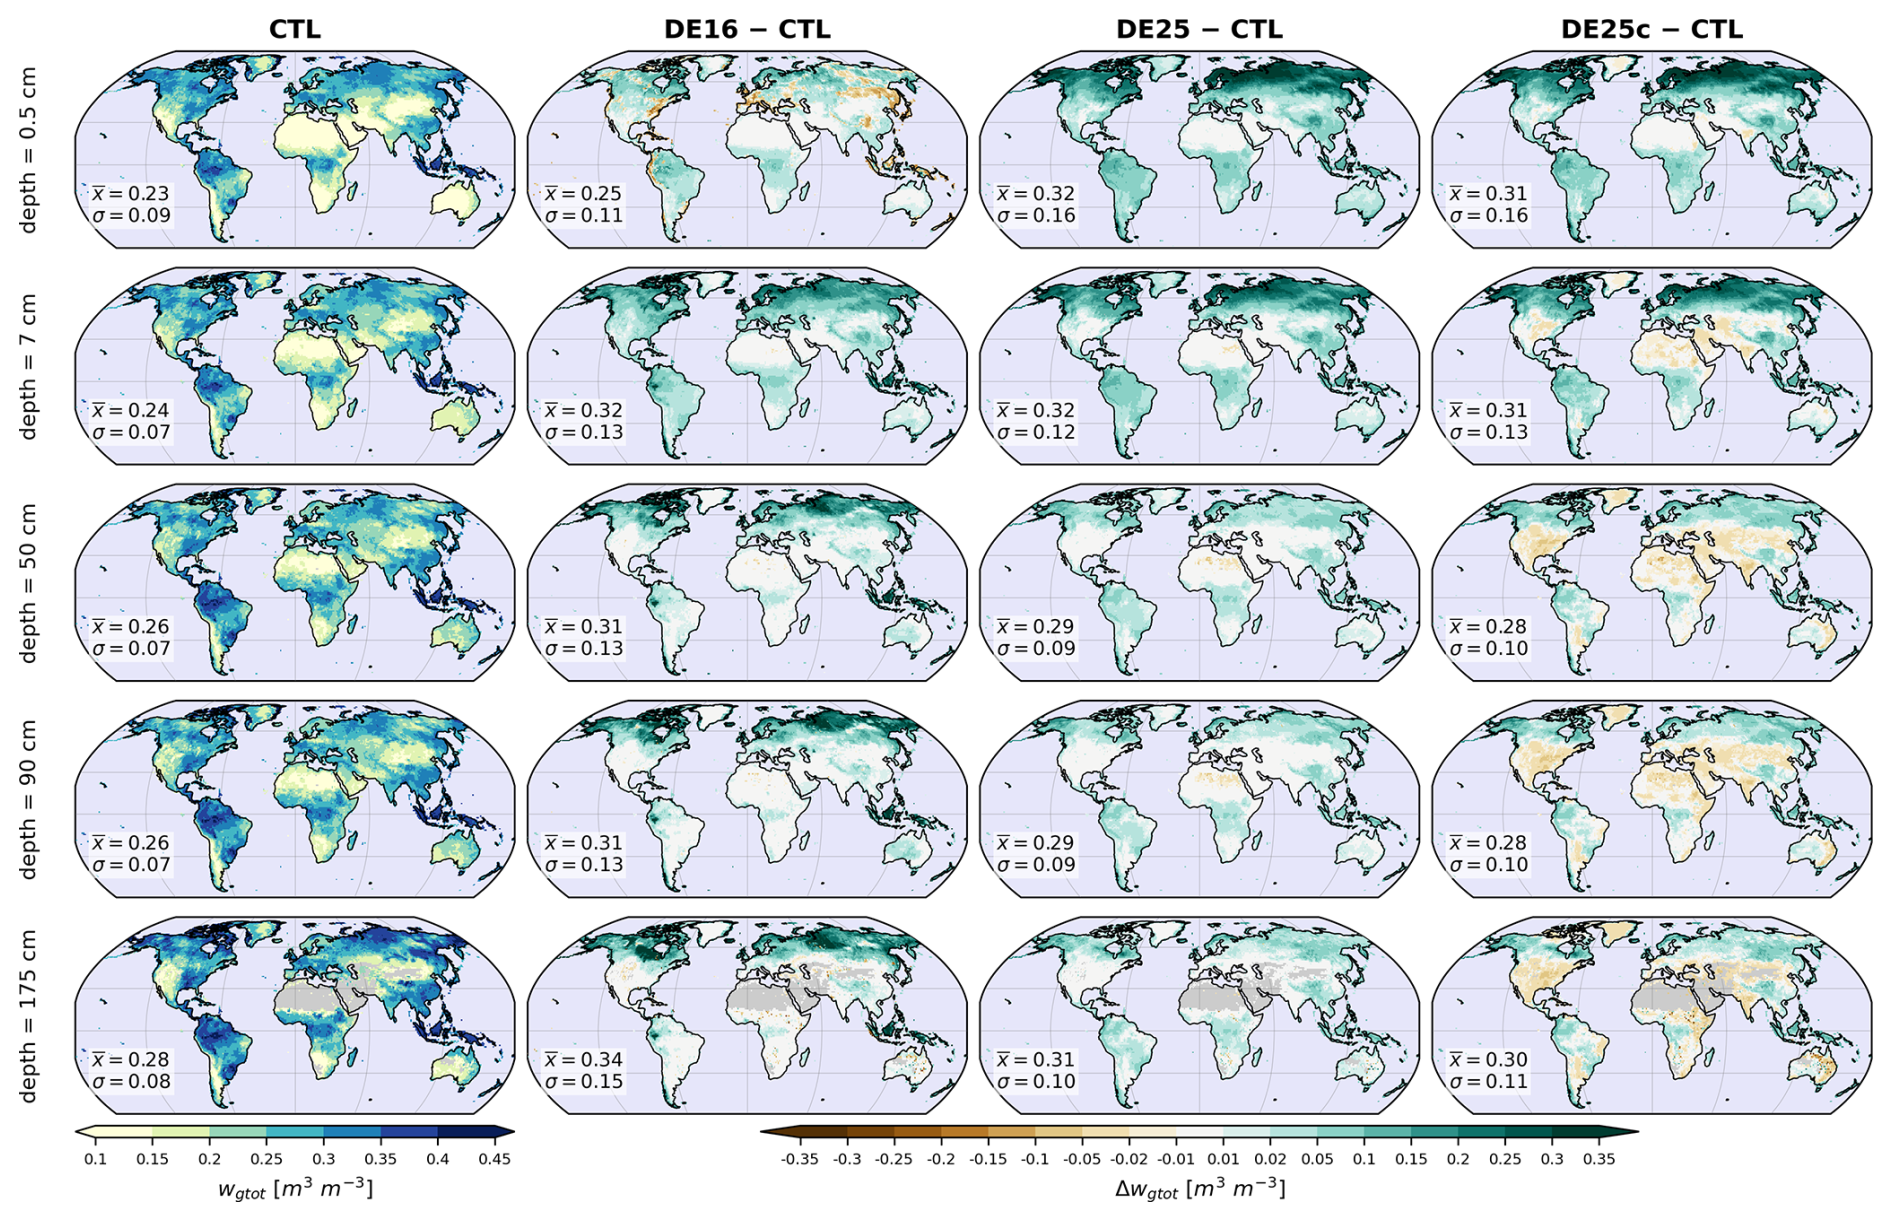
Figure 5Global distributions of the ISBA soil total water content, wgtot (m3 m−3), averaged over the 1979–2010 period, and shown at five representative depths of the soil profile (0.5, 7, 50, 90, and 175 cm). The first column shows wgtot in the mineral control experiment (CTL). The three other columns show differences relative to CTL, , for DE16, DE25, and DE25c. For each map, the inset reports the spatial mean and standard deviation σ over land points for the corresponding experiment (not for the differences). Gray-shaded regions indicate grid points where soil moisture is no longer simulated at the corresponding depth in ISBA due to shallower soil columns.
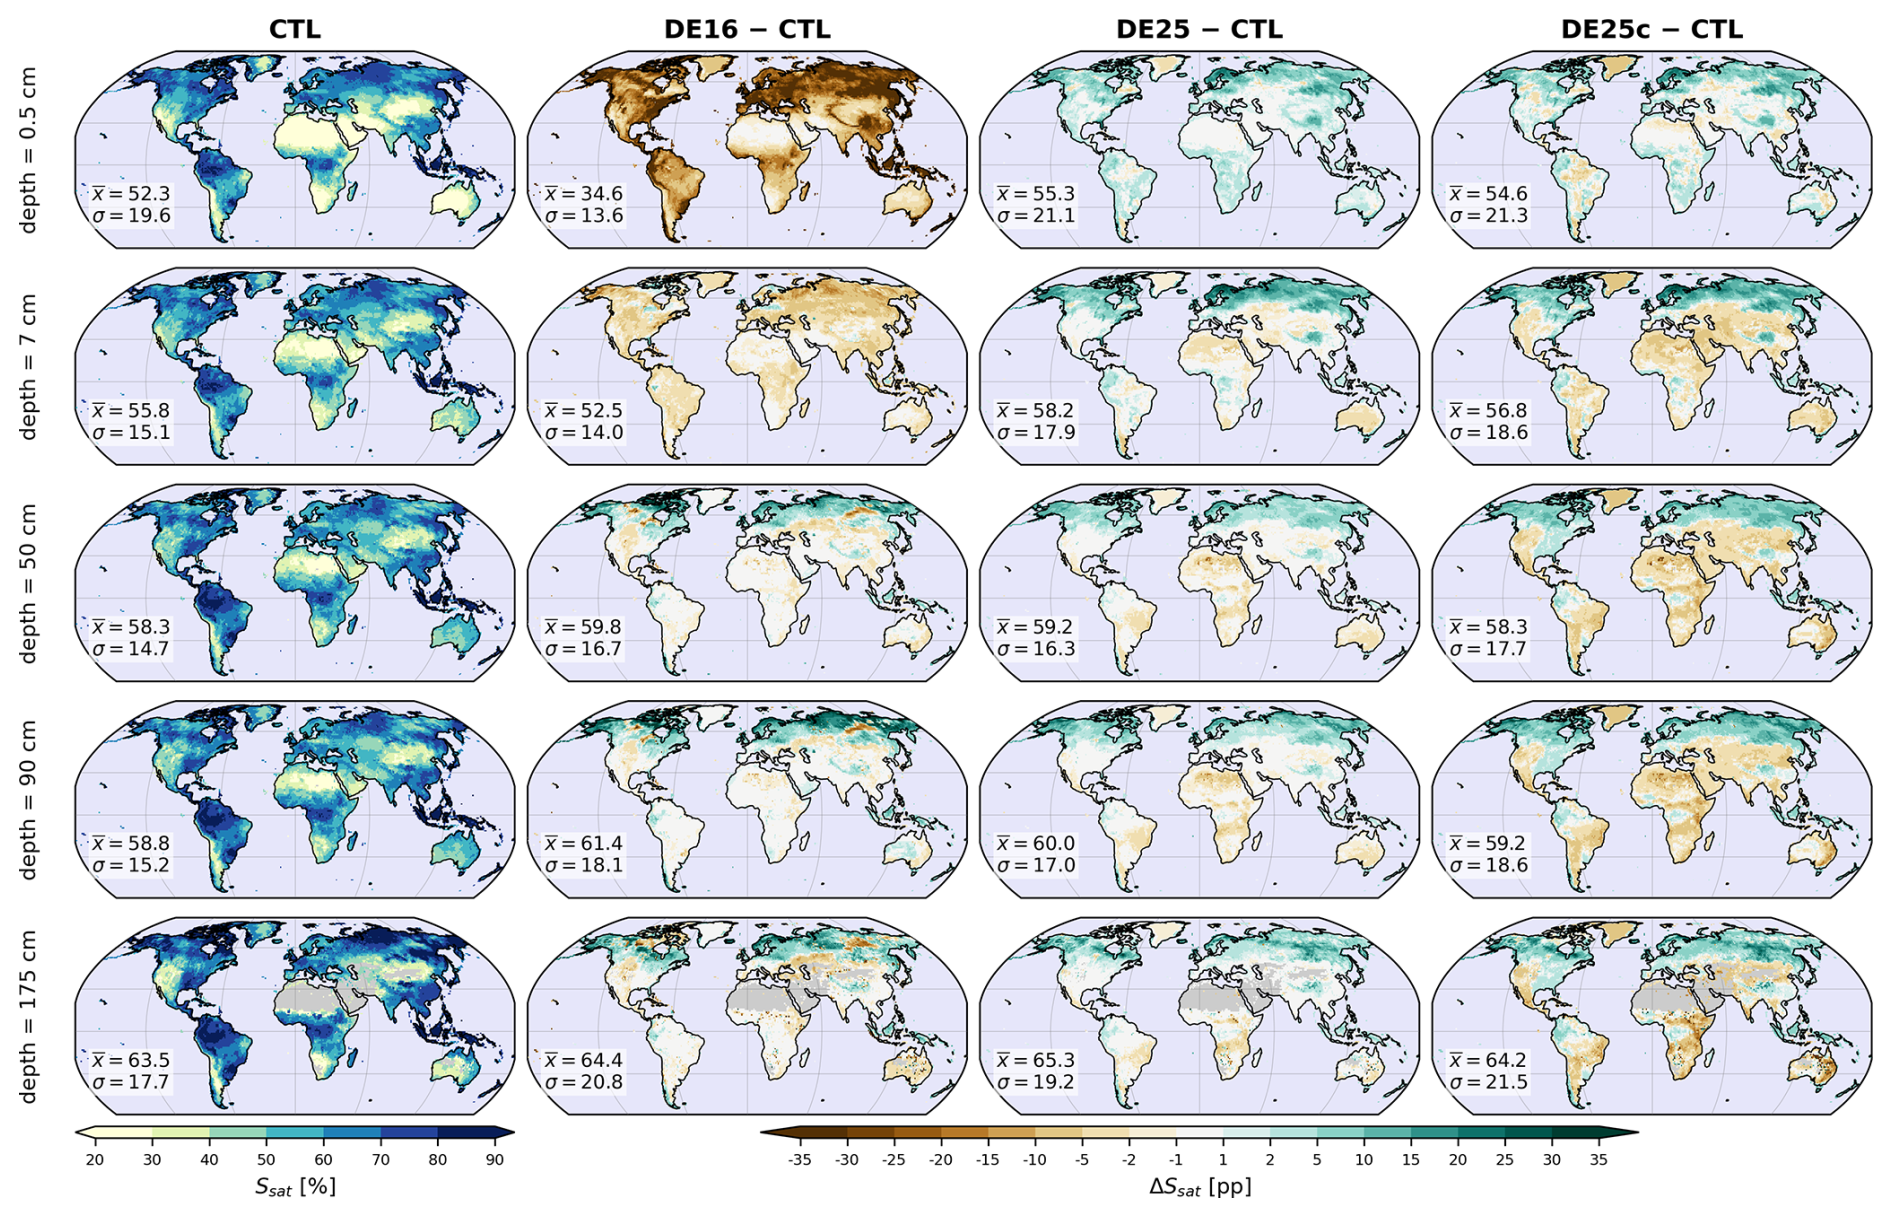
Figure 6As in Fig. 5 but for the ISBA soil saturation degree, , expressed in %. Differences relative to CTL, ΔSsat, are expressed in percentage points (pp).
3.2 Land surface hydrological impacts
These changes in soil parameters induced by mineral–organic mixing translate into systematic shifts in simulated soil water storage, which we quantify using the soil total water content wgtot. Figure 5 shows 1979–2010 climatologies of wgtot at five depths and the corresponding anomalies relative to CTL for DE16, DE25, and DE25c. In purely mineral soils (CTL), wgtot generally increases with depth, consistent with a larger contribution of fine-textured horizons in deeper layers (Fig. 4). All mineral–organic mixture experiments increase wgtot over most regions, with the strongest response in shallow layers of organic-rich areas. These results indicate that accounting for SOC modifies the mean water storage along the soil column. Despite different parameterization approaches, empirical for DE16 and physically constrained for DE25, both configurations produce broadly similar spatial patterns of change, but they differ in their vertical contrast. In organic-rich regions, DE16 increases wgtot preferentially in deeper layers, whereas DE25 enhances wgtot mainly in near-surface layers. This contrast is more clearly highlighted by the saturation degree (Fig. 6). Under DE16, Ssat strongly decreases in the upper soil layers even though wsat increases. This response indicates that the mean hydric state of the soil remains relatively far from saturation despite an increased storage capacity. It is consistent with very low ψsat and high ksat (and, to a lesser extent, lower b), which shift the retention curve toward lower effective saturations and facilitate gravitational drainage, thereby limiting the increase of wgtot in the upper layers in the 1979–2010 climatology. In contrast, under DE25, higher wsat in the upper soil layers is accompanied by higher Ssat, which corresponds to the expected behavior of a soil enriched in organic matter relative to a mineral soil. This indicates a stronger adjustment of wgtot toward higher water contents, consistent with higher values of ψsat that enhance retention and compensate for the effect of near-surface elevated ksat, while b is only weakly affected. Finally, the mineral soil compactness adjustment (DE25c) tends to slightly reduce wgtot relative to DE25 in regions poor in organic matter, consistent with an increase in AWC compared to DE25 and with a slight increase in evapotranspiration, as discussed in the following section.
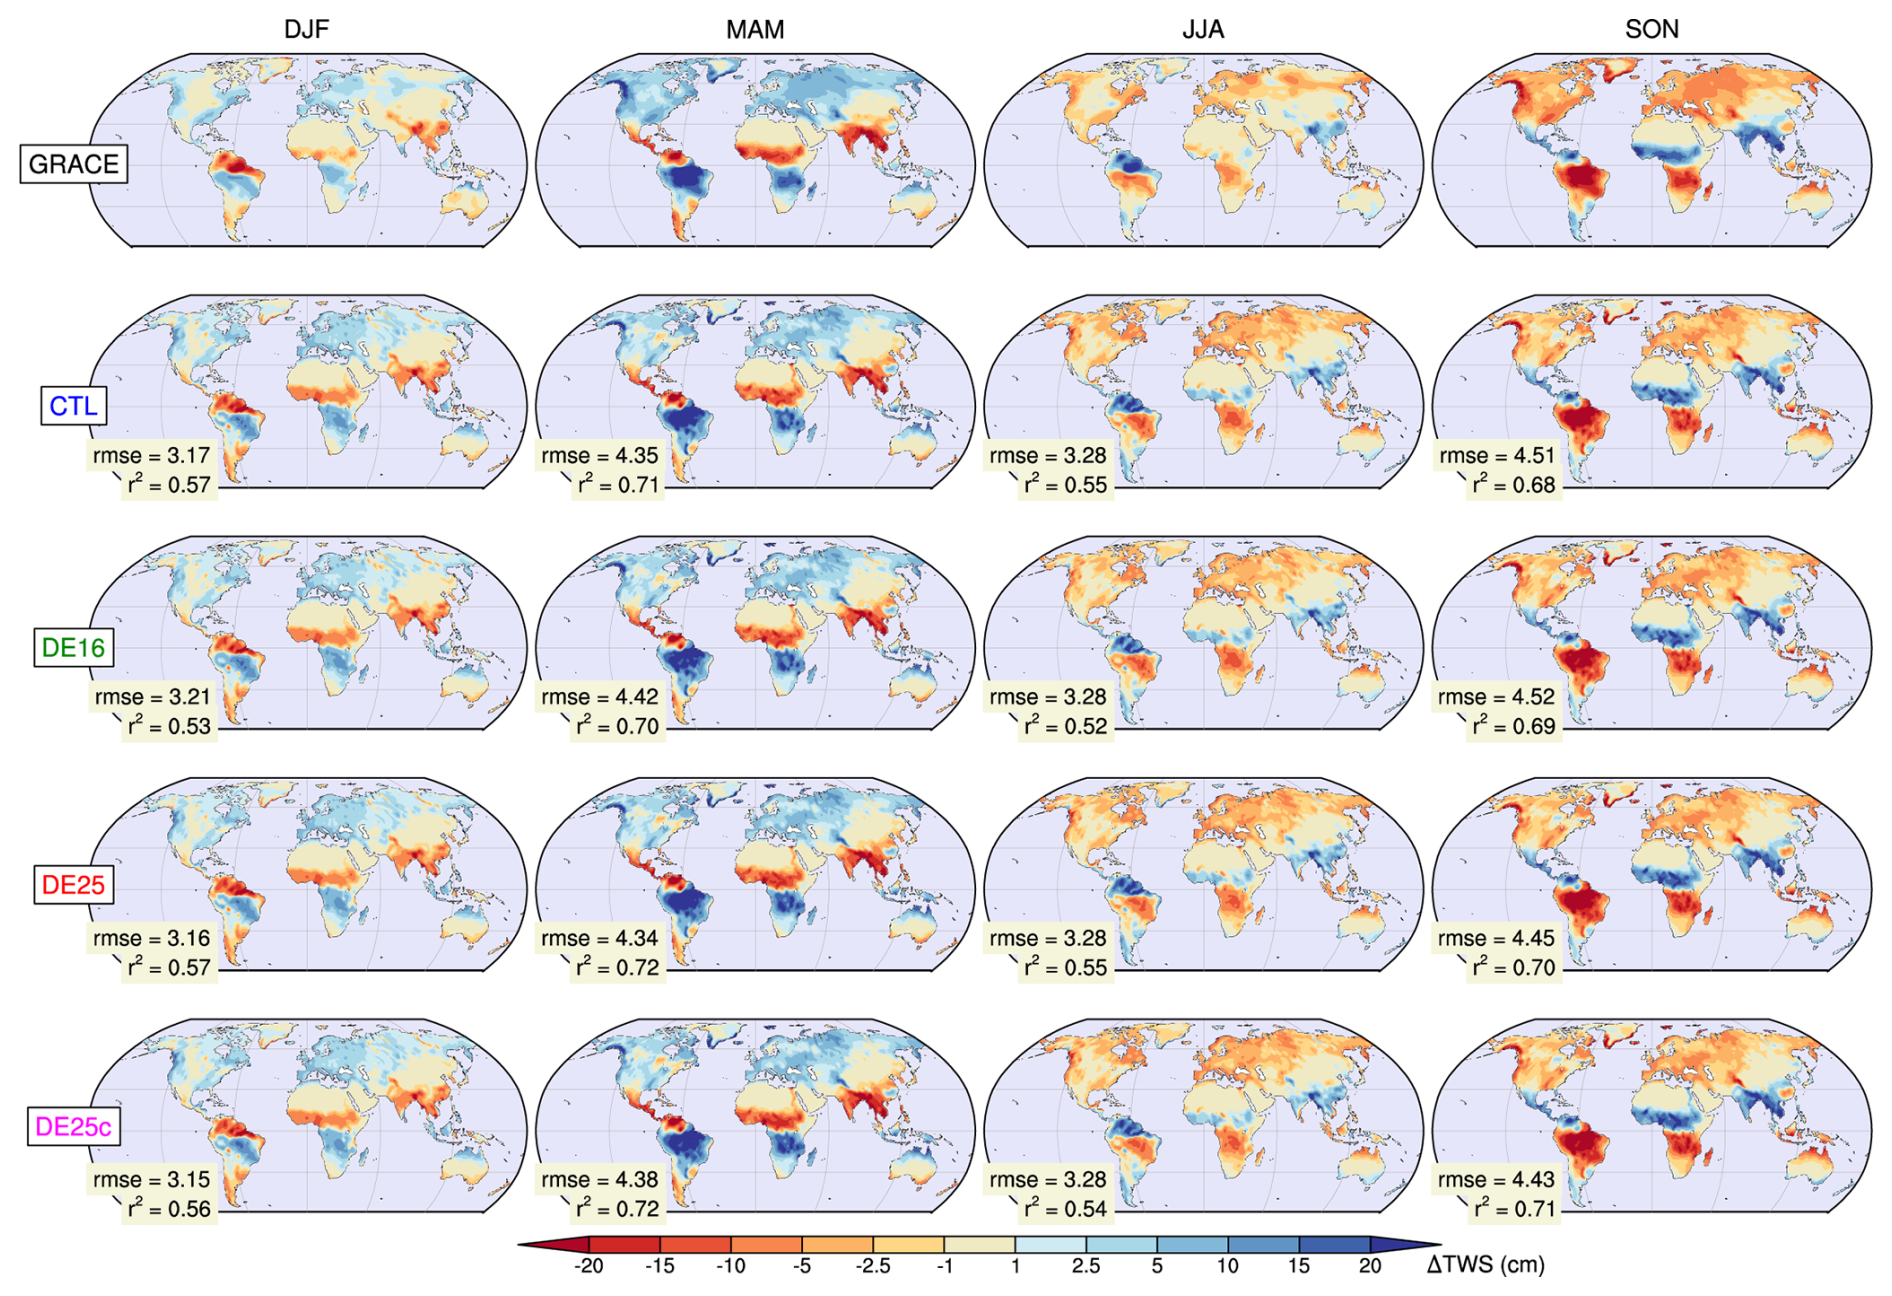
Figure 7Seasonal terrestrial water storage variations (ΔTWS in cm) estimated from GRACE over 2002–2010 and simulated by CTL, DE16, DE25, and DE25c. Climatological spatial distributions are shown for December–January–February (DJF), March–April–May (MAM), June–July–August (JJA), and September–October–November (SON). For each season, the root mean square error (rmse in cm) and the spatial coefficient of determination (r2) of each simulation relative to GRACE are reported on the panels.
At the global scale, no observational product provides a direct evaluation of soil water content across individual layers. We therefore evaluate the integrated response of each experiment using monthly terrestrial water storage variations ΔTWS from GRACE, which reflect changes across all continental water reservoirs. Figure 7 compares the 2002–2010 seasonal climatology of ΔTWS estimated from GRACE with those simulated by ISBA–CTRIP, computed as the sum of variations in snowpack, canopy water, total soil moisture, river water storage, floodplains, and groundwater reservoirs. Across all configurations, the seasonal ΔTWS patterns are broadly consistent with GRACE, but spatial skill scores highlight differences among experiments. Relative to CTL, DE16 slightly degrades the spatial scores in all seasons, whereas DE25 and DE25c are comparable to CTL and show modest improvements in some seasons. This suggests a closer agreement with GRACE for the physically constrained SOC parameterization based on soil mixture theory than for the empirical formulation used in DE16.
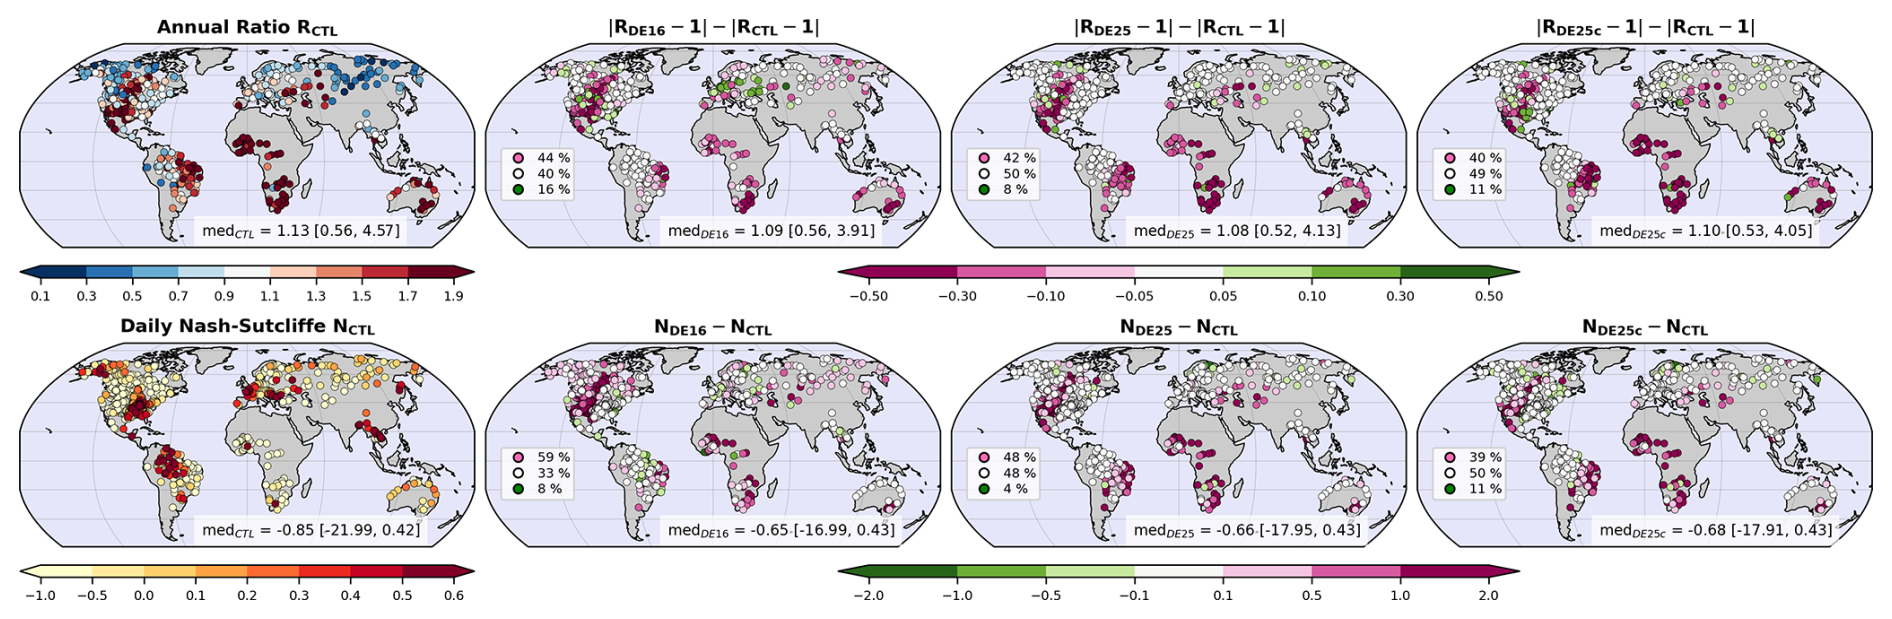
Figure 8Comparison between observed and simulated daily river discharges over the 1979–2010 period at 698 gauging stations. Each dot represents a river gauging station. The first column shows the annual discharge ratio, R, and the daily Nash–Sutcliffe efficiency, N, for the CTL experiment. The following columns show the differences in these metrics relative to CTL for DE16, DE25, and DE25c, respectively, using for the discharge ratio panels, which measures the distance to the unbiased value. For each panel, the inset reports the median and the [10,90] % interval of the corresponding metric across all stations. In the difference panels, stations are also classified as improved (pink), neutral (white), or degraded (green) based on their change relative to CTL, and expressed in % of all stations. For , a station is improved when , and degraded when . For N, a station is improved when ΔN≥0.1, and degraded when .
Changes in soil moisture are expected to propagate to integrated surface fluxes through shifts in runoff and evapotranspiration partitioning (Lohmann et al., 2004; Dirmeyer et al., 2006; Decharme and Douville, 2006; Seneviratne et al., 2010; Koster and Mahanama, 2012). Continental runoff is evaluated from the comparison between simulated daily discharges Qsim (m3 s−1) and observed discharges Qobs (m3 s−1). On Fig. 8, the annual ratio measures the ability of the model to reproduce mean annual streamflow, with unbiased behavior approaching R=1. The Nash–Sutcliffe efficiency is computed from daily values and quantifies the reproduction of discharge variability at the daily time scale, with positive N indicating acceptable performance and higher values indicating better agreement. The reference simulation CTL exhibits a large dispersion in both R and N, reflecting structural model limitations and the difficulty of representing the diversity of regional hydrological regimes at the global scale. We therefore analyze differences relative to CTL using to quantify the distance to unbiased mean discharge and allows identification of whether a given parameterization reduces or amplifies the mean bias. Differences in N scores are also considered to diagnose changes in daily discharge dynamics, where positive values indicate improved skill. The three mineral–organic mixture experiments induce globally moderate and spatially heterogeneous changes in both metrics, which limits robust ranking from discharge alone. Median scores show however slight improvements, which indicate a neutral to positive impact on discharge performance. This is supported by the station classification shown in the legend, which indicates that improved cases in DE16, DE25, and DE25c are of the same order as near-neutral changes relative to CTL and more frequent than degraded cases.
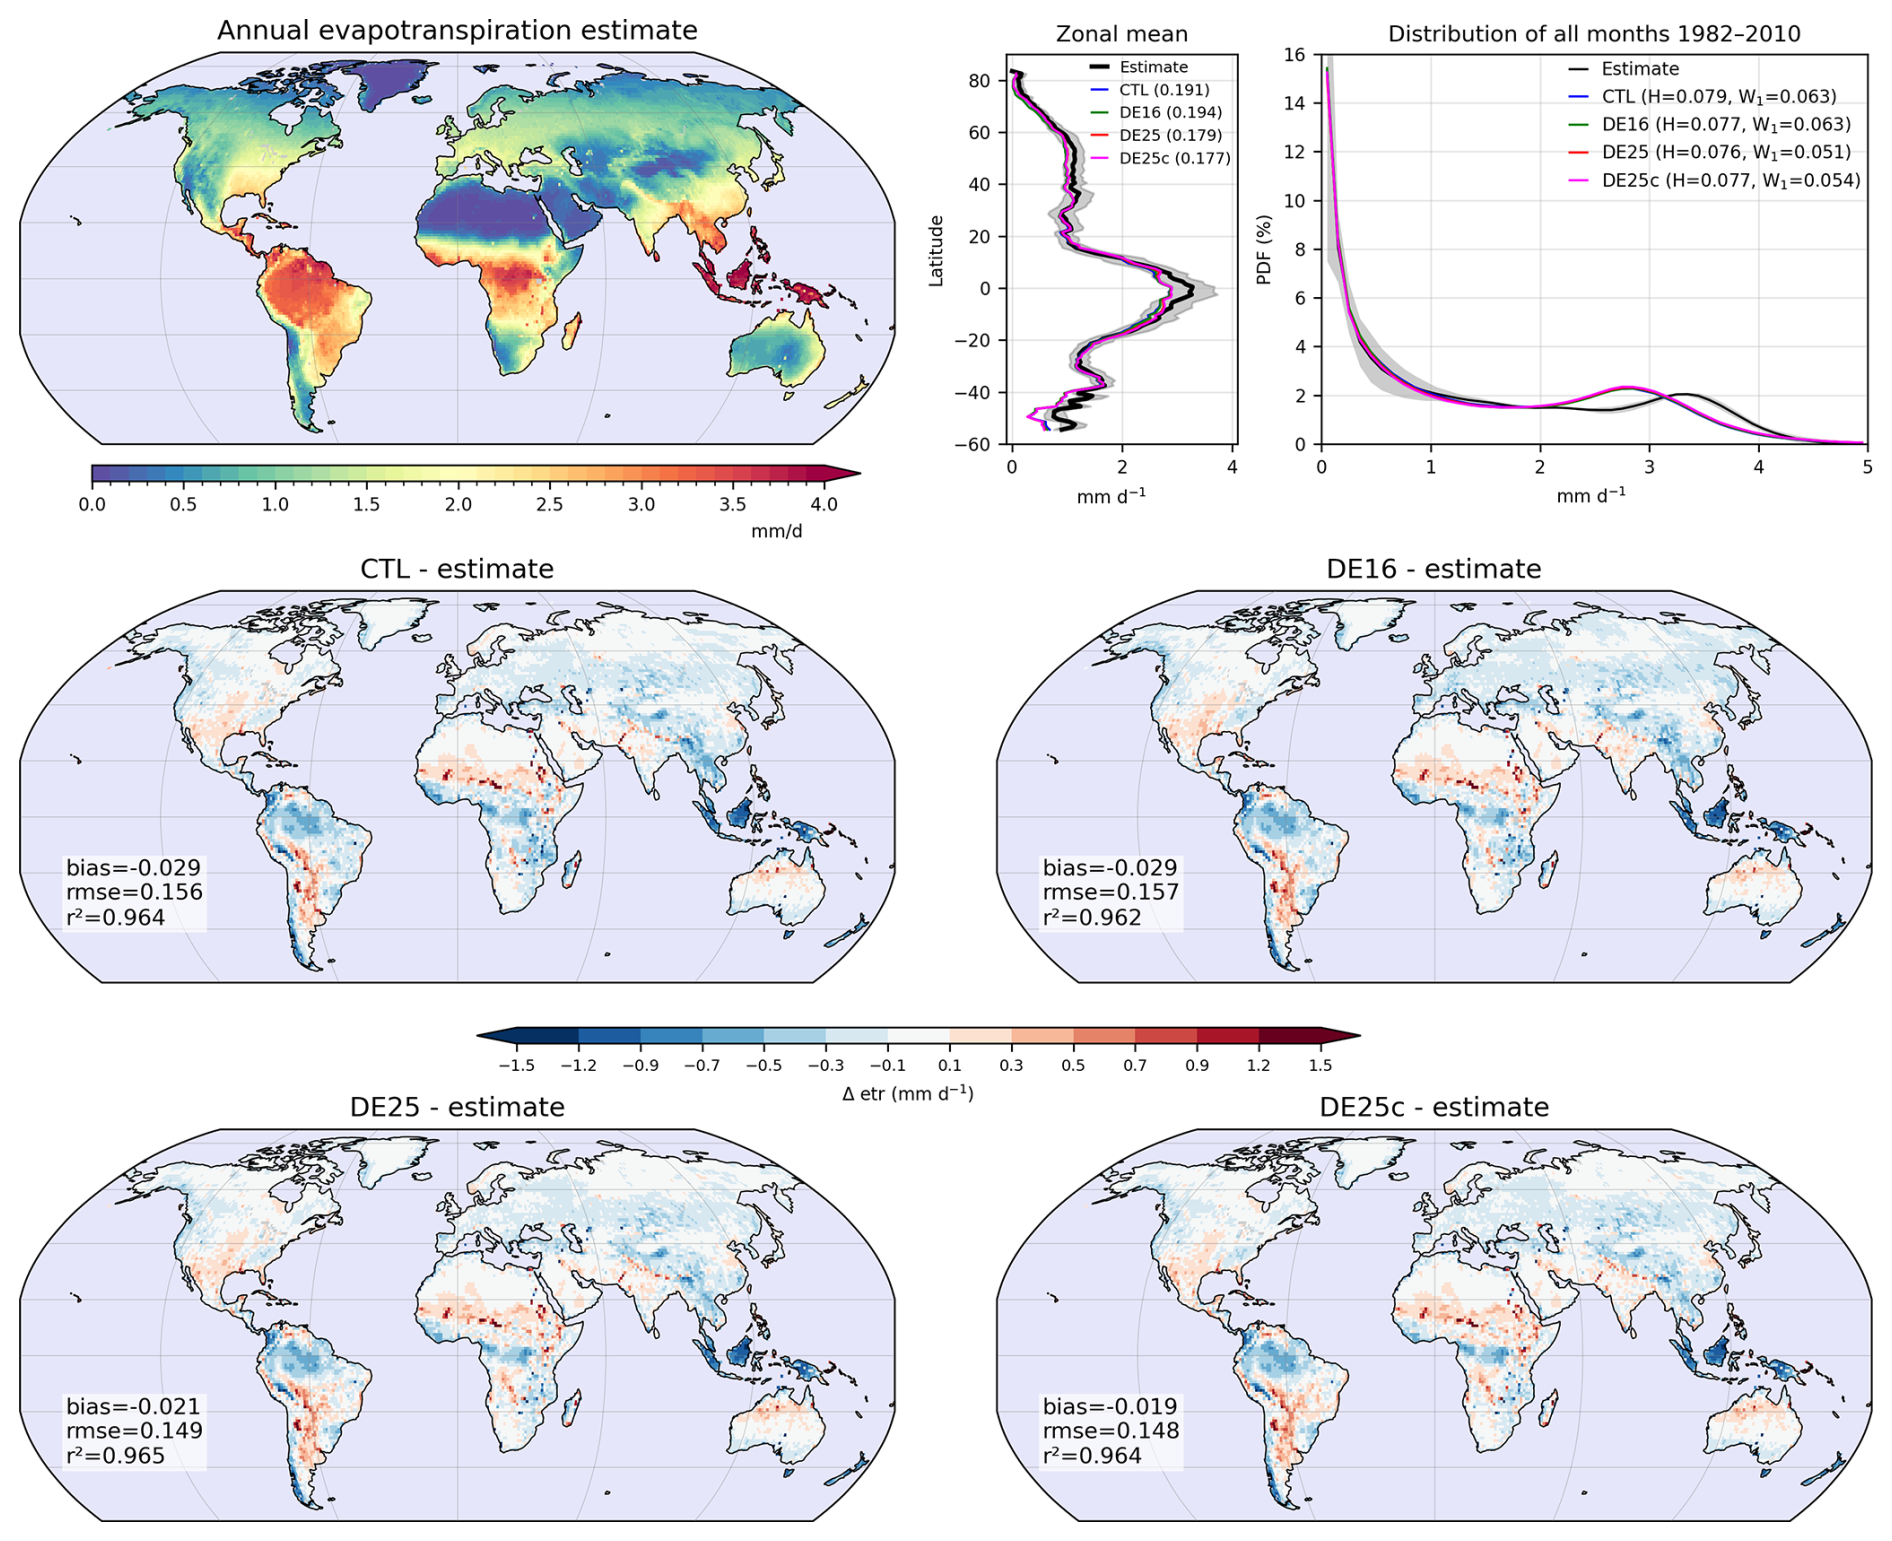
Figure 9Comparison between simulated and estimated land surface evapotranspiration over the 1982–2010 period. This estimate is defined as the mean of three independent global datasets from the evapoRe v2.04 archive (Rahmati Ziveh et al., 2025). The top row shows: (left) the global distribution of the annual mean evapotranspiration estimate; (center) the zonal mean comparison between the estimate and the simulations, with their root mean square error (rmse); and (right) the probability density function of monthly evapotranspiration values over 1982–2010. For the latter, the Hellinger distance (H), measuring differences in distribution shape, and the first-order Wasserstein distance (W1), measuring differences in distribution magnitude, are reported for each experiment. The following panels show the differences between simulated evapotranspiration and the estimate for CTL, DE16, DE25, and DE25c, respectively. For each experiment, the spatial bias, spatial rmse, and spatial coefficient of determination (r2) relative to the estimate are reported.
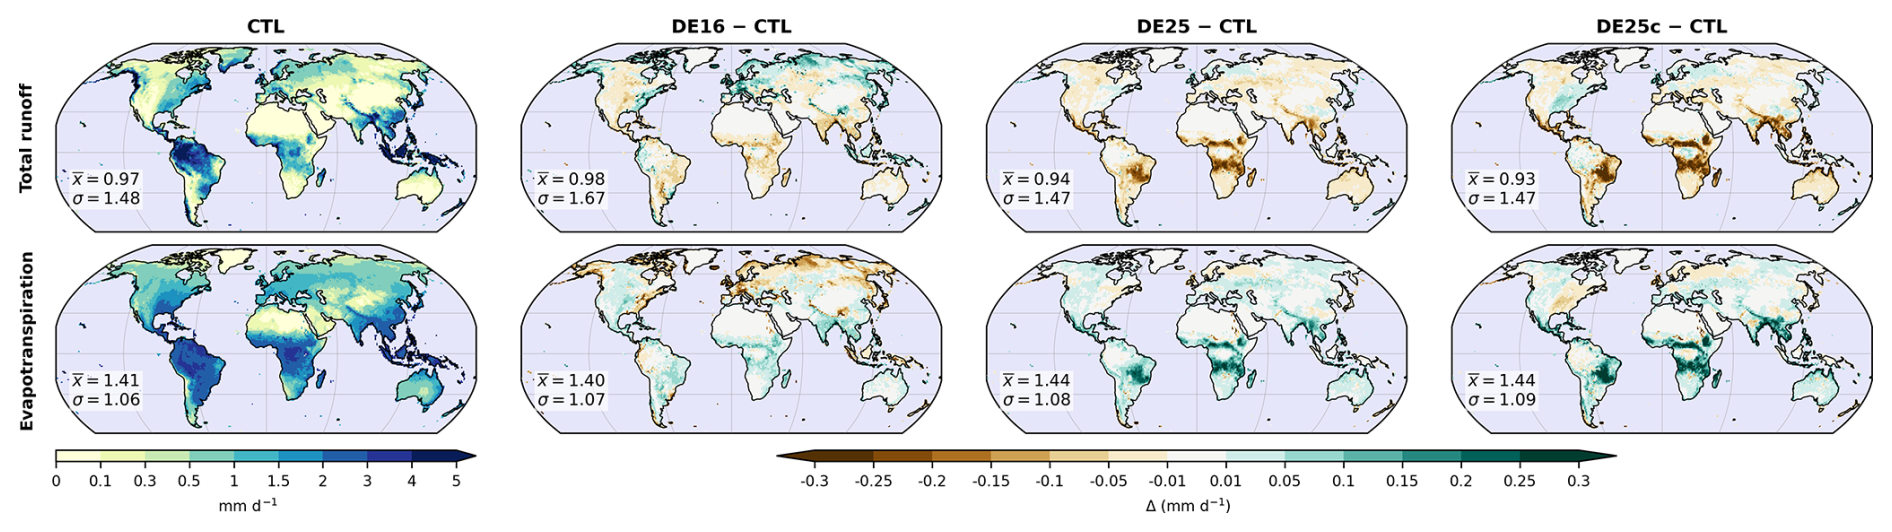
Figure 10Comparison of simulated continental runoff and evapotranspiration climatologies expressed in mm d−1 over the 1979–2010 period. The first column shows the annual mean total runoff (top row) and evapotranspiration (bottom row) for the CTL experiment. The following columns show the differences relative to CTL for DE16, DE25, and DE25c, respectively. For each map, the inset reports the spatial mean and standard deviation σ over land points for the corresponding experiment (not for the differences).
The evaluation of evapotranspiration against an independent estimate reveals more structured differences among experiments. Figure 9 shows the spatial distribution of the estimate, defined as the mean of three independent products, together with zonal mean profiles for each experiment and the probability density functions psim and pobs computed from all months over 1982–2010. Distribution shape differences are quantified using the Hellinger distance , where and denote the discretized probability density functions of simulated and observed evapotranspiration evaluated over common bins. We also use the first-order Wasserstein distance W1 (mm d−1), which measures a mean difference in magnitude and can be interpreted as a displacement of probability mass along the evapotranspiration axis. W1 is computed from the absolute differences between the cumulative distribution functions of simulated and observed evapotranspiration, summed over all bins and weighted by the mean bin width. Figure 9 also reports maps of simulated minus estimated evapotranspiration and spatial metrics including bias, RMSE, and the spatial coefficient of determination r2. All experiments reproduce the main spatial structures and the global distribution. DE16 shows slightly lower performance than CTL, and especially than DE25 and DE25c, in both spatial error metrics and distribution distances. DE25 and DE25c bring the simulations closer to the estimate in mean values, zonal structure, and monthly distribution. This suggests that the empirical formulation of DE16, while operational, does not fully capture the control exerted by SOM on evapotranspiration fluxes, whereas the DE25 and DE25c physically-based approaches provide a more consistent response. For all experiments, the psim exhibits a simulated peak slightly below 3 mm d−1, while the pobs maximum lies between 3 and 4 mm d−1, which indicates an underestimation of high evapotranspiration values. This feature is consistent with an underestimation of evapotranspiration in the tropics, particularly over the Maritime Continent (Indonesia). DE25 and DE25c slightly reduce this bias by increasing evapotranspiration in several tropical regions, thereby partially shifting the monthly distribution toward the estimate. This increase remains limited over the core of major tropical forest regions, including the Amazon, the Congo basin, and Indonesia. The lack of response over the forest cores, visible in Fig. 10, is consistent with the near-saturated soil moisture conditions shown in Fig. 5, under which AWC exerts little control on transpiration because soil water is not limiting. In contrast, a clearer response is found along the margins of forested regions, where soil moisture departs more from saturation and changes in hydrodynamic properties can affect water stress. In this interpretation, the residual evapotranspiration bias, and part of the persistent shift of the psim, are more consistent with limitations in the representation of tropical forest transpiration and phenology in ISBA than with a purely hydric constraint controlled by soil parameters.
Figure 10 synthesizes the impact of the three mineral–organic mixture parameterizations on surface hydrological fluxes by comparing climatologies of total runoff and evapotranspiration. At the global scale, all simulations display coherent spatial patterns and similar statistics. This indicates that changes in soil properties induced by mineral–organic mixing do not alter the continental water balance but primarily affect flux partitioning. Differences relative to CTL are dominated by regional signals and show spatial compensation between evapotranspiration and total runoff, which is a well-known feature of the terrestrial water balance. DE16 exhibits a large-scale dipole, with increased total runoff and decreased evapotranspiration over the mid and high latitudes of the Northern Hemisphere. Across much of the remaining land area, the response is weaker and of opposite sign. This dipole explains the degraded evapotranspiration scores in Fig. 9, reflecting low evapotranspiration over northern mid and high latitudes and an insufficient increase in the tropics. In DE25 and DE25c, this feature is absent, and differences relative to CTL are more regionally structured, with pronounced signals in hydroclimatic transition zones and along the margins of humid tropical regions. This behavior is consistent with the increase in AWC and the associated changes in soil water dynamics discussed in previous sections, and with improved agreement with independent evapotranspiration estimates. The decomposition of these fluxes into surface runoff, drainage, bare soil evaporation, and plant transpiration is shown in Fig. S15 in the Supplement. Overall, surface runoff decreases, while drainage tends to increase, especially in DE16 and DE25. The decrease in surface runoff is consistent with the response of the two runoff-generation mechanisms represented in ISBA. The Dunne component is reduced because higher near-surface wsat and higher AWC increase soil water storage capacity and reduce the tendency of the soil to reach saturation. The Horton component is also reduced where higher near-surface wsat and ksat increase infiltration capacity. A larger fraction of incoming water can therefore infiltrate instead of being converted into surface runoff. Part of this additional infiltrated water first increases soil water content and can then be transferred downward, thereby favoring higher drainage in DE16 and DE25. This redistribution is weaker in DE25c, consistent with the compactness-induced reduction of mineral porosity and saturated hydraulic conductivity in some mineral-dominated soils. For evapotranspiration, the response is mainly expressed through higher plant transpiration and lower or weakly modified bare soil evaporation. The increase in AWC, mainly driven by the increase in wfc, enhances root-zone water retention and water availability where transpiration is water-limited. Because bare soil evaporation is controlled mainly by water availability in the uppermost soil layers, while transpiration can use water stored over the root zone, the additional infiltrated water is preferentially partitioned toward root-zone storage and plant uptake. It can also be transferred downward as drainage. It is therefore less directly available as mobile near-surface water for bare soil evaporation, which explains the decrease in DE16 and DE25c and the weak response in DE25. The differences due to the mineral soil compactness adjustment remain second order at the global scale. DE25c preserves the spatial structures induced by DE25 while slightly attenuating or locally enhancing amplitudes depending on the region. This indicates that the mineral soil compactness adjustment mainly acts as a localized modulation of the SOM-driven response, without altering the spatial patterns.
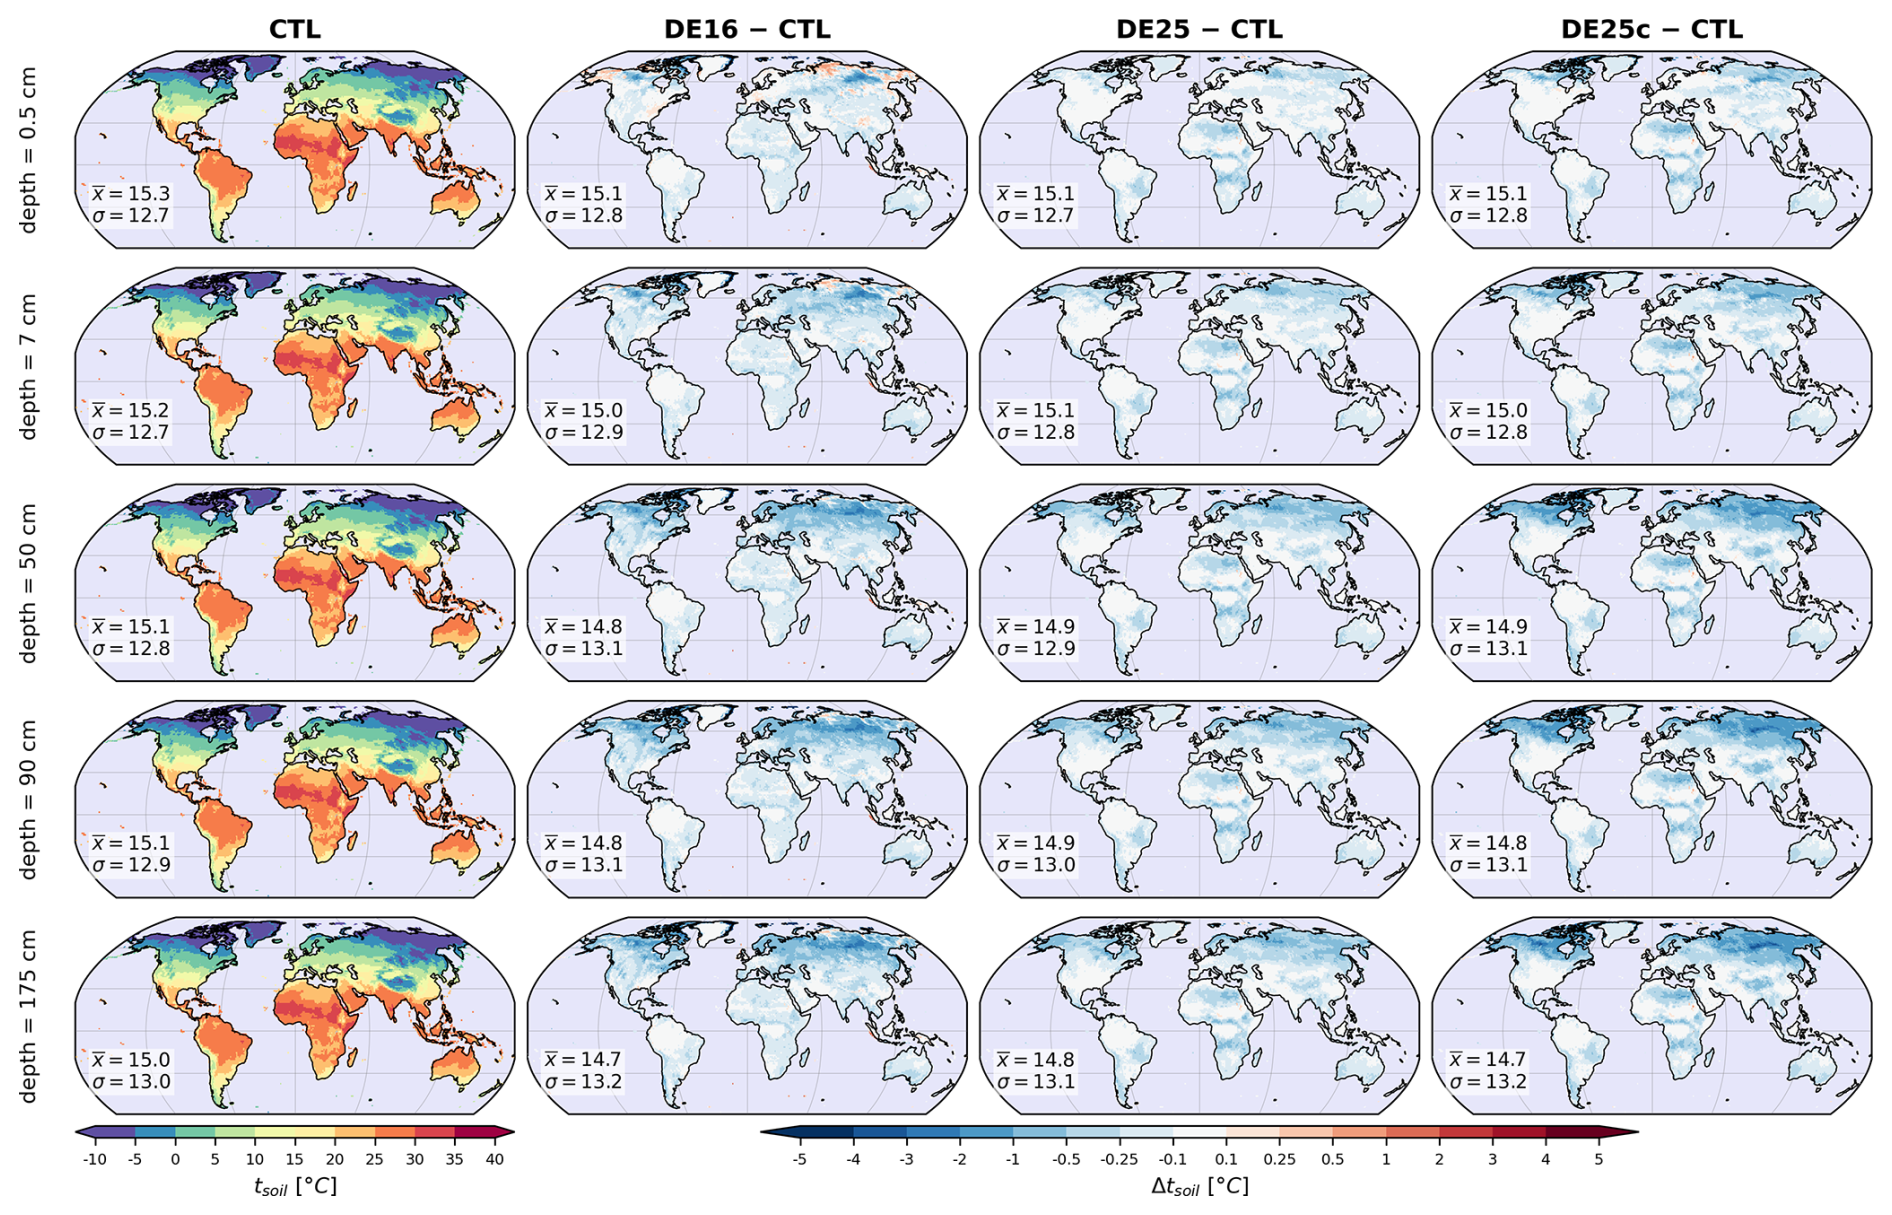
Figure 11As in Fig. 5, but for the simulated soil temperature (°C).
3.3 Land surface thermal impacts
We next assess the thermal impacts of the three mineral–organic mixture parameterizations by analyzing their effects on simulated soil temperature. Figure 11, in direct analogy with Fig. 5 for soil moisture, presents the CTL climatological soil temperature and differences relative to CTL for DE16, DE25, and DE25c at several soil depths. In CTL, soil temperature shows the expected latitudinal gradients, with warmer tropical and cooler high-latitude conditions, and temperature contrasts progressively attenuate with depth. Relative to CTL, all mineral–organic mixture parameterizations cool the soil column over large continental areas. The cooling is not confined to the upper soil layers. Instead, the spatial variability of the temperature anomalies slightly increases with depth, as shown by the standard deviations reported in Fig. 11. This indicates that the thermal response reflects not only changes in near-surface soil properties but also the modification of heat propagation through the soil column. The cooling is consistent with coupled changes in heat storage and heat transfer. The increase in wgtot modifies the volumetric heat capacity and the moisture-dependent component of λsoil, whereas the widespread decrease in soil thermal conductivity induced by mineral–organic mixing (Figs. S13 and S14 in the Supplement) provides the more direct mechanism limiting vertical heat transfer within the soil column. Among the three mineral–organic mixture experiments, soil temperature responses are broadly similar. Differences between DE16 and DE25 remain modest compared with the contrast found for wgtot, but DE16 shows locally stronger cooling at depth in organic-rich regions. This is consistent with higher near-surface and wsat, which are associated with lower effective soil thermal conductivity and can further limit downward heat transfer. Differences between DE25 and DE25c remain subtle and second order, with similar regional structures and slightly stronger cooling in DE25c, in line with a moderately higher leading to slightly lower soil thermal conductivity.
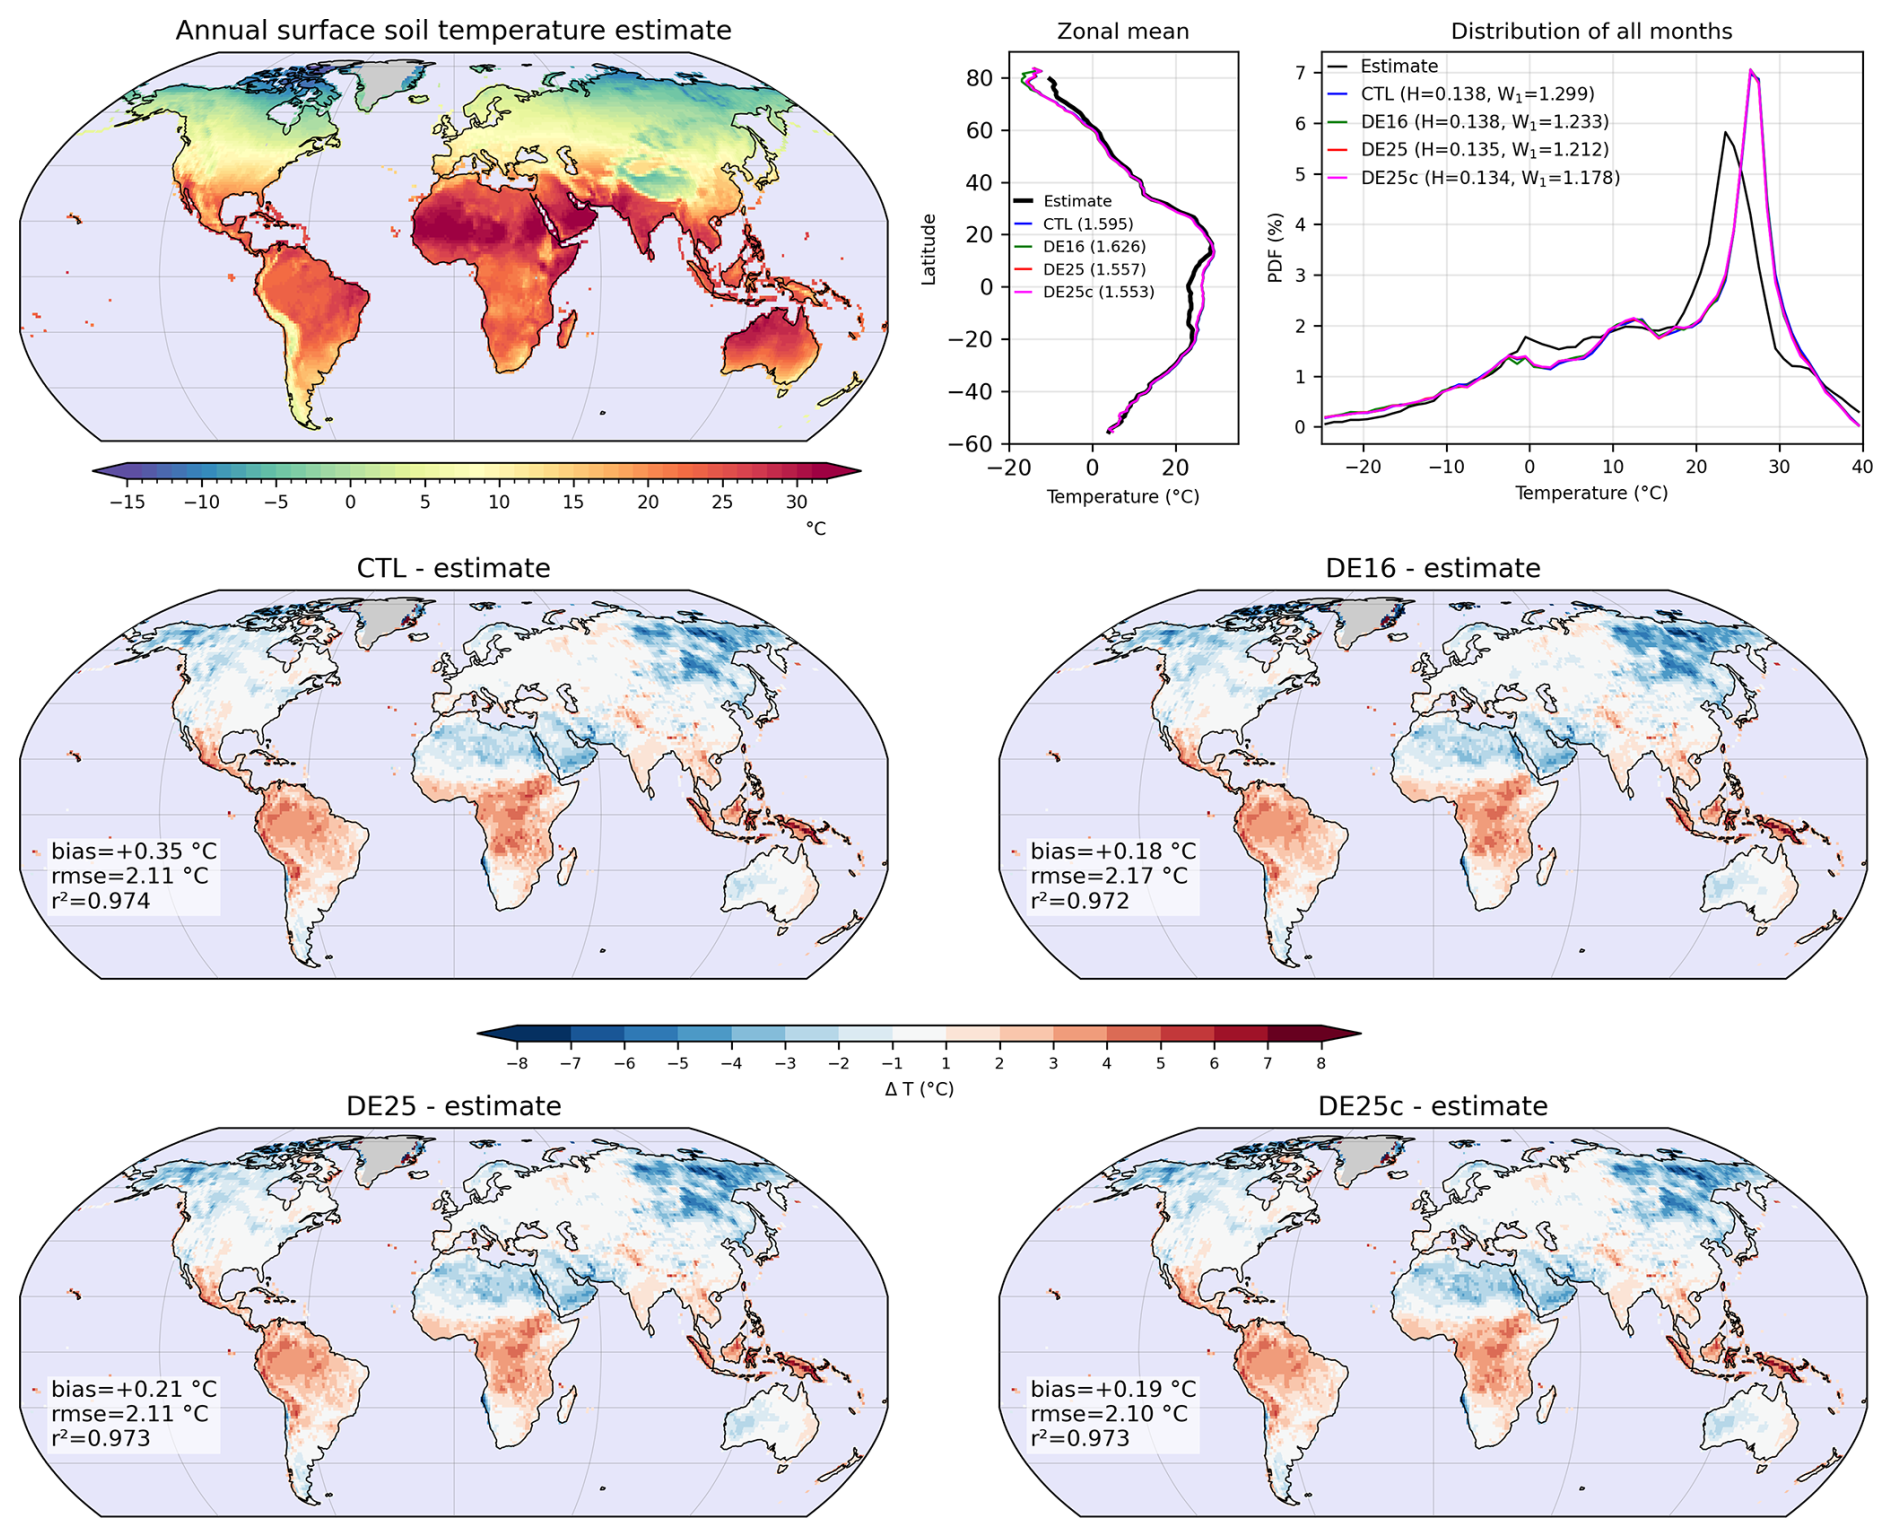
Figure 12As in Fig. 9, but for the comparison between simulated and estimated near-surface soil temperature (°C) at 0–5 cm depth over the 1979–2010 period. The estimate corresponds to the climatological product of Lembrechts et al. (2022).
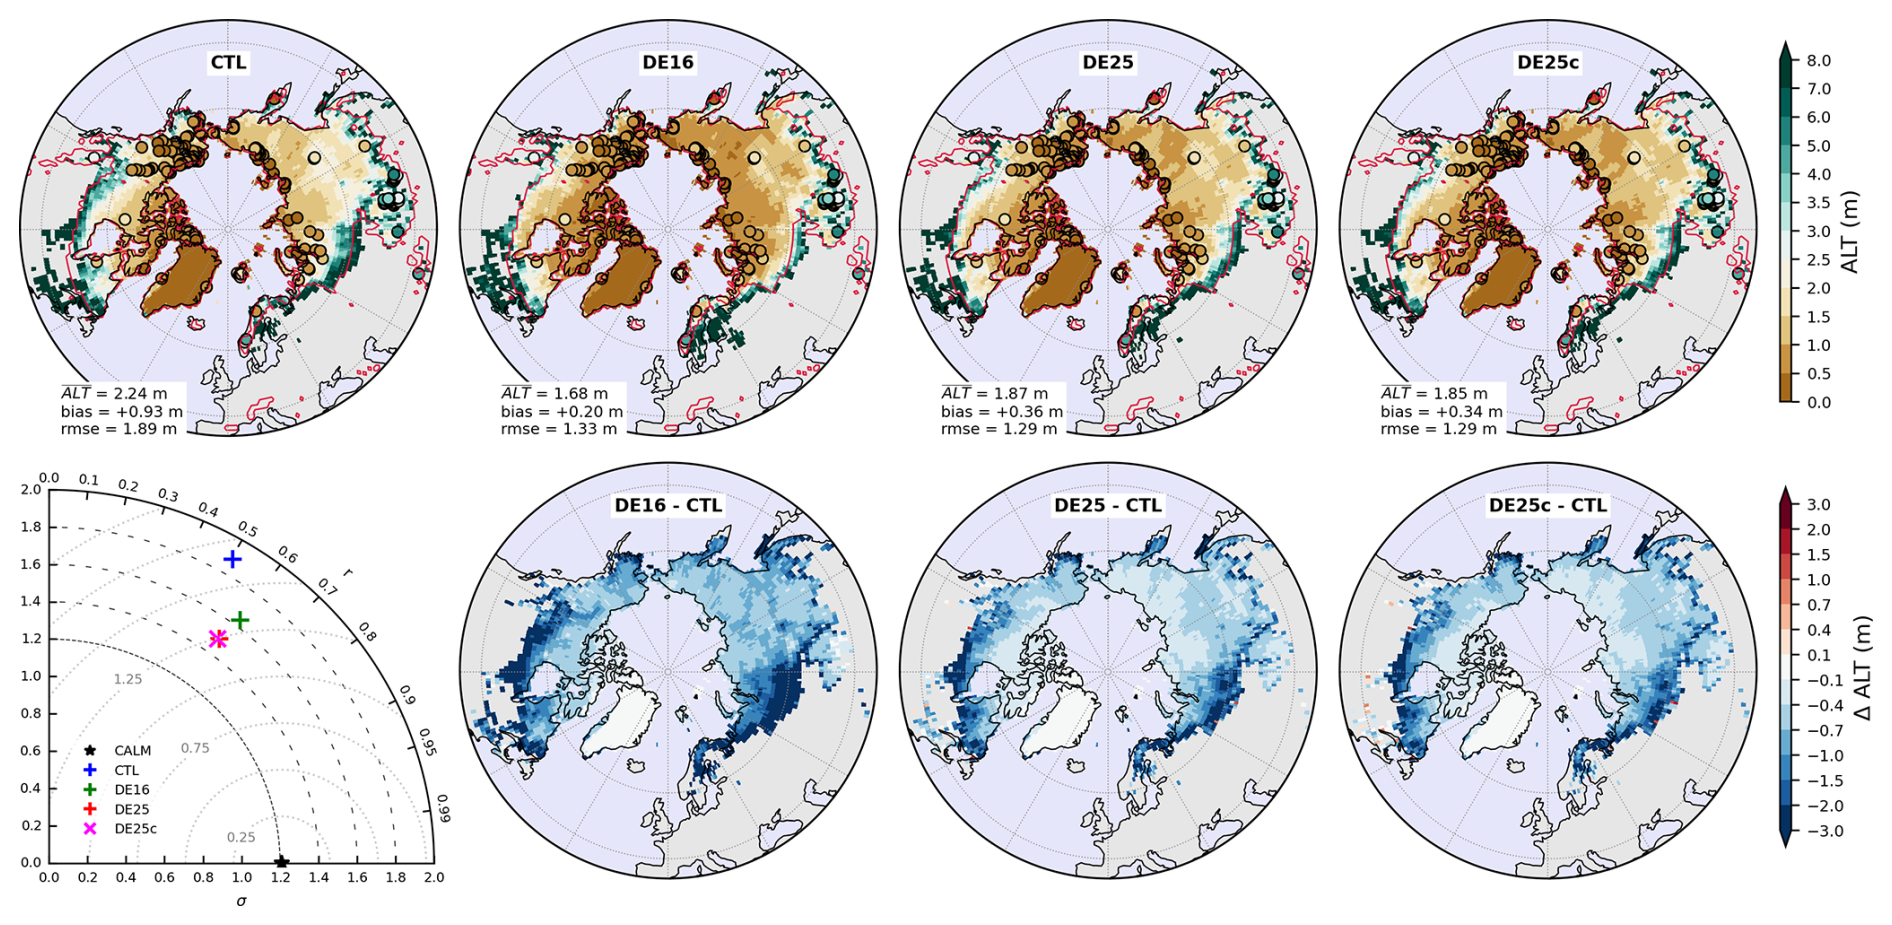
Figure 13Comparison of simulated annual active-layer thickness (ALT, m) for the CTL, DE16, DE25, and DE25c experiments. The upper panels show the climatological ALT for each experiment, with circles indicating CALM observation sites and their observed mean ALT. Reported values correspond to the spatial mean ALT, as well as the mean bias and the root-mean-square-error (rmse) relative to CALM observations. Red contours indicate the permafrost extent derived from the Circum-Arctic permafrost and ground ice map (Brown et al., 2002). The lower panels show differences in ALT relative to CTL for DE16, DE25, and DE25c. The Taylor diagram summarizes the agreement between simulated and observed ALT across CALM sites using correlation (r), standard deviation (σ), and centered root-mean-square difference (concentric dotted circles).
To compare these simulated temperature responses with an independent large-scale constraint, we evaluate near-surface soil temperature against the climatological product of Lembrechts et al. (2022). Figure 12 compares 1979–2010 simulated near-surface soil temperature with this estimate using spatial patterns, zonal means, and probability density functions derived from all monthly values, together with distribution-based metrics and spatial scores. All simulations reproduce the large-scale spatial organization and show high spatial correlation with the estimate, but they exhibit a systematic warm bias at the global scale. This bias is strongest over tropical land regions, while cold biases occur at high northern latitudes and over some deserts, including the Sahara and the Rub’ al Khali desert. The probability density functions reflect these patterns. They show an over-representation of very cold temperatures below about −10 °C, a warm-mode peak near 26 °C in the simulations compared with about 23 °C in the estimate, and an under-representation of moderate temperatures between 0 and 10 °C. Despite possible uncertainties in atmospheric forcing, especially air temperature and incident radiation, and in the reconstructed temperature estimate, several processes can contribute to these biases. In the tropics, underestimated evapotranspiration and a limited forest insulation effect in the vegetation energy balance can contribute to the warm bias. Over deserts, a surface albedo that is too high is a plausible contribution. Over high northern latitudes, the cold bias is consistent with insufficient soil thermal insulation under snow cover (Wang et al., 2016; Burke et al., 2020). The three mineral–organic mixture experiments reduce the global warm bias relative to CTL. This reduction is modest but spatially coherent, and spatial correlation remains high and comparable across experiments. DE16 slightly degrades the spatial RMSE, whereas DE25 and DE25c remain comparable to CTL. A consistent behavior is found for the zonal-mean profiles, where DE16 increases the RMSE, while DE25 and DE25c show a clearer reduction. The probability density functions further indicate reduced distribution distances for all mineral–organic mixture simulations. W1 decreases from CTL to DE16 and further to DE25 and DE25c, while H remains unchanged from CTL to DE16 and decreases for DE25 and DE25c. For DE25 and DE25c, the joint decrease in W1 and H indicates closer agreement with the reference distribution in both overall magnitude (i.e., reduced shifts in typical values) and distribution shape. Differences between DE25 and DE25c remain small, but they are more pronounced for near-surface soil temperature than for the hydrological fluxes. This indicates that the soil compactness adjustment can slightly modulate soil thermal amplitude without altering the overall structure, while as discussed above, SOM-related modifications of soil thermal properties dominate the temperature response.
To complement this near-surface evaluation with a constraint on deeper seasonal heat propagation, we assess simulated annual active-layer thickness (ALT) against CALM observations (Fig. 13). The upper panels show that all simulations reproduce the expected large-scale gradients, with shallow ALT in the coldest Arctic regions and deeper ALT toward the margins of the permafrost domain. Red contours indicate permafrost extent, and maximum ALT values are logically found near this boundary, where summer warming and surface conditions favor deeper seasonal thaw. CALM sites highlight this regional variability and exhibit a substantial spread across locations. In CTL, the mean ALT is 2.24 m with a positive mean bias of +0.93 m relative to CALM, indicating an overly deep simulated active layer. This overestimation is consistent with thermal insulation that is too weak under permafrost conditions when soils are represented as purely mineral. The three mineral–organic mixture experiments systematically reduce ALT and therefore the mean bias. This reduction is strongest in DE16 and more moderate in DE25 and DE25c. The difference maps confirm that these corrections occur through predominantly negative ALT anomalies relative to CTL, which reflect reduced summer thaw penetration into the soil. This behavior is consistent with cooling of the soil thermal profile and lower effective thermal conductivity when organic matter is represented. Differences between DE25 and DE25c remain small and spatially coherent, with nearly identical regional patterns. Finally, the Taylor diagram summarizes agreement with CALM across sites using spatial correlation r, standard deviation σ, and centered root-mean-square difference. CTL exhibits a large dispersion and departs substantially from the CALM reference. DE16 reduces the mean bias most strongly, but it performs less well than DE25 and DE25c in terms of spatial structure, which shows that bias reduction does not necessarily translate into improved inter-site contrasts. As expected, the close proximity of DE25 and DE25c indicates that the mineral soil compactness adjustment remains secondary also for ALT.
The main contribution of this study is to show, using global diagnostics, that explicitly representing the SOM phase within soil mixture theory (e.g., Decharme, 2025) yields hydrological and thermal properties that are physically coherent in LSM. Introducing organic matter and bulk density effects increases soil porosity and AWC, with the strongest signal in SOC-rich regions, notably at high northern latitudes and in several tropical areas (Figs. 4 and S6 to S10 in the Supplement). This behavior is in line with observational and synthesis studies linking SOM to bulk density, porosity, and water retention (Boelter, 1968; Hudson, 1994; Huntington, 2003; Rawls et al., 2003; Liu et al., 2022). It is accompanied by a thermal response with lower thermal conductivity and higher bulk volumetric heat capacity under wet conditions, as suggested by global distributions and vertical profiles (Figs. 4 and S11 to S14 in the Supplement). These findings align with earlier modeling and observational studies showing that SOM affects thermal regimes mainly through thermal conductivity and its moisture dependence (Lawrence and Slater, 2008; Dankers et al., 2011; Decharme et al., 2016; Chen et al., 2012, 2016; Guimberteau et al., 2018; Zhang et al., 2021; Sun et al., 2021; Cuynet et al., 2025; Gaillard et al., 2025).
The results further suggest that the DE25 configuration modifies the coupled hydrothermal behavior relative to CTL by shifting mean soil moisture (Fig. 5) and saturation proximity (Fig. 6), which affects storage and transport within the soil column. These changes translate into modest and spatially coherent improvements across large-scale hydrological benchmarks, including ΔTWS against GRACE (Fig. 7), river discharge (Fig. 8), and evapotranspiration estimates (Fig. 9). The associated flux response includes increased evapotranspiration and a modified partitioning between evapotranspiration and runoff (Fig. 10), in line with the increase in AWC induced by mineral–organic mixing. Through moisture-dependent heat transfer, DE25 also produces cooler soil temperature profiles (Fig. 11) and improves agreement with near-surface constraints (Fig. 12), while increasing the buffering of seasonal temperature variations without ad hoc tuning of thermal parameters. These coupled effects have implications for the representation of SOC-rich cold regions. DE25 reduces the active-layer thickness bias relative to CALM (Fig. 13), consistent with reduced seasonal thaw penetration driven by coupled changes in soil moisture and heat transfer. These results support the view that improvements arise from coupled soil hydrology and heat transfer rather than from isolated changes in dry thermal parameters, which is relevant for cold-region processes and permafrost sensitivity in land surface and climate models (Matthes et al., 2025; Lawrence et al., 2012; Dankers et al., 2011; Chadburn et al., 2015; Decharme et al., 2016; Sun et al., 2021; Chadburn et al., 2022).
Comparisons between DE16 and DE25 highlight behaviors that reflect their underlying assumptions. DE16 relies on an empirical relationship between SOC and effective soil properties, which leads to a more contrasted hydrological response with limited benefit and occasional degradation relative to CTL in comparisons with observations or independent estimates. Its thermal response is more acceptable, which suggests that the effect on thermal conductivity induced by mineral–organic mixing is captured more directly than the associated hydrodynamic adjustments. In DE25, the soil mixture framework produces more homogeneous large-scale patterns and more stable relationships between bulk density, porosity, soil water content, and thermal properties, which translates into modest but more consistently positive changes in skill metrics. This contrast between DE16 and DE25 suggests that coherent global signals are primarily driven by explicit physical mechanisms, whereas empirical approaches tend to locally amplify contrasts and provide less consistent improvements. The emergence of these coherent relationships at the global scale across diverse climates and soil types supports the robustness of the soil mixture theory, which can provide an operational framework for representing effective soil properties in LSMs across a broad range of SOC conditions. Our study extends earlier efforts to represent SOM effects in global LSMs, from empirical schemes to more physically based formulations (Letts et al., 2000; Lawrence and Slater, 2008; Dankers et al., 2011; Chen et al., 2016; Chadburn et al., 2015; Decharme et al., 2016; Guimberteau et al., 2018; Gaillard et al., 2025; Chadburn et al., 2022; Cuynet et al., 2025).
We also examine here how a mineral soil compactness adjustment within the soil mixture framework (DE25c) affects simulated soil structural properties and their downstream hydrothermal effects. CTL derives mineral porosity from the Cosby et al. (1984) pedotransfer formulation and does not explicitly represent mineral soil compactness or the structural impact of high organic matter, which limits its ability to reproduce observed porosity patterns (Decharme, 2025). Through a physically based representation of organic matter, DE25 broadens the range of effective porosity in SOC-rich soils, while DE25c further refines the mineral component through the mineral soil compactness adjustment. This adjustment mainly improves agreement with porosity observational constraints under organic-poor conditions where mineral properties dominate (Fig. 2), while its leverage is limited in SOC-rich environments where pore space is controlled by the organic phase. Consistently, DE25 and DE25c remain very similar across soil moisture, surface flux, and soil temperature diagnostics, which suggests a secondary influence of the mineral soil compactness adjustment on the simulated large-scale hydrothermal response. The mineral soil compactness adjustment therefore acts primarily as a local refinement that modulates amplitudes through modest shifts in mineral pore space and associated hydraulic properties, without altering the main spatial patterns set by the explicit representation of SOM-driven processes.
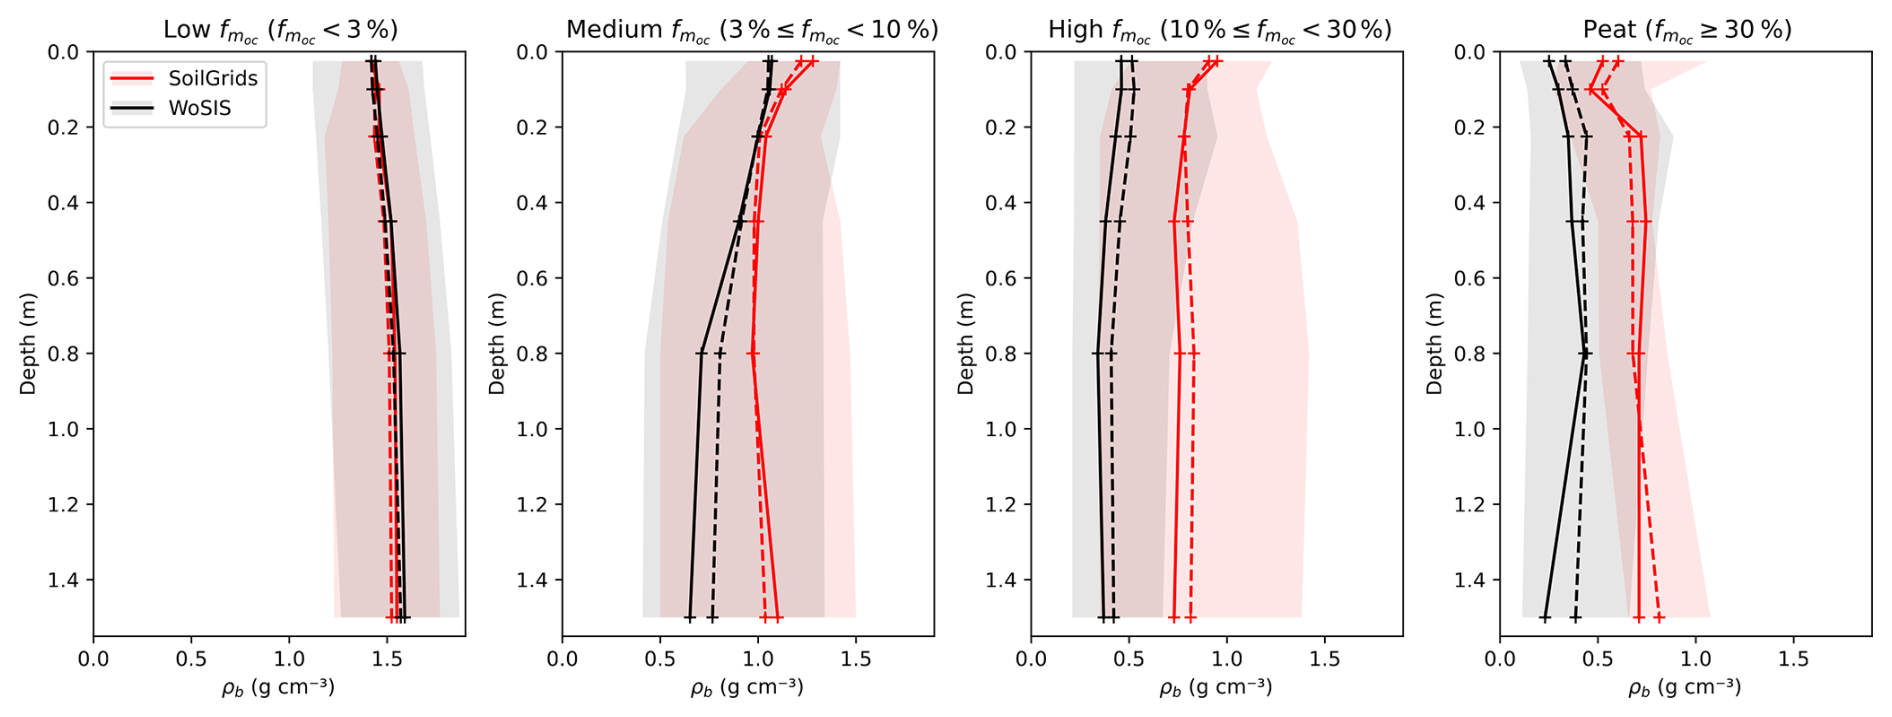
Figure 14Comparison of SoilGrids and WoSIS vertical profiles of soil bulk density (ρb) as a function of depth for four classes of organic matter content: low SOC (fmoc < 3 %), medium SOC (3 % ≤ fmoc < 10 %), high SOC (10 % ≤ fmoc < 30 %), and peat (fmoc ≥ 30 %). WoSIS (World Soil Information Service) is a global database of in situ soil profile observations maintained by International Soil Reference and Information Centre (ISRIC), compiling measured soil properties from multiple sources and regions worldwide, and constitutes the main observational reference for global soil mapping. Profiles are shown for SoilGrids in red and for WoSIS in black. As in Fig. 4, solid lines indicate median profiles, dashed lines indicate mean profiles, and shaded envelopes represent the 10th to 90th percentiles within each SOC class.
Although the evaluation mainly focuses on climatological states, several diagnostics also constrain temporal behavior, including the seasonal ΔTWS cycle from GRACE, daily discharge skill scores, and all-month distributions of evapotranspiration and near-surface soil temperature. Additional regional diagnostics over a SOC-rich Siberian domain indicate that the SOM parameterizations mainly alter the mean hydrothermal state and its seasonal expression, with larger effects during the warm season for evapotranspiration and soil temperature, while annual anomalies remain close across experiments (Fig. S16 in the Supplement). For saturation degree, the response mostly reflects a shift in the model equilibrium state rather than a change in interannual variability. This supports the interpretation that the new framework affects mean hydrothermal conditions and their seasonal modulation more than the temporal variability itself.
Finally, an important source of uncertainty arises from the datasets used to prescribe and ρb at the global scale. In SoilGrids, a machine-learning product trained largely on WoSIS soil profile observations (Batjes et al., 2017, 2024), soil properties seem to be predicted by separate statistical models, and no explicit physical constraint enforces consistency between and ρb at prediction time. This limitation is most consequential in organic-rich soils, where high SOC content is expected to strongly reduce ρb (Boelter, 1969; Rawls et al., 2003; De Vos et al., 2005). Figure 14 illustrates this issue by comparing SoilGrids and WoSIS vertical profiles of ρb across classes. While both datasets show comparable ρb ranges in low-SOC soils, divergence increases with , and SoilGrids tends to maintain higher ρb than WoSIS in the highest classes, suggesting a high bias in ρb under high-SOC conditions. Related limitations have been reported for SoilGrids ρb estimates in organic-rich and high-latitude regions, where ρb uncertainties affect carbon stock estimates (Tifafi et al., 2018). Fan et al. (2020) similarly reported large ρb biases under high conditions and applied an empirical adjustment in grid cells exceeding approximately 8 % organic matter. This correction underscores the difficulty of jointly constraining and ρb using global statistical products. Because DE25 explicitly combines and ρb to constrain mineral and organic phase properties, such inconsistencies can propagate into simulated porosity, water storage, and hydrothermal behavior, particularly where organic soils dominate the near-surface response. In the present framework, this propagation occurs partly through the diagnosed organic bulk density, , which controls both the volumetric organic matter fraction and the hydraulic properties assigned to the organic phase. This sensitivity does not challenge the soil mixture formulation itself, but it delineates its dependence on the quality and internal consistency of input datasets. A stronger empirical constraint on could reduce this sensitivity, but it would also mask inconsistencies in the input pair (), reduce the spatial variability of diagnosed organic matter properties, and partly reintroduce an a priori constraint on organic matter density, closer in spirit to empirical approaches such as DE16. We therefore retain the current diagnostic formulation and identify improved or corrected bulk-density input fields as the preferred way to address this limitation.
This companion study evaluates, at the global scale, the land surface implications of the process-based modeling of SOM physical properties introduced in Decharme (2025). When implemented in ISBA-CTRIP and driven by a standard global soil dataset, organic phase properties derived from density-based PTFs (Table 1) and embedded in soil mixture theory provide a consistent set of structural, hydraulic, and thermal properties across soil horizons. This internal consistency yields coherent coupled hydrothermal responses across soils spanning a wide range of SOM contents. It leads to modest but systematic improvements in independent large-scale benchmarks of the terrestrial water and energy cycles, while preserving the main spatial organization of simulated fields. The study also indicates that previous SOC-based parameterizations relying on empirical relationships to represent SOM physical properties, while operational, do not fully capture the control exerted by SOM on coupled soil hydrothermal processes. A second objective was to assess the added value of representing the in situ compactness state of the mineral phase as an adjustment embedded within the same mixture framework. Porosity diagnostics indicate that this adjustment primarily refines mineral-dominated soil structure by shifting mineral pore space toward observational constraints. In the global simulations, its influence remains however secondary relative to the dominant contribution of SOM-related mechanisms. The close similarity of simulated soil moisture, surface fluxes, and soil temperature with and without the mineral soil compactness adjustment supports the view that this correction mainly acts as a local modulator. It operates through modest changes in mineral hydraulic properties that can slightly redistribute water and indirectly affect moisture-dependent heat transfer, while preserving the main spatial structures of the SOM-driven response.
These conclusions must be interpreted in light of input-data uncertainties. Because the mixture framework derives effective soil properties from , ρb, and texture, errors or inconsistencies in these inputs can propagate into the inferred organic volumetric fraction and effective density. This propagation can affect derived porosity, water storage capacity, and moisture-dependent thermal properties, and ultimately alter the simulated soil hydrothermal response. This sensitivity motivates an explicit characterization of uncertainty propagation. Quantifying how plausible uncertainties in and ρb translate into ranges of effective properties and associated hydrothermal fluxes at regional and global scales would provide clearer confidence bounds on simulated soil moisture, surface energy partitioning, and cold-region diagnostics. It would also help prioritize observational efforts toward the most influential parameters. A practical way to support this effort is to conduct parallel simulations based on alternative global soil products in addition to SoilGrids, such as HWSD v2.0 (FAO and IIASA, 2023), or other recent datasets and harmonization approaches (e.g. Dai et al., 2019). In this study, a prominent source of uncertainty appears to be the internal inconsistency of the SoilGrids pair () under organic-rich conditions. Because ρb strongly constrains pore space and volumetric organic fraction, such inconsistencies can have first-order implications for effective soil properties and the resulting hydrothermal response. This issue is especially relevant across northern high latitudes, where cold-season soil temperature and thaw dynamics control permafrost stability. In this context, the use of corrected SoilGrids bulk density fields, as for instance proposed by Fan et al. (2020), appears to be a priority avenue for future sensitivity analyses.
As emphasized in the companion theoretical study, an important perspective is to extend the same physically constrained logic to alternative hydraulic formulations. In this context, revisiting the calibration of the continuous pedotransfer functions proposed by Wösten et al. (1999) appears promising. Decharme (2025) showed that this approach can reproduce European-scale porosity patterns and implicitly captures part of the strong coupling between SOC and bulk density, although further improvements are needed for highly organic soils. Recalibrating these continuous PTFs would offer two practical advantages. First, it could reduce the need for an explicit empirical mineral soil compactness adjustment by representing compactness-related effects more intrinsically within the hydraulic parameterization. Second, it would facilitate transferring the present framework to LSMs that rely on the closed-form van Genuchten (1980) relationships, rather than the Brooks and Corey (1964) formulation, to link soil moisture, matric potential, and hydraulic conductivity. A complementary perspective is to combine these continuous PTFs or the Decharme (2025) mixture-based framework with a representation of coarse fragments. Accounting for the volumetric fraction of rock fragments and their effects on pore space and effective transport properties would further improve the realism of soil hydraulic and thermal behavior in LSMs, especially in regions where coarse materials contribute substantially to soil structure (Tokunaga et al., 2002; Núñez-González et al., 2016; Pan et al., 2017). Another important perspective is to clarify how mixture-based diagnostics can interface with interactive soil carbon schemes. Recent soil-crop and soil-profile models have started to represent feedbacks between SOM turnover, aggregation, bulk density, porosity, and physical protection (Meurer et al., 2020; Coucheney et al., 2025). However, translating such developments into large-scale LSMs requires ensuring consistency between soil physical properties and dynamically evolving carbon pools, without introducing circular dependencies between prognostic state variables and derived parameters. Addressing this issue would be a necessary step toward more integrated representations of soil structure, hydrology, and biogeochemistry in Earth system models.
Finally, while the robustness of the hydrothermal signals identified in this study should be further assessed under alternative meteorological forcings, as is common practice in LSM evaluations and associated uncertainty assessments (Decharme et al., 2019; Lawrence et al., 2019; Hardouin et al., 2022), it is also essential to test the proposed framework within fully coupled climate simulations. Extending the evaluation to coupled configurations would allow the assessment of two-way feedbacks that cannot be captured offline, including how changes in soil moisture and surface energy partitioning affect boundary-layer conditions, precipitation recycling, and the persistence of temperature and moisture anomalies (e.g. Decharme and Colin, 2025). This perspective is particularly relevant for cold-region applications. In permafrost environments, small shifts in the seasonal ground heat budget, snow-free season evapotranspiration, or soil moisture regimes can influence soil temperature profiles and thaw dynamics, with potential consequences for land–atmosphere coupling at seasonal to interannual timescales (Ardilouze and Boone, 2024). Coupled experiments would therefore provide a more complete test of whether the improvements in soil hydrothermal consistency obtained with the Decharme (2025) approach translate into more robust simulations of near-surface climate and permafrost-related diagnostics, including active layer thickness and its sensitivity to climate variability.
A1 Soil heat transfer
Soil heat transfer in ISBA, as in many LSMs, is typically described by the one-dimensional heat diffusion equation derived from Fourier’s law:
where Csoil is the volumetric heat capacity of the bulk soil (), λsoil the bulk thermal conductivity (), T the soil temperature (K), t the time (s), and z the soil depth (m). The volumetric heat capacity is calculated as the weighted average of the heat capacities of the dry solid matrix, liquid water, and ice, neglecting air:
where , Cw and Ci () are the volumetric heat capacities of the dry solid matrix, water and ice, respectively.
Water and ice have a strong influence on Csoil because they can store heat within the soil pores, while air is neglected due to its negligible volumetric heat capacity. Accordingly, Cw=cwρwwl and Ci=ciρiwi represent the contributions from liquid water and ice, where cw and ci () are their specific heat capacities, ρw and ρi (kg m−3) their densities, and wl and wi (m3 m−3) their volumetric contents. Usually, Csoil is expressed as a mixture of organic and mineral domains. Previous parameterizations used the volumetric fraction of organic matter in the bulk soil to weight the mixture (Lawrence and Slater, 2008; Dankers et al., 2011; Chen et al., 2012; Chadburn et al., 2015; Decharme et al., 2016; Chen et al., 2016; Guimberteau et al., 2018; Sun et al., 2021), whereas recent approaches have shown that the volumetric fraction of organic matter in the solid phase should be used instead (Cuynet et al., 2025; Decharme, 2025).
The thermal conductivity of each soil layer, λsoil (), is computed from dry and saturated values, estimated from empirical relationships, and combined using the Kersten number as a function of soil moisture (Peters-Lidard et al., 1998) :
where λdry and λsat () are the dry and saturated thermal conductivities, respectively, and Ke (–) is the Kersten number, which increases with soil moisture content and equals 1 at saturation. This formulation allows a smooth transition from the low conductivity of dry soils to the higher conductivity of saturated soils. λdry is estimated from empirical relationships that account for bulk density and porosity. λsat is calculated as a geometric mean of the conductivities of the soil solid phase, water, and ice as follows:
where λs, λw, and λi () are the thermal conductivities of the soil solid phase, water, and ice, respectively, wsat (m3 m−3) the total porosity, and wl and wi (m3 m−3) the volumetric contents of liquid water and ice, respectively.
A1.1 The volumetric heat capacity of the dry solid matrix
In most previous parameterizations (and here in DE16), the volumetric heat capacity of the dry solid matrix, (), is simply computed as an arithmetic mean of the organic and mineral contributions weighted by the volumetric fraction of organic matter in the bulk soil, (m3 m−3):
where com and cms () are the specific heat capacities of organic matter and mineral substrate, and (kg m−3) their particle densities, and wsat (m3 m−3) the total porosity.
Recent studies (Cuynet et al., 2025; Decharme, 2025) have shown that this formulation is not physically consistent because refers to the fraction of organic matter in the bulk soil, including pores, whereas should be based on the volumetric fraction of organic matter in the solid phase, (m3 m−3). Using ensures mass-volume consistency and accounts for the true composition of the soil solid matrix. The correct formulation adopted in DE25 is therefore:
where can be derived from using the soil mixture theory (Decharme, 2025):
where (m3 m−3) is the porosity of the organic matter domain.
A1.2 The dry thermal conductivity
For a purely mineral soil, () is calculated following Peters-Lidard et al. (1998) as:
where (kg m−3) is the particle density of the mineral phase computed in ISBA following the PTF of Ruehlmann (2020), and (kg m−3) the dry bulk density of the mineral domain given by Eq. (1).
The soil dry thermal conductivity, λdry (), is thus usually computed in LSMs by combining the organic and mineral contributions according to their volumetric fractions in the bulk soil. As in Eq. (A4), and following the general approach for effective conductivities in heterogeneous porous media, Decharme et al. (2016) proposed a geometric mean, which is applied in the DE16 experiment:
where and () are the dry thermal conductivities of the organic and mineral domains, respectively.
Analyses presented in Decharme (2025) using binary mixture datasets have shown that the arithmetic mean does not fully reproduce the observed variation of λdry with . The results indicate that the mixing should be non-linear and, although a geometric mean appears acceptable, a geo-harmonic mean (Nielson and Rogers, 1982) provides a better fit across a wide range of organic matter contents, and is adopted in DE25:
This formulation captures the nonlinear decrease of λdry with increasing and better represents the behavior of mixed soils under dry conditions than using a geometric mean, although this remains a modeling choice.
A1.3 The thermal conductivity of the soil solid
The solid thermal conductivity of a purely mineral soil, (), is usually calculated following Peters-Lidard et al. (1998), which is based on the approach of Johansen (1977) and Farouki (1981). In this method, is expressed as a weighted geometric mean of the thermal conductivity of quartz and that of other minerals:
where λq and λo () are the thermal conductivities of quartz and other minerals, respectively, and (m3 m−3) is the quartz volumetric fraction of the mineral phase. The value of λq is typically set to 7.7 . The parameter can be estimated from soil texture, assuming that quartz is mainly contained in the sand fraction. In ISBA, is estimated from the sand fraction (kg kg−1) using the empirical relationship derived by Boone (2002) from tabular values given by Peters-Lidard et al. (1998) for all USDA soil types:
Two values of λo are used depending on quartz content. λo = 2.0 if 0.20 m3 m−3, and λo = 3.0 otherwise. This distinction accounts for the higher conductivity of non-quartz minerals in low-quartz soils (Peters-Lidard et al., 1998).
In organic-mineral soils, the thermal conductivity of the solid phase, λs (), is then computed by combining the conductivities of the organic and mineral domains. Decharme et al. (2016) noted that a geometric mean would be consistent with the formulation of the saturated thermal conductivity in Eq. (A4), and therefore adopted such mixing rule in DE16:
where () is the thermal conductivity of organic matter. This approach accounts for non-linear mixing between organic and mineral domains but still uses from the bulk soil rather than the fraction in the solid phase.
However, the DE16 formulation is physically inconsistent because it weights the mixing by from the bulk soil, which includes pore space (Balland and Arp, 2005; Cuynet et al., 2025). Instead, λs should be based on the volumetric fractions of organic matter within the solid phase only, as for quartz. Consequently, we adopt the formalism of Balland and Arp (2005), and in DE25 the solid-phase thermal conductivity is computed as a weighted geometric mean of the conductivities of organic matter, quartz, and other minerals, using their respective volumetric fractions in the solid phase:
where is the quartz volumetric fraction of the solid phase, accounting for the fact that quartz is present only in the mineral fraction of the solid phase. This formulation ensures that the mixing is carried out within the actual solid skeleton of the soil, excluding the pore space, and is therefore consistent with the physical definition of λsat given in Eq. (A4).
A2 Surface litter heat transfer and thermal properties
Surface litter commonly develops under forest canopies and forms a porous, low-density layer at the soil–atmosphere interface. In the present configuration, this litter option is activated only for forest tiles. It represents an explicit surface layer located above the SoilGrids-derived soil column. The SOM parameterizations described in Sect. 2.2 are instead applied to the soil layers themselves, using SoilGrids SOC and bulk density, whose first prescribed interval is 0 to 5 cm. Thus, litter and topsoil SOM effects can physically combine in forested soils, but they are not applied twice to the same numerical layer. Because litter water content varies rapidly and may freeze seasonally, litter influences surface thermal insulation and the transmission of temperature signals into the upper soil. In ISBA-MEB, the litter layer follows the hydrological formulation introduced by Napoly et al. (2017), including an explicit treatment of freezing and thawing in the litter water reservoir. Its heat transfer is solved using the same one-dimensional diffusion equation as for the soil, Eq. (A1), with litter-specific thermal properties. However, in the original implementation, the litter thermal conductivity parameterization depends only on liquid water content and neglects the contribution of ice, which makes it inconsistent under freezing conditions (Eq. A13 in Appendix A5 of Napoly et al., 2017). This formulation is therefore not consistent with freezing conditions. To address this limitation, we compute litter thermal properties using the same formalism as for the soil thermal scheme described in Appendix A, while treating the litter layer as a purely organic medium.
Specifically, litter thermal capacity and conductivity are computed using Eqs. (A6), (A10), and (A14), with the organic volumetric fractions set to unity ( and ). The litter bulk density is prescribed to 45 kg m−3 and the litter porosity to 0.95 m3 m−3 (Napoly et al., 2017). The thermal properties of organic matter are taken from Table 1. Liquid water and ice contents are those prognostically simulated for the litter layer in the Napoly et al. (2017) scheme. With this approach, the effect of freezing on litter thermal conductivity is explicitly accounted for, while preserving full consistency with the soil thermal formulation and avoiding the introduction of additional empirical parameters.
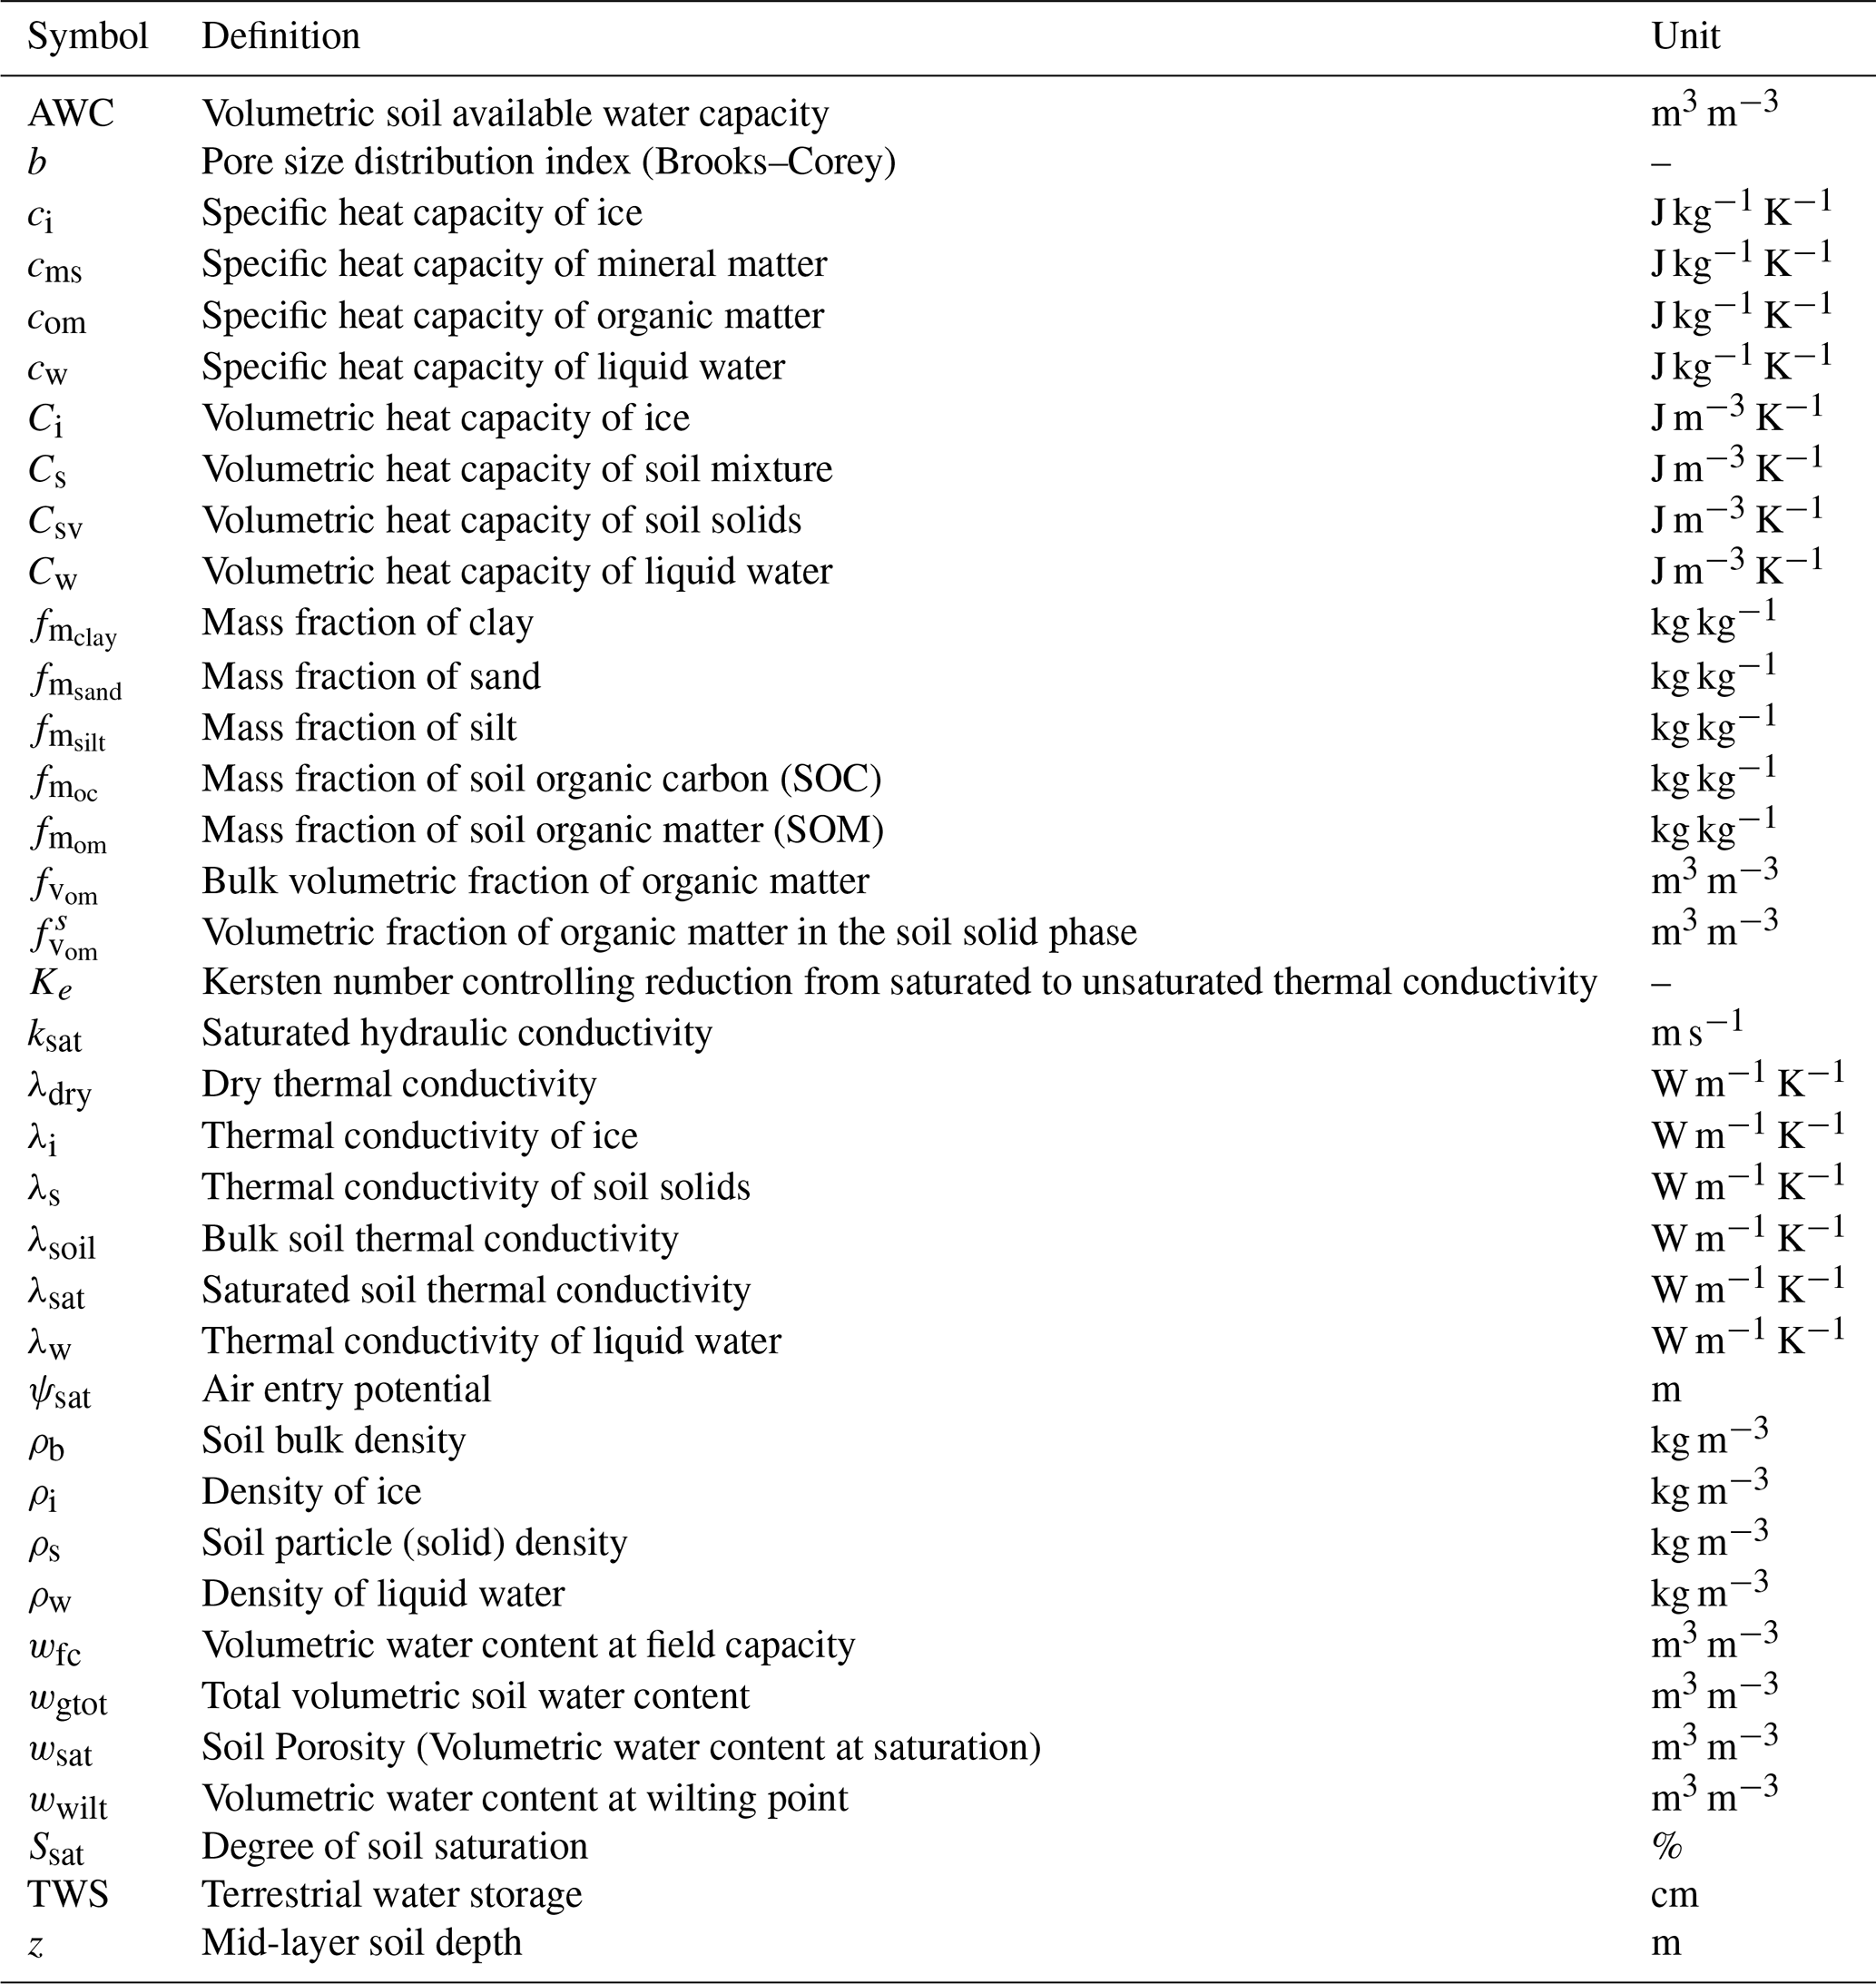
ISBA-CTRIP is embedded in the software SURFEX v9.0 available from the CNRM open-source website https://opensource.umr-cnrm.fr (last access: 3 August 2026) or https://www.umr-cnrm.fr/surfex/spip.php?rubrique8= (last access: 3 August 2026) under the CeCILL Free Software License Agreement v1.0. Versions including the DE16, DE25 and DE25c experiments are available in Decharme (2026) via Zenodo at https://doi.org/10.5281/zenodo.18619418. Data used for the figures are also provided on the Zenodo deposit.
The supplement related to this article is available online at https://doi.org/10.5194/gmd-19-7239-2026-supplement.
BD led the development of the main model, performed the modeling, and wrote the paper. DT processed the SoilGrids data for use in ISBA. LH and AB helped improve the surface runoff parameterization and the MEB scheme, respectively. MM is responsible for maintaining the SURFEX code. PL provided expertise in modeling. RG carried out the comparison between the SoilGrids and WoSIS products. All authors reviewed the paper.
At least one of the (co-)authors is a guest member of the editorial board of Geoscientific Model Development for the special issue “The externalised surface model SURFEX”. The peer-review process was guided by an independent editor, and the authors also have no other competing interests to declare.
Publisher's note: Copernicus Publications remains neutral with regard to jurisdictional claims made in the text, published maps, institutional affiliations, or any other geographical representation in this paper. The authors bear the ultimate responsibility for providing appropriate place names. Views expressed in the text are those of the authors and do not necessarily reflect the views of the publisher.
The authors gratefully acknowledge the Centre National de Recherches Météorologiques (CNRM) of Météo-France and the Centre National de la Recherche Scientifique (CNRS) for their support. We thank the three anonymous reviewers for their helpful comments, which contributed to improving the manuscript.
This research has been mainly supported by the ANR – France 2030 as part of the PEPR TRACCS program (grant no. ANR-22-EXTR-0009). This work also received partial support from the PEACE project within the FairCarboN exploratory program of France 2030 (grant no. ANR-22-PEXF-0011).
This paper was edited by Yuanchao Fan and reviewed by three anonymous referees.
Abatzoglou, J. T., Dobrowski, S. Z., Parks, S. A., and Hegewisch, K. C.: TerraClimate, a high-resolution global dataset of monthly climate and climatic water balance from 1958–2015, Scientific Data, 5, 170191, https://doi.org/10.1038/sdata.2017.191, 2018. a
Adams, W. A.: The effect of organic matter on the bulk and true densities of some uncultivated podzolic soils, J. Soil Sci., 24, 10–17, https://doi.org/10.1111/j.1365-2389.1973.tb00737.x, 1973. a
Antico, A., Aguiar, R. O., and Amsler, M. L.: Hydrometric Data Rescue in the Paraná River Basin, Water Resour. Res., 54, 1368–1381, https://doi.org/10.1002/2017WR020897, 2018. a
Ardilouze, C. and Boone, A. A.: Impact of initializing the soil with a thermally and hydrologically balanced state on subseasonal predictability, Clim. Dynam., 62, 2629–2644, https://doi.org/10.1007/s00382-023-07024-x, 2024. a
Arkhangel'skaya, T. A.: Parameterization and mathematical modeling of the dependence of soil thermal diffusivity on the water content, Eurasian Soil Sci.+, 42, https://doi.org/10.1134/S1064229309020070, 2009. a, b, c
Assouline, S.: Modeling the Relationship between Soil Bulk Density and the Water Retention Curve, Vadose Zone J., 5, 554–563, https://doi.org/10.2136/vzj2005.0083, 2006a. a, b
Assouline, S.: Modeling the Relationship between Soil Bulk Density and the Hydraulic Conductivity Function, Vadose Zone J., 5, https://doi.org/10.2136/vzj2005.0084, 2006b. a, b
Assouline, S., Tessier, D., and Tavares-Filho, J.: Effect of Compaction on Soil Physical and Hydraulic Properties: Experimental Results and Modeling, Soil Sci. Soc. Am. J., 61, 390–398, https://doi.org/10.2136/sssaj1997.03615995006100020005x, 1997. a, b
Balland, V. and Arp, P. A.: Modeling soil thermal conductivities over a wide range of conditions, J. Environ. Eng. Sci., 4, https://doi.org/10.1139/s05-007, 2005. a, b, c
Batey, T.: Soil compaction and soil management – a review, Soil Use Manage., 25, 335–345, https://doi.org/10.1111/j.1475-2743.2009.00236.x, 2009. a
Batjes, N. H., Ribeiro, E., van Oostrum, A., Leenaars, J., Hengl, T., and Mendes de Jesus, J.: WoSIS: providing standardised soil profile data for the world, Earth Syst. Sci. Data, 9, 1–14, https://doi.org/10.5194/essd-9-1-2017, 2017. a, b
Batjes, N. H., Calisto, L., and de Sousa, L. M.: Providing quality-assessed and standardised soil data to support global mapping and modelling (WoSIS snapshot 2023), Earth Syst. Sci. Data, 16, 4735–4765, https://doi.org/10.5194/essd-16-4735-2024, 2024. a, b
Blyth, E. M., Arora, V. K., Clark, D. B., Dadson, S. J., De Kauwe, M. G., Lawrence, D. M., Melton, J. R., Pongratz, J., Turton, R. H., Yoshimura, K., and Yuan, H.: Advances in Land Surface Modelling, Current Climate Change Reports, 7, 45–71, https://doi.org/10.1007/s40641-021-00171-5, 2021. a
Boelter, D.: Important physical properties of peat materials, in: Proceedings of the Third International Peat Congress, 18–23 August 1968, Quebec, Canada, Department of Energy, Mines and Resources and National Research Council of Canada, 150–154, https://research.fs.usda.gov/treesearch/12921 (last access: 3 August 2026), 1968. a, b, c, d, e
Boelter, D. H.: Physical Properties of Peats as Related to Degree of Decomposition, Soil Sci. Soc. Am. J., 33, 606–609, https://doi.org/10.2136/sssaj1969.03615995003300040033x, 1969. a, b, c, d, e
Bonan, G. B. and Doney, S. C.: Climate, ecosystems, and planetary futures: The challenge to predict life in Earth system models, Science, 359, https://doi.org/10.1126/science.aam8328, 2018. a
Boone, A.: Modélisation des processus hydrologiques dans le schéma de surface ISBA: Inclusion d'un réservoir hydrologique, du gel et modélisation de la neige., PhD thesis, Météo-France, Toulouse, http://bibliotheque.meteo.fr/exl-php/cadcgp.php?
CMD=CHERCHE&MODELE=vues/mf_-_internet_recherche_
avancee_anonyme/tpl-r.html&WHERE_IS_DOC_REF_LIT=
ISO00020893&&TABLE=ILS_DOC (last access: 3 August 2026), 2002. a
Boone, A. and Etchevers, P.: An Intercomparison of Three Snow Schemes of Varying Complexity Coupled to the Same Land Surface Model: Local-Scale Evaluation at an Alpine Site, J. Hydrometeorol., https://doi.org/10.1175/1525-7541(2001)002<0374:AIOTSS>2.0.CO;2, 2001. a
Boone, A., Masson, V., Meyers, T., and Noilhan, J.: The influence of the inclusion of soil freezing on simulations by a soil-vegetation-atmosphere transfer scheme, J. Appl. Meteorol., 39, https://doi.org/10.1175/1520-0450(2000)039<1544:TIOTIO>2.0.CO;2, 2000. a, b
Boone, A., Samuelsson, P., Gollvik, S., Napoly, A., Jarlan, L., Brun, E., and Decharme, B.: The interactions between soil–biosphere–atmosphere land surface model with a multi-energy balance (ISBA-MEB) option in SURFEXv8 – Part 1: Model description, Geosci. Model Dev., 10, 843–872, https://doi.org/10.5194/gmd-10-843-2017, 2017. a
Brooks, R.-H. and Corey, A.-T.: Hydraulic properties of porous media, Hydrology Papers, Colorado State University, Fort Collins, CO, 3, 27 pp., http://hdl.handle.net/10217/61288 (last access: 3 August 2026), 1964. a, b, c, d
Brown, J., Ferrians, O., Heginbottom, J., and Melnikov, E. S.: Circum-Arctic Map of Permafrost and Ground-Ice Conditions, (GGD318, Version 2), [Data Set], National Snow and Ice Data Center, Boulder, Colorado USA, https://doi.org/10.7265/SKBG-KF16 (last access: 20 January 2026), 2002. a
Burke, E. J., Zhang, Y., and Krinner, G.: Evaluating permafrost physics in the Coupled Model Intercomparison Project 6 (CMIP6) models and their sensitivity to climate change, The Cryosphere, 14, 3155–3174, https://doi.org/10.5194/tc-14-3155-2020, 2020. a
Campbell, G. S.: A simple method for determining unsaturated conductivity from moisture retention data, Soil Sci., 117, https://doi.org/10.1097/00010694-197406000-00001, 1974. a
Canadell, J., Jackson, R. B., Ehleringer, J. R., Mooney, H. A., Sala, O. E., and Schulze, E. D.: Maximum rooting depth of vegetation types at the global scale, Oecologia, 108, https://doi.org/10.1007/BF00329030, 1996. a
Carrer, D., Meurey, C., Ceamanos, X., Roujean, J. L., Calvet, J.-C., and Liu, S.: Dynamic mapping of snow-free vegetation and bare soil albedos at global 1km scale from 10-year analysis of MODIS satellite products, Remote Sens. Environ., https://doi.org/10.1016/j.rse.2013.08.041, 2014. a
Chadburn, S., Burke, E., Essery, R., Boike, J., Langer, M., Heikenfeld, M., Cox, P., and Friedlingstein, P.: An improved representation of physical permafrost dynamics in the JULES land-surface model, Geosci. Model Dev., 8, 1493–1508, https://doi.org/10.5194/gmd-8-1493-2015, 2015. a, b, c, d, e
Chadburn, S. E., Burke, E. J., Gallego-Sala, A. V., Smith, N. D., Bret-Harte, M. S., Charman, D. J., Drewer, J., Edgar, C. W., Euskirchen, E. S., Fortuniak, K., Gao, Y., Nakhavali, M., Pawlak, W., Schuur, E. A. G., and Westermann, S.: A new approach to simulate peat accumulation, degradation and stability in a global land surface scheme (JULES vn5.8_accumulate_soil) for northern and temperate peatlands, Geosci. Model Dev., 15, 1633–1657, https://doi.org/10.5194/gmd-15-1633-2022, 2022. a, b, c, d
Chen, L., Li, Y., Chen, F., Barr, A., Barlage, M., and Wan, B.: The incorporation of an organic soil layer in the Noah-MP land surface model and its evaluation over a boreal aspen forest, Atmos. Chem. Phys., 16, 8375–8387, https://doi.org/10.5194/acp-16-8375-2016, 2016. a, b, c, d
Chen, Y. Y., Yang, K., Tang, W. J., Qin, J., and Zhao, L.: Parameterizing soil organic carbon's impacts on soil porosity and thermal parameters for Eastern Tibet grasslands, Sci. China Earth Sci., 55, https://doi.org/10.1007/s11430-012-4433-0, 2012. a, b, c
Cosby, B. J., Hornberger, G. M., Clapp, R. B., and Ginn, T. R.: A Statistical Exploration of the Relationships of Soil Moisture Characteristics to the Physical Properties of Soils, Water Resour. Res., 20, 682–690, https://doi.org/10.1029/WR020i006p00682, 1984. a, b, c, d, e, f, g, h, i, j, k, l
Coucheney, E., Herrmann, A. M., and Jarvis, N.: A simple model of the turnover of organic carbon in a soil profile: model test, parameter identification and sensitivity, SOIL, 11, 715–733, https://doi.org/10.5194/soil-11-715-2025, 2025. a
Cuynet, A., Salmon, E., López-Blanco, E., Goeckede, M., Ikawa, H., Kobayashi, H., Lohila, A., and Ottlé, C.: Enhanced Prescription of Soil Organic and Mineral Content in the ORCHIDEE LSM to Better Simulate Soil Temperatures: Application at Nine High-Latitude GEM and FLUXNET Sites, J. Geophys. Res.-Biogeo., 130, e2025JG008776, https://doi.org/10.1029/2025JG008776, 2025. a, b, c, d, e, f, g
Dai, Y., Shangguan, W., Wei, N., Xin, Q., Yuan, H., Zhang, S., Liu, S., Lu, X., Wang, D., and Yan, F.: A review of the global soil property maps for Earth system models, SOIL, 5, 137–158, https://doi.org/10.5194/soil-5-137-2019, 2019. a
Danielson, J. J. and Gesch, D. B.: Global multi-resolution terrain elevation data 2010 (GMTED2010), Tech. rep., https://doi.org/10.3133/ofr20111073, 2011. a
Dankers, R., Burke, E. J., and Price, J.: Simulation of permafrost and seasonal thaw depth in the JULES land surface scheme, The Cryosphere, 5, 773–790, https://doi.org/10.5194/tc-5-773-2011, 2011. a, b, c, d, e, f, g, h
De Vos, B., Van Meirvenne, M., Quataert, P., Deckers, J., and Muys, B.: Predictive Quality of Pedotransfer Functions for Estimating Bulk Density of Forest Soils, Soil Sci. Soc. Am. J., 69, 500–510, https://doi.org/10.2136/sssaj2005.0500, 2005. a
Decharme, B.: A process-based modeling of soil organic matter physical properties for land surface models – Part 1: Soil mixture theory, Geosci. Model Dev., 18, 9349–9384, https://doi.org/10.5194/gmd-18-9349-2025, 2025. a, b, c, d, e, f, g, h, i, j, k, l, m, n, o, p, q, r, s, t, u, v, w, x, y, z, aa, ab, ac, ad, ae, af, ag, ah, ai, aj, ak, al, am, an, ao, ap, aq
Decharme, B.: Supporting information for the study “A process-based modeling of soil organic matter physical properties for land surface models – Part 2: Global land surface simulations and mineral soil compaction adjustment”, Zenodo [data set], https://doi.org/10.5281/zenodo.18619418, 2026. a
Decharme, B. and Colin, J.: Influence of floodplains and groundwater dynamics on the present-day climate simulated by the CNRM climate model, Earth Syst. Dynam., 16, 729–752, https://doi.org/10.5194/esd-16-729-2025, 2025. a, b, c, d
Decharme, B. and Douville, H.: Introduction of a sub-grid hydrology in the ISBA land surface model, Clim. Dynam., 26, https://doi.org/10.1007/s00382-005-0059-7, 2006. a, b
Decharme, B., Douville, H., Boone, A., Habets, F., and Noilhan, J.: Impact of an Exponential Profile of Saturated Hydraulic Conductivity within the ISBA LSM: Simulations over the Rhône Basin, J. Hydrometeorol., 7, 61–80, https://doi.org/10.1175/JHM469.1, 2006. a, b
Decharme, B., Boone, A., Delire, C., and Noilhan, J.: Local evaluation of the Interaction between Soil Biosphere Atmosphere soil multilayer diffusion scheme using four pedotransfer functions, J. Geophys. Res.-Atmos., 116, https://doi.org/10.1029/2011JD016002, 2011. a
Decharme, B., Alkama, R., Papa, F., Faroux, S., Douville, H., and Prigent, C.: Global off-line evaluation of the ISBA-TRIP flood model, Clim. Dynam., 38, 1389–1412, https://doi.org/10.1007/s00382-011-1054-9, 2012. a, b
Decharme, B., Martin, E., and Faroux, S.: Reconciling soil thermal and hydrological lower boundary conditions in land surface models, J. Geophys. Res.-Atmos., 118, https://doi.org/10.1002/jgrd.50631, 2013. a, b
Decharme, B., Brun, E., Boone, A., Delire, C., Le Moigne, P., and Morin, S.: Impacts of snow and organic soils parameterization on northern Eurasian soil temperature profiles simulated by the ISBA land surface model, The Cryosphere, 10, 853–877, https://doi.org/10.5194/tc-10-853-2016, 2016. a, b, c, d, e, f, g, h, i, j, k, l, m, n, o, p
Decharme, B., Delire, C., Minvielle, M., Colin, J., Vergnes, J., Alias, A., Saint-Martin, D., Séférian, R., Sénési, S., and Voldoire, A.: Recent Changes in the ISBA-CTRIP Land Surface System for Use in the CNRM-CM6 Climate Model and in Global Off-Line Hydrological Applications, J. Adv. Model. Earth Sy., 11, 1207–1252, https://doi.org/10.1029/2018MS001545, 2019. a, b, c, d, e, f, g, h, i
Decharme, B., Costantini, M., and Colin, J.: A Simple Approach to Represent Irrigation Water Withdrawals in Earth System Models, J. Adv. Model. Earth Sy., 17, e2024MS004508, https://doi.org/10.1029/2024MS004508, 2025. a, b, c, d
Delire, C., Séférian, R., Decharme, B., Alkama, R., Calvet, J., Carrer, D., Gibelin, A., Joetzjer, E., Morel, X., Rocher, M., and Tzanos, D.: The Global Land Carbon Cycle Simulated With ISBA-CTRIP: Improvements Over the Last Decade, J. Adv. Model. Earth Sy., 12, e2019MS001886, https://doi.org/10.1029/2019MS001886, 2020. a, b, c
Dias, A. S., Hughes, P. N., and Toll, D. G.: Soil–Water Retention Curve Prediction for Compacted London Clay Subjected to Moisture Cycles, Geotechnical and Geological Engineering, 42, https://doi.org/10.1007/s10706-023-02706-z, 2024. a
Dirmeyer, P. A., Gao, X., Zhao, M., Guo, Z., Oki, T., and Hanasaki, N.: GSWP-2: Multimodel Analysis and Implications for Our Perception of the Land Surface, B. Am. Meteorol. Soc., 87, 1381–1398, https://doi.org/10.1175/BAMS-87-10-1381, 2006. a
Fan, N., Koirala, S., Reichstein, M., Thurner, M., Avitabile, V., Santoro, M., Ahrens, B., Weber, U., and Carvalhais, N.: Apparent ecosystem carbon turnover time: uncertainties and robust features, Earth Syst. Sci. Data, 12, 2517–2536, https://doi.org/10.5194/essd-12-2517-2020, 2020. a, b
FAO and IIASA: Harmonized World Soil Database version 2.0, FAO, International Institute for Applied Systems Analysis (IIASA), https://doi.org/10.4060/cc3823en, 2023. a
Farouki, O. T.: Thermal Properties of Soils – CRREL Monograph, US Army Cold Regions Research and Engineering Laboratory, 11, https://usace.contentdm.oclc.org/digital/collection/p266001coll1/id/6302 (last access: 3 August 2026), 1981. a
Faroux, S., Kaptué Tchuenté, A. T., Roujean, J.-L., Masson, V., Martin, E., and Le Moigne, P.: ECOCLIMAP-II/Europe: a twofold database of ecosystems and surface parameters at 1 km resolution based on satellite information for use in land surface, meteorological and climate models, Geosci. Model Dev., 6, 563–582, https://doi.org/10.5194/gmd-6-563-2013, 2013. a
Gaillard, R., Peylin, P., Cadule, P., Bastrikov, V., Chéruy, F., Cuynet, A., Ghattas, J., Zhu, D., and Guenet, B.: Arctic soil carbon insulation averts large spring cooling from surface–atmosphere feedbacks, P. Natl. Acad. Sci. USA, 122, e2410226122, https://doi.org/10.1073/pnas.2410226122, 2025. a, b, c, d, e
GRDC: The Global Runoff Data Centre Data Portal, GRDC [data set], https://grdc.bafg.de/data/data_portal/ (last access: 3 August 2026), 2025. a
Guimberteau, M., Zhu, D., Maignan, F., Huang, Y., Yue, C., Dantec-Nédélec, S., Ottlé, C., Jornet-Puig, A., Bastos, A., Laurent, P., Goll, D., Bowring, S., Chang, J., Guenet, B., Tifafi, M., Peng, S., Krinner, G., Ducharne, A., Wang, F., Wang, T., Wang, X., Wang, Y., Yin, Z., Lauerwald, R., Joetzjer, E., Qiu, C., Kim, H., and Ciais, P.: ORCHIDEE-MICT (v8.4.1), a land surface model for the high latitudes: model description and validation, Geosci. Model Dev., 11, 121–163, https://doi.org/10.5194/gmd-11-121-2018, 2018. a, b, c, d, e
Gupta, S., Hengl, T., Lehmann, P., Bonetti, S., and Or, D.: SoilKsatDB: global database of soil saturated hydraulic conductivity measurements for geoscience applications, Earth Syst. Sci. Data, 13, 1593–1612, https://doi.org/10.5194/essd-13-1593-2021, 2021. a
Håkansson, I.: A method for characterizing the state of compactness of the plough layer, Soil Till. Res., 16, 105–120, https://doi.org/10.1016/0167-1987(90)90024-8, 1990. a
Håkansson, I. and Lipiec, J.: A review of the usefulness of relative bulk density values in studies of soil structure and compaction, Soil Till. Res., 53, 71–85, https://doi.org/10.1016/S0167-1987(99)00095-1, 2000. a, b
Harbo, L. S., Lacoste, M., Boulonne, L., Wengler, J., Fenton, O., Bondi, G., Tuohy, P., Beucher, A. M., Lamandé, M., D'Hose, T., and Schneider, F.: Towards a Quantitative Estimate of Anthropogenic Subsoil Compaction in European Croplands Based on National Soil Surveys, European J. Soil Sci., 76, https://doi.org/10.1111/ejss.70150, 2025. a
Hardouin, L., Delire, C., Decharme, B., Lawrence, D. M., Nabel, J. E. M. S., Brovkin, V., Collier, N., Fisher, R., Hoffman, F. M., Koven, C. D., Séférian, R., and Stacke, T.: Uncertainty in land carbon budget simulated by terrestrial biosphere models: the role of atmospheric forcing, Environ. Res. Lett., 17, 094033, https://doi.org/10.1088/1748-9326/ac888d, 2022. a
Hardouin, L., Decharme, B., Colin, J., and Delire, C.: Climate-Driven Projections of Future Global Wetlands Extent, Earths Future, 12, https://doi.org/10.1029/2024EF004553, 2024. a
Hollis, J. M., Lilly, A., Higgins, A., Jones, R. J. A., Keay, C. A., and Bellamy, P.: Predicting the water retention characteristics of UK mineral soils, Eur. J. Soil Sci., 66, 239–252, https://doi.org/10.1111/ejss.12186, 2015. a
Hudson, B. D.: Soil organic matter and available water capacity, J. Soil Water Conserv., 49, 189–194, https://doi.org/10.1080/00224561.1994.12456850, 1994. a
Huntington, T. G.: Soil: Organic Matter and Available Water Capacity, in: Landscape and Land Capacity, vol. 49, pp. 273–281, CRC Press, Second edition | Boca Raton: CRC Press, [2020] | Revised edition of: Encyclopedia of natural resources, [2014], https://doi.org/10.1201/9780429445552-36, 2003. a
Hybam: Hybam – Amazon basin water resources observation service, https://hybam.obs-mip.fr/en/homepage/ (last access: 3 August 2026), 2025. a
Johansen, O.: Thermal Conductivity of Soils, CRREL Draft Translation 637, U.S. Army Cold Regions Research and Engineering Laboratory, Hanover, New Hampshire, USA, 291 pp., English translation of the PhD thesis Termisk ledningsevne av jordarter, Norwegian Institute of Technology, Trondheim, Norway, 1975, https://www.researchgate.net/publication/235140845_Thermal_Conductivity_of_Soils (last access: 3 August 2026), 1977. a, b
Jones, R., Spoor, G., and Thomasson, A.: Vulnerability of subsoils in Europe to compaction: a preliminary analysis, Soil Till. Res., 73, 131–143, https://doi.org/10.1016/S0167-1987(03)00106-5, 2003. a, b
Keller, T. and Håkansson, I.: Estimation of reference bulk density from soil particle size distribution and soil organic matter content, Geoderma, https://doi.org/10.1016/j.geoderma.2009.11.013, 2010. a, b, c, d, e
Koster, R. D. and Mahanama, S. P. P.: Land Surface Controls on Hydroclimatic Means and Variability, J. Hydrometeorol., 13, 1604–1620, https://doi.org/10.1175/JHM-D-12-050.1, 2012. a
Kristensen, J. A., Balstrøm, T., Jones, R. J. A., Jones, A., Montanarella, L., Panagos, P., and Breuning-Madsen, H.: Development of a harmonised soil profile analytical database for Europe: a resource for supporting regional soil management, SOIL, 5, 289–301, https://doi.org/10.5194/soil-5-289-2019, 2019. a, b, c
Landerer, F.: CSR TELLUS GRACE-FO Level-3 Monthly Ocean Bottom Pressure Anomaly Release 6.0 version 04 in netCDF/ASCII/GeoTIFF Formats, Ver. RL06v04. PO.DAAC, CA, USA [data set], https://doi.org/10.5067/GFOCN-3AC64, 2021. a
Lawrence, D. M. and Slater, A. G.: Incorporating organic soil into a global climate model, Clim. Dynam., 30, https://doi.org/10.1007/s00382-007-0278-1, 2008. a, b, c, d, e, f, g, h, i
Lawrence, D. M., Slater, A. G., and Swenson, S. C.: Simulation of Present-Day and Future Permafrost and Seasonally Frozen Ground Conditions in CCSM4, J. Climate, 25, 2207–2225, https://doi.org/10.1175/JCLI-D-11-00334.1, 2012. a
Lawrence, D. M., Fisher, R. A., Koven, C. D., Oleson, K. W., Swenson, S. C., Bonan, G., Collier, N., Ghimire, B., van Kampenhout, L., Kennedy, D., Kluzek, E., Lawrence, P. J., Li, F., Li, H., Lombardozzi, D., Riley, W. J., Sacks, W. J., Shi, M., Vertenstein, M., Wieder, W. R., Xu, C., Ali, A. A., Badger, A. M., Bisht, G., van den Broeke, M., Brunke, M. A., Burns, S. P., Buzan, J., Clark, M., Craig, A., Dahlin, K., Drewniak, B., Fisher, J. B., Flanner, M., Fox, A. M., Gentine, P., Hoffman, F., Keppel-Aleks, G., Knox, R., Kumar, S., Lenaerts, J., Leung, L. R., Lipscomb, W. H., Lu, Y., Pandey, A., Pelletier, J. D., Perket, J., Randerson, J. T., Ricciuto, D. M., Sanderson, B. M., Slater, A., Subin, Z. M., Tang, J., Thomas, R. Q., Val Martin, M., and Zeng, X.: The Community Land Model Version 5: Description of New Features, Benchmarking, and Impact of Forcing Uncertainty, J. Adv. Model. Earth Sy., 11, https://doi.org/10.1029/2018MS001583, 2019. a
Lembrechts, J. J., van den Hoogen, J., Aalto, J., Ashcroft, M. B., De Frenne, P., Kemppinen, J., Kopecký, M., Luoto, M., Maclean, I. M. D., Crowther, T. W., Bailey, J. J., Haesen, S., Klinges, D. H., Niittynen, P., Scheffers, B. R., Van Meerbeek, K., Aartsma, P., Abdalaze, O., Abedi, M., Aerts, R., Ahmadian, N., Ahrends, A., Alatalo, J. M., Alexander, J. M., Allonsius, C. N., Altman, J., Ammann, C., Andres, C., Andrews, C., Ardö, J., Arriga, N., Arzac, A., Aschero, V., Assis, R. L., Assmann, J. J., Bader, M. Y., Bahalkeh, K., Barančok, P., Barrio, I. C., Barros, A., Barthel, M., Basham, E. W., Bauters, M., Bazzichetto, M., Marchesini, L. B., Bell, M. C., Benavides, J. C., Benito Alonso, J. L., Berauer, B. J., Bjerke, J. W., Björk, R. G., Björkman, M. P., Björnsdóttir, K., Blonder, B., Boeckx, P., Boike, J., Bokhorst, S., Brum, B. N. S., Brůna, J., Buchmann, N., Buysse, P., Camargo, J. L., Campoe, O. C., Candan, O., Canessa, R., Cannone, N., Carbognani, M., Carnicer, J., Casanova-Katny, A., Cesarz, S., Chojnicki, B., Choler, P., Chown, S. L., Cifuentes, E. F., Čiliak, M., Contador, T., Convey, P., Cooper, E. J., Cremonese, E., Curasi, S. R., Curtis, R., Cutini, M., Dahlberg, C. J., Daskalova, G. N., de Pablo, M. A., Della Chiesa, S., Dengler, J., Deronde, B., Descombes, P., Di Cecco, V., Di Musciano, M., Dick, J., Dimarco, R. D., Dolezal, J., Dorrepaal, E., Dušek, J., Eisenhauer, N., Eklundh, L., Erickson, T. E., Erschbamer, B., Eugster, W., Ewers, R. M., Exton, D. A., Fanin, N., Fazlioglu, F., Feigenwinter, I., Fenu, G., Ferlian, O., Fernández Calzado, M. R., Fernández-Pascual, E., Finckh, M., Higgens, R. F., Forte, T. G. W., Freeman, E. C., Frei, E. R., Fuentes-Lillo, E., García, R. A., García, M. B., Géron, C., Gharun, M., Ghosn, D., Gigauri, K., Gobin, A., Goded, I., Goeckede, M., Gottschall, F., Goulding, K., Govaert, S., Graae, B. J., Greenwood, S., Greiser, C., Grelle, A., Guénard, B., Guglielmin, M., Guillemot, J., Haase, P., Haider, S., Halbritter, A. H., Hamid, M., Hammerle, A., Hampe, A., Haugum, S. V., Hederová, L., Heinesch, B., Helfter, C., Hepenstrick, D., Herberich, M., Herbst, M., Hermanutz, L., Hik, D. S., Hoffrén, R., Homeier, J., Hörtnagl, L., Høye, T. T., Hrbacek, F., Hylander, K., Iwata, H., Jackowicz-Korczynski, M. A., Jactel, H., Järveoja, J., Jastrzȩbowski, S., Jentsch, A., Jiménez, J. J., Jónsdóttir, I. S., Jucker, T., Jump, A. S., Juszczak, R., Kanka, R., Kašpar, V., Kazakis, G., Kelly, J., Khuroo, A. A., Klemedtsson, L., Klisz, M., Kljun, N., Knohl, A., Kobler, J., Kollár, J., Kotowska, M. M., Kovács, B., Kreyling, J., Lamprecht, A., Lang, S. I., Larson, C., Larson, K., Laska, K., le Maire, G., Leihy, R. I., Lens, L., Liljebladh, B., Lohila, A., Lorite, J., Loubet, B., Lynn, J., Macek, M., Mackenzie, R., Magliulo, E., Maier, R., Malfasi, F., Máliš, F., Man, M., Manca, G., Manco, A., Manise, T., Manolaki, P., Marciniak, F., Matula, R., Mazzolari, A. C., Medinets, S., Medinets, V., Meeussen, C., Merinero, S., Mesquita, R. d. C. G., Meusburger, K., Meysman, F. J. R., Michaletz, S. T., Milbau, A., Moiseev, D., Moiseev, P., Mondoni, A., Monfries, R., Montagnani, L., Moriana-Armendariz, M., Morra di Cella, U., Mörsdorf, M., Mosedale, J. R., Muffler, L., Muñoz-Rojas, M., Myers, J. A., Myers-Smith, I. H., Nagy, L., Nardino, M., Naujokaitis-Lewis, I., Newling, E., Nicklas, L., Niedrist, G., Niessner, A., Nilsson, M. B., Normand, S., Nosetto, M. D., Nouvellon, Y., Nuñez, M. A., Ogaya, R., Ogée, J., Okello, J., Olejnik, J., Olesen, J. E., Opedal, Ø. H., Orsenigo, S., Palaj, A., Pampuch, T., Panov, A. V., Pärtel, M., Pastor, A., Pauchard, A., Pauli, H., Pavelka, M., Pearse, W. D., Peichl, M., Pellissier, L., Penczykowski, R. M., Penuelas, J., Petit Bon, M., Petraglia, A., Phartyal, S. S., Phoenix, G. K., Pio, C., Pitacco, A., Pitteloud, C., Plichta, R., Porro, F., Portillo-Estrada, M., Poulenard, J., Poyatos, R., Prokushkin, A. S., Puchalka, R., Puşcaş, M., Radujković, D., Randall, K., Ratier Backes, A., Remmele, S., Remmers, W., Renault, D., Risch, A. C., Rixen, C., Robinson, S. A., Robroek, B. J. M., Rocha, A. V., Rossi, C., Rossi, G., Roupsard, O., Rubtsov, A. V., Saccone, P., Sagot, C., Sallo Bravo, J., Santos, C. C., Sarneel, J. M., Scharnweber, T., Schmeddes, J., Schmidt, M., Scholten, T., Schuchardt, M., Schwartz, N., Scott, T., Seeber, J., Segalin de Andrade, A. C., Seipel, T., Semenchuk, P., Senior, R. A., Serra-Diaz, J. M., Sewerniak, P., Shekhar, A., Sidenko, N. V., Siebicke, L., Siegwart Collier, L., Simpson, E., Siqueira, D. P., Sitková, Z., Six, J., Smiljanic, M., Smith, S. W., Smith-Tripp, S., Somers, B., Sørensen, M. V., Souza, J. J. L. L., Souza, B. I., Souza Dias, A., Spasojevic, M. J., Speed, J. D. M., Spicher, F., Stanisci, A., Steinbauer, K., Steinbrecher, R., Steinwandter, M., Stemkovski, M., Stephan, J. G., Stiegler, C., Stoll, S., Svátek, M., Svoboda, M., Tagesson, T., Tanentzap, A. J., Tanneberger, F., Theurillat, J., Thomas, H. J. D., Thomas, A. D., Tielbörger, K., Tomaselli, M., Treier, U. A., Trouillier, M., Turtureanu, P. D., Tutton, R., Tyystjärvi, V. A., Ueyama, M., Ujházy, K., Ujházyová, M., Uogintas, D., Urban, A. V., Urban, J., Urbaniak, M., Ursu, T., Vaccari, F. P., Van de Vondel, S., van den Brink, L., Van Geel, M., Vandvik, V., Vangansbeke, P., Varlagin, A., Veen, G. F., Veenendaal, E., Venn, S. E., Verbeeck, H., Verbrugggen, E., Verheijen, F. G. A., Villar, L., Vitale, L., Vittoz, P., Vives-Ingla, M., von Oppen, J., Walz, J., Wang, R., Wang, Y., Way, R. G., Wedegärtner, R. E. M., Weigel, R., Wild, J., Wilkinson, M., Wilmking, M., Wingate, L., Winkler, M., Wipf, S., Wohlfahrt, G., Xenakis, G., Yang, Y., Yu, Z., Yu, K., Zellweger, F., Zhang, J., Zhang, Z., Zhao, P., Ziemblińska, K., Zimmermann, R., Zong, S., Zyryanov, V. I., Nijs, I., and Lenoir, J.: Global maps of soil temperature, Glob. Change Biol., 28, 3110–3144, https://doi.org/10.1111/gcb.16060, 2022. a, b, c
Lennartz, B. and Liu, H.: Hydraulic Functions of Peat Soils and Ecosystem Service, Frontiers in Environmental Science, 7, https://doi.org/10.3389/fenvs.2019.00092, 2019. a
Letts, M. G., Comer, N. T., Roulet, N. T., Skarupa, M. R., and Verseghy, D. L.: Parametrization of peatland hydraulic properties for the Canadian land surface scheme, Atmos. Ocean, 38, https://doi.org/10.1080/07055900.2000.9649643, 2000. a, b, c, d, e, f
Li, B., Ryu, Y., Jiang, C., Dechant, B., Liu, J., Yan, Y., and Li, X.: BESSv2.0: A satellite-based and coupled-process model for quantifying long-term global land–atmosphere fluxes, Remote Sens. Environ., 295, 113696, https://doi.org/10.1016/j.rse.2023.113696, 2023. a
Li, C., Liu, Z., Yang, W., Tu, Z., Han, J., Li, S., and Yang, H.: CAMELE: Collocation-Analyzed Multi-source Ensembled Land Evapotranspiration Data, Earth Syst. Sci. Data, 16, 1811–1846, https://doi.org/10.5194/essd-16-1811-2024, 2024. a
Liu, H. and Lennartz, B.: Hydraulic properties of peat soils along a bulk density gradient—A meta study, Hydrol. Process., 33, https://doi.org/10.1002/hyp.13314, 2019. a, b, c, d, e, f
Liu, H., Rezanezhad, F., and Lennartz, B.: Impact of land management on available water capacity and water storage of peatlands, Geoderma, 406, https://doi.org/10.1016/j.geoderma.2021.115521, 2022. a, b, c
Lohmann, D., Mitchell, K. E., Houser, P. R., Wood, E. F., Schaake, J. C., Robock, A., Cosgrove, B. A., Sheffield, J., Duan, Q., Luo, L., Higgins, R. W., Pinker, R. T., and Tarpley, J. D.: Streamflow and water balance intercomparisons of four land surface models in the North American Land Data Assimilation System project, J. Geophys. Res.-Atmos., 109, https://doi.org/10.1029/2003JD003517, 2004. a
Marthews, T. R., Dadson, S. J., Lehner, B., Abele, S., and Gedney, N.: High-resolution global topographic index values for use in large-scale hydrological modelling, Hydrol. Earth Syst. Sci., 19, 91–104, https://doi.org/10.5194/hess-19-91-2015, 2015. a
Masson, V., Champeaux, J. L., Chauvin, F., Meriguet, C., and Lacaze, R.: A global database of land surface parameters at 1-km resolution in meteorological and climate models, J. Climate, https://doi.org/10.1175/1520-0442(2003)16<1261:AGDOLS>2.0.CO;2, 2003. a
Masson, V., Le Moigne, P., Martin, E., Faroux, S., Alias, A., Alkama, R., Belamari, S., Barbu, A., Boone, A., Bouyssel, F., Brousseau, P., Brun, E., Calvet, J.-C., Carrer, D., Decharme, B., Delire, C., Donier, S., Essaouini, K., Gibelin, A.-L., Giordani, H., Habets, F., Jidane, M., Kerdraon, G., Kourzeneva, E., Lafaysse, M., Lafont, S., Lebeaupin Brossier, C., Lemonsu, A., Mahfouf, J.-F., Marguinaud, P., Mokhtari, M., Morin, S., Pigeon, G., Salgado, R., Seity, Y., Taillefer, F., Tanguy, G., Tulet, P., Vincendon, B., Vionnet, V., and Voldoire, A.: The SURFEXv7.2 land and ocean surface platform for coupled or offline simulation of earth surface variables and fluxes, Geosci. Model Dev., 6, 929–960, https://doi.org/10.5194/gmd-6-929-2013, 2013. a
Matthes, H., Damseaux, A., Westermann, S., Beer, C., Boone, A., Burke, E., Decharme, B., Genet, H., Jafarov, E., Langer, M., Parmentier, F., Porada, P., Gagne-Landmann, A., Huntzinger, D., Rogers, B., Schädel, C., Stacke, T., Wells, J., and Wieder, W.: Advances in Permafrost Representation: Biophysical Processes in Earth System Models and the Role of Offline Models, Permafrost Periglac., 36, 302–318, https://doi.org/10.1002/ppp.2269, 2025. a
Meurer, K. H. E., Chenu, C., Coucheney, E., Herrmann, A. M., Keller, T., Kätterer, T., Nimblad Svensson, D., and Jarvis, N.: Modelling dynamic interactions between soil structure and the storage and turnover of soil organic matter, Biogeosciences, 17, 5025–5042, https://doi.org/10.5194/bg-17-5025-2020, 2020. a
Morris, P. J., Davies, M. L., Baird, A. J., Balliston, N., Bourgault, M. A., Clymo, R. S., Fewster, R. E., Furukawa, A. K., Holden, J., Kessel, E., Ketcheson, S. J., Kløve, B., Larocque, M., Marttila, H., Menberu, M. W., Moore, P. A., Price, J. S., Ronkanen, A. K., Rosa, E., Strack, M., Surridge, B. W., Waddington, J. M., Whittington, P., and Wilkinson, S. L.: Saturated Hydraulic Conductivity in Northern Peats Inferred From Other Measurements, Water Resour. Res., 58, https://doi.org/10.1029/2022WR033181, 2022. a
Napoly, A., Boone, A., Samuelsson, P., Gollvik, S., Martin, E., Seferian, R., Carrer, D., Decharme, B., and Jarlan, L.: The interactions between soil–biosphere–atmosphere (ISBA) land surface model multi-energy balance (MEB) option in SURFEXv8 – Part 2: Introduction of a litter formulation and model evaluation for local-scale forest sites, Geosci. Model Dev., 10, 1621–1644, https://doi.org/10.5194/gmd-10-1621-2017, 2017. a, b, c, d, e, f
Nawaz, M. F., Bourrié, G., and Trolard, F.: Soil compaction impact and modelling. A review, Agron. Sustain. Dev., 33, 291–309, https://doi.org/10.1007/s13593-011-0071-8, 2013. a, b
Nelson, F. E., Shiklomanov, N. I., and Nyland, K. E.: Cool, CALM, collected: the Circumpolar Active Layer Monitoring program and network, Polar Geography, 44, 155–166, https://doi.org/10.1080/1088937X.2021.1988001, 2021. a
Nielson, K. and Rogers, V.: Mathematical model for radon diffusion in earthen materials, Tech. rep., Pacific Northwest National Laboratory (PNNL), Richland, WA (United States), https://doi.org/10.2172/6678584, 1982. a
Núñez-González, F., Martín-Vide, J. P., and Kleinhans, M. G.: Porosity and size gradation of saturated gravel with percolated fines, Sedimentology, 63, 1209–1232, https://doi.org/10.1111/sed.12257, 2016. a
OFB: Naïades – Données sur la qualité des eaux de surface en France, Office Français de la Biodiversité, https://naiades.eaufrance.fr/ (last access: 3 August 2026), 2025. a
Or, D., Leij, F. J., Snyder, V., and Ghezzehei, T. A.: Stochastic model for posttillage soil pore space evolution, Water Resour. Res., 36, 1641–1652, https://doi.org/10.1029/2000WR900092, 2000. a, b
Pachepsky, Y. and Rawls, W.: Soil structure and pedotransfer functions, Eur. J. Soil Sci., 54, 443–452, https://doi.org/10.1046/j.1365-2389.2003.00485.x, 2003. a
Paleologos, E. K., Neuman, S. P., and Tartakovsky, D.: Effective Hydraulic Conductivity of Bounded, Strongly Heterogeneous Porous Media, Water Resour. Res., 32, 1333–1341, https://doi.org/10.1029/95WR02712, 1996. a
Pan, Y., Lyu, S., Li, S., Gao, Y., Meng, X., Ao, Y., and Wang, S.: Simulating the role of gravel in freeze–thaw process on the Qinghai–Tibet Plateau, Theor. Appl. Climatol., 127, 1011–1022, https://doi.org/10.1007/s00704-015-1684-7, 2017. a
Panagos, P., De Rosa, D., Liakos, L., Labouyrie, M., Borrelli, P., and Ballabio, C.: Soil bulk density assessment in Europe, Agr. Ecosyst. Environ., 364, 108907, https://doi.org/10.1016/j.agee.2024.108907, 2024. a, b
Peters, A., Germer, K., Naseri, M., Rolfes, L., and Lorenz, M.: Modeling compaction effects on hydraulic properties of soils using limited information, Soil Till. Res., 246, 106349, https://doi.org/10.1016/j.still.2024.106349, 2025. a, b
Peters-Lidard, C. D., Blackburn, E., Liang, X., and Wood, E. F.: The effect of soil thermal conductivity parameterization on surface energy fluxes and temperatures, J. Atmos. Sci., 55, https://doi.org/10.1175/1520-0469(1998)055<1209:TEOSTC>2.0.CO;2, 1998. a, b, c, d, e, f
Poggio, L., de Sousa, L. M., Batjes, N. H., Heuvelink, G. B. M., Kempen, B., Ribeiro, E., and Rossiter, D.: SoilGrids 2.0: producing soil information for the globe with quantified spatial uncertainty, SOIL, 7, 217–240, https://doi.org/10.5194/soil-7-217-2021, 2021. a, b
Prudic, D.: Estimates of hydraulic conductivity from aquifer-test analyses and specific-capacity data, Gulf Coast Regional Aquifer Systems, south-central United States, Tech. rep., U. S. Geological Survey, https://doi.org/10.3133/wri904121, 1991. a
Raats, P. A.: Applications of the theory of mixtures in soil science, Math. Modelling, 9, https://doi.org/10.1016/0270-0255(87)90003-0, 1987. a
Rahmati Ziveh, A., Vargas Godoy, M. R., Thakur, V., and Markonis, Y.: evapoRe, Zenodo [data set], https://doi.org/10.5281/zenodo.14622177, 2025. a, b
Rawls, W., Pachepsky, Y., Ritchie, J., Sobecki, T., and Bloodworth, H.: Effect of soil organic carbon on soil water retention, Geoderma, 116, 61–76, https://doi.org/10.1016/S0016-7061(03)00094-6, 2003. a, b, c
Reeve, M. J., Smith, P. D., and Thomasson, J.: THE EFFECT OF DENSITY ON WATER RETENTION PROPERTIES OF FIELD SOILS, J. Soil Sci., 24, 355–367, https://doi.org/10.1111/j.1365-2389.1973.tb00771.x, 1973. a
Renger, M., Bohne, K., and Wessolek, G.: Bodenphysikalische Kennwerte für die Praxis, Teil II Soil hydraulic parameter for pratical purposes, https://www.researchgate.net/publication/288667932_Bodenphysikalische_Kennwerte_fur_die_Praxis_Teil_II_Soil_hydraulic_parameter_for_pratical_purposes (last access: 3 August 2026), 2014. a, b, c
Reynolds, W. D., Nurse, R. E., Phillips, L. A., Drury, C. F., Yang, X. M., and Page, E. R.: Characterizing mass–volume–density–porosity relationships in a sandy loam soil amended with compost, Can. J. Soil Sci., 100, https://doi.org/10.1139/cjss-2019-0149, 2020. a
Richard, G., Cousin, I., Sillon, J. F., Bruand, A., and Guérif, J.: Effect of compaction on the porosity of a silty soil: influence on unsaturated hydraulic properties, Eur. J. Soil Sci., 52, 49–58, https://doi.org/10.1046/j.1365-2389.2001.00357.x, 2001. a
Roehrig, R., Beau, I., Saint-Martin, D., Alias, A., Decharme, B., Guérémy, J., Voldoire, A., Abdel-Lathif, A. Y., Bazile, E., Belamari, S., Blein, S., Bouniol, D., Bouteloup, Y., Cattiaux, J., Chauvin, F., Chevallier, M., Colin, J., Douville, H., Marquet, P., Michou, M., Nabat, P., Oudar, T., Peyrillé, P., Piriou, J., Salas y Mélia, D., Séférian, R., and Sénési, S.: The CNRM Global Atmosphere Model ARPEGE-Climat 6.3: Description and Evaluation, J. Adv. Model. Earth Sy., 12, e2020MS002075, https://doi.org/10.1029/2020MS002075, 2020. a
Rojas, J. P., Ruge, J. C., and Carrillo, G. A.: Unsaturated Hydraulic Conductivity in Composite Porous Media, Appl. Sci.-Basel, 12, https://doi.org/10.3390/app12189058, 2022. a
Ruehlmann, J.: Soil particle density as affected by soil texture and soil organic matter: 1. Partitioning of SOM in conceptional fractions and derivation of a variable SOC to SOM conversion factor, Geoderma, 375, https://doi.org/10.1016/j.geoderma.2020.114542, 2020. a, b, c, d, e, f
Rühlmann, J., Körschens, M., and Graefe, J.: A new approach to calculate the particle density of soils considering properties of the soil organic matter and the mineral matrix, Geoderma, 130, https://doi.org/10.1016/j.geoderma.2005.01.024, 2006. a
Sakaki, T. and Smits, K. M.: Water Retention Characteristics and Pore Structure of Binary Mixtures, Vadose Zone J., 14, https://doi.org/10.2136/vzj2014.06.0065, 2015. a
Schjønning, P., Akker, J., Keller, T., Greve, M., Lamandé, M., Simojoki, A., Stettler, M., Arvidsson, J., and Breuning-Madsen, H.: Soil compaction, 69–78, https://doi.org/10.2788/828742, 2016. a
Schneider, F. and Don, A.: Root-restricting layers in German agricultural soils. Part I: extent and cause, Plant Soil, 442, https://doi.org/10.1007/s11104-019-04185-9, 2019. a
Schneider, U., Becker, A., Finger, P., Meyer-Christoffer, A., Rudolf, B., and Ziese, M.: GPCC Full Data Reanalysis Version 6.0 at 1.0°: Monthly Land-Surface Precipitation from Rain-Gauges built on GTS-based and Historic Data, Global Precipitation Climatology Centre [data set], https://doi.org/10.5676/DWD_GPCC/FD_M_V6_100, 2011. a
Schneider, U., Becker, A., Finger, P., Meyer-Christoffer, A., Ziese, M., and Rudolf, B.: GPCC's new land surface precipitation climatology based on quality-controlled in situ data and its role in quantifying the global water cycle, Theor. Appl. Climatol., 115, 15–40, https://doi.org/10.1007/s00704-013-0860-x, 2014. a
Séférian, R., Nabat, P., Michou, M., Saint-Martin, D., Voldoire, A., Colin, J., Decharme, B., Delire, C., Berthet, S., Chevallier, M., Sénési, S., Franchisteguy, L., Vial, J., Mallet, M., Joetzjer, E., Geoffroy, O., Guérémy, J., Moine, M., Msadek, R., Ribes, A., Rocher, M., Roehrig, R., Salas-y-Mélia, D., Sanchez, E., Terray, L., Valcke, S., Waldman, R., Aumont, O., Bopp, L., Deshayes, J., Éthé, C., and Madec, G.: Evaluation of CNRM Earth-System model, CNRM-ESM 2-1: role of Earth system processes in present-day and future climate, J. Adv. Model. Earth Sy., 11, 2019MS001791, https://doi.org/10.1029/2019MS001791, 2019. a, b, c
Seneviratne, S. I., Corti, T., Davin, E. L., Hirschi, M., Jaeger, E. B., Lehner, I., Orlowsky, B., and Teuling, A. J.: Investigating soil moisture–climate interactions in a changing climate: A review, Earth-Sci. Rev., 99, 125–161, https://doi.org/10.1016/j.earscirev.2010.02.004, 2010. a
Sheffield, J., Goteti, G., and Wood, E. F.: Development of a 50-year high-resolution global dataset of meteorological forcings for land surface modeling, J. Climate, https://doi.org/10.1175/JCLI3790.1, 2006. a, b
Smith, C. W., Johnston, M. A., and Lorentz, S. A.: The effect of soil compaction on the water retention characteristics of soils in forest plantations, South African Journal of Plant and Soil, 18, 87–97, https://doi.org/10.1080/02571862.2001.10634410, 2001. a
Stepanyants, Y. A. and Teodorovich, E. V.: Effective hydraulic conductivity of a randomly heterogeneous porous medium, Water Resour. Res., 39, https://doi.org/10.1029/2001WR000366, 2003. a
Stewart, V. I., Adams, W. A., and Abdulla, H. H.: Quantitative pedological studies on soils derived from Silurian mudstones. 2. The relationship between stone content and apparent density of the fine earth., J. Soil Sci., 21, 248–255, https://doi.org/10.1111/j.1365-2389.1970.tb01174.x, 1970. a
Stolte, J., Tesfai, M., Keizer, J., Øygarden, L., Kværnø, S., Verheijen, F., Panagos, P., Ballabio, C., and Hessel, R.: Soil threats in Europe, EUR 27607, https://doi.org/10.2788/828742, 2016. a
Sun, J., Chen, Y., Yang, K., Lu, H., Zhao, L., and Zheng, D.: Influence of Organic Matter on Soil Hydrothermal Processes in the Tibetan Plateau: Observation and Parameterization, J. Hydrometeorol., 22, https://doi.org/10.1175/JHM-D-21-0059.1, 2021. a, b, c, d
Swenson, S. C.: GRACE monthly land water mass grids NETCDF RELEASE 5.0. Ver. 5.0., https://doi.org/10.5067/TELND-NC005, 2012. a
Tian, Z., Gao, W., Kool, D., Ren, T., Horton, R., and Heitman, J. L.: Approaches for Estimating Soil Water Retention Curves at Various Bulk Densities With the Extended Van Genuchten Model, Water Resour. Res., 54, 5584–5601, https://doi.org/10.1029/2018WR022871, 2018. a, b
Tian, Z., Kool, D., Ren, T., Horton, R., and Heitman, J. L.: Approaches for estimating unsaturated soil hydraulic conductivities at various bulk densities with the extended Mualem-van Genuchten model, J. Hydrol., 572, 719–731, https://doi.org/10.1016/j.jhydrol.2019.03.027, 2019. a
Tifafi, M., Guenet, B., and Hatté, C.: Large Differences in Global and Regional Total Soil Carbon Stock Estimates Based on SoilGrids, HWSD, and NCSCD: Intercomparison and Evaluation Based on Field Data From USA, England, Wales, and France, Global Biogeochem. Cy., 32, 42–56, https://doi.org/10.1002/2017GB005678, 2018. a
Tokunaga, T. K., Wan, J., and Olson, K. R.: Saturation-matric potential relations in gravel, Water Resour. Res., 38, https://doi.org/10.1029/2001WR001242, 2002. a
USGS: Surface-Water Data for the Nation, United States Geological Survey, https://waterdata.usgs.gov/nwis/sw (last access: 3 August 2026), 2019. a
van Genuchten, M. T.: A Closed-form Equation for Predicting the Hydraulic Conductivity of Unsaturated Soils, Soil Sci. Soc. Am. J., 44, 892, https://doi.org/10.2136/sssaj1980.03615995004400050002x, 1980. a
Van Looy, K., Bouma, J., Herbst, M., Koestel, J., Minasny, B., Mishra, U., Montzka, C., Nemes, A., Pachepsky, Y. A., Padarian, J., Schaap, M. G., Tóth, B., Verhoef, A., Vanderborght, J., van der Ploeg, M. J., Weihermüller, L., Zacharias, S., Zhang, Y., and Vereecken, H.: Pedotransfer Functions in Earth System Science: Challenges and Perspectives, Rev. Geophys., 55, 1199–1256, https://doi.org/10.1002/2017RG000581, 2017. a
Vereecken, H., Weihermüller, L., Assouline, S., Šimůnek, J., Verhoef, A., Herbst, M., Archer, N., Mohanty, B., Montzka, C., Vanderborght, J., Balsamo, G., Bechtold, M., Boone, A., Chadburn, S., Cuntz, M., Decharme, B., Ducharne, A., Ek, M., Garrigues, S., Goergen, K., Ingwersen, J., Kollet, S., Lawrence, D. M., Li, Q., Or, D., Swenson, S., de Vrese, P., Walko, R., Wu, Y., and Xue, Y.: Infiltration from the Pedon to Global Grid Scales: An Overview and Outlook for Land Surface Modeling, Vadose Zone J., 18, https://doi.org/10.2136/vzj2018.10.0191, 2019. a
Voldoire, A., Decharme, B., Pianezze, J., Lebeaupin Brossier, C., Sevault, F., Seyfried, L., Garnier, V., Bielli, S., Valcke, S., Alias, A., Accensi, M., Ardhuin, F., Bouin, M.-N., Ducrocq, V., Faroux, S., Giordani, H., Léger, F., Marsaleix, P., Rainaud, R., Redelsperger, J.-L., Richard, E., and Riette, S.: SURFEX v8.0 interface with OASIS3-MCT to couple atmosphere with hydrology, ocean, waves and sea-ice models, from coastal to global scales, Geosci. Model Dev., 10, 4207–4227, https://doi.org/10.5194/gmd-10-4207-2017, 2017. a
Voldoire, A., Saint-Martin, D., Sénési, S., Decharme, B., Alias, A., Chevallier, M., Colin, J., Guérémy, J., Michou, M., Moine, M., Nabat, P., Roehrig, R., y Mélia, D., Séférian, R., Valcke, S., Beau, I., Belamari, S., Berthet, S., Cassou, C., Cattiaux, J., Deshayes, J., Douville, H., Ethé, C., Franchistguy, L., Geoffroy, O., Lévy, C., Madec, G., Meurdesoif, Y., Msadek, R., Ribes, A., Sanchez-Gomez, E., Terray, L., and Waldman, R.: Evaluation of CMIP6 DECK Experiments With CNRM-CM6-1, J. Adv. Model. Earth Sy., 11, 2019MS001683, https://doi.org/10.1029/2019MS001683, 2019. a, b
Wang, W., Rinke, A., Moore, J. C., Ji, D., Cui, X., Peng, S., Lawrence, D. M., McGuire, A. D., Burke, E. J., Chen, X., Decharme, B., Koven, C., MacDougall, A., Saito, K., Zhang, W., Alkama, R., Bohn, T. J., Ciais, P., Delire, C., Gouttevin, I., Hajima, T., Krinner, G., Lettenmaier, D. P., Miller, P. A., Smith, B., Sueyoshi, T., and Sherstiukov, A. B.: Evaluation of air–soil temperature relationships simulated by land surface models during winter across the permafrost region, The Cryosphere, 10, 1721–1737, https://doi.org/10.5194/tc-10-1721-2016, 2016. a
Weber, T. K. D., Weihermüller, L., Nemes, A., Bechtold, M., Degré, A., Diamantopoulos, E., Fatichi, S., Filipović, V., Gupta, S., Hohenbrink, T. L., Hirmas, D. R., Jackisch, C., de Jong van Lier, Q., Koestel, J., Lehmann, P., Marthews, T. R., Minasny, B., Pagel, H., van der Ploeg, M., Shojaeezadeh, S. A., Svane, S. F., Szabó, B., Vereecken, H., Verhoef, A., Young, M., Zeng, Y., Zhang, Y., and Bonetti, S.: Hydro-pedotransfer functions: a roadmap for future development, Hydrol. Earth Syst. Sci., 28, 3391–3433, https://doi.org/10.5194/hess-28-3391-2024, 2024. a
Weihermüller, L., Lehmann, P., Herbst, M., Rahmati, M., Verhoef, A., Or, D., Jacques, D., and Vereecken, H.: Choice of Pedotransfer Functions Matters when Simulating Soil Water Balance Fluxes, J. Adv. Model. Earth Sy., 13, 1–30, https://doi.org/10.1029/2020MS002404, 2021. a
Wösten, J. H. M., Lilly, A., Nemes, A., and Le Bas, C.: Development and use of a database of hydraulic properties of European soils, Geoderma, https://doi.org/10.1016/S0016-7061(98)00132-3, 1999. a
Xiao, T., Li, P., Pan, Z., and Wang, J.: Effect of compaction condition on the water retention capacity, microstructure and its evolution during drying of compacted loess, Geoenvironmental Disasters, 9, 27, https://doi.org/10.1186/s40677-022-00229-y, 2022. a
Zhang, G., Chen, Y., and Li, J.: Effects of organic soil in the Noah-MP land-surface model on simulated skin and soil temperature profiles and surface energy exchanges for China, Atmos. Res., 249, https://doi.org/10.1016/j.atmosres.2020.105284, 2021. a
Zhang, S., Grip, H., and Lövdahl, L.: Effect of soil compaction on hydraulic properties of two loess soils in China, Soil Till. Res., 90, 117–125, https://doi.org/10.1016/j.still.2005.08.012, 2006. a
- Abstract
- Introduction
- Materials and methods
- Results
- Discussion
- Conclusions and perspectives
- Appendix A: ISBA thermal properties
- Appendix B: List of symbols
- Code and data availability
- Author contributions
- Competing interests
- Disclaimer
- Acknowledgements
- Financial support
- Review statement
- References
- Supplement
- Abstract
- Introduction
- Materials and methods
- Results
- Discussion
- Conclusions and perspectives
- Appendix A: ISBA thermal properties
- Appendix B: List of symbols
- Code and data availability
- Author contributions
- Competing interests
- Disclaimer
- Acknowledgements
- Financial support
- Review statement
- References
- Supplement