
the Creative Commons Attribution 4.0 License.
the Creative Commons Attribution 4.0 License.
 | 27 Oct 2026
Stochastic homogeneous freezing of supercooled droplets in mixed-phase clouds in particle-based idealised microphysics framework (exemplified with PySDM v3.0)
Tim Lüttmer

Sylwester Arabas
Peter Spichtinger
Homogeneous freezing of supercooled cloud droplets is an important process governing ice formation during the transition from mixed-phase clouds to pure ice-phase clouds in the upper troposphere. In this study, we implement a stochastic representation of homogeneous freezing in the particle-based aerosol–cloud microphysics model PySDM, treating freezing as a Poisson process dependent on droplet volume, time step, and the nucleation rate. We compare two parameterisations of the nucleation rate: a temperature-dependent formulation and a saturation-dependent formulation. Using an idealised adiabatically ascending air-parcel framework, we investigate the distribution of freezing temperatures and the resulting ice number concentrations across ensembles that vary updraft speed, cloud condensation nuclei number concentration, droplet size distribution, and the number of super-particles. Simulations are performed both with and without vapour deposition on ice, enabling assessment of the role of the Wegener-Bergeron-Findeisen process. We find that homogeneous freezing occurs over a broad temperature range rather than at a single threshold, with freezing temperatures strongly controlled by cooling rate and droplet size. When vapour deposition on ice is active, early stochastic freezing events dominate the evolution of the frozen droplet fraction and substantially reduce the fraction of droplets that ultimately freeze. The two nucleation-rate formulations produce similar behaviour near water saturation but diverge significantly when supersaturation or subsaturation with respect to water develops, leading to pronounced differences in freezing temperatures and ice number concentrations. Our results highlight the importance of stochastic freezing formulations and nucleation-rate choice for representing cloud glaciation in models.
- Article
(3872 KB) - Full-text XML
-
Supplement
(1664 KB) - BibTeX
- EndNote


Pure ice-phase clouds at temperatures below Thom∼235 K, commonly referred to as cirrus clouds, consist only of ice crystals and snow aggregates. Thom denotes the temperature threshold of homogeneous freezing, below which we can assume that all liquid water droplets of substantial size (e.g., in the µm size range) are frozen. Hence, it separates the pure-ice phase from the mixed-phase thermodynamic regime, where the liquid and ice phase can coexist. Cirrus clouds frequently form in the upper-level outflow of vertically developing dynamical systems such as deep convection and Warm Conveyor Belts (WCBs). Two main formation pathways for cirrus can be distinguished (Krämer et al., 2016; Luebke et al., 2016). In the liquid-origin pathway, cirrus forms from the freezing of supercooled water droplets, hence they stem from glaciation of mixed-phase clouds that were subsequently transported to lower temperatures (≤Thom). In contrast, in-situ cirrus forms directly from the vapour phase, usually in a thermodynamic regime where (pure) water droplets are already frozen. Observational studies suggest that cirrus formed via the liquid-origin pathway typically exhibit higher ice mass mixing ratios and larger mean ice crystal sizes than cirrus formed via the in-situ-origin pathway (Krämer et al., 2020). These microphysical differences can substantially influence the radiative properties of cirrus clouds and therefore determine whether their net radiative effect is warming or cooling (Zhang et al., 1999; Fusina et al., 2007; Joos et al., 2014). In addition, they alter the particle size distribution which affects aggregation and sedimentation rates, which can affect precipitation and influence lower-level clouds. In the anvils of deep convective clouds, cirrus forms predominantly through the liquid-origin pathway, as mixed-phase processes dominate in the convective core and are subsequently transported upward into the thermodynamic regime of pure ice-phase clouds (Gasparini et al., 2018; Lüttmer et al., 2025b). In contrast, cirrus clouds in the outflow of WCBs can originate from both liquid-origin and in-situ formation pathways (Krämer et al., 2020). In some cases, the resulting cirrus exhibits a mixed origin, where ice formed through the glaciation of mixed-phase clouds during the WCB ascent coexists with ice produced in-situ above the WCB that subsequently sediments into the ascending air mass (Lüttmer et al., 2025a). Understanding the liquid-origin pathway is essential for characterizing the properties of cirrus clouds in the outflow of WCBs and convective systems. The freezing of supercooled water droplets generally occurs via two nucleation modes: homogeneous nucleation, in which droplets freeze without the presence of foreign substances aiding the nucleation process, and heterogeneous nucleation, in which freezing is initiated by foreign substances, referred to as ice-nucleating particles (INPs), that reduce the temperature and supersaturation required for ice nucleation as compared to homogeneous nucleation (Vali et al., 2015). Heterogeneous freezing plays a key role in mixed-phase cloud microphysics, as it governs the initial formation of ice. Considerable effort has therefore been devoted to improving the representation of INPs in atmospheric models. This includes characterizing their freezing properties (e.g., as a function of temperature) (Phillips et al., 2008; Ullrich et al., 2017), constraining their spatial and temporal variability through observations and climatologies (Hande et al., 2015), and developing physically based aerosol–cloud interaction frameworks (Hoshyaripour et al., 2026; Costa-Surós et al., 2026). In addition, different conceptual approaches are used to represent INP activation, e.g. “singular” and “time-dependent” parameterizations (Alpert and Knopf, 2016; Arabas et al., 2025). In contrast, homogeneous freezing of micrometre-sized supercooled water droplets has received comparatively less attention in cloud modeling studies. While numerous laboratory experiments provide estimates of homogeneous nucleation rates (see, e.g., Murray et al., 2010; Ickes et al., 2015; Koop and Murray, 2016), their representation in atmospheric models is often simplified. A common approach is to treat homogeneous freezing as a threshold process, whereby all micrometre-sized droplets (“cloud droplets”) instantaneously freeze once temperatures fall below a prescribed threshold Thom. This formulation is widely used in large-scale and cloud-resolving models, such as EC-Earth3-AerChem (Costa-Surós et al., 2026), SCALE-SDM (Shima et al., 2020), IFS (ECMWF, 2023), and the P3 scheme used in WRF (Morrison and Milbrandt, 2015). Typical values for Thom are 235 K or −38 °C. More advanced approaches attempt to account for the competition between homogeneous ice freezing and droplet evaporation. For example, the microphysics scheme in the Unified Model allows the number of homogeneously frozen droplets to be limited by updraft velocity and environmental conditions, thereby representing the depletion of supersaturation due to vapour deposition onto newly formed ice crystals (“supersaturation quenching”) (Field et al., 2023). In contrast, the microphysics schemes used in ICON and ICON-ART explicitly integrate the homogeneous nucleation rate coefficient Jhom over the cloud droplet size distribution, providing a more physically consistent representation of the freezing process (Seifert and Beheng, 2006; Welss et al., 2024; Hoshyaripour et al., 2026). In this study, we represent the homogeneous freezing of micrometre-sized water droplets as a stochastic process, using classical nucleation theory (Ickes et al., 2015). The super-particle framework is well suited for a physically consistent approach by describing homogeneous freezing as a Poisson process that depends on droplet volume, time step, and the homogeneous nucleation rate. We employ the Python super-particle model PySDM, an open-source Python 3 package designed to simulate populations of super-particles representing atmospheric hydrometeors (Bartman et al., 2022; de Jong et al., 2023). Section 2 introduces the model extensions implemented in this study, namely homogeneous freezing and vapour deposition on ice crystals. In Sect. 3, we present results from idealised simulations of freezing in an adiabatically ascending air parcel. We investigate the sensitivity to updraft velocity, the number of super-particles, and the cloud condensation nuclei (CCN) concentration. In addition, we examine differences arising from formulations of the homogeneous nucleation rate coefficient Jhom based on either temperature or water activity. Finally, we highlight the interplay between homogeneous freezing and droplet evaporation driven by the Wegener–Bergeron–Findeisen process.
Hydrometeors (liquid water droplets and ice crystals) are represented as super-particles. Each super-particle represents a number of real particles specified by its multiplicity ξ. In addition to ξ, each super-particle is described by the following attributes: phase state (liquid l or ice i), mass m, radius r, volume V, hygroscopicity parameter κ, and terminal velocity vt, respectively. The prognostic attributes are the multiplicity ξ, mass m, and phase state. All other attributes are diagnostic, with the exception of κ, which is set to a fixed value (see Sect. 2.2). Attributes of (liquid) droplets are denoted by the subscript l and attributes of ice crystals by the subscript i. Droplets are assumed to be spherical, whereas ice crystals are columnar in shape. All hydrometeors are initially represented as cloud condensation nuclei (CCN) with a dry radius rd. Super-particles are sampled uniformly from an analytical size distribution of CCNs. The number of super-particles used for sampling, nsd, determines the accuracy of the simulation.
2.1 Homogeneous freezing
Homogeneous freezing of supercooled liquid droplets can be described using classical nucleation theory (for detailed treatments, see, e.g., Pruppacher et al., 2010; Lamb and Verlinde, 2011; Ickes et al., 2015; Koop and Murray, 2016). Here, we restrict our discussion to the temperature range relevant for ice formation in the troposphere, below the melting temperature of water . In a supercooled liquid droplet (T<Tm), thermal molecular motion can lead to the spontaneous formation of molecular clusters that serve as ice embryos. Although the ice phase is thermodynamically favored below Tm, nucleation is impeded by a Gibbs free-energy barrier. Formation of a critical embryo is required before further molecular attachment to the crystalline lattice becomes energetically favorable. Once such a critical cluster forms, macroscopic freezing is initiated and the entire droplet freezes. The Gibbs free-energy barrier arises from (i) the change in chemical potential between the liquid and solid phases (a volume term), and (ii) the interfacial free energy associated with the liquid-ice boundary (a surface-area term). On a kinetic level, molecules continuously attach to and detach from the solid embryo, a process that can be described as a diffusive molecular flux. Both the thermodynamic and kinetic effects determine the homogeneous nucleation rate . This rate represents the number of critical ice embryos formed per unit droplet volume and unit time. In general, Jhom depends only on the droplet temperature Td, under the assumption that the droplet is in thermodynamic equilibrium with the ambient air such that Td=T and the droplet is pure, hence there are no foreign substances present that affect the freezing behaviour. Because the ice embryo forms inside the liquid, it has no interface with the ambient environment, and thus the formulation of Jhom should not depend directly on the ambient vapour pressure or saturation ratio. However, as discussed below, the saturation ratio becomes relevant in the parametrisation of homogeneous nucleation for aqueous solution droplets. The value of Jhom is sensitive to the parametrisation of the diffusion activation energy, the liquid–ice interfacial energy, and the saturation ratios (Koop and Murray, 2016). Theoretical constraints on these dependencies are limited in the temperature regime relevant for homogeneous nucleation, and they are therefore obtained through fits to nucleation rates measured in laboratory experiments. Significant uncertainties remain, both in the derivation of Jhom and in the applicability of classical nucleation theory itself (Ickes et al., 2015). A detailed discussion of these uncertainties is beyond the scope of this study, but they should be kept in mind when evaluating the impact of the choice of Jhom parameterization. We define Pfrz as the probability of homogeneous freezing of a droplet. First, we formulate this probability as a simple temperature dependent threshold process Pfrz,thr
where the common choice for Thom=235 K which corresponds to (see Fig. 1). A more physical approach is to parameterize homogeneous freezing as a Poisson counting process (see, e.g., Bigg, 1953; Pruppacher et al., 2010). Here Pfrz is the probability that at least one ice embryo of critical size forms inside a droplet of volume Vl within the time interval Δt and thus initiates homogeneous freezing. Assuming that the process rate rproc=JhomVl remains constant over Δt, the droplet-freezing probability is
Pfrz therefore depends on the droplet volume (), the thermodynamic state variables that control Jhom (primarily T), and the elapsed time t. An important consequence of this time dependence is that even small droplets, or droplets in thermodynamic states with low values of Jhom, will eventually freeze if sufficient time is available. The same framework has also been applied to heterogeneous freezing, where the droplet volume is replaced by the surface area of the immersed ice-nucleating particle (Arabas et al., 2025). In the model, freezing is treated using a Monte Carlo approach. At each time step, a uniform random number is generated for each super-particle i. Freezing occurs if . Because each super-particle represents ξ real droplets, once freezing is initiated, all real droplets represented by that super-particle freeze. Statistical convergence thus depends not only on the physical time step Δt but also on the sampling of the droplet spectrum – specifically, the number of super-particles nsd and sampling method (e.g., constant multiplicity, uniform in size) used to discretise the size distribution. The formulation of the homogeneous nucleation rate Jhom is critical for representing homogeneous freezing in numerical models. The study by Koop et al. (2000) (hereafter KP00) is a foundational contribution in this regard. Solutes inhibit the nucleation ability of droplets, allowing aqueous solution droplets to be supercooled to lower temperatures than pure water droplets before freezing becomes likely. The freezing of submicrometre-sized aqueous solution droplets plays a key role in cirrus formation. KP00 found empirically that Jhom for aqueous solution droplets depends solely on thermodynamic state variables and is independent of the type of solute. Moreover, assuming that the droplet is in thermodynamic equilibrium with the ambient environment, Jhom can be expressed by shifting the melting curve of water by an offset in water activity, , where esat,i and esat,l are the saturation vapour pressures over ice and (pure) water, respectively. This formulation extends the dependence of Jhom from temperature T alone to include the saturation ratio with respect to ice Si. The KP00 rate is formulated as a third-order polynomial in Δaw. The study of Koop and Murray (2016) (hereafter KM16) revisited the parameterisation of Jhom for micrometre-sized pure water droplets. They used new methods to constrain the relevant thermodynamic and kinetic properties controlling Jhom and used a selected dataset of nucleation-rate measurements to fit Jhom. KM16 use a sixth-order polynomial in T as a fit
with the melting temperature of ice at standard pressure Tm=273.15 K. The coefficients ck can be found in Koop and Murray (2016), Table 7. This parameterisation is valid for a temperature regime . The label JHOM-T denotes that Jhom depends only on T.
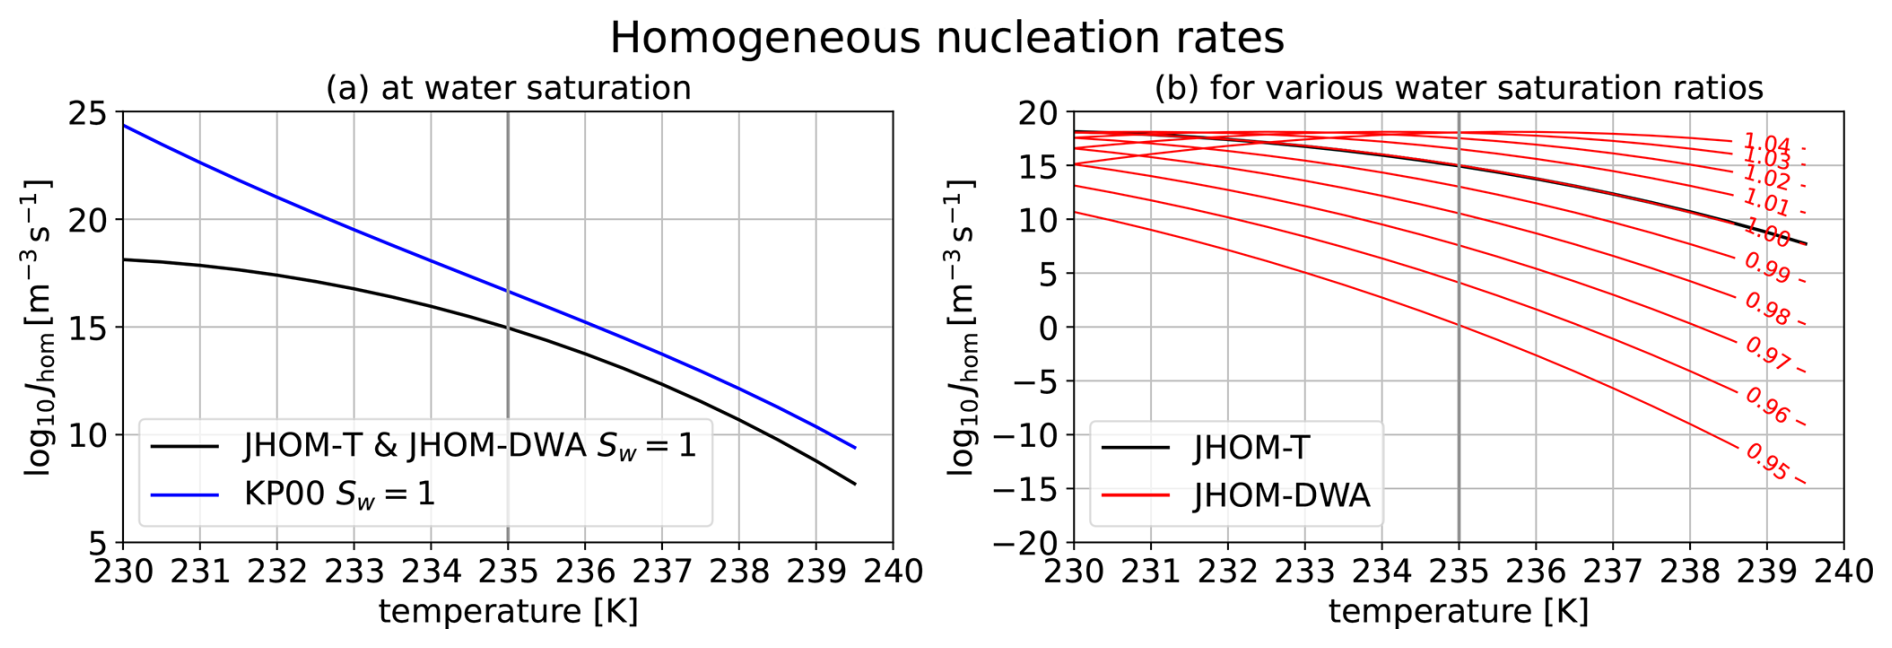
Figure 1Homogeneous nucleation rates at (a) water saturation (Sw=1) for the JHOM-T, JHOM-DWA, and KP00 formulations, and (b) for JHOM-DWA at various water saturation ratios, where the rate from JHOM-T is shown as a reference.
Figure 1a shows three formulations of Jhom at water saturation Sw=1. Here we focus first on the parameterisation for JHOM-T (black line), which depends only on T. We note that Jhom increases from 240 to 235 K by over 5 orders of magnitude highlighting the sharp increase of Jhom with decreasing temperature. Over the same temperature range, the earlier parameterisation of KP00 (blue line), which depends on Δaw and thus on the saturation ratios (Sw or Si), follows the same slope as JHOM-T for Sw=1 but shows an offset of about 1.5 orders of magnitude. The slope of the JHOM-T rate diverges from KP00 at T<234 K. While it remains unclear which behaviour is correct, the temperature range below T=235 K is rarely relevant for the homogeneous freezing events investigated in this study (Spichtinger et al., 2023). This highlights the highly uncertain nature of Jhom. The JHOM-T parameterisation of KM16 is the latest fit to describe homogeneous freezing of pure water droplets and should therefore be used instead of the earlier KP00 parameterisation in that case. However, from a modeling viewpoint it is beneficial to have a unified, Δaw-based parameterisation that is valid for both submicrometre-sized aqueous solution droplets (in the pure-ice regime) and micrometre-sized pure water droplets (in the mixed-phase regime). The study of Spichtinger et al. (2023) (hereafter SP23) provides such an option. They reformulated the T-based parameterisation of KM16 as a function of Δaw
where the bk coefficients can be found in Spichtinger et al. (2023). The label JHOM-DWA denotes that Jhom depends on Δaw. The black line in Fig. 1a actually shows Jhom not only for JHOM-T but also for the JHOM-DWA formulation at Sw=1 as they coincide by construction. So, in principle, the Δaw-based rate of JHOM-DWA should be valid for both thermodynamic regimes – near water saturation (Sw≈1) for the homogeneous freezing of micrometre-sized pure droplets, and below water saturation (Sw<1) for the homogeneous freezing of submicrometre-sized aqueous solution droplets. However, at temperatures close to T=235 K Δaw varies strongly with small changes in Sw. Figure 1b shows Jhom for JHOM-DWA at water-saturation ratios ranging from 0.95 to 1.04 (red curves) together with the Sw-independent rate of JHOM-T (black). Here we note that even for small supersaturation or subsaturation, Jhom differs strongly from the base JHOM-T rate. As previously discussed, Jhom should in general be independent of the vapour pressure in the ambient air (as the ice embryo has no interface with it), at least for the case of pure-water droplets. However, cloud droplets in the atmosphere generally contain foreign substances, e.g., the CCN responsible for droplet activation. In this model, we also assume a soluble CCN. Hence, we should expect some effect on the freezing behaviour from these substances. However, the magnitude of the effect is uncertain, especially since the concentration of foreign substances is only substantial if the droplet is unactivated and thus in the submicrometre size range. Hence, JHOM-T would be the better choice for micrometre-sized cloud droplets, even if the ambient air is super- or subsaturated with respect to water. Note that JHOM-DWA and JHOM-T coincide, as long as water saturation is maintained. In many models featuring bulk schemes, it is a basic assumption that Sw=1 for as long as cloud droplets are present (using saturation adjustment, see Seifert and Beheng, 2006; ECMWF, 2023; Field et al., 2023). However, we will later see that this assumption is often violated during homogeneous freezing events.
2.2 Particle growth by vapour deposition
The growth of droplets by water vapour deposition (condensation) and evaporation is modeled here by κ-Köhler theory (Petters and Kreidenweis, 2007). The hygroscopicity parameter κ is defined by the relation of the water activity aw to the volume ratio of the solute vs and water Vl
The implementation of condensation in PySDM is described following the formulation in libcloudph (Arabas et al., 2015). Following Shima et al. (2020), vapour deposition on ice is implemented in a separate integration step from condensation evaporation. We obtain the mass rate for the growth and sublimation of ice crystals by deposition of water vapour as
The capacitance C in m accounts for the non-spherical nature of the ice crystals. Here we use prolate ellipsoids as approximation for columnar ice crystals fitted as in Spichtinger et al. (2023) with the (ice crystal) mass mi in kg
The diffusion of vapour onto the ice surface is a gas kinetic process. For large ice crystals (>1 µm) we can treat the diffusion of vapour in the continuous regime (Spichtinger and Gierens, 2009; Skrotzki et al., 2013). There the diffusion constant Dv only depends on temperature and pressure (Pruppacher et al., 2010). For larger ice crystals (>100 µm) a ventilation correction must be applied, whereas for smaller ice crystals (<1 µm) a correction for the kinetic regime is required. The latter one is especially relevant in this work, as we investigate the freezing of droplets in the micrometre size range, where kinetic effects dominate. The correction factor for ventilation can be neglected for the ice crystal sizes considered in this study. is the diffusion coefficient of water vapour Dv corrected for the kinetic regime
with the equivalent radius of the ice crystal ri, the mean free path of air λa and the mean thermal velocity of water molecules . Not every water molecule that impacts the surface of an ice crystal is integrated into the crystal structure. The ratio of colliding to integrated molecules is given by the mass accommodation coefficient αd. The value of αd is highly uncertain and might depend on the ice crystal size and temperature (Skrotzki et al., 2013). Here we set αd=0.5 as in other studies that investigate homogeneous nucleation and which results are compared to this study (Kärcher and Lohmann, 2002; Spichtinger and Gierens, 2009). The phase change of vapour to ice at the surface of the ice crystals results in latent heating. Hence, the surface temperature of the ice crystals is warmer than the ambient air. This changes the local supersaturation experienced by the ice crystal. The growth rate Eq. (6) needs to account for temperature difference between ice crystal and ambient air and the thermal diffusion. This is modeled here by the Howell-factor Gv (Howell, 1949)
with the latent heat of sublimation Ls, the specific gas constant of water vapour Rv and the thermal conductivity of moist air KT. Similar as for Dv we apply a correction for the kinetic regime to KT
with the specific heat of dry air at constant pressure cp, and the mean thermal velocity of air . The thermal accommodation coefficient αT describes the ratio of colliding molecules that attain a thermodynamic equilibrium with the ice crystals during contact. Here we set αT=1 (Spichtinger and Gierens, 2009). The change of water vapour mixing ratio due to deposition onto ice crystals and evaporation of ice crystals is expressed as
where we iterate over all super particles of the ice phase with their mass rate and multiplicity ξk with the mass of dry air mdry.
2.3 Adiabatic parcel model
We use an adiabatic parcel model to represent an air parcel rising with a prescribed constant velocity w. The thermodynamic state of the air parcel is described by the air pressure p, air temperature T and water vapour mixing ratio qv. For the (adiabatic) change of pressure we assume hydrostatic balance
with the gravitational acceleration g and dry air density ρ. The temperature changes due to adiabatic expansion during vertical motion and latent heat of vaporization Lv and latent heat of sublimation Ls
with the specific heat of dry air cp at constant p. Note that we neglect latent heat of freezing of droplets. The change in vapour mass mixing ratio qv is controlled by phase change due to condensation/evaporation and vapour deposition/sublimation
The saturation ratios with respect to ice Si and with respect to water Sw are diagnostic quantities dependent on T, p and qv
with and the saturation pressure es,i and es,w of ice and water, respectively. Si and Sw control the growth of frozen and liquid super-particles, respectively, and they control Jhom for the Δaw formulation.
2.4 Model setup
All simulations use the simple parcel-model setup described in Sect. 2.3. Unless otherwise specified (e.g., in sensitivity simulations), we use . The thermodynamic initial conditions for all simulations are temperature T0=245 K, pressure p0=500 hPa, and saturation ratio with respect to water Sw=0.995. Super-particles in the considered volume represent particles which are initially unactivated and liquid phase (i.e., CCN), upon their growth and freezing they become cloud droplets or ice crystals. We prescribe a monodisperse CCN size spectrum with a dry aerosol radius of 15 nm and a hygroscopicity parameter κ=0.65. Note that these parameter choices affect the simulation outcome only in a minor way. The use of a monodisperse size spectrum ensures that all CCN activate, after which droplet sizes equilibrate to the ambient environment, which is determined by the adiabatic cooling rate (and thus the updraft speed w). Because the simulations start at T0=245 K, all droplets have sufficient time to activate and equilibrate before thermodynamic conditions favorable for homogeneous freezing are reached. In Sect. 3.3 we will investigate polydisperse CCN size spectra using log-normal distribution with the geometric standard deviation σ as an ensemble parameter. Unless otherwise specified (e.g., in sensitivity simulations), we use a CCN number concentration of at STP (standard temperature and pressure), representative of an average continental air mass (Jurányi et al., 2010; Choudhury and Tesche, 2023). Note, that the local CCN concentration used as input for the simulation is thus lower than the stated CCN concentration at STP as it has to be scaled by . Condensation, homogeneous freezing, and ambient thermodynamics are active for all simulations, whereas ice growth by vapour deposition (DEP-ICE) is only enabled when explicitly stated. The model time step is linked to w such that the parcel’s vertical displacement per time step, Δz, is constant. Hence, simulations with stronger updraft speeds employ shorter time steps than those with weaker updrafts. For simulations without DEP-ICE, Δz=2 m is sufficient; for simulations with DEP-ICE, we use Δz=1 m. For simulations with enhanced nccn and DEP-ICE, Δz=0.5 m is used. The simulation is stopped when all super-particles are frozen or evaporated. In this study we investigate the parameter space spanned by these variables: w, nccn, and nsd. For each of these parameters, ensemble simulations are performed with a choice between the two Jhom parametrisations – the T-dependent JHOM-T formulation and the Δaw-dependent JHOM-DWA formulation – and a choice between DEP-ICE inactive (Sect. 3.1) or active (Sect. 3.2). Additionally, we investigate the impact of choosing a lognormal CCN size distribution instead of a monodisperse distribution, with an ensemble over the width of the distribution, σ, in Sect. 3.3.
3.1 Simulations without vapour deposition on ice
First, we investigate the setup where only ambient thermodynamics, condensation, and homogeneous freezing are active. Here, frozen super-particles act as passive tracers, since without vapour deposition on ice (DEP-ICE) or collisions, they do not interact with other super-particles or the ambient air. Without DEP-ICE, the ambient air never becomes subsaturated with respect to water (Sw<1). As a consequence, all droplets eventually freeze, as there is no removal process. Thus, for the bulk quantities - droplet number concentration nc, CCN number concentration nccn, and ice number concentration ni – the following relationship holds: , where tf is the time of the first freezing event, and tend is the end of the simulation when all droplets are frozen. Number concentrations are expressed as number per kg of dry air. Figure 2 shows a sample air parcel ascent for the JHOM-T rate (Fig. 2a–d) and JHOM-DWA rate (Fig. 2e–h) with nsd=1000 and . We show only a single simulation here, as nsd=1000 is sufficient to resolve the stochasticity for this setup, and we do not observe significant changes between runs (see Sect. 3.1.1). The dashed line represents the first occurrence of ice (). Since w is constant, there is a constant adiabatic cooling rate applied. Hence, an earlier time step is associated with warmer temperatures. Panels (a) and (e) show the evolution of ambient temperature T in black, as well as the saturation ratios with respect to water (Sw, red) and ice (Si, blue). T governs Jhom for JHOM-T, while the ratio of Sw and Si governs Jhom for JHOM-DWA. Before homogeneous freezing sets in (dashed line), both simulations show the same evolution of T, Sw, and Si. After activation of the (monodisperse) CCN population at the beginning, it takes several seconds until the droplets equilibrate with the ambient water vapour and water saturation (Sw=1) is reached. T decreases continuously, mainly driven by adiabatic cooling. This leads to a decrease in esat,i, which in turn increases Si from 1.3 to 1.5 over the course of the simulation. Panels (b) and (f) show the microphysical bulk quantities for both simulations. The mixing ratio of liquid water (qw, red) increases steadily due to the constant supply of supersaturation, while the vapour mixing ratio (qv, black) decreases. Only about Δt≈75 s after the first freezing event does qw begin to decrease significantly as droplets freeze and contribute to the ice mixing ratio (qi, blue). At this point, the air parcel becomes supersaturated with respect to water (Sw>1), because too few droplets remain to maintain water saturation through condensation (and DEP-ICE is disabled). Panels c and g show a cumulative histogram of freezing temperatures Tfrz. Here the cumulative frequency of Tfrz is the same as the frozen fraction of super-particles. Since all super-particles freeze in this example, the frozen fraction reaches 1 by the end of the simulations. These histograms demonstrate that the stochastic freezing approach used here leads to a gradual freezing event over a range of Tfrz from ∼239 to 235 K. The first freezing event, indicated by the dashed line, occurs close to 238 K for both simulations. However, note that the first Tfrz can vary slightly between simulation runs due to the Monte-Carlo approach. A significant frozen fraction (>0.01) only occurs at temperatures lower than 237 K. The frozen fraction for JHOM-DWA increases more steeply than for JHOM-T, completing the freezing event at temperatures slightly above 236 K, whereas JHOM-T completes freezing closer to the “classical” homogeneous-freezing limit of 235 K. As discussed in Sect. 2.1, Jhom for JHOM-DWA and JHOM-T should be of the same order of magnitude for Sw=1, a condition that is maintained for most of the freezing events. Panels (d) and (h) show Jhom for JHOM-T in blue and for JHOM-DWA in red. The line indicates the active parameterisation, while the dashed line shows the other parameterisation under the same thermodynamic conditions for comparison. As freezing begins, the two parameterisations agree closely in order of magnitude. However, plotting the relative error (with JHOM-T considered the reference value) already reveals a divergence during the early onset of freezing. Although such deviations might be considered a “close match” in studies focusing on Jhom (see, e.g., Koop and Murray, 2016; Spichtinger et al., 2023), they have a significant impact on the stochastic freezing approach employed here. Since the JHOM-DWA rate is slightly higher than JHOM-T even for Sw=1, this leads to a shift of the histogram toward higher Tfrz. Once Sw=1 is no longer maintained, the difference between JHOM-DWA and JHOM-T becomes much larger. This is a consequence of the Δaw-dependent approach and would also occur even if JHOM-DWA and JHOM-T matched exactly at Sw=1.
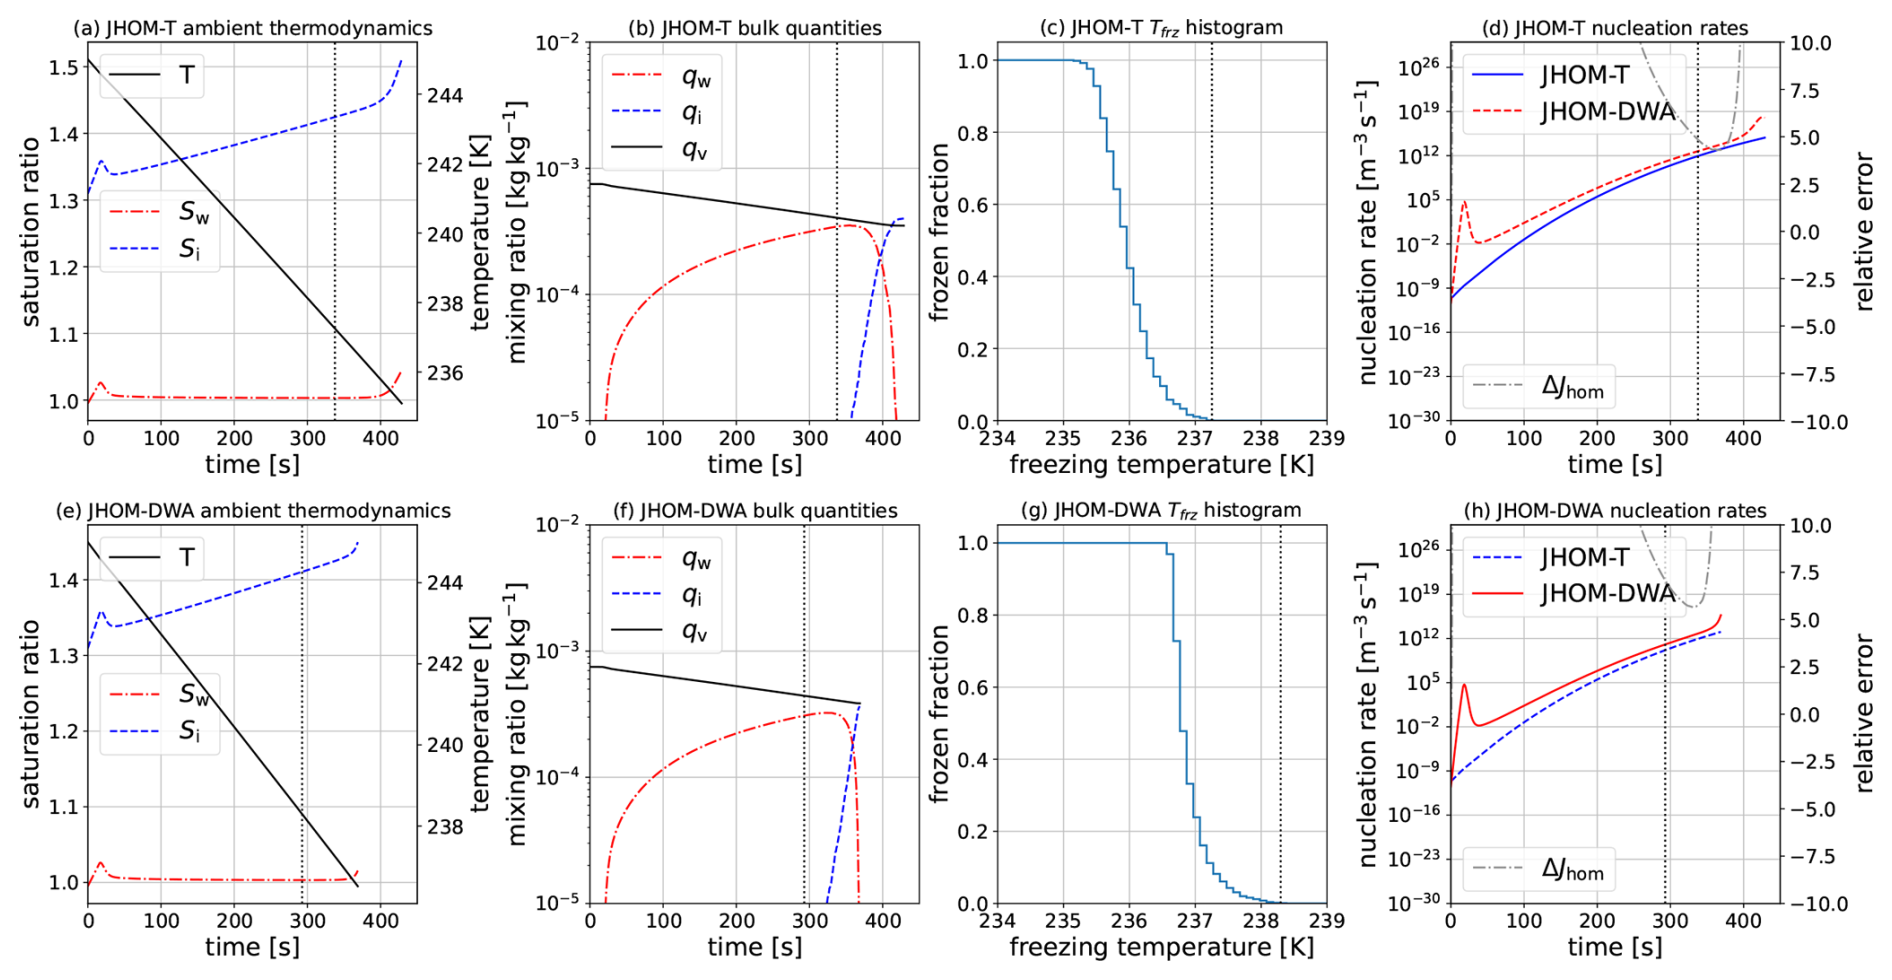
Figure 2Air parcel ascent simulations for nsd=1000 using the JHOM-T (a–d) and JHOM-DWA (e–h) Jhom formulations, showing (a, e) ambient temperature T and saturation ratios with respect to water Sw and ice Si, (b, f) bulk microphysical quantities, and (c, g) cumulative histograms of freezing temperatures Tfrz. Panels (d) and (h) show the Jhom rates (solid lines indicate the active formulation, dashed lines the alternative formulation for comparison), as well as the relative difference between the JHOM-T and JHOM-DWA rates (grey). The vertical dashed line marks the first freezing event.
3.1.1 nsd ensemble
Figure 3a and b show cumulative density estimates of freezing temperatures Tfrz for ensemble simulations for a range of super-particle numbers nsd (10, 100 and 1000) used to discretise the initial CCN/droplet size distribution. Panels a and b show the results with the JHOM-T and JHOM-DWA rates, respectively. Each ensemble consists of 5 model runs with the same nsd. Otherwise, all simulations have the same initial conditions with a constant updraft of . The line is the ensemble mean, and the shaded area indicates the upper and lower bounds of the ensemble. The general impact of Jhom rate choice is the same as describe in Sect. 3.1 and holds true for all nsd. JHOM-DWA (Panel b) shows the onset of significant homogeneous freezing at higher Tfrz. The increase is sharper and full glaciation is achieved at Tfrz>236 K. JHOM-T (Panel a) on the other hand shows a more gradual increase and full glaciation is achieved at lower Tfrz than JHOM-DWA but still before the “classical” homogeneous nucleation threshold Tfrz=235 K. Simulations with only nsd=10 (grey shaded) show large ensemble spread in the resulting Tfrz histogram corresponding to a high variance for the small sample size. Simulations with nsd=100 show a larger spread for JHOM-T than for JHOM-DWA. The higher Jhom of JHOM-DWA leads to freezing in a narrower Tfrz range, and thus to shorter nucleation events (with this setup of constant w). Simulations with nsd=1000 show a very narrow spread such that there are only negligible differences in the Tfrz histogram between the 5 model realisations of the ensemble. Hence, for the setup in this section – in particular, with no DEP-ICE and the use of a monodisperse size spectra – just 1000 super-particles are sufficient to resolve homogeneous freezing events using a stochastic approach. Therefore we performed all other simulations that do not include DEP-ICE with nsd=1000.
3.1.2 w ensemble
Figure 3c and d show histograms of Tfrz for w ranging from 0.2 to 10 m s−1. The second y axis shows the mean cooling rate of the air parcel. This rate is primarily determined by (constant) adiabatic cooling, but it is modulated over time by latent heating. Consequently, the exact values differ slightly between the two rates, as the timing of freezing events affects the latent heating. Overall, weak updrafts of 0.2 m s−1 correspond to , whereas strong updrafts of 10 m s−1 correspond to .
For the JHOM-T rate (panel c), all Tfrz values lie between 234.5 and 239 K. We note a shift toward lower Tfrz for higher w, which is a consequence of the time dependence of the stochastic homogeneous freezing approach: at high w, droplets have less time to trigger a freezing event before reaching lower temperatures. For strong updrafts of 5 and 10 m s−1, representative of conditions in deep convective systems, the Tfrz histogram extends to temperatures below the classical homogeneous freezing threshold. The marginal plot above the figure shows the Tfrz histogram aggregated over all w, which for JHOM-T is approximately normally distributed and centered close to 236 K. Panel d shows the Tfrz histograms of the w ensemble for the JHOM-DWA rate. The overall histogram differs substantially from the ensemble employing JHOM-T. Tfrz is capped above 236 K for all w, and we do not observe the general shift toward lower Tfrz at higher w. Instead, Tfrz remains largely unchanged across most of the w range. Only for convective-like updrafts with do we see a notable shift – but unlike JHOM-T, this shift is toward higher Tfrz. This behavior stems from the Δaw dependence of JHOM-DWA: for such strong updrafts, water saturation cannot be maintained, and the ambient air becomes slightly supersaturated with respect to water. As discussed in Sect. 2.1, this causes a strong increase in Jhom for JHOM-DWA, leading to freezing at higher temperatures.
3.1.3 nccn ensemble
Figure 3e and f show 2D histograms of Tfrz for nccn ranging from 100 to 10 000 cm−3 (at STP) with for the JHOM-T and JHOM-DWA rates. Since the CCN size distribution is monodisperse, all super-particles always have the same radius. Consequently, the droplet radius rw decreases with increasing nccn, as more droplets compete for the available supersaturation. Therefore, the nccn ensemble can be interpreted as an rw ensemble, with high nccn corresponding to small rw and vice versa. The second y axis shows rw at the time of the first freezing event, tf. Since tf differs between simulations, small differences appear in the labels of the second y axis in panels e and f. As shown in Fig. 2b and f, the droplet mixing ratio qw increases over time until enough droplets have frozen. rw also increases over time but changes only weakly after tf, making it a suitable reference radius for freezing. The process rate of stochastic homogeneous freezing is the product of Jhom and the droplet volume . Therefore, larger droplets have a higher probability of freezing. This behavior is evident for both nccn ensembles using the JHOM-T and JHOM-DWA rates. For higher nccn (smaller rw), the Tfrz histograms shift toward lower temperatures. For JHOM-T, the distribution extends below the classical homogeneous freezing threshold for . Under the same conditions, for JHOM-DWA all Tfrz are above the classical homogeneous threshold. Note that the absolute decrease in rw between very high and very low nccn is only about 7 µm. However, this decrease is amplified in the process rates of probabilistic freezing, since they scale with droplet volume. The process rate for the largest droplets (lowest nccn) is approximately 90 times larger than that for the smallest droplets (highest nccn). Comparing JHOM-T and JHOM-DWA, we again observe the same overall trends as before: JHOM-DWA histograms are shifted toward higher Tfrz by 0.5 to 1 K. Both rates, exhibit long-tailed distributions for each nccn. In particular, the upper end of the Tfrz range, where only few freezing events occur, is strongly influenced by the probabilistic formulation of the homogeneous freezing approach.
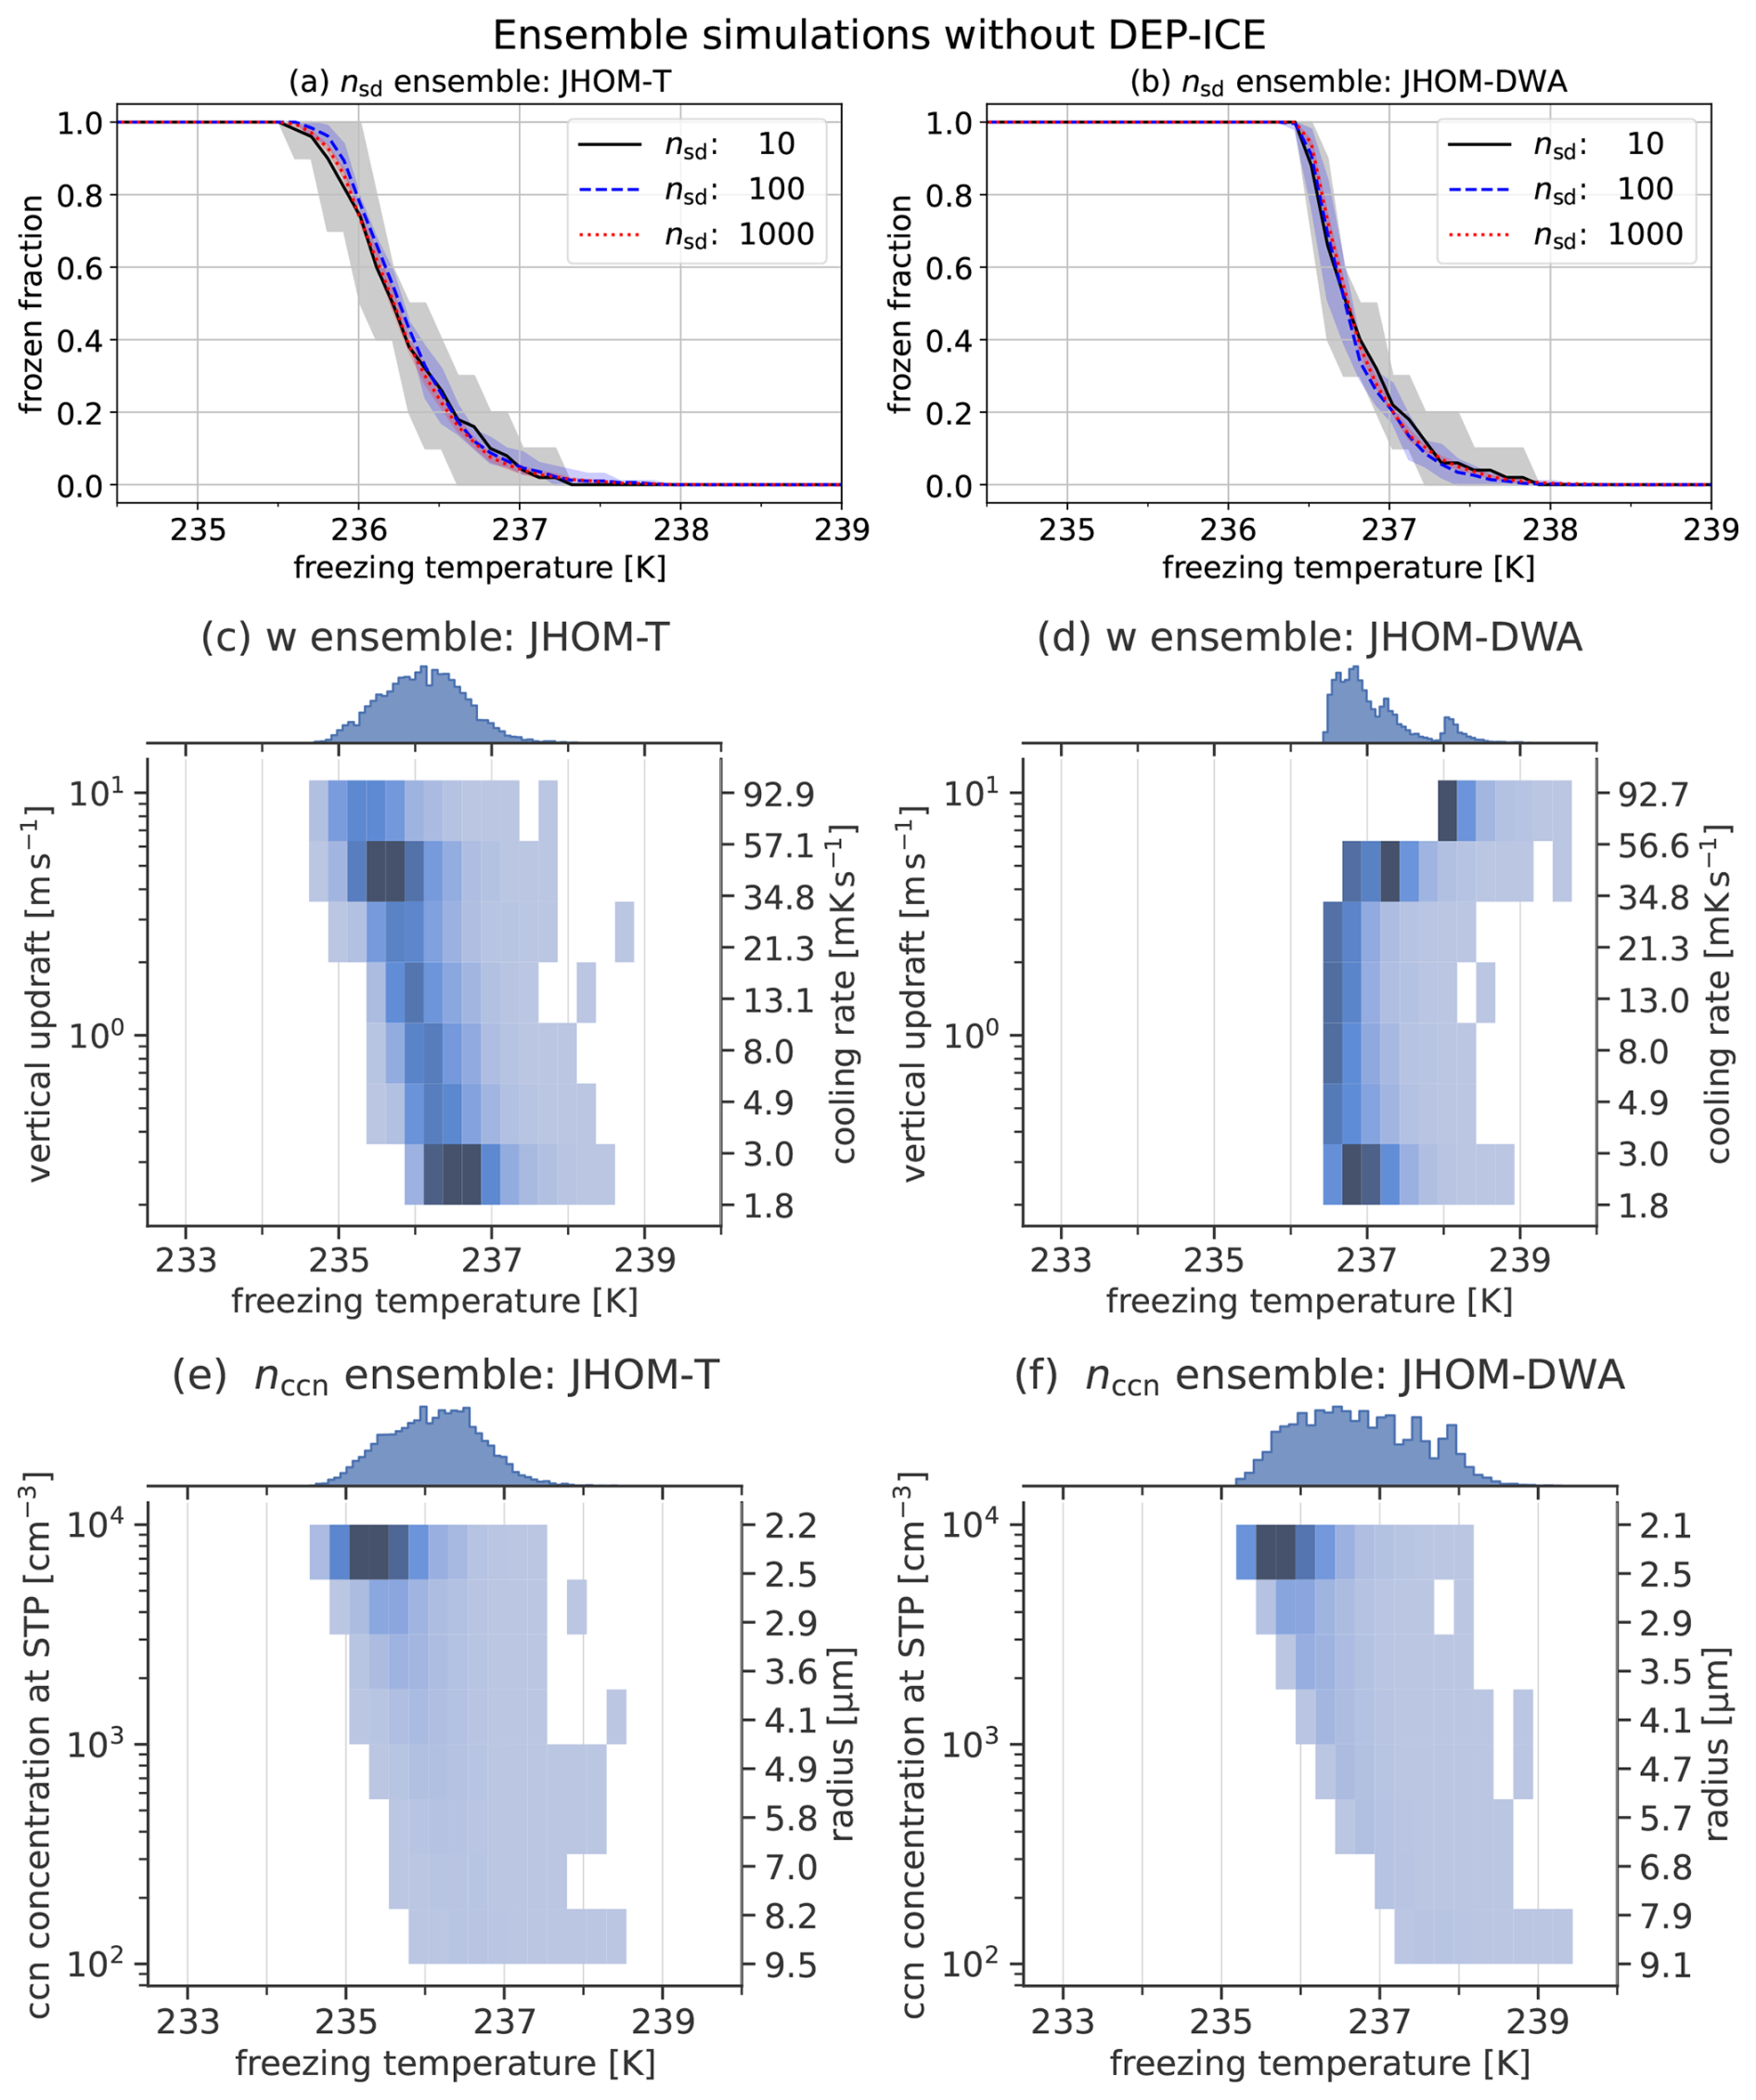
Figure 3Ensemble simulations without DEP-ICE. Cumulative histograms of Tfrz for the nsd ensemble using (a) JHOM-T and (b) JHOM-DWA rates, respectively. Two-dimensional histograms of Tfrz for the w ensemble using (c) JHOM-T and (d) JHOM-DWA rates, respectively. Two-dimensional histograms of Tfrz for the nccn ensemble using (e) JHOM-T and (f) JHOM-DWA rates, respectively.
3.2 Simulations with vapour deposition on ice
We now investigate the setup in which vapour deposition on ice (DEP-ICE) is active in addition to ambient thermodynamics, condensation, and homogeneous freezing. Frozen droplets are no longer passive tracers; instead, they interact with the ambient air through vapour deposition. As vapour is depleted, the air parcel becomes increasingly subsaturated with respect to water (Sw<1). Consequently, once a sufficient number of droplets have frozen, the remaining liquid super-particles begin to evaporate. This marks the onset of the Wegener-Bergeron-Findeisen process. The air parcel is strongly supersaturated with respect to ice (Si∼1.5) in the temperature range of homogeneous freezing in this study (239 to 234 K). Thus, the thermodynamic driving force of the Wegener-Bergeron-Findeisen process is exceptionally large, owing to the large difference between Sw and Si (see also Fig. 2). In this setup, the resulting ice number concentration ni at the end of the simulation is of particular interest, because not all droplets will freeze: .
3.2.1 nsd ensemble
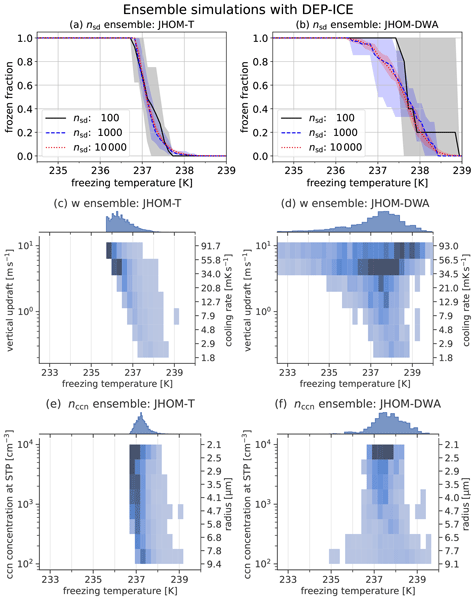
Figure 4a and b show cumulative density estimates of freezing temperatures Tfrz for nsd ensemble simulations using the JHOM-T and JHOM-DWA rates, respectively. In contrast to the nsd ensemble discussed in Sect. 3.1.1, we now consider larger nsd with the range of values – 100, 1000, and 10 000, i.e., one order of magnitude higher. As before, five simulations were performed for each nsd, and the shaded areas denote the upper and lower bounds of the frozen fractions (cumulative frequency of Tfrz) for each ensemble. The solid lines denote the mean of each ensemble. All simulations share the same initial conditions with . Only those super-particles that actually freeze contribute to the statistics shown in the histograms. The nsd ensemble using the JHOM-T rate (Panel a) shows a substantially larger spread than in the simulations without DEP-ICE. Previously, nsd=1000 (blue) was sufficient to ensure that the five model realisations produced nearly indistinguishable Tfrz histograms. With DEP-ICE active, however, nsd=10 000 is required to achieve statistically robust Tfrz histograms. The freezing histogram is also shifted toward higher temperatures. The onset of significant freezing now occurs at ∼238 K, and the final homogeneous freezing events occur just below 237 K. Without DEP-ICE, this range extended from 237 to 235.5 K (see Sect. 3.1.1). Consequently, the histograms exhibit a substantially steeper ascent compared to the case without DEP-ICE. The histograms of the JHOM-DWA rate ensemble (Panel b) are not statistically robust even for nsd=10 000. For all values of nsd, the model realisations differ substantially. Freezing also begins at higher temperatures, with Tfrz>238.5 K. However, the final freezing events occur at slightly lower temperatures than for JHOM-T. In contrast to the simulations without DEP-ICE, the ascent of the JHOM-DWA histogram is thus more gradual than that of JHOM-T. This shift of the Tfrz histogram toward higher temperatures, together with the reduced statistical robustness, arises from the Wegener-Bergeron-Findeisen process. In Sect. 3.1 we noted that the tail of the Tfrz histograms is long, meaning that a few droplets occasionally froze at relatively high temperatures, but these rare events had little influence on the overall statistics. With DEP-ICE active, however, such “lucky” early-freezing super-particles encounter high Si, and still liquid super-particles begin to evaporate before the air parcel cools further. As a result, the model becomes more sensitive to the stochasticity inherent in the homogeneous freezing formulation. Moreover, fewer than 7.5 % of droplets freeze, while the remaining population evaporates. This is shown by the frozen fraction in Fig. 5a, where the red and blue lines indicate the ensemble mean of simulations using the JHOM-DWA and JHOM-T rates, respectively. The shaded area denotes the spread across the five ensemble realisations. Because only a small fraction of super-particles freeze, the shown Tfrz histograms contain far fewer data points than those presented in the previous sections. For clouds transitioning from a liquid or mixed-phase state to a pure ice-phase (cirrus) cloud, the key quantity of interest is the ice crystal number concentration ni after all droplets have either frozen or evaporated. This is shown in Fig. 5b, where we observe surprisingly little difference between simulations using nsd=1000 and nsd=10 000. Moreover, JHOM-DWA generally exhibits a smaller ensemble spread in ni, despite its broader Tfrz histogram.
3.2.2 w ensemble
For the case without DEP-ICE active (see Sect. 3.1.1), higher updraft velocities led to lower Tfrz because, in the stochastic homogeneous-freezing framework, droplets experience less time to freeze before reaching lower temperatures. This behaviour still holds when DEP-ICE is active, but the effect is amplified by the Wegener-Bergeron-Findeisen process. In strong updrafts, droplets are advected to lower temperatures more rapidly, where Jhom is larger, increasing the likelihood that they freeze before evaporating. This is reflected in Fig. 5c, which shows the frozen fraction nfrz for the w ensemble. nfrz increases with increasing w. For weak updrafts (), fewer than 0.2 % of droplets freeze for both parameterisations. At , more than 2.5 % freeze for JHOM-T, whereas JHOM-DWA remains below 0.5 %. This difference grows further at stronger updrafts, where up to 20 % and 5.5 % of droplets freeze for JHOM-T and JHOM-DWA, respectively. Figure 4c and d show histograms of Tfrz for w ranging from 0.2 to 10 m s−1. The second y axis indicates the mean cooling rate of the air parcel. While this rate is still primarily set by (dry) adiabatic cooling, it is now additionally modulated by latent heating from both condensation and DEP-ICE. For the JHOM-T rate, the overall histogram (as illustrated by the marginal distribution above) is centered at 236.75 K, where most freezing events occur, but it lacks a substantial number of freezing events at lower Tfrz. For the JHOM-DWA rate, the Tfrz histograms are similarly narrow for , yet become significantly broader for stronger updrafts. Interestingly, as previously discussed, the frozen fraction nfrz is much lower for JHOM-DWA. Thus, fewer freezing events are spread over a much wider temperature range. This behaviour again reflects the Δaw-dependence of JHOM-DWA. In the case without DEP-ICE, JHOM-DWA was consistently larger than JHOM-T throughout the simulation because Sw≥1. While this remains true at the onset of freezing, the Wegener-Bergeron-Findeisen process rapidly drives the air parcel into subsaturation with respect to water (Sw < 1). Once sufficient droplets have frozen, the JHOM-DWA rate becomes much smaller for the remaining droplets, effectively delaying further freezing events. This can also be seen in Fig. S1 in the Supplement showing a sample ascent at . Finally, note that the entire freezing period is considerably shorter for JHOM-T than JHOM-DWA, which is reflected in the narrower range of Tfrz. Figure 5d shows ni for the w ensemble for the JHOM-DWA (red) and JHOM-T (blue) rates. For both nucleation rates we find that ni increases with updraft speed, spanning more than 1.5 orders of magnitude. Across the entire range of w, the JHOM-T rate produces substantially higher ni than JHOM-DWA. It is also important to note that the resulting ni values are much lower than those obtained using a homogeneous freezing threshold (where ni=nccn). However, we emphasise that this finding applies only to the idealised setup considered here, which excludes ice-nucleating particles and pre-existing ice. Overall, stronger updrafts lead to higher ni. We do not show the bulk ice mixing ratio qi here. Since newly formed ice crystals rapidly equilibrate to Si=1, qi is thermodynamically constrained and is therefore mainly controlled by the adiabatic cooling rate, which itself primarily depends on w. For completeness, a corresponding figure showing qi is provided in the Supplement (see Fig. S4).
3.2.3 nccn ensemble
For the nccn ensemble, all simulations use . For the JHOM-T rate (Fig. 4e), the range of Tfrz is similar to that obtained in the w ensemble at this updraft for all choices of nccn. The corresponding overall distribution (shown in the marginal plot above) is approximately a normal distribution and centered at ∼237.25 K. The frozen fraction nfrz (Fig. 5e) shows that fewer than 0.2 % of droplets freeze at high nccn, whereas about 10 % freeze at low nccn. Although ni still increases with nccn (Fig. 5f), although a larger fraction of droplets evaporates, the total ni still benefits from the increased number of available droplets. The histograms for the JHOM-DWA rate (Fig. 4f) show a large spread of Tfrz for low nccn (large droplets) and a small spread for high nccn (small droplets), with Tfrz generally extending to lower temperatures than for JHOM-T. As before, the Δaw-dependency makes the freezing behaviour more complex, resulting in increased variability across the ensemble. The behaviour of nfrz and ni is similar to that of JHOM-T, but, consistent with the w ensemble, both quantities take lower values. The size dependency of homogeneous freezing acts as a limitation in this ensemble setup. Larger droplets (low nccn) freeze earlier during the ascent (at higher T), which subsequently leads to the evaporation of a larger number of droplets. That higher nccn promotes more pronounced homogeneous freezing is also consistent with previous findings (Lüttmer et al., 2025b). We note that nsd=10 000 was kept constant and that all ensemble simulations used monodisperse droplet size distributions. Therefore, increasing nccn increases the multiplicity ξ, i.e., the number of real droplets represented by a single super-particle. In simulations with DEP-ICE active, this becomes important because both the depletion of ambient water vapour and the associated latent heating are weighted by ξ. Additionally, DEP-ICE depends on the size of the super-particle due to the dependence of the mass rate for the growth on capacitance C and ice crystal radius ri. Hence, a more rigorous approach would adjust nsd when varying nccn. Nevertheless, for simplicity we vary only one model parameter at a time. Even so, the overall behaviour resulting from changes in nccn aligns with our expectations.
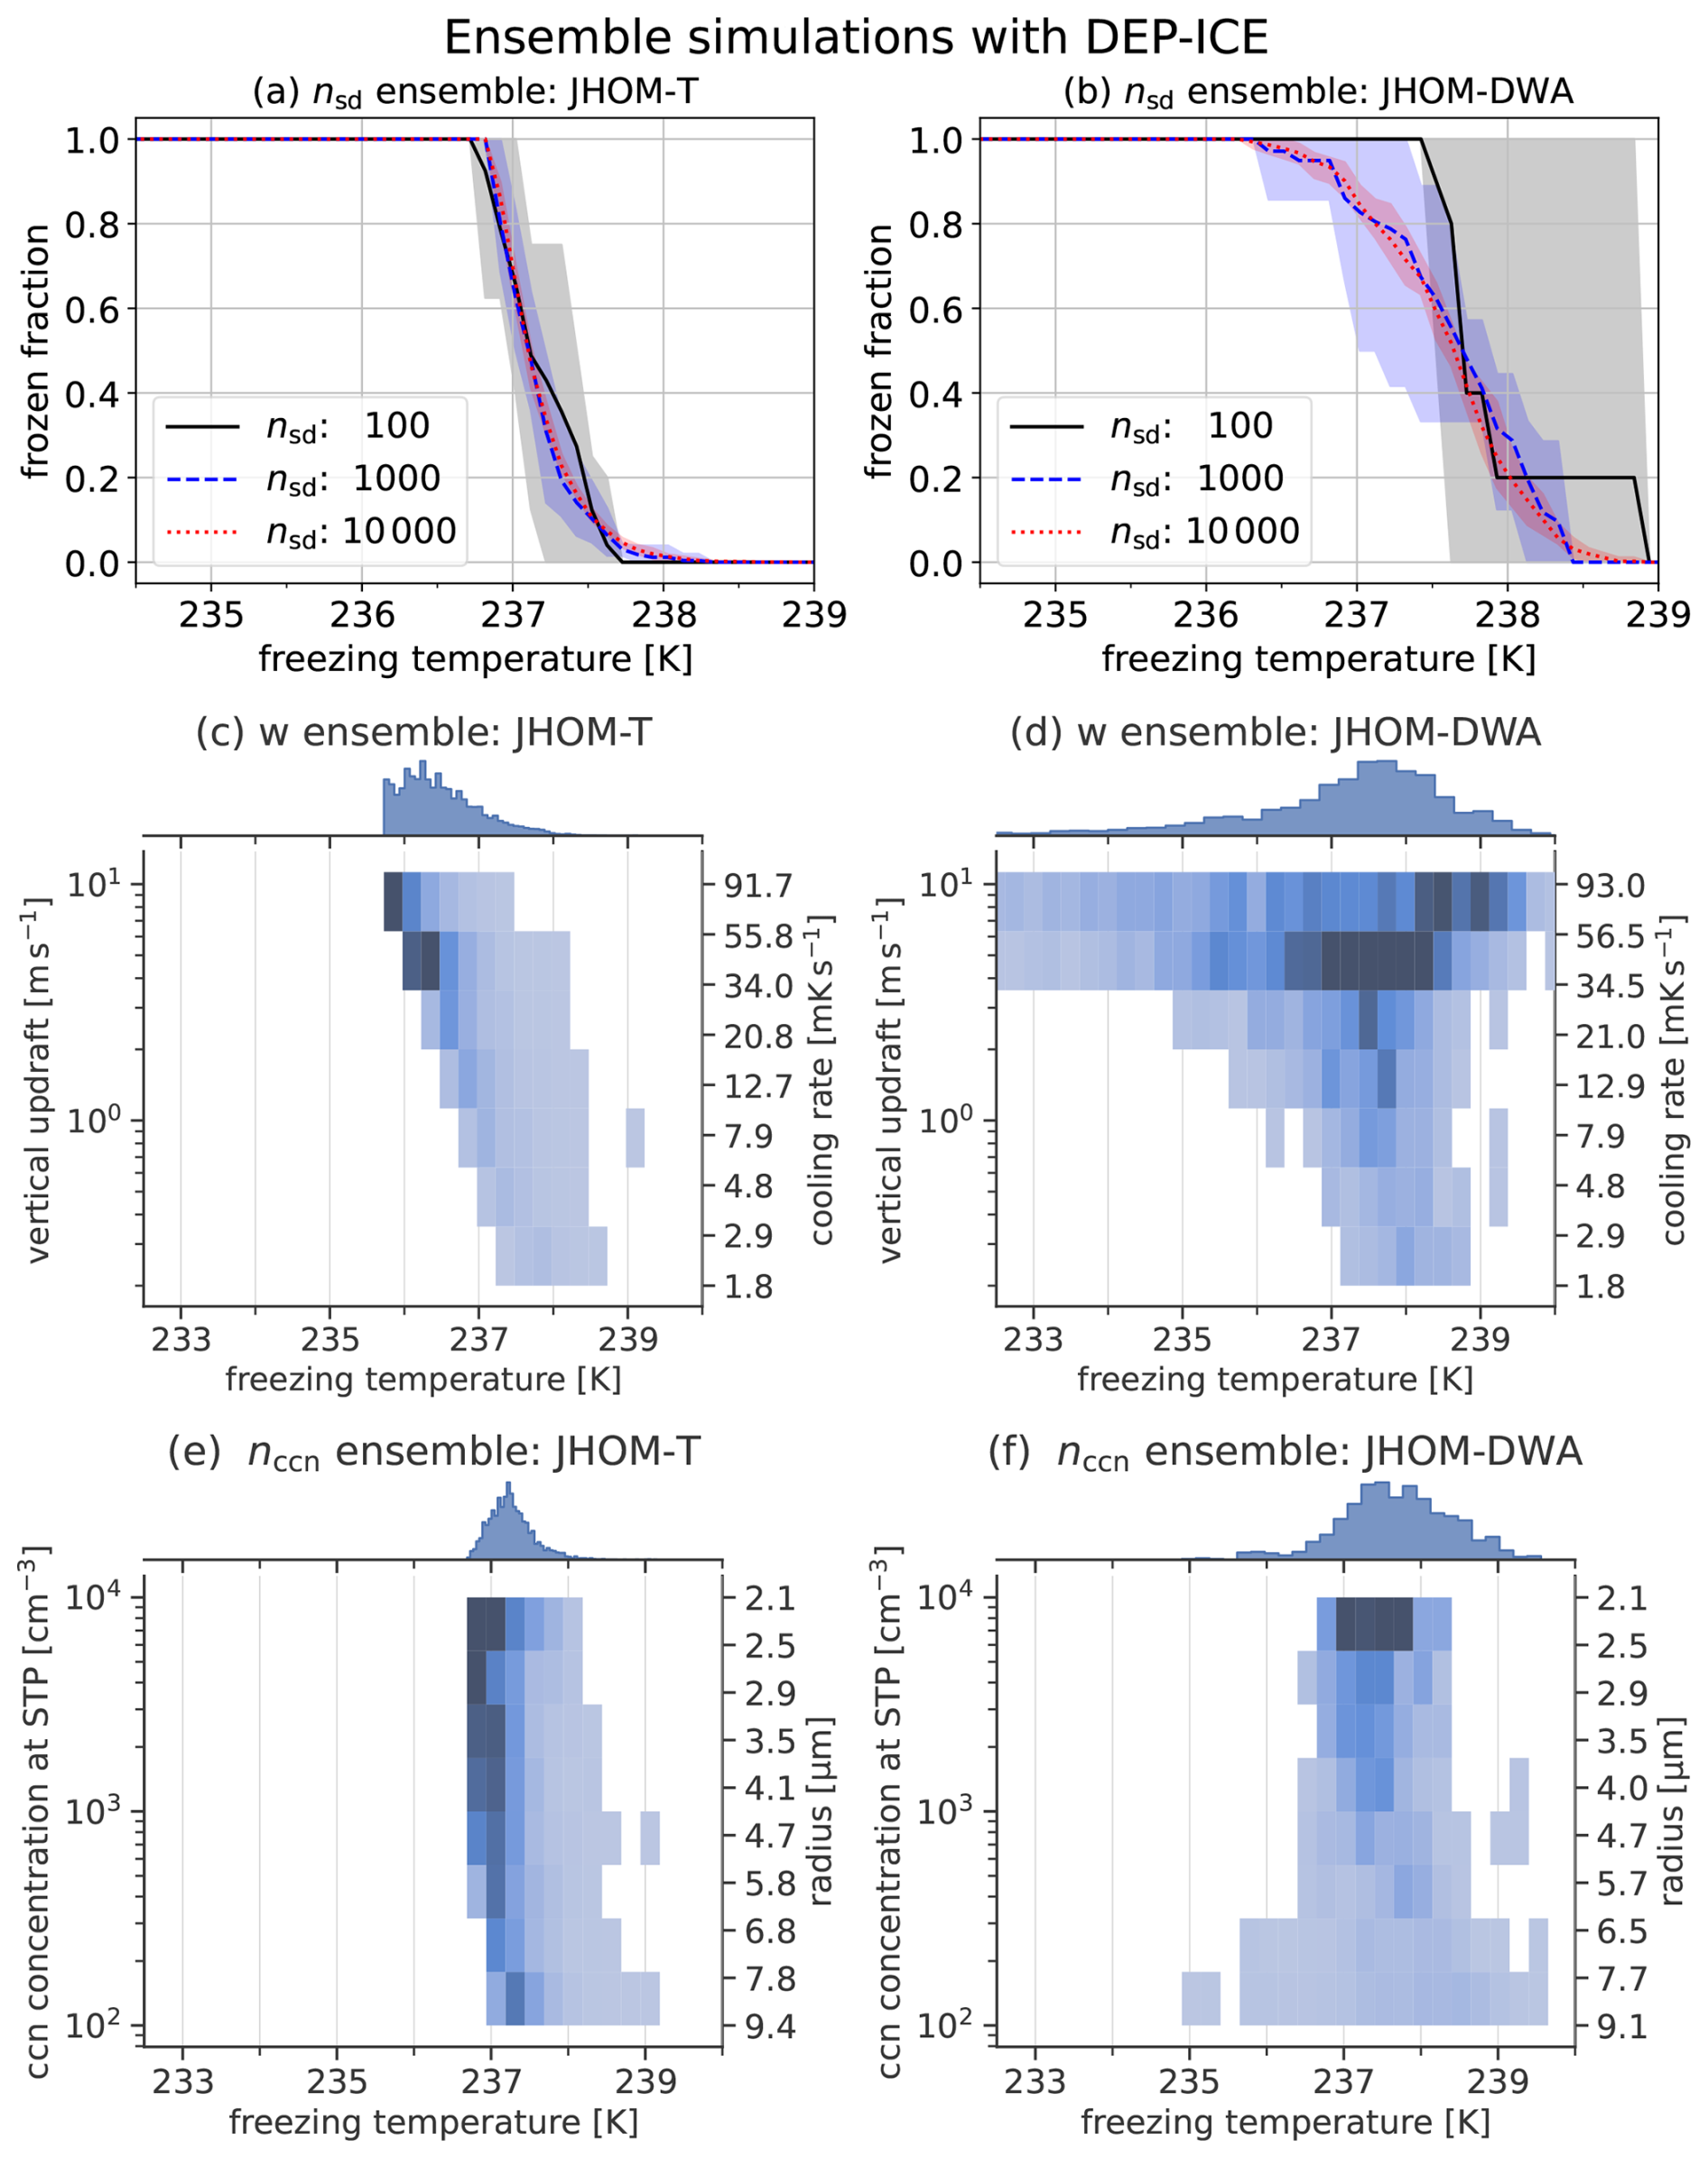
Figure 4Ensemble simulations with vapour deposition on ice. Cumulative histograms of Tfrz for the nsd ensemble using (a) JHOM-T and (b) JHOM-DWA rates, respectively. Two-dimensional histograms of Tfrz for the w ensemble using (c) JHOM-T and (d) JHOM-DWA rates, respectively. Two-dimensional histograms of Tfrz for the nccn ensemble using (e) JHOM-T and (f) JHOM-DWA rates, respectively.
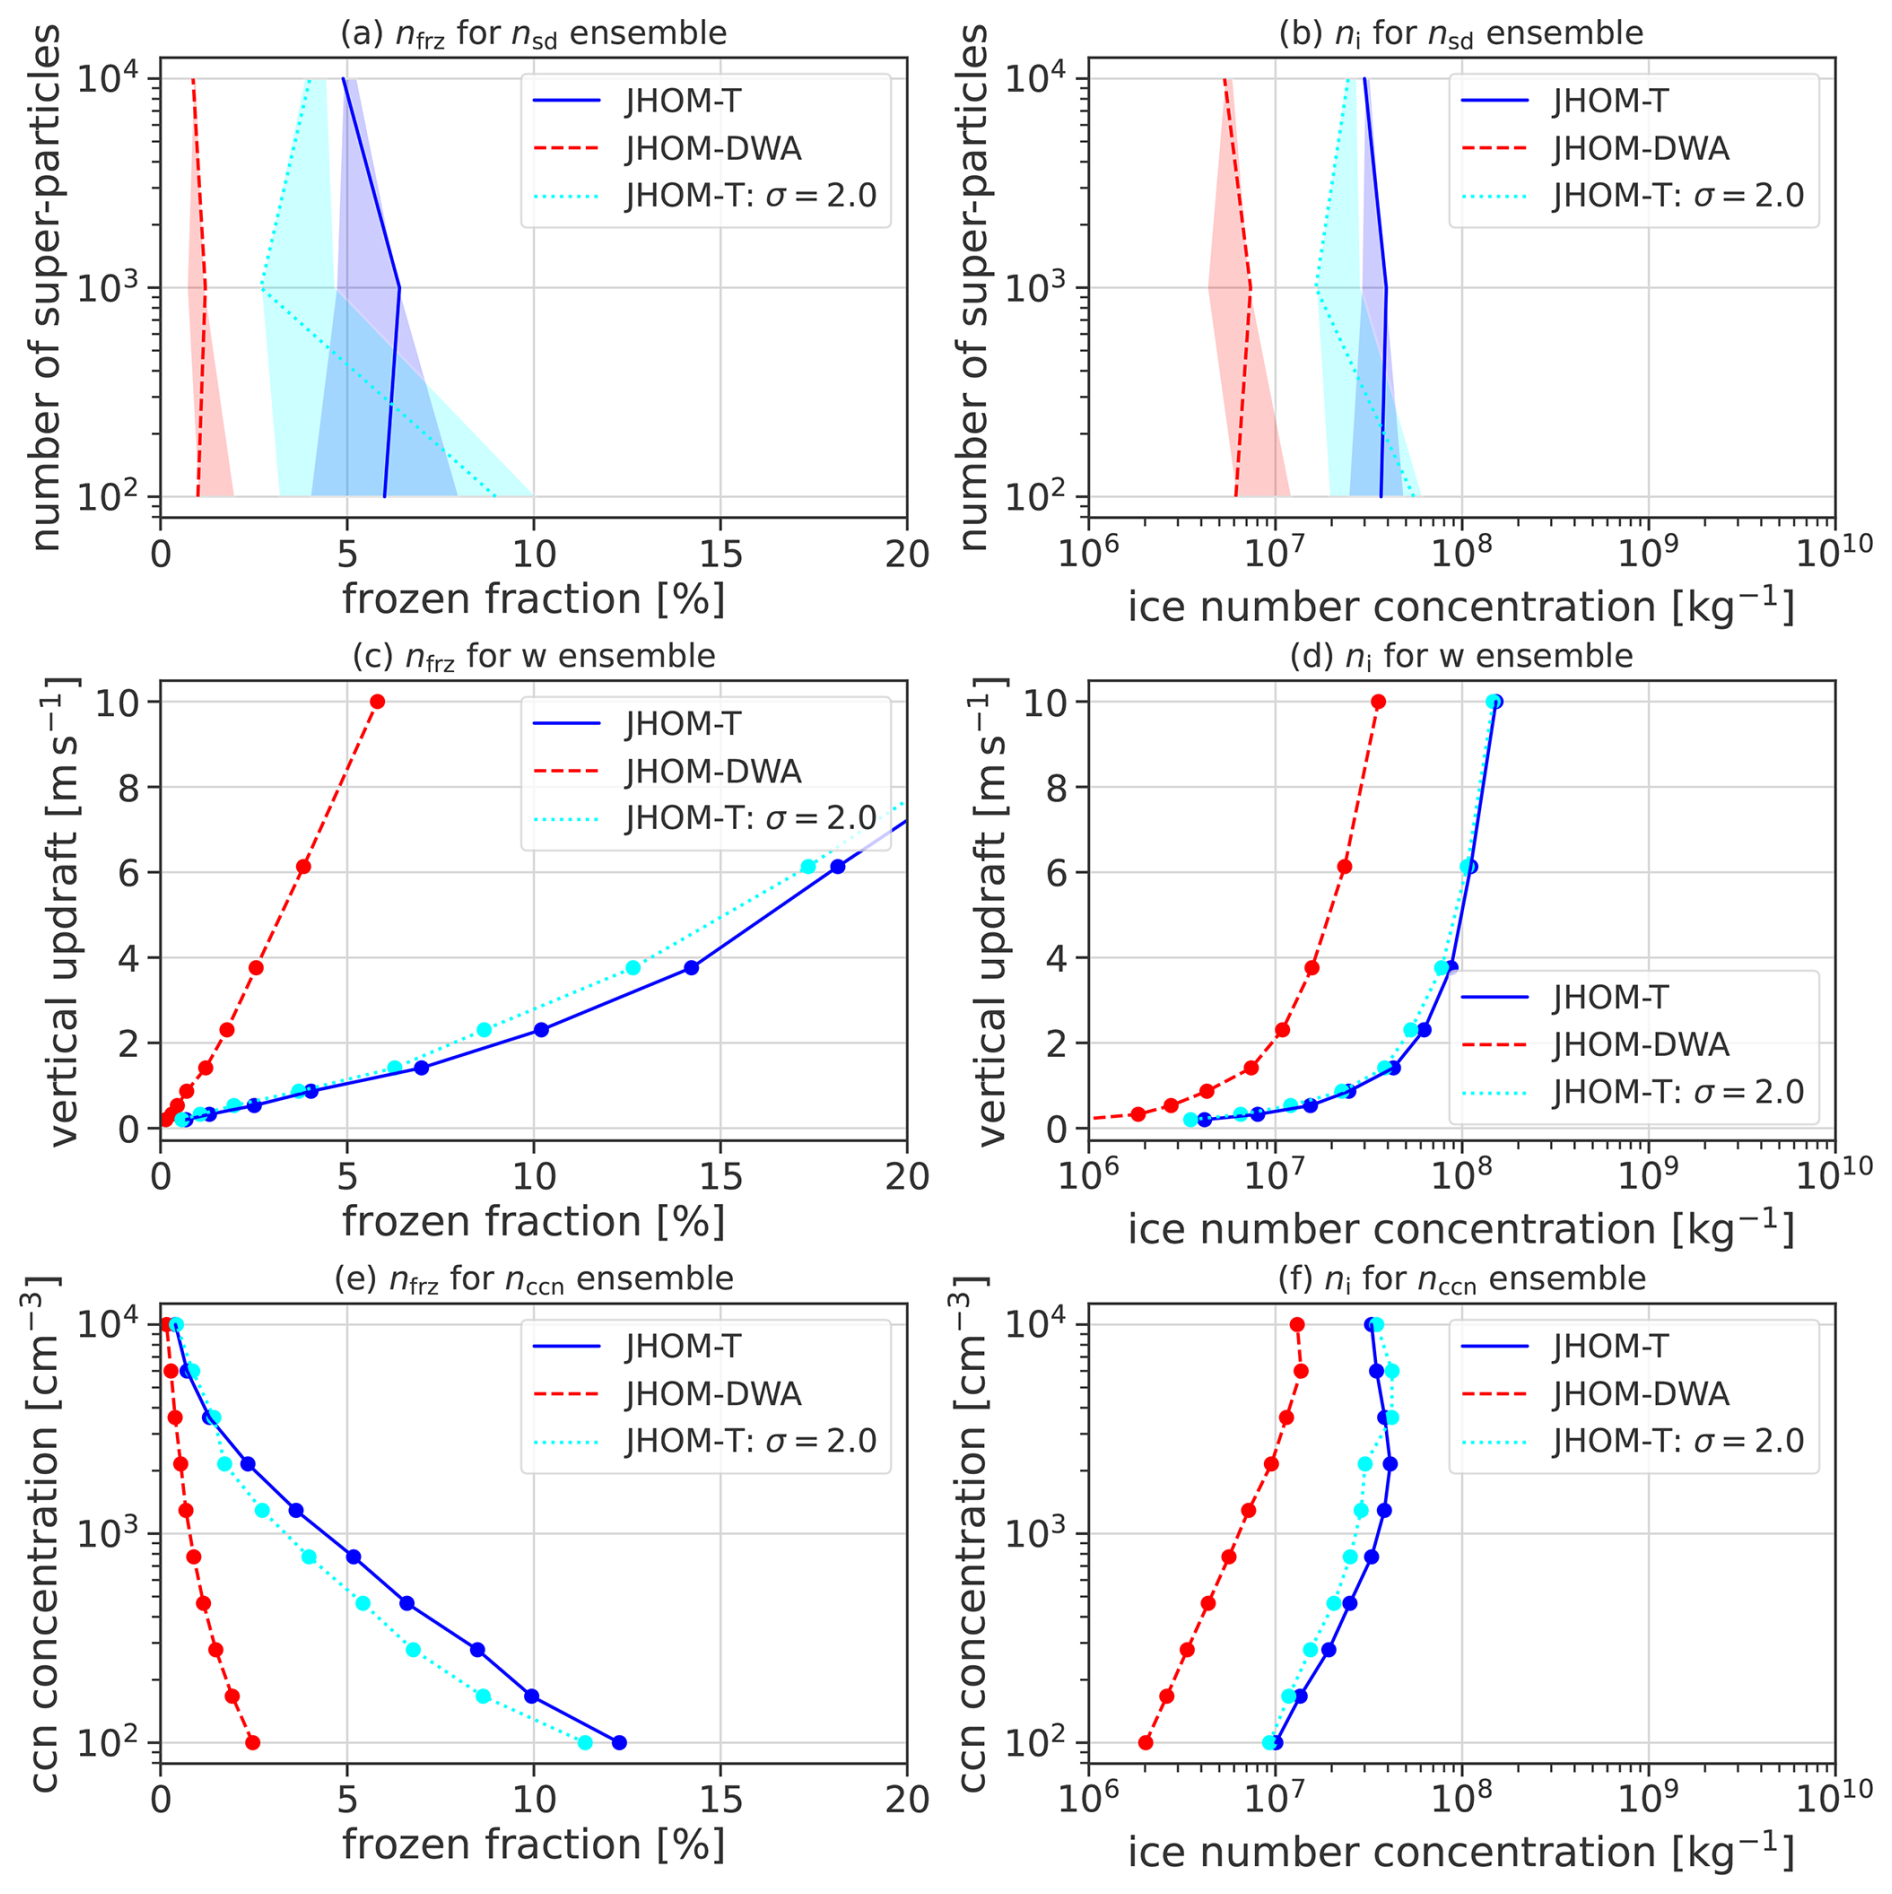
Figure 5Frozen fraction nfrz for (a) the nsd ensemble, (c) the w ensemble, (e) and the nccn ensemble. Ice number concentration ni for (b) the nsd ensemble, (d) the w ensemble, and (f) the nccn ensemble. Blue lines indicate simulations using the JHOM-T nucleation rate with monodisperse CCN spectra, teal lines the JHOM-T rate with lognormal CCN spectra, and red lines simulations using the JHOM-DWA rate. All simulations were performed with nsd=10 000 and vapour deposition on ice active.
3.3 Simulations with polydisperse DSD
So far, we have used only a monodisperse mode to discretise the CCN size distribution. In the atmosphere, however, CCN size spectra are more diverse and often follow log-normal distributions or exhibit multiple modes. In this section, we use a log-normal distribution with a geometric mean radius of r0=0.05 µm and geometric standard deviations in the range . These values of σ are typical for a variety of aerosol species, including several types of mineral dust, sea salt, sulfate, and ammonium nitrate (Hande et al., 2016). A more comprehensive approach would involve varying not only σ, but also r0 and the hygroscopicity parameter κ to represent CCN spectra more realistically. However, for simplicity, we again vary only a single parameter at a time. Moreover, in this model setup – with a single CCN mode and idealised parcel physics – the exact values of r0 and κ (chosen within a reasonable range) do not significantly affect the simulation outcome. This is because, after activation, droplet sizes increases to a radius determined by the ambient water saturation ratio Sw. The use of a polydisperse CCN size spectrum has several important consequences. First, the multiplicity ξ is no longer uniformly distributed across all super-particles. As a result, different super-particles have varying impacts on the ambient thermodynamics, since condensation, latent heating, and vapour deposition on ice are weighted by ξ. Second, super-particles exhibit different droplet radii r because they activate at different times during the ascent, with the largest CCN activating first, and have more time to grow. This affects their freezing probabilities as it is size-dependent (see Sect. 2.1) as well as their growth rates by deposition of vapour. In this section, we exclusively employ the JHOM-T parameterization for the homogeneous freezing rate Jhom, which we consider the more accurate representation. We present simulations both with and without vapour deposition on ice. If not otherwise specified, all simulations in this section discretise the CCN size spectrum as a lognormal distribution with r0=0.05 µm and σ=2, using nsd=10 000. A sample ascent for these initial conditions is shown in the Supplement (see Fig. S2). The CCN size spectrum spans radii from 0.0025 to 1 µm, with ξ varying by more than three orders of magnitude between the maximum and the tail end of the distribution. This leads to a smoother onset of droplet activation (in terms of saturation adjustment for Sw) and a wider, more gradual histogram of Tfrz. As before, we choose and for the ensemble simulations.
3.3.1 σ ensemble
As for the previous sections, we also performed ensemble simulations for different nsd. With vapour deposition on ice (DEP-ICE) inactive, nsd=1000 is sufficient to robustly represent the Tfrz histogram. With DEP-ICE active, however, nsd=10 000 is required. Since these results do not introduce new insights beyond our previous findings, the corresponding plots are provided in the Supplement (see Fig. S3). Figure 6a shows the Tfrz histogram for varying σ with DEP-ICE inactive. The histogram spans a Tfrz range between 234 and 238 K for all choices of σ. In contrast to the monodisperse CCN spectra (see Sect. 3.1), Tfrz extends below the classical homogeneous freezing threshold at 235 K. This is caused by small droplets populating the lower end of the CCN spectrum. The Tfrz histogram does not change substantially with σ. Figure 6b shows the 2-D Tfrz histogram for varying σ with DEP-ICE active. As in our previous findings, DEP-ICE active substantially narrows the range of Tfrz, with the lowest values occurring just below 237 K. Because droplets on the upper tail of the CCN spectrum grow to the largest radii, they have the highest freezing probabilities. Once these droplets freeze, the smaller (and far more numerous) droplets evaporate before freezing due to the Wegener-Bergeron-Findeisen process. Overall, the Tfrz histograms show only minor sensitivity to the choice of σ. This is consistent with the resulting ice number concentration ni and frozen fraction nfrz after glaciation, both of which are largely independent of σ (see Fig. S5). Hence, the freezing behaviour of the droplet spectrum is governed primarily by the ambient thermodynamics (here controlled by w) and by the droplet number concentration (controlled by nccn), rather than by the width of the CCN size distribution (controlled by σ).
3.3.2 w ensemble
Figure 6c shows the 2-D Tfrz histogram for varying w with DEP-ICE inactive. Compared to the ensemble with a monodisperse CCN spectrum (Fig. 3c), the Tfrz range is broader. The histogram still exhibits a systematic shift towards lower temperatures for higher w, caused by the time dependence of the stochastic homogeneous freezing process. However, in contrast to the monodisperse case, two distinct modes emerge in the Tfrz distribution (as shown by the marginal histogram above), rather than a single dominant mode. With DEP-ICE active, the Tfrz histograms for lognormal and monodisperse CCN size spectra differ only marginally (compare Figs. 6d and 4c). Small differences remain in the bulk properties after the freezing event, with a lower frozen fraction and slightly lower ice number concentration ni for the lognormal case (compare the blue and teal lines in Fig. 5c and d). Overall, the Wegener-Bergeron-Findeisen process smooths out differences in freezing behaviour between monodisperse and lognormal droplet spectra. In both cases, early freezing events at higher temperatures dominate the Tfrz histogram and largely determine the bulk properties of the fully glaciated cloud. The timing of these early freezing events seems largely independent of the initial CCN size spectra.
3.3.3 nccn ensemble
Figure 6e shows the 2-D Tfrz histogram for varying nccn with DEP-ICE inactive. The Tfrz range is large for all nccn, spanning more than 5 K. The overall structure of the Tfrz histogram does not change with nccn; instead, it is shifted towards lower temperatures. This results in a broad maximum at ≈236 K with a pronounced tail towards lower Tfrz. Consequently, Tfrz values are generally lower than in the case of monodisperse CCN spectra (see Fig. 3e). With DEP-ICE active, fewer than 12.5 % of real droplets freeze even for low nccn (see Fig. 5e, teal line). As a consequence, the Tfrz histogram becomes much narrower and is shifted towards higher temperatures corresponding to the earliest freezing droplets. As for the w ensemble, the difference in freezing behaviour between monodisperse and lognormal CCN spectra is negligible. Again, only the ice number concentration ni after completion of the freezing event is slightly lower (compare the blue and teal lines in Fig. 5f).
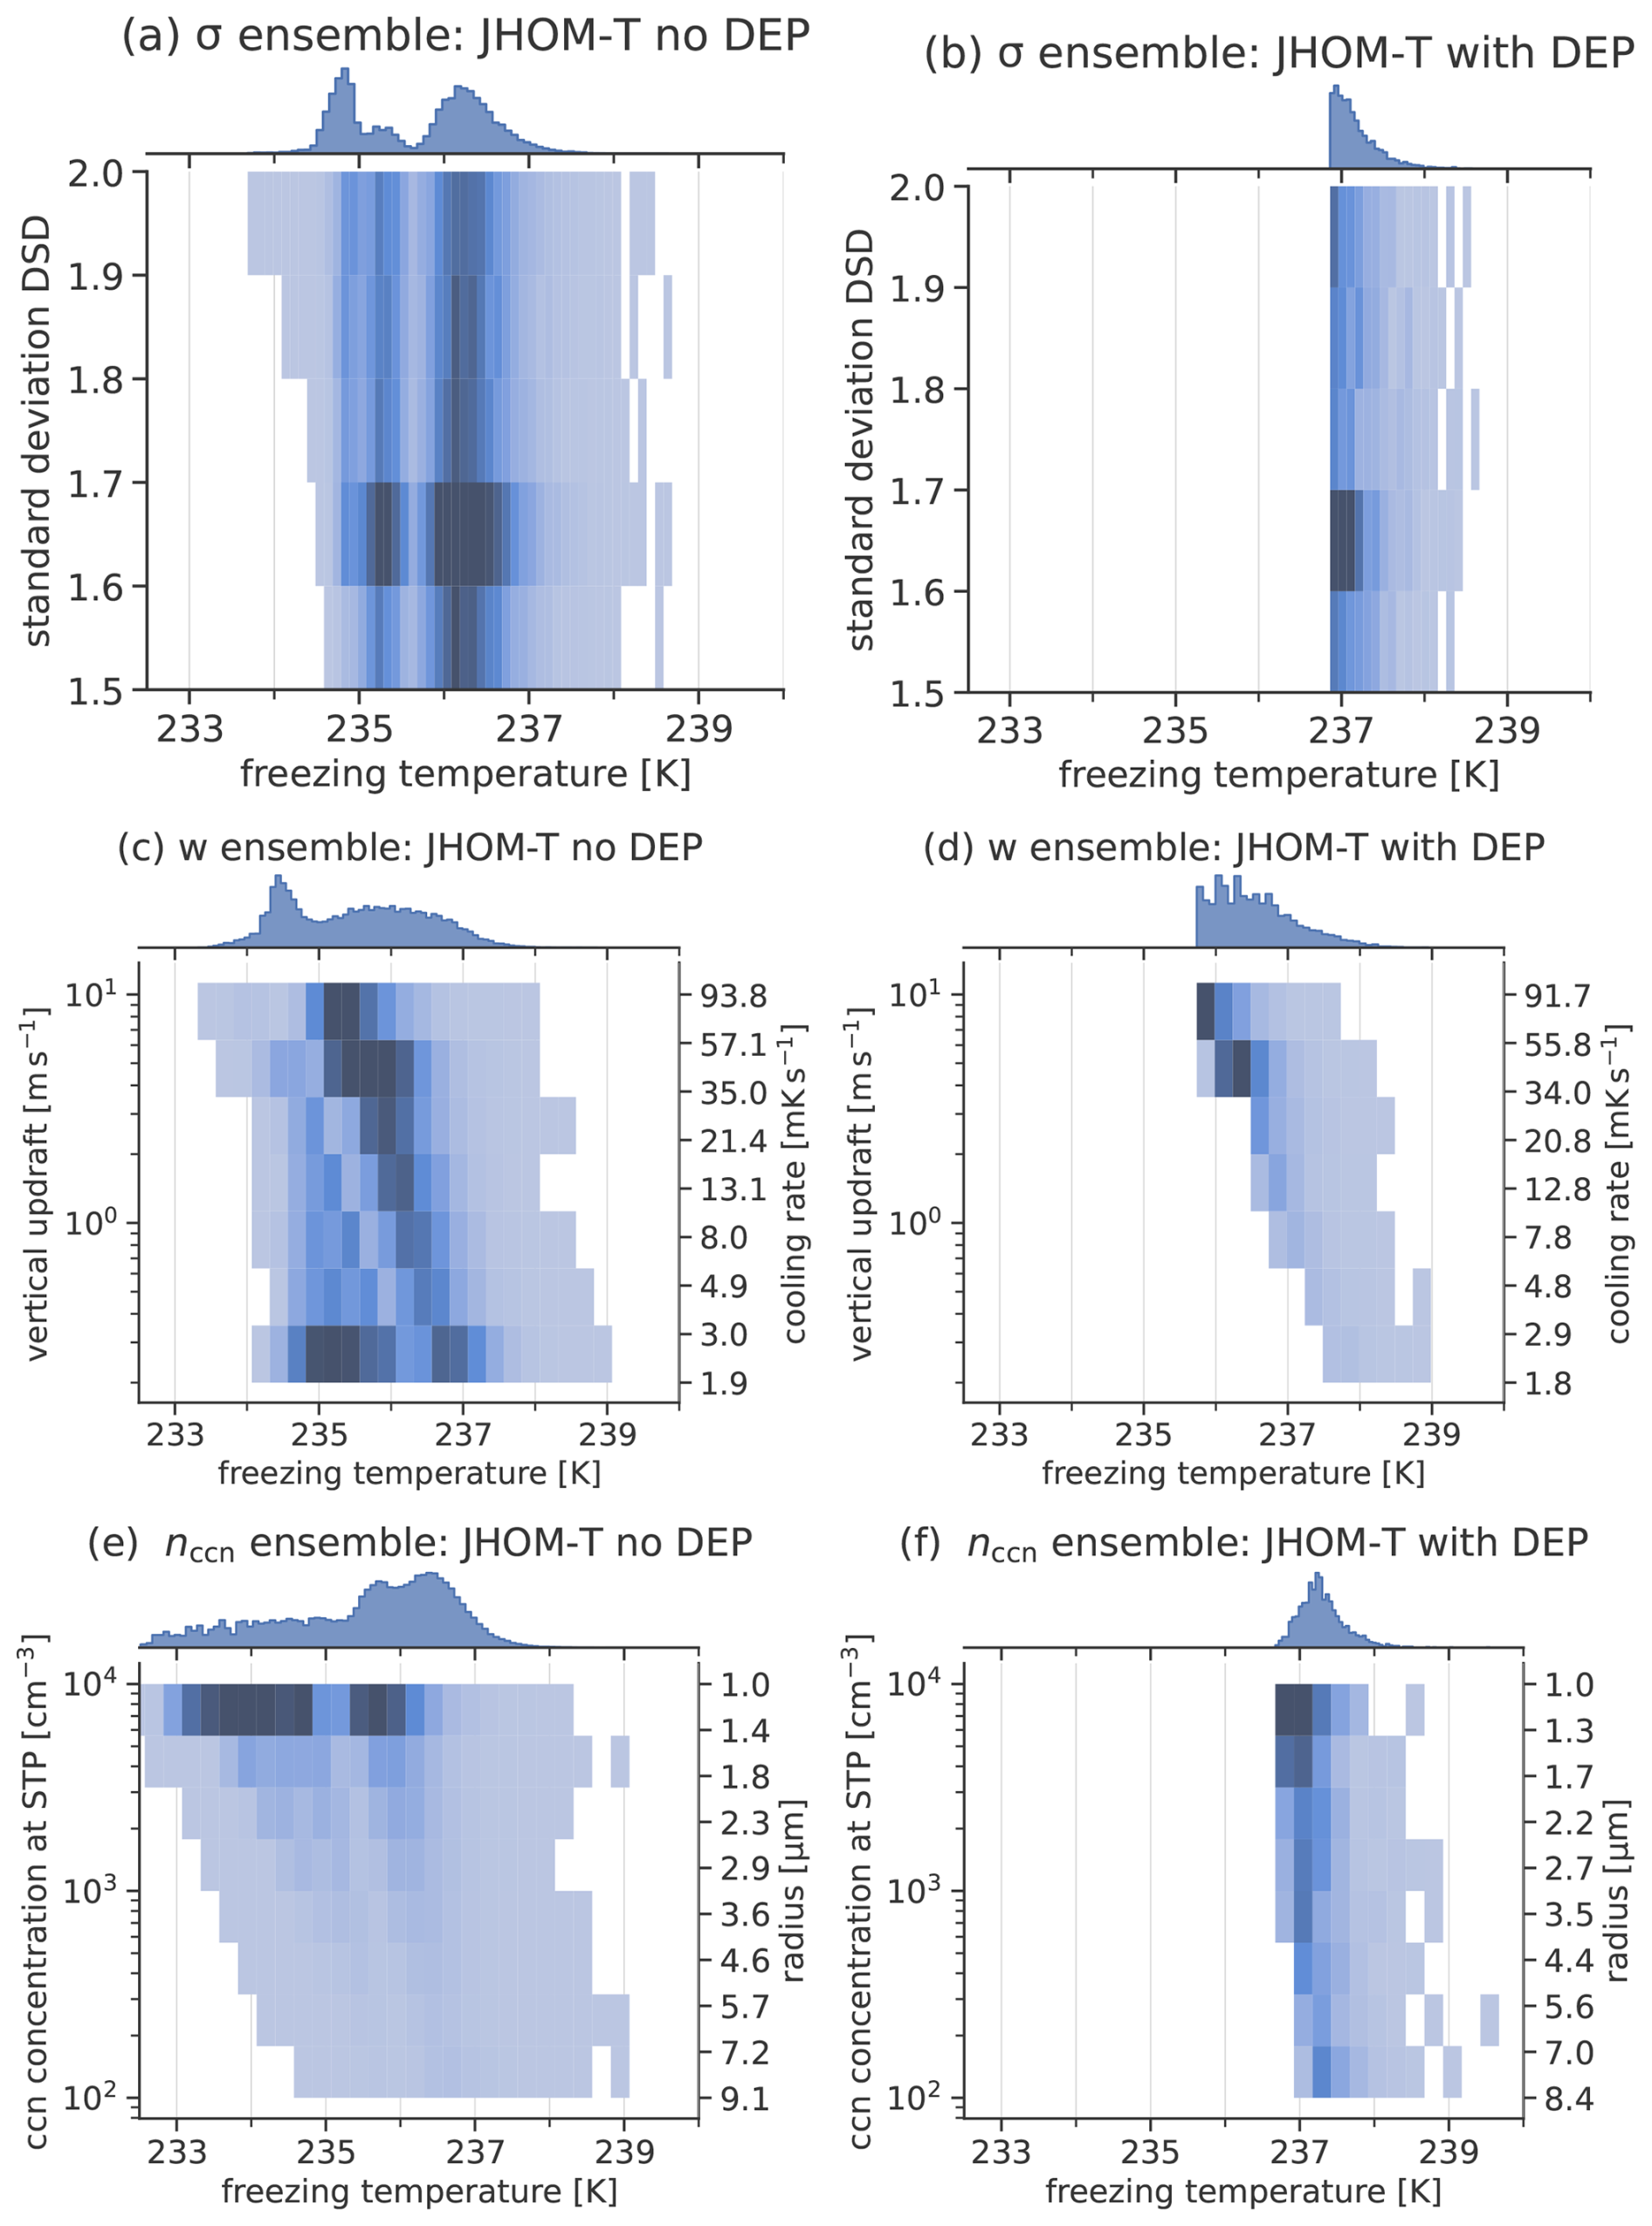
Figure 6Ensemble simulations using the JHOM-T parametrisation. Two-dimensional histograms of Tfrz for the σ ensemble with (a) and without (b) vapour deposition on ice; for the w ensemble with (c) and without (d) deposition on ice; and for the nccn ensemble with (e) and without (f) deposition on ice.
In this study, we implement stochastic homogeneous freezing of pure water droplets using a Monte Carlo scheme within the super-particle model PySDM. The freezing probability depends on the droplet volume v, the time interval Δt, and the homogeneous nucleation rate Jhom. For Jhom, we employ two parametrisations: one depending only on temperature (JHOM-T), and one depending on both temperature and saturation ratio with respect to ice (JHOM-DWA). While JHOM-T represents the state-of-the-art formulation for Jhom for pure water droplets in the µm size range, the JHOM-DWA rate is additionally applicable to aqueous solution droplets in the nm size range. Both rates “closely” agree at water saturation, Sw=1. We use a simple parcel-model framework to investigate the distribution of freezing temperatures Tfrz and the resulting ice number concentration ni after the freezing event has concluded. We test both nucleation rates for ensembles varying the number of super-particles nsd used to discretise the initial droplet spectrum, the updraft speed w controlling the adiabatic cooling rate, the cloud condensation nuclei (CCN) number concentration nccn controlling droplet size and super-particle multiplicity, and the geometric standard deviation σ of the lognormal CCN size spectrum. We also performed simulations with and without vapour deposition on ice (DEP-ICE). When DEP-ICE is inactive, frozen droplets act as passive tracers. When DEP-ICE is active, vapour deposition on ice enables the Wegener-Bergeron-Findeisen process. All simulations in this paper assume a constant updraft (and thus cooling).
4.1 Fundamental characteristics of homogeneous freezing
Our ensemble simulations confirm the fundamental characteristics of homogeneous freezing events. The shift of freezing temperatures Tfrz towards lower temperatures for stronger updrafts reflects the time dependency of the stochastic freezing process, as droplets have less time to freeze before reaching lower temperatures. Parameters affecting the CCN size spectrum- the width determined by σ and the multiplicity determined by nccn – control the droplet size, with larger droplets shifting Tfrz towards higher temperatures. Repeating the simulations yields different Tfrz histograms, highlighting the probabilistic formulation of homogeneous freezing. To obtain smooth Tfrz histograms, nsd=1000 super-particles were sufficient when DEP-ICE was inactive, whereas nsd=10 000 were required when DEP-ICE was active. However, bulk properties such as the ice number concentration ni were already robust for nsd=1000.
4.2 Distribution of freezing temperatures Tfrz
Most cloud models employ a threshold formulation for homogeneous nucleation of pure water droplets, in which all droplets freeze once the ambient temperature drops below a prescribed threshold Thom. A commonly used value is Thom=235 K (or −38 °C). In contrast, we find that most super-particles freeze at temperatures higher than Thom, with the highest freezing temperatures Tfrz close to 240 K. Only for strong updrafts (), high CCN number concentrations (), or lognormal CCN size spectra do some super-particles freeze below Thom. With vapour deposition on ice (DEP-ICE) active, the thermodynamic forcing of the Wegener-Bergeron-Findeisen process is particularly strong in this temperature range. As a result, most droplets (> 90 %) evaporate before freezing following the first few freezing events, which typically occur at Tfrz>237 K. In this sense, our results are consistent with the classical homogeneous nucleation threshold Thom=235 K, in that by this temperature most droplets have indeed been removed or are frozen. However, two important caveats must be considered. First, when ice is already present (e.g. due to immersion freezing), liquid droplets may evaporate before reaching Thom. In a more realistic stochastic freezing framework, these droplets would still have a significant probability of freezing. In this case, a threshold formulation underestimates the resulting ice number concentration ni. Second, in the absence of pre-existing ice or ice-nucleating particles, the threshold formulation overestimates ni, since in reality early freezing events trigger the evaporation of a large fraction of the remaining droplets via the Wegener-Bergeron-Findeisen process.
4.3 Choice of Jhom parametrisation
The choice of homogeneous nucleation rate parameterisation influences both the distribution of Tfrz and the resulting ni after the freezing event. Although the JHOM-T and JHOM-DWA formulations have similar slopes and are often considered to agree closely at water saturation (Sw=1), even small absolute differences between the two can lead to different onsets of freezing. Their behaviour diverges further when water saturation is no longer maintained. This divergence arises from the explicit dependence of the JHOM-DWA formulation on water activity, which makes the nucleation rate sensitive to small deviations of Sw. In our simulations, use of the JHOM-DWA formulation is associated with broader Tfrz distributions and generally lower ni compared to JHOM-T, particularly when vapour deposition on ice (DEP-ICE) is active. While JHOM-DWA in principle provides a unified framework applicable to both cloud droplets and aqueous solution droplets, our results suggest that its application to micrometre-sized cloud droplets in mixed-phase conditions requires care, especially in models that explicitly predict Sw (e.g., without saturation adjustment). However, we should not neglect the JHOM-DWA approach for cloud droplets entirely. While these can mostly be considered pure droplets, as the amount of solute from the CCN is low in this size range, these foreign substances should still have some effect on the freezing behaviour. However, constraining the magnitude of this effect is beyond the scope of this study.
4.4 Limitations
In this study, we employ a highly idealised model setup. The simple air-parcel framework does not account for turbulent mixing or interactions with the surrounding flow. In addition, sedimentation is neglected, both the sedimentation of particles into the air parcel and their removal from it. Including sedimentation in a parcel framework is inherently problematic, as it depends on the arbitrary choice of parcel volume and the assumed surrounding cloud environment. Droplet coalescence is also not considered. However, this process is not expected to be relevant for most setups investigated here, as the commonly used geometric collision kernel is not applicable to the monodisperse CCN spectra employed in this study. While coalescence would lead to larger droplets that freeze at higher temperatures, it would also modify the multiplicity distribution ξ, thereby affecting how super-particle–environment interactions such as condensation, latent heating, and DEP-ICE are weighted. The Wegener-Bergeron-Findeisen process plays a key role in stochastic homogeneous freezing events, as early freezing of a small number of “lucky” super-particles can trigger the evaporation of the remaining liquid droplets. In our simulations, typically more than 90 % of droplets evaporate before freezing. However, several studies suggest that glaciation driven by the Wegener-Bergeron-Findeisen process may be overestimated in cloud models, and that mixed-phase conditions can be maintained for longer periods (Abade and Albuquerque, 2024). Improving the representation of this process is therefore critical for accurately modelling homogeneous freezing events. Finally, all simulations were performed without ice-nucleating particles (INPs) or pre-existing ice. Including INPs would introduce additional degrees of freedom, such as the freezing temperature and surface area of INPs. Here, we focus on the fundamental behaviour of homogeneous freezing. We further argue that the INP-free conditions considered here are relevant in specific atmospheric situations, such as at rising cloud tops with high droplet concentrations or in regions where pre-existing ice has already sedimented out of the air parcel.
Figures 1–6 and S1–S5 can be reproduced using Jupyter notebooks openly available at https://github.com/open-atmos/PySDM (last access: 9 October 2026). The exact version of the model used to produce the results used in this paper is archived on Zenodo under https://doi.org/10.5281/zenodo.22080761 (Lüttmer, 2026), as are scripts to run the model and produce the plots for all the simulations presented in this paper.
The supplement related to this article is available online at https://doi.org/10.5194/gmd-19-10185-2026-supplement.
TL and SA contributed to the model development; TL designed the study; TL performed the simulations and carried out the data analyses; TL and PS contributed to interpreting the results; TL, SA and PS contributed to writing the paper.
At least one of the (co-)authors is a member of the editorial board of Geoscientific Model Development. The peer-review process was guided by an independent editor, and the authors also have no other competing interests to declare.
Publisher's note: Copernicus Publications remains neutral with regard to jurisdictional claims made in the text, published maps, institutional affiliations, or any other geographical representation in this paper. The authors bear the ultimate responsibility for providing appropriate place names. Views expressed in the text are those of the authors and do not necessarily reflect the views of the publisher.
We thank the anonymous reviewers for their insightful comments on the original paper.
This research has been supported by the Deutsche Forschungsgemeinschaft (grant no. 428312742), by the Polish National Science Centre (grant no. 2020/39/D/ST10/01220) and by the Mainz Institute of Multiscale Modeling (M3ODEL Junior Fellowship).
This paper was edited by Wojciech W. Grabowski and reviewed by two anonymous referees.
Abade, G. C. and Albuquerque, D. G.: Persistent mixed-phase states in adiabatic cloud parcels under idealised conditions, Q. J. Roy. Meteor. Soc., 150, 3450–3474, https://doi.org/10.1002/qj.4775, 2024. a
Alpert, P. A. and Knopf, D. A.: Analysis of isothermal and cooling-rate-dependent immersion freezing by a unifying stochastic ice nucleation model, Atmos. Chem. Phys., 16, 2083–2107, https://doi.org/10.5194/acp-16-2083-2016, 2016. a
Arabas, S., Jaruga, A., Pawlowska, H., and Grabowski, W. W.: libcloudph 1.0: a single-moment bulk, double-moment bulk, and particle-based warm-rain microphysics library in C, Geosci. Model Dev., 8, 1677–1707, https://doi.org/10.5194/gmd-8-1677-2015, 2015. a
Arabas, S., Curtis, J. H., Silber, I., Fridlind, A. M., Knopf, D. A., West, M., and Riemer, N.: Immersion Freezing in Particle-Based Aerosol-Cloud Microphysics: A Probabilistic Perspective on Singular and Time-Dependent Models, J. Adv. Model. Earth Sy., 17, https://doi.org/10.1029/2024MS004770, 2025. a, b
Bartman, P., Bulenok, O., Górski, K., Jaruga, A., Łazarski, G., Olesik, M. A., Piasecki, B., Singer, C. E., Talar, A., and Arabas, S.: PySDM v1: particle-based cloud modeling package for warm-rain microphysics and aqueous chemistry, Journal of Open Source Software, 7, 3219, https://doi.org/10.21105/joss.03219, 2022. a
Bigg, E. K.: The Supercooling of Water, P. Phys. Soc. Lond. B, 66, 688, https://doi.org/10.1088/0370-1301/66/8/309, 1953. a
Choudhury, G. and Tesche, M.: A first global height-resolved cloud condensation nuclei data set derived from spaceborne lidar measurements, Earth Syst. Sci. Data, 15, 3747–3760, https://doi.org/10.5194/essd-15-3747-2023, 2023. a
Costa-Surós, M., Gonçalves Ageitos, M., Chatziparaschos, M., Georgakaki, P., Thomas, M. A., Montané Pinto, G., Myriokefalitakis, S., van Noije, T., Le Sager, P., Kanakidou, M., Nenes, A., and Pérez García-Pando, C.: Implementation of primary and secondary ice production in EC-Earth3-AerChem: global impacts and insights, Atmos. Chem. Phys., 26, 2667–2690, https://doi.org/10.5194/acp-26-2667-2026, 2026. a, b
de Jong, E. K., Singer, C. E., Azimi, S., Bartman, P., Bulenok, O., Derlatka, K., Dula, I., Jaruga, A., Mackay, J. B., Ward, R. X., and Arabas, S.: New developments in PySDM and PySDM-examples v2: collisional breakup, immersion freezing, dry aerosol initialization, and adaptive time-stepping, Journal of Open Source Software, 8, 4968, https://doi.org/10.21105/joss.04968, 2023. a
ECMWF: IFS Documentation CY48R1 – Part IV: Physical Processes, 4, ECMWF, https://doi.org/10.21957/02054f0fbf, 2023. a, b
Field, P. R., Hill, A., Shipway, B., Furtado, K., Wilkinson, J., Miltenberger, A., Gordon, H., Grosvenor, D. P., Stevens, R., and Van Weverberg, K.: Implementation of a double moment cloud microphysics scheme in the UK met office regional numerical weather prediction model, Q. J. Roy. Meteor. Soc., 149, 703–739, https://doi.org/10.1002/qj.4414, 2023. a, b
Fusina, F., Spichtinger, P., and Lohmann, U.: Impact of ice supersaturated regions and thin cirrus on radiation in the midlatitudes, J. Geophys. Res.-Atmos., 112, https://doi.org/10.1029/2007JD008449, 2007. a
Gasparini, B., Meyer, A., Neubauer, D., Münch, S., and Lohmann, U.: Cirrus Cloud Properties as Seen by the CALIPSO Satellite and ECHAM-HAM Global Climate Model, J. Climate, 31, 1983–2003, https://doi.org/10.1175/JCLI-D-16-0608.1, 2018. a
Hande, L. B., Engler, C., Hoose, C., and Tegen, I.: Seasonal variability of Saharan desert dust and ice nucleating particles over Europe, Atmos. Chem. Phys., 15, 4389–4397, https://doi.org/10.5194/acp-15-4389-2015, 2015. a
Hande, L. B., Engler, C., Hoose, C., and Tegen, I.: Parameterizing cloud condensation nuclei concentrations during HOPE, Atmos. Chem. Phys., 16, 12059–12079, https://doi.org/10.5194/acp-16-12059-2016, 2016. a
Hoshyaripour, G. A., Baer, A., Bierbauer, S., Bruckert, J., Brunner, D., Förstner, J., Hamzehloo, A., Hanft, V., Keller, C., Klose, M., Kumar, P., Ludwig, P., Metzner, E., Muth, L., Pauling, A., Porz, N., Ramezani Ziarani, M., Reddmann, T., Reißig, L., Ruhnke, R., Satitkovitchai, K., Seifert, A., Sinnhuber, M., Steiner, M., Versick, S., Vogel, H., Weimer, M., Werchner, S., and Hoose, C.: The atmospheric composition component of the ICON modeling framework: ICON-ART version 2025.10, Geosci. Model Dev., 19, 1645–1681, https://doi.org/10.5194/gmd-19-1645-2026, 2026. a, b
Howell, W. E.: The Growth of Cloud Drops in Uniformly Cooled Air, J. Atmos. Sci., 6, 134–149, https://doi.org/10.1175/1520-0469(1949)006<0134:TGOCDI>2.0.CO;2, 1949. a
Ickes, L., Welti, A., Hoose, C., and Lohmann, U.: Classical nucleation theory of homogeneous freezing of water: thermodynamic and kinetic parameters, Phys. Chem. Chem. Phys., 17, 5514–5537, https://doi.org/10.1039/C4CP04184D, 2015. a, b, c, d
Joos, H., Spichtinger, P., Reutter, P., and Fusina, F.: Influence of heterogeneous freezing on the microphysical and radiative properties of orographic cirrus clouds, Atmos. Chem. Phys., 14, 6835–6852, https://doi.org/10.5194/acp-14-6835-2014, 2014. a
Jurányi, Z., Gysel, M., Weingartner, E., DeCarlo, P. F., Kammermann, L., and Baltensperger, U.: Measured and modelled cloud condensation nuclei number concentration at the high alpine site Jungfraujoch, Atmos. Chem. Phys., 10, 7891–7906, https://doi.org/10.5194/acp-10-7891-2010, 2010. a
Kärcher, B. and Lohmann, U.: A parameterization of cirrus cloud formation: Homogeneous freezing of supercooled aerosols, J. Geophys. Res.-Atmos., 107, https://doi.org/10.1029/2001JD000470, 2002. a
Koop, T. and Murray, B. J.: A physically constrained classical description of the homogeneous nucleation of ice in water, J. Chem. Phys., 145, https://doi.org/10.1063/1.4962355, 2016. a, b, c, d, e, f
Koop, T., Luo, B., Tsias, A., and Peter, T.: Water activity as the determinant for homogeneous ice nucleation in aqueous solutions, Nature, 406, 611–614, https://doi.org/10.1038/35020537, 2000. a
Krämer, M., Rolf, C., Luebke, A., Afchine, A., Spelten, N., Costa, A., Meyer, J., Zöger, M., Smith, J., Herman, R. L., Buchholz, B., Ebert, V., Baumgardner, D., Borrmann, S., Klingebiel, M., and Avallone, L.: A microphysics guide to cirrus clouds – Part 1: Cirrus types, Atmos. Chem. Phys., 16, 3463–3483, https://doi.org/10.5194/acp-16-3463-2016, 2016. a
Krämer, M., Rolf, C., Spelten, N., Afchine, A., Fahey, D., Jensen, E., Khaykin, S., Kuhn, T., Lawson, P., Lykov, A., Pan, L. L., Riese, M., Rollins, A., Stroh, F., Thornberry, T., Wolf, V., Woods, S., Spichtinger, P., Quaas, J., and Sourdeval, O.: A microphysics guide to cirrus – Part 2: Climatologies of clouds and humidity from observations, Atmos. Chem. Phys., 20, 12569–12608, https://doi.org/10.5194/acp-20-12569-2020, 2020. a, b
Lamb, D. and Verlinde, J.: Physics and chemistry of clouds, Cambridge University Press, https://doi.org/10.1017/CBO9780511976377, 2011. a
Luebke, A. E., Afchine, A., Costa, A., Grooß, J.-U., Meyer, J., Rolf, C., Spelten, N., Avallone, L. M., Baumgardner, D., and Krämer, M.: The origin of midlatitude ice clouds and the resulting influence on their microphysical properties, Atmos. Chem. Phys., 16, 5793–5809, https://doi.org/10.5194/acp-16-5793-2016, 2016. a
Lüttmer, T., Miltenberger, A., and Spichtinger, P.: On the impact of ice formation processes and sedimentation on cirrus origin classification in warm conveyor belt outflow, Atmos. Chem. Phys., 25, 10245–10265, https://doi.org/10.5194/acp-25-10245-2025, 2025a. a
Lüttmer, T., Spichtinger, P., and Seifert, A.: Investigating ice formation pathways using a novel two-moment multi-class cloud microphysics scheme, Atmos. Chem. Phys., 25, 4505–4529, https://doi.org/10.5194/acp-25-4505-2025, 2025b. a, b
Lüttmer, T.: Stochastic homogeneous freezing of supercooled droplets in mixed-phase clouds in particle-based idealised microphysics framework (exemplified with PySDM v3.0), Zenodo [code, data set], https://doi.org/10.5281/zenodo.22080761, 2026. a
Morrison, H. and Milbrandt, J. A.: Parameterization of Cloud Microphysics Based on the Prediction of Bulk Ice Particle Properties. Part I: Scheme Description and Idealized Tests, J. Atmos. Sci., 72, 287–311, https://doi.org/10.1175/JAS-D-14-0065.1, 2015. a
Murray, B. J., Broadley, S. L., Wilson, T. W., Bull, S. J., Wills, R. H., Christenson, H. K., and Murray, E. J.: Kinetics of the homogeneous freezing of water, Phys. Chem. Chem. Phys., 12, 10380–10387, https://doi.org/10.1039/C003297B, 2010. a
Petters, M. D. and Kreidenweis, S. M.: A single parameter representation of hygroscopic growth and cloud condensation nucleus activity, Atmos. Chem. Phys., 7, 1961–1971, https://doi.org/10.5194/acp-7-1961-2007, 2007. a
Phillips, V. T., DeMott, P. J., and Andronache, C.: An empirical parameterization of heterogeneous ice nucleation for multiple chemical species of aerosol, J. Atmos. Sci., 65, 2757–2783, https://doi.org/10.1175/2007JAS2546.1, 2008. a
Pruppacher, H., Klett, J., Pruppacher, H., and Klett, J.: Microstructure of atmospheric clouds and precipitation, Springer, https://doi.org/10.1007/978-0-306-48100-0, 2010. a, b, c
Seifert, A. and Beheng, K. D.: A two-moment cloud microphysics parameterization for mixed-phase clouds. Part 1: Model description, Meteorol. Atmos. Phys., 92, 45–66, https://doi.org/10.1007/s00703-005-0112-4, 2006. a, b
Shima, S., Sato, Y., Hashimoto, A., and Misumi, R.: Predicting the morphology of ice particles in deep convection using the super-droplet method: development and evaluation of SCALE-SDM 0.2.5-2.2.0, -2.2.1, and -2.2.2, Geosci. Model Dev., 13, 4107–4157, https://doi.org/10.5194/gmd-13-4107-2020, 2020. a, b
Skrotzki, J., Connolly, P., Schnaiter, M., Saathoff, H., Möhler, O., Wagner, R., Niemand, M., Ebert, V., and Leisner, T.: The accommodation coefficient of water molecules on ice – cirrus cloud studies at the AIDA simulation chamber, Atmos. Chem. Phys., 13, 4451–4466, https://doi.org/10.5194/acp-13-4451-2013, 2013. a, b
Spichtinger, P. and Gierens, K. M.: Modelling of cirrus clouds – Part 1a: Model description and validation, Atmos. Chem. Phys., 9, 685–706, https://doi.org/10.5194/acp-9-685-2009, 2009. a, b, c
Spichtinger, P., Marschalik, P., and Baumgartner, M.: Impact of formulations of the homogeneous nucleation rate on ice nucleation events in cirrus, Atmos. Chem. Phys., 23, 2035–2060, https://doi.org/10.5194/acp-23-2035-2023, 2023. a, b, c, d, e
Ullrich, R., Hoose, C., Möhler, O., Niemand, M., Wagner, R., Höhler, K., Hiranuma, N., Saathoff, H., and Leisner, T.: A New Ice Nucleation Active Site Parameterization for Desert Dust and Soot, J. Atmos. Sci., 74, 699–717, https://doi.org/10.1175/JAS-D-16-0074.1, 2017. a
Vali, G., DeMott, P. J., Möhler, O., and Whale, T. F.: Technical Note: A proposal for ice nucleation terminology, Atmos. Chem. Phys., 15, 10263–10270, https://doi.org/10.5194/acp-15-10263-2015, 2015. a
Welss, J.-N., Siewert, C., and Seifert, A.: Explicit Habit-Prediction in the Lagrangian Super-Particle Ice Microphysics Model McSnow, J. Adv. Model. Earth Sy., 16, e2023MS003805, https://doi.org/10.1029/2023MS003805, 2024. a
Zhang, Y., Macke, A., and Albers, F.: Effect of crystal size spectrum and crystal shape on stratiform cirrus radiative forcing, Atmos. Res., 52, 59–75, https://doi.org/10.1016/S0169-8095(99)00026-5, 1999. a