the Creative Commons Attribution 4.0 License.
the Creative Commons Attribution 4.0 License.
 | 02 Dec 2025
A process-based modeling of soil organic matter physical properties for land surface models – Part 1: Soil mixture theory
Bertrand Decharme
Numerous studies have highlighted the critical role of soil organic matter (SOM) physical properties in simulating hydrological and energy exchanges within Earth system models. However, current approaches in their land surface model (LSM) components typically rely on empirically derived parameterizations that lack physical consistency and often fail to distinguish between soil organic carbon (SOC) and total SOM. This conceptual simplification leads to inaccurate estimates of the volumetric organic fraction of soils and, consequently, of their physical properties as highlighted in this study. A process-based framework grounded in soil mixture theory is thus proposed to provide a physically consistent representation of the effects of SOM on soil behavior. The volumetric fraction of SOM is derived using mass-volume relationships, combined with an SOC-to-SOM conversion based on recent pedotransfer functions. For LSMs using the Brooks and Corey model to simulate soil water retention and hydraulic conductivity, new parameterizations are proposed for SOM hydrodynamic properties as functions of bulk density and depth, informed by recent observational datasets. Validation against experimental binary mixtures and large in situ datasets shows significant improvements over conventional methods. Designed for compatibility with global soil databases, the framework enables more physically consistent SOM representation in LSMs without requiring additional inputs or calibration.
- Article
(8295 KB) - Full-text XML
-
Supplement
(7688 KB) - BibTeX
- EndNote


Soil is a fundamental component of the land surface. It consists of solid particles surrounding pore spaces that contain water, ice, and usually air. It forms gradually over time through the physical, chemical, and biological weathering of parent rock material located beneath the surface. This process results from the combined influence of climate (notably temperature fluctuations, precipitation, and freeze-thaw cycles), living organisms (such as roots, microorganisms, and earthworms), chemical weathering, and the passage of time. Weathering breaks down the rock, releases minerals, and allows the accumulation of organic matter derived from decomposing plant material, giving rise to a complex and evolving medium (Buol et al., 2011). The soil then consists of a fine fraction, composed of particles smaller than 2 mm in diameter, and a coarse fraction, made up of rock fragments or gravel larger than 2 mm (Blair and McPherson, 1999). This heterogeneous system plays an important role in the functioning of the Earth's climate system, particularly by regulating the exchange of water, energy, and gases with the atmosphere. Soil acts as a temporary reservoir for rainfall: it can retain water, redistribute it to plants via capillarity, or allow it to infiltrate into groundwater systems. Once its retention capacity is exceeded, excess water may flow over the surface into rivers. This hydrological dynamic, in interaction with the soil’s thermal and structural properties, directly influences plant growth, local climate, and energy fluxes between the biosphere and the atmosphere.
The majority of soils contain in its fine fraction both mineral and organic components in the different horizons that constitute it, although one of these components typically predominates. The organic component of soil, known as soil organic matter (SOM), is a complex mixture of microbial biomass, partially decomposed plant and animal residues, and stable organic compounds resulting from advanced stages of decomposition. Soil horizons with a SOM content of less than about 20 % to 35 % by weight exhibit characteristics that are more akin to those of mineral soil (USDA, 1999). Despite this separation, the volume of SOM often exceeds that of the mineral material in the fine-earth fraction, primarily due to its lower bulk density. A key constituent of SOM is soil organic carbon (SOC), which refers specifically to the carbon elements present in organic compounds within the soil. SOM typically contains more or less 50 % by mass of SOC, although this proportion varies depending on the degree of decomposition and organic matter composition. Other elements are oxygen, hydrogen and small quantities of sulfur, nitrogen, phosphorus, potassium, calcium and magnesium. As such, SOC represents only the carbonaceous fraction of total SOM, and although often used as a proxy in soil databases, it does not fully capture the physical and chemical contributions of organic matter. For instance, according to the United States Department of Agriculture (USDA), a soil material is classified as mineral when it exhibits a SOC content less than 12 % by weight for soils devoid of clay and less than 18 % by weight for soils containing 60 % by weight or more clay. If SOC content exceeds this threshold, the material is classified as organic and is designated as peat. Importantly, mineral soils often have a superficial organic horizon formed by the gradual accumulation of partially decomposed organic matter derived from the decomposition of fallen leaves and other plant residues.
SOM alters soil structure by reducing the bulk density of the fine fraction and increasing the porosity compared to pure mineral materials. This facilitates air and water movement, increases the soil's water-holding capacity and facilitates plant growth (Boggie, 1970; Walczak et al., 2002; Deeb et al., 2016; Willaredt et al., 2023). When SOM is only slightly decomposed, typically near the surface, it tends to increase the hydraulic conductivity of the soil compared to purely mineral soils. Conversely, at greater depths, where SOM is more decomposed, it tends to reduce hydraulic conductivity, thereby contributing to greater moisture retention in the soil (Boelter, 1968, 1969; Letts et al., 2000; Liu and Lennartz, 2019; Liu et al., 2020, 2022; Morris et al., 2022). SOM has also a low thermal conductivity and a relatively high specific heat capacity compared to mineral soil (Farouki, 1981; Zhu et al., 2019; Arkhangelskaya and Gvozdkova, 2019; Arkhangelskaya and Telyatnikova, 2023). It therefore moderates the transfer of energy into the soil and acts as an insulator, preventing the soil from becoming too warm in summer and too cold in winter (Lawrence and Slater, 2008; Decharme et al., 2016; Gaillard et al., 2025). In addition to this direct effect, SOM also mainly influences soil thermal behavior indirectly through its impact on soil structure and porosity.
This brief overview underlines why a better modeling of the physical processes governing the influence of SOM on soil properties is essential for improving the representation of soils in Land Surface Models (LSMs), and thus in Earth system models. More than 50 years ago, LSMs were introduced into atmospheric general circulation models and then climate models to provide realistic lower boundary conditions for temperature and moisture. From the simple bucket models of Manabe (1969) or Noilhan and Planton (1989), their complexity has progressively increased to include sophisticated multilayer representations of soil and snow, with multiple parameterizations describing the physical processes associated with vegetation, soil, and snow, as well as the biogeochemical processes linked to the carbon cycle (Bonan and Doney, 2018; Blyth et al., 2021). Originally, soils were represented solely based on mineral materials using pedotransfer functions (PTFs) to derive physical properties from soil texture (e.g. Van Looy et al., 2017). Since the late 2010s, building on pioneering works of Letts et al. (2000) and especially Lawrence and Slater (2008), land surface modellers have developed empirical approaches to account for the influence of organic matter on soil physical properties (Dankers et al., 2011; Chen et al., 2012; Chadburn et al., 2015; Decharme et al., 2016; Chen et al., 2016; Guimberteau et al., 2018; Sun et al., 2021). While PTFs including organic matter have long existed in soil science for hydrodynamic properties (Rawls et al., 2004; Weynants et al., 2009; Wösten et al., 1999; Tóth et al., 2015; Van Looy et al., 2017), their use in LSMs has generally remained limited. For thermal properties, such PTFs are nearly absent, with models usually relying on fixed values or simple mixing rules.
The primary challenges faced by LSMs in accounting for the physical effects of SOM lies in the need to determine its volumetric fraction. It is indeed the volumetric proportions of the various soil components (mineral particles, organic matter, water, and air) that govern its key physical properties (Farouki, 1981). For instance, soil porosity is defined as the ratio of pore volume to total soil volume, while volumetric heat capacity, i.e. the ability of soil to store heat, is calculated based on the heat required to increase the temperature by 1 K of 1 m3 of soil. Accurate estimation of the volumetric contribution of each component is also critical for deriving soil thermal conductivity (Farouki, 1981; Peters-Lidard et al., 1998; Balland and Arp, 2005; He et al., 2020). However, current LSMs typically rely on global or regional soil databases, which often do not provide direct information on volumetric composition. Instead, databases such as the Harmonized World Soil Database (HWSD; FAO, 2012; FAO and IIASA, 2023) and SoilGrids (Poggio et al., 2021) commonly report soil textures (sand, clay, loam) content by weight, soil dry bulk density and SOC content by weight, but not the actual volumetric content of organic matter, which must be inferred indirectly. To estimate this volumetric fraction of SOM, all the previously mentioned parameterizations compute it as the ratio of the SOC density in each soil layers (possibly inferred from the product of SOC content by weight and the soil dry bulk density) to a fixed maximum soil carbon density, typically set to 130 kg m−3 (Lawrence and Slater, 2008), with the questionable assumption that this value is equivalent to a standard bulk density of peat based on Farouki (1981).
This assumption is problematic for two main reasons. First, it overlooks the substantial variability in peat bulk density, which can range from as low as 10 to 400 kg m−3, and even up to 800 kg m−3, depending on peat type, total SOM content, degree of decomposition, and compaction (Boelter, 1968; Letts et al., 2000; Schwärzel et al., 2002; Liu and Lennartz, 2019). Second, Farouki (1981) does not explicitly relate a standard bulk density of peat to SOC density, but instead provides an approximate average particle density of SOM of 1300 kg m−3. When combined with a plausible peat porosity of 90 %, this yields a bulk density of around 130 kg m−3 for pure SOM material. However, since this value refers to total organic matter and not specifically to SOC, using it as a direct threshold for SOC is inconsistent and potentially misleading. For instance, Decharme et al. (2016) fell into the same conceptual trap. They combined the approximate average particle density of SOM of Farouki (1981) with an idealized peat porosity profile based on Boelter (1968) and Letts et al. (2000) to derive this threshold value. However, this method is theoretically flawed, as it conflates SOM-based bulk density with a threshold intended for SOC, leading to a potentially incorrect representation of the SOM volumetric fraction. To summarize, existing parameterizations in LSMs that account for the influence of organic matter on soil physical properties, and are based on the pioneering work of Lawrence and Slater (2008), exhibit conceptual inconsistencies that warrant reconsideration in light of recent understanding.
This last inconsistency highlights the second challenge faced by LSMs in accounting for the physical effects of SOM, which arises from the often-overlooked distinction between SOC and total SOM. While SOC is often used as a proxy in LSMs due to data availability, SOM includes not only carbon-based compounds but also a variety of other organic constituents. Therefore, misinterpretation of SOC as a direct measure of SOM can lead to significant errors. This discrepancy is not only an additional source of uncertainty, but also a potential source of systematic bias in the parameterization of soil physical processes. Recent studies estimate the carbon fraction in SOM, historically based on van Bemmelen's factor of 58 %, to be closer to a median value of 50 %, but with significant variation (13 % to 74 %) depending on soil type and degree of organic matter decomposition (Pribyl, 2010; Ruehlmann, 2020). Improving the accuracy of this estimate in LSMs is therefore essential for more reliable representations of the physical effects of SOM. A final limitation lies in the uncertainty surrounding the hydrodynamic parameters used in LSMs to represent organic-rich soils. Many models rely on the Brooks and Corey (1964) water retention and hydraulic conductivity relationships to solve the Richards equation for soil water flow (e.g. Vereecken et al., 2019). These closed-form equations, which link soil moisture, water potential and hydraulic conductivity, however often lack well-constrained parameter values for organic soils. In contrast, LSMs that use the van Genuchten (1980) closed-form equations could benefit from more recent pedotransfer functions that explicitly incorporate SOM content and soil dry bulk density (e.g. Vereecken et al., 2010) or that are directly calibrated for organic soils and peatlands (Liu and Lennartz, 2019). Theses pedotransfer functions are however rarely used by regional or global LSMs.
The aim of the present study is therefore to propose a robust, process-based framework for accurately representing the physical properties of SOM in LSMs. As is common practice in current LSMs, we focus exclusively on the fine earth fraction of the soil, neglecting the coarse fragment content (stones, gravels, etc.). First, we apply the theory of soil mixture (Stewart et al., 1970; Adams, 1973; Raats, 1987; Rühlmann et al., 2006; Reynolds et al., 2020) to estimate the “true” volumetric fraction of SOM. This soil mixture theory is a mathematical framework that seeks to explain the composition and structure of soil. Second, in order to derive SOM content from SOC measurements, we use the recent pedotransfer function developed by Ruehlmann (2020) to provide a refined estimate of the van Bemmelen factor. Finally, for LSMs that use the Brooks and Corey (1964) relationships, we propose accurate parameter values for SOM hydraulic properties, informed by recent observational studies (Liu and Lennartz, 2019; Lennartz and Liu, 2019; Liu et al., 2022; Morris et al., 2022). The new modeling strategy is presented in Sect. 2, along with a brief review of existing parameterizations. Section 3 details the data used for validation. The main results are presented in Sect. 4 and discussed in Sect. 5. While the study primarily focuses on LSMs that use the Brooks and Corey (1964) model, Sect. 5 also discusses the viability of the proposed approach for LSMs that rely on the closed-form equations of van Genuchten (1980). Finally, the main conclusions of the study are provided in Sect. 6.
2.1 Previous parameterization in LSMs
2.1.1 Soil organic volumetric fraction from SOC content
As previously mentioned, most parameterizations of the physical effects of SOM in LSMs rely on the formulation proposed by Lawrence and Slater (2008) for estimating the soil organic matter volumetric fraction, (m3 m−3), defined as:
Here, ρsc (kg m−3) is the soil carbon density, which can be estimated from (kg kg−1), the SOC mass fraction (i.e. the ratio of SOC mass to the total soil mass commonly expressed as a percentage or in g cg−1) and ρb (kg m−3), the soil dry bulk density. The parameter kg m−3 represents the maximum soil carbon density, assumed equivalent to a standard bulk density of peat. A similar formulation is provided by Decharme et al. (2016), but propose an expression for ρsc,max based on the relationship between SOM particle density and peat porosity that varies with depth. Specifically, they write:
where kg m−3 is an estimates of the SOM particle density (the mass of SOM per unit volume of organic matter within the soil, i.e., the density of the organic phase itself), and (m3 m−3) is the porosity of the organic material, which varies between 0.93 and 0.845 m3 m−3 depending on a depth idealised profile, z (m), typically assumed to extend over a 1 m soil depth. When reaches 0.9 m3 m−3, which corresponds to a few centimeters below the soil surface within this idealised profile, this expression effectively becomes equivalent to the formulation used by Lawrence and Slater (2008). Finally, Chen et al. (2012) proposed the following equation to estimate the volumetric fraction of SOM from the SOC content by weight, the density of the mineral component, and the maximum soil carbon density intended to be typical of organic-rich peat:
Here, (kg m−3) is the bulk density of the mineral component, defined as the mass of mineral matter per unit total soil volume. It is derived from the porosity of the mineral phase, (m3 m−3), and the standard value for the particle density of mineral matter, kg m−3, which represents the mass per unit volume of mineral solids. The parameter kg m−3 is adopted from Lawrence and Slater (2008).
However, as previously discussed, these formulation are conceptually problematic. If ρsc,max is interpreted as the mass of organic carbon per unit soil volume (i.e., SOC density), these equations are formally valid but represent the SOC volumetric fraction and thus could systematically introduce biases in the actual volumetric fraction of organic matter, as it neglects the SOC-to-SOM conversion. Conversely, if ρsc,max truly refers to the bulk density of peat, a material largely composed of SOM, then the denominator should physically represent the density of total organic matter, not just its carbon content. In this case, these equation become inconsistent with physical definitions, as it compares quantities of different nature.
2.1.2 Soil mineral and organic properties, and applied mixing rules
In most existing parameterizations, LSMs estimate the thermal and hydraulic properties of soils by mixing the contributions of mineral and organic components. For the mineral material, thermal properties are generally estimated based on the formulations of Johansen (1977) and Farouki (1981), as adapted for LSMs by Peters-Lidard et al. (1998). The volumetric heat capacity of the mineral solid phase is typically computed as the product of the specific heat capacity of quartz (733 J kg−1 K−1) and the standard value for . The dry and solid thermal conductivities are generally derived from non-linear formulations that depend on the same particle density, the mineral porosity (or saturated water content), the thermal conductivity of quartz, and the soil's quartz content. Hydraulic properties of the mineral material associated with the Brooks and Corey (1964) model, such as the porosity, the air entry pressure head (or saturated matric potential), the pore-size distribution index (or the shape of the soil water retention curve), and the saturated hydraulic conductivity, are usually derived from Clapp and Hornberger (1978) or Cosby et al. (1984) PTFs.
The physical properties of organic materials are generally empirically derived from meta-analyses and literature values, with thermal properties often taken from Farouki (1981), and hydraulic properties from studies such as Boelter (1969) and Letts et al. (2000). For instance, Table S1 in the Supplement summaries the values used for organic soil physical properties by Lawrence and Slater (2008) and Decharme et al. (2016). As previously discussed, these include prescribed thermal and hydraulic properties from peat literature. Lawrence and Slater (2008) apply uniform values representative of fibric peat, while Decharme et al. (2016) introduce depth-dependent profiles to reflect the transition from fibric to sapric material. Although these values are broadly consistent with observed ranges reported in the literature, they remain empirical and do not account for the structural variability or compositional differences of organic matter. This limitation motivates the physically based approach developed in this study.
These mineral and organic properties are then combined in LSMs to estimate the thermal and hydraulic properties of soils, denoted Xs in the following paragraph. Specifically, these properties are represented as a weighted average between those of pure mineral material (Xms) and pure organic matter (Xom). Lawrence and Slater (2008) adopt a simple arithmetic mixing formulation for all parameters, given by:
This simple formalism is adopted by the majority of LSMs. The parameterization proposed by Decharme et al. (2016) adopts the same arithmetic mixing approach for most soil parameters but applies a geometric mixing rule to compute both thermal and hydraulic conductivities:
The rationale behind this geometric averaging is that it is more consistent with standard formulations for estimating effective conductivities in heterogeneous porous media (Farouki, 1981; Nielson and Rogers, 1982; Prudic, 1991; Peters-Lidard et al., 1998; Stepanyants and Teodorovich, 2003). Other non-linear mixing rules can also be used, both in existing models and in this study. For example, the weighted harmonic mean is often applied to average thermal conductivities in vertically heterogeneous soils:
The geo-harmonic average, originally introduced by Nielson and Rogers (1982) in the context of radon diffusion through heterogeneous porous media, may also provide a suitable alternative. This formulation was designed to better account for the tortuous flow paths and variable phase continuity that arise in granular mixtures. It combines features of both geometric and harmonic means, making it particularly suited for estimating effective transport properties, such as thermal or gas diffusivities, in partially connected or stratified systems. The geo-harmonic mean is defined as:
This approach captures the non-linear blending behavior often observed in porous materials with strong contrasts between constituents. It has proven useful in soil biophysics applications where both phase connectivity and interfacial resistance are key factors (Nielson and Rogers, 1982; Morel et al., 2019).
However, none of these mixing approaches (linear or non-linear) have been formally or empirically demonstrated to be physically justified for soils composed of both mineral and organic materials, at least not in the context of their application in LSMs.
2.2 A new process-based framework
To address these limitations and the conceptual inconsistencies identified in the previous section, a physically-based framework grounded in soil mixture theory is introduced. This framework aims to compute the “true” volumetric fraction of SOM and derive consistent thermal and hydrodynamic soil properties using only standard inputs available in global soil databases.
2.2.1 Theoretical background
Before deriving the entire framework, it is useful to recall the fundamental physical relationships linking volume, mass, density, and porosity. A soil can be described by the mass and volume of its solid matrix, along with the volume of voids within it. The total or bulk dry soil volume, vb (m3), is defined as the sum of the volume occupied by solid components, vs (m3), and the pore volume, vp (m3), which corresponds to voids that could then be filled with air, water, or ice:
Since the mass of the voids is null, the total dry soil mass, ms (kg), is equal to the mass of the solid matrix alone. From this, we define the particle (or solid) density, ρs (kg m−3), and the dry bulk density, ρb (kg m−3), of the soil as follows:
Equation (9a) shows that the particle density ρs characterizes the density of the solid phase alone, considering only the volume actually occupied by the solid material and excluding any pore space. In contrast, the bulk density ρb, given by Eq. (9b), uses the same solid mass but relates it to the total bulk volume of the soil, which includes both solids and voids. As a result, ρb is always lower than ρs, reflecting not only the composition of the soil solids, but also the internal void structure and the degree of compaction.
The internal void structure of the soil is commonly referred to as porosity, which is defined as the ratio of pore volume to total soil volume, (m3 m−3). By substituting Eq. (9) into Eq. (8), porosity can be expressed in terms of either the solid volume fraction or the ratio of bulk to particle densities, as follows:
Equation (10b) also shows that the dry bulk density of the soil can be determined from the total soil porosity and the soil solid density, as follows:
These two expressions (Eqs. 10b and 11) highlight the fundamental interdependence between porosity, bulk density, and solid density. The knowledge of any two allows the calculation of the third.
2.2.2 Soil mixture theory
However, soil is not a homogeneous medium, and its fine solid fraction is composed of both mineral matter and SOM. As comprehensively reviewed by Reynolds et al. (2020), the mixture theory provides a consistent framework to describe the mass-volume-density-porosity relationships among bulk soil, mineral components, and organic matter (Stewart et al., 1970; Adams, 1973; Raats, 1987; Rühlmann et al., 2006). In this conceptualization, soil is treated as a composite of two domains, a mineral matter domain and an organic matter domain, each with distinct mass and volume, as follow:
where mms and mom (kg) are the masses of mineral substance and organic matter, respectively, and (m3) the particle (or specific solid) volumes of the mineral and organic matter materials, respectively, and and (m3) the bulk volumes occupied by the mineral and organic matter components with their own porosities, respectively.
Next, each domain is characterised by distinct mass fractions (i.e., the ratio of each component's mass to the total soil mass defined by Eq. 12a), particle densities, and apparent bulk volumes, as follows:
where and (kg kg−1) are the soil organic and mineral mass fractions, respectively. It is then interesting to note that using the transposition of Eq. (12a) for mms into Eq. (13a). and (kg m−3) are the particle densities of organic matter and mineral matter, respectively, and and (kg m−3) the apparent bulk densities of each component. Substituting Eqs. (13b) and (13c) into Eqs. (12b) and (12c), and using Eq. (9), yields:
Inserting the definitions of the mass fractions from Eq. (13a) into Eq. (14), and using , leads to expressions for both soil bulk and particle densities as functions of and the densities of the individual soil components:
This formulation shows that both ρs and ρb are inversely related to the organic matter mass fraction . Within this framework, the solid and bulk densities of the soil can be interpreted as harmonic means (cf. Eq. 6) of the densities of the organic and mineral components, weighted by their respective mass fractions. In other words, the overall density reflects not just how dense each component is, but also how much of each is present in the mixture. Because organic matter is much less dense than mineral matter, even a small proportion of organic material can significantly reduce the effective density of the soil.
Finally, Eq. (10) states that the ratio between bulk density ρb and particle density ρs is equal to 1 minus the soil porosity wsat. Substituting the expressions from Eq. (14) into Eq. (10) thus yields:
Using volume mixing from Eq. (12c) and the mass-volume relationships from Eq. (13c), we can demonstrate that (see Sect. S1):
This expression reveals the contribution of the volumetric fractions of each soil component, organic and mineral, to the total porosity. Setting the volumetric fraction of organic matter in the soil as (m3 m−3), Eq. (17) can thus be rewritten as:
In full consistency with Eq. (10) and the soil mixture theory, the total soil porosity emerges as the volumetric-weighted arithmetic mean of the porosities of the individual domains, defined as:
with being the porosity of the organic matter domain and that of the mineral matter domain. This Eq. (18) validates the arithmetic mixing formulation adopted by Lawrence and Slater (2008) and by most LSMs, at least in the case of soil porosity.
2.2.3 “True” soil organic volumetric fraction
As expressed above, to pass from Eq. (17) to Eq. (18), the soil organic volumetric fraction is defined as the volumetric fraction of organic matter in the soil. It can be rearranged using Eq. (13c) as follow:
Recasting Eq. (20) in terms of mass fractions yields:
Then, substituting Eq. (9b) and the mass fraction definitions from Eq. (13a) into Eq. (21) leads to the “true” soil organic volumetric fraction :
Although Eq. (22) is mathematically similar in form to commonly used SOC-based formulations in LSMs, it provides a physically consistent estimate of (unlike these earlier approaches). Specifically, it avoids conflating SOC with total SOM and ensures dimensional and physical consistency between the two terms in the equation: the numerator, representing the mass of SOM per unit volume of bulk soil (i.e., how much organic matter is present per cubic meter of soil), and the denominator, representing the mass of SOM per unit volume of the SOM domain (i.e., how much organic matter would fill one cubic meter entirely composed of organic material).
2.2.4 SOM apparent bulk density
An essential requirement for deriving the “true” soil organic volumetric fraction from Eq. (22) is the knowledge of the apparent bulk density of SOM. Although this is not commonly measured, it can be inferred from the principle of mass-volume relationships inherent to soil mixture theory, starting from Eq. (15b) as follows:
can therefore be inferred from commonly available database, as many soil datasets provide observations or estimates of both ρb and , or more commonly . In the latter case, the SOC content must be accurately converted to SOM content, for instance as proposed in Sect. 2.2.5. In contrast, the apparent bulk density of the mineral substance () is generally not directly available, but it can be derived from Eq. (19) using the porosity of the mineral matter domain, estimated through standard PTFs (Clapp and Hornberger, 1978; Cosby et al., 1984), in combination with the particle density of mineral matter following Eq. (19):
In LSMs, is typically prescribed using a fixed value, often 2650 or 2700 kg m−3 (Peters-Lidard et al., 1998; Chen et al., 2012). However, observational studies report a wider range of values, from 2400 to 2900 kg m−3 (Schjønning et al., 2017; Ruehlmann and Körschens, 2020). To account for this inherent variability of , this study adopts an approach proposed by Ruehlmann (2020), which estimates as a function of the mass fractions of sand, silt, and clay:
where , , and (kg kg−1) are the mass fractions of clay, sand, and silt, respectively. The corresponding particle densities are taken from the PTF H-model of Ruehlmann (2020), with ρclay=2761, ρsand=2656, and ρsilt=2692 kg m−3.
2.2.5 SOC-to-SOM conversion factor
Quantifying SOM content from SOC estimates is generally done using the van Bemmelen SOC-to-SOM conversion factor, κvb (kg kg−1), which translates SOC into SOM as follow:
However, this conversion remains problematic due to the uncertainty surrounding the appropriate value of κvb. Pribyl (2010) demonstrated that κvb can vary substantially, from 1.35 kg kg−1 to as high as 7.5 kg kg−1, depending on the composition of organic matter, although a median value of 2 kg kg−1 is recommended.
To address the limitations of using a fixed κvb, we adopt the approach developed by Ruehlmann (2020). This method introduces a mechanistic framework that accounts for the compositional variability of organic matter as a function of SOC content. Rather than applying a single, static conversion factor, the H-model proposed by Ruehlmann (2020) differentiates between two conceptual fractions of SOM: a low-density component (), associated with fresh organic inputs or microbial biomass, and a high-density component (), representing more decomposed and stabilized material. The relative contribution of these two fractions varies with SOC, following a logarithmic mixing model. Each fraction is assigned a specific SOC-to-SOM conversion factor: 2.37 kg kg−1 for and 1.89 kg kg−1 for , reflecting their differing carbon concentrations. The overall conversion factor κvb is then calculated as a weighted harmonic mean of the two fractions, making it dynamic and SOC-dependent:
This H-model was calibrated using a comprehensive dataset from locations worldwide, covering the full range of observed soil organic matter contents, diverse soil textures, and parent materials. As illustrated in Fig. 1a, the conversion factor κvb derived from the H-model approaches a value of 2 kg kg−1 for SOC contents around 10 %, and gradually decreases at higher SOC levels, reaching 1.89 kg kg−1 at a SOC content of 50 %. At lower SOC contents, however, κvb increases sharply, reaching 2.37 kg kg−1 for SOC ≤ 0.1 %.
Substituting Eq. (27) into Eq. (26) yields an analytical function to directly estimate SOM content from SOC. Fitting this function for the range results in the following formulation, which we used to convert SOC into SOM:
This empirical expression (Fig. 1a) provides an accurate and practical alternative to the piecewise formulation of the H-model. It effectively captures the nonlinear relationship between SOC and SOM across the full range of typical SOC values in mineral soils and peats, under the assumption that the H-model remains valid. The function is particularly well suited for large-scale modeling applications, where computational efficiency and continuity are preferred over the use of more complex, condition-based formulations.
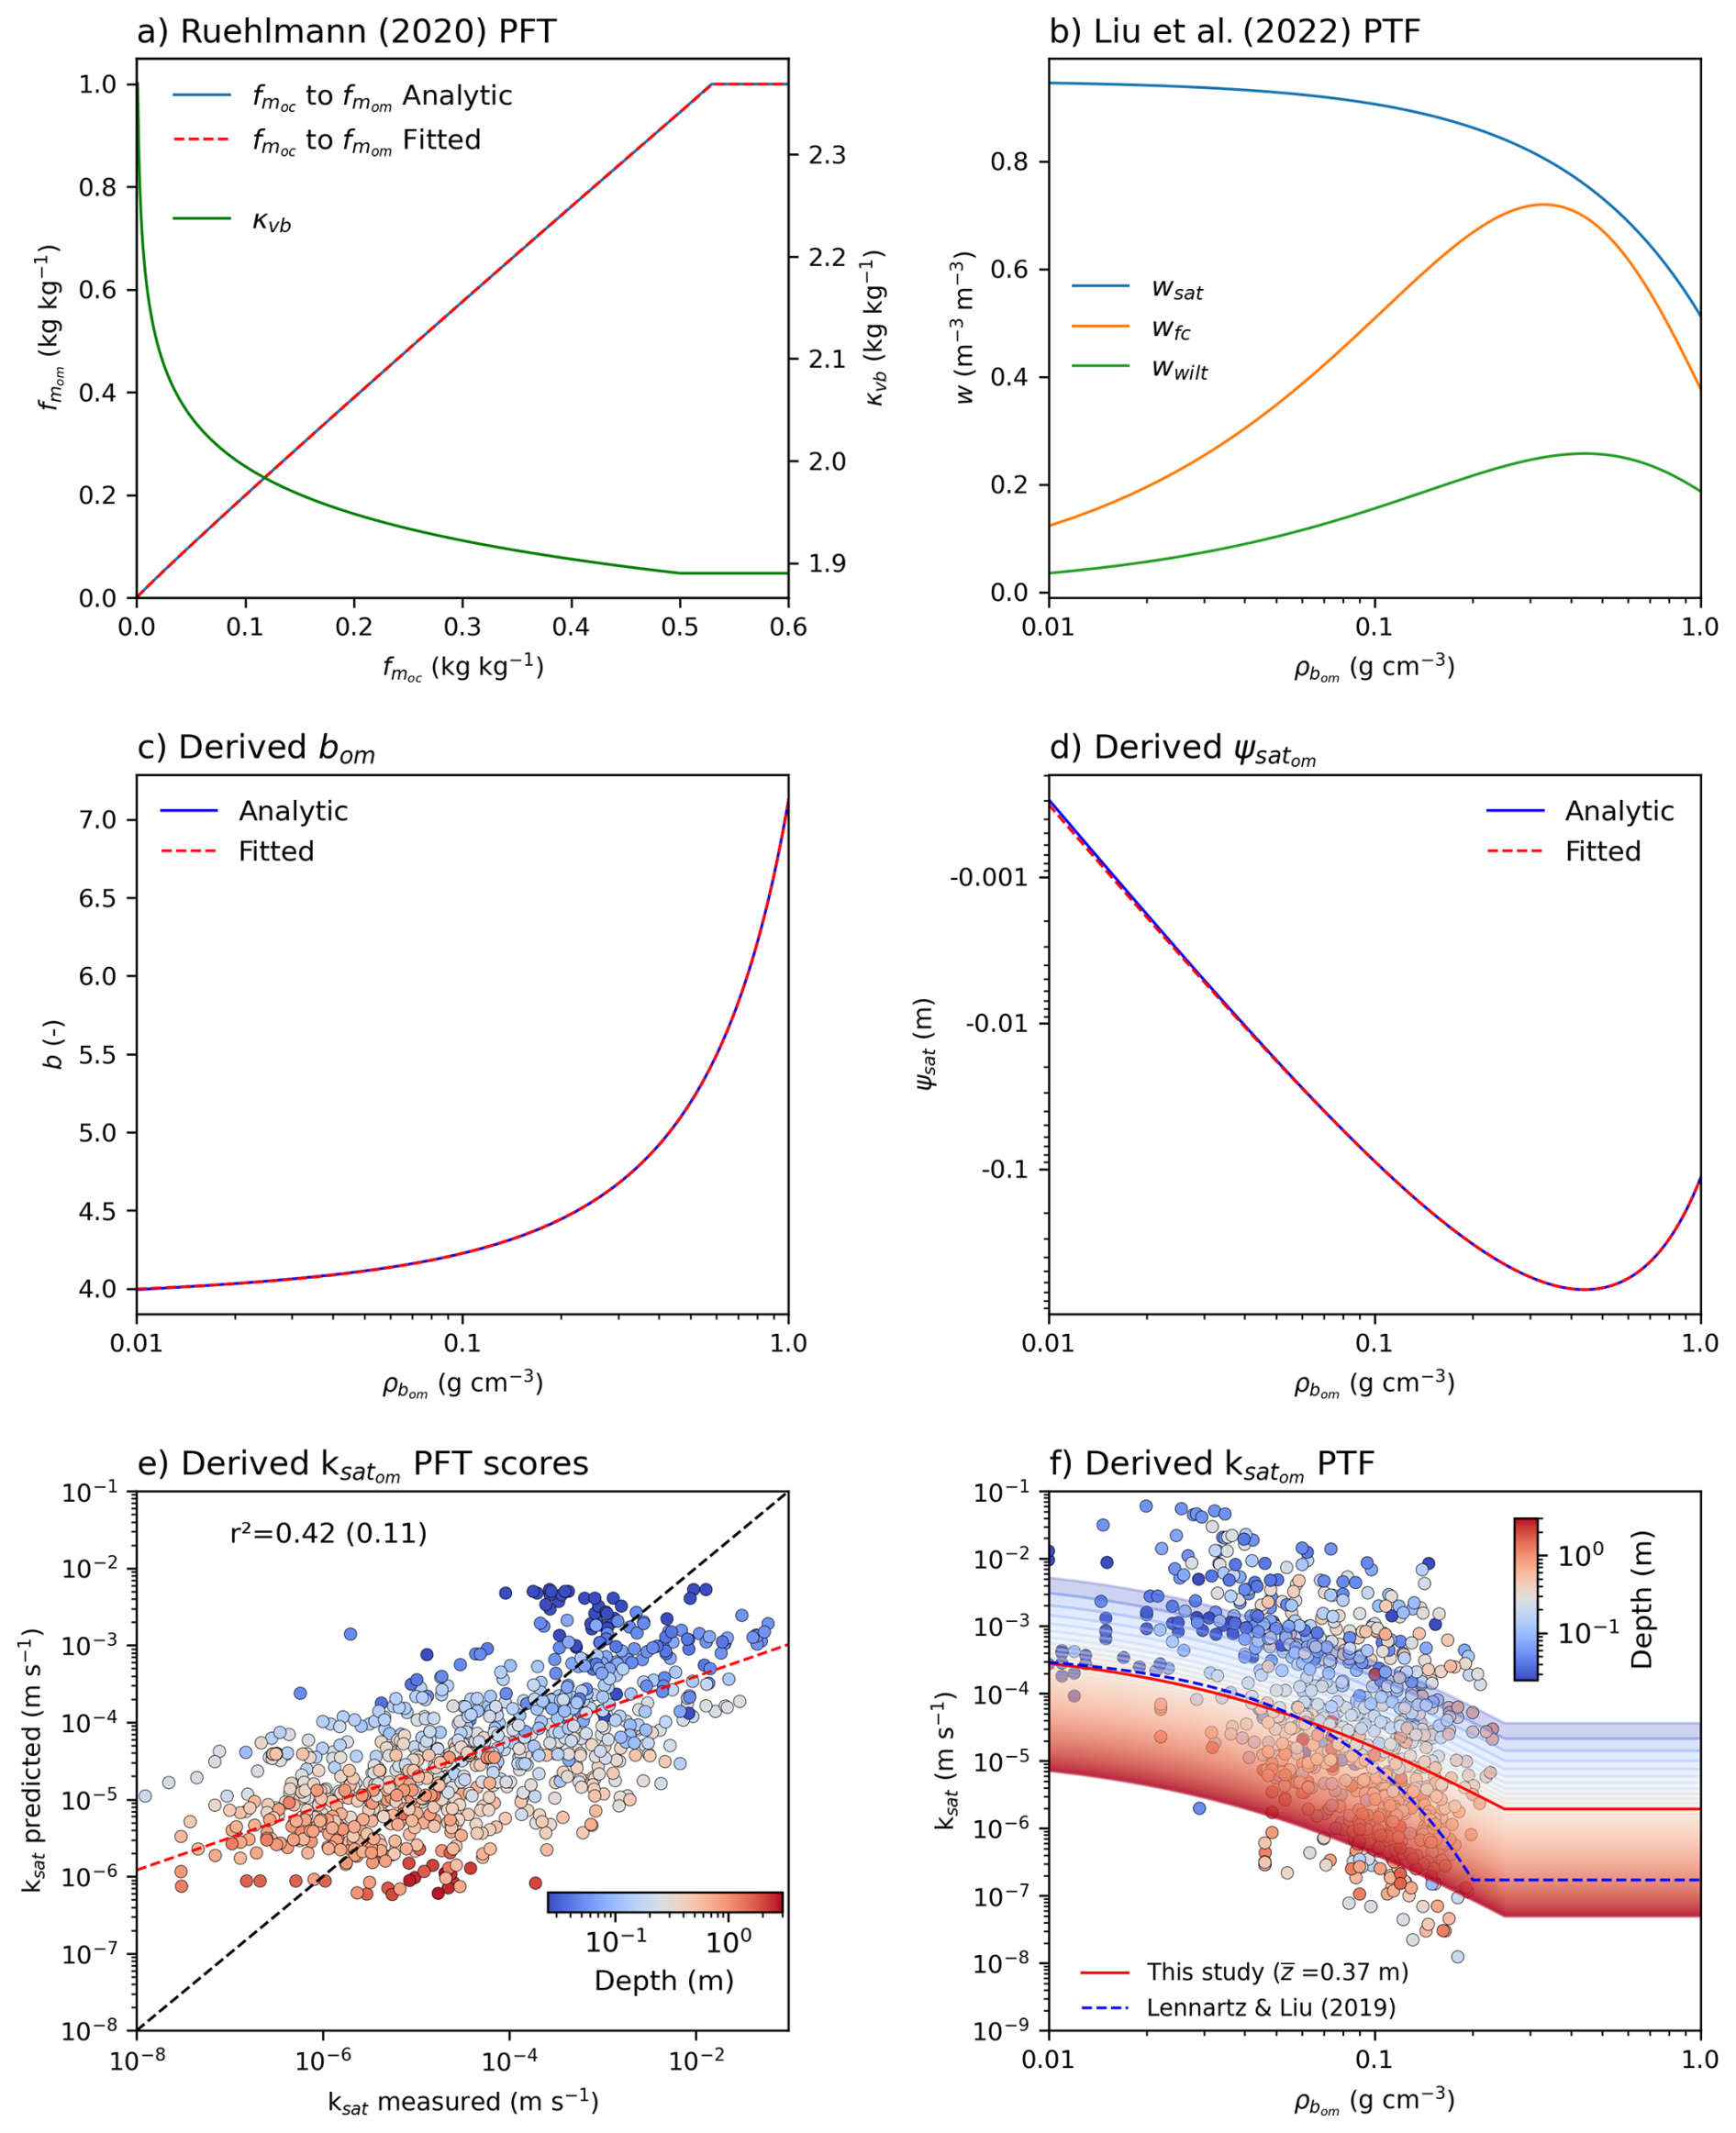
Figure 1Derived hydrodynamic properties for SOM domain as a function of its apparent bulk density () for the Brooks and Corey (1964) model. (a) Conversion function from organic carbon fraction () to organic matter fraction (), shown in both analytic (blue) and fitted (red dashed) forms, using the Van Bemmelen factor (κvb) as described by the PTF of Ruehlmann (2020). (b) Volumetric water contents at saturation (wsat), field capacity (wfc), and wilting point (wwilt) estimated with the PTFs of Liu et al. (2022). (c–d) Derived pore-size distribution index (bom) and air-entry potential () from analytical and fitted solutions. (e) Evaluation of the predicted saturated hydraulic conductivity () against observed data from Morris et al. (2022), with points colored by depth. The coefficient of determination (r2) is shown for the current model, with the value obtained using the PTF of Lennartz and Liu (2019) indicated in parentheses for comparison. Black and red dashed lines are the 1:1 line and the best fit, respectively. (f) Predicted as a function of and depth (shaded contours). The red line corresponds to the mean observed depth . Results are compared with the depth-independent PTF from Lennartz and Liu (2019). Observations are shown as points, colored by sampling depth.
2.2.6 SOM water-retention properties
To solve the Richards equation for soil water flow, the hydrodynamic properties of soils are often parameterized using the relationships of Campbell (1974), a simplified variant of Brooks and Corey (1964) model, which relate matric potential to soil water content as follow :
where w(ψ) (m3 m−3) is the volumetric water content at matric potential ψ (m), ψsat the air-entry pressure head, and b (–) the pore-size distribution index. This Eq. (29) is widely adopted in LSMs due to its simplicity and physical interpretability (e.g. Vereecken et al., 2019).
To account for the effect of SOM on soil water retention, these parameters (wsat, ψsat, b) are typically estimated by combining mineral soil and organic matter properties using arithmetic mixing (Eq. 4), as reported in Sect. 2.1.2. Equation (18) supports the validity of this assumption, at least in the case of wsat. While hydraulic parameters for mineral soils can be readily estimated using standard PTFs (Clapp and Hornberger, 1978; Cosby et al., 1984), those for highly organic soils (e.g., peat) remain poorly constrained, at least for the Brooks and Corey (1964) model. Aside from the meta-analysis by Letts et al. (2000), which proposed values for organic horizons based on a synthesis of field and laboratory observations, few efforts have been made to define these parameters specifically for SOM-rich soils. Given the high porosity, unique pore structure, and often hydrophobic nature of organic matter, extrapolating parameters from mineral soils is inherently challenging.
Recent research conducted at the University of Rostock has significantly advanced our understanding of the hydrodynamic properties of peat soils, helping to address a longstanding gap in the modeling of organic-rich soils (Liu and Lennartz, 2019; Lennartz and Liu, 2019; Liu et al., 2019, 2020, 2022). These studies demonstrated that the hydraulic parameters of peatlands can be reliably predicted from their bulk density, which is largely governed by the organic matter content. Building on this work, and assuming that the apparent bulk density of SOM, (as defined in Eq. 23), mainly dominates peat bulk density, we estimate the porosity of the organic matter domain, , using the PTF proposed by Liu and Lennartz (2019), which relates total porosity to dry bulk density in peats:
where , i.e. exprimed in g cm−3. According to this relationship (Fig. 1b), porosity remains above 0.9 m3 m−3 for bulk densities below 110 kg m−3, reflecting the highly porous structure of undecomposed peat. It declines to around 0.8 m3 m−3 at a bulk density of approximately 340 kg m−3, and reaches 0.51 m3 m−3 for a density of 1000 kg m−3, a value approaching those of mineral soils.
To determine the parameters and bom, we rely on the study by Liu et al. (2022), which investigates the variation of soil available water capacity (AWC) in peat soils. Soil AWC refers to the amount of water available to plants, defined as the difference between the volumetric water content at field capacity, (m3 m−3), and at the wilting point, (m3 m−3). This study relates AWC to peat dry bulk density through the following pedotransfer functions (PTFs), providing a practical basis for parameterizing the hydraulic properties of the organic matter domain:
These relationships are illustrated in Fig. 1b. By definition, corresponds to the volumetric water content at a matric potential of kPa, and to the content at kPa. Combined with the Brooks and Corey (1964) model (Eq. 29), this leads to the following system of equations with two unknowns, and bom:
Taking the logarithm of both equations and eliminating , the system can be solved analytically, yielding simple explicit expressions for bom and :
where and m, while the remaining parameters are derived from using Eqs. (30) and (31). For more simplicity, these analytical form can be fitted according to as follow:
The resulting analytical and fitted bom and values are presented in Fig. 1c and d, respectively.
2.2.7 SOM hydraulic conductivity
In addition to the water retention relationship (Eq. 29), solving Richards’ equation requires an accurate description of soil hydraulic conductivity. Campbell (1974), building on the Brooks and Corey (1964) model, proposed the following relationship linking the soil matric potential to the hydraulic conductivity:
where k(ψ) (m s−1) is the unsaturated hydraulic conductivity, and ksat (m s−1) the saturated hydraulic conductivity. This formulation, like the water retention curve, is widely used in LSMs due to its simplicity and physical basis. The key unknown is thus ksat, which must be estimated by combining mineral soil () and organic matter () saturated hydraulic conductivities. Some LSMs use arithmetic mixing (Eq. 4), as proposed by Lawrence and Slater (2008), while others prefer geometric mixing (Eq. 5), as introduced by Decharme et al. (2016). The latter approach is supported by earlier studies suggesting that the effective combination of saturated hydraulic conductivities is generally better captured using nonlinear mixing formulations (Prudic, 1991; Stepanyants and Teodorovich, 2003).
While for mineral soils can be readily estimated using standard PTFs (Clapp and Hornberger, 1978; Cosby et al., 1984), these functions are not applicable to organic soils due to their poorly defined grain-size distribution and high organic matter content (Morris et al., 2022). To address this limitation, Lennartz and Liu (2019) proposed a peat-specific PTF, derived from a reanalysis of the large secondary database compiled by Liu and Lennartz (2019), using dry bulk density as the primary predictor (Sect. S2). This PTF captures the steep decline in with increasing dry bulk density from 0.01 to 0.2 g cm−3 (Fig. 1f), reflecting the substantial reduction in macroporosity associated with peat degradation. Beyond 0.2 g cm−3, tends to level off, although the data from Liu and Lennartz (2019) exhibit considerable variability across the 0.2–1.0 g cm−3 range, which remains difficult to explain.
Building on a large meta-analysis of northern peat samples, Morris et al. (2022) developed log-linear models to predict based on variables such as depth, dry bulk density, von Post humification score, and categorical descriptors including surface microform and peatland trophic type. Their results showed that incorporating multiple predictors, especially dry bulk density, von Post score, and to a lesser extent depth, significantly improves predictions. However, von Post score and fine-scale descriptors such as microform type or trophic classification are not available at the global scale and are therefore unsuitable for application in LSMs. Following the approach suggested by Morris et al. (2022), we selected dry bulk density and soil depth as the only feasible predictors of for large-scale modeling. To this end, we used their dataset and retained the 883 samples that included both dry bulk density and depth information.
This dataset also reveals that, in addition to the decrease in with increasing bulk density, tends to decline with depth in organic soils (Figure S1b in the Supplement). To model this behavior through a PTF, we developed a formulation relating to both bulk organic matter density () and depth (z in m). This was achieved through a multi-step approach combining data filtering, non-linear regression, and performance evaluation. First, we retained 98 % of the dataset by filtering out outliers based on a two-dimensional kernel density estimate in the space. The threshold was set to the 2nd percentile of the estimated density values, ensuring that only the densest regions of the data cloud were preserved (Fig. S1a). From the filtered dataset, 80 % of the observations (approximately 706 data points) were randomly selected for model training, and the remaining 20 % (about 177 points) were reserved for validation. We proposed a semi-empirical model designed to reflect the asymptotic saturation behavior observed at higher densities and deeper horizons. The functional form that was selected is quasi similar to that of Morris et al. (2022):
where and z (m) is the depth at the center of each soil horizon, and (g cm−3) is the capped bulk density of the organic matter domain. These constraints reflect the upper bounds of the observational dataset, which includes maximum values of approximately 2.92 m for depth and 0.25 g cm−3 for bulk density. To avoid extrapolation beyond the empirical range, both variables are accordingly limited in the proposed framework. On the training dataset, this model yielded a coefficient of determination r2=0.41, and on the validation set, R2=0.46 (Fig. S1c). When applied to the entire filtered dataset (98 % of the total), the model explained 42 % of the variance in observations, i.e. r2=0.42 (Fig. 1e).
These results indicate that, although the model explains a moderate share of the variance in ksat, its performance remains comparable to, or even exceeds, that of existing PTFs applied to similar datasets. For example, the original formulation by Lennartz and Liu (2019) yields a much lower r2 of 0.11 when applied to the same data subset (Fig. 1e). Similarly, Liu and Lennartz (2019) report values up to r2=0.4 using alternative models and datasets. Even the most comprehensive model from Morris et al. (2022), which incorporates additional predictors such as the Kerner Oceanity Index and the distinction between treed and open peatlands, achieves a maximum r2 of 0.48. Reaching higher predictive power, such as the r2=0.76 reported for their full model, requires a much larger set of variables, including in addition von Post humification score, and multiple categorical indicators representing peatland trophic status as well as local climatic conditions. However, these predictors are not available for global LSMs, which limits the applicability of such complex models at large scales.
Figure 1f illustrates the behavior of the derived PTF for as a function of and depth z, based on the log-linear formulation in Eq. (36). Colored curves represent model predictions across a range of depths (0.025 to 3 m), with shading indicating increasing depth. The red solid line corresponds to the mean depth of the dataset ( m), while the dashed blue line shows the depth-independent predictions from Lennartz and Liu (2019). Observed values from the Morris et al. (2022) dataset (filtered 98 % subset, n=866) are overlaid, colored by sample depth. The figure illustrates the main structural differences between the two models. Both predict a strong decrease in at low bulk densities, and flattens beyond 0.2 or 0.25 g cm−3. The inclusion of depth dependence in the proposed PTF aims however to better reflect the vertical variation observed in the dataset (Fig. S1d). This added flexibility results in a better fit to the data (r2=0.42 for this study compared to only r2=0.11 for the Lennartz PTF on the same dataset). Although the observational scatter remains substantial, the proposed function reproduces the general trend in the data and accounts for the combined influence of bulk density and depth on .
2.2.8 SOM thermal properties
Although the impact of soil organic matter on thermal processes is not the primary focus of this study, we briefly review a physically consistent approach to represent it within LSMs, as it complements the broader treatment of SOM hydrodynamics presented here. In LSMs, soil heat transport is typically described by the one-dimensional heat diffusion equation, derived from Fourier’s law:
where Csoil is the volumetric heat capacity of the soil (J m−3 K−1), λsoil the soil thermal conductivity (W m−1 K−1), T the soil temperature (K), t the time (s), and z the soil depth (m).
In many LSMs, the thermal conductivity λsoil is computed using a combination of dry and saturated soil conductivities, weighted by the Kersten number, which reflects the degree of saturation of each soil layer (Johansen, 1977; Farouki, 1981; Peters-Lidard et al., 1998). Within this framework, the saturated thermal conductivity is calculated as a volumetric-weighted geometric mean of the thermal conductivities of the solid phase, liquid water, and ice. Lawrence and Slater (2008) or Decharme et al. (2016) proposed that the dry conductivity (λdry) and the solid-phase conductivity (λs) be calculated using arithmetic or geometric mixing, respectively, based on the volumetric fractions of the organic and mineral components. The corresponding conductivity values for the organic domain can be taken from Table S1, while mineral values can be taken from Peters-Lidard et al. (1998) as mentioned in Sect. 2.1.2. In the present study, we focus exclusively on λdry and show that the geo-harmonic mean also provides a suitable alternative, while the computation of λs is addressed in the companion paper to this work.
The total volumetric heat capacity of soil, Csoil, can be derived from its fundamental physical definition, expressed as the heat capacity per unit volume of bulk soil:
where vb is the total soil volume, and mk (kg) and ck (J kg−1 K−1) denote the mass and specific heat capacity of each soil constituent k, including the solid matrix, liquid water, ice, and air. Assuming that air has negligible heat capacity compared to other phases, its contribution can be ignored. Grounding into the soil mixture theory and substituting the contributions of each relevant phase (organic matter, mineral matter, liquid water, and ice) into Eq. (38), the total volumetric heat capacity becomes:
where mom and mms (kg) are the masses of organic and mineral solids, mw and mi (kg) the masses of liquid water and ice, com, cms, cw, and ci (J kg−1 K−1) their respective specific heat capacities. Each term in the summation of Eq. (39) can be decomposed as the product of a mass concentration (mass per unit volume of the constituent’s domain) and the corresponding volume fraction within the bulk soil. This leads to the following equivalent formulation:
where vk (m3) denotes the volume of each soil constituent, with liquid water and ice occupying the pore space, and organic matter and mineral substrate forming the soil solid. For liquid water and ice, the ratios and are simply their specific densities, ρw and ρi (kg m−3), and the ratios and correspond to their volumetric contents, ww and wi (m3 m−3), respectively. For the solid constituents, vom and vms correspond to the volumes of organic matter and mineral substrate within the soil solid, i.e. and . Consequently, in Eq. (40), and are simply their solid densities, and , as defined by Eq. (13b). The computation of the ratios and is less trivial, but they can be expressed as the product of their respective solid-phase volumetric fractions, and (infered via Eq. 12b), and the fraction of solids in the bulk soil, (infered via Eq. 10). Substituting these relationships into Eq. (40) leads to the following formulation for the total volumetric heat capacity Csoil expressed as an arithmetic mean of the product of density and specific heat capacity of each soil constituent:
Here, (J m−3 K−1) is the volumetric heat capacity of the dry solid matrix, while Cw and Ci represent the contributions of the liquid water and ice phases, respectively. As with porosity, Eq. (41) supports the use of an arithmetic mixing formulation, as adopted by Lawrence and Slater (2008) and most LSMs, to compute the volumetric heat capacity of the dry soil matrix.
In Eq. (41), the appropriate quantity to use is the volumetric fraction of SOM within the soil solid phase (), consistent with previous findings (Balland and Arp, 2005; Cuynet et al., 2025), rather than the volumetric fraction of SOM in the bulk soil () as commonly assumed in earlier LSM parameterizations. Consistently with Eq. (22), (m3 m−3) is defined as the ratio between the SOM density in the soil solid, expressed as the SOM mass fraction () relative to the soil particle density (ρs), and the SOM particle density ():
can be related to its bulk density and porosity via Eq. (19):
As ρs is related to ρb through the soil porosity (wsat), replacing ρs and using Eqs. (11) and (43) in Eq. (42) leads to the following relationship between and :
This relationship shows that can be readily obtained from . Furthermore, substituting Eqs. (42) and (44) into Eq. (41) and applying the complement of Eq. (18) with respect to unity (i.e. , the volumetric heat capacity of the dry soil matrix can be expressed directly in terms of the bulk densities and volumetric fractions of the organic and mineral domains:
Equation (45) may, in some cases, be more straightforward to apply than Eq. (41), provided that the bulk densities of each constituent are known.
A more usual form of currently used in LSMs can be derived from Eq. (41) using solid heat capacities for each soil component :
where and (J m−3 K−1) are the soil solid heat capacity for organic matter and mineral substance, which can be specified as in Lawrence and Slater (2008) from a lookup table (see Table S1) or as in the proposed framework from their specific heat capacities and particle densities. Following Peters-Lidard et al. (1998), and based on the average values reported in Farouki (1981), we adopt cms=733 J kg−1 K−1 for mineral matter and com=1972 J kg−1 K−1 for organic matter. The particle density of mineral solids () can be estimated using the PTF from Ruehlmann (2020) (Eq. 25). For organic matter, the particle density can be computed using Eq. (43). Finally, the total soil porosity, wsat, can be computed via arithmetic mixing using the PTF from Liu and Lennartz (2019) for the organic matter domain (Eq. 30), and, for instance, the PTF from Cosby et al. (1984) for the mineral soil. This approach ensures physical consistency between the volumetric heat capacity of the dry soil matrix, total soil porosity, and the particle densities of each solid soil component.
Table 1Summary of the proposed framework, including the steps to derive the “true” soil organic volumetric fraction, the PTFs used to compute SOM hydraulic properties for the Brooks and Corey (1964) model, and the mixing rules applied to combine organic and mineral contributions into bulk soil properties. The framework relies on a limited set of input data commonly available in all current regional and global soil databases: the soil organic carbon mass fraction (), the dry bulk density of the fine earth, and the mass fractions of clay (), sand (), and silt (). In this study, the hydraulic properties of the mineral domain (, bms, , ) are taken from the texture-based pedotransfer functions of Cosby et al. (1984). The dry thermal conductivity of the mineral domain can be estimated using the approach proposed by Peters-Lidard et al. (1998).
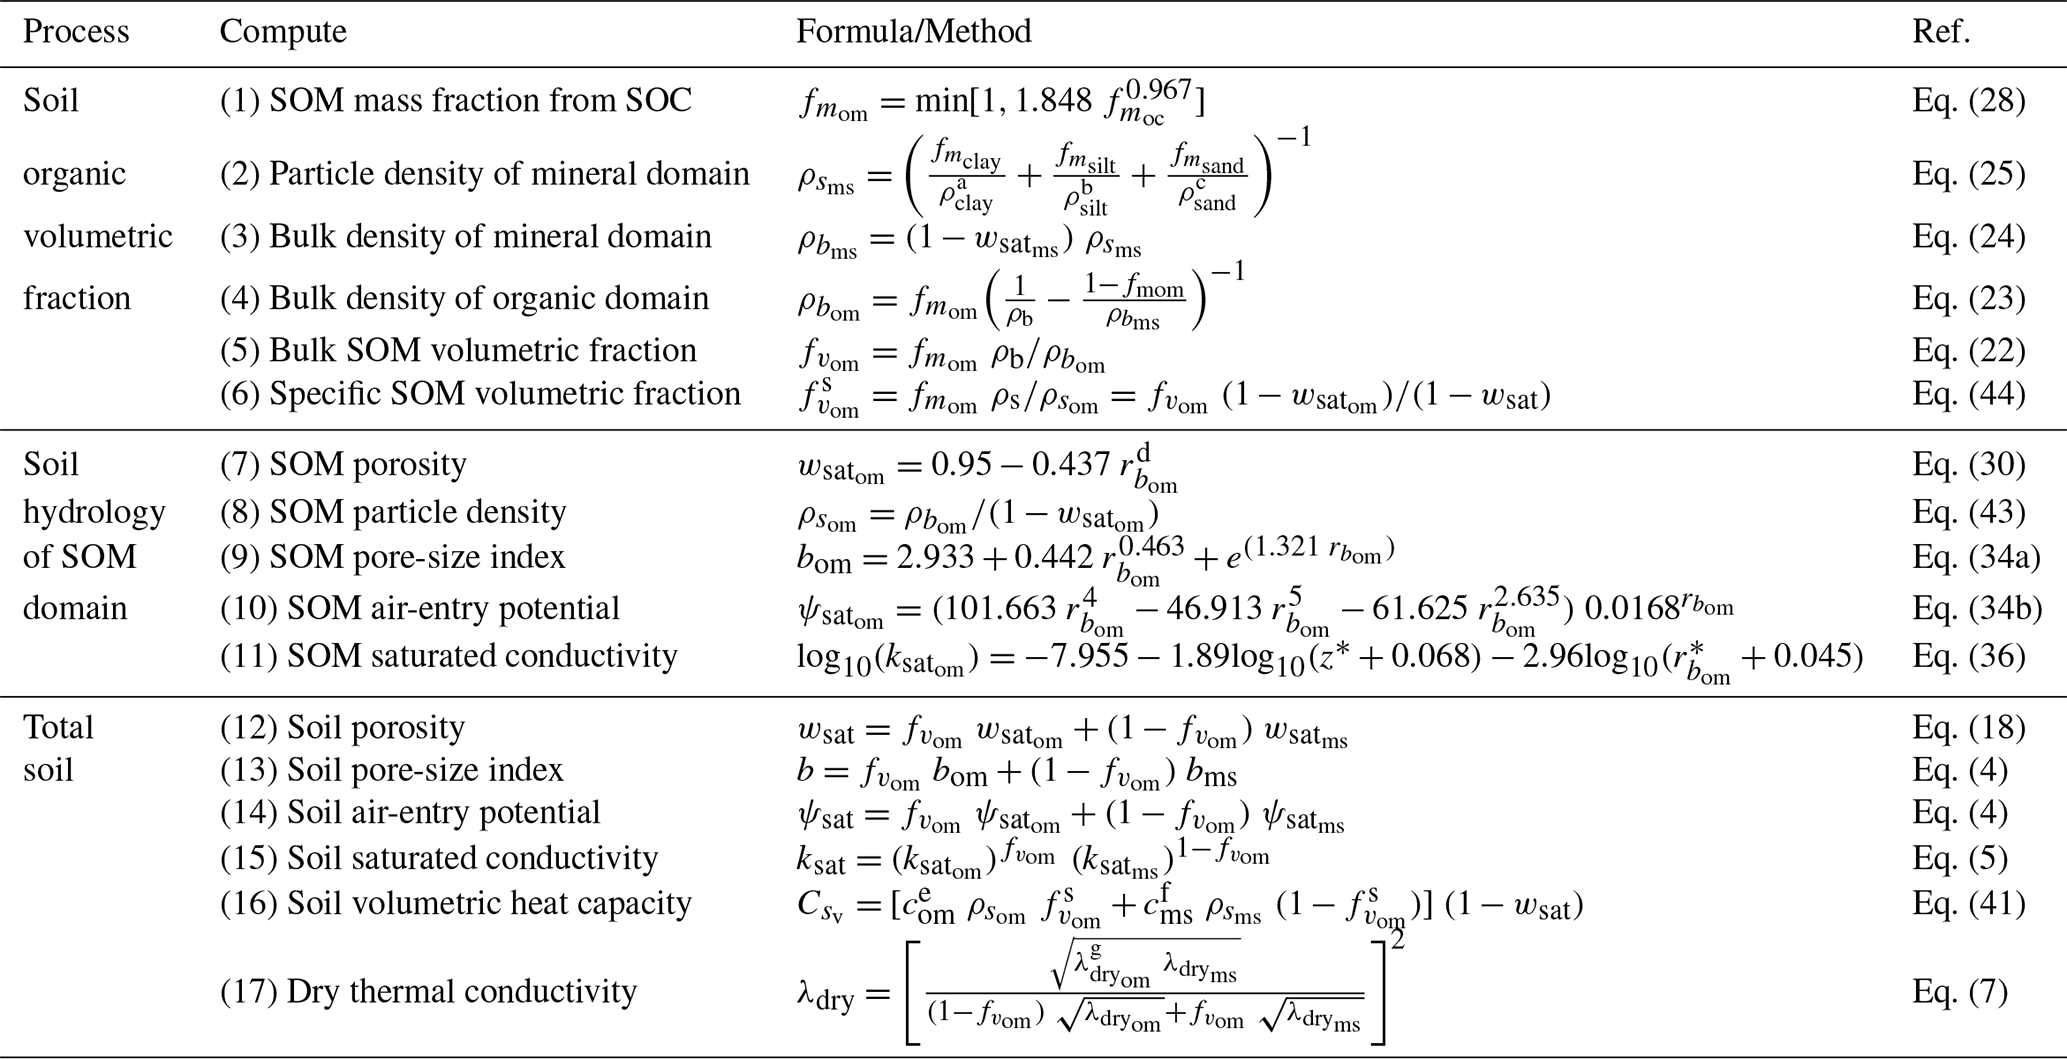
a ρclay=2761 kg m−3, b ρsand=2656 kg m−3, c ρsilt=2692 kg m−3, d , e com=1972 J kg−1 K−1, f cms=733 J kg−1 K−1, g W m−1 K−1
3.1 Experimental datasets of soil binary mixtures
Before validating the full proposed framework summarized in Table 1, we first aim to evaluate the applicability of soil mixture theory to soils composed of both organic and mineral materials. To this end, we used three experimental datasets based on binary soil mixtures, each consisting of one organic and one mineral component. These controlled mixtures include direct measurements of soil porosity (Walczak et al., 2002; Willaredt and Nehls, 2021) or dry thermal diffusivity (Arkhangelskaya and Telyatnikova, 2023). These datasets serve two main purposes. First, to test the “true” formulation of the soil organic volumetric fraction, computed solely from soil organic mass content and bulk density (Eq. 22). Second, to evaluate the performance of arithmetic mixing for estimating soil porosity, and nonlinear mixing for estimating dry thermal conductivity. All three datasets were available in raw numerical form, making them easy to use.
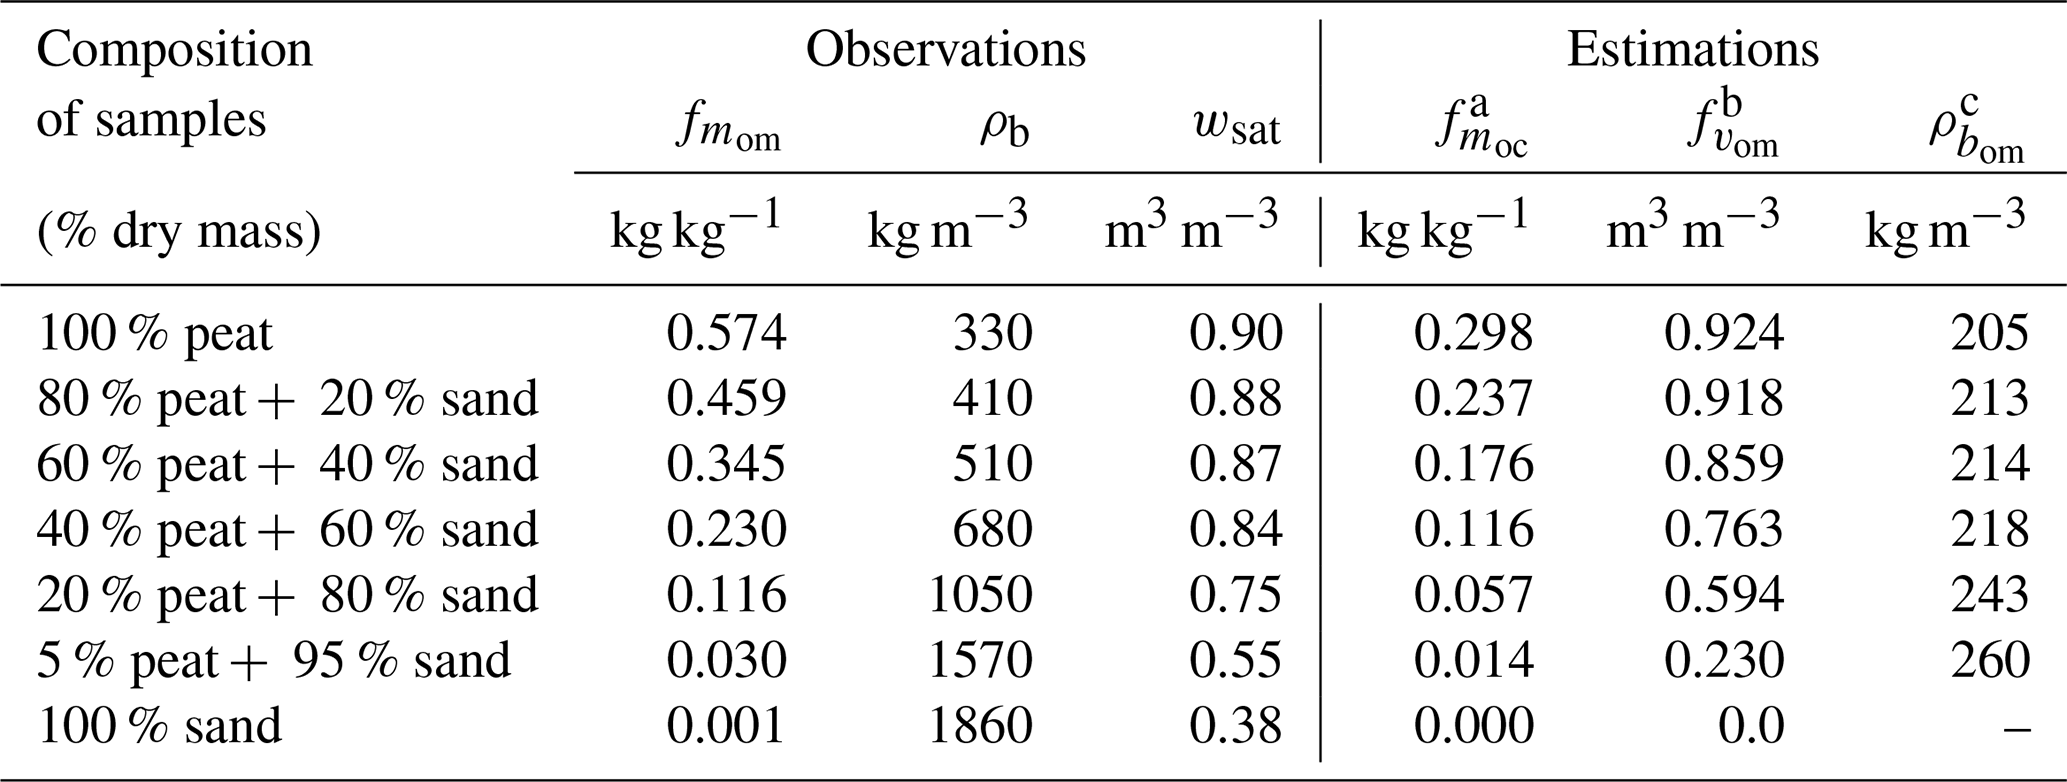
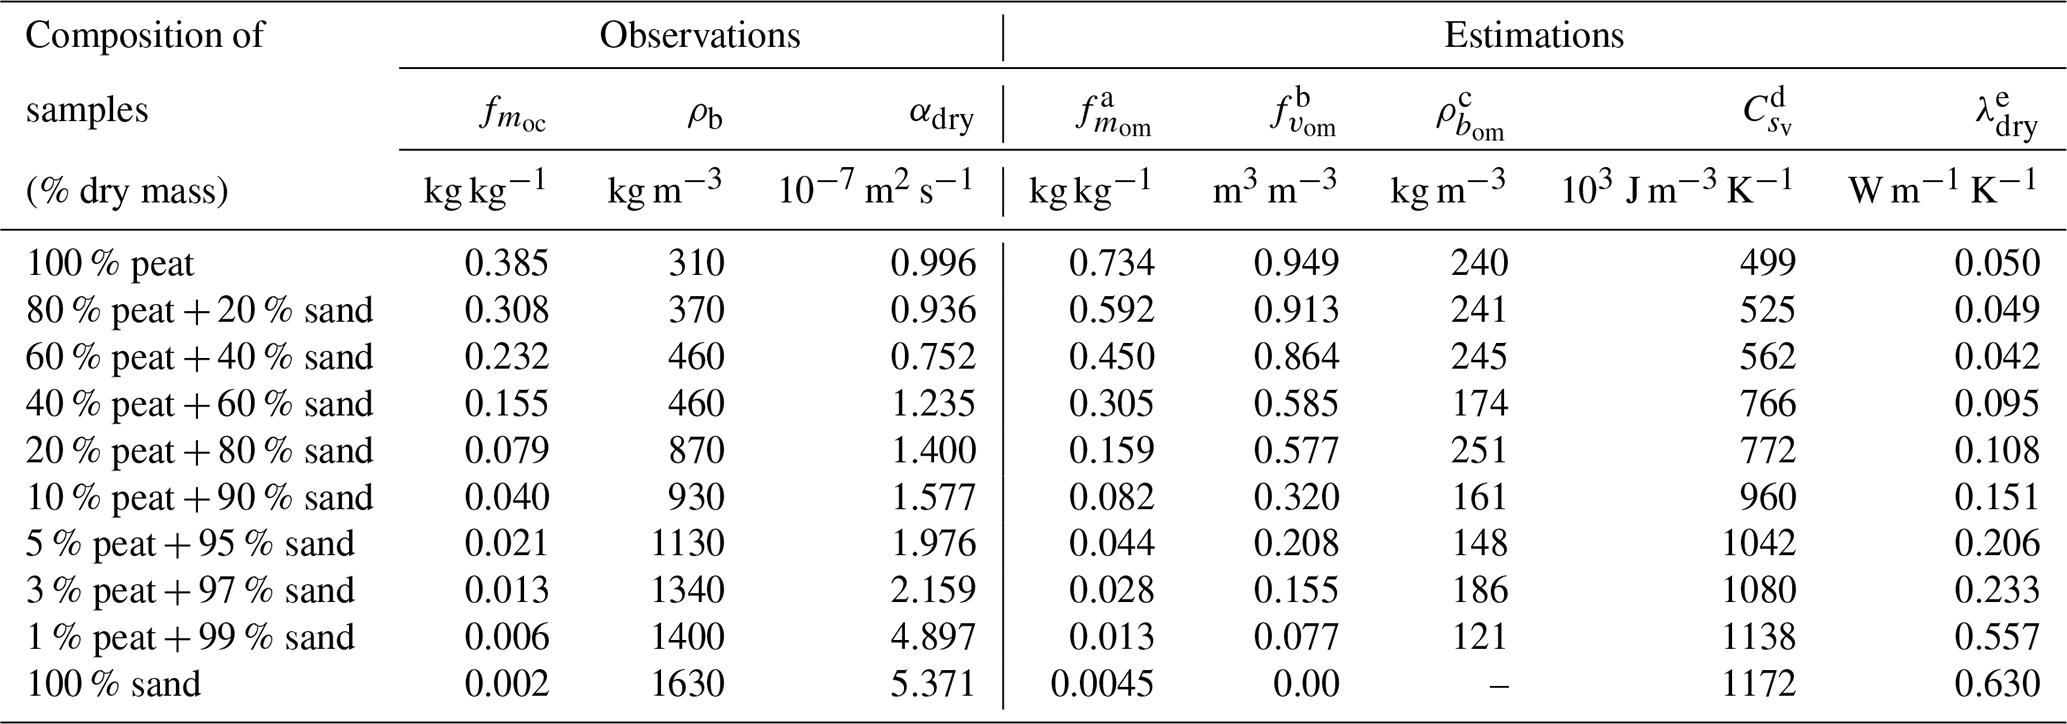
The dataset from Walczak et al. (2002) consists of seven laboratory-prepared binary mixtures of peat and quartz sand, designed to represent a gradient of organic matter content from 5 % to 57.4 % by dry weight. The peat used originated from a sedge peat soil of moderate decomposition, while the mineral component consisted of a clean quartz sand with negligible organic content (0.1 %). The samples were prepared by hand mixing fixed proportions of dry peat and sand. The reported dry bulk densities of the peat and sand are 330 and 1860 kg m−3, respectively, values that are relatively high for these materials. In the case of the peat, this elevated density likely results from its moderate degree of decomposition (35 %–40 %) and its high ash content (42.6 %), both of which indicate a more compact and mineral-rich organic material than typical fibric peat. For the sand, the high bulk density can be attributed to the use of a medium-grained quartz sand with low porosity and the absence of organic content. For each mixture, key physical properties were measured, including dry bulk density and total porosity (Table 2). This dataset is particularly interesting for evaluating both the volumetric fraction formulation of organic matter and the performance of mixing model used to estimate bulk properties such as porosity.
Table 2Observed and estimated properties of peat-sand binary mixtures from Walczak et al. (2002). Observations include the organic matter mass fraction (), dry bulk density (ρb), and total porosity (wsat). Estimations include the organic carbon mass fraction (), the organic volume fraction (), and the bulk density of the organic phase (), computed using the referenced equations with fixed end-member densities for the pure organic and mineral components.
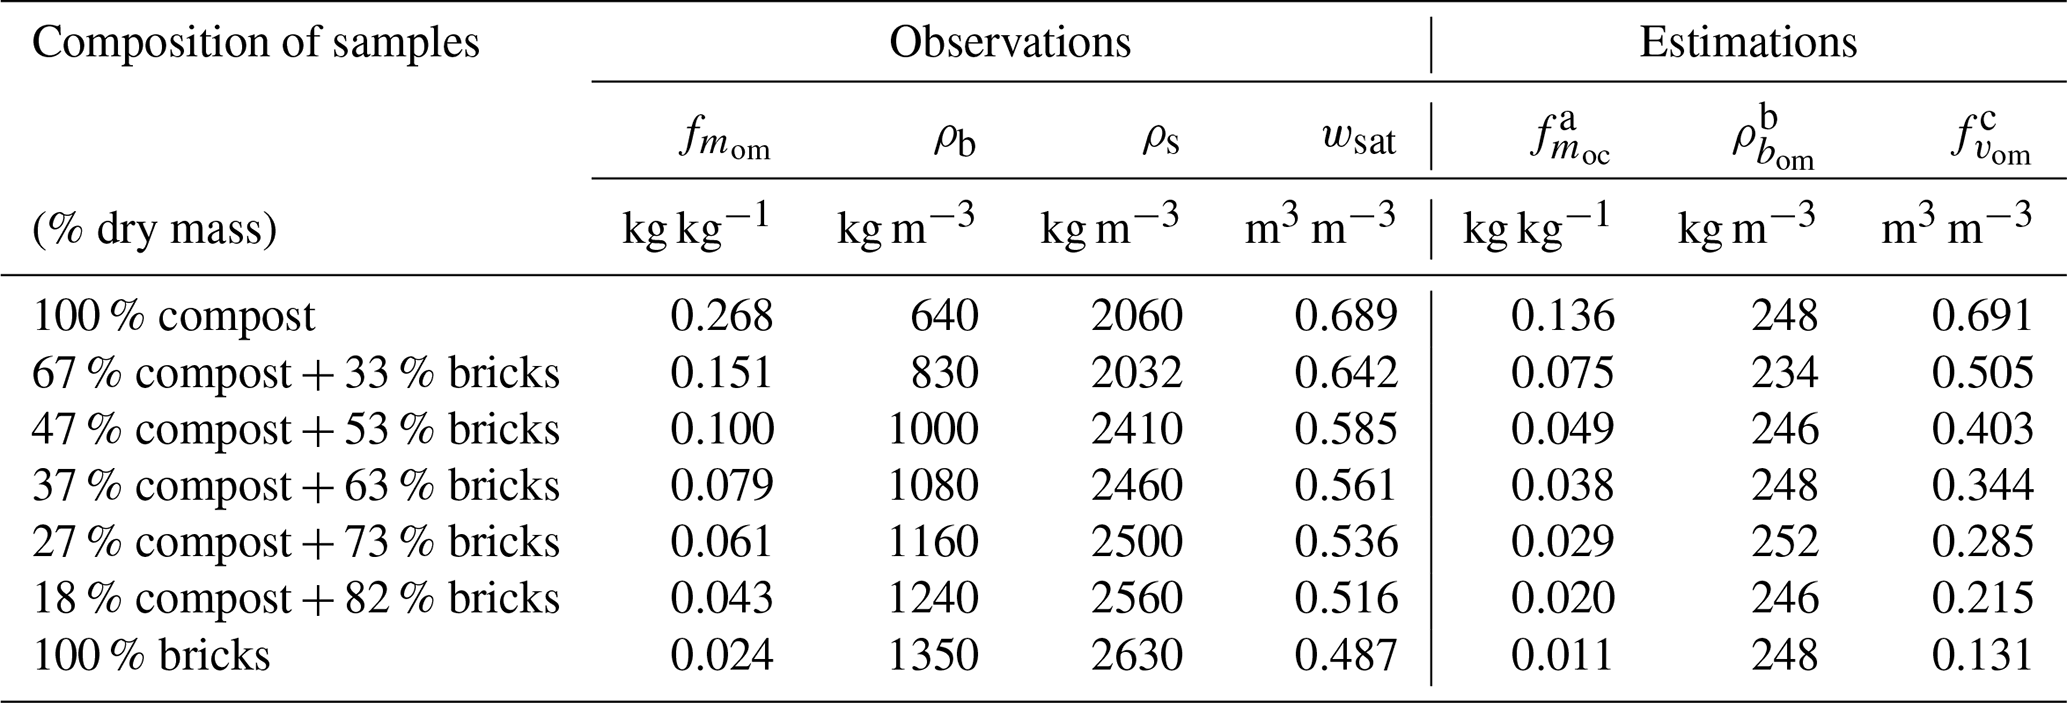
The dataset from Willaredt and Nehls (2021) consists of laboratory-prepared binary mixtures of compost and crushed brick, representative of Technosols used in urban green infrastructure such as green roofs or roadside plantings. Compost serves as the organic component and crushed brick as the mineral one, reflecting typical materials used in engineered soils for urban applications. The crushed brick material was classified as a loamy sand, but with a non-negligible organic matter content (2.4 %). For each mixture, both the dry bulk density and the particle density were reported, allowing total soil porosity to be derived. Organic matter content was estimated by loss on ignition (LOI), and values are summarized in Table 3. Compared to the peat-sand mixtures of Walczak et al. (2002), which represent highly organic substances, the compost-brick mixtures from Willaredt and Nehls (2021) span a lower range of organic matter contents (from 2 % to 27 %) and result in bulk densities ranging from 640 to 1350 kg m−3. This dataset therefore provides a complementary case study for assessing the formulation of organic volumetric fractions and the applicability of arithmetic mixing for porosity in more mineral-dominated substances.
Table 3Observed and estimated properties of compost-brick binary mixtures from Willaredt and Nehls (2021). Observations include the organic matter mass fraction (), dry bulk density (ρb), and particle density (ρs), total porosity (wsat). Estimations include organic carbon mass fraction (), organic bulk density (), and the organic volume fraction (), calculated using the equations referenced below.
Finally, the dataset from Arkhangelskaya and Telyatnikova (2023) was developed to investigate how thermal diffusivity varies with moisture content across a wide range of organic matter contents in peat-sand mixtures. The study used laboratory-prepared combinations of lowland peat and sieved quarry sand, both previously employed in the construction of Technosols. Eight mixtures were prepared with peat mass fractions ranging from 1 % to 80 %. Particular attention was given to low peat contents (1%, 3 %, and 10 %) to capture the non-linear sensitivity of thermal properties at modest SOC levels. Each sample was packed into metal cylinders, and bulk density was determined gravimetrically. Thermal diffusivity was measured repeatedly under varying moisture conditions, from full saturation to air-dry, using an unsteady-state method and a thermostated water bath. This dataset complements those of Walczak et al. (2002) and Willaredt and Nehls (2021) by extending the analysis to soil thermal behavior with a broad spectrum of SOC contents, with particular resolution in the low-to-intermediate range typical of mineral-organic transitional soils. For our purposes, the key information provided by this dataset is the air-dry thermal diffusivity, αdry (m2 s−1), from which the air-dry thermal conductivity, λdry (W m−1 K−1), can be estimated using the relationship:
Assuming (J m−3 K−1) can be independently estimated from Eq. (45) and the mixture composition (Table 4), this formulation allows us to test whether an arithmetic, geometric or another mixing rule more accurately represents the dry thermal conductivity of mineral-organic soils. The dataset thus provides a valuable benchmark for evaluating mixing models under dry conditions. Note that the air-dry thermal diffusivity values reported in Table (4) are extracted from their graphs using the open-access WebPlotDigitizer software (Rohatgi, 2020).
Table 4Observed and estimated properties of the peat-sand binary mixtures from Arkhangelskaya and Telyatnikova (2023). The table includes measured organic carbon fractions (), dry bulk density (ρb), and air-dry thermal diffusivity (αdry), along with derived values: estimated organic matter mass and volume fractions (, ), bulk density of the organic phase (), volumetric heat capacity of the dry matrix (), and dry thermal conductivity (λdry). Estimations are based on referenced equations, using fixed assumptions for pure component densities.
3.2 Natural soils data Collection
After evaluating the internal consistency of the soil mixture theory using controlled binary mixture experiments, we turn to natural soil datasets based on in situ or laboratory measurements to assess the performance of the proposed framework under realistic conditions. To this end, we use four independent datasets spanning a wide range of soil textures, organic matter contents, and climatic contexts (Fig. 2): (1) Keller and Håkansson (2010), which provides soil observations across Nordic agricultural ; (2) Arkhangel'skaya (2009), based on field observations of thermal and structural properties in Russian soils; (3) Kristensen et al. (2019), which compiles harmonized European in situ measurements of bulk density, porosity, and organic carbon across multiple land uses and depths; and (4) Gupta et al. (2021), who assembled SoilKsatDB, a global database of saturated hydraulic conductivity with associated data on soil texture, bulk density, water retention, and organic carbon across diverse climates and land uses.
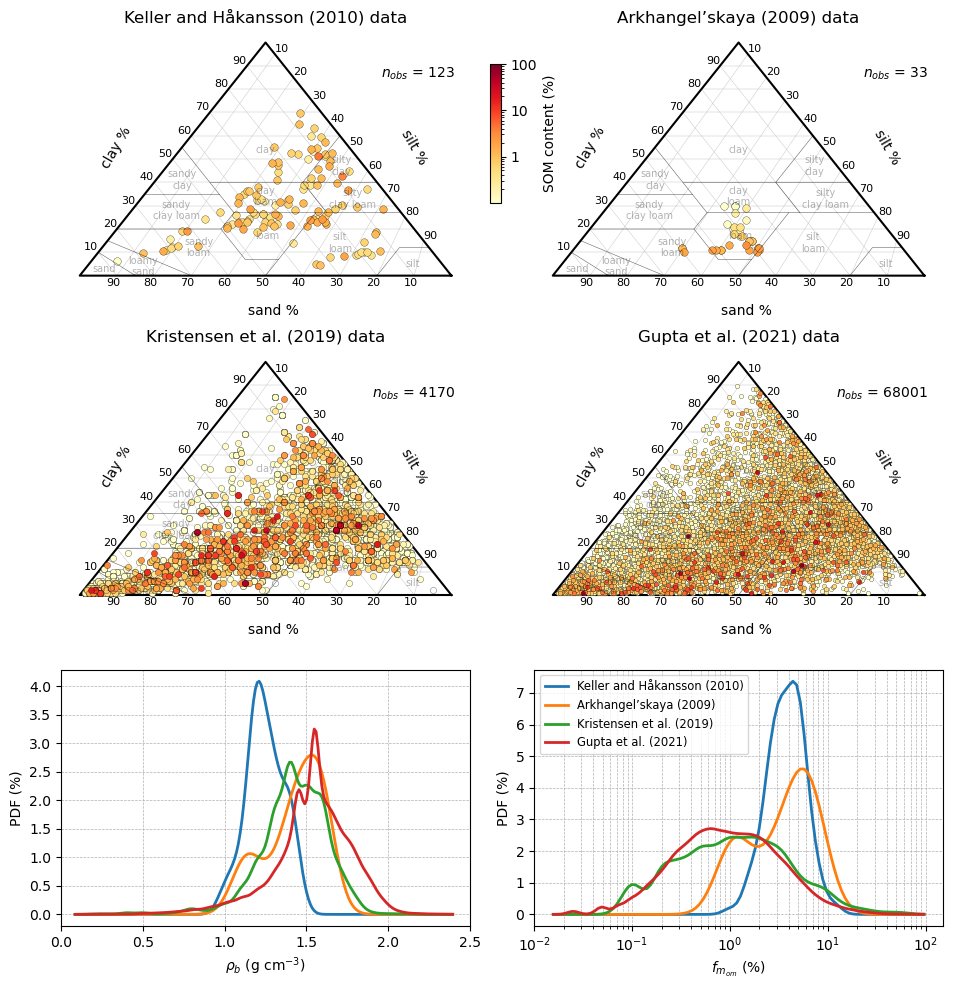
Figure 2Overview of the four in situ datasets used to evaluate the proposed framework. Ternary diagrams show the distribution of soil texture (clay, silt, sand) for the selected horizons in: (top left) Keller and Håkansson (2010), (top right) Arkhangel'skaya (2009), (bottom left) Kristensen et al. (2019), and (bottom right) Gupta et al. (2021). Points are colored by soil organic matter (SOM) content, and the number of observations retained in each dataset (nobs) is indicated. The bottom panels display the probability density functions (PDF in %) of bulk density (ρb) and SOM mass fraction () across the four datasets, highlighting their diversity in terms of organic matter content and soil density.
The dataset from Keller and Håkansson (2010) consists of in situ measurements of reference bulk density (ρref), particle density, particle-size distribution (clay, silt, and sand fractions), and SOM content for 171 experimental sites across Sweden, with additional data from Poland and Finland. For this study, we retained the subset of 123 samples for which complete measurements of texture, organic matter, particle density, and bulk density were available. Figure 2 (top left) shows that these samples span a relatively balanced range of textures, with a prevalence of loams, sandy loams, and silty loams, and SOM content ranging from less than 1 % to over 12%, as indicated by the color scale. The probability density functions (PDFs in bottom panels) show that this dataset has bulk densities primarily between 1.0 and 1.5 g cm−3, and SOM contents generally above 1 %, with a significant portion ranging from 2 % to 8 %. While textures are consistent with cultivated mineral soils (Fig. 2), the relatively low bulk densities and elevated SOM levels likely reflect the cold and humid climatic conditions prevailing in northern Europe, which limit organic matter mineralization and promote its accumulation even under agricultural use. Following the authors' recommendation, we computed bulk density as ρb=0.83 ρref and used it together with the measured particle density to estimate porosity via Eq. (10b). Indeed, ρref defined by Keller and Håkansson (2010) is not a conventional soil bulk density but the value obtained from uniaxial compression at 200 kPa. Following their recommendations (Eq. 17 in their manuscript), we consistently used the so-called normal bulk density (ρn=0.83 ρref), which corresponds to our definition of soil bulk density.
The dataset from Arkhangel'skaya (2009) consists of measurements from 33 soil horizons sampled in the Vladimir Opolie region of Russia. For each horizon, bulk density, particle density, SOC content, and detailed particle-size distributions were reported and are available in raw form. SOM mass fraction was derived from SOC using Eq. (28), and porosity was computed from measured bulk and particle densities using Eq. (10b). As shown in Fig. 2 (top right), the textural diversity in this dataset is more limited, with most points falling within the sandy loam to clay loam region. It thus complements the Keller dataset by covering a different part of the texture triangle. The SOM content ranges from 0.9 % to 9.5 %, and bulk density spans from 1.0 to 1.6 g cm−3. The PDFs (bottom panels) show a balanced spread, with bulk densities mostly below 1.5 g cm−3 and a substantial number of horizons exceeding 2 % SOM. This dataset thus provides a complementary set of structured mineral to moderately organic soils under cold-temperate continental conditions, bridging the gap between the more SOM-rich dataset from Keller and Håkansson (2010) and the following more mineral-dominated datasets used in this study.
Indeed, the third dataset is based on the harmonised European soil profile database compiled by Kristensen et al. (2019), commonly referred to as SPADE14. It includes over 4500 soil horizon records across Europe, linked to the Soil Geographical Database of Europe. For our analysis, we retained the 4170 horizons with complete records of depth, bulk density, soil texture, and SOM content. Figure 2 (bottom left) shows that this dataset spans a broad range of soil textures, from sand-dominated to fine-textured clay soils, with SOM content varying from near-zero to over 60 %. The PDFs (bottom panels) show that bulk density is broadly distributed, with roughly equal representation of low-density (<1.5 g cm−3) and high-density (>1.5 g cm−3) soils. In contrast, SOM content is predominantly below 2 %, although a notable number of horizons exceed this threshold, including a few highly organic profiles (up to 66 %). This dataset is therefore representative of mineral-dominated soils, while still encompassing a range of organic matter contents, particularly in northern Europe, making it well suited to test the general applicability of our framework across both low- and high-SOM conditions. From this dataset, we also used estimated volumetric water contents at four standard matric potentials (−1, −10, −100, and −1500 kPa), allowing assessment of our framework's predictions not only for porosity and SOM volumetric fraction but also for water retention behavior. These volumetric water contents were not measured directly but estimated using linear regression models based on bulk density, particle-size distribution, and organic matter content, calibrated on a subset of national observations.
Finally, the fourth dataset, compiled by Gupta et al. (2021), is derived from version 3 of the SoilKsatDB database (Gupta et al., 2020), and specifically from the “sol_hydro.pnts” file, which contains a global compilation of over 150 000 laboratory and field measurements of soil hydraulic properties collected from all continents. These data include saturated hydraulic conductivity as well as water retention values at standard matric potentials (−6, −10, −33, and −1500 kPa), along with a range of supporting soil physical properties. For this study, we retained the subset of approximately 68 000 samples for which bulk density, texture, and organic carbon content were available, making it highly suitable for evaluating the framework’s ability to predict both water retention parameters and Ksat under a wide range of environmental and methodological conditions. As shown in Fig. 2 (bottom right), the dataset spans the entire soil texture triangle, with substantial representation across all textural classes. The PDF of bulk density shows a pronounced peak around 1.6 g cm−3 and a consequent number of larger values, indicating that soils in this dataset are generally denser than in the other collections. The SOM content distribution is quasi similar in shape to that of the Kristensen dataset, although with slightly lower organic matter contents on average. This combination makes the dataset highly complementary to the others, particularly for assessing the generality of the proposed framework under mineral-dominated conditions worldwide, while still capturing a non-negligible gradient in organic matter content.
The evaluation of the proposed framework (Table 1) is structured in two main stages. First, we assess its internal consistency using experimental datasets of binary soil mixtures. Second, we test the framework’s predictive performance on in situ soil data from diverse field conditions, focusing in particular on porosity, water retention properties as described by the Brooks and Corey (1964) model, and saturated hydraulic conductivity. The proposed framework outputs are compared against the PTF of Cosby et al. (1984) for mineral soils, and the SOC-based parameterization of Lawrence and Slater (2008) representative of current LSM implementations. These comparisons are used to benchmark the added value of our process-based formulation across a wide range of soil textures and organic matter contents.
4.1 Evaluation Using Binary Mixture Datasets
The first stage of validation focuses on the three experimental binary mixture datasets previously described, composed of controlled combinations of organic and mineral materials (Walczak et al., 2002; Willaredt and Nehls, 2021; Arkhangelskaya and Telyatnikova, 2023). These mixtures emulate soils with varying SOM contents and allow us to assess several core components of our framework. Specifically, we use them to evaluate: (i) the theoretical formulation of the volumetric organic matter fraction (Eq. 22); (ii) the soil mixture theory introduced in Sect. 2.2.2, which leads to the arithmetic mixing of porosity as formalized in Eq. (18); and (iii) the performance of different mixing rules for estimating dry thermal conductivity.
Figure 3a (left) shows the estimation of the volumetric organic matter fraction as a function of the organic matter mass fraction using the binary mixture data from Walczak et al. (2002). The round markers represent the values of derived by applying Eq. (22) to each sample, using the observed bulk density and fixing the organic matter bulk density () to 205 kg m−3. This fixed value corresponds to the pure peat sample in the dataset (100 % peat), and is consistent with the bulk density computed from Eq. (23) assuming a mineral bulk density () of 1860 kg m−3 (given by the pure sand sample). This approach assumes that the bulk density of the organic material remains constant across the mixture series. In other words, it considers that the peat component used by Walczak et al. (2002) retains a consistent internal structure regardless of its proportion in the mix. We then compare these data-derived estimates with the predictions of from our framework (Eqs. 22 to 25) and from earlier parameterizations. Our theoretical relationship closely follows the derived values, supporting the internal consistency of the proposed formulation. In contrast, previous approaches (Lawrence and Slater, 2008; Chen et al., 2012) show larger discrepancies, especially at higher SOM contents. The formulation of Decharme et al. (2016) is not shown here, as it depends on a depth-varying peat porosity prescribed from an idealized vertical profile, which is not applicable to binary mixture data. Assuming a typical value of 0.9 for the peat porosity, their formulation becomes equivalent to that of Lawrence and Slater (2008), which is thus more generally applicable in this context.
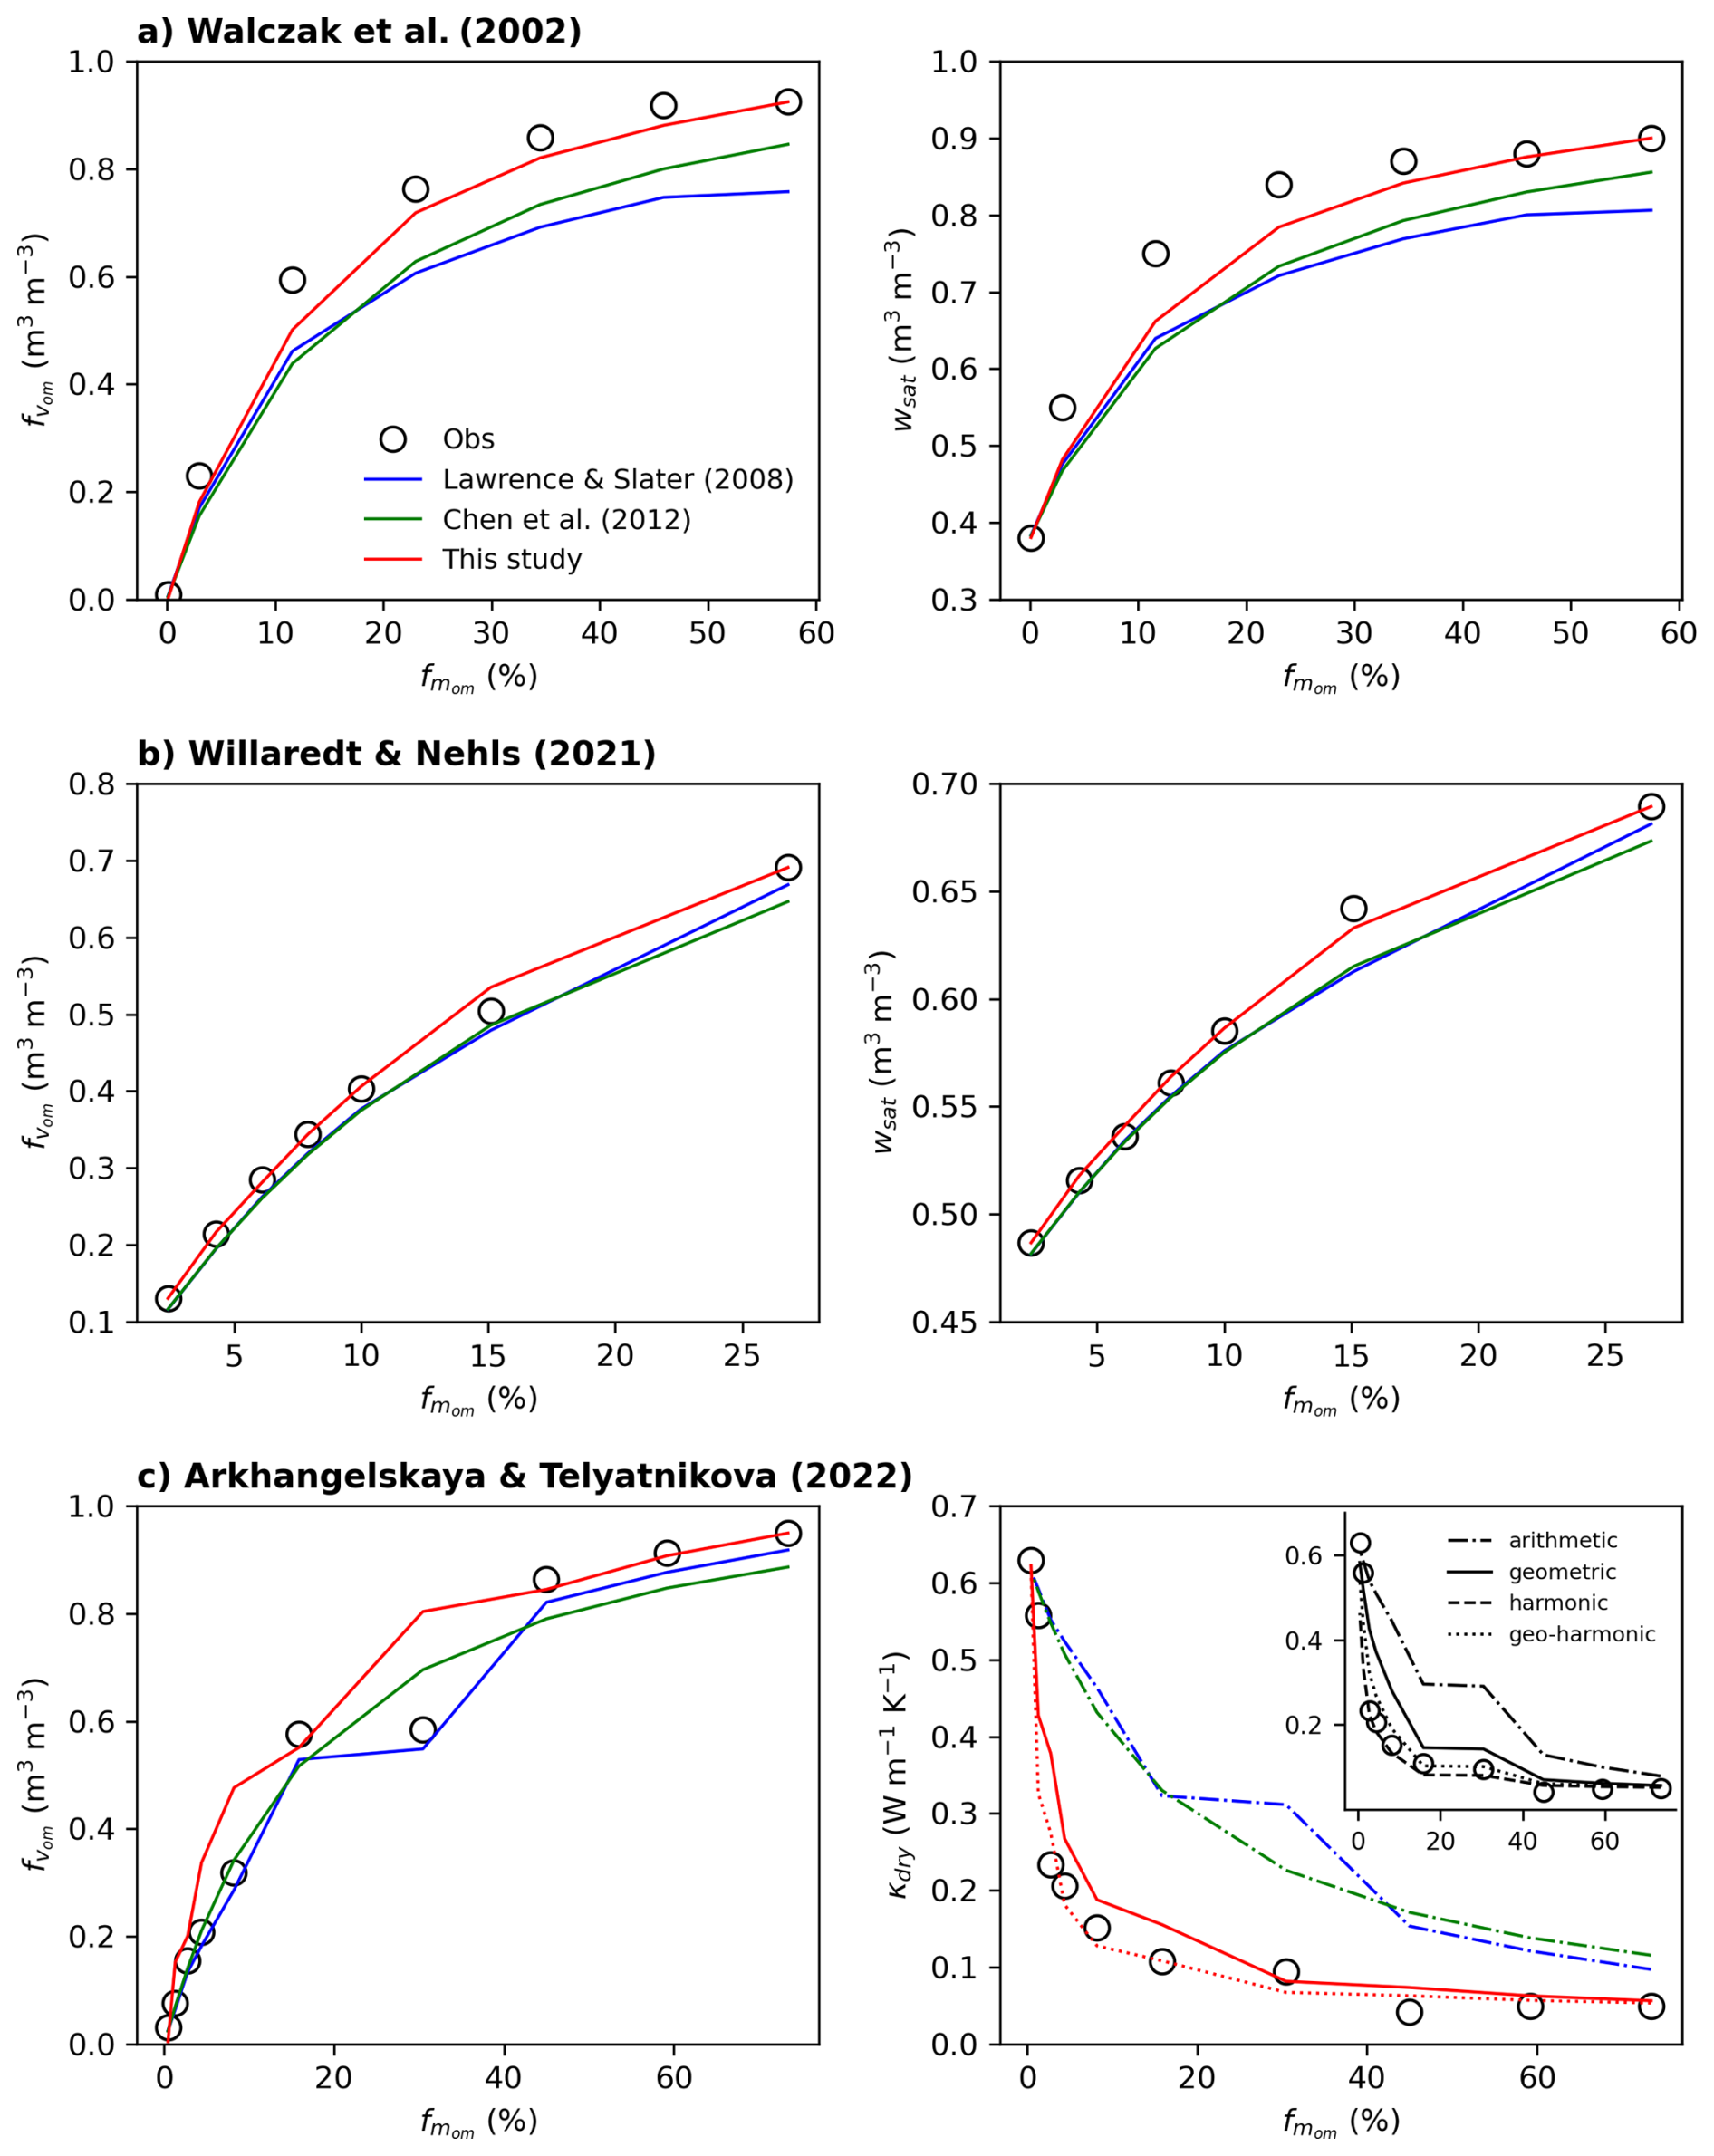
Figure 3Evaluation of the proposed framework against experimental binary mixture datasets. Each panel compares observed or estimated values (open circles) with predictions from this study (red), and approaches of Lawrence and Slater (2008) (blue) and Chen et al. (2012) (green). Panels (a) and (b) show the volumetric organic matter fraction () and porosity (wsat) as functions of the organic matter mass fraction (), based on data from Walczak et al. (2002) and Willaredt and Nehls (2021), respectively. Panel (c) shows results based on the dataset from Arkhangelskaya and Telyatnikova (2023), comparing the volumetric organic matter fraction (left) and the dry thermal conductivity kdry (right). For kdry, various mixing rules are compared to same estimates (open circles) in the inset: arithmetic (dash-dotted line), geometric (solid line), harmonic (dashed line), and geo-harmonic mean (dotted line), each computed using the values estimated directly from the data (open circles in the right panel). In the main right panel, the tested parameterizations are shown with their corresponding averaging schemes, using the same line styles as in the inset: Lawrence and Slater (2008) (blue) and Chen et al. (2012) (green) rely on arithmetic means (dash-dotted), while the presented framework (red) relies on either a geometric mean (solid) or a geo-harmonic mean (dotted).
Previous approaches estimate the SOM volumetric fraction from SOC using a fixed bulk density, typically 130 kg m−3. This value does not reflect the wide variability in SOM compaction and structure. Additionally, using SOC rather than total SOM introduces another approximation, as SOC typically represents only about half of SOM. These two simplifications, namely relying on SOC and assuming a low fixed SOM bulk density, introduce opposing biases that tend to partially offset one another. In practice, combining a SOC-to-SOM factor close to 2 (Eq. 28) with a fixed bulk density of organic carbon of 130 kg m−3 fixed in previous approaches is equivalent to a bulk density of organic matter of 260 kg m−3, which can be directly compared to the values of 205, 248, and 240 kg m−3 obtained for the three laboratory datasets using the present framework. As a result, the predicted may appear reasonable in some cases, but this is due to compensating errors rather than a physically sound model. Here, this method tends to systematically underestimate the volumetric contribution of organic matter, especially in SOM-rich samples. As shown on Fig. 3a, the discrepancy between these predictions and the data-derived estimates increases with rising SOM content. By contrast, our framework directly links SOM mass content and bulk density through a consistent formulation, incorporating an empirically derived organic matter bulk density that remains close to the observed value of 205 kg m−3 (see Table 2). This approach better captures the structural properties of SOM and aligns more closely with the observed values across the full mixture range.
These results are further supported by Fig. 3a (right), which compares the observed wsat of the binary mixtures with predictions from various approaches as a function of . In our framework, soil mixing theory directly leads to an arithmetic mixing rule for porosity (Eq. 18), where wsat is computed as a volumetric-weighted average of and , based on their respective contributions. To apply this equation, we estimated these pure component porosity by using the measured properties of 100 % sand and the 100 % peat samples in the dataset of Walczak et al. (2002). We first derived the particle density of the mineral phase () from the pure sand sample using Eq. (11). Following the same principle, we then estimated the particle density of the organic matter phase () from the pure peat sample, using inversion of Eq. (15a). Given the previously calculated bulk density of the organic component (205 kg m−3), and using Eq. (11), which defines porosity as the complement of the bulk-to-particle density ratio, we obtained a reconstructed of 0.94 m3 m−3. This value was then used as a fixed reference in our arithmetic mixing rule to predict wsat of all intermediate mixtures. As shown in the figure, older approaches systematically underestimate wsat, particularly in SOM-rich mixtures. This bias is primarily due to their underestimated and the simplistic assumptions about the structure and density of organic matter. In contrast, our framework provides predictions that better match the observed wsat across the full composition range, reinforcing both the validity of the volumetric fraction formulation and the soil mixture theory. While some discrepancies remain, the overall agreement confirms that our approach is able to more accurately represent the bulk structural properties of mixed soils.
We now turn to the dataset from Willaredt and Nehls (2021), which provides a complementary case to the Walczak mixtures by focusing on substances with lower SOM content (Table 3). These mixtures allow us to test the robustness of the soil mixture theory under more mineral-dominated conditions (Fig. 3b). To determine the pure component properties (organic and mineral) from the Willaredt and Nehls (2021) dataset, we used the two most compositionally distinct samples: the one with the highest organic matter content (100 % compost) and the one with the lowest (100 % crushed brick). These two endmembers form the basis of a two-equation system with two unknowns, derived from the porosity relationship (Eq. 10b) and the general mixing formulation (Eq. 15a). We first solved this system to estimate the properties of the mineral component, assuming the crushed brick sample represents the pure mineral phase. Using the measured bulk and particle densities of the two selected samples, we derived a of 1515 kg m−3 and a of 2715 kg m−3 for the mineral phase, yielding a of 0.44 m3 m−3. We then used the inverse of the mixing formulation (Eq. 15a) to infer the organic component properties from the pure compost sample. This yielded a of 248 kg m−3 and a of 1230 kg m−3, corresponding to a of 0.80 m3 m−3. These reconstructed pure component properties lie within the typical ranges reported for mineral and organic soils (Boelter, 1968; Clapp and Hornberger, 1978; Cosby et al., 1984; Letts et al., 2000; Rühlmann et al., 2006; Hossain et al., 2015; Liu and Lennartz, 2019; Ruehlmann, 2020; Ruehlmann and Körschens, 2020; Robinson et al., 2022). These values served as fixed references to estimate using Eq. (22), and were subsequently used in the arithmetic mixing rule (Eq. 18) to predict wsat of each mixture in the Willaredt dataset. In both cases, our framework predictions align well with the observations across the full range of mixtures, confirming its robustness even in soils where SOM is less dominant. In contrast, previous approaches (Lawrence and Slater, 2008; Chen et al., 2012) systematically slightly underestimate both and porosity. As discussed earlier, the relatively low discrepancy observed for previous approaches stems from compensating biases in their assumptions, i.e. the use of SOC instead of SOM and the application of fixed, underestimated SOM bulk density values.
We finally turn to the dataset of Arkhangelskaya and Telyatnikova (2023), which offers a well-balanced set of samples across a wide SOM gradient, including both mineral-dominated and organic-rich compositions. This dataset offers a valuable opportunity to evaluate the thermal component of our framework, especially under contrasting SOM conditions. The left panel of Fig. 3c compares the estimate of with the predictions from our framework and previous approaches. To estimate and predict , the SOM content was converted from SOC using Eq. (28). We then derived the pure component densities from Table 4: the mineral component was taken from the 100 % sand sample, providing a of 1630 kg m−3. was reconstructed from the peat-rich sample using Eq. (23), resulting in a value of 240 kg m−3. As in the other binary mixture datasets, our predictions align relatively well with the empirical estimates across the full range of SOM content. In contrast, older formulations tend to underestimate , particularly in samples with higher organic content. However, the data point corresponding to the “40 % peat + 60 % sand” sample ( in Table 4) stands out as showing a substantial deviation between our framework prediction and estimate. While the estimate of gives a value near 0.5, our prediction approach 0.8, producing an apparent overestimation. This discrepancy can be traced to the reported bulk density of this sample, which is 460 kg m−3, and suspiciously identical to that of a sample with higher SOC content (). Given the lower organic content, a higher bulk density would be expected for this sample. Using Eq. (22) and assuming kg m−3 and , we estimate that a more physically consistent bulk density for this sample would be around 600 kg m−3. This value falls well within the observed range for the dataset (460–870 kg m−3) and suggests that the deviation is likely due to an experimental underestimation of bulk density. This misestimation propagates into the estimate, artificially inflating its value and explaining the bias observed in the figure. Interestingly, the approach of Lawrence and Slater (2008) does not show this deviation, though for fundamentally different reasons. Their method estimates from using a fixed carbon-to-organic matter conversion factor and a constant low SOM bulk density (typically 130 kg m−3), without relying on the observed bulk density of the soil. As a result, it is not affected by potential measurement errors in ρb. However, once again, the apparent agreement with observations is likely due to a compensation of biases: the use of SOC instead of total SOM tends to underestimate organic content, while assuming a low fixed SOM bulk density tends to overestimate the associated volume. These two opposing errors can partially cancel each other, producing seemingly reasonable values. While this makes the method somewhat robust to data uncertainties in some cases, it comes at the cost of physical realism. In contrast, our framework uses observed bulk density to reconstruct , providing a more mechanistic and composition-specific estimate. However, this method is inherently more sensitive to measurement uncertainties.
This dataset from Arkhangelskaya and Telyatnikova (2023) also provides direct measurements of dry thermal diffusivity, from which dry thermal conductivity (λdry) can be inferred. We reconstructed λdry for each binary mixture by applying Eq. (47), using air-dry diffusivity values and estimating the volumetric heat capacity () with Eq. (41). The latter was computed based on the predicted or estimated and the specific heat capacities (com and cms) and bulk densities of the organic and mineral components, as detailed in Sect. 2.2.8. From this, we derived λdry values of approximately 0.63 W m−1 K−1 for the mineral phase and 0.05 W m−1 K−1 for the organic matter component. Notably, the latter value matches the organic λdry commonly used in LSMs following Farouki (1981). Using these pure component values, we evaluated several mixing rules to model λdry across the full SOM gradient. Specifically, we tested arithmetic mixing (Eq. 4) as in Lawrence and Slater, 2008), geometric mixing (Eq. 5) as in Decharme et al. (2016), harmonic mixing (Eq. 6), and the hybrid geo-harmonic mixing (Eq. 7).
The right panel of Fig. 3c presents the relationship between kdry and . The circular markers represent the estimated values of kdry for each binary mixture. These estimates were obtained by combining observed dry thermal diffusivity with calculated volumetric heat capacity as described above. In the inset, the same estimated kdry are plotted (white markers), but here compared against predicted kdry values obtained by applying different mixing rules. These predictions are computed using the estimated values from the left panel and the reconstructed pure component dry thermal conductivities. This comparison enables a direct assessment of which average formulation best captures the effective thermal conductivity behavior across the SOM gradient. Among the different mixing rules, only the non-linear formulations are able to capture the observed decline in kdry with increasing SOM content, in line with the hypothesis of Decharme et al. (2016). While the geometric mean tends to slightly overestimate and the harmonic mean to slightly underestimate kdry, the geo-harmonic mean offers an interesting compromise between the two, providing a balanced representation across the full SOM gradient. The figure also shows the kdry predicted using our framework (red curves), combined with either a geometric (solid) or geo-harmonic (dotted) mixing rule. Both approaches capture the overall trend of the observations. However, the geo-harmonic formulation provides a closer match to the data and further supports the validity of our framework, not only for predicting kdry but also for estimating the underlying volumetric heat capacity. Logically, earlier parameterizations, which rely on simple arithmetic mixing (Lawrence and Slater, 2008; Chen et al., 2012), substantially overestimate kdry, particularly at higher SOM contents.
4.2 Porosity of natural soils
We now assess the ability of the proposed framework to reproduce wsat of natural soils across a wide range of conditions. Once again, the accurate simulation of wsat directly validates the soil mixture theory introduced in Sect. 2.2.2. In our approach, wsat is computed as a volumetric weighted average (Eq. 18) between and , based on the predicted . The accuracy of this prediction depends not only on the quality of the pure component porosity estimates, but also on the internal consistency of the volumetric formulation across observed gradients in SOM and bulk density. is derived from the observed ρb, the organic matter mass fraction , either observed directly or converted from via Eq. (28), and a reconstructed . This reconstructed value is obtained through Eq. (23) to Eq. (25), using predicted by Ruehlmann (2020) and estimated from the Cosby-SC PTF (i.e. sand and clay only) given in Table 5 of Cosby et al. (1984). We adopt this Cosby-SC PTF because it has been identified as the most reliable PTF for simulating soil water balance with the Brooks and Corey (1964) model (e.g., Weihermüller et al., 2021). Finally, is estimated using the PTF of Liu and Lennartz (2019), which relates to (Eq. 30). To evaluate this framework, we use three independent datasets (Keller and Håkansson, 2010; Arkhangel'skaya, 2009; Kristensen et al., 2019), each providing in situ measurements of ρb, or , and soil texture (, and ) across a broad range of soil types and land uses.
As shown in Fig. 4, we compare the performance of our framework against two commonly used parameterizations, applied separately to each dataset. First, the mineral soil Cosby-SC PTF of Cosby et al. (1984) serves as a benchmark representative of LSMs that do not account for organic matter. Second, we include the parameterization of Lawrence and Slater (2008) using content (either directly observed or estimated from by inverting Eq. 28) and assuming fixed of 130 kg m−3 and of 0.9 m3 m−3. As in our framework, for the parameterization of Lawrence and Slater (2008) is given by the Cosby-SC PTF. The comparisons reveal systematic differences between the three approaches. The Cosby-SC PTF, which does not account for organic matter, consistently underestimates wsat in soils with moderate to high SOM content. The parameterization of Lawrence and Slater (2008), although it includes organic soil properties, shows slightly improved skill scores and linear regression slopes compared to the purely mineral-based Cosby PTF. This suggests a partial correction effect due to the inclusion of organic properties. However, it still fails to accurately capture wsat across the full SOM gradient. In particular, it systematically overestimates porosity in organic-rich soils. This overestimation partly stems from its fixed assumptions of a low and a constant , which do not reflect the variability estimated in natural soil structures (Fig. 5). In contrast, the proposed framework shows improved agreement across all datasets. By explicitly accounting for the variability in SOM content and structure, it captures both the lower porosities of mineral soils and the higher porosities of organic-rich soils with greater realism. Because porosity estimates are constrained by bulk density in the mixture-theory formulation, this agreement also reflects the consistency of the inferred and , which fall within reported ranges as shown by Figs. 4 and S3. This consistent performance highlights the robustness of the underlying soil mixture theory and its adaptability across a wide range of soil conditions, requiring only observed or content as well as measurements of ρb and soil texture as inputs.
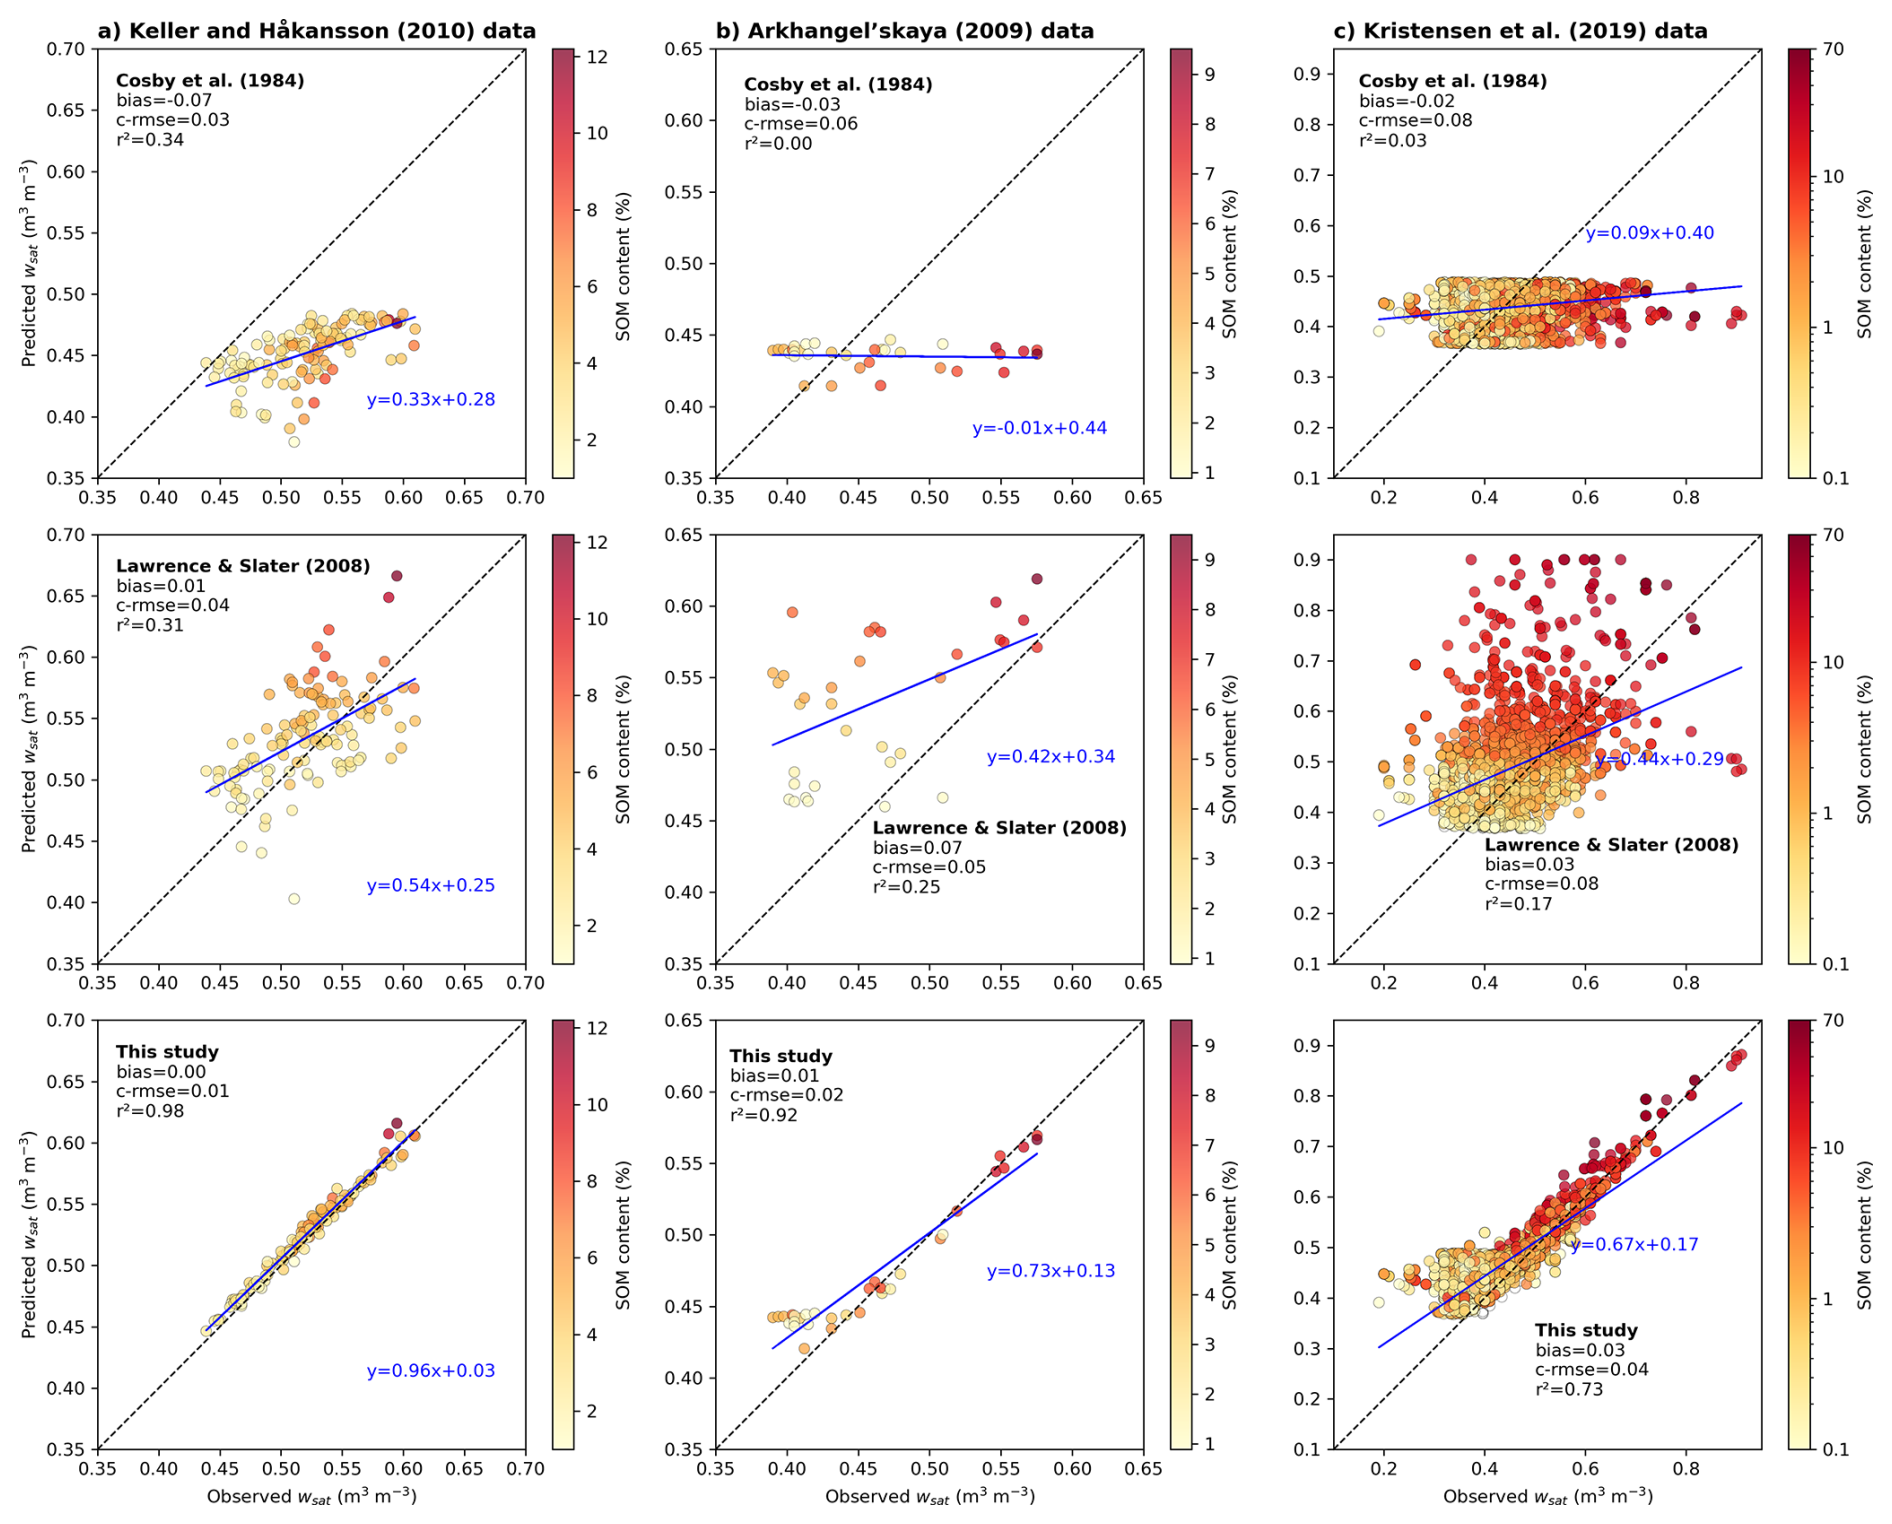
Figure 4Comparison of observed and predicted soil porosity across three in situ datasets: (a) Keller and Håkansson (2010), (b) Arkhangel'skaya (2009), and (c) Kristensen et al. (2019). Each row corresponds to a different prediction method: the first row uses the mineral-soil PTF of Cosby et al. (1984), which ignores the presence of organic matter; the second row applies the method of Lawrence and Slater (2008), which includes SOM effects using a simplified approach; and the third row shows results from the process-based framework developed in this study. The 1:1 line is shown in black, and the blue line represents the linear regression between predicted and observed values where its slope and intercept provide an additional measure of agreement. Finally, skill scores are given for each panel.
While the overall agreement between our framework and the observed porosities is strong, a closer examination of Fig. 4 (lowest line) reveals a tendency to overestimate wsat for samples with observed low porosity value (≤0.4 m3 m−3) generally associated with low SOM content. This deviation is not due to the soil mixture theory itself, but rather to the porosity of the mineral reference phase, which is derived from the Cosby-SC PTF. This texture-based model rarely predicts below 0.4 m3 m−3, even in dense mineral soils. The same pattern is visible in the Arkhangelskaya dataset. To isolate this effect, we recalculated model performance metrics by retaining only the samples with ≥ 4 % or with ≥ 2 % (see Fig. S2). In this subset, the r2 of our framework increases significantly from 0.73 to 0.90 in the Kristensen dataset and from 0.93 to 0.95 in the Arkhangelskaya dataset. In contrast, the performance of the Lawrence and Slater (2008) approach deteriorates sharply, with r2 dropping from 0.17 to 0.02 in the Kristensen dataset. This highlights the limited realism of older SOC-based parameterizations when applied to organic-rich soils. As expected, the scores for the Cosby PTF remain largely unchanged, since this method is independent of organic matter content. These results confirm the validity of our process-based framework. They also indicate that the residual biases in porosity predictions are primarily attributable to uncertainties in mineral property estimations rather than limitations in the soil mixture formulation itself.
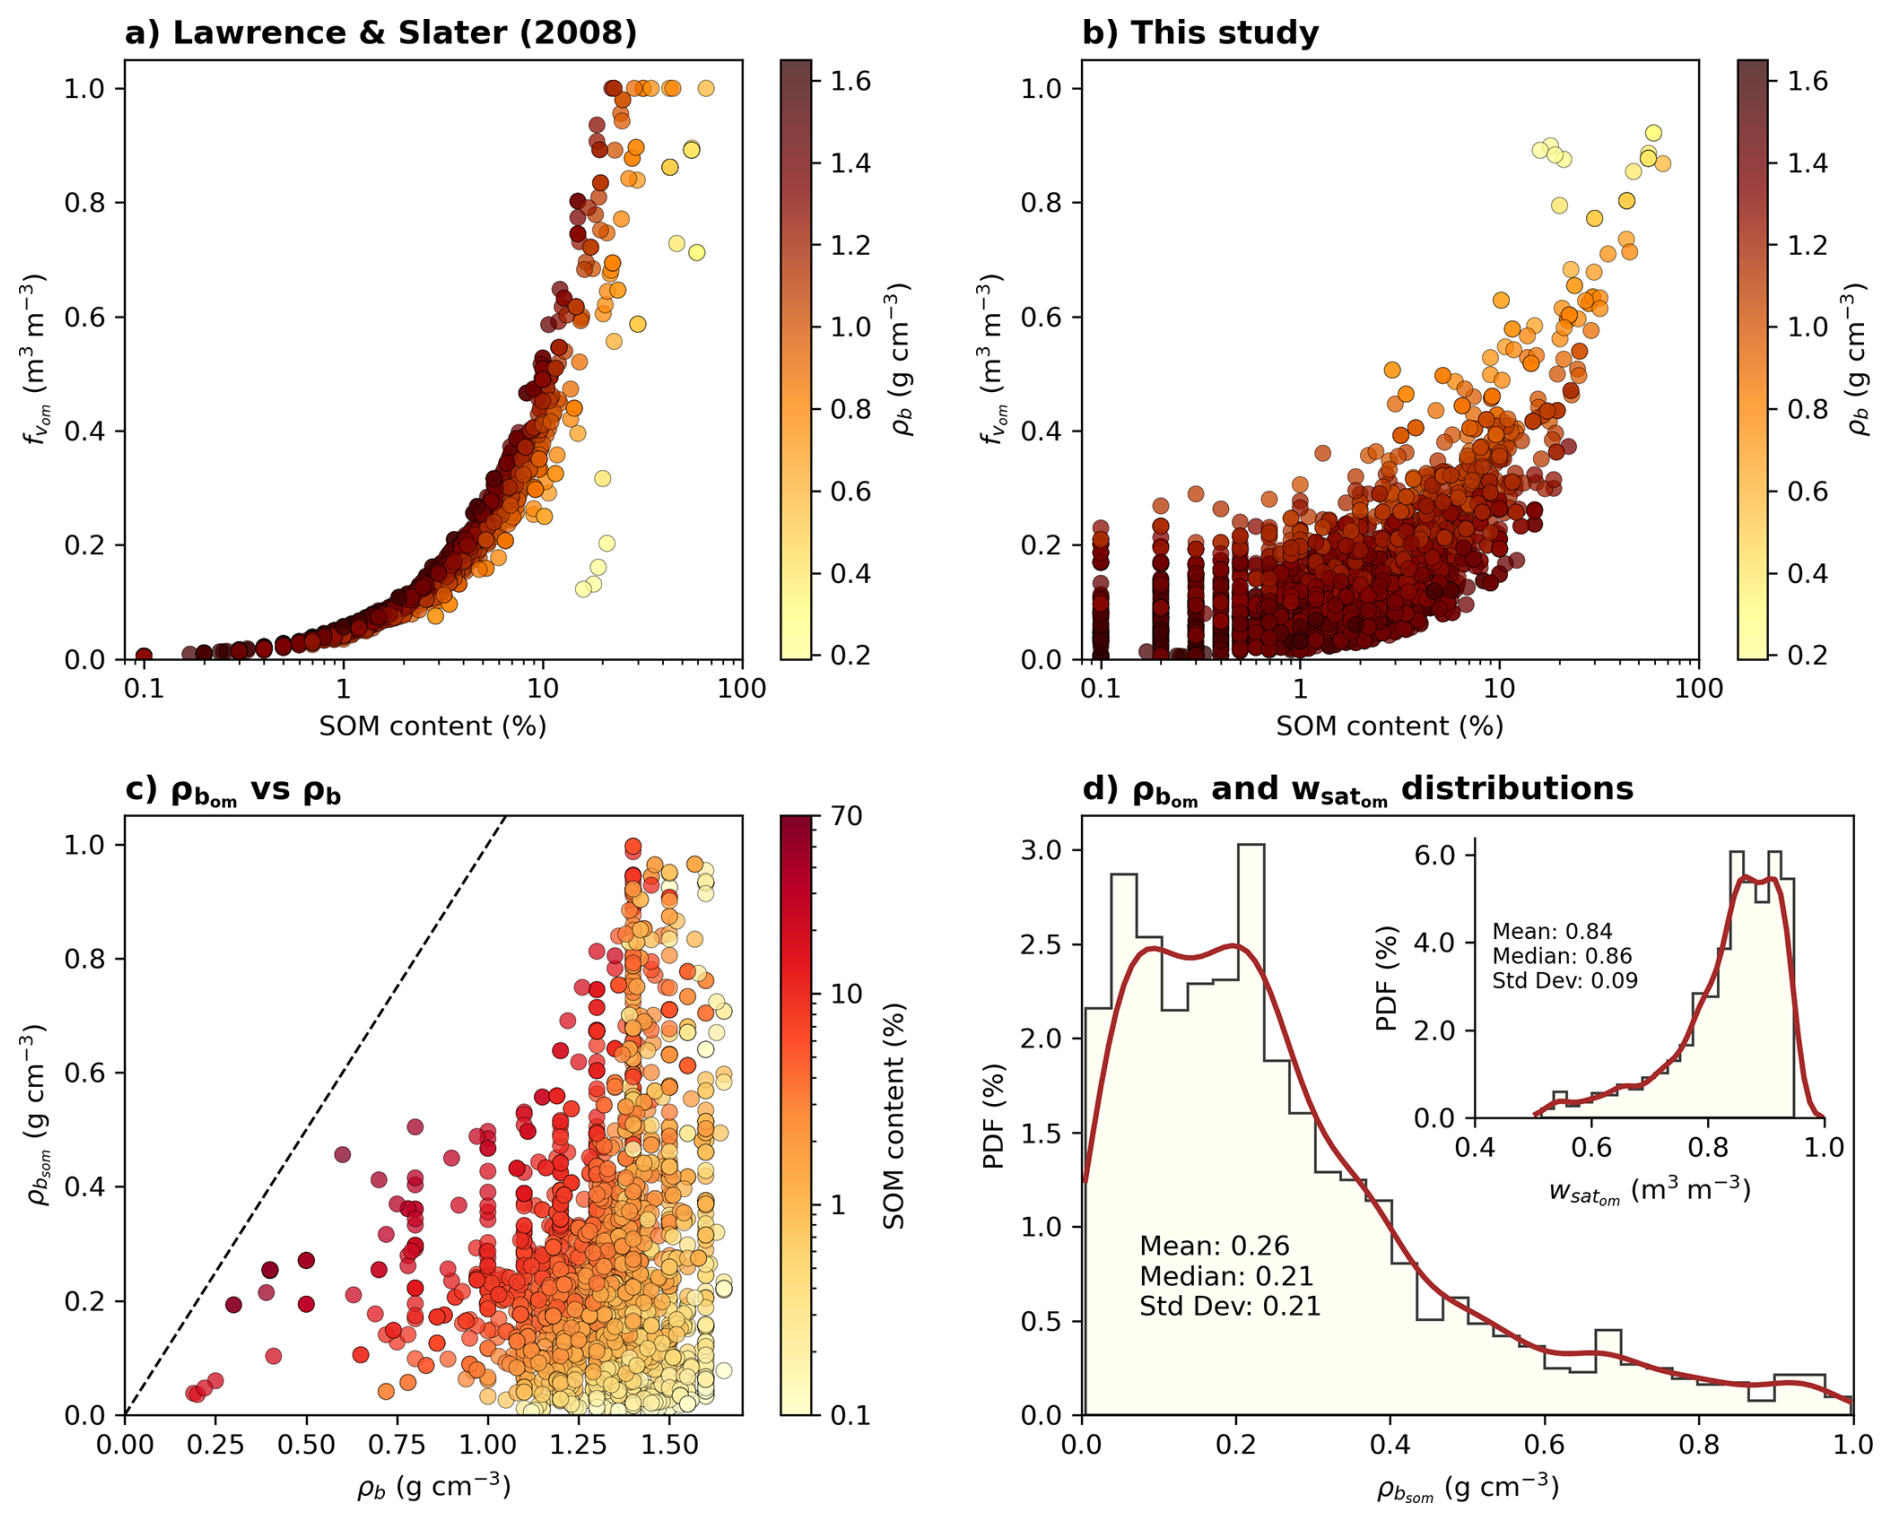
Figure 5Diagnostic analysis of the soil mixture theory framework behavior, based on the three in situ datasets used in Fig. 4. Panels (a) and (b) show the volumetric organic matter fraction () as a function of SOM content for the parameterization of Lawrence and Slater (2008) and for the current study, respectively. Points are colored by observed bulk density (ρb). Panel (c) compares the reconstructed organic bulk density () from our framework with ρb, with point color indicating SOM content. The dashed black line represents the 1:1 line. Panel (d) shows the PDF (in %) of (main plot) and of the associated organic porosity (inset), both estimated across all data points using Eqs. (23) and (30).
Figure 5a and b compare the predicted as a function of SOM content across the three in situ datasets. In Panel (a), the parameterization of Lawrence and Slater (2008) is shown. The overall trend of increasing with SOM content is expected, but the relationship is highly non-linear and remarkably narrow: at any given SOM content, nearly all points collapse onto the same predicted value. This reflects the fact that structural variability is not accounted for in this approach. Moreover, for SOM contents above 20 %, most predictions saturate near 1 m3 m−3, which appears excessive. Finally, the distribution of colors associated with ρb shows no clear organization, highlighting that this variable has no explicit influence on the prediction. As a result, the approach can yield physically inconsistent outcomes: for instance, some very low-density soils (in yellow) with high SOM content (> 10 %) are assigned unrealistically low values (< 0.2 m3 m−3), while denser soils with lower SOM contents may be assigned disproportionately high values.
By contrast, our framework (Fig. 5b) accounts explicitly for both ρb and in the derivation of . This allows to incorporate structural information about the soil, which older approaches do not. As a result, the relationship appears more dispersed but also more physically meaningful. As expected, low-density soils correspond to higher , while denser soils show lower values. For a given SOM content, varies depending on the soil’s bulk density: lighter soils (shown in light yellow) have higher than compact soils (dark brown), which is consistent with the idea that a looser structure allows organic matter to occupy a larger volume. Unlike the Lawrence and Slater (2008) approach, which quickly saturates toward for SOM-rich soils, the proposed method shows a smoother and more gradual transition. In particular, when SOM content exceeds 10 %, the previous method systematically predicts larger values of than the proposed approach. This also explains why the Lawrence and Slater (2008) formulation systematically overestimates porosity in organic-rich soils (Fig. 4). More generally, our framework captures the structural heterogeneity of the fine-earth fraction by accounting for both the actual bulk density of the soil and the reconstructed apparent density of SOM. This allows for the representation of a wider diversity of soil profiles, particularly when two soils have the same SOM content but differ in bulk density.
Indeed, Fig. 5c shows the estimated as a function of total soil bulk density ρb, with SOM content indicated by color. Denser soils tend to be associated with more compact organic components. This is consistent with our formulation, where is computed from mineral structure and SOM content (via Eqs. 23 to 25). For a given , soils with higher SOM content (warmer colors) usually show lower ρb. This reflects the more porous structure of organic-rich soils. As SOM increases, and ρb get closer. This is expected, since in organic-dominated soils, the total bulk density becomes close to that of the organic phase. Figure 5d shows the PDF of the estimated and across all in situ datasets. The distribution of is centered between 210 and 250 kg m−3, with main values ranging from about 10 to 400 kg m−3. This is consistent with previous observations from organic-rich horizons and peat soils (Adams, 1973; Boelter, 1968; Letts et al., 2000; Ruehlmann and Körschens, 2009; Liu and Lennartz, 2019). In comparison, a considerable number of LSMs adopt a fixed value of 130 kg m−3. While this value is physically plausible, it falls toward the lower bound of our estimated values. The distribution of spans mainly from 0.8 to 0.95 m3 m−3, in good agreement with empirical ranges reported for organic horizons in natural and managed soils (Liu and Lennartz, 2019). Together, these results support the internal consistency of the framework in deriving physically realistic properties for the organic soil component. A complementary quality check can be provided by the inferred particle density of organic matter (), obtained from and (Eq. 11). The distribution shown in Fig. S3 (mean 1380 kg m−3, and median 1490 kg m−3) is centered within the typical range of 1100–1500 kg m−3 reported by Rühlmann et al. (2006) and Ruehlmann (2020) or 900–1550 kg m−3 reported by Redding and Devito (2006), further supporting the physical consistency of the framework.
4.3 Water retention of natural soils
We now evaluate the ability of the framework to reproduce water retention properties across a wide range of soil types using the Brooks and Corey (1964) model. In addition to validating wsat as done in the previous section, this also allows us to assess the air-entry potential (ψsat) and the pore-size distribution index (b). For mineral soils, both parameters are estimated using the Cosby-SC PTF, consistent with the porosity benchmarks used earlier. For organic soils, they are predicted from using the empirical relationships introduced in Sect. 2.2.6. In all cases, an arithmetic mixing (Eq. 4) is applied to combine the mineral and organic components. Additional tests on the water retention curves from the binary mixture datasets of Walczak et al. (2002) and Willaredt and Nehls (2021) did not show any evidence that nonlinear formulations would perform better than this linear approach. To evaluate the framework’s performance, we compare simulated water contents to in situ estimates from two large-scale datasets of Kristensen et al. (2019) and Gupta et al. (2021). Both datasets offer independent validation opportunities across diverse climates, textures, and SOM contents.
Figure 6 is drawn from the European soil profile database of Kristensen et al. (2019), which includes estimations of water contents at four standard matric potentials (−1, −10, −100 and −1500 kPa) for over 4000 soil horizons. We evaluate our framework by comparing it with the mineral soil PTF from Cosby et al. (1984) and the SOC-based parameterization of Lawrence and Slater (2008). At low suctions (−1 kPa), our framework outperforms the others. The predicted values align more closely with observations, as indicated by a tighter regression along the 1:1 line, higher coefficients of determination, and reduced bias. This better performance is mainly due to improvement in simulating wsat, a key determinant parameter in near-saturation water retention. At intermediate suction (−10 and −100 kPa), the three approaches seem to converge, though our framework maintains a robust advantage (especially the r2 score). This suggests that while the influence of porosity lessens, the model’s performance still benefits from the organic-specific prediction of the shape parameter b and the air-entry potential ψsat in the Brooks and Corey formulation. At high suction (−1500 kPa), the performance gap between models narrows considerably, although our model still has a slight advantage. This is consistent with the experimental literature showing that the influence of SOM on water retention decreases under strong suctions. In particular, several binary mixture datasets reported by Willaredt et al. (2023) indicate that differences in water retention between mineral-organic mixtures are more pronounced at low to moderate suctions, but tend to fade at higher tension levels (e.g. −1500 kPa).
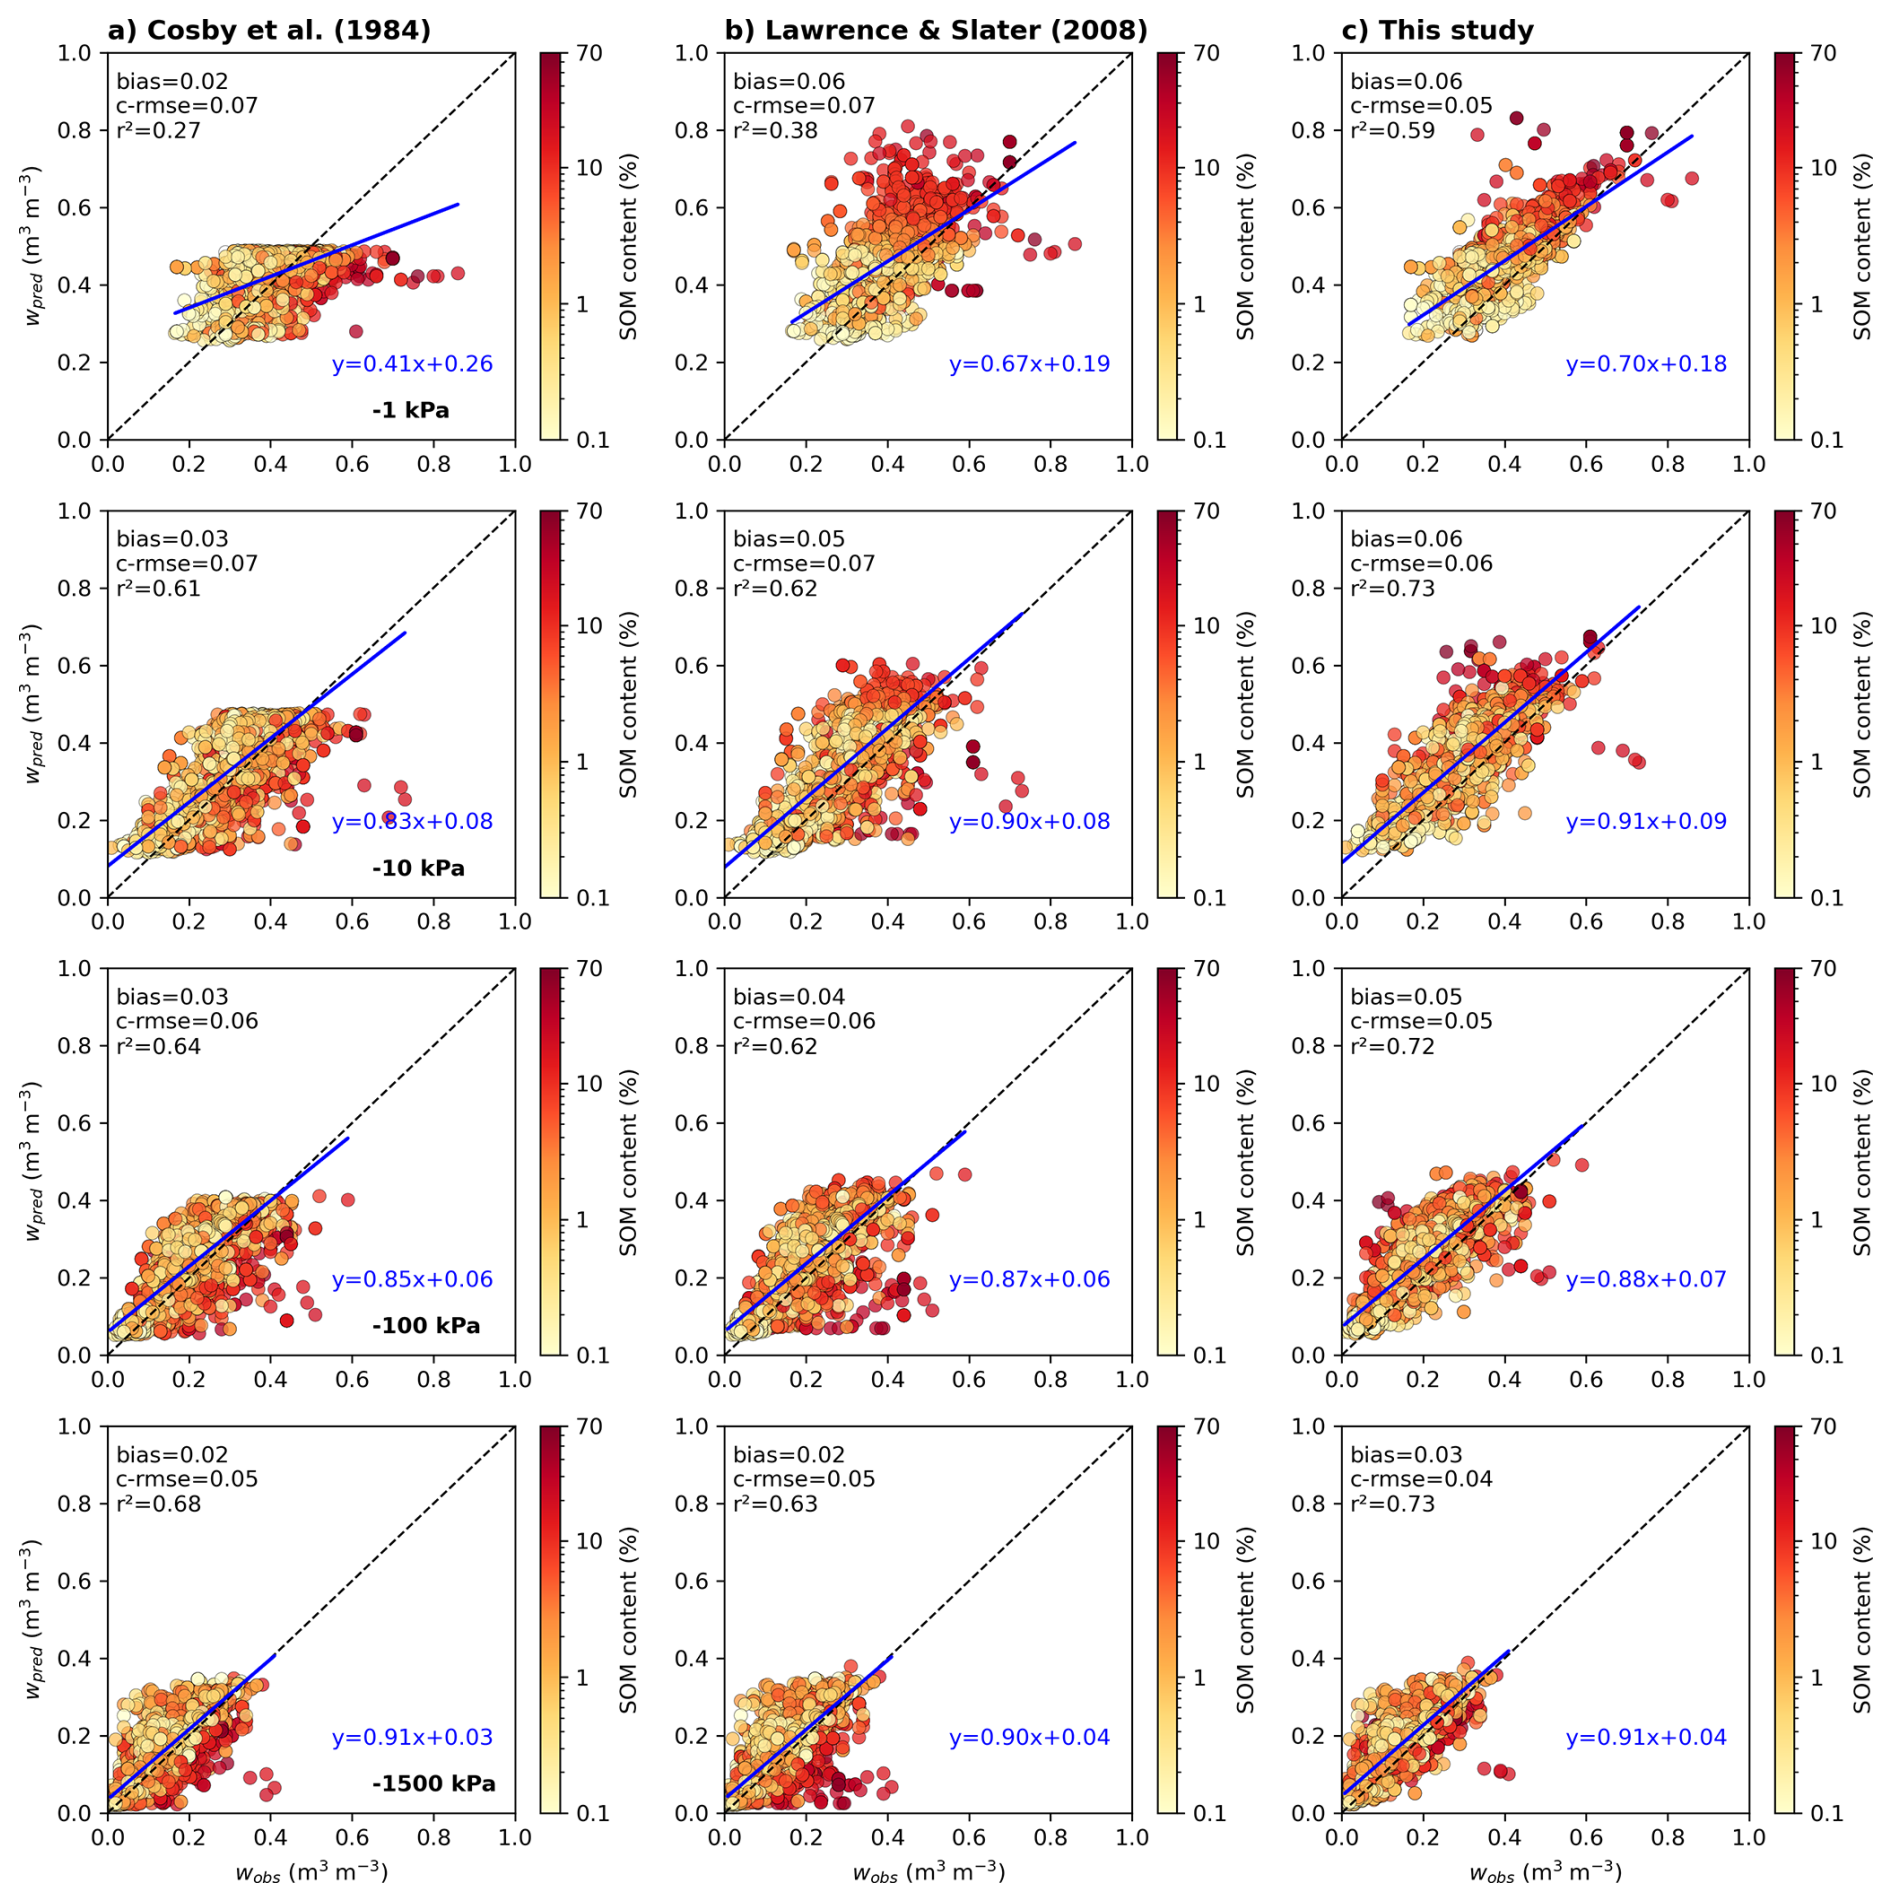
Figure 6Comparison between predicted and estimated volumetric water contents (w, m3 m−3) at four matric potentials (−1, −10, −100, and −1500 kPa) from the Kristensen et al. (2019) dataset. Each column shows results for a different model: (a) the mineral soil PTF of Cosby et al. (1984), (b) the SOC-based parameterization of Lawrence and Slater (2008), and (c) the framework developed in this study. Points are colored by SOM content, the blue line represents the least-squares regression between predicted and estimated values, and dashed black lines indicate the 1:1 line. Each panel includes the regression equation, bias, centered root mean square error (c-rmse), and coefficient of determination (r2).
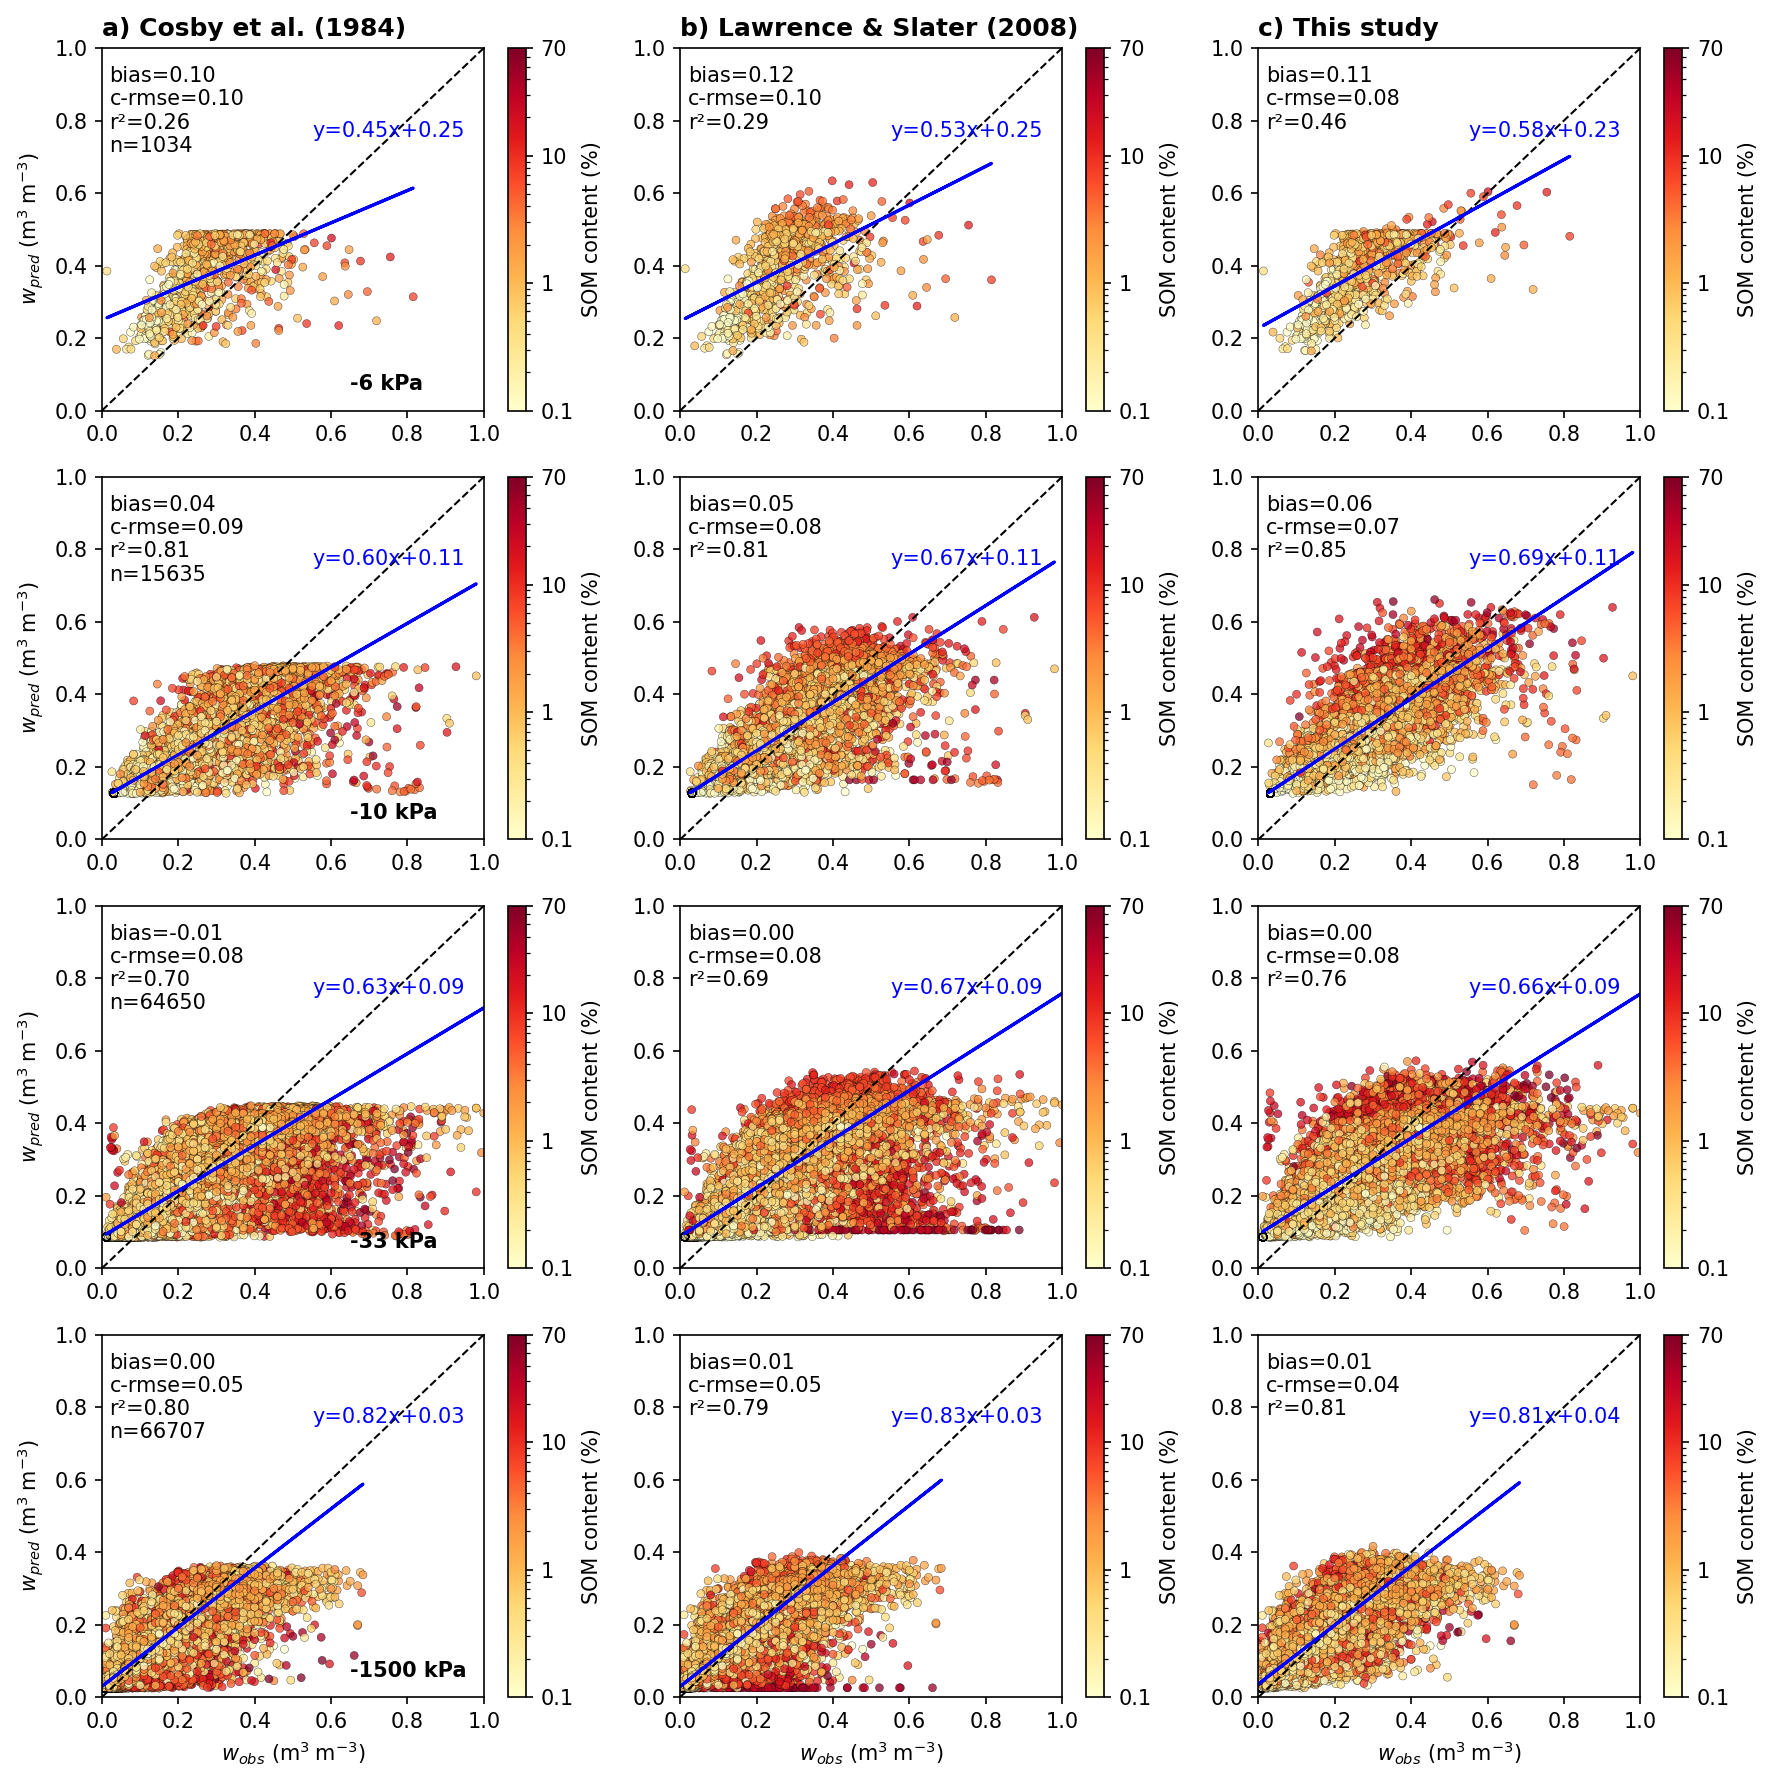
Figure 7As in Fig. 6, but for the dataset of Gupta et al. (2021) with four matric potentials at −1, −10, −33, and −1500 kPa.
Figure 7 presents the evaluation against the global SoilKsatDB dataset (Gupta et al., 2021), which provides in situ measurements of texture, bulk density, organic carbon, depth and water retention at four matric potentials (−1, −10, −33, and −1500 kPa) for a wide range of soils worldwide. The number of available samples increases with matric potential, from around 1000 at saturation to over 66 000 near the wilting point (−1500 kPa). The overall patterns are consistent with those observed for the previous dataset (Fig. 6). At low suction (−1 kPa), our framework shows superior performance compared to the two benchmark approaches, although absolute scores remain modest. At intermediate potentials (−10 and −33 kPa), all three approaches tend to converge, yet our framework consistently maintains an advantage, at least, in terms of square correlation and c-rmse. Finally, near the wilting point, the three models yield similar performance, though the overall shape of the regression fit remains slightly better with our approach. These results confirm, across a broad diversity of soil types and climates, the added value of our physically based framework. They reinforce the validity of the porosity formulation and support the assumption of arithmetic mixing for the water retention parameters ψsat and b.
4.4 Saturated hydraulic conductivity of natural soils
We finally evaluate the ability of our approach to predict ksat using the observational dataset compiled by Gupta et al. (2021). The SoilKsatDB contains approximately 16 000 measurements of ksat, covering a broad range of soil types, textures, and organic carbon contents. From these, we retain a subset of more than 14 000 samples for which soil texture, bulk density, organic carbon content, and sampling depth are available. Figure 8 compares predicted and observed ksat for the mineral soil PTF of Cosby et al. (1984), the SOC-based approach of Lawrence and Slater (2008), and the method proposed in this study, which explicitly accounts for the bulk density of the organic matter domain and its variation with depth. In these two last approaches, the mineral component of ksat is computed using the formulation of Cosby et al. (1984). For the organic component, a fixed value of m s−1 is used in Lawrence and Slater (2008), whereas we apply Eq. (36) in our approach. The final ksat value is then computed as an arithmetic mean in the case of Lawrence and Slater (2008), and as a geometric mean in our formulation.
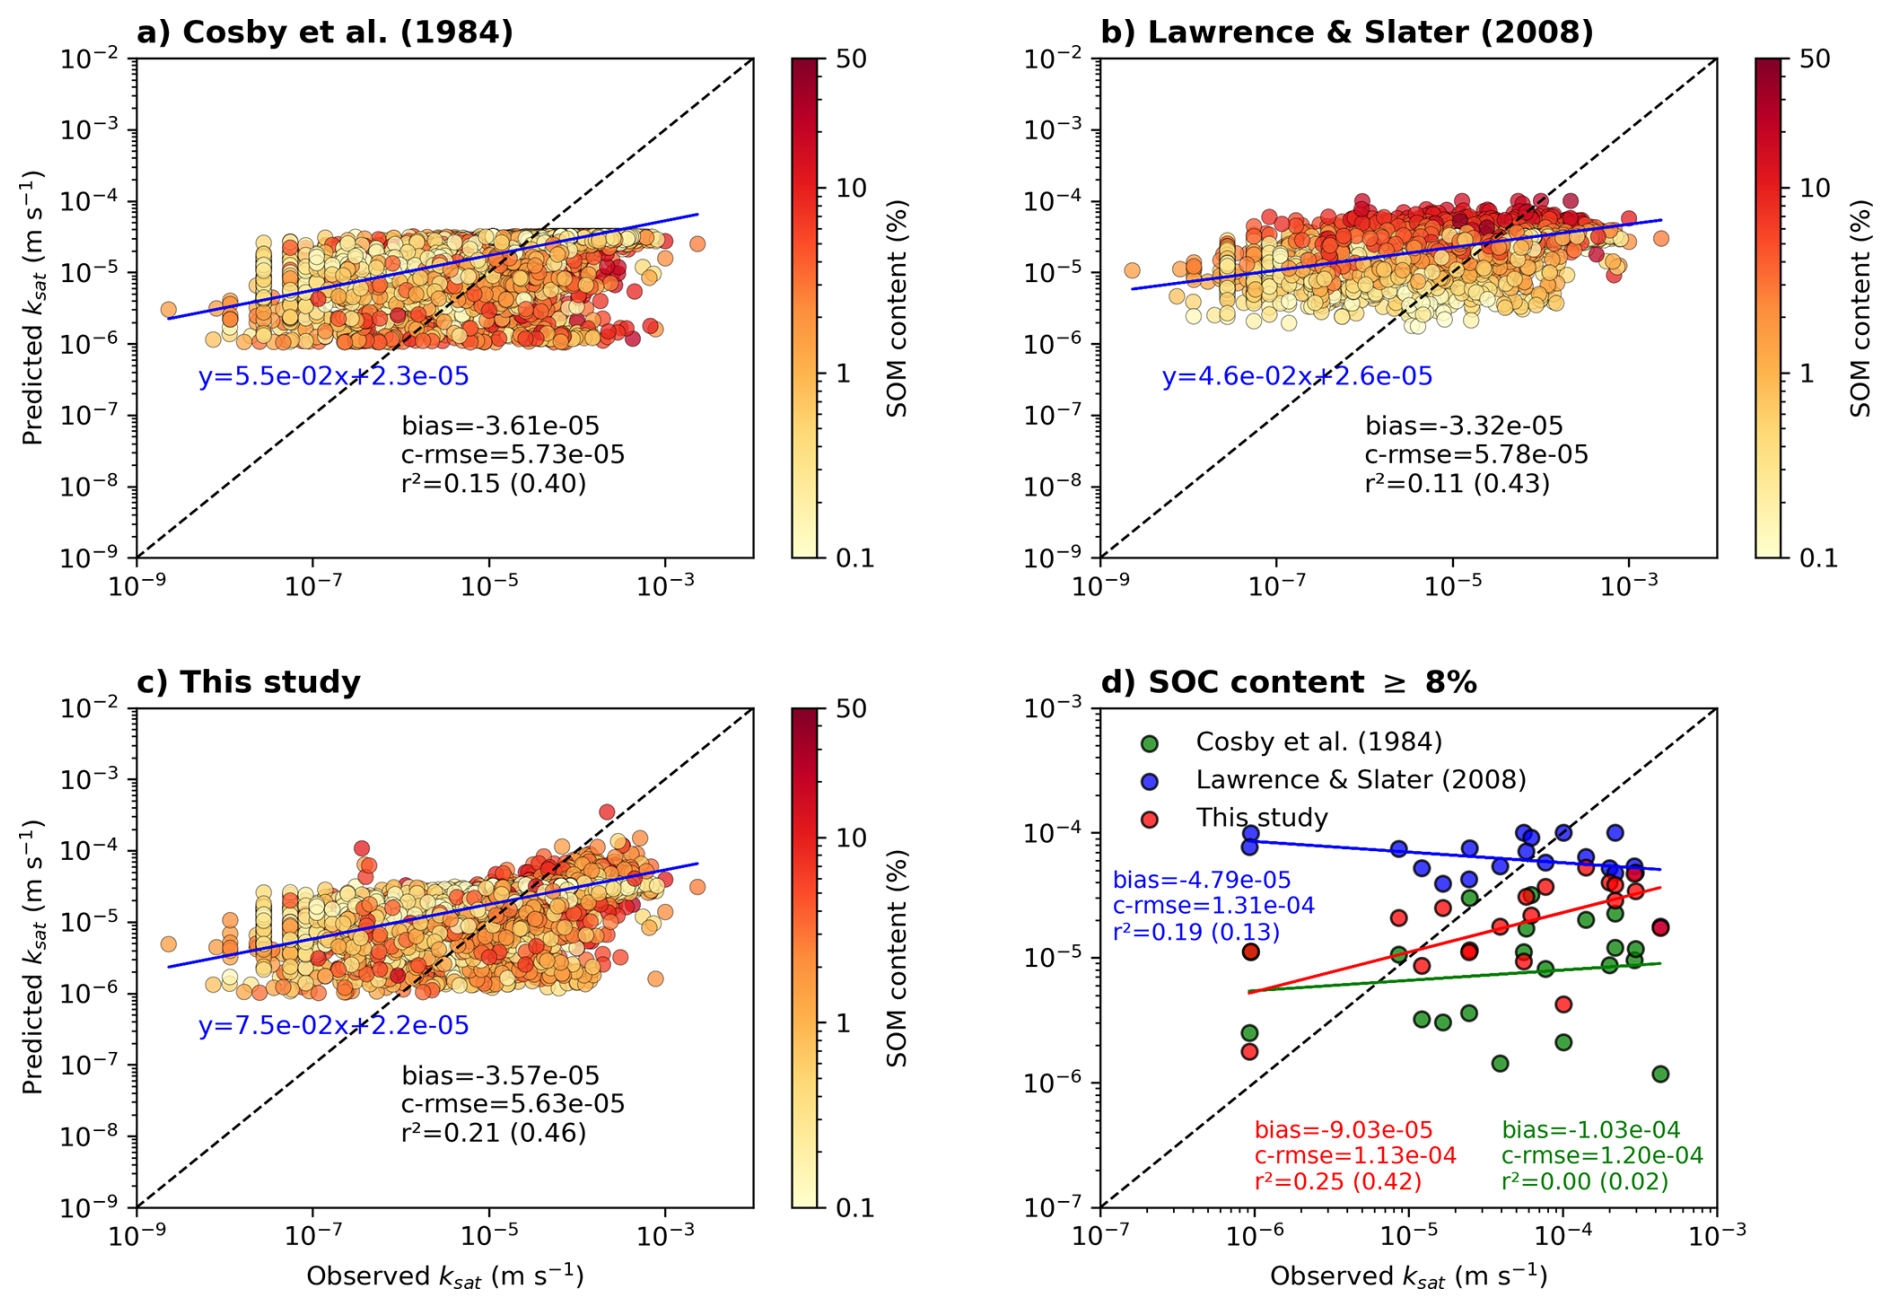
Figure 8Comparison between predicted and observed ksat using the dataset of Gupta et al. (2021). Predictions are based on (a) the mineral soil PTF from Cosby et al. (1984), (b) the SOC-based approach of Lawrence and Slater (2008), and (c) the process-based approach proposed in this study. Colors indicate SOM content. Each panel includes the least-squares regression (blue line), the 1:1 reference line (black dashed), the regression equation, the c-rmse, the bias, and the r2 score calculated in linear and log-transformed space (in parentheses). Panel (d) shows the same comparison restricted to samples with SOC content ≥8 %. Results are displayed in green for Cosby et al. (1984), blue for Lawrence and Slater (2008), and red for this study.
Figure 8a to c show the comparison across the full dataset. The Cosby et al. (1984) PTF exhibits a negative bias and a weak correlation with the observations (r2=0.15, and 0.40 on the log-transformed scale). The color distribution of the points, which reflects SOM content, suggests that mineral soils (light colors, low SOM) tend to be overestimated, whereas soils with higher SOM content (warmer colors) are more frequently underestimated. The SOC-based approach of Lawrence and Slater (2008) slightly reduces the bias, but the predicted variability remains poorly correlated with observations (r2=0.11, and 0.43 on the log-transformed scale). The color distribution shows a general overestimation of ksat in SOM-rich soils (warm colors systematically above the 1:1 line), which may indicate that the fixed value of m s−1 is too high, or that the organic fraction is overestimated for these conditions. Our approach yields improved agreement, with a higher r2 of 0.21 (0.46 on the log-transformed scale), a lower c-rmse, and a better representation of the ksat distribution across the SOM gradient. Although performance remains limited for mineral soils, due to reliance on the Cosby et al. (1984) PTF for the mineral component, results seem to show non negligible improvements for soils with higher SOM content.
This is further illustrated in Fig. 8d, which focuses on soils with SOC content above 8 % (corresponding to SOM content greater than 16 %), where organic matter strongly influences ksat. Differences between the parameterizations are more pronounced in this subset. The mineral-only approach (green) shows no correlation with observations (r2=0.00, 0.02 on the log scale), and systematically underestimates ksat. The SOC-based method of Lawrence and Slater (2008) (blue) has limited predictive power (r2=0.19, 0.13 on the log scale) and overestimates low observed values. Our formulation (red) produces a slope closer to the 1:1 line, a smaller bias, and a higher coefficient of determination (r2=0.25, 0.42 on the log scale), indicating improved consistency with the measurements.
The evaluation presented in the previous section confirms the internal consistency and predictive skill of the proposed framework across a wide range of soil types and conditions. We will now move on to a more general discussion of its conceptual implications, beginning with an examination of Table 1, which summarizes the key computation steps used to derive the “true” soil organic volumetric fraction and the associated physical properties of soil from a limited set of input data. These input data are the SOC mass fraction, the dry bulk density of the fine earth, and the mass fractions of clay, sand, and silt. These data are commonly available in widely used global and regional soil databases such as SoilGrids (Poggio et al., 2021) or HWSD (FAO, 2012; FAO and IIASA, 2023). This framework can be readily implemented without requiring additional measurements, making it compatible with the simple data infrastructure currently used by most regional and global LSMs.
In contrast to existing SOC-based parameterizations that rely on fixed reference densities, the proposed formulation derives from fundamental mass-volume relationships using soil mixture theory. This physically consistent approach ensures dimensional coherence and directly links standard input variables (SOC, bulk density, texture) to key volumetric properties such as porosity and hydraulic or thermal parameters. Its implementation is detailed step by step in Table 1. This conceptual clarification helps prevent structural inconsistencies in LSMs by ensuring a physically grounded representation of soil organic matter properties. However, as illustrated in Fig. 3c, this physically consistent formulation also makes the estimation of sensitive to the quality of input data. In particular, uncertainties in SOC, bulk density, or mineral fraction can propagate through the computation steps. One limitation of this approach lies also in the fact that key parameters, such as the SOC-to-SOM conversion and , are not directly observed but are instead estimated using a texture-based PTF model (Ruehlmann, 2020). Although widely used in LSMs, such PTF approximations may reduce accuracy in soils with unusual mineralogical properties. Regardless, the improvements offered by the proposed framework also hold when applied to observational data from natural soils. As shown in Fig. 4, our framework reproduces measured porosity with high accuracy, whereas SOC-based or mineral-only formulations lead to systematic biases, especially in organic-rich soils. In addition, derived from the soil mixture theory are consistent with values reported for peat soils, further supporting the physical realism of the proposed approach. This consistency also reflects the ability of our framework to distinguish soils that have similar SOM content but differ in bulk density, by explicitly accounting for structural variability (Fig. 5). Such differentiation is not captured in previous SOC-based formulations used in LSMs.
This physical behavior of the proposed framework gives further confidence in the choice to use as the main proxy for describing the hydrodynamic parameters of the SOM domain (second section of Table 1). While all the proposed PTFs are based on robust observational datasets and scientifically sound protocols, they rely on measurements taken in peat materials. The assumption that can be assimilated to the bulk density of peats governing theirs hydraulic properties is a strong, yet physically justified choice. As a soil becomes increasingly organic, its SOM content increases, its bulk density ρb decreases, and tends to converge toward ρb. This behavior, illustrated in Fig. 5c, supports the validity of this assumption, especially for SOM-rich soils where the organic domain dominates the fine-earth fraction. The results presented in Figs. 6 and 7 provide also further support for the use of as the main proxy for describing SOM hydrodynamic behavior. When , bom, and are reconstructed using our framework and applied to simulate soil water retention, the resulting curves show improved agreement with observations compared to SOC-based or mineral-only formulations. This improvement is consistent across both SOM-poor and SOM-rich soils, indicating that the underlying assumption linking to the structural state of the organic domain holds across a wide range of soil conditions. However, our approach is most effective at low to moderate soil water suctions. The gains in performance are strongest in the wet to intermediate moisture range, while differences tend to diminish near the wilting point. This behavior is consistent with several binary mixture experiments which show that differences in water retention between mineral-organic mixtures are more evident under low to moderate tension, but tend to converge under high suction (Willaredt et al., 2023). This perhaps reflects the dominance of mineral pore structures in controlling residual water content, regardless of organic composition, or a shift from macropore-dominated retention to finer pore contributions, leading to a convergence of retention behavior across soil types at high matric potentials.
While the proposed framework clearly improves the simulation of soil water retention across a broad range of SOM contents, its performance for predicting ksat is more nuanced (Fig. 8). As reported by Gupta et al. (2021), ksat is intrinsically difficult to model with PTFs, given its high spatial variability and strong dependence on measurement conditions, soil structure, and climatic context. In addition, many ksat values in the SoilKsatDB lack critical metadata such as soil structure, land use, or vegetation cover, despite their known influence on saturated conductivity. The database also includes measurements taken under diverse and sometimes undocumented conditions, with limited information on sampling depth or saturation status. Combined with the fact that ksat can vary by several orders of magnitude within a single site, these limitations introduce substantial uncertainty in model calibration and evaluation. Their work shows that even advanced machine learning approaches suffer from limited transferability across regions and measurement protocols, with substantial drops in predictive accuracy when moving from temperate to tropical settings or from lab to field observations. Furthermore, as emphasized by Morris et al. (2019, 2022) for peat soils, proxies such as bulk density and depth are not sufficient to capture the entire variability of ksat. Accurate prediction requires accounting for additional factors like the degree of humification or even the specific composition of the SOM that are currently beyond the scope of global or regional LSMs. This highlights an inherent limitation in current modeling capabilities. Nonetheless, when focusing on the most SOC-rich soils in the dataset of Gupta et al. (2021), our approach does show a modest improvement in the prediction of ksat compared to the other methods (Fig. 8d). These results confirm that explicitly incorporating and depth into ksat predictions for organic-rich soils can provide added value. While our approach offers a more physical basis for modeling ksat, its predictive performance remains constrained by the limitations of available data and the structural complexity of the soil.
The third section of Table 1 addresses the choice of mixing rules used to compute the bulk soil properties from the mineral and organic components. For porosity, there is no ambiguity. The application of soil mixture theory leads directly to a volume-weighted arithmetic mean, which is both physically justified and analytically derived. In contrast, for the Brooks and Corey (1964) parameters b and ψsat, there is no theoretical or empirical evidence favoring a nonlinear or more complex mixing approach. As already mentioned in Sect. 4.3, to investigate this, we analyzed water retention curves of each sample from the binary mineral-organic mixture datasets of Walczak et al. (2002) and Willaredt et al. (2023). The fitted values of b and ψsat for each mixture showed no consistent trend or deviation that would support an alternative to arithmetic averaging. In the absence of a clear nonlinear relationship, the arithmetic mean remains the most computational time-efficient, parsimonious and transparent choice for these parameters. A geometric mean formulation is adopted for ksat. This choice is supported by both theoretical and empirical studies. Prudic (1991) proposed the geometric mean as a realistic approximation for layered or structured soils with high contrasts in hydraulic properties. Stepanyants and Teodorovich (2003) further demonstrated, using stochastic models, that the geometric mean emerges naturally as the effective conductivity of randomly heterogeneous porous media. Paleologos et al. (1996) shows that, in statistically isotropic and unstructured heterogeneous media, the effective saturated hydraulic conductivity tends toward the geometric mean of the local conductivities. Assuming that mineral-organic soils present such random distributions of hydraulic contrasts, this supports the use of a geometric mean formulation in our framework. More recent experimental work on binary mixtures by Sakaki and Smits (2015) and Rojas et al. (2022) also supports this choice. In both cases, ksat varies non-linearly with the proportion of fine or low-conductivity material, often decreasing exponentially with increasing content. While no single mixing rule captures all configurations, we assume that the geometric mean offers a physically consistent approximation for combining mineral and organic domains in soils, especially when their conductivities differ by several orders of magnitude.
The selection of mixing rules used to compute soil thermal properties can also be discussed, with the exception of volumetric heat capacity, for which we have shown that starting from its physical definition and applying the soil mixture theory leads analytically to an arithmetic mixing rule, similar to what is found for porosity. In contrast, there is no analytical justification for using a specific mixing rule to compute the dry thermal conductivity (λdry). However, experimental data suggest that the arithmetic mean as proposed by Lawrence and Slater (2008) is not appropriate in this case. In particular, the measurements from Arkhangelskaya and Telyatnikova (2023) clearly demonstrate that dry conductivity does not vary linearly with the organic volumetric fraction (Fig. 3c). This means that a nonlinear mixing approach is needed. As proposed by Decharme et al. (2016), a geometric mean provides a simple option that gives reasonable results. Still, we observed that a geo-harmonic mean, which was developed to represent transport through heterogeneous porous materials (Nielson and Rogers, 1982), performs even better in this context. It more accurately captures the decline in conductivity as the proportion of organic matter increases. That said, this remains a modeling choice. More datasets of the same type would be needed to confirm whether this mixing rule should be preferred more generally. Regarding the thermal conductivity of the soil matrix (λs), even though it is not addressed in this study, several lines of evidence from the literature support the use of the geometric mean. Previous studies, including those by Johansen (1977), Farouki (1981), and Peters-Lidard et al. (1998), have shown that this approach provides consistent and physically reasonable estimates across a wide range of soil types.
Unfortunately, the full proposed framework cannot be directly applied in all LSMs, as some of them simulate soil water retention using the van Genuchten (1980) model rather than the Brooks and Corey (1964) formulation. Nevertheless, although the hydrological component is specifically designed for Brooks and Corey-based LSMs, its core principles can also be adapted to models that rely on the van Genuchten (1980) formulation. In particular, the estimation of the true SOM volumetric fraction and the computation of thermal properties remain independent of the retention model and can be directly applied. For the van Genuchten (1980) model parameters, an analogous procedure could be developed. Mineral-only texture-based PTFs calibrated for the van Genuchten (1980) model, such as those of Carsel and Parrish (1988), may be combined with the same mixing rules used in this study for Brooks and Corey parameters. This hypothesis was tested using the evaluation framework developed in this study and applied to porosity predictions (Fig. 9). Results show that combining our framework with a mineral PTF such as Carsel and Parrish (1988), in its continuous form (Decharme et al., 2011) designed for the van Genuchten (1980) model, yields similar or even better performance than using our framework with the mineral PTF of Cosby et al. (1984) developed for the Brooks and Corey (1964) model (Fig. 9 versus Fig. 4). For other soil hydrodynamic parameters, the evaluation framework used here could be readily extended to test equivalent or alternative mixing strategies tailored to the van Genuchten (1980) model, as all required input data are readily available.
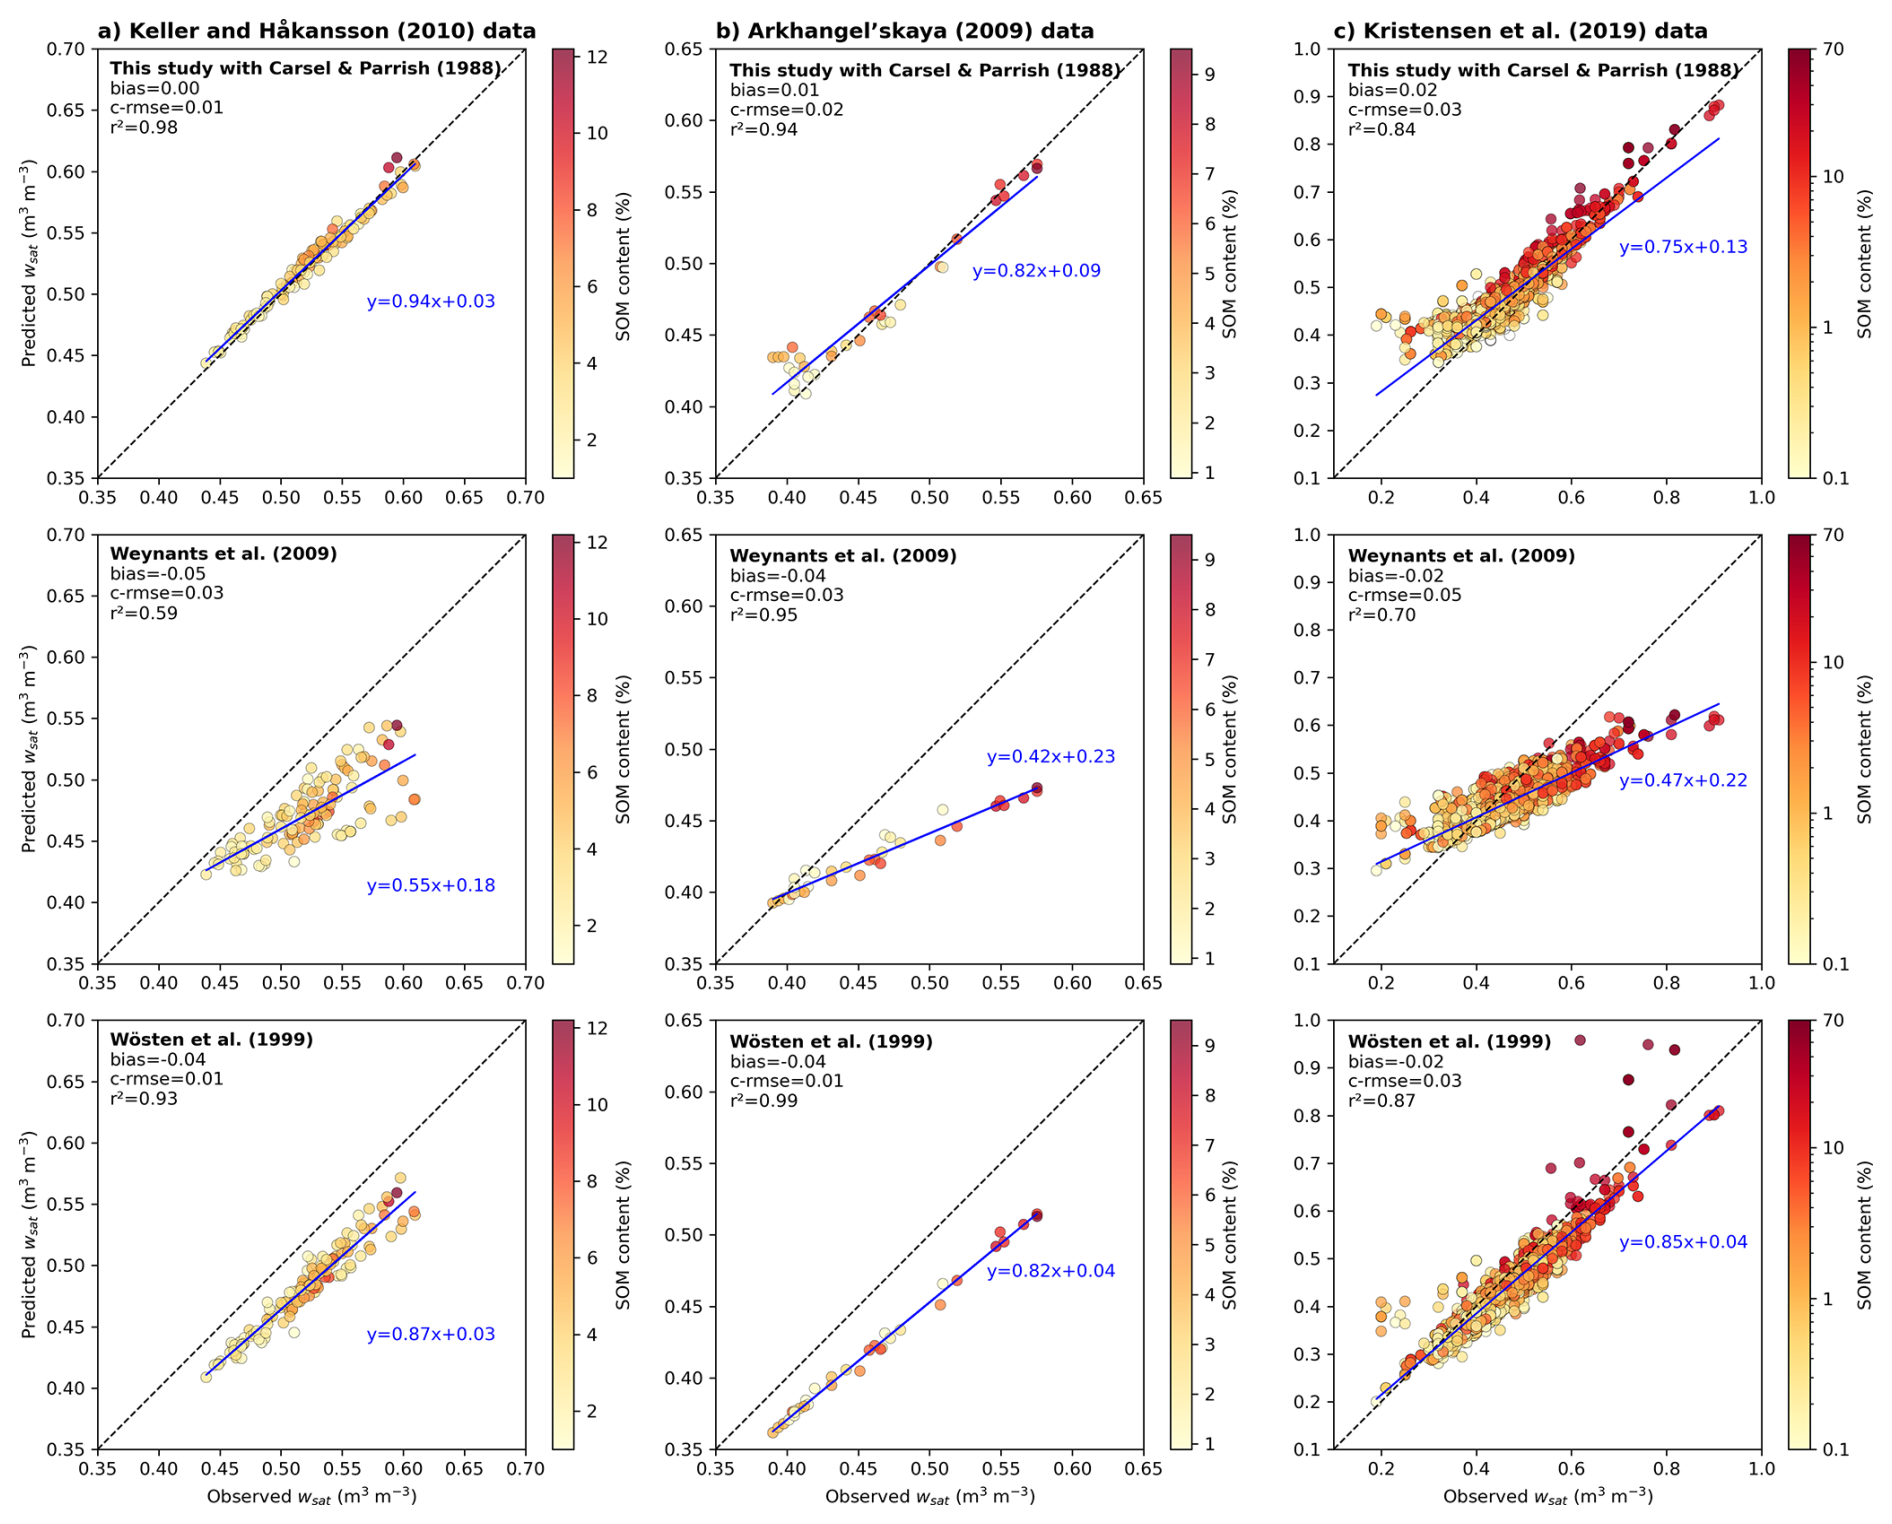
Figure 9Comparison of observed and predicted soil porosity across three in situ datasets, as in Fig. 4, but using PTFs designed for the van Genuchten (1980) model. Each row corresponds to a different prediction method. The first row uses the proposed framework combined with the mineral-based PTF of Carsel and Parrish (1988) in its continuous form (Decharme et al., 2011). The second row applies the continuous PTF of Weynants et al. (2009), which includes bulk density effects. The third row shows results from the continuous PTF of Wösten et al. (1999), which includes both bulk density and SOM content as predictors.
An additional advantage in the van Genuchten (1980) context is that several pedotransfer functions already exist, which, in addition to soil texture, incorporate either bulk density, SOC/SOM content, or both (e.g., Wösten et al., 1999; Weynants et al., 2009; Tóth et al., 2015). This hypothesis is also tested in Fig. 9. The PTF of Weynants et al. (2009), which accounts for bulk density effects, captures part of the observed trend but fails to reproduce the full range of porosity values. The PTF of Wösten et al. (1999), which incorporates both bulk density and SOM content in addition to texture, provides improved results. However, it does not outperform our framework combined with the mineral PTF of Carsel and Parrish (1988). In particular, the Wösten et al. (1999) PTF tends to systematically underestimate porosity, whatever the dataset used. In the SOM-rich soils of the Kristensen et al. (2019) dataset, predicted porosity values show large dispersion compared to observations, suggesting that this PTF is likely not suited for organic-rich or peat soils. We also extended the comparison to soil water retention (Figs. S4 and S5) and saturated hydraulic conductivity (Fig. S6), for which the mixture-theory approach provided equal or better agreement with observations than existing PTFs. The Weynants PTF performed poorly for both variables, while the Wösten PTF gave more promising results but with two clear limitations: a large dispersion at high SOM contents, as also noted for porosity (Fig. 9), and a systematic overestimation of saturated conductivity. These results highlight that, while promising, the continuous PTF of Wösten et al. (1999) would likely require recalibration using for instance the datasets presented in this study.
However, one may argue that the well-documented interactions between organic and mineral components are not captured by mixture theory and would only be represented by PTFs. Numerous studies (e.g., Stewart et al., 1970; Adams, 1973; Raats, 1987; Rühlmann et al., 2006; Reynolds et al., 2020) have demonstrated that soil bulk density, particle density, and porosity can be expressed as the sum of the effective volumes of mineral and organic domains, highlighting that these interactions are indeed included in mixture theory. This theory provides mathematical formulations conceptually comparable to PTFs, which rely on empirical regressions between texture, organic matter, and hydraulic properties, while mixture theory captures these relationships through conservation-based analytical expressions. The two approaches should therefore be considered complementary rather than exclusive. Moreover, for porosity our mixture-theory approach provides a closer match to observations than existing PTFs (Fig. 9), and similar behavior is found for retention and saturated conductivity (Figs. S4 to S6), indicating that mixture theory can serve as a useful complement or alternative to existing PTFs. For thermal properties, the situation differs. Conduction models (Johansen, 1975; De Vries, 1974; Balland and Arp, 2005) require the volumetric fractions of each soil constituent, which makes mixture theory not only suitable but indispensable in this domain.
The aim of this study was to propose a physically consistent framework to represent the influence of soil organic matter on key physical properties required in LSMs. This is the case for instance for the Community Land Model (CLM, Lawrence et al., 2019) of the National Center for Atmospheric Research (NCAR), the Noah-Multiparameterization model (Noah-MP, Niu et al., 2011) of the National Centers for Environmental Prediction (NCEP), the Joint UK Land Environment Simulator model (JULE, Best et al., 2011) of the met-Office, or the Interaction Soil Biosphere Atmosphere model (ISBA, Decharme et al., 2019) of Météo-France. In these models, the volumetric fraction of organic matter () is a critical quantity used to estimate soil porosity, thermal conductivity, heat capacity, and hydrodynamic parameters. Since global databases typically provide SOC content rather than total SOM, many LSMs rely on empirical formulations derived from the pioneer work of Lawrence and Slater (2008) to infer from SOC content only. Although these formulations (Eqs. 1, 2 and 3) are mathematically valid, they are physically flawed. The numerator is expressed in mass of carbon per unit soil volume, whereas the denominator represents the mass of organic matter per unit soil volume. This subtle confusion between SOC and SOM contents by weight leads to a fundamental misrepresentation of soil composition.
To address this issue, we proposed a framework that explicitly accounts for the volumetric composition of the soil as mixture of organic and mineral components. is derived from its mass content, the dry bulk density, and the bulk density of the organic matter component. This latter is not empirically prescribed, but computed from the soil mixture theory as a function of the total soil bulk density and the mineral bulk density, both of which can be estimated from standard inputs or pedotransfer functions. In summary, the derivation of from the soil mixture theory ensures internal consistency between SOC, SOM, and volumetric properties. The results of this study show that the proposed formulation is not only theoretically consistent, but also performs reliably across a wide range of real-world conditions. It yields improved agreement with in situ measurements of soil porosity and water retention, especially in SOM-rich soils where previous formulations tend to produce systematic biases. A key advantage of the proposed framework is that it applies a unified and physically consistent treatment across porosity, hydraulic, and thermal properties, using a single theoretical basis. Moreover, it does not rely on any tuning or soil-specific calibration parameters.
Based on this volumetric formulation, we derived a physically consistent scheme to compute key soil properties as a mixture of mineral and organic domains. For the Brooks and Corey (1964) model, the hydrodynamic parameters of the organic matter domain are predicted from the apparent bulk density of SOM, with the saturated hydraulic conductivity also depending on depth. These parameters are then combined with standard mineral soil estimates using arithmetic or geometric mixing rules. For thermal properties, the framework provides physically consistent expressions based on mass-volume relationships for the volumetric heat capacity, while experimental data support non linear mixing for the dry thermal conductivity. Indeed, the choice of mixing rules is guided by theoretical considerations and supported by experimental data, with arithmetic averaging used for porosity and heat capacity, and geometric or geo-harmonic means for conductivity parameters. Importantly, the formulation is designed to work with standard soil inputs, including SOC content, texture, and dry bulk density, which are available in global databases such as SoilGrids (Poggio et al., 2021) or HWSD (FAO, 2012; FAO and IIASA, 2023). This makes the framework directly applicable in LSMs at regional or global scales. This fact is supported by the study results. Indeed, the framework was evaluated using both experimental binary mixtures and in situ datasets. It shows consistent improvements over existing approaches for predicting soil porosity and water retention curves across a wide range of SOM contents. For saturated hydraulic conductivity, performance remains limited overall, but non negligible improvements are observed in SOM-rich soils.
While the proposed parameterizations were developed for the Brooks and Corey (1964) model, the underlying structure of the framework can be extended to the van Genuchten (1980) formulation. As shown in the discussion, applying the same mixing principles to van Genuchten-based PTFs yields comparable or even improved results, particularly when combined with mineral PTFs such as that of Carsel and Parrish (1988). In contrast, continuous PTFs directly calibrated for van Genuchten parameters, such as those of Wösten et al. (1999), may require recalibration, especially for organic-rich or peat soils where predictions tend to show systematic biases or larger dispersion. Further development is needed to establish a framework for the van Genuchten (1980) model with the same level of physical consistency and robustness demonstrated here for the Brooks and Corey formulation. This effort could be facilitated by the collection of observational datasets compiled in this study, which provide a solid basis for testing and calibrating mixing schemes across a wide range of soil conditions.
The next step will be addressed in a companion paper, where the proposed framework is implemented and evaluated within a global LSM. While the improvements in physical consistency are clear, the overall impact on model outputs could remain moderate. This hypothesis is supported by several factors. First, outside the near-saturation range, the previous and proposed formulations produce similar water retention behavior. Since many soils rarely reach full saturation, especially at large scales, the differences in hydrodynamic properties may have limited influence on simulated fluxes. Second, although previous approaches produce biased estimates of the organic volumetric fraction, they still capture part of the thermal insulating effect of SOM on soil temperature. Third, compensating errors in physically inconsistent formulations can, in some cases, lead to reasonable results despite conceptual flaws. Indeed, results obtained with binary mixture data show that the use of a fixed bulk density together with SOC-based estimates leads to partial error compensation, resulting in seemingly acceptable predictions of the organic volumetric fraction at intermediate SOM levels.
Despite this, results from both the previous and proposed formalisms diverge more strongly in SOM-rich soils, where their limitations become more apparent. This highlights the importance of accurately representing the volumetric fraction and intrinsic properties of SOM in soils with high organic matter content. More generally, regardless of SOM content, the proposed framework offers a physically grounded and internally consistent solution to a longstanding issue in LSMs. It provides a robust method for deriving the volumetric fraction and intrinsic properties of SOM from standard soil inputs. Now that a physically robust framework is available and requires no additional data or calibration to improve the representation of soil organic matter physical properties in LSMs, maintaining inconsistent parameterisations is no longer justifiable. The next step will be to test its integration in a full LSM in order to assess its added value in realistic land-atmosphere simulations. In the companion paper, the proposed approach will be implemented into the ISBA LSM (Decharme et al., 2019; Decharme and Colin, 2025). This model provides a suitable platform for global-scale testing, allowing the framework to be evaluated under a wide range of climate and soil conditions. Input data for soil texture, SOC content, and dry bulk density will be derived from the SoilGrids database, ensuring compatibility with standard global datasets. This implementation will make it possible to assess not only the impact on individual soil properties, but also on land surface fluxes and their coupling with the land surface hydrology.
This next step will provide a clear baseline for land-surface physics and a necessary preliminary stage before attempting any more complex prognostic coupling to a dynamic soil carbon scheme, which will in turn deserve specific consideration. The framework proposed in this study, which assumes a time-constant bulk soil density to determine the bulk density of the organic domain, is not, in its current form, directly applicable in LSMs that would couple it with an interactive simulation of the soil carbon cycle. Indeed, attempting to dynamically couple the organic carbon mass simulated by an LSM with our diagnostic relations between ρb, and raises questions that are outside the scope of this work. On the one hand, if such a coupling were attempted, and in order to avoid any potential circularity, a single structural variable (e.g. ρb or ) should be prognostic, with the other diagnosed using the mixing relations presented here. On the other hand, the desirability of such a coupling can be questioned given the structural and parametric uncertainties of current soil carbon schemes. A tight coupling with soil physics could add uncertainty to the simulated physical state of the land surface and generate undesired feedbacks on the carbon cycle. These points should be studied specifically before any coupling is proposed. Nevertheless, by providing a consistent and physically based link between organic and mineral components of the soil, the present framework offers a solid basis for future developments toward more integrated representations of soil processes in land surface models.
All Python 3-compatible scripts used in this study, including the implementation of the proposed framework, data processing routines, and figure generation codes, are publicly available at https://doi.org/10.5281/zenodo.15837794 (Decharme, 2025).
This study uses seven datasets. The first four are directly available in raw numerical form in the original publications as detailed below: (1) the sand-peat binary mixtures with porosity measurements of Walczak et al. (2002); (2) the compost-brick mixtures used to model Technosols of Willaredt and Nehls (2021); (3) the sand-peat mixtures with thermal diffusivity data of Arkhangelskaya and Telyatnikova (2023); (4) the Nordic agricultural soil profiles with bulk density and texture data of Keller and Håkansson (2010); (5) the Russian soil profiles with thermal and structural measurements of Arkhangel'skaya (2009). The remaining two datasets are available from public data servers: (6) the harmonized European profile database (SPADE14) of Kristensen et al. (2019), available at https://doi.org/10.5194/soil-5-289-2019 and from the EU Soil Data Centre (ESDAC) at https://esdac.jrc.ec.europa.eu/content/spade-14 (last access: 26 November 2025); (7) the “sol_hydro.pnts_horizons” version of the global SoilKsatDB for saturated hydraulic conductivity of Gupta et al. (2020), accessible via Zenodo at https://doi.org/10.5281/zenodo.4541586.
The supplement related to this article is available online at https://doi.org/10.5194/gmd-18-9349-2025-supplement.
The author has declared that there are no competing interests.
Publisher’s note: Copernicus Publications remains neutral with regard to jurisdictional claims made in the text, published maps, institutional affiliations, or any other geographical representation in this paper. While Copernicus Publications makes every effort to include appropriate place names, the final responsibility lies with the authors. Views expressed in the text are those of the authors and do not necessarily reflect the views of the publisher.
The author gratefully acknowledges the Centre National de Recherches Météorologiques (CNRM) of Météo-France and the Centre National de la Recherche Scientifique (CNRS) for their support. Special thanks are extended to Patrick Le Moigne, David Saint-Martin, and Christine Delire for their valuable feedback and constructive comments, which greatly contributed to improving the quality of this study. The authors would like to thank anonymous reviewers for their positive feedback and constructive comments on this study.
This research has been mainly supported by the ANR – France 2030 as part of the PEPR TRACCS program (grant no. ANR-22-EXTR-0009). This work also received partial support from the European Union (Horizon 2020, grant no. 101003536, ESM2025 Earth System Models for the Future) and from the French National Research Agency (ANR) through Arctic-Peat (grant no. ANR-20-CE01-0001) and PEACE within the FairCarboN exploratory program of France 2030 (grant no. ANR-22-PEXF-0011).
This paper was edited by Yuanchao Fan and reviewed by Jan De Pue and one anonymous referee.
Adams, W. A.: The effect of organic matter on the bulk and true densities of some uncultivated podzolic soils, Journal of Soil Science, 24, 10–17, https://doi.org/10.1111/j.1365-2389.1973.tb00737.x, 1973. a, b, c
Arkhangel'skaya, T. A.: Parameterization and mathematical modeling of the dependence of soil thermal diffusivity on the water content, Eurasian Soil Science, 42, https://doi.org/10.1134/S1064229309020070, 2009. a, b, c, d, e, f
Arkhangelskaya, T. A. and Gvozdkova, A. A.: Thermal diffusivity of peat-sand mixtures, in: IOP Conference Series: Earth and Environmental Science, vol. 368, https://doi.org/10.1088/1755-1315/368/1/012005, 2019. a
Arkhangelskaya, T. A. and Telyatnikova, E. V.: Thermal Diffusivity of Peat-Sand Mixtures with Different Peat and Sand Contents, Eurasian Soil Science, 56, https://doi.org/10.1134/S1064229322602463, 2023. a, b, c, d, e, f, g, h, i, j
Balland, V. and Arp, P. A.: Modeling soil thermal conductivities over a wide range of conditions, Journal of Environmental Engineering and Science, 4, https://doi.org/10.1139/s05-007, 2005. a, b
Best, M. J., Pryor, M., Clark, D. B., Rooney, G. G., Essery, R. L. H., Ménard, C. B., Edwards, J. M., Hendry, M. A., Porson, A., Gedney, N., Mercado, L. M., Sitch, S., Blyth, E., Boucher, O., Cox, P. M., Grimmond, C. S. B., and Harding, R. J.: The Joint UK Land Environment Simulator (JULES), model description – Part 1: Energy and water fluxes, Geosci. Model Dev., 4, 677–699, https://doi.org/10.5194/gmd-4-677-2011, 2011. a
Blair, T. C. and McPherson, J. G.: Grain-size and textural classification of coarse sedimentary particles, Journal of Sedimentary Research, 69, 6–19, https://doi.org/10.2110/jsr.69.6, 1999. a
Blyth, E. M., Arora, V. K., Clark, D. B., Dadson, S. J., De Kauwe, M. G., Lawrence, D. M., Melton, J. R., Pongratz, J., Turton, R. H., Yoshimura, K., and Yuan, H.: Advances in Land Surface Modelling, Current Climate Change Reports, 7, 45–71, https://doi.org/10.1007/s40641-021-00171-5, 2021. a
Boelter, D.: Important physical properties of peat materials, in: Proceedings, third internationalpeat congress; 18–23 August 1968, Quebec, Canada, Department of Engery, Minds and Resources and National Research Council of Canada, 150–154, https://research.fs.usda.gov/treesearch/12921 (last access: 26 November 2025), 1968. a, b, c, d, e
Boelter, D. H.: Physical Properties of Peats as Related to Degree of Decomposition, Soil Science Society of America Journal, 33, 606–609, https://doi.org/10.2136/sssaj1969.03615995003300040033x, 1969. a, b
Boggie, R.: Moisture characteristics of some peat-sand mixtures, Scientific Horticulture, 22, 87–91, https://www.jstor.org/stable/45128182 (last access: 26 November 2025), 1970. a
Bonan, G. B. and Doney, S. C.: Climate, ecosystems, and planetary futures: The challenge to predict life in Earth system models, Science, 359, https://doi.org/10.1126/science.aam8328, 2018. a
Brooks, R.-H. and Corey, A.-T.: Hydraulic properties of porous media, Hydrology Papers, Colorado State University, Fort Collins CO, 3, 27 pp., http://hdl.handle.net/10217/61288 (last access: 26 November 2025), 1964. a, b, c, d, e, f, g, h, i, j, k, l, m, n, o, p, q, r
Buol, S. W., Southard, R. J., Graham, R. C., and McDaniel, P. A.: Soil Genesis and Classification, Wiley, ISBN 9780813807690, https://doi.org/10.1002/9780470960622, 2011. a
Campbell, G. S.: A simple method for determining unsaturated conductivity from moisture retention data, Soil Science, 117, https://doi.org/10.1097/00010694-197406000-00001, 1974. a, b
Carsel, R. F. and Parrish, R. S.: Developing joint probability distributions of soil water retention characteristics, Water Resources Research, 24, 755–769, https://doi.org/10.1029/WR024i005p00755, 1988. a, b, c, d, e
Chadburn, S., Burke, E., Essery, R., Boike, J., Langer, M., Heikenfeld, M., Cox, P., and Friedlingstein, P.: An improved representation of physical permafrost dynamics in the JULES land-surface model, Geosci. Model Dev., 8, 1493–1508, https://doi.org/10.5194/gmd-8-1493-2015, 2015. a
Chen, L., Li, Y., Chen, F., Barr, A., Barlage, M., and Wan, B.: The incorporation of an organic soil layer in the Noah-MP land surface model and its evaluation over a boreal aspen forest, Atmos. Chem. Phys., 16, 8375–8387, https://doi.org/10.5194/acp-16-8375-2016, 2016. a
Chen, Y. Y., Yang, K., Tang, W. J., Qin, J., and Zhao, L.: Parameterizing soil organic carbon's impacts on soil porosity and thermal parameters for Eastern Tibet grasslands, Science China Earth Sciences, 55, https://doi.org/10.1007/s11430-012-4433-0, 2012. a, b, c, d, e, f, g, h
Clapp, R. B. and Hornberger, G. M.: Empirical equations for some soil hydraulic properties, Water Resources Research, 14, 601–604, https://doi.org/10.1029/WR014i004p00601, 1978. a, b, c, d, e
Cosby, B. J., Hornberger, G. M., Clapp, R. B., and Ginn, T. R.: A Statistical Exploration of the Relationships of Soil Moisture Characteristics to the Physical Properties of Soils, Water Resources Research, 20, 682–690, https://doi.org/10.1029/WR020i006p00682, 1984. a, b, c, d, e, f, g, h, i, j, k, l, m, n, o, p, q, r, s, t
Cuynet, A., Salmon, E., Lopéz-Blanco, E., Goeckede, M., Ikawa, H., Kobayashi, H., Lohila, A., and Ottlé, C.: Enhanced prescription of soil organic and mineral content in the ORCHIDEE LSM to better simulate soil temperatures: application at nine high-latitude GEM and FLUXNET sites, Authorea, Wiley, https://doi.org/10.22541/au.173748260.01626603/v1, 2025. a
Dankers, R., Burke, E. J., and Price, J.: Simulation of permafrost and seasonal thaw depth in the JULES land surface scheme, The Cryosphere, 5, 773–790, https://doi.org/10.5194/tc-5-773-2011, 2011. a
Decharme, B.: Supporting information for the study “A process-based modeling of soil organic matter physical properties for land surface models – Part 1: Soil mixture theory”, Zenodo [data set], https://doi.org/10.5281/zenodo.15837794, 2025. a
Decharme, B. and Colin, J.: Influence of floodplains and groundwater dynamics on the present-day climate simulated by the CNRM climate model, Earth Syst. Dynam., 16, 729–752, https://doi.org/10.5194/esd-16-729-2025, 2025. a
Decharme, B., Boone, A., Delire, C., and Noilhan, J.: Local evaluation of the Interaction between Soil Biosphere Atmosphere soil multilayer diffusion scheme using four pedotransfer functions, Journal of Geophysical Research Atmospheres, 116, https://doi.org/10.1029/2011JD016002, 2011. a, b
Decharme, B., Brun, E., Boone, A., Delire, C., Le Moigne, P., and Morin, S.: Impacts of snow and organic soils parameterization on northern Eurasian soil temperature profiles simulated by the ISBA land surface model, The Cryosphere, 10, 853–877, https://doi.org/10.5194/tc-10-853-2016, 2016. a, b, c, d, e, f, g, h, i, j, k, l, m
Decharme, B., Delire, C., Minvielle, M., Colin, J., Vergnes, J., Alias, A., Saint‐Martin, D., Séférian, R., Sénési, S., and Voldoire, A.: Recent Changes in the ISBA‐CTRIP Land Surface System for Use in the CNRM‐CM6 Climate Model and in Global Off‐Line Hydrological Applications, Journal of Advances in Modeling Earth Systems, 11, 1207–1252, https://doi.org/10.1029/2018MS001545, 2019. a, b
Deeb, M., Grimaldi, M., Lerch, T. Z., Pando, A., Podwojewski, P., and Blouin, M.: Influence of Organic Matter Content on Hydro-Structural Properties of Constructed Technosols, Pedosphere, 26, 486–498, https://doi.org/10.1016/S1002-0160(15)60059-5, 2016. a
FAO: Harmonized World Soil Database (version 1.2), https://www.fao.org/soils-portal/data-hub/soil-maps-and-databases/harmonized-world-soil-database-v12/en/ (last access: 26 November 2025), 2012. a, b, c
FAO and IIASA: Harmonized World Soil Database version 2.0, FAO; International Institute for Applied Systems Analysis (IIASA), ISBN 978-92-5-137499-3, https://doi.org/10.4060/cc3823en, 2023. a, b, c
Farouki, O. T.: Thermal Properties of Soils – CRREL Monograph, US Army Cold Regions Research and Engineering Laboratory, 11, https://usace.contentdm.oclc.org/digital/collection/p266001coll1/id/6302 (last access: 26 November 2025), 1981. a, b, c, d, e, f, g, h, i, j, k, l, m
Gaillard, R., Peylin, P., Cadule, P., Bastrikov, V., Chéruy, F., Cuynet, A., Ghattas, J., Zhu, D., and Guenet, B.: Arctic soil carbon insulation averts large spring cooling from surface–atmosphere feedbacks, Proceedings of the National Academy of Sciences, 122, e2410226122, https://doi.org/10.1073/pnas.2410226122, 2025. a
Guimberteau, M., Zhu, D., Maignan, F., Huang, Y., Yue, C., Dantec-Nédélec, S., Ottlé, C., Jornet-Puig, A., Bastos, A., Laurent, P., Goll, D., Bowring, S., Chang, J., Guenet, B., Tifafi, M., Peng, S., Krinner, G., Ducharne, A., Wang, F., Wang, T., Wang, X., Wang, Y., Yin, Z., Lauerwald, R., Joetzjer, E., Qiu, C., Kim, H., and Ciais, P.: ORCHIDEE-MICT (v8.4.1), a land surface model for the high latitudes: model description and validation, Geosci. Model Dev., 11, 121–163, https://doi.org/10.5194/gmd-11-121-2018, 2018. a
Gupta, S., Hengl, T., Lehmann, P., Bonetti, S., and Or, D.: SoilKsatDB: global compilation of soil saturated hydraulic conductivity measurements for geoscience applications (v0.3), Zenodo [data set], https://doi.org/10.5281/zenodo.4541586, 2020. a, b
Gupta, S., Hengl, T., Lehmann, P., Bonetti, S., and Or, D.: SoilKsatDB: global database of soil saturated hydraulic conductivity measurements for geoscience applications, Earth Syst. Sci. Data, 13, 1593–1612, https://doi.org/10.5194/essd-13-1593-2021, 2021. a, b, c, d, e, f, g, h, i, j
He, H., He, D., Jin, J., Smits, K. M., Dyck, M., Wu, Q., Si, B., and Lv, J.: Room for improvement: A review and evaluation of 24 soil thermal conductivity parameterization schemes commonly used in land-surface, hydrological, and soil-vegetation-atmosphere transfer models, Earth-Science Reviews, 211, 103419, https://doi.org/10.1016/j.earscirev.2020.103419, 2020. a
Hossain, M., Chen, W., and Zhang, Y.: Bulk density of mineral and organic soils in the Canada’s arctic and sub-arctic, Information Processing in Agriculture, 2, 183–190, https://doi.org/10.1016/j.inpa.2015.09.001, 2015. a
Johansen, O.: Thermal Conductivity of Soils, Tech. rep., US Dept of the Army, https://www.researchgate.net/publication/235140845_Thermal_Conductivity_of_Soils (last access: 26 November 2025), 1977. a, b, c
Keller, T. and Håkansson, I.: Estimation of reference bulk density from soil particle size distribution and soil organic matter content, Geoderma, https://doi.org/10.1016/j.geoderma.2009.11.013, 2010. a, b, c, d, e, f, g, h
Kristensen, J. A., Balstrøm, T., Jones, R. J. A., Jones, A., Montanarella, L., Panagos, P., and Breuning-Madsen, H.: Development of a harmonised soil profile analytical database for Europe: a resource for supporting regional soil management, SOIL, 5, 289–301, https://doi.org/10.5194/soil-5-289-2019, 2019. a, b, c, d, e, f, g, h, i, j
Lawrence, D. M. and Slater, A. G.: Incorporating organic soil into a global climate model, Climate Dynamics, 30, https://doi.org/10.1007/s00382-007-0278-1, 2008. a, b, c, d, e, f, g, h, i, j, k, l, m, n, o, p, q, r, s, t, u, v, w, x, y, z, aa, ab, ac, ad, ae, af, ag, ah, ai, aj, ak, al, am, an, ao, ap, aq, ar
Lawrence, D. M., Fisher, R. A., Koven, C. D., Oleson, K. W., Swenson, S. C., Bonan, G., Collier, N., Ghimire, B., van Kampenhout, L., Kennedy, D., Kluzek, E., Lawrence, P. J., Li, F., Li, H., Lombardozzi, D., Riley, W. J., Sacks, W. J., Shi, M., Vertenstein, M., Wieder, W. R., Xu, C., Ali, A. A., Badger, A. M., Bisht, G., van den Broeke, M., Brunke, M. A., Burns, S. P., Buzan, J., Clark, M., Craig, A., Dahlin, K., Drewniak, B., Fisher, J. B., Flanner, M., Fox, A. M., Gentine, P., Hoffman, F., Keppel-Aleks, G., Knox, R., Kumar, S., Lenaerts, J., Leung, L. R., Lipscomb, W. H., Lu, Y., Pandey, A., Pelletier, J. D., Perket, J., Randerson, J. T., Ricciuto, D. M., Sanderson, B. M., Slater, A., Subin, Z. M., Tang, J., Thomas, R. Q., Val Martin, M., and Zeng, X.: The Community Land Model Version 5: Description of New Features, Benchmarking, and Impact of Forcing Uncertainty, Journal of Advances in Modeling Earth Systems, 11, https://doi.org/10.1029/2018MS001583, 2019. a
Lennartz, B. and Liu, H.: Hydraulic functions of peat soils and ecosystem service, Frontiers in Environmental Science, 7, https://doi.org/10.3389/fenvs.2019.00092, 2019. a, b, c, d, e, f, g
Letts, M. G., Comer, N. T., Roulet, N. T., Skarupa, M. R., and Verseghy, D. L.: Parametrization of peatland hydraulic properties for the Canadian land surface scheme, Atmosphere – Ocean, 38, https://doi.org/10.1080/07055900.2000.9649643, 2000. a, b, c, d, e, f, g, h
Liu, H. and Lennartz, B.: Hydraulic properties of peat soils along a bulk density gradient – A meta study, Hydrological Processes, 33, https://doi.org/10.1002/hyp.13314, 2019. a, b, c, d, e, f, g, h, i, j, k, l, m, n
Liu, H., Price, J., Rezanezhad, F., and Lennartz, B.: Centennial-Scale Shifts in Hydrophysical Properties of Peat Induced by Drainage, Water Resources Research, 56, https://doi.org/10.1029/2020WR027538, 2020. a, b
Liu, H., Rezanezhad, F., and Lennartz, B.: Impact of land management on available water capacity and water storage of peatlands, Geoderma, 406, https://doi.org/10.1016/j.geoderma.2021.115521, 2022. a, b, c, d, e
Liu, Z., Ballantyne, A. P., and Cooper, L. A.: Biophysical feedback of global forest fires on surface temperature, Nature Communications, 10, 1–9, https://doi.org/10.1038/s41467-018-08237-z, 2019. a
Manabe, S.: Climate and the ocean circulation, Monthly Weather Review, 97, 739–774, https://doi.org/10.1175/1520-0493(1969)097<0739:CATOC>2.3.CO;2, 1969. a
Morel, X., Decharme, B., Delire, C., Krinner, G., Lund, M., Hansen, B. U., and Mastepanov, M.: A New Process-Based Soil Methane Scheme: Evaluation Over Arctic Field Sites With the ISBA Land Surface Model, Journal of Advances in Modeling Earth Systems, 11, 293–326, https://doi.org/10.1029/2018MS001329, 2019. a
Morris, P. J., Baird, A. J., Eades, P. A., and Surridge, B. W.: Controls on Near‐Surface Hydraulic Conductivity in a Raised Bog, Water Resources Research, 55, https://doi.org/10.1029/2018WR024566, 2019. a
Morris, P. J., Davies, M. L., Baird, A. J., Balliston, N., Bourgault, M. A., Clymo, R. S., Fewster, R. E., Furukawa, A. K., Holden, J., Kessel, E., Ketcheson, S. J., Kløve, B., Larocque, M., Marttila, H., Menberu, M. W., Moore, P. A., Price, J. S., Ronkanen, A. K., Rosa, E., Strack, M., Surridge, B. W., Waddington, J. M., Whittington, P., and Wilkinson, S. L.: Saturated Hydraulic Conductivity in Northern Peats Inferred From Other Measurements, Water Resources Research, 58, https://doi.org/10.1029/2022WR033181, 2022. a, b, c, d, e, f, g, h, i, j
Nielson, K. and Rogers, V.: Mathematical model for radon diffusion in earthen materials, Tech. rep., Pacific Northwest National Laboratory (PNNL), Richland, WA (United States), https://doi.org/10.2172/6678584, 1982. a, b, c, d
Niu, G. Y., Yang, Z. L., Mitchell, K. E., Chen, F., Ek, M. B., Barlage, M., Kumar, A., Manning, K., Niyogi, D., Rosero, E., Tewari, M., and Xia, Y.: The community Noah land surface model with multiparameterization options (Noah-MP): 1. Model description and evaluation with local-scale measurements, Journal of Geophysical Research Atmospheres, 116, https://doi.org/10.1029/2010JD015139, 2011. a
Noilhan, J. and Planton, S.: A Simple Parameterization of Land Surface Processes for Meteorological Models, Monthly Weather Review, 117, 536–549, https://doi.org/10.1175/1520-0493(1989)117<0536:aspols>2.0.co;2, 1989. a
Paleologos, E. K., Neuman, S. P., and Tartakovsky, D.: Effective hydraulic conductivity of bounded, strongly heterogeneous porous media, Water Resources Research, 32, 1333–1341, https://doi.org/10.1029/95WR02712, 1996. a
Peters-Lidard, C. D., Blackburn, E., Liang, X., and Wood, E. F.: The effect of soil thermal conductivity parameterization on surface energy fluxes and temperatures, Journal of the Atmospheric Sciences, 55, https://doi.org/10.1175/1520-0469(1998)055<1209:TEOSTC>2.0.CO;2, 1998. a, b, c, d, e, f, g, h, i
Poggio, L., de Sousa, L. M., Batjes, N. H., Heuvelink, G. B. M., Kempen, B., Ribeiro, E., and Rossiter, D.: SoilGrids 2.0: producing soil information for the globe with quantified spatial uncertainty, SOIL, 7, 217–240, https://doi.org/10.5194/soil-7-217-2021, 2021. a, b, c
Pribyl, D. W.: A critical review of the conventional SOC to SOM conversion factor, Geoderma, 156, 75–83, https://doi.org/10.1016/j.geoderma.2010.02.003, 2010. a, b
Prudic, D.: Estimates of hydraulic conductivity from aquifer-test analyses and specific-capacity data, Gulf Coast Regional Aquifer Systems, south-central United States, Tech. rep., U.S. Geological Survey, https://doi.org/10.3133/wri904121, 1991. a, b, c
Raats, P. A.: Applications of the theory of mixtures in soil science, Mathematical Modelling, 9, https://doi.org/10.1016/0270-0255(87)90003-0, 1987. a, b
Rawls, W., Nemes, A., and Pachepsky, Y.: Effect of soil organic carbon on soil hydraulic properties, Developments in Soil Science, 30, 95–114, https://doi.org/10.1016/S0166-2481(04)30006-1, 2004. a
Redding, T. E. and Devito, K. J.: Particle densities of wetland soils in northern Alberta, Canada, Canadian Journal of Soil Science, 86, https://doi.org/10.4141/S05-061, 2006. a
Reynolds, W. D., Nurse, R. E., Phillips, L. A., Drury, C. F., Yang, X. M., and Page, E. R.: Characterizing mass–volume–density–porosity relationships in a sandy loam soil amended with compost, Canadian Journal of Soil Science, 100, https://doi.org/10.1139/cjss-2019-0149, 2020. a, b
Robinson, D. A., Thomas, A., Reinsch, S., Lebron, I., Feeney, C. J., Maskell, L. C., Wood, C. M., Seaton, F. M., Emmett, B. A., and Cosby, B. J.: Analytical modelling of soil porosity and bulk density across the soil organic matter and land-use continuum, Scientific Reports, 12, 7085, https://doi.org/10.1038/s41598-022-11099-7, 2022. a
Rohatgi, A.: WebPlotDigitizer – version 4.8, https://apps.automeris.io/wpd4/ (last access: 26 November 2025), 2020. a
Rojas, J. P., Ruge, J. C., and Carrillo, G. A.: Unsaturated Hydraulic Conductivity in Composite Porous Media, Applied Sciences (Switzerland), 12, https://doi.org/10.3390/app12189058, 2022. a
Ruehlmann, J.: Soil particle density as affected by soil texture and soil organic matter: 1. Partitioning of SOM in conceptional fractions and derivation of a variable SOC to SOM conversion factor, Geoderma, 375, https://doi.org/10.1016/j.geoderma.2020.114542, 2020. a, b, c, d, e, f, g, h, i, j, k, l
Ruehlmann, J. and Körschens, M.: Calculating the Effect of Soil Organic Matter Concentration on Soil Bulk Density, Soil Science Society of America Journal, 73, 876–885, https://doi.org/10.2136/sssaj2007.0149, 2009. a
Ruehlmann, J. and Körschens, M.: Soil particle density as affected by soil texture and soil organic matter: 2. Predicting the effect of the mineral composition of particle-size fractions, Geoderma, 375, https://doi.org/10.1016/j.geoderma.2020.114543, 2020. a, b
Rühlmann, J., Körschens, M., and Graefe, J.: A new approach to calculate the particle density of soils considering properties of the soil organic matter and the mineral matrix, Geoderma, 130, https://doi.org/10.1016/j.geoderma.2005.01.024, 2006. a, b, c, d
Sakaki, T. and Smits, K. M.: Water Retention Characteristics and Pore Structure of Binary Mixtures, Vadose Zone Journal, 14, https://doi.org/10.2136/vzj2014.06.0065, 2015. a
Schjønning, P., McBride, R. A., Keller, T., and Obour, P. B.: Predicting soil particle density from clay and soil organic matter contents, Geoderma, 286, https://doi.org/10.1016/j.geoderma.2016.10.020, 2017. a
Schwärzel, K., Renger, M., Sauerbrey, R., and Wessolek, G.: Soil physical characteristics of peat soils, Journal of Plant Nutrition and Soil Science, 165, https://doi.org/10.1002/1522-2624(200208)165:4<479::AID-JPLN479>3.0.CO;2-8, 2002. a
Stepanyants, Y. A. and Teodorovich, E. V.: Effective hydraulic conductivity of a randomly heterogeneous porous medium, Water Resources Research, 39, https://doi.org/10.1029/2001WR000366, 2003. a, b, c
Stewart, V. I., Adams, W. A., and Abdulla, H. H.: Quantitative pedological studies on soils derived from Silurian mudstones. 2. The relationship between stone content and apparent density of the fine earth, Journal of Soil Science, 21, 248–255, https://doi.org/10.1111/j.1365-2389.1970.tb01174.x, 1970. a, b
Sun, J., Chen, Y., Yang, K., Lu, H., Zhao, L., and Zheng, D.: Influence of Organic Matter on Soil Hydrothermal Processes in the Tibetan Plateau: Observation and Parameterization, Journal of Hydrometeorology, 22, https://doi.org/10.1175/JHM-D-21-0059.1, 2021. a
Tóth, B., Weynants, M., Nemes, A., Makó, A., Bilas, G., and Tóth, G.: New generation of hydraulic pedotransfer functions for Europe, European Journal of Soil Science, 66, https://doi.org/10.1111/ejss.12192, 2015. a, b
USDA: Soil Taxonomy: A Basic System of Soil Classification for Making and Interpreting Soil Surveys, 2nd Edition, vol. 436, USDA, https://www.nrcs.usda.gov/sites/default/files/2022-06/Soil%20Taxonomy.pdf (last access: 26 November 2025), 1999. a
van Genuchten, M. T.: A Closed-form Equation for Predicting the Hydraulic Conductivity of Unsaturated Soils, Soil Science Society of America Journal, 44, 892, https://doi.org/10.2136/sssaj1980.03615995004400050002x, 1980. a, b, c, d, e, f, g, h, i, j, k, l
Van Looy, K., Bouma, J., Herbst, M., Koestel, J., Minasny, B., Mishra, U., Montzka, C., Nemes, A., Pachepsky, Y. A., Padarian, J., Schaap, M. G., Tóth, B., Verhoef, A., Vanderborght, J., van der Ploeg, M. J., Weihermüller, L., Zacharias, S., Zhang, Y., and Vereecken, H.: Pedotransfer Functions in Earth System Science: Challenges and Perspectives, Reviews of Geophysics, 55, 1199–1256, https://doi.org/10.1002/2017RG000581, 2017. a, b
Vereecken, H., Weynants, M., Javaux, M., Pachepsky, Y., Schaap, M. G., and van Genuchten, M.: Using Pedotransfer Functions to Estimate the van Genuchten–Mualem Soil Hydraulic Properties: A Review, Vadose Zone Journal, 9, https://doi.org/10.2136/vzj2010.0045, 2010. a
Vereecken, H., Weihermüller, L., Assouline, S., Šimůnek, J., Verhoef, A., Herbst, M., Archer, N., Mohanty, B., Montzka, C., Vanderborght, J., Balsamo, G., Bechtold, M., Boone, A., Chadburn, S., Cuntz, M., Decharme, B., Ducharne, A., Ek, M., Garrigues, S., Goergen, K., Ingwersen, J., Kollet, S., Lawrence, D. M., Li, Q., Or, D., Swenson, S., de Vrese, P., Walko, R., Wu, Y., and Xue, Y.: Infiltration from the Pedon to Global Grid Scales: An Overview and Outlook for Land Surface Modeling, Vadose Zone Journal, 18, https://doi.org/10.2136/vzj2018.10.0191, 2019. a, b
Walczak, R., Rovdan, E., and Witkowska-Walczak, B.: Water retention characteristics of peat and sand mixtures, International Agrophysics, 16, http://www.international-agrophysics.org/Water-retention-characteristics-of-peat-and-sand-mixtures,106790,0,2.html (last access: 26 November 2025), 2002. a, b, c, d, e, f, g, h, i, j, k, l, m, n
Weihermüller, L., Lehmann, P., Herbst, M., Rahmati, M., Verhoef, A., Or, D., Jacques, D., and Vereecken, H.: Choice of Pedotransfer Functions Matters when Simulating Soil Water Balance Fluxes, Journal of Advances in Modeling Earth Systems, 13, 1–30, https://doi.org/10.1029/2020MS002404, 2021. a
Weynants, M., Vereecken, H., and Javaux, M.: Revisiting Vereecken Pedotransfer Functions: Introducing a Closed‐Form Hydraulic Model, Vadose Zone Journal, 8, https://doi.org/10.2136/vzj2008.0062, 2009. a, b, c, d
Willaredt, M. and Nehls, T.: Investigation of water retention functions of artificial soil-like substrates for a range of mixing ratios of two components, Journal of Soils and Sediments, 21, https://doi.org/10.1007/s11368-020-02727-8, 2021. a, b, c, d, e, f, g, h, i, j, k
Willaredt, M., Nehls, T., and Peters, A.: Predicting soil hydraulic properties for binary mixtures – concept and application for constructed Technosols, Hydrol. Earth Syst. Sci., 27, 3125–3142, https://doi.org/10.5194/hess-27-3125-2023, 2023. a, b, c, d
Wösten, J. H. M., Lilly, A., Nemes, A., and Le Bas, C.: Development and use of a database of hydraulic properties of European soils, Geoderma, https://doi.org/10.1016/S0016-7061(98)00132-3, 1999. a, b, c, d, e, f, g
Zhu, D., Ciais, P., Krinner, G., Maignan, F., Jornet Puig, A., and Hugelius, G.: Controls of soil organic matter on soil thermal dynamics in the northern high latitudes, Nature Communications, 10, 3172, https://doi.org/10.1038/s41467-019-11103-1, 2019. a