the Creative Commons Attribution 4.0 License.
the Creative Commons Attribution 4.0 License.
 | 28 Nov 2025
Urban heat forecasting in small cities: evaluation of a high-resolution operational numerical weather prediction model
Yuqi Huang
Tyler Danzig
Temple R. Lee
Sandip Pal
With rising global temperatures, urban environments are increasingly vulnerable to heat stress, often exacerbated by the Urban Heat Island (UHI) effect. While most UHI research has focused on large metropolitan areas around the world, relatively smaller-sized cities (with a population 100 000–300 000) remain understudied despite their growing exposure to extreme heat and meteorological significance. In particular, urban heat advection (UHA), the transport of heat by mean winds, remains a key but underexplored mechanism in most modeling frameworks. High-resolution numerical weather prediction (NWP) models are essential tools for simulating urban hydrometeorological conditions, yet most prior evaluations have focused on retrospective reanalysis products rather than forecasts. In this study, we assess the performance of a widely used operational weather forecast model, the High-Resolution Rapid Refresh (HRRR), as a representative example of current NWP systems. We investigate its ability to predict spatial and temporal patterns of urban heat and UHA within and around Lubbock, Texas, a small-sized city located in a semi-arid environment in the southwestern US. Using data collected between 1 September 2023, and 31 August 2024 from the Urban Heat Island Experiment in Lubbock, Texas (U-HEAT) network and five West Texas Mesonet stations, we compare 18 h forecasts against in situ observations. HRRR forecasts exhibit a consistent nighttime cold bias at both urban and rural sites, a daytime warm bias at rural locations, and a pervasive dry bias across all seasons. The model also systematically overestimates near-surface wind speeds, further limiting its ability to accurately predict UHA. Although HRRR captures the expected slower nocturnal cooling in urban areas, it does not well capture advective heat transport under most wind regimes. Our findings reveal both systematic biases and urban representation limitations in current high-resolution NWP forecasts. Our forecast–observation comparisons underscore the need for improved urban parameterizations and evaluation frameworks focused on forecast skill, with important implications for heat-risk warning systems and forecasting in small and mid-sized cities.
- Article
(6631 KB) - Full-text XML
-
Supplement
(3976 KB) - BibTeX
- EndNote


Global cities are experiencing increasingly pronounced environmental changes driven by rapid urbanization, climate change, and other anthropogenic influences (Masson et al., 2020; Oke et al., 2017). In turn, cities have been shown to substantially alter local weather and climate processes, such as cloud and precipitation patterns (Lu et al., 2024; Vo et al., 2023; Yang et al., 2024), boundary layer development (Caicedo et al., 2019; Fenner et al., 2024; Pal et al., 2012), and air pollutant transport (Klein et al., 2014; Lac et al., 2013; Wang et al., 2018a). Among these, urban thermal conditions stand out as being particularly affected, shaped by the heterogeneous nature of the built environment and surrounding semi-urban and rural areas. Indeed, heat-related phenomena, such as the urban heat island (UHI) effect, urban dry/moisture islands, and heat waves, have remained central focuses in urban climate research (Barlow, 2014)
Like other urban climatic phenomena, urban thermal conditions are strongly influenced by both atmospheric processes and surface properties (Oke et al., 2017). Wind plays a particularly important role by transporting heat via advection and turbulent mixing, mechanisms that drive temperature gradients within and around urban areas, a phenomenon known as urban heat advection (Lowry, 1977). Both the intensity and spatial structure of the UHI are more closely linked to wind speed and direction compared to humidity or urban morphology (Bassett et al., 2019). Strong winds typically reduce UHI intensity by enhancing heat dispersion, whereas calm wind conditions tend to promote a circular UHI footprint (Oke, 1976). Under high wind conditions, the UHI often becomes elongated in the downwind direction due to advective heat transport (Bohnenstengel et al., 2011). Beyond thermal effect, the dynamic urban heat advection process also influences local pollution dispersion and regional air quality (Agarwal and Tandon, 2010), and may affect convective processes such as cloud formation and precipitation patterns around cities (Wang et al., 2018b). A comprehensive understanding of the spatial variability in urban heat and its advection behavior is therefore critical for improving urban weather forecasting and mitigating temperature-related risks.
Understanding urban heat-related processes has traditionally relied on observations (Bassett et al., 2016, 2017). While such observations offer high accuracy and real-time insights, they are inherently limited by sparse spatial coverage, lack of temporal continuity, and the high costs associated with installation and maintenance (Chen et al., 2022). Satellite remote sensing, by contrast, provides broad spatial coverage and effectively captures key urban surface characteristics (Zhou et al., 2018). However, it remains insufficient for characterizing urban thermal conditions, particularly due to its limited temporal resolution and the inability to retrieve key atmospheric variables such as air temperature and wind. In this context, Numerical Weather Prediction (NWP) models have emerged as valuable tools for investigating urban heat processes, which provide full atmospheric properties at high temporal frequency with operational relevance (Best, 2005; Chen et al., 2011). Importantly, NWP forecasts, rather than reanalyses, are particularly critical for supporting urban resilience and heat mitigation through early warning systems (Kacker et al., 2025; Yang et al., 2016). Because operational heat warnings depend on lead-time forecast skill, evaluation efforts should focus on forecast fields, whereas reanalysis products, which assimilate observations, may mask systematic model errors and bias performance assessments. Nevertheless, earlier land surface models (LSMs) commonly used in NWP systems, such as Noah-LSM (Chen and Dudhia, 2001), the Common Land Model (CLM) (Dai et al., 2003), and Rapid Update Cycle (RUC) (Benjamin et al., 2004), often underrepresented urban processes due to coarse spatial resolution and limited urban-specific parameterizations, in part reflecting the operational emphasis on rapid forecasts.
Recent advances in high-resolution urban land-use datasets and urban land surface models (ULSMs) have substantially improved urban representation in numerical models (Chen et al., 2011; Lipson et al., 2024; Stewart et al., 2014). Among ULSMs, one-dimensional slab models remain widely used in operational NWP because they are computationally efficient (Oleson et al., 2008) and perform reasonably well in simulating urban surface energy fluxes over predominantly impervious surfaces with strong sensible heat fluxes (Jongen et al., 2024; Lipson et al., 2024). However, these models idealize the urban surface as a homogeneous layer and oversimplify radiative and hydrological interactions that are increasingly important in cities with nature-based solutions such as urban vegetation, green infrastructure, and irrigation (Huang et al., 2025; Wang et al., 2025). While slab models have been criticized for their structural simplicity and are often considered surpassed by more advanced urban schemes in research applications, they remain the default choice in many operational forecasting systems. Despite this continued use, there has been limited evaluation of their forecast performance, especially with respect to capturing fine-scale spatiotemporal variations in urban heat. Addressing this gap is crucial for enhancing urban heat forecasting and informing the development of more accurate and adaptive urban land surface parameterizations for operational use.
In addition, urban climate studies have predominantly focused on major metropolitan areas, often overlooking small to mid-sized cities due to limitations such as low model resolution and sparse observational networks. Yet, there are numerous small cities around the world that remain understudied in urban climate research. For example, approximately 96 % of US cities with populations over 20 000 have fewer than 300 000 residents (U.S. Census Bureau, Population Division, 2024). Despite their smaller size and lower population density, these cities are increasingly vulnerable to heat stress due to limited adaptive capacity, constrained resources, and inadequate emergency response systems (Youngquist et al., 2023). Evidence from cities such as Szeged, Hungary, and Utrecht, the Netherlands, demonstrates that smaller urban areas can exhibit substantial UHI intensities, emphasizing their susceptibility to elevated temperatures and associated risks (Brandsma and Wolters, 2012; Unger et al., 2011). This vulnerability is further amplified in dryland regions considering their fragile ecosystems and chronic water scarcity (Huang et al., 2017; Lee et al., 2023a, 2025). In these areas, decreasing soil moisture and vegetation cover contribute to a positive feedback loop of surface warming, land degradation, and further aridification (Charney et al., 1977; Li et al., 2021; Zhang et al., 2020), which may in turn exacerbate UHI effects. Recent global modeling work also indicates that urbanization-induced warming and associated land–atmosphere feedback processes are stronger in water-limited (dry) regimes than in humid ones, underscoring dryland cities as critical stress tests for operational urban forecasts (Zhang et al., 2025). As population growth and climate fragility increase in semi-arid regions, small and mid-sized cities are becoming critical frontiers for addressing heat-related challenges.
In this study, we conduct a year-long evaluation of urban heat forecasts from the High-Resolution Rapid Refresh (HRRR) model in Lubbock, Texas, a small city located in a semi-arid region of the southwestern US. HRRR is one of the highest-resolution operational NWP systems and incorporates a slab urban parameterization scheme. The forecast products from HRRR have been evaluated from a variety of perspectives in previous studies. These include assessments of warm-season precipitation over the US Central Plains (Bytheway et al., 2017), cloud cover across the contiguous United States (Griffin et al., 2017), and convective storm characteristics in the eastern United States (Katona et al., 2016). More recent evaluations have focused on convective available potential energy, near-surface meteorology, and surface energy fluxes in Alabama (Lee et al., 2019; Wagner et al., 2019), as well as winds and gusts in New York State (Fovell and Gallagher, 2022). Beyond these evaluations, HRRR forecast products have increasingly been incorporated into urban applications. For example, HRRR forecasts have been coupled with hydrological models to support urban flood forecasting (Coelho et al., 2022) and used to improve air quality predictions (Park et al., 2025). To our knowledge, however, HRRR forecasts have never been systematically evaluated for urban heat dynamics.
To address this critical gap, we pose the following research questions: (1) How accurately does HRRR simulate near-surface hydrometeorological conditions, particularly temperature and humidity, within and around a semi-arid urban environment across different times of the day and throughout varying seasons? (2) To what extent does HRRR reproduce observed nocturnal cooling rates across heterogeneous urban and rural landscapes? (3) Can HRRR capture the spatial variability and magnitude of UHI and urban heat advection (UHA), particularly under varying wind regimes? Our evaluation leverages observational data collected from 23 Urban Heat Island Experiment in Lubbock, Texas (U-HEAT) stations measuring 2 m air temperature and dew point temperature (Danzig et al., 2025). Wind speed and direction data from five West Texas Mesonet stations are also used to characterize local advection. Corresponding to these questions, we focus on three key aspects of urban thermal conditions: near-surface hydrometeorological forecasts, the spatial variability of UHA, and nocturnal cooling rates. By explicitly addressing these questions, our findings aim not only to systematically evaluate HRRR's skill in urban heat forecasting across critical temporal scales but also to directly inform enhancements in operational NWP systems. Ultimately, this research seeks to improve forecast-based heat-risk management strategies for small and mid-sized cities facing growing heat vulnerability.
2.1 Study area
The study area, Lubbock, Texas (33.58° N, 101.84° W), is situated in the northwestern part of Texas within the Great Plains region (Fig. 1). As of the 2023 census, Lubbock had a population of 266 878, considerably smaller than major US metropolitan areas such as New York City, Los Angeles, and Chicago. Despite recent population growth, Lubbock remains a medium-sized city. Its rapid urbanization, semi-arid climate, and relative isolation from the influence of larger metropolitan areas makes it an ideal testbed for examining thermal conditions in small, climate-sensitive cities.
According to the Köppen climate classification (Cui et al., 2021), Lubbock exhibits a cold semi-arid climate, characterized by an average annual precipitation of approximately 466 mm and a mean annual temperature of 16.3 °C. The majority of precipitation occurs between May and October. While the overall decadal mean precipitation has shown a declining trend in recent decades, May remains an exception, exhibiting relatively stable or even increased precipitation levels (Fig. S1b in the Supplement). Concurrently, both monthly and decadal mean temperatures have demonstrated a consistent upward trend, with the decadal mean temperature rising from 15.5 to 17.2 °C over recent decades (Fig. S1a). In the context of ongoing climate change, which is amplifying the frequency and intensity of heatwaves (Meehl and Tebaldi, 2004), Lubbock has experienced a notable increase in extreme heat events. Specifically, during the 2010s, the city recorded up to 171 d yr−1 with maximum temperatures exceeding 100 °F (37.8 °C), indicating a significant escalation in heat stress conditions (Fig. S1a).
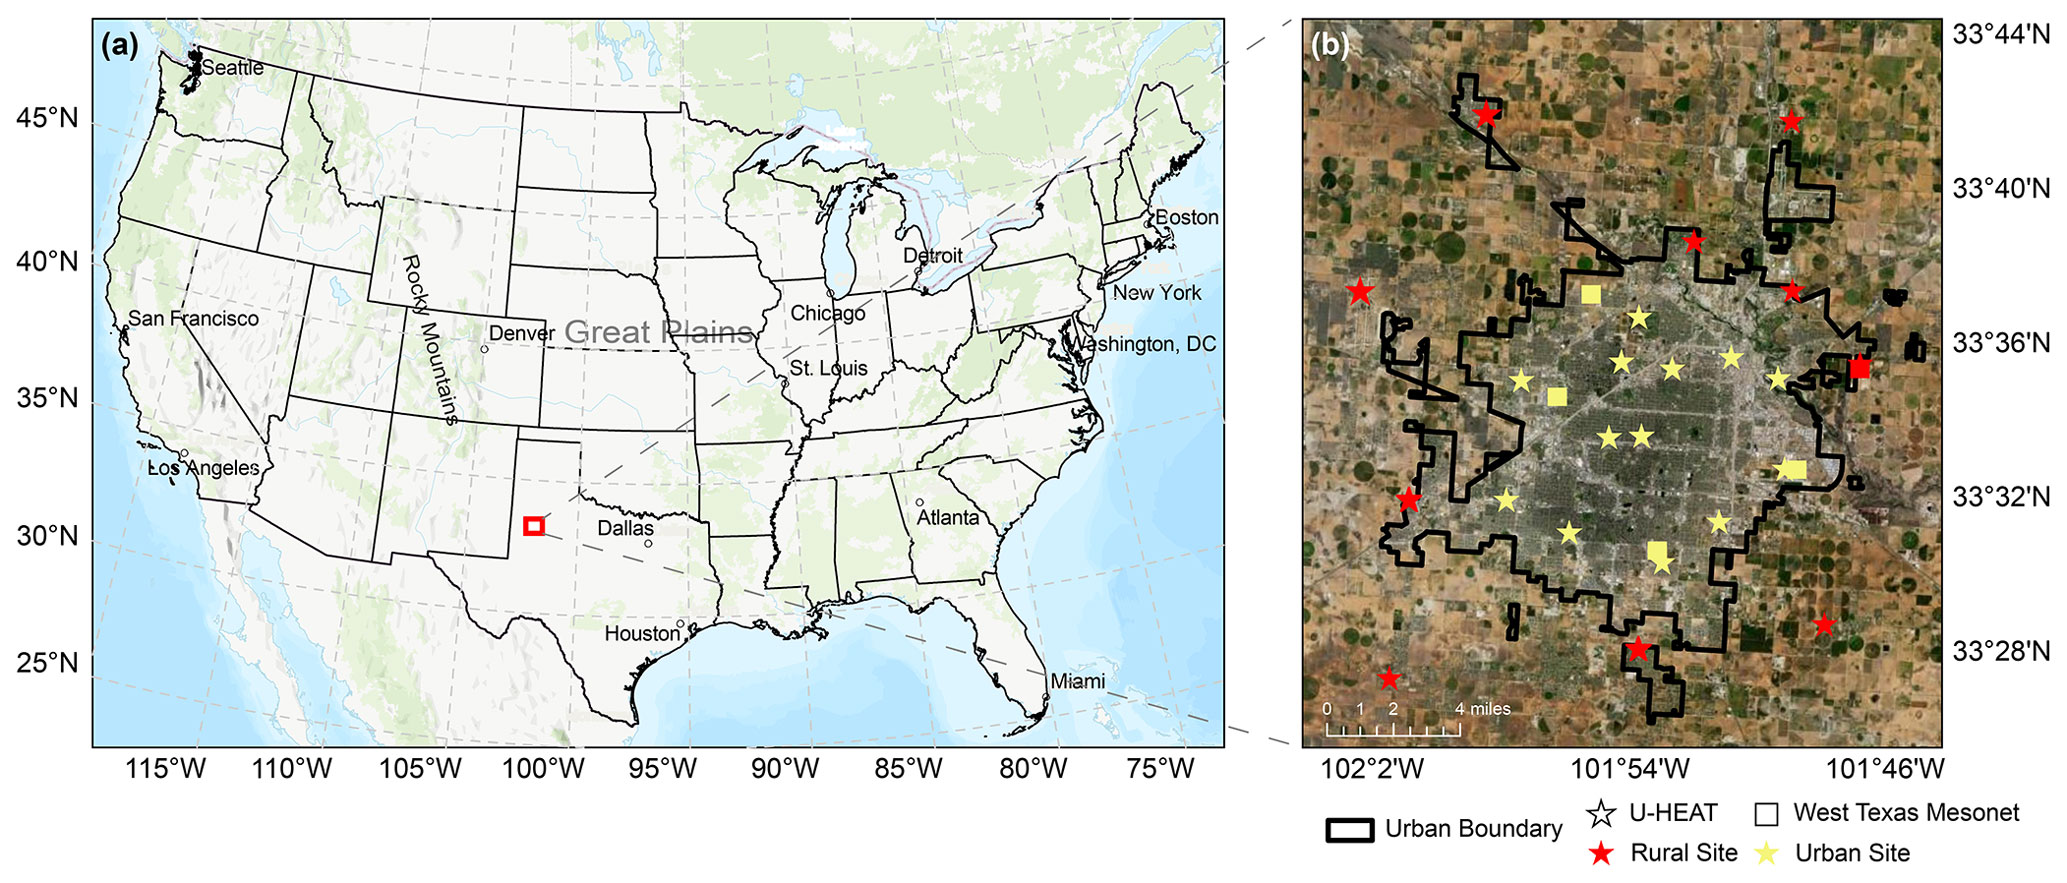
Figure 1Geographical overview of the study area: (a) location of Lubbock, Texas, within the contiguous United States (CONUS) shown on the topographic map; (b) distribution of 28 in-situ observational sites in and around Lubbock, including 23 U-HEAT stations and 5 West Texas Mesonet stations overlaid on a satellite image (map source: Esri, U.S. Department of Agriculture Farm Service Agency; urban boundary source: U.S. Census Bureau).
2.2 In-situ data
2.2.1 Observation networks in Lubbock
Accurately characterizing urban thermal conditions requires observational datasets that offer both high temporal resolution and extensive spatial coverage across urban and surrounding rural areas. To address this need, we leveraged observational data from two complementary networks: the West Texas Mesonet (WTM) and the newly established Urban Heat Experiment Around Lubbock, Texas (U-HEAT) network.
The WTM, established in 1999 through funding from the Texas Department of Economic Development, is operated by the National Wind Institute. For this study, we utilized one-minute interval observations of 10-meter wind speed and direction. Among the 158 active WTM stations, five located in and around Lubbock were selected due to their proximity to the urban core and their representative spatial coverage (Fig. 1b). These stations are Lubbock TTU East Campus (33.59° N, 101.78° W), Lubbock All Saints School (33.50° N, 101.88° W), Lubbock South Plains Food Bank (33.54° N, 101.81° W), Lubbock TTU (33.60° N, 101.89° W), and Lubbock LCU (33.57° N, 101.94° W).
The U-HEAT stations use HOBO MX2301A data loggers. Each logger is equipped with internal sensors for temperature and relative humidity, enabling the calculation of dew point temperature. The entire U-HEAT was deployed between June and August 2023 and began recording observations immediately upon installation. To capture detailed temperature variability during periods of extreme heat in summer and early fall, the loggers were configured with a 1 min recording interval. For the remaining months, when temperature is typically lower, a 5 min interval was applied. A total of 23 stations were strategically placed across Lubbock (Fig. 1b and Table S1 in the Supplement), aligned along the city's southwest-to-northeast urban development axis. This orientation, forming a round-shaped network, has been demonstrated in previous studies to enhance the accuracy of UHI intensity and UHA assessments (Bassett et al., 2016; Danzig et al., 2025). Sensor placement, including height, land-surface characteristics, and deployment practices, adhered to World Meteorological Organization guidelines, ensuring installation on grassy surfaces, free from overhead vegetation and nearby anthropogenic heat sources.
2.2.2 Data pre-processing
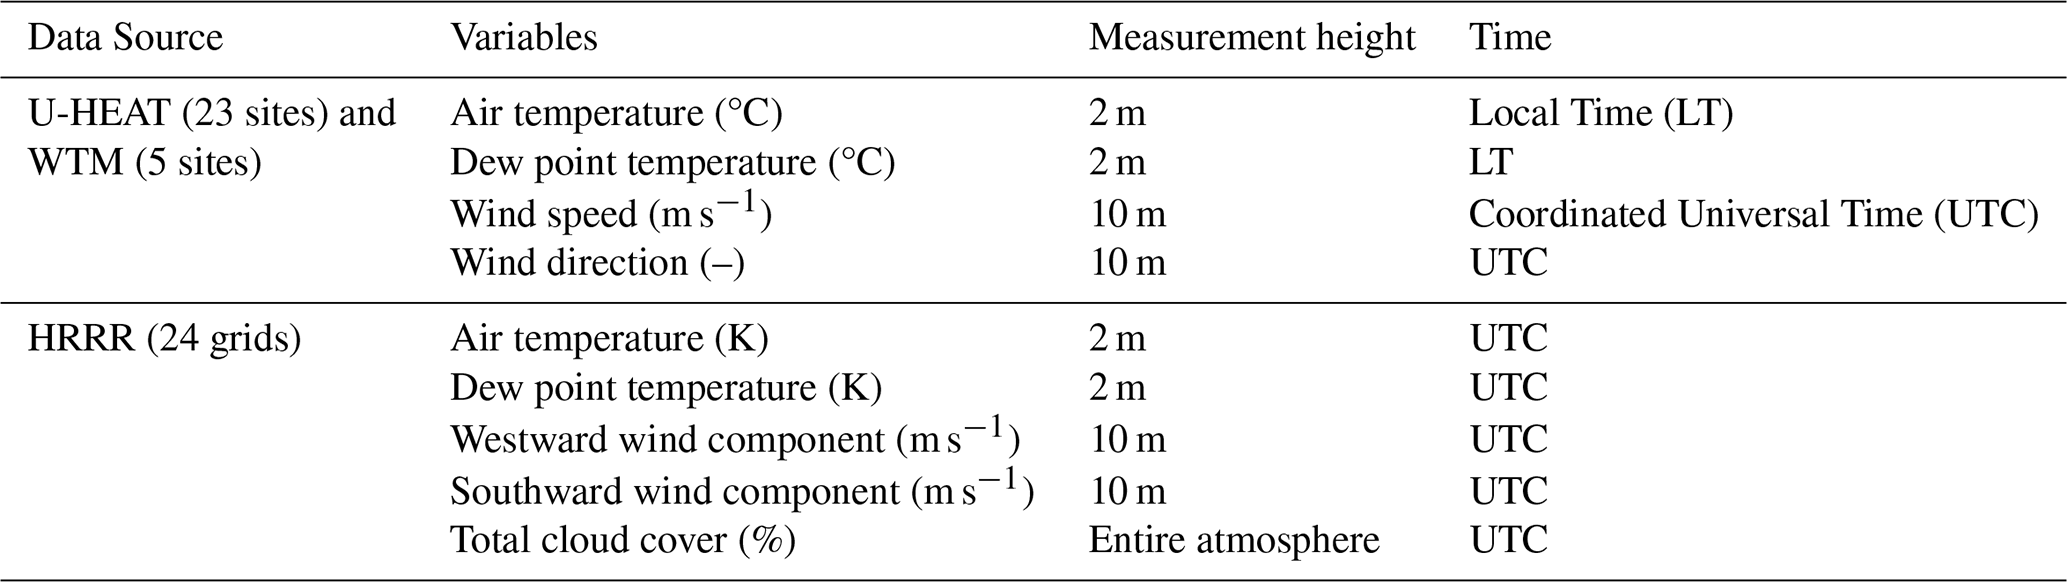
We retrieved both the 18 h forecast and the 0 h forecast (i.e., the model initialization) from HRRRv4 for the period between 1 September 2023 and 31 August 2024, via the NOAA Open Data Dissemination (NODD) program through the Google Cloud Platform HRRR archive. For site-specific analysis, the nearest HRRR grid point was identified for each observation location, resulting in a total of 24 HRRR grid points selected for direct comparison with in situ measurements (Fig. S2). To ensure temporal consistency, all U-HEAT observational data were converted to Coordinated Universal Time (UTC), while the Mesonet data were already recorded in UTC. We also took into account daylight-saving time in Lubbock, where the local time offset from UTC shifts from −5 to −6 h between 5 November 2023, at 01:00 and 10 March 2024, at 02:00 due to the transition to standard time. For the 1 min interval data from the Mesonet and U-HEAT, hourly means were calculated by averaging observations within a 10 min window centered on each exact hour (i.e., 5 min before and after). This approach helps smooth short-term variability and reduce potential errors associated with localized fluctuations, such as those induced by transient urban influences or microscale atmospheric perturbations. For the U-HEAT data recorded at 5 min intervals, the observation at the exact hour was directly used to represent the hourly value. A summary of the extracted HRRR variables and corresponding observational datasets used for comparison is provided in Table 1.
Table 1Summary of variables retrieved from the observational networks and HRRR model.
2.3 HRRR forecast data
The HRRR model is a deterministic, convection-allowing numerical weather prediction system that provides high-resolution (3 km) short-term (hourly) forecasts across the conterminous United States (CONUS). Operational since 2014, HRRR has been widely used to support real-time weather forecasting (Benjamin et al., 2016; Lee et al., 2024). Our evaluation focuses on version 4 of HRRR (HRRRv4), which incorporates the Rapid Update Cycle Land Surface Model (RUC LSM) to simulate surface and near-surface hydrometeorological conditions. The RUC LSM includes 21 land-cover categories based on MODIS classifications; however, it represents all urban areas using a single category (Category 13: Urban and Built-Up), which limits its ability to capture the heterogeneity of urban surface types (Smirnova et al., 2016). A technical summary of RUC LSM and urban parameterization in HRRRv4 can be found in Appendix A. We specifically assess HRRR's 18 h forecast, as it represents the maximum lead time available in its hourly forecast cycle. This forecast horizon is also less influenced by initial conditions and data assimilation compared to shorter lead times, making it more suitable for evaluating the model's forecast capability, particularly its treatment of land–atmosphere interactions (Lee et al., 2024). Detailed descriptions of the HRRR system and the RUC LSM can be found in Benjamin et al. (2016) and Dowell et al. (2022).
2.4 Model evaluation metrics
The overall performance of HRRR was determined by thoroughly evaluating near-surface meteorological variables (2 m air temperature, 2 m dew point temperature, and 10 m wind speed) in different seasons and during daytime or nighttime against observational data. Here, daytime is defined as 12:00 to 05:00 p.m. local time and nighttime as 12:00 to 05:00 a.m. local time, efficiently capturing the periods of peak solar influence and nocturnal cooling. Evaluation metrics include mean bias error (MBE), root mean square error (RMSE), and Pearson correlation coefficient (r), which are expressed as (Wang and Wang, 2020; Wilks, 2011):
where Mi and Oi represent the model forecast and observation, respectively, an overbar (i.e., and ) indicates the mean of all samples, and N denotes the number of simulated periods, which is 8784 for a year-long simulation. In general, model performance is considered more accurate when the MBE and RMSE are close to 0, and r approaches 1.
2.5 Determination of nocturnal cooling rate
The nocturnal cooling rate indicates how effectively an area losses heat accumulated during the day. Urban areas, characterized by high fraction of impervious surfaces, complex geometries, and distinct thermal properties, typically exhibit slower cooling rates than rural surroundings, leading to pronounced nighttime UHI effects (Oke et al., 2017). Several seminal studies have demonstrated that nighttime cooling is strongly modulated by surface properties, atmospheric conditions, and land cover patterns, making it a key metric for assessing nighttime thermal behavior and urban hydrometeorological conditions (Kidder and Essenwanger, 1995; Spronken-Smith and Oke, 1999). This contrast is particularly pronounced in semi-arid cities such as Lubbock, where prevailing clear skies and dry air conditions can enhance radiative cooling in rural areas and intensify urban–rural cooling differences. Here we consistently define nighttime as from 12:00 a.m. to 05:00 a.m. local time, aligning with the evaluation window used in model evaluation. To isolate the effects of surface characteristics and minimize cloud-induced variability, we restrict our analysis to nights with continuous domain-wide cloud cover below 25 %. This threshold, corresponding to “mostly clear” conditions in U.S. National Weather Service definitions, is selected to isolate surface-driven cooling processes and minimize cloud-related variability while retaining an adequate sample size. Only regression-derived cooling rates with statistical significance (p<0.05) are retained for further analysis.
2.6 Assessment of urban heat advection
The general framework of estimating urban effects on local and regional climate was initially established by Lowry (1977). Although urban heat advection has been recognized in numerous UHI studies, it remains relatively underexplored, primarily due to the scarcity of dense observational networks and challenges in effectively isolating urban influences from those of the surrounding landscape or background climate (Lowry, 1977). Using measurements from only a few sites, Angevine et al. (2003) provided some qualitative ideas about the presence of UHA in their work. Building upon this foundational concept, Heaviside et al. (2015) introduced a novel approach to isolate UHA from the background UHI by decomposing UHI intensity into two components: (1) a time-mean temperature field representing background conditions aggregated over all wind directions, and (2) a wind-dependent temperature field driven by the prevailing flow. This method has been applied and validated in various studies utilizing both observational networks and numerical models (Bassett et al., 2016, 2019). However, to the best of our knowledge, weather forecast model has never been examined in the context of UHA.
In this study, we adopt a similar wind-direction-dependent analytical framework to quantify UHA forecasts from the HRRR model. Specifically, we use wind-direction-dependent rural reference temperatures, Trural, following the procedural steps outlined in Heaviside et al. (2015), but extend the method by refining the wind classification. Instead of the original four categories, we classify the mean nighttime 10 m wind field from HRRR into eight directional sectors. To minimize noise from short-term directional shifts, only nights with relatively stable wind conditions (defined as having consistent wind direction over six consecutive nighttime hours) are included in the analysis. These filtered nights are referred to as “effective nights”. For each effective night t, we derive the temperature anomaly ΔT(t) at each grid cell as the difference between the HRRR-forecasted temperature and the corresponding rural reference temperature Trural. We then determine the annual mean temperature anomaly across all effective nights. Lastly, the wind-dependent UHA signal, denoted , is derived by subtracting from the wind-direction-specific temperature anomaly. We calculated temperature anomaly following a similar procedure using station-based wind direction data to indicate the urban heat advection inferred from observational data. Temperature anomalies at each site are computed during each effective night and then averaged across all effective nights for each wind direction. This approach isolates persistent spatial patterns in nocturnal temperature associated with mean wind advection. Since wind transports heat from warmer to cooler regions, a systematic downwind warming captured through these directional composites would serve as a robust proxy for UHA. The workflow for calculating HRRR-derived UHA is illustrated in Fig. 2.
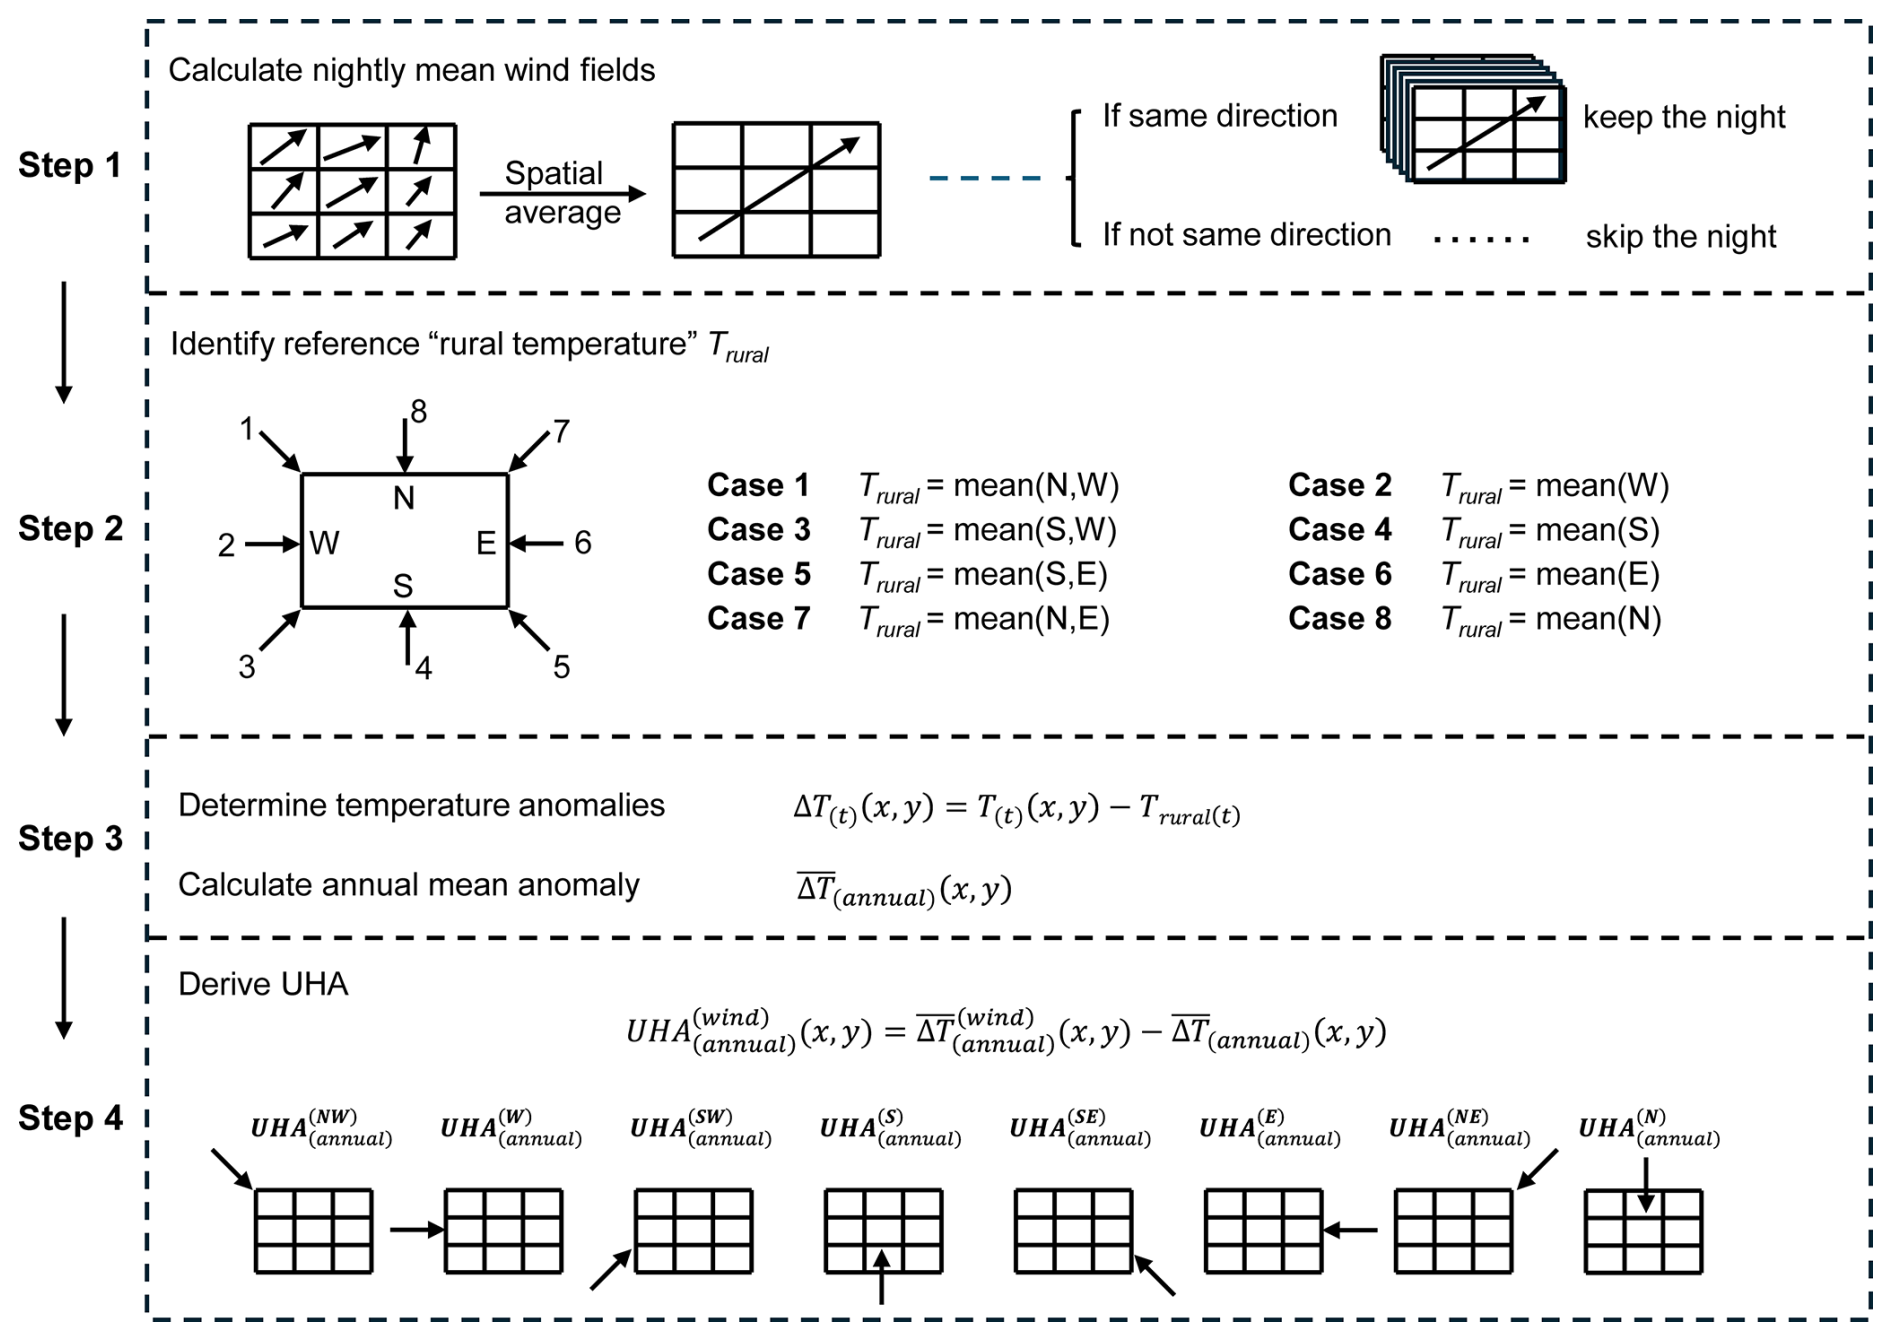
Figure 2Workflow for calculating Urban Heat Advection (UHA), adapted from the framework by Heaviside et al. (2015).
In this section, we present a comprehensive evaluation of HRRR forecast performance against U-HEAT and WTM observations. In Sect. 3.1, we assess overall forecast skill for three key urban hydrometeorological variables: 2 m air temperature, 2 m dew point temperature, and 10 m wind speed. Section 3.2 compares predicted hourly outputs at two lead times, i.e., 0 h (near-real-time) and 18 h, to assess sensitivity to forecast horizon. The final two subsections focus on HRRR's capability to capture the temporal and spatial features of urban thermal environments. Specifically, Sect. 3.3 evaluates forecasted nocturnal cooling rates at urban and rural sites, while Sect. 3.4 assesses HRRR-derived UHA in comparison with observation-based estimates.
3.1 Spatial, seasonal, and diurnal evaluation of HRRR hydrometeorological forecast
The comparison between HRRR 18 h forecasts and observations across the U-HEAT suggests generally strong correlations for both 2 m air temperature and dew point temperature throughout the day during the entire study period, with average correlation coefficients (r) across all sites of 0.98±0.00 and 0.93±0.01, respectively (Fig. 3). The average RMSE for dew point temperature (4.06±0.19 °C) is notably higher than for 2 m air temperature (2.01±0.12 °C). There is no clear urban–rural contrast in RMSE, though slightly better performance is observed in the southwestern part of the study domain for 2 m air temperature. In terms of MBE, urban sites exhibit a consistent cold bias for 2 m air temperature (average MBE °C), whereas peripheral rural sites show a warm bias (average MBE = 0.10 °C). In comparison, HRRR forecasts uniformly underestimate dew point temperature at both urban and rural sites, with an average MBE of °C. HRRR struggles to accurately capture wind speed across all five Mesonet sites, irrespective of their urban or rural classification, as evidenced by low correlations (r ranging from 0.37 to 0.39) and consistent overestimations (average MBE = 0.29±0.12 °C).
Seasonal variations in forecast performance reveal distinct patterns. For 2 m air temperature, HRRR shows relatively better performance in spring (Fig. S3; RMSE = 2.04±0.20 °C, ) and fall (Fig. S5; RMSE = 1.81±0.17 °C, ). Summer forecasts feature a pronounced warm bias across all sites (Fig. S4; average MBE = 0.26 °C), while winter forecasts exhibit a systematic cold bias (Fig. S6; mean MBE °C). During spring and fall, a clear spatial MBE pattern emerges, resembling the annual pattern of urban cold biases and peripheral warm biases (cf. Fig. 3). Dew point temperature forecasts are least accurate during spring, characterized by a pronounced dry bias (average MBE °C), higher RMSE (mean = 5.30 °C), and lower correlations (mean r=0.86). The dry bias persists consistently across other seasons as well, albeit to a lesser extent. Wind speed forecasts perform slightly better during winter (mean r=0.44, average MBE = 0.12 m s−1), while overestimations with relatively low correlations are consistent in other seasons.
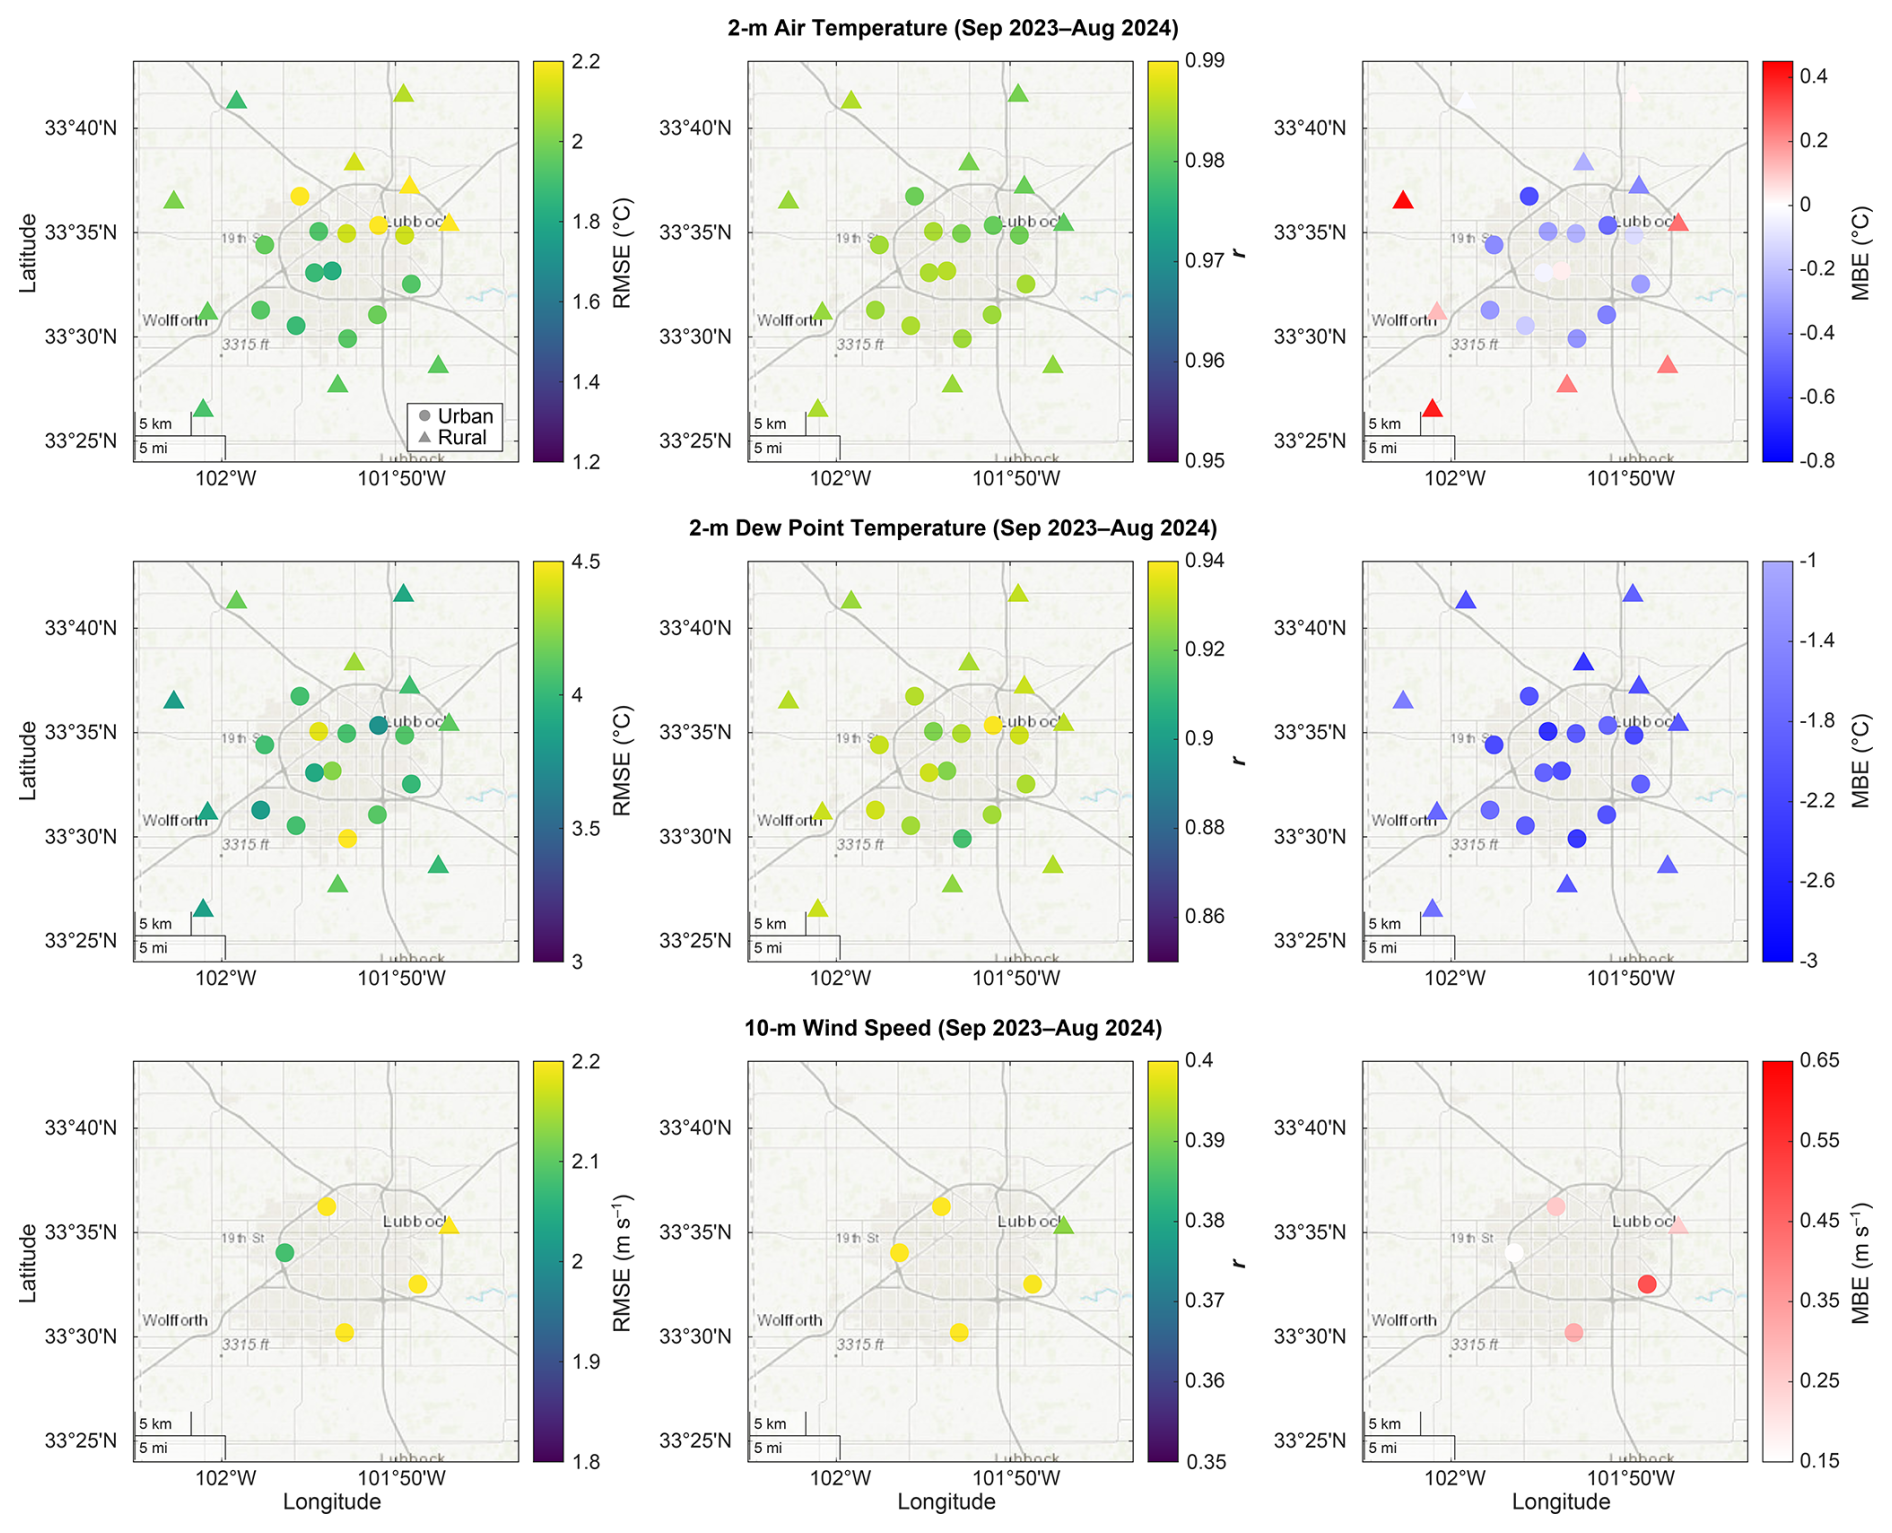
Figure 3Site-specific evaluation of HRRR 18 h forecasts against in situ observations in and around Lubbock, Texas. Rows correspond to different variables: 2 m air temperature (top), 2 m dew point temperature (middle), and 10 m wind speed (bottom). Columns show spatial distributions of three statistical metrics: Root Mean Square Error (RMSE; left), correlation coefficient (r; middle), and Mean Bias Error (MBE; right). Urban and rural sites are color-coded by metric value, with urban and rural sites marked by circles and triangles, respectively.
In addition to spatial variability, clear forecast performance contrasts emerge between urban and rural sites. As illustrated in the top row of Fig. 4, rural sites generally show a slight warm bias (average annual MBE = 0.10 °C), while urban sites consistently show a cold bias (average MBE °C). This contrast persists across all seasons, with rural sites exhibiting consistently higher MBE values relative to urban sites. While urban sites show persistent underestimation of 2 m air temperature throughout all seasons, rural sites exhibit milder cold biases, specifically in fall and winter (average seasonal MBE °C). For dew point temperature, urban–rural differences are minimal, with similar average annual MBEs of −2.00 °C for urban and −1.89 °C for rural sites. Both urban and rural sites consistently show a systematic dry bias across seasons and most pronounced in spring (average seasonal MBE °C) compared to other seasons (average MBE °C). Wind speed overestimations persistent year-round, with urban sites slightly more biased (average MBE = 0.24 m s−1) than rural ones (average MBE = 0.15 m s−1).
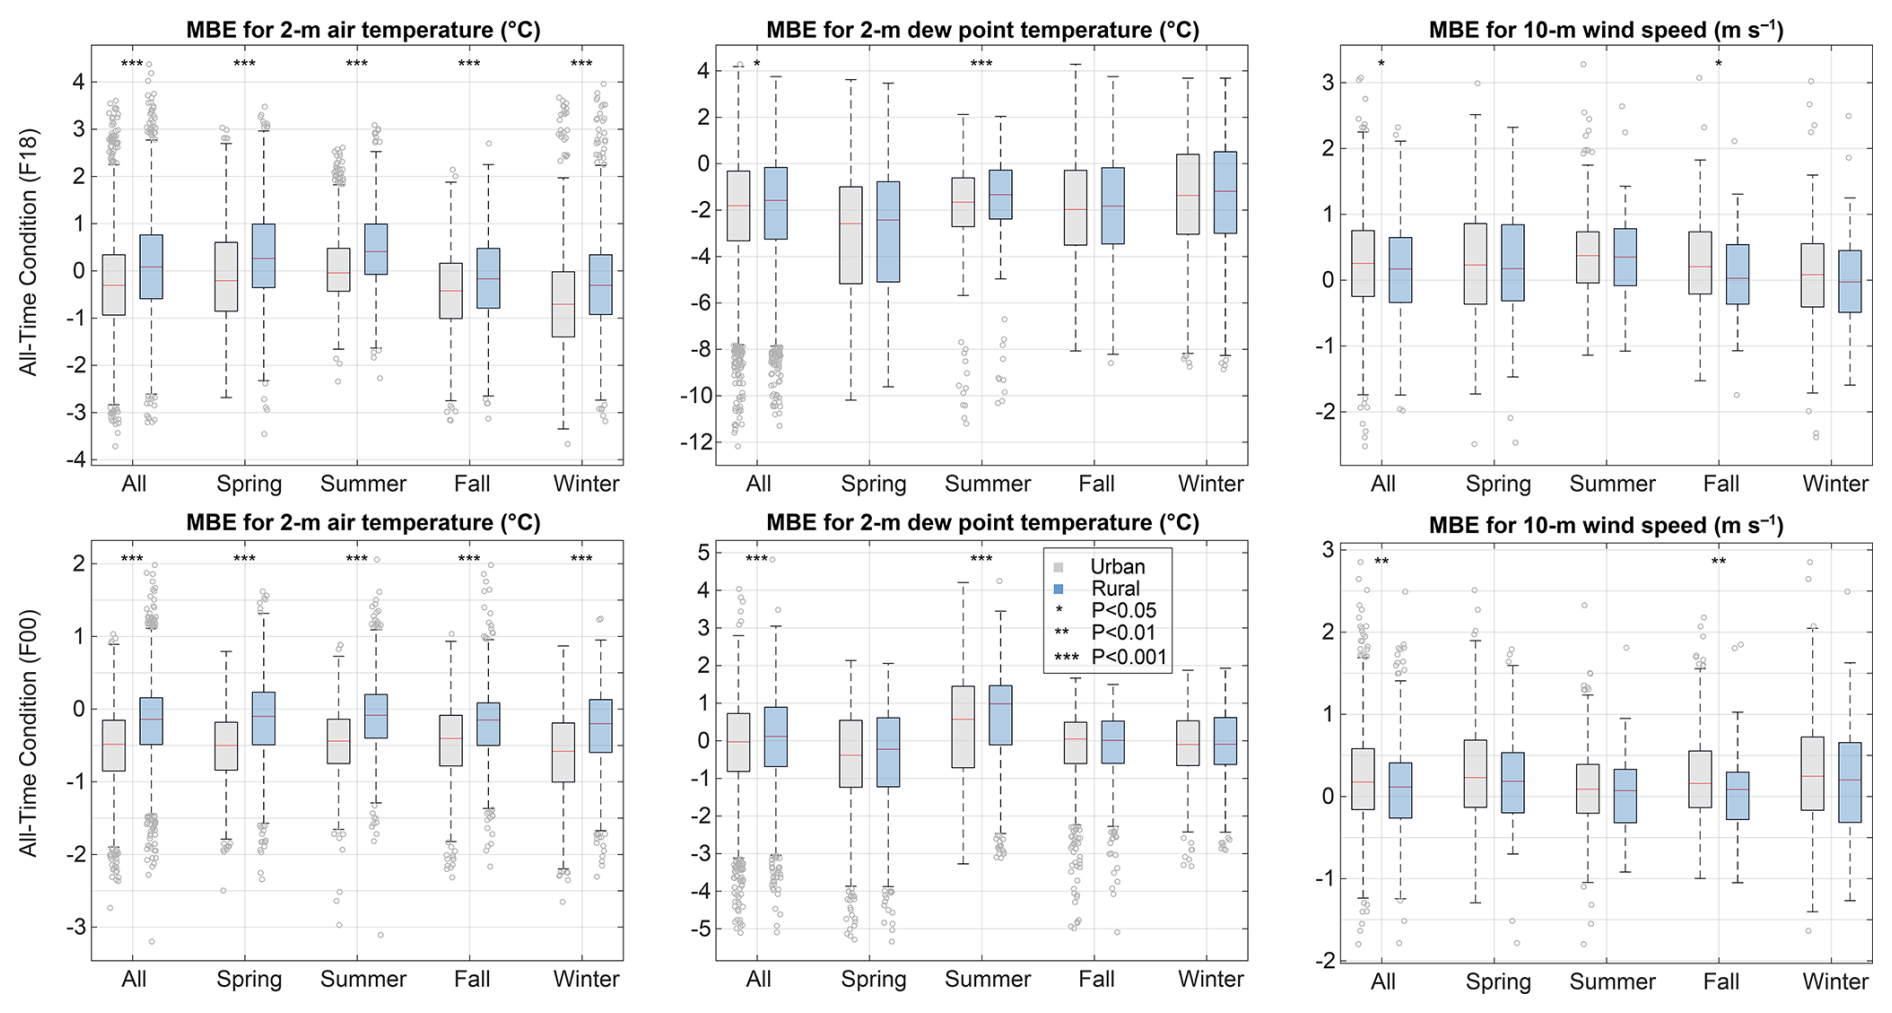
Figure 4Comparison of HRRR 18 h lead forecasts (top) and near-real-time (0 h lead) forecasts (bottom) evaluated using mean bias error (MBE) across all seasons for 2 m air temperature (left), 2 m dew point temperature (middle), and 10 m wind speed (right). Each subplot includes five seasonal groupings (All, Spring, Summer, Fall, and Winter), with paired boxplots for urban and rural sites. Each individual data point corresponds to MBE based on a single day at each station location. Box denotes the interquartile range (IQR; 25th to 75th percentile), with the horizontal line indicating the median. Whiskers extend to the furthest data points within IQR. Asterisks indicate statistically significant differences between urban and rural results based on a paired-sample t-test such that *, , and correspond with p<0.05, p<0.01, and p<0.001, respectively.
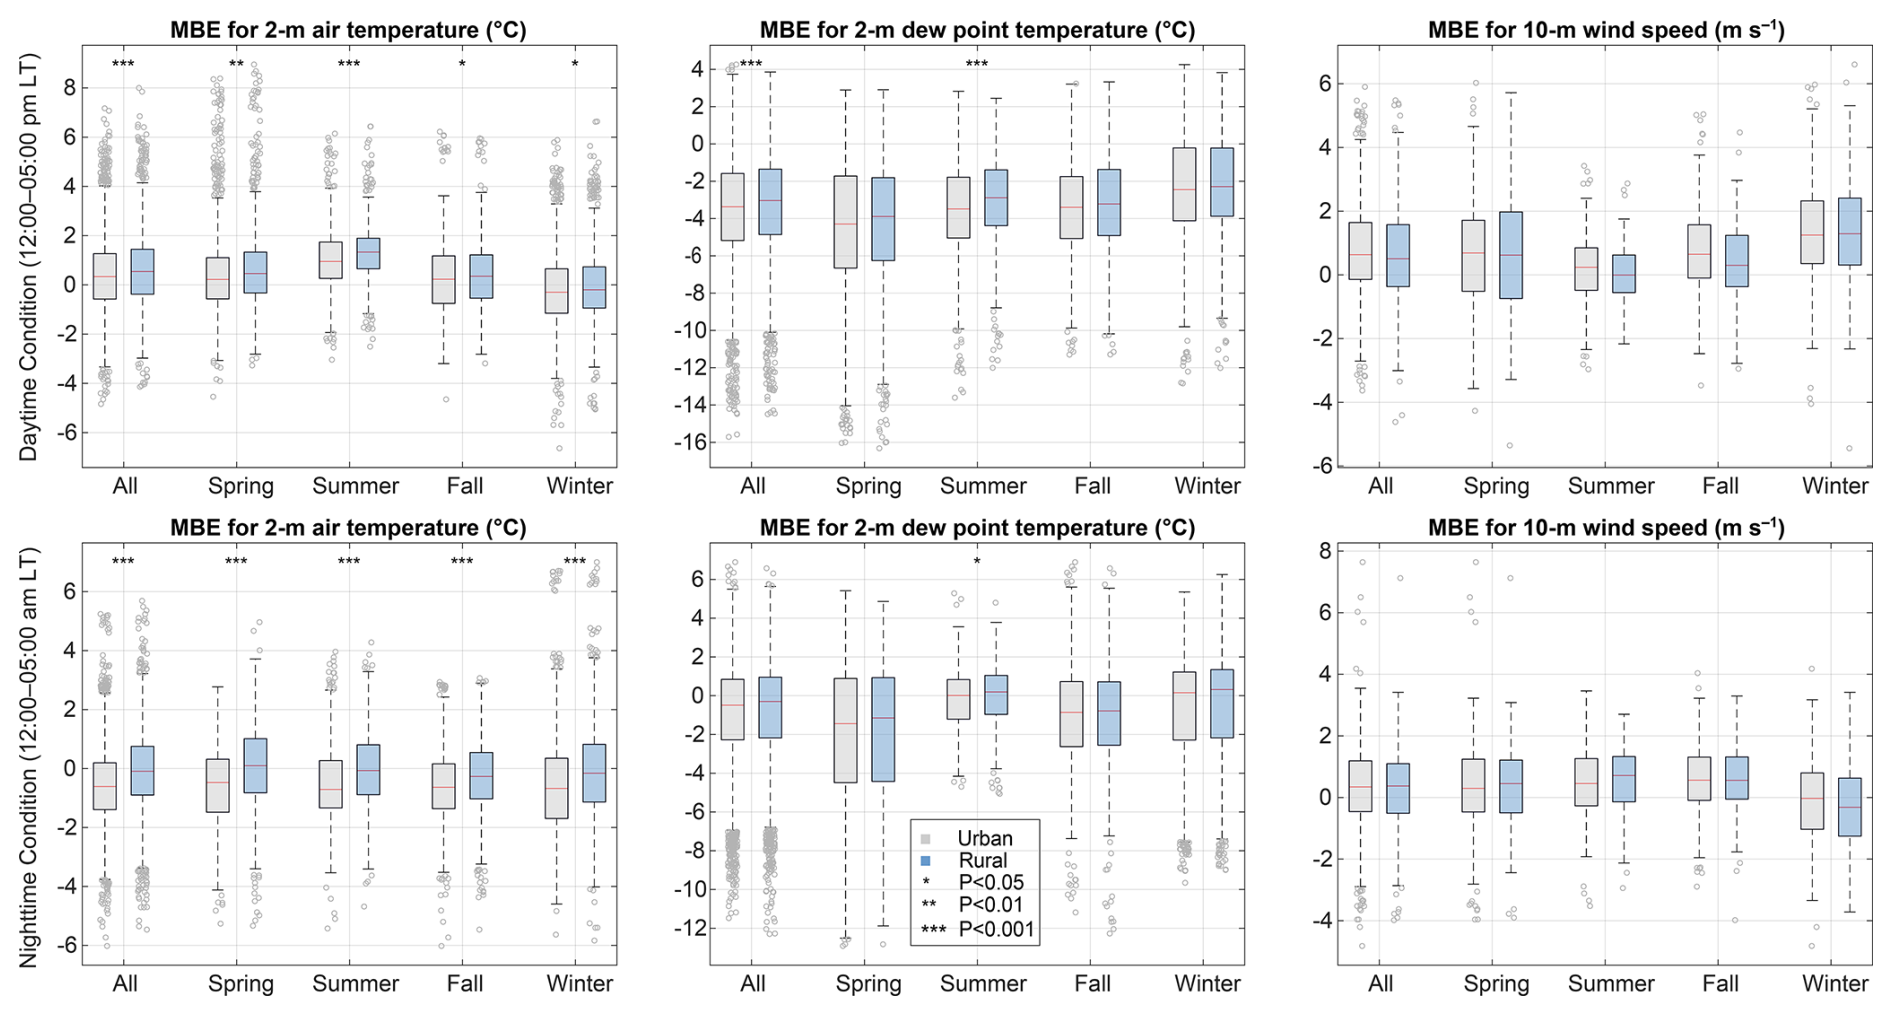
Figure 5Diurnal evaluation of HRRR forecasts using mean bias error (MBE) across all seasons for 2 m air temperature (left), 2 m dew point temperature (middle), and 10 m wind speed (right) during daytime (12:00–05:00 p.m. LT; top) and nighttime (12:00–05:00 a.m. LT; bottom). Each subplot includes five seasonal groupings (All, Spring, Summer, Fall, and Winter), with paired boxplots for urban and rural sites. Each individual data point corresponds to MBE based on a single daytime or nighttime period at each station location. Box denotes the interquartile range (IQR; 25th to 75th percentile), with the horizontal line indicating the median. Whiskers extend to the furthest data points within IQR. Asterisks indicate statistically significant differences between urban and rural results based on a paired-sample t-test such that *, , and correspond with p<0.05, p<0.01, and p<0.001, respectively.
We further evaluated HRRR forecasts during daytime and nighttime periods, as shown in Fig. 5. MBEs at both urban and rural sites are generally larger during the day across all variables and seasons. For 2 m air temperature, HRRR forecasts show a daytime warm bias at both urban (annual average MBE = 0.38 °C) and rural (annual average MBE = 0.59 °C) sites. At night, urban sites exhibit a pronounced cold bias (annual average MBE °C), while rural sites show only a slight underestimation (annual average MBE °C). Notably, daytime warm biases are consistent during spring, summer, and fall, while cold biases dominate during winter. At night, cold biases are present across all seasons, except for a slight warm bias at rural sites during spring (average MBE = 0.08 °C). Additionally, extreme temperature biases (outliers) tend to be less prevalent during nighttime periods.
For dew point temperature, HRRR forecasts generally yield drier conditions during daytime than nighttime at both urban and rural sites across all seasons. Spring notably exhibits the strongest dry bias, on average with daytime MBE of −4.59 °C (urban) and −4.28 °C (rural), and nighttime MBEs of −1.93 °C (urban) and −1.86 °C (rural). Dew point forecasts show the best performance during summer nights, as reflected by narrower MBE spreads and less pronounced negative outliers with mean MBE of −0.16 °C (urban) and 0.01 °C (rural). Daytime periods consistently show dry biases across all sites and seasons. Wind speed forecasts reveal systematic overestimations year-round, with stronger biases at urban sites except during winter daytime. Although seasonable differences are relatively minor, HRRR forecasts are most accurate during summer daytime and winter nighttime.
3.2 Comparison of HRRR forecast skill at 0 and 18 h lead times
To assess the extent to which forecast performance may deteriorate with lead time, particularly within urban areas, we compared HRRR model performance between the 18 h lead-time forecasts and the 0 h forecasts, the latter of which incorporates data assimilated on hourly to sub-hourly timescales from multiple observational sources. As shown in the lower row of Fig. 4, the average annual MBEs of 2 m air temperature for the 0 h lead time forecasts (urban: −0.52 °C; rural: −0.17 °C) do not show marked improvement relative to the 18 h lead time forecast (urban: −0.28 °C, rural: 0.10 °C). However, the 0 h forecasts display notably lower variability in the temperature bias, with errors generally confined within ±2.5 °C, which indicates improved performance in capturing extreme temperatures.
Across individual seasons, rural sites consistently exhibit smaller MBEs under the 0 h forecasts compared to urban sites, while slightly larger temperature biases are observed using the 18 h forecast. A clear and substantial improvement is observed for dew point temperature in the 0 h forecasts, as suggested by the reduced biases, narrower spreads, and fewer extreme outliers using the 0 h forecasts, both annually and seasonally. Specifically, during summer and winter, average seasonal MBEs are close to zero, with average MBEs of 0.32 °C (urban) and 0.63 °C (rural) in summer, and −0.12 °C (urban) and −0.08 °C (rural) in winter. On an annual basis, average MBE for urban sites markedly improves from −2.0 °C (18 h) to −0.11 °C (0 h) and similarly for rural sites from −1.89 to 0.01 °C. In contrast, shorter lead time show negligible improvement for wind speed forecasts. The average annual MBEs for wind speed for 0 h forecasts (urban: 0.24 m s−1; rural: 0.14 m s−1) are nearly identical to those from the 18 h forecasts, indicating limited sensitivity to forecast lead time.
Overall, the near-real-time forecasts (0 h lead time) generally outperform 18 h forecasts in predicting extreme 2 m air temperatures and dew point temperatures. However, 0 h forecasts do not notably improve wind speed predictions. From an urban–rural contrast perspective, performance gains with shorter lead times are more evident in rural areas, while limited improvements in urban areas may reflect persistent deficiencies in the model's urban representation rather than input data constraints.
3.3 Nocturnal cooling behavior in HRRR forecasts
To better evaluate how well HRRR forecasts capture nighttime urban thermal conditions, we compared 18 h forecasted nocturnal cooling rates against in situ observations from both urban and rural sites throughout the study period. Out of 364 complete nights evaluated, 41 exhibited statistically significant nocturnal cooling (p<0.05), characterized by consistent air temperature decreases at both urban and rural sites (Fig. 6). Among these nights, there was no clear dominance in cooling behavior between land cover types, as urban sites showed faster cooling on 20 nights, while rural sites cooled faster on 21 nights. Seasonal variations in nocturnal cooling rates were notable, with winter and spring exhibiting the highest cooling rates. Specifically, mean cooling rate during winter was 0.88 °C h−1 at urban sites and 0.93 °C h−1 at rural sites, followed by fall with 0.60 and 0.69 °C h−1, respectively. HRRR forecasts effectively capture urban–rural cooling difference, as rural areas cooled slightly faster. Conversely, summer had the lowest forecasted cooling rates (0.33 °C h−1 at urban and 0.46 °C h−1 at rural sites), though based on only two clear nights due to frequent cloud cover.
Rapid cooling events – defined as cooling rates exceeding 1.00 °C h−1 – were forecasted on 27 and 24 nights at urban and rural sites, respectively. These events occurred most frequently during winter (14 urban and 10 rural cases) and fall (13 urban and 12 rural cases). However, no events exceeded 1.50 °C h−1 during the study period. The seasonal distribution of rapid cooling events shows no consistent pattern: based on HRRR forecasts, urban sites recorded one such event in winter and two in spring, while rural sites recorded three events across fall, winter, and spring. Inter-site variability in cooling rates remained low, as indicated by standard deviations of 0.36 ± 0.01 °C h−1 for both urban and rural sites.
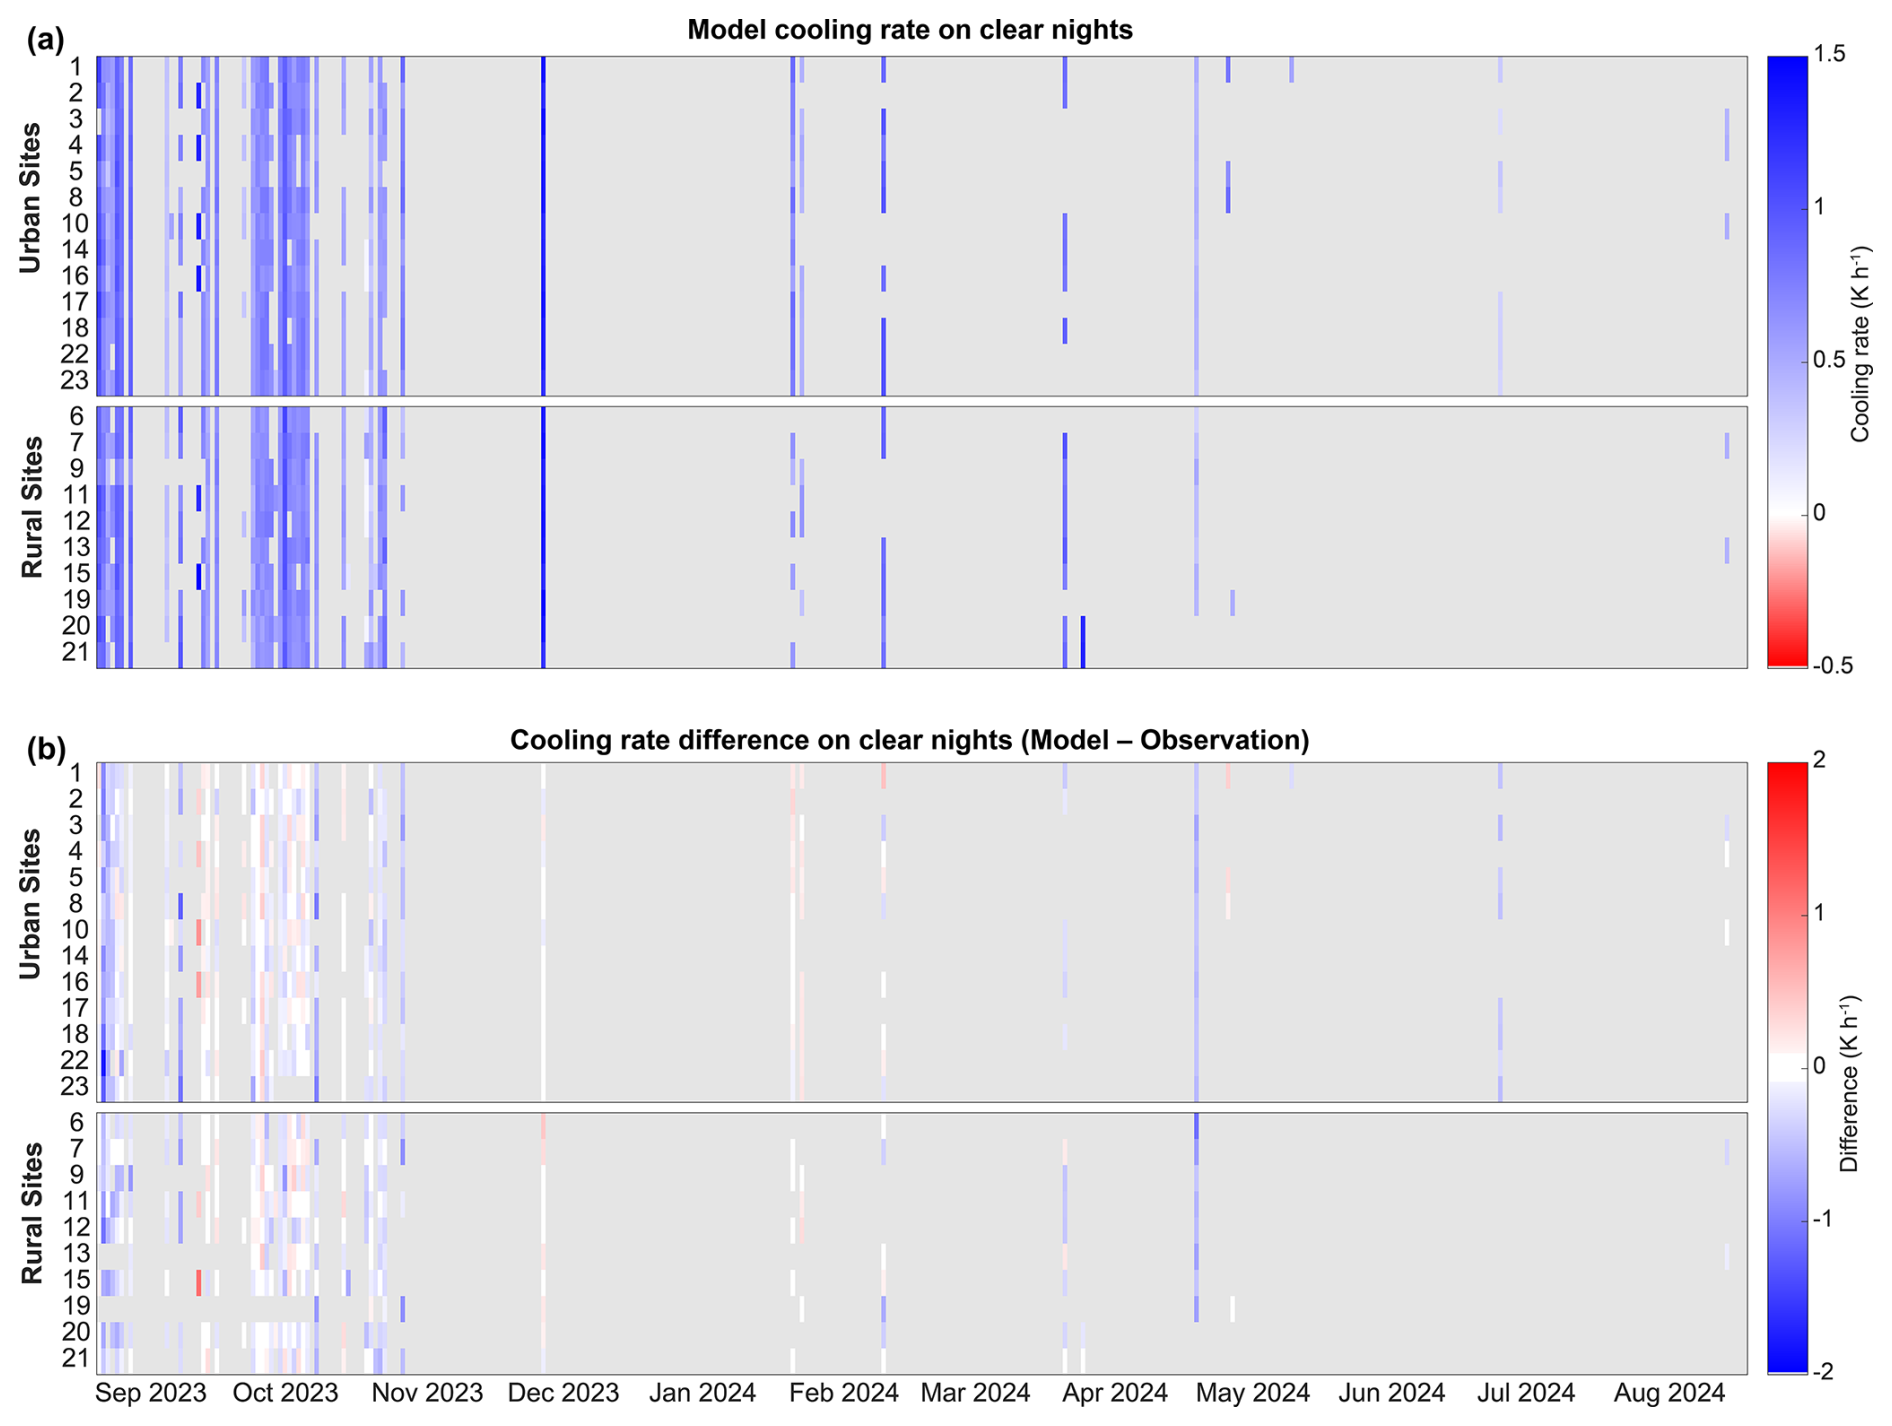
Figure 6Evaluation of nocturnal cooling rates on clear nights during the study period. (a) Forecasted cooling rates at urban and rural sites; negative values (red) indicate nighttime warming. (b) Difference between forecasted and observed cooling rates (HRRR – observation); positive values indicate that HRRR predicts stronger (more rapid) cooling than observation. Clear nights are defined as those with domain-wide cloud cover below 25 % between 00:00 and 05:00 local time. Only nights with statistically significant cooling rates (p<0.05) for both HRRR forecasts and observations are shown. Station numbering is listed in Table S1.
Model performance evaluated using MBE reveals systematic underestimation of nocturnal cooling. At urban sites, the HRRR predicted faster cooling than observations on 15 nights and slower cooling on 29 nights. Rural sites showed a similar pattern, with 13 nights of overestimated cooling rate and 32 nights of underestimation. The average MBE is −0.12 ± 0.27 °C h−1 at urban sites and −0.14 ± 0.26 °C h−1 at rural sites. Seasonally, except for winter when HRRR exhibited a slight overestimation of cooling rates (urban MBE: 0.05 °C h−1; rural MBE: 0.01 °C h−1), the model consistently underestimated cooling across all other seasons, averaging −0.28 °C h−1 at urban sites and −0.24 °C h−1 at rural sites.
Note that we also evaluated the sensitivity of the results to the selection criteria. Using only the statistical significance criterion (p<0.05) yields 51 nights, whereas applying a stricter 12.5 % cloud-cover threshold results in 40 nights. The conclusions remain unchanged across these sensitivity tests.
3.4 Urban heat advection in HRRR forecasts
Following the application of the filtering criteria outlined in Sect. 2.6, 110 nights were identified as effective nights suitable for evaluating wind-direction-dependent UHA. Among these, southerly winds, including south, southeast, and southwest directions, dominated, occurring on 62 nights, as shown in Fig. 7. This prevalence may reflect the influence of air masses originating from the Gulf of Mexico.
Observation-based UHA analysis provides a coherent picture of UHA dynamics. Observed temperature anomalies consistently shift downwind under all wind regimes, clearly reflecting the influence of prevailing winds. The observed UHA patterns also reflect the impacts of wind speed; distinct UHA signatures are less evident under both high wind speeds (e.g., northerly winds of 5.35 m s−1) and low wind speed (e.g., southeasterly winds of 3.41 m s−1). Overall, observations effectively characterize the spatial signature of UHA, revealing clear relationships between wind direction, wind speed, and UHA.
Analysis of UHA patterns derived from 18 h HRRR forecasts indicates that the model reasonably captures large-scale wind-direction patterns. However, its performance in representing UHA varies considerably among wind regimes. Under southeasterly, westerly, and northwesterly wind regimes, the HRRR effectively predicts the spatial displacement of urban heat downwind of the city core, demonstrating its capability to capture directional UHA patterns. A weak but discernible UHA pattern is also reproduced by the model under southerly wind conditions, suggesting that model captures this feature to some extent. In contrast, under northerly wind conditions, the model incorrectly predicts a cold-core anomaly centered over the urban area. Notably, HRRR-based UHA patterns show limited sensitivity to wind speed, as distinct urban heat advection signatures are not consistently observed across varying wind intensities, except under southeasterly conditions with relatively low wind speeds (i.e., < 3.40 m s−1).
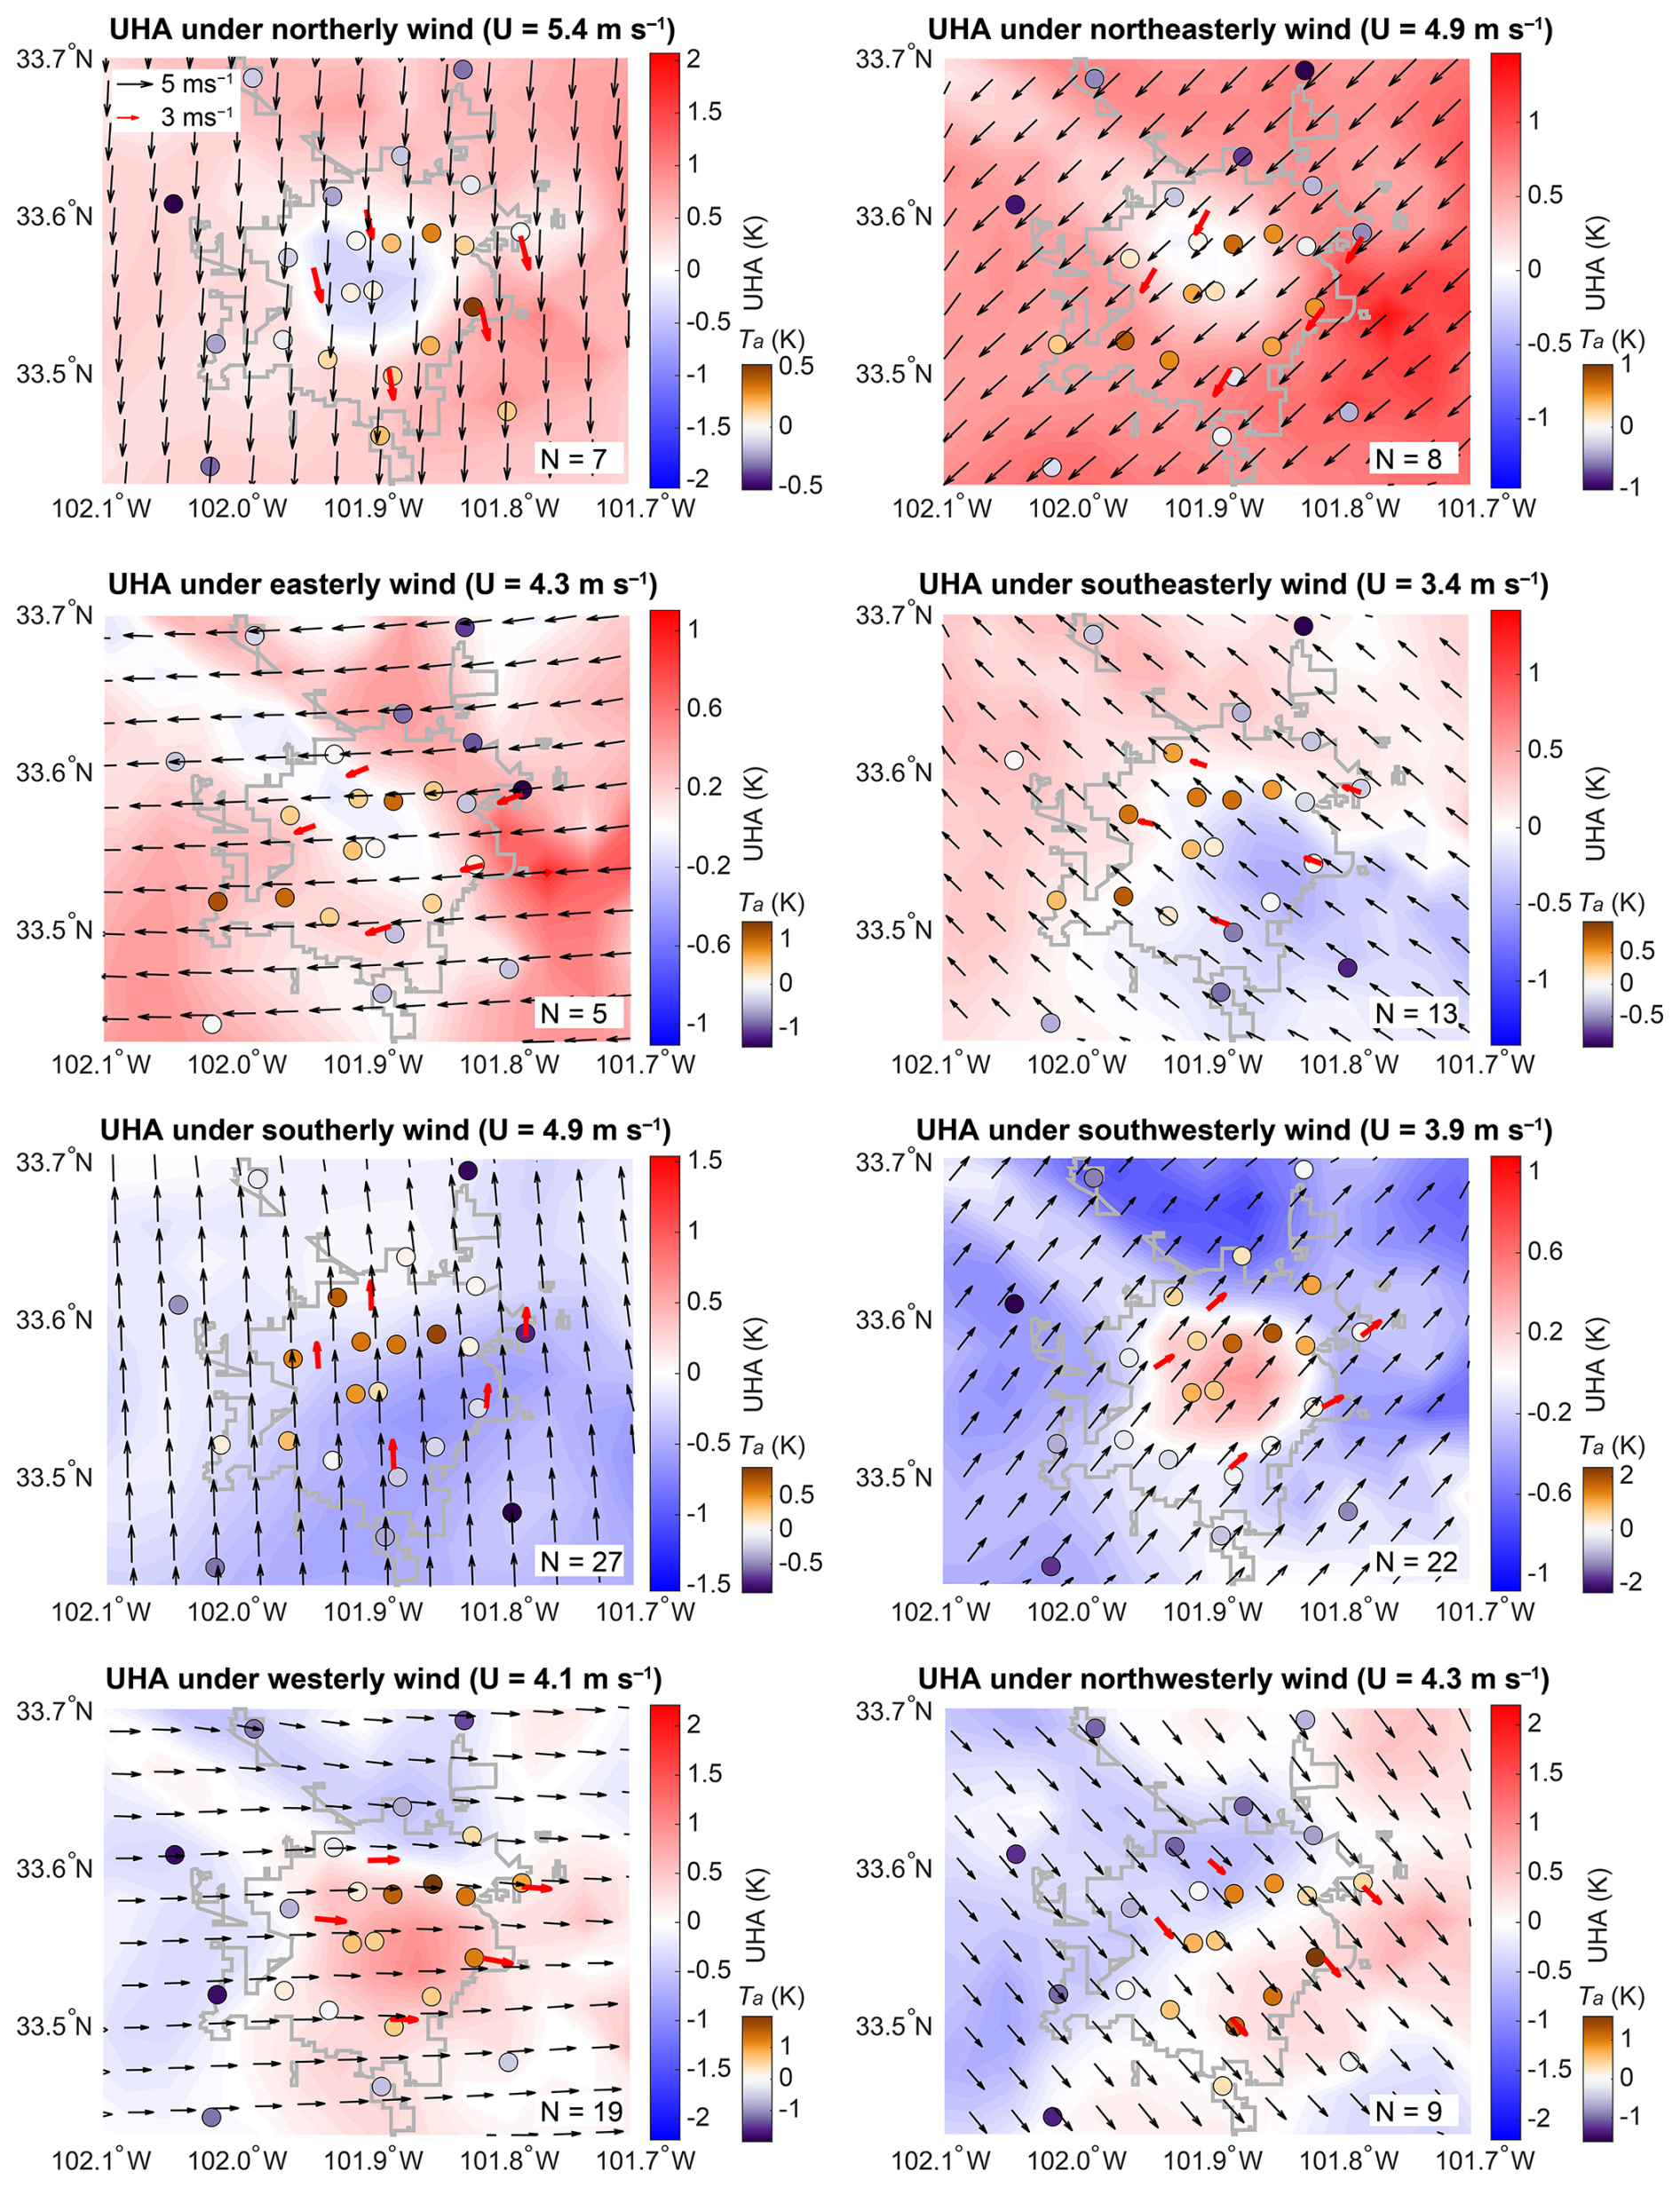
Figure 7Modeled mean Urban Heat Advection (UHA) patterns under eight distinct wind regimes during selected effective nights based on 18 h HRRR forecasts. Black arrows indicate mean wind fields from HRRR forecasts, while red arrows represent observed mean winds from five West Texas Mesonet stations. The gray boundary outlines Lubbock city limits. Colored scatter points depict averaged, normalized temperature anomalies (Ta) during each selected effective night.
Our analysis reveals distinct patterns and complexities in the ability of HRRR forecasts to reproduce near-surface hydrometeorological conditions and urban heat processes within semi-arid urban environments. Across rural sites, HRRR forecasts exhibit a characteristic pattern of overestimated daytime 2 m air temperatures and underestimated nighttime temperatures. This diurnal bias is largely driven by the model's systematic overprediction of incoming shortwave radiation, particularly evident during the warm season (Lee et al., 2023b), also evident in our seasonal analyses (Fig. 4), where summer exhibits higher warm bias at both urban and rural sites than other season. Similar patterns were documented in previous studies for rural areas. For instance, Lee et al. (2019) evaluated 1 h HRRRv2 forecasts of 2 m air temperature using two micrometeorological towers in rural northern Alabama and reported comparable daytime warm biases (average MBE = 0.85 °C) and nighttime cold biases (average MBE = −0.75 °C). A subsequent evaluation of HRRRv4 against 114 stations of the U.S. Climate Reference Network suggested an average MBE of approximately 0.4 °C for 18 h forecasts in 2021 (Lee et al., 2023b), with no particular emphasis on dryland cities. In urban areas, these existing biases are further complicated by HRRR's use of a simplified slab urban model, which omits detailed urban canopy geometry and thus cannot capture the shading and radiative trapping effects of urban street canyons. As a result, despite a positive bias in shortwave radiation leading to higher daytime temperatures (Fig. 5), the nighttime urban environment shows a consistent cold bias due to excessive nocturnal radiative cooling that would otherwise be impeded by urban geometry. The daytime cold bias is presumably driven by enhanced longwave radiation loss, linked to the same shortwave overestimation. This suggests that radiative trapping associated with urban surfaces (e.g., three-dimensional morphology) plays a critical role in shaping near-surface meteorological conditions, underscoring the importance of explicitly representing building structure and shading effects in urban settings.
Regarding dew point temperature, our observations indicate a consistent dry bias across all seasons, especially during the warm season at rural sites. This finding generally aligns with He et al. (2023), which used 6 h lead time forecasts to evaluate HRRR performance over northern Oklahoma over a full year cycle, an area with climatic and soil conditions analogous to Lubbock. In contrast to Lee et al. (2019), which did not detect significant dew point biases, our persistent dry bias could be attributed to systematic biases in HRRR's representation of incoming shortwave radiation (positive bias) and precipitation (negative bias) over the southwestern CONUS (Lee et al., 2023b). Interestingly, urban–rural contrasts in dew point temperature biases are less pronounced than anticipated. This diminished contrast likely results from the RUC LSM used in HRRR, known to overestimate soil moisture under dry conditions (soil moisture < 0.2 m3 m−3), particularly in semi-arid regions of the southwestern CONUS (Lee et al., 2023b). Similar soil moisture biases have also been found in previous studies using different LSMs (Leeper et al., 2017; Xia et al., 2015). Furthermore, the RUC LSM permits evaporation from urban impervious surfaces modeled as homogeneous slabs, thus maintaining relatively higher soil moisture levels. As a result, this may mask expected urban–rural contrasts in moisture availability.
Wind speed consistently exhibits a positive mean bias throughout all seasons at both urban and rural sites, echoing findings from Salamanca et al. (2018), which reported similar overestimations using various Noah-MP urban schemes in Phoenix. Our urban sites exhibit a notably larger positive wind speed bias compared to rural areas, likely due to HRRR's slab urban representation failing to simulate the blocking and drag effects of complex urban structures adequately. A recent evaluation of HRRRv4 using 788 Automated Surface Observing System (ASOS) stations across the US found nearly perfect correlations between observed and forecasted 10 m wind speeds, independent of forecast hour or time of day (Fovell and Capps, 2024). However, this evaluation was biased toward well-exposed stations. In the same study, a regional evaluation using 121 New York State Mesonet (NYSM) stations reported an average MBE of 1.22 m s−1, which is generally consistent with but slightly higher than our results. Notably, several rooftop urban weather stations in New York City were excluded from this evaluation due to mismatches with model heights (Fovell and Capps, 2024), which further illustrates the current lack of robust urban forecast evaluations. Nevertheless, the overestimation identified in our evaluation contrasts with recent findings by Thompson et al. (2025), which evaluated a long-term Noah-MP-based CONUS simulation and reported a persistent wind speed underestimation at urban sites. This recent study attributed the underestimation to inaccurate representation of urban roughness lengths and the use of airport weather stations from the CHUWD-H dataset (Wang et al., 2024) in model evaluations. These contrasting findings highlight the complexity of wind bias patterns and suggest that both model physics and the choice of observational references play critical roles in determining the reliability of wind predictions in urban areas.
Comparisons between two forecast lead times indicate that data assimilation, characteristic of near-real-time forecasts, partially improved HRRR's predictive performance, particularly by reducing extreme values and improving the simulated diurnal cycle. However, these improvements are not uniformly observed across all variables. Given that accurate surface-layer parameterizations of heat and moisture exchanges are becoming increasingly critical at longer forecast horizons, incorporating detailed, up-to-date land surface data through data assimilation remains essential for enhancing HRRR's overall predictive accuracy. To further investigate the role of land surface characteristics on model performance, we examined relationships between model biases and fractional land cover within HRRR grid cells. The RUC LSM integrates sub-grid heterogeneity, which calculates essential surface parameters (e.g., roughness length, emissivity, soil porosity) based on fractional land-use types instead of the dominant land type (Smirnova et al., 2016). As a result, grids with higher urban fraction and lower vegetation fraction are expected to exhibit greater model errors. Our analysis confirms this dependency on vegetation and urban fractions (Figs. S8 and S9). Specifically, increasing vegetation cover leads to reductions in cold biases for 2 m air temperature in fall and winter and notably decreased dry biases across all seasons except spring, especially during summer, as it allows enhanced biophysical processes of urban vegetation such as evapotranspiration. Conversely, higher urban fractions are associated with poorer performance in predicting temperature and dew point. These dependencies underscore the limitations of HRRR's simplified urban scheme and reinforce the need for more advanced urban canopy models in NWP systems.
Regarding nocturnal cooling rates, HRRR consistently underestimates the cooling rate relative to observations at both urban and rural sites. This milder cooling in simulations likely results from modeled excessive soil moisture, incurring slower nocturnal heat release due to larger soil thermal inertia. Interestingly, the HRRR accurately captures the expected urban–rural contrast, with urban areas showing slower cooling, which is likely influenced by the interplay between the land surface (high soil moisture) and atmospheric boundary layer.
Urban heat advection, which is critical to understanding spatial and temporal characteristics of canopy layer UHI, posed additional modeling challenges. Compared with megacities, small-sized cities are particularly sensitive to dominant synoptic conditions such as frontal passages (see Pal et al., 2025, for some example cases over Lubbock region), rendering them more likely to exhibit weaker urban heat signals. Given HRRR's systematic overprediction of wind speeds at Lubbock, accurately capturing UHA is inherently challenging, as shown by our results. Yet, previous studies have demonstrated superior performance of more sophisticated urban schemes, such as those embedded in WRF-urban, which effectively simulate urban heat related processes such as UHI effects especially under large scale weather impacts (Di Bernardino et al., 2022; Ribeiro et al., 2018). Thus, to advance predictive skill in urban environments, especially in small and semi-arid cities, future operational NWP models may incorporate more realistic urban canopy parameterizations, improve the treatment of land–atmosphere interactions, and account for dynamic surface properties such as detailed vegetation phenology or even anthropogenic heat fluxes.
We compared HRRRv4 forecasts of key surface hydrometeorological variables, including 2 m air temperature, 2 m dew point temperature, and 10 m wind speed, using in situ observations from 23 densely deployed U-HEAT sites and 5 Mesonet stations in and around Lubbock, Texas. In addition to standard statistical metrics, we also evaluated HRRR's ability to represent urban heat-related processes such as nocturnal cooling and UHA, particularly in the context of a small-sized city located in the semi-arid climate of the southwestern US.
During the study period, HRRRv4 demonstrates generally strong agreement with observed 2 m air temperature (r>0.95 and RMSE < 2 °C) and dew point temperature (r > 0.92 and RMSE < 4 °C). However, wind speed forecasts show persistent biases and weaker skill, particularly at urban sites, where the model fails to capture urban drag due to the use of a simplified slab urban model. Characteristic warm bias during the day and cold bias at night are observed at rural sites, while urban sites tend to show mainly cold biases. For dew temperature, a uniform dry bias is observed at both urban and rural sites, especially during the warm season and daytime. Interestingly, the urban–rural contrast in dew point temperature performance is very weak, likely due to overestimated urban soil moisture and evaporation in the model. While HRRR captures the slower nocturnal cooling rates in urban areas than rural surroundings, it generally underestimates cooling rates for both site types. HRRR forecasts also fail to accurately reproduce UHA patterns under most wind regimes due in part to the model's limitations in simulating near-surface wind fields. These deficiencies are likely linked to oversimplified urban parameterizations and inaccurate representation of urban surface characteristics such as thermal inertia, roughness length, and anthropogenic heat emissions.
Although this evaluation focuses on a single small city in a semi-arid climate, several of the identified forecast biases are likely to occur in other small cities under different climatic conditions. This expectation arises primarily from HRRR's use of a slab urban scheme, which simplifies urban surfaces, and is partially supported by previous evaluations of near-surface temperature and wind speed at non-urban sites. However, confirming the transferability of these biases will require dense, city-scale observational networks deployed in additional small cities. This is particularly important because many small urban areas are represented by only a few HRRR urban grid cells, yet can exhibit substantial spatial variability in vegetation fraction, soil moisture, and urban morphology.
Future work should advance evaluation and model development in parallel. Replicating this analysis in other small US cities that vary in population density, degree of urbanization, land cover, and background climate, with comparably dense within-city observations, will enable more systematic assessments of model performance and provide additional insight into the generalizability and scalability of our results. Future developments should prioritize the integration of advanced urban canopy parameterizations, refined sub-grid land surface heterogeneity, and high-resolution urban observations. More broadly, this evaluation highlights the limitations of applying conventional NWP systems to urban environments without targeted enhancements. As cities face growing challenges from extreme heat and flooding, poor air quality, and evolving land cover, integrating urban-specific processes into NWP frameworks (Wang et al., 2025) and examination of parameterization schemes (Lee et al., 2023a, 2025) will remain essential to ensure accurate, actionable forecasts in both research and operational contexts.
This appendix summarizes the slab urban parameterization implemented in the Rapid Update Cycle Land Surface Model (RUC LSM) within HRRRv4. Technical details are primarily based on Dowell et al. (2022) for HRRRv4, Smirnova et al. (2016) for the MODIS-based RUC LSM, and Benjamin et al. (2021) for the diagnostic fields.
A1 Surface representation and physical properties
Operational HRRRv4 couples the atmosphere model to the RUC LSM, which includes nine soil layers extending to a depth of 3 m. Urban areas are represented through the “urban and built-up” land-use category in the MODIS classification. The RUC LSM treats each urban grid cell as a slab surface (i.e., without explicit building geometry), rather than more advanced urban canopy models such as the single-layer urban canopy model.
RUC LSM in HRRRv4 uses a mosaic approach to account for sub-grid land-use heterogeneity. For each grid cell, surface parameters such as emissivity, leaf area index, and plant coefficient for transpiration function are computed as fractional-area weighted averages of all land-use types present. These aggregated values govern the grid-mean properties. However, the effective roughness length is not a simple area-weighted mean. It is computed based on a blending-height formulation following Mason (1988).
Sub-grid soil heterogeneity is similarly represented using the area-weighted mosaic method. Soil hydraulic and thermal properties, including heat capacity, Clapp–Hornberger parameterization exponent, available water capacity, saturated hydraulic conductivity, saturated soil matric potential, residual soil moisture, field capacity, wilting point, and quartz fraction, are averaged over soil types within the grid. The resulting effective parameters are used in the soil heat conduction and moisture transport equations.
In HRRRv4, the greenness fraction has been updated from climatological values to a real-time VIIRS-based green vegetation fraction product, allowing dynamic seasonal evolution of vegetation cover.
A2 Surface energy balance
The RUC LSM solves coupled heat and moisture transfer equations for soil and canopy layers together with a surface energy balance at the interface between the surface and the atmosphere. The net radiation flux at the surface is decomposed into sensible heat flux, latent heat flux, ground (soil) heat flux in the top layer, heat storage, and energy flux of snow phase change. The model solves for surface/skin temperature and specific humidity to close this balance using a root-finding algorithm. Surface exchange coefficients for heat and moisture are from the MYNN surface layer scheme, which provides stability-dependent turbulent transfer coefficients.
A3 Near-surface temperature, humidity, and wind
The 2 m air temperature is diagnosed using surface/skin temperature, sensible heat flux, air density, heat transfer coefficient, and potential temperature at the lowest prognostic model level (0.999σ or ∼ 8 m above ground level). The 2 m specific humidity is diagnosed from surface and lowest-level specific humidities, latent heat flux, air density, and moisture transfer coefficient. The 2 m dew point temperature is calculated directly from temperature, specific humidity, and pressure at the lowest prognostic model level.
The 10 m winds are estimated by logarithmic interpolation between model levels using Monin–Obukhov similarity, typically between the first and second model levels (0.999σ and 0.996σ or ∼ 8 and ∼ 30 m above ground level). The derived 10 m wind represents a grid-cell mean wind, consistent with the grid-mean roughness length.
A4 Known limitations of the HRRRv4 urban parameterization
Although HRRRv4 benefits from frequent data assimilation and high spatial resolution (3 km), the representation of urban processes remains simplified. Major limitations include:
-
Lack of explicit urban geometry. Buildings and streets are represented as a uniform slab, with no street-canyon radiative trapping and shading. As a result, nocturnal longwave trapping and diurnal shadowing effects are not captured.
-
Prescribed and static urban parameters. Thermal and radiative properties (e.g., emissivity, roughness, and heat capacity) are fixed for the urban land-use category and do not vary with geographic location, morphology, or building material.
-
Simplified surface heterogeneity. The sub-grid mosaic approach represents fractional contributions to parameters from multiple land use types but cannot resolve within-grid variations and interactions.
-
Diagnostic height inconsistency in urban canopy layers. The 2 and 10 m output variables essentially assume horizontally homogeneous, aerodynamically smooth surfaces and therefore do not accurately represent conditions within urban canopy layer, where the mean building height often exceeds the first or even second atmospheric model levels.
-
Simplified hydrology. Urban surfaces are not treated as fully impervious; infiltration and evaporation can still occur through soil properties. The model lacks stormwater routing or runoff storage, which limits its direct applications for hydrological or flood studies.
-
Omission of anthropogenic fluxes and urban vegetation management. Anthropogenic heat emissions, building energy use, or irrigation of green spaces, which can modify local energy and moisture balances, are not considered.
The NOAA Online Weather Data (NOWData) for Lubbock Area are available at https://www.weather.gov/wrh/Climate?wfo=lub (National Weather Service, 2025). Original HRRRv4 outputs can be accessed at https://rapidrefresh.noaa.gov/hrrr/ (National Oceanic and Atmospheric Administration, 2025). HRRRv4 uses the Weather Research and Forecasting (WRF) model v3.9.1, which is available at https://www2.mmm.ucar.edu/wrf/users/download/get_source.html (National Center for Atmospheric Research, 2025), with the namelist provided at https://rapidrefresh.noaa.gov/hrrr/wrf.nl.txt (National Oceanic and Atmospheric Administration, 2025). The processed HRRRv4 data, observations from West Texas Mesonet and U-HEAT, and source code are available at https://doi.org/10.5281/zenodo.15885174 (Huang and Wang, 2025).
The supplement related to this article is available online at https://doi.org/10.5194/gmd-18-9237-2025-supplement.
YH: Conceptualization, Data curation, Formal analysis, Investigation, Methodology, Software, Visualization, Writing (original draft preparation). CW: Conceptualization, Data curation, Funding acquisition, Investigation, Methodology, Project administration, Resources, Software, Supervision, Validation, Visualization, Writing (review and editing). TL: Data curation, Investigation, Validation, Writing (review and editing). TD: Data curation, Investigation, Validation, Writing (review and editing). SP: Conceptualization, Data curation, Funding acquisition, Investigation, Methodology, Project administration, Resources, Validation, Writing (review and editing).
The contact author has declared that none of the authors has any competing interests.
The scientific results and conclusions, as well as any views or opinions expressed herein, are those of the authors and do not necessarily reflect those of NOAA, OAR, the Department of Commerce, the South Central Climate Adaptation Science Center, or the USGS. This manuscript is submitted for publication with the understanding that the U.S. Government is authorized to reproduce and distribute reprints for Governmental purposes.
Publisher’s note: Copernicus Publications remains neutral with regard to jurisdictional claims made in the text, published maps, institutional affiliations, or any other geographical representation in this paper. While Copernicus Publications makes every effort to include appropriate place names, the final responsibility lies with the authors. Views expressed in the text are those of the authors and do not necessarily reflect the views of the publisher.
This work was supported by the National Oceanic and Atmospheric Administration (NOAA) Weather Program Office under grant No. NA21OAR4590361. We would like to thank our research partners at the National Wind Institute and the West Texas Mesonet (WTM), particularly Wesley Burgett, Matthew Asel, and Brian Hirth, for providing the WTM datasets essential to the development of the U-HEAT network. U-HEAT network has been routinely maintained by our community partners in Lubbock NWS, Citizen Climate Lobby and TTU graduate students Diya Das, Hassanpreet Dhaliwal, and Matthew Hamel. We also would like to thank Dr. Tatiana Smirnova for her help with the retrieval of the HRRR dataset.
This research has been supported by the National Oceanic and Atmospheric Administration (grant no. NA21OAR4590361), the National Aeronautics and Space Administration (grant nos. 80NSSC24K1056, 80NSSC24K0357, and 80NSSC25K7496), the National Science Foundation (grant no. OIA-2327435), and the U.S. Geological Survey (grant no. G24AC00475). Financial support for publication was provided by the University of Oklahoma Libraries' Open Access Fund.
This paper was edited by Ting Sun and reviewed by two anonymous referees.
Agarwal, M. and Tandon, A.: Modeling of the urban heat island in the form of mesoscale wind and of its effect on air pollution dispersal, Appl. Math. Model., 34, 2520–2530, https://doi.org/10.1016/j.apm.2009.11.016, 2010.
Angevine, W. M., White, A. B., Senff, C. J., Trainer, M., Banta, R. M., and Ayoub, M. A.: Urban–rural contrasts in mixing height and cloudiness over Nashville in 1999, J. Geophys. Res., 108, 2001JD001061, https://doi.org/10.1029/2001JD001061, 2003.
Barlow, J. F.: Progress in observing and modelling the urban boundary layer, Urban Clim., 10, 216–240, https://doi.org/10.1016/j.uclim.2014.03.011, 2014.
Bassett, R., Cai, X., Chapman, L., Heaviside, C., Thornes, J. E., Muller, C. L., Young, D. T., and Warren, E. L.: Observations of urban heat island advection from a high-density monitoring network, Q. J. R. Meteorol. Soc., 142, 2434–2441, https://doi.org/10.1002/qj.2836, 2016.
Bassett, R., Cai, X., Chapman, L., Heaviside, C., and Thornes, J. E.: The effects of heat advection on UK weather and climate observations in the vicinity of small urbanized areas, Bound.-Layer Meteorol., 165, 181–196, https://doi.org/10.1007/s10546-017-0263-0, 2017.
Bassett, R., Cai, X., Chapman, L., Heaviside, C., and Thornes, J. E.: Semi-idealized urban heat advection simulations using the Weather Research and Forecasting mesoscale model, Int. J. Climatol., 39, 1345–1358, https://doi.org/10.1002/joc.5885, 2019.
Benjamin, S. G., Dévényi, D., Weygandt, S. S., Brundage, K. J., Brown, J. M., Grell, G. A., Kim, D., Schwartz, B. E., Smirnova, T. G., Smith, T. L., and Manikin, G. S.: An hourly assimilation–forecast cycle: The RUC, Mon. Weather Rev., 132, 495–518, https://doi.org/10.1175/1520-0493(2004)132<0495:AHACTR>2.0.CO;2, 2004.
Benjamin, S. G., Weygandt, S. S., Brown, J. M., Hu, M., Alexander, C. R., Smirnova, T. G., Olson, J. B., James, E. P., Dowell, D. C., Grell, G. A., Lin, H., Peckham, S. E., Smith, T. L., Moninger, W. R., Kenyon, J. S., and Manikin, G. S.: A North American hourly assimilation and model forecast cycle: The Rapid Refresh, Mon. Weather Rev., 144, 1669–1694, https://doi.org/10.1175/MWR-D-15-0242.1, 2016.
Benjamin, S. G., James, E. P., Brown, J. M., Szoke, E. J., Kenyon, J. S., Ahmadov, R., and Turner, D. D.: Diagnostic fields developed for hourly updated NOAA weather models, NOAA Technical Memorandum OAR GSL-66, https://doi.org/10.25923/f7b4-rx42, 2021.
Best, M. J.: Representing urban areas within operational numerical weather prediction models, Bound.-Layer Meteorol., 114, 91–109, https://doi.org/10.1007/s10546-004-4834-5, 2005.
Bohnenstengel, S. I., Evans, S., Clark, P. A., and Belcher, S. E.: Simulations of the London urban heat island, Q. J. R. Meteorol. Soc., 137, 1625–1640, https://doi.org/10.1002/qj.855, 2011.
Brandsma, T. and Wolters, D.: Measurement and statistical modeling of the urban heat island of the city of Utrecht (the Netherlands), J. Appl. Meteorol. Climatol., 51, 1046–1060, https://doi.org/10.1175/JAMC-D-11-0206.1, 2012.
Bytheway, J. L., Kummerow, C. D., and Alexander, C.: A features-based assessment of the evolution of warm season precipitation forecasts from the HRRR model over three years of development, Weather Forecast., 32, 1841–1856, https://doi.org/10.1175/WAF-D-17-0050.1, 2017.
Caicedo, V., Rappenglueck, B., Cuchiara, G., Flynn, J., Ferrare, R., Scarino, A. J., Berkoff, T., Senff, C., Langford, A., and Lefer, B.: Bay breeze and sea breeze circulation impacts on the planetary boundary layer and air quality from an observed and modeled DISCOVER-AQ Texas case study, J. Geophys. Res.-Atmos., 124, 7359–7378, https://doi.org/10.1029/2019JD030523, 2019.
Charney, J., Quirk, W. J., Chow, S., and Kornfield, J.: A comparative study of the effects of albedo change on drought in semi-arid regions, J. Atmospheric Sci., 34, 1366–1385, https://doi.org/10.1175/1520-0469(1977)034<1366:ACSOTE>2.0.CO;2, 1977.
Chen, F. and Dudhia, J.: Coupling an advanced land surface–hydrology model with the Penn State–NCAR MM5 modeling system. Part I: model implementation and sensitivity, Mon. Weather Rev., 129, 569–585, https://doi.org/10.1175/1520-0493(2001)129<0569:CAALSH>2.0.CO;2, 2001.
Chen, F., Kusaka, H., Bornstein, R., Ching, J., Grimmond, C. S. B., Grossman-Clarke, S., Loridan, T., Manning, K. W., Martilli, A., Miao, S., Sailor, D., Salamanca, F. P., Taha, H., Tewari, M., Wang, X., Wyszogrodzki, A. A., and Zhang, C.: The integrated WRF/urban modelling system: development, evaluation, and applications to urban environmental problems, Int. J. Climatol., 31, 273–288, https://doi.org/10.1002/joc.2158, 2011.
Chen, S., Yang, Y., Deng, F., Zhang, Y., Liu, D., Liu, C., and Gao, Z.: A high-resolution monitoring approach of canopy urban heat island using a random forest model and multi-platform observations, Atmos. Meas. Tech., 15, 735–756, https://doi.org/10.5194/amt-15-735-2022, 2022.
Coelho, G. D. A., Ferreira, C. M., and Kinter III, J. L.: Multiscale and multi event evaluation of short-range real-time flood forecasting in large metropolitan areas, J. Hydrol., 612, 128212, https://doi.org/10.1016/j.jhydrol.2022.128212, 2022.
Cui, D., Liang, S., Wang, D., and Liu, Z.: A 1 km global dataset of historical (1979–2013) and future (2020–2100) Köppen–Geiger climate classification and bioclimatic variables, Earth Syst. Sci. Data, 13, 5087–5114, https://doi.org/10.5194/essd-13-5087-2021, 2021.
Dai, Y., Zeng, X., Dickinson, R. E., Baker, I., Bonan, G. B., Bosilovich, M. G., Denning, A. S., Dirmeyer, P. A., Houser, P. R., Niu, G., Oleson, K. W., Schlosser, C. A., and Yang, Z.-L.: The Common Land Model, Bull. Am. Meteorol. Soc., 84, 1013–1024, https://doi.org/10.1175/BAMS-84-8-1013, 2003.
Danzig, T. B., Pal, S., Medley, Z., Dhaliwal, H., Hamel, M., Sorensen, M., Das, D., Menon, K. V., Lee, T. R. and Conder, M.: Impact of advection on the urban heat of a small-sized city: The Urban Heat Island Experiment Around Lubbock, Texas (U-HEAT), Urban Clim., https://doi.org/10.1016/j.uclim.2025.102714, in press 2025.
Di Bernardino, A., Mazzarella, V., Pecci, M., Casasanta, G., Cacciani, M., and Ferretti, R.: Interaction of the sea breeze with the urban area of Rome: WRF mesoscale and WRF large-eddy simulations compared to ground-based observations, Bound.-Layer Meteorol., 185, 333–363, https://doi.org/10.1007/s10546-022-00734-5, 2022.
Dowell, D. C., Alexander, C. R., James, E. P., Weygandt, S. S., Benjamin, S. G., Manikin, G. S., Blake, B. T., Brown, J. M., Olson, J. B., Hu, M., Smirnova, T. G., Ladwig, T., Kenyon, J. S., Ahmadov, R., Turner, D. D., Duda, J. D., and Alcott, T. I.: An hourly updating convection-allowing forecast model. Part I: motivation and system description, Weather Forecast., 37, 1371–1395, https://doi.org/10.1175/WAF-D-21-0151.1, 2022.
Fenner, D., Christen, A., Grimmond, S., Meier, F., Morrison, W., Zeeman, M., Barlow, J., Birkmann, J., Blunn, L., Chrysoulakis, N., Clements, M., Glazer, R., Hertwig, D., Kotthaus, S., König, K., Looschelders, D., Mitraka, Z., Poursanidis, D., Tsirantonakis, D., Bechtel, B., Benjamin, K., Beyrich, F., Briegel, F., Feigel, G., Gertsen, C., Iqbal, N., Kittner, J., Lean, H., Liu, Y., Luo, Z., McGrory, M., Metzger, S., Paskin, M., Ravan, M., Ruhtz, T., Saunders, B., Scherer, D., Smith, S. T., Stretton, M., Trachte, K., and Van Hove, M.: urbisphere-Berlin Campaign: Investigating multiscale urban impacts on the atmospheric boundary layer, Bull. Am. Meteorol. Soc., 105, E1929–E1961, https://doi.org/10.1175/BAMS-D-23-0030.1, 2024.
Fovell, R. G. and Capps, S. B.: Sustained wind forecasts from the High-Resolution Rapid Refresh model: skill assessment and bias mitigation, Atmosphere, 16, 16, https://doi.org/10.3390/atmos16010016, 2024
Fovell, R. G. and Gallagher, A.: An evaluation of surface wind and gust forecasts from the High-Resolution Rapid Refresh model, Weather Forecast., 37, 1049–1068, https://doi.org/10.1175/WAF-D-21-0176.1, 2022.
Griffin, S. M., Otkin, J. A., Rozoff, C. M., Sieglaff, J. M., Cronce, L. M., Alexander, C. R., Jensen, T. L., and Wolff, J. K.: Seasonal analysis of cloud objects in the High-Resolution Rapid Refresh (HRRR) model using object-based verification, J. Appl. Meteorol. Climatol., 56, 2317–2334, https://doi.org/10.1175/JAMC-D-17-0004.1, 2017.
He, S., Turner, D. D., Benjamin, S. G., Olson, J. B., Smirnova, T. G., and Meyers, T.: Evaluation of the near-surface variables in the HRRR weather model using observations from the ARM SGP site, J. Appl. Meteorol. Climatol., 62, 769–780, https://doi.org/10.1175/JAMC-D-23-0003.1, 2023.
Heaviside, C., Cai, X.-M., and Vardoulakis, S.: The effects of horizontal advection on the urban heat island in Birmingham and the West Midlands, United Kingdom during a heatwave, Q. J. R. Meteorol. Soc., 141, 1429–1441, https://doi.org/10.1002/qj.2452, 2015.
Huang, J., Li, Y., Fu, C., Chen, F., Fu, Q., Dai, A., Shinoda, M., Ma, Z., Guo, W., Li, Z., Zhang, L., Liu, Y., Yu, H., He, Y., Xie, Y., Guan, X., Ji, M., Lin, L., Wang, S., Yan, H., and Wang, G.: Dryland climate change: Recent progress and challenges, Rev. Geophys., 55, 719–778, https://doi.org/10.1002/2016RG000550, 2017.
Huang, Y. and Wang, C.: Evaluation of High-Resolution Rapid Refresh forecasts in small cities, Zenodo [code and data set], https://doi.org/10.5281/zenodo.15885174, 2025.
Huang, Y., Wang, C., and Wang, Z.-H. Multi-parameterization of hydrological processes in an urban canopy model, Build. Environ., 285, 113567, https://doi.org/10.1016/j.buildenv.2025.113567, 2025.
Jongen, H. J., Lipson, M., Teuling, A. J., Grimmond, S., Baik, J.-J., Best, M., Demuzere, M., Fortuniak, K., Huang, Y., De Kauwe, M. G., Li, R., McNorton, J., Meili, N., Oleson, K., Park, S. -B., Sun, T., Tsiringakis, A., Varentsov, M., Wang, C., Wang, Z. -H., and Steeneveld, G. J.: The water balance representation in Urban-PLUMBER land surface models, J. Adv. Model. Earth Syst., 16, e2024MS004231, https://doi.org/10.1029/2024MS004231, 2024.
Kacker, K., Srivastava, P., and Mukherjee, M.: Personalized heat stress early warning system for an urban area, Environ. Int., 199, 109507, https://doi.org/10.1016/j.envint.2025.109507, 2025.
Katona, B., Markowski, P., Alexander, C., and Benjamin, S.: The influence of topography on convective storm environments in the eastern United States as deduced from the HRRR, Weather Forecast., 31, 1481–1490, https://doi.org/10.1175/WAF-D-16-0038.1, 2016.
Kidder, S. Q. and Essenwanger, O. M.: The effect of clouds and wind on the difference in nocturnal cooling rates between urban and rural areas, J. Appl. Meteorol., 34, 2440–2448, https://doi.org/10.1175/1520-0450(1995)034<2440:TEOCAW>2.0.CO;2, 1995.
Klein, P. M., Hu, X.-M., and Xue, M.: Impacts of mixing processes in nocturnal atmospheric boundary layer on urban ozone concentrations, Bound.-Layer Meteorol., 150, 107–130, https://doi.org/10.1007/s10546-013-9864-4, 2014.
Lac, C., Donnelly, R. P., Masson, V., Pal, S., Riette, S., Donier, S., Queguiner, S., Tanguy, G., Ammoura, L., and Xueref-Remy, I.: CO2 dispersion modelling over Paris region within the CO2-MEGAPARIS project, Atmos. Chem. Phys., 13, 4941–4961, https://doi.org/10.5194/acp-13-4941-2013, 2013.
Lee, T. R., Buban, M., Turner, D. D., Meyers, T. P., and Baker, C. B.: Evaluation of the High-Resolution Rapid Refresh (HRRR) model using near-surface meteorological and flux observations from northern Alabama, Weather Forecast., 34, 635–663, https://doi.org/10.1175/WAF-D-18-0184.1, 2019.
Lee, T. R., Pal, S., Krishnan, P., Hirth, B., Heuer, M., Meyers, T. P., Saylor, R. D., and Schroeder, J.: On the efficacy of Monin–Obukhov and bulk Richardson surface-layer parameterizations over drylands, J. Appl. Meteorol. Climatol., 62, 1655–1675, https://doi.org/10.1175/JAMC-D-23-0092.1, 2023a.
Lee, T. R., Leeper, R. D., Wilson, T., Diamond, H. J., Meyers, T. P., and Turner, D. D.: Using the U.S. Climate Reference Network to identify biases in near- and subsurface meteorological fields in the High-Resolution Rapid Refresh (HRRR) weather prediction model, Weather Forecast., 38, 879–900, https://doi.org/10.1175/WAF-D-22-0213.1, 2023b.
Lee, T. R., Pal, S., Leeper, R. D., Wilson, T., Diamond, H. J., Meyers, T. P., and Turner, D. D.: On the importance of regime-specific evaluations for numerical weather prediction models as demonstrated, Weather Forecast., https://doi.org/10.1175/WAF-D-23-0177.1, 2024.
Lee, T. R., Pal, S., Meyers, T. P., Krishnan, P., Hirth, B., Heuer, M., Saylor, R. D., Kochendorfer, J., and Schroeder, J.: Impact of the Bowen ratio on surface-layer parameterizations of heat, moisture, and turbulent fluxes in drylands, J. Appl. Meteorol. Climatol., 64, 549–568, https://doi.org/10.1175/JAMC-D-24-0075.1, 2025.
Leeper, R. D., Bell, J. E., Vines, C., and Palecki, M.: An evaluation of the North American Regional Reanalysis simulated soil moisture conditions during the 2011–13 drought period, J. Hydrometeorol., 18, 515–527, https://doi.org/10.1175/JHM-D-16-0132.1, 2017.
Li, C., Fu, B., Wang, S., Stringer, L. C., Wang, Y., Li, Z., Liu, Y., and Zhou, W.: Drivers and impacts of changes in China's drylands, Nat. Rev. Earth Environ., 2, 858–873, https://doi.org/10.1038/s43017-021-00226-z, 2021.
Lipson, M. J., Grimmond, S., Best, M., Abramowitz, G., Coutts, A., Tapper, N., Baik, J., Beyers, M., Blunn, L., Boussetta, S., Bou-Zeid, E., De Kauwe, M. G., De Munck, C., Demuzere, M., Fatichi, S., Fortuniak, K., Han, B., Hendry, M. A., Kikegawa, Y., Kondo, H., Lee, D., Lee, S., Lemonsu, A., Machado, T., Manoli, G., Martilli, A., Masson, V., McNorton, J., Meili, N., Meyer, D., Nice, K. A., Oleson, K. W., Park, S., Roth, M., Schoetter, R., Simón-Moral, A., Steeneveld, G., Sun, T., Takane, Y., Thatcher, M., Tsiringakis, A., Varentsov, M., Wang, C., Wang, Z., and Pitman, A. J.: Evaluation of 30 urban land surface models in the Urban-PLUMBER project: Phase 1 results, Q. J. R. Meteorol. Soc., 150, 126–169, https://doi.org/10.1002/qj.4589, 2024.
Lowry, W. P.: Empirical estimation of urban effects on climate: A problem analysis, J. Appl. Meteorol., 16, 129–135, https://doi.org/10.1175/1520-0450(1977)016<0129:EEOUEO>2.0.CO;2, 1977.
Lu, Y., Yu, Z., Albertson, J. D., Chen, H., Hu, L., Pendergrass, A., Chen, X., and Li, Q.: Understanding the influence of urban form on the spatial pattern of precipitation, Earth's Future, 12, e2023EF003846, https://doi.org/10.1029/2023EF003846, 2024.
Mason, P. J.: The formation of areally-averaged roughness lengths, Q. J. R. Meteorol. Soc., 114, 399–420, https://doi.org/10.1002/qj.49711448007, 1988.
Masson, V., Lemonsu, A., Hidalgo, J., and Voogt, J.: Urban climates and climate change, Annu. Rev. Environ. Resour., 45, 411–444, https://doi.org/10.1146/annurev-environ-012320-083623, 2020.
Meehl, G. A. and Tebaldi, C.: More intense, more frequent, and longer lasting heat waves in the 21st century, Science, 305, 994–997, https://doi.org/10.1126/science.1098704, 2004.
National Center for Atmospheric Research: WRF Source Codes and Graphics Software Downloads, https://www2.mmm.ucar.edu/wrf/users/download/get_source.html, last access: 4 October 2025.
National Oceanic and Atmospheric Administration: The High-Resolution Rapid Refresh (HRRR), https://rapidrefresh.noaa.gov/hrrr/, last access: 25 July 2025.
National Weather Service: NOWData – NOAA Online Weather Data, https://www.weather.gov/wrh/Climate?wfo=lub, last access: 25 July 2025.
Oke, T. R.: The distinction between canopy and boundary-layer urban heat islands, Atmosphere, 14, 268–277, https://doi.org/10.1080/00046973.1976.9648422, 1976.
Oke, T. R., Mills, G., Christen, A., and Voogt, J. A.: Urban Climates, Cambridge University Press, https://doi.org/10.1017/9781139016476, 2017.
Oleson, K. W., Bonan, G. B., Feddema, J., Vertenstein, M., and Grimmond, C. S. B.: An urban parameterization for a global climate model. Part I: formulation and evaluation for two cities, J. Appl. Meteorol. Climatol., 47, 1038–1060, https://doi.org/10.1175/2007JAMC1597.1, 2008.
Pal, S., Xueref-Remy, I., Ammoura, L., Chazette, P., Gibert, F., Royer, P., Dieudonné, E., Dupont, J.-C., Haeffelin, M., Lac, C., Lopez, M., Morille, Y., and Ravetta, F.: Spatio-temporal variability of the atmospheric boundary layer depth over the Paris agglomeration: An assessment of the impact of the urban heat island intensity, Atmos. Environ., 63, 261–275, https://doi.org/10.1016/j.atmosenv.2012.09.046, 2012.
Pal, S., Prince, N. E., Anand, M., and Hamel, M.: Aerosol transport and associated boundary layer thermodynamics under contrasting synoptic conditions over a semiarid site, Sci. Total Environ., 962, 178357, https://doi.org/10.1016/j.scitotenv.2024.178357, 2025.
Park, S., Sayeed, A., Seo, J., Henderson, B. H., Naeger, A. R., and Gupta, P.: Hour by hour PM2.5 mapping using geostationary satellites, ACS ES&T Air, 2, 1816–1830, https://doi.org/10.1021/acsestair.4c00365, 2025.
Ribeiro, F. N. D., Oliveira, A. P. D., Soares, J., Miranda, R. M. D., Barlage, M., and Chen, F.: Effect of sea breeze propagation on the urban boundary layer of the metropolitan region of Sao Paulo, Brazil, Atmospheric Res., 214, 174–188, https://doi.org/10.1016/j.atmosres.2018.07.015, 2018.
Salamanca, F., Zhang, Y., Barlage, M., Chen, F., Mahalov, A., and Miao, S.: Evaluation of the WRF-urban modeling system coupled to Noah and Noah-MP land surface models over a semiarid urban environment, J. Geophys. Res.-Atmos., 123, 2387–2408, https://doi.org/10.1002/2018JD028377, 2018.
Smirnova, T. G., Brown, J. M., Benjamin, S. G., and Kenyon, J. S.: Modifications to the Rapid Update Cycle land surface model (RUC LSM) available in the Weather Research and Forecasting (WRF) model, Mon. Weather Rev., 144, 1851–1865, https://doi.org/10.1175/MWR-D-15-0198.1, 2016.
Spronken-Smith, R. A. and Oke, T. R.: Scale modelling of nocturnal cooling in urban parks, Bound.-Layer Meteorol., 93, 287–312, https://doi.org/10.1023/A:1002001408973, 1999.
Stewart, I. D., Oke, T. R., and Krayenhoff, E. S.: Evaluation of the “local climate zone” scheme using temperature observations and model simulations, Int. J. Climatol., 34, 1062–1080, https://doi.org/10.1002/joc.3746, 2014.
Thompson, L., Wang, C., He, C., Lin, T.-S., Liu, C., and Dudhia, J.: Assessment of convection-permitting hydroclimate modeling in urban areas across the contiguous United States, Urban Clim., 61, 102375, https://doi.org/10.1016/j.uclim.2025.102375, 2025.
Unger, J., Savić, S., and Gál, T.: Modelling of the annual mean urban heat island pattern for planning of representative urban climate station network, Adv. Meteorol., 2011, 1–9, https://doi.org/10.1155/2011/398613, 2011.
U.S. Census Bureau, Population Division: Annual Estimates of the Resident Population for Incorporated Places of 20,000 or More, Ranked by July 1, 2023 Population: April 1, 2020 to July 1, 2023 (SUB-IP-EST2023-ANNRNK), https://www.census.gov/newsroom/press-kits/2024/subcounty-population-estimates.html (last access: 4 October 2025), 2024.
Vo, T. T., Hu, L., Xue, L., Li, Q., and Chen, S.: Urban effects on local cloud patterns, Proc. Natl. Acad. Sci. USA, 120, e2216765120, https://doi.org/10.1073/pnas.2216765120, 2023.
Wagner, T. J., Klein, P. M., and Turner, D. D.: A new generation of ground-based mobile platforms for active and passive profiling of the boundary layer, Bull. Am. Meteorol. Soc., 100, 137–153, https://doi.org/10.1175/BAMS-D-17-0165.1, 2019.
Wang, C. and Wang, Z.-H.: A network-based toolkit for evaluation and intercomparison of weather prediction and climate modeling, J. Environ. Manage., 268, 110709, https://doi.org/10.1016/j.jenvman.2020.110709, 2020.
Wang, C., Li, Q., and Wang, Z.-H.: Quantifying the impact of urban trees on passive pollutant dispersion using a coupled large-eddy simulation–Lagrangian stochastic model, Build. Environ., 145, 33–49, https://doi.org/10.1016/j.buildenv.2018.09.014, 2018a.
Wang, C., Deng, C., Horsey, H., Reyna, J. L., Liu, D., Feron, S., Cordero, R. R., Song, J., and Jackson, R. B.: CHUWD-H v1.0: a comprehensive historical hourly weather database for U.S. urban energy system modeling, Sci. Data, 11, 1383, https://doi.org/10.1038/s41597-024-04238-4, 2024.
Wang, C., Zhao, Y., Li, Q., Wang, Z., and Fan, J.: Ultrafine-resolution urban climate modeling: Resolving processes across scales, J. Adv. Model. Earth Sy., 17, e2025MS005053, https://doi.org/10.1029/2025MS005053, 2025.
Wang, J., Feng, J., and Yan, Z.: Impact of extensive urbanization on summertime rainfall in the Beijing region and the role of local precipitation recycling, J. Geophys. Res.-Atmos., 123, 3323–3340, https://doi.org/10.1002/2017JD027725, 2018b.
Wilks, D. S.: Statistical methods in the atmospheric sciences, 3rd Edn., Elsevier/Academic Press, Amsterdam, 676 pp., ISBN 9780123850225, 2011.
Xia, Y., Ek, M. B., Wu, Y., Ford, T., and Quiring, S. M.: Comparison of NLDAS-2 simulated and NASMD observed daily soil moisture. Part I: comparison and analysis, J. Hydrometeorol., 16, 1962–1980, https://doi.org/10.1175/JHM-D-14-0096.1, 2015.
Yang, L., Yang, Y., Shen, Y., Yang, J., Zheng, G., Smith, J., and Niyogi, D.: Urban development pattern's influence on extreme rainfall occurrences, Nat. Commun., 15, 3997, https://doi.org/10.1038/s41467-024-48533-5, 2024.
Yang, T.-H., Hwang, G.-D., Tsai, C.-C., and Ho, J.-Y.: Using rainfall thresholds and ensemble precipitation forecasts to issue and improve urban inundation alerts, Hydrol. Earth Syst. Sci., 20, 4731–4745, https://doi.org/10.5194/hess-20-4731-2016, 2016.
Youngquist, K., Shrestha, M., Ryan, B., and Mitra, C.: A global scoping review on sustainability, climate migration, and climate resilience of small and medium-sized cities (SMSC), Urban Clim., 49, 101546, https://doi.org/10.1016/j.uclim.2023.101546, 2023.
Zhang, F., Wang, C., and Wang, Z.-H.: Response of natural vegetation to climate in dryland ecosystems: A comparative study between Xinjiang and Arizona, Remote Sens., 12, 3567, https://doi.org/10.3390/rs12213567, 2020.
Zhang, K., Fang, B., Oleson, K., Zhao, L., He, C., Huang, Q., Liu, Z., Cao, C., and Lee, X.: Urban land expansion amplifies surface warming more in dry climate than in wet climate: A global sensitivity study, J. Geophys. Res.-Atmos., 130, e2024JD041696, https://doi.org/10.1029/2024JD041696, 2025.
Zhou, D., Xiao, J., Bonafoni, S., Berger, C., Deilami, K., Zhou, Y., Frolking, S., Yao, R., Qiao, Z., and Sobrino, J. A.: Satellite remote sensing of surface urban heat islands: Progress, challenges, and perspectives, Remote Sens., 11, 48, https://doi.org/10.3390/rs11010048, 2018.
- Abstract
- Introduction
- Datasets and methods
- Results
- Discussion
- Conclusions
- Appendix A: Technical summary of the urban parameterization used by the land surface model in HRRRv4
- Code and data availability
- Author contributions
- Competing interests
- Disclaimer
- Acknowledgements
- Financial support
- Review statement
- References
- Supplement