the Creative Commons Attribution 4.0 License.
the Creative Commons Attribution 4.0 License.
 | 29 Jun 2022
TIM: modelling pathways to meet Ireland's long-term energy system challenges with the TIMES-Ireland Model (v1.0)
James Glynn
Vahid Aryanpur
Ankita Gaur
Jason McGuire
Andrew Smith
Xiufeng Yue
Hannah Daly
Ireland has significantly increased its climate mitigation ambition, with a recent government commitment to reduce greenhouse gases by an average of 7 % yr−1 in the period to 2030 and a net-zero target for 2050, underpinned by a series of 5-year carbon budgets. Energy systems optimisation modelling (ESOM) is a widely used tool to inform pathways to address long-term energy challenges. This article describes a new ESOM developed to inform Ireland's energy system decarbonisation challenge. The TIMES-Ireland Model (TIM) is an optimisation model of the Irish energy system, which calculates the cost-optimal fuel and technology mix to meet future energy service demands in the transport, buildings, industry, and agriculture sectors, while respecting constraints in greenhouse gas emissions, primary energy resources, and feasible deployment rates. TIM is developed to take into account Ireland's unique energy system context, including a very high potential for offshore wind energy and the challenge of integrating this on a relatively isolated grid, a very ambitious decarbonisation target in the period to 2030, the policy need to inform 5-year carbon budgets to meet policy targets, and the challenge of decarbonising heat in the context of low building stock thermal efficiency and high reliance on fossil fuels. To that end, model features of note include future-proofing with flexible temporal and spatial definitions, with a possible hourly time resolution, unit commitment and capacity expansion features in the power sector, residential and passenger transport underpinned by detailed bottom-up sectoral models, cross-model harmonisation, and soft-linking with demand and macro models. The paper also outlines a priority list of future model developments to better meet the challenge of deeply decarbonising energy supply and demand, taking into account the equity, cost-effectiveness, and technical feasibility. To support transparency and openness in decision-making, TIM is available to download under a Creative Commons licence.
- Article
(2254 KB) - Full-text XML
- BibTeX
- EndNote


Ireland faces very significant challenges in meeting greater energy needs in the future with a much lower carbon footprint. Ireland has a high per capita carbon footprint relative to the European Union average (e.g. in 2018, 13.5 vs. 8.6 t CO2 e per capita (European Environmental Agency, 2022)) and was expected to fail its 2020 decarbonisation objective as set by the European Union (EU) (DCCAE, 2019). Under existing policy measures, overall greenhouse gases (GHGs) are projected to be relatively stable in the period to 2030 and to increase in the period to 2040 (EPA, 2020). In contrast, the EU's Effort Sharing Regulation sets forth a legislated target which increases the Irish decarbonisation objective to reduce non-emissions traded sector emissions by 30 % relative to 2005 levels by 2030 (CCAC, 2020). In 2019, the government presented a Climate Action Plan which set forth sector-by-sector measures to meet this increased ambition from the EU, which includes increasing the renewable electricity share to 70 % by 2030, for electric vehicles to reach full market share later in the decade, and very ambitious targets for retrofitting and electrifying home heating.
However, additional policy measures are needed to reduce emissions even faster. In 2020, a new government adopted an even more ambitious decarbonisation target to reduce emissions by 7 % annually in the period to 2030, more than halving emissions, and planning for a legislated net-zero emissions target by 2050 (Department of the Taoiseach, 2020). During the preceding decade, emissions decreased on average by only about 1 % annually (European Environmental Agency, 2022).
Ireland faces a number of challenges in meeting these objectives. First, a very high share of GHG emissions (34 % in 2018 (Duffy et al., 2019)1) in Ireland arise in the agricultural sector, which is a large and export-led part of the economy, dominated by beef and dairy production, with an emissions profile which is considered more difficult to abate than energy sectors. Slower mitigation in this sector will require energy to decarbonise faster. Second, transport and heating are heavily dependent on fossil fuels (with shares of 94 % and 96 % of consumption, respectively; SEAI, 2019), while dispersed settlement patterns and an inefficient building stock make improving efficiencies challenging. Third, while Ireland has already been successful in generating 42 % of its electricity from renewables in 2020, 86 % of which came from wind energy (SEAI, 2021), the relatively isolated nature of the electricity grid and lack of alternative low-carbon electricity sources will make it very challenging to integrate high shares of renewable electricity. The TIMES-Ireland Model (TIM) has been built to offer mitigation solutions taking these challenges into account (Balyk et al., 2021).
Energy system models have long been used to inform decarbonisation policies both in Ireland and other countries. Integrated and dynamic energy systems models have a number of advantages over single-sector or static approaches. Current energy systems are the result of complex country-dependent, multi-sector developments. The complex dynamics (incorporating technologies, fuel prices, infrastructures, and capacity constraints) of the entire energy system can be analysed through this modelling approach to better inform policy choices. A key strength is to approach energy as a system rather than as a set of discrete non-interactive elements. This has the advantage of providing insights into the most important substitution options that are linked to the system as a whole, which cannot be understood when analysing a single technology, commodity, or sector. A single focus on the electricity sector, for example, risks excluding possible unforeseen step changes in electricity demand because of, perhaps, the electrification of transport or of heating.
TIM is the successor to the Irish TIMES model (Ó Gallachóir et al., 2020), which has a long (more than 10 years) history of providing analytical input to Irish energy policy development, including acting as the basis for Ireland's first low-carbon roadmap in 2015 (Deane et al., 2013) and for developing energy pathways consistent with the Paris Agreement (Glynn et al., 2019), to which Ireland is a signatory. TIM is a new model and has been developed to better inform increased national climate mitigation ambition, to take into account the changing energy technology landscape, and to take advantage of new advances in energy systems optimisation modelling techniques, which are described in the remainder of this paper.
Internationally, TIMES models are used in a number of countries to understand and plan for long-term energy transitions, including in Denmark (Balyk et al., 2019), Ukraine (Petrović et al., 2021), and the United Kingdom (Fais et al., 2016; Daly et al., 2015).
Other energy system models in Ireland which are used to inform long-term pathways include the LEAP-Ireland model (Mac Uidhir et al., 2020; Rogan et al., 2014), based on a simulation approach, which is being co-developed with TIM to take advantage of data harmonisation and complement policy insights. Furthermore, the Economic and Social Research Institute (ESRI) develops the I3E model, a top-down computable general equilibrium (CGE) model (see Sect. 2.6). The 2019 Climate Action Plan was informed by McKinsey's marginal abatement cost curve (MACC) (DCCAE, 2019).
TIM is a significant step forward in the national energy systems modelling capacity. A number of features better enable this model to capture long-term energy systems transitions, enabling it to better inform very ambitious decarbonisation targets. These features are described in detail throughout the paper and are summarised in Sect. 4.
The rest of the paper is structured as follows: Sect. 2 gives a general description of the model, including a plain English description of the model (Sect. 2.1), an outline of the TIMES methodology and model generator (Sect. 2.2), an overview of the system (Sect. 2.3), the temporal and regional characteristics (Sect. 2.4), underlying demand drivers (Sect. 2.5), and the model development approach (Sect. 2.6). Section 3 describes the model sectors (supply, power, transport, residential, industry, services, and agriculture). Section 4 discusses model strengths, weaknesses, and priority areas for future development. Finally, Appendix A includes additional technoeconomic assumptions for future technologies.
2.1 Plain English description
The TIMES-Ireland Model produces energy system pathways for energy supply and demand in Ireland consistent with either a carbon budget or a decarbonisation target. It calculates the lowest cost configuration of energy fuels and technologies which meet future energy demands, while respecting technical, environmental, economic, social, and policy constraints. Key inputs and constraints include primary energy resource availability and costs, the technical and cost evolution of new mitigation options, and maximum feasible uptake rates of new technologies. Alternatively, TIM can be used to assess the implications of certain policies, namely regulatory or technology target setting (for example, biofuels blending obligation or the sales/stock share target for electric vehicles).
2.2 TIMES model generator
TIMES (The Integrated MARKAL-EFOM System) is a bottom-up optimisation model generator for energy–environment systems analysis at various levels of spatial, temporal, and sectoral resolutions (Loulou et al., 2016a, b). The TIMES code, written in GAMS and available under an open-source licence (IEA-ETSAP, 2020), is developed and maintained by the Energy Technology Systems Analysis Programme (ETSAP; https://iea-etsap.org/, last access: 18 May 2022), a Technology Collaboration Programme (TCP) of the International Energy Agency (IEA), established in 1976. TIMES models can have single or several regions and are typically rich in technology detail, used for medium- to long-term energy system analysis and planning at a regional, national, or global scale.
TIMES is a linear optimisation, technoeconomic, partial equilibrium model generator which assumes perfectly competitive markets and perfect foresight. Model variants enable myopic foresight, general equilibrium, stochastic programming, and a variety of multi-objective function options. The standard objective function maximises the net total surplus (the sum of producers' and consumers' surpluses) which, in a perfect market with perfect foresight, equates to maximising the net present value (NPV) of the whole energy system, maximising societal welfare. Profits, taxes, and subsidies are internal transfers, i.e. occurring within the economy, that do not change the NPV (albeit that taxes and subsidies can be included to influence the optimisation). It calculates the energy system specification which minimises the discounted total energy system costs over the model time horizon, which is the sum of investments, fixed and variable costs, fuel import costs, and export revenues for all the modelled processes less the potential salvage values of investments for which the whole lifetime goes beyond the model time horizon.
The user inputs the following to the model generator:
-
Reference energy system (RES), which is the process-flow architecture of economic sectors and energy flows (commodity) between processes (technology), which consume and produce energy, energy service demands, and/or other commodities such as environmental emissions (including greenhouse gases) and other materials. The base year energy flows are calibrated to national energy balances.
-
Energy service demands are the physical services required by the economy and society for mobility, heat, communications, food, etc., which drive energy demand.
-
Energy supply curves are the quantities of primary energy resources (e.g. wind power) or imported commodities (e.g. oil, gas, and bioenergy) available at specific costs points for differing quality and quantity of energy commodities.
-
Technoeconomic parameters of existing and potential future energy technologies are economic parameters including current and projected future investment and fixed/variable costs and efficiencies of technologies for energy supply (e.g. solar PV panels, transmission and distribution infrastructure, biorefineries, and hydrogen production) and energy demand (e.g. electric vehicles, natural gas boilers, and carbon capture and storage). Technological parameters include the transformation efficiency, availability factor, capacity factor, and emissions factor.
-
User constraints, which can be any combination of linear constraints (including fixed, maximum, or minimum bounds on growth, investment, or shares) on technologies or fuels. These are typically used to simulate real-world technology constraints or to simulate policy scenarios. A typical user constraint for decarbonisation analysis is limiting total annual or cumulative CO2 emissions to model energy system pathways that meet a national decarbonisation target.
TIMES outputs the optimal investment and operation level of all energy technologies which meet future energy service demands at least cost, while respecting user constraints. The model also produces corresponding energy flows, emissions, and marginal prices of energy and emissions flows.
2.3 Model architecture
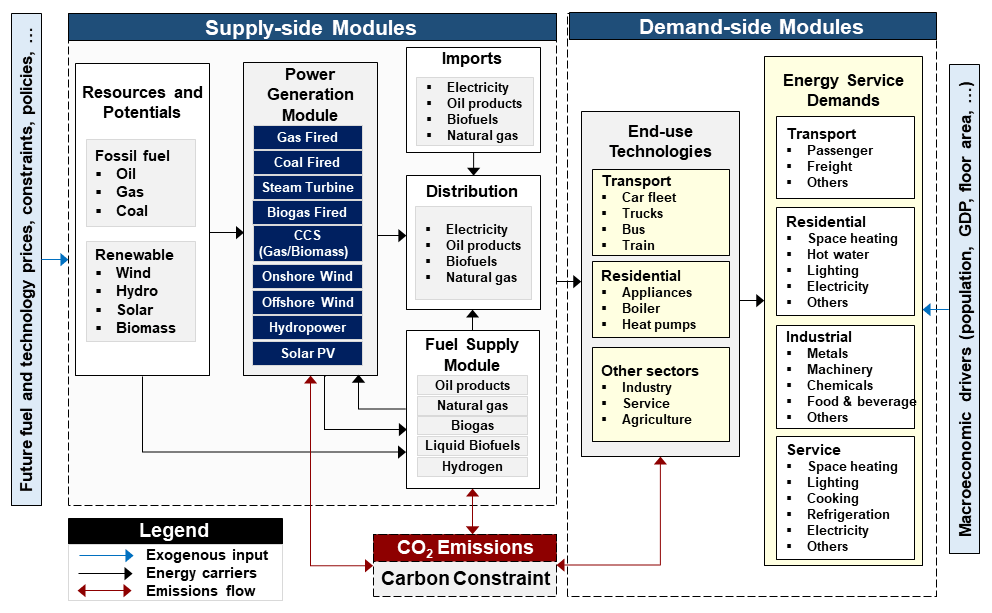
Figure 1 shows a simplified RES in TIM. It describes the structure and energy flows including two major parts, i.e. the supply side and demand side. The former comprises energy resources, fuel production and conversion technologies (e.g. biorefineries, hydrogen production, and different power plants), transmission, and distribution infrastructure (e.g. gas pipelines and power grid). The latter covers end-use sectors (e.g. transport and residential) and the corresponding energy service demands (i.e. passenger, freight, and hot water). Energy resources incorporate both domestic fossil-based fuels and renewable resource potential. These fuels are processed and then distributed across the country. End-use technologies consume energy commodities to meet energy service demands. GHG emissions from fossil fuels combustion and process-related emissions in industry are tracked with the fuel supply module, electricity generation technologies, and sectoral consumption levels.
The model's base year is 2018, and all energy flows, emissions, and energy technology stocks are calibrated to the 2018 energy balance (SEAI, 2019).
The discount rate, the degree to which future values are discounted to the present, is a key parameter in the TIMES objective function. A social discount rate reflects how society views present costs and benefits against future ones and is lower than a financial discount rate, which is how firms make investment decisions. In appraising potential projects or investments, the government applies a social discount rate. Broadly speaking, in an energy systems optimisation modelling (ESOM) scenario with a carbon budget constraint, a higher discount rate would promote later decarbonisation and fewer capital-intensive technology choices. In this model, a discount rate of 4 % is applied, which is based on a social rate of time preference methodology, as set forth in the Public Spending Code (O'Callaghan and Prior, 2018). This rate is consistent with García-Gusano et al. (2016), who recommend using a maximum value of 4 %–5 % for the social discount rate in ESOMs.
Technology-specific discount rates (also known as hurdle rates) are typically used in ESOMs to capture investment decision-making from the individual user or industry perspective to capture market imperfections, limited finance, and behavioural heuristics, which limit the uptake of novel or capital-intensive investments, even when they are cost-optimal. These parameters are not used in the core version of TIM, given its use for modelling long-term energy system pathways from a societal perspective. However, variants of the model can be developed to simulate real-world impacts of policies and behaviour, which can include hurdle rates (Aryanpur et al., 2022).
2.4 Time and geography
TIM has been developed with a deep knowledge of the geography of the Irish energy system. A special spatiotemporal approach was taken in the RES base year specification and scenario file data structures to allow flexible regional definitions and temporal resolution in TIM. The model can run in multiple modes with multiple configurations of regional and temporal resolution, ranging from a single region national model at a single annual time slice, all the way to 26 counties at hourly resolution where supply–demand data are available at that spatiotemporal granularity (electricity, gas, and transport).
High temporal granularity is needed to appropriately model energy futures with high variable renewable energy systems integration, especially in scenarios with high levels of electrification of end-use demands. At the same time, high temporal granularity can be computationally expensive and can significantly increase the time required for model development and testing. In TIM, we address this issue by constraining all time slice model input data to a single file generated with a specific temporal resolution. A time slice tool is used to aggregate raw time series data and create a file in the required format (Balyk, 2022).
High spatial granularity is required to give greater policy clarity on optimal investment needs based on region- and county-specific characteristics to enable the counteraction of socioeconomic challenges such as energy poverty and infrastructure development within an optimisation framework (Aryanpur et al., 2021). We address this in TIM by creating model input data structures that allow specifying data and formulating constraints on both national and county levels. Internal file switches, and user shell options, could then be used to apply TIM on either of the levels.
We have decided to focus on this data-driven spatiotemporal model set-up to future-proof TIM and enable future Irish energy policy research needs as data availability improves during TIM's lifespan.
2.5 Demands: drivers and projections
Energy service demands in end-use sectors are driven by growth in the population and in the economy. The model is set up to allow for alternative scenarios for these drivers, resulting in different energy service demand projections in the end-use sectors, e.g. as applied in Gaur et al. (2022a, b). This section describes baseline driver projections with a detailed description of energy service demand projections included in the respective sector sections.
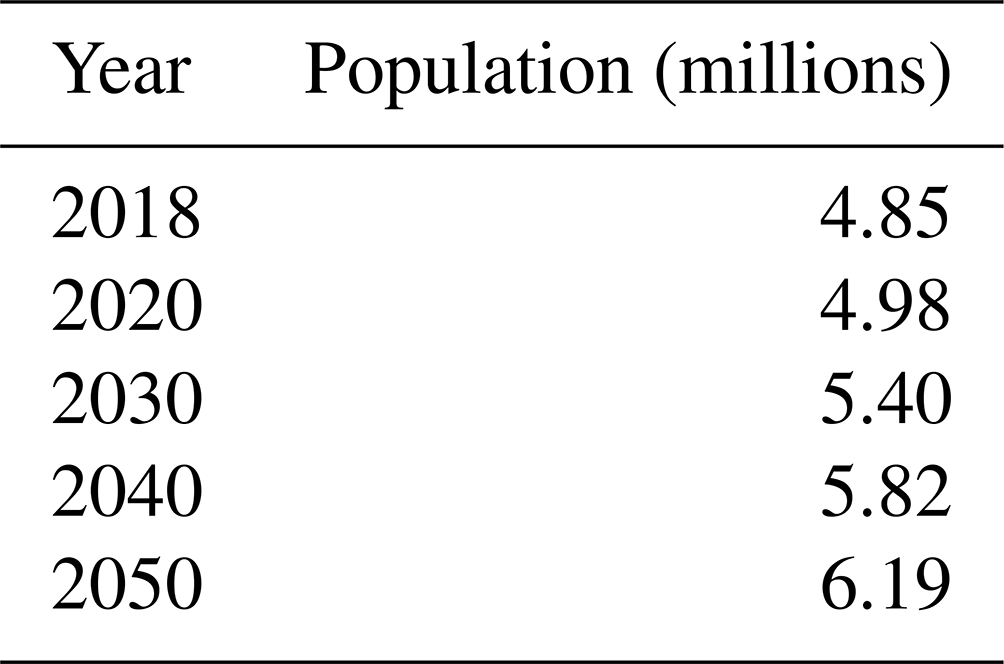
2.5.1 Population
Historical population estimates and future projections are obtained from CSO (2020d). We use the M2F1 scenario since it represents a medium growth in population and is in line with population projections used in other national sources (Yakut and de Bruin, 2020).
2.5.2 Economic growth
Economic growth projections are mostly taken from national sources to ensure internal consistency. Gross value added (GVA) and income projections are modelling outcomes from Bergin et al. (2017) and used by national sources. The following historical and projected data are used:
-
Historical gross value added (GVA) for the required NACE (statistical classification of economic activities in the European community) categories in the services and industry sectors is obtained from the EUROSTAT database. Projections for GVA are from the Ireland Environment, Energy, and Economy (I3E) model (Yakut and de Bruin, 2020).
-
Gross domestic product (GDP), both historical and future projections, is obtained from OECD (2018).
-
Income and historical values of total incomes are taken from CSO (2021). Assumptions about income growth in the future are from the National Transport Model (AECOM, 2019).
-
Modified gross national income (GNI∗) is derived from the Central Statistics Office (CSO) labour force scenario combined with a forecast for output per person (CSO, 2018).
Table 2Energy service demands in TIM.
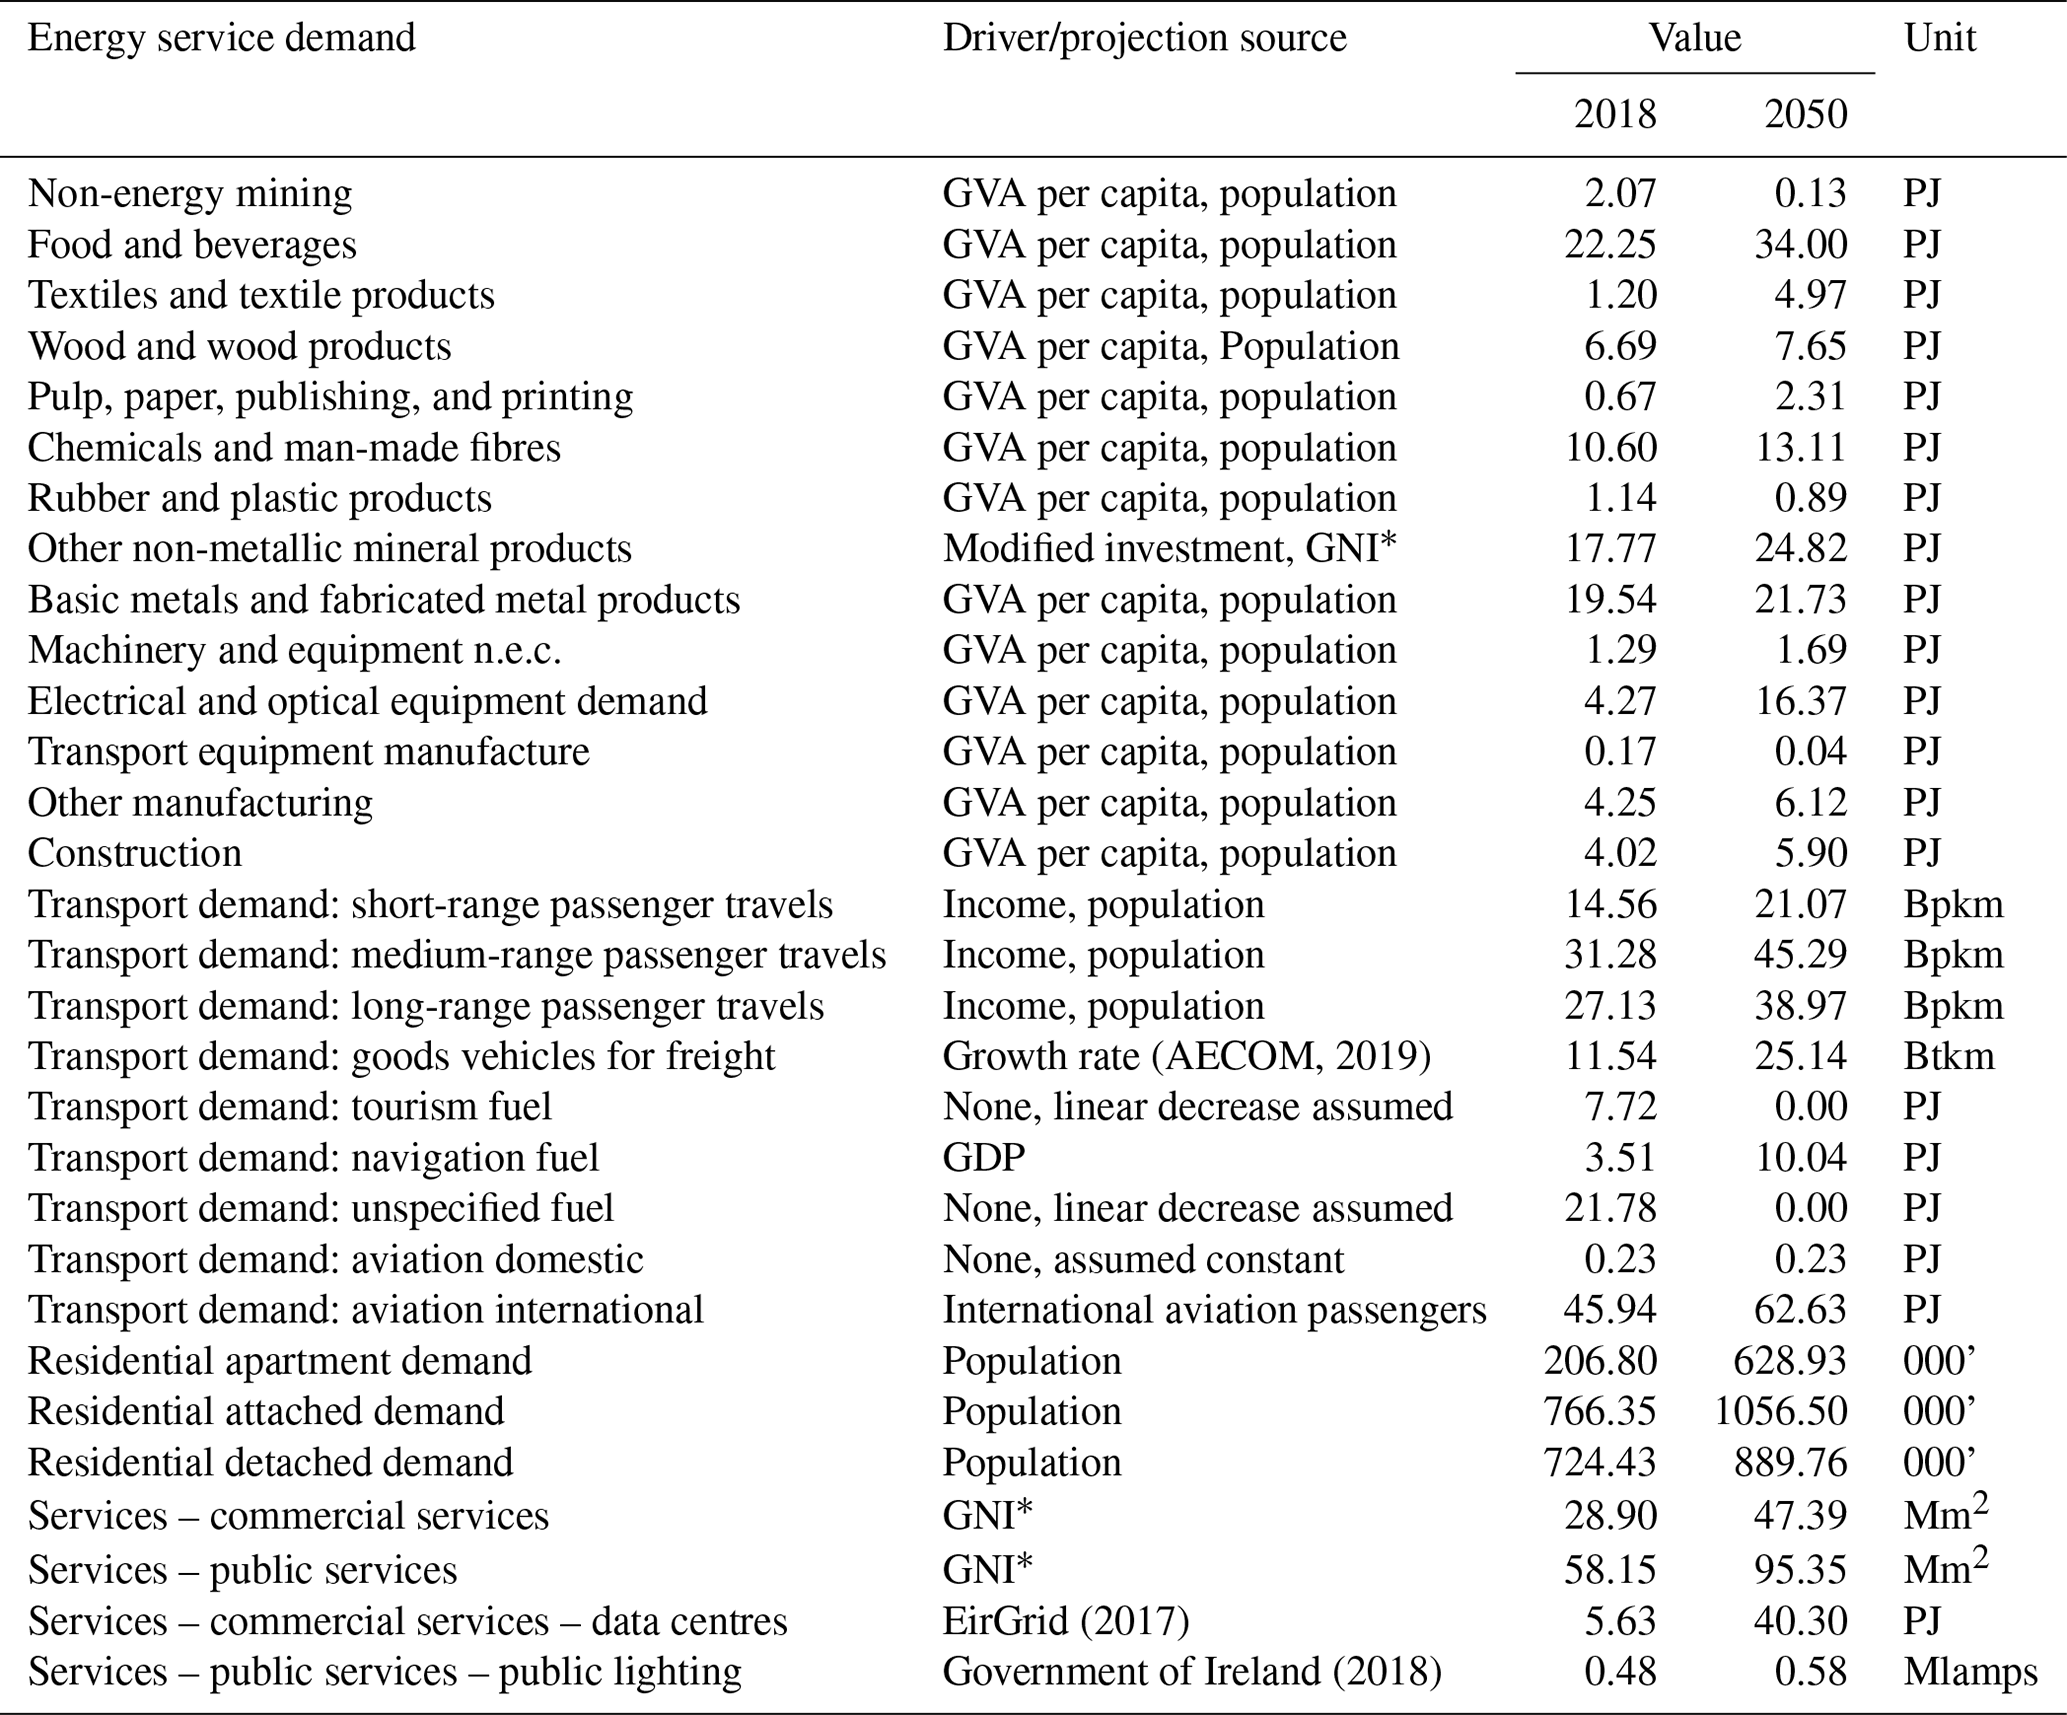
The abbreviations used in the table are as follows: Bpkm – billion passenger kilometres, Btkm – billion tonne kilometres, and Mlamps – million lamps.
2.5.3 Energy service demands
Table 2 lists the energy service demands in TIM along with their corresponding drivers and values for 2018 and 2050. Specifics of the methodologies for projecting each energy service demand are detailed in later sections, for transport (Sect. 3.3), residential (Sect. 3.4), industry (Sect. 3.5), and services (Sect. 3.6).
2.6 Development approach
TIM has been developed with the goal of achieving best-practice standards in software development and open modelling convention. A Git-centred model development process has been an integral part of the model development approach to enable version control and model management. Along with improvements in management, quality assurance, and transparency this brings, it also allows developers and researchers from different projects to branch research versions of the model to explore innovations and new developments, while keeping a secure and stable main version of the model for policy application. At the same time, individual projects and researchers can input their improvements and developments to the core model to enable continuous improvements.
TIM is freely available, which is a prerequisite for transparency, repeatable research, model maintenance, and enhancement and verification of results (Pfenninger et al., 2018).
Web-based dashboards (https://tim-review1.netlify.app/results/, last access: 18 May 2022) have been extensively used in the model development process, both for internal model diagnostics and for external engagement and review. The first TIM scenario results archive has also been published on Zenodo (Daly et al., 2021).
TIM has been co-developed with the LEAP-Ireland model (Mac Uidhir et al., 2020), which is a bottom-up simulation model of the Irish energy system which simulates the impact of different policy measures and targets on overall GHG emissions in Ireland, with a particularly granular representation of transport and residential heat demand. Underlying data for the relevant sectors are shared between TIM and LEAP using a data repository and a shared coding convention dictionary to improve the consistency between the models, give more robust analytical insights for policy, and to share and exchange expertise between the modelling teams. This also facilitates multimodel approaches to energy systems modelling, which can make use of harmonised hybrid frameworks coupling simulation and optimisation simultaneously (Rogan et al., 2014).
TIM has also been developed to enable soft-linking with the Ireland Environment, Energy, and Economy (I3E) macroeconomic model developed at the Economic and Social Research Institute (ESRI; Yakut and de Bruin, 2020). I3E is a single-country, multi-sector (NACE) inter-temporal computable general equilibrium (CGE) model focusing on environmental and energy accounts in Ireland. While COre Structural MOdel for Ireland (COSMO) focuses on the influence of monetary and fiscal policy on economic activity in Ireland, I3E supplements the macroeconomic outlook from COSMO with environmental and energy disaggregation. I3E retrieves economic growth rates and population estimates from COSMO. TIM derives macroeconomic drivers coupled to the output variables of I3E, enabling scenario variants based on alternative monetary, fiscal, and macroeconomic futures, as well as rapid energy system outlook updates aligned with the update cycle of the macroeconomic outlooks from the ESRI.
3.1 Supply
3.1.1 Overview
The supply sector (SUP) in TIM represents the primary and secondary energy commodities and the processes by which those same commodities are imported, exported, domestically produced through mining or capture of renewable energy potentials, and transformed or refined for end-use consumption within the energy system both in the base year (2018) and into the future. The supply sector declares the future available routes for commodity trade for the import and export of energy commodities in terms of the quantity of energy and in terms of import capacity through ports, pipelines, and interconnectors at any given time in the model horizon.
3.1.2 Energy balance and commodity declarations
Building the supply sector begins with declaring the energy commodities as per the SEAI (2019) energy balance, as reported to the International Energy Agency. Care is taken to ensure best-practice coding conventions are followed for each commodity – coal, oil, gas, first- and second-generation bioenergy (biogas, bioliquids, and solid biomass), liquid and gaseous hydrogen, wind, solar, geothermal, wave, tidal, municipal wastes, agriculture wastes, and industrial food waste. Active transport time for walking and cycling is also declared. All base year commodities are declared in the supply sector to maintain clear, tidy, and transparent data structures within TIM.
The model development team co-created a convention dictionary workbook within the main repository that utilises automated three-letter coding conventions for technology, commodity, and file name creation. This designed and followed code convention enables the clean creation of process sets, commodity sets, results sets, and data automation routines for preprocessing and postprocessing data inputs, data outputs, and results. Ultimately, this makes the model architecture more transparent and easy to develop, enabling new users into the community of developers and peer review. Moreover, setting out a predefined and intuitive commodity naming convention and a dictionary that is shared across TIM and LEAP-Ireland has multiple benefits for the multimodel coupling, diagnostics, and results reporting that are discussed.
3.1.3 Emissions tracking
The environmental emissions from each primary energy commodity are tracked on the basis of energy- and process-based emissions via combustion and activity-based emissions intensity factors, calibrated on a sector-by-sector basis. Within the supply sector, methane, nitrogen dioxide, sulfur dioxide, carbon dioxide, nitrogen oxide, and particulate matter can be tracked in the sector's emissions accounting balance. In the current version of TIM, biomass is assumed to be carbon neutral. However, future versions of the model may include different assumptions on emissions linked to use of biomass.
3.1.4 Import/export
Primary and secondary energy commodities, both fossil energy and bioenergy, are imported from international markets at international prices. There are no constraints on the import quantity of oil and coal, as it is assumed that international markets can supply domestic demand and that there is sufficient on island storage aligned with International Energy Agency – Organisation for Economic Co-operation and Development (IEA-OECD) energy security protocols. Imported gas via pipeline and liquefied petroleum gas (LPG) are modelled on an annual basis. Bidirectional electricity interconnectors to the UK are also represented. Greenlink and Celtic interconnectors are assumed operational from 2023 and 2026, respectively.
3.1.5 Fuel prices
Fuel prices for each imported energy commodity are sourced from IEA (2019, 2020). Secondary commodity import prices are index linked to the primary commodities by a price ratio on the basis of the current ratio between primary and secondary commodity prices. For example, imported gasoline is assumed to be 1.65 times the price of crude oil per unit energy.
3.1.6 Domestic energy resources
Domestic fossil fuel reserves for the production of natural gas from both the Corrib and Kinsale gas fields and the production of peat are calibrated with two-step supply curves. These supply curves are constrained in terms of cumulative energy reserves, annual production costs, and annual production output in energy terms to account for typical production profiles from each field.
Renewable energy potentials (hydro, wind, solar, waste, ocean, geothermal, and ambient heat) are declared in the supply sector but are calibrated and constrained in their relevant sectors, such as power generation and transport.
3.1.7 Bioenergy potentials
Bioenergy potentials are calibrated to SEAI (2015), both in terms of sustainable import volume availability and domestic production potential. Domestic bioenergy potentials such as sawmill residues, post-consumer recycled wood, municipal waste, tallow, recovered vegetable oil, straw, animal waste, and industrial food wastes are modelled with three-step supply curves in terms of price and quantities available. Crop-based bioenergy feedstocks are modelled within the agriculture sector. Domestic bioenergy supply potentials and costs are sensitive to scenarios narrative and, as such, are modelled within scenario files to account for uncertainty.
3.1.8 Refineries
Ireland has only one oil refinery, i.e. Whitegate in County Cork. It is calibrated to import crude oil at international prices and converts crude oil to refined products limited by the upper bounds of output shares, such that the output has flexible upper shares of 22.9 % gasoline, 8.1 % kerosene, 40.9 % diesel, and 34.4 % heavy fuel oil. The refinery is constrained to stay at current capacity, has a lifespan of 50 years, and the production costs are differentiated by production (flow) costs for each output fuel.
3.1.9 Electricity interconnectors
Existing electricity interconnectors to the UK are calibrated such that exports are priced 30 % lower than imports. The 2018 export and import quantities of electricity are calibrated as per historical data. The future activity is constrained using upper bounds, given that TIM does not model the UK electricity market other than through a predefined price signal. This constrain can be relaxed but is used to explore domestic needs for system flexibility, security, system services, and storage. Neither reinforcement of existing interconnectors nor investment in new interconnectors is currently included in the model.
3.1.10 Biorefineries
Future biorefinery technologies are defined in the supply sector future technology (SubRES) database. The following technologies are defined: (1) ethanol production from wheat, woody biomass, and grass, (2) biodiesel production from oilseed rape (OSR), woody biomass, industrial food waste, recovered vegetable oil (RVO), and tallow, (3) wood pellets production from biomass, and (4) biogas production from grass, woody biomass, municipal waste, industrial food waste, and animal wastes. All biorefining technologies are defined in terms of the start year, efficiency, investment costs, availability factor, and the operation and maintenance costs.
3.1.11 Hydrogen
Hydrogen production is modelled, distinguishing future investments in centralised and decentralised electrolysis options. Delivery options are disaggregated and costed at high pressure for both transmission and distribution pipelines and a road tanker option for distribution. Hydrogen storage is also modelled within TIM at the finest time slice level, allowing hourly production and consumption of hydrogen to be represented. This is particularly useful for modelling electricity grid balancing with unit commitment, dispatch, and capacity expansion, while capturing variable renewable energy system dynamics.
3.2 Electricity
3.2.1 Overview
Ireland has a high share of variable renewable electricity for a relatively isolated grid, with 32.5 % of electricity generation in 2019 coming from onshore wind energy. Achieving the 2020 electricity from renewable energy sources (RES-E) target has encouraged strong growth in onshore wind, while increasing the non-synchronous penetration of renewables to 70 % by 2030, including offshore wind development, is a key policy objective over the next decade as Ireland moves towards a net-zero carbon electricity system.
3.2.2 Existing dispatchable grid
The existing 61 generation unit fleet is calibrated to the base year of 2018 from the Commission for Energy Regulation (CRU) I-SEM validated PLEXOS model (Geffert et al., 2018). Each existing generation unit can be explicitly modelled with a possibility to use unit commitment within TIM. This model configuration includes the generation unit capacity, the fuel type of each generation unit, the start-up costs (from cold, warm, and hot), the efficiency curve of the generation unit to include startup and shutdown phases, startup and shutdown times (cold, warm, and hot), the ramp rates, minimum load, efficiency at minimum load, minimum uptime and minimum downtime, the unit lifespan, the unit annual availability, and the start year of the unit (Geffert et al., 2018). The near-term generation unit pipeline is calibrated to EirGrid and SONI (2019, 2020) to account for early closures of units before their economic lifespan, which largely takes into account coal- and peat-based plants during the next decade. We have not forced a new capacity of future planned power plants from EirGrid and SONI (2020) in TIM, which includes recent battery storage installations. These recent and planned units can be forced via a scenario file.
Existing 302 onshore and 1 offshore wind farms within the Irish Wind Energy Association database currently operate as a single aggregated generation pool governed by historical hourly availability factors for wind generation from 2018.
3.2.3 Future electricity system
New generation capacity investment costs, fixed and variable operation, and maintenance costs and technical efficiencies are derived from Carlsson et al. (2014). The future unit commitment dispatch operational constraints and cycling costs are generalised for each technology type based on the fuel and vintage (Kumar et al., 2012).
Renewable energy potentials are based on a number of sources. Total energy resource availability of solar and wind are from Pfenninger and Staffell (2016) and Staffell and Pfenninger (2016), respectively, with availability factors from Ruiz et al. (2019). Ocean and tidal energy potentials are from O'Rourke et al. (2010), and the wave energy power matrix (for a comprehensive discussion, see, e.g., https://www.sciencedirect.com/topics/engineering/matrix-power, last access: 18 May 2022) is derived from Nambiar et al. (2016). Hourly availability factors for ocean energy technologies are derived from the marine institute and Office of Public Works' data buoy services.
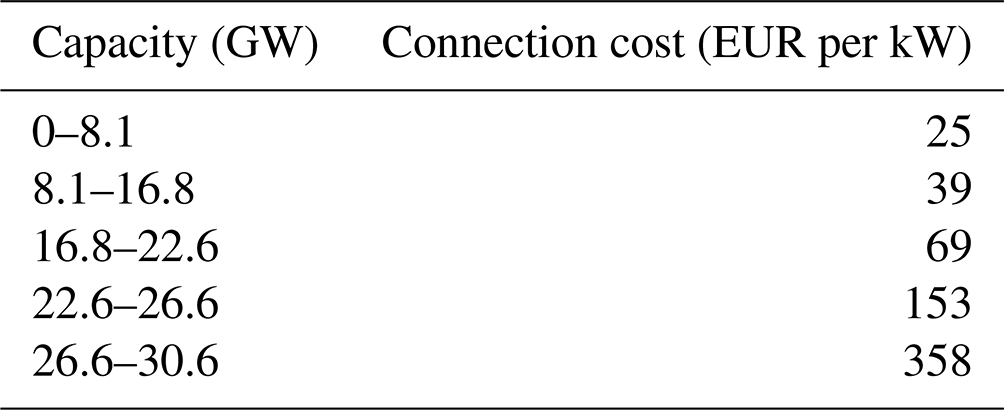
Future onshore wind energy potential has been assessed at high spatial resolution using geographic information system (GIS) techniques. Wind farm expansion is constrained by both technology costs and a supply curve for grid connections, based on a GIS analysis of existing houses, special areas of heritage and conservation, existing grid lines by voltage specification, wind energy potential, existing substation locations, and the costs per kilometre of the standard Electricity Supply Board (ESB) grid line specifications to connect wind resource potential to the existing grid. The wind energy potential is defined as a cost curve aggregated from 1938 suitable land parcels from a GIS analysis (Fig. 3). Due to the fact that increasing both technical details and the temporal resolution causes exponential increase in model size, the spatial resolution is simplified and is represented in a four-step cost curve (Table 3). This can be disaggregated on a spatial resolution down to each individual parcel of land or on a county-by-county basis. Future wind energy can generate at the same hourly capacity factor that occurred in 2018 but with capacity expansion.
Losses from electricity transmission and distribution are assumed to be 7 %, with no grid expansion costs currently represented in the model. The maximum share of variable renewable energy, including wind, solar, and wave energy is constrained at 75 % by 2030, and 100 % is allowed by 2050. The model technology database includes short-term storage battery technologies, medium-term pumped hydro storage, and long-term hydrogen storage. All these storage technology options are typically deployed in hourly unit commitment capacity expansion scenarios and provide ancillary services and balancing in 100 % variable renewable energy source (VRES) scenarios.
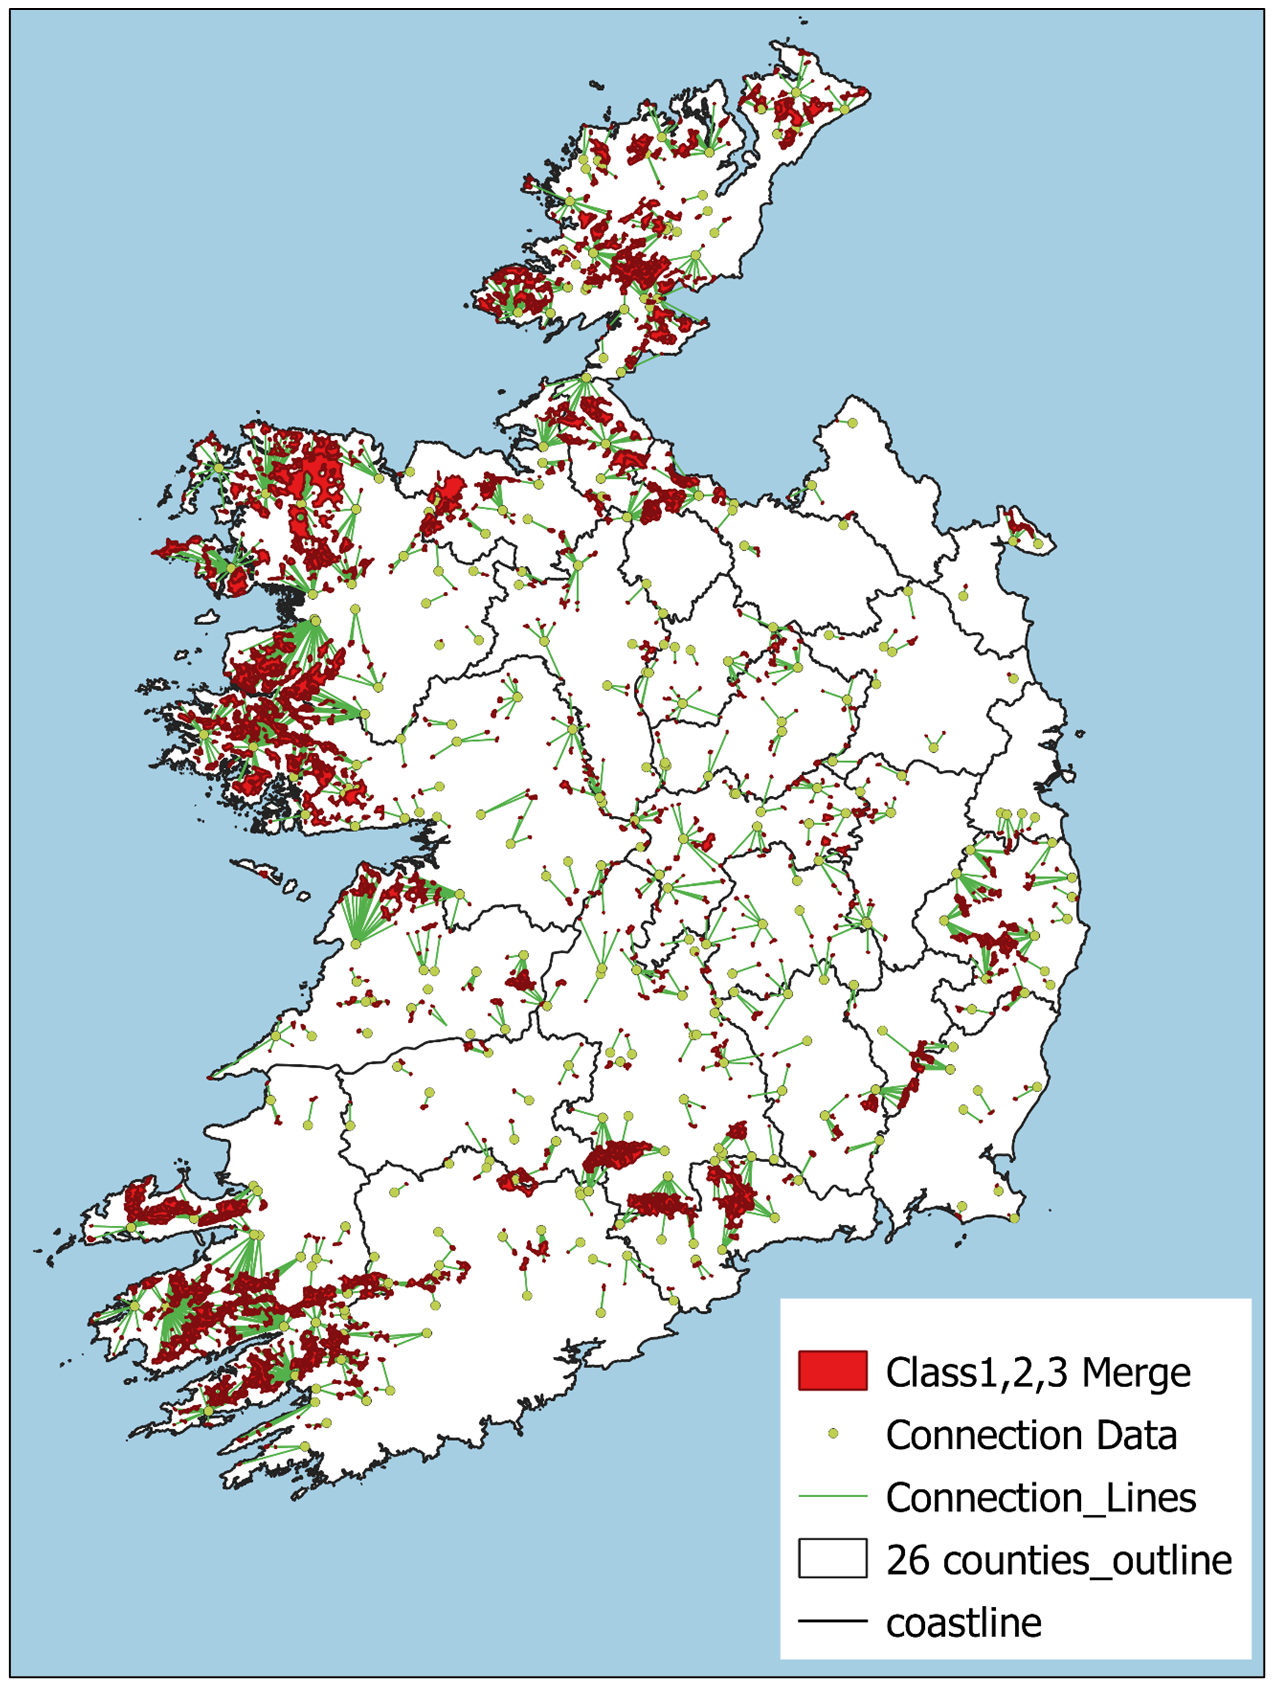
Figure 3Wind energy potential locations.
3.2.4 Carbon capture and storage, carbon dioxide removal, and negative emissions technologies
It is well documented in the literature that residual emissions are likely to remain in the future (net-)zero carbon energy system from hard-to-decarbonise sectors (Rogelj et al., 2018). Carbon capture and storage (CCS), carbon dioxide removal (CDR) technologies, and negative emission technologies (NETS) are currently seen within the literature as being critical future technologies to capture the last marginal residual emissions to bring the energy system to net-zero CO2 or even net-negative CO2 by mid-century. With this in mind, TIM has carbon capture and storage (CCS) technology options available from 2030, including retrofit options on existing coal, peat, and gas power plants. Bioenergy carbon capture and storage (BECCS) is available in TIM from 2030 and provides net-negative CO2 capture and allows negative emissions electricity generation. Direct air carbon capture and storage (DACCS) is also defined as a backstop technology, i.e. it has a static unit cost of EUR 2000 per ton of CO2 and an unlimited capacity. This caps the marginal abatement cost of the model at a price that does not exclude any of the plausible mitigation measures.
3.2.5 User constraints
User constraints applied to the power sector in TIM largely pertain to the calibration of the near-term shutdown of coal and peat power plants before their economic lifetime ends as a result of policy decisions.
3.3 Transport
3.3.1 Overview
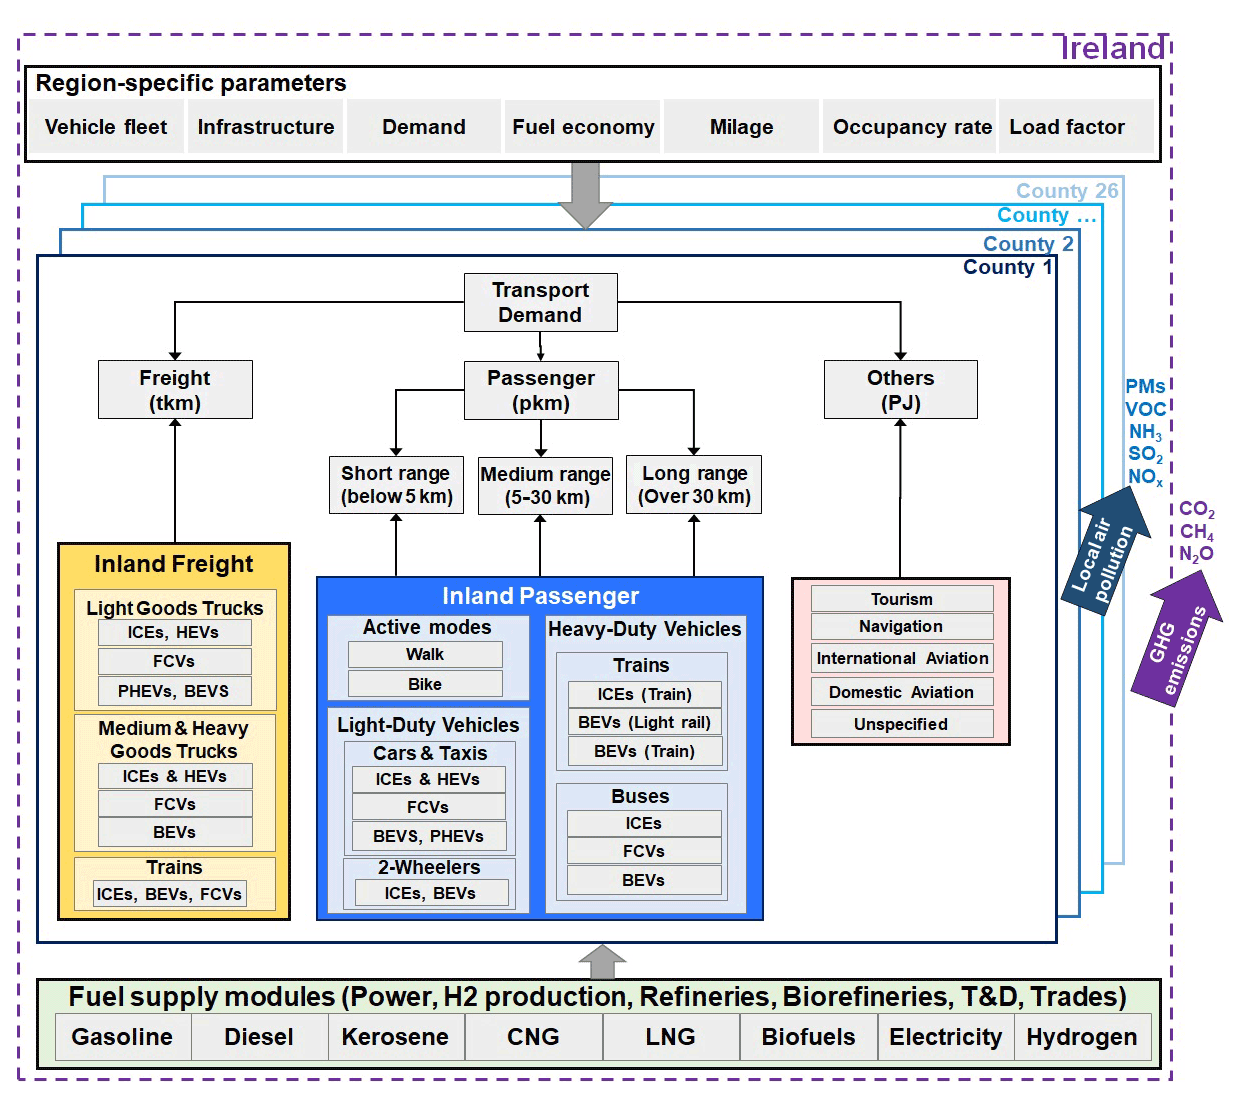
The transport sector comprehensively describes the end-use transport technologies and freight and mobility demands on a regional basis. This sector is divided into 26 counties across Ireland. To represent region-specific transport characteristics, some main parameters (vehicle fleet, transport infrastructure, fuel consumption, mileage, occupancy rate, and load factor) are differentiated on a county level. Transport demand is split into the following three main categories: passenger, freight, and others. The passenger and freight demands are expressed as activity demands, and others are defined as a final energy demand (PJ). These final energy demands further split into aviation (international and domestic), navigation, fuel tourism, and unspecified, aligned with the energy balance (SEAI, 2019). Fuel tourism refers to cross-border consumers, and a portion of demand is used by unspecified modes.
The passenger transport demands are expressed in billion passenger kilometres (Bpkm). As shown in Table 4, the total passenger demand is divided into three classes of distance range, including short range (less than 5 km), medium range (5–30 km), and long range (more than 30 km; NTA, 2018). A total of four transport modes satisfy travel demands, namely public services (bus, train, and taxi), private cars, powered two-wheelers (PTW), and active modes (walk and bike). Non-motorised transport is only used for short-range trips, PTW are used for short- and medium-range travel, urban buses and school buses are used for short- and medium-range travel, intercity buses and heavy trains are used for long-range trips, and light rail can only be used for the short- and medium-range trips in Dublin county. As shown in Fig. 4, the demand for each mode can be met with a different set of technologies, based on cost-optimisation and user constraints. The base year is calibrated based on the actual number of vehicles and the corresponding vehicle activities. Mode-specific relation between distance ranges is assumed constant throughout the modelling horizon (can be derived from Table 4). Total future passenger demand is obtained as a sum of mode-specific demand projections, as described in Sect. 3.3.2. Table 6 shows vehicle characteristics on a national basis.
Table 4Total passenger demand and share of transport modes for each class of distance range (CSO, 2017, 2020c, e, f, g, h).
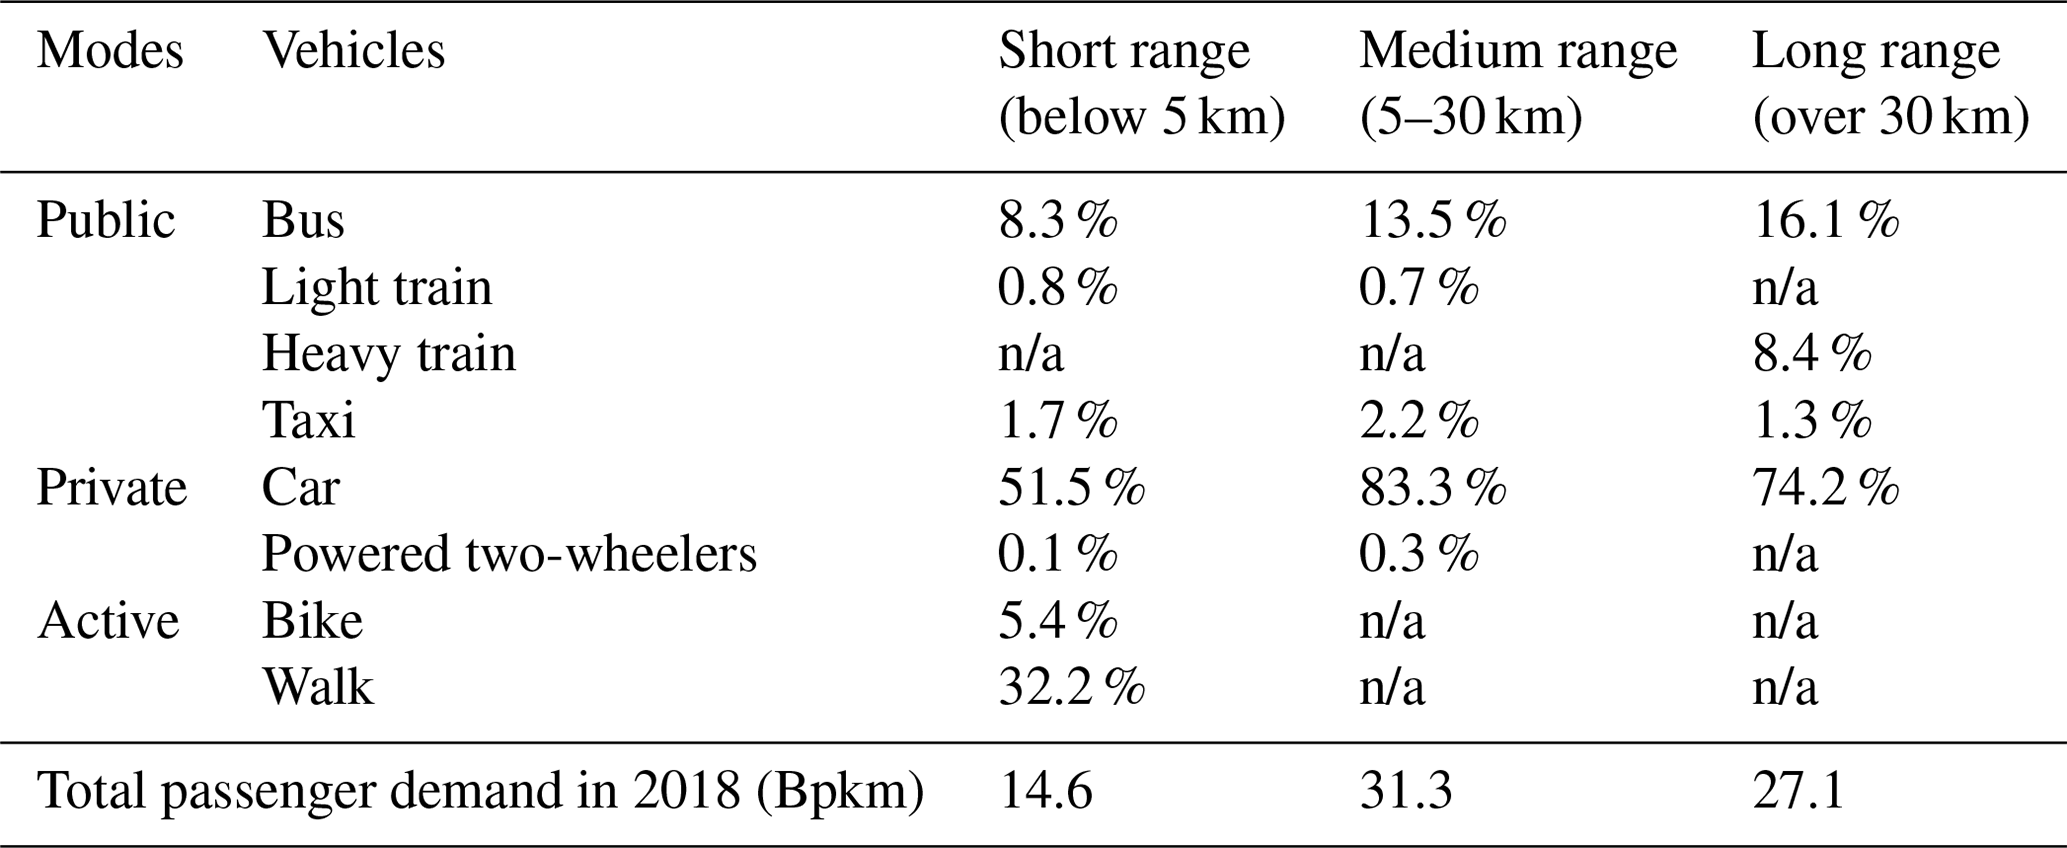
n/a: not applicable
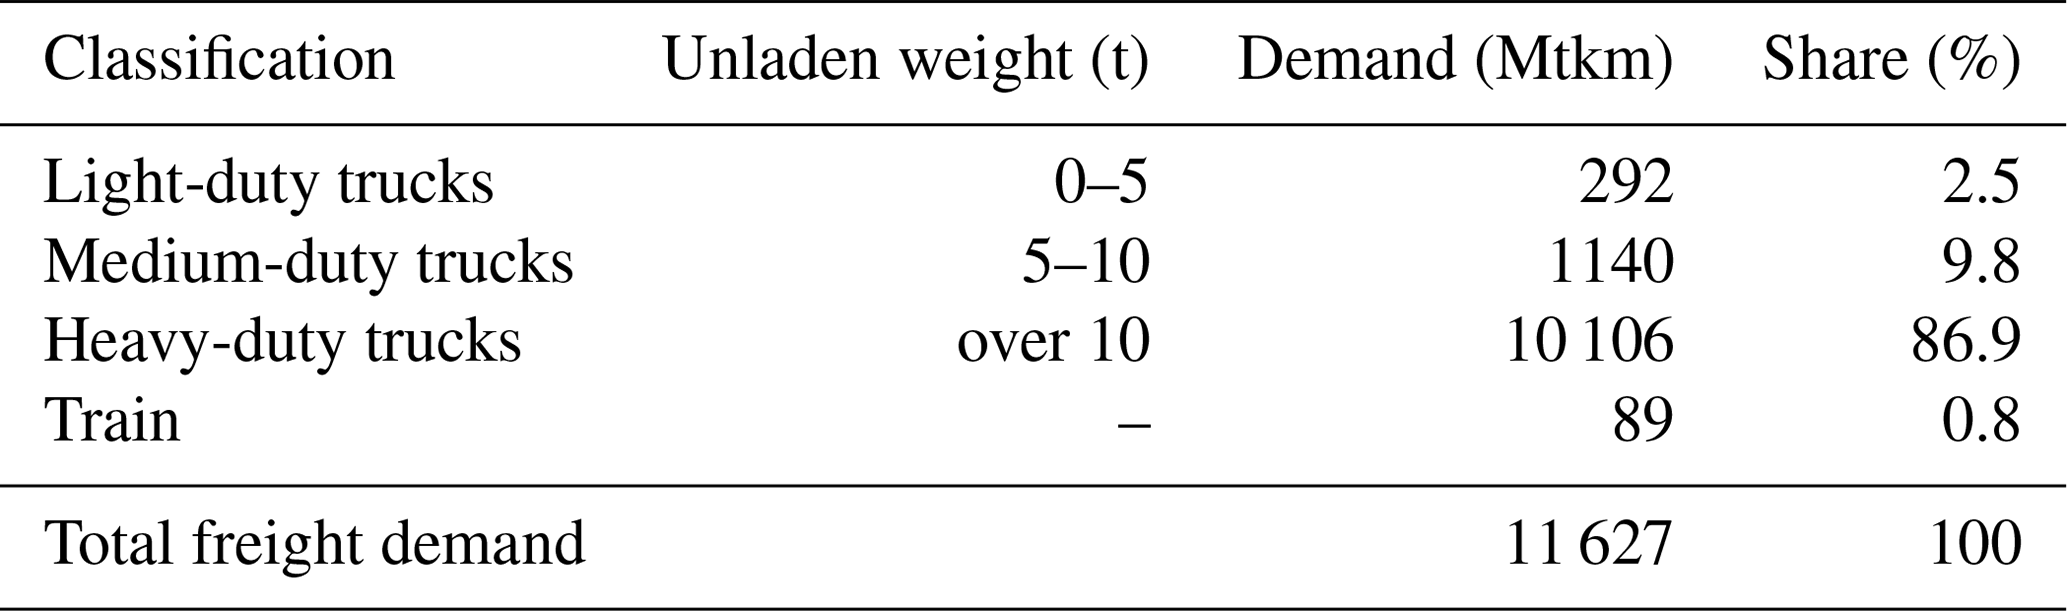
The inland freight demand is expressed in billion tonne kilometres (Btkm). It comprises two main modes, i.e. goods trucks and trains. The definition of light and heavy goods vehicles varies in different studies. In this model, they are disaggregated by the following three unladen weight bands (CSO, 2020g, h, i): light-duty trucks (below 5 t), medium-duty trucks (5–10 t), and heavy-duty trucks (over 10 t). Table 5 shows freight demand in the base year in million tonne kilometres (Mtkm); the modal shares are assumed constant throughout the modelling horizon.
3.3.2 Future transport demand projections
Passenger kilometres: private cars
Future passenger car transport demand is projected based on future population growth and a growing rate of car ownership, which is in turn determined by income growth. Car ownership usually follows an S-shaped function which has three periods, i.e. slow growth during low income levels, rapid increase as income levels rise quickly, and finally a saturation period. The Gompertz statistical model has been found to fit the historical relationship between car ownership and income levels best, although other functions have also been used in previous studies (Lian et al., 2018). The basic Gompertz function is shown in Eq. (1).
where y is the car per adult, α is saturation level of car ownership, x is an economic indicator (income per adult in this case), and β, γ are parameters that are estimated using historical data obtained from the CSO.
Projection of future car ownership levels is based on change in income levels. The saturation level of car ownership is assumed at 875 per 1000 adults (AECOM, 2019). Car ownership (cars per adult) is projected to rise from 0.56 in 2018 to 0.69 in 2050, an increase of 23 %. Passenger kilometres are then derived using car ownership as a proxy and assuming an occupancy level of 1.492 and kilometres per car to remain constant at about 17 300 yr−1. Total passenger kilometres from private cars in 2050 is projected to increase by 42 % from the 2018 level, with a compound annual growth rate (CAGR) of 1.1 %. The growth rate of passenger kilometres from private cars was 1.35 % between 2008 and 2018.
Passenger kilometres: other modes of transport
Other modes of transport represent a much smaller share of mobility demand compared to private cars. Passenger kilometres of large public service vehicles (PSVs) are projected using population as a driver in a log function and assuming an average occupancy of 27.5. Large PSV passenger kilometres are expected to increase by 24.2 % in 2050, as compared to those in 2018, with a CAGR of 0.7 %. Passenger kilometres of other modes (luas, train, small PSVs, and motorcycles) and active modes (walking and cycling) are projected using population as a driver. The passenger kilometres are expected to increase by 60 % with a CAGR of 1.5 %.
International aviation fuel demand
International aviation fuel demand is projected using number of passengers as a driver. The number of aviation passengers is projected using damped Holt–Winters function based on historical time series data obtained from CSO (Dantas et al., 2017; Grubb and Mason, 2001). The number of passengers in 2050 is expected to increase by 45.5 % compared to 2018. The historical fuel demand for aviation and number of aviation passengers are then used as input for a linear regression model to project the future demand for aviation fuel. The fuel demand in 2050 increases by 37 % relative to 2018 with a CAGR of 1 %.
Other transport fuel demand
Demand for freight is projected using growth rates from AECOM (2019). The growth in tonne kilometres of freight is expected to increase by 1.18 times in 2050 from 2018 levels with a CAGR of 2.5 %. Navigation fuel demand is projected using GDP as the explanatory variable. Fuel demand for navigation in 2050 is expected to increase 2.85 times compared to 2018 with a CAGR of 3.3 %. Fuel tourism is assumed to remain constant at 11 PJ.
3.3.3 Future technology options
Common vehicle technologies and future options that are likely to become available for future investment shape the technology database for the transportation sector in TIM. They are categorised into five major groups as follows (Aryanpur and Shafiei, 2015):
-
Internal combustion engines (ICEs) consist of spark ignition engines fuelled by gasoline, bioethanol, compressed natural gas (CNG), compressed biogas (BioCNG), hydrogen, and dual-fuel engines (running either on gasoline or CNG/BioCNG, each one taking 50 % of the distance travelled) and compression ignition engines powered by diesel and biodiesel.
-
Hybrid electric vehicles (HEVs) are equipped with an ICE, which provides the main power, and a small electric motor to support the ICE and to recuperate the braking energy.
-
Plug-in hybrid electric vehicles (PHEVs) have a similar power train to HEVs. Their batteries can be charged from the grid for driving tens of kilometres solely on electrical power. We assume the maximum distance driven on electric mode is 50 % in the base year, and it can increase to 80 % over time.
-
Battery electric vehicles (BEVs) solely rely on batteries, which provide the total motive power of the vehicle. The batteries charge from the grid.
-
Fuel cell vehicles (FCVs) are electrochemical devices that produce electricity through a reaction between hydrogen and oxygen. The electricity drives a vehicle's electric motor. Conventional fuel tanks are replaced with pressurised hydrogen storage tanks in FCVs.
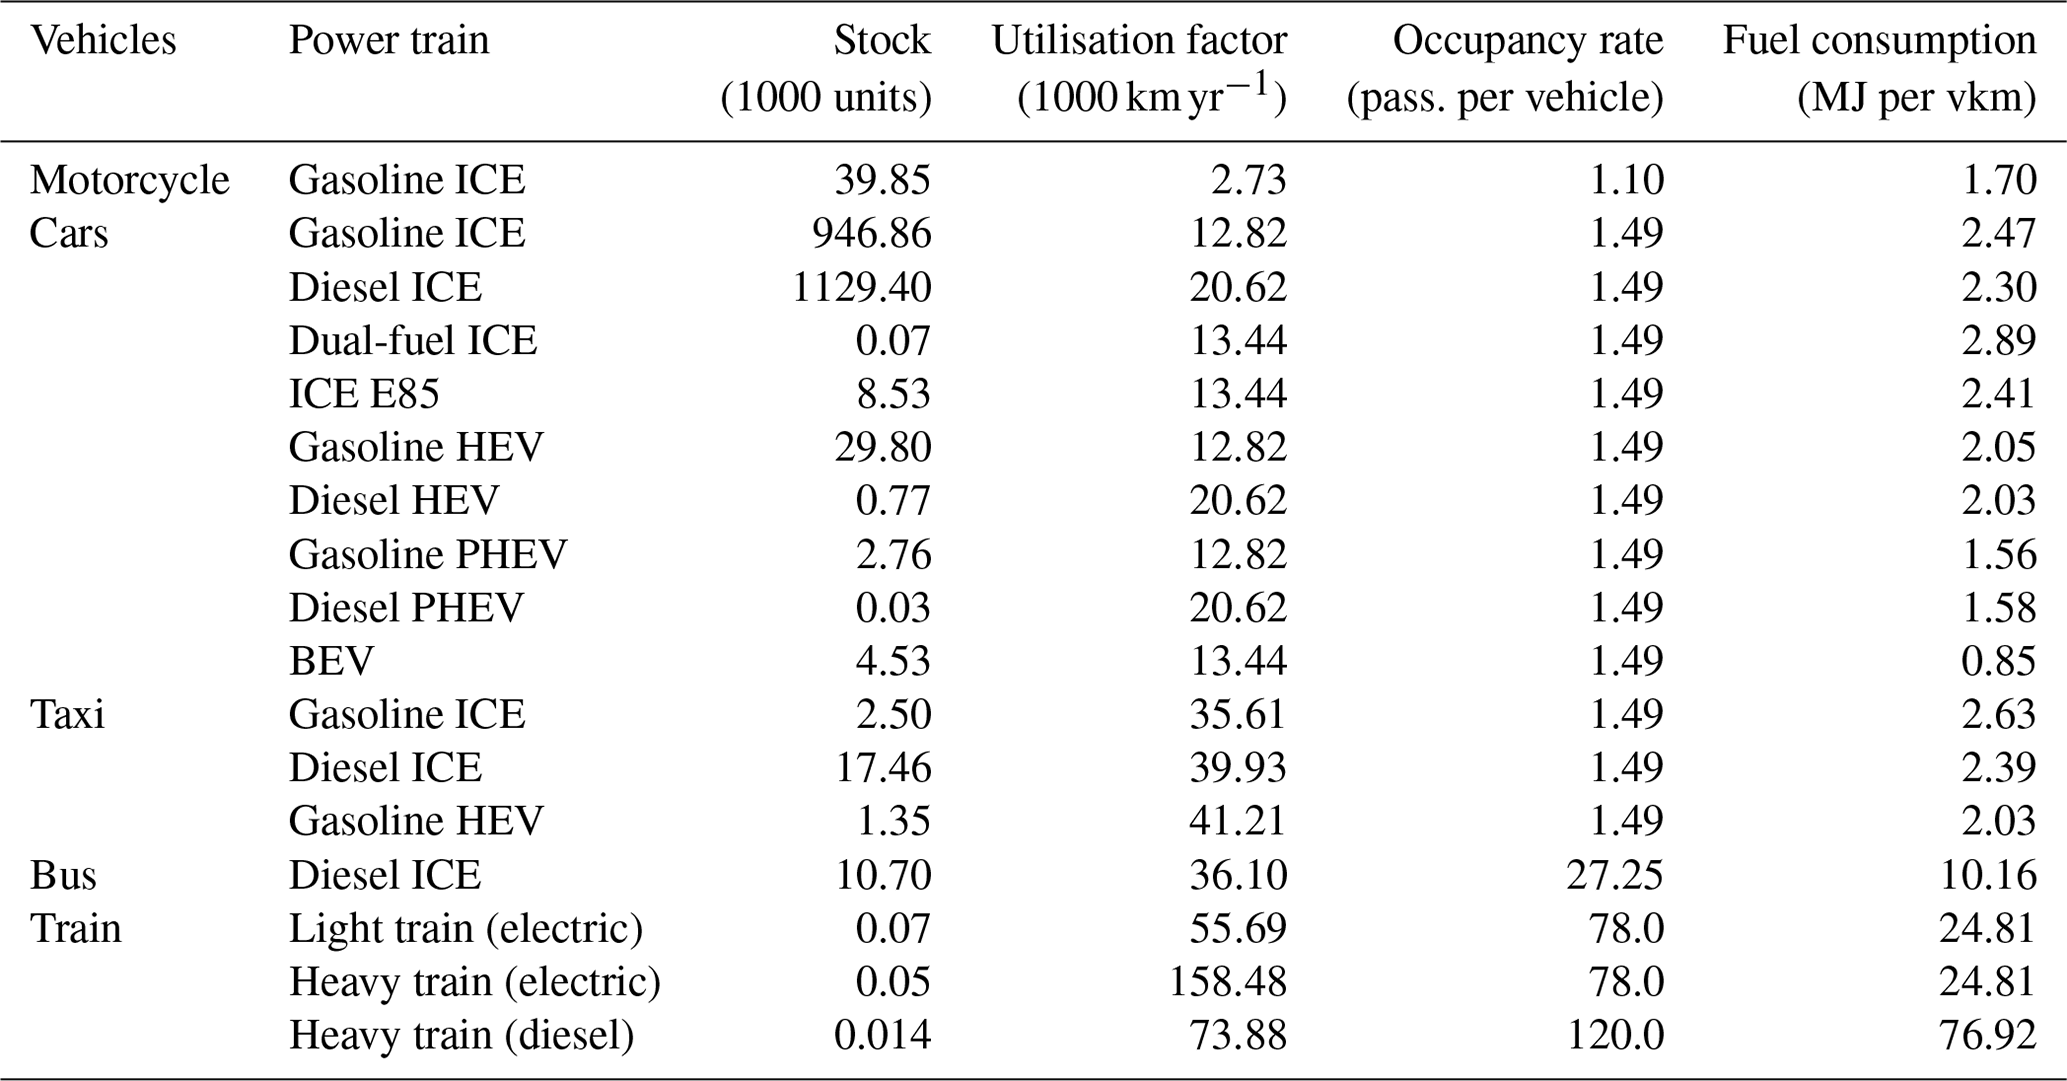
Table A7 shows the technoeconomic characteristics of future passenger transport vehicles (Mulholland et al., 2017; Helgeson and Peter, 2020). Maintenance costs are assumed to remain constant. Vehicle purchase price parity between BEVs and ICEs is expected in the period 2025–2030.
All these technologies compete to meet the mobility demand over the planning horizon. The model structure allows competition among stock replacement and fuel substitution within a mode. Modal shift may be simulated within each travel distance band by defining scenario-specific shares for the different modes (e.g., see Table 4).
Different fuels are supplied to the transport sector via four separated modules, including supply, power, biorefineries, and hydrogen modules. In other words, these connections integrate the transport sector with the entire energy system.
TIMES models usually use a simplified constant lifetime for different vehicles, and thus, the vehicles are retired at the end of that lifetime. However, a detailed analysis of technology retirement profiles in Ireland shows that this simplified representation is far from reality (Mulholland et al., 2018). An actual profile shows a low decay in the beginning years and a long tail in the distribution over the longer term. To improve the retirement profile both for existing and new vehicles, TIM is equipped with realistic representation of the survival profile of car technologies. The survival rates are from the Irish CarSTOCK model (Daly and Ó Gallachóir, 2011; Mulholland et al., 2018).
3.3.4 User constraints
A set of constraints limits fuel and modal shares in transport sector as follows:
-
Maximum biodiesel share in passenger and freight transport demand is 4.1 % in the base year.
-
Maximum bioethanol share in passenger and freight transport demand is 3.2 % in the base year.
-
Maximum growth rate in new vehicle sales for advanced power trains (HEVs, PHEVs, BEVs, and FCVs) is 16 % yr−1, which is enforced once the sales of a vehicle type reaches 15 % of the total vehicle sales in the base year.
-
The blend limit for biofuels is 10 %–12 % for the regular ICEs without any modifications (i.e. 10 % bioethanol and 12 % biodiesel, with 90 % and 88 % gasoline and diesel, respectively).
-
Total biofuel supply for the transport sector is allowed to double each decade, reflecting the rate of growth between 2010 and 2020 (NORA, 2021).
3.4 Residential sector
3.4.1 Energy service demands and projections
The residential stock projections up to 2040 are taken from Bergin and García-Rodríguez (2020) housing demand estimates, which utilise economic growth projections from Bergin et al. (2017). The stock is expected to increase by 40 % from 2018 levels with a CAGR of 2 %. This results in an average of 27 600 new houses per annum between 2021–2040. Beyond 2040, the population is used as a driver to project housing stock. The total housing stock obtained in 2050 is 2.57 million dwellings, which implies 8 % increase from 2040.
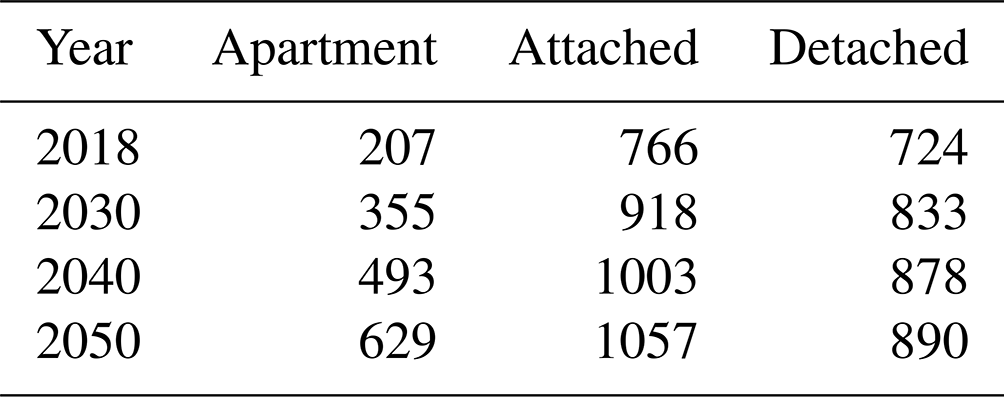
Figure 5 shows the RES diagram for the residential sector. Energy service demands are disaggregated between archetype and non-archetype demands. Archetype demands are energy service demands which depend on the house type, namely the dwelling type and building energy rating (BER) rating.

The base year residential energy demand by fuel is calibrated to the SEAI (2019) energy balance.
Archetype energy service demands are particularly dependent on the type of building. The four energy service demands which are modelled based on archetype are space heating, water heating, pump and fans, and lighting. The residential building stock by type is explicitly modelled in TIM in three archetypes, i.e. detached, attached, and apartments.
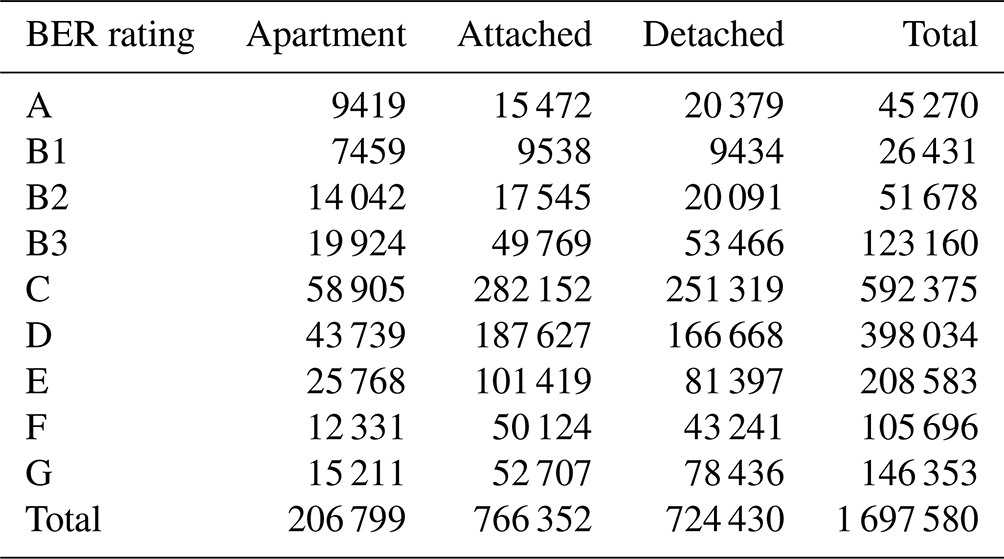
The archetype energy service demand data are sourced from SEAI (2020)'s BER database, which contains the raw data of 906 048 BER surveys. The BER database was filtered before use to remove outliers and any nonsensical values. The filters were based upon Dineen et al. (2015), Uidhir et al. (2020a), and group discussions within the Irish Building Stock Observatory (https://www.marei.ie/project/irish-building-stock-observatory/, last access: 18 May 2022), reducing the total records to 815 246.
The filtered BER database is projected onto the total dwelling stock, using data from CSO (2020a, b) to calculate the total number BER ratings per archetype in the dwelling stock, as shown in Table 8.
BER assumes all buildings are heated to between 18 ∘C for non-living areas (e.g. bedroom and bathroom) to 21 ∘C for living areas (e.g. sitting room and kitchen). This assumption is based on ISO 13790 calculations. To reflect the actual energy use based upon internal temperatures in the Irish residential sector, the Archetype Dwelling Energy Model (ArDEM) was used to provide simulated annual energy consumption (Dineen et al., 2015). ArDEM modifies the expected space heating energy consumption of each archetype and BER rating to the actual space heating energy consumption by adjusting internal temperatures in the building stock; a similar approach was used by Uidhir et al. (2020b).
The alternative internal temperatures assumptions in TIM are outlined in Table 9.

After the base year, the change in the number of new dwellings per archetype drives the demand, as previously outlined in Sect. 2.5. All new dwellings mimic the energy intensity of the average base year A-rated (BER energy rating) dwelling for that archetype. This is due to directive (EU) 2018/844, which requires all new residential dwellings to equate to at least a A2 BER by 2020.
The non-archetype energy service demands are cooking, refrigeration, cloth washing, cloth drying, dish washing, and electrical appliances. The non-archetype energy service demands are not dependent on the age, type, or BER rating of the future housing type. These demands are projected to grow at the same rate as the growth in the total housing stock.
Non-archetype energy demand data were obtained from SEAI (2018). This data were cross-checked with the JRC-IDEES (Joint Research Centre Integrated Database of the European Energy System) database. The process involved cross-checking the share of residential energy service demands in TIM against a database which had no input in to the model.
3.4.2 Future technology options
The TIM residential sector has two main mitigation options – switching heat technologies and fuels and retrofitting existing dwellings to improve the thermal efficiency and uplift BER ratings.
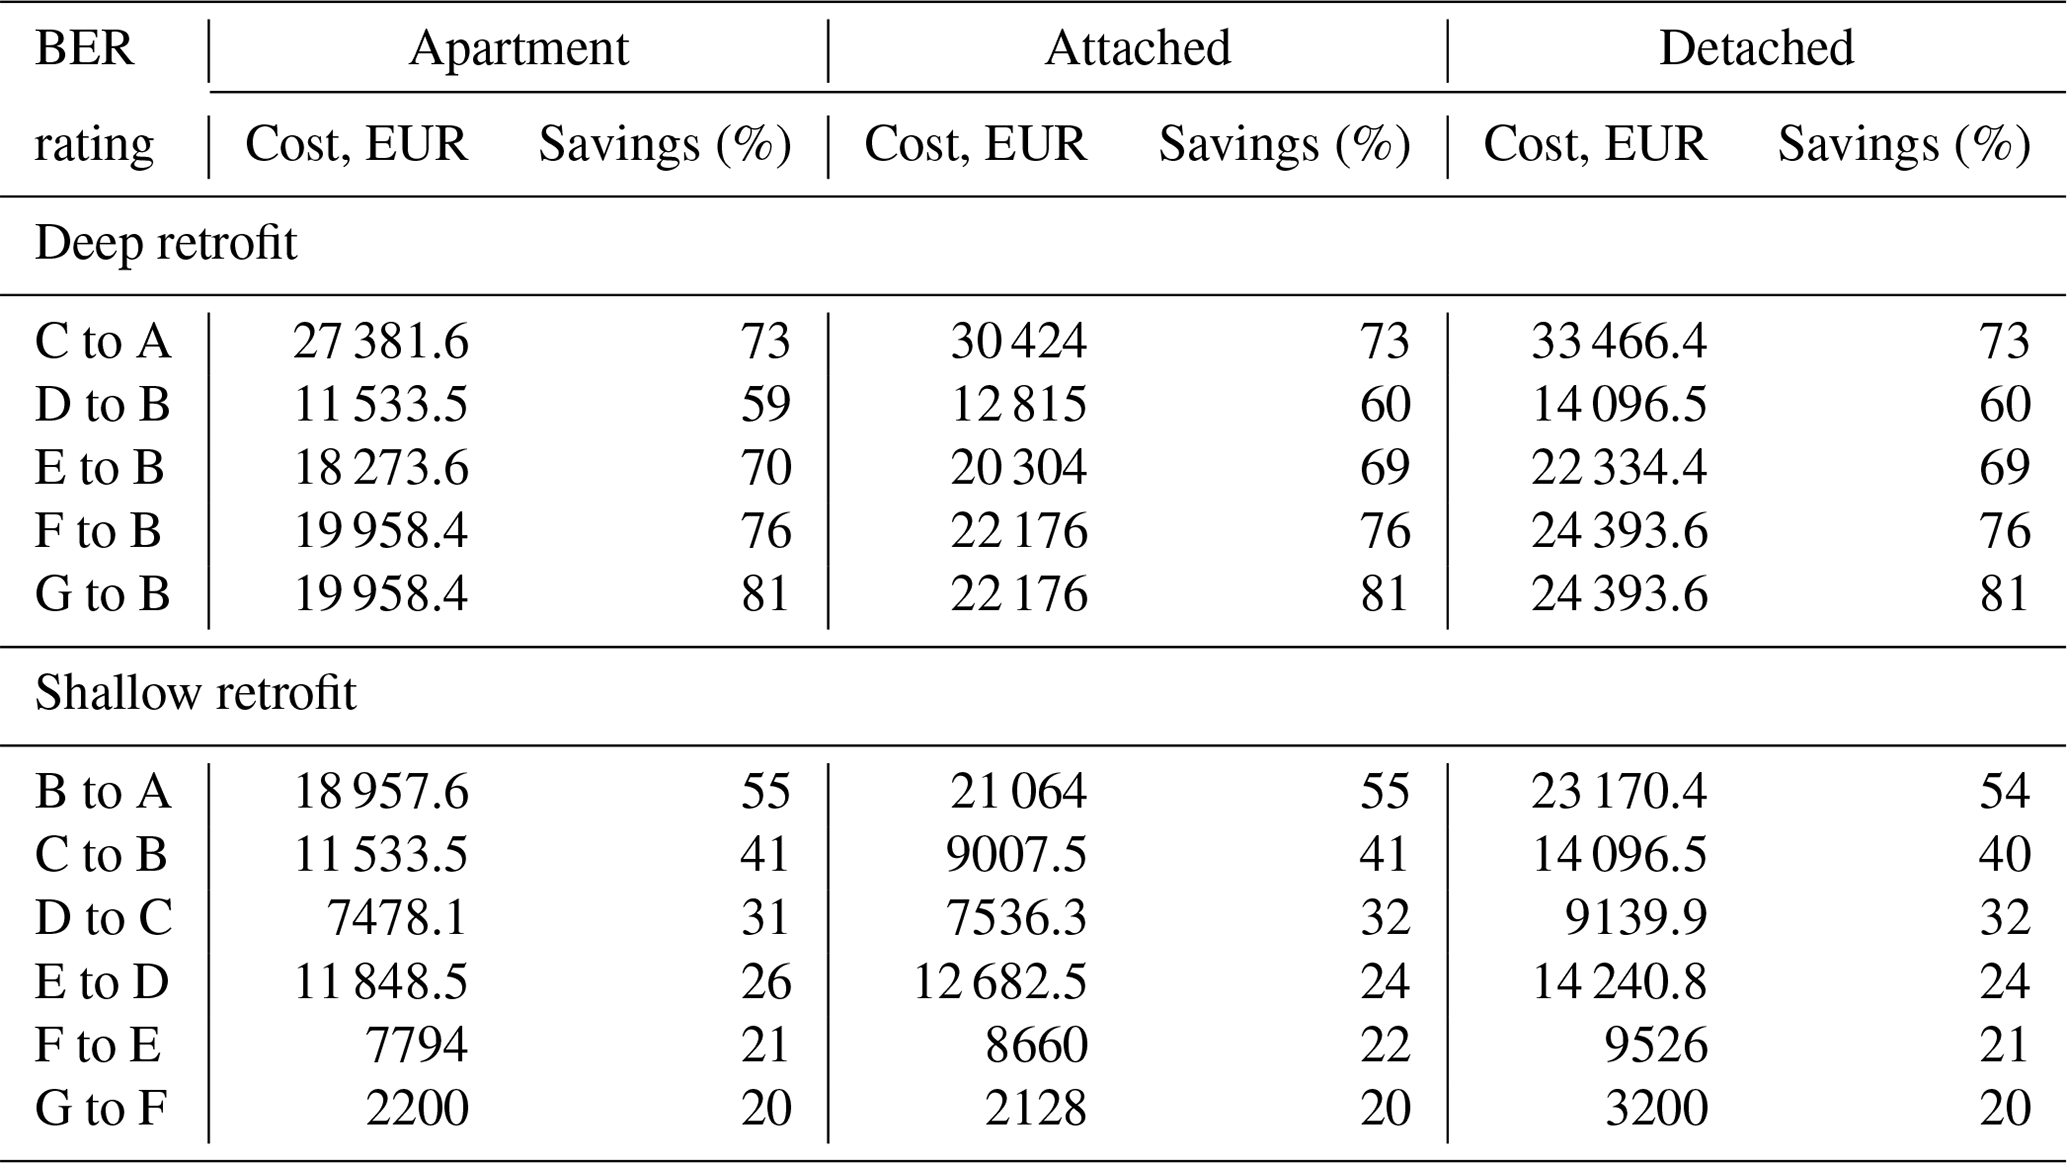
While Ireland has ambitious retrofitting targets for 2030, data on the cost and energy savings for retrofitting are limited, particularly for deep retrofits. The expected costs and heat energy saving of retrofitting from one BER rating to another requires further investigation. The retrofit cost data are based upon AECOM (2013) and Ali et al. (2020), and the expected energy saving is based upon Collins and Curtis (2017). For this reason, the model uses a simplistic retrofitting options. There are two options for each archetype, namely shallow retrofit, which reduces dwelling space heating energy demand by 10 %–34 %, and deep retrofit, which improves space heating energy efficiency by at least 35 %.
The cost and expected heat energy savings per archetype by BER improvement is outlined in Table 10. The model currently implements a weighted average value, but a fully disaggregated retrofit could be implemented in a future model version.
The cost and efficiencies of new space heating and water heating technologies is sourced from Danish Energy Agency and Energinet (2020). The cost and efficiency of lighting, pumps, and fans and non-archetype demands came from a range of sources, including SEAI (2018) and Topten International Group (2021).
3.4.3 User constraints
-
One space and water heating system per household (stoves excluded). This user constraint is applied to represent individual heating systems and calibrate the results.
-
A maximum, 60 %, of existing buildings to be retrofitted by 2030 and 95 % by 2070; the maximum value is interpolated between 2030 and 2050. This user constraint is applied to align with maximum available labour.
-
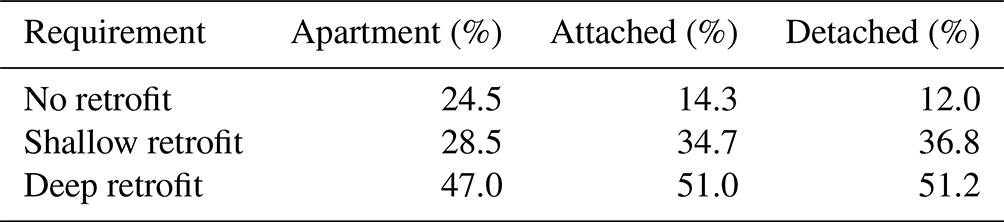
A prerequisite retrofitting requirement for electrical heat pump installation is applied to each archetype. Table 11 shows the percentage of dwellings which require a shallow or deep retrofit before an electrical heat pump can be installed (a heat-pump-ready dwelling must be at least a B2 energy rating). This user constraint is applied because of the lack of data regarding the operation of electrical heat pumps in less than B2-rated dwellings. Without this constraint, heat pumps would be installed in poorly rated dwellings and run at high performance. The constraint aligns with known heat pump performance data.
-
Maximum fuel share in cooking for natural gas and LPG is 40 % and 10 %, respectively. The base year fuel share for natural gas is 32 % and for LPG is 1.5 %. This user constraint is applied to align with the increasing market share of electrical induction hobs.
3.5 Industry
The industrial sector is modelled using a top-down methodology, where energy demand is projected based on an assumed future economic growth. In total, 14 subsectors are represented and are based on SEAI (2019)'s energy balance. Baseline shares of energy carriers in the final energy consumption by subsector are assumed constant into the future and are based on the 2018 values (SEAI, 2019).
Energy demand for the industrial sector is projected using GVA per capita for each NACE category and population (Yakut and de Bruin, 2020). Historical energy consumption is obtained from SEAI (2019)'s energy balance. The total energy demand from industry in 2050 is projected to increase by 47 % from the 2018 level. Cement demand up to 2025 is projected using the Department of Finance (2020) stability programme update which provides forecasts for the growth in modified investment. In 2019, 65 % of the modified investment was in building and construction. Calculating a linear regression of the log of the index for output of the cement sector on the log of investment in building and construction at constant price results in an 18.6 % increase in the cement demand in 2025 from 2018 level. Beyond 2025, growth in cement demand is assumed to be the same as the growth in GNI∗. This leads to a further increase by 17.8 % between 2025 and 2050 at a CAGR of 0.7 %. The energy intensity of the industry sector is expected to decline by 46.5 % between 2018 and 2050 with a CAGR of −2 %, reflecting historical trends.
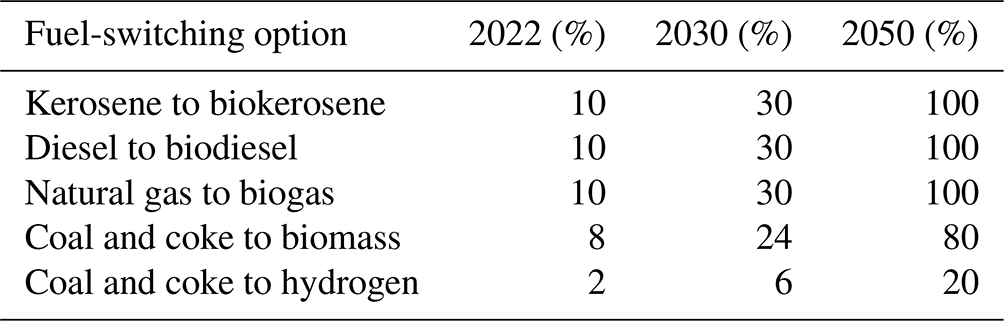
Fuel switching is the only mitigation option available for combustion emissions from industry in the model. It is controlled through maximum predefined shares which are defined per year and subsector. Table 12 illustrates assumed maximum fuel switching shares which are possible across all the subsectors.
Process emissions
Among the industrial processes, the cement industry has the largest share of process emissions, which is accounted for in the model. Historical data of cement production and emissions are obtained from the National Inventory Submissions (Duffy et al., 2020). Process emissions increased by 87 % between 1990 and 2018 with a CAGR of 2.3 %. The cement demand is projected using the number of new dwellings and the energy consumption of the corresponding industrial sector in a linear model. The amount of cement needed in 2050 is projected to double relative to 2018 with a CAGR of 2.2 %. The demand for cement is then used to project process emission, which is expected to increase by 96 % between 2018 and 2050 with a CAGR of 2.1 %.

3.6 Services
The service sector in TIM comprises public and private services. It includes a representation of the following energy services: space heating, space cooling, water heating, cooking, refrigeration, building lighting, and other appliances. Data centres electricity demand and public lighting are also represented.
Future fuel-switching and technology-based efficiency options in the services sector are represented explicitly. However given a lack of sufficient building-level data to enable a detailed analysis, public and private services are modelled in an aggregated fashion (i.e. the building stock is not divided in categories). This is an area identified as a priority area for future model development.
The end-use demand services in the service sector include a 1×10⁶ m2 area for public and private sector buildings, data centre demand, and public lighting units. The area is projected assuming the same growth as in GNI∗. The total area is projected to increase by 61.8 % by 2050 from 2018 level with a CAGR of 1.5 %.
Electricity demand for data centres is obtained from EirGrid's steady evolution scenario (EirGrid, 2017). The demand is expected to increase by 6 times in 2030 from 2018 levels. We assume no growth in data centre demand after 2030 since permission requests for new/expanding existing capacities are not available yet. Furthermore, the post-2030 demand is even more uncertain given (i) the potential for exponential data usage growth and further data centres applications vs. (ii) technology improvements and whether data centres fully utilise their contracted import capacity. Electricity consumption of data centres for cooling, and their potential to supply district heat from the excess heat they generate, are represented using the methodology described in Petrović et al. (2020).
Public lighting units are projected based on the Project Ireland 2040, whereby the five major cities of Ireland, Dublin, Cork, Limerick, Galway, and Waterford are expected to grow by 50 % in 2040 (Government of Ireland, 2018). This results in a 12.5 % increase in public lighting units in Ireland by 2040 from 2018 levels with a CAGR of 1 %. Beyond 2040, the units are projected to increase by 1 % per annum until 2050.
3.7 Agriculture
The current version of the agriculture sector in TIM comes from the Irish TIMES model and is documented in Chiodi et al. (2016). It includes the representation of 12 energy service demands; half of them (dairy cattle, non-dairy cattle, sheep, pigs, poultry, and other animal rearing) belong to the livestock and half (production of pulses, potatoes, sugar beets, barley, oats, and wheat) to the tillage sector. Land availability and water consumption are explicitly represented and accounted for in the sector; however, no specific constraints are set. Future energy service demands in the agriculture sector are left unchanged from the 2018 level. Since the sector is a large and export-led part of the Irish economy, these should be adjusted based on a specific scenario narrative.
Crop-based bioenergy feedstocks are modelled within the agriculture sector. This includes growing of wheat, grass, and rapeseed for biofuel production in the supply sector, as well as the growing of miscanthus, willow, and the availability of forestry residues for biomass. Production of crop-based bioenergy feedstocks is constrained by potentials from SEAI (2015).
A representation of CH4 and N2O emissions related to livestock and tillage is included in the agriculture sector. At the same time, as emphasised by Chiodi et al. (2016), due to the complexity of the sector, with a tendency for both technologies and productions levels to vary considerably among farms, challenges exist in identifying applicable mitigation options and their potentials.
This section discusses the strengths, limitations, and development priorities for the TIMES-Ireland model, using the framework proposed by Pye et al. (2021) and DeCarolis et al. (2017), which outline the best practice for ESOM development and priorities for new developments and applications of ESOMs for deep decarbonisation challenges.
4.1 Analytical advancements
The following is a summary of the main analytical advancements of TIM, which are explained in more detail throughout the text.
-
The model has a flexible time slice configuration with a resolution possible up to the hourly level, which is necessary to, e.g., model the power system under very high shares of variable renewables in deep decarbonisation scenarios, including power storage.
-
The model also makes use of new TIMES features in the power sector, including modelling dispatch, unit commitment, and capacity expansion.
-
The model has been developed with flexible regional definitions, with transport and power sectors detailed at the county level.
-
Energy service demands are driven by a consistent set of population and macroeconomic indicators, consistent with a national CGE model, and also disaggregated in sufficient detail to allow alternative demand scenarios, such as transport mode shifting, lower housing demand requirements, etc.
-
The development process strives to achieve best practice in software development, including version control, transparency (with open source and open data), quality assurance, documentation, and wide stakeholder consultation.
4.2 Modelling for policy insight
The main purpose of the model is to meet the policy need to inform detailed sectoral pathways which can meet very ambitious decarbonisation targets. This subsection discusses TIM's strengths and weaknesses in this regard.
First, the integrated whole-system approach offers a macrosystem perspective. The temporal and spatial flexibility resolves the tension between the requirements for granularity for certain model functionalities, and the requirement for data and model tractability and fast solving speed. A key strength of TIM is that it draws from openly available and regularly updated national datasets, which allows for future updates and alignment with other models drawing from the same sources.
Second, an appropriately wide mitigation option space is required to meet deep decarbonisation challenges. Strengths of TIM include the rich depiction of important demand sectors, namely transport and residential, which are characterised to enable scenario variants of alternative demands. For example, splitting passenger transport demand into long-, medium-, and short-distance demand allows for switching to active and public transport demands. Similarly, the archetypal model underpinning the residential sector allows for lowering building floor area demand and internal temperatures, which can be key scenario variants. These scenario variants are exogenous, though there is increasing literature on endogenising behaviour in TIMES models. Several options for shifting to more efficient uses of energy, for example, are endogenous. However, the aggregate nature of the industry sector limits the potential analysis of demand reduction in this sector and is an area of future model development priority.
Another area for future model improvements is to explore CDR options in more detail. At the global level, modelled pathways meeting the Paris Agreement rely on large-scale deployment of CDR options, including BECCS (IPCC, 2018). BECCS is currently modelled within TIM, but options like DACCS (Realmonte et al., 2019) are currently represented in an oversimplified manner; as real-world trials provide operational performance data, we will be able to improve the representation of DACCS in TIM.
Another limitation of TIM is the sole focus on energy and process emissions. Agriculture and land use are very significant emitters in Ireland, and future energy system decarbonisation trajectories will require a focus on the overlaps with other emitters. This is required, first, to understand bioenergy and waste potentials and to take into account future gains from the circular economy and also competition between energy crops, agriculture, and reforestation.
A focus on the practice of model development and application is key. Robust quantitative analysis and information is an important ingredient in the energy and climate policy-making process. But energy modelling should support the policy-making process rather than determine its contents. This means the interface between energy modelling and the policy-making process should be an iterative one that incorporates regular review and feedback as new issues and questions emerge (Strachan et al., 2016). TIM has been developed with the aims of openness and transparency, quality assurance and best practice in software development, iterative engagement with key stakeholders to feed in sectoral and industry expertise, and to be able reflect policy and societal factors. Any model built to inform policy should be open to deep scrutiny early and throughout the process. It also requires capacity development among the consumers of model outputs to ensure that results are interpreted, communicated, and applied appropriately.
It is also important to communicate what the model can and cannot do. For example, while TIM is a cost-optimal model, it does not capture many of the societal costs or benefits that the energy system imposes. For example, higher renewable energy shares may represent a higher overall investment and operation cost over the project lifetime; these may offer significant societal benefits in terms of lower air pollution, reducing the fossil fuel import bill and providing high-quality employment. Similarly, the distributional effects of the costs are not captured in the model, therefore considerations of a just transition are a challenge within TIM currently.
4.3 Future improvements
TIM will undergo continuous and iterative improvements and developments. In the near term, the following is the priority list for future development.
-
Modelling gas supply at hourly resolution – it is currently modelled at a seasonal level, which may unintentionally allow for energy storage capacity.
-
Similarly, modelling electricity interconnectors with the UK and France at the same time resolution as the power sector, taking into account capacity constraints on top of annual trade constraints.
-
Modelling hydrogen production routes other than from renewables (green hydrogen), such as blue, brown, and grey hydrogen production options.
-
Reviewing and updating bioenergy conversion options, including an update of domestic bioenergy potentials.
-
Reviewing and updating future low-carbon technology costs.
-
Developing further the Agri-TIMES module, first developed by Chiodi et al. (2016), in order to better represent agriculture, livestock, and land use emissions and mitigation options, including competition for land use.
-
Developing a more detailed bottom-up focus on the industry sector, which is currently modelled in an aggregated top-down fashion, and a disaggregation of the services sector.
-
Developing a “business as usual” or “with existing policy measures” case, which includes current policies and measures and hurdle rates to represent end-use technology uptake.
This paper presents the TIMES-Ireland Model, an energy systems optimisation model which is a significant step forward both in terms of analytical heft, open and best-practice development approach, and in its contribution to national evidence-based policy development. TIM has been developed to help inform very ambitious decarbonisation objectives and to inform future carbon budgets on the path to net-zero GHG emissions by 2050.
The model was developed from the legacy model, Irish TIMES, which has had a long history of contributing to the evidence base for Irish energy policy and for pushing the state-of-the-art ESOM development. TIM also benefits from ongoing collaborations and interactions with other national models and data sources, including LEAP-Ireland, the ESRI's I3E model and Sustainable Energy Authority of Ireland (SEAI) databases. The model also benefits from the continuous development of the TIMES model generator within the ETSAP community.
Continuous, iterative, and open model development is essential to ensure that the model remains fit for purpose and state of the art. The model has been built with these future calibrations and improvements in mind, with clear open documentation and development protocol to allow for ongoing improvements and updates, to better enable the Irish energy system to achieve the goal of carbon neutrality.
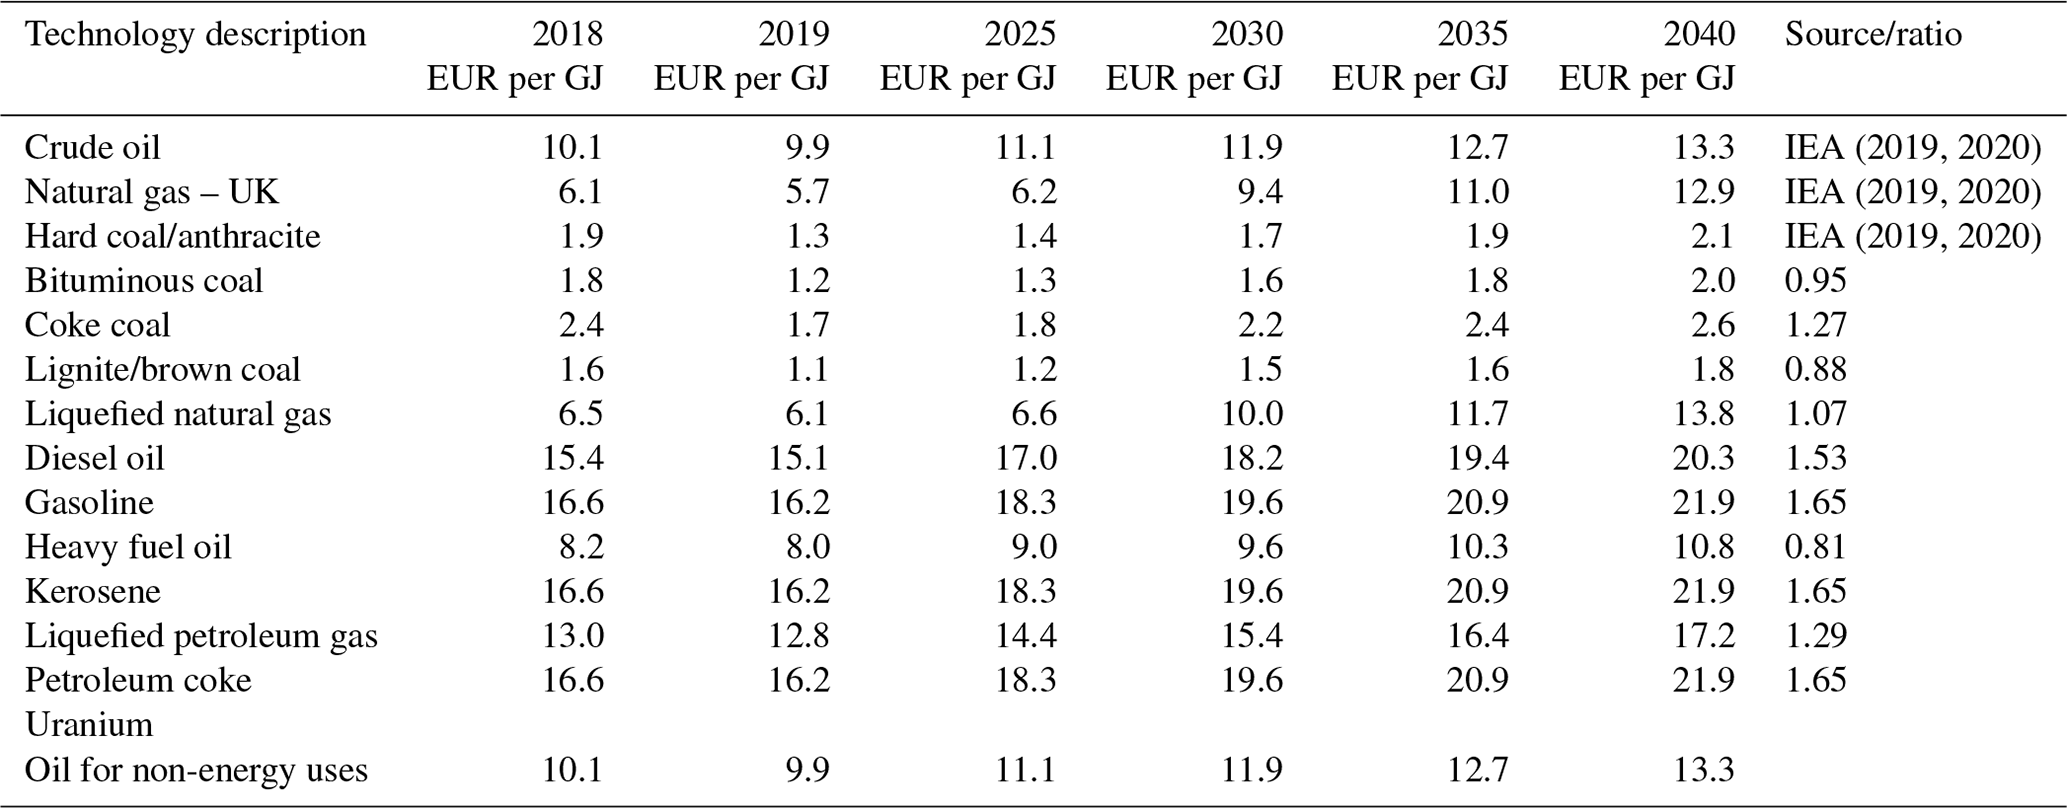

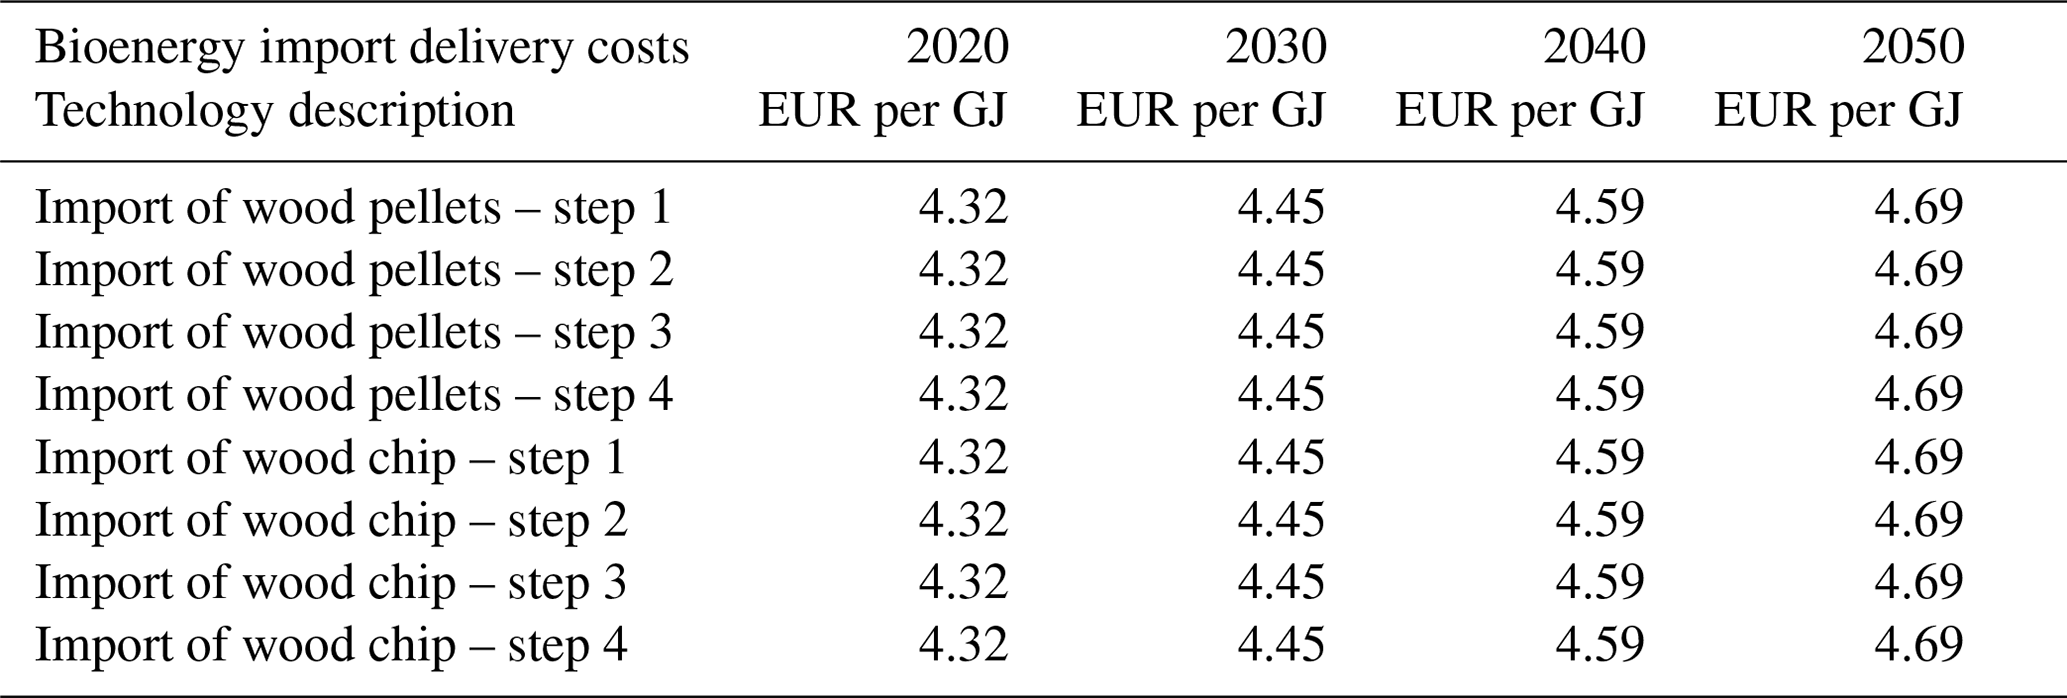
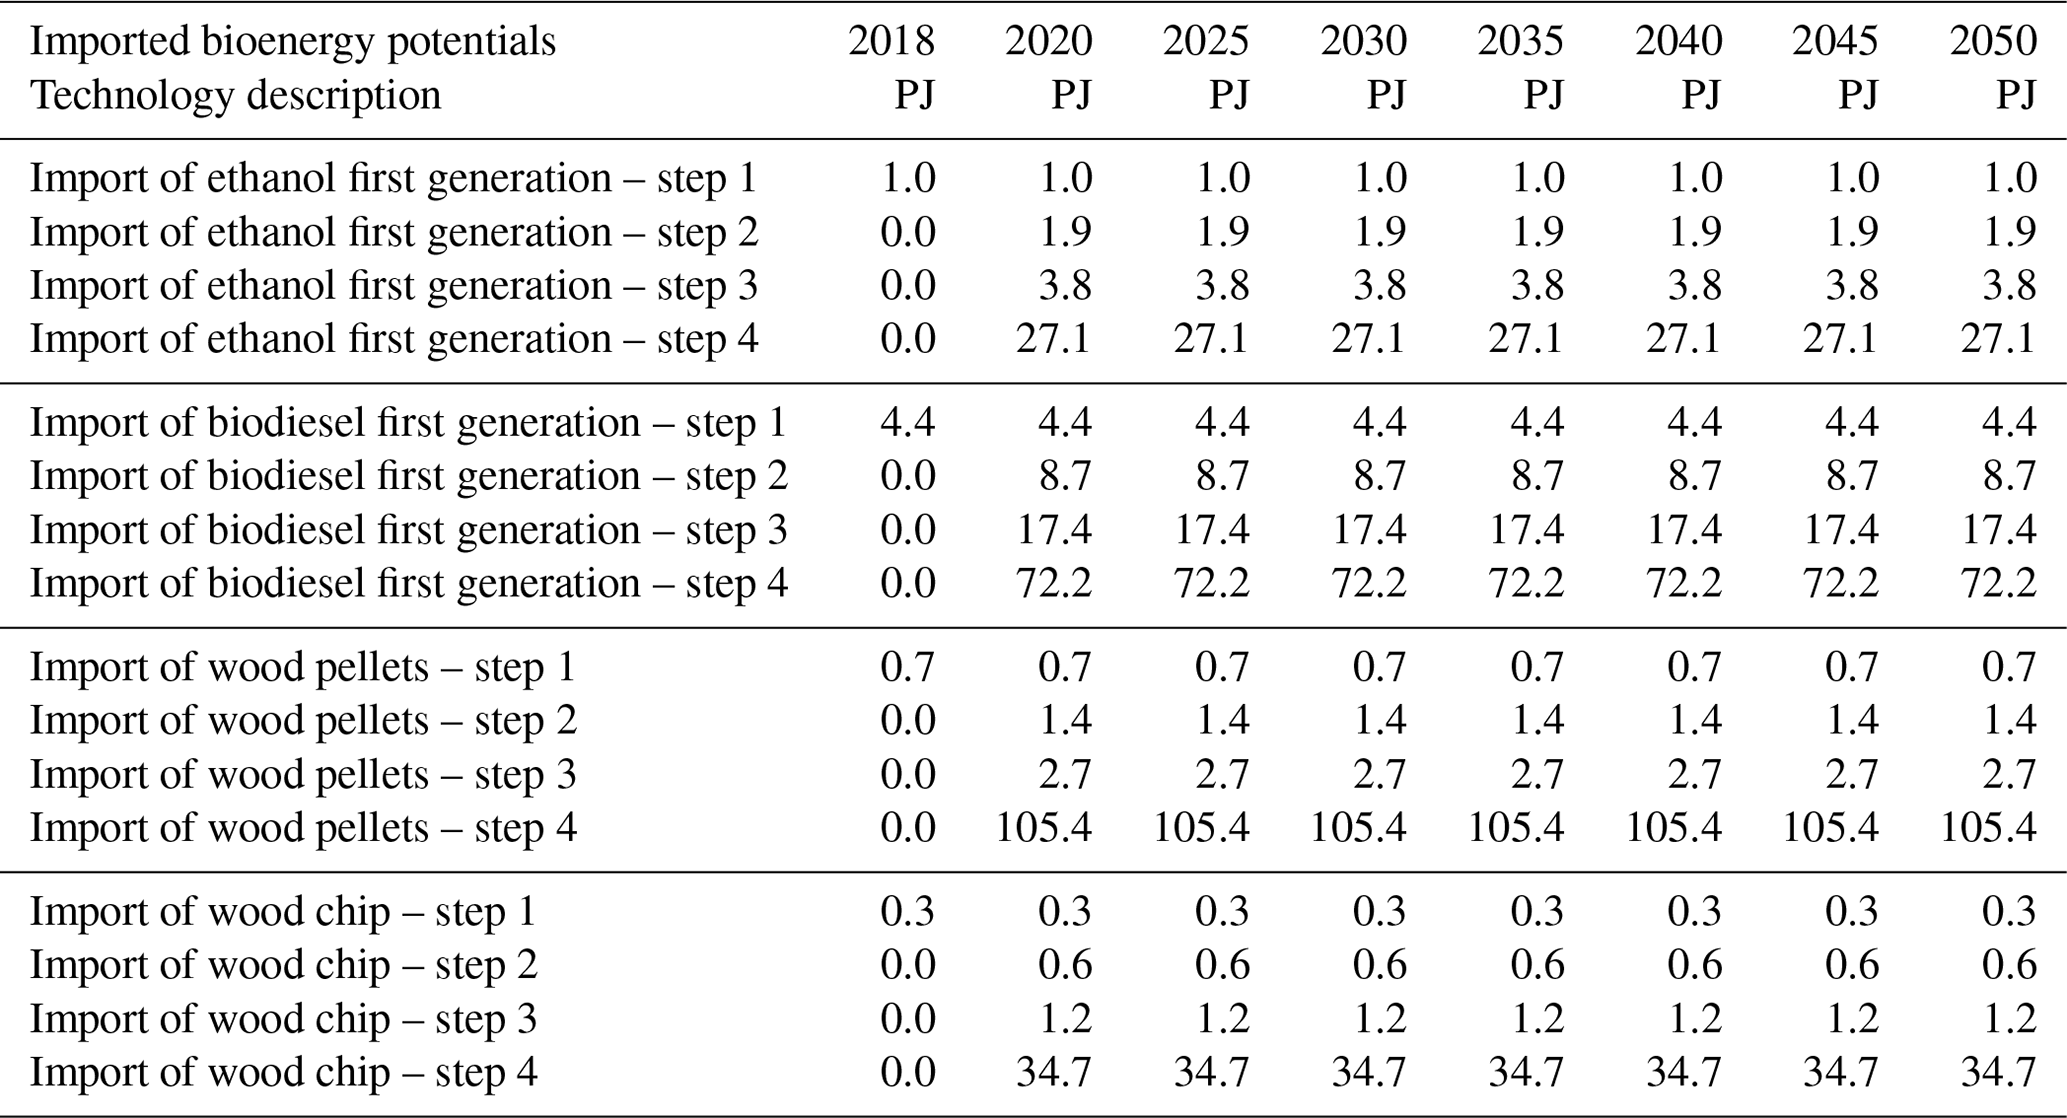
Table A5Base year generation units.
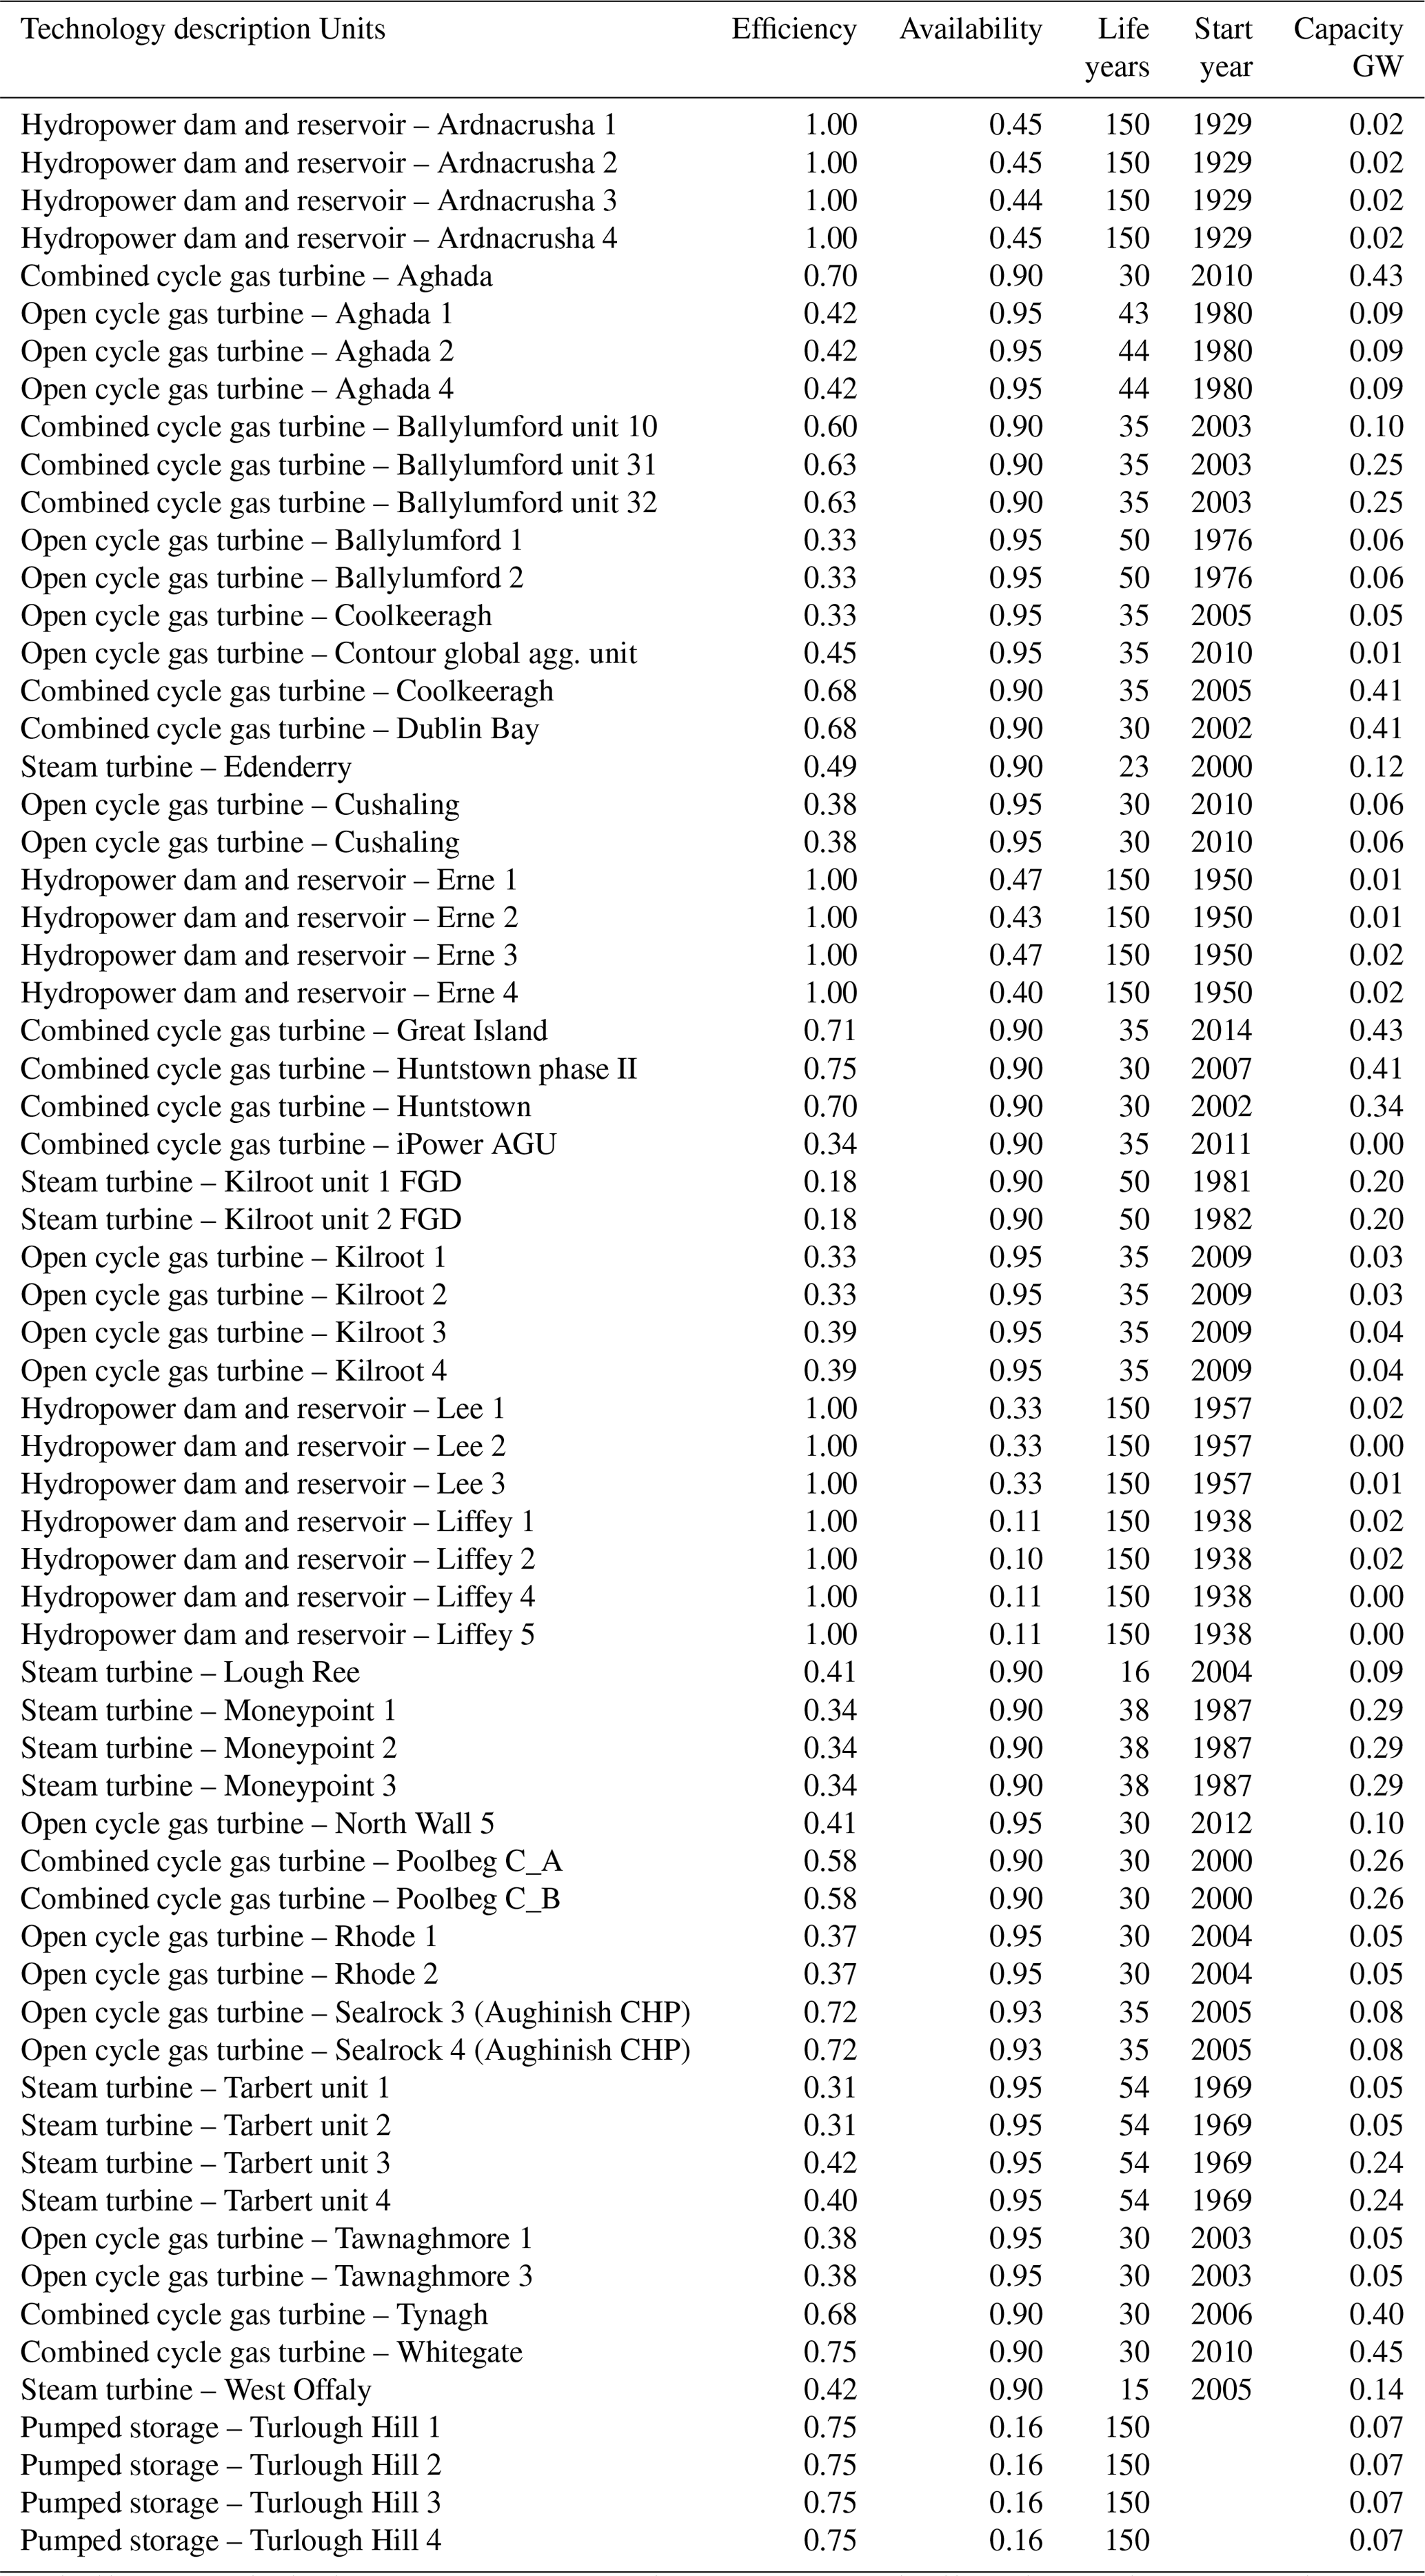
The abbreviations used in the table are as follows: FGD – flue gas desulfurisation, CHP – combined heat and power, and AGU – aggregated generating unit.
Table A6Residential heating cost and efficiency. Note: it is assumed that water heaters are 30 % less efficient than space heaters. The costs shown are for space heaters only.
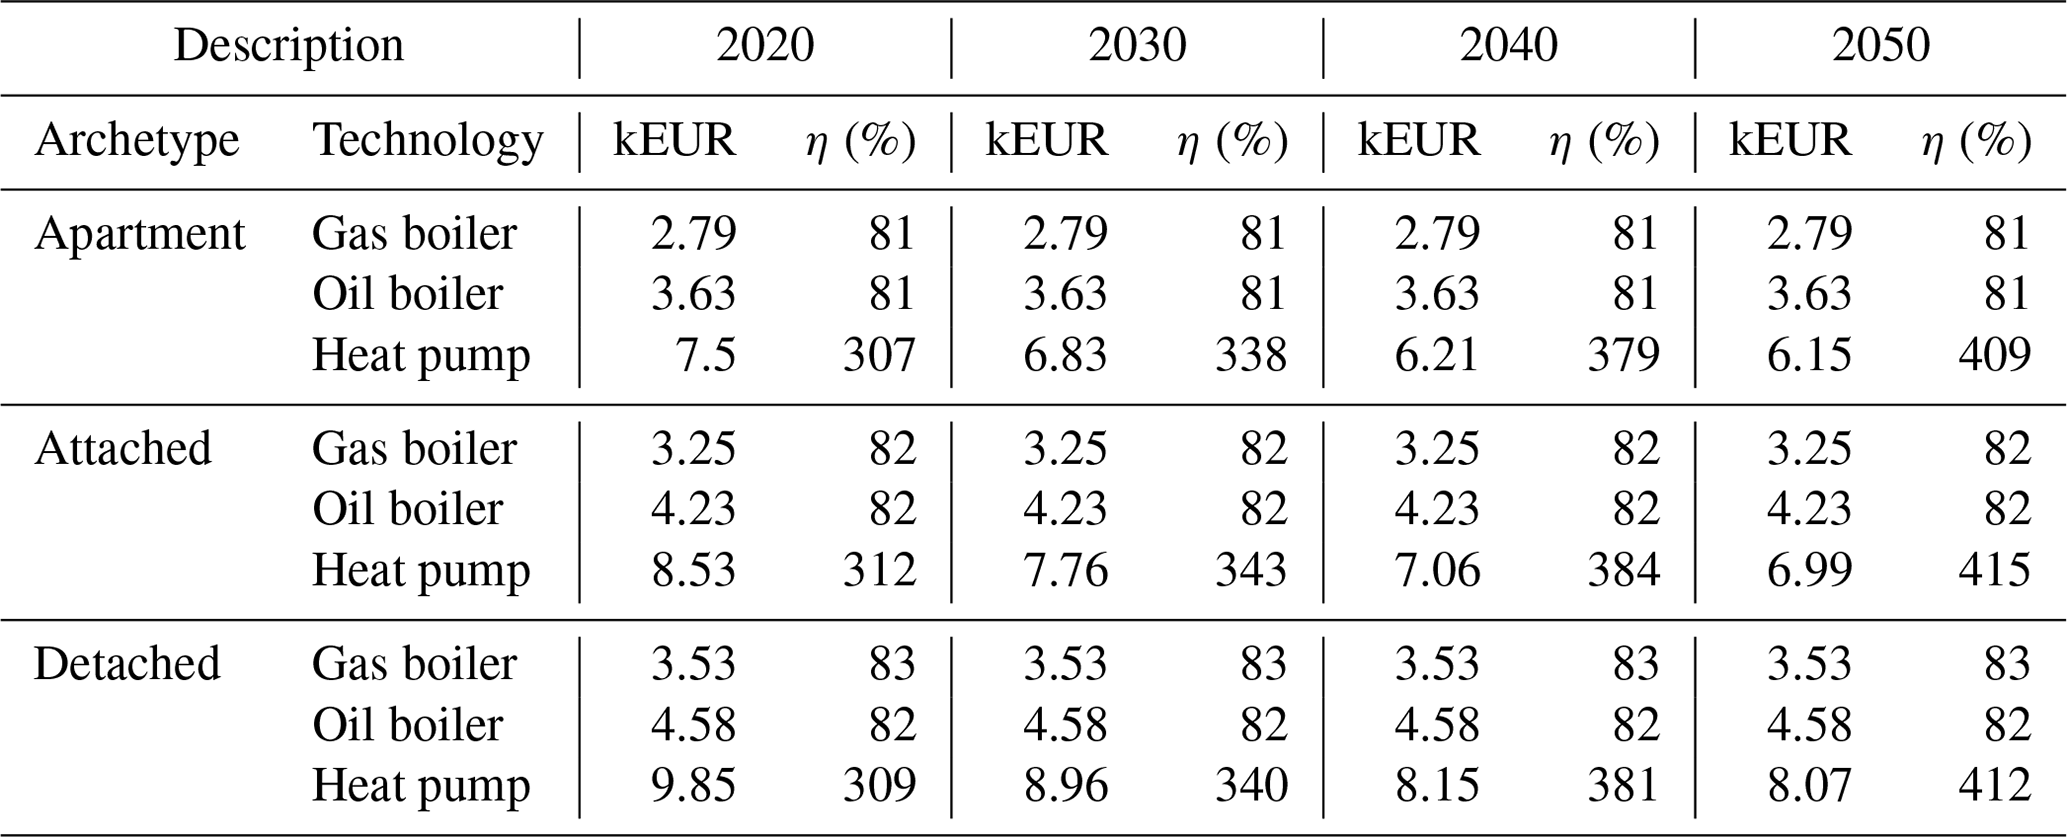
kEUR: thousand euro.
Table A7Technoeconomic characteristics of passenger transport vehicles.
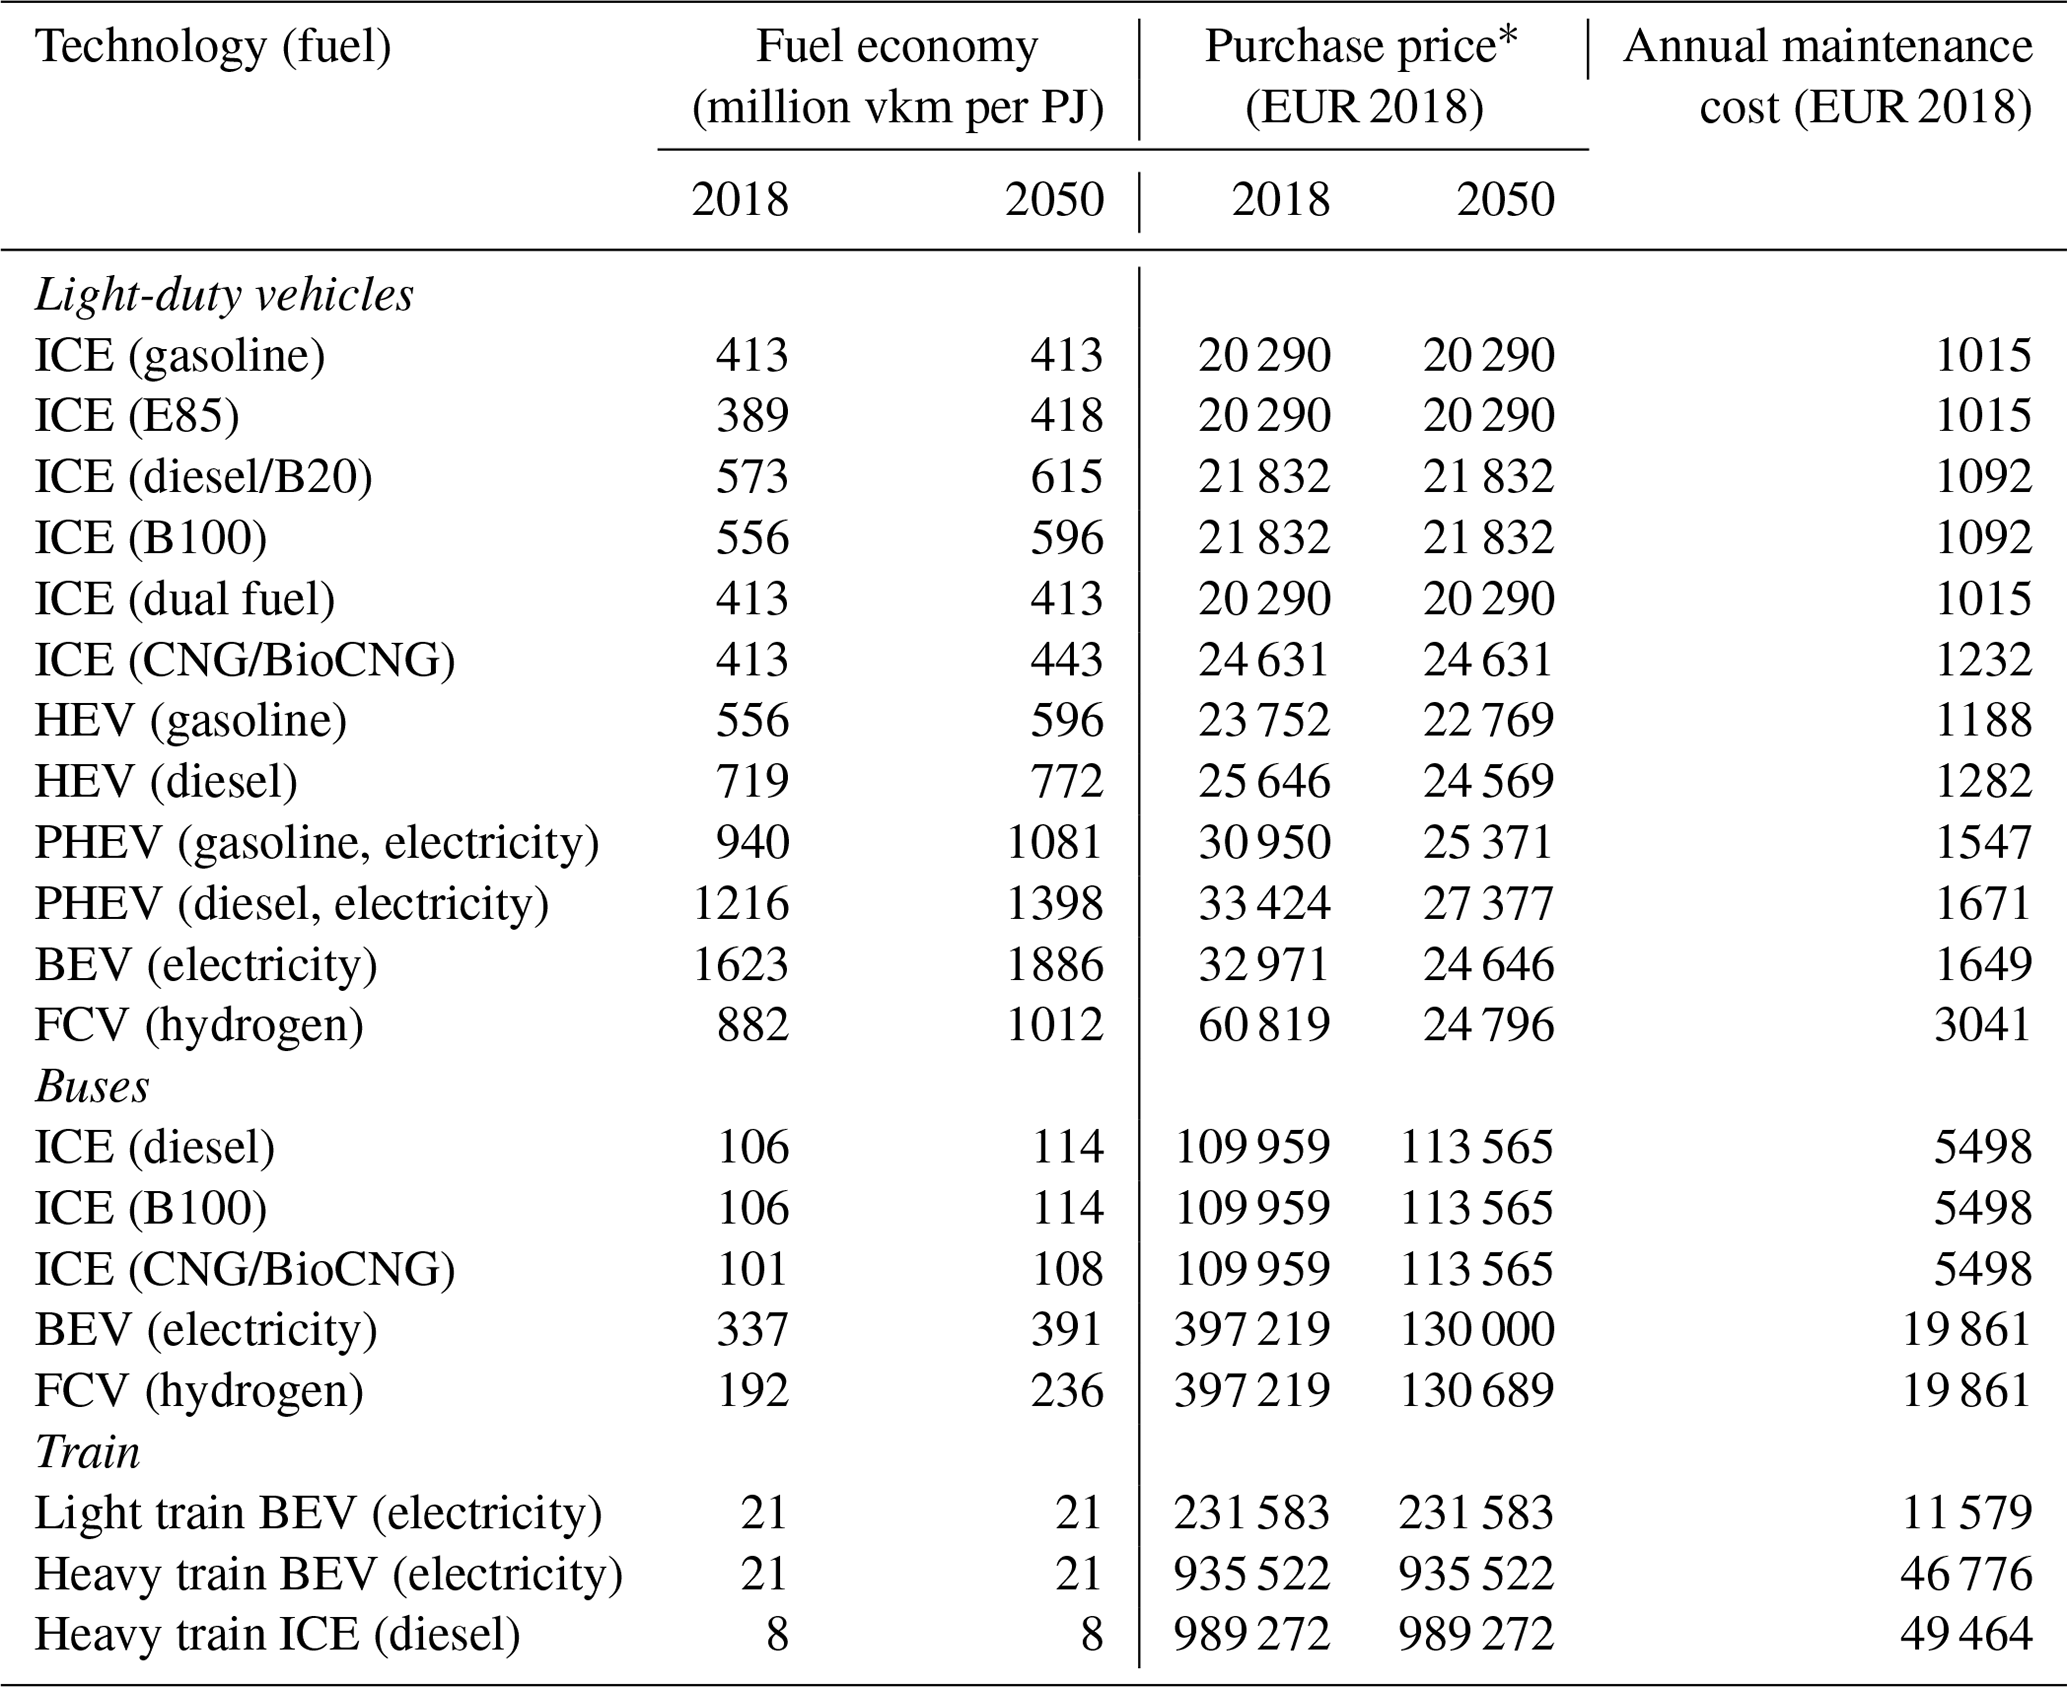
∗ The values exclude taxes and subsidies. vkm: vehicle kilometres.
The version of the TIMES source code used to develop and execute TIMES-Ireland Model is available on Zenodo (https://doi.org/10.5281/zenodo.5537496; Antti-L et al., 2021). The TIMES-Ireland Model (which is essentially a database composed of excel files) is available on GitHub (https://github.com/MaREI-EPMG/times-ireland-model, last access: 18 May 2022) and is archived on Zenodo (https://doi.org/10.5281/zenodo.5708680; Balyk et al., 2021).
OB conceptualised the idea together with HD and JG. HD led the preparation of the paper, with contributions from JG, VA, AG, JM, XY, and OB. All authors contributed to model creation, data analysis, and model validation. OB and AS reviewed and edited the draft before the original submission.
The contact author has declared that neither they nor their co-authors have any competing interests.
Publisher's note: Copernicus Publications remains neutral with regard to jurisdictional claims in published maps and institutional affiliations.
The authors wish to acknowledge the contributions of the following people: Alessandro Chiodi, Paul Deane, Maurizio Gargiulo, Gerald Lyons, Brian Ó Gallachóir, and Fionn Rogan. The authors would also like to thank the following experts, for their feedback during the expert review process: Andrew Kelly, Sarah Ni Ruairc, Joseph Cummins, Andrew Moloney, Marie Bourke, Ilkka Keppo, John Curtis, Gerry Duggan, John Fitzgerald, Luke O'Call White, Tadhg O'Mahony, and Andrew Murphy, as well as individuals at UCD, DFIN, and EirGrid.
This research has been supported by the Department of Environment, Climate and Communications through the Climate and Energy Modelling Services to the Technical Research and Modelling (TRAM) Group (grant no. RFT2016/01213/12806) and by the Science Foundation Ireland (grant nos. 17/NSFC/5181 and 12/RC/2302_P2).
This paper was edited by Gunnar Luderer and reviewed by Oliver Broad and James Price.
AECOM: Cost Optimal Calculations and Gap Analysis for Buildings in Ireland under Directive 2010/31/EU on the Energy Performance of Buildings (Recast) Section 1-Residential Buildings, Tech. rep., AECOM, https://assets.gov.ie/100189/eb2d862f-6d19-4578-8dd0-47f1d7cc0d0f.pdf (last access: 18 May 2022), 2013. a
AECOM: National Transport Model Update: Travel Demand Forecasting Report, Tech. rep., AECOM, Dublin, Ireland, https://www.tii.ie/tii-library/strategic-planning/national-transport-model/NTpM-Vol3-Travel-Demand-Forcasting-Report.pdf (last access: 18 May 2022), 2019. a, b, c, d
Ali, U., Shamsi, M. H., Bohacek, M., Hoare, C., Purcell, K., Mangina, E., and O'Donnell, J.: A data-driven approach to optimize urban scale energy retrofit decisions for residential buildings, Appl. Energ., 267, 114861, https://doi.org/10.1016/j.apenergy.2020.114861, 2020. a
Antti-L, IEA-ETSAP, and ggiannakidis: etsap-TIMES/TIMES_model: TIMES Version 4.5.8 (v4.5.8), Zenodo [code], https://doi.org/10.5281/zenodo.5537496, 2021. a
Aryanpur, V. and Shafiei, E.: Transition to alternative fuel vehicles and implications for energy demand and GHG emissions in Iran, Energy and Environment, 26, 863–875, https://doi.org/10.1260/0958-305X.26.5.863, 2015. a
Aryanpur, V., O'Gallachoir, B., Dai, H., Chen, W., and Glynn, J.: A review of spatial resolution and regionalisation in national-scale energy systems optimisation models, Energy Strateg. Rev., 37, 100702, https://doi.org/10.1016/j.esr.2021.100702, 2021. a
Aryanpur, V., Balyk, O., Daly, H., Ó Gallachóir, B., and Glynn, J.: Decarbonisation of passenger light-duty vehicles using spatially resolved TIMES-Ireland Model, Appl. Energ., 316, 119078, https://doi.org/10.1016/j.apenergy.2022.119078, 2022. a
Balyk, O.: Timeslice Tool for TIMES models (v0.1.0), Zenodo, https://doi.org/10.5281/zenodo.6564759, 2022. a
Balyk, O., Andersen, K. S., Dockweiler, S., Gargiulo, M., Karlsson, K., Næraa, R., Petrović, S., Tattini, J., Termansen, L. B., and Venturini, G.: TIMES-DK: Technology-rich multi-sectoral optimisation model of the Danish energy system, Energy Strateg. Rev., 23, 13–22, https://doi.org/10.1016/j.esr.2018.11.003, 2019. a
Balyk, O., Glynn, J., Aryanpur, V., Gaur, A., McGuire, J., Smith, A., Yue, X., Chiodi, A., Gargiulo, M., and Daly, H.: TIMES-Ireland Model (v1.0), Zenodo [data set], https://doi.org/10.5281/zenodo.5708680, 2021. a, b
Bergin, A. and García-Rodríguez, A.: Regional Demographics and Structural Housing Demand At a County Level, Tech. Rep. 111, The Economic and Social Research Institute, Dublin, Ireland, https://doi.org/10.26504/rs111, 2020. a
Bergin, A., Conroy, N., Rodriguez, A. G., Holland, D., McInerney, N., Morgenroth, E. L., and Smith, D.: COSMO: A new COre Structural MOdel for Ireland, Tech. rep., ESRI Working Paper, The Economic and Social Research Institute (ESRI), Dublin, Ireland, 2017. a, b
Carlsson, J., del Mar Perez Fortes, M., de Marco, G., Giuntoli, J., Jakubcionis, M., Jäger-Waldau, A., Lacal-Arantegui, R., Lazarou, S., Magagna, D., Moles, C., Sigfusson, B., Spisto, A., Vallei, M., and Weidner, E.: Energy Technology Reference Indicator (ETRI) Projections for 2010–2050, Tech. rep., European Commission Joint Resarch Centre, Petten, the Netherlands, https://doi.org/10.2790/057687, 2014. a
CCAC: Climate Change Advisory Council Annual Review 2020, Tech. rep., Climate Change Advisory Council, Dublin, Ireland, https://www.climatecouncil.ie/media/climatechangeadvisorycouncil/contentassets/publications/CCAC_AnnualReview2020FINAL.pdf(last access: 18 May 2022), 2020. a
Chiodi, A., Donnellan, T., Breen, J., Deane, P., Hanrahan, K., Gargiulo, M., and Ó Gallachóir, B. P.: Integrating agriculture and energy to assess GHG emissions reduction: a methodological approach, Clim. Policy, 16, 215–236, https://doi.org/10.1080/14693062.2014.993579, 2016. a, b, c
Collins, M. and Curtis, J.: Value for money in energy efficiency retrofits in Ireland: grant provider and grant recipients, Appl. Econ., 49, 5245–5267, https://doi.org/10.1080/00036846.2017.1302068, 2017. a
CSO: Census of Population 2016 – Profile 2 Population Distribution and Movements, Central Statistics Office (CSO), https://www.cso.ie/en/releasesandpublications/ep/p-cp2tc/cp2pdm/ (last access: 18 May 2022), 2017. a
CSO: Population and Labour Force Projections 2017–2051, Central Statistics Office (CSO), https://www.cso.ie/en/releasesandpublications/ep/p-plfp/populationandlabourforceprojections2017-2051/ (last access: 18 May 2022), 2018. a
CSO: Private Households in Permanent Housing Units 2011 to 2016 (Table E1008), Central Statistics Office (CSO), https://data.cso.ie/table/E1008 (last access: 18 May 2022), 2020a. a
CSO: Private Households in Permanent Housing Units 2011 to 2016 (Table E1055), Central Statistics Office (CSO), https://data.cso.ie/table/E1055 (last access: 18 May 2022), 2020b. a
CSO: How We Travelled, in: National Travel Survey 2019, Central Statistics Office (CSO), https://www.cso.ie/en/releasesandpublications/ep/p-nts/nationaltravelsurvey2019/howwetravelled/ (last access: 18 May 2022), 2020c. a
CSO: Projected Population 2016 Based, Central Statistics Office (CSO), https://data.cso.ie/table/pea22 (last access: 18 May 2022), 2020d. a
CSO: Transport Omnibus 2018: Public Transport, Central Statistics Office (CSO), https://www.cso.ie/en/releasesandpublications/ep/p-tranom/transportomnibus2018/publictransport/ (last access: 18 May 2022), 2020e. a
CSO: Passengers, Freight and Commercial Flights (Table TAA03), Central Statistics Office (CSO), https://data.cso.ie/table/taa03 (last access: 18 May 2022), 2020f. a
CSO: Road Freight Transport Activity (Table TFA22), Central Statistics Office (CSO), https://data.cso.ie/table/TFA22 (last access: 18 May 2022), 2020g. a, b, c
CSO: Road Freight Transport Activity (Table TFA03), Central Statistics Office (CSO), https://data.cso.ie/table/TFA03 (last access: 18 May 2022), 2020h. a, b, c
CSO: Road Traffic Volumes of Goods Vehicle (Table THA19), Central Statistics Office (CSO), https://data.cso.ie/table/THA19 (last access: 18 May 2022), 2020i. a, b
CSO: Road Traffic Volumes of Private Cars (Table THA18), Central Statistics Office (CSO), https://data.cso.ie/table/THA18 (last access: 18 May 2022), 2020j. a
CSO: Road Traffic Volumes (Table THA17), Central Statistics Office (CSO), https://data.cso.ie/table/THA17 (last access: 18 May 2022), 2020k. a
CSO: Road Traffic Volumes of Small Public Serviced Vehicle (Table THA20), Central Statistics Office (CSO), https://data.cso.ie/table/THA20 (last access: 18 May 2022), 2020l. a
CSO: Estimates of Household Income, Central Statistics Office (CSO), https://ws.cso.ie/public/api.restful/PxStat.Data.Cube_API.ReadDataset/CIA02/CSV/1.0/en (last access: 18 May 2022), 2021. a
Daly, H., Smith, A., Aryanpur, V., Gaur, A., McGuire, J., Yue, X., Glynn, J., and Balyk, O.: Carbon Budget Scenarios for Ireland's Energy System, 2021-50 (v1.0), Zenodo, https://doi.org/10.5281/zenodo.5517363, 2021. a
Daly, H. E. and Ó Gallachóir, B. P.: Modelling future private car energy demand in Ireland, Energ. Policy, 39, 7815–7824, https://doi.org/10.1016/j.enpol.2011.09.027, 2011. a
Daly, H. E., Scott, K., Strachan, N., and Barrett, J.: Indirect CO2 Emission Implications of Energy System Pathways: Linking IO and TIMES Models for the UK, Environ. Sci. Technol., 49, 10701–10709, https://doi.org/10.1021/acs.est.5b01020, 2015. a
Danish Energy Agency and Energinet: Technology Data – Heating installations, Tech. Rep. 0003, DEA, https://ens.dk/sites/ens.dk/files/Analyser/technology_data_catalogue_for_individual_heating_installations.pdf (last access: 18 May 2022), 2020. a
Dantas, T. M., Cyrino Oliveira, F. L., and Varela Repolho, H. M.: Air transportation demand forecast through Bagging Holt Winters methods, J. Air Transp. Manag., 59, 116–123, https://doi.org/10.1016/j.jairtraman.2016.12.006, 2017. a
DCCAE: Climate Action Plan 2019: to Tackle Climate Breakdown, Tech. rep., Department of Communications Climate Action and Environment, https://assets.gov.ie/25419/c97cdecddf8c49ab976e773d4e11e515.pdf (last access: 18 May 2022), 2019. a, b
Deane, P., Curtis, J., Chiodi, A., Gargiulo, M., Rogan, F., Dineen, D., Glynn, J., FitzGerald, J., Ó Gallachóir, B., DECLG, UCC, and ESRI: Technical support on developing low carbon sector roadmaps for Ireland: Low Carbon Energy Roadmap for Ireland, Tech. Rep. 021, Department of Environment, Community and Local Government, Dublin, Ireland, https://www.esri.ie/system/files?file=media/file-uploads/2015-07/BKMNEXT292.pdf (last access: 18 May 2022), 2013. a
DeCarolis, J., Daly, H., Dodds, P., Keppo, I., Li, F., McDowall, W., Pye, S., Strachan, N., Trutnevyte, E., Usher, W., Winning, M., Yeh, S., and Zeyringer, M.: Formalizing best practice for energy system optimization modelling, Appl. Energ., 194, 184–198, https://doi.org/10.1016/j.apenergy.2017.03.001, 2017. a
Department of Finance: Stability Programme Update 2020, Tech. rep., Department of Finance, Dublin, Ireland, 2020. a
Department of the Taoiseach: Programme for Government: Our Shared Future, Tech. rep., Department of the Taoiseach, https://assets.gov.ie/130911/fe93e24e-dfe0-40ff-9934-def2b44b7b52.pdf (last access: 18 May 2022), 2020. a
Dineen, D., Rogan, F., and Ó Gallachóir, B. P.: Improved modelling of thermal energy savings potential in the existing residential stock using a newly available data source, Energy, 90, 759–767, https://doi.org/10.1016/j.energy.2015.07.105, 2015. a, b
Duffy, P., Black, K., Hyde, B., Ryan, A. M., and Ponzi, J.: Ireland's National Inventory Report 2019: Greenhouse Gas Emissions 1990-2017, Tech. rep., Environmental Protection Agency, Johnstown Castle, https://www.epa.ie/publications/monitoring–assessment/climate-change/air-emissions/Ireland-NIR-2019_Final.pdf (last access: 18 May 2022), 2019. a
Duffy, P., Black, K., Fahey, D., Hyde, B., Kehoe, A., Murphy, J., Quirke, B., Ryan, A. M., and Ponzi, J.: Ireland's National Inventory Report 2020: Greenhouse Gas Emissions 1990-2018, Tech. rep., Environmetal Protection Agency, Johnstown Castle, https://www.epa.ie/publications/monitoring--assessment/climate-change/air-emissions/NIR-2020_Merge_finalv2.pdf (last access: 18 May 2022), 2020. a
EirGrid: Tomorrow's Energy Scenarios 2017, Tech. rep., EirGrid, Dublin, Ireland, http://www.eirgridgroup.com/site-files/library/EirGrid/EirGrid-Tomorrows-Energy-Scenarios-Report-2017.pdf (last access: 18 May 2022), 2017. a, b
EirGrid and SONI: All-Island Generation Capacity Statement 2019–2028, Tech. rep., EirGrid Group, https://www.eirgridgroup.com/site-files/library/EirGrid/EirGrid-Group-All-Island-Generation-Capacity-Statement-2019-2028.pdf (last access: 18 May 2022), 2019. a
EirGrid and SONI: All-Island Generation Capacity Statement 2020–2029 All-Island, Tech. rep., EirGrid Group, https://www.eirgridgroup.com/site-files/library/EirGrid/All-Island-Generation-Capacity-Statement-2020-2029.pdf (last access: 18 May 2022), 2020. a, b
EPA: Ireland's Greenhouse Gas Emissions Projections 2019-2040, Tech. rep., Environmental Protection Agency, https://www.epa.ie/publications/monitoring–assessment/climate-change/air-emissions/2020-EPA-Greenhouse-Gas-Emissions-Projections_final.pdf (last access: 18 May 2022), 2020. a
European Environmental Agency: Greenhouse gas emissions per capita (t2020_rd300), Eurostat, https://ec.europa.eu/eurostat/databrowser/view/t2020_rd300/ (last access: 18 May 2022), 2022. a, b
Fais, B., Keppo, I., Zeyringer, M., Usher, W., and Daly, H.: Impact of technology uncertainty on future low-carbon pathways in the UK, Energy Strateg. Rev., 13, 154–168, 2016. a
García-Gusano, D., Espegren, K., Lind, A., and Kirkengen, M.: The role of the discount rates in energy systems optimisation models, Renewable and Sustainable Energy Reviews, 59, 56–72, https://doi.org/10.1016/j.rser.2015.12.359, 2016. a
Gaur, A., Balyk, O., Glynn, J., Aryanpur, V., McGuire, J., Smith, A., Yue, X., Chiodi, A., Gargiulo, M., and Daly, H.: TIMES-Ireland Model (v1.0.0-s.1), Zenodo, https://doi.org/10.5281/zenodo.6531582, 2022a. a
Gaur, A., Balyk, O., Glynn, J., Curtis, J., and Daly, H.: Low energy demand scenario for feasible deep decarbonisation: Whole energy systems modelling for Ireland, Renewable and Sustainable Energy Transition, 2, 100024, https://doi.org/10.1016/j.rset.2022.100024, 2022b. a
Geffert, W., Rush, J., Strunk, K., and Falk, J.: Validation Report for I-SEM PLEXOS Model, 2018-2023, Tech. rep., NERA Economic Consulting, https://www.semcommittee.com/sites/semc/files/media-files/SEM-18-175%28a%29%20NERA%20Report%20on%20the%20validated%20SEM%20PLEXOS%20model%202018-2023.pdf (last access: 18 May 2022), 2018. a, b
Glynn, J., Gargiulo, M., Chiodi, A., Deane, P., Rogan, F., and Ó Gallachóir, B.: Zero carbon energy system pathways for Ireland consistent with the Paris Agreement, Clim. Policy, 19, 30–42, https://doi.org/10.1080/14693062.2018.1464893, 2019. a
Government of Ireland: Project Ireland 2040 – National Planning Framework, Tech. rep., Department of Housing, Planning and Local Government, Dublin, Ireland, https://npf.ie/ (last access: 18 May 2022), 2018. a, b
Grubb, H. and Mason, A.: Long lead-time forecasting of UK air passengers by Holt–Winters methods with damped trend, Int. J. Forecasting, 17, 71–82, https://doi.org/10.1016/S0169-2070(00)00053-4, 2001. a
Helgeson, B. and Peter, J.: The role of electricity in decarbonizing European road transport – Development and assessment of an integrated multi-sectoral model, Appl. Energ., 262, 114365, https://doi.org/10.1016/j.apenergy.2019.114365, 2020. a
IEA: World Energy Outlook 2019, Tech. rep., IEA, Paris, https://www.iea.org/reports/world-energy-outlook-2019 (last access: 18 May 2022), 2019. a, b, c, d
IEA: World Energy Outlook 2020, Tech. rep., IEA, Paris, https://www.iea.org/reports/world-energy-outlook-2020 (last access: 18 May 2022), 2020. a, b, c, d
IEA-ETSAP: etsap-TIMES/TIMES_model: Latest TIMES Version, Zenodo, https://doi.org/10.5281/zenodo.3865460, 2020. a
IPCC: Global Warming of 1.5 ∘C. An IPCC Special Report on the impacts of global warming of 1.5 ∘C above pre-industrial levels and related global greenhouse gas emission pathways, in the context of strengthening the global response to the threat of climate change,, Intergovernmental Panel on Climate Change, https://www.ipcc.ch/site/assets/uploads/sites/2/2019/06/SR15_Full_Report_High_Res.pdf (last access: 18 May 2022), 2018. a
Irish Rail: Annual Report, Tech. rep., Irish Rail, Dublin, Ireland, https://www.irishrail.ie/IrishRail/media/Imported/18_ie_annual_report_final.pdf (last access: 18 May 2022), 2018. a
Kumar, N., Peter, B., Lefton, S., Agan, D., and Hilleman, D.: Power Plant Cycling Costs, Tech. Rep. November, National Renewable Energy Laboratory, Golden, Colorado, https://www.nrel.gov/docs/fy12osti/55433.pdf (last access: 18 May 2022), 2012. a
Lian, L., Tian, W., Xu, H., and Zheng, M.: Modeling and forecasting passenger car ownership based on symbolic regression, Sustainability (Switzerland), 10, 2275, https://doi.org/10.3390/su10072275, 2018. a
Loulou, R., Goldstein, G., Kanudia, A., Lettila, A., and Remme, U.: Documentation for the TIMES Model Part I: TIMES Concepts and Theory, IEA-ETSAP, https://www.iea-etsap.org/docs/Documentation_for_the_TIMES_Model-Part-I.pdf (last access: 18 May 2022), 2016a. a
Loulou, R., Lehtila, A., Kanudia, A., Remme, U., and Goldstein, G.: Documentation for the TIMES Model Part II: Reference Manual, IEA-ETSAP, https://www.iea-etsap.org/docs/Documentation_for_the_TIMES_Model-PartII.pdf (last access: 18 May 2022), 2016b. a
Mac Uidhir, T., Rogan, F., and Ó Gallachóir, B. Ó.: Develop a LEAP GHG Ireland Analytical Tool for 2050, Tech. rep., Environmental Protection Agency, Dublin, Ireland, https://www.epa.ie/publications/research/climate-change/Research_Report_349.pdf (last access: 18 May 2022), 2020. a, b
Mulholland, E., Rogan, F., and Ó Gallachóir, B. P.: Techno-economic data for a multi-model approach to decarbonisation of the Irish private car sector, Data in Brief, 15, 922–932, https://doi.org/10.1016/j.dib.2017.10.006, 2017. a
Mulholland, E., Tattini, J., Ramea, K., Yang, C., and Ó Gallachóir, B. P.: The cost of electrifying private transport – Evidence from an empirical consumer choice model of Ireland and Denmark, Transport. Res. D-Tr. E., 62, 584–603, https://doi.org/10.1016/j.trd.2018.04.010, 2018. a, b
Nambiar, A. J., Collin, A. J., Karatzounis, S., Rea, J., Whitby, B., Jeffrey, H., and Kiprakis, A. E.: Optimising power transmission options for marine energy converter farms, International Journal of Marine Energy, 15, 127–139, https://doi.org/10.1016/j.ijome.2016.04.008, 2016. a
NORA: Volumes of Oil Consumption Subject to NORA Levy, National Oil Reserves Agency (NORA), https://www.nora.ie/statistics.312.html (last access: 18 May 2022), 2021. a
NTA: National Household Travel Survey 2017, Tech. rep., National Transport Authority, Dublin, Ireland, 2018. a
O'Callaghan, D. and Prior, S.: Staff Paper 2018 Central Technical Appraisal Parameters Discount Rate, Time Horizon, Shadow Price of Public Funds and Shadow Price of Labour, Tech. rep., Department of Public Expenditure and Reform, https://igees.gov.ie/wp-content/uploads/2019/07/Parameters-Paper-Final-Version.pdf (last access: 18 May 2022), 2018. a
OECD: Economic Outlook No 103 – July 2018 – Long-term baseline projections, Organisation for Economic Co-Operation and Development (OECD), https://stats.oecd.org/Index.aspx?DataSetCode=EO103_LTB (last access: 18 May 2022), 2018. a
Ó Gallachóir, B., Deane, P., Glynn, J., and Rogan, F.: The Role of Energy Technology in Climate Mitigation in Ireland: Irish TIMES Phase 3, Tech. rep., Environmental Protection Agency, Dublin, Ireland, https://www.epa.ie/publications/research/climate-change/Research_Report_326.pdf (last access: 18 May 2022), 2020. a
O'Rourke, F., Boyle, F., and Reynolds, A.: Tidal current energy resource assessment in Ireland: Current status and future update, Renewable and Sustainable Energy Reviews, 14, 3206–3212, https://doi.org/10.1016/j.rser.2010.07.039, 2010. a
Petrović, S., Colangelo, A., Balyk, O., Delmastro, C., Gargiulo, M., Simonsen, M. B., and Karlsson, K.: The role of data centres in the future Danish energy system, Energy, 194, 116928, https://doi.org/10.1016/j.energy.2020.116928, 2020. a
Petrović, S. N., Diachuk, O., Podolets, R., Semeniuk, A., Bühler, F., Grandal, R., Boucenna, M., and Balyk, O.: Exploring the Long-Term Development of the Ukrainian Energy System, Energies, 14, 7731, https://doi.org/10.3390/en14227731, 2021. a
Pfenninger, S. and Staffell, I.: Long-term patterns of European PV output using 30 years of validated hourly reanalysis and satellite data, Energy, 114, 1251–1265, https://doi.org/10.1016/j.energy.2016.08.060, 2016. a
Pfenninger, S., Hirth, L., Schlecht, I., Schmid, E., Wiese, F., Brown, T., Davis, C., Gidden, M., Heinrichs, H., Heuberger, C., Hilpert, S., Krien, U., Matke, C., Nebel, A., Morrison, R., Müller, B., Pleßmann, G., Reeg, M., Richstein, J. C., Shivakumar, A., Staffell, I., Tröndle, T., and Wingenbach, C.: Opening the black box of energy modelling: Strategies and lessons learned, Energy Strateg. Rev., 19, 63–71, https://doi.org/10.1016/j.esr.2017.12.002, 2018. a
Pye, S., Broad, O., Bataille, C., Brockway, P., Daly, H. E., Freeman, R., Gambhir, A., Geden, O., Rogan, F., Sanghvi, S., Tomei, J., Vorushylo, I., and Watson, J.: Modelling net-zero emissions energy systems requires a change in approach, Clim. Policy, 21, 222–231, https://doi.org/10.1080/14693062.2020.1824891, 2021. a
Realmonte, G., Drouet, L., Gambhir, A., Glynn, J., Hawkes, A., Köberle, A. C., and Tavoni, M.: An inter-model assessment of the role of direct air capture in deep mitigation pathways, Nat. Commun., 10, 3277, https://doi.org/10.1038/s41467-019-10842-5, 2019. a
Rogan, F., Cahill, C. J., Daly, H. E., Dineen, D., Deane, J. P., Heaps, C., Welsch, M., Howells, M., Bazilian, M., and Ó Gallachóir, B. P.: LEAPs and Bounds-an Energy Demand and Constraint Optimised Model of the Irish Energy System, Energ. Effic., 7, 441–466, https://doi.org/10.1007/s12053-013-9231-9, 2014. a, b
Rogelj, J., Shindell, D., Jiang, K., Fifita, S., Forster, P., Ginzburg, V., Handa, C., Kheshgi, H., Kobayashi, S., Kriegler, E., Mundaca, L., Séférian, R., and Vilariño, M.: Mitigation pathways compatible with 1.5 ∘C in the context of sustainable development, in: Global Warming of 1.5 ∘C. An IPCC Special Report on the impacts of global warming of 1.5 ∘C above pre-industrial levels and related global greenhouse gas emission pathways, in the context of strengthening the global response to the threat of climate change, edited by: Masson-Delmotte, V., Zhai, P., Pörtner, H.-O., Roberts, D., Skea, J., Shukla, P., Pirani, A., Moufouma-Okia, W., Péan, C., Pidcock, R., Connors, S., Matthews, J., Chen, Y., Zhou, X., Gomis, M., Lonnoy, E., Maycock, T., Tignor, M., and Waterfield, T., IPCC, https://www.ipcc.ch/site/assets/uploads/sites/2/2019/02/SR15_Chapter2_Low_Res.pdf (last access: 18 May 2022), pp. 93–174, 2018. a
Ruiz, P., Nijs, W., Tarvydas, D., Sgobbi, A., Zucker, A., Pilli, R., Jonsson, R., Camia, A., Thiel, C., Hoyer-Klick, C., Dalla Longa, F., Kober, T., Badger, J., Volker, P., Elbersen, B. S., Brosowski, A., and Thrän, D.: ENSPRESO – an open, EU-28 wide, transparent and coherent database of wind, solar and biomass energy potentials, Energy Strateg. Rev., 26, 100379, https://doi.org/10.1016/j.esr.2019.100379, 2019. a
SEAI: Bioenergy Supply in Ireland 2015-2035, Tech. rep., Sustainable Energy Authority of Ireland, https://www.seai.ie/publications/Bioenergy-Supply-in-Ireland-2015-2035.pdf (last access: 18 May 2022), 2015. a, b
SEAI: Energy in the residential sector 2018 Report, Tech. rep., Sustainable Energy Authority of Ireland, https://www.seai.ie/publications/Energy-in-the-Residential-Sector-2018-Final.pdf (last access: 18 May 2022), 2018. a, b
SEAI: Ireland's Energy Balance 2018, Sustainable Energy Authority of Ireland (SEAI), https://www.seai.ie/publications/2018-National-Energy-Balance-Final.pdf (last access: 18 May 2022), 2019. a, b, c, d, e, f, g, h
SEAI: SEAI BER Database, Tech. rep., Sustainable Energy Authority of Ireland, https://ndber.seai.ie/BERResearchTool/ber/search.aspx (last access: 18 May 2022), 2020. a
SEAI: Energy in Ireland. 2021 Report, Tech. rep., Sustainable Energy Authority of Ireland, Dublin, https://www.seai.ie/publications/Energy-in-Ireland-2020.pdf (last access: 18 May 2022), 2021. a
Staffell, I. and Pfenninger, S.: Using bias-corrected reanalysis to simulate current and future wind power output, Energy, 114, 1224–1239, https://doi.org/10.1016/j.energy.2016.08.068, 2016. a
Strachan, N., Fais, B., and Daly, H.: Reinventing the energy modelling–policy interface, Nature Energy, 1, 16012, https://doi.org/10.1038/nenergy.2016.12, 2016. a
TII: Project Appraisal Guidelines for National Roads Unit 6.11 – National Parameters Values Sheet, Tech. rep., Transport Infrastructure Ireland, Dublin, Ireland, https://www.tiipublications.ie/library/PE-PAG-02030-01.pdf (last access: 18 May 2022), 2016. a
Topten International Group: Topten, https://www.topten.eu/private (last access: 18 May 2022), 2021. a
Uidhir, T. M., Rogan, F., Collins, M., Curtis, J., and Ó Gallachóir, B.: Residential stock data and dataset on energy efficiency characteristics of residential building fabrics in Ireland, Data in Brief, 29, 109656, https://doi.org/10.1016/j.dib.2020.105247, 2020a. a
Uidhir, T. M., Rogan, F., Collins, M., Curtis, J., and Ó Gallachóir, B. P.: Improving energy savings from a residential retrofit policy: A new model to inform better retrofit decisions, Energ. Buildings, 209, 109656, https://doi.org/10.1016/j.enbuild.2019.109656, 2020b. a
Yakut, A. M. and de Bruin, K.: Technical documentation of I3E model, Version 3, Tech. rep., Economic and Social Research Institute, Dublin, Ireland, https://doi.org/10.26504/sustat91, 2020. a, b, c, d
These emissions are mainly non-CO2 emissions, CH4 and N2O, arising from enteric fermentation, fertiliser application and soil management, and do not include emissions from land use, while grasslands are a net carbon source.