the Creative Commons Attribution 4.0 License.
the Creative Commons Attribution 4.0 License.
 | 28 Oct 2021
REMIND2.1: transformation and innovation dynamics of the energy-economic system within climate and sustainability limits
Lavinia Baumstark
Nico Bauer
Falk Benke
Christoph Bertram
Stephen Bi
Chen Chris Gong
Jan Philipp Dietrich
Alois Dirnaichner
Anastasis Giannousakis
Jérôme Hilaire
David Klein
Johannes Koch
Marian Leimbach
Antoine Levesque
Silvia Madeddu
Aman Malik
Anne Merfort
Leon Merfort
Adrian Odenweller
Michaja Pehl
Robert C. Pietzcker
Franziska Piontek
Sebastian Rauner
Renato Rodrigues
Marianna Rottoli
Felix Schreyer
Anselm Schultes
Bjoern Soergel
Dominika Soergel
Jessica Strefler
Falko Ueckerdt
Elmar Kriegler
Gunnar Luderer
This paper presents the new and now open-source version 2.1 of the REgional Model of INvestments and Development (REMIND). REMIND, as an integrated assessment model (IAM), provides an integrated view of the global energy–economy–emissions system and explores self-consistent transformation pathways. It describes a broad range of possible futures and their relation to technical and socio-economic developments as well as policy choices. REMIND is a multiregional model incorporating the economy and a detailed representation of the energy sector implemented in the General Algebraic Modeling System (GAMS). It uses non-linear optimization to derive welfare-optimal regional transformation pathways of the energy-economic system subject to climate and sustainability constraints for the time horizon from 2005 to 2100. The resulting solution corresponds to the decentralized market outcome under the assumptions of perfect foresight of agents and internalization of external effects. REMIND enables the analyses of technology options and policy approaches for climate change mitigation with particular strength in representing the scale-up of new technologies, including renewables and their integration in power markets. The REMIND code is organized into modules that gather code relevant for specific topics. Interaction between different modules is made explicit via clearly defined sets of input and output variables. Each module can be represented by different realizations, enabling flexible configuration and extension. The spatial resolution of REMIND is flexible and depends on the resolution of the input data. Thus, the framework can be used for a variety of applications in a customized form, balancing requirements for detail and overall runtime and complexity.
- Article
(3643 KB) - Full-text XML
- BibTeX
- EndNote


This paper presents the new and now open-source version 2.1 of the REgional Model of INvestments and Development (REMIND). The focus is predominantly on the technical structure and the representation of processes in REMIND. Further, illustrative results are presented. The integrated assessment model (IAM) REMIND was originally introduced by Leimbach et al. (2010b). This paper is an update of previous documentations of the model version 1.5 (Luderer et al., 2013), version 1.6 (Luderer et al., 2015), and version 1.7 (Model Documentation – REMIND – IAMC-Documentation, 2020).
This paper is structured as follows: the rest of Sect. 1 provides an overview of REMIND as an integrated assessment model; in Sect. 2, the regional and temporal resolution of REMIND, its modular code structure, interfaces with other models, and the solution algorithm are presented; Sect. 3 provides a description of the representation of different sectors and processes; Sect. 4 shows some example results; and Sect. 5 discusses the strengths and limitations of REMIND.
1.1 What are IAMs?
Integrated assessment models (IAMs) provide an integrated view of the global energy–economy–climate–land system. By asking questions like “Can the world still reach the 2 ∘C target?” and, if so, “Under what socio-economic conditions and applying what technological options?”, it is the goal of these models to explore self-consistent transformation pathways of these highly interdependent subsystems. IAMs can spell out a broad range of possible futures and their relation to technical and socio-economic developments as well as policy choices. More specifically, IAMs are mostly used for sustainable transformation and development pathway analysis and exploring climate policy and technology options. Some IAMs are based on inter-temporal optimization as a powerful and valuable methodological approach, as it enables the derivation of optimal policies to be used as benchmarks in the analyses of other policy options. These analyses constitute an important part of international reports on climate change, including the works from the Intergovernmental Panel on Climate Change (IPCC; Rogelj et al., 2018b) and the United Nations Environment Programme (UNEP) gap reports (UNEP, 2019).
Shared by many IAMs, the Shared Socioeconomic Pathways (SSPs) and Representative Concentration Pathways (RCPs) provide a common reference framework for assumed socio-economic developments and greenhouse gas emission levels (O'Neill et al., 2013). The use of SSPs helps to cover uncertainties regarding technological development for renewable energy or fossil fuel availability but also social and behavioural development like population growth, dietary preferences, environmental awareness, or international cooperation.
The history of integrated assessment modelling dates back several decades (van Beek et al., 2020), and a wide range of different integrated assessment models are currently available. They differ in their level of detail, structure, solution method, and time horizon, and are continuously being developed, which makes categorization difficult (Krey, 2014). Nevertheless, some IAMs are derived from top-down macroeconomic models such that a stylized energy system is embedded into a macroeconomic modelling framework, whereas other IAMs stand in the tradition of systems engineering models and take a bottom-up perspective on the energy system, which comes at the cost of macroeconomic detail. Hybrid IAMs (Hourcade et al., 2006) aim at combining a solid macroeconomic framework with high process detail of mitigation options. The latter is required to describe system transformations that take path dependencies and explicit technological development into account. By contrast, there are some top-down models that are dedicated to cost-benefit analyses of climate mitigation, requiring an even broader modelling scope including climate damages, which comes at the cost of any explicit representation of process-based mitigation options (e.g. DICE, Nordhaus, 2010; and FUND, Anthoff and Tol, 2013). Whereas process-based IAMs typically take a cost-effectiveness approach, in which a given climate target is reached at minimal economic costs of climate mitigation, the REMIND model can endogenously represent macroeconomic climate change damages based on recent damage function estimates (Kalkuhl and Wenz, 2020) and can, thus, be used for cost-benefit analyses or least total cost analyses (as presented in Schultes et al., 2021) (see Sect. 3.1.3).
1.2 What is REMIND?
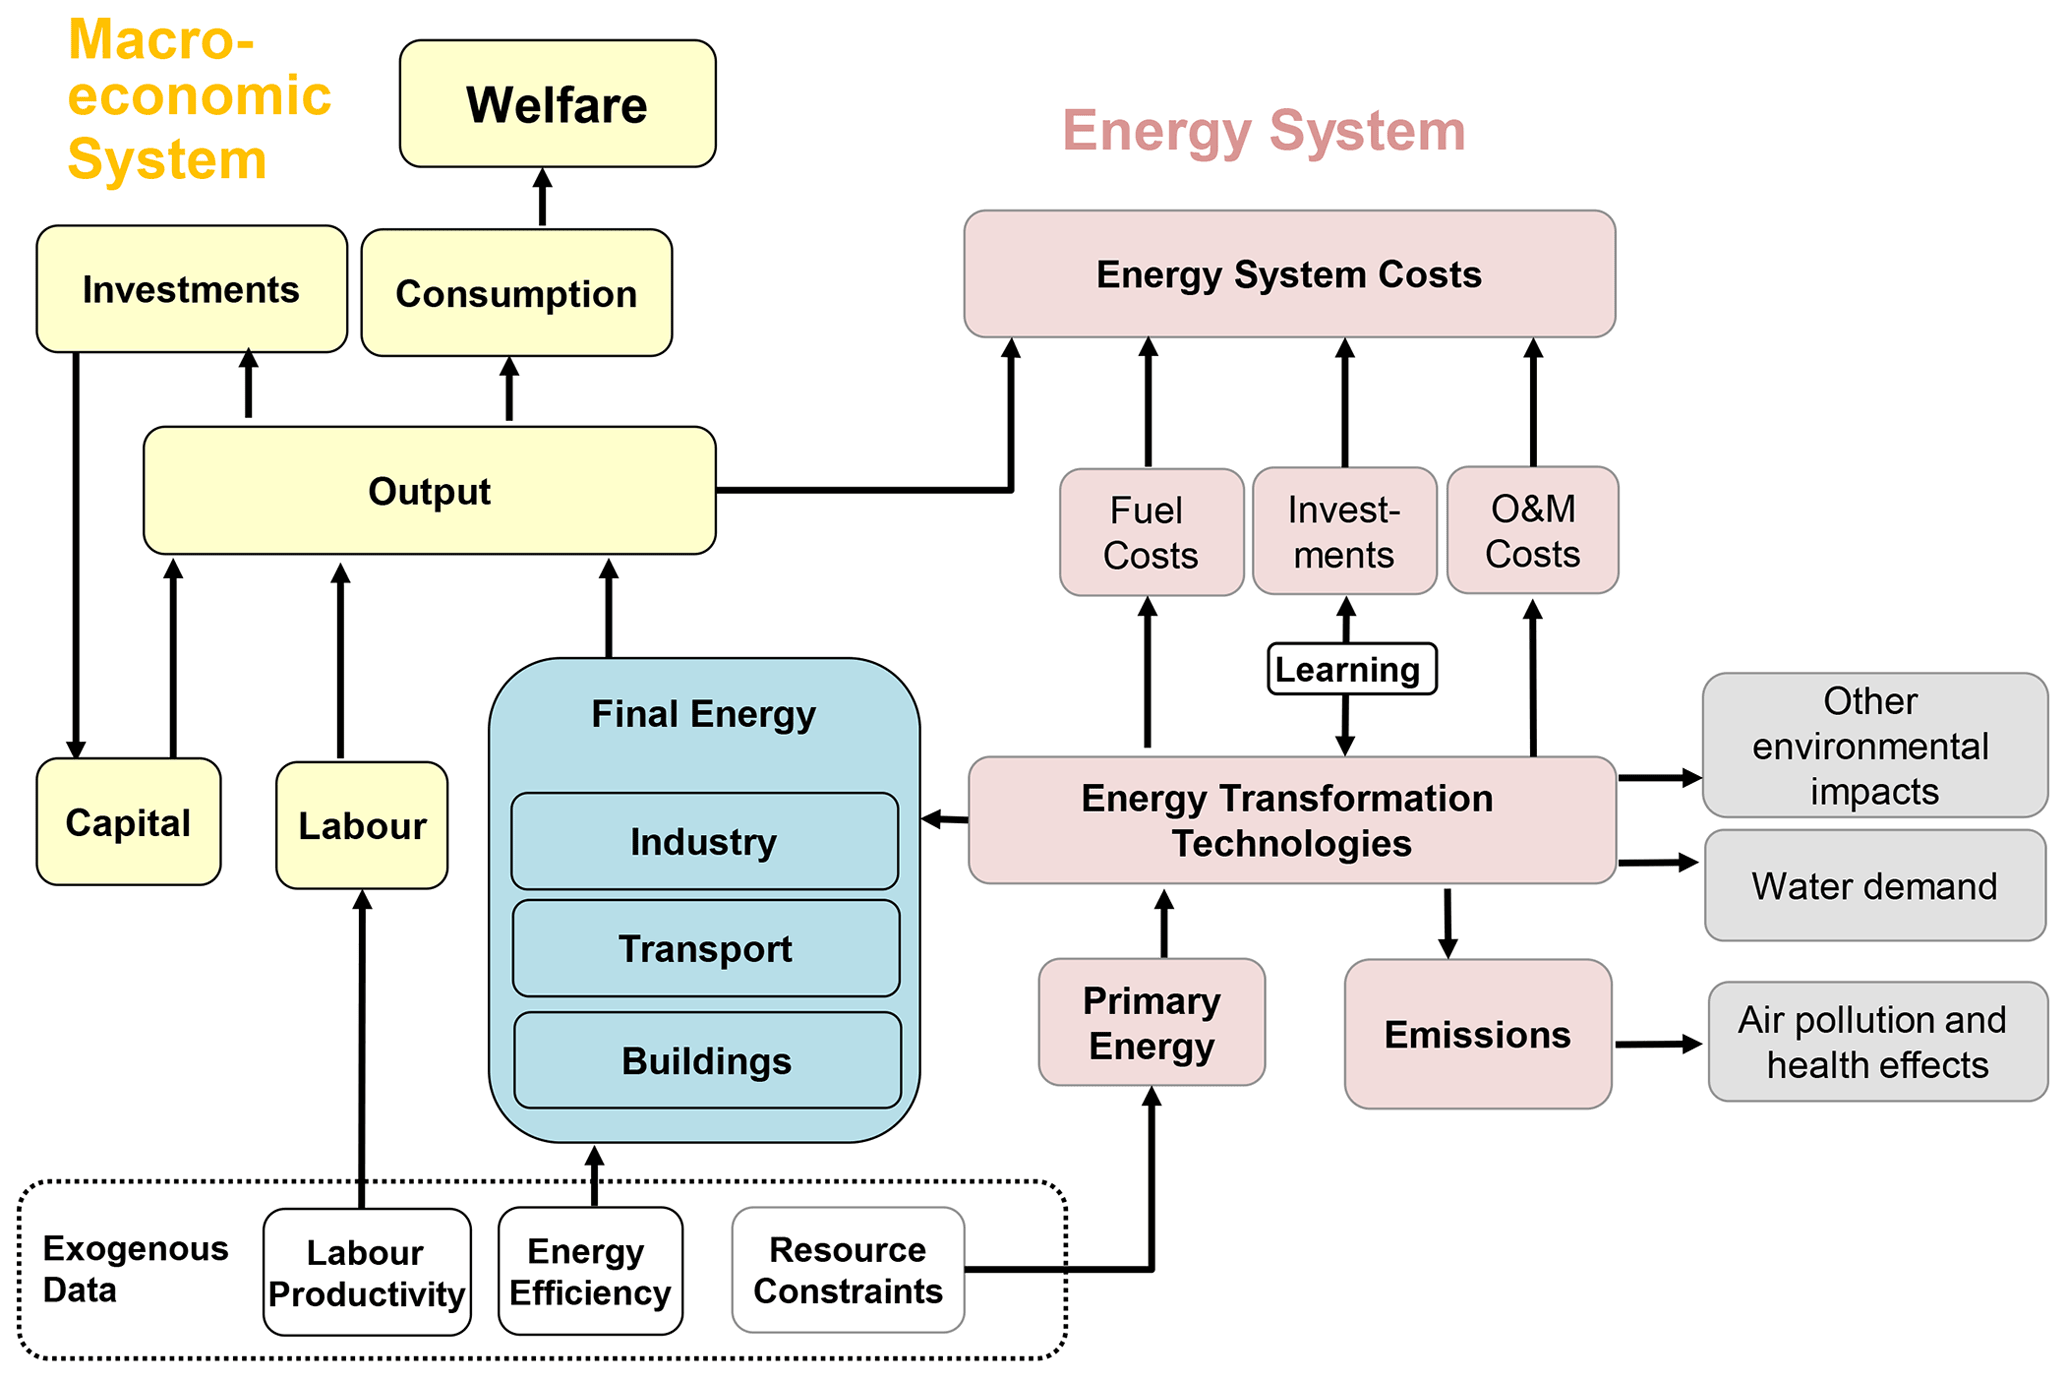
REMIND is a modular multiregional model with a detailed representation of the energy sector in the context of long-term macroeconomic developments (see Fig. 1). REMIND enables the exploration of a wide range of plausible developments and of possible futures of the energy-economic system, investigating internally consistent transformation pathways. REMIND can be coupled to the land-use model MAgPIE (see Sect. 2.4.1) and the climate model MAGICC (see Sect. 2.4.3) for a fully integrated assessment of the energy–economy–land–climate system. In this paper, the version REMIND 2.1.3 is presented and used for the production of outputs.
REMIND is implemented as a non-linear programming (NLP) mathematical optimization problem. Its algebraic formulation is implemented in GAMS (GAMS, 2020). CONOPT version 3.17 (CONOPT, 2020) is used as the numerically efficient solver for the NLP problem. R (R Core Team, 2019) is used for code management as well as handling of input data and post-processing. REMIND calculates aggregate macroeconomic as well as technology-specific, energy-related investments for an inter-temporal Pareto optimum in the model regions for the time horizon from 2005 to 2100, fully accounting for interregional trade in goods, energy carriers, and emissions allowances. REMIND enables the analyses of technology options and policy proposals for climate change mitigation, along with sustainability challenges related to development, air pollution, and – via coupling to MAgPIE (Dietrich et al., 2019, 2020) – land use.
The macroeconomic core of REMIND (Leimbach et al., 2010b, a; Bauer et al., 2012b; Luderer et al., 2012) features a multiregional general equilibrium representation of the Ramsey growth model (i.e. the investment share of economic output is determined endogenously to maximize inter-temporal welfare). This approach is well suited for describing patterns of long-term economic growth (e.g. convergence between developing and industrialized countries) (Barro and Sala-i-Martin, 2004), which are key drivers of energy demand and, thus, emissions. The optimization is subject to equilibrium constraints, such as energy balances, economic production functions, or the budget constraint of the representative household. The model explicitly represents trade in final composite good, primary energy carriers, and, if certain climate policies are enabled, emissions allowances. Thus, equilibrium refers to the balance in goods markets and international trade, such as the global oil market. It is a valid assumption for the decadal timescales considered in scenarios and, thus, does not compromise the validity of the model dynamics. REMIND is usually run in a decentralized mode, where each model region is optimized separately and the clearing of global trade markets is ensured via iterative solutions (see Sect. 2.2).
The macroeconomic production factors are capital, labour, and final or useful energy. A nested production function with constant elasticity of substitution determines the energy demand. REMIND uses economic output for investments in the macroeconomic capital stock as well as for consumption, trade, and energy system expenditures. The macroeconomic core and the energy system part are hard-linked via final or useful energy demand (input to the economy) and the costs incurred by the energy system (output of the economic part). Economic activity results in demand for energy in different sectors (transport, industry, and building sectors) and of different types (electric and non-electric). The primary energy carriers in REMIND include both exhaustible and renewable resources. Exhaustible resources comprise coal, oil, gas, and uranium. Renewable resources include hydro, wind, solar, geothermal, and biomass. More than 50 technologies are available for the conversion of primary energy into secondary energy carriers as well as for the distribution of secondary energy carriers into final energy.
REMIND uses reduced-form emulators derived from the detailed land-use and agricultural model MAgPIE (Lotze-Campen et al., 2008; Dietrich et al., 2019) to represent land-use and agricultural emissions as well as bioenergy supply and other land-based mitigation options. REMIND can also be run in soft-coupled mode with the MAgPIE model (see Sect. 2.4.1).
The model accounts for the full range of anthropogenic greenhouse gas (GHG) emissions, most of which are represented by source. REMIND simulates emissions from long-lived GHGs (CO2, CH4, and N2O), short-lived GHGs (CO, NOx, and volatile organic compounds – VOCs), and aerosols (SO2, black carbon – BC, and organic carbon – OC). It calculates CO2 emissions from fuel combustion and industrial processes, CH4 emissions from fossil fuel extraction and residential energy use, and N2O emissions from energy supply based on sources. Fluorinated gases (F-gases) and emissions from land-use change are included exogenously with different trajectories depending on the SSP and climate target.
In terms of its macroeconomic formulation, REMIND resembles other well-established integrated assessment models such as RICE (Nordhaus and Yang, 1996) and MERGE (Manne et al., 1995). However, REMIND is broader in scope and features a substantially higher level of detail in the representation of energy-system technologies, trade, and global capital markets. Its comparative advantage is that the high technological detail enables a more detailed exploration of efficient strategies to attain an exogenously prescribed climate target (“cost-effectiveness mode”).
Scenarios developed with previous REMIND versions have been published in numerous studies (Bauer et al., 2012a; Bertram et al., 2015; Strefler et al., 2018a). REMIND has also been part of various model inter-comparison projects (e.g. ADVANCE, Luderer et al., 2018; CD-LINKS, Roelfsema et al., 2020; EMF-30, Harmsen et al., 2020; EMF-33, Bauer et al., 2018, p. 33; and SSP, Riahi et al., 2017) as well as the international research initiative for developing the SSPs. The scenario data are accessible via the databases hosted at the International Institute for Applied Systems Analysis (IIASA; e.g. the IAMC 1.5 ∘C Scenario Explorer; Huppmann et al., 2018). The scenarios and SSP framework were used for international assessment processes (Rogelj et al., 2018a; IPCC, 2019; The World in 2050 initiative (TWI), 2018). Some of these studies included dedicated diagnostic exercises to assess the dynamic behaviour of the models (Kriegler et al., 2015), or focused on comparing input assumptions across models (Krey et al., 2019).
1.3 What is new in REMIND 2.1?
This paper introduces the new version 2.1 of REMIND. The last comprehensive documentation of REMIND described version 1.7 (Model Documentation – REMIND – IAMC-Documentation, 2020). Since then, many new features have been added to REMIND, and the model code has become open-source. Flexible spatial aggregation for input data generation was introduced and enables a flexible spatial resolution in REMIND. The techno-economic parameters for most technologies are updated to reflect the latest market data. Bounds on developments until 2019 to reflect the latest deployment and policy developments are introduced, and policy scenarios, especially regarding near-term developments, are adjusted. Besides this, a more detailed representation of the three demand sectors – building, transport, and industry – enables both sector-specific analysis and analysis of the interplay of different energy sectors and sector-coupling strategies. Further novelties are the possibility to include an aggregated representation of impacts in this version as well as the possibility for imperfect capital markets.
1.4 Inputs and outputs of REMIND
REMIND uses a range of exogenous data as an input in order to ensure the consistency of scenarios with historic developments and realistic future projections. Historical data for the year 2005 are used to calibrate most of the free variables (e.g. primary energy mixes in 2005, secondary energy mixes in 2005, standing capacities in 2005, and trade in all traded goods for 2005). Additional bounds for a select few variables, primarily capacity (additions), up through 2019 ensure that the 2020 point of departure in current policy cases is proximal to actual developments. The ability to also run the simulation without these constraints enables important comparisons of model dynamics from 2005 to 2020 with real-world developments. Technology parameters are projected into the future, generally assuming a certain level of convergence across regions in the long term. Projections of coherent future demographic and economic developments offer population and labour trajectories from 2005 to 2100 (SSP trajectories; Dellink et al., 2017; KC and Lutz, 2017). To align with gross domestic product (GDP) trajectories consistent with the population trajectories from 2005 to 2100 (see Fig. 2), as well as final and useful energy trajectories, REMIND calibrates its production function as described in Sect. 2.3.
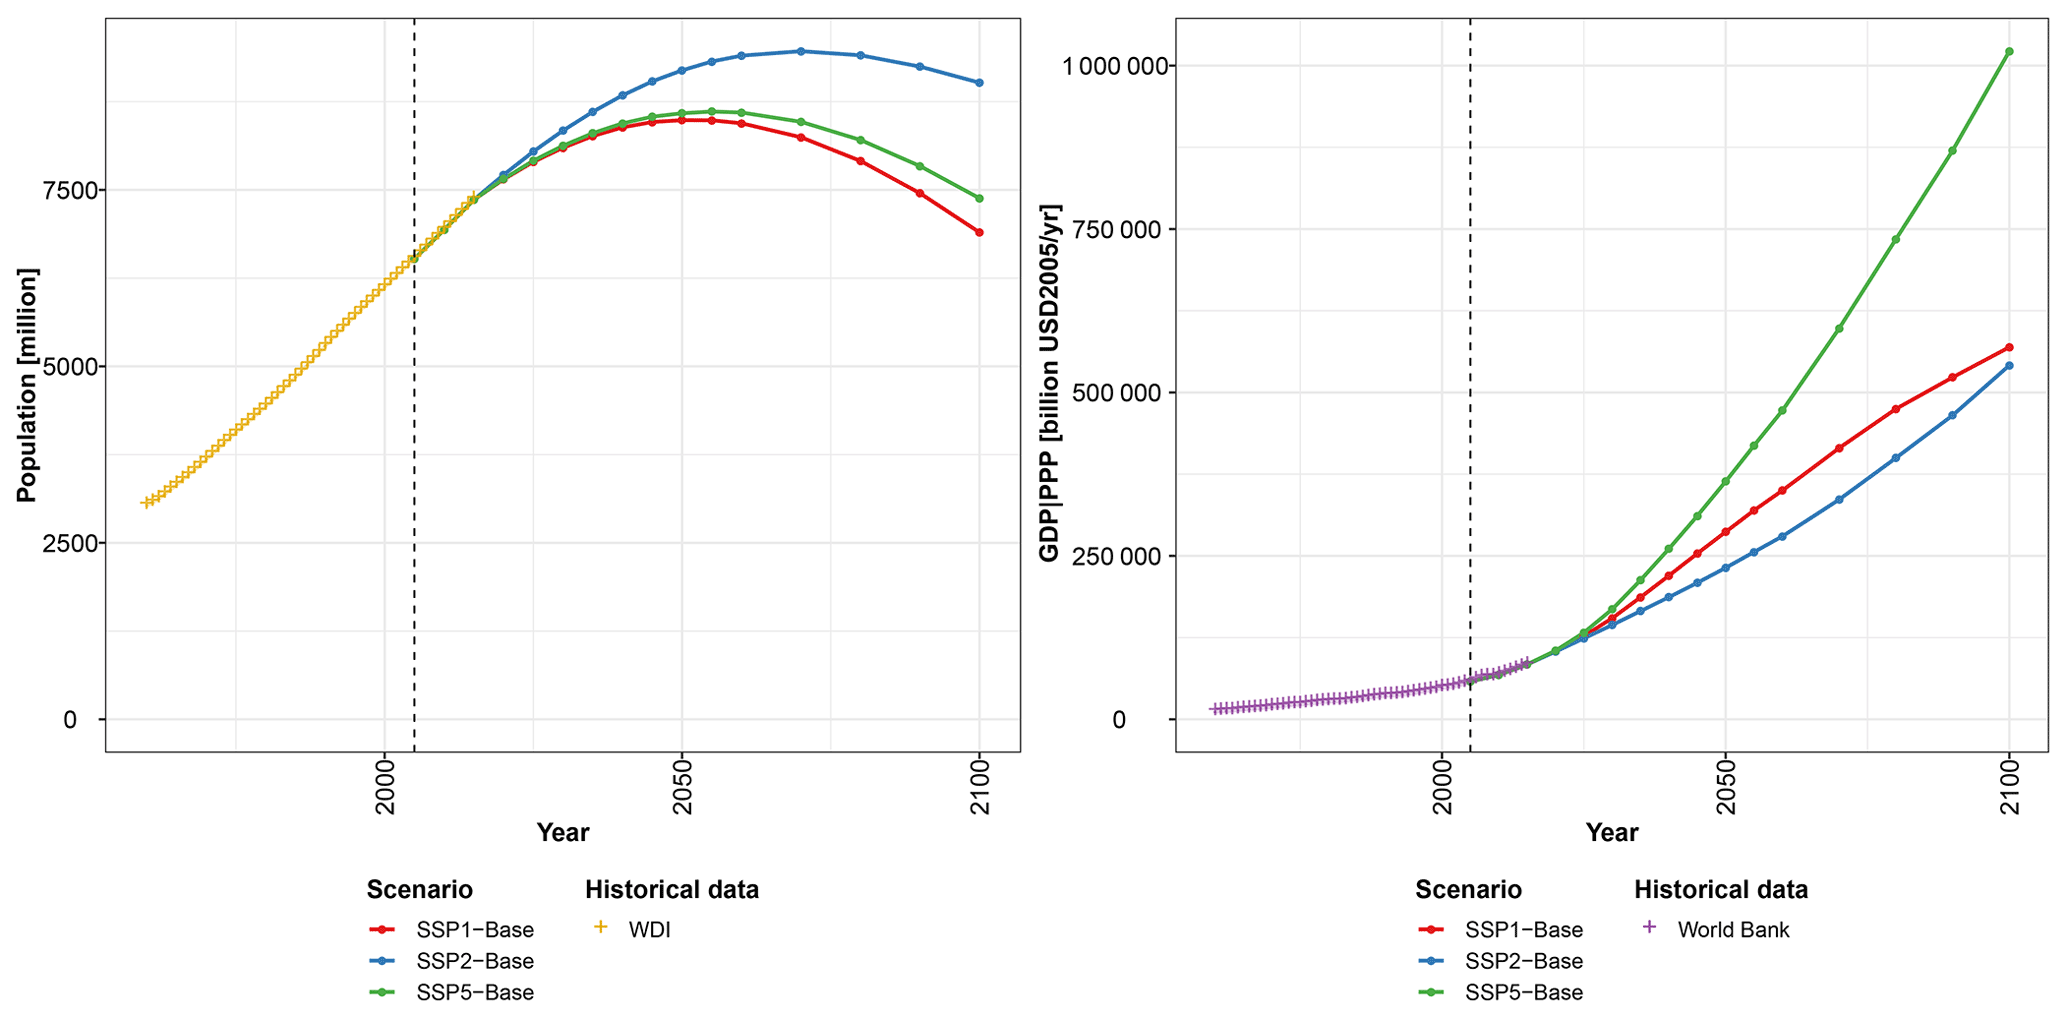
Figure 2Global population and GDP trajectories for 2005 to 2100 for SSP1, SSP2, and SSP5, compared to historical data from the World Development Indicator (WDI) and World Bank (2012).
Based on these input parameters, REMIND calculates investments into different technological capacities and capital, price-induced adjustments of final energy use, the resulting primary and secondary energy trajectories, emissions of all greenhouse gases, and imports and exports of traded goods until 2100. This enables the analysis of technology options and policy proposals for climate change mitigation.
The REMIND code is structured in a modular way, with code belonging either to the model core or to one of REMIND's modules. A module gathers all code relevant for a certain topic and interacts with other modules or the core through a clearly defined set of input and output variables only (interface). The name of each module starts with a two-digit number. Each parameter and variable of the REMIND code follows a naming convention: a prefix indicates the type of object (e.g. “v” for variables and “p” for parameters) and whether it is only used inside one module (i.e. using the module number) or as an interface with at least one other module or the core (i.e. using “m”). For example, the variable “vm_taxrev” is an interface between the “21_tax” module and the core, whereas the variable “v21_taxrevGHG” is only used inside the “21_tax” module. Appendix C gives an overview of all modules used in REMIND. Each module can be represented by different realizations. This structure allows for both complex and simplified realizations of each module as long as all interfaces (i.e. incoming and outgoing information) between the modules and the core are addressed in a consistent way. Different module realization configurations can be selected depending on the research questions to be analysed. For example, if the focus is on the fossil fuel sector, a realization with a detailed representation of this sector would be chosen. In most other applications, another realization designed as an emulator of the complex version with less computational demand may be used (for more information about the modular structure, see Appendix A in Dietrich et al., 2019).
REMIND is run by executing scripts written in R, which take the file “main.gms”, load configuration information, and build the model, by concatenating all necessary files from the core and modules folders into a single file called “full.gms”. This paper focuses on realizations that are active in default scenarios. More detail about all modules and their interlinkages can be found in the model documentation (https://rse.pik-potsdam.de/doc/remind/2.1.3/, last access: 1 December 2020) (Luderer et al., 2020b).
2.1 Spatial and temporal discretization and input data management
REMIND is an inter-temporal optimization model, deriving an equilibrium solution of the world economy under the assumption of perfect foresight. The spacing of time steps is flexible. In the default case, there are 5-year time steps until 2060, 10-year time steps until 2110, and 20-year time steps after that. The analysis of scenarios is typically focused on the time span from 2005 to 2100, but the model runs until 2150 to avoid distortions due to end effects.
Moreover, the spatial resolution of REMIND is flexible. It depends on the resolution of the input data, which is computed separately from the GAMS code. Using the “mrremind” (Baumstark et al., 2020), “mrcommons” (Bodirsky et al., 2020), and “madrat” (Dietrich et al., 2017) R packages, it is possible to generate the input data for any spatial aggregation of ISO-country-specific data.
By default, REMIND calculates results for the 12 following world regions: CAZ – Canada, Australia, and New Zealand; CHA – mainly China; EUR – the European Union and the UK; IND – India; JPN – Japan; LAM – Latin America; MEA – the Middle East and Africa; NEU – non-EU Europe; OAS – other Asia; REF – reforming economies; SSA – sub-Saharan Africa; and USA – United States of America. A detailed mapping of REMIND regions to countries is provided in Appendix B. Countries from the same territorial area and/or similar development level and/or similar climate policies are merged into the same world region. Some countries that are of specific interest regarding climate change mitigation (e.g. USA, China, and India) are represented individually.
For research projects focusing on specific areas or regions (e.g. Europe and Australia), REMIND can be run with a higher spatial resolution (i.e. more than the 12 global default regions). By parallelizing the calculation of the individual regions in decentralized optimization mode (see Sect. 2.2), the computation time increases only moderately with increasing spatial detail.
In practice, there are some limitations to the spatial resolution. First, it is not guaranteed that the model will find an optimal solution for a new region. Second, for each new spatial resolution, the plausibility of the results needs to be checked (especially for very small countries), as some country-specific peculiarities might not be fully captured by the general model structure.
2.2 Solution algorithm
REMIND, as a composition of different modules and components, is mathematically coded as a non-linear programming model (i.e. a model with a single objective function and a large number of side constraints). As such, it is computed by the solver CONOPT, which seeks a local optimal solution. At the same time, REMIND is formulated as an inter-temporal optimization problem. Time represents a separate dimension within all equations – alongside the also ubiquitous spatial dimension and further equation-specific dimensions relating to factors such as technologies and emission species – increasing the overall dimensionality of the model. The solution algorithm in the “80_optimization” module optimizes over all time periods simultaneously, thereby treating time in the same manner as other dimensions. Individual solutions are not guaranteed to be the global optimum, but the stability of the solution is examined by running the model with different initial values. Over the course of thousands of experiments, unique solutions are nearly exclusively observed.
While basic features of the solution algorithm underlying CONOPT (inner optimization) are proprietary and opaque, there is a second, more transparent layer to the solution structure (outer optimization). This is related to two algorithms (Nash and Negishi mode) implemented in-house in order to generate meaningful solutions from an economic point of view. As part of the overall optimization problem, REMIND searches for a distinguished equilibrium related to the trade interaction between countries and regions.
REMIND follows an equilibrium concept that is based on general equilibrium theory and the Walras law (Arrow and Debreu, 1954; Debreu, 1970; Ewing et al., 2006). In Nash mode (“nash” realization of the “80_optimization” module), REMIND searches for an equilibrium solution that is characterized by a set of prices for tradable goods which clear all markets. Each region forms its own optimization problem and trades with other regions in goods and energy resource markets, but market-clearing conditions are not part of the inner optimization itself. Instead, regions are subject to an inter-temporal budget constraint. Regional actors start from an initial price vector and choose their trade patterns, acting as price takers. The regional solutions are subsequently collected, and the price for the next iteration is adjusted based on the surplus and deficits on the markets. Such Walrasian-type price adjustment algorithms are commonly used, and convergence is conceptually proven under generous conditions. The implemented specification of the price adjustment algorithm (see details in Leimbach et al., 2017) makes use of parameters that play the role of price elasticities and help the model to converge. In order to guarantee convergence, two auxiliary mechanisms are applied: (i) anticipation of price changes, and (ii) penalty costs depending on the change in regional trade patterns over iterations.
Arrow and Debreu (1954) introduced two welfare theorems with the general equilibrium theory. The so-called “Second Welfare Theorem”, in particular, states that the market equilibrium can be determined from a Pareto optimum solution. This finding provides the conceptual basis for the Negishi approach, and the market equilibrium is determined from the social planner's solution. Manne and Rutherford (1994) first applied the Negishi approach in an inter-temporal setting using a joint maximization algorithm (which is similar to the present algorithm).
In REMIND in Negishi mode (“negishi” realization of the “80_optimization” module), all regions collectively form a single inner optimization problem where the weighted sum of regional welfare is maximized. Regions trade in goods and resource markets, and market-clearing conditions are part of the inner optimization. Yet, within the outer optimization (Negishi iterations), regions are evaluated separately and the welfare weights are adjusted according to their inter-temporal trade balance. This adjustment between Negishi iterations continues until a Pareto optimal solution without transfers is found. A solution is Pareto optimal if there is no other allocation of income and resources that would increase the welfare of one region without decreasing the welfare of another. Lending and borrowing across regions is allowed, but inter-temporal trade balances need to be equalized.
While both the Nash and the Negishi algorithm help to find an equilibrium solution, the solutions generally differ. Benefits of a Nash solution are a massive reduction in runtime (due to the possibility of parallel computing, both the baseline and policy scenarios converge within 1 to a few hours, mostly depending on the specified module detail.), and more flexibility in treating interregional externalities. Learning-by-doing technologies are included by default and cause an interregional spillover that is directly internalized by the planner solution (Negishi mode) only. In Nash mode, a subsidy on the investment cost of learning technologies can be used to internalize this spillover externality (“globallyOptimal” realization of the “22_subsidiseLearning” module) (Schultes et al., 2018). Without internalizing the learning-by-doing spillover due to the global technology learning curves, Nash and Negishi solutions differ.
2.3 Calibration of the production function
REMIND uses a nested production function with constant elasticity of substitution (CES) to determine a region's gross domestic product (GDP). The “29_CES_parameters” module covers two options: the calibration of parameters of the production function (“calibrate” realization) and the loading of former parameters for this function (“load” realization). Inputs at the upper layer of the production function include labour, capital, and energy services. Labour is represented by the population at working age. Energy services at the upper level are the output from a CES tree combining sectoral energy inputs from transportation, the building sector, and industry. In turn, the demand for specific energy carriers at the sectoral level is also depicted through individual CES nests. Each production factor in the various macroeconomic CES functions has an efficiency parameter. The aim of the CES calibration (“calibrate” realization of the “29_CES_parameters” module) is to provide the efficiency parameters of the CES tree for each time step and each region. The changes in efficiency parameters over time are tuned such that the baseline scenario meets exogenous economic growth pathways (Dellink et al., 2017) and final or useful energy pathways (see Sect. 2.4.2) in line with the SSPs (O'Neill et al., 2013).
The calibration has to fulfil two constraints: an economic and a technological constraint. The technological constraint requires the inputs of the CES function to yield the desired output. At this stage, there is no economic consideration at all. During a REMIND run, however, the model will strive to find the most efficient solution in terms of costs. Therefore, the second constraint is an economic constraint. The derivatives of the CES function, i.e. the marginal increase in income from increasing the considered input by one unit, must equal the price of that input, i.e. the marginal cost.
The calibration operates in several iterations. In each iteration, the nested CES function is adapted such that the exogenous final energy pathways and the exogenous GDP and labour trajectories are matched. Each iteration only differs from the others with respect to the prices that are provided to the calibration, which are the feedback from the energy system. The efficiency parameters converge towards a stable set of values.
The economic constraint defines that the prices are equal to the derivatives. Following Euler's rule, the technological constraint determines that, for homogeneous functions of degree 1 (as is the case here), the output is equal to the sum of the derivatives times the quantity of inputs. Combining both constraints means that the output is equal to the sum of inputs valued at their price. Thus, the prices and quantities given exogenously, combined with the two constraints, are sufficient to determine all of the quantities of the CES tree up to the last level with labour and capital.
For many assumptions regarding variables which influence the macroeconomic dynamic of REMIND (e.g. SSP scenario), CES parameters already exist and can be loaded (“load” realization of the “29_CES_parameters” module).
2.4 Interfaces with other models
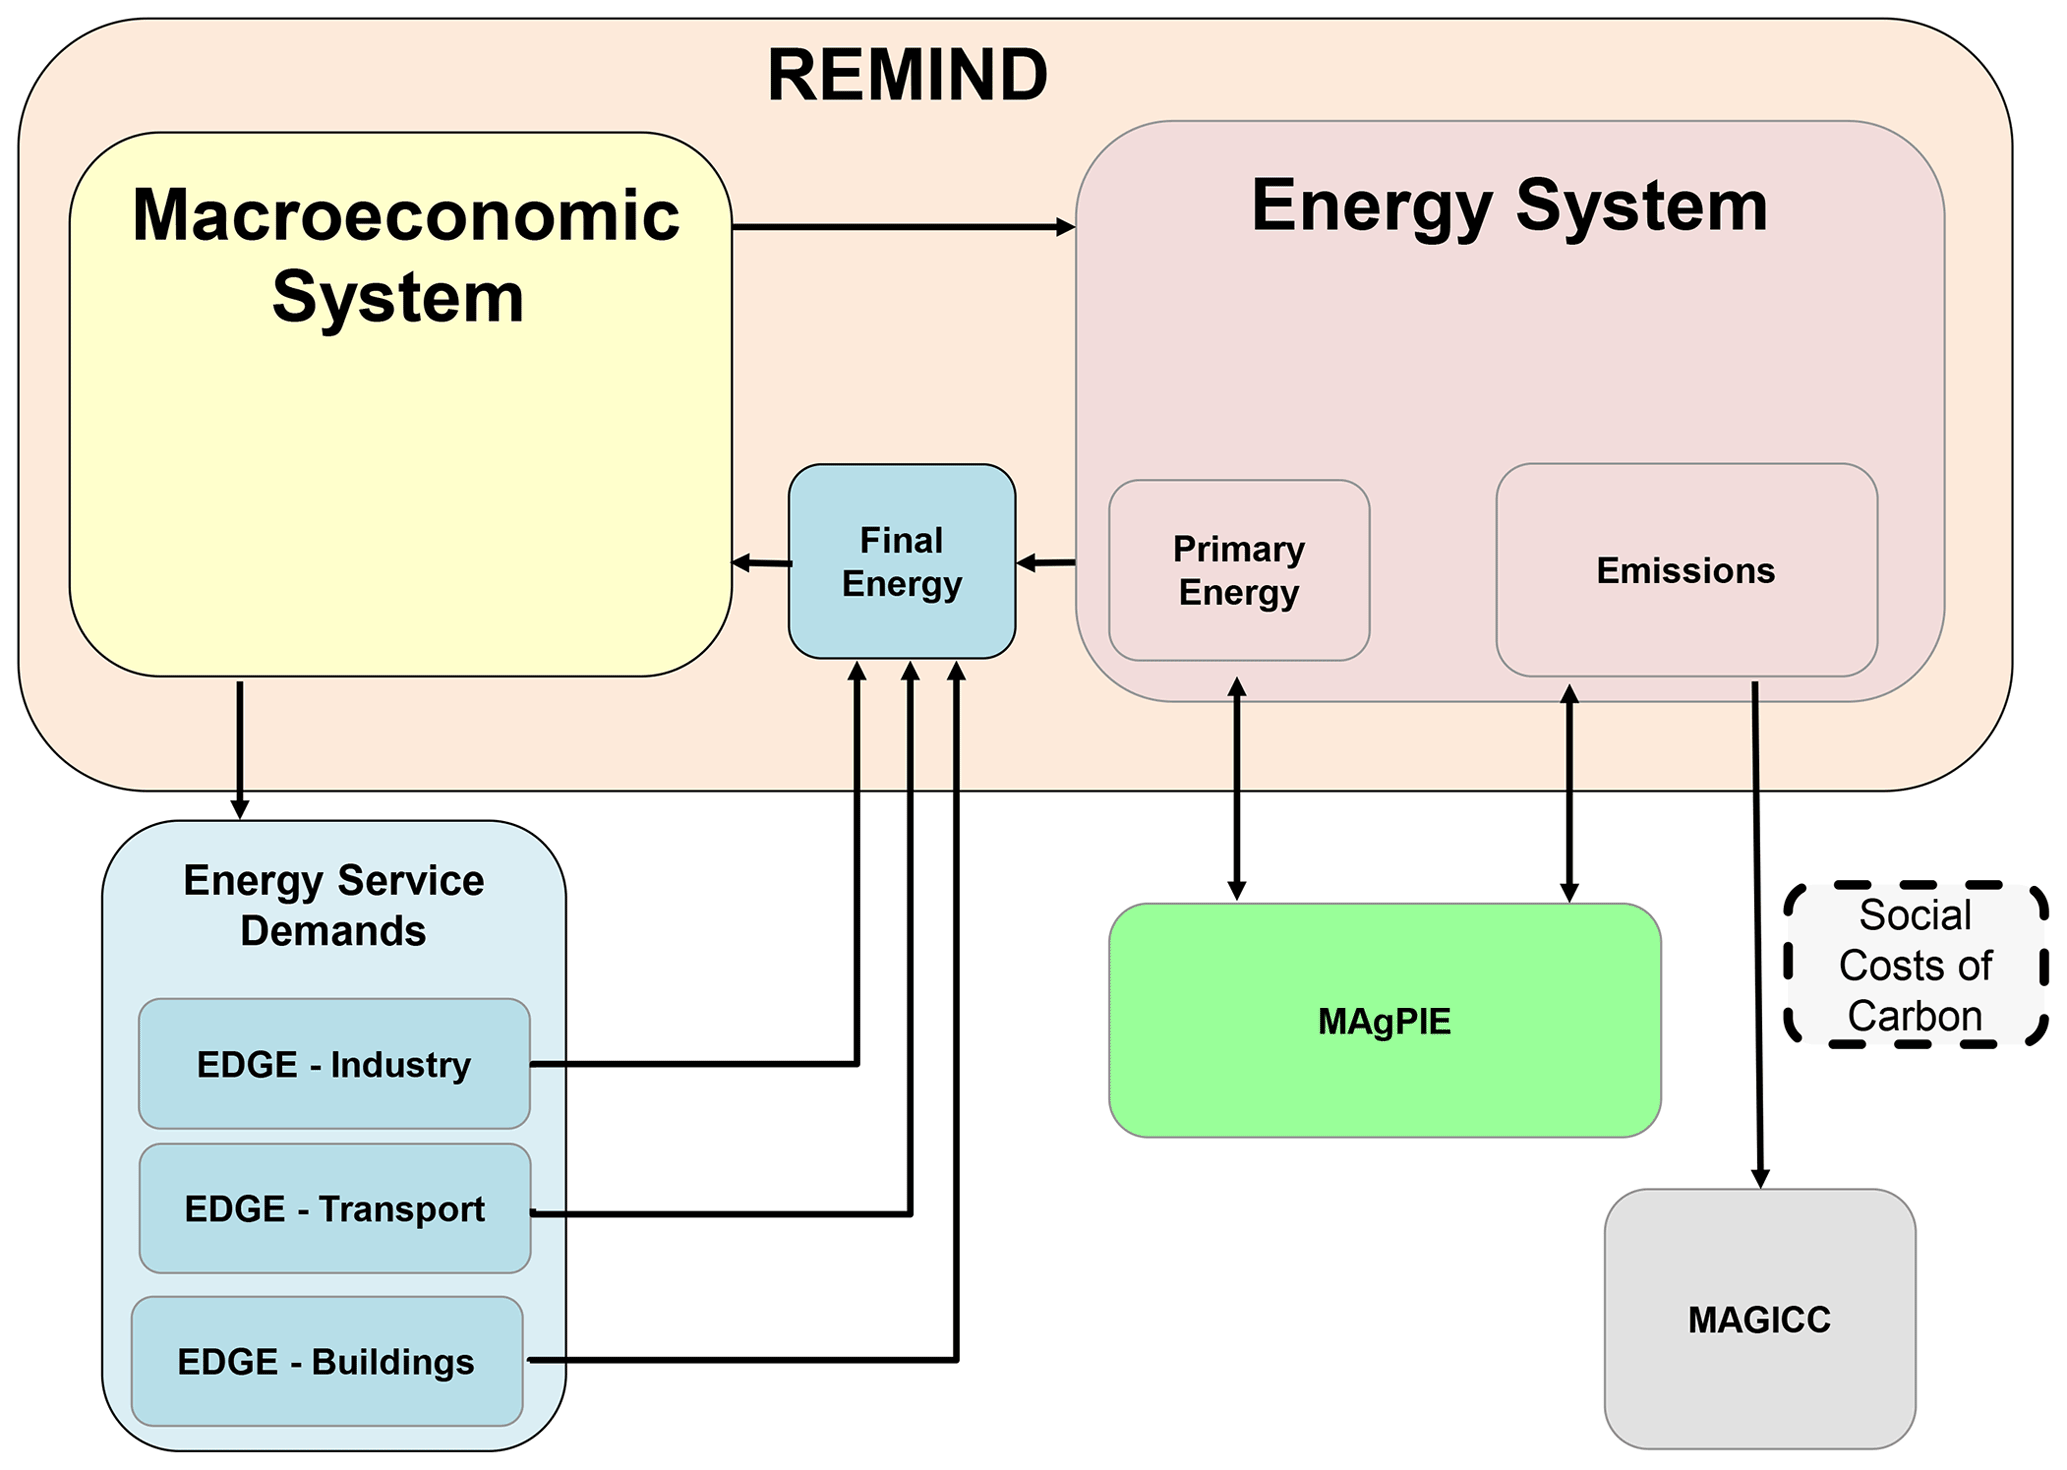
The REMIND model can be coupled to other models that have more detail in specific areas (see Fig. 3). The coupling interfaces are usually soft links and lead to a consistent solution by running the respective models after each other and updating some information iteratively. The “Energy Demand GEnerator” (EDGE) (Levesque et al., 2018) models inform REMIND about final energy demands while the “Model for the Assessment of Greenhouse Gas Induced Climate Change” (MAGICC) (Meinshausen et al., 2011) calculates radiative forcing and global mean temperature based on emissions from REMIND. The interface with MAgPIE (Lotze-Campen et al., 2008; Dietrich et al., 2019) enables the analysis of consistent land-use scenarios.
2.4.1 Land use (MAgPIE)
From a climate protection perspective, two aspects of the land-use sector are of particular interest: the supply of biomass that can be used for energy production (possibly with carbon capture and storage – CCS) and the total emissions of the land-use sector. By default, REMIND uses supply curves for purpose-grown biomass, and exogenous projections for land-use emissions and agricultural production costs as described in Sect. 3.2.5. These projections have been derived from the MAgPIE land-use model (Lotze-Campen et al., 2008; Dietrich et al., 2019) for a set of the most common climate targets (Representative Concentration Pathways – RCPs) and Socioeconomic Development Pathways (SSPs). Only for these scenarios are the assumptions regarding the land-use quantities in REMIND consistent with MAgPIE. However, changing crucial parameters in REMIND (such as the climate target or the availability of technologies or resources) can have significant impact on GHG prices and bioenergy demand, such that the assumptions regarding the land-use parameters mentioned above would no longer be consistent with the response of the land-use system. Thus, to cover these potential deviations from the standard scenarios, REMIND can be run in an iterative soft-coupled mode with MAgPIE (Klein, 2015; Bauer et al., 2020), where REMIND updates MAgPIE's assumptions regarding bioenergy demand and GHG prices, and MAgPIE, in turn, updates REMIND's assumptions regarding bioenergy prices and land-use emissions and agricultural production costs. The iteration is continued until changes between iterations become negligible. The resulting scenarios are consistent regarding the price and quantity of bioenergy and GHG emissions.
2.4.2 Deriving baseline energy demand pathways from sectoral EDGE models
Energy demand pathways depend on numerous drivers and constraints which vary across energy sectors (transportation, industry, and building), as well as across sub-sectors. The determinants of the demand for space heating and cooking differ to the same extent as the determinants for steel and chemical production. To limit the complexity of the model, REMIND does not represent all variables and parameters that would be relevant for the future development of energy demand. Instead, detailed sectoral EDGE models (EDGE-Buildings, EDGE-Transport, and EDGE-Industry) produce the final energy pathways. The baseline scenario of REMIND, which assumes no climate policy, is calibrated to meet these final energy pathways (see Sect. 2.3). In policy scenarios, the demand would then evolve in reaction to the effects of carbon prices and other price shifts.
The above-mentioned sectoral EDGE models are as follows:
- a.
EDGE-Transport
In addition to the default “complex” realization of the “35_transport” module (see Sect. 3.3.1), REMIND can run coupled to the EDGE-Transport transport model (Rottoli et al., 2021).
To represent transport sector demands, EDGE-Transport has been engineered, as a successor of the “Global Change Analysis Model” (GCAM) transport module (Mishra et al., 2013; Kyle and Kim, 2011), to interface with REMIND. The detail required to model fine-grained sector-specific dynamics would add too much of a burden to the REMIND optimization routine.
The coupling with EDGE-Transport significantly increases the level of detail in the technological and modal choice. It also adds further criteria to the decision-making process. Actual consumer decisions are governed by both tangible costs and other decision drivers. The mobility consumer in EDGE-Transport is susceptible to time invested in travelling (Schafer and Victor, 2000), range anxiety (Bonges and Lusk, 2016), inertia of the infrastructure system (Waisman et al., 2013), consumer lifestyles (Le Gallic et al., 2017), and the availability of modes.
The consistency between REMIND and EDGE-Transport is achieved via two distinct steps. First, the baseline demand for transport energy services in REMIND's production function is calibrated to the baseline projections from EDGE-Transport for all regions and time steps. Second, REMIND and EDGE-Transport are solved iteratively to ensure consistency between the prices and quantities of energy services required by the transport system. In the iterative process, EDGE-Transport informs REMIND about the market shares gained by the different transportation technologies as well as about the per-unit costs and per-unit energy intensity of each node. On the basis of this information, REMIND determines the volume of energy services' demand for transport.
On the REMIND side of the coupling, transportation demands are represented as strongly aggregated categories: transport is divided into passenger and freight demand, which each include a short- to medium-distance and a long-distance option. The aggregated demands are accounted for in energy service units (ton kilometre for freight and passenger kilometre for passenger transport), as the benefit to households and firms results from the amount of travelling and transported goods. EDGE-Transport provides the initial configuration of demand for each production factor for the model calibration phase, where the set of efficiency parameters is calculated for the baseline economic and technological development scenario (see Sect. 2.3).
- b.
EDGE-Industry
Final energy demand for the industry sector is based on trajectories tuned to conform to experts' judgement of future developments in the sector in the absence of climate change mitigation policies. The original 11-region time series are disaggregated to the country level, adjusted to follow recent historic trends for a period until the middle of the century, and again aggregated to the desired regional resolution. REMIND is then calibrated to meet these trajectories in the baseline scenario (see Sect. 2.3).
- c.
EDGE-Buildings
The future of the building sector energy demand will depend on manifold factors including demographic and socio-economic trajectories, as well as climate, floor space demand, and building components. Because of the diversity of the relevant factors and the limited resources to include them all in the REMIND model, for computational reasons, building energy demand projections are split into a two-step process. First, the EDGE-Buildings model (Levesque et al., 2018, 2019) – a detailed bottom-up model for the building sector – is used to project energy demand in the absence of climate policy. The REMIND baseline scenario is calibrated (see Sect. 2.3) to this trajectory. EDGE-Buildings projections are disaggregated both by energy carrier and by energy service and can, therefore, be used to calibrate the different building sector module realizations (see Sect. 3.3.2). Second, in the climate policy scenario, building energy demand in REMIND reacts to carbon pricing by adjusting the energy demand level as well as the distribution among energy carriers, with a typically higher demand for electricity in climate scenarios. Therefore, the EDGE-Buildings model is only run before calibrating the REMIND model, not between REMIND run iterations as is the case for the EDGE-Transport model.
2.4.3 Climate (MAGICC)
REMIND calculates GHG emissions from different sectors such as energy production, transport, land-use change, and waste. To translate emissions into changes in atmospheric composition, radiative forcing, and temperature increase, REMIND can be coupled with the MAGICC 6 (Meinshausen et al., 2011) climate model (“magicc” realization of the “15_climate” module). Due to numerical complexity, the evaluation of climate change using MAGICC is performed after running REMIND. Iterative adjustment of emission constraints or carbon taxes allows for specific temperature or radiative forcing limits to be met in the case of temperature targets.
2.5 Exploring scenarios – most common climate policy scenarios
REMIND is able to explore a wide range of plausible developments in the energy-economic system using the concept of perfect foresight. The model provides an integrated view of possible futures of the global energy-economy system, exploring self-consistent transformation pathways. The focus of these scenarios is on climate change mitigation in the cross-sectoral context under consideration of technological and socio-economic changes. However, these self-consistent scenarios are not to be understood as forecasts but rather as projections that depend on a broad set of assumptions, including policies (Nakicenovic et al., 2000). Applying perfect foresight is a powerful methodological approach to derive first-best, benchmark scenarios for reaching climate targets. These benchmark scenarios enable the analysis and comparison of different policy scenarios and serve as the basis of policy advice. Real-world investment decisions – by energy corporations, for instance – are guided by expectation formation, which is typically based on inter-temporally optimizing planning tools.
An alternative to the perfect foresight assumption is that of adaptive expectation formation. This approach hypothesizes that economic agents always assume that prices remain constant and base their investment decisions on this simple extrapolation. As prices change earlier, it turns out that some investments went in the wrong direction (e.g. wrong technology) and adjustments are made in the next period. It is well known that the adaptive expectation assumption leads to cyclical investment behaviour, huge swings in prices, and unstable technology deployment patterns. On the contrary, the perfect foresight assumption implies a rational expectation equilibrium that leads to stable long-term development.
The perfect foresight assumption of REMIND holds for various parts, not only inter-temporally but also across regions and sectors (i.e. emission reductions happen first where they are cheapest). However, at least as important as the provision of perfect benchmark scenarios is the ability of REMIND to limit foresight and generate scenarios featuring imperfections. In this case, REMIND operates in a mode of false expectations (e.g. regarding the stringency of climate policies) to analyse pathways that are inter-temporally suboptimal. In a number of REMIND studies, such settings have been applied, such as in the context of delayed action scenarios (Jakob et al., 2012) or limited technological availability (Luderer et al., 2013). Moreover, the effects, if international spillovers are not fully internalized in technology support policies, are implemented and discussed in Schultes et al. (2018). Similarly, recent developments in REMIND account for the short-sightedness of certain agents, such as the owner–renter relationship in the building sector (Levesque et al., 2021) or consumer choice in transportation (Rottoli et al., 2021). These policy scenarios do not have complete perfect foresight, only some element of foresight under scenario constraints.
With different bundles of such scenarios, the model can address various research questions. For each scenario, the model calculates the cost-optimal investments in economy and energy sectors by maximizing global welfare subject to equilibrium constraints. By default, negative impacts of climate change are ignored (see Sect. 3.1.3 for options for representing damages), but the representation of the full basket of GHGs allows for the calculation of the temperature outcome of each scenario.
Baseline scenarios without any explicit representation of climate policies serve as benchmarks (for the comparison with scenarios with climate policies), and they are used for the final energy calibration. In addition, regularly computed climate policy scenarios include scenarios following current country plans (nationally determined contributions – NDCs), national policies implemented (NPi), and stylized policy scenarios with different ad hoc assumptions regarding policy stringency and burden-sharing, which are each described in more detail below.
A scenario that follows the NDCs as submitted to the United Nations Framework Convention on Climate Change (UNFCCC) between 2015 and 2017 is implemented by a stylized representation of technology policies and targets for a few major regions and countries, and emission constraints based on quantifiable country targets, achieved via iteratively adjusted regional carbon prices. Both the technology targets and the emissions targets are implemented in a separate module (“NDC2018” realizations of the “40_techpol” and “45_carbonprice” modules). Most targets are implemented for the year 2030, and a middle-of-the-road assumption is taken for the extrapolation of policy stringency beyond that year: sectoral targets are moderately strengthened, and carbon prices are assumed to moderately increase and gradually converge until 2100.
The current policy scenario (NPi) is identical to the NDC scenario until 2020 (via fixing of variables) but assumes that policies fail to achieve NDC targets in 2030. Instead, carbon prices are assumed to grow and converge more slowly, leading to emissions trajectories in line with bottom-up studies on the effect of currently implemented policies (den Elzen et al., 2019).
Stylized climate policy scenarios either assume an explicit carbon price trajectory or a bound on cumulative emissions, i.e. a budget on total CO2 emissions from 2011 to 2100 (in Gt CO2). The most commonly used budgets rely on the IPCC 1.5 ∘C report (chap. 2, Table 2.2 in Rogelj et al., 2018b). By introducing a carbon price (see Sect. 3.1.4 on the implementation of taxation) which is iteratively (after each Nash or Negishi iteration) adjusted until the carbon budget is met. The carbon price transitions to the level consistent with the long-term policy start after 2020. The carbon price adjustment can be instantaneous (jumping to the new value within one time step) or can occur with a period of gradual convergence implemented as regionally differentiated carbon prices (see e.g. Kriegler et al., 2018). In the latter scheme, developing countries initially face much lower prices but gradually converge to a globally uniform price level. As a default setting for REMIND 2.1, a carbon price differentiation according to GDP per capita (purchasing power parity, PPP) values in 2015 and a convergence of regional carbon prices until 2050 is used (see Fig. 4).
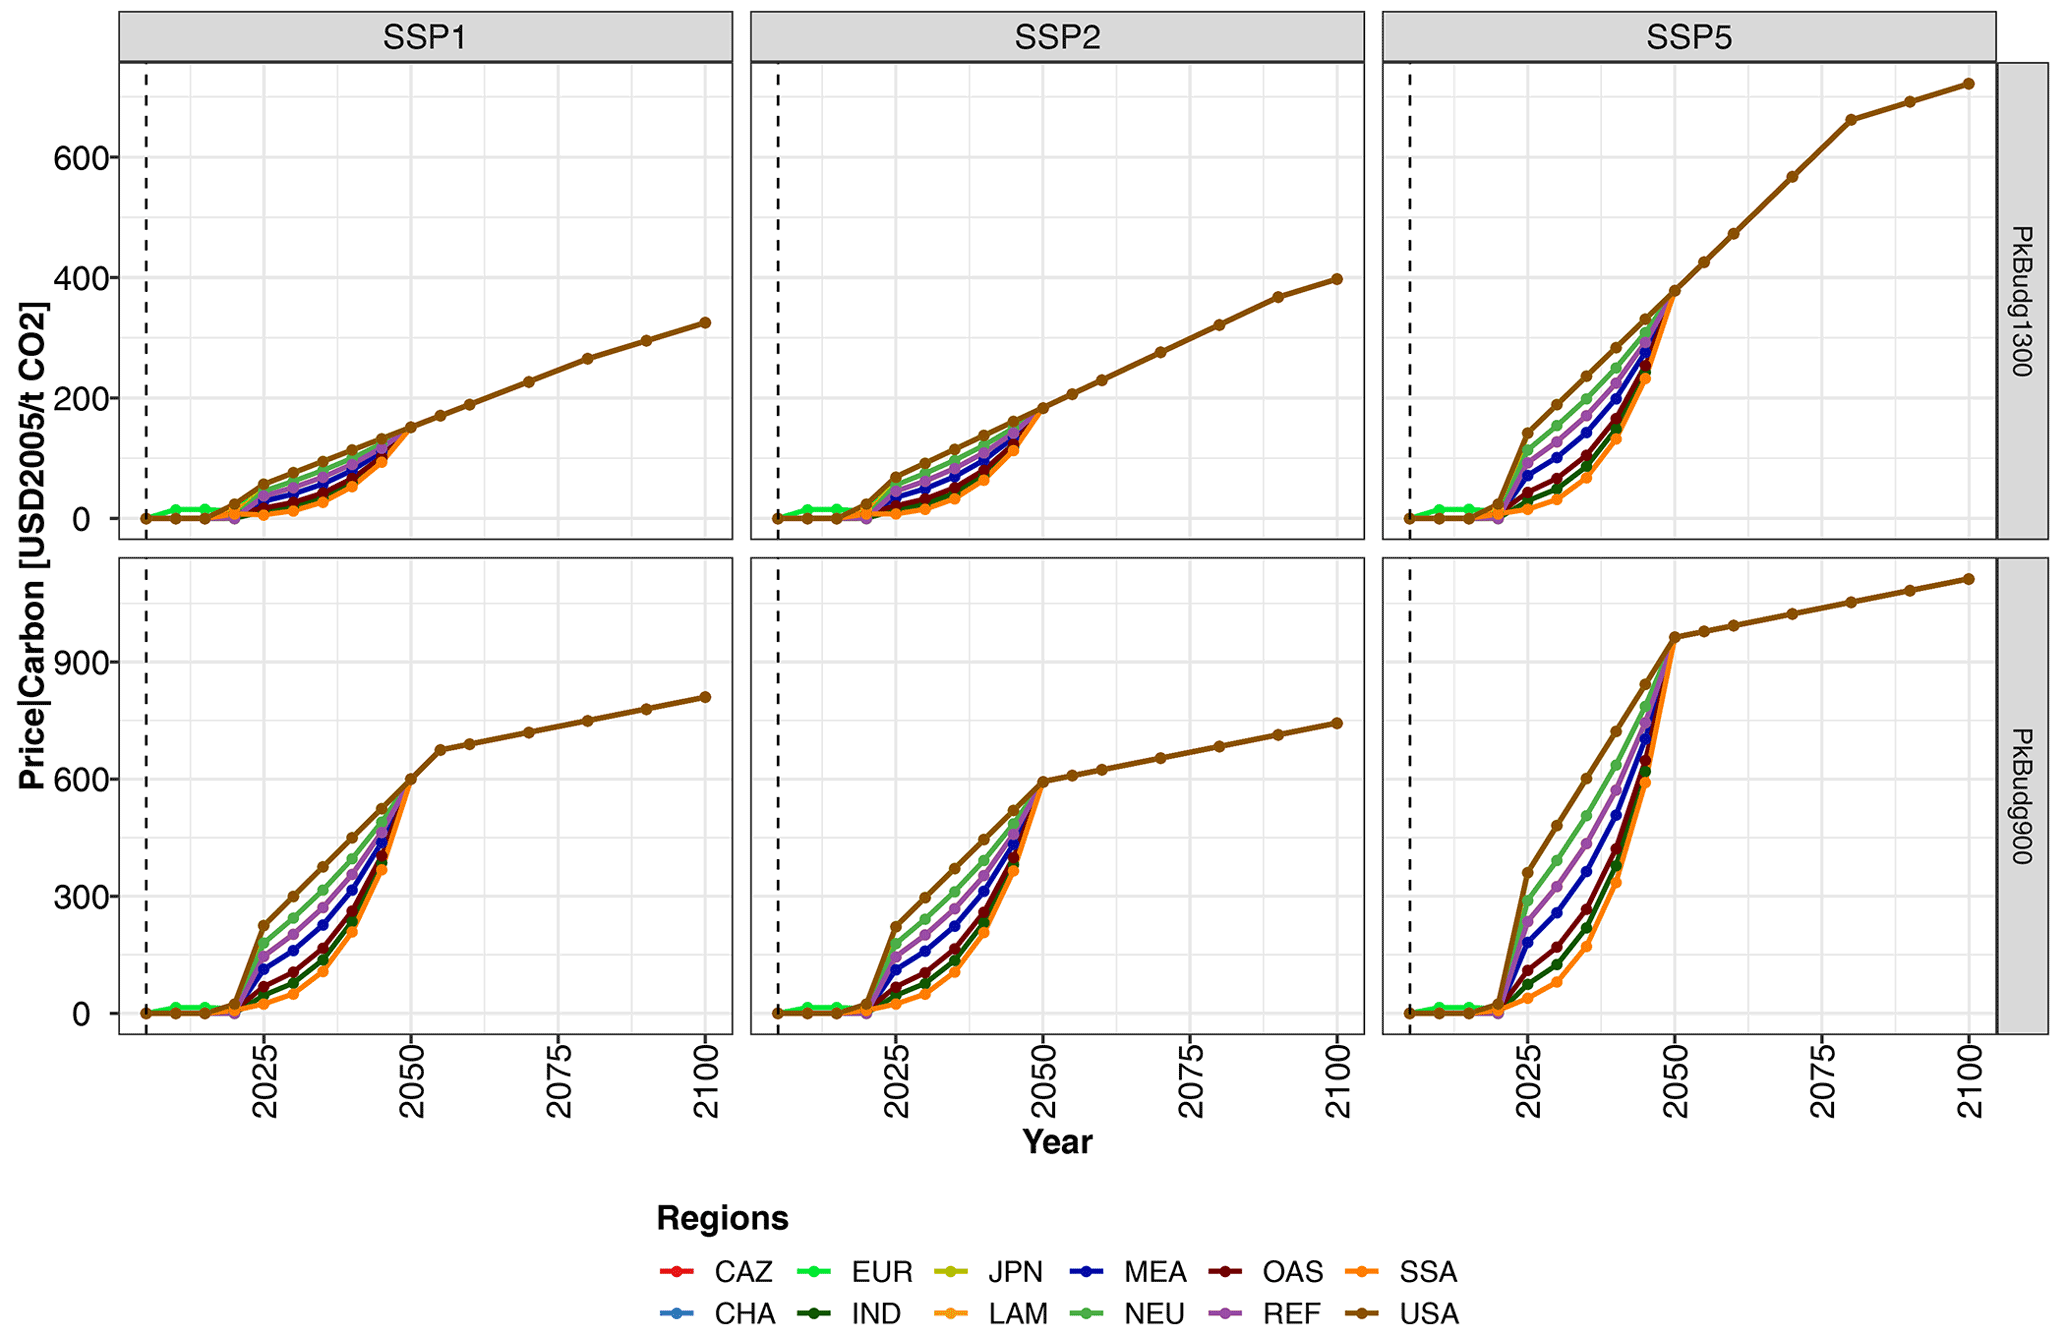
Figure 4Regional CO2 price trajectories for the NPi and PkBudg900 scenarios for SSP1, SSP2, and SSP5.
In 1.5 ∘C scenarios, peak warming is allowed to be at or slightly above 1.5 ∘C, at median climate sensitivity (MAGICC 6; Meinshausen et al., 2011), but returns to values below 1.5 ∘C in at least 67 % of scenarios by the end of the century (Rogelj et al., 2018a). With default SSP2 settings, this is implemented via a peak budget of 900 Gt CO2 from 2011 until the time of net-zero CO2 emissions, with slightly net-negative emissions thereafter so that end-of-century budgets are around 700–800 Gt. For well below 2 ∘C scenarios, the peak budget is typically set to 1300 Gt CO2. The peak budget approach (Rogelj et al., 2019) is represented in REMIND by a specific shape of the carbon price trajectory, with a steep linear increase in the front-runner regions (see above for the default regional carbon price differentiation and convergence) until the peak budget is reached and a further slow linear increase of carbon prices at USD 3 per year thereafter. The timing of the peak year as well as the required carbon price in this year are endogenously determined based on the peak-budget value. Thus, scenarios with a high overshoot of the carbon budget around mid-century and a large reliance on carbon dioxide removal (CDR) in the second half of the century, as are common when CO2 budgets are only specified for the year 2100, are avoided.
To account for uncertainty in input data (parametric uncertainty), REMIND is used in sensitivity analyses of techno-economic inputs (Bauer et al., 2018; Giannousakis et al., 2020b). REMIND is also used to run myopic scenarios (Luderer et al., 2013), as well as in a stochastic version (Giannousakis et al., 2020a) to account for uncertainty in the representation of the energy–economy–emissions system, and socioeconomic and regulatory uncertainty about the future.
In this section, the representation of different processes that are implemented in REMIND are described. Most of the different aspects of the model are separated into modules of REMIND and can be described by different realizations.
3.1 Macroeconomy
3.1.1 Drivers of economic growth
The macroeconomic core of REMIND features a multiregional general equilibrium growth model (Barro and Sala-i-Martin, 2004). This model is well suited to describe patterns of long-term economic growth (e.g. convergence between developing and industrialized countries), which are key drivers of energy demands and, thus, emissions. Physical capital is a major driver of economic growth, and related investments are endogenous in such models. In each period, the representative agent, endowed with perfect foresight, has to make the choice of using output for consumption or for investment, which is consumption tomorrow. Perfect foresight is a standard assumption in economic models and widely used IAMs (e.g. DICE/RICE, Nordhaus and Yang, 1996; MERGE, Manne et al., 1995; MESSAGE, Fricko et al., 2017; WITCH, Bosetti et al., 2007). While in the real world agents rarely have perfect foresight, using this concept is a useful approximation in a context of models with long planning horizons (see also discussion in Sect. 2.5). When using the perfect foresight assumption to formulate an inter-temporal optimization problem, the model is completed by components (technically – side constraints) that help to reproduce real-world dynamics caused by imperfectly foresighted decision-making (e.g. adjustment costs for the increase of the macroeconomic capital stock). In REMIND each region maximizes its welfare subjected to a budget constraint. The relevant equations are spread between the “02_welfare” and “01_macro” modules. The sole realization “singleSectorGr” of the “02_welfare” module implements an utilitarian social welfare function. Social welfare is equal to the discounted inter-temporal sum of utility, which itself is a non-linear function of per capita consumption. Air pollution generated by the energy system induces a welfare penalty. The time preference rate, a parameter describing what consumption in the future is valued at compared with consumption in the present, and the inter-temporal elasticity of substitution, a measure of the willingness to consume in the present instead of in the future, determine the trade-off between consumption today and in the future. While the discount rate equals the assumed time preference rate, the real rate of interest emerges endogenously according to the Keynes–Ramsey rule based on the two preference parameters and the optimal consumption growth rate.
3.1.2 Steady state and equilibrium
In economics, the long-term economic growth is called “steady state”, meaning the stability of the evolution problem (note that, in contrast to physical sciences, steady state in the context of macroeconomic growth theory means that key characteristics of the system, such as the savings rate, and income share of labour, remain constant, while the overall economy still grows). If an economic system is stable, a deviation from the steady-state growth path leads to transition processes that close the gap to the steady state (or balanced growth path) asymptotically. During this process the markets are in equilibrium (i.e. prices equal demand and supply) in each time step. This ensures that basic accounting requests are met (i.e. no loss of commodities at the global level). The REMIND model is supposed to analyse transitions to a balanced growth path in response to policies while market equilibrium is ensured at each time (step).
The general equilibrium concept on which REMIND is based is mathematically and numerically tractable and is the fundamental theoretical framework of a majority of economic models. It aggregates the independent decisions of various economic agents so that production and consumption are consistent, with a balance between supply and demand, which leads to an efficient allocation of goods and services in the economy. However, this concept also has some limitations. On the one hand, there are strong assumptions like the perfect information for all agents. On the other hand, uniqueness and robustness of the equilibrium cannot be demonstrated for a very general set of assumptions (Balasko, 2009). The ability of REMIND to model long-term growth dynamics and energy demands is hardly contained by limitations of the equilibrium concept. Application of this concept is contained to international trade interactions, while the dynamics of long-term growth is mainly driven by preferences, productivities, technological change, capital accumulation, population growth, and endowments (e.g. fossil resources).
3.1.3 Production and trade
The sole realization “utilitarian” of the “01_macro” module implements the macroeconomic production, capital stock, and GDP balance (or budget) equations. The production function represents a system of non-linear equations or, more specifically, a nested CES (constant elasticity of substitution) function with capital, labour, and final energy as inputs. Investments increase capital stocks which depreciate according to the depreciation rate, labour is given exogenously, and energy is produced at a cost. Generated economic output (GDP) is used for consumption, investments in the macroeconomic capital stock and energy system expenditures, as well as trade, non-energy-related greenhouse gas abatement costs, and agricultural costs delivered by the land-use model MAgPIE (see Sects. 2.4.1 and 3.2.5). Tax revenues are redistributed as a lump sum; thus, net taxes converge to zero in the optimal solution (equilibrium point).
REMIND considers the trade of coal, gas, oil, biomass, uranium, the composite good (aggregated output of the macroeconomic system), and emissions permits (in the case of climate policy based on an emissions trading system (ETS), which is not the default but has been used in some studies, most recently in Leimbach and Giannousakis, 2019). It assumes that renewable energy sources (other than biomass) and secondary energy carriers are non-tradable across regions.
REMIND models regional trade via a common pool (“24_trade” module). While each region is an open system – meaning that it can import more than it exports – the global system is closed. The combination of regional budget constraints and balanced international trade (enforced by market clearing prices see Sect. 2.2) ensures that the sum of regional consumption, investments, and energy-system expenditures cannot be greater than the global total output in each period. In line with the classical Heckscher–Ohlin and Ricardian models (Heckscher et al., 1991), trade between regions is induced by differences in factor endowments and technologies. REMIND also represents the additional possibility of inter-temporal trade. This can be interpreted as capital trade or borrowing and lending. Capital trade is linked to the export and import of goods and energy, and is accounted for in the inter-temporal trade balance. By directing the goods trade, the capital market implementation affects the consumption.
To reconcile modelled capital flows and currently observed patterns (Lucas paradox; Lucas, 1990), REMIND represents capital market imperfections (“23_capitalMarket” module). The default setting includes limitations on the growth of debts and surpluses that each region can accumulate within a 5-year period. As an alternative, a more comprehensive representation of capital market imperfections is implemented. This realization considers imperfections in capital markets that, in addition to limits on debt accumulation, take risk markups on capital flows into account, which make the lending of capital more costly for some regions. Moreover, regionally differentiated preference parameters (so-called savings wedges) cover institutional imperfections and help to further reconcile model results of short-term consumption and current accounts with observed data (Leimbach and Bauer, 2021).
3.1.4 Representation of taxes
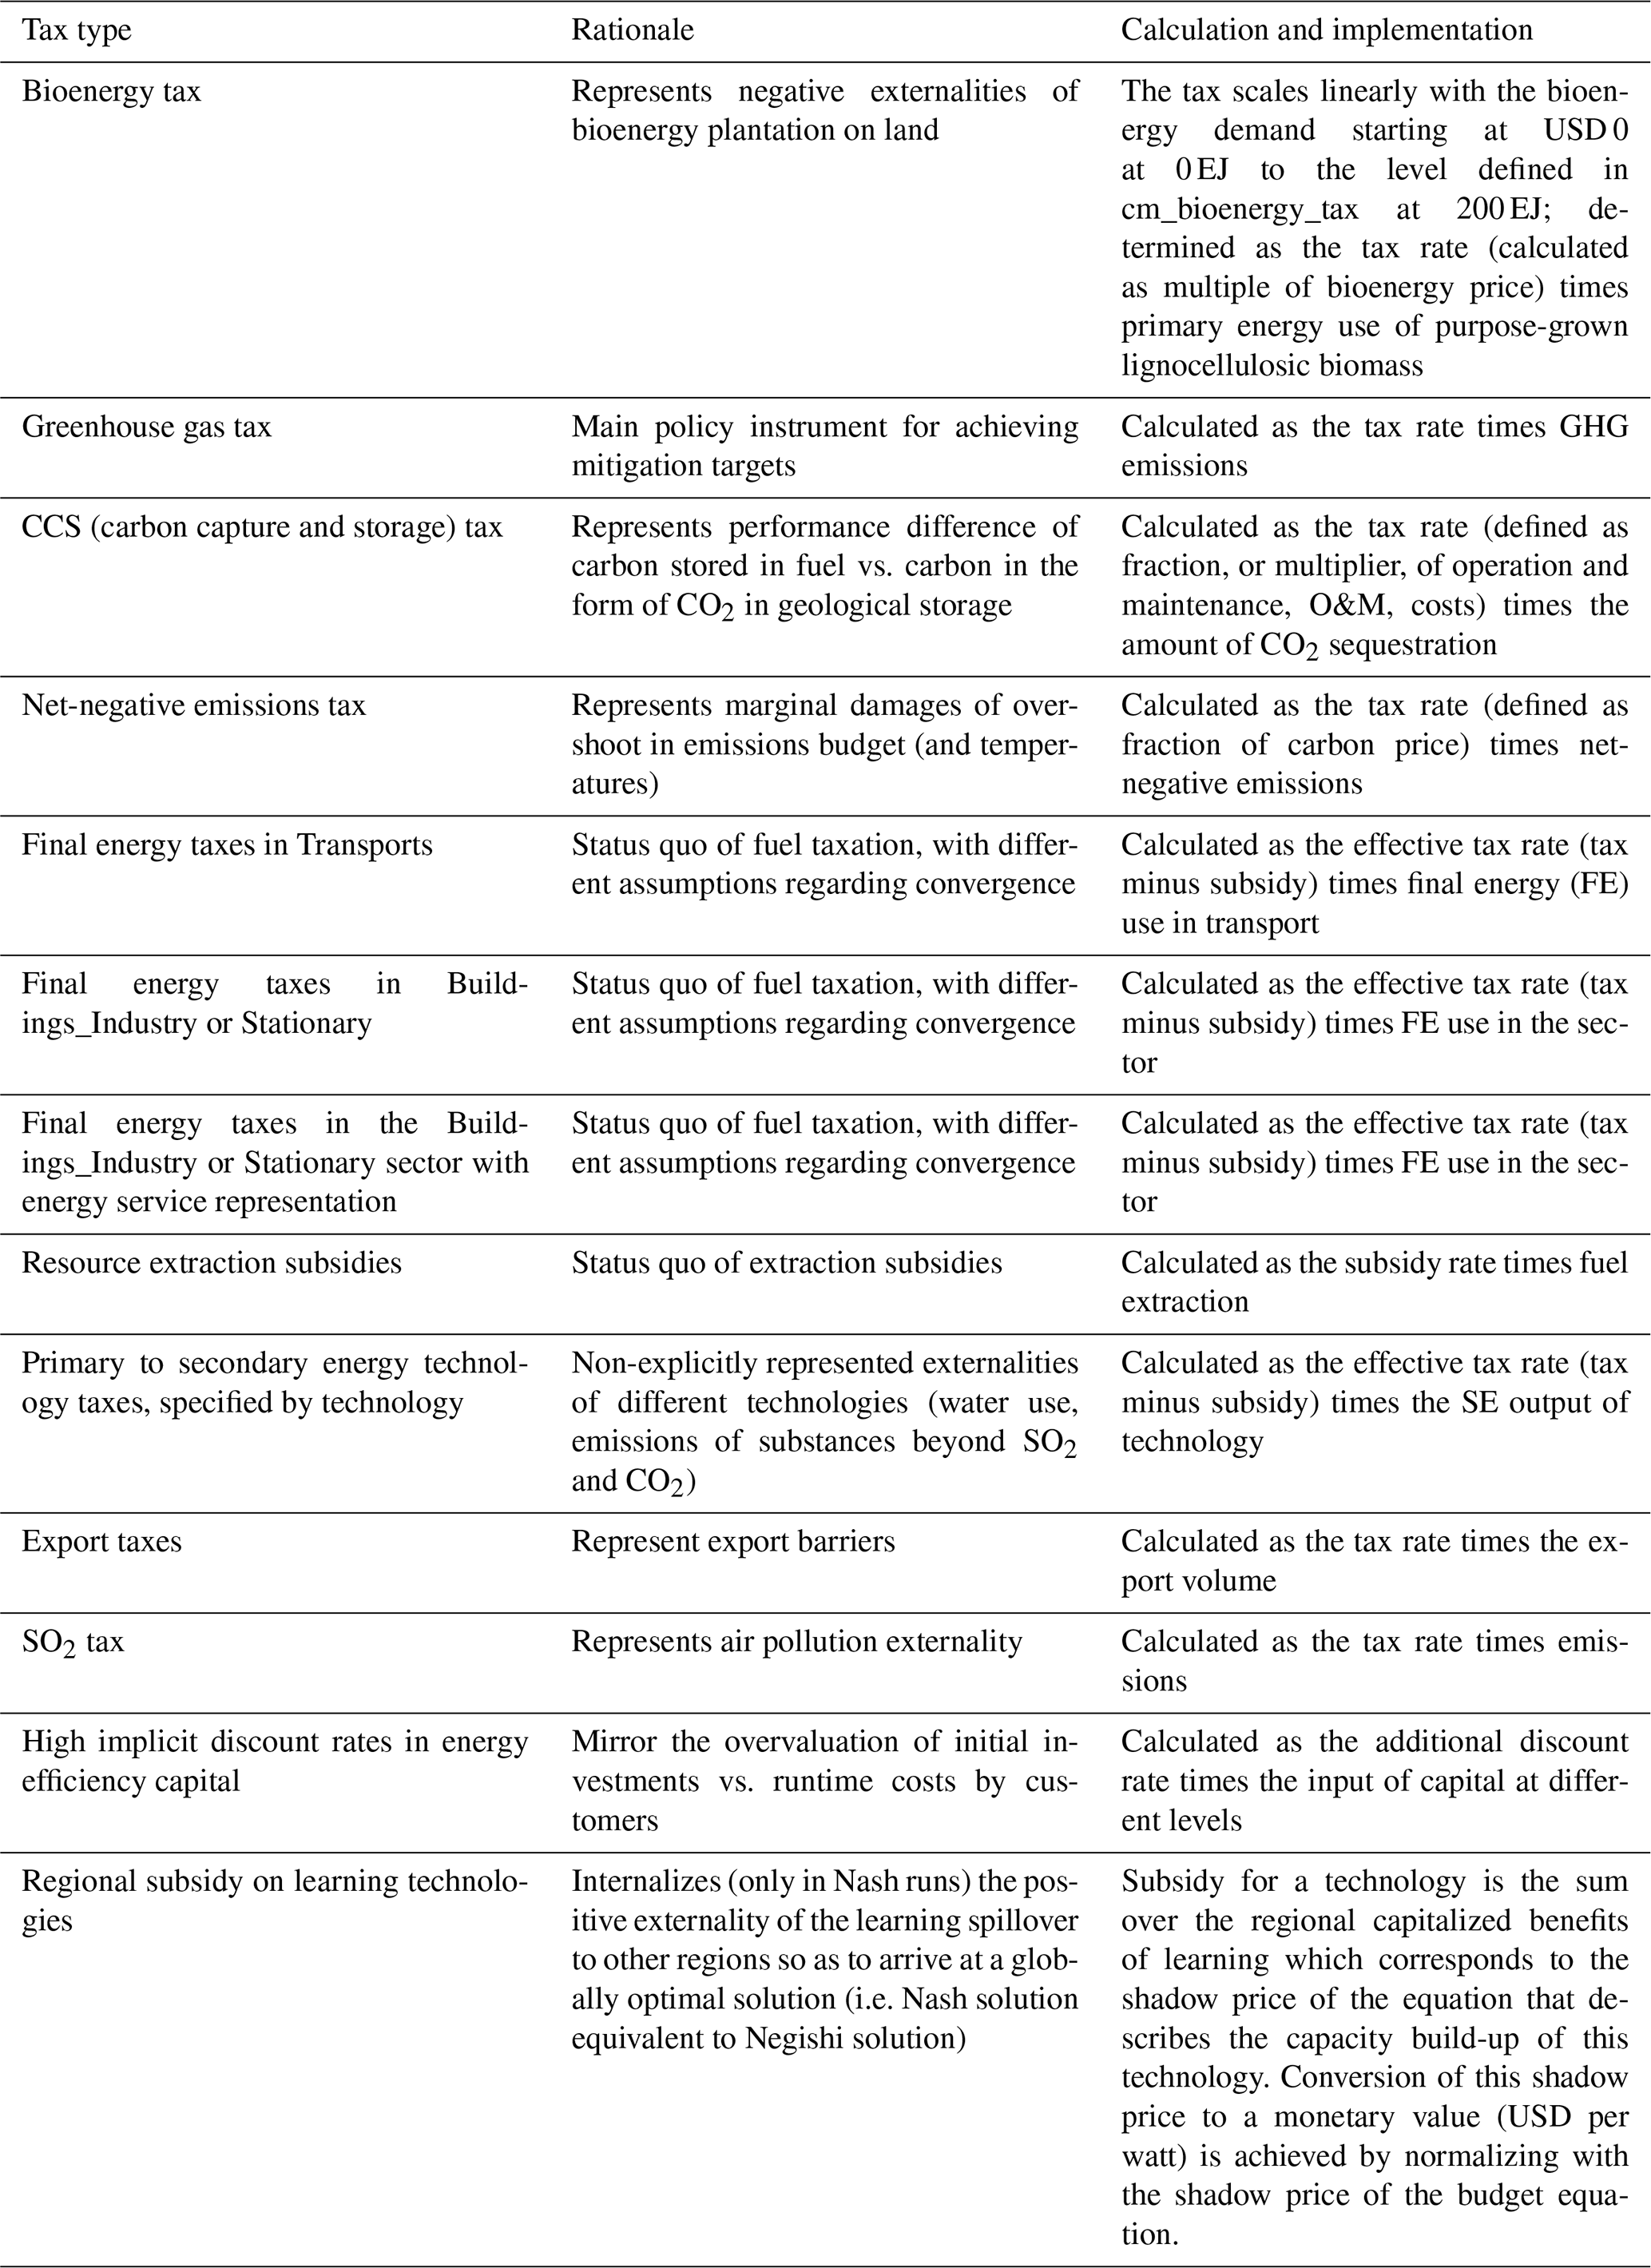
REMIND includes different types of taxes (see Table 1), representing existing energy taxes, emulating climate policies via carbon prices or additional externalities for some technologies and processes. The representation of taxes is implemented in the “21_tax” module. The overall tax revenue is the sum of various components, each of which is calculated using an analogous structure: the tax revenue is the difference between the product of an activity level (a variable) and a tax rate (a parameter), and the corresponding product from the last iteration (which is loaded as a parameter). After convergence of Negishi or Nash iterations, the value of the tax revenue approaches zero, as the activity levels between the current and last iteration do not change anymore. This means that taxes are revenue-neutral: the amount of potential tax is always recycled and remains available for the economy. Nevertheless, the marginal value of the variable (but not the parameter) of taxed activities reflects the tax rate which leads to the intended adjustment in the CONOPT solution.
Table 1Types of taxes within REMIND, the reason for their inclusion, and the approach to their implementation.
3.1.5 Representation of economic damages due to climate change
Research on the economic impacts of climate change is rapidly evolving, and there is currently no agreement on how exactly the effects of climate change affect the socioeconomic system. Traditional damage functions affect the level of output (e.g. in the DICE model; Nordhaus, 2017). Empirical studies are now providing new top-down impact estimates with some evidence of possible effects of climate on growth rates (Burke et al., 2015). Applications show that the resulting compounding effects lead to much larger social costs of carbon and, as a result, more stringent mitigation action (Glanemann et al., 2020; Moore and Diaz, 2015). Reflecting this ongoing and open debate, REMIND uses a flexible approach to account for different types of macroeconomic damages.
Damages are included through a soft-coupled approach explained in detail in Schultes et al. (2021). Emissions from REMIND are passed on to the simple climate model MAGICC (“magicc” realization of the “15_climate” module) which calculates global mean temperature changes. These are passed to the “50_damages” damage module where different damage functions can be chosen to calculate the impacts. The reduction in output is passed back to the “01_macro” macro module and is included in the budget function as an exogenous parameter. In order to internalize the damage, the social cost of carbon is calculated and included as a carbon price. Updating the social cost of carbon iteratively yields the same solution that a fully endogenous representation of climate and damages within REMIND would. The soft-coupled approach has two advantages: first, it allows more flexibility and complexity in the exogenous damage module; second, it allows one to easily combine damages with a climate target, reflecting that the available damage functions only include certain types of climate impacts (mostly productivity effects) and, in particular, omit tipping points and other potentially high-impact processes to be hedged against.
Currently, two different types of damages are implemented. The first are level effects, represented by four different specifications (“DiceLike” realization): the function as used in the most recent versions of the DICE model (DICE2013R, Nordhaus, 2014, and DICE2016, Nordhaus, 2017), and two specifications from the meta-analysis of Howard and Sterner (2017).
The second type of damages are growth rate damages (“BurkeLike” realization). One realization used the original empirical specifications by Burke et al. (2015). The resulting GDP reduction of a one-off temperature shock is infinitely persistent in this formulation. In addition, a specification introduced by Schultes et al. (2021) is included, where the GDP reduction has a finite persistence time only. This reflects the high uncertainty surrounding the empirical estimates and the possibility of future adaptation beyond historically observed degrees.
Regional temperatures are obtained through statistical downscaling based on Coupled Model Intercomparison Project - Phase 5 (CMIP5; Taylor et al., 2012, p. 5) results from the global mean temperature change pathway obtained from MAGICC. The temperature downscaling is based on the CMIP5 climate model ensemble and observed present-day temperatures calculated from the University of Delaware Air Temperature and Precipitation v4.01 data set (University of Delaware Air Temperature and Precipitation, 2020). Aggregation from gridded to regional temperatures uses constant 2010 population weights (Jones and O'Neill, 2016). Details are given in Schultes et al. (2021).
3.2 Energy resources and supply
3.2.1 General representation of energy conversion and technologies
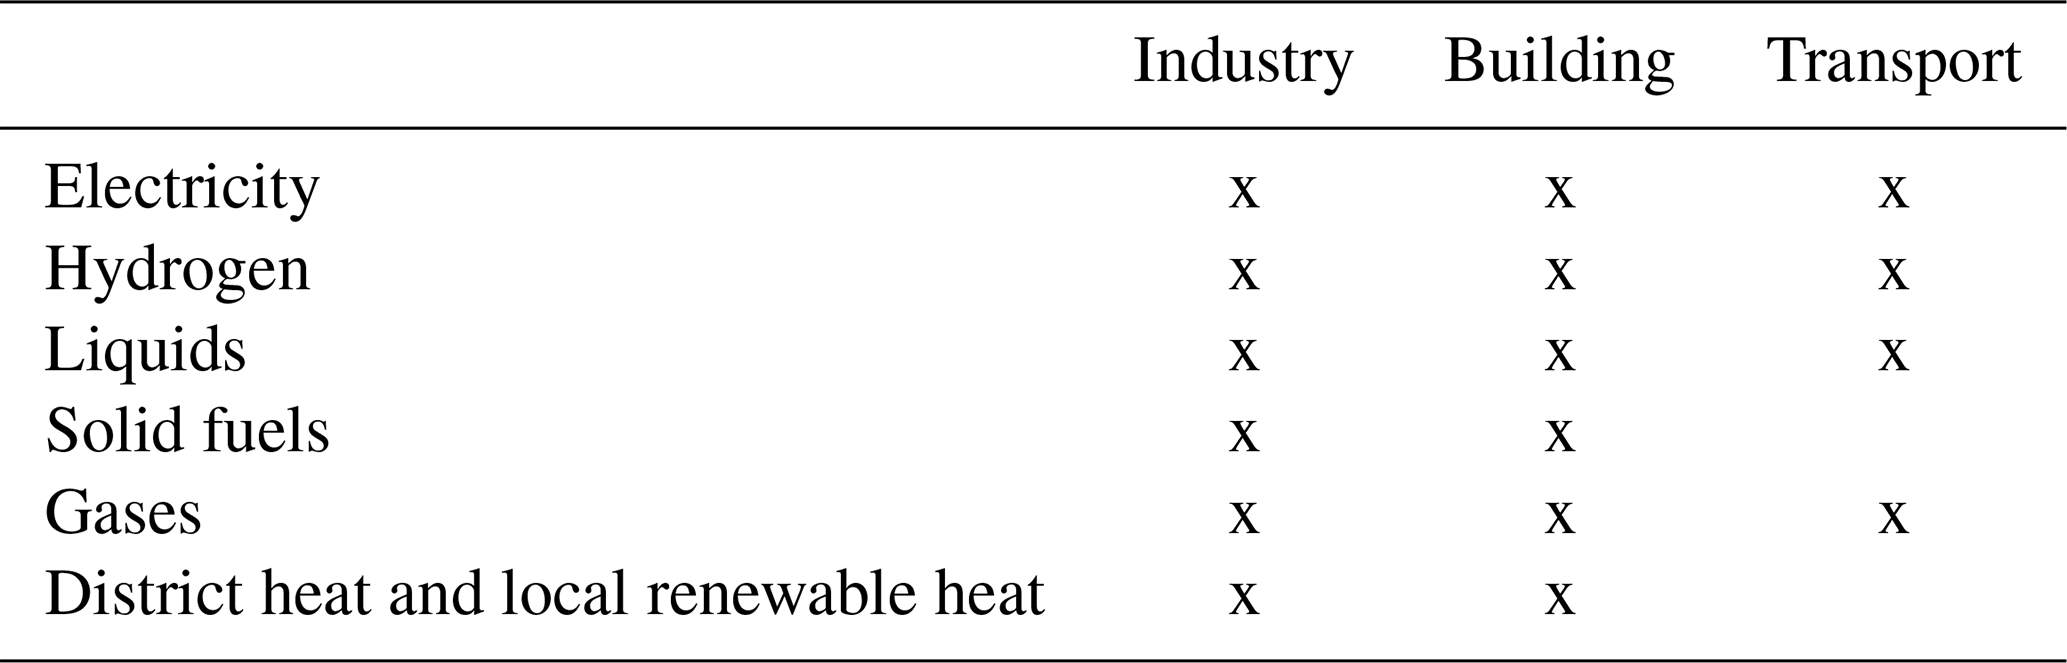
The core part of REMIND includes the representation of the energy system via the conversion of primary energy into secondary energy carriers via specific energy conversion technologies. Around 50 different energy conversion technologies are included in REMIND. In general, technologies providing a certain secondary energy type compete linearly against each other, i.e. technology choice follows cost optimization based on investment costs, fixed and variable operation and maintenance costs, fuel costs, emission costs, efficiencies, lifetimes, and learning rates. REMIND assumes full substitutability between different technologies producing one energy type. Table 2 shows the secondary energy carriers included in REMIND and the sectors they are used in.
Table 2Secondary energy carriers included in REMIND and the sectors they are used in.
A few technologies convert secondary energy into secondary energy, namely the conversion of electricity to hydrogen via electrolysis and the reconversion via hydrogen turbines, as well as the production of methanol and methane from hydrogen.
In REMIND technologies are represented as linear transformation processes that convert one or more inputs into one or more outputs. In- and outputs can be energy, materials, water, intermediate products or emissions, or labour inputs. The number of in- and outputs is not restricted, and technologies vary between in- and output characteristics. In the broader system context, technologies and their deployment interact via various budget constraints, which give rise to competition for resources as well as the potential to expand feasible production possibilities. A model solution provides a set of activities that is feasible with all constraints simultaneously.
REMIND specifies each technology through a number of characteristic parameters:
-
specific overnight investment costs that are constant for most technologies and decrease due to learning-by-doing for some relatively new technologies (see below);
-
cost markups due to financing costs over the construction time;
-
fixed yearly operating and maintenance costs in percent of investment costs;
-
variable operating costs (per unit of output, excluding fuel costs);
-
conversion efficiency from input to output;
-
capacity factor (maximum utilization time per year) – this parameter also reflects maintenance periods and other technological limitations that prevent the continuous operation of the technology;
-
average technical lifetime of the conversion technology in years;
-
and, if the technology experiences learning-by-doing, the initial learn rate, initial cumulative capacity, and floor costs that can only be approached asymptotically.
REMIND represents all technologies as capacity stocks with full vintage tracking. As there are no hard constraints on the rate of change in investments, the possibility of investing in different capital stocks provides high flexibility for technological evolution. However, the model includes cost markups for the fast upscaling of investments into individual technologies; therefore, a more realistic phasing in and out of technologies is achieved. The model allows for premature retirement of capacities before the end of their technological lifetime, and the lifetimes of capacities differ between various types of technologies. Capacities are phased out before they reach the end of their technical lifetime by the optimization if the value of their outputs is lower than the costs of variable inputs, reflecting a situation of asset stranding. This happens predominantly in “delayed” scenarios, which begin optimization at a future point in time. Furthermore, capacities of conversion technologies age realistically from an engineering point of view: depreciation rates are very low in the first half of the lifetime and increase strongly thereafter.
In the sole realization “iea2014” of the “04_PE_ FE_ parameters” module, regional conversion efficiencies for all technologies and by-production coefficients of combined heat and power (CHP) technologies are calculated from the input–output relations provided by International Energy Agency (IEA) energy statistics (IEA, 2016, 2021). In the sole realization “on” of the “05_initialCap” module, each region is then initialized with the vintage capital stock needed to produce the reported energy flows. The conversion efficiencies for new vintages converge across the regions from the 2005 values to a global constant value in 2050. Furthermore, for some fossil power plants, transformation efficiencies improve exogenously over time to represent technological advances.
3.2.2 Representation of exhaustible resources
REMIND characterizes the exhaustible resources coal, oil, gas, and uranium in terms of extraction cost curves (“31_fossil” module). Fossil resources (e.g. oil, coal, and gas) are further defined by decline rates and adjustment costs (Bauer et al., 2016b). Extraction costs increase as low-cost deposits become exhausted (Herfindahl, 1967; Rogner, 1997; Aguilera et al., 2009; Bauer et al., 2016a). In REMIND, region-specific extraction cost curves relate the production cost increase to cumulative extraction (Bauer et al., 2016a; Rogner et al., 2012, p. 7).
More details on the underlying data and method are presented in a separate paper (Bauer et al., 2016b). In the model, these fossil extraction cost input data are approximated by piecewise linear functions that are employed for fossil resource extraction curves. In the “timeDepGrades” realization, it is possible to make oil and gas extraction cost curves time-dependent. This means that resources and costs may increase or decrease over time depending on expected future conditions such as technological and geopolitical changes. This representation is demanding both numerically and with respect to runtime. Therefore, the default “grades2poly” realization of the “31_fossil” module emulates the supply generated by the time-dependent grades using polynomial functions. For uranium, extraction costs follow a third-order polynomial parameterization based on data of the Nuclear Energy Agency (NEA); see Bauer et al. (2012a) for details.
3.2.3 Representation of renewable resources
REMIND models resource potentials for non-biomass renewables (hydro, solar, wind, and geothermal) using region-specific potentials in its “core”. For each renewable energy type, potentials are classified by different grades, specified by capacity factors. Superior grades have higher capacity factors, which correspond to more full-load hours per year. This implies higher energy production for a given installed capacity. Therefore, the grade structure represents optimal deployment of renewable energy, first using the best sites before turning to sites with worse conditions.
The renewable energy potentials of REMIND may appear higher than the potentials used in other models (Luderer et al., 2014). However, these models typically limit potentials to specific locations that are currently competitive or close to becoming competitive. The grade structure of REMIND allows for the inclusion of sites that are less attractive but that may become competitive in the long-term as the costs of technologies and fuels change. This choice is dependent on the model. The regionally aggregated potentials for solar photovoltaics (PV) and concentrated solar power (CSP) used in REMIND were developed in Pietzcker et al. (2014b) in cooperation with the German Aerospace Center (DLR). To account for the competition between PV and CSP for the same sites with good irradiation, an additional constraint for the combined deployment of PV and CSP was introduced in REMIND (Pietzcker et al., 2014b) to ensure that the model cannot use the available area twice to install both PV and CSP.
The regionally aggregated wind potentials were developed based on a number of studies (Hoogwijk, 2004; Brückl, 2005; Hoogwijk and Graus, 2008; EEA, 2009; Eurek et al., 2017). The technical potentials for combined on- and offshore wind power amount to 800 EJ yr−1 (half of this amount is at sites with more than 1900 full-load hours). The total value is roughly half as large as the maximum extractable electric energy from wind over land area as estimated in Miller and Kleidon (2016), and about one-fifth of the potential estimated in Lu et al. (2009).
The global potentials of hydropower amount to 50 EJ yr−1. These estimates are based on the technological potentials provided in the report from WGBU (2003) and the background paper produced for the aforementioned report (Horlacher, 2003).
3.2.4 Representation of power sector and variable renewable energy integration
The “IntC” (integrated costs) realization assumes a single electricity market balance that is complemented by equations that implicitly represent challenges and options related to the temporal and spatial variability of wind and solar power. The core approach (Pietzcker et al., 2014b) is an aggregated representation of technology- and region-specific wind and solar PV (variable renewable energy, VRE) integration costs and curtailment rates (i.e. unused surplus share of VRE electricity generation), which, since 2017, are parameterized with the help of two detailed electricity production cost models (Scholz et al., 2017; Ueckerdt et al., 2017). Integration costs consist of costs associated with short-term storage deployment (batteries), long-term hydrogen storage (electrolysis and hydrogen turbines), transmission and distribution grid expansion and reinforcement, and curtailment of surplus electricity. These variables are linked via specific equations to the shares of VRE generation, with higher VRE shares resulting in higher requirements for storage and grid. The parametrization of these equations also takes the region-specific temporal and spatial matching of electricity demand and renewable supply into account, so that regions with better concurrence (e.g. large noon demand peaks for air conditioning) require less storage, and regions with higher geographical proximity of VRE resource and demand require less grid investment. With higher VRE shares, depending on the wind and solar share, the short-term (battery) storage and long-term (hydrogen) storage requirements change to balance electricity demand and supply at all temporal scales. In addition, operating reserve requirements are represented similarly to a flexibility balance equation that was introduced for the MESSAGE model (Sullivan et al., 2013). In a more detailed representation, “RLDC” (residual load duration curve), the REMIND model represents regional load and renewable supply patterns in an explicit representation of RLDCs that endogenously change based on regional VRE shares, exogenous battery, and endogenous hydrogen storage, all of which are again parameterized with detailed electricity production cost models (Ueckerdt et al., 2017).
3.2.5 Representation of bioenergy – land use
The land-use sector is particularly relevant for climate change mitigation because of its big share of global emissions and its ability to provide the renewable and comparatively low-emission resource biomass. In REMIND, biomass is used to produce electricity, heat, ethanol, diesel, and hydrogen energy sources. Some of the conversion routes are equipped with CCS, which makes biomass an important source of negative emissions (Klein et al., 2014b). The following types of biomass are considered: food crops containing sugar, starch, and oil; lignocellulosic residues from forestry and agriculture; and lignocellulosic grasses and trees from short-rotation plantations.
The latter is assumed to play a more important role in climate protection than biomass from food crops because of its reduced adverse side effects on the land-use sector and the climate (food competition, deforestation, fertilizer, and water consumption). Therefore, the resource potential for purpose-grown lignocellulosic biomass is represented in REMIND via detailed supply curves (Klein et al., 2014a), while bioenergy from food crops is limited to today's level. The REMIND–MAgPIE coupling (see Sect. 2.4.1) also focuses on lignocellulose from short-rotation plantations.
The resource potential for the three biomass feedstocks is defined in the “30_biomass” realization of the “magpie_40” module. The price for purpose-grown lignocellulosic biomass is calculated as a (linear) function of demand according to the supply curves. The supply curves are exogenous to REMIND and have been derived in preprocessing by evaluating the price response of the MAgPIE model to different global bioenergy demand scenarios. Bioenergy costs of purpose-grown lignocellulosic biomass are calculated by integrating the price supply curve over the demand. Purpose-grown lignocellulosic biomass is the only biomass resource that can be traded between regions in REMIND. Residues from forestry and food production are available as a limited low-cost lingo-cellulosic resource slightly increasing over time with a constant price.
Land-use emissions are defined in the “core” as exogenous trajectories for CO2, CH4, and N2O derived from MAgPIE. They serve as emission baselines from which further abatement is possible according to the GHG price using marginal abatement cost curves (MACC). The MACCs for CH4 and N2O are based on Lucas et al. (2007) (see Sect. 3.4.1 for details).
Agricultural production costs (excluding the costs of biomass production) are also exogenous scenarios for REMIND derived from MAgPIE and provided in the “costs” realization of the “26_agCosts” module.
When coupled to MAgPIE, the following measures are taken in REMIND to ensure consistency with the land-use system: the supply curves are updated by shifting them according to the price response of MAgPIE (Klein, 2015), the exogenous projections for land-use emissions, and non-biomass agricultural production costs are replaced with data from the latest MAgPIE iteration. All land-use-related MACCs are switched off in REMIND, as abatement is realized in MAgPIE through changes in land-use patterns, technological change, and MACCs. Bioenergy trade remains in REMIND. Biomass from food crops is harmonized with MAgPIE in the preprocessing but is not part of the coupling.
3.3 Representation of energy demand sectors
3.3.1 Transport
The “35_transport” module calculates the transport demand composition as a part of the CES structure. In the default “complex” realization, transport demand composition is calculated for light-duty vehicles (LDVs), electric trains, and heavy-duty vehicles (HDVs), an aggregate category including passenger non-LDVs and freight modes (Pietzcker et al., 2014a). The three corresponding nodes in the CES transport branch represent aggregated transportation demands in terms of useful, i.e. motive, energy. The LDV node in the CES tree is supplied by either electricity, hydrogen, or liquid fuels with different conversion efficiencies, accounting for vehicles with internal combustion engines, fuel cell cars, or battery electric vehicles. The shares of the different drivetrain technologies are determined endogenously. HDVs can also be powered by liquid fuels, hydrogen, and electricity; trains are all electric. REMIND keeps track of fleet capacities and accounts for additional costs per aggregated demand unit.
For a more detailed representation of the transport sector, REMIND can be run coupled to EDGE-Transport (see Sect. 2.4.2) by choosing the “edge_esm” realization of the “35_transport” module.
3.3.2 Industry
The “37_industry” module models final energy use in the industry sector and its subsectors, as well as the emissions generated by them.
In the default “fixed_shares” realization, the final energy demand is determined for the aggregated industry sector and subdivided into four industry subsectors: cement production, chemicals production, iron and steel production, as well as all remaining industry energy demand (denoted “other Industry”) using region-specific shares that are kept constant at 2005 levels. Fuel switching (e.g. electrification) is enabled based on final energy prices and elasticities of substitution of the final energy carriers in the CES function.
In the “subsectors” realization, the energy demand from industry is modelled explicitly for the four subsectors (cement, chemicals, and iron and steel, and all remaining industry energy demand (denoted “other Industry”) in the nested CES production function. The iron and steel sector is subdivided into primary steel (from iron ore) and secondary steel (from scrap). The production of cement and steel as well as the value added from chemicals are derived via econometric regressions models based on per capita GDP at the country level. Steel demand is projected following the approach of Pauliuk et al. (2013).
In all realizations of the “37_industry” module, three marginal abatement cost (MAC) curves have been derived from the literature for CCS in the cement, chemicals, and iron and steel sectors (Kuramochi et al., 2012). A fourth curve that does not differentiate between the subsectors was derived from Fischedick et al. (2014). Subsector-specific MAC curves for CCS are applied to emissions calculated from energy use and emission factors according to the endogenous CO2 price, to calculate industry CO2 emissions and CCS. Process emissions from cement production are based on an econometric estimate of cement production according to Strefler (2014) and are included in cement emissions for which CCS is applicable. Industry CCS costs (by subsector) are equal to the integral below the MAC cost curve.
3.3.3 Building sector
The “36_buildings” module determines the demand for final energy carriers necessary to provide energy services whose production will, in turn, determine the welfare of the representative consumer. In the default “simple” realization, the heterogeneity of the demand is rendered through a nested CES function with a high degree of substitutability among non-electric fuels (e.g. heating oil and natural gas) and a low degree of substitutability between non-electric fuels and electric demand. The distinction between the non-electric and electric energy carriers is motivated by the different uses that can be made of these energy sources. While non-electric fuels are mostly used for heating purposes (e.g. space, water, and cooking), electricity consumption covers a wider range of purposes (e.g. lighting, appliances, and cooling).
In addition to the default building representation, REMIND can also include the more detailed building realization “services_putty”, that distinguishes not only between energy carriers but also across energy services with four categories (“appliances and lighting”, “space cooling”, “space heating”, and “cooking and water heating”). Energy demand is not only depicted at the final energy level but also at the useful energy level. The choice of energy carriers and technologies for heating purposes is dealt with outside the CES function to keep the physical balance between final and useful energy. The choice is handled through a multinomial logit. The detailed module also includes a trade-off between efficiency investments and energy consumption for insulation, space cooling, and appliances, and can represent efficiency policies. Furthermore, the module includes a representation of the inertia dynamics at work in the building envelope investment cycle via a putty-clay formulation in the CES nested function (Levesque et al., 2021).
The “services_with_capital” realization reproduces the features from the “services_putty” realization with the exception of the specific inertia dynamics of the building envelope investments.
3.4 Representation of emissions
REMIND simulates emissions from long-lived GHGs (CO2, CH4, and N2O), short-lived GHGs (CO, NOx, and VOCs), and aerosols (SO2, BC, and OC). REMIND accounts for these emissions with different levels of detail depending on the types and sources of emissions.
3.4.1 Greenhouse gases
REMIND accounts for all anthropogenic GHG emissions, including LULUCF (land use, land-use change, and forestry), and calculates the contributions from the majority of emissions sources endogenously. The energy system provides information on the regional consumption of fossil fuels and biomass for each time step and technology. For each fuel, region, and technology, REMIND applies specific emissions factors, which are calibrated to match base year GHG inventories (Global Emissions EDGAR v4.2, 2013). Emission factors for CH4 from the residential sector, and N2O from energy supply are taken from Amous (2000, Table 1). CH4, N2O, and CO2 from land-use change, fossil fuel extraction, cement production, and waste handling have mitigation options that are independent of energy consumption and are calculated in the core of REMIND. However, there are costs associated with these emission reductions. Therefore, REMIND derives the mitigation options from marginal abatement cost curves (MACC), which describe the percentage of abated emissions as a function of the costs (Lucas et al., 2007). It is possible to obtain baseline emissions – to which the MACCs are applied – by three different methods: by source, by an econometric estimate, or exogenously. Baseline emissions for CH4 fugitive emissions from coal, oil, and gas extraction and processing, are calculated by source using region- and fuel-specific emission factors. The emission factors for CH4 fugitive emissions are derived using the emissions inventory (Global Emissions EDGAR v4.2, 2013) and the amount of fossil fuel extracted in each region in REMIND in 2005. REMIND uses an econometric estimate for CO2 emissions from cement production as well as CH4 and N2O emissions from waste handling. In both cases, the driver of emissions depends on the development of population and GDP (as a proxy for waste production) or capital investment (as a proxy for cement production in infrastructure). REMIND uses exogenous baselines for N2O emissions from transport and industry, and for CO2, CH4, and N2O emissions from land-use and land-use change based on MAgPIE (see Sect. 3.2.5). CH4 and N2O emissions from open burning are assumed to remain constant at their 2005 levels.
Emissions of other GHGs (e.g. F-gases and Montreal gases) are exogenous and are taken from the SSP scenario data set from the IMAGE model (van Vuuren et al., 2017). REMIND does not represent abatement options for these gases; therefore, emissions from the corresponding SSP and RCP scenario best matching the target of the specific model simulation are used.
3.4.2 Pollutants and non-GHG forcing agents
REMIND calculates emissions of aerosols and ozone precursors (SO2, BC, OC, NOx, CO, VOCs, and NH3) in the “11_aerosols” module (sole realization “on”). It accounts for these emissions with different levels of detail depending on sources and species.
For pollutant emissions of SO2, BC, OC, NOx, CO, VOCs, and NH3 related to the combustion of fossil fuels, REMIND considers time- and region-specific emissions factors coupled to model-endogenous activity data. BC and OC emissions in 2005 are calibrated to the GAINS model (Klimont et al., 2017; Amann et al., 2011). All other emissions from fuel combustion in 2005 are calibrated to Global Emissions EDGAR v4.2 (2013). Emission factors for SO2, BC, and OC are assumed to decline over time according to air pollution policies based on Klimont et al. (2021). Current near-term policies are enforced in high-income countries, with gradual strengthening of goals over time and gradual technology (research, development, demonstration, and deployment – RDD&D). Low-income countries do not fully implement near-term policies but gradually improve over the century.
Emissions from international shipping and aviation and waste of all species are exogenous and are taken from Fujino et al. (2006). Further, REMIND uses land-use emissions from the MAgPIE model (see Sect. 2.4.1), which, in turn, are based on emission factors from van der Werf et al. (2010).
3.4.3 Carbon dioxide removal
In addition to CCS with fossil fuels and in the industry sector, four CDR options are available: afforestation and reforestation, bioenergy with CCS (BECCS), direct air capture with CCS (DACCS), and enhanced weathering of rocks (EW). The first two are calculated in the core, whereas DACCS and EW are calculated in the “33_CDR” module.
CO2 emissions from afforestation and reforestation are derived from the land-use optimization model MAgPIE4 (see Sect. 3.2.5). The trade-off between land expansion and yield increases is treated endogenously in the model. BECCS is the only CDR technology that provides sizable energy instead of consuming it. The idea of BECCS is to turn biomass grown on land carbon-negative by capturing the emissions arising during combustion or the refinery process. BECCS can be used for electricity, hydrogen, gas, or liquid-fuel production with different carbon capture rates.
DACCS captures CO2 directly from the ambient air. The techno-economic parameterization relies on the literature review performed in Broehm et al. (2015). Besides capital investments and O&M costs, DACCS requires heat and electricity. In REMIND, natural gas or H2 can be used to generate the required heat. There is no explicit limitation to the amount of carbon removal via DACCS; it is only limited due to costs and the amount of energy and carbon storage that can be provided. EW is based on the acceleration of the natural weathering of silicate rocks, which is an integral part of the carbon cycle. In REMIND, those rocks are assumed to be basalt, which is rich in phosphorus and potassium and contains very low concentrations of trace elements. The basalt has to be mined, ground to small grain sizes, and spread on agricultural fields. The regional potential for carbon removal depends on the agricultural land and the climate zone, as this process is faster in warm and humid regions and amounts to a maximum of 4.9 Gt CO2 yr−1 removed (Strefler et al., 2018b). Economic costs are at USD 200 per ton of CO2 removed, including electricity and diesel for grinding and transport. Due to the still large uncertainties especially in the carbon removal potential, EW is only included in dedicated studies.
In all regions, an additional tax of 50 % of the current carbon price is imposed on net-negative emissions to address two aspects: firstly, as soon as total emissions turn net-negative, carbon pricing no longer generates revenue but instead requires net government spending; secondly, geophysical constraints provide grounds for limiting the overshoot of cumulative emissions budget. REMIND assumes the value of 50 % to balance the likelihoods that net-negative emissions might be treated equally to emission reductions or not incentivized at all, i.e. a tax of 100 % which would preclude any revenues.
BECCS, DACCS, and fossil CCS compete for geological storage. Effective cumulative storage capacities were estimated to be half of the theoretical potentials given by IEA (IEA, 2008). Annual CCS deployment in each region is limited to 0.5 % of total storage capacity, limiting the total global CCS use to about 20 Gt CO2 yr−1 (values for SSP2, which decreased by 50 % for SSP1 and increased by 50 % for SSP5). To reflect the risk of leakage and the associated possible costs, such as costs of improved safety criteria related to monitoring, reporting, and verification, and difficulties due to public acceptance, which are all likely to increase with deployment, the best estimate of CCS costs is increased linearly such that costs are about 100 % or USD 30 per ton of CO2 higher at maximum deployment.
3.5 Representation of other environmental and social impacts
Tackling climate change will not only affect GHG emissions. The deep transformation of the energy system, transportation, and industry provides both synergies and trade-offs with broader sustainable development goals (SDGs) as defined by the United Nations General Assembly (2015). As such, IAMs increasingly try to capture the additional effects of climate policy, most prominently air pollution (Rao et al., 2016; West et al., 2013; Vandyck et al., 2018; Rauner et al., 2020) and water use (Mouratiadou et al., 2018; Fricko et al., 2016).
REMIND explicitly models the following non-climate environmental outcomes: water withdrawal and usage associated with power generation (“70_water” module; Mouratiadou et al., 2018) and air pollution emission (“11_aerosols” module), concentrations, and human health impacts for all sectors; the reader is referred to Mouratiadou et al. (2018) and Rauner et al. (2020) for detailed descriptions of the methodology. Furthermore, environmental and health impacts of the power sector are represented through life-cycle analysis (Luderer et al., 2019; Gibon et al., 2017b, a), and consequences of mitigation policies for inequality and poverty can be calculated in post-processing (Soergel et al., 2021b). Increasingly, a broader set of social and environmental outcomes of climate policy and other sustainability measures is covered (Bertram et al., 2018), also making use of the interface with the MAgPIE model (Humpenöder et al., 2018). Linking the REMIND–MAgPIE framework to additional SDG-specific models allows for a fairly comprehensive coverage of the SDG space and the modelling of sustainable development pathways (Soergel et al., 2021a).
REMIND provides an integrated view of possible future developments and their implications on the global energy–economy system, enabling the exploration of climate policy options while fully capturing the interactions between economic development, trade, and climate mitigation policies. In this section, model outputs from REMIND 2.1 for the SSP1, SSP2, and SSP5 scenarios are presented. For each of these assumptions regarding future development, a scenario with current policy assumptions (NPi) and a climate policy scenario restricting cumulative emissions to a budget of 1300 Gt CO2 (PkBudg1300) and a budget of 900 Gt CO2 (PkBugd900) (counted from 2011, see Sect. 2.5) are shown. This is an update of the previous SSP scenarios derived by REMIND 1.6, reflecting the latest developments in the model (e.g. changes in systems representation and spatial resolution, and an updated optimization start year such that policy scenarios only start to diverge from 2020 onwards).
4.1 Emissions
Different socio-economic developments feature different strategies to achieve the 1.5 ∘C target (see Fig. 5). While CO2 emissions from fossil fuels and industry are reduced by 70 %–80 % in 2050 in all scenarios, the deployment of CCS increases significantly from SSP1 to SSP2 to SSP5. In 2100, the difference is even more pronounced. In an SSP1 setting, CO2 emissions are reduced by 90 %, and CH4 and N2O emissions from land use are also much lower than in the other scenarios due to a lower population growth than in SSP2 and more sustainable lifestyles with less demand for animal-based products. This also leads to less demand for agricultural land and leaves room for regrowth of forests and natural vegetation, thereby enhancing the land carbon sink. The SSP5 scenario also assumes lower population growth and, therefore, sees a similar land carbon sink and lower CH4 and N2O emissions from land use than the SSP2 scenario. At the same time, it features strong increases in energy demands, relies more strongly on CCS, and, therefore, does not reduce CO2 emissions significantly in the second half of the century. In the SSP2 scenario, non-CO2 GHG emissions from land use are hardly reduced and, therefore, contribute a significant share to the residual emissions in 2050 and 2100.

Figure 5Global GHG emissions by type for the 1.5 ∘C scenarios (pkBudg900) based on SSP1, SSP2, and SSP5. The white line shows net GHG emissions.
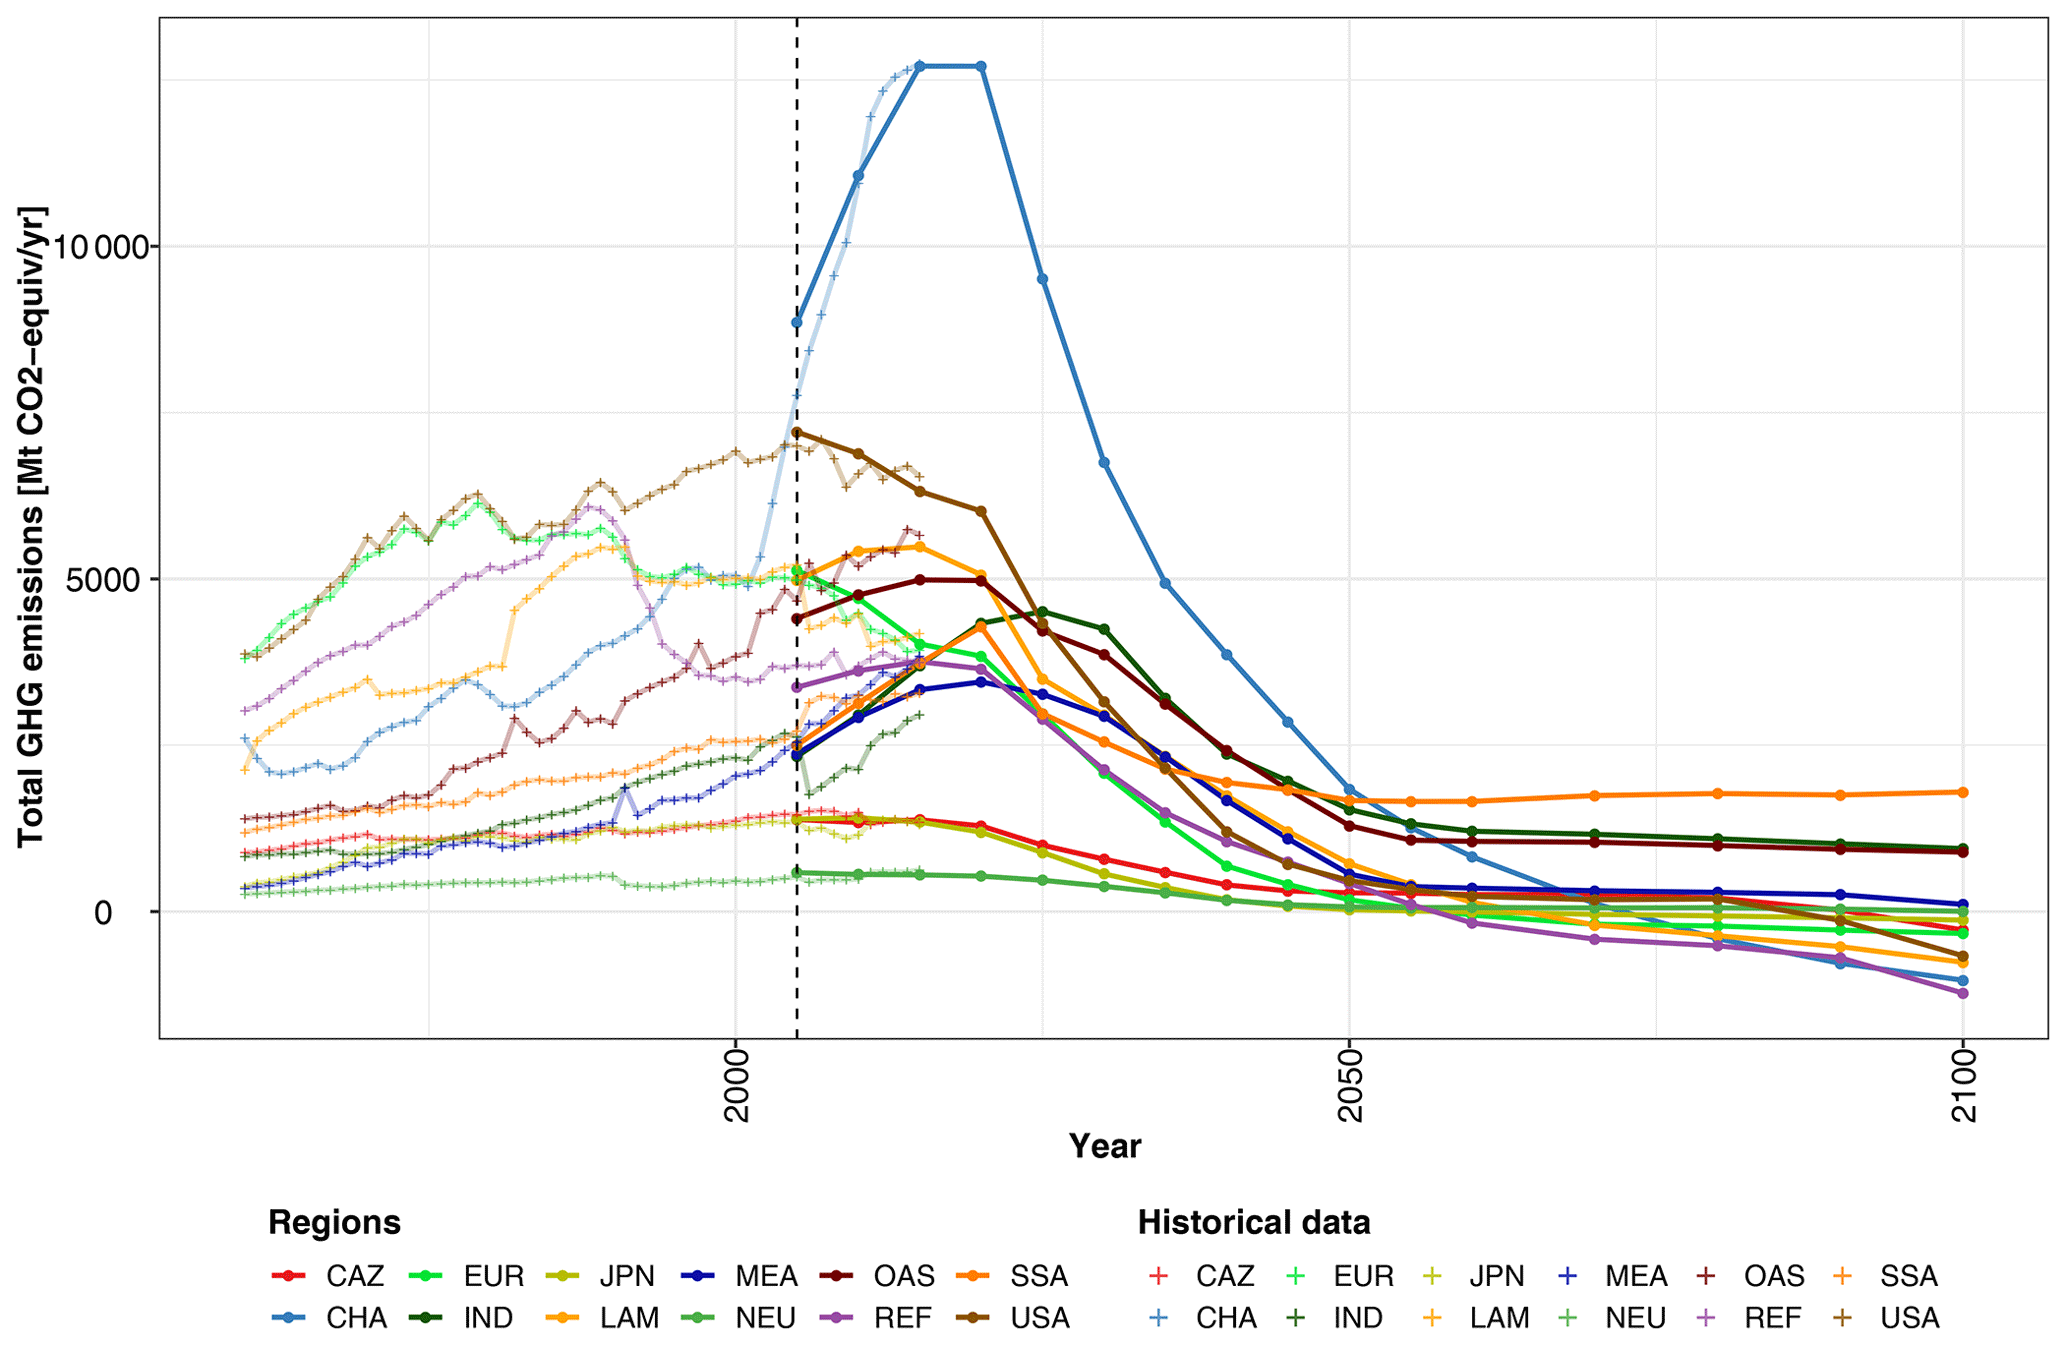
Figure 6Regional total GHG emissions by type for the 1.5 ∘C scenario (pkBudg900) of SSP2 with historical data from PRIMAPhist (Gütschow et al., 2016).
While global GHG emissions in the SSP2 scenario are reduced by 15 % in 2030, 80 % in 2050, and about 100 % in 2100, the timing of emission reduction can vary strongly across regions (see Fig. 6). In the Organisation for Economic Co-operation and Development (OECD) regions of Canada, Australia, New Zealand (CAZ); Europe (EUR); Japan (JPN); non-EU Europe (NEU); and the United States of America (USA), emissions have peaked already. In most other regions, emissions peak only in 2020, as 2025 already sees strong emission pricing across all sectors. One exception is India (IND), where emissions only peak in 2025 despite ambitious immediate climate policies. Regional differences are even more pronounced regarding the timing of net-zero emissions. The EU, Japan, and the USA reach net-zero emissions mid-century, closely followed by the reforming economies (REF) in 2055, Latin America (LAM) in 2060, and China in 2070. CAZ and NEU achieve emission neutrality only towards the end of the century, and the remaining regions India, the Middle East, and North Africa (MEA); other Asia (OAS); and sub-Saharan Africa (SSA) retain some residual emissions that are compensated for by net-negative emissions in the other regions.
4.2 Energy
Socio-economic assumptions as well as climate policy stringency strongly impact the evolution of the global energy system (see Fig. 7). In scenarios without strong climate mitigation policies (NPi), fossil fuels will retain a dominant role until 2050. Their dominance would also continue for SSP5 socio-economic assumptions but would be gradually reduced in SSP2 futures and would be replaced by a rather diverse energy system with similar contributions from wind, solar, bioenergy, and fossil fuels in 2100 in SSP1. These structural differences are partly due to alternate assumptions regarding technology cost and resource availability across SSPs but are also due to the main scale effect implying a more than 2 times higher total energy consumption in SSP5 compared with SSP1. All NPi scenarios project a considerable amount of wind and solar power to be competitive even without ambitious climate policies.
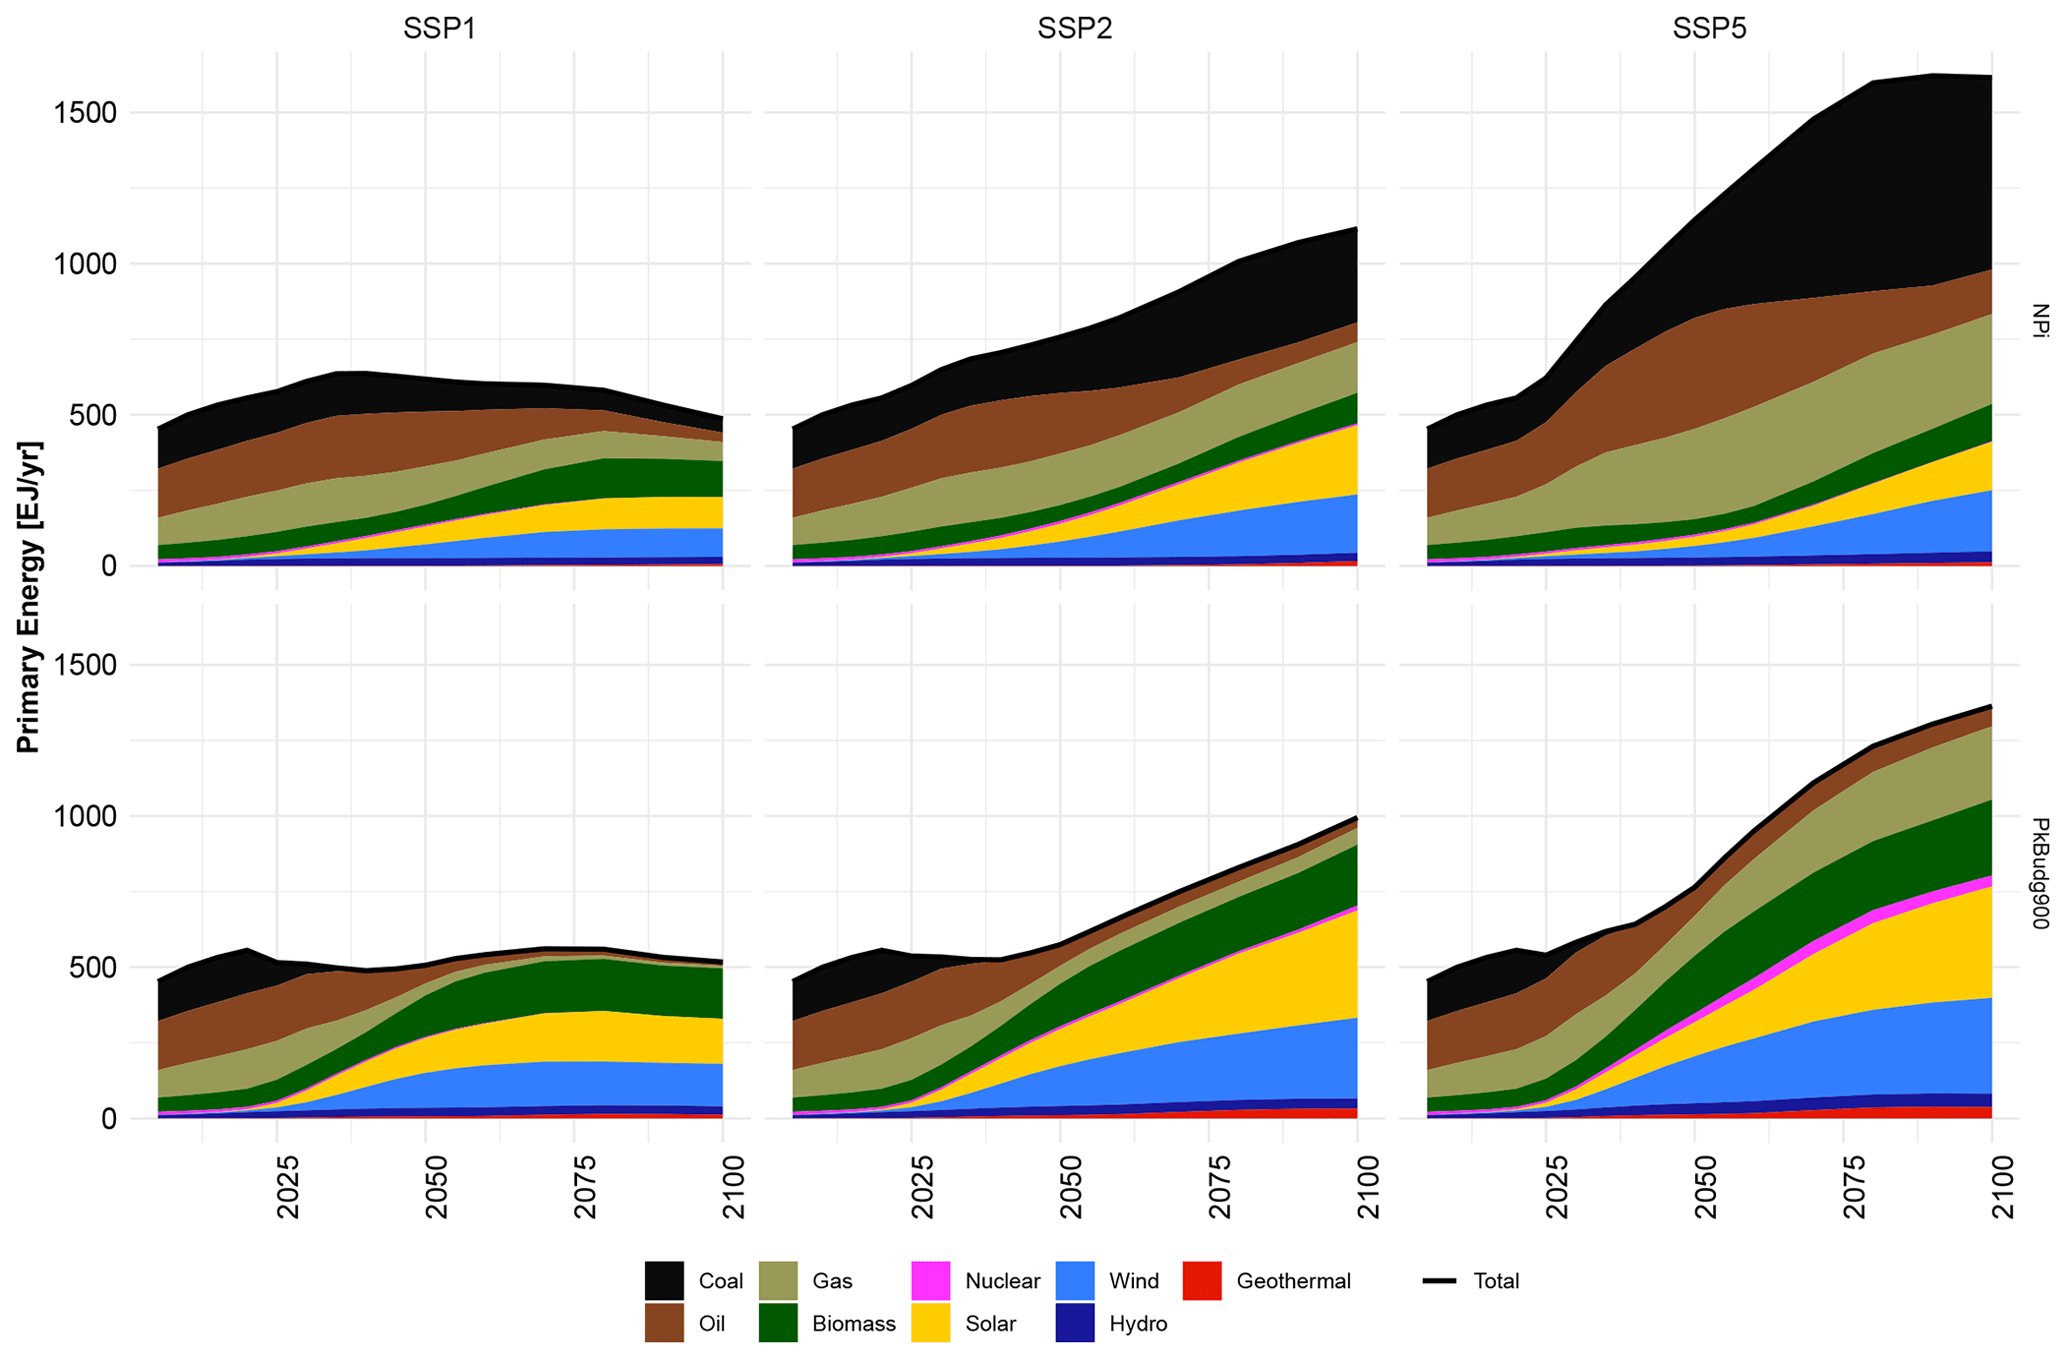
Figure 7Primary energy mixes by carrier for the NPi and pkBudg900 (1.5 ∘C) scenario of SSP1, SSP2, and SSP5.
Ambitious climate policies lead to a complete transformation of the global energy system, with most of the transformation already complete by 2050. Coal is quickly phased out completely in the power sector, and only a very small residual use remains in the industry sector (partly enabled by CCS). In SSP1 and SSP2, oil and gas use is also reduced to very low levels by 2050. In SSP5, however, oil and especially gas use continues throughout the century, enabled partly by CCS for gas and by very high levels of carbon dioxide removal (CDR) to offset the considerable residual CO2 emissions from these uses. Across SSPs, renewables, especially wind and solar, dominate decarbonized energy systems, and climate policy in line with 1.5 ∘C results in twice as much deployment of these respective technologies in each SSP compared with the NPi scenario. More importantly still, deployment is strongly accelerated, with very high growth rates for both technologies in the coming decades. Very high shares of wind and solar in total primary energy supply in policy scenarios are enabled by stronger and accelerated electrification of all end-use sectors. Nuclear plays no relevant role in climate policy scenarios with SSP1 or SSP2 socio-economic assumptions, but it plays an important niche role in the SSP5 variant, where very high electricity demands in some regions surpass the generation potentials assumed for wind and solar. Therefore, nuclear power, while not providing larger shares to global electricity production than today, is massively scaled up in such a scenario in absolute terms. The use of biomass, hydro power, and geothermal energy is relatively similar across SSP policy scenarios, mainly caused by supply constraints for these options.
The key role of energy efficiency measures for climate mitigation is best illustrated by the reduction in final energy demands when comparing each of the mitigation scenarios to the corresponding NPi scenario (see Fig. 8). The reduction in final energy due to climate policy is strongest in the next few decades when the energy system is in transformation, whereas it is less pronounced once the transformation is completed. As a consequence, the SSP2 and especially SSP5 mitigation scenarios project substantially higher total final energy demands than today for the end of the century, whereas the SSP1 scenario stabilizes FE demand at approximately the current level. In terms of the sectoral composition of final energy, neither the socio-economic assumption nor the climate policy has a strong impact, with the exception of the noticeable higher share of transport for the very high final energy demands in SSP5. Mitigation in all sectors involves accelerated electrification (Luderer et al., 2018), although the absolute level of electrification that can be reached varies by both sector and SSP.
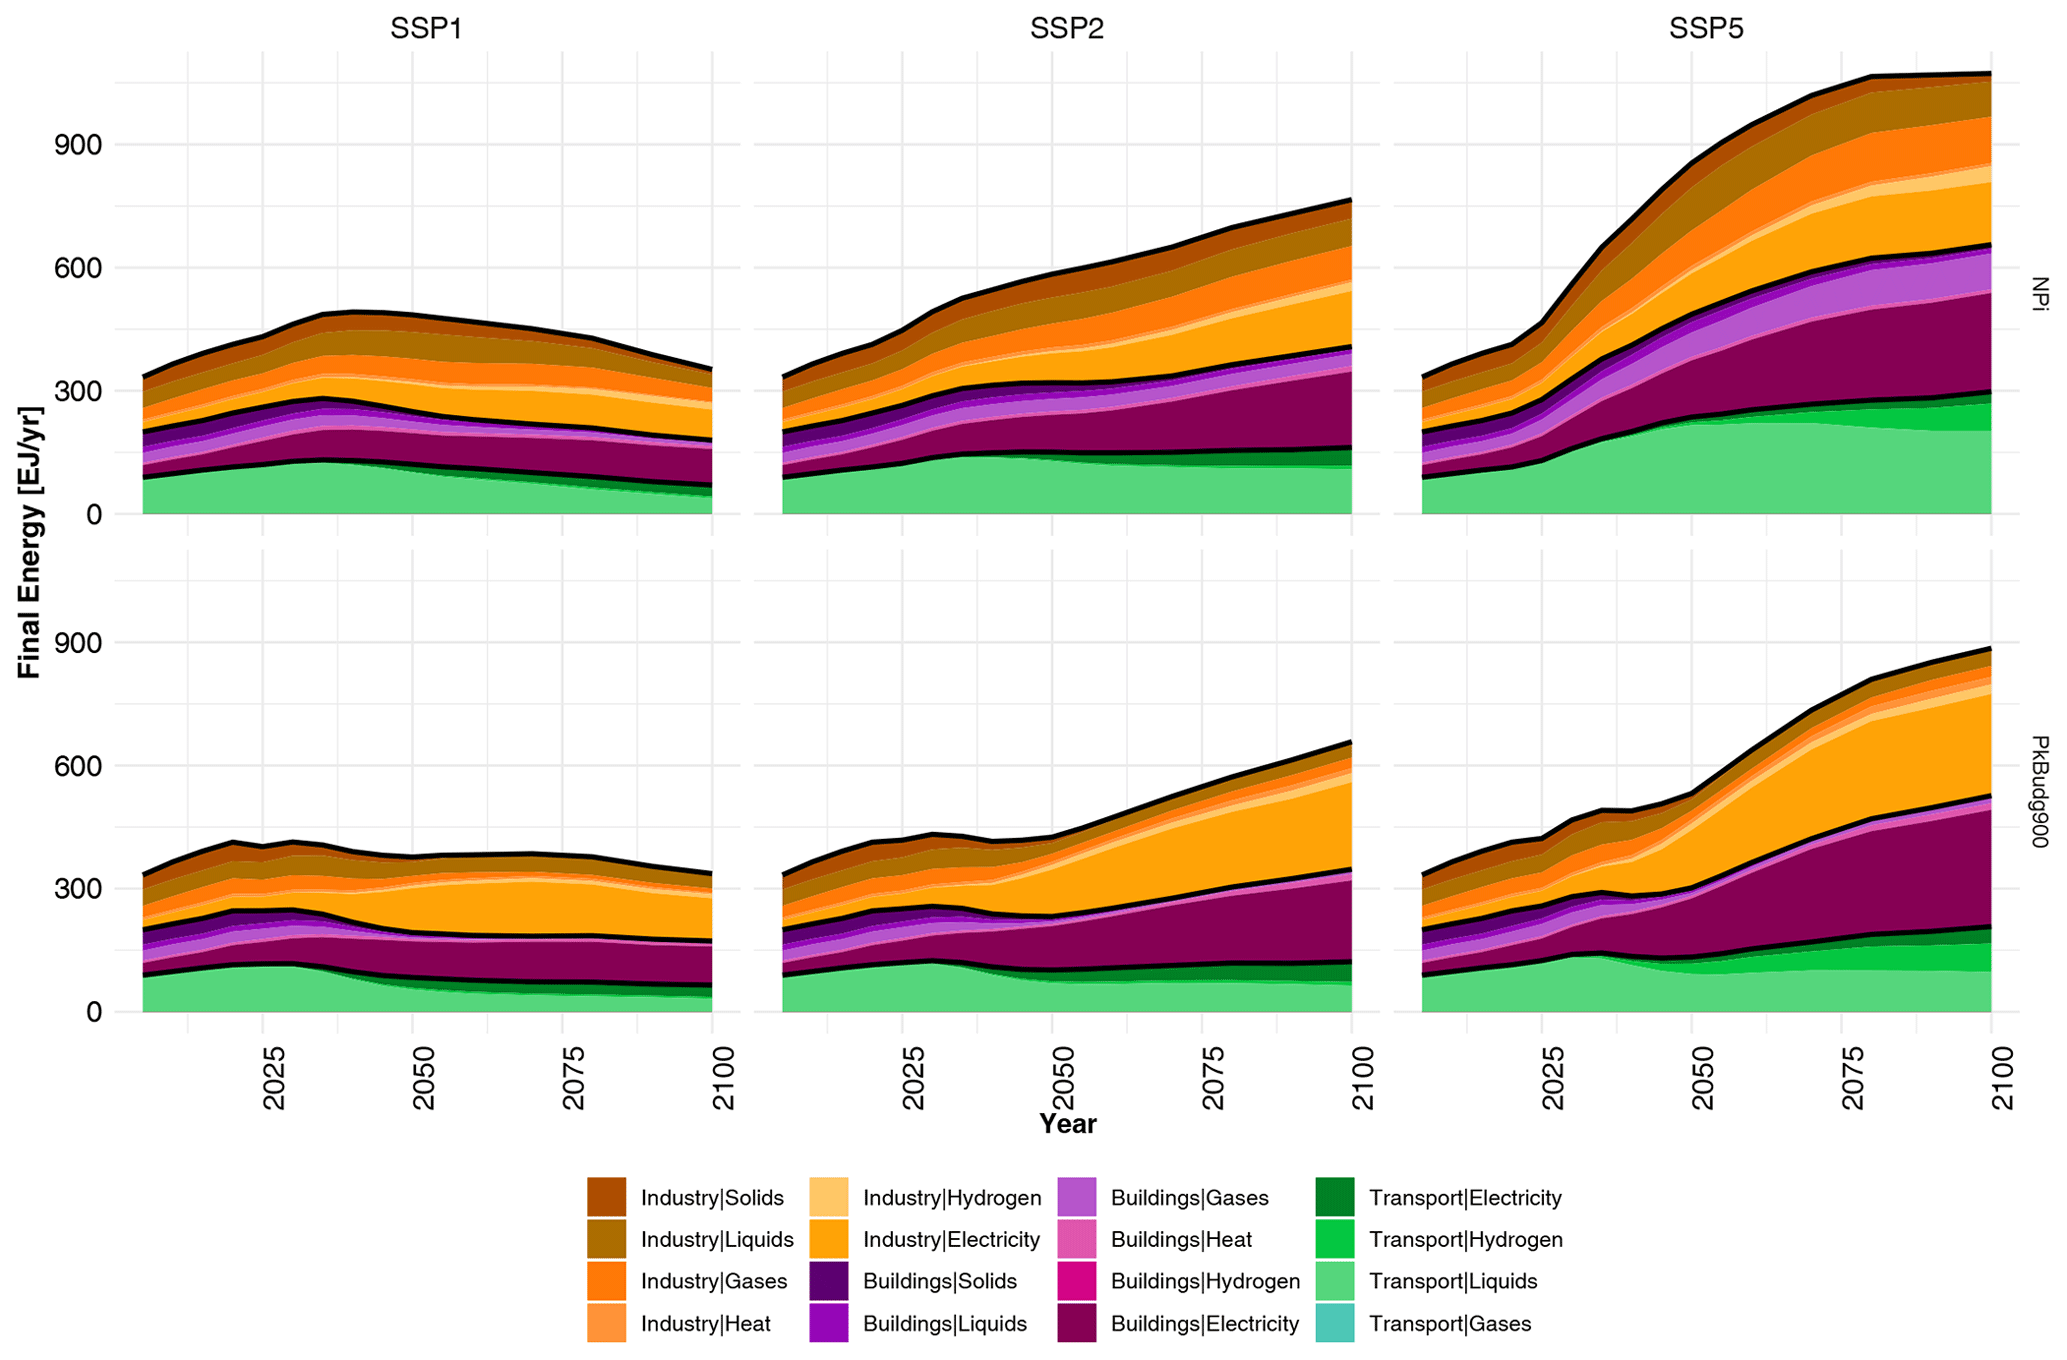
Figure 8Final energy mixes for sectors by carrier for the NPi and pkBudg900 (1.5 ∘C) scenarios of SSP1, SSP2, and SSP5.
As REMIND is a multiregional model of the energy-economic system, it is well equipped to capture the interactions between the energy transformation in response to climate policies and economic development. Full macroeconomic integration is particularly valuable for the assessment of effects of climate policies on the scarcity of energy carriers, demand response, structural changes, investments, macroeconomic costs, and their regional distribution.
The central strength of REMIND with its perfect foresight is its ability to calculate first-best mitigation strategies that provide benchmark development scenarios with detailed representation of the key dynamics related to the scale-up of novel technologies and integration constraints in the power sector. These benchmark scenarios allow for comparison with mitigation scenarios under second-best policy settings (regional or sectoral fragmentation) or technology constraints.
Within some numerical restrictions, the flexible spatial resolution of REMIND enables the exploration of transformation pathways of the energy-economic system for specific countries or global regions (e.g. Europe).
Due to the simultaneous solution of the macroeconomy and the detailed energy system, as well as inter-temporal optimization and several non-linear equations in the model, the computational effort for solving REMIND is substantial. This level of computational complexity also puts an upper limit on the amount of detail that can be represented in the model.
However, the modular structure of REMIND enables detailed analysis of a specific part of the model (e.g. fossil fuel extraction) tailored to the research question without increasing the numerical burden of the default model. In addition, the feasibility to link REMIND with other models (e.g. EDGE, MAgPIE, and MAGICC) guarantees consistent detailed results with a small increase in model complexity.
REMIND generates scenarios that are under no circumstances to be understood as forecasts. It generates possible future projections conditional on specific assumptions that serve as benchmarks (due to perfect foresight and inter-temporal optimization) for policy advice. It is not the primary purpose of REMIND, nor any model with a distinct normative component, to reproduce past development. This does not mean that there is no validation of the model. For example, the REMIND model replicates a set of stylized facts of macroeconomic growth and their interrelationship with energy demand (Kriegler et al., 2017). However, the validation criteria are softer and more difficult to define than for purely descriptive and geophysical models. Therefore, one focus is to match short-term trends. REMIND includes bounds (e.g. capacity of technologies) to emulate the near-term future. As pointed out by Schwanitz (2013), validation of IAMs cannot rely to the same extent as for geophysical models on hindcasting; therefore, complementary evaluation approaches such as comparison to more stylized historical trends or comparison across models are used in addition. A key outcome of transition scenarios is the scale and speed at which new technologies deploy and diffuse. Independent analyses of REMIND scenarios have shown that the model's early periods do not contradict historical experience (Wilson et al., 2013; van Sluisveld et al., 2015). Moreover, the base year calibration of the model, regional energy potentials, and the techno-economic assumptions of technologies are regularly reviewed in model comparison studies (e.g. Luderer et al., 2018; Roelfsema et al., 2020; Bauer et al., 2018; Riahi et al., 2017).
In the following, illustrative results of various REMIND scenarios are compared to historical data. As the model starts in 2005, this demonstrates that results for the overlapping time span from 2005 to 2015(2019) fit to historical data. Future projections take up historical trends and provide plausible results of the future. For population and GDP, this is shown in Fig. 1, and regional GHG emissions are compared in Fig. 6. Figure A1 demonstrates global primary energy pathways for coal, oil, gas, and biomass compared to historical data from IEA. Trajectories of global total final energy and final energies of the building, industry, and transport sectors in comparison to IEA data are shown in Fig. A2.
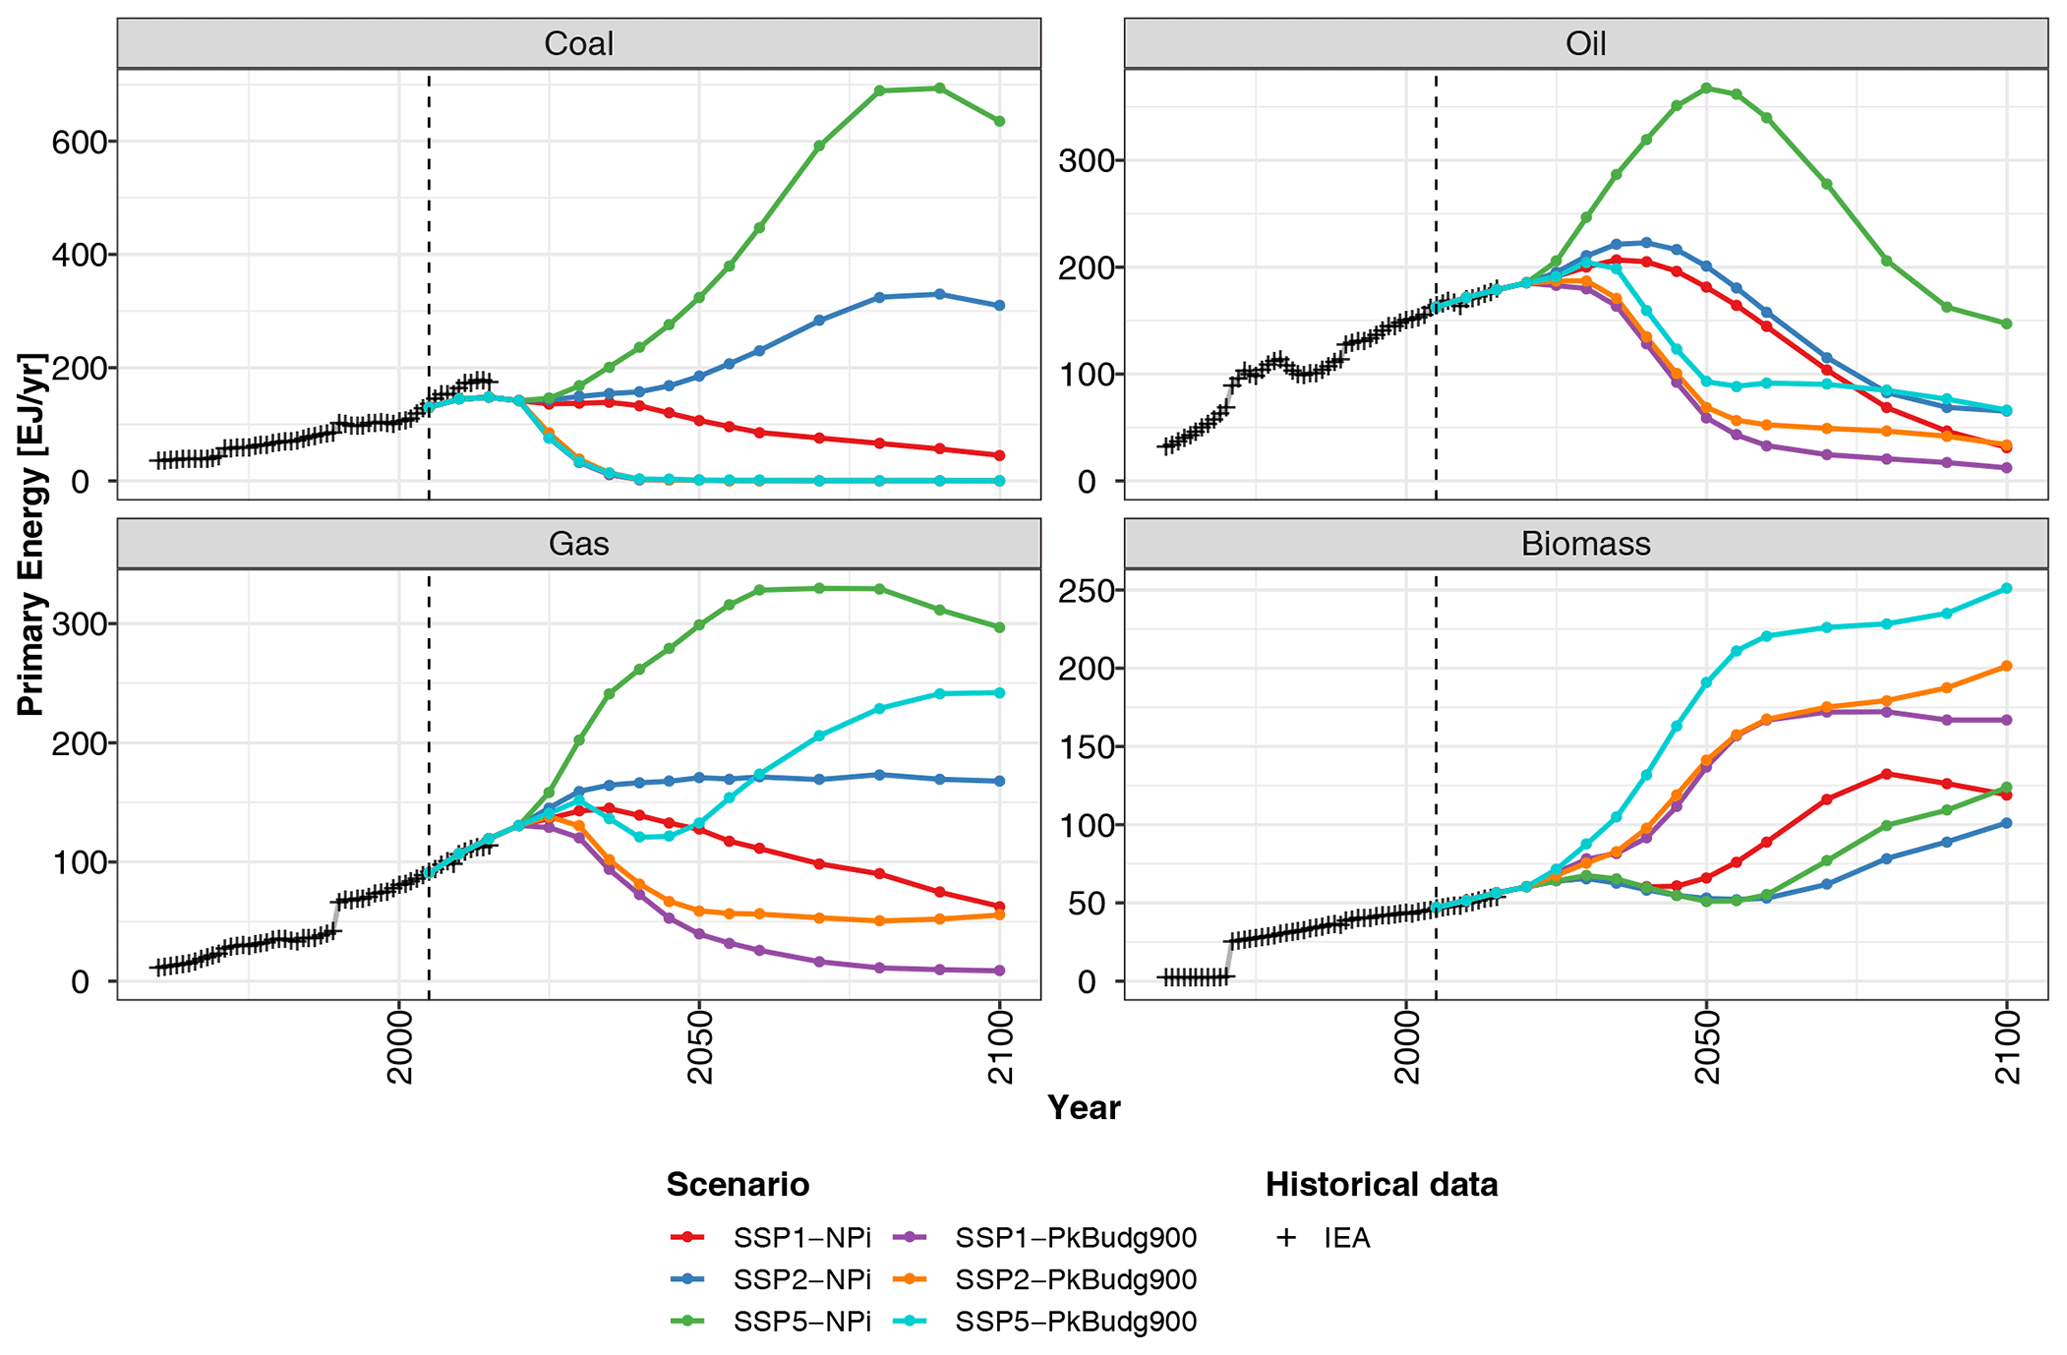
Figure A1Global primary energy consumption of different energy carriers for NPi and pkBudg900 (1.5 ∘C) scenarios of SSP1, SSP2 and SSP5 compared to historical data from IEA.
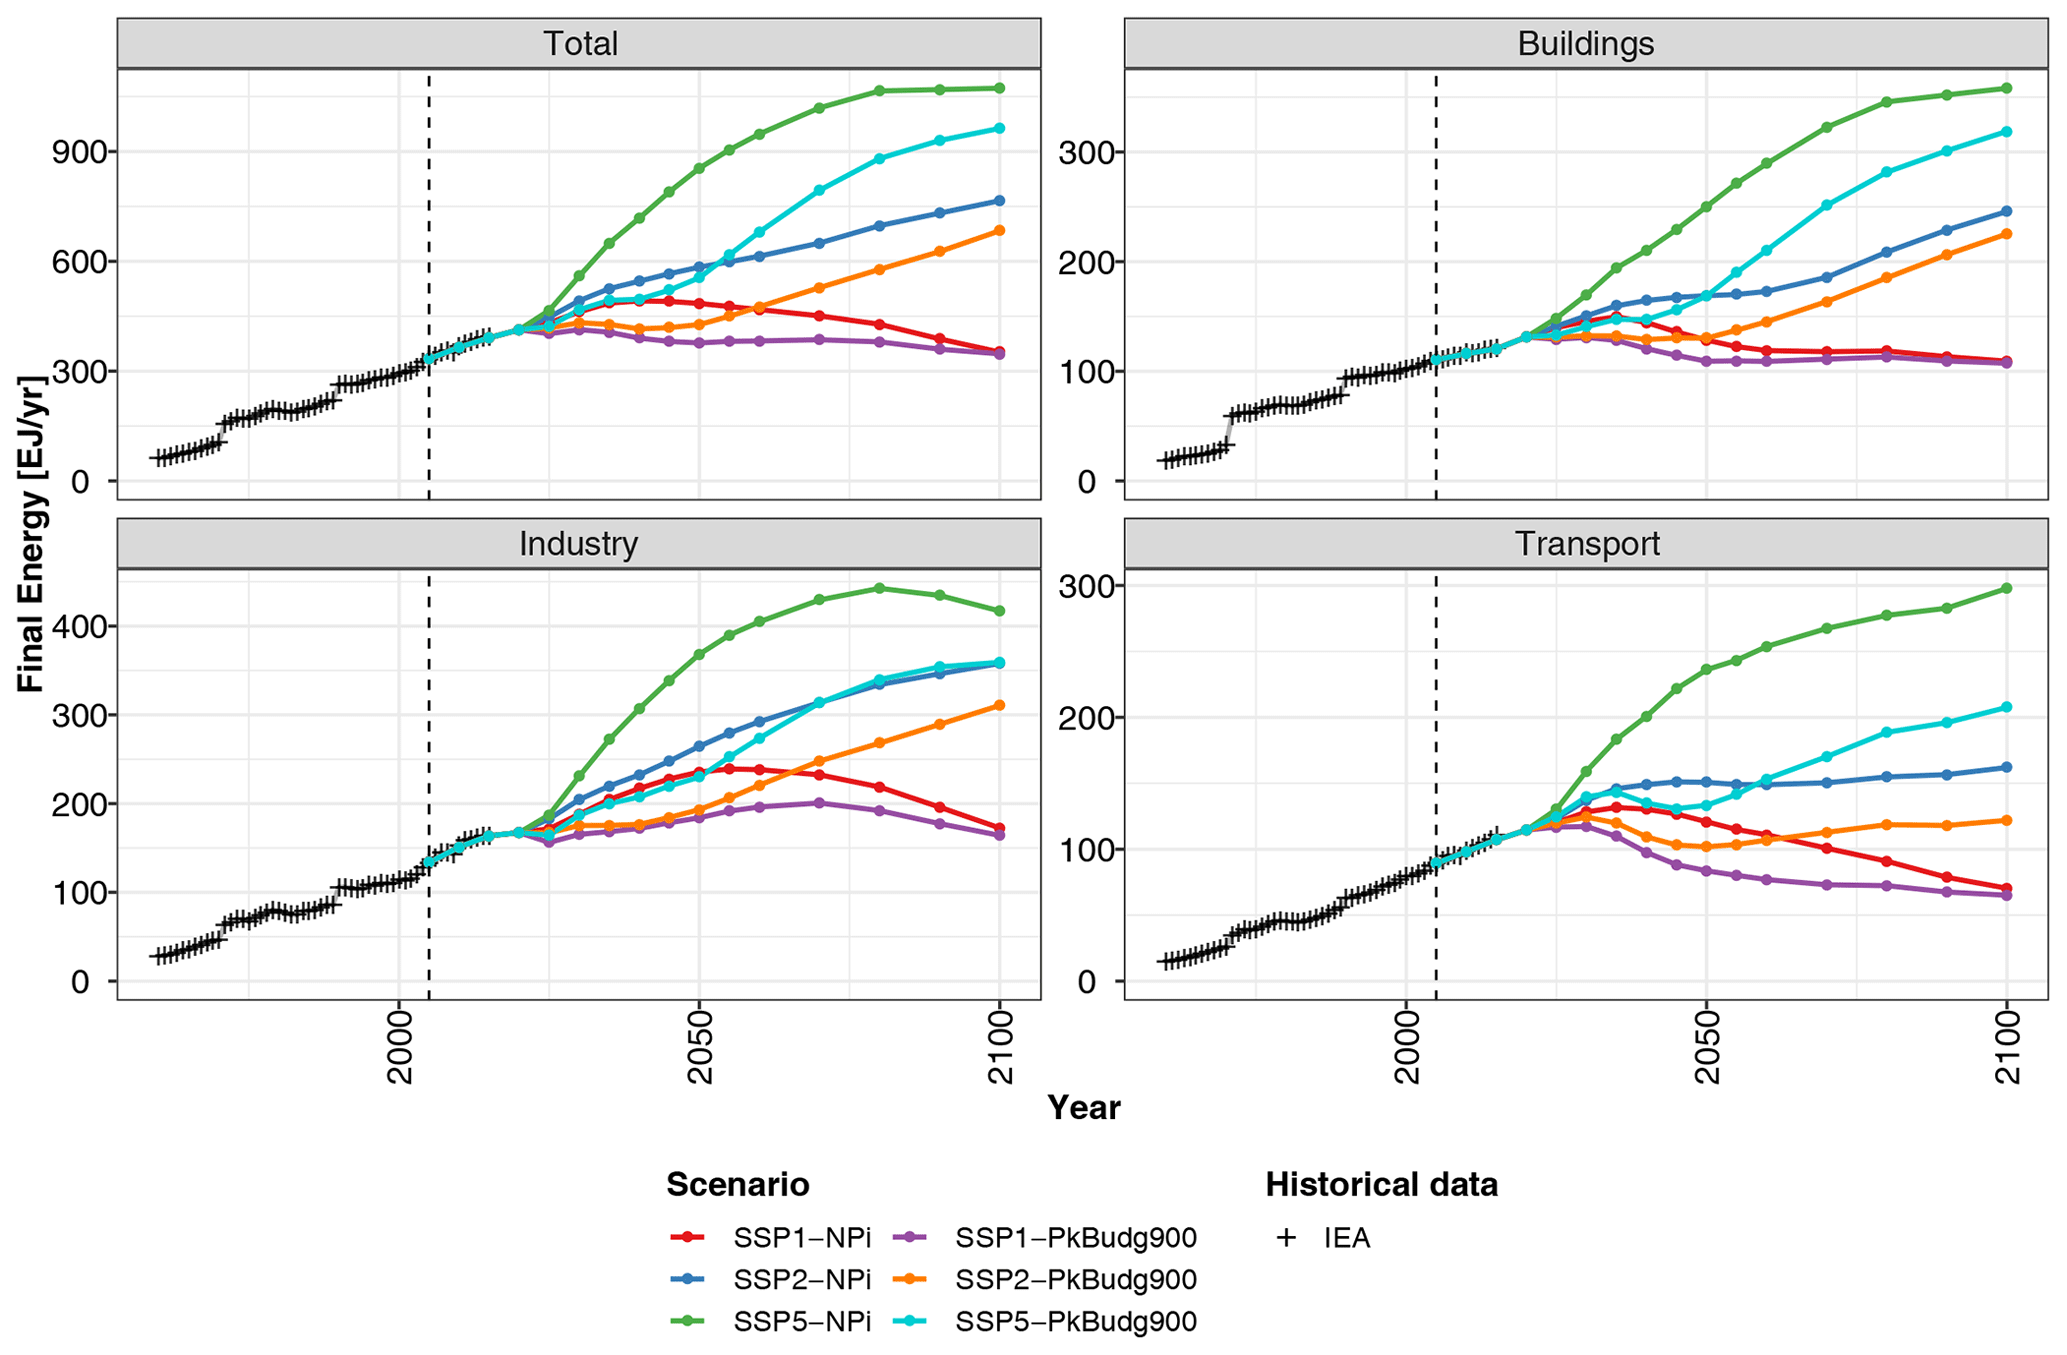
Figure A2Global final energy for sectors for NPi and pkBudg900 (1.5 ∘C) scenarios of SSP1, SSP2 and SSP5 compared to historical data from IEA.
The default spatial aggregation combines countries into 12 global regions. Table B1 shows the mapping of countries (ISO country code) to the default REMIND regions as used for this study.

Table C1 lists all modules of REMIND 2.1.3 and provides a short description of the modules.

The REMIND code is implemented in GAMS, whereas code and data management is done using R. The REMIND 2.1.3 code is archived at Zenodo (https://doi.org/10.5281/zenodo.4091409, Luderer et al., 2020a). The technical model documentation is available from https://rse.pik-potsdam.de/doc/remind/2.1.3/ (last access: 1 December 2020) and is also archived via Zenodo (https://doi.org/10.5281/zenodo.4268254, Luderer et al., 2020b). The GAMS code, results, and requisite scripts to produce the figures shown in this paper are archived at Zenodo (https://doi.org/10.5281/zenodo.5047314, Baumstark, 2021).
GL and EK supervised the development of the model with respect to content. LB, AG, DK, and JPD provided technical support regarding the development of the model framework. LB performed the simulations and prepared the paper with contributions from NB, CB, DK, JK, ML, AL, SM, MP, RCP, FP, SR, RR, MR, JS, FU, and GL. LB, DK, and FB created the figures shown in this paper. All authors contributed to the development of the model framework and the paper.
The authors declare that they have no conflict of interest.
Publisher's note: Copernicus Publications remains neutral with regard to jurisdictional claims in published maps and institutional affiliations.
The authors thank the editor and reviewers for their valuable remarks which led to significant improvements of the paper.
This research has been supported by the Bundesministerium für Bildung und Forschung (grant no. 03EK3046A, START project, and grant no. 03SFK5A, ARIADNE project), the Deutsche Forschungsgemeinschaft (grant no. 1689, CEMICS2 project), and the Horizon 2020 (grant no. 821124, NAVIGATE project, and grant no. 821471, ENGAGE project).
The publication of this article was funded by the Open Access Fund of the Leibniz Association.
This paper was edited by Daniel Huppmann and reviewed by two anonymous referees.
Aguilera, R. F., Eggert, R. G., Lagos C. C., G., and Tilton, J. E.: Depletion and the Future Availability of Petroleum Resources, Energ. J., 30, 141–174, https://doi.org/10.5547/ISSN0195-6574-EJ-Vol30-No1-6, 2009.
Amann, M., Bertok, I., Borken-Kleefeld, J., Cofala, J., Heyes, C., Höglund-Isaksson, L., Klimont, Z., Nguyen, B., Posch, M., Rafaj, P., Sandler, R., Schöpp, W., Wagner, F., and Winiwarter, W.: Cost-effective control of air quality and greenhouse gases in Europe: Modeling and policy applications, Environ. Modell. Softw., 26, 1489–1501, https://doi.org/10.1016/j.envsoft.2011.07.012, 2011.
Amous, S.: Non-CO2 emissions from stationary combustion. Background paper to “Good Practice Guidance and Uncertainty Management in National Greenhouse Gas Inventories,” IPCC, 2000.
Anthoff, D. and Tol, R. S. J.: The uncertainty about the social cost of carbon: A decomposition analysis using fund, Climatic Change, 117, 515–530, https://doi.org/10.1007/s10584-013-0706-7, 2013.
Arrow, K. J. and Debreu, G.: Existence of an Equilibrium for a Competitive Economy, Econometrica, 22, 265–290, https://doi.org/10.2307/1907353, 1954.
Balasko, Y.: The Equilibrium Manifold: Postmodern Developments in the Theory of General Economic Equilibrium, MIT Press, 245 pp., 2009.
Barro, R. J. and Sala-i-Martin, X.: Economic growth, 2nd Edn., MIT Press, Cambridge, Massachusetts, 2004.
Bauer, N., Brecha, R. J., and Luderer, G.: Economics of nuclear power and climate change mitigation policies, P. Natl. Acad. Sci. USA, 109, 16805–16810, https://doi.org/10.1073/pnas.1201264109, 2012a.
Bauer, N., Baumstark, L., and Leimbach, M.: The REMIND-R model: the role of renewables in the low-carbon transformation – first-best vs. second-best worlds, Climatic Change, 114, 145–168, https://doi.org/10.1007/s10584-011-0129-2, 2012b.
Bauer, N., Hilaire, J., Brecha, R. J., Edmonds, J., Jiang, K., Kriegler, E., Rogner, H.-H., and Sferra, F.: Assessing global fossil fuel availability in a scenario framework, Energy, 111, 580–592, https://doi.org/10.1016/j.energy.2016.05.088, 2016a.
Bauer, N., Mouratiadou, I., Luderer, G., Baumstark, L., Brecha, R. J., Edenhofer, O., and Kriegler, E.: Global fossil energy markets and climate change mitigation – an analysis with REMIND, Climatic Change, 136, 69–82, https://doi.org/10.1007/s10584-013-0901-6, 2016b.
Bauer, N., Rose, S. K., Fujimori, S., Vuuren, D. P. van, Weyant, J., Wise, M., Cui, Y., Daioglou, V., Gidden, M. J., Kato, E., Kitous, A., Leblanc, F., Sands, R., Sano, F., Strefler, J., Tsutsui, J., Bibas, R., Fricko, O., Hasegawa, T., Klein, D., Kurosawa, A., Mima, S., and Muratori, M.: Global energy sector emission reductions and bioenergy use: overview of the bioenergy demand phase of the EMF-33 model comparison, Climatic Change, 163, 1553–1568, https://doi.org/10.1007/s10584-018-2226-y, 2018.
Bauer, N., Klein, D., Humpenöder, F., Kriegler, E., Luderer, G., Popp, A., and Strefler, J.: Bio-energy and CO2 emission reductions: an integrated land-use and energy sector perspective, Climatic Change, 163, 1675–1693, https://doi.org/10.1007/s10584-020-02895-z, 2020.
Baumstark, L.: REMIND 2.1 paper – code, reportings, scripts, Zenodo [code], https://doi.org/10.5281/zenodo.5047314, 2021.
Baumstark, L., Giannousakis, A., Rodrigues, R., Levesque, A., Oeser, J., Bertram, C., Mouratiadou, I., Malik, A., Schreyer, F., Soergel, B., Rottoli, M., Mishra, A., Dirnaichner, A., Pehl, M., Klein, D., Strefler, J., Feldhaus, L., Brecha, R., Dietrich, J. P., and Bi, S.: mrremind: MadRat REMIND Input Data Library, Zenodo [code], https://doi.org/10.5281/zenodo.4309197, 2020.
Bertram, C., Luderer, G., Pietzcker, R. C., Schmid, E., Kriegler, E., and Edenhofer, O.: Complementing carbon prices with technology policies to keep climate targets within reach, Nat. Clim. Change, 5, 235–239, https://doi.org/10.1038/nclimate2514, 2015.
Bertram, C., Luderer, G., Popp, A., Minx, J. C., Lamb, W. F., Miodrag Stevanović, Humpenöder, F., Giannousakis, A., and Kriegler, E.: Targeted policies can compensate most of the increased sustainability risks in 1.5 ∘C mitigation scenarios, Environ. Res. Lett., 13, 064038, https://doi.org/10.1088/1748-9326/aac3ec, 2018.
Bodirsky, B. L., Karstens, K., Baumstark, L., Weindl, I., Wang, X., Mishra, A., Wirth, S., Stevanovic, M., Steinmetz, N., Kreidenweis, U., Rodrigues, R., Popov, R., Humpenoeder, F., Giannousakis, A., Levesque, A., Klein, D., Araujo, E., Beier, F., Oeser, J., Pehl, M., Leip, D., Molina Bacca, E., Martinelli, E., Schreyer, F., and Dietrich, J. P.: mrcommons: MadRat commons Input Data Library, Zenodo [code], https://doi.org/10.5281/zenodo.3822010, 2020.
Bonges, H. A. and Lusk, A. C.: Addressing electric vehicle (EV) sales and range anxiety through parking layout, policy and regulation, Transport. Res. A-Pol., 83, 63–73, https://doi.org/10.1016/j.tra.2015.09.011, 2016.
Bosetti, V., Massetti, E., and Tavoni,M.: TheWITCHModel, Structure, Baseline, Solutions, 2007, FEEM Working Paper No. 10.2007, CMCC Research Paper No. 7, 2007.
Broehm, M., Strefler, J., and Bauer, N.: Techno-Economic Review of Direct Air Capture Systems for Large Scale Mitigation of Atmospheric CO2, SSRN, https://doi.org/10.2139/ssrn.2665702, 2015.
Brückl, O.: Global Technical Potential of Electricity Production from Wind Energy, Internal Final Report for BMW AG Study, Institute for Energy Economy and Application Technology (IfE) Germany, Technische Universität München, Munich, Germany, 2005.
Burke, M., Hsiang, S. M., and Miguel, E.: Global non-linear effect of temperature on economic production, Nature, 527, 235–239, https://doi.org/10.1038/nature15725, 2015.
CONOPT: CONOPT version 3.17L, ARKI Consulting and Development A/S, Bagsvaerdvej 246 A, DK-2880 Bagsvaerd, Denmark, 2020.
Debreu, G.: Economies with a Finite Set of Equilibria, Econometrica, 38, 387–392, https://doi.org/10.2307/1909545, 1970.
Dellink, R., Chateau, J., Lanzi, E., and Magné, B.: Long-term economic growth projections in the Shared Socioeconomic Pathways, Global Environ. Chang., 42, 200–214, https://doi.org/10.1016/j.gloenvcha.2015.06.004, 2017.
den Elzen, M., Kuramochi, T., Höhne, N., Cantzler, J., Esmeijer, K., Fekete, H., Fransen, T., Keramidas, K., Roelfsema, M., Sha, F., van Soest, H., and Vandyck, T.: Are the G20 economies making enough progress to meet their NDC targets?, Energ. Policy, 126, 238–250, https://doi.org/10.1016/j.enpol.2018.11.027, 2019.
Dietrich, J. P., Baumstark, L., Bodirsky, B. L., Giannousakis, A., Wirth, S., Kreidenweis, U., Rodrigues, R., and Stevanovic, M.: pik-piam/madrat: v1.33.1, Zenodo [code], https://doi.org/10.5281/zenodo.1115491, 2017.
Dietrich, J. P., Bodirsky, B. L., Humpenöder, F., Weindl, I., Stevanović, M., Karstens, K., Kreidenweis, U., Wang, X., Mishra, A., Klein, D., Ambrósio, G., Araujo, E., Yalew, A. W., Baumstark, L., Wirth, S., Giannousakis, A., Beier, F., Chen, D. M.-C., Lotze-Campen, H., and Popp, A.: MAgPIE 4 – a modular open-source framework for modeling global land systems, Geosci. Model Dev., 12, 1299–1317, https://doi.org/10.5194/gmd-12-1299-2019, 2019.
Dietrich, J. P., Bodirsky, B. L., Weindl, I., Humpenöder, F., Stevanovic, M., Kreidenweis, U., Wang, X., Karstens, K., Mishra, A., Beier, F. D., Molina Bacca, E. J., Klein, D., Ambrósio, G., Araujo, E., Biewald, A., Lotze-Campen, H., and Popp, A.: MAgPIE – An Open Source land-use modeling framework, Zenodo [code], https://doi.org/10.5281/zenodo.4231467, 2020.
Eurek, K., Sullivan, P., Gleason, M., Hettinger, D., Heimiller, D., and Lopez, A.: An improved global wind resource estimate for integrated assessment models, Energ. Econ., 64, 552–567, https://doi.org/10.1016/j.eneco.2016.11.015, 2017.
European Environmental Agency (EEA): Europe's onshore and offshore wind energy potential – An assessment of environmental and economical constraints, Technical Report 6/2009, https://doi.org/10.2800/11373, 2009.
Ewing, B. T., Barron, J. M., and Lynch, G. J.: Understanding Macroeconomic Theory, Routledge, 241 pp., 2006.
Fischedick, M., Roy, J., Abdel-Aziz, A., Acquaye, A., Allwood, J. M., Ceron, J.-P., Geng, Y., Kheshgi, H., Lanza, A., Perczyk, D., Price, L., Santalla, E., Sheinbaum, C., and Tanaka, K.: Industry, in: Climate Change 2014: Mitigation of Climate Change, Contribution of Working Group III to the Fifth Assessment Report of the Intergovernmental Panel on Climate Change, edited by: Edenhofer, O., Pichs-Madruga, R., Sokona, Y., Farahani, E., Kadner, S., Seyboth, K., Adler, A., Baum, I., Brunner, S., Eickemeier, P., Kriemann, B., Savolainen, J., Schlömer, S., von Stechow, C., Zwickel, T., and Minx, J. C., Cambridge University Press, Cambridge, United Kingdom and New York, NY, USA, 2014.
Fricko, O., Parkinson, S. C., Johnson, N., Strubegger, M., van Vliet, M. T., and Riahi, K.: Energy sector water use implications of a 2 ∘C climate policy, Environ. Res. Lett., 11, 034011, https://doi.org/10.1088/1748-9326/11/3/034011, 2016.
Fricko, O., Havlik, P., Rogelj, J., Klimont, Z., Gusti, M., Johnson, N., Kolp, P., Strubegger, M., Valin, H., Amann, M., Ermolieva, T., Forsell, N., Herrero, M. Heyes, C., Kindermann, G., Krey, V., McCollum, D. L., Obersteiner, M., Pachauri, S., Rao, S., Schmid, E., Schoepp, W., and Riahia, K.: The marker quantification of the Shared Socioeconomic Pathway 2: A middle-of-the-road scenario for the 21st century, Global Environ. Change, 42, 251–267, https://doi.org/10.1016/j.gloenvcha.2016.06.004, 2017.
Fujino, J., Nair, R., Kainuma, M., Masui, T., and Matsuoka, Y.: Multi-gas mitigation analysis on stabilization scenarios using AIM global model, Energ. J., in: Multi-Greenhouse Gas Mitigation and Climate Policy, 343–354, https://doi.org/10.5547/ISSN0195-6574-EJ-VolSI2006-NoSI3-17, 2006.
GAMS: General Algebraic Modeling System (GAMS) Release 31.1.1, GAMS Development Corporation, Washington, DC, USA, 2020.
Giannousakis, A., Baumstark, L., and Kriegler, E.: En route to China's mid-century climate goal: comparison of emissions intensity versus absolute targets, Clim. Policy, 20, 1274–1289, https://doi.org/10.1080/14693062.2020.1798734, 2020a.
Giannousakis, A., Hilaire, J., Nemet, G. F., Luderer, G., Pietzcker, R. C., Rodrigues, R., Baumstark, L., and Kriegler, E.: How uncertainty in technology costs and carbon dioxide removal availability affect climate mitigation pathways, Energy, 216, 119253, https://doi.org/10.1016/j.energy.2020.119253, 2020b.
Gibon, T., Hertwich, E. G., Arvesen, A., Singh, B., and Verones, F.: Health benefits, ecological threats of low-carbon electricity, Environ. Res. Lett., 12, 034023, https://doi.org/10.1088/1748-9326/aa6047, 2017a.
Gibon, T., Arvesen, A., and Hertwich, E. G.: Life cycle assessment demonstrates environmental co-benefits and trade-offs of low-carbon electricity supply options, Renew. Sustain. Energ. Rev., 76, 1283–1290, https://doi.org/10.1016/j.rser.2017.03.078, 2017b.
Glanemann, N., Willner, S. N., and Levermann, A.: Paris Climate Agreement passes the cost-benefit test, Nat. Commun., 11, 110, https://doi.org/10.1038/s41467-019-13961-1, 2020.
Global Emissions EDGAR v4.2: http://edgar.jrc.ec.europa.eu/overview.php?v=42, last access: 25 January 2013.
Gütschow, J., Jeffery, L., Gieseke, R., Gebel, R., Stevens, D., Krapp, M., and Rocha, M.: The PRIMAP-hist national historical emissions time series (1850–2014), GFZ Data Services, https://doi.org/10.5880/PIK.2016.003, 2016.
Harmsen, M., Fricko, O., Hilaire, J., van Vuuren, D. P., Drouet, L., Durand-Lasserve, O., Fujimori, S., Keramidas, K., Klimont, Z., Luderer, G., Aleluia Reis, L., Riahi, K., Sano, F., and Smith, S. J.: Taking some heat off the NDCs? The limited potential of additional short-lived climate forcers' mitigation, Climatic Change, 163, 1443–1461, https://doi.org/10.1007/s10584-019-02436-3, 2020.
Heckscher, E. F., Ohlin, B., Flam, H., and Flanders, M. J.: Heckscher-Ohlin trade theory, MIT Press, Cambridge, Massachusetts, 234 pp., 1991.
Herfindahl, O. C.: Depletion and Economic Theory, in: Extractive Resources and Taxation, edited by: Gaffney, M., University of Wisconsin Press, Madison, Wisconsin, 1967.
Hoogwijk, M.: On the global and regional potential of renewable energy sources, PhD Thesis, Universiteit Utrecht, Faculteit Scheikunde, Utrecht, 2004.
Hoogwijk, M. and Graus, W.: Global potential of renewable energy sources: a literature assessment, Ecofys, REN21 – Renewable Energy Policy Network for the 21st Century, 45 pp., available at: https://www.researchgate.net/profile/Wina-Crijns-Graus/publication/237576106_Global_Potential_of_Renewable_ Energy_Sources_a_Literature_Assessment/links/0deec52f89ed 07b2b9000000/Global-Potential-of-Renewable-Energy-Sources-a-Literature-Assessment.pdf (last access: 27 October 2021), 2008.
Horlacher, H.-B.: Globale Potenziale der Wasserkraft. Externe Expertise für das WBGU-Hauptgutachten 2003 “Welt im Wandel: Energiewende zur Nachhaltigkeit,” WBGU, Heidelberg, Germany, 2003.
Hourcade, J.-C., Jaccard, M., Bataille, C., and Ghersi, F.: Hybrid Modeling: New Answers to Old Challenges Introduction to the Special Issue of “The Energy Journal”, Energ. J., 27, 1–11, 2006.
Howard, P. H. and Sterner, T.: Few and Not So Far Between: A Meta-analysis of Climate Damage Estimates, Environ. Resour. Econ., 68, 197–225, https://doi.org/10.1007/s10640-017-0166-z, 2017.
Humpenöder, F., Popp, A., Bodirsky, B. L., Weindl, I., Biewald, A., Hermann Lotze-Campen, Dietrich, J. P., Klein, D., Kreidenweis, U., Müller, C., Rolinski, S., and Stevanovic, M.: Large-scale bioenergy production: how to resolve sustainability trade-offs?, Environ. Res. Lett., 13, 024011, https://doi.org/10.1088/1748-9326/aa9e3b, 2018.
Huppmann, D., Kriegler, E., Krey, V., Riahi, K., Rogelj, J., Rose, S. K., Weyant, J., Bauer, N., Bertram, C., Bosetti, V., Calvin, K., Doelman, J., Drouet, L., Emmerling, J., Frank, S., Fujimori, S., Gernaat, D., Grubler, A., Guivarch, C., Haigh, M., Holz, C., Iyer, G., Kato, E., Keramidas, K., Kitous, A., Leblanc, F., Liu, J.-Y., Löffler, K., Luderer, G., Marcucci, A., McCollum, D., Mima, S., Popp, A., Sands, R. D., Sano, F., Strefler, J., Tsutsui, J., Van Vuuren, D., Vrontisi, Z., Wise, M., and Zhang, R.: IAMC 1.5 ∘C Scenario Explorer and Data hosted by IIASA, Integrated Assessment Modeling Consortium & International Institute for Applied Systems Analysis, https://doi.org/10.22022/SR15/08-2018.15429, 2018.
IEA: CO2 Capture and Storage – A key carbon abatement option, edited by: OECD, I., International Energy Agency, 2008.
IEA: World Energy Outlook 2016, International Energy Agency, Paris, France, 2016.
IEA: Extended world energy balances, IEA World Energy Statistics and Balances (database), International Energy Agency, https://doi.org/10.1787/data-00513-en, 2021.
IPCC: Special Report on climate change, desertification, land degradation, sustainable land management, food security, and greenhouse gas fluxes in terrestrial ecosystems (SRCCL), available at: https://www.ipcc.ch/srccl/ (last access: 27 October 2021), 2019.
Jakob, M., Luderer, G., Steckel, J., Tavoni, M., and Monjon, S.: Time to act now? Assessing the costs of delaying climate measures and benefits of early action, Climatic Change, 114, 79–99, https://doi.org/10.1007/s10584-011-0128-3, 2012.
Jones, B. and O'Neill, B. C.: Spatially explicit global population scenarios consistent with the Shared Socioeconomic Pathways, Environ. Res. Lett., 11, 084003, https://doi.org/10.1088/1748-9326/11/8/084003, 2016.
Kalkuhl, M. and Wenz, L.: The Impact of Climate Conditions on Economic Production. Evidence from a Global Panel of Regions, EAERE, Journal of Environmental Economics and Management, 103, 102360, https://doi.org/10.1016/j.jeem.2020.102360, 2020.
KC, S. and Lutz, W.: The human core of the shared socioeconomic pathways: Population scenarios by age, sex and level of education for all countries to 2100, Global Environm. Chang., 42, 181–192, https://doi.org/10.1016/j.gloenvcha.2014.06.004, 2017.
Klein, D.: Bioenergy markets in a climate constrained world, Doctoral Thesis, Fakultät VI – Planen Bauen Umwelt, Technische Universität Berlin, Berlin, Germany, https://doi.org/10.14279/depositonce-4307, 2015.
Klein, D., Humpenöder, F., Bauer, N., Dietrich, J. P., Popp, A., Bodirsky, B. L., Bonsch, M., and Lotze-Campen, H.: The global economic long-term potential of modern biomass in a climate-constrained world, Environ. Res. Lett., 9, 074017, https://doi.org/10.1088/1748-9326/9/7/074017, 2014a.
Klein, D., Luderer, G., Kriegler, E., Strefler, J., Bauer, N., Leimbach, M., Popp, A., Dietrich, J. P., Humpenöder, F., Lotze-Campen, H., and Edenhofer, O.: The value of bioenergy in low stabilization scenarios: an assessment using REMIND-MAgPIE, Climatic Change, 123, 705–718, https://doi.org/10.1007/s10584-013-0940-z, 2014b.
Klimont, Z., Kupiainen, K., Heyes, C., Purohit, P., Cofala, J., Rafaj, P., Borken-Kleefeld, J., and Schöpp, W.: Global anthropogenic emissions of particulate matter including black carbon, Atmos. Chem. Phys., 17, 8681–8723, https://doi.org/10.5194/acp-17-8681-2017, 2017.
Klimont, Z., Hoglund, L., Heyes, C., Rafaj, P., Schoepp, W., Cofala, J., Borken-Kleefeld, J., Purohit, P., Kupiainen, K., Winiwarter, W., Amann, M., Zhao, B., Wang, S. X., Bertok, I., and Sander, R.: Global scenarios of air pollutants and methane: 1990–2050, in preparation, 2021.
Krey, V.: Global energy-climate scenarios and models: a review, WIREs Energy and Environment, 3, 363–383, https://doi.org/10.1002/wene.98, 2014.
Krey, V., Guo, F., Kolp, P., Zhou, W., Schaeffer, R., Awasthy, A., Bertram, C., de Boer, H.-S., Fragkos, P., Fujimori, S., He, C., Iyer, G., Keramidas, K., Köberle, A. C., Oshiro, K., Reis, L. A., Shoai-Tehrani, B., Vishwanathan, S., Capros, P., Drouet, L., Edmonds, J. E., Garg, A., Gernaat, D. E. H. J., Jiang, K., Kannavou, M., Kitous, A., Kriegler, E., Luderer, G., Mathur, R., Muratori, M., Sano, F., and van Vuuren, D. P.: Looking under the hood: A comparison of techno-economic assumptions across national and global integrated assessment models, Energy, 172, 1254–1267, https://doi.org/10.1016/j.energy.2018.12.131, 2019.
Kriegler, E., Petermann, N., Krey, V., Schwanitz, V. J., Luderer, G., Ashina, S., Bosetti, V., Eom, J., Kitous, A., Méjean, A., Paroussos, L., Sano, F., Turton, H., Wilson, C., and Van Vuuren, D. P.: Diagnostic indicators for integrated assessment models of climate policy, Technol. Forecast. Soc., 90, 45–61, https://doi.org/10.1016/j.techfore.2013.09.020, 2015.
Kriegler, E., Bauer, N., Popp, A., Humpenöder, F., Leimbach, M., Strefler, J., Baumstark, L., Bodirsky, B. L., Hilaire, J., Klein, D., Mouratiadou, I., Weindl, I., Bertram, C., Dietrich, J.-P., Luderer, G., Pehl, M., Pietzcker, R., Piontek, F., Lotze-Campen, H., Biewald, A., Bonsch, M., Giannousakis, A., Kreidenweis, U., Müller, C., Rolinski, S., Schultes, A., Schwanitz, J., Stevanovic, M., Calvin, K., Emmerling, J., Fujimori, S., and Edenhofer, O.: Fossil-fueled development (SSP5): An energy and resource intensive scenario for the 21st century, Global Environ. Chang., 42, 297–315, https://doi.org/10.1016/j.gloenvcha.2016.05.015, 2017.
Kriegler, E., Bertram, C., Kuramochi, T., Jakob, M., Pehl, M., Stevanović, M., Höhne, N., Luderer, G., Minx, J. C., Fekete, H., Hilaire, J., Luna, L., Popp, A., Steckel, J. C., Sterl, S., Yalew, A. W., Dietrich, J. P., and Edenhofer, O.: Short term policies to keep the door open for Paris climate goals, Environ. Res. Lett., 13, 074022, https://doi.org/10.1088/1748-9326/aac4f1, 2018.
Kuramochi, T., Ramírez, A., Turkenburg, W., and Faaij, A.: Comparative assessment of CO2 capture technologies for carbon-intensive industrial processes, Prog. Energ. Combust., 38, 87–112, https://doi.org/10.1016/j.pecs.2011.05.001, 2012.
Kyle, P. and Kim, S. H.: Long-term implications of alternative light-duty vehicle technologies for global greenhouse gas emissions and primary energy demands, Energ. Policy, 39, 3012–3024, https://doi.org/10.1016/j.enpol.2011.03.016, 2011.
Le Gallic, T., Assoumou, E., and Maïzi, N.: Future demand for energy services through a quantitative approach of lifestyles, Energy, 141, 2613–2627, 2017.
Leimbach, M. and Bauer, N.: Capital markets and the costs of climate policies, Environ. Econ. Policy Stud., https://doi.org/10.1007/s10018-021-00327-5, online first, 2021.
Leimbach, M. and Giannousakis, A.: Burden sharing of climate change mitigation: global and regional challenges under shared socio-economic pathways, Climatic Change, 155, 273–291, https://doi.org/10.1007/s10584-019-02469-8, 2019.
Leimbach, M., Bauer, N., Baumstark, L., and Edenhofer, O.: Mitigation Costs in a Globalized World: Climate Policy Analysis with REMIND-R, Environ. Model Assess., 15, 155–173, https://doi.org/10.1007/s10666-009-9204-8, 2010a.
Leimbach, M., Bauer, N., Baumstark, L., Luken, M., and Edenhofer, O.: Technological Change and International Trade – Insights from REMIND-R, Energ. J., 31, 109–136, https://doi.org/10.5547/ISSN0195-6574-EJ-Vol31-NoSI-5, 2010b.
Leimbach, M., Schultes, A., Baumstark, L., Giannousakis, A., and Luderer, G.: Solution algorithms for regional interactions in large-scale integrated assessment models of climate change, Ann. Oper. Res., 255, 29–45, https://doi.org/10.1007/s10479-016-2340-z, 2017.
Levesque, A., Pietzcker, R. C., Baumstark, L., De Stercke, S., Grübler, A., and Luderer, G.: How much energy will buildings consume in 2100? A global perspective within a scenario framework, Energy, 148, 514–527, https://doi.org/10.1016/j.energy.2018.01.139, 2018.
Levesque, A., Pietzcker, R. C., and Luderer, G.: Halving energy demand from buildings: The impact of low consumption practices, Technol. Forecast. Soc., 146, 253–266, https://doi.org/10.1016/j.techfore.2019.04.025, 2019.
Levesque, A., Pietzcker, R. C., Baumstark, L., and Luderer, G.: Deep decarbonisation of buildings energy services through demand and supply transformations in a 1.5 ∘C scenario, Environ. Res. Lett., 16, 054071, https://doi.org/10.1088/1748-9326/abdf07, 2021.
Lotze-Campen, H., Müller, C., Bondeau, A., Rost, S., Popp, A., and Lucht, W.: Global food demand, productivity growth, and the scarcity of land and water resources: a spatially explicit mathematical programming approach, Agr. Econ., 39, 325–338, https://doi.org/10.1111/j.1574-0862.2008.00336.x, 2008.
Lu, X., McElroy, M. B., and Kiviluoma, J.: Global potential for wind-generated electricity, P. Natl. Acad. Sci. USA, 106, 10933–10938, https://doi.org/10.1073/pnas.0904101106, 2009.
Lucas, P. L., van Vuuren, D. P., Olivier, J. G. J., and den Elzen, M. G. J.: Long-term reduction potential of non-CO2 greenhouse gases, Environ. Sci. Policy, 10, 85–103, https://doi.org/10.1016/j.envsci.2006.10.007, 2007.
Lucas, R. E.: Why Doesn't Capital Flow from Rich to Poor Countries?, Am. Econ. Rev., 80, 92–96, 1990.
Luderer, G., Pietzcker, R. C., Kriegler, E., Haller, M., and Bauer, N.: Asia's role in mitigating climate change: A technology and sector specific analysis with ReMIND-R, Energ. Econ., 34, S378–S390, https://doi.org/10.1016/j.eneco.2012.07.022, 2012.
Luderer, G., Pietzcker, R. C., Bertram, C., Kriegler, E., Meinshausen, M., and Edenhofer, O.: Economic mitigation challenges: how further delay closes the door for achieving climate targets, Environ. Res. Lett., 8, 034033, https://doi.org/10.1088/1748-9326/8/3/034033, 2013.
Luderer, G., Krey, V., Calvin, K., Merrick, J., Mima, S., Pietzcker, R., Vliet, J. V., and Wada, K.: The role of renewable energy in climate stabilization: results from the EMF27 scenarios, Climatic Change, 123, 427–441, https://doi.org/10.1007/s10584-013-0924-z, 2014.
Luderer, G., Leimbach, M., Bauer, N., Kriegler, E., Baumstark, L., Bertram, C., Giannousakis, A., Hilaire, J., Klein, D., Levesque, A., Mouratiadou, I., Pehl, M., Pietzcker, R., Piontek, F., Roming, N., Schultes, A., Schwanitz, V. J., and Strefler, J.: Description of the REMIND Model (Version 1.6), Social Science Research Network, Rochester, NY, 2015.
Luderer, G., Vrontisi, Z., Bertram, C., Edelenbosch, O. Y., Pietzcker, R. C., Rogelj, J., De Boer, H. S., Drouet, L., Emmerling, J., Fricko, O., Fujimori, S., Havlík, P., Iyer, G., Keramidas, K., Kitous, A., Pehl, M., Krey, V., Riahi, K., Saveyn, B., Tavoni, M., Van Vuuren, D. P., and Kriegler, E.: Residual fossil CO2 emissions in 1.5–2 ∘C pathways, Nat. Clim. Change, 8, 626–633, https://doi.org/10.1038/s41558-018-0198-6, 2018.
Luderer, G., Pehl, M., Arvesen, A., Gibon, T., Bodirsky, B. L., de Boer, H. S., Fricko, O., Hejazi, M., Humpenöder, F., Iyer, G., Mima, S., Mouratiadou, I., Pietzcker, R. C., Popp, A., van den Berg, M., van Vuuren, D., and Hertwich, E. G.: Environmental co-benefits and adverse side-effects of alternative power sector decarbonization strategies, Nat. Commun., 10, 5229, https://doi.org/10.1038/s41467-019-13067-8, 2019.
Luderer, G., Bauer, N., Baumstark, L., Bertram, C., Leimbach, M., Pietzcker, R., Strefler, J., Aboumahboub, T., Auer, C., Bi, S., Dietrich, J., Dirnaichner, A., Giannousakis, A., Haller, M., Hilaire, J., Klein, D., Koch, J., Körner, A., Kriegler, E., Levesque, A., Lorenz, A., Ludig, S., Lüken, M., Malik, A., Manger, S., Merfort, L., Mouratiadou, I., Pehl, M., Piontek, F., Popin, L., Rauner, S., Rodrigues, R., Roming, N., Rottoli, M., Schmidt, E., Schreyer, F., Schultes, A., Sörgel, B., and Ueckerdt, F.: REMIND – REgional Model of INvestments and Development (version 2.1.3), Zenodo [code], https://doi.org/10.5281/zenodo.4091409, 2020a.
Luderer, G., Auer, C., Bauer, N., Baumstark, L., Bertram, C., Bi, S., Dirnaichner, A., Giannousakis, A., Hilaire, J., Klein, D., Koch, J., Leimbach, M., Levesque, A., Malik, A., Merfort, L., Pehl, M., Pietzker, R., Piontek, F., Rauner, S., Rodrigues, R., Rottoli, M., Schreyer, F., Sörgel, B., Strefler, J., and Ueckerdt, F.: REMIND v2.1.3 – Model documentation, Zenodo [data set], https://doi.org/10.5281/zenodo.4268254, 2020b.
Manne, A., Mendelsohn, R., and Richels, R.: A Model for Evaluating Regional and Global Effects of GHG Reduction Policies, Energ. Policy, 23, 17–34, 1995.
Manne, A. S. and Rutherford, T. F.: International Trade in Oil, Gas and Carbon Emission Rights: An Intertemporal General Equilibrium Model, Energ. J., 15, 57–76, 1994.
Meinshausen, M., Wigley, T. M. L., and Raper, S. C. B.: Emulating atmosphere-ocean and carbon cycle models with a simpler model, MAGICC6 – Part 2: Applications, Atmos. Chem. Phys., 11, 1457–1471, https://doi.org/10.5194/acp-11-1457-2011, 2011.
Miller, L. M. and Kleidon, A.: Wind speed reductions by large-scale wind turbine deployments lower turbine efficiencies and set low generation limits, P. Natl. Acad. Sci. USA, 113, 13570, https://doi.org/10.1073/pnas.1602253113, 2016.
Mishra, G. S., Kyle, P., Teter, J., Morrison, G. M., Kim, S. H., and Yeh, S.: Transportation Module of Global Change Assessment Model (GCAM): Model Documentation – Version 1.0, 2013.
Model Documentation – REMIND – IAMC-Documentation: https://www.iamcdocumentation.eu/index.php/Model_Documentation -_REMIND, last access: 8 December 2020.
Moore, F. C. and Diaz, D. B.: Temperature impacts on economic growth warrant stringent mitigation policy, Nat. Clim. Change, 5, 127–131, https://doi.org/10.1038/nclimate2481, 2015.
Mouratiadou, I., Bevione, M., Bijl, D. L., Drouet, L., Hejazi, M., Mima, S., Pehl, M., and Luderer, G.: Water demand for electricity in deep decarbonisation scenarios: a multi-model assessment, Climatic Change, 147, 91–106, https://doi.org/10.1007/s10584-017-2117-7, 2018.
Nakicenovic, N., Alcamo, J., Davis, G., de Vries, B., Fenhann, J., Gaffin, S., Gregory, K., Grubler, A., Jung, T. Y., Kram, T., La Rovere, E. L., Michaelis, L., Mori, S., Morita, T., Pepper, W., Pitcher, H. M., Price, L., Riahi, K., Roehrl, A., Rogner, H.-H., Sankovski, A., Schlesinger, M., Shukla, P., Smith, S. J., Swart, R., van Rooijen, S., Victor, N., and Dadi, Z.: Special Report on Emissions Scenarios: A Special Report of Working Group III of the Intergovernmental Panel on Climate Change, Cambridge University Press, Cambridge, UK, 2000.
Nordhaus, W.: Estimates of the Social Cost of Carbon: Concepts and Results from the DICE-2013R Model and Alternative Approaches, Journal of the Association of Environmental and Resource Economists, 1, 273–312, https://doi.org/10.1086/676035, 2014.
Nordhaus, W. D.: Economic aspects of global warming in a post-Copenhagen environment, P. Natl. Acad. Sci. USA, 107, 11721–11726, https://doi.org/10.1073/pnas.1005985107, 2010.
Nordhaus, W. D.: Revisiting the social cost of carbon, P. Natl. Acad. Sci. USA,, 114, 1518–1523, https://doi.org/10.1073/pnas.1609244114, 2017.
Nordhaus, W. D. and Yang, Z.: A Regional Dynamic General-Equilibrium Model of Alternative Climate-Change Strategies, Am. Econ. Rev., 86, 741–765, 1996.
O'Neill, B. C., Kriegler, E., Riahi, K., Ebi, K. L., Hallegatte, S., Carter, T. R., Mathur, R., and Vuuren, D. P.: A new scenario framework for climate change research: the concept of shared socioeconomic pathways, Climatic Change, 122, 387–400, https://doi.org/10.1007/s10584-013-0905-2, 2013.
Pauliuk, S., Milford, R. L., Müller, D. B., and Allwood, J. M.: The Steel Scrap Age, Environ. Sci. Technol., 47, 3448–3454, https://doi.org/10.1021/es303149z, 2013.
Pietzcker, R. C., Longden, T., Chen, W., Fu, S., Kriegler, E., Kyle, P., and Luderer, G.: Long-term transport energy demand and climate policy: Alternative visions on transport decarbonization in energy-economy models, Energy, 64, 95–108, https://doi.org/10.1016/j.energy.2013.08.059, 2014a.
Pietzcker, R. C., Stetter, D., Manger, S., and Luderer, G.: Using the sun to decarbonize the power sector: The economic potential of photovoltaics and concentrating solar power, Appl. Energ., 135, 704–720, https://doi.org/10.1016/j.apenergy.2014.08.011, 2014b.
Rao, S., Klimont, Z., Leitao, J., Riahi, K., van Dingenen, R., Reis, L. A., Calvin, K., Dentener, F., Drouet, L., Fujimori, S., Harmsen, M., Luderer, G., Heyes, C., Strefler, J., Tavoni, M., and van Vuuren, D. P.: A multi-model assessment of the co-benefits of climate mitigation for global air quality, Environ. Res. Lett., 11, 124013, https://doi.org/10.1088/1748-9326/11/12/124013, 2016.
Rauner, S., Bauer, N., Dirnaichner, A., Dingenen, R. V., Mutel, C., and Luderer, G.: Coal-exit health and environmental damage reductions outweigh economic impacts, Nat. Clim. Change, 10, 308–312, https://doi.org/10.1038/s41558-020-0728-x, 2020.
R Core Team: R: A language and environment for statistical computing, R Foundation for Statistical Computing, Vienna, Austria, 2019.
Riahi, K., Vuuren, D. P. van, Kriegler, E., Edmonds, J., O'Neill, B. C., Fujimori, S., Bauer, N., Calvin, K., Dellink, R., Fricko, O., Lutz, W., Popp, A., Cuaresma, J. C., KC, S., and Leimbach, M.: Shared Socioeconomic Pathways: An Overview, Global Environ. Change, 42, 153–168, https://doi.org/10.1016/j.gloenvcha.2016.05.009, 2017.
Roelfsema, M., van Soest, H. L., Harmsen, M., van Vuuren, D. P., Bertram, C., den Elzen, M., Höhne, N., Iacobuta, G., Krey, V., Kriegler, E., Luderer, G., Riahi, K., Ueckerdt, F., Després, J., Drouet, L., Emmerling, J., Frank, S., Fricko, O., Gidden, M., Humpenöder, F., Huppmann, D., Fujimori, S., Fragkiadakis, K., Gi, K., Keramidas, K., Köberle, A. C., Aleluia Reis, L., Rochedo, P., Schaeffer, R., Oshiro, K., Vrontisi, Z., Chen, W., Iyer, G. C., Edmonds, J., Kannavou, M., Jiang, K., Mathur, R., Safonov, G., and Vishwanathan, S. S.: Taking stock of national climate policies to evaluate implementation of the Paris Agreement, Nat. Commun., 11, 2096, https://doi.org/10.1038/s41467-020-15414-6, 2020.
Rogelj, J., Shindell, D., Jiang, K., Fifita, S., Forster, P., Ginzburg, V., Handa, C., Kheshgi, H., Kobayashi, S., Kriegler, E., Mundaca, L., Seferian, R., Vilarino, M. V., Calvin, K., Edelenbosch, O., Emmerling, J., Fuss, S., Gasser, T., Gillet, N., He, C., Hertwich, E., Höglund Isaksson, L., Huppmann, D., Luderer, G., Markandya, A., McCollum, D., Millar, R., Meinshausen, M., Popp, A., Pereira, J., Purohit, P., Riahi, K., Ribes, A., Saunders, H., Schadel, C., Smith, C., Smith, P., Trutnevyte, E., Xiu, Y., Zickfeld, K., and Zhou, W.: Chapter 2: Mitigation pathways compatible with 1.5 ∘C in the context of sustainable development, in: Global Warming of 1.5 ∘C an IPCC special report on the impacts of global warming of 1.5 ∘C above pre-industrial levels and related global greenhouse gas emission pathways, in the context of strengthening the global response to the threat of climate change, Intergovernmental Panel on Climate Change, Geneva, Switzerland, available at: https://www.ipcc.ch/sr15/ (last access: 27 October 2021), 2018a.
Rogelj, J., Shindell, D., Jiang, K., Fifita, S., Forster, P., Ginzburg, V., Handa, C., Kheshgi, H., Kobayashi, S., Kriegler, E., Mundaca, L., Séférian, R., and Vilariño, M. V.: Mitigation pathways compatible with 1.5 ∘C in the context of sustainable development, in: Special Report on the impacts of global warming of 1.5 ∘C, in: Global Warming of 1.5 ∘C an IPCC special report on the impacts of global warming of 1.5 ∘C above pre-industrial levels and related global greenhouse gas emission pathways, in the context of strengthening the global response to the threat of climate change, Intergovernmental Panel on Climate Change, Geneva, Switzerland, available at: https://www.ipcc.ch/sr15/ (last access: 27 October 2021), 2018b.
Rogelj, J., Huppmann, D., Krey, V., Riahi, K., Clarke, L., Gidden, M., Nicholls, Z., and Meinshausen, M.: A new scenario logic for the Paris Agreement long-term temperature goal, Nature, 573, 357–363, https://doi.org/10.1038/s41586-019-1541-4, 2019.
Rogner, H.-H.: An assessment of world hydrocarbon ressources, Annu. Rev. Energ. Env., 22, 217–262, https://doi.org/10.1146/annurev.energy.22.1.217, 1997.
Rogner, H.-H., Aguilera, R. F., Bertani, R., Bhattacharya, S. C., Dusseault, M. B., Gagnon, L., Haberl, H., Hoogwijk, M., Johnson, A., Rogner, M. L., Wagner, H., and Yakushev, V.: Chapter 7 – Energy Resources and Potentials, in: Global Energy Assessment – Toward a Sustainable Future, Cambridge University Press, Cambridge, UK and New York, NY, USA and the International Institute for Applied Systems Analysis, Laxenburg, Austria, 423–512, 2012.
Rottoli, M., Dirnaichner, A., Kyle, P., Baumstark, L., Pietzcker, R., and Luderer, G.: Coupling a Detailed Transport Model to the Integrated Assessment Model REMIND, Environ. Model. Assess., https://doi.org/10.1007/s10666-021-09760-y, 2021.
Schafer, A. and Victor, D. G.: The future mobility of the world population, Transport. Res. A-Pol., 34, 171–205, https://doi.org/10.1016/S0965-8564(98)00071-8, 2000.
Scholz, Y., Gils, H. C., and Pietzcker, R. C.: Application of a high-detail energy system model to derive power sector characteristics at high wind and solar shares, Energ. Econ., 64, 568–582, 2017.
Schultes, A., Leimbach, M., Luderer, G., Pietzcker, R. C., Baumstark, L., Bauer, N., Kriegler, E., and Edenhofer, O.: Optimal international technology cooperation for the low-carbon transformation, Clim. Policy, 18, 1165–1176, https://doi.org/10.1080/14693062.2017.1409190, 2018.
Schultes, A., Piontek, F., Soergel, B., Rogelj, J., Baumstark, L., Kriegler, E., Edenhofer, O., and Luderer, G.: Economic damages from on-going climate change imply deeper near-term emission cuts, Environ. Res. Lett., 16, 104053, https://doi.org/10.1088/1748-9326/ac27ce, 2021.
Schwanitz, V. J.: Evaluating integrated assessment models of global climate change, Environ. Model. Softw., 50, 120–131, https://doi.org/10.1016/j.envsoft.2013.09.005, 2013.
Soergel, B., Kriegler, E., Weindl, I., Rauner, S., Dirnaichner, A., Ruhe, C., Hofmann, M., Bauer, N., Bertram, C., Bodirsky, B. L., Leimbach, M., Leininger, J., Levesque, A., Luderer, G., Pehl, M., Wingens, C., Baumstark, L., Beier, F., Dietrich, J. P., Humpenöder, F., von Jeetze, P., Klein, D., Koch, J., Pietzcker, R., Strefler, J., Lotze-Campen, H., and Popp, A.: A sustainable development pathway for climate action within the UN 2030 Agenda, Nat. Clim. Change, 11, 656–664, https://doi.org/10.1038/s41558-021-01098-3, 2021a.
Soergel, B., Kriegler, E., Bodirsky, B. L., Bauer, N., Leimbach, M., and Popp, A.: Combining ambitious climate policies with efforts to eradicate poverty, Nat. Commun., 12, 2342, https://doi.org/10.1038/s41467-021-22315-9, 2021b.
Strefler, J.: Challenges for low stabilization of climate change: The complementarity of non-CO2 greenhouse gas and aerosol abatement to CO2 emission reductions, PhD Thesis, Technische Universität Berlin, Berlin, Germany, 178 pp., 2014.
Strefler, J., Bauer, N., Kriegler, E., Popp, A., Giannousakis, A., and Edenhofer, O.: Between Scylla and Charybdis: Delayed mitigation narrows the passage between large-scale CDR and high costs, Environ. Res. Lett., 13, 044015, https://doi.org/10.1088/1748-9326/aab2ba, 2018a.
Strefler, J., Amann, T., Bauer, N., Kriegler, E., and Hartmann, J.: Potential and costs of carbon dioxide removal by enhanced weathering of rocks, Environ. Res. Lett., 13, 034010, https://doi.org/10.1088/1748-9326/aaa9c4, 2018b.
Sullivan, P., Krey, V., and Riahi, K.: Impacts of considering electric sector variability and reliability in the MESSAGE model, Energy Strateg. Rev., 1, 157–163, https://doi.org/10.1016/j.esr.2013.01.001, 2013.
Taylor, K. E., Stouffer, R. J., and Meehl, G. A.: An Overview of CMIP5 and the Experiment Design, B. Am. Meteorol. Soc., 93, 485–498, https://doi.org/10.1175/BAMS-D-11-00094.1, 2012.
The World in 2050 initiative (TWI): Transformations to Achieve the Sustainable Development Goals, IIASA, TWI2050, Laxenburg, Austria, 2018.
Ueckerdt, F., Pietzcker, R., Scholz, Y., Stetter, D., Giannousakis, A., and Luderer, G.: Decarbonizing global power supply under region-specific consideration of challenges and options of integrating variable renewables in the REMIND model, Energ. Econ., 64, 665–684, https://doi.org/10.1016/j.eneco.2016.05.012, 2017.
UNEP: The Emissions Gap Report 2019, UNEP, Nairobi, Kenya, 2019.
United Nations General Assembly: Transforming our World: The 2030 Agenda for Sustainable Development, UN, New York, NY, USA, 2015.
University of Delaware Air Temperature and Precipitation: NOAA Physical Sciences Laboratory, available at: https://psl.noaa.gov/data/gridded/data.UDel_AirT_Precip.html, last access: 8 December 2020.
van Beek, L., Hajer, M., Pelzer, P., van Vuuren, D., and Cassen, C.: Anticipating futures through models: the rise of Integrated Assessment Modelling in the climate science-policy interface since 1970, Global Environ. Chang., 65, 102191, https://doi.org/10.1016/j.gloenvcha.2020.102191, 2020.
Vandyck, T., Keramidas, K., Kitous, A., Spadaro, J. V., Van Dingenen, R., Holland, M., and Saveyn, B.: Air quality co-benefits for human health and agriculture counterbalance costs to meet Paris Agreement pledges, Nat. Commun., 9, 1–11, https://doi.org/10.1038/s41467-018-06885-9, 2018.
van Sluisveld, M. A. E., Harmsen, J. H. M., Bauer, N., McCollum, D. L., Riahi, K., Tavoni, M., Vuuren, D. P. van, Wilson, C., and Zwaan, B. van der: Comparing future patterns of energy system change in 2 ∘C scenarios with historically observed rates of change, Global Environ. Chang., 35, 436–449, https://doi.org/10.1016/j.gloenvcha.2015.09.019, 2015.
van Vuuren, D. P., Stehfest, E., Gernaat, D. E. H. J., Doelman, J. C., van den Berg, M., Harmsen, M., de Boer, H. S., Bouwman, L. F., Daioglou, V., Edelenbosch, O. Y., Girod, B., Kram, T., Lassaletta, L., Lucas, P. L., van Meijl, H., Müller, C., van Ruijven, B. J., van der Sluis, S., and Tabeau, A.: Energy, land-use and greenhouse gas emissions trajectories under a green growth paradigm, Global Environ. Chang., 42, 237–250, https://doi.org/10.1016/j.gloenvcha.2016.05.008, 2017.
van der Werf, G. R., Randerson, J. T., Giglio, L., Collatz, G. J., Mu, M., Kasibhatla, P. S., Morton, D. C., DeFries, R. S., Jin, Y., and van Leeuwen, T. T.: Global fire emissions and the contribution of deforestation, savanna, forest, agricultural, and peat fires (1997–2009), Atmos. Chem. Phys., 10, 11707–11735, https://doi.org/10.5194/acp-10-11707-2010, 2010.
Waisman, H.-D., Guivarch, C., and Lecocq, F.: The transportation sector and low-carbon growth pathways: modelling urban, infrastructure, and spatial determinants of mobility, Clim. Policy, 13, 106–129, https://doi.org/10.1080/14693062.2012.735916, 2013.
West, J. J., Smith, S. J., Silva, R. A., Naik, V., Zhang, Y., Adelman, Z., Fry, M. M., Anenberg, S., Horowitz, L. W., and Lamarque, J.-F.: Co-benefits of mitigating global greenhouse gas emissions for future air quality and human health, Nat. Clim. Change, 3, 885–889, https://doi.org/10.1038/nclimate2009, 2013.
WGBU: Welt im Wandel: Energiewende zur Nachhaltigkeit (WB der B globale Umweltveränderung), available at: https://www.wbgu.de/de/publikationen/publikation/welt-im-wandel-energiewende-zur-nachhaltigkeit (last access: 27 October 2021), 2003.
Wilson, C., Grubler, A., Bauer, N., Krey, V., and Riahi, K.: Future capacity growth of energy technologies: are scenarios consistent with historical evidence?, Climatic Change, 118, 381–395, https://doi.org/10.1007/s10584-012-0618-y, 2013.
World Bank: World Development Report 2012: Gender Equality and Development, World Bank, available at: https://openknowledge.worldbank.org/handle/10986/4391 (last access: 27 October 2021), 2012.
- Abstract
- Introduction
- Code structure and general modelling philosophy
- System representation
- Outputs
- Conclusions
- Appendix A: Comparison with historical data
- Appendix B: Spatial resolution
- Appendix C: Modules of REMIND 2.1
- Code and data availability
- Author contributions
- Competing interests
- Disclaimer
- Acknowledgements
- Financial support
- Review statement
- References
Can the world keep global warming below 2 °C?and, if so,
Under what socio-economic conditions and applying what technological options?, it is the goal of REMIND to explore consistent transformation pathways.
- Abstract
- Introduction
- Code structure and general modelling philosophy
- System representation
- Outputs
- Conclusions
- Appendix A: Comparison with historical data
- Appendix B: Spatial resolution
- Appendix C: Modules of REMIND 2.1
- Code and data availability
- Author contributions
- Competing interests
- Disclaimer
- Acknowledgements
- Financial support
- Review statement
- References