the Creative Commons Attribution 4.0 License.
the Creative Commons Attribution 4.0 License.
 | 22 Sep 2020
Stoichiometrically coupled carbon and nitrogen cycling in the MIcrobial-MIneral Carbon Stabilization model version 1.0 (MIMICS-CN v1.0)
Emily Kyker-Snowman
William R. Wieder
Serita D. Frey
A. Stuart Grandy
Explicit consideration of microbial physiology in soil biogeochemical models that represent coupled carbon–nitrogen dynamics presents opportunities to deepen understanding of ecosystem responses to environmental change. The MIcrobial-MIneral Carbon Stabilization (MIMICS) model explicitly represents microbial physiology and physicochemical stabilization of soil carbon (C) on regional and global scales. Here we present a new version of MIMICS with coupled C and nitrogen (N) cycling through litter, microbial, and soil organic matter (SOM) pools. The model was parameterized and validated against C and N data from the Long-Term Inter-site Decomposition Experiment Team (LIDET; six litter types, 10 years of observations, and 13 sites across North America). The model simulates C and N losses from litterbags in the LIDET study with reasonable accuracy (C: R2=0.63; N: R2=0.29), which is comparable with simulations from the DAYCENT model that implicitly represents microbial activity (C: R2=0.67; N: R2=0.30). Subsequently, we evaluated equilibrium values of stocks (total soil C and N, microbial biomass C and N, inorganic N) and microbial process rates (soil heterotrophic respiration, N mineralization) simulated by MIMICS-CN across the 13 simulated LIDET sites against published observations from other continent-wide datasets. We found that MIMICS-CN produces equilibrium values in line with measured values, showing that the model generates plausible estimates of ecosystem soil biogeochemical dynamics across continental-scale gradients. MIMICS-CN provides a platform for coupling C and N projections in a microbially explicit model, but experiments still need to identify the physiological and stoichiometric characteristics of soil microbes, especially under environmental change scenarios.
- Article
(3156 KB) - Full-text XML
-
Supplement
(126 KB) - BibTeX
- EndNote


Soils contain the largest actively cycling terrestrial carbon (C) stocks on earth and also serve as the dominant source of nutrients, like nitrogen (N), that are critical for maintaining ecosystem productivity (Gruber and Galloway, 2008; Jobbágy and Jackson, 2000). Soil C cycle projections and their response to global change factors remain highly uncertain (Bradford et al., 2016; Todd-Brown et al., 2013), but recent empirical insights into microbial processing of soil C provide opportunities to update models and reduce this uncertainty (Cotrufo et al., 2013; Kallenbach et al., 2016; Lehmann and Kleber, 2015; Schmidt et al., 2011; Six et al., 2006). Several models have been developed recently with explicit representation of nonlinear microbial C processing dynamics, including the MIcrobial-MIneral Carbon Stabilization (MIMICS) model (Sulman et al., 2018; Wieder et al., 2014, 2015b) and others (Abramoff et al., 2017; Allison, 2014; Fatichi et al., 2019; Hararuk et al., 2015; Robertson et al., 2019; Sulman et al., 2014; Wang et al., 2013, 2014a, 2017). While these models serve different purposes, some can be as good as or better than models without explicit microbial pools at simulating global soil C stocks and the response of soil C to environmental perturbations (Wieder et al., 2013, 2015b), and they also predict very different long-term responses of soil C to global change (Wieder et al., 2013, 2018). Microbially explicit models have thus furthered our understanding of C cycling in the terrestrial system, but they also provide new opportunities to explore couplings between C and nutrient cycles, especially N.
Terrestrial models that couple C and N cycles reveal important ecosystem feedbacks that are absent from C-only models. For example, across ecosystems, experimental manipulations consistently indicate that N availability limits plant productivity (LeBauer and Treseder, 2008). C-only model configurations in models typically predict that CO2 fertilization will result in a large increase in both plant productivity and the land C sink in coming decades, but nutrient limitation may constrain the magnitude of this terrestrial ecosystem C uptake (Wieder et al., 2015a; Zaehle et al., 2015; Zaehle and Dalmonech, 2011). As terrestrial models increasingly represent coupled C–N biogeochemistry, accurate model estimates of N release from soil organic matter (SOM) will become important to reducing uncertainty in the CO2 fertilization response of the terrestrial C cycle.
Currently, most biogeochemical models that couple C and N cycles have an implicit representation of microbial activity. These conventional models represent SOM decomposition with the assumption that chemical recalcitrance of organic matter dictates the turnover of litter and SOM pools (Luo et al., 2016). Carbon and N fluxes represented in these models are directly proportional to donor pool sizes, without any explicit representation of the microbes that mediate these fluxes (Schimel, 2001, 2013). Linear decay constants and transfer coefficients determine the flow of C and N through a decomposition cascade, and rates of N immobilization and mineralization emerge from the interaction of fixed respiration fractions and the stoichiometry of donor and receiver SOM pools. The lack of plant–microbe–soil feedbacks in these models may limit their predictive capacity, especially in the face of environmental change. For example, in these models increased plant inputs to soil only build soil C and N stocks, and plants have no way to stimulate the microbial community to mine existing SOM for N without model modifications (Guenet et al., 2016; Wutzler and Reichstein, 2013). This “N mining” or “priming” effect, where increased plant inputs result in increased microbial activity and decomposition rates, has been demonstrated in experimental studies (Cheng and Kuzyakov, 2005; Dijkstra et al., 2013; Phillips et al., 2012) and may be a critical pathway for plants to obtain more N and support increased plant productivity under elevated CO2 (Thomas et al., 2015; Zaehle et al., 2014).
Microbes are critical mediators of soil C–N couplings and the release of plant-available N. As such, models that explicitly consider microbial activity provide an opportunity to explore potential microbial control over soil C–N biogeochemical cycling and improve simulations of patterns in ecosystem C and N. Towards this end, multiple models have been introduced that explicitly consider the role of microbial activity in ecosystem C–N interactions (Averill and Waring, 2017; Fatichi et al., 2019; Huang et al., 2018; Schimel and Weintraub, 2003; Sistla et al., 2014; Sulman et al., 2014, 2017, 2018, 2019; Wang et al., 2014a, 2017, 2013). To date, the majority of these microbially explicit C–N models have been developed to explore soil biogeochemical interactions and microbial community dynamics, while only one has been validated for N dynamics across a continental-scale gradient (Fatichi et al., 2019).
Although there is great value in exploring diverse approaches to explicitly representing microbes in purely theoretical or site-specific applications, implementing these conceptual developments within larger-scale models requires convincing evidence that adding them improves model performance against large-scale data. Recent soil model comparisons report divergent responses to simulated global change experiments among microbially explicit model formulations, highlighting the large uncertainty in their underlying process-level representation and parameterization (Sulman et al., 2018; Wieder et al., 2018). The addition of explicit microbial pools may improve the predictive ability of landscape-scale models in the long run, but microbial models must be validated against landscape-scale datasets of a variety of pools and process rates before they can reasonably be expected to improve model performance and reduce uncertainty.
We developed a coupled C–N version of MIMICS (MIMICS-CN) to fill the need at the intersection of microbially explicit models, coupled C–N models, models that work well enough to be considered for use in ESMs, and models that can be validated against currently available large-scale data. The C-only iteration of MIMICS considers tradeoffs involved with microbial functional traits as well as both physicochemical (i.e., mineral associations) and chemical (i.e., recalcitrance) mechanisms of C stabilization in soil. Wieder et al. (2014, 2015b) and Sulman et al. (2018) evaluated this C-only version of MIMICS across site, continental, and global scales. Here we expand on this work, introducing MIMICS-CN, which incorporates stoichiometrically coupled C and N cycling of all microbial, litter, and SOM pools and stoichiometric constraints on microbial growth. Our core objectives were to (1) formulate a framework and parameterization for coupled C and N cycling in MIMICS; (2) validate MIMICS-CN against a continental-scale litter decomposition dataset (LIDET) and compare MIMICS-CN to a microbially-implicit, linear model (DAYCENT); and (3) evaluate equilibrium soil and microbial stocks and fluxes (and their parameter sensitivities) that are simulated by MIMICS-CN with data synthesized across published landscape-scale data. Our overarching goal was to create a microbially explicit coupled C–N model of soil that balances ecological realism with the practical considerations of large-scale simulation and to demonstrate the abilities of this model through parameterization, validation, and evaluation exercises using both dynamic and equilibrium data.
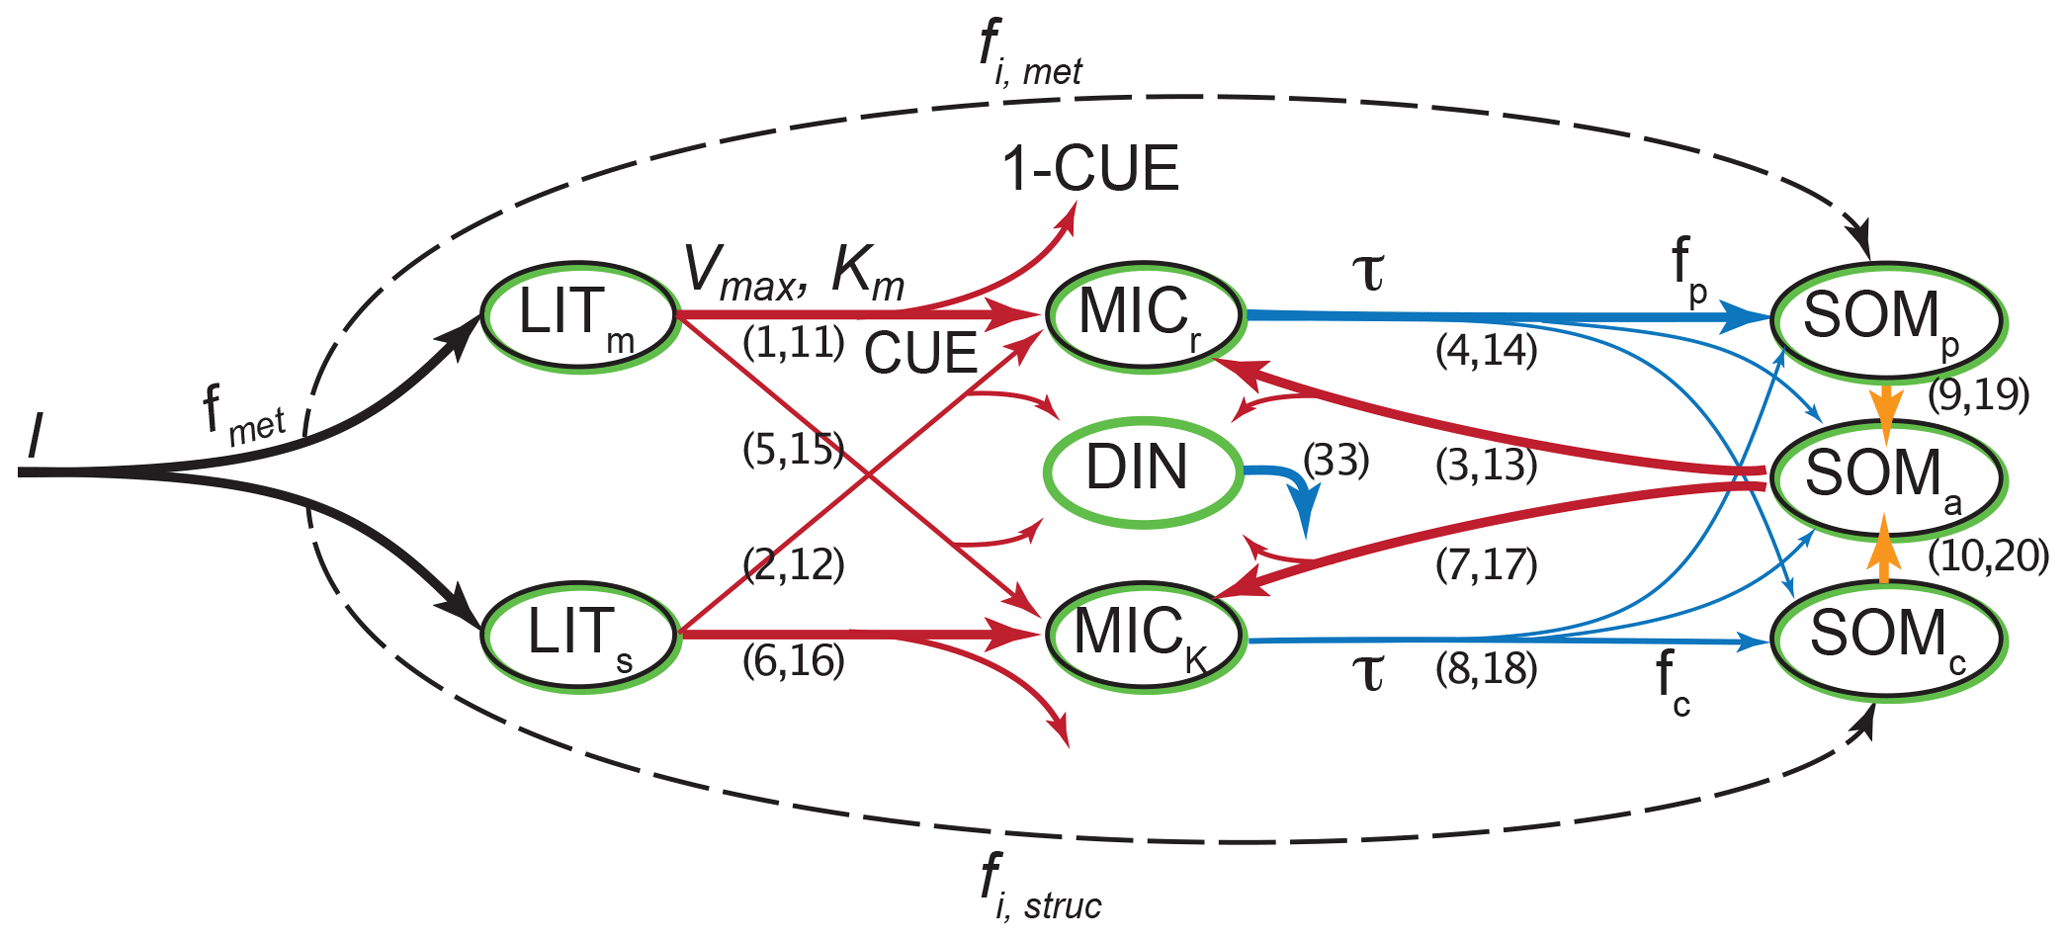
Figure 1Overview of the pools and fluxes of C and N in MIMICS-CN. Black outlines indicate pools that contain C; green outlines indicate pools that contain N. Litter inputs (I) are determined based on site-specific net primary productivity and partitioned between metabolic and structural litter pools (LITm and LITs) using a site-specific litter quality metric (fmet) calculated using litter lignin and N content. Temperature-sensitive forward Michaelis–Menten kinetics (Vmax and Km; red lines) determine the flux of litter pool C and N and available SOM C and N (SOMa) into microbial biomass (MICr and MICK). Fluxes of C into microbial pools result in respiration losses according to a defined carbon use efficiency (CUE). Microbes maintain biomass stoichiometry by spilling excess C as overflow respiration or excess N into the dissolved inorganic nitrogen pool (DIN) based on a prescribed biomass C : N. Microbial biomass turnover (τ, blue) varies by functional type (MICr and MICK) and is proportional to the square of microbial biomass. Microbial biomass turns over into available (SOMa), physicochemically stabilized (SOMp), and chemically stabilized (SOMc) soil organic matter pools. Inorganic N (DIN) leaks from the model at a first-order rate. Numbers in parentheses indicate the equations in Appendix A that correspond to each depicted flux. Parameter values, units, and descriptions are given in Table 1.
2.1 Model formulation
MIMICS-CN builds upon the previous C-only version of MIMICS, described in Wieder et al. (2014, 2015b), using the same pool structure for N as for C plus an additional pool for dissolved inorganic nitrogen (DIN; Fig. 1). In-depth discussion of the reasoning behind the development of the C-only version of the model is available in these previous publications, but the general intent behind the development of MIMICS was to incorporate a simplified representation of the important aspects of microbial communities (biomass-dependent control of process rates, diversity in life history strategies, and physiological parameters) into a soil model that stabilizes organic matter through both physical (mineral-associated, protected from microbial decomposition) and chemical (recalcitrance-based, vulnerable to microbial decomposition) means. The C-only version of the model represents C flows through seven pools (Fig. 1): two litter pools, two microbial pools, and three SOM pools. Litter inputs to the model are partitioned into structural litter (LITs) and metabolic litter (LITm) pools based on estimates of litter quality for different biomes (Brovkin et al., 2012).
Temperature-sensitive forward Michaelis–Menten kinetics determine the flux of litter and SOM through microbial biomass pools that determine rates of organic matter decomposition, SOM formation, soil respiration, and nitrogen mineralization fluxes. The microbial functional groups are intended to broadly capture tradeoffs in microbial growth rates and growth efficiency, with rapidly growing microbial decomposers – low efficiency, r strategist (MICr) – and slower-growing microbial decomposers – higher efficiency, K strategist (MICK; Wieder et al., 2015b). In MIMICS-CN we extend these microbial physiological traits to include microbial stoichiometry and assume that the higher metabolic capacity of MICr also requires more nitrogen and, thus a lower microbial biomass C : N ratio. Fluxes of C into microbial pools result in respiration losses according to a defined carbon use efficiency (CUE) that varies by microbial functional group and substrate quality (e.g., structural or metabolic litter). Microbial pool sizes are moderated by inputs, CUE, and biomass-specific turnover rates. We implemented density-dependent microbial turnover (sensu Georgiou et al., 2017; see Appendix A) for this iteration of the model to make microbial pools behave realistically in response to small changes in C inputs (Wang et al., 2014b, 2016). The density-dependent turnover of microbial biomass dampens the oscillatory response of microbial biomass to perturbations.
Microbial biomass turns over into physicochemically stabilized (SOMp), chemically stabilized (SOMc), and a pool that is “available” for microbial decomposition (SOMa). We consider the SOMp pool to mostly consist of low C : N organic matter that is primarily composed of microbial products that are adsorbed onto mineral surfaces (e.g., mineral-associated organic matter, MAOM; Grandy and Neff, 2008). By contrast, the low-quality SOMc pool consists of decomposed or partially decomposed litter that has more structural C compounds, such as lignin, and a higher C : N ratio (e.g., particulate organic matter, POM). Finally, SOMa is the only SOM pool that is available for microbial decomposition; it contains a mixture of fresh microbial residues, products that are desorbed from the SOMp pool (e.g., Jilling et al., 2018), as well as depolymerized organic matter from the SOMc pool. We do not specifically consider soil aggregates, but we recognize that in some soils they are an important component of accruing and maintaining persistent organic matter.
The current representation of N cycling in MIMICS-CN is based on the threshold element ratio idea described in Sinsabaugh et al. (2009) and Mooshammer et al. (2014) whereby organisms maintain biomass stoichiometry by spilling excess C or N on either side of a threshold ratio. We modified the C-only iteration of MIMICS to include N by adding a parallel set of pools and fluxes for N, as well as a pool for inorganic N (Fig. 1). The C cycle drives decomposition with fluxes from litter and SOM pools to microbes based on biomass-C-based forward Michaelis–Menten kinetics. Parallel N fluxes are determined by the C : N ratio of the donor pools, which is a fixed parameter for the metabolic litter pool, varies with litter input chemistry for the structural litter pool, and depends on inputs for SOM pools. We use a fixed C : N of 15 for metabolic litter inputs, while the C : N of structural litter was allowed to vary to ensure conservation of total N inputs from litterfall (Table 1).
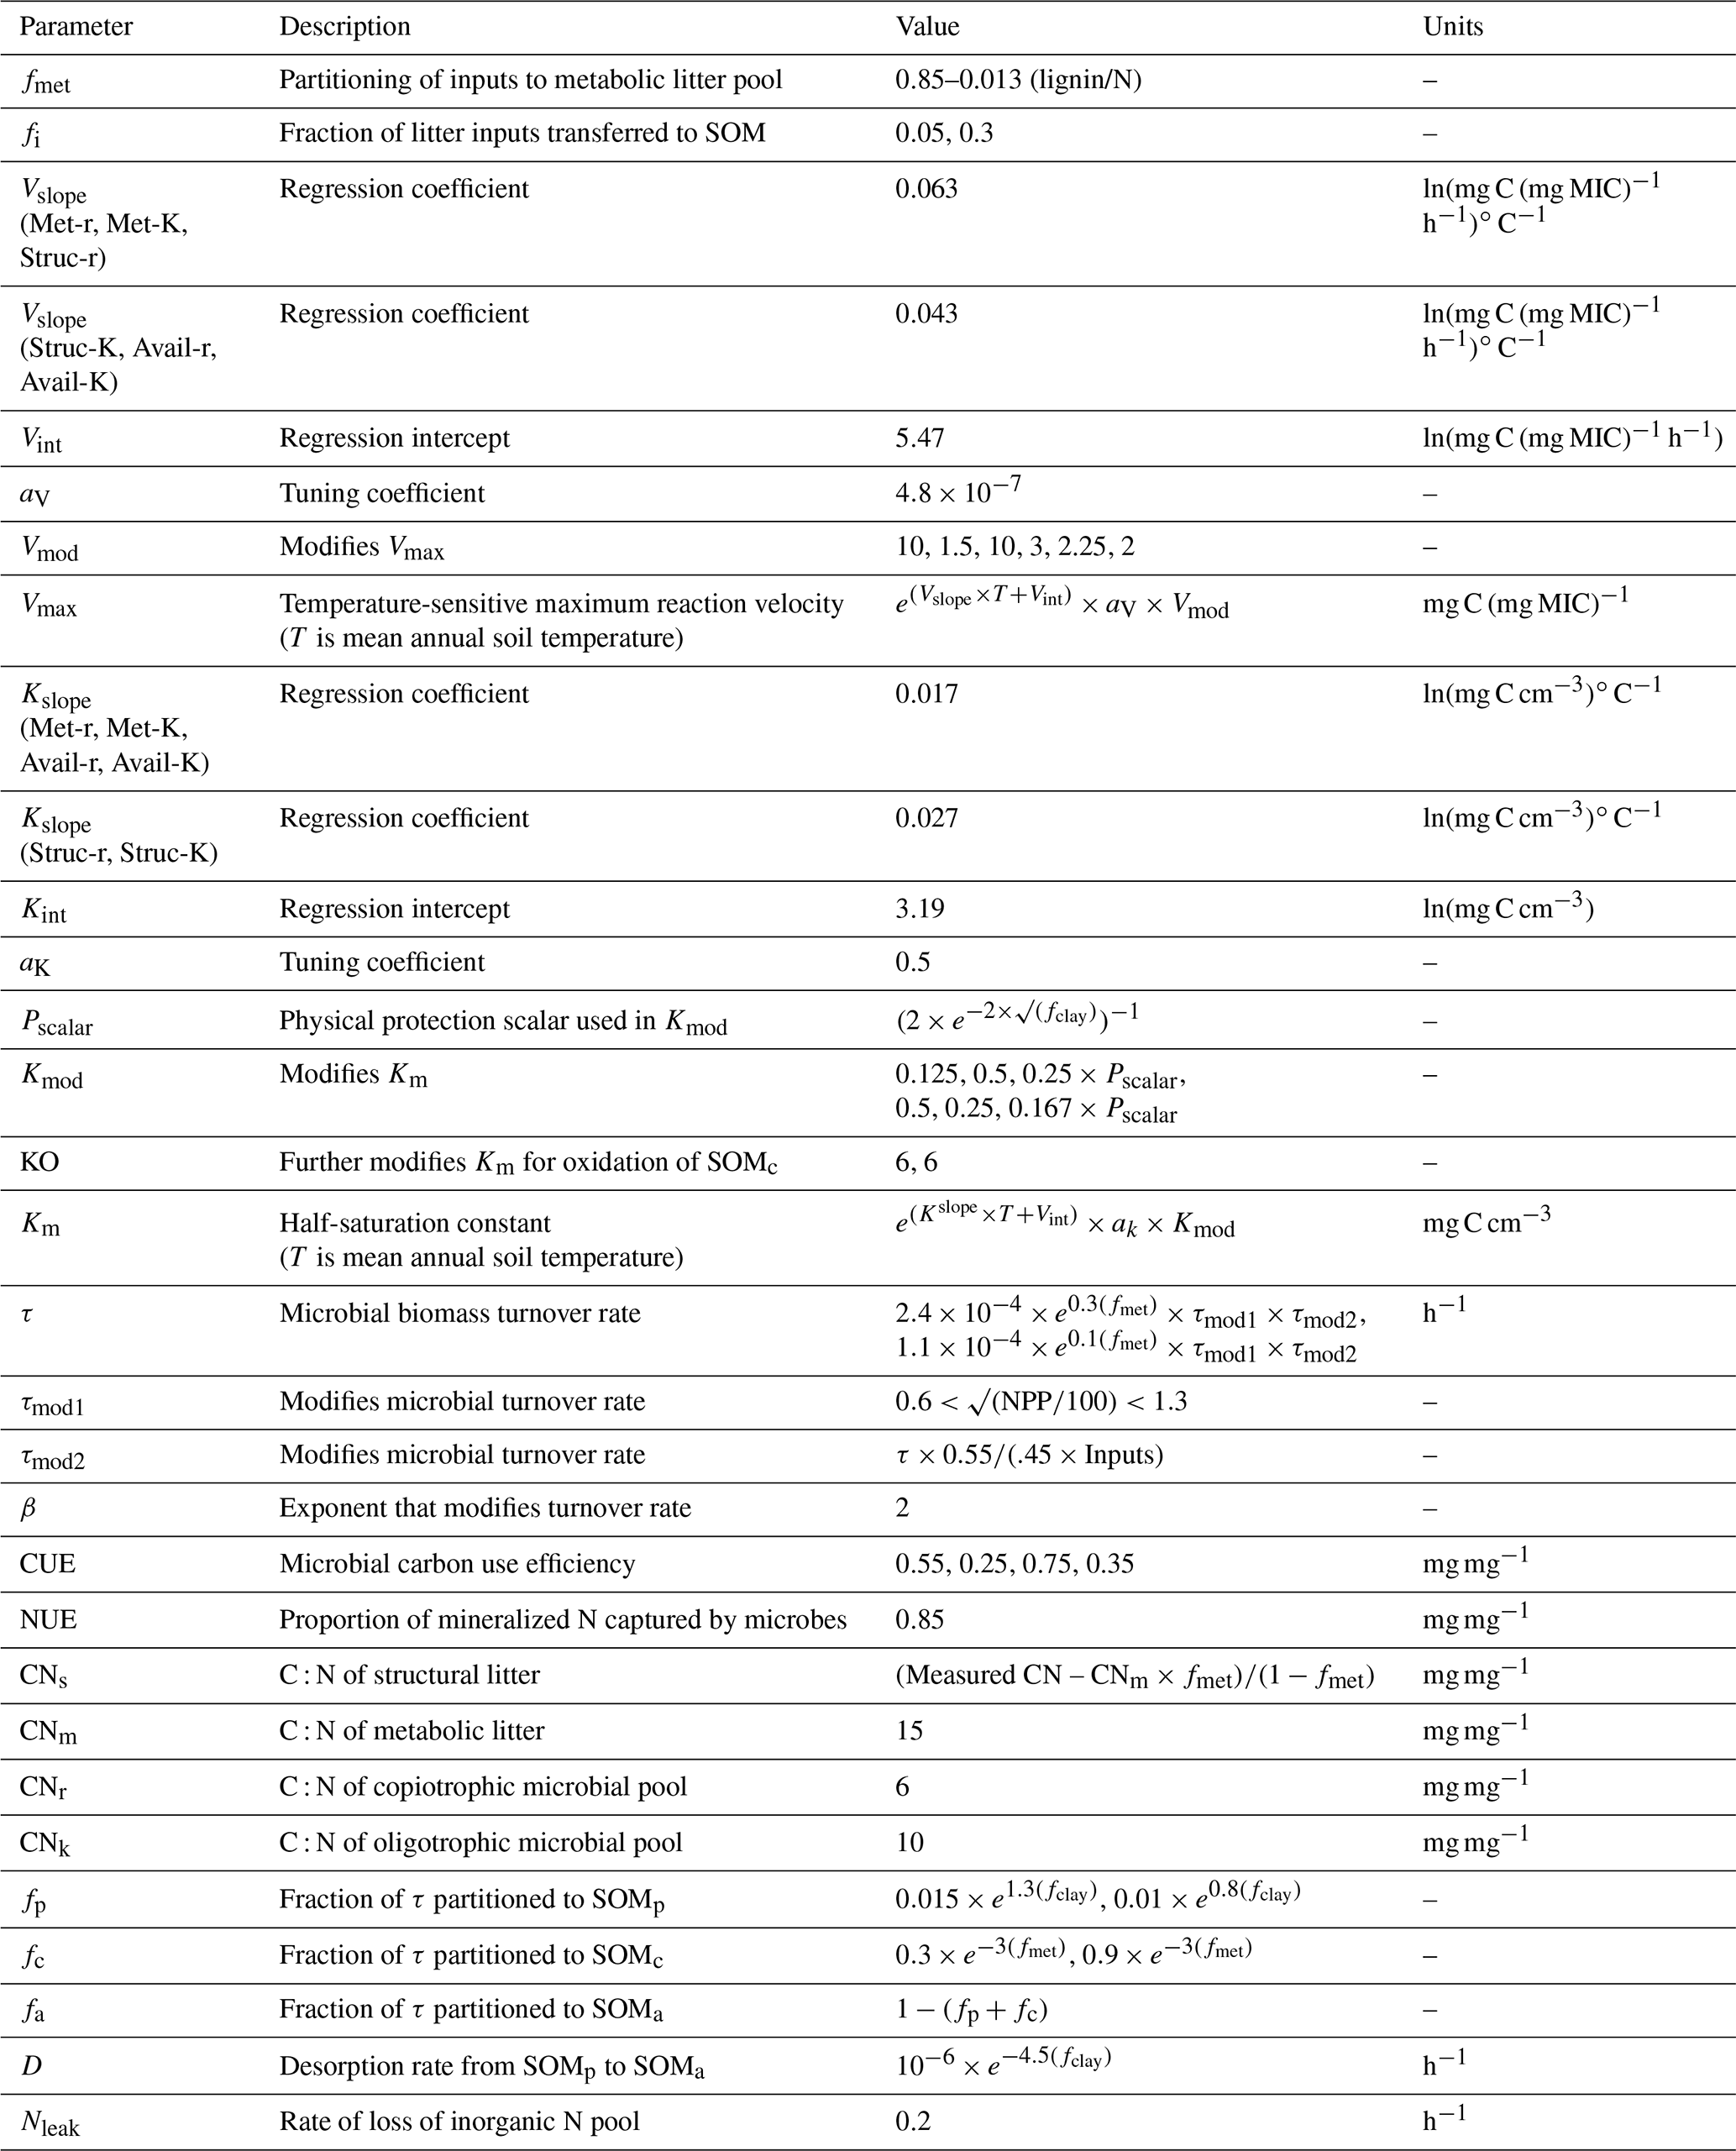
Table 1Parameters used in MIMICS-CN for both LIDET and equilibrium simulations.
The coupling between C and N cycles in MIMICS-CN occurs in the microbial biomass: at each hourly time step, the total C and N in incoming fluxes available to microbes is summed and adjusted based on the C use efficiency (CUE; varies with microbial functional group and substrate) and N use efficiency (NUE; set to 0.85 for all fluxes entering microbial biomass pools in this model iteration). If the C : N of substrates being assimilated by microbial functional groups is greater or less than the C : N of the microbial biomass (defined as 6 and 10 for r and K strategists, respectively; Table 1), the microbes will spill excess C or N to maintain their biomass stoichiometry through overflow respiration or excess N mineralization. In MIMICS-CN the C : N ratio of SOM pools is flexible and determined by the inputs from microbial residues and direct inputs from litterfall fluxes (fi; Fig. 1). All N fluxes into microbial pools leak a small quantity of N into a dissolved inorganic N pool (DIN) based on the model-defined NUE. At each time step, each microbial functional group can access a fraction of the inorganic N pool proportional to their fraction of total microbial biomass. Plant N uptake and ecosystem losses (both hydraulic and gaseous) of inorganic N are handled implicitly at this stage, with a fixed fraction (20 %) of DIN leaving the soil component model every time step.
2.2 Model parameterization and validation: cross-site litter decomposition
We parameterized and validated MIMICS-CN using C and N dynamics observed across multiple sites participating in the 10-year Long-Term Intersite Decomposition Experiment Team (LIDET) experiment (Adair et al., 2008; Harmon et al., 2009; Parton et al., 2007). The LIDET study selected standardized plant litter types with a range of litter quality (lignin and N concentration), placed litterbags containing 100 g of each litter type at sites across a continental-scale gradient of climatic conditions, and measured changes in the C and N in litterbags on an approximately annual basis for 10 years. Although the original dataset included 27 sites across North America, we utilized data from 14 sites ranging from Alaska to Puerto Rico based on the data available at those sites to drive MIMICS (see Wieder et al., 2015b, for site information). We focus our analysis on six leaf litters that were simulated across all sites that have been used previously to evaluate litter decomposition dynamics in terrestrial models (Bonan et al., 2013; Parton et al., 2007; Wieder et al., 2015b). Root litter types included in the original LIDET experiment were not included. The LIDET dataset is a robust appraisal of the impacts of climate and litter chemistry on litter decomposition and has been used as a dataset for comparing models of soil and litter decomposition in the past (Bonan et al., 2013). MIMICS has been used previously to simulate C losses in the LIDET study (Wieder et al., 2014, 2015b).
We parameterized MIMICS-CN using observations from Harvard Forest in Petersham, MA, USA. Observations included both litterbag C loss and N data from the LIDET study as well as measurements of soil C and N stocks and microbial C and N from other studies at Harvard Forest (Colman and Schimel, 2013). Multiple combinations of parameters produced equally good fits to litter decomposition data; thus ancillary data on soil and microbial C stocks were used to inform the parameter values presented here (Table 1). These ancillary data were not reported in LIDET and were not measured on identical plots to those used for the LIDET study (Harvard Forest encompasses multiple experiments and ecotypes), but these general targets were useful in distinguishing among model parameterizations. Our general targets for stocks at Harvard Forest included soil C and N (0–5 cm mineral soils, coniferous stand): 61 mg C cm−3 and 2.9 mg N cm−3; soil C : N of 21; and microbial biomass: 0.61 mg C cm−3 (estimated as 1 % of soil C based on Xu et al., 2013).
After parameterizing the model to match observations at Harvard Forest, the model was validated using data from the remaining LIDET sites. To represent litterbags in MIMICS-CN, we first spun up the underlying model to simulate steady-state soil C and N pools and fluxes across sites in the LIDET study using site-level measurements of mean annual temperature, clay content, and litter input quantity and litter chemistry (Wieder et al., 2015b). Then, we added a pulse of metabolic and structural litter based on the type of litter in the simulated litterbag. We tracked the C and N across all model pools for 10 years and calculated the C and N in litterbags as the difference between total model C and N in the simulations and total model C and N at steady state. In both the simulated and real litterbags, microbes immobilized N from the soil DIN pool, resulting in litterbag N contents for some time points in excess of the initial values. For each site, the model was sampled at time points equivalent to the real data collection dates in LIDET (approximately annually). Observed and modeled values of C and N in litterbags were compared by calculating R2, root mean square error (RMSE), and bias.
To contextualize our results and better understand how our model functions compared to a widely used microbial-implicit model, we compared MIMICS-CN simulations of LIDET data against DAYCENT (Bonan et al., 2013) simulations of the same data. Bonan et al. (2013) used the full complement of 27 LIDET sites in their analysis, but here we subset those results for the 13 sites used in the MIMICS-CN validation. We calculated R2, RMSE, and bias in the same way for each model and compared results across models, grouping results by biome.
2.3 Model evaluation: equilibrium C and N cycling
Building on the LIDET simulations, we independently synthesized observations to evaluate the patterns of C and N pools and fluxes across a variety of sites. Although direct, site-specific comparisons of modeled and observed values like microbial biomass would have been ideal, MIMICS-CN represents many variables that were not measured in the LIDET study and have not been synthesized across these Long-Term Ecological Research sites. Instead, we compared the range and distribution of pools (soil organic C and N, microbial biomass C and N, and total inorganic N) and fluxes (heterotrophic respiration and N mineralization) using the modeled LIDET simulations and published syntheses of observations from other sites (Cleveland and Liptzin, 2007; Colman and Schimel, 2013; Xu et al., 2013; Zak et al., 1994). To more directly compare measurements with model results, stock measurements were converted to units of percent of soil mass, and fluxes (heterotrophic respiration and net N mineralization rates) were converted to units of micrograms per cubic centimeter per hour (µg cm−3 h−1). MIMICS reports pool values in units of grams per square centimeter (g cm−2) (0–30 cm); to compare MIMICS against observations we converted MIMICS values to percent by mass assuming a bulk density of 1.5 g cm−2. Soil depth simulated by MIMICS (30 cm) is deeper than most of the observations in the compiled dataset, but the purpose of this exercise was to evaluate whether MIMICS produces realistic values for soil biogeochemical stocks and fluxes across continental-scale ecoclimatological and edaphic gradients, rather than making a direct site-specific comparison. The distribution of values produced by MIMICS across the LIDET sites was superimposed on the distributions of observed values to illustrate data–model agreement and to visualize the median and range of measurements across studies.
Finally, we documented relationships between model input variables (mean annual temperature, productivity, clay content, and litter quality) and the distribution of SOM pools that were simulated at the LIDET sites. Our aim with these analyses was to illustrate the underlying assumptions in the model and how they influence the size and distribution of C across SOM pools. Specifically, we wanted to explore how assumptions made in the model structure and parameterization of MIMICS determine the quantity and distribution of SOM pools and how they change among sites with variation in climatic, biological, and edaphic properties. To do this we looked at the absolute and relative contributions of each SOM pool simulated by MIMICS across the LIDET sites and conducted linear regressions to determine how environmental factors control their distributions. We also conducted linear regressions between soil C : N and both litter chemistry and environmental factors to assess the drivers of soil C : N in the model.
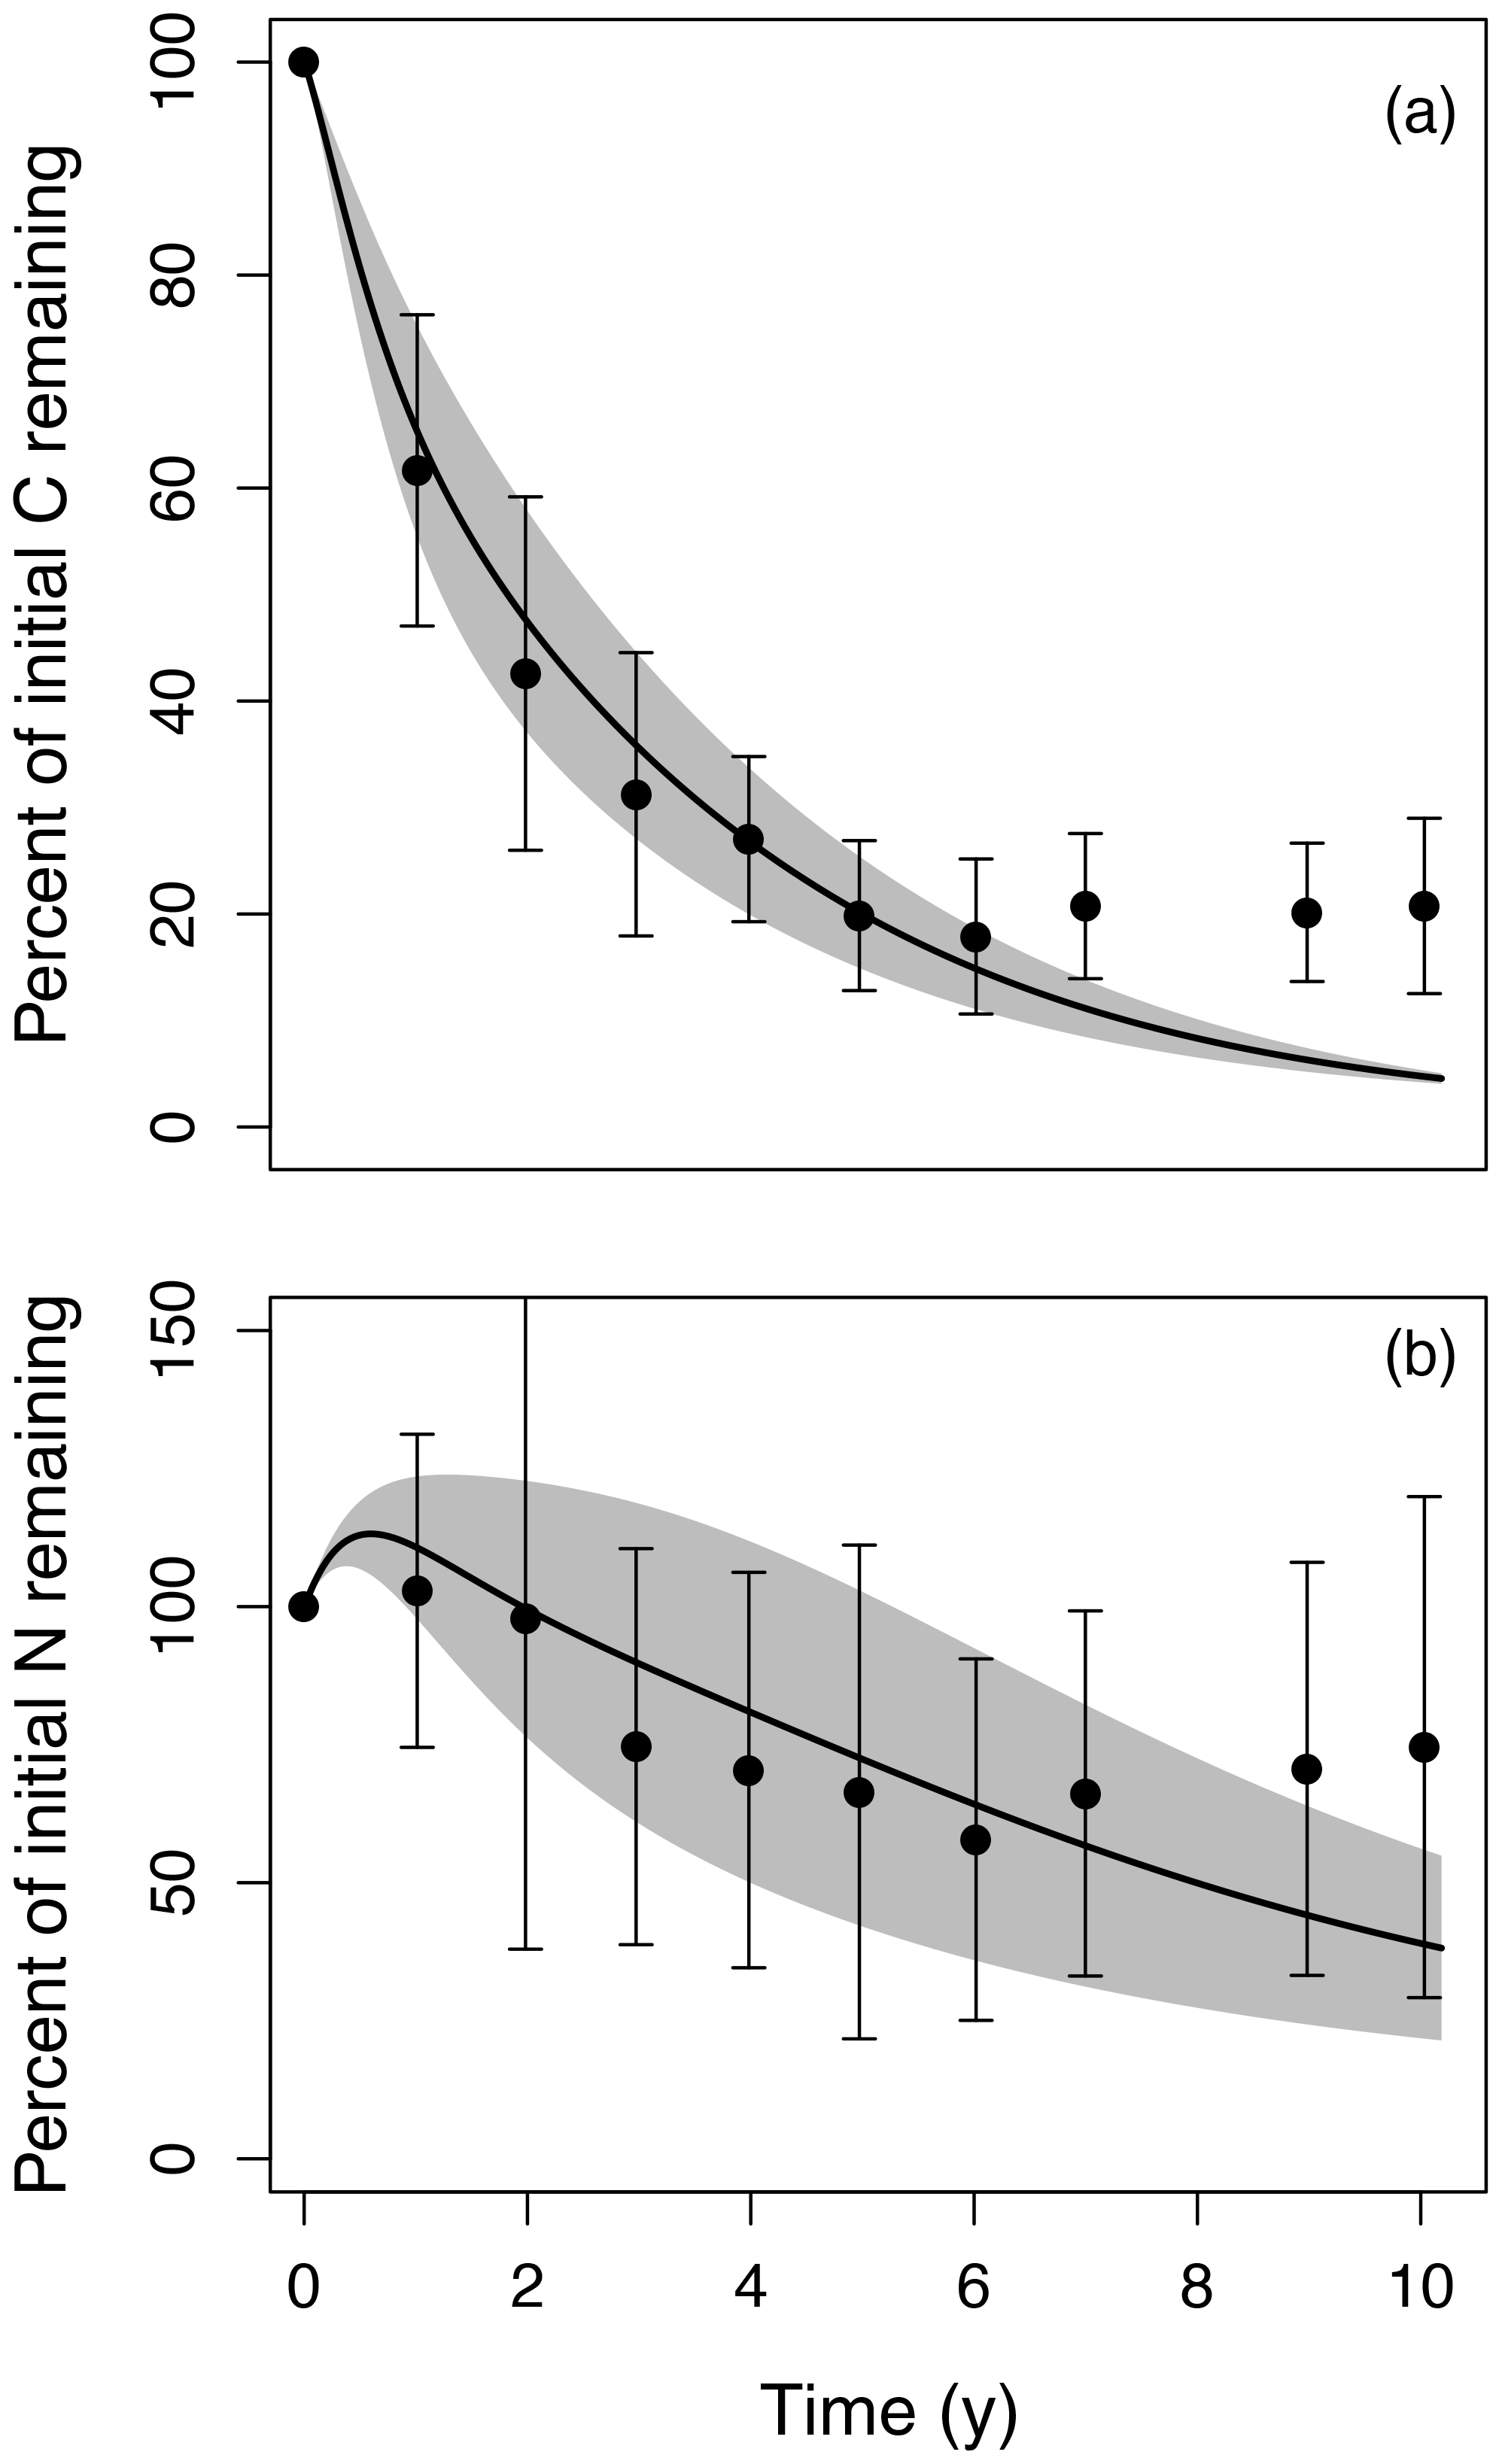
Figure 2Litter decomposition time series simulated by MIMICS-CN (lines with shaded area) compared to observations (points and error bars) of (a) percent mass remaining and (b) percent of initial N remaining over 10 years for six different litter types at the Harvard Forest LTER. Litter decomposition data came from the LIDET study (Parton et al., 2007; Bonan et al., 2013; mean ±1 SD). Spread in the observations and model is largely generated by the effects of initial litter quality on decomposition rates and N dynamics. Model parameters were calibrated to fit MIMICS-CN to observations from Harvard Forest (Table 1).
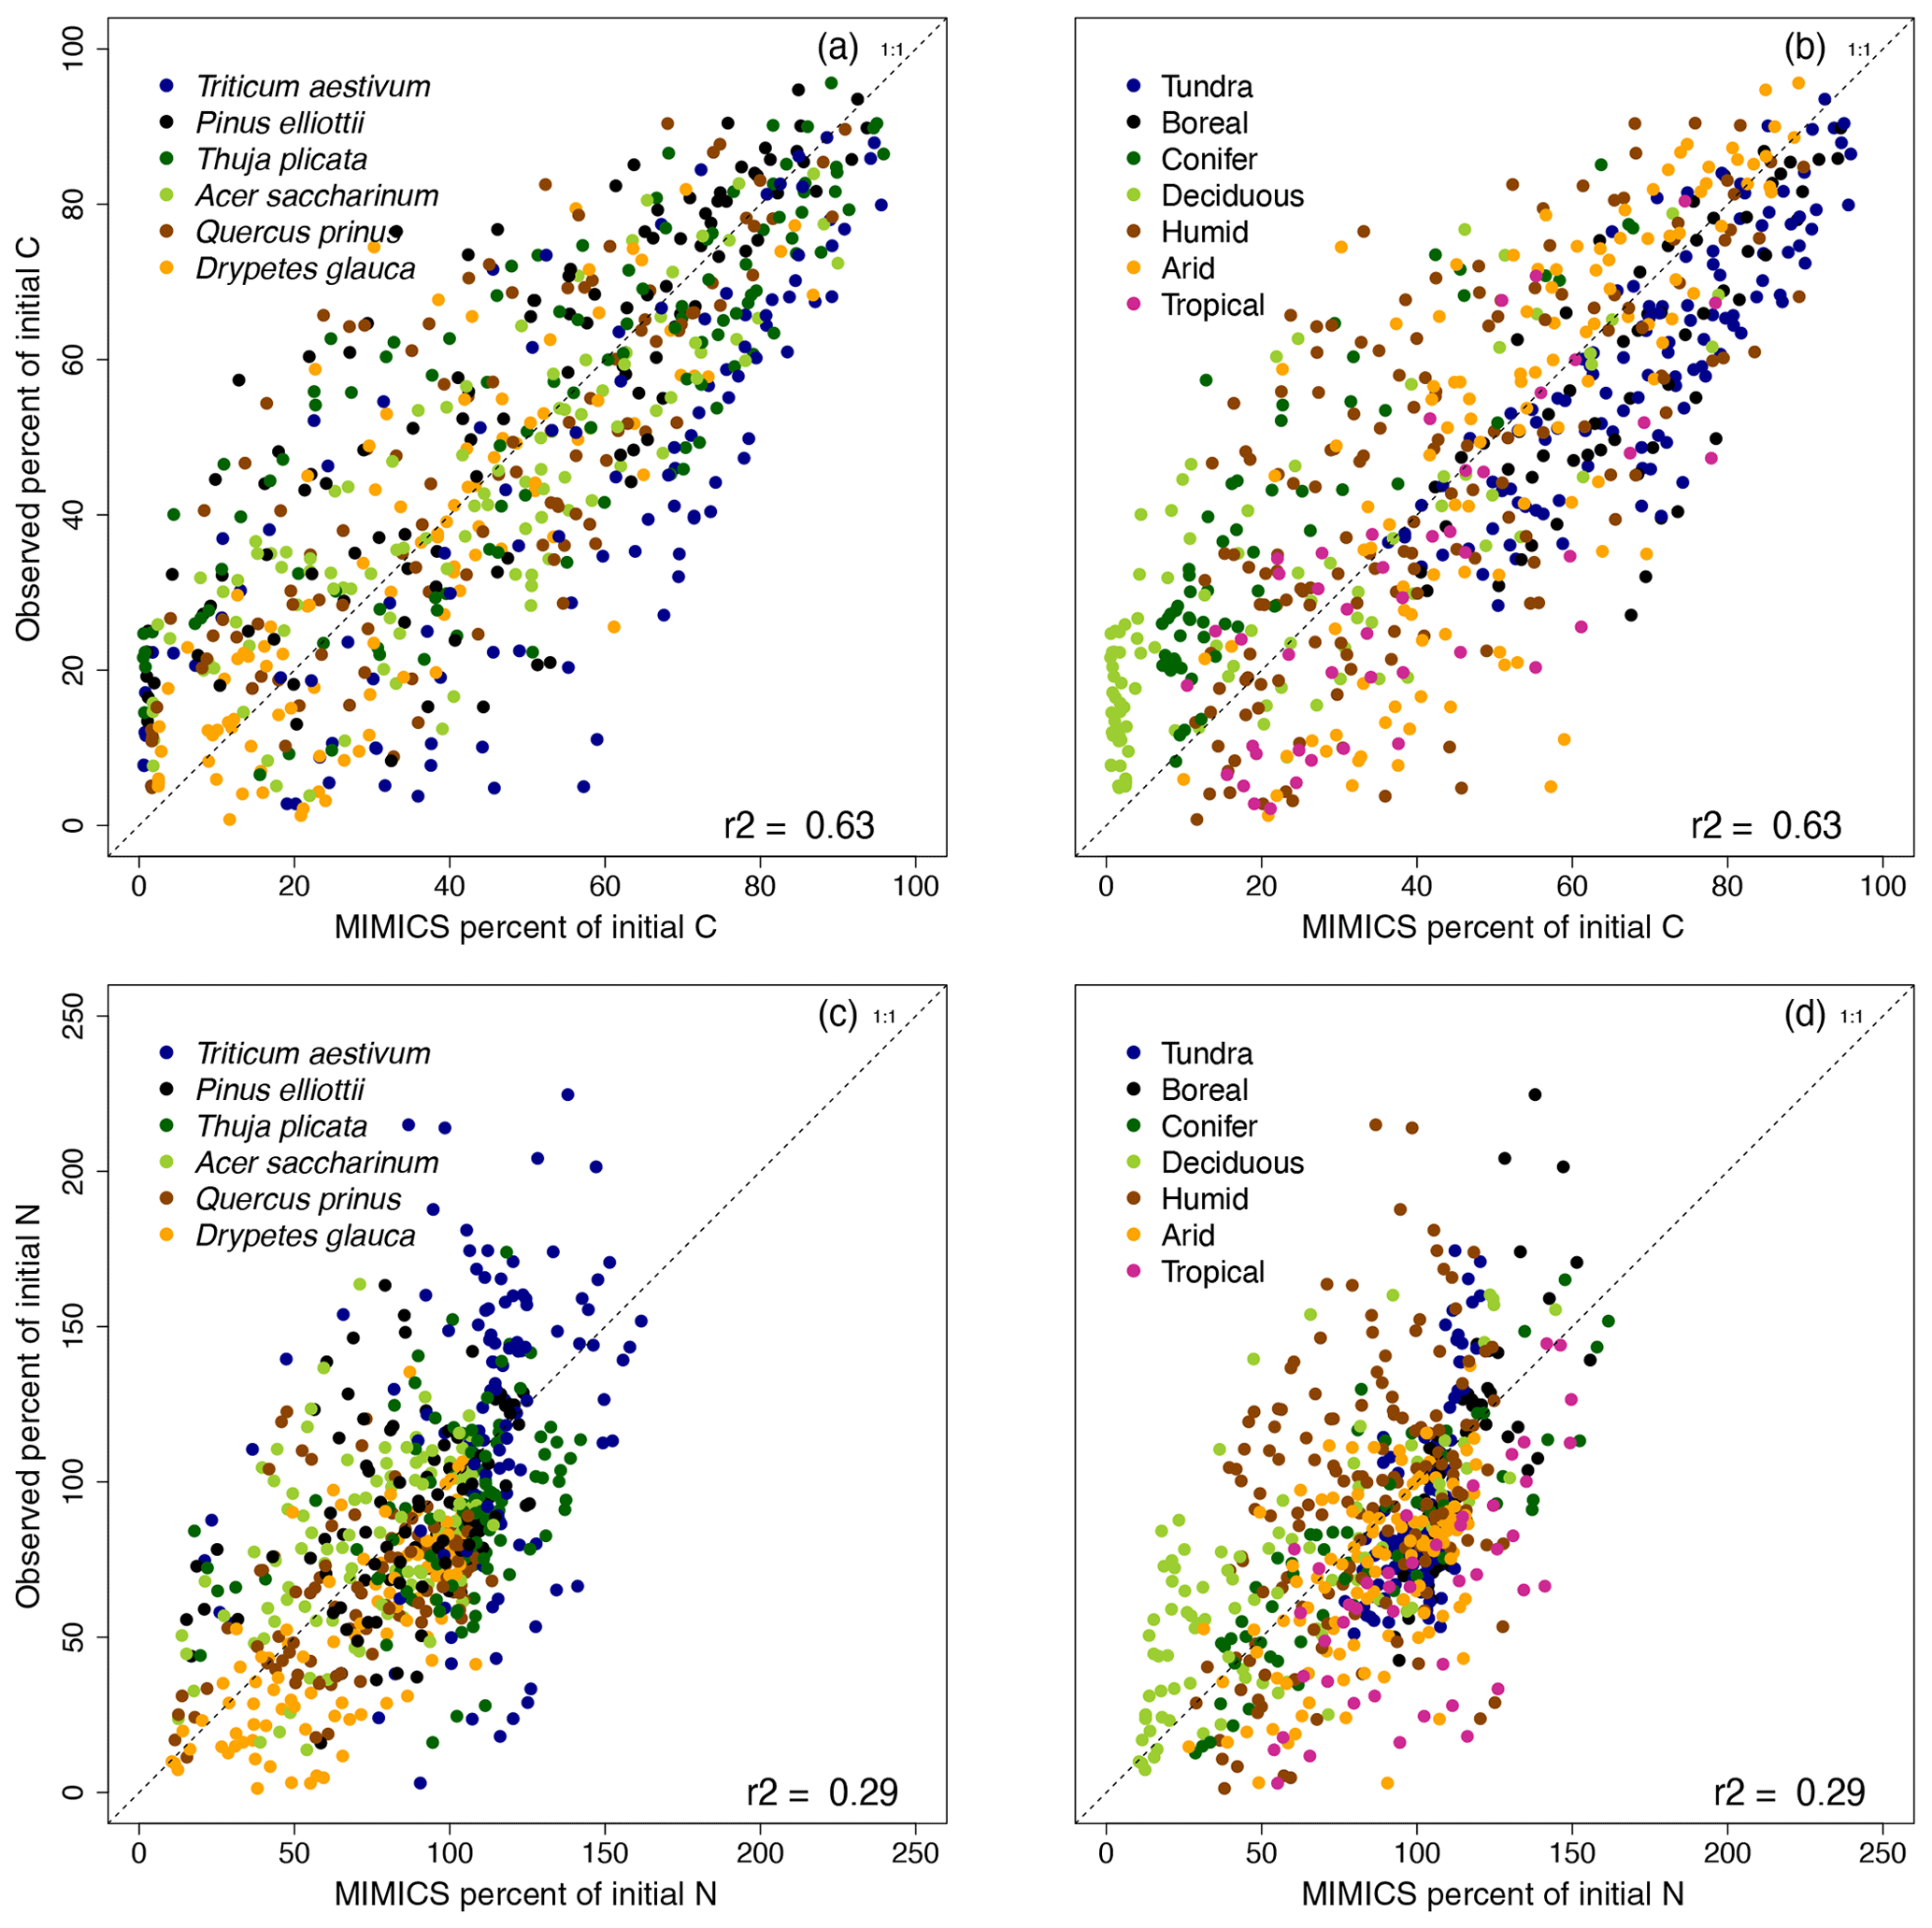
Figure 3MIMICS-CN simulations of percent (a, b) C remaining and (c, d) N remaining in litterbags in the LIDET study versus observed values, colored by (a, c) litter type or (b, d) biome. Dashed line shows the 1 : 1 line.
3.1 Model parameterization and validation: cross-site litter decomposition
We parameterized MIMICS-CN to replicate litter C decay rates and N dynamics of six litter types observed in the LIDET study at the Harvard Forest Long-Term Ecological Research (LTER) site (Fig. 2). In its current parameterization, MIMICS slightly overestimates litter C loss at later stages of decay, but most time points are within uncertainty estimates of the observations (Fig. 2a). Similarly, for N, MIMICS-CN overestimates N accumulation in early stages of decay and underestimates N remaining at later stages, but most time points follow a reasonable trajectory given observations. MIMICS-CN also captures the effects of litter quality on both rates of litter decay (Fig. 2a) and litterbag N accumulation (Fig. 2b). The parameters we used to fit MIMICS-CN to Harvard Forest data also produce reasonable estimates of soil N stocks (2.0 vs. 2.9 mg N cm−3 for model and observations, respectively) and microbial biomass (0.65 vs. 0.61 mg C cm−3), although estimates of soil C (21 vs. 61 mg C cm−3) and soil C : N (11 vs. 21) are both lower than observations.
Parameter values used for this and subsequent simulations across all LIDET sites are shown in Table 1. Relative to the previous C-only version of the model (Wieder et al., 2014, 2015b), kinetic parameters and microbial turnover values were adjusted to account for density-dependent turnover (Georgiou et al., 2017). In addition, the fraction of structural litter that bypasses microbial biomass to enter the chemically protected pool (fi) was increased from 5 % to 30 % as a means to produce reasonable values for total soil C : N. Finally, we adjusted the partitioning of microbial turnover to stable soil pools in order to more closely match distributions at Harvard Forest.
Applying this parameterization across all six litter types at 13 LIDET sites, MIMICS-CN simulates C losses and N dynamics from litterbags with an R2 of 0.63 and 0.29, respectively (Fig. 3). MIMICS-CN captures effects of litter quality on decay rates, with faster rates of C loss and more rapid N mineralization simulated with more N-rich Drypetes glauca litter and slower rates of C loss and greater N immobilization simulated by low-quality Triticum aestivum litter (Fig. 3a, c). MIMICS-CN is best at capturing C loss rates in high- and intermediate-quality litters (Drypetes glauca, Pinus elliottii, Thuja plicata, and Acer saccharinum) but tends to underestimate litter C loss rates from the lowest-quality litter (T. aestivum). For N immobilization and loss, the model performs well especially for high-quality litters but underestimates N accumulation slightly in the lowest-quality litter. The model also captures broad climate effects on litter C loss, with slower decay rates in tundra and boreal forest sites and faster decay in tropical and deciduous forests (Fig. 3b).
Table 2Goodness-of-fit statistics comparing MIMICS-CN and DAYCENT simulations to observations of C and N in decomposing litterbags in the LIDET study, aggregated by biome. DAYCENT results are subset from simulations in Bonan et al. (2013) to match the sites included in MIMICS-CN simulations. The values shown are the number of observations (n), Pearson's correlation coefficient squared (R2), root mean square error (RMSE), and bias calculated between observed and simulated percent C and N remaining. For more details on the sites grouped into each biome, see Wieder et al. (2015).
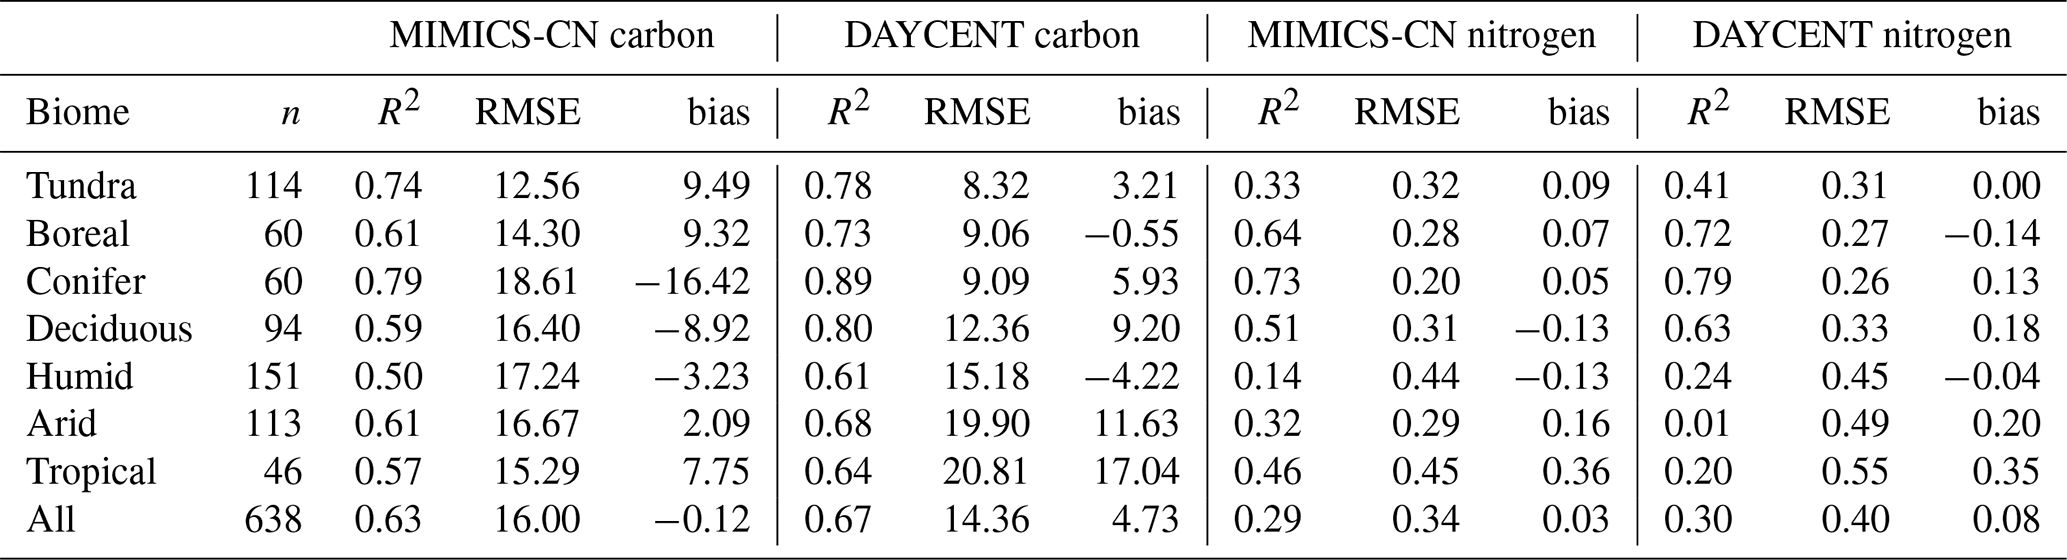
MIMICS-CN and DAYCENT simulations of LIDET decomposition data are compared in Table 2. Across a broad range of biomes, MIMICS-CN and DAYCENT both show good agreement with LIDET observations. Across sites MIMICS-CN has similar R2 and RMSE values but lower bias compared to DAYCENT for mass loss (MIMICS-CN: R2=0.63, RMSE = 16.0, bias = −0.12; DAYCENT: R2=0.67, RMSE = 14.4, bias = 4.73) and percent N remaining (MIMICS-CN: R2=0.29, RMSE = 0.34, bias = 0.03; DAYCENT: R2=0.30, RMSE = 0.40, bias = 0.08). Broadly, MIMICS-CN outperformed DAYCENT in the warmest biomes, while DAYCENT excelled for colder sites for both C and N (Table 2), but the differences in model fit to data were slight and would be difficult to attribute to any particular differences in model structure. DAYCENT simulates decomposition based on initial litter chemistry and showed no site-specific effects on the maximum N immobilized or the relationship between C and N during decomposition for a given litter type (Figs. S1 and S2). By contrast, the amount of N that can be immobilized by a litterbag in MIMICS-CN is driven by the availability of N and the stocks and flows of N in the simulated steady-state soil, and MIMICS-CN showed site-specific variability in the shape of N immobilization and loss curves (Figs. 3 and 4).
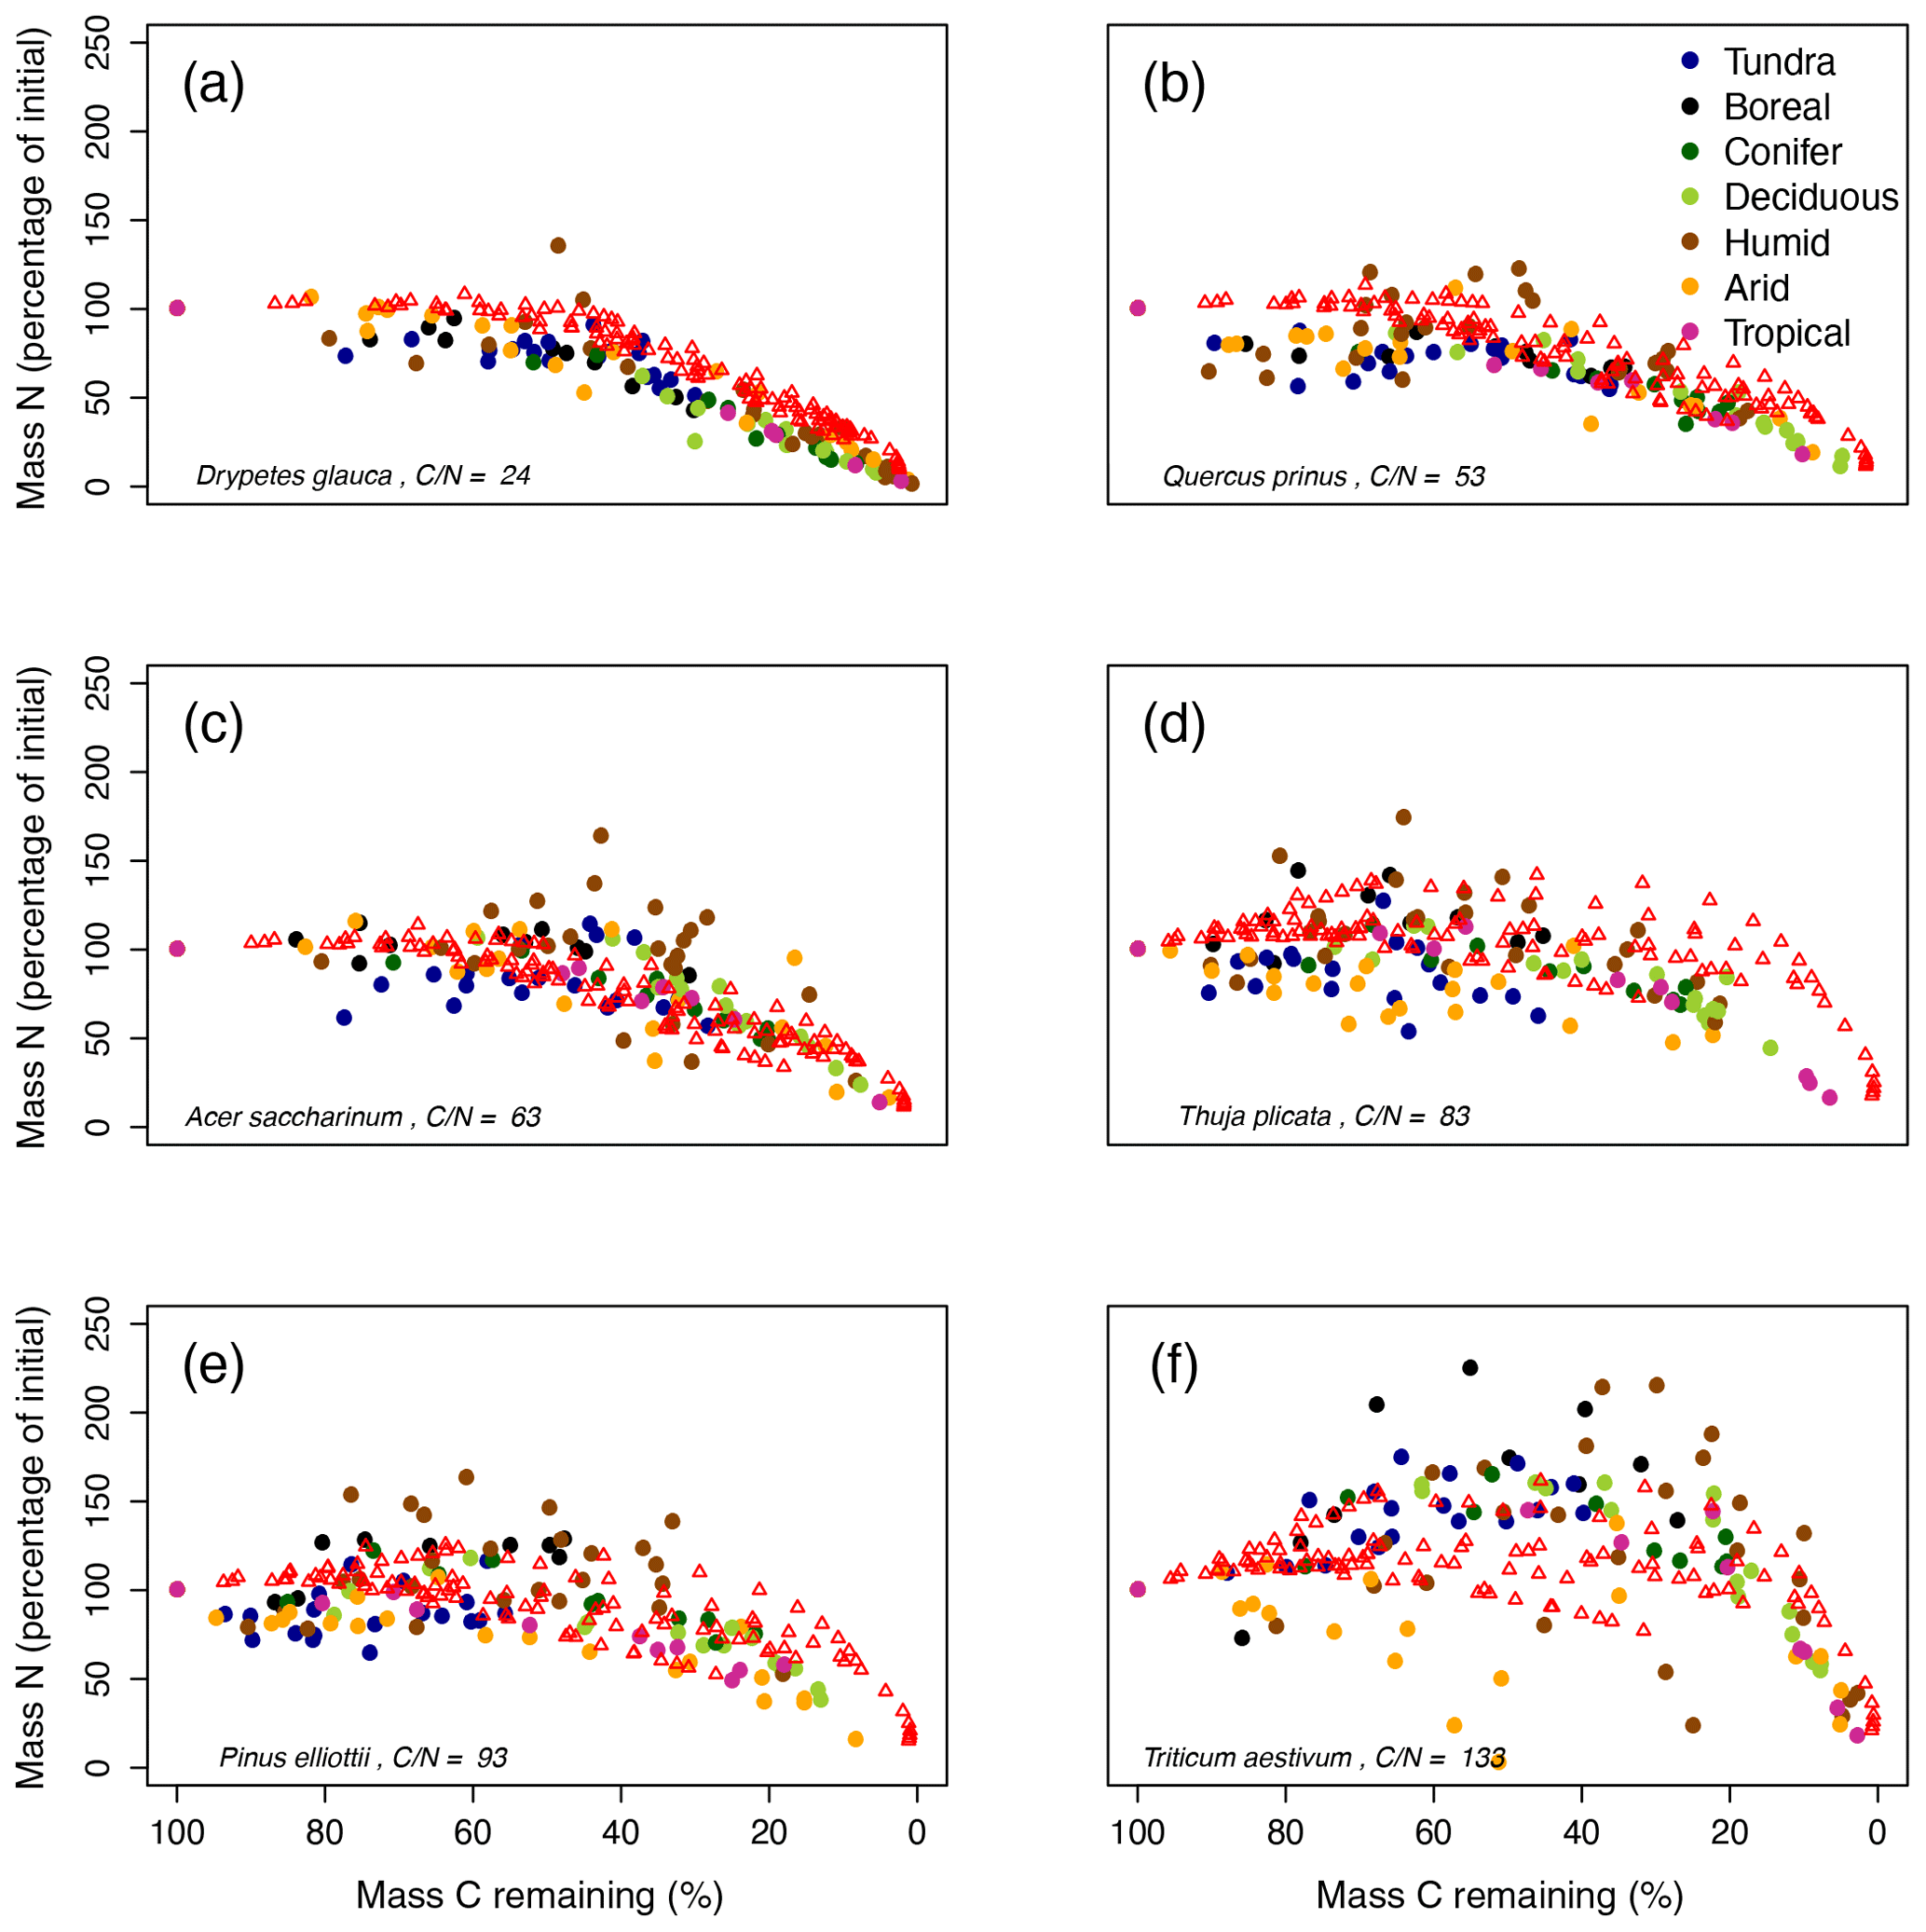
Figure 4MIMICS-CN simulations of immobilization–mineralization thresholds across litters of different quality. Litter quality (in terms of C : N and lignin content) decreases from upper-left panel to lower-right panel. Red triangles show model simulations of C losses vs. N losses from litterbags in the LIDET study. Colored dots show observed C vs. N losses across biomes (Parton et al., 2007).
Litter quality determines the timing of N immobilization vs. mineralization in observations. This produces a functional relationship between initial litter chemistry, C loss, and N immobilization or mineralization that is fairly consistent across sites (colored dots; Fig. 4). MIMICS-CN broadly captured litter quality effects on the timing and magnitude of N immobilization and mineralization dynamics across all biomes (red triangles; Fig. 4). For example, litters with high initial chemical quality consistently mineralize N throughout all stages of litter decay, and MIMIC-CN adequately captures this functional C–N relationship (Fig. 4a, b). By contrast, litters with lower initial chemical quality immobilize N during early stages of litter decay but subsequently mineralize N as decomposition proceeds. MIMICS-CN broadly captures these patterns but without as much variation as the observations (Fig. 4c–f). The lowest-quality litter (Triticum aestivum) immobilizes N until only 40 % of C remains in litterbags. Although MIMICS-CN potentially underestimates total N immobilization in Triticum aestivum litter, it does capture the point at which net N mineralization begins (Fig. 4f).
Table 3Ranges of MIMICS-CN estimates of steady-state values for a variety of soil pools and fluxes, compared against observed ranges from several continent-wide data synthesis studies. The ranges of values included for MIMICS-CN are derived from simulations of sites included in the LIDET study.
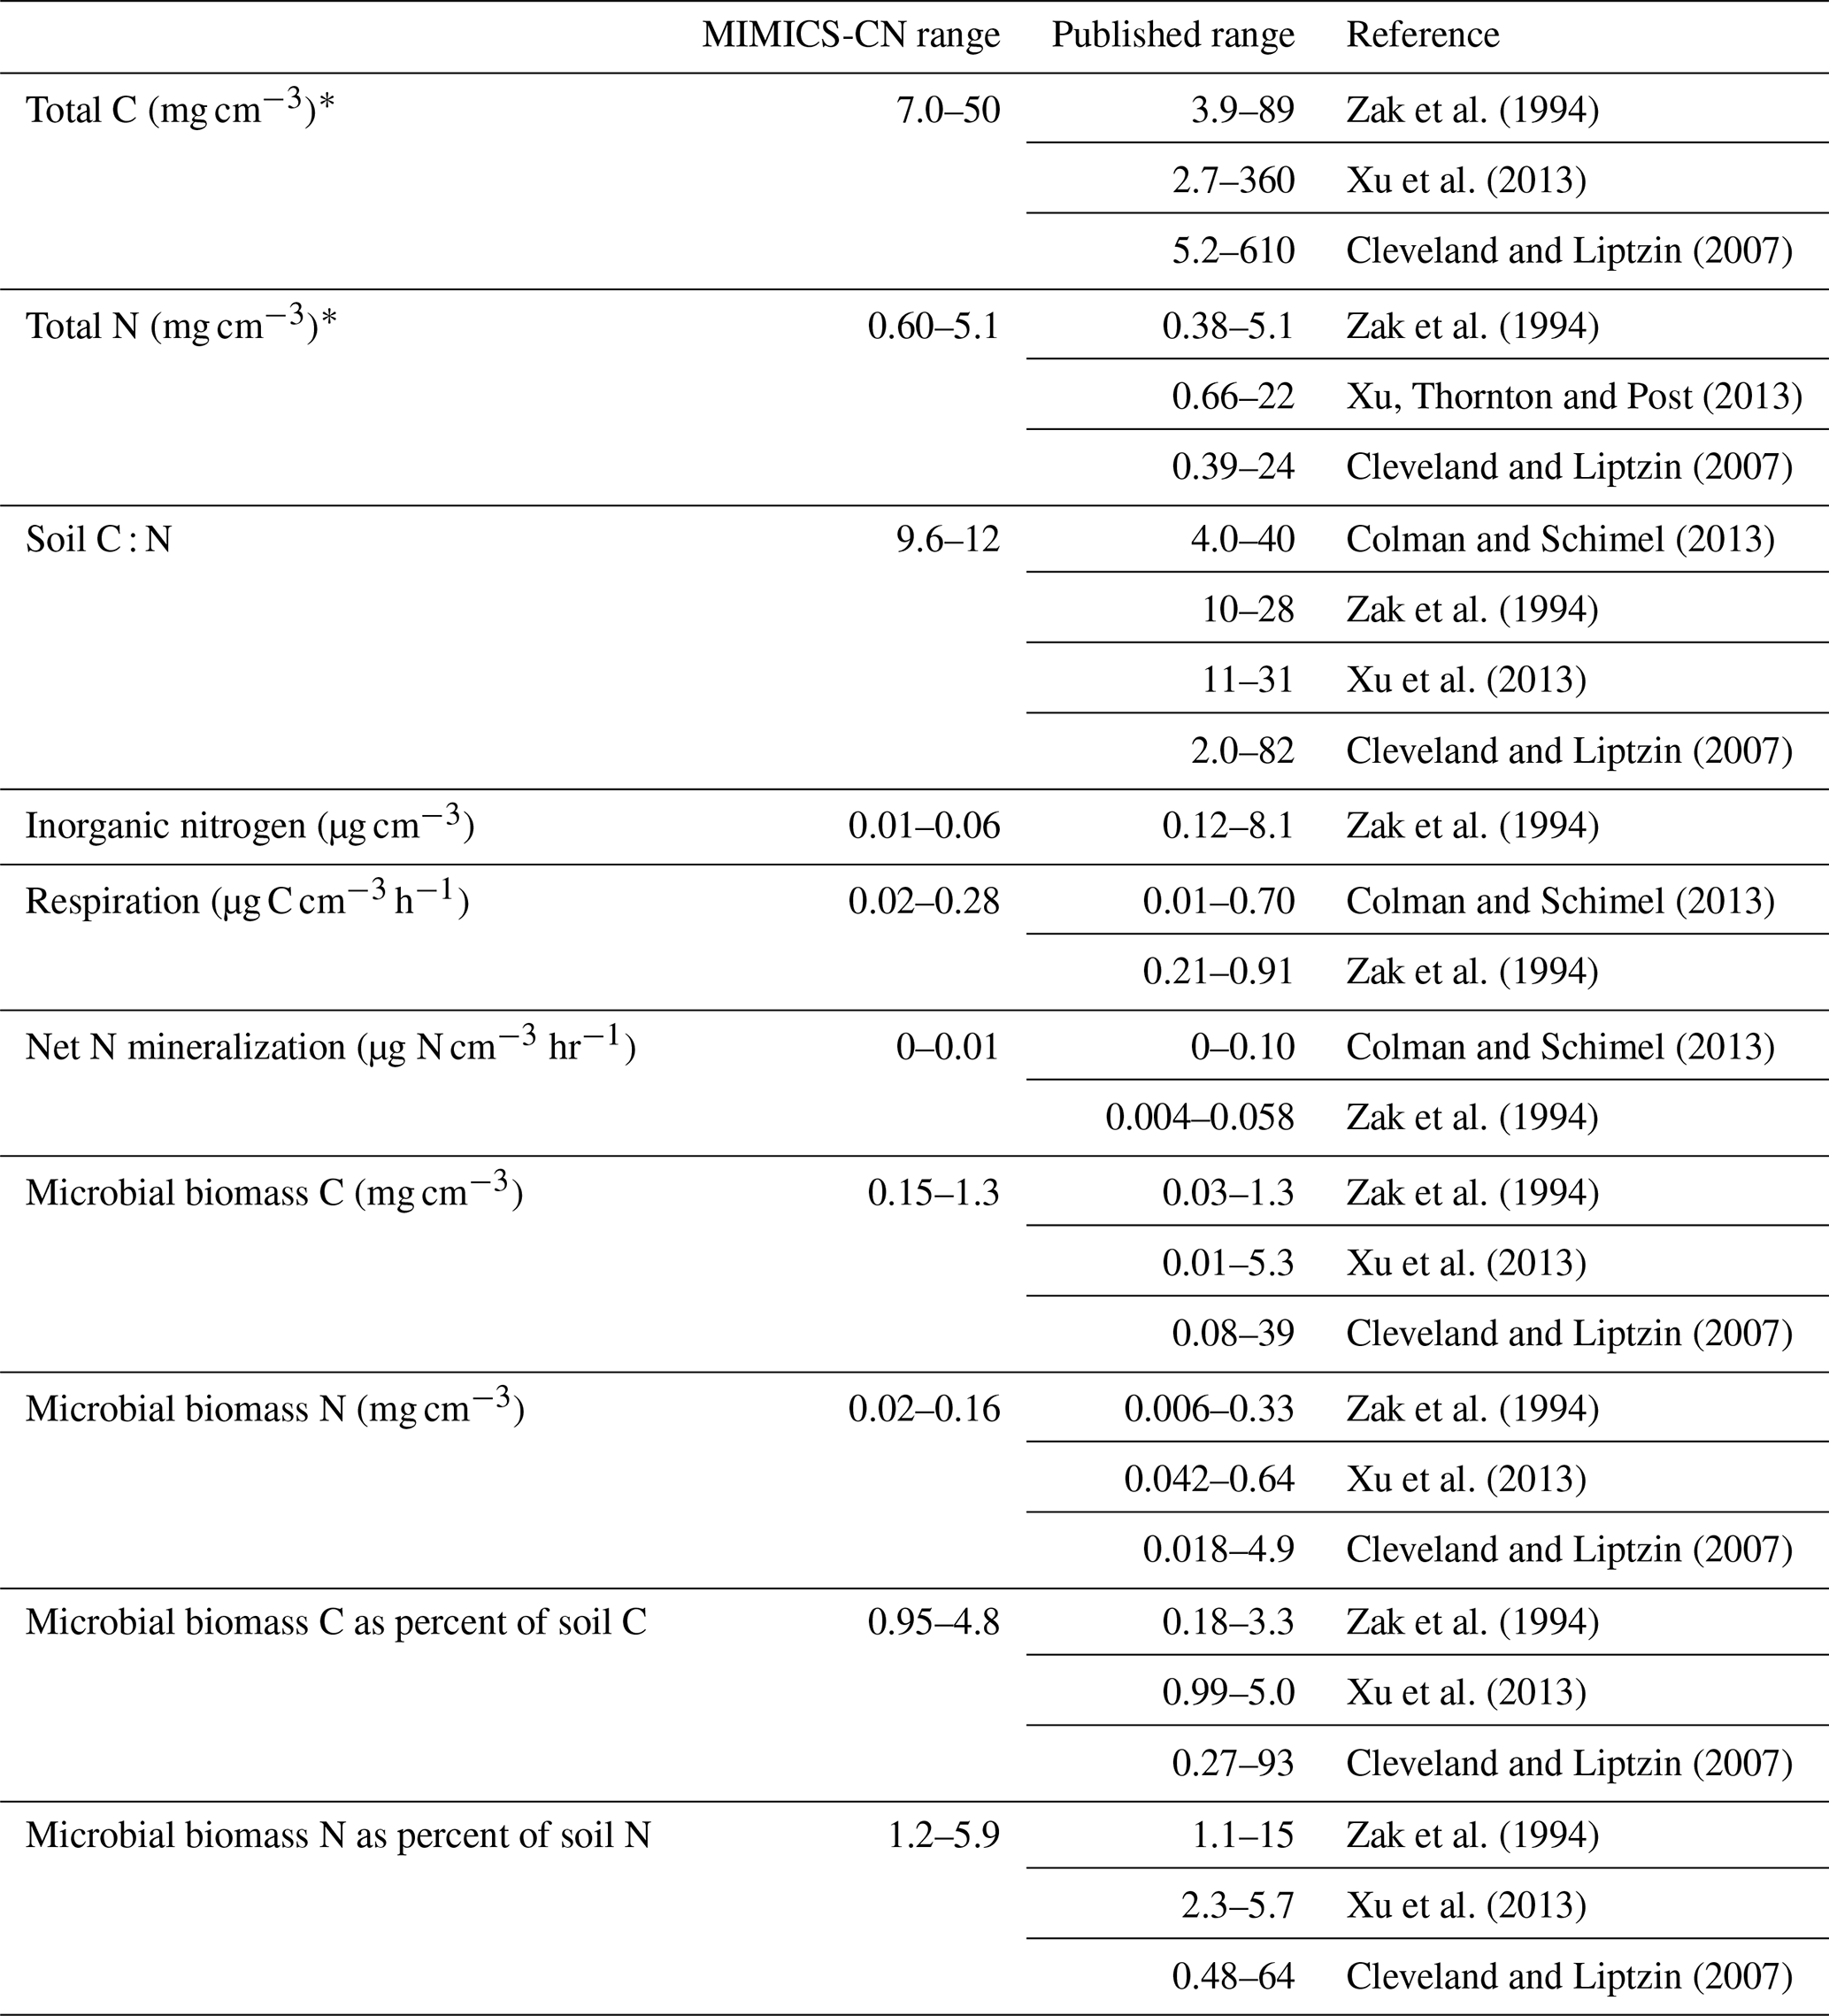
* Depths simulated by MIMICS-CN are for the top 30 cm of soil, whereas published ranges represent measurements ranging from the top 5 to top 30 cm.
3.2 Model evaluation: equilibrium C and N cycling
Across all sites and litter types in the LIDET simulations, the ranges of underlying pool sizes and process rates in MIMICS-CN were compared against published ranges from similarly diverse sets of sites (Cleveland and Liptzin, 2007; Colman and Schimel, 2013; Xu et al., 2013; Zak et al., 1994). MIMICS-CN simulations produced reasonable equilibrium values for most pools and fluxes (Table 3 and Fig. 5). In general, the range of values across the 13 sites simulated by MIMICS was smaller than the ranges across the thousands of sites included in the compiled dataset of observations. For example, total soil C ranged from 7.0 to 50 mg C cm−3 in MIMICS simulations but ranged from 2.7 to 610 mg C cm−3 in observations. Despite this discrepancy, the median values of the simulations and observations were generally within reason (Fig. 5). The distributions of measured and modeled values for microbial biomass C and N as a percent of total soil C and N overlapped, providing evidence that the model reasonably represents microbial stoichiometry, microbial activity as a function of biomass, and microbial biomass as a function of SOM. For soil C : N, the model tended to produce low values with a relatively narrow range, relative to observed values.
Finally, we explored the environmental controls on the distribution of SOM across physicochemically protected, chemically protected, and available pools in MIMICS-CN by examining the correlations between pool sizes and salient input variables (mean annual temperature, productivity, clay content, and litter lignin content). The results are shown in Fig. 6. The absolute concentration of SOM simulated across the LIDET sites was most strongly correlated with annual net primary productivity (ANPP; R2=0.52), but it also tended to increase with MAT, albeit inconsistently (Fig. 6a; R2=0.15). The distribution of SOM across stabilized pools strongly favored chemically protected SOM at sites with lower temperatures, while the relative proportion of physicochemically protected SOM increased with increasing temperature (Fig. 6b). The relative proportion of SOM in the available pool remained fairly consistent across simulated sites. Physicochemically protected SOM was tightly positively correlated with the product of ANPP and clay content (R2=0.96; Fig. 6c), while chemically protected and available SOM were negatively correlated with MAT (Fig. 6d; R2=0.40 and 0.47, respectively) and positively correlated with litter lignin content (Fig. 6e; R2=0.68 and 0.32, respectively). The C : N of individual pools was fairly consistent across sites and tended to be higher for chemically protected SOM (∼ 15) than available (∼ 8) or physicochemically protected SOM (∼ 10). As a result, soil C : N was largely driven across sites by the distribution of SOM across pools, especially the absolute size of the SOMp pool (Fig. 6f; R2=0.79). Given that clay content was an important driver of physicochemically protected SOM in the model, clay content was tightly correlated with soil C : N (R2=0.88). Other litter characteristics and environmental factors were not strong drivers of soil C : N (R2 for MAT: 0.42; litter lignin: 0.03; litter C : N: 0.005).
Terrestrial models are increasingly representing coupled C–N biogeochemistry, and MIMICS-CN is among the first attempts to do so with a microbially explicit soil biogeochemical model that can be used to project C and N dynamics across continental-scale gradients. Our formulation and parameterization of MIMICS-CN captures site level observations of litter C loss and N immobilization at the Harvard Forest LTER site (Fig. 2). Cross-site validation of the model demonstrates that it broadly captures climate and litter quality effects on rates of C and N transformations from the LIDET observations (Figs. 3–4). Notably, the results simulated by MIMICS-CN represent N dynamics during litter decomposition about as well as a first-order model that implicitly represents microbial activity (Table 2). It also generates steady-state pools and fluxes of C and N that seem reasonable compared to published syntheses (Table 3; Fig. 5). Below we discuss these dynamic and equilibrium model simulations in greater detail, as well as some of the limitations of MIMICS-CN that will be addressed in future work.
4.1 Model parameterization and validation: cross-site litter decomposition
We first parameterized and validated MIMICS-CN using the cross-site litter decomposition study, LIDET. Previous LIDET simulations using MIMICS have successfully replicated observed C loss patterns, and adding coupled N cycling to MIMICS neither improved nor degraded simulations of LIDET litter C losses relative to the C-only model (Figs. 2–3; Wieder et al., 2015b report global RMSE for the C-only model is 14.6 vs. 16.0 in this study). Our results show higher-than-observed rates of litter C mass loss in deciduous and coniferous forest (Figs. 2a, 3b; Table 2). This suggests that the partitioning of plant detrital inputs into litter pools that are chemically defined works well for initial stages of litter decay but may not consider the changes in substrate chemistry or microbial community succession that occur in later stages of decomposition that slow rates of mass loss (Berg, 2000; Melillo et al., 1989). Models that implicitly represent microbial activity capture this phenomena by using a three pool structure (Adair et al., 2008), and future studies can consider how to more mechanistically understand interactions between initial litter quality, decomposer communities, climate, nutrient availability, and late-stage litter decay rates (e.g., Craine et al., 2007; Hobbie et al., 2012; Wickings et al., 2012) in models like MIMICS-CN. In MIMICS-CN, carbon and nitrogen move together through model pools, but model dynamics are primarily driven by C, with N dynamics following suit based on pool stoichiometry. The N dynamics do, however, constrain C cycling in the model if microbes are N limited, in which case microbes lose excess C through overflow respiration. At equilibrium, microbes in our MIMICS-CN simulations primarily obtained N through recycling of SOM pools with favorably low C : N ratios, with the result that modeled microbes were almost always C limited at equilibrium and rarely exhibited overflow respiration. Large pulses of low-quality litter can perturb this equilibrium and induce N limitation, but in the absence of losses of or plant competition for inorganic and dissolved organic N, C cycling in MIMICS proceeds in essentially the same way with or without accounting for N.
MIMICS-CN accurately captured the stoichiometric relationships between C and N during litter decomposition (Fig. 4). This stoichiometric relationship has been well defined in the past using theoretical microbial stoichiometry and CUE (Parton et al., 2007), but comparable soil models without explicit microbial physiology have tended to overpredict N accumulation in litterbags (Bonan et al., 2013). Moreover, models without microbially explicit physiology also show N immobilization mineralization dynamics that are completely determined by initial litter quality, whereas MIMICS simulations show greater site-level variation (Figs. 4, S2). In MIMICS-CN, stoichiometric relationships drive litterbags to accumulate soil N until they reach a threshold C : N, after which litterbags become net sources of N. This threshold, representing the balance between microbial N requirements and availability, is a function of changes in litter stoichiometry during decomposition, as well as of the stoichiometry of microbes and their nutrient use efficiencies. By explicitly considering these dynamics, MIMICS-CN has a similar or lower RMSE for N remaining in litter bags than a model that implicitly represents microbes, DAYCENT (Table 2).
MIMICS-CN and DAYCENT capture N dynamics during decomposition with similar overall degrees of fit but for different reasons. In DAYCENT, N immobilization and loss dynamics are driven by initial litter chemistry, and good model fit to data is achieved by capturing the average N immobilized for a given litter type regardless of biome and climate conditions (see Figs. S1 and S2). By contrast, litterbag N immobilization in MIMICS-CN is driven by the availability of N in the underlying modeled soil and by site-specific effects (e.g., climate, clay content) on the simulated stocks and fluxes of N. As a result, MIMICS-CN generates greater variation in the amount N immobilized for a given litter type across sites (Figs. 3 and 4). Site-specific variability in N immobilization patterns is also clearly visible in LIDET observations (colored dots; Fig. 4), but the introduction of site-specific variability in MIMICS-CN does not substantially improve model fit to data relative to DAYCENT. Spatial variability in ecosystem processes, like N mineralization rates, may be linked to factors like local-scale microbial community composition, soil moisture, or mineralogy (Graham et al., 2016; Smithwick et al., 2005; Soranno et al., 2019; Doetterl et al., 2015). While more work needs to be done to understand the factors controlling within and among site variation in soil C–N dynamics (Bradford et al., 2017), these results highlight that the explicit representation of microbial activity in MIMICS-CN may present opportunities to explore factors responsible for biogeochemical heterogeneity across scales.
Although MIMICS-CN broadly captures appropriate climate and litter quality effects on leaf litter decomposition patterns, the model underestimates N accumulation in the highest C : N ratio litter (Triticum aestivum; Fig. 4f). Microbes in MIMICS-CN recycle nitrogen from necromass and necromass-derived SOM, which might allow microbes to scavenge the N required to decompose high C : N litter without having to accumulate it from the inorganic soil pool. In a real litterbag, necromass might be lost through leaching, and microbial access to recycled biomass might be limited, and some microbial-derived compounds may require extensive depolymerization and proteolysis before the N is available for recycling (Schulten and Schnitzer, 1997), thus favoring N uptake from the soil pool. Alternatively, N inputs to real litterbags in the LIDET study may have come from atmospheric deposition or other unintended sources that MIMICS-CN does not address. Nonetheless, the high C : N ratio of Triticum aestivum is not typical of the majority of litter inputs across diverse biomes (Brovkin et al., 2012), which are well within the range that MIMICS-CN can simulate.

Figure 5Distributions of MIMICS-CN estimates of steady-state values for a variety of soil pools and fluxes, compared against observed ranges from several continent-wide data synthesis studies. Black lines show the median value across all observations; red lines show median value of MIMICS-CN simulations.
4.2 Model evaluation: equilibrium C and N cycling
We conducted additional model evaluation by comparing model pools and fluxes at equilibrium to published observations. The parameter values used in the LIDET simulations produced reasonable estimates of equilibrium pools (soil organic C and N, microbial biomass C and N, and total inorganic N) and fluxes (heterotrophic respiration and N mineralization) (Table 3; Fig. 5). In combination with the LIDET results, these results indicate that MIMICS-CN can produce realistic simulations of both the short-term dynamic processes involved in litter decomposition and the soil-forming processes that produce equilibrium pools and fluxes over much longer timescales. In addition, MIMICS-CN simulates microbial stoichiometry, microbial growth and turnover, and microbially mediated decomposition, rather than using prescribed values as in models that lack explicit representation of microbes. This increases the power of MIMICS-CN to explore the microbial and biogeochemical processes underpinning model predictions.
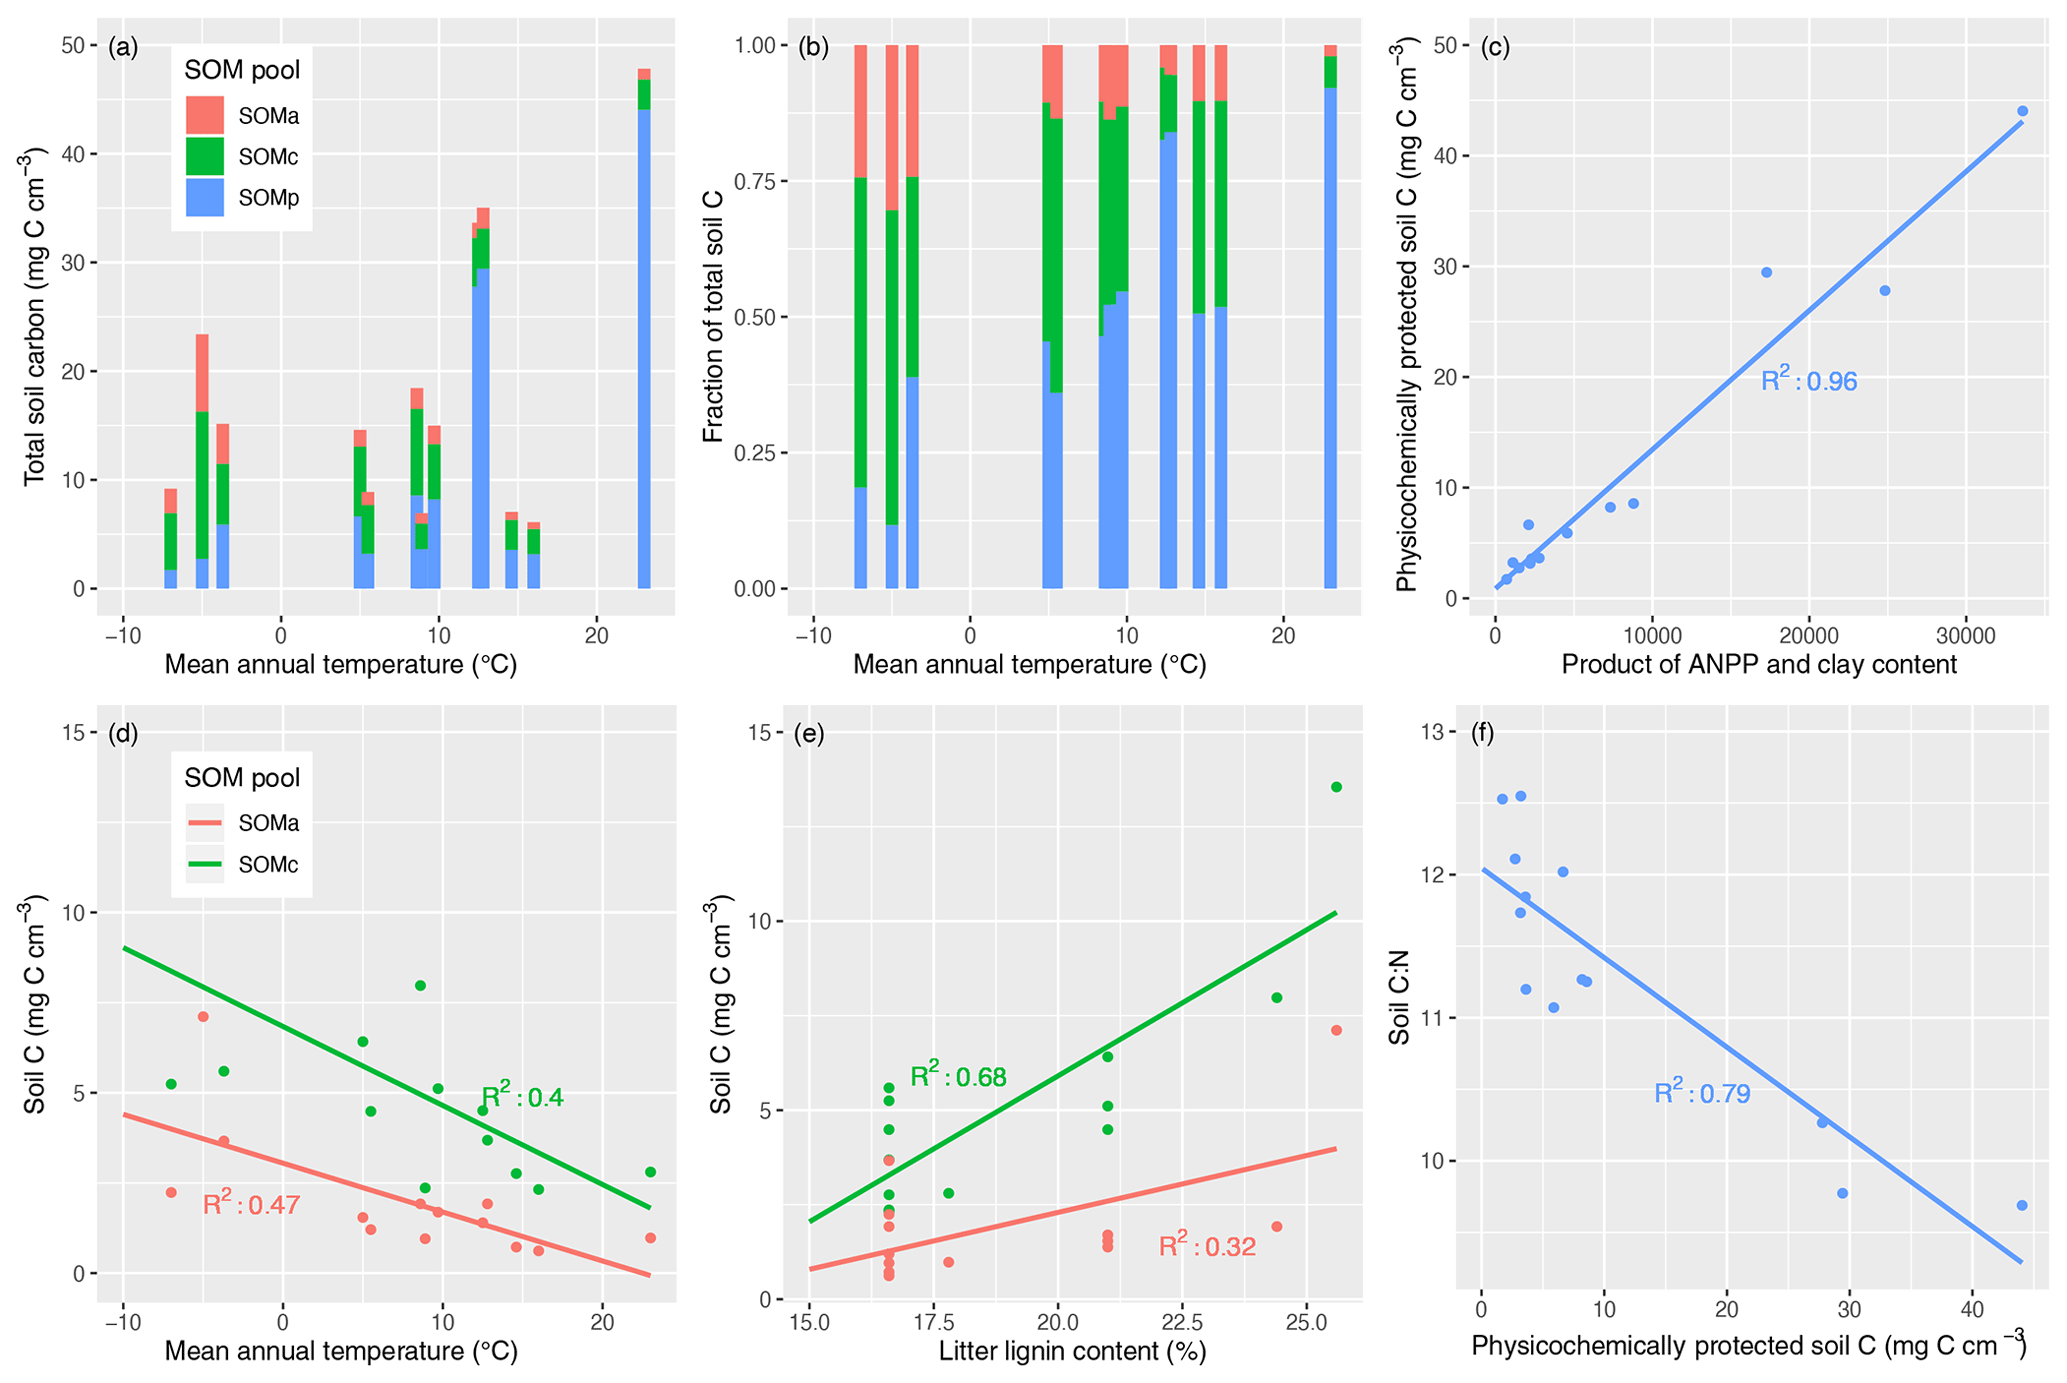
Figure 6Variation in steady-state SOM pools and environmental factors controlling their distribution in MIMICS-CN simulations across LIDET sites. Top panels show the (a) total C stocks in physicochemically protected, chemically protected, and available SOM pools (SOMp, SOMc, SOMa pools, respectively) arranged by the site mean annual temperature (MAT) or the (b) relative fraction of each SOM pool arranged in the same way. Upper-right and bottom panels show the correlations between C in each SOM pool and environmental drivers including: (c) SOMp vs. the product of annual net primary productivity (ANPP) and clay content, (d) SOMc and SOMa vs. MAT, and (e) SOMc and SOMa vs. lignin content of litter inputs at each site. Finally, (f) soil stoichiometry is largely determined by the fraction of total SOM pools that are considered physicochemically protected.
Continent-wide observations of soil pools and fluxes range over several orders of magnitude (Table 3), but MIMICS simulations agreed well with the median of those ranges. Observations tended to be spread over a much larger range of values than the MIMICS-CN simulations, but these simulations only included information from 13 sites, while the observations included thousands of locations. The median values of observed and simulated values were within a factor of 2.5 for all pools (Fig. 5). Differences in measurement depth or error in estimated bulk density values could account for some of the differences between measurements and simulations and for the spread across observed values. This is less of a concern for three of the variables used here (soil C : N, microbial biomass C as a percent of total soil C, and microbial biomass N as a percent of total soil N), which are ratios that are comparable across sites. Microbial biomass C as a percent of total soil C and microbial biomass N as a percent of total soil N were highly conserved across sites, relative to soil stocks or microbial C or N, and may be particularly useful metrics for evaluating microbially explicit soil biogeochemical models since the size of the microbial biomass pool directly controls rates of SOM turnover and formation in models like MIMICS-CN. For these ratios, MIMICS-CN reproduced distributions and median values that overlapped well with observations. In future work, direct comparisons of modeled and measured values for these ratios at specific sites may shed light on the limitations of the model and the origins of data–model disagreement. However, even the simple range comparisons included here provide evidence that the mechanistic representation of soil biogeochemistry in MIMICS-CN is ecologically realistic. Examinations of model realism like this are a crucial step in transitioning from theory and small-scale model tests to applications in ESMs or at larger scales where evaluation data are more sparse.
Besides representing appropriate soil biogeochemical stocks, fluxes simulated by the models also agree well with observations. Specifically, MIMICS-CN simulations of heterotrophic respiration and net N mineralization rates fell within observed bounds, although the variation in observations was much greater than the variation in simulated values. Our simulations calculated rates at equilibrium assuming constant temperature and other factors, while real rates of these processes are driven by seasonally and diurnally variable temperature, soil moisture, and other factors, so predictably, our simulations produced smaller-than-observed variability in rates. MIMICS-CN produced total soil C : N values that fall within observed ranges, although observations again show greater variation in soil C : N ratios and have maximum values that are much higher than the maximum C : N ratios simulated by MIMICS-CN. SOM pools in MIMICS-CN are mostly comprised of microbial necromass, in addition to a small proportion of litter that enters SOM pools directly without first passing through microbial biomass. Increasing this proportion in the model is one way to increase the C : N of SOM pools and the overall system at equilibrium. At some sites, litter may contribute more directly to SOM pools than microbial necromass (Jilling et al., 2018). For example, forests often have a higher proportion of total soil C in the light fraction, which is almost entirely made up of plant residues, compared to agroecosystems and many grasslands (Grandy and Robertson, 2007). For those sites with large, direct contributions of plant matter to SOM, increasing the fraction of litter that passes directly into SOM in MIMICS may be appropriate.
4.3 Exploring emergent SOM dynamics
The distribution of SOM across simulated pools in MIMICS-CN (Fig. 6) illustrates how model-defined assumptions about pool stabilization mechanisms drive potential responses to environmental variables. The wide variation in SOM pool distributions among contrasting environments in our simulations provides support for experimental efforts aimed at distinguishing between SOM pools to understand SOM responses to environmental changes and potential ecosystem feedbacks. For example, global change factors like warming can cause a range of different responses among SOM pools (Conant et al., 2008; Li et al., 2013; von Lützow and Kögel-Knabner, 2009; Plante et al., 2010). Experimental studies also show that increases in SOM resulting from increased inputs are not typically evenly distributed across different SOM pools (Lajtha et al., 2017; Stewart et al., 2009), which can influence feedbacks to productivity as well as the persistence of soil C gains in response to shifts in climate. Thus, while our broad-scale projections of how and why SOM differs among pools need to be evaluated with experiments and data synthesis across environments, they can provide a starting point for understanding SOM responses to global change factors across environments.
In MIMICS, the turnover of chemically protected and available SOM pools is based on temperature-sensitive Michaelis–Menten kinetics and litter chemistry (the latter controlling allocation of litter pools to the different microbial functional groups). This results in SOMC pools (analogous to light fraction or POM pools) that are negatively correlated with MAT and positively correlated with litter lignin content (Fig. 6d, e). Turnover of the physicochemically protected SOM pool, on the other hand, occurs via first-order kinetics with a rate constant modified by clay content, and the equilibrium values of this pool are determined by inputs that largely come from microbial biomass and biomass turnover rates (Fig. 1). Therefore, the equilibrium values of SOMp (analogous to heavy fraction or MAOM pools) were strongly positively correlated with the product of ANPP and clay content (Fig. 6c). This relationship broadly reflects the expected importance of total soil C inputs and their potential to be preserved after microbial processing by association with clays (Kleber et al., 2015). However, these two variables are also likely to covary with others, especially MAT, highlighting the difficulty of isolating individual mechanisms that regulate SOM.
Across the sites included in these simulations, chemically protected SOM formed a higher proportion of total SOM at lower MAT, while physicochemically protected SOM was favored at warmer sites (Fig. 6b). In global simulations with the carbon-only version of MIMICS, these assumptions result in MIMICS projecting longer soil C turnover times in soil C pools and larger soil C pools in the tropics than other models (Koven et al., 2017; Wieder et al., 2018) and a higher vulnerability of high-latitude soil C stocks (Wieder et al., 2015b, 2019). Evaluating the accuracy of our model assumptions and the resulting patterns in soil C and N cycling requires coupling process-level studies of the fate of decomposing litter (e.g., using isotope tracers) to broad-scale evaluation of SOM pool distributions across environmental gradients.
Soil C : N ratios simulated by MIMICS-CN across sites were highly correlated with soil clay content (R2=0.88), suggesting that, in the model, soil stoichiometry emerges from the relative contributions of SOM across physicochemically and chemically protected pools (Fig. 6). Although the spread of C : N values across the sites simulated by MIMICS-CN was small (Fig. 6f), C : N tended to decrease with increasing temperature, and simulated soil C : N was more correlated with site temperature (R2=0.42) than any of the litter characteristics used to drive the model, such as litter lignin (R2=0.03) or litter C : N (R2=0.005). This result directly contradicts a recent study using a first-order linear model which presumed that litter quality and soil quality at equilibrium were directly proportional (Menichetti et al., 2019). Although many soil biogeochemical models prescribe soil C : N ratios for individual pools, the stoichiometry of SOM in MIMICS-CN is an emergent property of the model.
The lack of correlation between simulated soil C : N and litter C : N in MIMICS-CN simulations suggests an intriguing followup question: in the field, is SOM stoichiometry correlated with litter quality, or is it better explained by climate, edaphic, and mineralogical gradients that impact soil microbial community composition, microbial activity, and mineral-mediated mechanisms of SOM persistence? Various regional studies provide limited support for the relationships generated by MIMICS-CN between soil C : N and MAT (Miller et al., 2004) or clay content (Hassink et al., 1993; Homann et al., 2007; Jenny, 1941), though a large-scale synthesis of measurements across all of these variables is still needed. Presently, MIMICS-CN assumes that microbial biomass stoichiometry largely controls the C : N ratios of stable SOM, with relatively minor contributions from litter quality. However, a small proportion of litter inputs become stabilized in MIMICS-CN without first passing through the stoichiometric filter of microbial biomass, and increasing this fraction in the model is a means to increase the C : N of simulated stable SOM. The strength of the mineral sink for microbial necromass in the model also impacts the relative balance of microbe- or plant-derived stable SOM, which in turn impacts modeled soil C : N. This result implies that in the field, C : N stoichiometry might be used as a means to differentiate the degree to which a given soil fraction is derived from direct plant inputs or microbial biomass, and mineralogical variables might be useful for explaining differences in fraction distributions across soils that impact C : N. Studies like Mikutta et al. (2019) illustrate the way that C : N can be used to assess the relative contributions of plant matter or microbial residues to stable SOM. Future work will use measured C : N of soils and soil fractions and isotopic insights into the plant or microbial origins of stable SOM to improve the parameterization of this aspect of the model and better understand the relationship between mechanisms of SOM stabilization and soil stoichiometry.
4.4 Limitations and future work
MIMICS-CN combines reasonable biogeochemical simulations with the option to explore underlying microbial processes, but limitations remain. For example, MIMICS only represents two microbial groups with different stoichiometric and physiological parameters, but real soils contain a much more diverse array of microbial functional groups with different responses to environmental conditions and different couplings between C and N cycles. CUE and NUE are critical microbial parameters in MIMICS-CN, but the relationships between CUE and microbial community composition (Maynard et al., 2017), microbial growth rate (Molenaar et al., 2009; Pfeiffer et al., 2001), temperature (Allison, 2014; Dijkstra et al., 2011; Frey et al., 2013; Steinweg et al., 2008), substrate quality (Blagodatskaya et al., 2014; Frey et al., 2013; Sinsabaugh et al., 2013), or any number of other aspects of microbial metabolism are complex, difficult to quantify, and challenging to represent at the scale of a whole soil community (Geyer et al., 2016). In its current configuration, MIMICS-CN also simplifies a number of ecosystem biogeochemical processes, and there are several important pathways of N cycling currently absent from the model. For example, MIMICS-CN does not currently represent free living biological N fixation, direct mycorrhizal exchanges for plant C for microbial N, dissolved organic C or N losses, denitrification/nitrification/other inorganic N transformation and loss pathways, plant uptake of N, or inorganic N leaching beyond a simple linear decay rate. Some of these shortcomings may be remedied by integrating MIMICS with a full ecosystem biogeochemical model that represents the greater complexity of the plant–soil continuum. MIMICS-CN provides a pathway to reconcile mechanistic explanations for phenomena like priming and plant–soil feedbacks with emergent patterns in terrestrial biogeochemistry across landscapes. MIMICS-CN and microbial models like it are a good first step towards representing the complex ecological factors that drive the coupling of soil C and N biogeochemistry, including the distribution of SOM among functionally relevant pools and SOM C : N ratios. Future work could compare model formulations that take different approaches to microbial community and stoichiometric parameters (e.g., flexible microbial parameters like C : N or CUE, additional microbial groups, partitioning microbial metabolism into a greater number of pathways) and refinement of mechanisms that confer SOM persistence. These efforts should also assess the ramifications of different choices for simulating existing data and predicting the long-term response of soil C and N cycles to global change. Our work demonstrates that MIMICS-CN can reproduce site and litter quality effects on litter decomposition C and N dynamics at a landscape scale, while also pointing to the importance of underlying, interacting microbial and biogeochemical factors in regulating SOM dynamics. Future work coupling MIMICS-CN to experiments and syntheses relating the distribution of SOM across pools to their underlying controls across gradients will improve our confidence in our ability to understand and project SOM dynamics.
The structure and assumptions in the C-only version of MIMICS have been described previously (Wieder et al., 2014, 2015b), and the structure and assumptions in MIMIC-CN are described in Sect. 2.1 (Model formulation) of the methods section of this paper. The C fluxes (mg C cm−3 h−1) from donor to receiver pools in MIMICS-CN, numbered in Fig. 1, are defined by the following:
where pools and parameters are described in Sect. 2.1 and Table 1, respectively. The N fluxes (mg N cm−3 h−1) from donor to receiver pools in MIMICS-CN are calculated based on the C fluxes between pools and the C : N ratio of donor pools. These fluxes are numbered in Fig. 1 and defined by the following:
Each time step, the microbial pools in MIMICS-CN take up inorganic N from the DIN pool proportional to the biomass in each pool. Subsequently, the C : N ratio of all the inputs to each microbial pool is calculated, and the microbial pools spill either excess C or excess N to maintain a model-defined C : N ratio of microbial biomass. The algorithm that determines the release of excess C or N is determined using the following equations:
Inorganic N leaches slowly from the model according to a model-defined rate:
Given the fluxes defined above, the changes in C and N pools in each hourly time step (mg C or N cm−3) are described by the following:
MIMICS-CN (v1.0) is written in R using packages rootSolve (Soetaert and Herman, 2009) and hydroGOF (Zambrano-Bigiarini, 2017). Figures were generated using packages ggplot2 (Wickham, 2016), reshape2 (Wickham, 2007), scales (Wickham, 2018), gridextra (Auguie, 2017), and cowplot (Wilke, 2016). The R scripts and datasets used to generate model results are available at https://doi.org/10.5281/zenodo.3534562 (Kyker-Snowman, 2019). See Appendix A for equations.
The supplement related to this article is available online at: https://doi.org/10.5194/gmd-13-4413-2020-supplement.
EKS developed new model code and conducted model parameterization and testing with feedback from WRW and ASG. WRW developed the code for the original C-only MIMICS model. ASG supervised model development and testing. SF provided advice on Harvard Forest data used to parameterize and evaluate the model and contributed intellectually during manuscript development. EKS prepared the manuscript with contributions from all coauthors.
The authors declare that they have no conflict of interest.
Funding for this study was provided by the USDA National Institute of Food and Agriculture (project no. 2015-35615-22747) and the US Department of Energy (grant number DE-SC0016590). Emily Kyker-Snowman was supported by an NSF Graduate Research Fellowship under grant no. DGE-1450271. Partial funding was provided by the New Hampshire Agricultural Experiment Station. William R. Wieder was supported by grants from US Department of Energy, Office of Science, Biological and Environmental Research (BER), under award numbers TES DE-SC0014374 and BSS DE-SC0016364 and the USDA National Institute of Food and Agriculture 2015-67003-23485.
This paper was edited by Christian Folberth and reviewed by two anonymous referees.
Abramoff, R., Xu, X., Hartman, M., O'Brien, S., Feng, W., Davidson, E., Finzi, A., Moorhead, D., Schimel, J., Torn, M., and Mayes, M. A.: The Millennial model: in search of measurable pools and transformations for modeling soil carbon in the new century, Biogeochemistry, 137, 51–71, https://doi.org/10.1007/s10533-017-0409-7, 2017.
Adair, E. C., Parton, W. J., Del Grosso, S. J., Silver, W. L., Harmon, M. E., Hall, S. A., Burke, I. C., and Hart, S. C.: Simple three-pool model accurately describes patterns of long-term litter decomposition in diverse climates, Glob. Change Biol., 14, 2636–2660, https://doi.org/10.1111/j.1365-2486.2008.01674.x, 2008.
Allison, S. D.: Modeling adaptation of carbon use efficiency in microbial communities, Front. Microbiol., 5, 1–9, https://doi.org/10.3389/fmicb.2014.00571, 2014.
Auguie, B.: gridExtra: functions in Grid graphics, R Package Version 2.3, CRAN Project, 2017.
Averill, C. and Waring, B.: Nitrogen limitation of decomposition and decay: How can it occur?, Glob. Chang. Biol., 24, 1417–1427, https://doi.org/10.1111/gcb.13980, 2017.
Berg, B.: Litter decomposition and organic matter turnover in northern forest soils, For. Ecol. Manage., 133, 13–22, 2000.
Blagodatskaya, E., Blagodatsky, S., Anderson, T. H., and Kuzyakov, Y.: Microbial growth and carbon use efficiency in the rhizosphere and root-free soil, PLoS One, 9, e93282, https://doi.org/10.1371/journal.pone.0093282, 2014.
Bonan, G. B., Hartman, M. D., Parton, W. J., and Wieder, W. R.: Evaluating litter decomposition in earth system models with long-term litterbag experiments: an example using the Community Land Model version 4 (CLM4), Glob. Change Biol., 19, 957–74, https://doi.org/10.1111/gcb.12031, 2013.
Bradford, M. A., Wieder, W. R., Bonan, G. B., Fierer, N., Raymond, P. A., and Crowther, T. W.: Managing uncertainty in soil carbon feedbacks to climate change, Nat. Clim. Change, 6, 751–758, https://doi.org/10.1038/nclimate3071, 2016.
Bradford, M. A., Ciska, G. F., Bonis, A., Bradford, E. M., Classen, A. T., Cornelissen, J. H. C., Crowther, T. W., De Long, J. R., Freschet, G. T., Kardol, P., Manrubia-Freixa, M., Maynard, D. S., Newman, G. S., Logtestijn, R. S. P., Viketoft, M., Wardle, D. A., Wieder, W. R., Wood, S. A., and Van Der Putten, W. H.: A test of the hierarchical model of litter decomposition, Nat. Ecol. Evol., 1, 1836–1845, https://doi.org/10.1038/s41559-017-0367-4, 2017.
Brovkin, V., van Bodegom, P. M., Kleinen, T., Wirth, C., Cornwell, W. K., Cornelissen, J. H. C., and Kattge, J.: Plant-driven variation in decomposition rates improves projections of global litter stock distribution, Biogeosciences, 9, 565–576, https://doi.org/10.5194/bg-9-565-2012, 2012.
Cheng, W. and Kuzyakov, Y.: Root effects on soil organic matter decomposition, in Roots and soil management: interactions between roots and the soil, Agronomy monograph No. 48, 2005.
Cleveland, C. C. and Liptzin, D.: C : N : P stoichiometry in soil: is there a “Redfield ratio” for the microbial biomass?, Biogeochemistry, 85, 235–252, https://doi.org/10.1007/s10533-007-9132-0, 2007.
Colman, B. P. and Schimel, J. P.: Drivers of microbial respiration and net N mineralization at the continental scale, Soil Biol. Biochem., 60, 65–76, https://doi.org/10.1016/j.soilbio.2013.01.003, 2013.
Conant, R. T., Steinweg, J. M., Haddix, M. L., Paul, E. A., Plante, A. F. and Six, J.: Experimental warming shows that decomposition temperature sensitivity increase with soil organic matter recalcitrance, Ecology, 89, 2384–2391, 2008.
Cotrufo, M. F., Wallenstein, M. D., Boot, C. M., Denef, K., and Paul, E.: The Microbial Efficiency-Matrix Stabilization (MEMS) framework integrates plant litter decomposition with soil organic matter stabilization: Do labile plant inputs form stable soil organic matter?, Glob. Change Biol., 19, 988–995, https://doi.org/10.1111/gcb.12113, 2013.
Craine, J., Morrow, C., and Fierer, N.: Microbial nitrogen limitation increases decomposition, Ecology, 88, 2105–2113, 2007.
Dijkstra, F. A., Carrillo, Y., Pendall, E., and Morgan, J. A.: Rhizosphere priming: A nutrient perspective, Front. Microbiol., 4, 216, https://doi.org/10.3389/fmicb.2013.00216, 2013.
Dijkstra, P., Thomas, S. C., Heinrich, P. L., Koch, G. W., Schwartz, E., and Hungate, B. A.: Effect of temperature on metabolic activity of intact microbial communities: Evidence for altered metabolic pathway activity but not for increased maintenance respiration and reduced carbon use efficiency, Soil Biol. Biochem., 43, 2023–2031, https://doi.org/10.1016/j.soilbio.2011.05.018, 2011.
Doetterl, S., Stevens, A., Six, J., Merckx, R., Van Oost, K., Casanova Pinto, M., Casanova-Katny, A., Muñoz, C., Boudin, M., Zagal Venegas, E., and Boeckx, P.: Soil carbon storage controlled by interactions between geochemistry and climate, Nat. Geosci., 8, 780–783, https://doi.org/10.1038/ngeo2516, 2015.
Fatichi, S., Manzoni, S., Or, D., and Paschalis, A.: A Mechanistic Model of Microbially Mediated Soil Biogeochemical Processes: A Reality Check, Global Biogeochem. Cy., 33, 620–648, https://doi.org/10.1029/2018GB006077, 2019.
Frey, S. D., Lee, J., Melillo, J. M., and Six, J.: The temperature response of soil microbial efficiency and its feedback to climate, Nat. Clim. Chang., 3, 395–398, https://doi.org/10.1038/nclimate1796, 2013.
Georgiou, K., Abramoff, R. Z., Harte, J., Riley, W. J., and Torn, M. S.: Microbial community-level regulation explains soil carbon responses to long-term litter manipulations, Nat. Commun., 8, 1223, https://doi.org/10.1038/s41467-017-01116-z, 2017.
Geyer, K. M., Kyker-Snowman, E., Grandy, A. S., and Frey, S. D.: Microbial carbon use efficiency: accounting for population, community, and ecosystem-scale controls over the fate of metabolized organic matter, Biogeochemistry, 127, 173–188, https://doi.org/10.1007/s10533-016-0191-y, 2016.
Graham, E. B., Knelman, J. E., Schindlbacher, A., Siciliano, S., Breulmann, M., Yannarell, A., Beman, J. M., Abell, G., Philippot, L., Prosser, J., Foulquier, A., Yuste, J. C., Glanville, H. C., Jones, D. L., Angel, R., Salminen, J., Newton, R. J., Bürgmann, H., Ingram, L. J., Hamer, U., Siljanen, H. M. P., Peltoniemi, K., Potthast, K., Bañeras, L., Hartmann, M., Banerjee, S., Yu, R. Q., Nogaro, G., Richter, A., Koranda, M., Castle, S. C., Goberna, M., Song, B., Chatterjee, A., Nunes, O. C., Lopes, A. R., Cao, Y., Kaisermann, A., Hallin, S., Strickland, M. S., Garcia-Pausas, J., Barba, J., Kang, H., Isobe, K., Papaspyrou, S., Pastorelli, R., Lagomarsino, A., Lindström, E. S., Basiliko, N., and Nemergut, D. R.: Microbes as Engines of Ecosystem Function: When Does Community Structure Enhance Predictions of Ecosystem Processes?, Front. Microbiol., 7, 214, https://doi.org/10.3389/fmicb.2016.00214, 2016.
Grandy, A. S. and Neff, J. C.: Molecular C dynamics downstream: The biochemical decomposition sequence and its impact on soil organic matter structure and function, Sci. Total Environ., 404, 297–307, https://doi.org/10.1016/j.scitotenv.2007.11.013, 2008.
Grandy, A. S. and Robertson, G. P.: Land-use intensity effects on soil organic carbon accumulation rates and mechanisms, Ecosystems, 10, 58–73, https://doi.org/10.1007/s10021-006-9010-y, 2007.
Gruber, N. and Galloway, J. N.: An Earth-system perspective of the global nitrogen cycle, Nature, 451, 293–296, https://doi.org/10.1038/nature06592, 2008.
Guenet, B., Moyano, F. E., Peylin, P., Ciais, P., and Janssens, I. A.: Towards a representation of priming on soil carbon decomposition in the global land biosphere model ORCHIDEE (version 1.9.5.2), Geosci. Model Dev., 9, 841–855, https://doi.org/10.5194/gmd-9-841-2016, 2016.
Hararuk, O., Smith, M. J., and Luo, Y.: Microbial models with data-driven parameters predict stronger soil carbon responses to climate change, Glob. Chang. Biol., 2439–2453, https://doi.org/10.1111/gcb.12827, 2015.
Harmon, M. E., Silver, W. L., Fasth, B., Chen, H., Burke, I. C., Parton, W. J., Hart, S. C., Currie, W. S., and LIDET: Long-term patterns of mass loss during the decomposition of leaf and fine root litter: an intersite comparison, Glob. Chang. Biol., 15, 1320–1338, https://doi.org/10.1111/j.1365-2486.2008.01837.x, 2009.
Hassink, J., Bouwman, L. A., Zwart, K. B., Bloem, J., and Brussaard, L.: Relationships between soil texture, physical protection of organic matter, soil biota, and c and n mineralization in grassland soils, Geoderma, 57, 105–128, https://doi.org/10.1016/0016-7061(93)90150-J, 1993.
Hobbie, S. E., Eddy, W. C., Buyarski, C. R., Carol Adair, E., Ogdahl, M. L., and Weisenhorn, P.: Response of decomposing litter and its microbial community to multiple forms of nitrogen enrichment, Ecol. Monogr., 82, 389–405, https://doi.org/10.1890/11-1600.1, 2012.
Homann, P. S., Kapchinske, J. S., and Boyce, A.: Relations of mineral-soil C and N to climate and texture: Regional differences within the conterminous USA, Biogeochemistry, 85, 303–316, https://doi.org/10.1007/s10533-007-9139-6, 2007.
Huang, Y., Guenet, B., Ciais, P., Janssens, I. A., Soong, J. L., Wang, Y., Goll, D., Blagodatskaya, E., and Huang, Y.: ORCHIMIC (v1.0), a microbe-mediated model for soil organic matter decomposition, Geosci. Model Dev., 11, 2111–2138, https://doi.org/10.5194/gmd-11-2111-2018, 2018.
Jenny, H.: Factors of Soil Formation, Soil Sci., 281 pp., https://doi.org/10.1097/00010694-194111000-00009, 1941.
Jilling, A., Keiluweit, M., Contosta, A. R., Frey, S., Schimel, J., Schnecker, J., Smith, R. G., Tiemann, L., and Grandy, A. S.: Minerals in the rhizosphere: overlooked mediators of soil nitrogen availability to plants and microbes, Biogeochemistry, 139, 103–122, https://doi.org/10.1007/s10533-018-0459-5, 2018.
Jobbágy, E. G. and Jackson, R. B.: The vertical distribution of soil organic carbon and its relation to climate and vegetation, Ecol. Appl., 10, 423–436, https://doi.org/10.1890/1051-0761(2000)010[0423:TVDOSO]2.0.CO;2, 2000.
Kallenbach, C. M., Grandy, A., and Frey, S. D.: Direct evidence for microbial-derived soil organic matter formation and its ecophysiological controls, Nat. Commun., in revisio, 7, 13630, https://doi.org/10.1038/ncomms13630, 2016.
Kleber, M., Eusterhues, K., Keiluweit, M., Mikutta, C., Mikutta, R., and Nico, P. S.: Mineral-Organic Associations: Formation, Properties, and Relevance in Soil Environments, Adv. Agron., 130, 1–140, https://doi.org/10.1016/bs.agron.2014.10.005, 2015.
Koven, C. D., Hugelius, G., Lawrence, D. M., and Wieder, W. R.: Higher climatological temperature sensitivity of soil carbon in cold than warm climates, Nat. Clim. Change, 7, 817–822, https://doi.org/10.1038/nclimate3421, 2017.
Kyker-Snowman, E.: EmilyKykerSnowman/MIMICS-CN-for-publication v1.0 (Version v1.0), Zenodo, https://doi.org/10.5281/zenodo.3534562, 2019.
Lajtha, K., Bowden, R. D., Crow, S., Fekete, I., Kotroczo, Z., Plante, A., Simpson, M., and Nadelhoffer, K.: The Detrital Input and Removal Treatment (DIRT) Network, Elsevier Inc., 2017.
LeBauer, D. and Treseder, K.: Nitrogen Limitation of Net Primary Productivity, Ecology, 89, 371–379, https://doi.org/10.1016/j.agee.2013.04.020, 2008.
Lehmann, J. and Kleber, M.: The contentious nature of soil organic matter, Nature, 528, 60–68, https://doi.org/10.1038/nature16069, 2015.
Li, D., Schädel, C., Haddix, M. L., Paul, E. A., Conant, R., Li, J., Zhou, J., and Luo, Y.: Differential responses of soil organic carbon fractions to warming: Results from an analysis with data assimilation, Soil Biol. Biochem., 67, 24–30, https://doi.org/10.1016/j.soilbio.2013.07.008, 2013.
Luo, Y., Ahlström, A., Allison, S. D., Batjes, N. H., Brovkin, V., Carvalhais, N., Chappell, A., Ciais, P., Davidson, E. A., Finzi, A., Georgiou, K., Guenet, B., Hararuk, O., Harden, J. W., He, Y., Hopkins, F., Jiang, L., Koven, C., Jackson, R. B., Jones, C. D., Lara, M. J., Liang, J., Mcguire, A. D., Parton, W., Peng, C., Randerson, J. T., Salazar, A., Sierra, C. A., Smith, M. J., Tian, H., Todd-Brown, K. E. O., Torn, M., Groenigen, K. J., Wang, Y. P., West, T. O., Wei, Y., Wieder, W. R., Xia, J., Xu, X., Xu, X. and Zhou, T.: Toward more realistic projections of soil carbon dynamics by Earth system models, Global Biogeochem. Cy., 30, 40–56, https://doi.org/10.1002/2015GB005239, 2016.
von Lützow, M. and Kögel-Knabner, I.: Temperature sensitivity of soil organic matter decomposition-what do we know?, Biol. Fertil. Soils, 46, 1–15, https://doi.org/10.1007/s00374-009-0413-8, 2009.
Maynard, D. S., Crowther, T. W., and Bradford, M. A.: Fungal interactions reduce carbon use efficiency, Ecol. Lett., 20, 1034–1042, https://doi.org/10.1111/ele.12801, 2017.
Melillo, J. M., Aber, J. D., Linkins, A. E., Ricca, A., Fry, B., and Nadelhoffer, K. J.: Carbon and nitrogen dynamics along the decay continuum: Plant litter to soil organic matter, Plant. Soil, 115, 189–198, https://doi.org/10.1007/BF02202587, 1989.
Menichetti, L., Ågren, G. I., Barré, P., Moyano, F., and Kätterer, T.: Generic parameters of first-order kinetics accurately describe soil organic matter decay in bare fallow soils over a wide edaphic and climatic range, Sci. Rep., 9, 20319, https://doi.org/10.1038/s41598-019-55058-1, 2019.
Mikutta, R., Turner, S., Schippers, A., Gentsch, N., Meyer-Stüve, S., Condron, L. M., Peltzer, D. A., Richardson, S. J., Eger, A., Hempel, G., Kaiser, K., Klotzbücher, T., and Guggenberger, G.: Microbial and abiotic controls on mineral-associated organic matter in soil profiles along an ecosystem gradient, Sci. Rep., 9, 10294 , https://doi.org/10.1038/s41598-019-46501-4, 2019.
Miller, A. J., Amundson, R., Burke, I. C., and Yonker, C.: The effect of climate and cultivation on soil organic C and N, Biogeochemistry, 67, 57–72, https://doi.org/10.1023/B:BIOG.0000015302.16640.a5, 2004.
Molenaar, D., van Berlo, R., de Ridder, D., and Teusink, B.: Shifts in growth strategies reflect tradeoffs in cellular economics, Mol. Syst. Biol., 5, 323, https://doi.org/10.1038/msb.2009.82, 2009.
Mooshammer, M., Wanek, W., Zechmeister-Boltenstern, S., and Richter, A.: Stoichiometric imbalances between terrestrial decomposer communities and their resources: mechanisms and implications of microbial adaptations to their resources, Front. Microbiol., 5, 1–10, https://doi.org/10.3389/fmicb.2014.00022, 2014.
Parton, W., Silver, W. L., Burke, I. C., Grassens, L., Harmon, M. E., Currie, W. S., King, J. Y., Adair, E. C., Brandt, L. A., Hart, S. C., and Fasth, B.: Global-Scale Similarities in Nitrogen Release Patterns During Long-Term Decomposition, Science, 315, 361–364, 2007.
Pfeiffer, T., Schuster, S., and Bonhoeffer, S.: Cooperation and competition in the evolution of ATP-producing pathways, Science, 292, 504–507, https://doi.org/10.1126/science.1058079, 2001.
Phillips, R. P., Meier, I. C., Bernhardt, E. S., Grandy, S. A., Wickings, K., and Finzi, A. C.: Roots and fungi accelerate carbon and nitrogen cycling in forests exposed to elevated CO2, Ecol. Lett., 15, 1042–1049, https://doi.org/10.1111/j.1461-0248.2012.01827.x, 2012.
Plante, A. F., Conant, R. T., Carlson, J., Greenwood, R., Shulman, J. M., Haddix, M. L., and Paul, E. A.: Decomposition temperature sensitivity of isolated soil organic matter fractions, Soil Biol. Biochem., 42, 1991–1996, https://doi.org/10.1016/j.soilbio.2010.07.022, 2010.
Robertson, A. D., Paustian, K., Ogle, S., Wallenstein, M. D., Lugato, E., and Cotrufo, M. F.: Unifying soil organic matter formation and persistence frameworks: the MEMS model, Biogeosciences, 16, 1225–1248, https://doi.org/10.5194/bg-16-1225-2019, 2019.
Schimel, J.: Biogeochemical Models: Implicit versus Explicit Microbiology, Glob. Biogeochem. Cycles Clim. Syst., 177–183, https://doi.org/10.1016/B978-012631260-7/50015-7, 2001.
Schimel, J.: Microbes and global carbon, Nat. Clim. Change, 3, 867–868, https://doi.org/10.1038/nclimate2015, 2013.
Schimel, J. P. and Weintraub, M. N.: The implications of exoenzyme activity on microbial carbon and nitrogen limitation in soil: a theoretical model, Soil Biol. Biochem., 35, 549–563, doi:Doi 10.1016/S0038-0717(03)00015-4, 2003.
Schmidt, M. W. I., Torn, M. S., Abiven, S., Dittmar, T., Guggenberger, G., Janssens, I. A., Kleber, M., Kögel-Knabner, I., Lehmann, J., Manning, D. A. C., Nannipieri, P., Rasse, D. P., Weiner, S., and Trumbore, S. E.: Persistence of soil organic matter as an ecosystem property, Nature, 478, 49–56, https://doi.org/10.1038/nature10386, 2011.
Schulten, H. R. and Schnitzer, M.: The chemistry of soil organic nitrogen: A review, Biol. Fertil. Soils, 26, 1–15, https://doi.org/10.1007/s003740050335, 1997.
Sinsabaugh, R. L., Hill, B. H., and Follstad Shah, J. J.: Ecoenzymatic stoichiometry of microbial organic nutrient acquisition in soil and sediment, Nature, 462, 795–798, https://doi.org/10.1038/nature08632, 2009.
Sinsabaugh, R. L., Manzoni, S., Moorhead, D. L., and Richter, A.: Carbon use efficiency of microbial communities: stoichiometry, methodology and modelling., Ecol. Lett., 16, 930–9, https://doi.org/10.1111/ele.12113, 2013.
Sistla, S. A., Rastetter, E. B., and Schimel, J. P.: Responses of a tundra system to warming using SCAMPS: A stoichiometrically coupled, acclimating microbeplantsoil model, Ecol. Monogr., 84, 151–170, https://doi.org/10.1890/12-2119.1, 2014.
Six, J., Frey, S. D., Thiet, R. K., and Batten, K. M.: Bacterial and Fungal Contributions to Carbon Sequestration in Agroecosystems, Soil Sci. Soc. Am. J., 70, 555–569, https://doi.org/10.2136/sssaj2004.0347, 2006.
Smithwick, E. A. H., Mack, M. C., Turner, M. G., Chapin, F. S., Zhu, J., and Balser, T. C.: Spatial heterogeneity and soil nitrogen dynamics in a burned black spruce forest stand: Distinct controls at different scales, Biogeochemistry, 76, 517–537, https://doi.org/10.1007/s10533-005-0031-y, 2005.
Soetaert, K. and Herman, P. M. J.: A Practical Guide to Ecological Modelling. Using R as a Simulation Platform, Limnologica, 39, 260–261, https://doi.org/10.1016/s0075-9511(09)00026-7, 2009.
Soranno, P. A., Wagner, T., Collins, S. M., Lapierre, J., Lottig, N. R., and Oliver, S. K.: Spatial and temporal variation of ecosystem properties at macroscales, Ecol. Lett., 22, 1587–1598, https://doi.org/10.1111/ele.13346, 2019.
Steinweg, J. M., Plante, A. F., Conant, R. T., Paul, E. A., and Tanaka, D. L.: Patterns of substrate utilization during long-term incubations at different temperatures, Soil Biol. Biochem., 40, 2722–2728, https://doi.org/10.1016/j.soilbio.2008.07.002, 2008.
Stewart, C. E., Paustian, K., Conant, R. T., Plante, A. F., and Six, J.: Soil carbon saturation: Implications for measurable carbon pool dynamics in long-term incubations, Soil Biol. Biochem., 41, 357–366, https://doi.org/10.1016/j.soilbio.2008.11.011, 2009.
Sulman, B. N., Phillips, R. P., Oishi, A. C., Shevliakova, E., and Pacala, S. W.: Microbe-driven turnover offsets mineral-mediated storage of soil carbon under elevated CO2, Nat. Clim. Chang., 4, 1099–1102, https://doi.org/10.1038/NCLIMATE2436, 2014.
Sulman, B. N., Brzostek, E. R., Medici, C., Shevliakova, E., Menge, D. N. L., and Phillips, R. P.: Feedbacks between plant N demand and rhizosphere priming depend on type of mycorrhizal association, Ecol. Lett., 20, 1043–1053, https://doi.org/10.1111/ele.12802, 2017.
Sulman, B. N., Moore, J. A. M., Abramoff, R. Z., Averill, C., Kivlin, S., Georgiou, K., Sridhar, B., Hartman, M., Wang, G., Wieder, W. R., Bradford, M. A., Luo, Y., Mayes, M. A., Morrison, E., Riley, W. J., Salazar, A., Schimel, J. P., Tang, J., and Classen, A. T.: Multiple models and experiments underscore large uncertainty in soil carbon dynamics, Ecol. Lett., 14, 109–123, https://doi.org/10.1007/s10533-018-0509-z, 2018.
Sulman, B. N., Shevliakova, E., Brzostek, E. R., Kivlin, S. N., Malyshev, S., Menge, D. N. L., and Zhang, X.: Diverse Mycorrhizal Associations Enhance Terrestrial C Storage in a Global Model, Global Biogeochem. Cy., 33, 501–523, https://doi.org/10.1029/2018GB005973, 2019.
Thomas, R. Q., Brookshire, E. N. J., and Gerber, S.: Nitrogen limitation on land: How can it occur in Earth system models?, Glob. Chang. Biol., 21, 1777–1793, https://doi.org/10.1111/gcb.12813, 2015.
Todd-Brown, K. E. O., Randerson, J. T., Post, W. M., Hoffman, F. M., Tarnocai, C., Schuur, E. A. G., and Allison, S. D.: Causes of variation in soil carbon simulations from CMIP5 Earth system models and comparison with observations, Biogeosciences, 10, 1717–1736, https://doi.org/10.5194/bg-10-1717-2013, 2013.
Wang, G., Post, W. M., and Mayes, M. A.: Development of microbial-enzyme-mediated decomposition model parameters through steady-state and dynamic analyses, Ecol. Appl., 23, 255–272, https://doi.org/10.1890/12-0681.1, 2013.
Wang, G., Jagadamma, S., Mayes, M. A., Schadt, C. W., Steinweg, J. M., Gu, L., and Post, W. M.: Microbial dormancy improves development and experimental validation of ecosystem model, ISME J., 9, 226–237, https://doi.org/10.1038/ismej.2014.120, 2014a.
Wang, K., Peng, C., Zhu, Q., Zhou, X., Wang, M., Zhang, K., and Wang, G.: Modeling Global Soil Carbon and Soil Microbial Carbon by Integrating Microbial Processes into the Ecosystem Process Model TRIPLEX-GHG, J. Adv. Model. Earth Sy., 9, 2368–2384, https://doi.org/10.1002/2017MS000920, 2017.
Wang, Y. P., Chen, B. C., Wieder, W. R., Leite, M., Medlyn, B. E., Rasmussen, M., Smith, M. J., Agusto, F. B., Hoffman, F., and Luo, Y. Q.: Oscillatory behavior of two nonlinear microbial models of soil carbon decomposition, Biogeosciences, 11, 1817–1831, https://doi.org/10.5194/bg-11-1817-2014, 2014b.
Wang, Y. P., Jiang, J., Chen-Charpentier, B., Agusto, F. B., Hastings, A., Hoffman, F., Rasmussen, M., Smith, M. J., Todd-Brown, K., Wang, Y., Xu, X., and Luo, Y. Q.: Responses of two nonlinear microbial models to warming and increased carbon input, Biogeosciences, 13, 887–902, https://doi.org/10.5194/bg-13-887-2016, 2016.
Wickham, H.: Reshaping Data with the reshape Package, J. Stat. Softw., 21, 1–20, https://doi.org/10.18637/jss.v021.i12, 2007.
Wickham, H.: ggplot2: Elegant Graphics for Data Analysis, available at: https://cran.r-project.org/web/packages/ggplot2/citation.html (last access: 14 September 2020), 2016.
Wickham, H.: scales: Scale Functions for Visualization. R package version 1.0.0, available at: https://cran.r-project.org/package=scales (last access: 14 September 2020), 2018.
Wickings, K., Grandy, S. A., Reed, S. C., and Cleveland, C. C.: The origin of litter chemical complexity during decomposition., Ecol. Lett., 15, 1180–1188, https://doi.org/10.1111/j.1461-0248.2012.01837.x, 2012.
Wieder, W. R., Bonan, G. B., and Allison, S. D.: Global soil carbon projections are improved by modelling microbial processes, Nat. Clim. Change, 3, 909–912, https://doi.org/10.1038/nclimate1951, 2013.
Wieder, W. R., Grandy, A. S., Kallenbach, C. M., and Bonan, G. B.: Integrating microbial physiology and physio-chemical principles in soils with the MIcrobial-MIneral Carbon Stabilization (MIMICS) model, Biogeosciences, 11, 3899–3917, https://doi.org/10.5194/bg-11-3899-2014, 2014
Wieder, W. R., Cleveland, C. C., Smith, W. K., and Todd-Brown, K.: Future productivity and carbon storage limited by terrestrial nutrient availability, Nat. Geosci., 8, 441–444, https://doi.org/10.1038/ngeo2413, 2015a.
Wieder, W. R., Grandy, A. S., Kallenbach, C. M., Taylor, P. G., and Bonan, G. B.: Representing life in the Earth system with soil microbial functional traits in the MIMICS model, Geosci. Model Dev., 8, 1789–1808, https://doi.org/10.5194/gmd-8-1789-2015, 2015b.
Wieder, W. R., Hartman, M. D., Sulman, B. N., Wang, Y. P., Koven, C. D., and Bonan, G. B.: Carbon cycle confidence and uncertainty: Exploring variation among soil biogeochemical models, Glob. Chang. Biol., 24, 1563–1579, https://doi.org/10.1111/gcb.13979, 2018.
Wieder, W. R., Lawrence, D. M., Fisher, R. A., Bonan, G. B., Cheng, S. J., Goodale, C. L., Grandy, A. S., Koven, C. D., Lombardozzi, D. L., Oleson, K. W., and Thomas, R. Q.: Beyond static benchmarking: Using experimental manipulations to evaluate land model assumptions, 33, 1289–1309, 2019.
Wilke, C. O.: cowplot: Streamlined Plot Theme and Plot Annotations for “ggplot2”, R package version 0.7.0, available at: https://cran.r-project.org/web/packages/cowplot/index.html (last access: 18 October 2018), 2016.
Wutzler, T. and Reichstein, M.: Priming and substrate quality interactions in soil organic matter models, Biogeosciences, 10, 2089–2103, https://doi.org/10.5194/bg-10-2089-2013, 2013.
Xu, X., Thornton, P. E., and Post, W. M.: A global analysis of soil microbial biomass carbon, nitrogen and phosphorus in terrestrial ecosystems, Glob. Ecol. Biogeogr., 22, 737–749, https://doi.org/10.1111/geb.12029, 2013.
Zaehle, S. and Dalmonech, D.: Carbon-nitrogen interactions on land at global scales: Current understanding in modelling climate biosphere feedbacks, Curr. Opin. Environ. Sustain., 3, 311–320, https://doi.org/10.1016/j.cosust.2011.08.008, 2011.
Zaehle, S., Medlyn, B. E., De Kauwe, M. G., Walker, A. P., Dietze, M. C., Hickler, T., Luo, Y., Wang, Y. P., El-Masri, B., Thornton, P., Jain, A., Wang, S., Warlind, D., Weng, E., Parton, W., Iversen, C. M., Gallet-Budynek, A., McCarthy, H. R., Finzi, A., Hanson, P. J., Prentice, I. C., Oren, R. and Norby, R. J.: Evaluation of 11 terrestrial carbon-nitrogen cycle models against observations from two temperate Free-Air CO2 Enrichment studies, New Phytol., 202, 803–822, https://doi.org/10.1111/nph.12697, 2014.
Zaehle, S., Jones, C. D., Houlton, B., Lamarque, J. F., and Robertson, E.: Nitrogen availability reduces CMIP5 projections of twenty-first-century land carbon uptake, J. Clim., 28, 2494–2511, https://doi.org/10.1175/JCLI-D-13-00776.1, 2015.
Zak, D. R., Tilman, D., Parmenter, R. R., Rice, C. W., Fisher, F. M., Vose, J., Milchunas, D., and Martin, C. W.: Plant Production and Soil Microorganisms in Late-Succesional Ecosystems: A Continental-Scale Study, Ecology, 75, 2333–2347, 1994.
Zambrano-Bigiarini, M.: hydroGOF: Goodness-of-fit functions for comparison of simulated and observed hydrological time seriesR package version 0.3-10, Zenodo, https://doi.org/10.5281/zenodo.840087, 2017.