the Creative Commons Attribution 4.0 License.
the Creative Commons Attribution 4.0 License.
Ground subsidence effects on simulating dynamic high-latitude surface inundation under permafrost thaw using CLM5
Hanna Lee
David M. Lawrence
Sean C. Swenson
Catherine Prigent
Simulating surface inundation is particularly challenging for the high-latitude permafrost regions. Ice-rich permafrost thaw can create expanding thermokarst lakes as well as shrinking large wetlands. Such processes can have major biogeochemical implications and feedbacks to the climate system by altering the pathways and rates of permafrost carbon release. However, the processes associated with it have not yet been properly represented in Earth system models. We show a new model parameterization that allows direct representation of surface water dynamics in CLM (Community Land Model), the land surface model of several Earth System Models. Specifically, we coupled permafrost-thaw-induced ground subsidence and surface microtopography distribution to represent surface water dynamics in the high latitudes. Our results show increased surface water fractions around western Siberian plains and northeastern territories of Canada. Additionally, localized drainage events correspond well to severe ground subsidence events. Our parameterization is one of the first steps towards a process-oriented representation of surface hydrology, which is crucial to assess the biogeochemical feedbacks between land and the atmosphere under changing climate.
- Article
(3664 KB) - Full-text XML
-
Supplement
(926 KB) - BibTeX
- EndNote
Northern high latitudes experience pronounced warming due to Arctic amplification (Serreze and Francis, 2006). Within the last decades, temperature increase in the Arctic has been twice the amount of that in the tropics (Solomon et al., 2007). The abrupt increase in Arctic temperatures threatens to destabilize the global permafrost areas and can alter land surface structures, which can lead to releasing considerable amounts of permafrost carbon as greenhouse gases to the climate system (Schuur et al., 2008). Similarly, increased precipitation can accelerate the release of permafrost carbon in high latitudes (Chang et al., 2019; Grant et al., 2017). The balance between CO2 and CH4 release from permafrost depends largely on the organic matter decomposition pathway; larger inundated areas release more CH4 than CO2 using the anaerobic pathway but overall release of greenhouse gases is greater under aerobic conditions (Lee et al., 2014; Treat et al., 2015). However, for a future model estimate, Knoblauch et al. (2018) predicts twice as much permafrost carbon release in anoxic conditions (241±138 g CO2 kgC−1) compared to oxic conditions (113±58 g CO2 kgC−1) by 2100. The main natural sources of CH4 emissions are from tropical wetlands; however, the contributions from high-latitude wetlands are increasing each decade (Saunois et al., 2016) with further thawing of permafrost.
With a high percentage of surface wetland coverage (Grosse et al., 2013; Muster et al., 2017), characterizing high-latitude CH4 emissions requires detailed process representations in models. Besides surface wetland conditions, models should also properly estimate permafrost thaw stage (Malhotra and Roulet, 2015), changing surface topography (Olefeldt et al., 2013), and surface vegetation and microbial conditions (Grant et al., 2017) in order to improve estimations of surface CH4 emissions. However, Earth system models (ESMs) used in the future climate projections struggle to represent the complex physical or hydrological changes in the permafrost-covered high-latitude regions. Therefore, it is necessary to improve model representation of surface hydrology processes within the ESMs.
Permafrost processes have now been represented commonly within the land surface models (Lawrence et al., 2008; Gouttevin et al., 2012; Ekici et al., 2014; Chadburn et al., 2015); however, the complex hydrological feedbacks between degrading permafrost and thermokarst lake formations have been a major challenge. An extensive review of wetland modeling activities and an intercomparison effort of evaluating methane-modeling approaches are given in Wania et al. (2013) and Melton et al. (2013). These studies, however, do not include permafrost-specific features such as excess ice in frozen soils; therefore, they have tendency to under-represent key processes associated to permafrost thaw. Excess ice melt within the frozen soils can lead to abrupt changes in the surface topography, creating subsided ground levels, which can enhance pond formation often recognized as thermokarst formation. Such changes in surface microtopography can be very effective in altering the soil thermal and hydrological conditions (Zona et al., 2011).
Lee et al. (2014) implemented surface subsidence processes in the Community Land Model (CLM: Oleson et al., 2013; Lawrence et al., 2011; Swenson et al., 2012) to overcome some of the limitations in representing processes associated with permafrost thaw and subsequent land surface subsidence. The surface conditions altered by the subsidence events change the microtopography of the area, which can further modify the surface hydrological conditions in reality. Lee et al. (2014) did not further couple the land surface subsidence with hydrological processes to represent subsequent changes in local hydrology created under permafrost thawing. Here we developed a conceptual coupling of excess ice melting and subsequent land surface subsidence with hydrology and show how implementing permafrost-thaw-induced subsidence affects surface microtopography distribution and surface inundation in the CLM model.
Simulating the effects of permafrost thaw on surface water dynamics requires a complex interaction of thermodynamics and hydrology within the model. Here we use the 1∘ spatial resolution simulations of CLM5 (Lawrence et al., 2019) to represent such dynamics. CLM is a complex, process-based terrestrial ecosystem model simulating biogeophysical and biogeochemical processes within the soil and vegetation level. Lee et al. (2014) have presented the excess ice implementation into CLM. The ground excess ice data from International Circum-Arctic Map of Permafrost and Ground-Ice Conditions (Brown et al., 1997) are used to create an initial soil ice dataset to be prescribed into the model. This excess ice is added between 0.8 and 3.8 m in CLM soil scheme where permafrost exists and increases the relevant soil layer thicknesses. The amount of excess ice for each grid cell is estimated by multiplying percent permafrost area with the amount of excess ice from the Brown et al. (1997) dataset. The soil physical parameters (heat capacity and conductivity) are updated with the addition of excess ice. The excess ice in the model undergoes physical phase change but most importantly melting ice allows a first-order estimation of land surface subsidence under permafrost thaw. First the soil ice is allowed to melt and then the excess ice is subjected to phase change. Ice meltwater is then added the soil hydrology scheme in CLM and can be directed as runoff if it exceeds saturation. The soil layer thicknesses are then updated with the disappearing amount of excess ice. Lee et al.'s (2014) scheme does not allow the formation of excess ice after initialization.
In CLM, surface-inundated fraction (fh2osfc) of each grid cell is calculated by using the microtopography distribution (σmicro) and the surface water level (d) of the grid cell (Eqs. 1–3). Surface water is defined by a spatial scale elevation variation that is the microtopography. The microtopography is normally distributed around the grid cell mean elevation. The fractional area of the grid cell that is inundated (fh2osfc) can be calculated with the standard deviation of this microtopographic distribution. The surface-inundated fraction, in turn, affects the soil heat, water, or carbon fluxes with the atmosphere.
is the parameterization of surface-inundated fraction “fh2osfc” using an error function of surface water level “d” (height in meters relative to the grid cell mean elevation) and microtopography distribution “σmicro” (m).
is the microtopography distribution “σmicro” as a function of slope, where β is the prescribed topographic slope and “η” is an adjustable parameter.
is the adjustable coefficient β0 as a function of maximum topographical distribution “σmax”. The original value for σmax is 0.4, while η is −3.
This parameterization is similar to the TOPMODEL approach (Beven and Kirkby, 1979), where a hypsometric function is used to define the height of standing water (d) within the grid box by assuming a normal statistical distribution of ground-level microtopography. In this study, the subsidence levels from permafrost-thaw-induced excess ice melt are coupled with σmicro in order to represent the naturally occurring subsided landscapes within the permafrost-affected areas. With increasing excess ice melt, more subsidence occurs and the amount of subsidence redefines the surface σmicro, which is inversely related to fh2osfc (Eq. 1). Therefore, to represent increased fh2osfc, σmicro has to be decreased in value. However, σmicro is the statistical distribution of surface microtopography and hence cannot be directly related to physical subsidence levels. Therefore, a conceptual method of relating σmicro to an-order-of-magnitude-lower ground subsidence levels is used. (Eq. 4). This first step of conceptualization can be improved with subgrid-scale parameterization (Aas et al., 2019) in future studies.
New microsigma parameterization “” where “s” is the accumulated subsidence in meters and “b” is the adjustable parameter set to 10.
We implemented a conditional formulation regarding the severity of subsidence. In general, the surface is forced to allow more ponding of water with moderate levels of subsidence. However, advance levels of excess ice melt can degrade the surface levels so much that the small troughs created from the initial degradation can connect to create a drainage system that the grid box can no longer support any ponding (Liljedahl et al., 2016). For this reason, the excess ice melt has a reversed effect on σmicro after a threshold value of 0.5 m (Eq. 4). The choice of this threshold value is discussed in the following section.
We performed several experiments using CLM5 to assess the general response of surface hydrology to changing microsigma parameter values. First, the dependence of fh2osfc to σmicro is investigated by doubling σmicro (experiment: Sigma-2) and reducing it by half (experiment: Sigma-0.5). Afterwards, initialized with the default σmicro distribution (Fig. S1), the results of the new σmicro parameterization (experiment: Exice) are compared to the default model version (experiment: Control), where subsidence does not alter σmicro or fh2osfc, and to a satellite-driven data product (GIEMS, the Global Inundation Extent from Multiple Satellites; Prigent et al., 2012). All experiments include 155-year transient simulations following a spin-up procedure of repeating 1901–1930 climate forcing for 100 years. The transient 155-year simulation represents the time period from 1860 till 2015. CRUNCEP (Viovy, 2009), a combined dataset of Climate Research Unit (CRU) and National Center for Environmental Protection (NCEP) reanalysis datasets, is used as the atmospheric forcing for these experiments.
The GIEMS surface inundation dataset from Prigent et al. (2007, 2012) is used to compare the simulated inundated fractions. GIEMS uses a combination of satellite observations to derive the distribution and dynamics of the global surface water extent. The inundated areas are calculated using passive microwave observations from Special Sensor Microwave/Imager (SSM/I), active microwave observations from the scatterometer on board the European Remote Sensing (ERS) satellite, and the normalized difference vegetation index (NDVI) from the Advanced Very High resolution Radiometer (AVHRR). The dataset provides monthly-mean values of surface water area from 1993 to 2007, with a spatial resolution of 0.25∘. The dataset is spatially projected onto a 1∘ resolution grid for comparison with the model results.
In our experiments, surface inundation (fh2osfc) increases where surface microtopography distribution (σmicro) decreases (Fig. 1) as expected from the CLM parameterization. When σmicro decreases (Sigma-0.5) compared to the original value (shown in Supplement Fig. S1), it results in very high fh2osfc over western Siberia and Hudson Bay area, while increasing σmicro (Sigma-2) results in lower fh2osfc in general. In the original CLM parameterization, fh2osfc is calculated with a static microtopography index (Fig. S1) derived from a prescribed topographic slope dataset (Oleson et al., 2013).
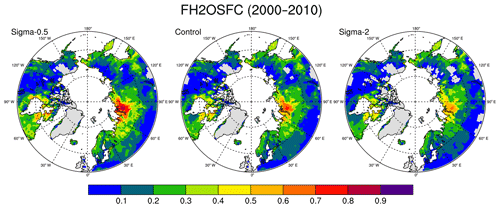
Figure 1High-latitude ( N) maps of simulated surface water fractions (fh2osfc) from the Control, Sigma-0.5, and Sigma-2.0 experiments with different σmicro distributions averaged for the period 2000–2010.
Our results illustrate the dependence of fh2osfc on σmicro and how a certain range of σmicro values can result in very high fh2osfc, and differences in fh2osfc can be quite regional (Fig. S2). This relation emphasizes the need for a dynamic circum-Arctic σmicro value to capture the natural variability of surface conditions when representing permafrost-thaw-associated hydrological changes. In the Exice experiment, coupling excess ice-melt-induced ground subsidence to σmicro leads to significant changes in surface hydrology (Fig. 2). In our simulations, σmicro is consistently lower in Exice compared to Control at the end of the 20th century (Fig. 2a). This is the model representation of increased variability in surface microtopography due to uneven subsidence events within the grid cell. Particularly larger inundated fractions are simulated around western Siberia and northeast Canada, which conform well to the observational datasets of peatland distribution (Tarnocai et al., 2007, 2009). Several other observational estimates agree on the spatial distribution of high-latitude peatlands, where most of the wetland formations are expected in the future (Melton et al., 2013). Therefore, the new parameterization of surface-inundated fraction is a stepping stone towards a more realistic representation of surface hydrology in permafrost-affected areas. Other modeling studies support these results with similar spatial patterns of surface wetland distributions (Wania et al., 2013; Melton et al., 2013). In the previous version of CLM, a simulated inundated area shows slightly different patterns (Riley et al., 2011), mainly due to non-process-based description of inundated fractions. We emphasize that although our parameterization is only conceptual, this is the first attempt towards coupling permafrost-thaw-associated land surface subsidence with hydrological changes in a land surface model within an ESM.
By introducing the effects of ground subsidence on σmicro, a dynamic inundated fraction is calculated. However, there is no observed dataset to evaluate the relation between subsidence and ground topography; therefore, an assumption had to be made regarding this coupling. In this study, changes in σmicro are proportional to the changes in ground subsidence with the difference in an order of magnitude. This assumption is put to test by doubling and halving the initial σmicro values, and the results show 10 % to 20 % change in surface-inundated fractions (Fig. 1). The difference in dynamic parameterization (Fig. 2b) stays in between these values and on average shows a 10 %–15 % increase, thus supporting the coupling assumption.
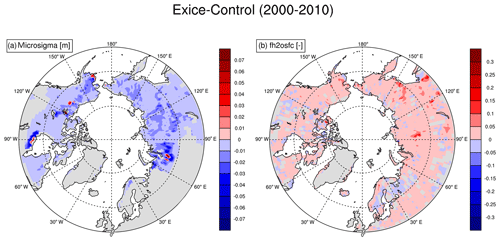
Figure 2Effects of coupled subsidence-microsigma parameterization on “σmicro” and “fh2osfc” from >50∘ N difference maps of the Exice–Control experiments for the period 2000–2010.
As expected, the fh2osfc and σmicro changes are related to the ground subsidence processes in most cases. Exice experiment produces land surface subsidence in some grid cells (Fig. 3) similar to the spatial patterns exhibited in σmicro and fh2osfc in Fig. 2, suggesting that melting of excess ice affects changes in surface hydrology. This is most pronounced around western Siberia, south of Hudson Bay, and around northwestern Canada and central Alaska, where initial excess ice was large (Lee et al., 2014). Simulated ground subsidence is associated to changes in fh2osfc described in Fig. 2.
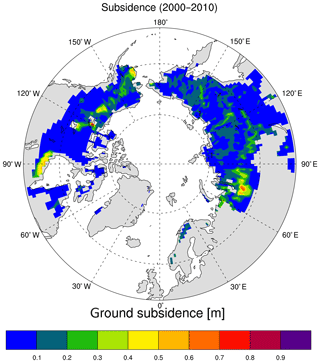
Figure 3High-latitude ( N) map of ground subsidence simulated from the Exice experiment averaged for the period 2000–2010.
As a result of subsidence threshold parameterization (see Methods), the reversed effect of excess ice melting is shown in the σmicro plots (Fig. 2a), where red points are directly related to the severe ground subsidence locations (Fig. 3). These areas consistently exhibit the abrupt melting of excess ice leading to increased σmicro. Larger negative deviations of σmicro from the original values were observed in central Alaska, northwestern Canada, south of Hudson Bay, southwest Russia, central Siberia, and the northern Yakutia regions of Russia (areas with dark blue in Fig. 2a). In reality, different landscapes should have a different threshold value, yet our work is aimed to capture the overall changes and general patterns rather than local conditions, so a preliminary choice of a single threshold value is used. Same areas show increased fh2osfc compared to Control (Fig. 2b). The largest increases in fh2osfc are observed in central Siberia and southeastern Russia, while some minor decreases in fh2osfc values are present in an unevenly distributed pattern. It is important to add that the choice of a 0.5 m threshold is arbitrary and can be modified according to the surface dataset of excess ice.
Spatially averaged time series of σmicro and fh2osfc show that in the Exice experiment σmicro decreases over time and fh2osfc shows a more dynamic change during the simulation (Fig. 4). The discrepancy in σmicro between Exice and Control in the beginning of the simulation is due to prior excess ice melting during the spin-up period (Fig. S3) and the values continue to decrease throughout the 20th century, while the decrease halts temporarily during 1960–1990 (microsigma–diff plot in Fig. 4).
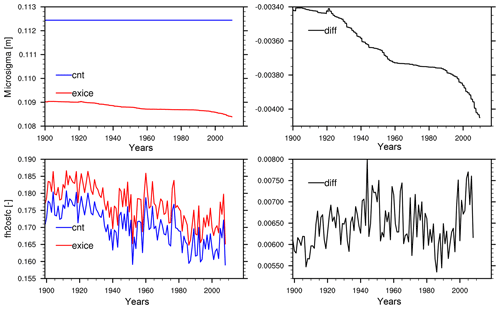
Figure 4Time series of spatially averaged high-latitude ( N) σmicro and annual maximum fh2osfc variables from Exice and Control experiments together with the time series of the Exice–Control difference (diff) for the period 1900–2010.
Model results show that fh2osfc is quite sensitive to the σmicro parameter. With the current knowledge, there is no perfect way to optimize the σmicro parameter for each grid box in global simulations; this is why we tried to estimate σmicro by coupling to other well-known physical processes like excess ice melt. Since there is no global dataset to directly compare it with our model results, one should be cautious when interpreting our model's contemporary and future estimates. One avenue to constrain our parameterization will be to use the terrestrial greenhouse gas fluxes in future studies.
Higher fh2osfc are observed in the Exice experiment; however, the differences between Exice and Control show a general increase throughout the simulation except in the period between 1960 and 1990. The spatially averaged fh2osfc values exhibit a nonlinear progression during the 20th century (Fig. 4). It is mainly the change in climate forcing that contributes to this trend. Analyzing the CRUNCEP atmospheric forcing data suggests that the precipitation pattern over the experiment domain shows a sudden reduction at the beginning of 1960s (Fig. S4). Even though the average precipitation starts increasing again, the lower values contribute to the reduced fh2osfc values. Similar changes occur with the patterns in atmospheric temperature (Fig. S4), which is a direct forcing for permafrost thaw and ground subsidence. A process-based representation of fh2osfc allows the model to naturally represent the temporal changes in climate. Hence, our representation of fh2osfc will improve the estimation of future surface hydrological states under changing climatic conditions.
The direct effects of the new model parameterization are better analyzed, while inspecting point-scale changes as shown in Fig. 5. The three selected points show a range of scenarios to observe the effects of subsidence on σmicro and fh2osfc. Point 1 has no change in subsidence during the simulation and with lower σmicro values in Exice (due to prior subsidence in spin-up), the difference in fh2osfc compared to the Control simulation is always positive, meaning higher surface-inundated fractions. In Point 2, Exice σmicro decreases due to the increase in subsidence during the simulation. These gradual changes are reflected in fh2osfc, where sudden increases are shown around 1935 and 1955, exactly when the subsidence changes occur. Similarly in Point 3, subsidence causes a lower σmicro in the beginning of the simulation; however the subsidence values surpass the 0.5 m threshold around 1920s, which causes the reversed effect on σmicro by increasing it compared to the Control experiment. Severe subsidence causing more drainage is represented in this way within our parameterization. The fh2osfc values show this drainage with a sudden decrease at 1920 and continuing with mostly negative values throughout the simulation. These scenarios support the validity of our new parameterization that can be used for any future climate scenario for a better representation of surface hydrology and subsidence coupling.
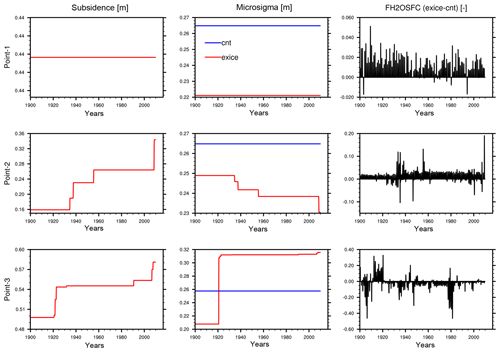
Figure 5Time series of subsidence, σmicro, and fh2osfc variables from the Exice and Control experiments at three selected sites. Point 1: 54∘ N, 272∘ E; Point 2: 64∘ N, 80∘ E; Point 3: 65∘ N, 70∘ E.
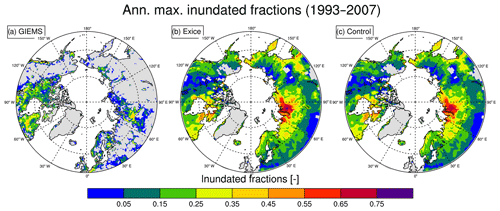
The GIEMS dataset (Prigent et al., 2012) provides the surface area of wetlands for each grid box. The fraction of wetland-covered grid box is calculated to compare it with the model results (Fig. 6). The range of estimated surface wetland fraction is different in the satellite dataset and model outputs; however, the spatial distribution of surface-inundated area is fairly comparable between the model and the satellite dataset. They both exhibit larger inundated fractions in western Siberia and around Hudson Bay. The ranges of estimated surface wetland fraction between the satellite dataset and model outputs are different due to differences in the definitions of inundated areas. However, spatial distribution of surface-inundated area is comparable between the model and the satellite dataset, where both exhibit larger inundated fractions in western Siberia and Hudson Bay. Since our model provides the fraction of grid box that is inundated, the satellite dataset had to be converted from actual wetland area to fractions. The GIEMS dataset assumes 773 km2 grid boxes all over the globe (Prigent et al., 2007), which creates grid-size problems compared to model grid box area. Another issue with such a comparison stems from the differences in the definition of inundated fraction. The GIEMS dataset uses satellite observations at different wavelengths to derive the wetland area, while the CLM creates the surface inundation with the topography index and water inputs to the grid box. Within the model parameterization, the height of the surface water level is calculated by a hypsometric function and the grid box fraction is further derived from the grid size. This allows an ever-existing surface-inundated fraction even in very dry grid boxes, whereas the GIEMS method underestimates the small wetlands comprising less than 10 % of the grid box area (Prigent et al., 2007); hence a model overestimation of satellite dataset is expected. Definition of modeled and satellite-derived inundated fraction is not the same. Unfortunately there is no standard definition (Reichhardt, 1995), which produces the struggle to find a proper observational dataset to evaluate model results. What we emphasize from our findings is, nevertheless, the spatial patterns of higher inundated fractions occurring at similar locations in model and satellite dataset (Fig. 6).
A warming climate affects the Arctic more severely than the rest of the globe. Increasing surface temperatures pose an important threat to the vulnerable high-latitude ecosystems. The degradation of Arctic permafrost due to increased soil temperatures leads to the release of permafrost carbon to the atmosphere and further strengthens the greenhouse warming (IPCC, 2013; Schuur et al., 2008). For future climate predictions, it is necessary to properly simulate the Arctic surface-inundated areas due to their physical and biogeochemical coupling with the atmosphere.
This study summarizes a new parameterization within the CLM to represent prognostic surface-inundated fractions under permafrost thawing using a conceptual approach that can lead to the implementation of a physical process-based parameterization. Coupling ground subsidence to surface microtopography distribution and hence allowing a natural link between surface hydrological conditions and soil thermodynamics resulted in generally increased surface-inundated fractions over the northern high latitudes, with larger surface-inundated fractions around western and far-east Siberian plains and northeastern Canada. Projected increase in global temperatures will inevitably cause more excess ice melting and subsequent ground subsidence; therefore, it will be necessary to incorporate a process-based parameterization to accurately account for future ground subsidence effects on surface hydrological states.
Our results confirm the enhancements of coupling ground subsidence and surface inundation to represent the temporal changes in surface hydrology reflected by soil physical states and the atmospheric forcing, which is much needed for a future scenario experiment. Here we conclude that our new parameterization is implemented successfully and functions globally for the CLM model in that the inundated areas exist in the same areas as the observational data. It can be used for future climate scenarios such as shown in Lee et al. (2014) with major subsidence events during the 21st century under a high warming scenario.
This new parameterization represents the first step towards a process-based representation of such hydrological processes in CLM. Using this parameterization, further work can proceed to investigate the biogeochemical feedbacks of permafrost greenhouse gas fluxes between land and atmosphere.
The code modifications to the CLM model in accordance with this paper are accessible through the Zenodo archive with the following link: https://doi.org/10.5281/zenodo.2652181 (Ekici, 2019).
The overall CLM model code can be obtained from the NCAR archives; the instructions on accessing the model code are given through this website: http://www.cesm.ucar.edu/models/cesm2/land/ (NCAR CESM2 archives, 2019, last access: 10 October 2019.).
The full set of model data will be made publicly available through the Norwegian Research Data Archive at https://archive.norstore.no (last access: 10 October 2019) upon publication.
The supplement related to this article is available online at: https://doi.org/10.5194/gmd-12-5291-2019-supplement.
AE and HL designed the experiments and AE carried them out. DML and SCS developed the main CLM model code and HL developed the previous version this model is based on. CP provided the GIEMS dataset. AE performed the simulations and prepared the paper with contributions from all co-authors.
The authors declare that they have no conflict of interest.
The simulations were performed on resources provided by UNINETT Sigma2-the National Infrastructure for High Performance Computing and Data Storage in Norway, accounts NS2345K and NN2345K.
This research has been supported by the Research Council of Norway projects PERMANOR (255331) and MOCABORS (255061) and NSF EaSM-L02170157.
This paper was edited by Min-Hui Lo and reviewed by four anonymous referees.
Aas, K. S., Martin, L., Nitzbon, J., Langer, M., Boike, J., Lee, H., Berntsen, T. K., and Westermann, S.: Thaw processes in ice-rich permafrost landscapes represented with laterally coupled tiles in a land surface model, The Cryosphere, 13, 591–609, https://doi.org/10.5194/tc-13-591-2019, 2019.
Beven, K. and Kirkby, M.: A physically based, variable contributing area model of basin hydrology, Hydrol. Sci. B., 24, 43–69, 1979.
Brown, J., Ferrians Jr., O. J., Heginbottom, J. A., and Melnikov, E. S.: Circum-Arctic Map of Permafrost and Ground-Ice Conditions version 2, Boulder, CO: National Snow and Ice Data Center, 1997.
Chadburn, S., Burke, E., Essery, R., Boike, J., Langer, M., Heikenfeld, M., Cox, P., and Friedlingstein, P.: An improved representation of physical permafrost dynamics in the JULES land-surface model, Geosci. Model Dev., 8, 1493–1508, https://doi.org/10.5194/gmd-8-1493-2015, 2015.
Chang, K.-Y., Riley, W. J., Crill, P. M., Grant, R. F., Rich, V. I., and Saleska, S. R.: Large carbon cycle sensitivities to climate across a permafrost thaw gradient in subarctic Sweden, The Cryosphere, 13, 647–663, https://doi.org/10.5194/tc-13-647-2019, 2019.
Ekici, A.: altugekici/clm_microsigma: first release (Version v1.0.0), Zenodo, https://doi.org/10.5281/zenodo.2652181, 2019.
Ekici, A., Beer, C., Hagemann, S., Boike, J., Langer, M., and Hauck, C.: Simulating high-latitude permafrost regions by the JSBACH terrestrial ecosystem model, Geosci. Model Dev., 7, 631–647, https://doi.org/10.5194/gmd-7-631-2014, 2014.
Gouttevin, I., Krinner, G., Ciais, P., Polcher, J., and Legout, C.: Multi-scale validation of a new soil freezing scheme for a land-surface model with physically-based hydrology, The Cryosphere, 6, 407–430, https://doi.org/10.5194/tc-6-407-2012, 2012.
Grant, R. F., Mekonnen, Z. A., Riley, W. J., Arora, B., and Torn, M. S.: Mathematical Modelling of Arctic Polygonal Tundra with Ecosys: 2. Microtopography Determines How CO2 and CH4 Exchange Responds to Changes in Temperature and Precipitation, J. Geophys. Res.-Biogeo., 122, 3174–3187, https://doi.org/10.1002/2017JG004037, 2017.
Grosse, G., Jones, B., and Arp, C.: Thermokarst Lakes, Drainage, and Drained Basins, Elsevier, Amsterdam, The Netherlands, 2013.
IPCC: Climate Change 2013: The Physical Science Basis, Contribution of Working Group I to the Fifth Assessment Report of the Intergovernmental Panel on Climate Change, edited by: Stocker, T. F., Qin, D., Plattner, G.-K., Tignor, M., Allen, S. K., Boschung, J., Nauels, A., Xia, Y., Bex, V., and Midgley, P. M., Cambridge University Press, Cambridge, United Kingdom and New York, NY, USA, 1535 pp., https://doi.org/10.1017/CBO9781107415324, 2013.
Knoblauch, C., Beer, C., Liebner, S., Grigoriev, M. N., and Pfeiffer, E. M.: Methane production as key to the greenhouse gas budget of thawing permafrost, Nat. Clim. Change, 8, 309–312, https://doi.org/10.1038/s41558-018-0095-z, 2018.
Lawrence, D. M., Slater, A. G., Romanovsky, V. E., and Nicolsky, D. J.: Sensitivity of a model projection of near-surface permafrost degradation to soil column depth and representation of soil organic matter, J. Geophys. Res., 113, 1–14, 2008.
Lawrence, D. M., Oleson, K. W., Flanner, M. G., Thornton, P. E., Swenson, S. C., Lawrence, P. J., Zeng, X., Yang, Z. L., Levis, S., Sakaguchi, K., and Bonan, G. B.: Parameterization improvements and functional and structural advances in version 4 of the Community Land Model, J. Adv. Model. Earth Sy., 3, M03001, https://doi.org/10.1029/2011MS00045, 2011.
Lawrence, D. M., Fisher, R. A., Koven, C. D., Oleson, K. W., Swenson, S. C., Bonan, G., Collier, N., Ghimire, B., van Kampenhout, L., Kennedy, D., and Kluzek, E.: The Community Land Model version 5: Description of new features, benchmarking, and impact of forcing uncertainty, J. Adv. Model. Earth Sy., https://doi.org/10.1029/2018MS001583, online first, 2019.
Lee, H., Swenson, S. C., Slater, A. G., and Lawrence, D. M.: Effects of excess ground ice on projections of permafrost in a warming climate, Environ. Res. Lett., 9 124006, https://doi.org/https://doi.org/10.1088/1748-9326/9/12/124006, 2014.
Liljedahl, A. K., Boike, J., Daanen, R. P., Fedorov, A. N., Frost, G. V., Grosse, G., Hinzman, L. D., Iijma, Y., Jorgenson, J. C., Matveyeva, N., and Necsoiu, M.: Pan-Arctic ice-wedge degradation in warming permafrost and its influence on tundra hydrology, Nat. Geosci., 9, 312–318, 2016.
Malhotra, A. and Roulet, N. T.: Environmental correlates of peatland carbon fluxes in a thawing landscape: do transitional thaw stages matter?, Biogeosciences, 12, 3119–3130, https://doi.org/10.5194/bg-12-3119-2015, 2015.
Melton, J. R., Wania, R., Hodson, E. L., Poulter, B., Ringeval, B., Spahni, R., Bohn, T., Avis, C. A., Beerling, D. J., Chen, G., Eliseev, A. V., Denisov, S. N., Hopcroft, P. O., Lettenmaier, D. P., Riley, W. J., Singarayer, J. S., Subin, Z. M., Tian, H., Zürcher, S., Brovkin, V., van Bodegom, P. M., Kleinen, T., Yu, Z. C., and Kaplan, J. O.: Present state of global wetland extent and wetland methane modelling: conclusions from a model inter-comparison project (WETCHIMP), Biogeosciences, 10, 753–788, https://doi.org/10.5194/bg-10-753-2013, 2013.
Muster, S., Roth, K., Langer, M., Lange, S., Cresto Aleina, F., Bartsch, A., Morgenstern, A., Grosse, G., Jones, B., Sannel, A. B. K., Sjöberg, Y., Günther, F., Andresen, C., Veremeeva, A., Lindgren, P. R., Bouchard, F., Lara, M. J., Fortier, D., Charbonneau, S., Virtanen, T. A., Hugelius, G., Palmtag, J., Siewert, M. B., Riley, W. J., Koven, C. D., and Boike, J.: PeRL: a circum-Arctic Permafrost Region Pond and Lake database, Earth Syst. Sci. Data, 9, 317–348, https://doi.org/10.5194/essd-9-317-2017, 2017.
NCAR CESM2 archives: http://www.cesm.ucar.edu/models/cesm2/land, last access: 10 October 2019.
Olefeldt, D., Turetsky, M. R., Crill, P. M., and Mcguire, A. D.: Environmental and physical controls on northern terrestrial methane emissions across permafrost zones, Glob. Change Biol., 19, 589–603, https://doi.org/10.1111/gcb.12071, 2013.
Oleson, K. W., Lawrence, D. M., Bonan, G. B., Drewniak, B., Huang, M., Koven, C. D., Levis, S., Li, F., Riley, W. J., Subin, Z. M., Swenson, S. C., Thornton, P. E., Bozbiyik, A., Fisher, R., Kluzek, E., Lamarque, J. -F., Lawrence, P. J., Leung, L. R., Lipscomb, W., Muszala, S., Ricciuto, D. M., Sacks, W., Sun, Y., Tang, J., and Yang, Z.-L: Technical Description of version 4.5 of the Community Land Model (CLM), Ncar Technical Note NCAR/TN-503+STR, National Center for Atmospheric Research, Boulder, CO, 422 pp., https://doi.org/10.5065/D6RR1W7M, 2013.
Prigent, C., Papa, F., Aires, F., Rossow, W. B., and Matthews, E.: Global inundation dynamics inferred from multiple satellite observations, 1993–2000, J. Geophys. Res.-Atmos., 112, 112, D12107, https://doi.org/10.1029/2006JD007847, 2007.
Prigent, C., Papa, F., Aires, F., Jimenez, C., Rossow, W. B., and Matthews, E.: Changes in land surface water dynamics since the 1990s and relation to population pressure, Geophys. Res. Let., 39, L08403, https://doi.org/10.1029/2012GL051276, 2012.
Reichhardt, T.: Academy under fire on “wetlands” definition, Nature, 375, 171–171, 1995.
Riley, W. J., Subin, Z. M., Lawrence, D. M., Swenson, S. C., Torn, M. S., Meng, L., Mahowald, N. M., and Hess, P.: Barriers to predicting changes in global terrestrial methane fluxes: analyses using CLM4Me, a methane biogeochemistry model integrated in CESM, Biogeosciences, 8, 1925–1953, https://doi.org/10.5194/bg-8-1925-2011, 2011.
Saunois, M., Bousquet, P., Poulter, B., Peregon, A., Ciais, P., Canadell, J. G., Dlugokencky, E. J., Etiope, G., Bastviken, D., Houweling, S., Janssens-Maenhout, G., Tubiello, F. N., Castaldi, S., Jackson, R. B., Alexe, M., Arora, V. K., Beerling, D. J., Bergamaschi, P., Blake, D. R., Brailsford, G., Brovkin, V., Bruhwiler, L., Crevoisier, C., Crill, P., Covey, K., Curry, C., Frankenberg, C., Gedney, N., Höglund-Isaksson, L., Ishizawa, M., Ito, A., Joos, F., Kim, H.-S., Kleinen, T., Krummel, P., Lamarque, J.-F., Langenfelds, R., Locatelli, R., Machida, T., Maksyutov, S., McDonald, K. C., Marshall, J., Melton, J. R., Morino, I., Naik, V., O'Doherty, S., Parmentier, F.-J. W., Patra, P. K., Peng, C., Peng, S., Peters, G. P., Pison, I., Prigent, C., Prinn, R., Ramonet, M., Riley, W. J., Saito, M., Santini, M., Schroeder, R., Simpson, I. J., Spahni, R., Steele, P., Takizawa, A., Thornton, B. F., Tian, H., Tohjima, Y., Viovy, N., Voulgarakis, A., van Weele, M., van der Werf, G. R., Weiss, R., Wiedinmyer, C., Wilton, D. J., Wiltshire, A., Worthy, D., Wunch, D., Xu, X., Yoshida, Y., Zhang, B., Zhang, Z., and Zhu, Q.: The global methane budget 2000–2012, Earth Syst. Sci. Data, 8, 697–751, https://doi.org/10.5194/essd-8-697-2016, 2016.
Schuur, E. A., Bockheim, J., Canadell, J. G., Euskirchen, E., Field, C. B., Goryachkin, S. V., Hagemann, S., Kuhry, P., Lafleur, P. M., Lee, H., and Mazhitova, G.: Vulnerability of permafrost carbon to climate change: Implications for the global carbon cycle, AIBS Bulletin, 58, 701–714, 2008.
Serreze, M. C. and Francis, J. A.: The Arctic amplification debate, Climatic Change, 76, 241–264, 2006.
Solomon, S., Qin, D., Manning, M., Averyt, K., and Marquis, M. (Eds.): Climate change 2007-the physical science basis: Working group I contribution to the fourth assessment report of the IPCC (Vol. 4), Cambridge university press, 2007.
Swenson, S. C., Lawrence, D. M., and Lee, H.: Improved simulation of the terrestrial hydrological cycle in permafrost regions by the Community Land Model, J. Adv. Model. Earth Sy., 4, M08002, https://doi.org/10.1029/2012MS000165, 2012.
Tarnocai, C., Swanson, D., Kimble, J., and Broll, J.: Northern Circumpolar Soil Carbon Database, Tech. Rep. Version 1, Research Branch, Agriculture and Agri-Food Canada, available at: http://wms1.agr.gc.ca/NortherCircumpolar/northercircumpolar.zip (last access: 1 October 2012), 2007.
Tarnocai, C., Canadell, J. G., Schuur, E. A. G., Kuhry, P., Mazhitova, G., and Zimov, S.: Soil organic carbon pools in the northern circumpolar permafrost region, Global Biogeochem. Cy., 23, GB2023, https://doi.org/10.1029/2008GB003327, 2009.
Treat, C. C., Natali, S. M., Ernakovich, J., Iversen, C. M., Lupascu, M., McGuire, A. D., Norby, R. J., Roy Chowdhury, T., Richter, A., Šantrůčková, H., and Schädel, C.: A pan-Arctic synthesis of CH4 and CO2 production from anoxic soil incubations, Glob. Change Biol., 21, 2787–2803, 2015.
Viovy, N.: CRUNCEP data set, available at: ftp://nacp.ornl.gov/synthesis/2009/frescati/temp/land_use_change/original/readme.htm (last access: 11 December 2017), 2009.
Wania, R., Melton, J. R., Hodson, E. L., Poulter, B., Ringeval, B., Spahni, R., Bohn, T., Avis, C. A., Chen, G., Eliseev, A. V., Hopcroft, P. O., Riley, W. J., Subin, Z. M., Tian, H., van Bodegom, P. M., Kleinen, T., Yu, Z. C., Singarayer, J. S., Zürcher, S., Lettenmaier, D. P., Beerling, D. J., Denisov, S. N., Prigent, C., Papa, F., and Kaplan, J. O.: Present state of global wetland extent and wetland methane modelling: methodology of a model inter-comparison project (WETCHIMP), Geosci. Model Dev., 6, 617–641, https://doi.org/10.5194/gmd-6-617-2013, 2013.
Zona, D., Lipson, D. A., Zulueta, R. C., Oberbauer, S. F., and Oechel, W. C.: Microtopographic controls on ecosystem functioning in the Arctic Coastal Plain, J. Geophys. Res.-Biogeo., 116, G00I08, https://doi.org/10.1029/2009JG001241, 2011.


