the Creative Commons Attribution 4.0 License.
the Creative Commons Attribution 4.0 License.
 | 05 Jul 2018
The Interactive Stratospheric Aerosol Model Intercomparison Project (ISA-MIP): motivation and experimental design
Claudia Timmreck
Graham W. Mann
Valentina Aquila
Rene Hommel
Lindsay A. Lee
Anja Schmidt
Christoph Brühl
Simon Carn
Mian Chin
Sandip S. Dhomse
Thomas Diehl
Jason M. English
Michael J. Mills
Ryan Neely
Jianxiong Sheng
Matthew Toohey
Debra Weisenstein
The Stratospheric Sulfur and its Role in Climate (SSiRC) Interactive Stratospheric Aerosol Model Intercomparison Project (ISA-MIP) explores uncertainties in the processes that connect volcanic emission of sulfur gas species and the radiative forcing associated with the resulting enhancement of the stratospheric aerosol layer. The central aim of ISA-MIP is to constrain and improve interactive stratospheric aerosol models and reduce uncertainties in the stratospheric aerosol forcing by comparing results of standardized model experiments with a range of observations. In this paper we present four co-ordinated inter-model experiments designed to investigate key processes which influence the formation and temporal development of stratospheric aerosol in different time periods of the observational record. The Background (BG) experiment will focus on microphysics and transport processes under volcanically quiescent conditions, when the stratospheric aerosol is controlled by the transport of aerosols and their precursors from the troposphere to the stratosphere. The Transient Aerosol Record (TAR) experiment will explore the role of small- to moderate-magnitude volcanic eruptions, anthropogenic sulfur emissions, and transport processes over the period 1998–2012 and their role in the warming hiatus. Two further experiments will investigate the stratospheric sulfate aerosol evolution after major volcanic eruptions. The Historical Eruptions SO2 Emission Assessment (HErSEA) experiment will focus on the uncertainty in the initial emission of recent large-magnitude volcanic eruptions, while the Pinatubo Emulation in Multiple models (PoEMS) experiment will provide a comprehensive uncertainty analysis of the radiative forcing from the 1991 Mt Pinatubo eruption.
- Article
(2279 KB) - Full-text XML
-
Supplement
(267 KB) - BibTeX
- EndNote


Stratospheric aerosol is an important component of the Earth system, which influences atmospheric radiative transfer, composition, and dynamics, thereby modulating the climate. The effects of stratospheric aerosol on climate are especially evident when the opacity of the stratospheric aerosol layer is significantly increased after volcanic eruptions. Through changes in the radiative properties of the stratospheric aerosol layer, volcanic eruptions are a significant driver of climate variability (e.g. Myhre et al., 2013; Zanchettin et al., 2016). Major volcanic eruptions inject vast amounts of SO2 into the stratosphere, which is converted into sulfuric acid aerosol with an e-folding time of about a month, which might be prolonged due to OH depletion within the dense SO2 cloud in the first weeks following a large volcanic eruption (Mills et al., 2017).
Observations show that the stratospheric aerosol layer remains enhanced for several years after major eruptions (SPARC, 2006). Such long-lasting volcanic perturbations cool the Earth's surface by scattering incoming solar radiation and warm the stratosphere by the absorption of infrared solar and long-wave terrestrial radiation which affect the dynamical structure as well as the chemical composition of the atmosphere (e.g. Robock, 2000; Timmreck, 2012). The consequent heating of the stratospheric sulfate layer, impacts stratospheric dynamics in various ways. It amplifies the Brewer–Dobson circulation (BDC) and modifies the equator-to-pole temperature gradient, driving changes in geostrophic zonal winds and the propagation of atmospheric waves (e.g. Bittner et al., 2016; Toohey et al., 2014) and strengthening the polar vortex (e.g. Charlton-Perez et al., 2013). The heating from continued SO2 injection to the stratosphere may further disturb or even “shut down” the quasi-biennial oscillation (QBO) (e.g. Aquila et al., 2014; Niemeier and Schmidt, 2017). The radiatively driven changes also influence the transport and the lifetime of long-lived species (N2O, CH4) (Pitari et al., 2016a; Visioni et al., 2017). The enhanced stratospheric aerosol layer after large volcanic eruptions also causes large mean age-of-air variations on timescales of several years (e.g. Ray et al., 2014; Muthers et al., 2016; Garfinkel et al., 2017).
As the ocean has a much longer memory than the atmosphere, large volcanic eruptions could have a long-lasting impact on the climate system that extends beyond the duration of the volcanic forcing (e.g., Zanchettin et al., 2012; Swingedouw et al., 2017). The chemical and radiative effects of the stratospheric aerosol are strongly influenced by its particle size distribution. Heterogeneous chemical reactions, which most notably lead to substantial ozone depletion (e.g. WMO/UNEP, 2007, chap. 3), take place on the surface of the stratospheric aerosol particles and are dependent on the aerosol surface area density. Aerosol particle size determines the scattering efficiency of the particles (e.g. Lacis et al., 1992) and their atmospheric lifetime (e.g., Pinto et al., 1989; Timmreck et al., 2010). Smaller-magnitude eruptions than the 1991 Mt Pinatubo eruption can also have significant impacts on climate. It is now established that a series of relatively small-magnitude volcanic eruptions caused the increase in stratospheric aerosol observed between 2000 and 2010 based on ground and satellite-borne observations (Vernier et al., 2011b; Neely III et al., 2013). Studies have suggested that this increase in stratospheric aerosol partly counteracted the warming due to increased greenhouse gases over that period (e.g. Solomon et al., 2011; Ridley et al., 2014; Santer et al., 2015). Small to moderate volcanic eruptions after 2008 also show an impact on the stratospheric circulation in the Northern Hemisphere, in particular on the pattern of decadal mean age variability and its trends during 2002–2011 (Diallo et al., 2017). Since the 2006 SPARC Assessment of Stratospheric Aerosol Properties Report (SPARC, 2006, herein referred to as ASAP2006) the increase in observations of stratospheric aerosol and its precursor gases and in the number of models which treat stratospheric aerosol interactively has advanced scientific understanding of the stratospheric aerosol layer and its effects on the climate (Kremser et al., 2016, herein referred to as KTH2016). In particular, research findings have given to the community a greater awareness of the role of the tropical tropopause layer (TTL) as a distinct pathway for transport into the stratosphere, of the interactions between stratospheric composition and dynamics, and of the importance of moderate-magnitude eruptions in influencing the stratospheric aerosol loading. In addition, over the last decade several new satellite instruments producing observations relevant to the stratospheric aerosol layer have become operational. For example, we now have a 2002–2012 record of global altitude-resolved SO2, carbonyl sulfide (OCS) and aerosol volume density measurements provided by the Michelson Interferometer for Passive Atmospheric Sounding Environmental Satellite (MIPAS ENVISAT; Höpfner et al., 2013, 2015; Glatthor et al., 2015; Günther et al., 2018). Furthermore aerosol extinction vertical profiles are available from limb-profiling instruments, such as the Scanning Imaging Absorption Spectrometer for Atmospheric Chartography (SCIAMACHY; 2002–2012; Bovensmann et al., 1999; von Savigny et al., 2015), the Optical Spectrograph and InfraRed Imager System (OSIRIS; 2001–present; Bourassa et al., 2007), and the Ozone Mapping and Profiler Suite–Limb Profiler (OMPS-LP; 2011–present; Rault and Loughman, 2013), and from the active sensor lidar measurements such as the Cloud-Aerosol Transport System (CATS; 2015–present; Yorks et al., 2015) and Cloud-Aerosol Lidar with Orthogonal Polarization (CALIOP; 2006-present; Vernier et al., 2009). Existing measurements have become more robust, for example by homogenizing the observations of aerosol properties derived from optical particle counter (OPC) and satellite measurements during stratospheric aerosol background periods (Kovilakam and Deshler, 2015), which previously showed large differences (Thomason et al., 2008). Other efforts include combining and comparing different satellite data sets (e.g. Rieger et al., 2015). However, some notable discrepancies still exist between different measurement data sets. For example, Reeves et al. (2008) showed that aircraft-borne Focused Cavity Aerosol Spectrometer (FCAS) measurements of the particle size distribution during the late 1990s yield surface area densities a factor 1.5 to 3 higher than that derived from Stratospheric Aerosol and Gases Experiment (SAGE-II) measurements.
On the modelling side there has been an increasing amount of global three-dimensional stratospheric aerosol models developed within the last years and used by research teams around the world (KTH2016). The majority of these global models explicitly simulate aerosol microphysical processes and treat the full life cycle of stratospheric aerosol, from the initial injection of sulfur-containing gases and their transformation into aerosol particles to their final removal from the stratosphere. Several of these models also include the interactive coupling between aerosol microphysics, atmospheric chemistry, dynamics, and radiation.
Given the improvements in observations and modelling of stratospheric aerosol since ASAP2006, we anticipate further advances in our understanding of stratospheric aerosol by combining the recent observational record with results from the current community of interactive stratospheric aerosol models. An Interactive Stratospheric Aerosol Model Intercomparison Project (ISA-MIP) has therefore been developed within the Stratospheric Sulfur and its Role in Climate (SSiRC) framework. The SPARC activity SSiRC (http://www.sparc-ssirc.org, last access: 26 June 2018) was initiated with the goal of reducing uncertainties in the properties of stratospheric aerosol and assessing its climate forcing. In particular, constraining simulations of historical eruptions with available observational data sets gives the potential to evaluate and substantially improve the accuracy of the volcanic forcing data sets used in climate models. This will not only enhance consistency with observed stratospheric aerosol properties and the underlying microphysical, chemical, and dynamical processes but also improve their conceptual understanding. The use of such new volcanic forcing data sets has the potential to increase the reliability of the simulated climate impacts of volcanic eruptions, which have been identified as a major influence on decadal global mean surface temperature trends in climate models (Marotzke and Forster, 2015).
The first international model inter-comparison of global stratospheric aerosol models was carried out within ASAP2006 and indicated that model simulations and satellite observations of stratospheric background aerosol extinction agree reasonably well in the visible wavelengths but not in the infrared. It also highlighted systematic differences between modelled and retrieved aerosol size, which have later been linked to shortcomings in the retrieval methods with regard to the detection of Aitken mode sized particles(R < 50 nm) in the lower stratosphere (Thomason et al., 2008; Reeves et al., 2008; Hommel et al., 2011). While in ASAP2006, only five global two- and three-dimensional stratospheric aerosol models were included in the analysis, there are today more than 15 global three-dimensional models available worldwide (KTH2016). No large comprehensive model intercomparison has ever been carried out to identify differences in stratospheric aerosol properties amongst these new interactive models. The models often show significant differences in terms of their simulated transport, chemistry, and removal of aerosols with inter-model differences in stratospheric circulation, radiative dynamical interactions, and exchange with the troposphere likely to play an important role (e.g. Aquila et al., 2012; Niemeier and Timmreck, 2015). The formulation of microphysical processes is also important (e.g. English et al., 2013), as are differing assumptions regarding the sources of stratospheric aerosols and their precursors. A combination of these effects likely explain the large inter-model differences as seen in Fig. 1 among the global stratospheric aerosol models which participated in the Tambora intercomparison, a precursor to the “consensus volcanic forcings” aspects of the CMIP6 Model Intercomparison Project on the climatic response to volcanic forcing (VolMIP; Zanchettin et al., 2016; Marshall et al., 2018). Even for the relatively recent 1991 Mt Pinatubo eruption, to reach the best agreement with observations, interactive stratospheric models have used a wide range of SO2 injections amounts, from as low at 10 Tg SO2 (Dhomse et al., 2014; Mills et al., 2016) to as high as 20 Tg SO2 (e.g. Aquila et al., 2012; English et al., 2013).
Volcanic eruptions are commonly taken as a real-world analogue for hypothesized geoengineering via stratospheric sulfur solar radiation management (SS-SRM). Indeed many of the assumptions and uncertainties related to simulated volcanic perturbations of stratospheric aerosol are also frequently given as caveats around research findings from modelling studies which seek to quantify the likely effects from SS-SRM (e.g. National Research Council, 2015), the mechanism steps between sulfur injection and radiative cooling being common to both aspects (Robock et al., 2013). We expect the analysis of the ISA-MIP experiments to improve our understanding of model sensitivities to key sources of uncertainty and to inform the interpretation of coupled climate model simulations and the next Intergovernmental Panel on Climate Change (IPCC) assessment. It will also provide a foundation for co-operation to assess the atmospheric and climate changes when the next large-magnitude eruption takes place.
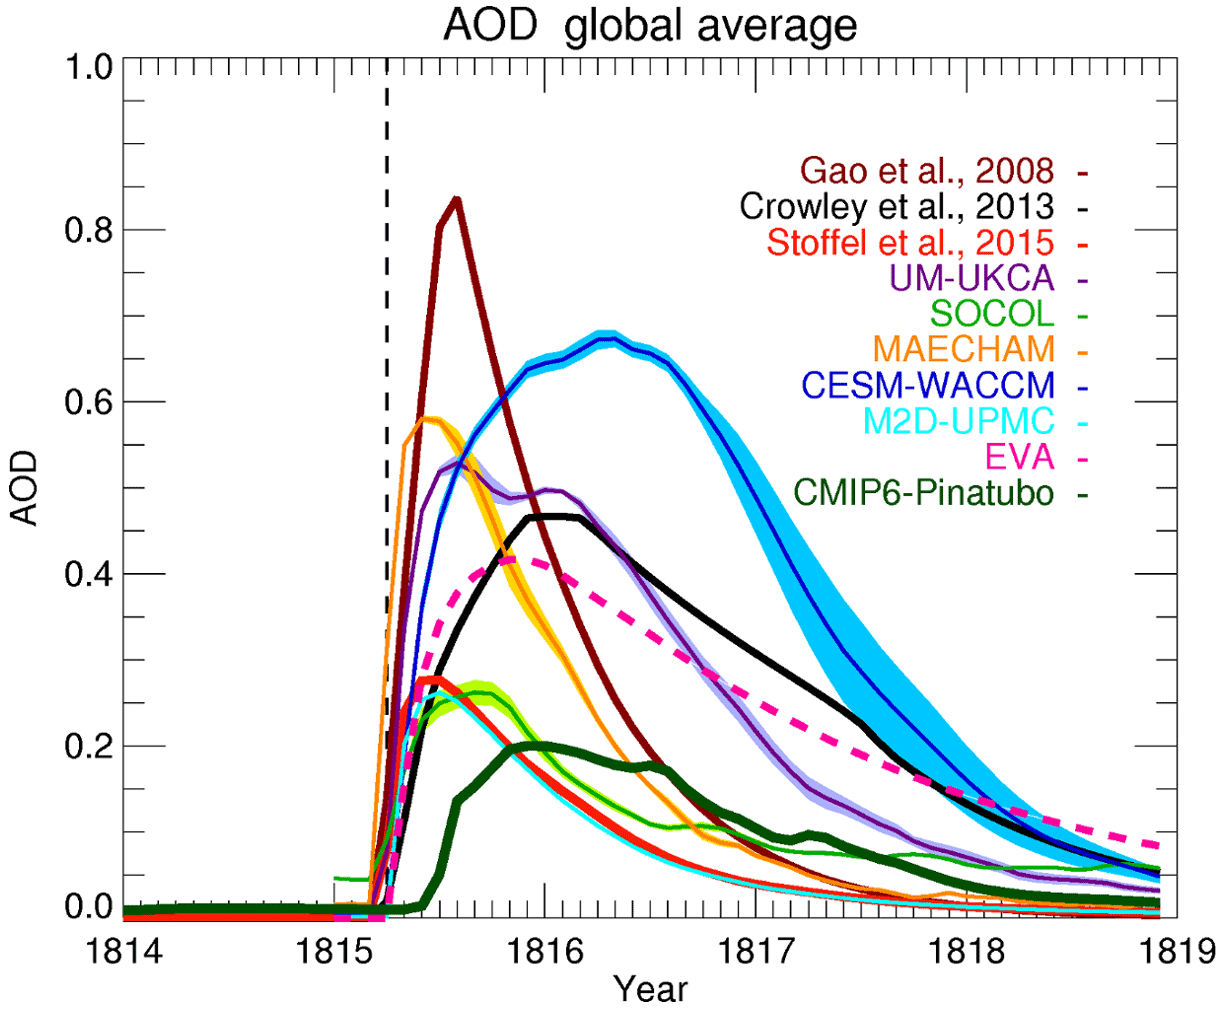
Figure 1Uncertainty in estimates of radiative forcing parameters for the 1815 eruption of Mt Tambora: global average aerosol optical depth (AOD) in the visible band from an ensemble of simulations with chemistry–climate models forced with a 60 Tg SO2 equatorial eruption, from the Easy Volcanic Aerosol (EVA; Toohey et al., 2016b) module with 56.2 Tg SO2 equatorial eruptions (thick dashed magenta line), from Stoffel et al. (2015), from Crowley and Unterman (2013), and from Gao et al. (2008; aligned so that the eruption starts on April 1815). The estimate for the Pinatubo eruption as used in the CMIP6 historical experiment is also reported for comparison. The black triangle shows latitudinal position and timing of the eruption. Chemistry–climate models are CESM (WACCM) (Mills et al., 2016), MAECHAM5-HAM (Niemeier et al., 2009), SOCOL (Sheng et al., 2015a), UM-UKCA (Dhomse et al., 2014), and CAMB-UPMC-M2D (Bekki, 1995; Bekki et al., 1996). For models producing an ensemble of simulations, the line and shading are the ensemble mean and ensemble standard deviation respectively. Figure from Zanchettin et al. (2016).
In this paper, we introduce the new model intercomparison project ISA-MIP developed within the SSiRC framework. In Sect. 2 we provide an overview of the current state of stratospheric sulfur aerosol modelling and its greatest challenges. In Sect. 3 we describe the scopes and protocols of the four model experiments planned within ISA-MIP. A concluding summary is provided in Sect. 4.
Before we discuss the current state of stratospheric aerosol modelling and its greatest challenges in detail, we briefly describe the main features of the stratospheric sulfur cycle. We are aware of the fact that the stratospheric aerosol layer also contains organics and inclusions of meteoritic dust (Ebert et al., 2016) and, after volcanic events, also co-exists with volcanic ash (e.g. Pueschel et al., 1994: KTH2016). However, the focus of the ISA-MIP experiments described here is on a comparison with measurements of the overall optical and physical properties of the stratospheric aerosol layer, which is mainly determined by sulfate.
2.1 The stratospheric aerosol life cycle
The stratospheric aerosol layer and its temporal and spatial variability are determined by the transport of aerosol and aerosol precursors in the stratosphere and their modification by chemical and microphysical processes (Hamill et al., 1997; ASAP2006; KTH2016). Volcanic eruptions can inject sulfur-bearing gases directly into the stratosphere, which significantly enhances the stratospheric aerosol load for years. A number of observations show that stratospheric aerosol increased over the first decade of the 21st century (e.g. Hofmann et al., 2009; Vernier et al., 2011b; Ridley et al., 2014). Although such an increase was attributed to the possible cause of Asian anthropogenic emission increase (Hofmann et al., 2009), later studies have shown that small-to-moderate magnitude volcanic eruptions are likely to be the major source of this recent increase (Vernier et al., 2011b; Neely III et al., 2013; Brühl et al., 2015).
Besides major volcanic eruptions, the photochemical oxidation of OCS, an insoluble gas mainly inert in the troposphere, is a stratospheric source. Tropospheric aerosols and aerosol precursors also enter the stratosphere through the tropical tropopause and through convective updrafts in the Asian and North American monsoons (Hofmann et al., 2009; Hommel et al., 2011; Vernier et al., 2011a; Bourassa et al., 2012; Yu et al., 2015). In the stratosphere, new sulfate aerosol particles are formed by binary homogenous nucleation (Vehkamäki et al., 2002), a process in which sulfuric acid vapour (H2SO4(g)) and water vapour condense simultaneously to form a liquid droplet. The condensation of H2SO4(g) onto pre-existing aerosol particles and the coagulation among particles shift the aerosol size distribution to greater radii. This takes place especially under volcanically perturbed conditions, when the concentrations of aerosol in the stratosphere are higher (e.g. Deshler, 2008).
From the tropics, where most of the tropospheric aerosol enters the stratosphere and the OCS chemistry is most active, the stratospheric aerosol particles are transported poleward within the large-scale BDC and removed through gravitational sedimentation and cross-tropopause transport in the extratropical regions. Internal variability associated with the QBO alters the isolation of the tropical stratosphere and subsequently the poleward transport of tropical stratospheric aerosol and modifies its global dispersal, particle size distribution, and residence time (e.g. Trepte and Hitchman, 1992; Hommel et al., 2015; Pitari et al., 2016b)
In general, under volcanically perturbed conditions with larger amounts of injected SO2, aerosol particles grow to much larger radii than in volcanically quiescent conditions (e.g. Deshler, 2008). The simulation of extremely large volcanic sulfur-rich eruptions shows a shift to particle sizes even larger than observed after the Pinatubo eruption and predicts a reduced cooling efficiency compared to moderate eruptions with moderate sulfur injections (e.g. Timmreck et al., 2010; English et al., 2013).
2.2 Global stratospheric aerosol models: current status and challenges
A comprehensive simulation of the spatio-temporal evolution of the particle size distribution is a continuing challenge for stratospheric aerosol models. Due to computational constraints, the formation of the stratospheric aerosol and the temporal evolution of its size distribution are usually parameterized with various degrees of complexity in global models. The simplest way to simulate the stratospheric aerosol distribution in global climate models is the mass-only (bulk) approach (e.g. Timmreck et al., 1999a, 2003; Aquila et al., 2012), where only the total sulfate mass is prognostically simulated and chemical and radiative processes are calculated assuming a fixed typical particle size distribution. More complex methods are size-segregated approaches, such as the modal approach (e.g. Niemeier et al., 2009; Toohey et al., 2011; Brühl et al., 2012; Dhomse et al., 2014; Mills et al., 2016), where the aerosol size distribution is simulated using one or more modes, usually of log-normal shape. The mean radius of each mode of these size distributions varies in time and space. Another common approach is the sectional method (e.g. English et al., 2011; Hommel et al., 2011; Sheng et al., 2015a; for ref prior to 2006 see ASAP2006, chap. 5), where the particle size distribution is divided into distinct size sections. Number and width of the size sections are dependent on the specific model configuration but are fixed throughout time and space. Size sections may be defined by an average radius, or by an average mass of sulfur, and are often spaced geometrically.
The choice of methods has an influence on simulated stratospheric aerosol size distributions and therefore on radiative and chemical effects. While previous model intercomparison studies in a box model (Kokkola et al., 2009) or in a two-dimensional framework (Weisenstein et al., 2007) were very useful for the microphysical schemes, they could not address uncertainties in the spatial transport pattern, e.g. transport across the tropopause and the subtropical transport barrier or regional/local differences in wet and dry removal. These uncertainties can only be addressed in a global three-dimensional model framework and with a careful validation with a variety of observational data.
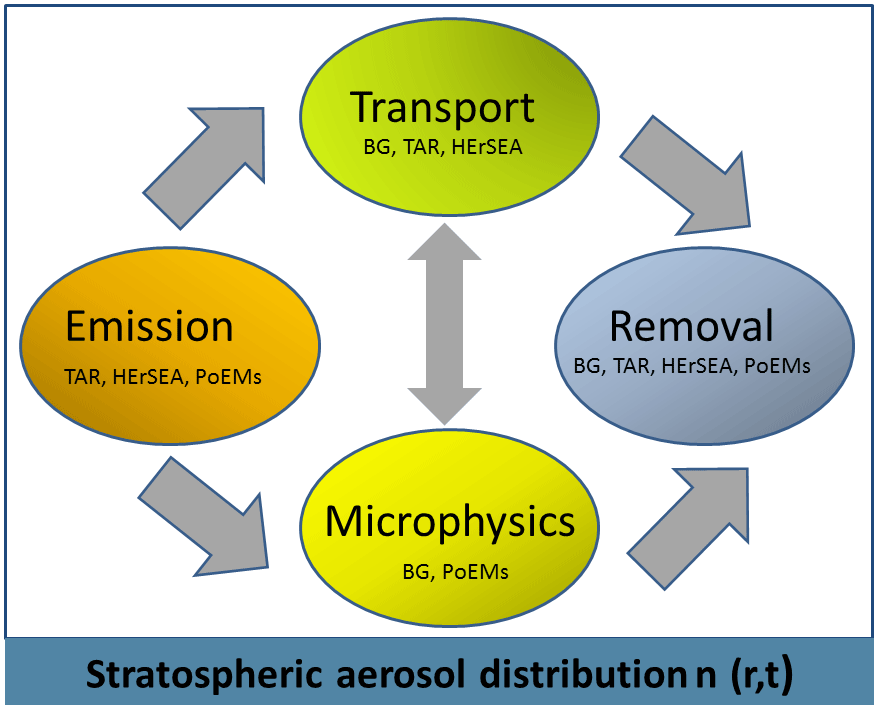
Figure 2Schematic overview over the processes that influence the stratospheric aerosol size distribution. The related SSiRC experiments are listed below. BG stands for Background, TAR for Transient Aerosol Record, HErSEA for Historical Eruption SO2 Emission Assessment, and PoEMs for Pinatubo Emulation in Multiple models.
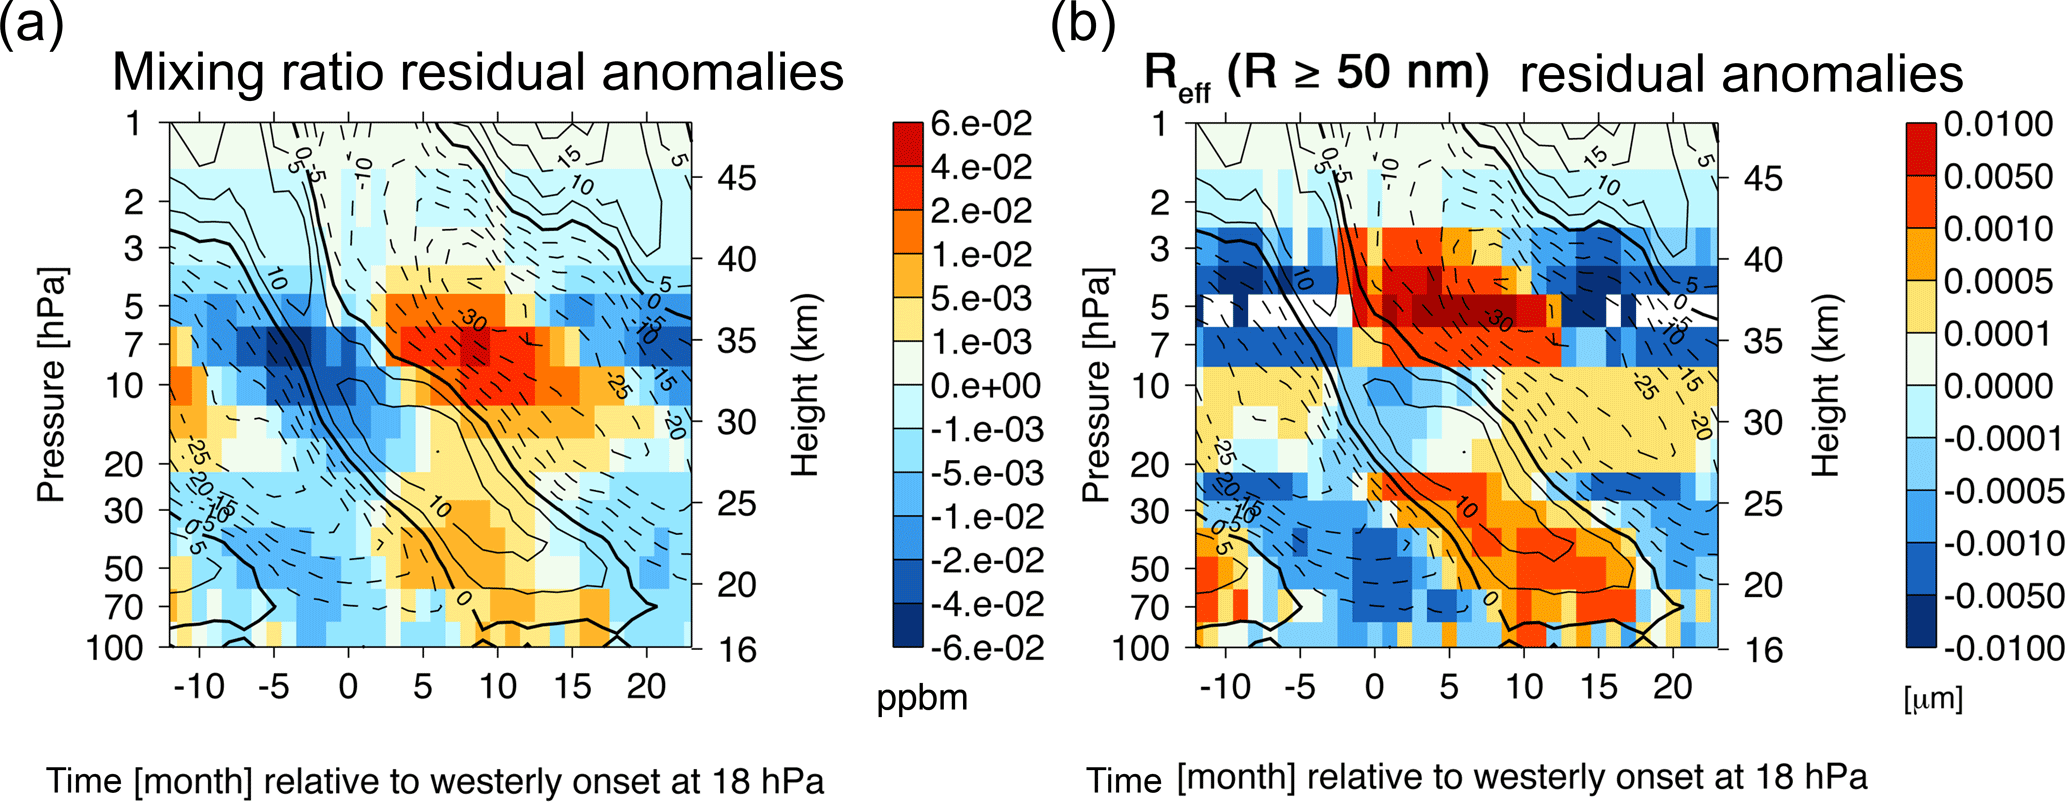
Figure 3(a) Composite of QBO-induced residual anomalies in the MAECHAM5-SAM2 modelled aerosol mass mixing ratio with respect to the time of onset of westerly zonal mean zonal wind at 18 hPa. Black contours denote the residual zonal wind. Dashed lines represent easterlies, contour interval is 5 ms. (b) Same but for the modelled effective radius of aerosols with R ≥ 50 nm. Figure from Hommel et al. (2015).
The June 1991 eruption of Mt Pinatubo, with the vast net of observations that tracked the evolution of the volcanic aerosol, provides a unique opportunity to test and validate global stratospheric aerosol models and their ability to simulate stratospheric transport processes. Previous model studies (e.g. Timmreck et al., 1999b; Aquila et al., 2012) highlighted the importance of an interactive online treatment of stratospheric aerosol radiative heating for the simulated transport of the volcanic cloud. A crucial point is the simulation of the tropical stratospheric aerosol reservoir (i.e., the tropical pipe, Plumb, 1996) and the meridional transport through the subtropical transport barrier. Some models show a very narrow tropical maximum in comparison to satellite data (e.g., Dhomse et al., 2014) while others show too fast a transport to higher latitudes and fail to reproduce the long persistence of the tropical aerosol reservoir (e.g. Niemeier et al., 2009; English et al., 2013). Sulfate geoengineering studies confirm the importance of the model-dependent meridional transport through the subtropical barrier (e.g. Niemeier and Timmreck, 2015; Visoni et al., 2018; Kleinschmitt et al., 2018). Reasons for these differences need to be understood with a multi-model comparison study, as suggested for example by Tilmes et al. (2015).
Many uncertainties remain in the model representation of stratospheric aerosol. Figure 2 summarizes the main processes that determine the stratospheric sulfate aerosol mass load, size distribution, and the associated optical properties. The four experiments in ISA-MIP are designed to address these key processes under a well-defined experiment protocol with prescribed boundary conditions (sea surface temperatures (SSTs), emissions). All simulations will be compared to observations to evaluate model performances and understand model strengths and weaknesses. The experiment Background (BG) focuses on microphysics and transport (Sect. 3.1) under volcanically quiescent conditions, when stratospheric aerosol is only modulated by seasonal changes and interannual variability. The experiment Transient Aerosol Record (TAR) addresses the role of time-varying SO2 emission, in particular the role of small- to moderate-magnitude volcanic eruptions and transport processes in the upper troposphere–lower stratosphere (UTLS) over the period 1998–2012 (Sect. 3.2). Two further experiments investigate the stratospheric sulfate aerosol size distribution under the influence of large volcanic eruptions. The Historical Eruptions SO2 Emission Assessment (HErSEA) focuses on the uncertainty in the initial emission characteristics of recent large volcanic eruptions (Sect. 3.3), while Pinatubo Emulation in Multiple models (PoEMS) provides an extensive uncertainty analysis of the radiative forcing of the Mt Pinatubo eruption. In particular the ISA-MIP model experiments aim to address the following questions:
-
How large is the stratospheric sulfate load under volcanically quiescent conditions, and how sensitive is the simulation of this background aerosol layer to model-specific microphysical parameterization and transport? (Sect. 3.1)
-
Can we explain the sources and mechanisms behind the observed variability in stratospheric aerosol load since the year 2000? (Sect. 3.2)
-
Can stratospheric aerosol observations constrain uncertainties in the initial sulfur injection amount and altitude distribution of the three largest volcanic eruptions of the last 100 years? (Sect. 3.3)
-
What is the confidence interval for volcanic forcing of the Pinatubo eruption simulated by interactive stratospheric aerosol models and to which parameter uncertainties are the predictions most sensitive to? (Sect. 3.4)
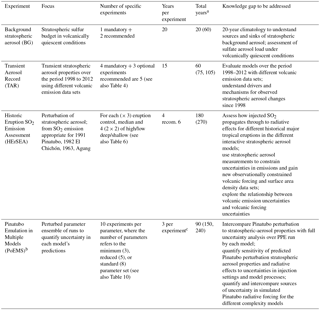
Table 1 gives an overview over all ISA-MIP experiments, which are described in detail below. In general each experiment will include several simulations from which only a subset is mandatory (Tier1). The modelling groups are free to choose in which of the experiments they would like to participate; however, the BG Tier1 simulation is mandatory for all groups and the entry card for the ISA-MIP intercomparison. All model results will be saved in a consistent format (netCDF), made available via https://cera-www.dkrz.de/WDCC/ui/cerasearch/ (last access: 26 June 2018), and compared to a set of benchmark observations. More detailed technical information about data requests can be found in the Supplement and on the ISA-MIP webpage: http://www.isamip.eu (last access: 26 June 2018).
Table 1General overview of the SSIRC ISA-MIP experiments.
a Each model will need to include an appropriate initialization and spin-up time for each ensemble member (∼ 3–6 years depending on model configuration). b As explained in the caption to Table 11 and Sect. 3.4, models will need to restrict the PoEMS parameter scaling to volcanically enhanced air masses (either via a total-sulfur vmr (volume mixing ratio) threshold or a passive volcanic SO2 tracer). c Although the Pinatubo enhancement to the stratospheric aerosol layer remained apparent until 1997 (e.g. Wilson et al., 2008), whereas the HErSEA experiments will continue for longer, the PoEMS analysis will require only 3 post-eruption years to be run, as this gives sufficient time after the peak aerosol to characterize decay timescales robustly (e.g. ASAP2006, Sect. 5).
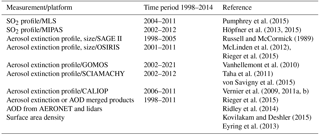
Table 2List of stratospheric aerosol and SO2 observations available for the BG and TAR time period.
It is mandatory for participating models to run with interactive sulfur chemistry (see review in SPARC ASAP2006) in order to capture the oxidation pathway from precursors to aerosol particles, including aerosol growth due to condensation of H2SO4. Chemistry–climate models (CCMs) with full interactive chemistry follow the Chemistry Climate Initiative (CCMI) hindcast scenario REF-C1 (Eyring et al., 2013, http://www.met.reading.ac.uk/ccmi/?page_id=11, last access: 26 June 2018) for the treatment of chemical fields and emissions of greenhouse gases (GHGs), ozone-depleting substances (ODSs), and very short-lived substances (VSLSs). Sea surface temperatures and sea ice extent are prescribed as monthly climatologies from the MetOffice Hadley Center Observational Dataset (Rayner et al., 2003). An overview of the boundary conditions is included in the Supplement (Table S1). Table S2 reports the inventories to be used for tropospheric emissions of aerosols and aerosol precursors. Anthropogenic sulfur emissions and biomass burning are taken from the Monitoring Atmospheric Composition and Climate (MACC)-CITY climatology (Granier et al., 2011). S emissions from continuously erupting volcanoes are taken into account using Dentener et al. (2006), which is based on Andres and Kasgnoc (1998). OCS concentrations are fixed at the surface at a value of 510 pptv (Montzka et al., 2007; ASAP2006). If possible, dimethyl sulfide (DMS), dust, and sea salt emissions should be calculated online depending on the model meteorology. Models considering DMS oxidation should calculate seawater DMS emissions as a function of wind speed and DMS seawater concentrations. Otherwise, modelling groups should prescribe for these species their usual emission database for the year 2000. Each group can specify solar forcing for year-2000 conditions according to their usual data set.
Modelling groups are encouraged to include a set of passive tracers to diagnose the atmospheric transport independently of emissions, mostly following the CCMI recommendations (Eyring et al., 2013). These tracers are listed in Table S3. Models diagnose aerosol parameters as specified in Tables S4 and S5. Additionally, volume mixing ratios of specified precursors are diagnosed.
3.1 Stratospheric background aerosol (BG)
3.1.1 Summary of experiment
The overall objective of the BG experiment is to better understand the processes involved in maintaining the stratospheric background aerosol layer, i.e. stratospheric aerosol not resulting from direct volcanic injections into the stratosphere. The simulations prescribed for this experiment are time-slice simulations for the year 2000 with prescribed SST including all sources of aerosols and aerosol precursors except for explosive volcanic eruptions. The result of BG will be a multi-model climatology of aerosol distribution, composition, and microphysical properties in the absence of volcanic eruptions. By comparing models with different aerosol microphysics parameterization and simulations of background circulation with a variety of observational data (Table 2), we aim to assess how these processes impact the simulated aerosol characteristics.
3.1.2 Motivation
The total net sulfur mass flux from the troposphere into the stratosphere is estimated to be about 181 Gg S yr−1 based on simulations by Sheng et al. (2015a) using the SOCOL-AER model, 1.5 times larger than reported in ASAP2006 (KTH2016). This estimate, however, could be highly dependent on the specific characteristics of the model used, such as the strength of convective systems, scavenging efficiency, and the occurrence of stratosphere–troposphere exchange. Therefore, especially in the lower stratosphere, the simulated distribution of stratospheric background aerosol could show a very large inter-model variability.
OCS is still considered the largest contributor to the aerosol loadings in the middle stratosphere. Several studies have shown that the transport to the stratosphere of tropospheric aerosol and aerosol precursors constitutes an important source of stratospheric aerosol (KTH2016 and references herein) although new in situ measurements indicate that the cross-tropopause SO2 flux is negligible over Mexico and Central America (Rollins et al., 2017). Observations of the Asian Tropopause Aerosol Layer (ATAL; Vernier et al., 2011a) show that, particularly in the UTLS, aerosol of tropospheric origin can significantly enhance the burden of aerosol in the stratosphere. This tropospheric aerosol has a more complex composition than traditionally assumed for stratospheric aerosol: Yu et al. (2015), for instance, showed that carbonaceous aerosol makes up to 50 % of the aerosol loadings within the ATAL. The rate of stratospheric–tropospheric exchange (STE) is influenced by the seasonality of the circulation and the frequency and strength of convective events in large-scale phenomena such as the Asian and North American monsoon or in small-scale phenomena such as strong storms. Model simulations by Hommel et al. (2015) also revealed significant QBO signatures in aerosol mixing ratio and size in the tropical middle stratosphere (Fig. 3). Hence, the model-specific implementation of the QBO (nudged or internally generated) could impact its effects on the stratospheric transport and, subsequently, on the stratospheric aerosol layer.
In this experiment, we aim to assess the inter-model variability of the background stratospheric aerosol layer and of the sulfur mass flux from the troposphere to the stratosphere and vice versa. We will exclude changes in emissions and focus on the dependence of stratospheric aerosol concentrations and properties on stratospheric transport and STE. The goal of the BG experiment aims to understand how the model-specific transport characteristics (e.g. isolation of the tropical pipe, representation of the QBO and the strength of convective systems) and aerosol parameterizations (e.g. aerosol microphysics and scavenging efficiency) affect the representation of the background aerosol.
3.1.3 Experiment set-up and specifications
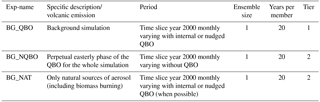
The BG experiment prescribes one mandatory (BG_QBO) and two recommended (BG_NQBO and BG_NAT) simulations (see Table 3). BG_QBO is a time-slice simulation with conditions characteristic of the year 20001, with the goal of understanding sources, sinks, composition, and microphysical characteristics of stratospheric background aerosol under volcanically quiescent conditions. The time-slice simulation should be at least 20 years long, after a spin-up period of at least 10 years to equilibrate stratospherically relevant quantities such as OCS concentrations and the age of air. The period seems to be sufficient to study differences in the aerosol properties but needs to be extended if dynamical changes, e.g. in NH winter variability, are to be analysed. Modelling groups should run this simulation with varying QBO, either internally generated or nudged to the 1981–2000 period.
If resources allow, each model should perform the sensitivity experiments BG_NQBO and BG_NAT. The specifics of these two experiments are the same as for BG_QBO, but BG_NQBO should be performed without varying QBO2 and BG_NAT without anthropogenic emissions of aerosol and aerosol precursors, as indicated in Table S1. The goals of these sensitivity experiments are to understand the effect of the QBO on the background aerosol characteristics and the contribution of anthropogenic sources to the background aerosol loading in the stratosphere.
3.2 Transient Aerosol Record (TAR)
3.2.1 Summary of experiment
The aim of the TAR experiment is to investigate the relative contributions of volcanic and anthropogenic sources to the temporal evolution of the stratospheric aerosol layer between 1998 and 2012. Observations show that there is a transient increase in stratospheric aerosol loading, in particular after the year 2003, with small-to moderate-magnitude volcanic eruptions contributing significantly to this increase (e.g. Solomon et al., 2011; Vernier et al., 2011b; Neely III et al., 2013; Ridley et al., 2014; Santer et al., 2015; Brühl et al., 2015). TAR model simulations will be performed using specified dynamics, prescribed sea surface temperature and time-varying SO2 emissions. The simulations are suitable for any general circulation or chemistry transport models that simulate the stratospheric aerosol interactively and have the capability to nudge meteorological parameters to reanalysis data. The TAR protocol covers the period from January 1998 to December 2012, when only volcanic eruptions have affected the UTLS aerosol layer with SO2 emissions about an order of magnitude smaller than Pinatubo. Time-varying surface emission data sets contain anthropogenic and natural sources of sulfur aerosol and their precursor species. The volcanic SO2 emission inventories contain information of all known eruptions that emitted SO2 into the UTLS during this period. It comprises the geolocation of each eruption, the amount of SO2 emitted, and the height of the emissions. SO2 emissions from continuously degassing volcanoes are also included.
3.2.2 Experiment set-up and specifications
Participating models are encouraged to perform up to seven experiments, based on five different volcanic SO2 emission databases (hereafter referred to as VolcDB). Four experiments are mandatory; three others are optional. The volcanic experiments are compared to a reference simulation (TAR_base) that does not use any of the volcanic emission databases but emissions from continuously degassing volcanoes. The aim of the reference simulation is to simulate the non-volcanically perturbed state of the stratospheric aerosol layer. In contrast to the experiment protocol BG (Sect. 3.1), here time-varying surface boundary conditions (SST/SIC) are applied, whereas BG intercompares model simulations under climatological mean conditions and uses constant 2000 conditions.
An overview of the volcanic emission inventories is given in Table 4 and in Fig. 4. VolcDB1/2/3 are new compilations (Bingen et al., 2017; Neely and Schmidt, 2016; Carn et al., 2016), whereas a fourth inventory (VolcDB4; Diehl et al., 2012), provided earlier, for the AeroCom community modelling initiative, is optional. The databases use SO2 observations from different sources and apply different techniques for the estimation of injection heights and the amount of emitted SO2. The four inventories are provided in the form of tabulated point sources, with each modelling group to translate emitted SO2 mass for each eruption into model levels spanning the upper and lower emission altitudes. To test the effect of the implementation strategy (point source vs. cloud), an additional non-mandatory experiment has been set up: TAR_db1_3D with VolcDB1_3D as corresponding data set which provides a series of discrete 3-D gridded SO2 injections at specified times. In both versions of VolcDB1, the integral SO2 mass of each injection is consistent.
We recommend performing one additional non-mandatory experiment TAR_sub in order to quantify and isolate the effects of eight volcanic eruptions that either had a statistically significant effect on, for instance, tropospheric temperatures (Santer et al., 2014, 2015) or emitted significant amounts of SO2 over the 1998 to 2012 time period. This experiment uses a subset of volcanic emissions (VolcDBSUB) that were derived based on the average mass of SO2 emitted using VolcDB1, VolcDB2, and VolcDB3 for the following eruptions: 28 January 2005 Manam (4.0∘ S, Papua New Guinea), 7 October 2006 Tavurvur (4.1∘ S, Papua New Guinea), 21 June 2009 Sarychev, (48.5∘ N, Kyrill, UDSSR) 8 November 2010 Merapi (7.3∘ S, Java, Indonesia), and 21 June 2011 Nabro (13.2∘ N, Eritrea). In addition the eruptions of Soufrière Hills (16.4∘ N, Montserrat) on 20 May 2006, Okmok (53.3∘ N, Alaska) on 12 July 2008, and Kasatochi (52.1∘ N, Alaska) on 7 August 2008 are considered (Table S6) although these are not discernible in climate proxies (Kravitz et al., 2010; Santer et al., 2014, 2015).
To summarize the number of experiments to be conducted within TAR, four are mandatory (TAR_base with no volcanic emission, Tar_db1/2/3), one additional one is recommended (TAR_sub), and two others are optional (TAR_db4 and TAR_db1_3D; see Table 5 for an overview).
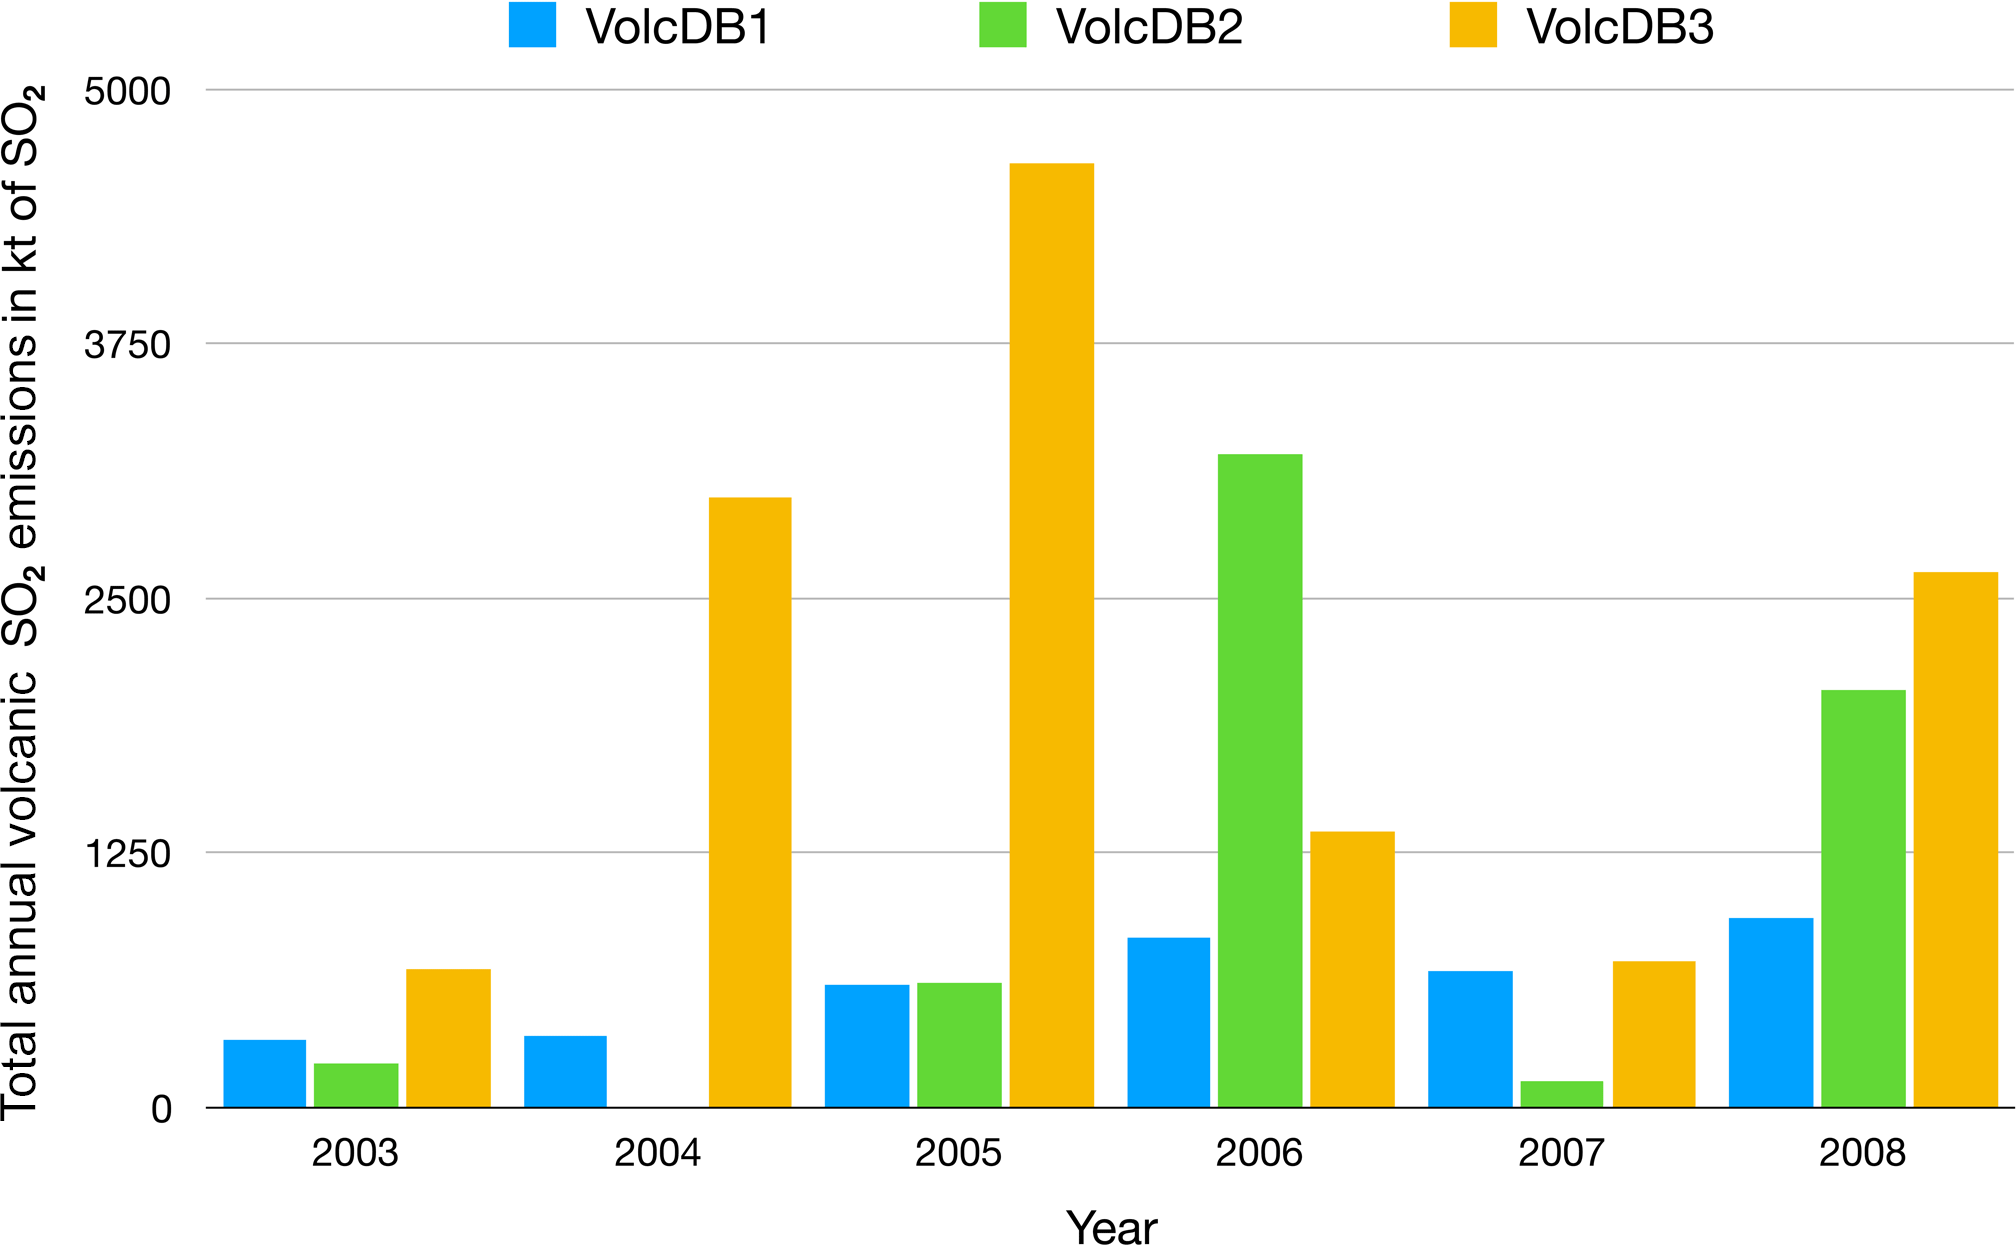
Figure 4Annual total volcanic sulfur dioxide (SO2) emission from three different emission data sets between 2003 and 2008 to be used in the Tier1 MITAR experiments. VolcDB1 (Bingen et al., 2017) considers only stratospheric SO2 emissions; VolcDB2 (Neely and Schmidt, 2016) and VolcDB3 (Carn et al., 2016) consider both tropospheric and stratospheric SO2 emission.
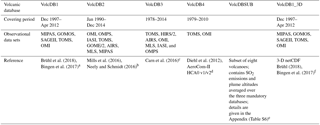
Table 4Overview of volcanic emission data sets for the different TAR experiments. Sensor acronyms: MIPAS: Michelson Interferometer for Passive Atmospheric Sounding; GOMOS: Global Ozone Monitoring by Occultation of Stars; TOMS: Total Ozone Mapping Spectrometer; OMI: Ozone Monitoring Instrument; OMPS: Ozone Mapping and Profiler Suite; IASI: Infrared Atmospheric Sounding Interferometer; GOME: Global Ozone Monitoring Experiment; AIRS: Atmospheric Infrared Sounder; MLS: Microwave Limb Sounder; HIRS: High-resolution Infrared Radiation Sounder; References to the observational data and emission sources included are given in the reference paper and for VolcDB1(_3D) also in Table S2.1. VolcDB1_3D is a three-dimensional database, containing the spatial distributions of the injected SO2 as initially observed by the satellite instruments. In both versions of VolcDB1, the integral SO2 mass of each injection is consistent.
a https://cera-www.dkrz.de/WDCC/ui/cerasearch/entry?acronym=SSIRC_1 (last access: 26 June 2018). b http://catalogue.ceda.ac.uk/uuid/bfbd5ec825fa422f9a858b14ae7b2a0d (last access: 26 June 2018). c https://measures.gesdisc.eosdis.nasa.gov/data/SO2/MSVOLSO2L4.2/ (last access: 26 June 2018). d http://aerocom.met.no/download/emissions/HTAP (last access: 26 June 2018). e http://isamip.eu/fileadmin/user_upload/isamip/volc_sub_v185.dat (last access: 26 June 2018). f https://cera-www.dkrz.de/WDCC/ui/cerasearch/entry?acronym=SSIRC_1 (last access: 26 June 2018).
Volcanic SO2 emission databases
VolcDB1 (Bingen et al., 2017; Brühl, 2018) are updates from Brühl et al. (2015) using satellite data of MIPAS and OMI. For TAR, VolcDB1 has been extended based on data from Global Ozone Monitoring by Occultation of Stars (GOMOS), SAGE II, Total Ozone Mapping Spectrometer (TOMS), and the Smithsonian database. The VolcDB1_3D data set, for the optional experiment TAR_db1_3D, contains volume mixing ratio distributions of the injected SO2 cloud on a T42 Gaussian grid with 90 levels. The integral SO2 mass for each injection is the same. VolcDB2 (Mills et al., 2016; Neely and Schmidt, 2016) contains volcanic SO2 emissions and plume altitudes for eruptions that have been detected by satellite instruments including TOMS, OMI, OMPS, the Infrared Atmospheric Sounding Interferometer (IASI), the Global Ozone Monitoring Experiment (GOME/2), the Atmospheric Infrared Sounder (AIRS), the Microwave Limb Sounder (MLS), and the MIPAS instrument. The database is compiled based on published estimates of the eruption source parameters and reports from the Smithsonian Global Volcanism Program (http://volcano.si.edu/, last access: 26 June 2018), NASA's Global Sulfur Dioxide Monitoring website (http://so2.gsfc.nasa.gov/, last access: 26 June 2018) as well as the Support to Aviation Control Service (http://sacs.aeronomie.be/, last access: 26 June 2018). The tabulated point source database also includes volcanic eruptions that emitted SO2 into the troposphere only, as well as direct stratospheric emissions, and has been used and compared to observations in Mills et al. (2016) and Solomon et al. (2016).
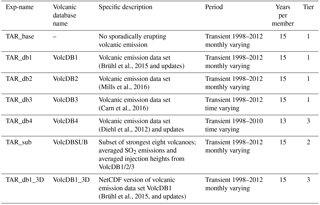
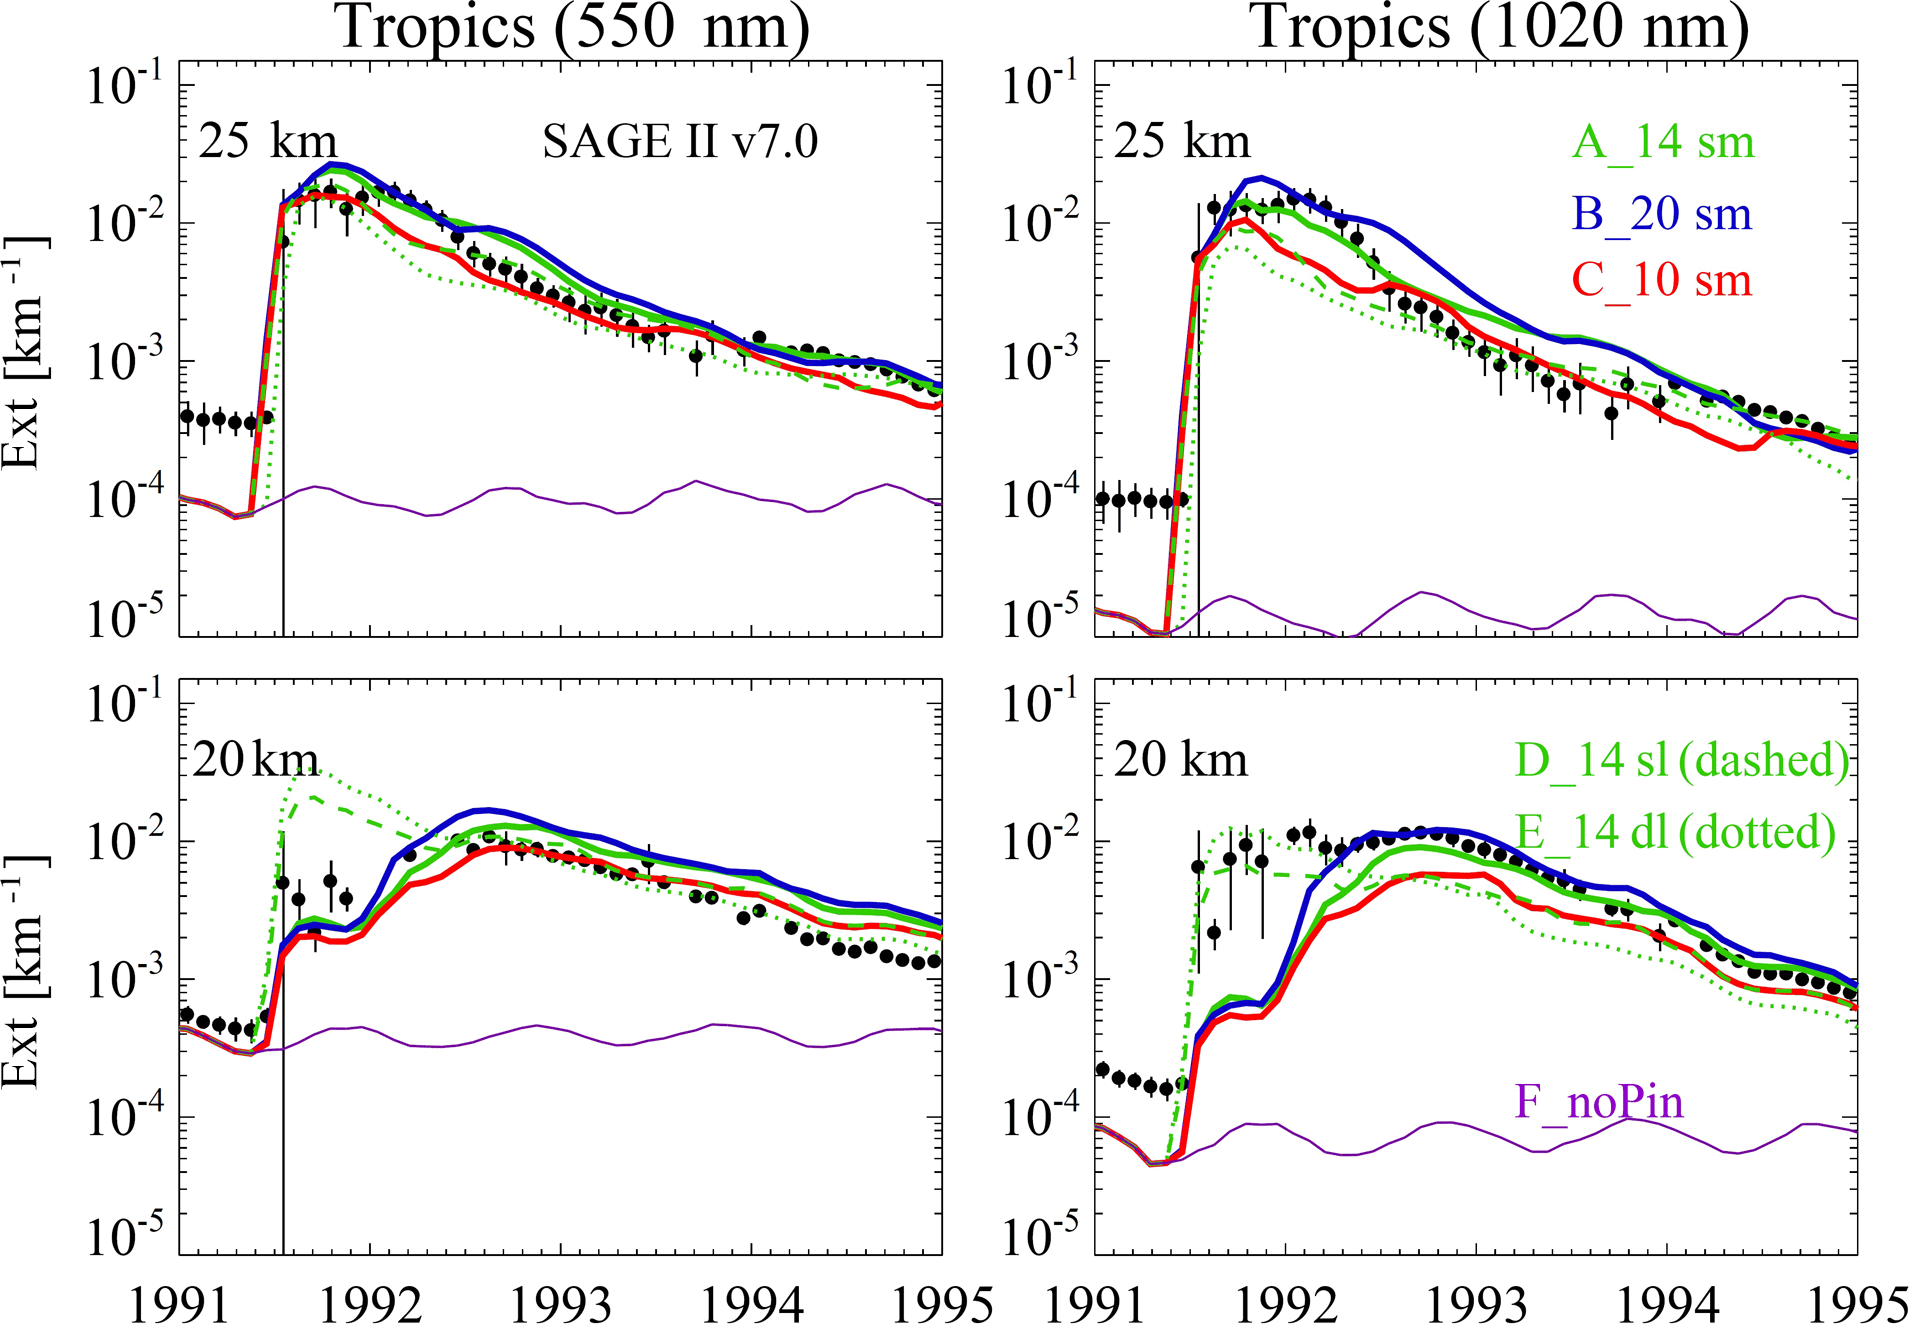
Figure 5Example results from interactive stratospheric aerosol simulations with the UM-UKCA model (Dhomse et al., 2014) of five different SO2 injection realizations of the 1991 Pinatubo eruption (see Table 8), The model tropical mean extinction in the mid-visible (550 nm) and near-infrared (1020 nm) is compared to that from SAGE-II measurements. Only two of the five injection realizations inject below 20 km and the impact on the timing of the peak and general evolution of the aerosol optical properties is apparent. In this model the growth to larger particle sizes and subsequent sedimentation to lower altitudes is able to explain certain signatures seen in the satellite data (see also Mann et al., 2015).
VolcDB3 uses the most recent compilation of the volcanic degassing database of Carn et al. (2016). Observations from the satellite instruments TOMS, the High-resolution Infrared Sounder (HIRS/2), AIRS, OMI, MLS, IASI, and OMPS are considered, measuring in the UV, IR, and microwave spectral bands. Similar to VolcDB1/2, VolcDB3 also includes tropospheric eruptions.
Historically VolcDB4 is an older data set, which relies on information from TOMS, OMI, the Global Volcanism Program (GVP), and other observations from the literature, covering the time period from 1979 to 2010. In contrast to the other inventories, VolcDB4 has previously been applied by a range of models within the AeroCom community (http://aerocom.met.no/emissions.html, last access: 26 June 2018; Diehl et al., 2012; Dentener et al., 2006). Hence, it adds valuable information to the TAR experiments because it allows an estimation of how the advances in observational methods impact modelling results. It should be noted that VolcDB4 already contains the inventory of Andres and Kasgnoc (1998) for S emissions from continuously erupting volcanoes and should not be allocated twice when running this experiment.
Boundary conditions, chemistry, and forcings
To reduce uncertainties associated with model differences in the reproduction of synoptic and large-scale transport processes, models are strongly encouraged to perform TAR experiments with specified dynamics, where meteorological parameters are nudged to a reanalysis such as the ECMWF ERA-Interim (Dee et al., 2011). This allows models to reasonably reproduce the QBO and planetary wave structure in the stratosphere and to replicate as closely as possible the state of the BDC in the simulation period. Nudging also allows comparing directly to available observations of stratospheric aerosol properties (Table 2), such as the extinction profiles and aerosol optical depth (AOD), and should enable the models to simulate the ATAL (Vernier et al., 2011a; Thomason and Vernier, 2013), which, so far, has been studied only by very few global models in great detail (e.g. Neely III et al., 2014; Yu et al., 2015).
3.3 Historical Eruption SO2 Emission Assessment (HErSEA)
3.3.1 Summary of experiment
This HErSEA experiment will involve each participating model running a limited ensemble of simulations for each of the three largest volcanic perturbations to the stratosphere in the last 100 years: 1963 Mt Agung, 1982 El Chichón, and 1991 Mt Pinatubo.
The main aim is to use a wide range of stratospheric aerosol observations to constrain uncertainties in the SO2 emitted for each eruption (amount, injection height). Several different aerosol metrics will be intercompared to assess how effectively the emitted SO2 translates into perturbations to stratospheric aerosol properties and simulated radiative forcings across interactive stratospheric aerosol CCMs with a range of different complexities. Whereas the TAR simulations (see Sect. 3.2) use specified dynamics and are suitable for chemistry transport models, for this experiment, simulations must be free-running with radiative coupling to the volcanically enhanced stratospheric aerosol, thereby ensuring the composition–radiation–dynamics interactions associated with the injection are resolved. We are aware that this specification inherently excludes chemistry transport models, which must impose atmospheric dynamics. However, since the aim is to apply stratospheric aerosol observations in concert with the models to re-evaluate current best estimates of the SO2 input and in light of the first-order impact the stratospheric heating has on hemispheric dispersion from these major eruptions (e.g. R. E. Young et al., 1994), we assert that this apparent exclusivity is entirely justified in this case.
As well as analysing and evaluating the individual model skill and identifying model consensus and disagreement for these three specific eruptions, we also seek to learn more about major eruptions which occurred before the era of satellite and in situ stratospheric measurements. Our understanding of the effects from these earlier eruptions relies on deriving volcanic forcings from proxies such as sulfate deposition to ice sheets (Gao et al., 2007; Sigl et al., 2015; Toohey et al., 2013), from photometric measurements from astronomical observatories (Stothers, 1996, 2001), or from documentary evidence (Stothers, 2002; Stothers and Rampino, 1983; Toohey et al., 2016a). Although HErSEA has no specific experiment to understand the relationship between the ice core sulfate deposition and the stratospheric aerosol layer enhancements that drive the surface cooling, there is the potential for a systematic inter-model study (e.g. similar to Marshall et al., 2018) to identify how uncertain historic volcanic forcings derived from ice core sulfate deposition may be.
3.3.2 Motivation
In the days following the June 1991 Pinatubo eruption, satellite SO2 measurements show (e.g. Guo et al., 2004a) that the peak gas phase sulfur loading was 7 to 11.5 Tg S (or 14–23 Tg SO2). The chemical conversion to sulfuric aerosol that occurred in the tropical reservoir over the following weeks and the subsequent transport to mid- and high latitudes caused a major enhancement to the stratospheric aerosol layer. The peak particle sulfur loading, through this global dispersion phase, reached only around half that in the initial SO2 emission; the maximum particle sulfur loading was measured as 3.7 to 6.7 Tg S (Lambert et al., 1993; Baran and Foot, 1994), based on an aqueous sulfuric acid composition range of 59 to 77 % by weight (Grainger et al., 1993).
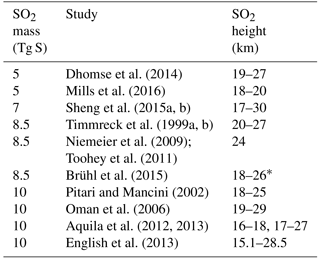
Whereas some model studies with aerosol microphysical processes find consistency with observations for SO2 injection values of 8.5 Tg S (e.g., Niemeier et al., 2009; Toohey et al., 2011; Brühl et al., 2015), several recent microphysical model studies (Dhomse et al., 2014; Sheng et al., 2015a; Mills et al., 2016) find best agreement for an injected sulfur amount at, or even below, the lower end of the range of the satellite SO2 measurements; see also Fig. 5. Model predictions are known to be sensitive to differences in assumed injection height (e.g. Sheng et al., 2015b; Jones et al., 2016), and whether models resolve radiative heating and “self-lofting” effects also affects subsequent transport pathways (e.g. R. E. Young et al., 1994; Timmreck et al., 1999b; Aquila et al., 2012). Another potential mechanism that could explain part of the apparent model–observation discrepancy is that a substantial proportion of the sulfur may have been removed from the plume in the first months after the eruption due to accommodation onto co-emitted ash/ice (Guo et al., 2004b) and subsequent sedimentation.
Table 7List of stratospheric aerosol observation data sets from the three large eruptions of the 21st century (Agung, El Chichón, and Mt Pinatubo). For NDACC archive, see http://www.ndsc.ncep.noaa.gov/data/ (last access: 26 June 2018).
This ISA-MIP experiment will explore these issues further, with the participating models carrying out co-ordinated experiments of the three most recent major eruptions, with specified common SO2 amounts and injection heights (Table 6). This design ensures the analysis can focus on key inter-model differences such as stratospheric circulation/dynamics, the impacts from radiative dynamical interactions, and the effects of aerosol microphysical schemes. Analysing how the vertical profile of the enhanced stratospheric aerosol layer evolves during global dispersion and decay will provide a key indicator for why the models differ, and what the key driving mechanisms are. Furthermore, the actual response of the BDC and mean age of air to Pinatubo is poorly constrained by existing reanalysis data (Garfinkel et al., 2017). While some modelling studies reported a decreasing mean age of air following volcanic eruptions throughout the stratosphere (Garcia et al., 2011; Garfinkel et al., 2017), others show an increase in mean age (Diallo et al., 2017). Moreover, Muthers et al. (2016) found a decreasing mean age of air in the middle and upper stratosphere and an increasing mean age below, while Pitari et al. (2016a) found a decreasing mean age at higher levels of 30 hPa in the tropics and 10 hPa in the middle latitudes after the Pinatubo eruption. The HErSEA experiment in combination with a passive volcanic tracer might therefore help to better constrain the response of the BDC to volcanic eruptions using observations and help to clarify the uncertainties in the age-of-air changes after the Pinatubo eruption. For all three major eruptions, we have identified key observational data sets (Table 7) that will provide benchmark tests to evaluate the vertical profile, covering a range of different aerosol metrics.
3.3.3 Experiment set-up and specifications
Each modelling group will run a mini-ensemble of transient AMIP-type runs for the three eruptions with upper and lower bound SO2 emissions and three different injection height settings: two shallow (e.g. 19–21 and 23–25 km) and one deep (e.g. 19–25 km) (see Table 7). The seasonal cycle of the BDC affects the hemispheric dispersion of the aerosol plume (e.g. Toohey et al., 2011), and the phase of the QBO is also known to be a key control for tropical eruptions (e.g. Trepte and Hitchman, 1992). In order to quantify the contribution of the tracer transport, it is recommended to additionally initialize and transport a passive tracer Volc (Table S3). Note that since the AMIP-type simulations will be transient, prescribing time-varying sea surface temperatures, the models will automatically match the surface climate state (ENSO, NAO) through each post-eruption period. Where possible, models should re-initialize (if they have internally generated QBO) or use specified dynamics approaches (e.g. Telford et al., 2008) to ensure the model dynamics are consistent with the QBO evolution through the post-eruption period. General circulation models should use GHG concentrations appropriate for the period, and models with interactive stratospheric chemistry should ensure the loading of ODSs matches that for the time period.
Table 8Settings to use for initializing the mini-ensemble of interactive stratospheric aerosol simulations for each eruption in the HErSEA experiment. For Pinatubo the upper range of SO2 emission is based on TOMS/TOVS SO2 observations (Guo et al., 2004a). The SO2 emissions flux ranges and central values (in parentheses) are specifically for application in interactive stratospheric aerosol (ISA) models rather than any new data compilation. The lower range and the central values are defined according to some recent Pinatubo studies (Dhomse et al., 2014; Mills et al., 2016; Sheng et al., 2015a) which have identified a modest downward adjustment of initially observed SO2 amounts to agree with HIRS/ISAMS measurements of peak sulfate aerosol loading (Baran and Foot, 1994). The adjustment assumes either uncertainties in the satellite measurements or that loss pathways in the first few weeks after these eruptions are either underpredicted (e.g. due to coarse spatial resolution) or omitted completely (accommodation onto ash/ice) in the ISA models. The El Chichón SO2 central estimate is taken from Krueger et al. (2008), and an emission range is based on assumed ±33 %, while for Agung the SO2 emission estimate is from Self and King (1996). For Pinatubo, injection height ranges for the two shallow and one deep realization are taken from Antuña et al. (2002). The El Chichón values are based on the tropical lidar signal from Fig. 4.34 of Hamill and Brogniez (2006), whereas for Agung we considered the measurements presented in Dyer and Hicks (1968) including balloon soundings (Rosen, 1964) and ground-based lidar (Grams and Fiocco, 1967).
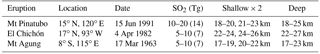
Table 8 shows the settings for the SO2 injection for each eruption. Note that experience of running interactive stratospheric aerosol simulations shows that the vertical extent of the enhanced stratospheric aerosol will be different from the altitude range in which the SO2 is injected. So, these sensitivity simulations will allow us to assess the behaviour of the individual models with identical settings for the SO2 injection.
For these major eruptions, where the perturbation is much larger than in TAR, model diagnostics include AOD and extinction at multiple wavelengths and heating rates (K day−1) in the lower stratosphere to identify the stratospheric warming induced by simulated volcanic enhancement, including exploring compensating effects from other constituents (e.g. Kinne et al., 1992). To allow the global variation in size distribution to be intercompared, models will also provide a 3-D monthly effective radius, which also includes cumulative number concentration at several size cuts for direct comparison to balloon measurements. Examining the co-variation of the particle size distribution with variations in extinction at different wavelengths will be of particular interest in relation to approaches used to interpret astronomical measurements of eruptions in the pre in situ era (Stothers, 1996, 2001). A three-member ensemble will be submitted for each different injection setting.
3.4 Pinatubo Emulation in Multiple models (PoEMs)
3.4.1 Summary of experiment
The PoEMS experiment will involve each interactive stratospheric aerosol model running a perturbed parameter ensemble (PPE) of simulations through the 1991–1995 Pinatubo-perturbed period. Variation-based sensitivity analysis will derive a probability distribution function (PDF) for each model's predicted Pinatubo forcing, following techniques applied successfully to quantify and attribute sources of uncertainty in tropospheric aerosol forcings (e.g. Carslaw et al., 2013). The approach will teach us which aspects of the radiative forcing from major eruptions is most uncertain and will enable us to identify how sensitive model predictions of key features (e.g. timing and value of peak forcing and decay timescales) are to uncertainties in several model parameters. Comparing the time signatures of different underlying aerosol metrics (mid-visible AOD, effective radius, particle number) between models, and crucially also against observations, may also help to reduce the natural forcing uncertainty, potentially thereby making the next generation of climate models more robust.
3.4.2 Motivation
The sudden global cooling from major eruptions is a key signature in the historical climate record and a natural global warming signature occurs after peak cooling as volcanic aerosol is slowly removed from the stratosphere. Quantitative information on the uncertainty range of volcanic forcings is therefore urgently needed. The amount of data collected by satellite-, ground-, and airborne instruments in the period following the 1991 eruption of Mount Pinatubo (see, e.g., Sect. 3.3.2, Table 7) provides an opportunity to test model capabilities in simulating large perturbations of stratospheric aerosol and their effect on the climate. Recent advances in quantifying uncertainty in climate models (e.g. Rougier et al., 2009; Lee at al., 2011) involve running ensembles of simulations to systematically explore combinations of different external forcings to scope the range of possible realizations. There are now a large number of general circulation models (GCMs) with prognostic aerosol modules, which tend to assess the stratospheric aerosol perturbation through the Pinatubo-perturbed period (see Table 9). Although these different models achieve reasonable agreement with the observations, this consistency of skill is achieved with considerable diversity in the values assumed for the initial magnitude and distribution of the SO2 injection. The SO2 injections prescribed by different models range from 5 to 10 Tg S, and the upper edge of the injection altitude varies among models from as low as 18 km to as high as 29 km, as shown in Table 9. Such simulations also differ in the choice of the vertical distribution of SO2 injection (e.g. uniform, Gaussian or triangular distributions) and the horizontal injection area (one to several grid boxes). The fact that different choices of injection parameters lead to similar results in different models points to differences in the models' internal treatment of aerosol evolution. Accurately capturing microphysical processes such as coagulational, growth, and subsequent rates of sedimentation has been shown to be important for volcanic forcings (English et al., 2013), but some studies (e.g. Mann et al., 2015) identify that these processes interplay also with aerosol–radiation interactions, the associated dynamical effects changing the fate of the volcanic sulfur and its removal into the troposphere. The PoEMS experiment will specifically assess this issue by adjusting the rate of specific microphysical processes in each model simultaneously with perturbations to SO2 emission and injection height, thereby assessing the footprint of their influence on subsequent volcanic forcing in different complexity aerosol schemes and the relative contribution to uncertainty from emissions and microphysics.
Table 9List of SO2 injection settings used in different interactive stratospheric aerosol model simulations of the 1991 Mount Pinatubo eruption. * Main peak at 23.5 km, secondary peak at 21 km.
3.4.3 Experiment set-up and specifications
For each model, an ensemble of simulations will be performed varying SO2 injection parameters and a selection of internal model parameters within a realistic uncertainty distribution. A maximin Latin hypercube sampling strategy will be used to define parameter values to be set in each PPE member in order to obtain good coverage of the parameter space. The maximin Latin hypercube is designed such that the range of every single parameter is well sampled and the sampling points are well spread through the multi-dimensional uncertainty space – this is achieved by splitting the range of every parameter into N intervals and ensuring that precisely one point is in each interval in all dimensions, where N is the total number of model simulations, and the minimum distance between any pair of points in all dimensions is maximized. Figure 6 shows the projection onto two dimensions of a Latin hypercube built in eight dimensions with 50 model simulations. The size of the Latin hypercube needed will depend on the number of model parameters to be perturbed; the number of simulations to be performed will be equal to 10 times the number of parameters – 7 per parameter to build the emulator and 3 per parameter to validate the emulator. All parameters are perturbed simultaneously in the Latin hypercube.
In order to be inclusive of modelling groups with less computing time available and of different types of aerosol schemes, we define three options of experimental design with different numbers of perturbed parameters and thus simulation ensemble members. The three options involve varying all eight (standard set), five (reduced set), or three (minimum set) of the list of uncertain parameters, resulting in ensembles of 80 (standard), 50 (reduced), or 30 (minimum) PPE members. The parameters to be varied are shown in Table 10 and include variables related to the volcanic injection, such as its magnitude, height, latitudinal extent, and composition, and to the life cycle of the volcanic sulfate, such as the sedimentation rate, its microphysical evolution, and the SO2 to conversion rate.
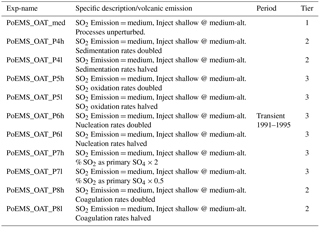
Prior to performing the full PPE, modelling groups are encouraged to run “one-at-a-time” (OAT) test runs with each of the process parameters increased/decreased to its maximum/minimum value. Submission of these OAT test runs is encouraged (following the naming convention in Table 11) because as well as being an important check that the model parameter scaling is being implemented as intended, the results will also enable intercomparison of single-parameter effects between participating models ahead of the full ensemble. When imposing the parameter scalings, the models must only enact that change in grid boxes with volcanically enhanced air masses. This can be determined either via total sulfur volume mixing ratio threshold suitable for the particular model or via the “passive tracer Volc” recommended in Sect. 3.3.3. Restricting the perturbation to the Pinatubo sulfur will leave pre-eruption conditions and tropospheric aerosol properties unchanged, ensuring a clean “uncertainty pdf” for the “volcanic forcing”.
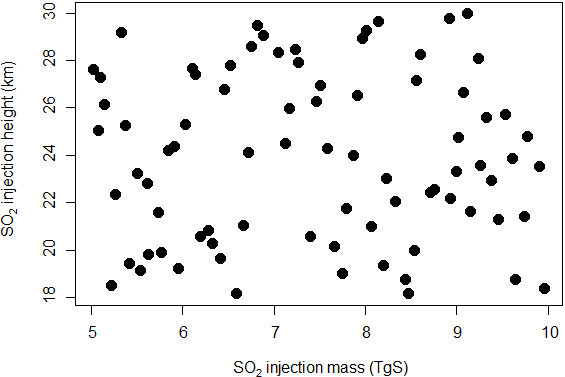
Figure 6Illustration of the Latin hypercube sampling method. Each dot represents the value used in one of the particular simulations with a perturbed parameter ensemble (PPE) with 50 members (realizations/integrations).
That this restriction to the parameter scalings is operational is an important preparatory exercise and will need to have been verified when running the OAT test runs.
Table 10Groups will need to translate the 0–1 latitude-spread parameter into a sequence of fractional injections into all grid boxes between the equator and 15∘ N. For example for a model with 2.5∘ latitude resolution, the relative injection in the six latitude bins between 0 and 15∘ N would take the form [0, 0, 0, 0, 0, 0, 1] for extent factor = 0 and [0.167, 0.167, 0.167, 0.167, 0.167, 0.167] for extent factor = 1. Injection ratios for intermediate values of the spread factor would be calculated by interpolation between these two end member cases.
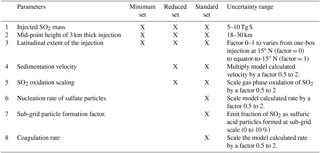
Table 11Overview of PoEMS one-at-a-time (OAT) test runs. Note that when imposing the parameter scaling, the models should only enact the change in volcanically enhanced air masses (where the total sulfur volume mixing ratio exceeds a threshold suitable for their model). Perturbing only the volcanically enhanced air masses will ensure, pre-eruption conditions and tropospheric aerosol properties remains unchanged by the scalings.
Once a modelling group has performed the PPE of simulations as defined by the Latin hypercube a statistical analysis will be performed. Emulators for each of a selection of key metrics will be built, following the approach described by Lee et al. (2011), to examine how the parameters lead to uncertainty in key features of the Pinatubo-perturbed stratospheric aerosol. The emulator builds a statistical model between the ensemble design and the key model output and once validated allows sampling of the whole parameter space to derive a PDF of each key model output.
Variance-based sensitivity analysis will then be used to decompose the resulting probability distribution into its sources providing information on the key sources of uncertainty in any model output. The two sensitivity indices of interest are called the main effect and the total effect. The main effect measures the percentage of uncertainty in the simulated metric due to each parameter variation individually. The total effect measures the percentage of uncertainty in the key model output due to each parameter, including the additional contribution from its interaction with other uncertain parameters. The sources of model parametric uncertainty (i.e. the sensitivity indices) will be identified for each model with discussion with each group to check the results. By then comparing the sensitivity to the uncertain parameters across the range of participating models, we will learn about how the model's differing treatment of aerosol processes and the inherent dynamical and chemical processes resolved in the host model together determine the uncertainty in its predicted Pinatubo radiative forcings.
The probability distribution of observable key model outputs will also be compared to observations in order to constrain the key sources of uncertainty and thereby reduce the parametric uncertainty in individual models. The resulting model constraints will be compared between models providing quantification of both parametric uncertainty and structural uncertainty for key variables such as AOD, effective radius, and radiative flux anomalies. This sensitivity analysis will also identify the variables for which better observational constraints would yield the greatest reduction in model uncertainties.
The ISA-MIP experiments will improve our understanding of stratospheric aerosol processes, chemistry, and dynamics and constrain climate impacts of background aerosol “variability”, small volcanic eruptions, and large volcanic eruptions. The experiments will also help to resolve some disagreements amongst global aerosol models, for instance the difference in volcanic SO2 forcing efficacy for Pinatubo (see Sect. 3.3.2). The results of this work will help constrain the contribution of stratospheric aerosols to the early 21st century global warming hiatus period, the effects of hypothetical geoengineering schemes, and other climate processes that are influenced by the stratosphere. Overall, they provide an excellent opportunity to answer some of these questions as part of the greater WCRP SPARC and CMIP6 efforts. For example, the CMIP6 Geoengineering Model Intercomparison Project (GeoMIP, Kravitz et al., 2015) investigates common ways in which climate models treat various geoengineering scenarios some of them via sulfate aerosols (e.g. Tilmes et al., 2015). However, there is a large inter-model spread for the cooling efficiency of sulfate aerosol, i.e. the normalized cooling rate per injected unit of sulfur (Moriyama et al., 2016). ISA-MIP is therefore of special importance for GeoMIP as it could help to understand the reason for these uncertainties, to better constrain the forcing efficiency and to improve future scenarios. Furthermore, it is so far not clear whether the large inter-model spread of the CMIP5 models in the simulated post-volcanic climate response mostly depends on uncertainties in the imposed volcanic forcing or on an insufficient representation of climate processes. To discriminate between the individual uncertainty factors, it is useful to develop standardized experiments/model activities that systematically address specific uncertainty factors. Hence, ISA-MIP, which covers the uncertainties in the pathway from the eruption source to the volcanic radiative forcing, will complement the CMIP6 VolMIP project (Zanchettin et al., 2016), which addresses the pathway from the forcing to the climate response and the feedback by studying the uncertainties in the post-volcanic climate response to a well-defined volcanic forcing. ISA-MIP also complements the chemistry climate model initiative (CCMI; Eyring et al., 2013) and the Aerosol Comparison (AeroCom) initiative (Schulz et al., 2006) as well as the Aerosol Chemistry Model Intercomparison Project (AerChemMIP; Collins et al., 2017) as it concentrates on stratospheric aerosol which is not in the focus of all these activities.
As well as identifying areas of agreement and disagreement among the different complexities of models in top-level comparisons focussing on fields such as zonal-mean mid-visible AOD and extinction profiles in different latitudes, ISA-MIP also intends to explore relationships between key parameters. For example, how does sulfate deposition to the polar ice sheets relate to volcanic forcing in the different interactive stratospheric aerosol models that predict the transport and sedimentation of the particles? Or how do model “spectral extinction curves” evolve through the different volcanically perturbed periods and how do they relate to simulated effective radius compared to the theoretical approach to derive effective radius from Stothers (1997, 2001)? There is considerable potential to apply the model uncertainty analysis to make new statements to inform our confidence in volcanic forcings derived from ice core and astronomical measurements for eruptions before the in situ measurement era.
The model output from the all simulations described in this paper will be distributed through the World Data climate Center https://cera-www.dkrz.de/WDCC/ui/cerasearch/ with digital object identifiers (DOIs) assigned. The model output will be freely accessible through this data portal after registration.
| AeroCom | Aerosol Comparisons between Observations and Models |
| AOD | Aerosol optical depth |
| ASAP2006 | Assessment of Stratospheric Aerosol properties (SPARC, 2006) |
| AVHRR | Advanced Very High Resolution Radiometer |
| BDC | Brewer–Dobson circulation |
| CALIOP | Cloud-Aerosol Lidar with Orthogonal Polarization |
| CATS | Cloud-Aerosol Transport System |
| CCM | Chemistry–climate model |
| CCMI | Chemistry-Climate Model Initiative |
| CMIP | Coupled Model Intercomparison Project |
| CMIP5 | Coupled Model Intercomparison Project, phase 5 |
| CMIP6 | Coupled Model Intercomparison Project, phase 6 |
| ECMWF | European Centre for Medium-Range Weather Forecasting |
| ENSO | El Niño–Southern Oscillation |
| ENVISAT | Environmental Satellite |
| ERA-Interim | ECMWF Interim Re-Analysis |
| EVA | Easy Volcanic Aerosol |
| GCM | General circulation model |
| GHG | Greenhouse gases |
| GOMOS | Global Ozone Monitoring by Occultation of Stars |
| HALOE | Halogen Occultation Experiment |
| ISA-MIP | Interactive Stratospheric Aerosol Model Intercomparion Project |
| IPCC | Intergovernmental Panel on Climate Change |
| MAECHAM5-SAM2 | Middle Atmosphere version of the European Center/HAMburg model, |
| atmospheric GCM (cycle 5) with the Stratospheric Aerosol Model (version 2) | |
| MIPAS | Michelson Interferometer for Passive Atmospheric Sounding |
| NAO | North Atlantic Oscillation |
| NH | Northern Hemisphere |
| OMI | Ozone Monitoring Instrument |
| OMPS | Ozone Mapping and Profiler Suite |
| OMPS-LP | Ozone Mapping and Profiler Suite–Limb Profiler |
| OPC | Optical particle counter |
| OSIRIS | Optical Spectrograph and InfraRed Imager System |
| Probability density function | |
| QBO | Quasi-biennial oscillation |
| SAGE | Stratospheric Aerosol and Gas Experiment |
| SAM II | Stratospheric Aerosol Measurement II |
| SCIAMACHY | Scanning Imaging Absorption Spectrometer for Atmospheric Chartography |
| SPARC | Stratosphere–troposphere Processes And their Role in Climate |
| SSiRC | Stratospheric Sulfur and its Role in Climate |
| SST | Sea surface temperature |
| SIC | Sea ice cover |
| TOMS | Total Ozone Mapping Spectrometer |
| TOVS | TIROS Operational Vertical Sounder |
| VolMIP | Model Intercomparison Project on the climate response to Volcanic forcing |
The supplement related to this article is available online at: https://doi.org/10.5194/gmd-11-2581-2018-supplement.
CT, GWM VA, RH, LAL, AS, CB, SC MC, SSD, TD, JME, MJM, RN, JXS, MT, and DW designed the experiments. CT and GWM co-ordinated the writing, and drafted the paper. All authors have contributed to the writing and have approved of the final version of the paper.
The authors declare that they have no conflict of interest.
The authors thank their SSiRC colleagues for continuing support and
discussion. We acknowledge the scientific guidance (and sponsorship) of the
World Climate Research Programme to motivate this work, to be co-ordinated in
the framework of SPARC. Claudia Timmreck, Matthew Toohey and Rene Hommel acknowledge
support from the German federal Ministry of Education (BMBF), the research
programme “MiKlip” (FKZ:01LP1517(CT):/01LP1130B(MT)), and ROMIC-ROSA
(FKZ:01LG1212A (RH)). Claudia Timmreck is also supported by the European Union project
StratoClim (FP7-ENV.2013.6.1-2). Christoph Brühl's PhD student Jennifer Schallock,
who contributed to the compilation of the volcano inventory, is also
supported by StratoClim. Anja Schmidt was funded by an Academic Research
Fellowship from the School of Earth and Environment, University of Leeds, and
NERC grant NE/N006038/1. Matthew Toohey acknowledges support by the Deutsche
Forschungsgemeinschaft (DFG) in the framework of the priority programme
“Antarctic Research with comparative investigations in Arctic ice areas”
through grant TO 967/1-1. The National Center for Atmospheric Research is
funded by the National Science Foundation. Lindsay Lee is a Leverhulme Early
Career Fellow funded under the Leverhulme Trust grant ECF-2014-524.
The article processing charges for this open-access
publication
were covered by the Max Planck Society.
Edited by: Slimane Bekki
Reviewed by: two anonymous referees
Andres, R. J. and Kasgnoc, A. D.: A time-averaged inventory of subaerial volcanic sulfur emissions, J. Geophys. Res., 103, 25251–25261, 1998.
Antuña, J. C., Robock, A., Stenchikov, G. L., Thomason, L. W., and Barnes, J. E.: Lidar validation of SAGE II aerosol measurements after the 1991 Mount Pinatubo eruption, J. Geophys. Res., 107, 4194, https://doi.org/10.1029/2001JD001441, 2002.
Aquila, V., Oman, L. D., Stolarski, R. S., Colarco, P. R., and Newman, P. A.: Dispersion of the volcanic sulfate cloud from a Mount Pinatubo-like eruption, J. Geophys. Res.-Atmos., 117, D06216, https://doi.org/10.1029/2011JD016968, 2012.
Aquila, V., Oman, L. D., Stolarski, R., Douglass, A. R., and Newman, P. A.: The Response of Ozone and Nitrogen Dioxide to the Eruption of Mt. Pinatubo at Southern and Northern Midlatitudes, J. Atmos. Sci., 70, 894–900, https://doi.org/10.1175/JAS-D-12-0143.1, 2013.
Aquila, V., Garfinkel, C. I., Newman, P., Oman, L. D., and Waugh, D. W.: Modifications of the quasi-biennial oscillation by a geoengineering perturbation of the stratospheric aerosol layer, Geophys. Res. Lett., 41, 1738–1744, https://doi.org/10.1002/2013GL058818, 2014.
Avdyushin, S. I. Tulinov, G. F., Ivanov, M. S., Kuzmenko, B. N., Mezhue, I. R., Nardi, B., Hauchecorne, I. A., and Chanin, M.-L.: 1. Spatial and temporal evolution of the optical thickness of the Pinatubo aerosol clouds in the Northern Hemisphere from a network of ship-borne and stationary lidars, Geophys. Res. Lett., 20, 1963–1966, 1993.
Baran, A. J. and Foot, J. S.: New application of the operational sounder HIRS in determining a climatology of sulphuric acid aerosol from the Pinatubo eruption, J. Geophys. Res., 99, 673–679, 1994.
Bekki, S.: Oxidation of volcanic SO2: a sink for stratospheric OH and H2O, Geophys. Res. Lett., 22, 913–916, 1995.
Bekki, S., Pyle, J. A., Zhong, W., Tourni, R., Haigh, J. D., and Pyle, D. M.: The role of microphysical and chemical processes in prolonging the climate forcing of the Toba Eruption, Geophys. Res. Lett., 23, 2669–2672, 1996.
Bingen, C., Robert, C. E., Stebel, K., Brühl, C., Schallock, J., Vanhellemont, F., Mateshvili, N., Höpfner, M., Trickl, T., Barnes, J. E., Jumelet, J., Vernier, J.-P., Popp, T., de Leeuw, G., and Pinnock, S.: Stratospheric aerosol data records for the climate change initiative: Development, validation and application to chemistry-climate modelling, Remote Sens. Environ., 203, 296–321, https://doi.org/10.1016/j.rse.2017.06.002, 2017.
Bittner, M., Timmreck, C., H. Schmidt, H., Toohey, M., and Krüger, K.: The impact of wave-mean flow interaction on the Northern Hemisphere polar vortex after tropical volcanic eruptions, J. Geophys. Res.-Atmos., 121, 5281–5297, https://doi.org/10.1002/2015JD024603, 2016.
Bourassa, A. E., Degenstein, D. A., Gattinger, R. L., and Llewellyn, E. J.: Stratospheric aerosol retrieval with OSIRIS limb scatter measurements, J. Geophys. Res., 112, D10217, https://doi.org/10.1029/2006JD008079, 2007.
Bourassa, A. E., Robock, A., Randel, W. J., Deshler, T., Rieger, L. A., Lloyd, N. D., Llewellyn, E. J. T., and Degenstein, D. A.: Large volcanic aerosol load in the stratosphere linked to Asian monsoon transport, Science, 337, 78–81, https://doi.org/10.1126/science.1219371, 2012.
Bovensmann, H. Burrows, J. P., Buchwitz, M., Frerick, J., Noël, S., Rozanov, V. V., Chance, K. V., and Goede, A. P. H.: SCIAMACHY: Mission Objectives and Measurement Modes, J. Atmos. Sci., 56, 127–150, https://doi.org/10.1175/1520-0469(1999)056<0127:SMOAMM>2.0.CO;2, 1999.
Brock, C. A., Jonsson, H. H., Wilson, J. C., Dye, J. E., Baumgardner, D., Borrmann, S., Pitts, M. C., Osborn, M. T., DeCoursey, R. J., and Woods, D. C: Relationships between optical extinction, backscatter and aerosol surface and volume in the stratosphere following the eruption of Mt. Pinatubo, Geophys. Res. Lett., 20, 2555–2558, 1993.
Browell, E. V., Butler, C. F., Fenn, M. A., Grant, W. B., Ismail, S., Schoeberl, M. R., Toon, O. B., Loewenstein, M., and Podolske, J. R.: Ozone and Aerosol Changes During the 1991–2 Airborne Arctic Stratospheric Expedition, Science, 261, 1151–1158, 1993.
Brühl, C.: Volcanic SO2 data derived from limb viewing satellites for the lower stratosphere from 1998 to 2012, World Data Center for Climate (WDCC) at DKRZ, https://doi.org/10.1594/WDCC/SSIRC_1, 2018.
Brühl, C., Lelieveld, J., Crutzen, P. J., and Tost, H.: The role of carbonyl sulphide as a source of stratospheric sulphate aerosol and its impact on climate, Atmos. Chem. Phys., 12, 1239–1253, https://doi.org/10.5194/acp-12-1239-2012, 2012.
Brühl, C., Lelieveld, J., Tost, H., Höpfner, M., and Glatthor, N.: Stratospheric sulphur and its implications for radiative forcing simulated by the chemistry climate model EMAC, J. Geophys. Res.-Atmos., 120, 2103–2118, https://doi.org/10.1002/2014JD022430, 2015.
Carslaw, K., Lee, L., Reddington, C., Pringle, K., Rap, A., Forster, P., Mann, G., Spracklen, D., Woodhouse, M., and Regayre, L.: Large contribution of natural aerosols to uncertainty in indirect forcing, Nature, 503, 67–71, 2013.
Carn, S. A., Clarisse, L., and Prata, A. J.: Multi-decadal satellite measurements of global volcanic degassing, J. Volcanol. Geoth. Res., 311, 99–134, 2016.
Charlton-Perez, A. J., Baldwin, M. P., Birner, T., Black, R. X., Butler, A. H., Calvo, N., Davis, N. A., Gerber, E. P., Gillett, N., Hardiman, S., Kim, J., Krüger, K., Lee, Y.-Y., Manzini, E., McDaniel, B. A., Polvani, L., Reichler, T., Shaw, T. A., Sigmond, M., Son, S.-W., Toohey, M., Wilcox, L., Yoden, S., Christiansen, B., Lott, F., Shindell, D., Yukimoto, S., and Watanabe, S.: On the lack of stratospheric dynamical variability in low-top versions of the CMIP5 models, J. Geophys. Res.-Atmos., 118, 2494–2505, https://doi.org/10.1002/jgrd.50125, 2013.
Clemesha, B. R., Kent, G. S., and Wright, R. W. H,: Laser probing the lower atmosphere, Nature, 209, 184–185, 1966.
Collins, W. J., Lamarque, J.-F., Schulz, M., Boucher, O., Eyring, V., Hegglin, M. I., Maycock, A., Myhre, G., Prather, M., Shindell, D., and Smith, S. J.: AerChemMIP: quantifying the effects of chemistry and aerosols in CMIP6, Geosci. Model Dev., 10, 585–607, https://doi.org/10.5194/gmd-10-585-2017, 2017.
Crowley, T. J. and Unterman, M. B.: Technical details concerning development of a 1200 yr proxy index for global volcanism, Earth Syst. Sci. Data, 5, 187–197, https://doi.org/10.5194/essd-5-187-2013, 2013.
Dee, D. P., Uppala, S. M., Simmons, A. J., Berrisford, P., Poli, P., Kobayashi, S., Andrae, U., Balmaseda, M. A., Balsamo, G., Bauer, P., Bechtold, P., Beljaars, A. C. M., van de Berg, L., Bidlot, J., Bormann, N., Delsol, C., Dragani, R., Fuentes, M., Geer, A. J., Haimberger, L., Healy, S. B., Hersbach, H., Holm, E. V., Isaksen, L., Kallberg, P., Kohler, M., Matricardi, M., McNally, A. P., Monge-Sanz, B. M., Morcrette, J. J., Park, B. K., Peubey, C., de Rosnay, P., Tavolato, C., Thepaut, J. N., and Vitart, F.: The ERA-Interim reanalysis: Configuration and performance of the data assimilation system, Q. J. Roy. Meteorol. Soc., 137, 553–597, https://doi.org/10.1002/qj.828, 2011.
Dentener, F., Kinne, S., Bond, T., Boucher, O., Cofala, J., Generoso, S., Ginoux, P., Gong, S., Hoelzemann, J. J., Ito, A., Marelli, L., Penner, J. E., Putaud, J.-P., Textor, C., Schulz, M., van der Werf, G. R., and Wilson, J.: Emissions of primary aerosol and precursor gases in the years 2000 and 1750 prescribed data-sets for AeroCom, Atmos. Chem. Phys., 6, 4321–4344, https://doi.org/10.5194/acp-6-4321-2006, 2006.
Deshler, T.: In situ measurements of Pinatubo aerosol over Kiruna on four days between 18 January and 13 February 1992, Geophys. Res. Lett., 21, 1323–1326, 1994.
Deshler, T.: A review of global stratospheric aerosol: measurements, importance, life cycle, and local stratospheric aerosol, Atmos. Res., 90, 223–232, https://doi.org/10.1016/j.atmosres.2008.03.016, 2008.
Deshler, T., Hervig, M. E., Hofmann, D. J., Rosen, J. M., and Liley, J. B.: Thirty years of in situ stratospheric aerosol size distribution measurements from Laramie, Wyoming (41∘ N), using balloon-borne instruments, J. Geophys. Res.-Atmos., 108, 4167, https://doi.org/10.1029/2002JD002514, 2003.
Dhomse, S. S., Emmerson, K. M., Mann, G. W., Bellouin, N., Carslaw, K. S., Chipperfield, M. P., Hommel, R., Abraham, N. L., Telford, P., Braesicke, P., Dalvi, M., Johnson, C. E., O'Connor, F., Morgenstern, O., Pyle, J. A., Deshler, T., Zawodny, J. M., and Thomason, L. W.: Aerosol microphysics simulations of the Mt. Pinatubo eruption with the UM-UKCA composition-climate model, Atmos. Chem. Phys., 14, 11221–11246, https://doi.org/10.5194/acp-14-11221-2014, 2014.
Diallo, M., Ploeger, F., Konopka, P., Birner, T., Müller, R., Riese, M., and Jegou, F.: Significant Contributions of Volcanic Aerosols to Decadal Changes in the Stratospheric Circulation, Geophys. Res. Lett., 44, 10780, https://doi.org/10.1002/2017GL074662, 2017.
Diehl, T., Heil, A., Chin, M., Pan, X., Streets, D., Schultz, M., and Kinne, S.: Anthropogenic, biomass burning, and volcanic emissions of black carbon, organic carbon, and SO2 from 1980 to 2010 for hindcast model experiments, Atmos. Chem. Phys. Discuss., 12, 24895–24954, https://doi.org/10.5194/acpd-12-24895-2012, 2012.
Dyer, A. J. and Hicks, B. B.: Stratospheric transport of volcanic dust inferred from surface radiation measurements, Nature, 208, 131–133, 1965.
Dyer, A. J. and Hicks, B. B.: Global spread of volcanic dust from the Bali eruption of 1963, Q. J. Roy. Meteorol. Soc., 94, 545–554, 1968.
Ebert, M., Weigel, R., Kandler, K., Günther, G., Molleker, S., Grooß, J.-U., Vogel, B., Weinbruch, S., and Borrmann, S.: Chemical analysis of refractory stratospheric aerosol particles collected within the arctic vortex and inside polar stratospheric clouds, Atmos. Chem. Phys., 16, 8405–8421, https://doi.org/10.5194/acp-16-8405-2016, 2016.
Elterman, L. Wexler, R., and Chang, D. T.: Features of Tropospheric and Stratospheric Dust, Appl. Optics, 8, 893–903, 1969.
English, J. M., Toon, O. B., Mills, M. J., and Yu, F.: Microphysical simulations of new particle formation in the upper troposphere and lower stratosphere, Atmos. Chem. Phys., 11, 9303–9322, https://doi.org/10.5194/acp-11-9303-2011, 2011.
English, J. M., Toon, O. B., and Mills, M. J.: Microphysical simulations of large volcanic eruptions: Pinatubo and Toba, J. Geophys. Res.-Atmos., 118, 1880–1895, https://doi.org/10.1002/jgrd.50196, 2013.
Eyring, V., Lamarque, J.-F., Hess, P., Arfeuille, F., Bowman, K., Chipperfield, M. P., Duncan, B., Fiore, A., Gettelman, A., Giorgetta, M. A., Granier, C., Hegglin, M., Kinnison, D., Kunze, M., Langematz, U., Luo, B., Martin, R., Matthes, K., Newman, P. A., Peter, T., Robock, A., Ryerson, T., Saiz-Lopez, A., Salawitch, R., Schultz, M., Shepherd, T. G., Shindell, D., Staehelin, J., Tegtmeier, S., Thomason, L., Tilmes, S., Vernier, J.-P., Waugh, D. W., and Young, P. J.: Overview of IGAC/SPARC Chemistry-Climate Model Initiative (CCMI) Community Simulations in Support of Upcoming Ozone and Climate Assessments, SPARC Newsletter No. 40, SPARC, 48–66, 2013.
Flowers, E. C. and Viebrock, H. J.: Solar Radiation: An Anomalous Decrease of Direct Solar Radiation, Science, 148, 493–494, 1965.
Friend, J. P.: Properties of the stratospheric aerosol, Tellus, 18, 465-473, 1966.
Gao, C., Oman, L., Robock, A., and Stenchikov, G. L.: Atmospheric volcanic loading derived from bipolar ice cores: Accounting for the spatial distribution of volcanic deposition, J. Geophys. Res., 112, D09109, https://doi.org/10.1029/2006JD007461, 2007.
Gao, C., Robock, A., and Ammann, C.: Volcanic forcing of climate over the past 1500 years: an improved ice core-based index for climate models, J. Geophys. Res., 113, D23111, https://doi.org/10.1029/2008JD010239, 2008.
Garcia, R. R., Randel, W. J., and Kinnison, D. E.: On the determination of age of air trends from atmospheric trace species, J. Atmos. Sci., 68, 139–154, https://doi.org/10.1175/2010JAS3527.1, 2011.
Garfinkel, C. I., Aquila, V., Waugh, D. W., and Oman, L. D.: Time-varying changes in the simulated structure of the Brewer–Dobson Circulation, Atmos. Chem. Phys., 17, 1313–1327, https://doi.org/10.5194/acp-17-1313-2017, 2017.
Glatthor, N., Höpfner, M., Baker, I. T., Berry, J., Campbell, J. E., Kawa, S. R., Krysztofiak, G., Leyser, A., Sinnhuber, B.-M., Stiller, G. P., Stinecipher, J., and von Clarmann, T.: Tropical sources and sinks of carbonyl sulfide observed from space, Geophys. Res. Lett., 42, 10082–10090, https://doi.org/10.1002/2015GL066293, 2015.
Grainger, R. G., Lambert, A., Taylor, F. W., Remedios, J. J., Rogers, C. D., and Corney, M.: Infrared absorption by volcanic stratospheric aerosols observed by ISAMS, Geophys. Res. Lett., 20, 1287–1290, 1993.
Grams, G. and Fiocco, G.: Stratospheric Aerosol Layer during 1964 and 1965, J. Geophys. Res., 72, 3523–3542, 1967.
Granier, C., Bessagnet, B., Bond, T. C., D'Angiola, A., Denier van der Gon, H., Frost, G. J., Heil, A., Kaiser, J. W., Kinne, S., Klimont, Z., Kloster, S., Lamarque, J.-F., Liousse, C., Masui, T., Meleux, F., Mieville, A., Ohara, T., Raut, J.-C., Riahi, K., Schultz, M. G., Smith, S. J., Thompson, A., Aardenne, J., Werf, G. R., and Vuuren, D. P.: Evolution of anthropogenic and biomass burning emissions of air pollutants at global and regional scales during the 1980–2010 period, Climatic Change, 109, 163–190, https://doi.org/10.1007/s10584-011-0154-1, 2011.
Günther, A., Höpfner, M., Sinnhuber, B.-M., Griessbach, S., Deshler, T., von Clarmann, T., and Stiller, G.: MIPAS observations of volcanic sulfate aerosol and sulfur dioxide in the stratosphere, Atmos. Chem. Phys., 18, 1217–1239, https://doi.org/10.5194/acp-18-1217-2018, 2018.
Guo, S., Bluth, G. J. S., Rose, W. I., Watson, I. M., and Prata, A. J.: Re-evaluation of SO2 release of the 15 June 1991 Pinatubo eruption using ultraviolet and infrared satellite sensors, Geochem. Geophy. Geosy., 5, 1–31, 2004a.
Guo, S, Rose, W. I., Bluth, G. J. S., and Watson, I. M.: Particles in the great Pinatubo volcanic cloud of June 1991: the role of ice, Geochem. Geophy. Geosy., 5, Q05003, https://doi.org/10.1029/2003GC000655, 2004b.
Hamill, P. and Brogniez, C.: Ch4. Stratospheric aerosol record and climatology, in: SPARC Assessment of Stratospheric Aerosol Properties, edited by: Thomason, L. and Peter, T., World Climate Research Program 124, Toronto, 107–176, 2006.
Hamill, P., Jensen, E. J., Russel, P. B., and Bauman, J. J.: The life cycle of stratospheric aerosol particles, B. Am. Meteorol. Soc., 78, 1395–1410, 1997.
Hofmann, D. J. and Rosen, J. M.: Sulfuric acid droplet formation and growth in the stratosphere after the 1982 eruption of El Chichón, Geophys. Res. Lett., 10, 313–316, https://doi.org/10.1029/GL010i004p00313, 1983.
Hofmann, D. J. and Rosen, J. M.: On the prolonged lifetime of the El Chichón sulfuric acid aerosol cloud, J. Geophys. Res., 92, 9825–9830, 1987.
Hofmann, D. J., Barnes, J. O'Neill, M., Trudeau, M. and Neely, R.: Increase in background stratospheric aerosol observed with lidar at Mauna Loa Observatory and Boulder, Colorado, Geophys. Res. Lett., 36, 1–5, 2009.
Hommel, R., Timmreck, C., and Graf, H. F.: The global middle-atmosphere aerosol model MAECHAM5-SAM2: comparison with satellite and in-situ observations, Geosci. Model Dev., 4, 809–834, https://doi.org/10.5194/gmd-4-809-2011, 2011.
Hommel, R., Timmreck, C., Giorgetta, M. A., and Graf, H. F.: Quasi-biennial oscillation of the tropical stratospheric aerosol layer, Atmos. Chem. Phys., 15, 5557–5584, https://doi.org/10.5194/acp-15-5557-2015, 2015.
Höpfner, M., Glatthor, N., Grabowski, U., Kellmann, S., Kiefer, M., Linden, A., Orphal, J., Stiller, G., von Clarmann, T., Funke, B., and Boone, C. D.: Sulfur dioxide (SO2) as observed by MIPAS/Envisat: temporal development and spatial distribution at 15–45 km altitude, Atmos. Chem. Phys., 13, 10405–10423, https://doi.org/10.5194/acp-13-10405-2013, 2013.
Höpfner, M., Boone, C. D., Funke, B., Glatthor, N., Grabowski, U., Günther, A., Kellmann, S., Kiefer, M., Linden, A., Lossow, S., Pumphrey, H. C., Read, W. G., Roiger, A., Stiller, G., Schlager, H., von Clarmann, T., and Wissmüller, K.: Sulfur dioxide (SO2) from MIPAS in the upper troposphere and lower stratosphere 2002–2012, Atmos. Chem. Phys., 15, 7017–7037, https://doi.org/10.5194/acp-15-7017-2015, 2015.
Jones, A. C., Haywood, J. M., Jones, A., and Aquila, V.: Sensitivity of volcanic aerosol dispersion to meteorological conditions: A Pinatubo case study, J. Geophys. Res.-Atmos., 121, 6892–6908, https://doi.org/10.1002/2016JD025001, 2016.
Kent, G. S., Clemesha, B. R., and Wright, R. W.: High altitude atmospheric scattering of light from a laser beam, J. Atmos. Terr. Phys., 29, 169–181, 1967.
Kinne, S., Toon, O. B., and Prather, M. J.: Buffering of stratospheric circulation by changing amounts of tropical ozone a Pinatubo Case Study, Geophys. Res. Lett., 19, 1927–1930, https://doi.org/10.1029/92GL01937, 1992.
Kleinschmitt, C., Boucher, O., and Platt, U.: Sensitivity of the radiative forcing by stratospheric sulfur geoengineering to the amount and strategy of the SO2 injection studied with the LMDZ-S3A model, Atmos. Chem. Phys., 18, 2769–2786, https://doi.org/10.5194/acp-18-2769-2018, 2018.
Kokkola, H., Hommel, R., Kazil, J., Niemeier, U., Partanen, A.-I., Feichter, J., and Timmreck, C.: Aerosol microphysics modules in the framework of the ECHAM5 climate model – intercomparison under stratospheric conditions, Geosci. Model Dev., 2, 97–112, https://doi.org/10.5194/gmd-2-97-2009, 2009.
Kovilakam, M. and Deshler, T.: On the accuracy of stratospheric aerosol extinction derived from in situ size distribution measurements and surface area density derived from remote SAGE II and HALOE extinction measurements, J. Geophys. Res.-Atmos., 120, 8426–8447, https://doi.org/10.1002/2015JD023303, 2015.
Kravitz, B., Robock, A., Bourassa, A., and Stenchikov, G.: Negligible climatic effects from the 2008 Okmok and Kasatochi volcanic eruptions, J. Geophys. Res., 115, D00L05, https://doi.org/10.1029/2009JD013525, 2010.
Kravitz, B., Robock, A., Tilmes, S., Boucher, O., English, J. M., Irvine, P. J., Jones, A., Lawrence, M. G., MacCracken, M., Muri, H., Moore, J. C., Niemeier, U., Phipps, S. J., Sillmann, J., Storelvmo, T., Wang, H., and Watanabe, S.: The Geoengineering Model Intercomparison Project Phase 6 (GeoMIP6): simulation design and preliminary results, Geosci. Model Dev., 8, 3379–3392, https://doi.org/10.5194/gmd-8-3379-2015, 2015.
Kremser, S., Thomason, L. W., von Hobe, M., Hermann, M., Deshler, T., Timmreck, C., Toohey, M., Stenke, A., Schwarz, J. P., Weigel, R., Fueglistaler, S., Prata, F. J., Vernier, J.-P., Schlager, H., Barnes, J. E., Antuña-Marrero, J.-C., Fairlie, D., Palm, M., Mahieu, E., Notholt, J., Rex, M., Bingen, C., Vanhellemont, F., Bourassa, A., Plane, J. M. C., Klocke, D., Carn, S. A., Clarisse, L., Trickl, T., Neely, R., James, A. D., Rieger, L., Wilson, J. C., and Meland, B.: Stratospheric aerosol – Observations, processes, and impact on climate, Rev. Geophys., 54, 1–58, https://doi.org/10.1002/2015RG000511, 2016.
Krueger, A. J., Krotkov, N. A., and Carn, S. A.: El Chichon: the genesis of volcanic sulfur dioxide monitoring from space, J. Volcanol. Geoth. Res., 175, 408–414, https://doi.org/10.1016/j.jvolgeores.2008.02.026, 2008.
Lacis, A., Hansen, J., and Sato, M.: Climate forcing by stratospheric aerosols, Geophys. Res. Lett., 19, 1607–1610, 1992.
Lambert, A., Grainger, R., Remedios, J., Rodgers, C., Corney, M., and Taylor, F.: Measurements of the evolution of the Mt. Pinatubo aerosol cloud by ISAMS, Geophys. Res. Lett., 20, 1287–1290, 1993.
Lee, L. A., Carslaw, K. S., Pringle, K. J., Mann, G. W., and Spracklen, D. V.: Emulation of a complex global aerosol model to quantify sensitivity to uncertain parameters, Atmos. Chem. Phys., 11, 12253–12273, https://doi.org/10.5194/acp-11-12253-2011, 2011.
Mann, G. W., Dhomse, S., Deshler, T., Timmreck, C., Schmidt, A., Neely, R., and Thomason, L.: Evolving particle size is the key to improved volcanic forcings, Past Global Change, 23, 52–53, 2015.
Marotzke, J. and Forster, P. M.: Forcing, feedback and internal variability in global temperature trends, Nature, 517, 565–570, https://doi.org/10.1038/nature14117, 2015.
Marshall, L., Schmidt, A., Toohey, M., Carslaw, K. S., Mann, G. W., Sigl, M., Khodri, M., Timmreck, C., Zanchettin, D., Ball, W. T., Bekki, S., Brooke, J. S. A., Dhomse, S., Johnson, C., Lamarque, J.-F., LeGrande, A. N., Mills, M. J., Niemeier, U., Pope, J. O., Poulain, V., Robock, A., Rozanov, E., Stenke, A., Sukhodolov, T., Tilmes, S., Tsigaridis, K., and Tummon, F.: Multi-model comparison of the volcanic sulfate deposition from the 1815 eruption of Mt. Tambora, Atmos. Chem. Phys., 18, 2307–2328, https://doi.org/10.5194/acp-18-2307-2018, 2018.
McLinden, C. A., Bourassa, A. E., Brohede, S., Cooper, M., Degenstein, D. A., Evans, W. J. F., Gattinger, R. L., Haley, C. S., Llewellyn, E. J., Lloyd, N. D., Loewen, P., Martin, R. V., McConnell, J. C., McDade, I. C., Murtagh, D., Rieger, L., Von Savigny, C., Sheese, P. E., Sioris, C. E., Solheim, B., and Strong, K.: Osiris: A Decade of scattered light, B. Am. Meteorol. Soc., 93, 1845–1863, https://doi.org/10.1175/BAMS-D-11-00135.1, 2012.
Mills, M. J., Schmidt, A., Easter, R., Solomon, S., Kinnison, D. E., Ghan, S. J., Neely III, R. R., Marsh, D. R., Conley, A., Bardeen, C. G., and Gettelman, A.: Global volcanic aerosol properties derived from emissions, 1990–2014, using CESM1(WACCM), J. Geophys. Res.-Atmos., 121, 2332–2348, https://doi.org/10.1002/2015JD024290, 2016.
Mills, M. J., Richter, J. H., Tilmes, S., Kravitz, B., MacMartin, D. G., Glanville, A. A., Tribbia, J. J., Lamarque, J.-F., Vitt, F., Schmidt, A., Gettelman, A., Hannay, C., Bacmeister, J. T., and Kinnison, D. E.: Radiative and chemical response to interactive stratospheric sulfate aerosols in fully coupled CESM1 (WACCM), J. Geophys. Res.-Atmos., 122, 13061–13078, https://doi.org/10.1002/2017JD027006, 2017.
Montzka, S. A., Calvert, P., Hall, B. D., Elkins, J. W., Conway, T. J., Tans, P. P., and Sweeney, C.: On the global distribution, seasonality, and budget of atmospheric carbonyl sulfide and some similarities with CO2, J. Geophys. Res., 112, D09302, https://doi.org/10.1029/2006JD007665, 2007.
Moreno, H. and Stock, J.: The atmospheric extinction on Cerro Tololo during 1963, Pub. Astron. Soc. Pacific, 76, 55–56, 1964.
Moriyama, R., Sugiyama, M., Kurosawa, A., Masuda, K., Tsuzuki, K., and Ishimoto, Y.: The cost of stratospheric climate engineering revisited, Mitig. Adapt. Strat. Global Change, 22, 1207–1228, https://doi.org/10.1007/s11027-016-9723-y, 2016.
Mossop, S. C.: Stratospheric particles at 20 km, Nature, 199, 325–326, 1963.
Mossop, S. C.: Volcanic dust collected at an altitude of 20 km, Nature, 203, 824–827, 1964.
Muthers, S., Kuchar, A., Stenke, A., Schmitt, J., Anet, J. G., Raible, C. C., and Stocker, T. F.: Stratospheric age of air variations between 1600–2100, Geophys. Res. Lett., 43, 5409–5418, https://doi.org/10.1002/2016GL068734, 2016.
Myhre, G., Shindell, D., Bréon, F. M., Collins, W., Fuglestvedt, J., Huang, J., Koch, D., Lamarque, J. F., Lee, D., Mendoza, B., Nakajima, T., Robock, A., Stephens, G., Takemura, T., and Zhang, H.: Anthropogenic and natural radiative forcing, in: Climate Change 2013: The Physical Science Basis, Contribution of Working Group I to the Fifth Assessment Report of the Intergovernmental Panel on Climate Change, edited by: Stocker, T. F., Qin, D., Plattner, G.-K., Tignor, M., Allen, S. K., Nauels, A., Xia, Y., Bex, V., and Midgley, P. M., Cambridge University Press, Cambridge, UK and New York, NY, USA, 2013.
Nardi, B., Chanin, M.-L, Hauchecorne, I. A., Avdyushin, S. I., Tulinov, G. F., Ivanov, M. S., Kuzmenko, B. N., and Mezhue, I. R.: 2. Morphology and dynamics of the Pinatubo aerosol layer in the northern hemisphere as detected from a ship-borne lidar, Geophys. Res. Lett., 20, 1967–1971, 1993.
National Research Council: Climate Intervention: Reflecting Sunlight to Cool Earth, The Natl. Acad. Press, Washington, D.C., 2015.
Neely, R. and Schmidt, A.: VolcanEESM: Global volcanic sulphur dioxide (SO2) emissions database from 1850 to present – Version 1.0, Cent. Environ. Data Anal., https://doi.org/10.5285/76ebdc0b-0eed-4f70-b89e-55e606bcd568, 2016.
Neely III, R. R., Toon, O. B., Solomon, S., Vernier, J. P., Alvarez, C., English, J. M., Rosenlof, K. H., Mills, M., Bardeen, C. G., Daniel, J. S., and Thayer, J. P.: Recent anthrogenic increases in SO2 from Asia have minimal impact on stratospheric aerosol, Geophys. Res. Lett., 40, 999–1004, https://doi.org/10.1002/grl.50263, 2013.
Neely III, R. R., Yu, P. Rosenlof, K. H., Toon, O. B., Daniel, J. S., Solomon, S., and Miller, H. L.: The contribution of anthropogenic SO2 emissions to the Asian tropopause aerosol layer, J. Geophys. Res.-Atmos., 119, 1571–1579, https://doi.org/10.1002/2013JD020578, 2014.
Niemeier, U. and Schmidt, H.: Changing transport processes in the stratosphere by radiative heating of sulfate aerosols, Atmos. Chem. Phys., 17, 14871–14886, https://doi.org/10.5194/acp-17-14871-2017, 2017.
Niemeier, U. and Timmreck, C.: What is the limit of climate engineering by stratospheric injection of SO2?, Atmos. Chem. Phys., 15, 9129–9141, https://doi.org/10.5194/acp-15-9129-2015, 2015.
Niemeier, U., Timmreck, C., Graf, H.-F., Kinne, S., Rast, S., and Self, S.: Initial fate of fine ash and sulfur from large volcanic eruptions, Atmos. Chem. Phys., 9, 9043–9057, https://doi.org/10.5194/acp-9-9043-2009, 2009.
Oman, L., Robock, A., Stenchikov, G. L., Thordarson, T., Koch, D., Shindell, D. T., and Gao, C. C.: Modeling the distribution of the volcanic aerosol cloud from the 1783–1784 Laki eruption, J. Geophys. Res.-Atmos., 111, D12209, https://doi.org/10.1029/2005JD006899, 2006.
Pinto, J. P., Turco, R. P., and Toon, O. B.: Self-limiting physical and chemical effects in volcanic eruption clouds, J. Geophys. Res., 94, 11165–11174, 1989.
Pitari, G. and Mancini, E.: Short-term climatic impact of the 1991 volcanic eruption of Mt. Pinatubo and effects on atmospheric tracers, Nat. Hazards Earth Syst. Sci., 2, 91–108, https://doi.org/10.5194/nhess-2-91-2002, 2002.
Pitari, G., Cionni, I., Di Genova, G., Visioni, D., Gandolfi, I., and Mancini, E.: Impact of Stratospheric Volcanic Aerosols on Age of-Air and Transport of Long-Lived Species, Atmosphere, 7, 149, https://doi.org/10.3390/atmos7110149, 2016a.
Pitari, G., Di Genova, G., Mancini, E., Visioni, D., Gandolfi, I., and Cionni, I.: Stratospheric Aerosols from Major Volcanic Eruptions: A Composition-Climate Model Study of the Aerosol Cloud Dispersal and e-folding Time, Atmosphere, 7, 75, https://doi.org/10.3390/atmos7060075, 2016b.
Pittock, A. B.: A thin stable layer of anomalous ozone and dust content, J. Atmos. Sci., 23, 538–542, 1966.
Plumb, R. A.: A “tropical pipe” model of stratospheric transport, J. Geophys. Res., 101, 3957–3972, https://doi.org/10.1029/95JD03002, 1996.
Pueschel, R. F., Machta, L., Cotton, G. F., Flower, E. C., and Peterson, J. T.: Normal Incidence Radiation Trends and Mauna Loa, Hawaii, Nature, 240, 545–547, 1972.
Pueschel, R. F., Russell, R. B., Allen, D. A., Ferry, G. V., Snetsinger, K. G., Livingston, J. M., and Verma, S.: Physical and optical properties of the Pinatubo volcanic aerosol: Aircraft observations with impactors and a Sun-tracking photometer, J. Geophys. Res.-Atmos., 99, 12915–12922, https://doi.org/10.1029/94JD00621, 1994.
Pumphrey, H. C., Read, W. G., Livesey, N. J., and Yang, K.: Observations of volcanic SO2 from MLS on Aura, Atmos. Meas. Tech., 8, 195–209, https://doi.org/10.5194/amt-8-195-2015, 2015.
Rault, D. F. and Loughman, R. P.: The OMPS Limb Profiler Environmental Data Record Algorithm Theoretical Basis Document and Expected Performance, IEEE T. Geosci. Remote, 51, 2505–2527, https://doi.org/10.1109/TGRS.2012.2213093, 2013.
Ray, E. A., Moore, F. L., Rosenlof, K. H., Davis, S. M., Sweeney, C., Tans, P., Wang, T., Elkins, J. W., Bönisch, H., Engel, A., and Sugawara, S.: Improving stratospheric transport trend analysis based on SF6 and CO2 measurements, J. Geophys. Res.-Atmos., 119, 14–110, 2014.
Rayner, N. A., Parker, D. E., Horton, E. B., Folland, C. K., Alexander, L. V., Rowell, D. P., Kent, E. C., and Kaplan, A.: Global analyses of sea surface temperature, sea ice, and night marine air temperature since the late nineteenth century, J. Geophys. Res., 108, 4407, https://doi.org/10.1029/2002JD002670, 2003.
Reeves, J. M., Wilson, J., Brock, C., A., and Bui, T. P.: Comparison of aerosol extinction coefficients, surface area density, and volume density from SAGE II and in situ aircraft measurements, J. Geophys. Res, 113, DI1202, https://doi.org/10.1029/2007JD009357, 2008.
Ridley, D. A., Solomon, S., Barnes, J. E., Burlakov, V. D., Deshler, T., Dolgii, S. I., Herber, A. B., Nagai, T., Neely III, R. R., Nevzorov, A. V., Ritter, C., Sakai, T., Santer, B. D., Sato, M., Schmidt, A., Uchino, O., and Vernier, J. P.: Total volcanic stratospheric aerosol optical depths and implications for global climate change, J. Geophys. Res., 41, 7763–7769, https://doi.org/10.1002/2014GL061541, 2014.
Rieger, L. A., Bourassa, A. E., and Degenstein, D. A.: Merging the OSIRIS and SAGE II stratospheric aerosol records, J. Geophys. Res.-Atmos., 120, 8890–8904, https://doi.org/10.1002/2015JD023133, 2015.
Robock, A.: Volcanic eruptions and climate, Rev. Geophys., 38, 191–219, https://doi.org/10.1029/1998RG000054, 2000.
Robock, A., MacMartin, D. G., Duren, R., and Christensen, M. W.: Studying geoengineering with natural and anthropogenic analogs, Climatic Change, 121, 445–458, https://doi.org/10.1007/s10584-013-0777-5, 2013.
Rollins, A. W., Thornberry, T. D., Watts, L. A., Yu, P., Rosenlof, K. H., Mills, M., Baumann, E., Giorgetta, F. R., Bui, T. V., Höpfner, M., Walker, K. A., Boone, C., Bernath, P. F., Colarco, P. R., Newman, P. A., Fahey, D. W., and Gao, R. S.: The role of sulfur dioxide in stratospheric aerosol formation evaluated by using in situ measurements in the tropical lower stratosphere, Geophys. Res. Lett., 44, 4280–4286, https://doi.org/10.1002/2017GL072754, 2017.
Rosen, J. M.: The Vertical Distribution of Dust to 30 Kilometers, J. Geophys. Res., 69, 4673–4767, 1964.
Rosen, J. M.: Correlation of dust and ozone in the stratosphere, Nature, 209, 1342, 1966.
Rosen, J. M.: Simultaneous Dust and Ozone Soundings over North and Central America, J. Geophys. Res., 73, 479–486, 1968.
Rougier, J., Sexton, D. M. H., Murphy, J. M., and Stainforth, D. A.: Analyzing the climate sensitivity of the HadSM3 climate model using ensembles from different but related experiments, J. Climate, 22, 3540–3557, 2009.
Russell, P. B. and McCormick, M. P.: SAGE II aerosol data validation and initial data use: An introduction and overview, J. Geophys. Res., 94, 8335–8338, 1989.
Santer, B. D., Bonfils, C., Painter, J. F., Zelinka, M. D., Mears, C., Solomon, S., Schmidt, G. A., Fyfe, J. C., Cole, J. N. S., Nazarenko, L., Taylor, K. E., and Wentz, F. J.: Volcanic contribution to decadal changes in tropospheric temperature, Nat. Geosci., 7, 185–189, https://doi.org/10.1038/ngeo2098, 2014.
Santer, B. D., Solomon, S.; Bonfils, C., Zelinka, M. D., Painter, J. F., Beltran, F., Fyfe, C., Johannesson, G., Mears, C., Ridley, D. A., Vernier, J.-P., and Wentz, F. J.: Observed multivariable signals of late 20th and early 21st century volcanic activity, Geophys. Res. Lett., 42, 500–509, https://doi.org/10.1002/2014GL062366, 2015.
Schulz, M., Textor, C., Kinne, S., Balkanski, Y., Bauer, S., Berntsen, T., Berglen, T., Boucher, O., Dentener, F., Guibert, S., Isaksen, I. S. A., Iversen, T., Koch, D., Kirkevåg, A., Liu, X., Montanaro, V., Myhre, G., Penner, J. E., Pitari, G., Reddy, S., Seland, Ø., Stier, P., and Takemura, T.: Radiative forcing by aerosols as derived from the AeroCom present-day and pre-industrial simulations, Atmos. Chem. Phys., 6, 5225–5246, https://doi.org/10.5194/acp-6-5225-2006, 2006.
Self, S. and King, A. J.: Petrology and sulfur and chlorine emissions of the 1963 eruption of Gunung Agung, Bali, Indonesia, Bull. Volcanol., 58, 263–285, 1996.
Sheng, J.-X., Weisenstein, D. K., Luo, B.-P., Rozanov, E., Stenke, A., Anet, J., Bingemer, H., and Peter, T.: Global atmospheric sulfur budget under volcanically quiescent conditions: aerosol–chemistry–climate model predictions and validation, J. Geophys. Res.-Atmos., 120, 256–276, https://doi.org/10.1002/2014JD021985, 2015a.
Sheng, J.-X., Weisenstein, D. K., Luo, B.-P., Rozanov, E., Arfeuille, F., and Peter, T.: A perturbed parameter model ensemble to investigate 1991 Mt Pinatubo's initial sulfur mass emission, Atmos. Chem. Phys., 15, 11501–11512, https://doi.org/10.5194/acp-15-11501-2015, 2015b.
Sigl, M., Winstrup, M., McConnell, J. R., Welten, K. C., Plunkett, G., Ludlow, F., Büntgen, U., Caffee, M., Chellman, N., Dahl-Jensen, D., Fischer, H., Kipfstuhl, S., Kostick, C., Maselli, O. J., Mekhaldi, F., Mulvaney, R., Muscheler, R., Pasteris, D. R., Pilcher, J. R., Salzer, M., Schüpbach, S., Steffensen, J. P., Vinther, B. M., and Woodruff, T. E.: Timing and climate forcing of volcanic eruptions for the past 2,500 years, Nature, 523, 543–549, https://doi.org/10.1038/nature14565, 2015.
Solomon, S., Daniel, J. S., Neely III, R. R., Vernier, J. P., Dutton, E. G., and Thomason, L. W.: The Persistently Variable “Background” Stratospheric Aerosol Layer and Global Climate Change, Science, 333, 866–870, 2011.
Solomon S., Ivy, D. J., Kinnison, D., Mills, M. J., Neely III, R. R., and Schmidt, A.: Emergence of healing in the Antarctic ozone layer, Science, 353, 269–274, https://doi.org/10.1126/science.aae0061, 2016.
SPARC: Assessment of Stratospheric Aerosol Properties (ASAP), in: SPARC Report No. 4, edited by: Thomason, L. and Peter, T., World Climate Research Programme WCRP-124, WMO/TD No. 1295, WMO, 2006.
Stevens, T. D., Haris, P. A. T., Rau, Y.-C., and Philbrick, C. R.: Latitudinal lidar mapping of stratospheric particle layers, Adv. Space Res., 14, 193–198, 1994.
Stoffel, M., Khodri, M., Corona, C., Guillet, S., Poulain, V., Bekki, S., Guiot, J., Luckman, B. H., Oppenheimer, C., Lebas, N., Beniston, M., and Masson-Delmotte, V.: Estimates of volcanic- induced cooling in the Northern Hemisphere over the past 1,500 years, Nat. Geosci., 8, 784–788, https://doi.org/10.1038/ngeo2526, 2015.
Stothers, R. B.: Major optical depth perturbations to the stratosphere from volcanic eruptions: Pyrheliometric period, 1881–1960, J. Geophys. Res., 101, 3901–3920, https://doi.org/10.1029/95JD03237, 1996.
Stothers, R. B.: Stratospheric aerosol clouds due to very large volcanic eruptions of the early twentieth century: Effective particle sizes and conversion from pyrheliometric to visual optical depth, J. Geophys. Res., 102, 6143–6151, https://doi.org/10.1029/96JD03985, 1997.
Stothers, R. B.: Major optical depth perturbations to the stratosphere from volcanic eruptions: Stellar extinction period, 1961–1978, J. Geophys. Res., 106, 2993–3003, https://doi.org/10.1029/2000JD900652, 2001.
Stothers, R. B.: Cloudy and clear stratospheres before A.D. 1000 inferred from written sources, J. Geophys. Res., 107, 4718, https://doi.org/10.1029/2002JD002105, 2002.
Stothers, R. B. and Rampino, M. R.: Volcanic eruptions in the Mediterranean before A.D. 630 from written and archaeological sources, J. Geophys. Res., 88, 6357, https://doi.org/10.1029/JB088iB08p06357, 1983.
Swingedouw, D., Mignot, J., Ortega, P., Khodri, M., Menegoz, M., Cassou, C., and Hanquiez, V.: Impact of explosive volcanic eruptions on the main climate variability modes, Global Planet. Change, 150, 24–45, https://doi.org/10.1016/j.gloplacha.2017.01.006, 2017.
Taha, G., Rault, D. F., Loughman, R. P., Bourassa, A. E., and von Savigny, C.: SCIAMACHY stratospheric aerosol extinction profile retrieval using the OMPS/LP algorithm, Atmos. Meas. Tech., 4, 547–556, https://doi.org/10.5194/amt-4-547-2011, 2011.
Telford, P. J., Braesicke, P., Morgenstern, O., and Pyle, J. A.: Technical Note: Description and assessment of a nudged version of the new dynamics Unified Model, Atmos. Chem. Phys., 8, 1701–1712, https://doi.org/10.5194/acp-8-1701-2008, 2008.
Thomason, L. W. and Vernier, J.-P.: Improved SAGE II cloud/aerosol categorization and observations of the Asian tropopause aerosol layer: 1989–2005, Atmos. Chem. Phys., 13, 4605–4616, https://doi.org/10.5194/acp-13-4605-2013, 2013.
Thomason, L. W., Burton, S. P., Luo, B.-P., and Peter, T.: SAGE II measurements of stratospheric aerosol properties at non-volcanic levels, Atmos. Chem. Phys., 8, 983–995, https://doi.org/10.5194/acp-8-983-2008, 2008.
Tilmes, S., Mills, M. J., Niemeier, U., Schmidt, H., Robock, A., Kravitz, B., Lamarque, J.-F., Pitari, G., and English, J. M.: A new Geoengineering Model Intercomparison Project (GeoMIP) experiment designed for climate and chemistry models, Geosci. Model Dev., 8, 43–49, https://doi.org/10.5194/gmd-8-43-2015, 2015.
Timmreck, C.: Modeling the climatic effects of large explosive volcanic eruptions, Wiley Interdisciplin. Rev.: Clim. Change, 3, 545–564, https://doi.org/10.1002/wcc.192, 2012.
Timmreck, C., Graf, H.-F., and Feichter, J.: Simulation of Mt. Pinatubo volcanic aerosol with the Hamburg Climate Model ECHAM4, Theor. Appl. Climatol., 62, 85–108, https://doi.org/10.1007/s007040050076, 1999a.
Timmreck, C., Graf, H.-F., and Kirchner, I.: A one and a half year interactive simulation of Mt. Pinatubo aerosol, J. Geophys. Res., 104, 9337–9360, 1999b.
Timmreck, C., Graf, H.-F., and Steil, B.: Aerosol chemistry interactions after the Mt. Pinatubo eruption, in: Volcanism and the Earth's Atmosphere, edited by: Robock, A. and Oppenheimer, C., AGU Monogr., 139, 214–225, 2003.
Timmreck, C., Graf, H. F., Lorenz, S. J., Niemeier, U., Zanchettin, D., Matei, D., Jungclaus, J. H., and Crowley, T. J.: Aerosol size confines climate response to volcanic super-eruptions, Geophys. Res. Lett., 37, L24705, https://doi.org/10.1029/2010GL045464, 2010.
Toohey, M., Krüger, K., Niemeier, U., and Timmreck, C.: The influence of eruption season on the global aerosol evolution and radiative impact of tropical volcanic eruptions, Atmos. Chem. Phys., 11, 12351–12367, https://doi.org/10.5194/acp-11-12351-2011, 2011.
Toohey, M., Krüger, K., and Timmreck, C.: Volcanic sulfate deposition to Greenland and Antarctica: A modeling sensitivity study, J. Geophys. Res.-Atmos., 118, 4788–4800, https://doi.org/10.1002/jgrd.50428, 2013.
Toohey, M., Krüger, K., Bittner, M., Timmreck, C., and Schmidt, H.: The impact of volcanic aerosol on the Northern Hemisphere stratospheric polar vortex: mechanisms and sensitivity to forcing structure, Atmos. Chem. Phys., 14, 13063–13079, https://doi.org/10.5194/acp-14-13063-2014, 2014.
Toohey, M., Krüger, K., Sigl, M., Stordal, F., and Svensen, H.: Climatic and societal impacts of a volcanic double event at the dawn of the Middle Ages, Climatic Change, 136, 401–412, https://doi.org/10.1007/s10584-016-1648-7, 2016a.
Toohey, M., Stevens, B., Schmidt, H., and Timmreck, C.: Easy Volcanic Aerosol (EVA v1.0): an idealized forcing generator for climate simulations, Geosci. Model Dev., 9, 4049–4070, https://doi.org/10.5194/gmd-9-4049-2016, 2016b.
Trepte C. R. and Hitchman, M. H.: Tropical stratospheric circulation deduced from satellite aerosol data, Nature, 355, 626–628, 1992.
Vanhellemont, F., Fussen, D., Mateshvili, N., Tétard, C., Bingen, C., Dekemper, E., Loodts, N., Kyrölä, E., Sofieva, V., Tamminen, J., Hauchecorne, A., Bertaux, J.-L., Dalaudier, F., Blanot, L., Fanton d'Andon, O., Barrot, G., Guirlet, M., Fehr, T., and Saavedra, L.: Optical extinction by upper tropospheric/stratospheric aerosols and clouds: GOMOS observations for the period 2002–2008, Atmos. Chem. Phys., 10, 7997–8009, https://doi.org/10.5194/acp-10-7997-2010, 2010.
Vehkamäki, H., Kulmala, M., Napari, I., Lehtinen, K. E. J., Timmreck, C., Noppel, M., and Laaksonen, A.: An improved parameterization for sulfuric acid-water nucleation rates for tropospheric and stratospheric conditions, J. Geophys. Res., 107, AAC3.1–AAC3.10, https://doi.org/10.1029/2002JD002184, 2002.
Vernier, J. P., Pommereau, J. P., Garnier, A., Pelon, J., Larsen, N., Nielsen, J., Christensen, T., Cairo, F., Thomason, L. W., Leblanc, T., and McDermid, I. S.: Tropical stratospheric aerosol layer from CALIPSO lidar observations, J. Geophys. Res., 114, D00H10, https://doi.org/10.1029/2009JD011946, 2009.
Vernier, J.-P., Thomason, L. W., and Kar, J.: CALIPSO detection of an Asian tropopause aerosol layer, Geophys. Res. Lett., 38, L07804, https://doi.org/10.1029/2010GL046614, 2011a.
Vernier, J.-P., Thomason, L. W., Pommereau, J.-P., Bourassa, A., Pelon, J., Garnier, A., Hauchecorne, A., Blanot, L., Trepte, C., Degenstein, D., and Vargas, F.: Major influence of tropical volcanic eruptions on the stratospheric aerosol layer during the last decade, Geophys. Res. Lett., 38, L12807, https://doi.org/10.1029/2011GL047563, 2011b.
Visioni, D., Pitari, G., and Aquila, V.: Sulfate geoengineering: a review of the factors controlling the needed injection of sulfur dioxide, Atmos. Chem. Phys., 17, 3879–3889, https://doi.org/10.5194/acp-17-3879-2017, 2017.
Visioni, D., Pitari, G., Tuccella, P., and Curci, G.: Sulfur deposition changes under sulfate geoengineering conditions: quasi-biennial oscillation effects on the transport and lifetime of stratospheric aerosols, Atmos. Chem. Phys., 18, 2787–2808, https://doi.org/10.5194/acp-18-2787-2018, 2018.
Volz, F. E.: Twilight phenomena caused by the eruption of Agung volcano, Science, 144, 1121–1122, 1964.
Volz, F. E.: Note on the global variation of stratospheric turbidity since the eruption of Agung volcano, Tellus, 17, 513–515, 1965.
Volz, F. E.: Atmospheric Turbidity after the Agung Eruption of 1963 and Size Distribution of the Volcanic Aerosol, J. Geophys. Res., 75, 5185–5193, 1970.
von Savigny, C., Ernst, F., Rozanov, A., Hommel, R., Eichmann, K.-U., Rozanov, V., Burrows, J. P., and Thomason, L. W.: Improved stratospheric aerosol extinction profiles from SCIAMACHY: validation and sample results, Atmos. Meas. Tech., 8, 5223–5235, https://doi.org/10.5194/amt-8-5223-2015, 2015.
Weisenstein, D. K., Penner, J. E., Herzog, M., and Liu, X.: Global 2-D intercomparison of sectional and modal aerosol modules, Atmos. Chem. Phys., 7, 2339–2355, https://doi.org/10.5194/acp-7-2339-2007, 2007.
Wilson, J. C., Jonsson, H. H., Brock, C. A., Toohey, D. W., Avallone, L. M., Baumgardner, D., Dye, J. E., Poole, L. R., Woods, D. C., DeCoursey, R. J., Osborn, M., Pitts, M. C., Kelly, K. K., Chan, K. R., Ferry, G. V., Loewenstein, M., Podolske, J. R., and Weaver, A.: In situ observations of aerosol and chlorine monoxide after the 1991 eruption of Mount Pinatubo: effect of reactions on sulfate aerosol, Science, 261, 1140–1143, 1993.
Wilson, J. C., Lee, S.-H., Reeves, J. M., Brock, C. A., Jonsson, H. H., Lafleur, B. G., Loewenstein, M., Podolske, J., Atlas, E., Boering, K., Toon, G., Fahey, D., Bui, T. P., Diskin, G., and Moore, F.: Steady-state aerosol distributions in the extra-tropical, lower stratosphere and the processes that maintain them, Atmos. Chem. Phys., 8, 6617–6626, https://doi.org/10.5194/acp-8-6617-2008, 2008.
WMO – World Meteorological Organization/UNEP – United Nations Environment Programme: Scientific Assessment of Ozone Depletion: 2006, World Meteorological Organization, Global Ozone Research and Monitoring Project, Report No. 50, Geneva, Switzerland, 2007.
Young, R. E., Houben, H., and Toon, O. B.: Radiatively forced dispersion of the Mt. Pinatubo volcanic cloud and induced temperature perturbations in the stratosphere during the first few months following the eruption, Geophys. Res. Lett., 21, 369–372, 1994.
Young, S. A., Manson, P. J., and Patterson, G. R.: Southern Hemisphere Lidar measurements of the Aerosol Clouds from Mt Pinatubo and Mt Hudson, Extended Abstracts of the 16th International Laser Radar Conference, July 1992, MIT, Cambridge, Massachusetts, 1994.
Yorks, J. E., Palm, S. P., McGill, M. J., Hlavka, D. L., Hart, W. D., Selmer, P. A., and Nowottnick, E. P.: CATS Algorithm Theoretical Basis Document, 1st Edn., NASA, Goddard Space Flight Center, Greenbelt, MD, 2015.
Yu, P., Toon, O. B., Neely, R. R., Martinsson, B. G., and Brenninkmeijer, C. A. M.: Composition and physical properties of the Asian Tropopause Aerosol Layer and the North American Tropospheric Aerosol Layer, Geophys. Res. Lett., 42, 2540–2546, https://doi.org/10.1002/2015GL063181, 2015.
Zanchettin, D., Timmreck, C., Graf, H.-F., Rubino, A., Lorenz, S., Lohmann, K., Krueger, K., and Jungclaus, J. H.: Bi-decadal variability excited in the coupled ocean–atmosphere system by strong tropical volcanic eruptions, Clim. Dynam., 39, 419–444, https://doi.org/10.1007/s00382-011-1167-1, 2012.
Zanchettin, D., Khodri, M., Timmreck, C., Toohey, M., Schmidt, A., Gerber, E. P., Hegerl, G., Robock, A., Pausata, F. S. R., Ball, W. T., Bauer, S. E., Bekki, S., Dhomse, S. S., LeGrande, A. N., Mann, G. W., Marshall, L., Mills, M., Marchand, M., Niemeier, U., Poulain, V., Rozanov, E., Rubino, A., Stenke, A., Tsigaridis, K., and Tummon, F.: The Model Intercomparison Project on the climatic response to Volcanic forcing (VolMIP): experimental design and forcing input data for CMIP6, Geosci. Model Dev., 9, 2701–2719, https://doi.org/10.5194/gmd-9-2701-2016, 2016.
To ensure comparability to the AeroCom simulations (http://aerocom.met.no/Welcome.html, last access: 26 June 2018).
Models with an internally generated QBO might nudge the tropical stratospheric winds.