
the Creative Commons Attribution 4.0 License.
the Creative Commons Attribution 4.0 License.
 | 01 Oct 2026
Relativistic runaway electron avalanches: unified density-dependent scaling and transport
Liza Hovhannisyan

Relativistic runaway electron avalanches (RREAs) are commonly characterized by an empirical relation linking the avalanche length to the electric-field excess above the runaway threshold. In this study, CORSIKA simulations are used to examine the behavior of this parameterization under different atmospheric densities and electric-field conditions and to investigate the subsequent propagation of particles beyond the accelerating field region. Simulations are performed for four high-altitude observational sites.
The effective avalanche lengths derived from the vertical electron profiles exhibit inter-station scatter when fitted with a single coefficient across the combined dataset. Incorporating an additional density-dependent term reduces this scatter and improves the fit, increasing the coefficient of determination from R2≈0.90 to R2≈0.99. Simulations of particle propagation beyond the electric-field region show different attenuation behavior for the electron and gamma-ray components. Reassessment of the empirical free path distance (FPD) formulation for a 100 m field-to-detector separation yields an electron–gamma energy coefficient of C1≈1.37, while the density dependence of electron energy losses is accounted for using stopping-power data from the National Institute of Standards and Technology (NIST) ESTAR (Stopping Powers and Range Tables for Electrons) database.
- Article
(2969 KB) - Full-text XML
- BibTeX
- EndNote


High-energy particle phenomena in the atmosphere constitute a rapidly developing field at the intersection of cosmic-ray physics, atmospheric electricity, and meteorology. Over the past decades, a wide variety of high-energy atmospheric phenomena have been observed, including thunderstorm ground enhancements (TGEs), gamma-ray glows, terrestrial gamma-ray flashes (TGFs), and the recently identified flickering gamma-ray flashes (FGFs) (Chilingarian et al., 2011; Fishman et al., 1994; Dwyer et al., 2012; Østgaard et al., 2024; Marisaldi et al., 2024). Despite the diversity of detection platforms and energy ranges, mounting experimental evidence suggests that these phenomena are closely related and arise from electron acceleration in atmospheric electric fields (Dwyer and Uman, 2014). Although the microphysics of gamma-ray production, electron acceleration, and electromagnetic interactions in air are well established (Bethe and Heitler, 1934; Koch and Motz, 1959), the atmospheric environment in which these processes occur is highly dynamic and difficult to characterize, particularly because reliable measurements of the spatial and temporal structure of electric fields within thunderclouds remain limited. RREA development has been investigated using analytical, numerical, and Monte Carlo approaches (Babich et al., 2001; Dwyer, 2003; Coleman and Dwyer, 2006; Dwyer et al., 2012; Skeltved et al., 2014), while empirical and semi-empirical formulations remain useful for describing the main characteristics of energetic particle populations under atmospheric electric fields.
A key step in the theoretical description of particle acceleration under thunderstorm conditions was the development of the relativistic runaway electron avalanche (RREA) theory (Gurevich et al., 1992; Dwyer, 2003). In sufficiently strong atmospheric electric fields (AEFs), energetic electrons can overcome ionization losses and enter a runaway regime, where they continue to gain energy from the electric field and produce secondary electrons through collisions with air molecules. This process leads to an avalanche multiplication of electrons and the accompanying production of high-energy bremsstrahlung gamma rays. In addition to this conventional avalanche development, more complex RREA models include the relativistic feedback mechanism. In this mechanism, backward-propagating positrons and high-energy photons generated within an avalanche can produce new seed electrons and initiate successive avalanches. Under sufficiently strong and extended electric-field conditions, this feedback can become self-sustaining and limit the maximum electric field that can persist in air (Dwyer, 2003, 2007). A central parameter characterizing this avalanche development is the e-folding length λ (E, ρ), which describes the characteristic distance over which the number of runaway electrons grows exponentially. For the conventional RREA development considered in this study, a widely used empirical description of this process was introduced by Dwyer (2003), who proposed the relation
where Ez and (the runaway threshold electric field) are expressed in kV m−1, λ is in meters, and K in kV. Here, ρ0=1.225 kg m−3 is the air density at sea level, and ρ is the air density at altitude z. Dwyer (2003) reported kV, while subsequent Monte Carlo calculations by Coleman and Dwyer (2006) obtained a closely related parameterization for electric fields above 300 kV m−1 and showed that a different empirical fit provides a better description close to the runaway threshold. Coleman and Dwyer (2006) also explicitly accounted for atmospheric density by scaling the electric field and avalanche length to their equivalent sea-level values. These results indicate that the applicability of a given avalanche-length parameterization should be considered in relation to the electric-field range and atmospheric conditions for which it is evaluated.
The concept of free path distance (FPD) has been introduced as a phenomenological quantity that characterizes the ability of energetic particles to propagate beyond the electric-field region and reach ground-based detectors (Chilingarian et al., 2021, 2022). Although this approach provides a useful link between simulations and observations, its empirical coefficients are constrained by limited datasets and simplified assumptions. In this work, two empirical relations that describe complementary stages of RREA evolution are revisited and optimized: avalanche development within the electric field and particle propagation beyond it. Both are evaluated and optimized using CORSIKA simulations for multiple high-altitude stations with different atmospheric densities. In particular, a proportionality between electron and gamma-ray energies at the field boundary is identified, and density-dependent energy losses during propagation are explicitly accounted for.
To investigate the development of relativistic runaway electron avalanches (RREAs) and the subsequent propagation of energetic particles, Monte Carlo simulations were performed using CORSIKA (COsmic Ray SImulations for KAscade) code (Heck et al., 1998), version 7.7500, which includes the effect of atmospheric electric fields on particle transport (Buitink et al., 2009).
As in Chilingarian et al. (2026), the atmospheric electric field was modeled as a vertically oriented uniform layer with a total thickness of 2000 m above the detector level. As shown in Sect. 3, a layer thickness of 2000 m is greater than the effective avalanche lengths obtained under all simulated electric-field conditions, allowing the avalanche multiplication process to develop before particles leave the acceleration region. To resolve the vertical development of electron and gamma-ray populations, the field region was subdivided into 20 layers of 100 m each, and particle numbers were recorded at each boundary. In addition to the observation levels within the electric-field region, an additional level was defined at the lower boundary of the electric field (exit), as well as a detector level (det) located 100 m below this boundary, corresponding to the station altitude above sea level. These levels are used for the post-field transport and FPD analyses.
Simulations were performed for four high-altitude observational stations with distinct atmospheric densities, all of which have reported thunderstorm-related particle enhancements: Aragats (ρ=0.77 kg m−3, roughly 3000 m a.s.l. – above sea level) (Chilingarian et al., 2022, 2024); Nor Amberd (ρ=0.89 kg m−3, about 2000 m a.s.l.) (Chilingarian et al., 2025); Lomnický Štít (ρ=0.83 kg m−3, approximately 2600 m a.s.l.) (Chum et al., 2020; Kisvárdai et al., 2025); and LHAASO (ρ=0.66 kg m−3, around 4400 m a.s.l.) (Aharonian et al., 2023). Across the four configurations, the electric-field regions span altitudes of approximately 4000–6400 m.
The electric-field ranges used in the simulations were selected separately for each observation site to obtain sustained supercritical RREA multiplication within the 2000 m field region under the corresponding atmospheric conditions. This selection was guided by the previous CORSIKA study (Chilingarian et al., 2026), in which the dependence of the RREA initiation threshold on altitude and atmospheric density was investigated. The local runaway threshold is defined as , where is the normalized atmospheric density and E0=284 kV m−1 is the adopted sea-level threshold, consistent with previous studies. For the empirical scaling analysis, a single representative atmospheric density is assigned to each station, corresponding to the midpoint altitude of the 2000 m electric-field layer. This reference density is used to calculate the station-specific values of n and the corresponding runaway threshold Eth for each station. Because Eth decreases with decreasing air density, the same absolute electric field does not correspond to the same degree of supercriticality at different altitudes. Therefore, the absolute applied-field values were not kept identical across the four sites but were varied taking into account the local atmospheric density and the corresponding runaway threshold. Accordingly, field ranges of 180–210 kV m−1 for LHAASO, 200–230 kV m−1 for Aragats, 210–240 kV m−1 for Lomnický Štít, and 230–260 kV m−1 for Nor Amberd were used, with the electric field varied in steps of 10 kV m−1 within each range. To express the selected fields under different atmospheric-density conditions on a common physical basis, the applied field is normalized to the local runaway threshold, . This dimensionless ratio characterizes the degree of field supercriticality under the local atmospheric conditions and provides a common basis for comparing the field regimes selected for the different observation sites.
Each simulation corresponds to the injection of a single seed electron into the electric-field region. The initial energy spectrum was adopted from the EXPACS model (Sato, 2015) and follows a power-law distribution with an index of 1.173 in the energy range 1–300 MeV. To ensure statistical stability, 500–1000 simulation events were performed for each field configuration. During particle propagation, electrons and gamma rays were tracked until their energies decreased to 0.05 MeV. At each observation level within the electric-field region, the numbers of electrons and gamma rays were recorded. The electron population Ne(d) is used to determine the effective avalanche length, while particle spectra at the field boundary and detector level are used for the FPD analysis.
The vertical profiles of the electron population from CORSIKA simulations provide a basis for determining the effective avalanche length of relativistic runaway electron avalanches. Particle numbers were recorded at 100 m intervals within the L=2000 m electric-field layer. To minimize sensitivity to the field boundaries, the effective avalanche-length analysis was restricted to the common fitting interval d=200–2000 m. For each value of the applied electric field and each observational site, the simulations produce a depth-dependent electron population, Ne(d), where d denotes the downward propagation distance from the top of the electric-field layer. The absolute height H is then given by:
where Hst is the altitude of the observational station above sea level. When the electric field exceeds the runaway threshold field Eth(h), the number of runaway electrons increases approximately exponentially with propagation distance. In this regime, the development of the avalanche can be described by the relation
where N0 is the electron population extrapolated to d=0, and λ is the characteristic avalanche length. Taking the natural logarithm of the expression above yields a linear dependence of the form
where c=ln N0 and . Thus, the avalanche length can be obtained from the slope of the linear fit to the logarithmic electron profile.
For each simulated electric-field strength, the electron population Ne(d) was averaged over the ensemble of simulation events. The natural logarithm of the averaged electron counts was then fitted as a function of depth using linear regression. The effective avalanche length was then obtained as
The standard error of the fitted slope b was propagated through Eq. (5) to obtain the corresponding fit-derived uncertainty σλ in λeff.
Repeating this process for various electric-field strengths and across all observational sites produces a set of effective avalanche lengths, λeff, corresponding to different values of the electric-field excess, Ez−Eth(h). These values serve as the basis for optimizing the empirical coefficient K in the avalanche-length relation (Eq. 1). The extracted avalanche lengths are then compared with the dependence predicted by Eq. (1).
The CORSIKA simulations are used to examine how consistently a single coefficient K describes the effective avalanche lengths obtained for the four observational sites.
For each simulated electric-field value and for each observational site, the variable
was computed․ According to Eq. (1), the avalanche length depends linearly on this variable:
Thus, the coefficient K can be determined by fitting a straight line through the origin in the (x,λeff) parameter space.
The fitting procedure was performed using the least-squares method constrained to pass through the origin. In this case, the optimal value of the coefficient is given by
where , λi is the corresponding effective avalanche length, and the index i labels the four simulated supercritical electric-field values used for each observational station in the least-squares fitting.
The fit-derived uncertainties of the individual effective avalanche lengths were propagated to the station-specific coefficient K. Treating the xi values as fixed and the uncertainties of the fitted λi values as independent, the uncertainty in K was calculated as
Here, is the fit-derived uncertainty of the effective avalanche length λi for the ith electric-field configuration, xi is defined by Eq. (6), and σK is the resulting propagated uncertainty of the station-specific coefficient K.
Applying this procedure consistently to the CORSIKA simulation results for all four observational sites yields the following station-specific coefficients, including the propagated fit-derived uncertainties:
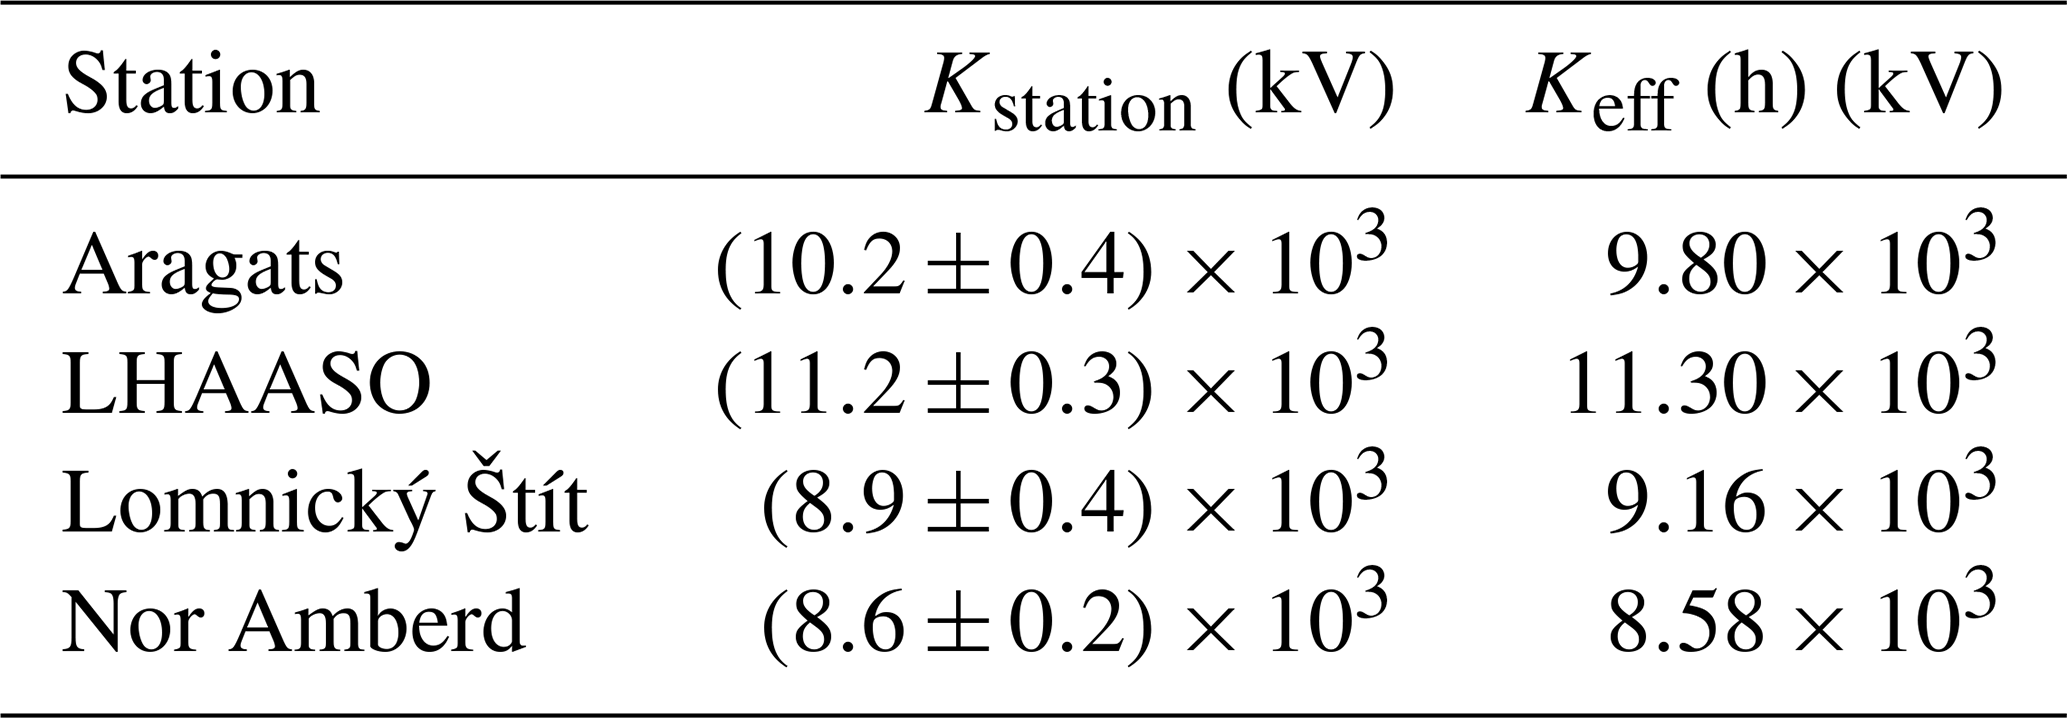
The station-specific coefficients obtained from the CORSIKA simulations are larger than the kV value reported by Dwyer (2003), ranging from approximately 8.6×10³ to 11.2×10³ kV across the four sites. Accounting for the propagated fit-derived uncertainties does not remove the station-to-station variation; the corresponding uncertainty intervals do not collapse onto a common range, although partial overlap occurs for some neighboring values. A simultaneous fit of Eq. (1) to all 16 simulation points yields a best-fit coefficient of kV. This global fit is used below as the reference for comparison with the density-dependent formulation. For comparison with previous RREA calculations, the present avalanche lengths can also be expressed in the conventional density-scaled form, using and n⋅λeff. Earlier numerical studies have reported broadly comparable avalanche-length scales in these similarity-scaled variables, although quantitative differences among individual models remain, particularly near the runaway threshold (Coleman and Dwyer, 2006; Dwyer et al., 2012; Skeltved et al., 2014). As an illustrative example, for the Aragats station at Ez=210 kV m−1, the present simulation corresponds to kV m−1 and m, which is within the range of previous Monte Carlo estimates at comparable density-scaled electric fields.
The observational sites considered in this work span a substantial range of atmospheric densities, from approximately 0.66 kg m−3 at LHAASO to 0.89 kg m−3 at Nor Amberd. Although the local runaway threshold Eth(h) accounts for density through the threshold scaling, the station-to-station variation of the fitted K values persists after the fit-derived uncertainties are taken into account. This motivates testing an additional explicit density dependence in the empirical parameterization. An additional density dependence is introduced through the generalized empirical relation
where is the normalized air density, ρ(h) is the local atmospheric density at altitude h, ρ0=1.225 kg m−3 is the air density at sea level, and a is an empirical exponent describing the additional density dependence.
Equation (10) was fitted jointly to the effective avalanche lengths from all four stations, with K and a as free parameters. The joint fit yields kV and , where the quoted uncertainties are derived from the joint fit․
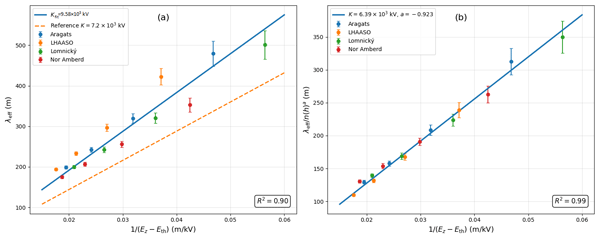
The fitted exponent indicates an additional approximately inverse dependence on atmospheric density beyond that already included through the density-scaled runaway threshold . Thus, the factor na represents an additional density-dependent correction within the present empirical parameterization. When is plotted as a function of the variable , the results from all four stations show reduced inter-station scatter around an approximately linear relation (Fig. 1). Figure 1 summarizes the simulation results obtained for the four observational sites considered in this work and compares the scaling relations given by Eqs. (1) and (10).
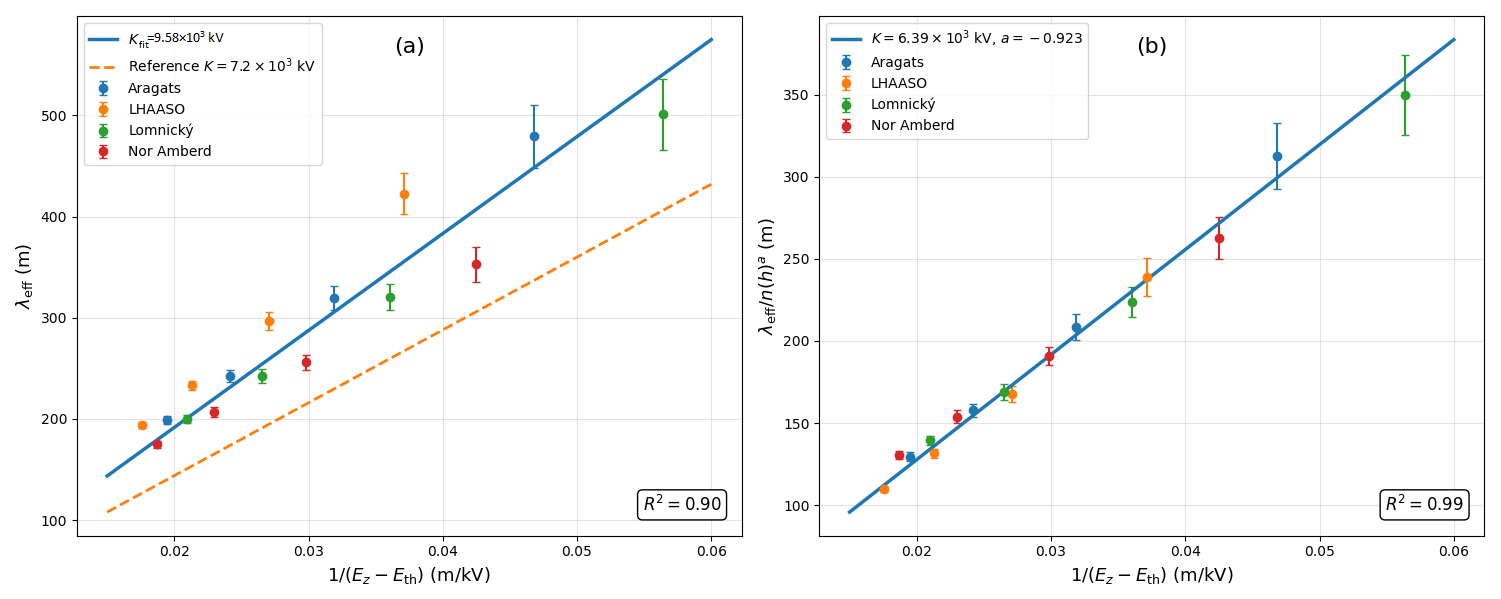
Figure 1Comparison of the standard and density-dependent parameterizations of the RREA avalanche length. (a) Standard parameterization for the combined four-station dataset, showing the global fit and the reference relation. (b) Density-dependent parameterization for the same dataset, showing reduced inter-station scatter after accounting for the additional density dependence.
Figure 1a shows the effective avalanche length λeff as a function of . The results exhibit an approximately linear trend with inter-station scatter. Figure 1b shows the same data after applying the density-dependent normalization n(h)a. With the fitted parameters kV and , the inter-station scatter is substantially reduced.
The station-specific coefficients Kstation and the effective coefficients Keff(h) are summarized in Table 1.
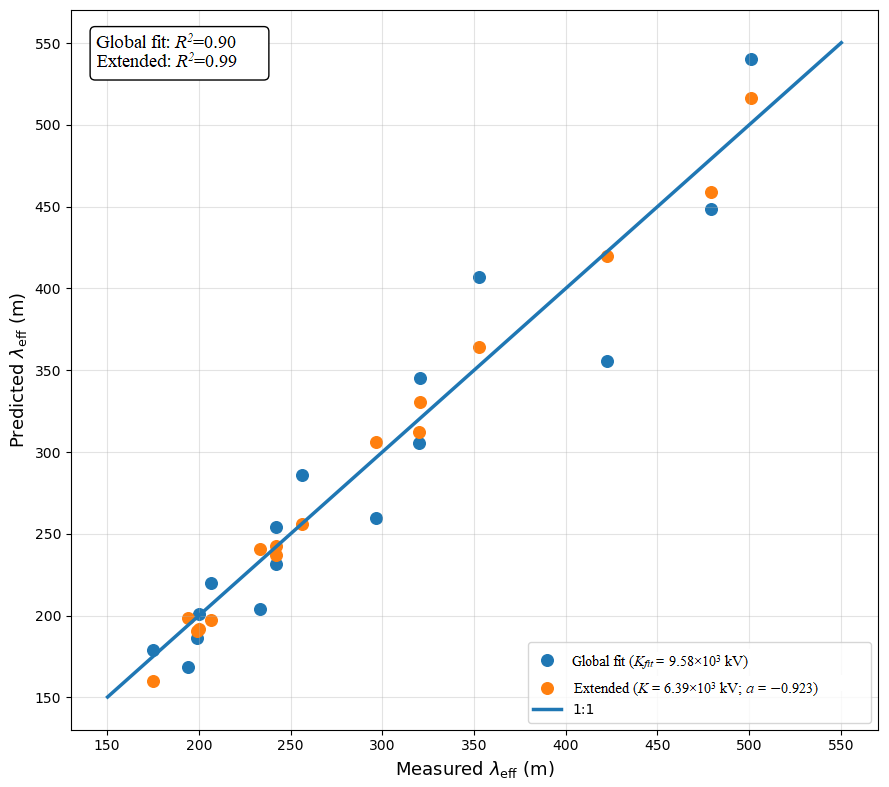
Figure 2Parity comparison between the effective avalanche lengths obtained from the CORSIKA simulations and those predicted by the global and extended fits.
Table 1Station-specific coefficients Kstation obtained from Eq. (1) and effective coefficients Keff(h)=Kn(h)a obtained from the joint density-dependent fit.
For the combined dataset, the coefficient of determination increases from R2≈0.90 for the fit of Eq. (1) to R2≈0.99 for the density-dependent formulation. Figure 2 compares the effective avalanche lengths obtained from the CORSIKA simulations with the corresponding model predictions. The density-dependent formulation shows better agreement with the simulations, particularly at larger avalanche lengths where the fit of Eq. (1) shows larger deviations from the 1:1 relation.
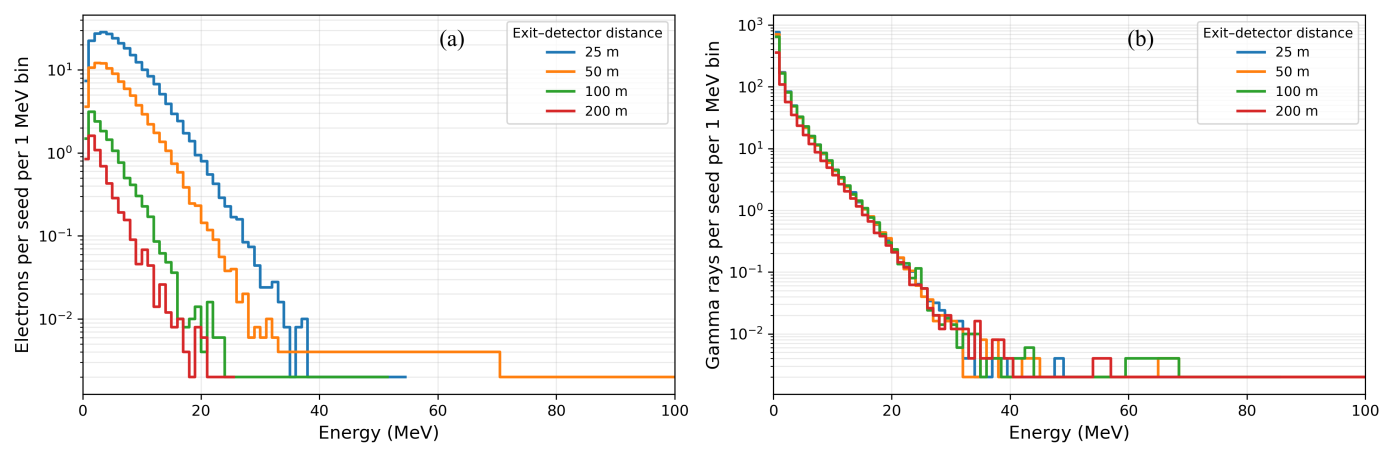
Figure 3Electron (a) and gamma-ray (b) energy spectra for detector levels located 25, 50, 100, and 200 m below the lower boundary of the electric field for the Aragats configuration. The spectra are normalized per injected seed electron.
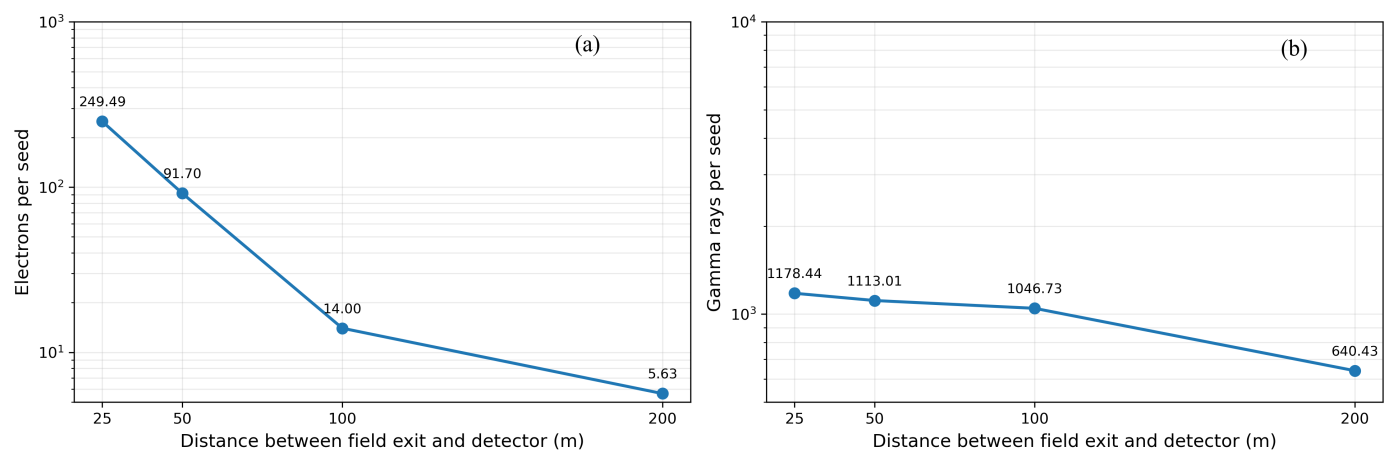
Figure 4Electron (a) and gamma-ray (b) counts at detector levels located 25, 50, 100, and 200 m below the lower boundary of the electric field for the Aragats configuration. Particle counts are normalized per injected seed electron.
To evaluate the dependence of particle energy spectra and total particle counts on the detector distance, additional simulations were performed for the Aragats configuration. All simulation parameters were kept unchanged, and only the detector position was varied. The detector was placed 25, 50, 100, and 200 m below the lower boundary of the electric field.
The resulting electron and gamma-ray energy spectra are presented in Fig. 3.
As the field-free propagation distance increases, the electron spectrum is progressively attenuated, with a pronounced suppression of the high-energy component. The gamma-ray component persists over larger distances, although its intensity also decreases with increasing propagation distance. This different transport behavior becomes particularly evident when the corresponding particle counts are considered (Fig. 4).
The electron population decreases rapidly and monotonically with increasing field-free propagation distance, whereas the gamma-ray population is attenuated more gradually. The extension of the simulations to 200 m confirms that the gamma-ray component also undergoes substantial attenuation at larger propagation distances. A separation of 100 m represents a configuration in which the electron component is already strongly attenuated while a substantial gamma-ray component is still preserved.
For the following analysis, Emax is defined as the highest energy for which at least three consecutive energy bins contain more than five counts. This criterion reduces sensitivity to isolated high-energy outliers. The electron and gamma-ray energies are denoted by and , respectively. The approximate gap length (free path distance) can then be estimated as:
where C2(h) is the mean energy loss of the electron at altitude h. However, (exit) is not directly available from detector measurements. Instead, the maximum gamma-ray energy (det) measured at the detector provides an observable quantity that can be related to the particle energies at the field boundary. Unlike electrons, which undergo continuous energy losses during propagation through air, gamma rays propagate through stochastic interactions whose probabilities depend on photon energy, including Compton scattering, photoelectric absorption, and electron–positron pair production. To quantitatively describe this propagation beyond the accelerating electric-field region, Chilingarian et al. (2021) introduced an empirical relation for estimating the free path distance (FPD). Since (exit) is not directly available from detector measurements, it is estimated using the empirical relation , where C1 relates the characteristic upper energies of the electron and gamma-ray components at the field boundary. Substitution of this relation into Eq. (11) gives
Here (exit) represents the characteristic gamma-ray energy at the exit of the electric-field region. For the 100 m separation used to calibrate the FPD relation, , as demonstrated by the simulated spectra below. (det) is the characteristic electron energy at the detector level, C1 is an empirical electron–gamma energy coefficient, and C2(h) is the altitude-dependent electron energy loss rate in air. The coefficient C1 is determined jointly for the four stations. For this analysis, the field-to-detector separation was fixed at 100 m for all four stations. The electric field strengths were selected for each station as follows: Aragats (210 kV m−1), LHAASO (190 kV m−1), Lomnický Štít (220 kV m−1), and Nor Amberd (240 kV m−1). Electron and gamma-ray spectra were obtained at both the exit and detector levels. A characteristic maximum energy Emax was defined as the highest energy for which at least three consecutive energy bins contain more than five counts. This criterion reduces sensitivity to high-energy outliers.
Gamma-ray spectra change little over the 100 m propagation distance, with characteristic energies of –30 MeV and –31 MeV, supporting the approximation . Accordingly, the detector value is used as a proxy for the corresponding field-exit quantity in Eq. (12). Conversely, electron spectra show a clear shift toward lower energies. At Aragats, the electron maximum energy dropped from approximately 38 MeV at exit to around 16 MeV at the detector after 100 m. This behavior is shown in Figs. 5 and 6.
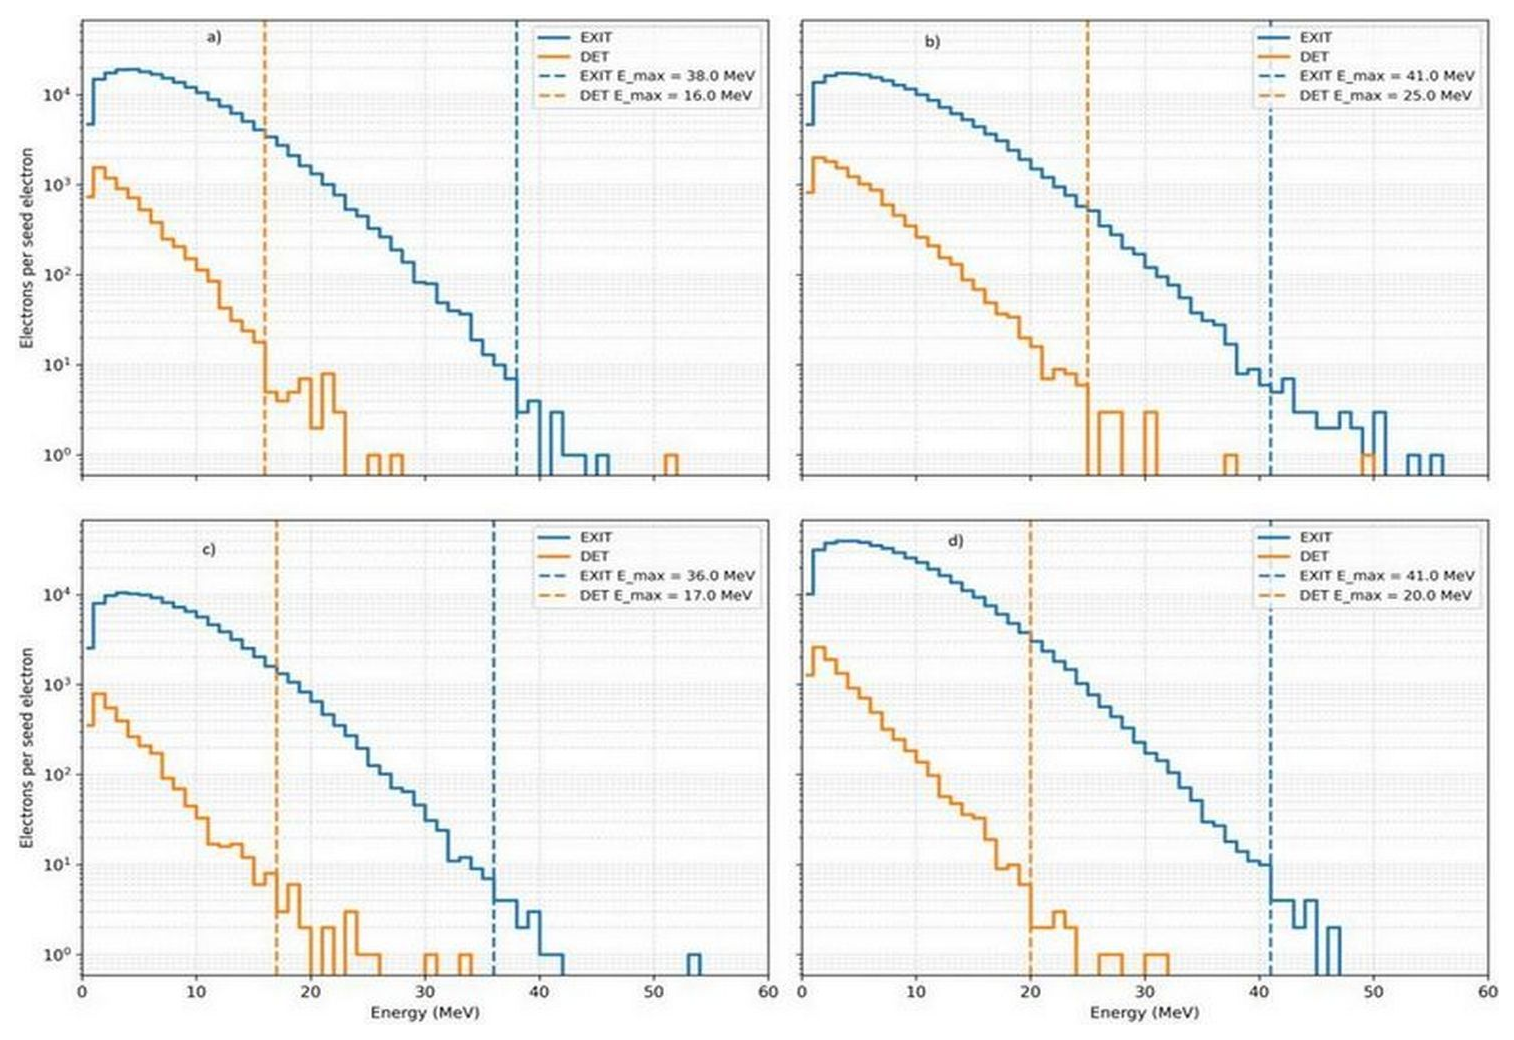
Figure 5The energy spectra of electrons at the exit and detector levels for all four stations: (a) Aragats (210 kV m−1), (b) LHAASO (190 kV m−1), (c) Lomnický Štít (220 kV m−1), and (d) Nor Amberd (240 kV m−1). The vertical separation between exit and detector is fixed at 100 m in all cases.
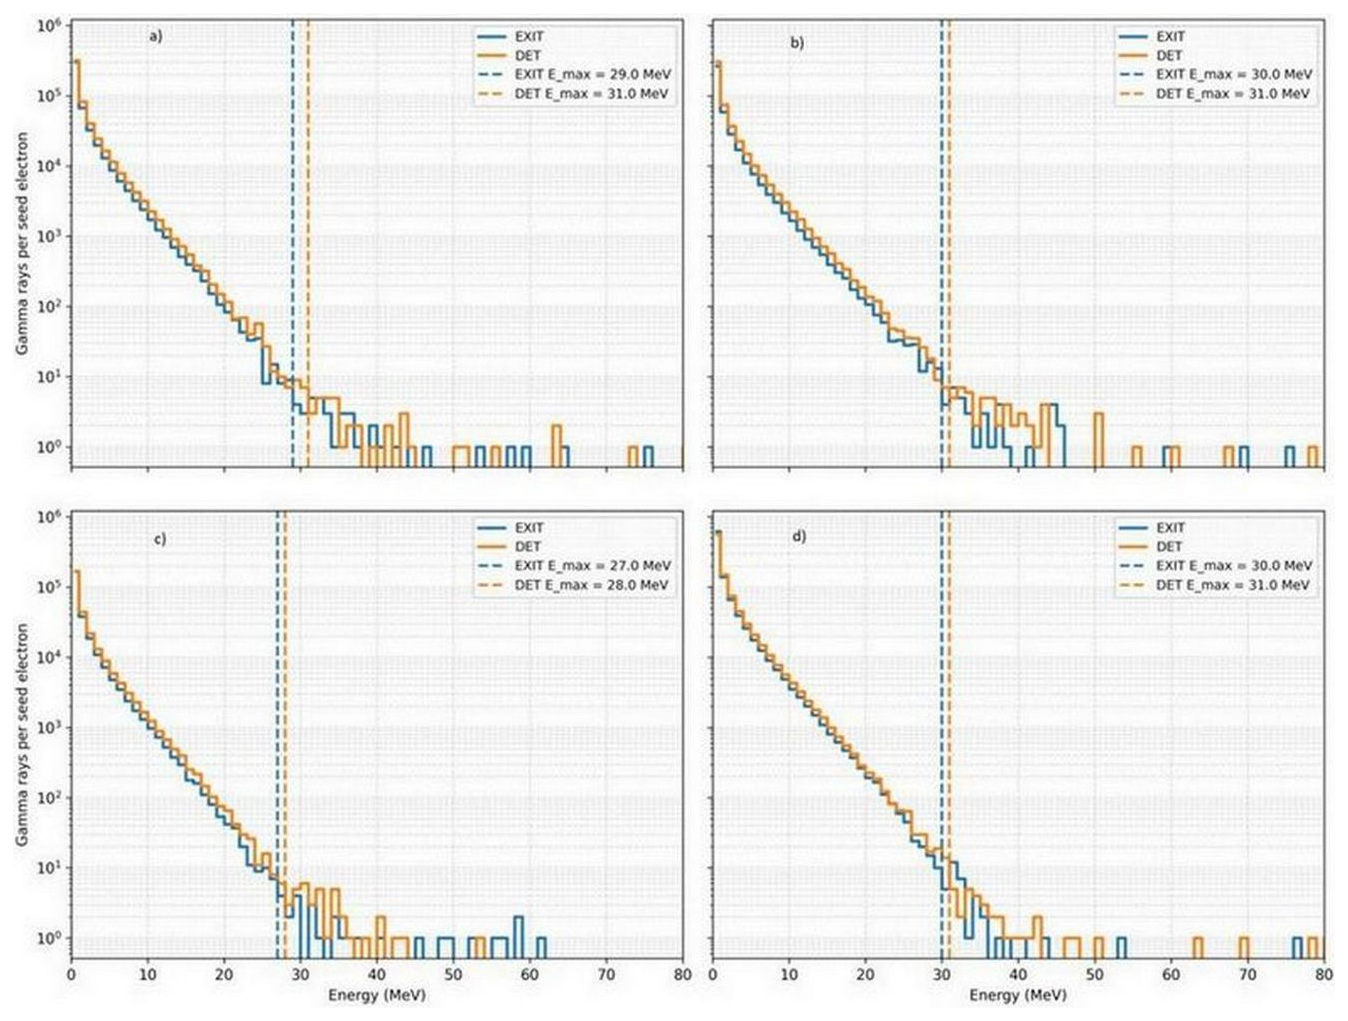
Figure 6Gamma-ray energy spectra at the exit and detector levels for all four stations: (a) Aragats (210 kV m−1), (b) LHAASO (190 kV m−1), (c) Lomnický Štít (220 kV m−1), and (d) Nor Amberd (240 kV m−1). The vertical separation between the exit and detector levels is fixed at 100 m in all cases. The characteristic high-energy endpoints show little change over the propagation distance, and the effective maximum energies are indicated by vertical dashed lines.
The relation between the characteristic electron and gamma-ray energies is parameterized by the coefficient C1 in Eq. (12). The proportionality coefficient C1 is derived directly from the exit and detector spectra using a bootstrap-based statistical procedure. For each station, the exit energy histograms of gamma rays and electrons were taken as the starting point. A Poisson bootstrap procedure was then applied, in which each energy bin count Ni was resampled according to
where b denotes the bootstrap realization. A total of B=2000 bootstrap realizations were used. For each bootstrap realization, the characteristic energies Ee(exit)(b), Ee(det)(b) and Eγ(exit)(b) were recalculated using the same three-consecutive-bin criterion defined above. Then, the corresponding coefficient was calculated as
The bootstrap realizations yield a C1 distribution for each station. The median values obtained for individual stations are:
In the present formulation, C1 is calibrated for a field-to-detector separation of 100 m. The station-specific C1 distributions show typical spreads of approximately ±0.03–0.05. Combining the bootstrap realizations from all four stations yields a pooled median of C1≈1.38, while a global least-squares optimization, minimizing the deviations of the predicted FPD from the 100 m propagation scale, gives C1≈1.375. The close agreement between these independent estimates supports the stability of the inferred coefficient across the atmospheric conditions considered here. Accordingly, C1≈1.37 is adopted for the subsequent FPD parameterization.
The second parameter of the model, C2(h), characterizes the average energy loss of electrons per unit path length, which depends explicitly on atmospheric density. For each station, a representative energy for calculation losses was defined as
which approximates the typical electron energy during propagation. The corresponding mass stopping power was obtained from the NIST ESTAR database (Berger et al., 2005) using linear interpolation and multiplied by the local air density to obtain the linear stopping power.
The resulting values are
The FPD was then calculated according to Eq. (12), where C1 was derived from spectral data, C2(h) from stopping-power tables, and the energies from the simulated spectra.
Applying this expression to the simulation data for four stations yields FPD values ranging from 85 to 105 m, in agreement with the expected ∼100 m scale.
To compare the empirical coefficient C1=1.2 with the optimized coefficient C1≈1.37, FPD distributions were calculated from the bootstrap realizations for all four stations using Eq. (12). The resulting distributions are shown in Fig. 7, with the mean values and corresponding 68 % intervals indicated.
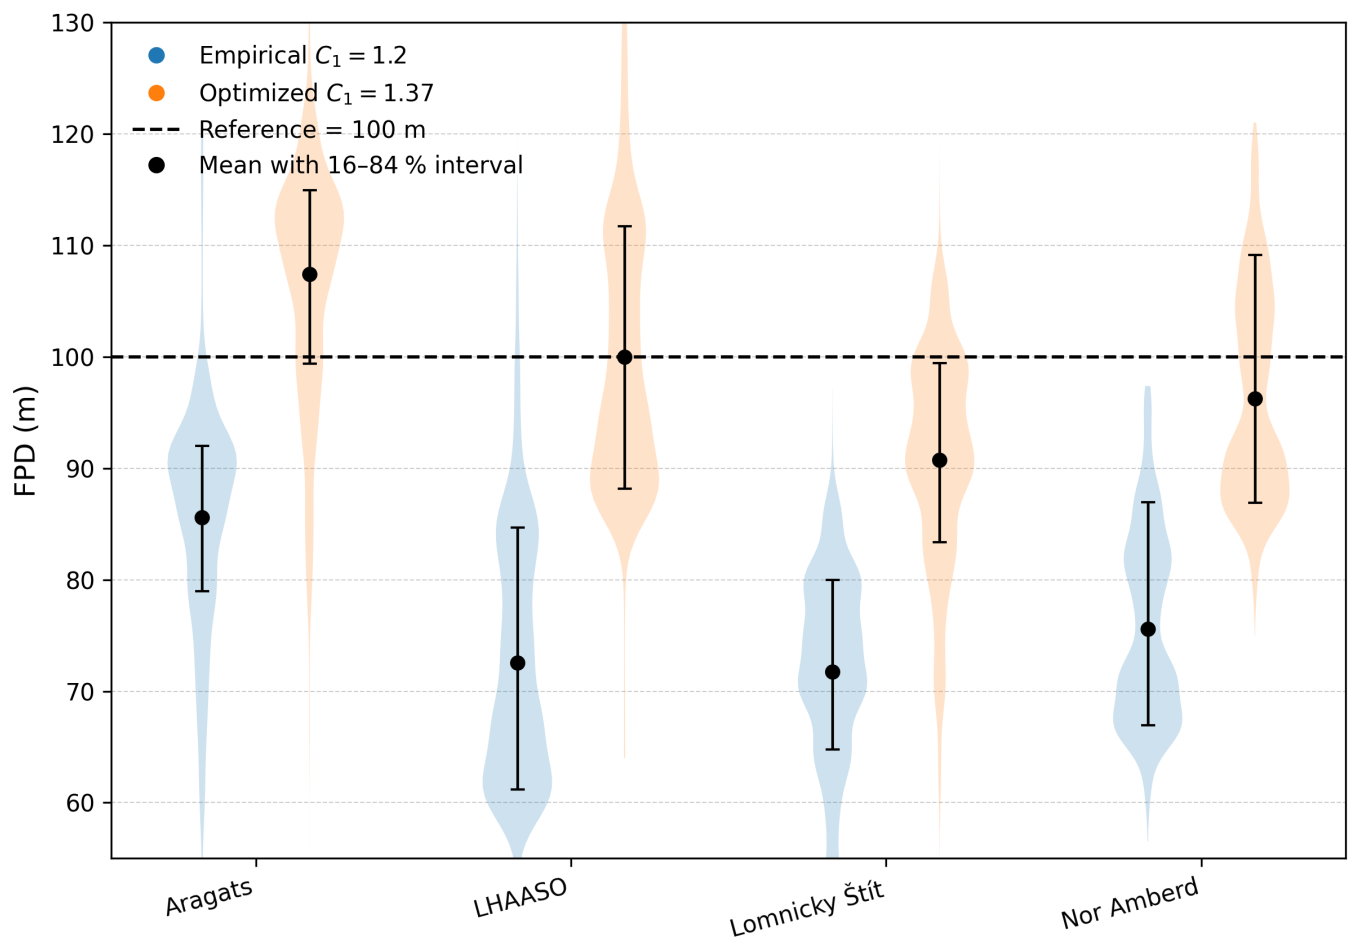
Figure 7Comparison of free path distance (FPD) distributions obtained using the empirical coefficient C1=1.2 and the optimized value C1=1.37 for four high-altitude stations (Aragats, LHAASO, Lomnický Štít, Nor Amberd). The distributions are derived from bootstrap resampling of the simulated spectra. Colored violins show the density of FPD values, while black markers denote mean values with 16th–84th percentile intervals. The dashed line indicates the reference field-to-detector separation of 100 m.
As shown in Fig. 7, the empirical coefficient C1=1.2 systematically underestimates the FPD at all four stations, whereas the optimized value C1≈1.37 gives values closer to the 100 m propagation distance. The remaining spread reflects the statistical variability of the high-energy spectral tails.
To test the robustness of the FPD estimate, 50 additional independent CORSIKA simulations were performed for the Aragats station at an electric field of 210 kV m−1, with a 50 m distance between the lower boundary of the electric-field region and the detector level. The resulting data were used to recalculate the FPD using the same coefficients obtained for the 100 m separation adopted for calibration of the FPD relation. For the 50 m distance, the median of the reconstructed FPD distribution was 69.9 m, with a 16th–84th percentile interval of 58.65–77.35 m:
The reconstructed FPD is shifted toward larger values by approximately 20 m. Nevertheless, the reconstructed distribution correctly identifies the short-distance range over which electrons emerging from the electric-field region can reach the detector level.
The obtained 16th–84th percentile interval should be regarded as a lower bound on the expected uncertainty, since the additional uncertainty associated with the experimental procedure of recovering energy spectra from energy-release histograms is not included in the simulations.
In this work, CORSIKA simulations were used to investigate two complementary stages of relativistic runaway electron avalanche development: avalanche growth within the atmospheric electric field and subsequent particle propagation beyond the accelerating region. The simulations were performed for four high-altitude observational sites spanning different atmospheric densities and electric-field conditions.
The effective avalanche lengths derived from the vertical electron profiles show station-to-station differences when a single coefficient is fitted to the combined dataset. The station-specific coefficients range from to kV. Introducing an additional density-dependent term reduces the inter-station scatter, increasing the coefficient of determination from R2≈0.90 to R2≈0.99. The joint fit yields kV and , indicating an additional approximately inverse dependence on atmospheric density beyond that already included in the runaway-threshold scaling.
The simulations also characterize the different evolution of the electron and gamma-ray components after leaving the accelerating electric-field region. Electron spectra and particle counts decrease rapidly with field-free propagation distance, whereas the gamma-ray component is attenuated more gradually. Within the FPD formulation, the characteristic electron and gamma-ray energies at the field boundary are related through the coefficient C1. Calibration for a 100 m field-to-detector separation gives C1≈1.37. The density-dependent electron energy-loss coefficient C2(h), obtained from ESTAR stopping-power data, ranges from approximately 0.17 to 0.23 MeV m−1 across the four stations. Using these parameters, the reconstructed FPD values range from approximately 85 to 105 m, consistent with the 100 m propagation scale used for the calibration.
These results are derived for the idealized uniform electric-field configurations considered here and should not be generalized to arbitrary thunderstorm electric-field structures without further validation.
All materials required to reproduce the results presented in this study that are under the author's control are publicly available at Zenodo: https://doi.org/10.5281/zenodo.19508876 (Hovhannisyan, 2026a).
An identical copy of the dataset is also available at Figshare: https://doi.org/10.6084/m9.figshare.31980552 (Hovhannisyan, 2026b).
The Zenodo record should be considered the primary reference, while the Figshare repository is provided as an alternative access point.
The archived materials include all CORSIKA input files used in the simulations, definitions of the atmospheric electric-field configurations, auxiliary analysis scripts, processed simulation outputs, and all figures and tables presented in the manuscript, together with documentation describing the workflow required to reproduce the results.
The CORSIKA simulation framework is a licensed third-party Monte Carlo code developed and maintained by the Karlsruhe Institute of Technology (KIT). Due to licensing restrictions, the source code cannot be redistributed. The exact version used in this study (CORSIKA 7.7500) is specified in the manuscript and can be obtained for scientific use directly from the official distribution portal.
These materials enable reproduction of the analysis workflow and reported results for users with legitimate access to the CORSIKA framework.
The author has declared that there are no competing interests.
Publisher's note: Copernicus Publications remains neutral with regard to jurisdictional claims made in the text, published maps, institutional affiliations, or any other geographical representation in this paper. The authors bear the ultimate responsibility for providing appropriate place names. Views expressed in the text are those of the authors and do not necessarily reflect the views of the publisher.
The author gratefully acknowledges Prof. A. Chilingarian for valuable discussions, guidance, and scientific support.
This paper was edited by Cynthia Whaley and reviewed by two anonymous referees.
Babich, L. P., Donskoy, E. N., Kutsyk, I. M., Kudryavtsev, A. Y., Roussel-Dupré, R. A., Shamraev, B. N., and Symbalisty, E. M. D.: Comparison of relativistic runaway electron avalanche rates obtained from Monte Carlo simulations and kinetic equation solution, IEEE T. Plasma Sci., 29, 430–438, https://doi.org/10.1109/27.928940, 2001.
Berger, M. J., Coursey, J. S., Zucker, M. A., and Chang, J.: ESTAR, PSTAR, and ASTAR: Computer Programs for Calculating Stopping-Power and Range Tables for Electrons, Protons, and Helium Ions, National Institute of Standards and Technology, Gaithersburg, MD, https://doi.org/10.18434/T4NC7P, 2005.
Bethe, H. A. and Heitler, W.: On the stopping of fast particles and on the creation of positive electrons, P. Roy. Soc. Lond. A, 146, 83–112, https://doi.org/10.1098/rspa.1934.0140, 1934.
Buitink, S., Huege, T., Falcke, H., Heck, D., and Kuijpers, J.: Monte Carlo simulations of air showers in atmospheric electric fields, Astropart. Phys., 33, 1–10, https://doi.org/10.1016/j.astropartphys.2009.10.006, 2009.
Chilingarian, A., Hovsepyan, G., and Hovhannisyan, A.: Particle bursts from thunderclouds: Natural particle accelerators above our heads, Phys. Rev. D, 83, 062001, https://doi.org/10.1103/PhysRevD.83.062001, 2011.
Chilingarian, A., Hovsepyan, G., and Zazyan, M.: Measurement of TGE particle energy spectra: An insight in the cloud charge structure, EPL, 134, 69001, https://doi.org/10.1209/0295-5075/ac0dfa, 2021.
Chilingarian, A., Hovsepyan, G., Aslanyan, D., Karapetyan, T., Khanikyanc, Y., Kozliner, L., Pokhsraryan, D., Sargsyan, B., Soghomonyan, S., Chilingaryan, S., and Zazyan, M.: Thunderstorm ground enhancements: Multivariate analysis of 12 years of observations, Phys. Rev. D, 106, 082004, https://doi.org/10.1103/PhysRevD.106.082004, 2022.
Chilingarian, A., Sargsyan, B., Karapetyan, T., Aslanyan, D., Chilingaryan, S., Kozliner, L., and Khanikyanc, Y.: Extreme thunderstorm ground enhancements registered on Aragats in 2023, Phys. Rev. D, 110, 063043, https://doi.org/10.1103/PhysRevD.110.063043, 2024.
Chilingarian, A., Williams, E., Hovsepyan, G., and Mkrtchyan, H.: Why Schonland failed in his search for runaway electrons from thunderstorms, J. Geophys. Res.-Atmos., 130, e2024JD042350, https://doi.org/10.1029/2024JD042350, 2025.
Chilingarian, A., Hovhannisyan, L., and Zazyan, M.: Threshold atmospheric electric fields for initiating relativistic runaway electron avalanches: theoretical estimates and CORSIKA simulations, Geosci. Model Dev., 19, 621–626, https://doi.org/10.5194/gmd-19-621-2026, 2026.
Chum, J., Langer, R., Baše, J., Kollárik, M., Strhárský, I., Diendorfer, G., and Rusz, J.: Significant enhancements of secondary cosmic rays and electric field at the high mountain peak of Lomnický Štít in High Tatras during thunderstorms, Earth Planets Space, 72, 28, https://doi.org/10.1186/s40623-020-01155-9, 2020.
Coleman, L. M. and Dwyer, J. R.: Propagation speed of runaway electron avalanches, Geophys. Res. Lett., 33, L11810, https://doi.org/10.1029/2006GL025863, 2006.
Dwyer, J. R.: A fundamental limit on electric fields in air, Geophys. Res. Lett., 30, 2055, https://doi.org/10.1029/2003GL017781, 2003.
Dwyer, J. R.: Relativistic breakdown in planetary atmospheres, Phys. Plasmas, 14, 042901, https://doi.org/10.1063/1.2709652, 2007.
Dwyer, J. R. and Uman, M. A.: The physics of lightning, Phys. Rep., 534, 147–241, https://doi.org/10.1016/j.physrep.2013.09.004, 2014.
Dwyer, J. R., Smith, D. M., and Cummer, S. A.: High-energy atmospheric physics: Terrestrial gamma-ray flashes and related phenomena, Space Sci. Rev., 173, 133–196, https://doi.org/10.1007/s11214-012-9894-0, 2012.
Fishman, G. J., Bhat, P. N., Mallozzi, R., Horack, J. M., Koshut, T., Kouveliotou, C., Pendleton, G. N., Meegan, C. A., Wilson, R. B., Paciesas, W. S., Goodman, S. J., and Christian, H. J.: Discovery of intense gamma-ray flashes of atmospheric origin, Science, 264, 1313–1316, https://doi.org/10.1126/science.264.5163.1313, 1994.
Gurevich, A. V., Milikh, G. M., and Roussel-Dupré, R.: Runaway electron mechanism of air breakdown and preconditioning during a thunderstorm, Phys. Lett. A, 165, 463–468, https://doi.org/10.1016/0375-9601(92)90348-P, 1992.
Heck, D., Knapp, J., Capdevielle, J. N., Schatz, G., and Thouw, T.: CORSIKA: A Monte Carlo code to simulate extensive air showers, Report FZKA-6019, Forschungszentrum Karlsruhe, Karlsruhe, Germany, https://doi.org/10.5445/IR/270043064, 1998.
Hovhannisyan, L.: Data and code for “Relativistic runaway electron avalanches: unified density-dependent scaling and transport”, Zenodo [code and data set], https://doi.org/10.5281/zenodo.19508876, 2026a.
Hovhannisyan, L.: Data and scripts for: Relativistic runaway electron avalanches: unified density-dependent scaling and transport, figshare [data set], https://doi.org/10.6084/m9.figshare.31980552.v1, 2026b.
Kisvárdai, I., Štempel, F., Randuška, L., Mackovjak, Š., Langer, R., Strhárský, I., and Kubančák, J.: Analysis of 42 years of cosmic ray measurements by the neutron monitor at Lomnický Štít observatory, Earth Space Sci., 12, e2024EA003656, https://doi.org/10.1029/2024EA003656, 2025.
Koch, H. W. and Motz, J. W.: Bremsstrahlung cross-section formulas and related data, Rev. Mod. Phys., 31, 920–955, https://doi.org/10.1103/RevModPhys.31.920, 1959.
Aharonian, F., An, Q., Axikegu, Bai, L. X., Bai, Y. X., Bao, Y. W., Bastieri, D., Bi, X. J., Bi, Y. J., Cai, J. T., Cao, Zhe, Cao, Zhen, Chang, J., Chang, J. F., Chen, E. S., Chen, Liang, Chen, Liang, Chen, Long, Chen, M. J., Chen, M. L., Chen, S. H., Chen, S. Z., Chen, T. L., Chen, X. J., Chen, Y., Cheng, H. L., Cheng, N., Cheng, Y. D., Cui, S. W., Cui, X. H., Cui, Y. D., Dai, B. Z., Dai, H. L., Dai, Z. G., Danzengluobu, Della Volpe, D., Duan, K. K., Fan, J. H., Fan, Y. Z., Fan, Z. X., Fang, J., Fang, K., Feng, C. F., Feng, L., Feng, S. H., Feng, X. T., Feng, Y. L., Gao, B., Gao, C. D., Gao, L. Q., Gao, Q., Gao, W., Gao, W. K., Ge, M. M., Geng, L. S., Gong, G. H., Gou, Q. B., Gu, M. H., Guo, F. L., Guo, J. G., Guo, X. L., Guo, Y. Q., Guo, Y. Y., Han, Y. A., He, H. H., He, H. N., He, S. L., He, X. B., He, Y., Heller, M., Hor, Y. K., Hou, C., Hou, X., Hu, H. B., Hu, Q., Hu, S., Hu, S. C., Hu, X. J., Huang, D. H., Huang, W. H., Huang, X. T., Huang, X. Y., Huang, Y., Huang, Z. C., Ji, X. L., Jia, H. Y., Jia, K., Jiang, K., Jiang, Z. J., Jin, M., Kang, M. M., Ke, T., Kuleshov, D., Li, B. B., Li, Cheng, Li, Cong, Li, F., Li, H. B., Li, H. C., Li, H. Y., Li, J., Li, Jian, Li, Jie, Li, K., Li, W. L., Li, X. R., Li, Xin, Li, Xin, Li, Y. Z., Li, Zhe, Li, Zhuo, Liang, E. W., Liang, Y. F., Lin, S. J., Liu, B., Liu, C., Liu, D., Liu, H., Liu, H. D., Liu, J., Liu, J. L., Liu, J. S., Liu, J. Y., Liu, M. Y., Liu, R. Y., Liu, S. M., Liu, W., Liu, Y., Liu, Y. N., Long, W. J., Lu, R., Luo, Q., Lv, H. K., Ma, B. Q., Ma, L. L., Ma, X. H., Mao, J. R., Masood, A., Min, Z., Mitthumsiri, W., Nan, Y. C., Ou, Z. W., Pang, B. Y., Pattarakijwanich, P., Pei, Z. Y., Qi, M. Y., Qi, Y. Q., Qiao, B. Q., Qin, J. J., Ruffolo, D., Sáiz, A., Shao, C. Y., Shao, L., Shchegolev, O., Sheng, X. D., Shi, J. Y., Song, H. C., Stenkin, Yu. V., Stepanov, V., Su, Y., Sun, Q. N., Sun, X. N., Sun, Z. B., Tam, P. H. T., Tang, Z. B., Tian, W. W., Wang, B. D., Wang, C., Wang, H., Wang, H. G., Wang, J. C., Wang, J. S., Wang, L. P., Wang, L. Y., Wang, R., Wang, R. N., Wang, W., Wang, X. G., Wang, X. Y., Wang, Y., Wang, Y. D., Wang, Y. J., Wang, Y. P., Wang, Z. H., Wang, Z. X., Wang, Zhen, Wang, Zheng, Wei, D. M., Wei, J. J., Wei, Y. J., Wen, T., Wu, C. Y., Wu, H. R., Wu, S., Wu, X. F., Wu, Y. S., Xi, S. Q., Xia, J., Xia, J. J., Xiang, G. M., Xiao, D. X., Xiao, G., Xin, G. G., Xin, Y. L., Xing, Y., Xiong, Z., Xu, D. L., Xu, R. X., Xue, L., Yan, D. H., Yan, J. Z., Yang, C. W., Yang, F. F., Yang, H. W., Yang, J. Y., Yang, L. L., Yang, M. J., Yang, R. Z., Yang, S. B., Yao, Y. H., Yao, Z. G., Ye, Y. M., Yin, L. Q., Yin, N., You, X. H., You, Z. Y., Yu, Y. H., Yuan, Q., Yue, H., Zeng, H. D., Zeng, T. X., Zeng, W., Zeng, Z. K., Zha, M., Zhai, X. X., Zhang, B. B., Zhang, F., Zhang, H. M., Zhang, H. Y., Zhang, J. L., Zhang, L. X., Zhang, Li, Zhang, Lu, Zhang, P. F., Zhang, P. P., Zhang, R., Zhang, S. B., Zhang, S. R., Zhang, S. S., Zhang, X., Zhang, X. P., Zhang, Y. F., Zhang, Y. L., Zhang, Yi, Zhang, Yong, Zhao, B., Zhao, J., Zhao, L., Zhao, L. Z., Zhao, S. P., Zheng, F., Zheng, Y., Zhou, B., Zhou, H., Zhou, J. N., Zhou, P., Zhou, R., Zhou, X. X., Zhu, C. G., Zhu, F. R., Zhu, H., Zhu, K. J., Zuo, X., and LHAASO Collaboration: Flux variations of cosmic ray air showers detected by LHAASO-KM2A during a thunderstorm on 10 June 2021, Chin. Phys. C, 47, 015001, https://doi.org/10.1088/1674-1137/ac9371, 2023.
Marisaldi, M., Østgaard, N., Mezentsev, A., Lang, T., Grove, J. E., Shy, D., Heymsfield, G. M., Krehbiel, P., Thomas, R. J., Stanley, M., Sarria, D., Schultz, C., Blakeslee, R., Quick, M. G., Christian, H., Adams, I., Kroodsma, R., Lehtinen, N., Ullaland, K., Yang, S., Hasan Qureshi, B., Søndergaard, J., Husa, B., Walker, D., Bateman, M., Mach, D., Cummer, S., Pazos, M., Pu, Y., Bitzer, P., Fullekrug, M., Cohen, M., Montanya, J., Younes, C., van der Velde, O., Roncancio, J. A., Lopez, J. A., Urbani, M., and Santos, A.: Highly dynamic gamma-ray emissions are common in tropical thunderclouds, Nature, 634, 57–60, https://doi.org/10.1038/s41586-024-07936-6, 2024.
Østgaard, N., Mezentsev, A., Marisaldi, M., Grove, J. E., Quick, M., Christian, H., Cummer, S., Pazos, M., Pu, Y., Stanley, M., Sarria, D., Lang, T., Schultz, C., Blakeslee, R., Adams, I., Kroodsma, R., Heymsfield, G., Lehtinen, N., Ullaland, K., Yang, S., Hasan Qureshi, B., Søndergaard, J., Husa, B., Walker, D., Shy, D., Bateman, M., Bitzer, P., Fullekrug, M., Cohen, M., Montanya, J., Younes, C., van der Velde, O., Krehbiel, P., Roncancio, J. A., Lopez, J. A., Urbani, M., Santos, A., and Mach, D.: Flickering gamma-ray flashes, the missing link between gamma glows and TGFs, Nature, 634, 53–56, https://doi.org/10.1038/s41586-024-07893-0, 2024.
Sato, T.: Analytical model for estimating terrestrial cosmic ray fluxes nearly anytime and anywhere in the world: Extension of PARMA/EXPACS, PLoS ONE, 10, e0144679, https://doi.org/10.1371/journal.pone.0144679, 2015.
Skeltved, A. B., Østgaard, N., Carlson, B., Gjesteland, T., and Celestin, S.: Modeling the relativistic runaway electron avalanche and the feedback mechanism with GEANT4, J. Geophys. Res.-Space, 119, 9174–9191, https://doi.org/10.1002/2014JA020504, 2014.