
the Creative Commons Attribution 4.0 License.
the Creative Commons Attribution 4.0 License.
 | 20 Aug 2026
AQUA v1.0.0: The Application for QUality Assessment for the Climate Change Adaptation Digital Twin – the core engine
Jost von Hardenberg
Marco Cadau
Silvia Caprioli
Paolo Ghinassi
Supriyo Ghosh
Nikolay Koldunov
Natalia Nazarova
Maqsood Mubarak Rajput
Emanuele Tovazzi
Paolo Davini
The increasing availability of kilometer-scale climate simulations presents major challenges for data access, processing, and analysis due to the unprecedented volume and heterogeneity of the outputs. Different data formats, structures, and metadata conventions, require dedicated solutions to ensure interoperability and usability. We introduce AQUA (Application for QUality Assessment), a Python-based framework developed within the Climate Change Adaptation Digital Twin of the Destination Earth (DestinE) initiative, designed to support the automated evaluation of high-resolution global climate simulations. Although several diagnostic suites for the analysis of global climate model data are already available, AQUA provides a flexible and modular infrastructure for accessing and processing climate model output across various formats. By building on widely adopted Python libraries, it enables scalable, out-of-core computations. Its design supports integration into automated workflows and user-defined pipelines, facilitating both operational and research-oriented applications. This paper focuses on the architecture and core functionalities of the AQUA core, which handles data ingestion, standardization, and pre-processing. AQUA is open source and actively maintained, and aims to serve as a community tool for robust, reproducible, and efficient climate data analysis across projects and institutions.
- Article
(1282 KB) - Full-text XML
- BibTeX
- EndNote


Earth System Models (ESMs) have become a cornerstone for state-of-the-art climate research, allowing scientists to simulate both historical climate conditions and projected future changes, as well as perform counterfactual and sensitivity experiments. They are essential for climate assessments, and the comparison of different model outputs provides valuable insights for further model development and policy-making such as in the work of the Intergovernmental Panel on Climate Change (IPCC, 2023).
The complexity of ESMs, as well as their spatial resolution and the temporal frequency at which model output is saved, have been constantly increasing resulting in a substantially larger volume of data produced. This has been made possible by advancements in computational capabilities (Bauer et al., 2021) and the porting of models to using Graphics Processing Units (GPUs; Fuhrer et al., 2018; Zhang et al., 2020; Hohenegger et al., 2023; Bishnoi et al., 2024). While including more Earth System components provides a more comprehensive representation of the climate system, high-resolution models offer finer spatial and temporal details, which can reduce biases in the simulated climate (Czaja et al., 2019; Moreno-Chamarro et al., 2022) and resolve processes at the kilometer scale that do not depend directly on parameterizations (Roberts et al., 2020; Judt et al., 2021; Vidale et al., 2021). At the same time the transition to complex high-resolution ESMs brings several challenges for efficient data-handling, effective discretization and efficient parallelization of the code (Bauer et al., 2021).
As a consequence, the current generation of high-resolution ESMs produces a volume of data that require substantial storage capacity and efficient data management strategies. The entire output produced by the Coupled Model Intercomparison Project Phase 5 (CMIP5; Taylor et al., 2012; Cinquini et al., 2014) was of 3.5 PB. CMIP6 increased even more the size of the total storage required, bringing it to around 40 PB of data (Acosta et al., 2024), and it is reasonable to expect a significant increase in the upcoming CMIP7 phase. For comparison, the amount of data produced by a single multidecadal km-scale run (e.g. 5 km, 30 years) is of around 1 PB per realization (35 TB yr−1; Doblas-Reyes et al., 2026). If such a model were used to produce the Tier1 simulations planned for the HighResMIP2 protocol (Roberts et al., 2025), the amount of data from a single model would approach 11 PB, exceeding the CMIP5 total and being a consistent fraction of the entire CMIP6 archive.
Navigating the metadata and retrieving the data of such output in order to extract the subset of data necessary for a focused analysis is a task that can be as complex as the scientific one, and the learning curve to access and process such data is quite steep and often discouraging. Additionally, the analysis of increasingly large datasets poses significant challenges for extracting meaningful information and for combining consistently outputs produced by different models. An initial quality assessment of a simulation may not require the full analysis of the entire high-resolution archive, but the pipeline needed to extract the coarser temporal and spatial resolutions can still pose a significant challenge. In other words, computing the global yearly average of an hourly 5 km output might be as challenging as computing local scale percentiles. These requirements call for efficient and scalable solutions while developing a pipeline for the data analysis.
The expanding diversity of climate models in the community has led to greater complexity in both data standards and model outputs. Despite the efforts of initiatives such as the Climate Model Output Rewriter (CMOR, Mauzey et al., 2026), which define standards to harmonize climate model output and enforce CF-compliant metadata, the raw output produced by individual modeling centers is often still based on internal conventions. This already fragmented landscape of data formats and metadata conventions is further complicated by the fact that the weather community predominantly relies on the World Meteorological Organization (WMO) GRIB2 format. Differences in model output formats and metadata conventions, together with the need to compare model results against observational datasets and reanalyses, can limit the ability to perform consistent and reproducible analyses across datasets. Therefore, analysis tools must be flexible in accommodating diverse input metadata and data file formats to ensure applicability across different climate centers.
These competing standards, as well as the quick advancement of innovative data file format such as Zarr (https://zarr.dev/, last access: 17 August 2026), urge for the development of analysis tools able to deal with different data formats to be handled with an homogeneous Application Programming Interface (API). For a tool dedicated to the analysis of climate and weather model output, it is therefore essential to seamlessly open and handle the different data formats and encoding standards currently used in the community (NetCDF, GRIB, Zarr, Field DataBase–FDB; Smart et al., 2017), enabling the same methods and analysis pipelines to be applied consistently.
At the same time, a data access and analysis tool should accommodate different levels of use, ranging from simple data retrieval to complex analyses. From this perspective, the modularity of a code is crucial to guarantee optimal analysis performance and facilitate development by making use only of the necessary components of a code in a seamless way. These evolving requirements, driven by increasing data volumes, higher output frequencies, and the growing need for automated and reproducible analyses, have made the traditional approach to processing climate model output, based on manual inspection and ad-hoc scientific scripts, increasingly inadequate. Indeed, in recent years data analysis is pushing for elaborated model evaluation tools, that sometimes also run in an automated way alongside simulations to provide prompt assessment of the model's climate.
This need has been the founding motivation for widely appreciated tools as ESMValTool (Schlund et al., 2025; Lauer et al., 2025; Righi et al., 2020; Eyring et al., 2020), E3SM (Zhang et al., 2022) and PMP (Lee et al., 2024, 2025) which provide the opportunity for climate scientists to run their analysis, as well as the delivery of a large amount of condensed information, that describe various aspects of the climate systems to support developers, final users and policy makers. Effort in this direction has been recently crowned by pioneering development of a federation of tools with a shared centralized interface as the Rapid Evaluation Framework (REF; https://wcrp-cmip.org/rapid-evaluation-framework, last access: 17 August 2026) (Dunne et al., 2025; Hoffman et al., 2025). It aims at providing evaluation of the results from the upcoming CMIP7 simulations, directly run on Earth System Gateway Federation (ESGF) nodes (Cinquini et al., 2014).
Along the same lines, the need for near–real-time model evaluation is becoming increasingly relevant with the development of the Digital Twin for Climate Change Adaptation (ClimateDT) of the Destination Earth initiative (Doblas-Reyes et al., 2026), which targets kilometre-scale horizontal resolution and hourly output frequency in a prototype operational framework (Wedi et al., 2025; Hoffmann et al., 2023; Wedi et al., 2022). By running km-scale simulations, the ClimateDT produces unprecedented amounts of data, so that a single experiment from the ClimateDT generates data of the order of PBs, being delivered with a rate that can exceed tens of TB per day (Doblas-Reyes et al., 2026). Given their relevance and their computational cost, the simulations require real-time monitoring and evaluation which has to be embedded in an automated workflow and to be deployed at multiple European pre-exascale supercomputers. Processing tools conventionally used by the climate community, based on standard pipelines and in-memory computation, might not be enough to guarantee the access to the data.
These requirements have been the premise for the development of a new unified tool that can access, preprocess and analyze the data produced by high-resolution simulations from the ClimateDT, aiming at overcoming the traditional issues that standard climate modeling evaluation tools encounter when dealing with such a large amount of data.
The Application for QUality Assessment (AQUA v1.0.0) is a Python3 package specifically tailored to address this challenge. The AQUA developers are committed to follow the standards of modern software practices and the core code is available in a central open source repository. A companion package, AQUA-diagnostics, containing diagnostics built with the AQUA core package, will be described in a companion paper.
The paper is organized as follows. In Sect. 2, the code design and philosophy is summarized. In Sect. 3, details of the code implementation are presented. In Sect. 4, a benchmark of the code performances is discussed. In Sect. 5, the role of AQUA in the Destination Earth project is described. Finally, in Sect. 6 we summarize our work and present our conclusions.
AQUA is an open-source software developed and maintained on GitHub (https://github.com/DestinE-Climate-DT/AQUA, last access: 17 August 2026) under the DestinE-Climate-DT organization. The code is entirely developed in Python3 and it is based on well-known python packages extensively used in the geoscientific community. This allows high reliability on the core code and reusability of data provided with other tools available in the community. The package is available in the Python Package Index (https://pypi.org/project/aqua-core/, last access: 17 August 2026) (pypi), although some binary dependencies need to be installed by the user, not being available as python packages.
The code aims at providing a framework to access, process and analyze large volumes of climate data. It has been developed under the ClimateDT to be flexible enough to support both large intercomparison projects and individual user applications. AQUA has been designed to target the initial needs of the ClimateDT described in the introduction, taking into account the four key principles highlighted below:
-
Homogeneity: AQUA provides a smooth and seamless interface to the user, despite differences in data formats and metadata conventions across climate models, and returns standardized objects by leveraging the Xarray (https://github.com/pydata/xarray, last access: 17 August 2026) package for climate data analysis. Its design complements Xarray by allowing users to apply familiar methods alongside the additional functionalities introduced by AQUA.
-
Efficiency: parallelization of the computation and lazy access to data are essential to enable the analysis of the large datasets produced by km-scale simulations. Lazy access refers to deferring the actual loading of data into memory until a computation is explicitly triggered, allowing workflows to operate on datasets that exceed available memory. The scalability of the framework code, from data access to data processing, has been one of the primary drivers for the code development. AQUA relies on Dask (https://www.dask.org/, last access: 17 August 2026) (Dask Development Team, 2016) for an efficient lazy and scalable computation. Data access is initially based on metadata inspection only, so that datasets are represented and used to set up computations without loading the underlying values into memory. This enables out-of-memory computation and scalable processing of datasets.
-
Modularity: a modular code should allow the user to interact only with the components necessary for the task. Analyses often require only a subset of the tools a package provides, and the ability to select only the necessary modules enhances the flexibility and applicability across different use cases. The AQUA framework provides a high level of modularity, with data processing tools already available as independent python classes. This designed modularity also allows for easy extension of the code capabilities with new features, without the creation of complicated cross-module dependencies.
-
Flexibility: A flexible code should be able to work with a broad range of existing data formats or metadata choices. In AQUA this is given by the possibility to extend the core functionalities to new data formats or to new metadata standards (e.g. CMOR) through Intake (https://github.com/intake/intake, last access: 17 August 2026) catalog access. When a given data format is not supported by Intake out of the box, a dedicated Intake driver is required, as implemented for the FDB data format within the ClimateDT. AQUA provides a default metadata convention and data model, with the possibility to modify the default or introduce new conventions.
Figure 1 shows the schema of the main AQUA dependencies. Starting from the left part of the figure, an ideal pipeline of data access, process and diagnostic evaluation is shown.
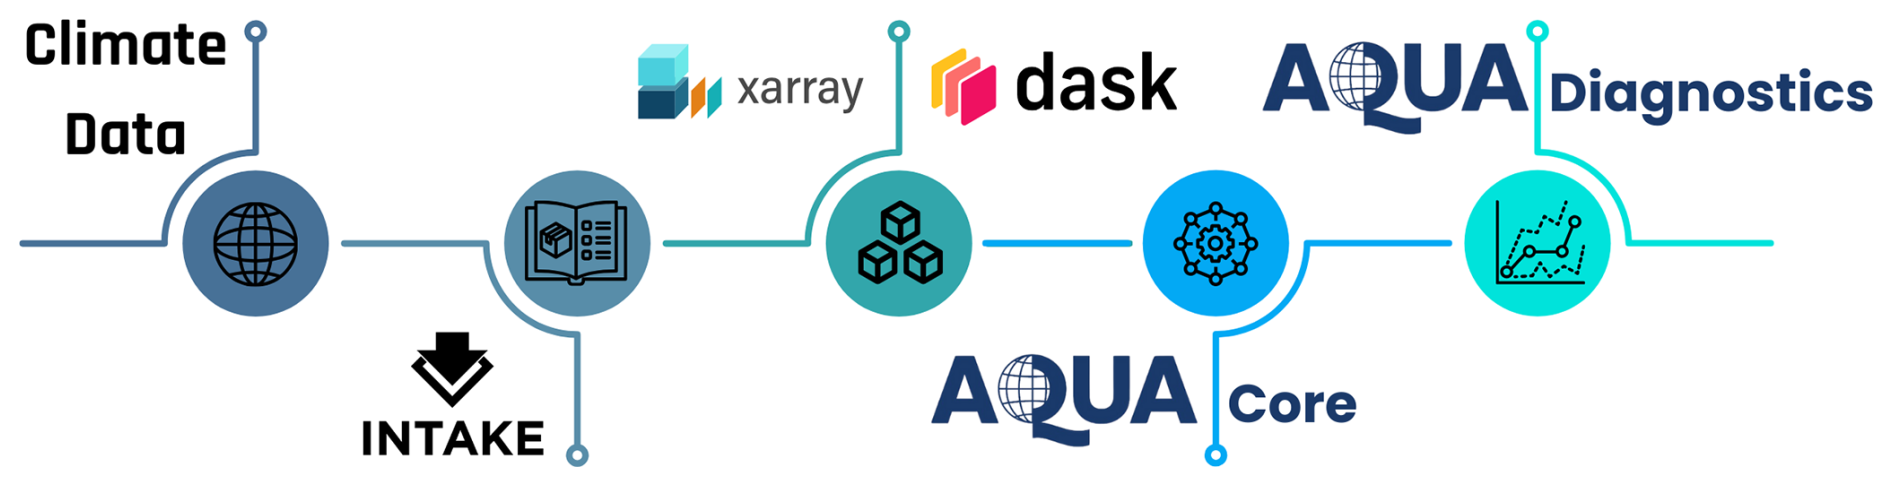
Figure 1A scheme of the AQUA core dependencies and the separation between the AQUA core and the diagnostics. Climate data are the input for the AQUA code. Intake is then used to create data catalogs. AQUA leverages Xarray and Dask to enable lazy access computation. The AQUA framework is the part devoted to data access and process. Finally AQUA Diagnostics, a diagnostic suite based on the AQUA framework will be introduced in a companion paper.
The first design choice of AQUA is the use of catalogs (both human and machine-readable) containing the information on paths and other specifications needed to access the climate data. This facilitates access to shared results in large collaborative projects. This solution is based on the Python Intake package, which natively supports catalogs for different data formats (netCDF, Zarr, Parquet, ARCO; https://help.marine.copernicus.eu/en/articles/12332770, last access: 17 August 2026) through specific drivers. Intake catalogs represent a solution adopted by major international modelling initiatives and community frameworks (Rackow et al., 2025), and can be easily extended to additional data formats by implementing new drivers. In the ClimateDT this has been done to extend the catalogs used by AQUA to access data written with the FDB storage technology used in the DestinE project and the Polytope (https://polytope-client.readthedocs.io/en/latest/index.html, last access: 17 August 2026) technology (Leuridan et al., 2025) to access the data made publicly available in the DestinE Core Service Platform (https://platform.destine.eu/, last access: 17 August 2026) (DESP).
Additionally, the catalogs are stored in a human-readable YAML format and support extra metadata and are ingested by Python as dictionaries. This provides an ideal foundation for the integration of new features. Specific AQUA add-ons can be designed by extending the metadata of Intake, such as specifications about the native model grid or required fixes to variables metadata, without disrupting the nature of Intake catalogs.
The second fundamental design choice is to rely on Xarray and its natural integration with Dask as a cornerstone of the data analysis framework. One of the primary requirements for the quality assessment of km-scale simulations and for dealing with the large datasets involved is efficient out-of-memory computation, naturally provided by Dask/Xarray. Xarray is widely used in the climate community, and constitutes the common primary choice as the main package for geophysical data analysis. The natural integration of Dask with Xarray allows for effective usage of the computational nodes that a computing cluster or an HPC can offer, fulfilling the needs of an efficient scalable code. AQUA can open all the supported data formats as Dask-enabled Xarray Datasets. All AQUA features preserve full Xarray compatibility: data remain standard Xarray objects throughout all stages of the analysis. From this perspective AQUA can be seen as a complement of Xarray, where extra processing capabilities coming from the knowledge of the specific dataset loaded are enabled.
As the last element of the processing chain, Fig. 1 shows the AQUA core and AQUA diagnostic suite. The core is the set of tools to perform data access and manipulations.
The core has been designed as flexible and with general applicability in mind. In this context, Fig. 2 gives an overview of the code capabilities. Users can interact with AQUA at three different levels: (i) as a data retriever, obtaining the required Xarray dataset to conduct an independent analysis; (ii) by applying AQUA's built-in methods (e.g., spatial regridding, temporal averaging); or (iii) by performing a complete analysis through the AQUA diagnostic suite.
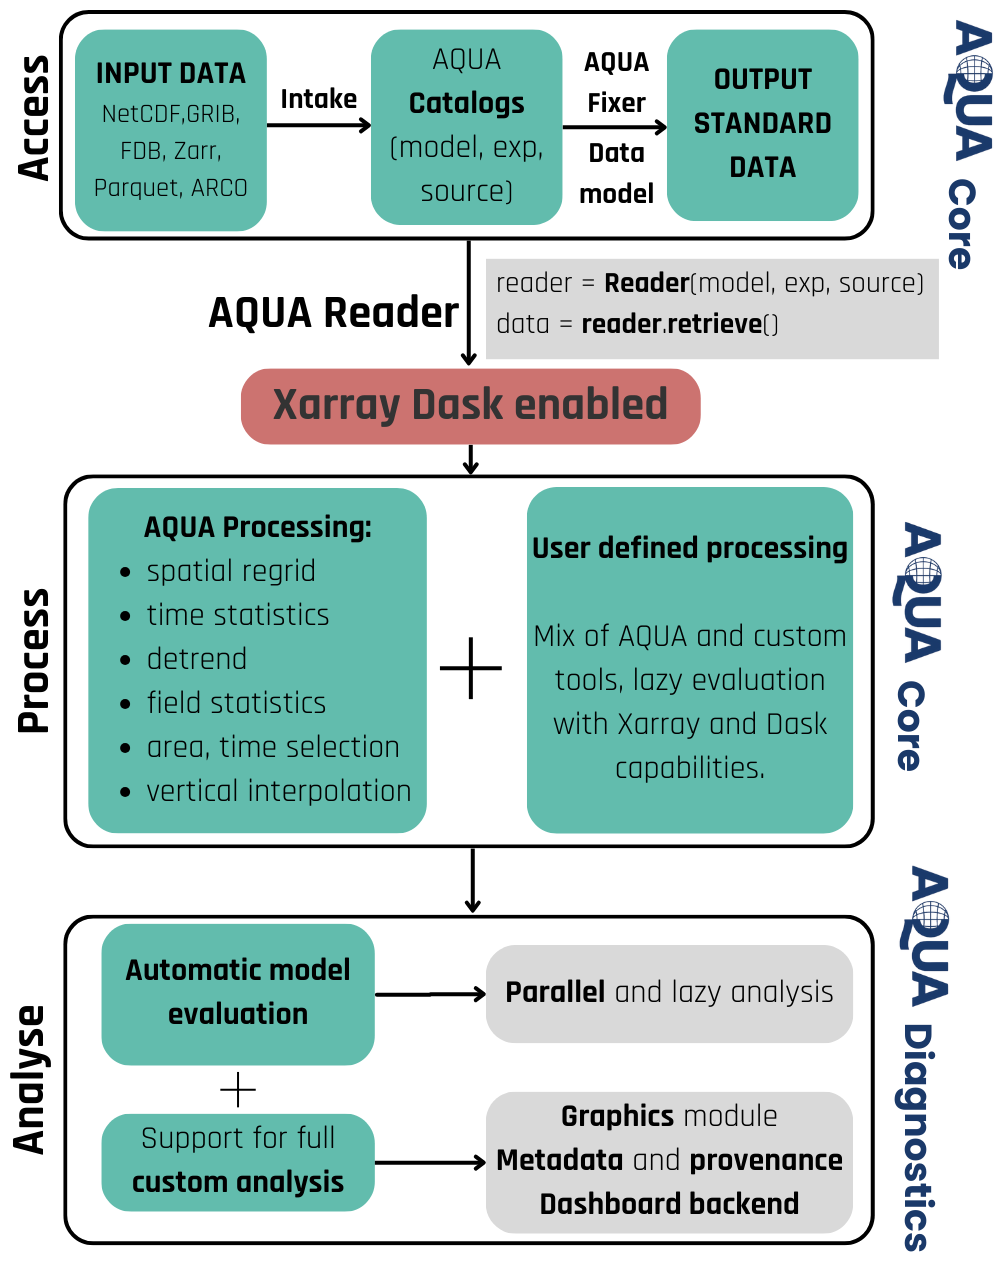
Figure 2Schematic view of the AQUA capabilities. A first block from the top describes the internal flow which gives access to the input data, resulting in a Xarray Dask enabled object. The second block describes the processing tools available in AQUA, which can be applied to the retrieved data and used together with other Xarray compatible tools. The third block describes the integrated analysis capabilities, where access and process of data is integrated in complete diagnostics, providing automatic model evaluation.
The first level of usage is a tool designed to simplify the data retrieval and access in case of complex datasets. This is done with the core class of AQUA, the Reader class, devoted to retrieving the data, irrespective of the data format and complexity. The metadata and the data model are aligned to a desired data standard (WMO GRIB2 as default) respectively by the Fixer and the DataModel classes (see Sect. 3.4), paired with the Reader. The two lines of code in Fig. 2 (grey block) showcase what is required to access an entire simulation (e.g. a 30 years 5 km atmospheric dataset). The output, a lazy Dask-enabled Xarray Dataset can be used for any analysis regardless of the size of data and, if desired, without any further usage of AQUA capabilities.
The second block of Fig. 2 describes the main Xarray-based capabilities of AQUA. More details on these features are described in Sect. 3.
Lastly, the third block presents the analysis done with the integrated diagnostic suite. The current diagnostics suite includes, among others, time series and climatologies analysis, radiation and seaice diagnostics, and ocean analysis of trends and drifts. This block describes how the code can be used in an integrated workflow, where AQUA provides a complete end-to-end solution for the quality assessment of simulation runs: from the catalog generation to producing diagnostic results and finally to the provision of a back-end interface (generating specific JSON/YAML files) to collect and prepare these results for visualization in a dashboard.
In this section we discuss how the design choices described in Sect. 2 are delivered in the actual implementation of the code and which future implementations are planned.
Figure 3 schematizes how the modularity concept introduced in Sect. 2 is implemented in AQUA and how it appears homogeneous for the user. A Catalog, represented on the left side of the image, is the collection of files, based on Intake, which describe the details needed to open a dataset. The Reader class has the main purpose of retrieving the data and enabling other elements that can be then used within the same Reader instance (e.g. the Regridder can be initialized to regrid data to a regular target grid). Indeed, as shown in Fig. 3, such complementary blocks are independent python classes and introduce extra functionalities that can be used individually or through the Reader instance.
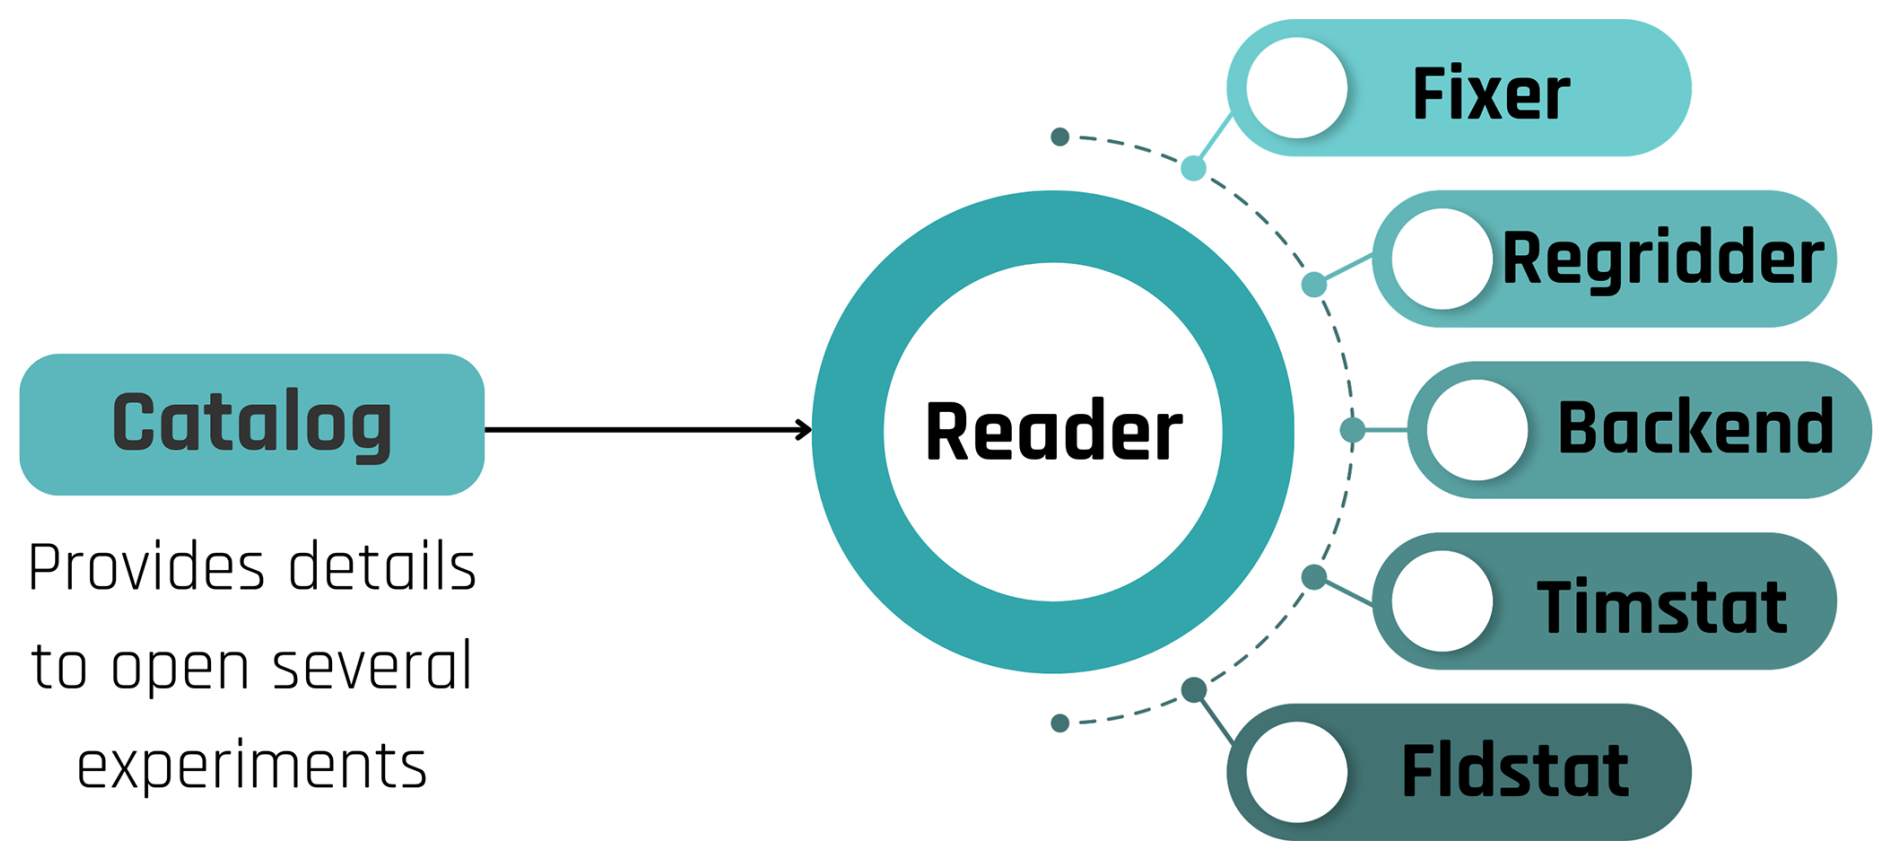
Figure 3A view of the main component of the AQUA framework code. On the left is the Catalog, described in Sect. 3.1, which provides the details to access climate data. On the right is the Reader class. It constitutes the core of the code, where the other classes depicted in this diagram are modular and available inside any Reader initialization if enabled by the user requirements.
The Reader can internally store details on how to initialize the different classes with the metadata provided by the catalog entry, so that no knowledge on the dataset is needed from the final user. All the details (such as how to fix variable metadata or which is the native grid of the dataset) are part of the description of the catalog entry (see Sect. 3.1 for more details). All the modules contain internally the same data provenance approach. Metadata are added as Xarray attributes when relevant and a log of important data manipulation is appended to the global history attribute.
In the following sections we describe the purpose of the main modules of the code, in particular the Reader and its complementary classes depicted in Fig. 3. For a detailed description of all the individual functionalities of the different classes, along with other tools available in the code the documentation is available on ReadTheDocs (https://aqua.readthedocs.io/en/latest/, last access: 17 August 2026).
3.1 Catalog
The Catalog is the structure that allows AQUA to access the data. It includes details on the data format, availability and location, and, most importantly, how to initialize all the complementary components of the Reader. The Catalog relies on Intake (using YAML files) and makes use of the built-in possibility to define additional metadata aimed at enabling different modules on each dataset. This completely shields the final user from the complexity of each dataset and detaches the task of catalog creation and metadata collection from the data analysis, with the possibility to have a dedicated team for the catalog creation or to develop a tool to generate the catalog entry alongside the simulation (as it is done in the current implementation in the ClimateDT project using Jinja2 (https://jinja.palletsprojects.com/en/stable/, last access: 17 August 2026) templates or as it could be done by exploring a STAC (https://stacspec.org/en/, last access: 17 August 2026) catalog, generating the corresponding Intake version). The catalog metadata design prioritizes backward compatibility, ensuring that existing catalog entries remain fully functional even as new features are introduced. Entries lacking the new metadata will simply not support the additional functionalities, but their core behavior will remain unaffected.
The catalog is made by a three-level hierarchy, which defines unique triplets identifying the model, the experiment (exp in the AQUA syntax) and the source (see Fig. 4 for an example and relative Reader initialization to access the dataset). The source includes all the data that can be opened within the same Xarray Dataset.
The hierarchy has been built with the simulation output in mind, but it has been widely used also for the observational dataset utilized by the diagnostics. The catalog also allows multiple ensemble members to be grouped under the same experiment, using Intake's support for extra parameters in catalog entries.
AQUA supports multiple catalogs that can be installed on the same machine (e.g. observations and simulation catalogs for different projects or project phases). The code is designed to scan all the available catalogs in order to match the required triplet if no catalog name is specified by the user. In addition, the same catalog can be used on multiple machines, so that specific datasets as the observations used for the quality assessment can be copied to another HPC and made available to the community with few changes in the catalog configuration files.
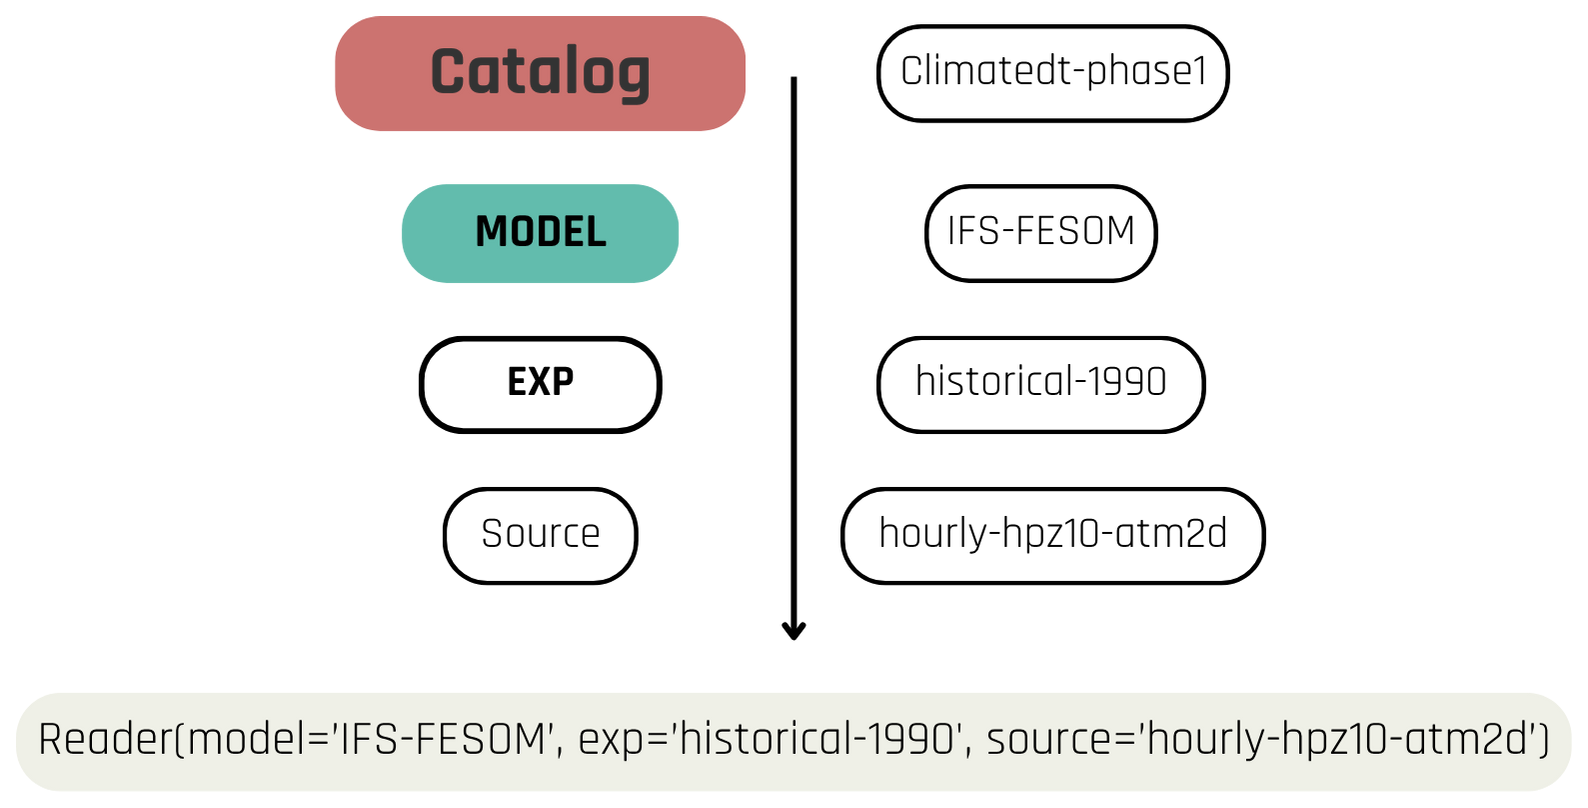
Figure 4Example of an AQUA catalog entry and the hierarchical structure introduced to organize the different datasets. From top to the bottom, different layers of dataset organization are shown. A single catalog is structured as an Intake catalog.
3.2 Deployment and configuration
The code has been deployed and tested on tens of local platforms as well as on several pre-exascale HPCs. The code is available on PyPI and the documentation contains a detailed description of how to install AQUA on different machines (https://aqua.readthedocs.io/en/latest/installation.html, last access: 17 August 2026). Additionally installation tools are provided inside the code repository. The repository contains also the file necessary for the creation of a Conda (https://anaconda.org/anaconda/conda, last access: 17 August 2026) environment, the installation in an already existing python environment and finally for building a Docker (https://www.docker.com/, last access: 17 August 2026) container. A container is automatically built at every new code release and made available through the GitHub container registry (https://github.com/DestinE-Climate-DT/AQUA/pkgs/container/aqua-core, last access: 17 August 2026).
The extra functionalities that are introduced by AQUA require definitions (such as grid structures, conversion rules for metadata etc.) that are stored in YAML files. This allows for a complete description of complex details in human-readable files that do not require final user access, unless small modifications are required. This design choice allows for a strong personalization offered to the user without the need of forcing them to know details of file structures and formats. These files are essential for the correct AQUA usage and their deployment and usage has different layers. Users can install them and ignore their purpose, using the default setting, or they can craft them in order to adapt the code behavior to their requirements.
These files must be installed in a local path by the user, and for this purpose AQUA provides a useful command line entry point aqua, (called aqua console in the rest of the paper) with the purpose of simplifying the installation of the auxiliary files needed by the code. The files are copied in a dedicated folder with the aqua install <machine-name> command. The default choice is to generate a .aqua folder in the user $HOME. However, the customization of the location of this folder is possible and the files can be linked from the source code for development reasons. A config-aqua.yaml file is generated during this operation, where user-dependent settings such as the default plot style can be modified also later on.
After the installation of the configuration files, the code has by design no catalog available. The aqua console gives support to both the installation of the official catalogs available in the Climate-DT-catalog repository (https://github.com/DestinE-Climate-DT/Climate-DT-catalog, last access: 17 August 2026) and the installation of custom catalogs. This latter could be curated by different projects or including different observational datasets. It has to be reminded that catalogs provide only the information to identify and load the data. Underlying data associated with the catalog are not downloaded with the catalog itself, and permission for the data on specific machines or tokens needed to access them, are the responsibility of the user.
The deployment on a new HPC machine or even a local installation is supported by a specific aqua console command to download available grids described in a dedicated section in the documentation (https://aqua.readthedocs.io/en/latest/aqua_console.html#aqua-grids-deploy-grid-name, last access: 17 August 2026. A more sophisticated solution taking care of data version control, using DVC (https://dvc.org/doc, last access: 17 August 2026) software and a dedicated remote backup is currently implemented within the ClimateDT.
3.3 Reader
The Reader provides the details of data access and results in an API which is transparent for the final user despite the different underlying APIs necessary to access the various data formats. It also initializes, if activated, all the other classes which introduce extra processing features on data. The basic API proposed in the Reader follows the same three-level hierarchy that is defined for the catalog (see Sect. 3.1). In order to retrieve a dataset, the user needs to be aware of the model, exp and source triplet. An example of access to ClimateDT data with AQUA is provided in Fig. 4.
Initializing a Reader class will not retrieve in memory any of the available data, but it will prepare everything required by the user for further processing of the requested data. This involves for example weights needed for the regrid or area weighted statistics.
The main method to get access to the data (as Dask Xarray Dataset) is the retrieve method. This method allows the selection of variables, dates or vertical levels to retrieve, since also the simple access to the metadata can be time consuming for some APIs and specification on the subset of data required can be beneficial. The handling of different APIs is internally managed in the Reader through the Backend class, which populate the retrieve method with the correct API's calls. Each instance of the Reader contains specific information to retrieve and process the data specified in the initialization triplet (including information for regridding or metadata transformations). For this reason it is required to initialize multiple instances of the Reader when comparing different datasets, one for each new dataset. As discussed above, this is a specific design choice which was preferred to the creation of new data types to maintain pure Xarray as the base data type in AQUA.
The Reader.retrieve() method can be seen as an extension of the xarray.open_mfdataset() function, where all the native Xarray capabilities are available and allowing, depending on the user needs, to use all the other classes introduced by AQUA, integrated in the Reader instance.
3.4 Fixer and Data Model
A broad range of diverse datasets, in terms of metadata conventions, standards or formats, can be included in catalog entries processed by the Reader. To support this, the code is designed to provide the flexibility to open a wide range of data formats and to normalize coordinates to a common standard. To perform data comparison a shared standard between different dataset can be imposed so that all the output resulting from a Reader call returns the same metadata (for example homogeneous variable names, coordinate names, variable or coordinate units etc.).
To this aim, two classes and respective modules have been developed, integrated in the Reader: the Fixer and the DataModel. The two modules are automatically enabled in any Reader instance, with the possibility to turn them off if the original characteristics of the dataset are preferred.
The DataModel contains a set of methods to identify first the nature of the dataset coordinates (horizontal, vertical or time) and to store additional information such as direction of values, range and units in a python dictionary. This is done by the CoordIdentifier class. After the coordinate identification the CoordTransformer class adapts the detected coordinates to the AQUA standard. As for any other tool in AQUA, the target data model is defined in a human readable YAML file exposed during the code installation (see Sect. 3.2) that can be customized. The DataModel is fundamental to guarantee homogeneous access to the data, allowing post-processing tools to work with the data without duplication of checks or computationally expensive try-except structures. Coordinates name and units are homogenized and area or spatial/time selection can be performed seamlessly on every dataset.
The Fixer module, instead, deals with the variables in a dataset and their metadata. It is applied after the DataModel. The module relies on YAML files and, when a shared standard is the target, on available tables for the metadata conversion. The current Fixer applies WMO GRIB2 standards, and the exact matching of metadata is guaranteed through inspection of eccodes (https://github.com/ecmwf/eccodes, last access: 17 August 2026) tables. Unit conversion is performed through the Metpy (https://github.com/Unidata/MetPy, last access: 17 August 2026) package. The WMO GRIB2 metadata standard has been a decision made in the ClimateDT project because of the alignment with the WMO standard. Together with this metadata standard, the ClimateDT adopted also GRIB as standard output format, due to the necessity to limit the risk of data loss and the self-contained nature of metadata in the GRIB messages.
The Fixer can collect information on how which variables should be translated to which target variable with two complementary python dictionaries.
-
A first dictionary, the so-called convention table, is extracted from a dataset agnostic YAML file, which contains the target variable names towards which the code will convert all the variables and a list of the most common variable names that can be found in a dataset. For the WMO GRIB2 implementation a target WMO GRIB2 code is provided along with the target variable name, so that target metadata can be dynamically extracted from the GRIB tables and nothing remains hard-coded in the convention table. Despite the current choice of the WMO GRIB2 standard for the Fixer within AQUA, the implementation of other conventions and the possibility to translate among different conventions is an ongoing work.
-
A second dictionary, called fixer_name in the catalog entry metadata, contains information more specific to individual models or data portfolio. This can range from the accumulation time for accumulated variables to derived quantities that cannot be generalized in the convention table. It can also override what is contained in the convention table and override metadata read from the data (as the source units) if a wrong encoding was mistakenly done.
In the current implementation the convention table is applied to every dataset where the Fixer is enabled (which is the AQUA default behavior). This enforces the WMO GRIB2 convention to all the data opened by AQUA.
The Fixer structure has been designed to support different convention tables to be applied to the data. Additionally the Fixer can apply some simple preprocessing fix, such as time shift or variable decumulation. These are all options to be specified in the fixer_name.
Finally, methods for correcting coordinates and dimensions are available. These partially overlap with the functionality of the DataModel, but while the DataModel identifies the coordinates' nature based on generic assumptions, the Fixer allows the user to specify source dependent customization of coordinates where the DataModel may fail the automatic identification.
3.5 Regridder
Climate data gridded sources usually come on extremely diverse grids, ranging from regular to curvilinear, to unstructured grids. ClimateDT output is based on HEALpix grids (Gorski et al., 2005), so that a tool able to deal with all these options is of uttermost importance.
The design choice has been to leverage one of the most used, versatile and efficient tools currently available, i.e. the Climate Data Operators (CDO; Schulzweida, 2023) for the generation of regridding weights. Despite CDO providing python bindings (https://code.mpimet.mpg.de/projects/cdo/wiki/Cdo%7Brbpy%7D, last access: 17 August 2026), it bases its architecture on binary calls and on writing output files to disk, which does not integrate with the AQUA Dask-based approach.
For this reason AQUA builds on smmregrid (https://github.com/jhardenberg/smmregrid, last access: 17 August 2026) (Davini et al., 2026), an open source package which provides a sparse matrix operation based on CDO remapping weights in order to guarantee a seamless Dask-enabled experience within Xarray. Furthermore, avoiding the I/O operations directly to disk, regridding operations performed within smmregrid are usually faster than what can be achieved with CDO (see Sect. 4 for more details). With this solution, AQUA can leverage CDO versatility and reliability in producing weights for regridding data, enhance this framework with lazy computation and introduce a framework where future updates from CDO can be integrated in the code pipeline.
A Regridder module and its corresponding class have been developed to collect all information on the source grid of a dataset and organize it in a way that can be ingested by smmregrid to generate the weights required for regridding. Similarly to the modules described above, a set of YAML files describes the different grid properties and metadata within the catalog associates the grid to the dataset to be opened. It is thus possible to define new grids if needed. Most importantly, AQUA checks if the weights have been already evaluated and computes the weights only if they are not available, saving computing time if subsequent calls on the same remapping procedure are required (a common situation). When the Regridder class is initialized, the user can specify (usually this is done at the Reader level) the target grid and the regrid method, using the CDO syntax, so that any grid or method supported by CDO is available.
3.6 FldStat
As introduced in Sect. 3.5, area-weighted statistics are crucial for the analysis of geospatial data. Indeed, climate data usually requires area weighting when doing spatial averages, and on non-regular grid estimating the grid cell weight might be a non-trivial operation. AQUA introduces a FldStat module and class that takes advantage of the information gathered by the Reader during initialization (in synergy with the DataModel). It can use user-provided area files or compute and store them automatically on disk, and reuse them in further computation. Area computation is based on smmregrid, which internally relies on CDO. Similar to the Regridder module, it leverages CDO's flexibility to efficiently compute areas for a wide range of atmospheric and oceanic grids. Building upon this feature, the Fldstat module allows the computation of area-weighted basic statistics (mean, max, min and std).
The FldStat class can be as well individually providing the area files. The description of how to generate the area files is handled by the same YAML files that defined the grid to the Regridder module.
In case the DataModel identifies the longitude and latitudes of a dataset, the module also allows to perform area subsetting on data and eventually evaluate statistics on these sub-regions. An AreaSelection class is available in the same module as independent module and embedded in the FldStat class. The selection can also be done on shapefile, using the syntax of the regionmask (https://regionmask.readthedocs.io/en/stable/, last access: 17 August 2026) Python package.
3.7 TimStat
A module to perform time statistics is available within AQUA. Although time statistics may be a trivial task with Xarray, the introduction of a specific module allows for a list of extra features and automatic verification on data.
The module leverages the Pandas (https://pandas.pydata.org/docs/index.html, last access: 17 August 2026) string frequency definitions and Xarray for the time operations. When the Fixer is applied, AQUA ensure that the time axis is always a datetime64 Pandas object with microseconds precision and a Gregorian calendar. The module includes the possibility to check and exclude values if not all the expected time chunks are available (e.g. if not all daily values from a defined month are available). This allows for an automatic removal of spurious data that could lead to unequal weighting. As for the other methods, data provenance is stored in the Xarray metadata attributes.
3.8 Data Reduction OPerator (DROP)
Dealing with extreme high resolution sometimes requires the creation of intermediate steps to avoid redoing the same computational and memory intensive operation several times: a typical case is the analysis of the global mean temperature of a km-scale hourly dataset. For the same reason, different diagnostics or analyses require the creation of a post-processed intermediate dataset that might have diverse characteristics such as coarser resolution, or an aggregated frequency.
To support users in this task, AQUA provides a data extraction tool, called Data Reduction OPerator (DROP), which leverages the Reader and all the integrated classes to generate in a highly efficient and modular way the required post-processing.
The module consists of an interface where the user can specify the input dataset (expressed as AQUA catalog entry) and the extraction details (such as variables, frequency, target resolution, region selection and statistics to be performed). It can be called with the command aqua drop, part of the aqua console and most of the extraction details can be set both by command line arguments or in a configuration YAML file. The module exploits Dask functionalities as much as possible, supporting parallel and lazy computation. It ensures the completeness of the chunk to be computed, checks the already computed data and produces only the missing ones.
After the data extraction, final data is stored on disk as NetCDF Zip, Zarr or Icechunk (https://github.com/earth-mover/icechunk, last access: 17 August 2026) files, with proper folder structure, filename and metadata for traceability. Finally the module can take care also of the catalog entry generation, which can be later used to access the freshly produced data with the Reader. DROP can be used both to produce a reduced/post-processed dataset to be shared in another machine for further analysis, or simply ingested by other elements of the AQUA processing pipeline.
3.9 Other modules and further functionalities
The AQUA framework contains other tools and utilities widely exploited by the diagnostics or within the Destination Earth workflow (see Sect. 5).
-
Graphical functionalities: Used by the diagnostics in order to have a common appearance and with the possibility to customize in a simple way the styles of all the plots, it leverages Matplotlib (The Matplotlib Development Team (2025), Matplotlib: Visualization with Python (v3.10.1), Zenodo. https://doi.org/10.5281/zenodo.14940554) and Cartopy (https://cartopy.readthedocs.io/stable/, last access: 17 August 2026) libraries. The functions offer a set of personalization with a simple interface and the possibility for the 2d maps to plot with the same tool both regular and HEALPix data, which usually require different plot routines.
-
Accessors (https://docs.xarray.dev/en/latest/internals/extending-xarray.html, last access: 17 August 2026): most of the Reader methods can be used similarly to Xarray methods using a so-called accessor functionality. For example, the FldStat.fldmean() method can be considered. As part of the FldStat module, it performs a weighted field mean on the input dataset. It can be applied to an Xarray object (after first retrieving the data with a Reader instance to initialize the weights) using the following syntax:
data_fldmean = data.aqua.fldmean()
This syntax allows for a seamless inline combination of AQUA and Xarray methods, still keeping the base data object in AQUA a pure Xarray, instead of defining a new datatype with its own methods. -
Catalog generator: the YAML files describing the access to the operational experiment within the ClimateDT project are generated based on a machine readable data portfolio. AQUA contains the code to automatically generate such files, which is exposed through the aqua console.
-
Grids builder: as mentioned in Sect. 3.5, the Regridder can take care of regridding data leveraging on CDO, with the caveat that the grid details (such as the weights file path or other metadata) should be already defined in the YAML file ingested by the Regridder. This is the case for most of the models already tested with AQUA, but for a new model and a new user it can be problematic to get familiar with the procedure needed to add a new grid in AQUA. The Grids builder takes care of this task and tries a set of steps to generate a grid working with the data provided. It is developed in the context of the ClimateDT, but it supports curvilinear, gaussian, regular and HEALpix grids.
-
Histogram: the histogram module is an example of a more complex functionality to be ingested by DROP through its Reader inclusion (Sect. 3.8). It consists of a function, mixing features from different modules (such as time operations and regridding) and providing an evaluation that can be used by a range of different diagnostics.
All the modules responsible for processing data in AQUA make use of Dask to enable lazy out-of-memory computation. This is the prerequisite to be able to process efficiently the high resolution data provided by the ClimateDT models.
We benchmarked the performance of AQUA using Dask with varying workers and data chunking. Two different data accesses used within the ClimateDT context, namely FDB or Polytope (https://destine-data-lake-docs.data.destination-earth.eu, last access: 17 August 2026), are also explored. For all the tests presented in this section the computation combines the time averaging and regridding capabilities, targeting monthly averaged data of a single variable on a regular 1 × 1° grid with NetCDF ZIP files as output. A Dask cluster with a specified number of workers has been set up before the computation and, in order to evaluate possible fluctuations in the execution time, all the setup have been tested with 3 repetitions of the same computation. The times presented here are averaged on the number of repetitions and comprehensive of data access, data process and I/O operation to save the NetCDF results.
All the benchmarks have been run on ClimateDT data, in particular on the IFS-NEMO storylines setup (John et al., 2024). These simulations are stored, in the highest resolution, as hourly atmospheric data at HEALPix zoom 9, corresponding to an horizontal resolution of roughly 10 km. The tests have been run on Lumi HPC, where access to the same data with FDB access directly from the machine and Polytope access to the DataLake have been exploited to have a comparison of the effectiveness of the different engine to access data. All the tests have been run with 128 GB of available memory and 4 months of data to process.
Figure 5 shows the results for the scaling of the code. The left panel shows how the mean total execution time behave while increasing the chunk size at different worker numbers. Chunk size ranges from 3 h to weekly, where the daily chunk size is the default chunk size set in the experiment catalog entry. It is possible to see in all the worker numbers chosen that increasing the chunk size decrease the mean execution time. However, when both the chunk size and the worker numbers are high, the memory per worker available can saturate. This is particularly visible for the 32 workers line, where from 6 h chunk size to the daily one the speedup is less evident due to the lack of available memory. The right panel shows the code's strong scaling. Different lines for different chunks size are shown at increasing workers number. The y-axis represents the normalized speedup, where each line is normalized its single thread execution (with 1 workers number). A dotted line representing the perfect scaling is shown, where a doubling in the worker numbers produces doubling in the normalized speedup. It is evident that a good scaling is achieved for every chunk size. The decrease of the available memory per worker has the effect of worsen the scaling, especially for the daily chunking, in which the 32 workers setup successfully produce the data, but there is no increase from the 16 workers setup. The two panels of Fig. 5 confirm that the code does a reliable use of Dask, where the usage of a computational node can bring big benefits in the data production. At the same time there is evidence that careful management of the balance between chunk size (the Reader allows also for vertical chunking with 3D variables) and worker numbers can further increase the time speed obtained.
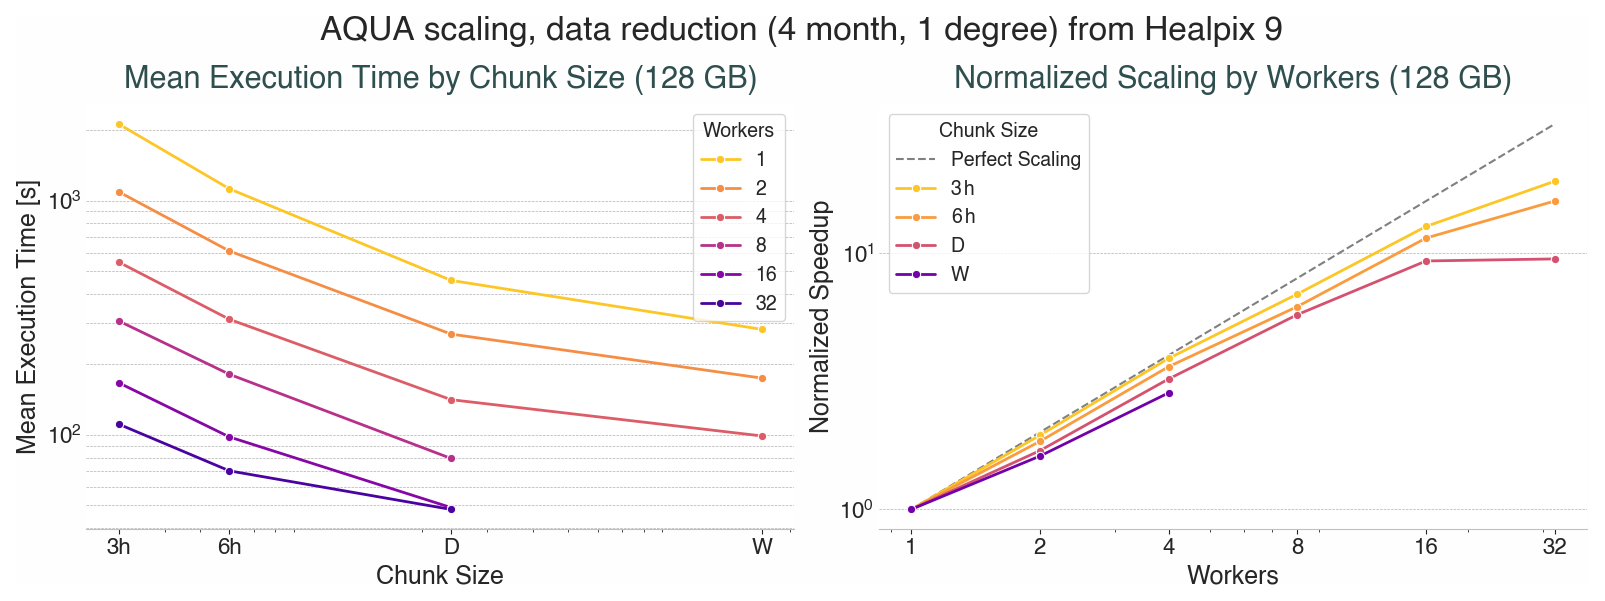
Figure 5Scaling of the AQUA core functionalities. Both the panels refer to a data reduction setup as described in Sect. 4. The left panel represents the mean total execution time for different worker numbers at different Dask chunk sizes, ranging from 3 h to weekly chunk size. The right panel represent the strong scaling. Different lines for different chunk sizes are shown with an increasing number of workers used, from single thread to 32 workers. The y-axis represents the normalized speedup, whereas the baseline for the normalization is the serial execution of the respective chunk size. The dotted line represents the perfect scaling, where doubling the number of workers doubles the speedup.
In addition to Fig. 5, a preliminary comparison between access to data on a local FDB and remote access with the Polytope engine has been produced. While the local FDB is restricted to member of the ClimateDT development, the Polytope access is available for any user with upgraded access to the DESP. We used the same experiment of the previous setup, producing only 1 month of data with weekly chunking and 8 workers. The Polytope engine resulted roughly three to four times slower than the direct FDB access (153 against 44 s) and less permissive in the time chunking (tests with daily chunking did not succeed with Polytope). It should be noted that Polytope is also sensitive to bandwidth, as it is based on remote access, while with the local FDB access data are retrieved directly from the same machine where the computation is performed.
We finally exploited the possibility to test the performances of smmregrid (Davini et al., 2026) presented in Sect. 3.5, both embedded within AQUA and with explicit calls to smmregrid code. The same experiment has accessed to test the data, using only one month of data. However a month of data for a single 2D variable has been stored as NetCDF on disk, to allow a comparison between AQUA, smmregrid and CDO, our baseline for the time comparison, which requires data on disk as input. The computation has been run with a fixed amount of allocated memory (128 GB), with an increasing number of Dask workers, ranging from 1 to 32, with daily chunking and with 10 repetitions for each setup. CDO has been run only in serial mode, despite being possible to be compiled with openMP in order to enable parallel computation: indeed, its role in this comparison is to represent a baseline to compare against the speedup of the different configurations. The regridding has been performed with the three setups with the regridding weights already computed. Results of this test are represented in Fig. 6. The CDO baseline is represented as an horizontal dashed red line. All the values are plotted as speedup with respect to this baseline so that values below 1 represent a slowdown while above 1 a speedup. It is possible to see that smmregrid alone is faster than CDO already with the single worker and the scaling is quite consistent up to 8 workers. With a higher number of workers the scaling degrades and no further speedup is seen, possibly due to limitation in memory. AQUA shows a consistent overhead with respect to smmregrid alone and only above 8 workers the execution time is faster than CDO. This is somehow expected by the additional overhead by AQUA (metadata check and fixes, grid recognition from data), but degrading quite substantially the speed of the computation. A detailed profiling of AQUA during this test is beyond the purpose of this paper, but is under investigation in order to enhance the efficiency of the code.
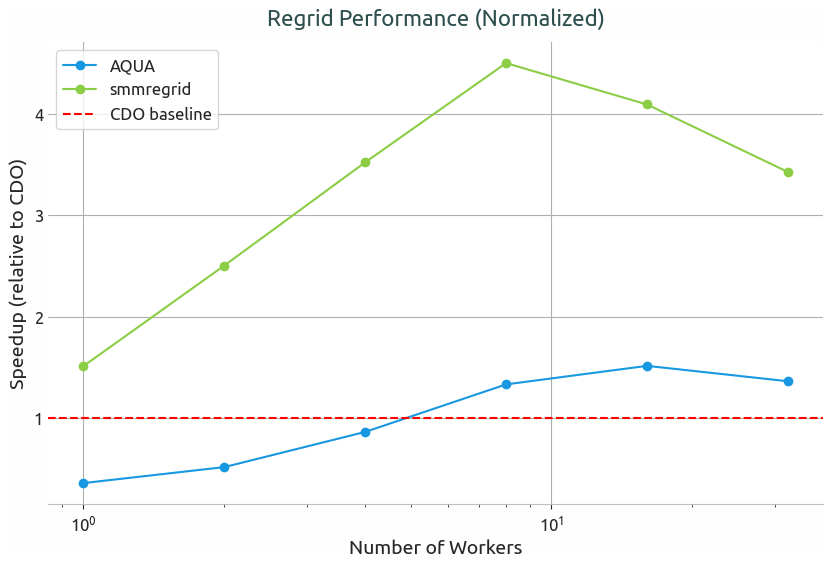
Figure 6Strong scaling for the regrid operation done with AQUA (blue line, embedding smmregrid package for the regrid) and smmregrid alone (green line), with daily chunking and various number of workers. Times are normalized with respect to the same operation done with serial 1-core CDO and represented as speedup with respect to the baseline, which is represented as a dashed red line.
The benchmarks presented in this section highlight the capability of AQUA to exploit memory and core available in HPCs. A more careful exploration of the chunk impact may be beneficial in order to achieve better performance and being able to correctly set the most efficient chunk configuration depending on the workers and memory setup.
As already mentioned, AQUA has been developed in the framework of the European initiative Destination Earth for the Climate Change Adaptation Digital Twin (Wedi et al., 2025; Doblas-Reyes et al., 2026). Among the goals of the project, there is the operationalization of climate simulations at km-scale horizontal resolution. Three different coupled models (ICON, Hohenegger et al., 2023; IFS-NEMO and IFS-FESOM, Rackow et al., 2025) are run in two of the most powerful pre-exascale HPC available in Europe (Lumi and Mare Nostrum 5) making use of an end-to-end workflow (Doblas-Reyes et al., 2026). From the simulation initialization to the output of the analysis performed by AQUA or other components, all the tasks are executed with an orchestration of jobs and dependencies handled by the Autosubmit workflow manager (Manubens-Gil et al., 2016).
In the end-to-end workflow AQUA is responsible for the online monitoring of the simulation. The results produced within the workflow are then stored and displayed on the ClimateDT internal dashboard and published in the ClimateDT evaluation chart (https://climatedt-evaluation-charts.destine.eu/, last access: 17 August 2026). To achieve this, AQUA performs multiple steps inside the ClimateDT workflow.
When the simulation starts, the catalog entry is automatically generated based on the simulation details. This is achieved by using the catalog generator available in the aqua console (see Sect. 3.9).
Most of the analysis is then performed on a coarser dataset generated from the original data (reduced from hourly or daily data at 5–10 km to monthly data at 1 °). The dataset generation is achieved using the DROP capabilities (see Sect. 3.8) so that every time a new month of data is available, a new month of reduced data is produced. The product of this data reduction is called Low Resolution Archive (LRA). The LRA is stored so that the analysis can be produced even if the simulation is streamed, meaning that the original data are stored on the HPC only for a short time-window and moved or deleted after AQUA used them. When the post-processed archive is produced, an analysis job is launched. All the diagnostics are executed within a single job, where the individual diagnostics run in parallel and a common Dask cluster can be opened in order to exploit the memory available in the node. A different distribution of Dask workers can be set in order to give more resources to diagnostics that may need more (e.g. diagnostics dealing with 3D data). Finally the results are stored in a S3 bucket, together with YAML files describing their metadata. This constitutes the back-end of the ClimateDT dashboard, allowing the users to have an overview of the monitoring of the simulation almost in real time.
The LRA and analysis generation are triggered by the workflow once a new month of simulation is available, but other frequencies may be set. Additionally both the steps are failure proof: if a LRA or analysis job fails, the following one will generate the missing data or reproduce the failed figures.
A novelty and challenge of the ClimateDT is how the produced data are stored. The data are saved as GRIB2 files and stored in a FDB (Smart et al., 2017) developed by ECMWF. Each HPC machine has a local FDB. Due to limitation in the long term storage of data on these machines, data is moved to a Data Bridge, which will connect to the common Data Lake, accessible through the DESP as described in the Data Lake documentation (https://destine-data-lake-docs.data.destination-earth.eu/en/latest/introduction/introduction.html, last access: 17 August 2026). AQUA offers an interface for this data as well, both through the local Data Bridge and the DESP access (using Polytope access). Additionally, AQUA integration into the workflow allows for the simulation monitoring also when not all the data are available on the HPC. Given the potential changes in variables, frequency, or resolution, it is foreseeable that storing the entire simulation on the HPC may become impractical, with older data being either deleted or retained in a reduced format. In this context, AQUA will preserve the LRA and will extend it with the new available data, enabling continuous online monitoring of the simulation under such constraints.
The code is currently used in the operational setup of the ClimateDT, having a target version for each cycle deployment which will be supported during the operation cycle. At the same time the code development will continue, with new features and improvements that will be made available for the new cycle. As such, AQUA will be able to integrate feedback from the operational cycles and input from the climate community in any new cycle, with the immediate application of any new feature or diagnostic to the km-scale simulations that will be run in the ClimateDT operational cycles.
The advancement of Earth System Models, while opening new scientific frontiers, presents substantial challenges in terms of data management, access, and analysis. AQUA is a tool born exactly to face such challenges. It has been developed within the Climate Change Adaptation Digital Twin of the Destination Earth initiative, with the ambition to simplify and unify the processing of heavy and heterogeneous climate model outputs. Designed to handle Petabyte-scale datasets produced at high spatial and temporal resolutions, it provides a robust, modular, and efficient framework that leverages widely adopted technologies in the Python climate data science ecosystem, such as Xarray, Dask, CDO and Intake. The software introduced in this paper is already effectively an essential part of the operational workflow of the ClimateDT. However, many features or improvements are under continuous development. In addition, due to the open source nature code, AQUA is now ready to receive feedback from the climate community in order to be effective for all the projects that can benefit from its usage, and might pave the way for future extension of the software capabilities.
Ongoing development is focused on extending AQUA to facilitate comparisons between ClimateDT simulations, other km-scale simulations, and datasets from the CMIP and Coordinated Regional Climate Downscaling Experiment (CORDEX; Jacob et al., 2013) projects. This is achieved by exploiting AQUA's capabilities to harmonize heterogeneous datasets into a common metadata and data model, enabling consistent analyses across different modelling frameworks.
Beyond the ClimateDT project, the wider climate modelling community could benefit from adopting AQUA during model development. AQUA can be integrated into the simulation workflow to monitor model performance after each run without requiring immediate compliance with a specific metadata convention. Instead, metadata harmonization can be deferred to later stages of the development process, reducing the initial burden while still enabling standardized analyses.
Concerning the core capabilities of AQUA, a better understanding of the computational efficiency of the different data formats for different tasks (e.g. local timeseries extraction, global high-resolution evaluations) will allow for a more systematic study of the impact of the data chunking and more structured benchmark tests. This may be beneficial and it could lead to a set of suggested chunking depending on the computation and data format, simplifying the amount of technical knowledge needed by the final user to achieve efficient and scalable computations. Parallel to this, such a study could help understanding the best format to store simulation results based on the expected user most common data usage. A detailed profiling of the different components of the classes which are used by the Reader may be highly beneficial to reduce possible inefficiency of the code and to speed it up. Additionally, data provenance, though currently deferred following broader discussions within the DestinE project, remains a strategic goal. Provenance tracking is essential to ensure reproducibility and transparency in large-scale automated evaluations.
The DROP tool (see Sect. 3.8) is becoming a central component of the AQUA data analysis pipeline, as it enables systematic data reduction that is essential when working with km-scale simulations. To further increase the flexibility of DROP, planned extensions include the ingestion of user-defined functions, allowing the computation of complex functions that cannot be expressed solely through the existing Reader methods.
Looking ahead, several enhancements are already under development. Ensemble support in the monitoring is being strengthened, particularly in anticipation of forthcoming high-resolution ensemble simulations within ClimateDT, where the ensemble support is a key target for the upcoming operational cycles. Enhanced tools for trend analysis and Empirical Orthogonal Functions will further expand the toolkit on which the diagnostics can build. Integration of the Fixer with CMOR standards and a possible interface with WMO GRIB2 convention remains a key objective, enabling seamless comparison between model outputs, operational datasets and enabling possible comparisons and collaborations with the CMIP communities. Furthermore, enhancing AQUA capability toward regional climate models as the ones from CORDEX would allow for further comparison between km-scale integrations.
A more robust support for on-the-fly evaluation and reduction of data can be a necessary paradigm shift, replacing the traditional post-processing pipeline. It is foreseeable that, particularly for simulations with both high spatial resolution and sub-hourly temporal frequency, storing the entire output of an experiment will become impractical even on state-of-the-art HPC systems, requiring embedded streaming analysis.
AQUA is conceived not as a monolithic solution, but as a community-facing platform: open-source, extensible, and developed under a funded and sustained project infrastructure. Its goal is to facilitate the comparison of simulations and observations while promoting inter-operability and collaboration across the climate modeling community. Building on the rich ecosystem of existing community-driven climate analysis tools, AQUA contributes a flexible infrastructure designed to address the challenges posed by the increasing volume, heterogeneity, and complexity of modern climate datasets. We hope that the design principles adopted in AQUA, homogeneity, efficiency, modularity and flexibility, will prove useful for future developments in climate data analysis software.
The source code for the AQUA package v1.0.0 implementation, with DOI https://doi.org/10.5281/zenodo.21640464 (Nurisso et al., 2026), can be found at https://github.com/DestinE-Climate-DT/AQUA (last access: 17 August 2026) and is licensed under the Apache License, version 2.0. The code and accompanying results to produce Figs. 5 and 6 can be found at https://github.com/koldunovn/high_res_data_access (last access: 17 August 2026) with DOI https://doi.org/10.5281/zenodo.21905343 (Nurisso and Koldunov, 2026). Access to the high-resolution data necessary for the production of Figs. 5 and 6 can be obtained by accessing ClimateDT generation 1 data DOI https://doi.org/10.21957/d3f982672e (ECMWF and Climate DT consortium, 2024) following Polytope documentation https://destine-data-lake-docs.data.destination-earth.eu/en/latest/dedl-discovery-and-data-access/Polytope/Polytope.html (last access: 17 August 2026).
JH, MN, NK, NN, SC, PD contributed to conceptualization; JH, MN, NK, PD contributed to the code benchmark, MN, PD contributed to the visualization, JH, MC, MN, SC, ET, PD contributed to writing the original draft. All the authors contributed to the software. All authors read, reviewed and approved the final manuscript.
The contact author has declared that none of the authors has any competing interests.
Views and opinions expressed are those of the author(s) only and do not necessarily reflect those of the European Union or the European Commission. Neither the European Union nor the European Commission can be held responsible for them.
Publisher's note: Copernicus Publications remains neutral with regard to jurisdictional claims made in the text, published maps, institutional affiliations, or any other geographical representation in this paper. The authors bear the ultimate responsibility for providing appropriate place names. Views expressed in the text are those of the authors and do not necessarily reflect the views of the publisher.
The authors would like to thank all their colleagues of the different participating institutes listed at https://destine.ecmwf.int/provider/climate-adaptation-digital-twin/ (last access: 17 August 2026) and from ECMWF for the fruitful collaboration in the project. We thank the anonymous referees for their constructive comments and suggestions, which helped improve the manuscript.
The work presented in this paper has been produced in the context of the European Union's Destination Earth Initiative and relates to tasks entrusted by the European Union to the European Centre for Medium-Range Weather Forecasts implementing part of this Initiative with funding by European Union. We acknowledge the EuroHPC Joint Undertaking (JU) for awarding this project access to the EuroHPC supercomputer LUMI and MareNostrum5 through a EuroHPC JU Special Access call.
This paper was edited by Martina Stockhause and reviewed by two anonymous referees.
Acosta, M. C., Palomas, S., Paronuzzi Ticco, S. V., Utrera, G., Biercamp, J., Bretonniere, P.-A., Budich, R., Castrillo, M., Caubel, A., Doblas-Reyes, F., Epicoco, I., Fladrich, U., Joussaume, S., Kumar Gupta, A., Lawrence, B., Le Sager, P., Lister, G., Moine, M.-P., Rioual, J.-C., Valcke, S., Zadeh, N., and Balaji, V.: The computational and energy cost of simulation and storage for climate science: lessons from CMIP6, Geosci. Model Dev., 17, 3081–3098, https://doi.org/10.5194/gmd-17-3081-2024, 2024. a
Bauer, P., Dueben, P. D., Hoefler, T., Quintino, T., Schulthess, T. C., and Wedi, N. P.: The digital revolution of Earth-system science, Nature Computational Science, 1, 104–113, https://doi.org/10.1038/s43588-021-00023-0, 2021. a, b
Bishnoi, A., Stein, O., Meyer, C. I., Redler, R., Eicker, N., Haak, H., Hoffmann, L., Klocke, D., Kornblueh, L., and Suarez, E.: Earth system modeling on modular supercomputing architecture: coupled atmosphere–ocean simulations with ICON 2.6.6-rc, Geosci. Model Dev., 17, 261–273, https://doi.org/10.5194/gmd-17-261-2024, 2024. a
Cinquini, L., Crichton, D., Mattmann, C., Harney, J., Shipman, G., Wang, F., Ananthakrishnan, R., Miller, N., Denvil, S., Morgan, M., Pobre, Z., Bell, G. M., Doutriaux, C., Drach, R., Williams, D., Kershaw, P., Pascoe, S., Gonzalez, E., Fiore, S., and Schweitzer, R.: The Earth System Grid Federation: An open infrastructure for access to distributed geospatial data, Future Gener. Comp. Sy., 36, 400–417, https://doi.org/10.1016/j.future.2013.07.002, 2014. a, b
Czaja, A., Frankignoul, C., Minobe, S., and Vannière, B.: Simulating the Midlatitude Atmospheric Circulation: What Might We Gain From High-Resolution Modeling of Air-Sea Interactions?, Current Climate Change Reports, 5, 390–406, https://doi.org/10.1007/s40641-019-00148-5, 2019. a
Dask Development Team: Dask: Library for dynamic task scheduling, http://dask.pydata.org (last access: 17 August 2026), 2016. a
Davini, P., von Hardenberg, J., Nurisso, M., Tovazzi, E., and Wales, S.: smmregrid, Zenodo [code], https://doi.org/10.5281/zenodo.15553576, 2026. a, b
Doblas-Reyes, F. J., Kontkanen, J., Sandu, I., Acosta, M., Al Turjmam, M. H., Alsina-Ferrer, I., Andrés-Martínez, M., Anerdi, C., Arriola, L., Axness, M., Batlle Martín, M., Bauer, P., Becker, T., Beltrán, D., Beyer, S., Bockelmann, H., Bretonnière, P.-A., Cabaniols, S., Caprioli, S., Castrillo, M., Chandrasekar, A., Cheedela, S., Correal, V., Danovaro, E., Davini, P., Enkovaara, J., Frauen, C., Früh, B., Gaya Àvila, A., Ghinassi, P., Ghosh, R., Ghosh, S., González, I., Grayson, K., Griffith, M., Hadade, I., Haine, C., Hartick, C., Haus, U.-U., Hearne, S., Järvinen, H., Jiménez, B., John, A., Juchem, M., Jung, T., Kegel, J., Kelbling, M., Keller, K., Kinoshita, B., Kiszler, T., Klocke, D., Kluft, L., Koldunov, N., Kölling, T., Kolstela, J., Kornblueh, L., Kosukhin, S., Lacima-Nadolnik, A., Leal Rojas, J. J., Lehtiranta, J., Lunttila, T., Luoma, A., Manninen, P., Medvedev, A., Milinski, S., Mohammed, A., Müller, S., Naryanappa, D., Nazarova, N., Niemelä, S., Niraula, B., Nortamo, H., Nummelin, A., Nurisso, M., Ortega, P., Paronuzzi, S., Pedruzo-Bagazgoitia, X., Pelletier, C., Peña, C., Polade, S., Pradhan, H. K., Quintanilla, R., Quintino, T., Rackow, T., Räisänen, J., Rajput, M. M., Redler, R., Reuter, B., Rocha Monteiro, N., Roura-Adserias, F., Ruppert, S., Sayed, S., Schnur, R., Sharma, T., Sidorenko, D., Sievi-Korte, O., Soret, A., Steger, C., Stevens, B., Streffing, J., Sunny, J., Tenorio, L., Thober, S., Tigerstedt, U., Tinto, O., Tonttila, J., Tuomenvirta, H., Tuppi, L., Van Thielen, G., Vitali, E., von Hardenberg, J., Wagner, I., Wedi, N., Wehner, J., Willner, S., Yepes-Arbós, X., Ziemen, F., and Zimmermann, J.: The Destination Earth digital twin for climate change adaptation, Geosci. Model Dev., 19, 2821–2848, https://doi.org/10.5194/gmd-19-2821-2026, 2026. a, b, c, d, e
Dunne, J. P., Hewitt, H. T., Arblaster, J. M., Bonou, F., Boucher, O., Cavazos, T., Dingley, B., Durack, P. J., Hassler, B., Juckes, M., Miyakawa, T., Mizielinski, M., Naik, V., Nicholls, Z., O'Rourke, E., Pincus, R., Sanderson, B. M., Simpson, I. R., and Taylor, K. E.: An evolving Coupled Model Intercomparison Project phase 7 (CMIP7) and Fast Track in support of future climate assessment, Geosci. Model Dev., 18, 6671–6700, https://doi.org/10.5194/gmd-18-6671-2025, 2025. a
ECMWF and Climate DT consortium (led by CSC): Destination Earth Digital Twin for Climate Change Adaptation (DestinE Climate DT V1), ECMWF [data set], https://doi.org/10.21957/d3f982672e, 2024. a
Eyring, V., Bock, L., Lauer, A., Righi, M., Schlund, M., Andela, B., Arnone, E., Bellprat, O., Brötz, B., Caron, L.-P., Carvalhais, N., Cionni, I., Cortesi, N., Crezee, B., Davin, E. L., Davini, P., Debeire, K., de Mora, L., Deser, C., Docquier, D., Earnshaw, P., Ehbrecht, C., Gier, B. K., Gonzalez-Reviriego, N., Goodman, P., Hagemann, S., Hardiman, S., Hassler, B., Hunter, A., Kadow, C., Kindermann, S., Koirala, S., Koldunov, N., Lejeune, Q., Lembo, V., Lovato, T., Lucarini, V., Massonnet, F., Müller, B., Pandde, A., Pérez-Zanón, N., Phillips, A., Predoi, V., Russell, J., Sellar, A., Serva, F., Stacke, T., Swaminathan, R., Torralba, V., Vegas-Regidor, J., von Hardenberg, J., Weigel, K., and Zimmermann, K.: Earth System Model Evaluation Tool (ESMValTool) v2.0 – an extended set of large-scale diagnostics for quasi-operational and comprehensive evaluation of Earth system models in CMIP, Geosci. Model Dev., 13, 3383–3438, https://doi.org/10.5194/gmd-13-3383-2020, 2020. a
Fuhrer, O., Chadha, T., Hoefler, T., Kwasniewski, G., Lapillonne, X., Leutwyler, D., Lüthi, D., Osuna, C., Schär, C., Schulthess, T. C., and Vogt, H.: Near-global climate simulation at 1 km resolution: establishing a performance baseline on 4888 GPUs with COSMO 5.0, Geosci. Model Dev., 11, 1665–1681, https://doi.org/10.5194/gmd-11-1665-2018, 2018. a
Gorski, K. M., Hivon, E., Banday, A. J., Wandelt, B. D., Hansen, F. K., Reinecke, M., and Bartelmann, M.: HEALPix: A Framework for High‐Resolution Discretization and Fast Analysis of Data Distributed on the Sphere, The Astrophysical Journal, 622, 759–771, https://doi.org/10.1086/427976, 2005. a
Hoffman, F. M., Hassler, B., Swaminathan, R., Lewis, J., Andela, B., Collier, N., Hegedűs, D., Lee, J., Pascoe, C., Pflüger, M., Stockhause, M., Ullrich, P., Xu, M., Bock, L., Chun, F., Gier, B. K., Kelley, D. I., Lauer, A., Lenhardt, J., Schlund, M., Sreeush, M. G., Weigel, K., Blockley, E., Beadling, R., Beucher, R., Dugassa, D. D., Lembo, V., Lu, J., Brands, S., Tjiputra, J., Malinina, E., Medeiros, B., Scoccimarro, E., Walton, J., Kershaw, P., Lanfer Marquez, A., Roberts, M. J., O'Rourke, E., Dingley, B., Turner, B., Hewitt, H., and Dunne, J. P.: Rapid Evaluation Framework for the CMIP7 Assessment Fast Track, Geosci. Model Dev., 19, 7415–7455, https://doi.org/10.5194/gmd-19-7415-2026, 2026. a
Hoffmann, J., Bauer, P., Sandu, I., Wedi, N., Geenen, T., and Thiemert, D.: Destination Earth – A digital twin in support of climate services, Climate Services, 30, 100394, https://doi.org/10.1016/j.cliser.2023.100394, 2023. a
Hohenegger, C., Korn, P., Linardakis, L., Redler, R., Schnur, R., Adamidis, P., Bao, J., Bastin, S., Behravesh, M., Bergemann, M., Biercamp, J., Bockelmann, H., Brokopf, R., Brüggemann, N., Casaroli, L., Chegini, F., Datseris, G., Esch, M., George, G., Giorgetta, M., Gutjahr, O., Haak, H., Hanke, M., Ilyina, T., Jahns, T., Jungclaus, J., Kern, M., Klocke, D., Kluft, L., Kölling, T., Kornblueh, L., Kosukhin, S., Kroll, C., Lee, J., Mauritsen, T., Mehlmann, C., Mieslinger, T., Naumann, A. K., Paccini, L., Peinado, A., Praturi, D. S., Putrasahan, D., Rast, S., Riddick, T., Roeber, N., Schmidt, H., Schulzweida, U., Schütte, F., Segura, H., Shevchenko, R., Singh, V., Specht, M., Stephan, C. C., von Storch, J.-S., Vogel, R., Wengel, C., Winkler, M., Ziemen, F., Marotzke, J., and Stevens, B.: ICON-Sapphire: simulating the components of the Earth system and their interactions at kilometer and subkilometer scales, Geosci. Model Dev., 16, 779–811, https://doi.org/10.5194/gmd-16-779-2023, 2023. a, b
IPCC: Climate Change 2023: Synthesis Report. Contribution of Working Groups I, II and III to the Sixth Assessment Report of the Intergovernmental Panel on Climate Change, IPCC, Geneva, Switzerland, https://doi.org/10.59327/ipcc/ar6-9789291691647, 2023. a
Jacob, D., Petersen, J., Eggert, B., Alias, A., Christensen, O. B., Bouwer, L. M., Braun, A., Colette, A., Déqué, M., Georgievski, G., Georgopoulou, E., Gobiet, A., Menut, L., Nikulin, G., Haensler, A., Hempelmann, N., Jones, C., Keuler, K., Kovats, S., Kröner, N., Kotlarski, S., Kriegsmann, A., Martin, E., van Meijgaard, E., Moseley, C., Pfeifer, S., Preuschmann, S., Radermacher, C., Radtke, K., Rechid, D., Rounsevell, M., Samuelsson, P., Somot, S., Soussana, J.-F., Teichmann, C., Valentini, R., Vautard, R., Weber, B., and Yiou, P.: EURO-CORDEX: new high-resolution climate change projections for European impact research, Reg. Environ. Change, 14, 563–578, https://doi.org/10.1007/s10113-013-0499-2, 2013. a
John, A., Beyer, S., Athanase, M., Benítez, A. S., Goessling, H., Hossain, A., Nurisso, M., Aguridan, R., Andrés-Martínez, M., Gaya-Àvila, A., Cheedela, S. K., Geier, P., Ghosh, R., Hadade, I., Koldunov, N. V., Pedruzo-Bagazgoitia, X., Rackow, T., Sandu, I., Sidorenko, D., Streffing, J., Vitali, E., and Jung, T.: Global Storyline Simulations at the Kilometre-scale, ESS Open Archive [preprint], https://doi.org/10.22541/essoar.173160166.64258929/v1, 2024. a
Judt, F., Klocke, D., Rios-Berrios, R., Vanniere, B., Ziemen, F., Auger, L., Biercamp, J., Bretherton, C., Chen, X., Düben, P., Hohenegger, C., Khairoutdinov, M., Kodama, C., Kornblueh, L., Lin, S.-J., Nakano, M., Neumann, P., Putman, W., Röber, N., Roberts, M., Satoh, M., Shibuya, R., Stevens, B., Vidale, P. L., Wedi, N., and Zhou, L.: Tropical Cyclones in Global Storm-Resolving Models, J. Meteorol. Soc. Jpn., 99, 579–602, https://doi.org/10.2151/jmsj.2021-029, 2021. a
Lauer, A., Bock, L., Hassler, B., Jöckel, P., Ruhe, L., and Schlund, M.: Monitoring and benchmarking Earth system model simulations with ESMValTool v2.12.0, Geosci. Model Dev., 18, 1169–1188, https://doi.org/10.5194/gmd-18-1169-2025, 2025. a
Lee, J., Gleckler, P. J., Ahn, M.-S., Ordonez, A., Ullrich, P. A., Sperber, K. R., Taylor, K. E., Planton, Y. Y., Guilyardi, E., Durack, P., Bonfils, C., Zelinka, M. D., Chao, L.-W., Dong, B., Doutriaux, C., Zhang, C., Vo, T., Boutte, J., Wehner, M. F., Pendergrass, A. G., Kim, D., Xue, Z., Wittenberg, A. T., and Krasting, J.: Systematic and objective evaluation of Earth system models: PCMDI Metrics Package (PMP) version 3, Geosci. Model Dev., 17, 3919–3948, https://doi.org/10.5194/gmd-17-3919-2024, 2024. a
Lee, J., Gleckler, P., Ordonez, A., Dong, B., Chang, K., and Ullrich, P.: PCMDI Metrics Package, Zenodo [code], https://doi.org/10.5281/ZENODO.15013367, 2025. a
Leuridan, M., Hawkes, J., Smart, S., Danovaro, E., Schultz, M., and Quintino, T.: Polytope: an algorithm for efficient feature extraction on hypercubes, Journal of Big Data, 12, https://doi.org/10.1186/s40537-025-01306-3, 2025. a
Manubens-Gil, D., Vegas-Regidor, J., Prodhomme, C., Mula-Valls, O., and Doblas-Reyes, F. J.: Seamless management of ensemble climate prediction experiments on HPC platforms, in: 2016 International Conference on High Performance Computing and Simulation (HPCS), 895–900, IEEE, https://doi.org/10.1109/hpcsim.2016.7568429, 2016. a
Mauzey, C., Doutriaux, C., Nadeau, D., Taylor, K. E., Durack, P. J., Betts, E., Cofino, A. S., Florek, P., Hogan, E., Rodriguez Gonzalez, J. M., Kettleborough, J., Nicholls, Z., Ogochi, K., Seddon, J., Wachsmann, F., and Weigel, T.: The Climate Model Output Rewriter (CMOR), Zenodo [code], https://doi.org/10.5281/ZENODO.592733, 2026. a
Moreno-Chamarro, E., Caron, L.-P., Loosveldt Tomas, S., Vegas-Regidor, J., Gutjahr, O., Moine, M.-P., Putrasahan, D., Roberts, C. D., Roberts, M. J., Senan, R., Terray, L., Tourigny, E., and Vidale, P. L.: Impact of increased resolution on long-standing biases in HighResMIP-PRIMAVERA climate models, Geosci. Model Dev., 15, 269–289, https://doi.org/10.5194/gmd-15-269-2022, 2022. a
Nurisso, M. and Koldunov, N.: High resolution data access, Zenodo [code], https://doi.org/10.5281/zenodo.21905343, 2026. a
Nurisso, M., Caprioli, S., Davini, P., von Hardenberg, J., Nazarova, N., Ghosh, S., Ghinassi, P., Cadau, M., Tovazzi, E., Koldunov, N., Rajput, M. M., and Kinoshita, B.: AQUA-core, Zenodo [code], https://doi.org/10.5281/zenodo.21640464, 2026. a
Rackow, T., Pedruzo-Bagazgoitia, X., Becker, T., Milinski, S., Sandu, I., Aguridan, R., Bechtold, P., Beyer, S., Bidlot, J., Boussetta, S., Deconinck, W., Diamantakis, M., Dueben, P., Dutra, E., Forbes, R., Ghosh, R., Goessling, H. F., Hadade, I., Hegewald, J., Jung, T., Keeley, S., Kluft, L., Koldunov, N., Koldunov, A., Kölling, T., Kousal, J., Kühnlein, C., Maciel, P., Mogensen, K., Quintino, T., Polichtchouk, I., Reuter, B., Sármány, D., Scholz, P., Sidorenko, D., Streffing, J., Sützl, B., Takasuka, D., Tietsche, S., Valentini, M., Vannière, B., Wedi, N., Zampieri, L., and Ziemen, F.: Multi-year simulations at kilometre scale with the Integrated Forecasting System coupled to FESOM2.5 and NEMOv3.4, Geosci. Model Dev., 18, 33–69, https://doi.org/10.5194/gmd-18-33-2025, 2025. a, b
Righi, M., Andela, B., Eyring, V., Lauer, A., Predoi, V., Schlund, M., Vegas-Regidor, J., Bock, L., Brötz, B., de Mora, L., Diblen, F., Dreyer, L., Drost, N., Earnshaw, P., Hassler, B., Koldunov, N., Little, B., Loosveldt Tomas, S., and Zimmermann, K.: Earth System Model Evaluation Tool (ESMValTool) v2.0 – technical overview, Geosci. Model Dev., 13, 1179–1199, https://doi.org/10.5194/gmd-13-1179-2020, 2020. a
Roberts, M. J., Camp, J., Seddon, J., Vidale, P. L., Hodges, K., Vanniere, B., Mecking, J., Haarsma, R., Bellucci, A., Scoccimarro, E., Caron, L.-P., Chauvin, F., Terray, L., Valcke, S., Moine, M.-P., Putrasahan, D., Roberts, C., Senan, R., Zarzycki, C., and Ullrich, P.: Impact of Model Resolution on Tropical Cyclone Simulation Using the HighResMIP–PRIMAVERA Multimodel Ensemble, J. Climate, 33, 2557–2583, https://doi.org/10.1175/jcli-d-19-0639.1, 2020. a
Roberts, M. J., Reed, K. A., Bao, Q., Barsugli, J. J., Camargo, S. J., Caron, L.-P., Chang, P., Chen, C.-T., Christensen, H. M., Danabasoglu, G., Frenger, I., Fučkar, N. S., ul Hasson, S., Hewitt, H. T., Huang, H., Kim, D., Kodama, C., Lai, M., Leung, L.-Y. R., Mizuta, R., Nobre, P., Ortega, P., Paquin, D., Roberts, C. D., Scoccimarro, E., Seddon, J., Treguier, A. M., Tu, C.-Y., Ullrich, P. A., Vidale, P. L., Wehner, M. F., Zarzycki, C. M., Zhang, B., Zhang, W., and Zhao, M.: High-Resolution Model Intercomparison Project phase 2 (HighResMIP2) towards CMIP7, Geosci. Model Dev., 18, 1307–1332, https://doi.org/10.5194/gmd-18-1307-2025, 2025. a
Schlund, M., Andela, B., Benke, J., Comer, R., Hassler, B., Hogan, E., Kalverla, P., Lauer, A., Little, B., Loosveldt Tomas, S., Nattino, F., Peglar, P., Predoi, V., Smeets, S., Worsley, S., Yeo, M., and Zimmermann, K.: Advanced climate model evaluation with ESMValTool v2.11.0 using parallel, out-of-core, and distributed computing, Geosci. Model Dev., 18, 4009–4021, https://doi.org/10.5194/gmd-18-4009-2025, 2025. a
Schulzweida, U.: CDO User Guide, Zenodo [code], https://doi.org/10.5281/ZENODO.10020800, 2023. a
Smart, S. D., Quintino, T., and Raoult, B.: A Scalable Object Store for Meteorological and Climate Data, in: Proceedings of the Platform for Advanced Scientific Computing Conference, PASC '17, 1–8, ACM, https://doi.org/10.1145/3093172.3093238, 2017. a, b
Taylor, K. E., Stouffer, R. J., and Meehl, G. A.: An Overview of CMIP5 and the Experiment Design, Bull. Am. Meteorol. Soc., 93, 485–498, https://doi.org/10.1175/bams-d-11-00094.1, 2012. a
Vidale, P. L., Hodges, K., Vannière, B., Davini, P., Roberts, M. J., Strommen, K., Weisheimer, A., Plesca, E., and Corti, S.: Impact of Stochastic Physics and Model Resolution on the Simulation of Tropical Cyclones in Climate GCMs, J. Climate, 34, 4315–4341, https://doi.org/10.1175/jcli-d-20-0507.1, 2021. a
Wedi, N., Bauer, P., Sandu, I., Hoffmann, J., Sheridan, S., Cereceda, R., Quintino, T., Thiemert, D., and Geenen, T.: Destination Earth: High-Performance Computing for Weather and Climate, Computing in Science and Engineering, IEEE, 24, 29–37, https://doi.org/10.1109/mcse.2023.3260519, 2022. a
Wedi, N., Sandu, I., Bauer, P., Acosta, M., Andersen, R. C., Andrae, U., Auger, L., Balsamo, G., Baousis, V., Bennett, V., Bennett, A., Buontempo, C., Bretonnière, P.-A., Capell, R., Castrillo, M., Chantry, M., Chevallier, M., Correa, R., Davini, P., Denby, L., Doblas-Reyes, F., Dueben, P., Fischer, C., Frauen, C., Frogner, I.-L., Früh, B., Gascón, E., Gérard, E., Gorwits, O., Geenen, T., Grayson, K., Guenova-Rubio, N., Hadade, I., von Hardenberg, J., Haus, U.-U., Hawkes, J., Hirtl, M., Hoffmann, J., Horvath, K., Järvinen, H., Jung, T., Kann, A., Klocke, D., Koldunov, N., Kontkanen, J., Sievi-Korte, O., Kristiansen, J., Kuwertz, E., Mäkelä, J., Maljutenko, I., Manninen, P., McKnight, U. S., Milinski, S., Mueller, A., McNally, A., Modigliani, U., Narayanappa, D., Nielsen, K. P., Nipen, T., Nortamo, H., Peuch, V.-H., Polade, S., Quintino, T., Schicker, I., Reuter, B., Smart, S., Sleigh, M., Suttie, M., Termonia, P., Thober, S., Randriamampianina, R., Theeuwes, N., Thiemert, D., Vannière, B., Vannitsem, S., Wittmann, C., Yang, X., Pontaud, M., Stevens, B., and Pappenberger, F.: Implementing digital twin technology of the earth system in Destination Earth, J. Eur. Meteorol. Soc., 3, 100015, https://doi.org/10.1016/j.jemets.2025.100015, 2025. a, b
Zhang, C., Golaz, J.-C., Forsyth, R., Vo, T., Xie, S., Shaheen, Z., Potter, G. L., Asay-Davis, X. S., Zender, C. S., Lin, W., Chen, C.-C., Terai, C. R., Mahajan, S., Zhou, T., Balaguru, K., Tang, Q., Tao, C., Zhang, Y., Emmenegger, T., Burrows, S., and Ullrich, P. A.: The E3SM Diagnostics Package (E3SM Diags v2.7): a Python-based diagnostics package for Earth system model evaluation, Geosci. Model Dev., 15, 9031–9056, https://doi.org/10.5194/gmd-15-9031-2022, 2022. a
Zhang, S., Fu, H., Wu, L., Li, Y., Wang, H., Zeng, Y., Duan, X., Wan, W., Wang, L., Zhuang, Y., Meng, H., Xu, K., Xu, P., Gan, L., Liu, Z., Wu, S., Chen, Y., Yu, H., Shi, S., Wang, L., Xu, S., Xue, W., Liu, W., Guo, Q., Zhang, J., Zhu, G., Tu, Y., Edwards, J., Baker, A., Yong, J., Yuan, M., Yu, Y., Zhang, Q., Liu, Z., Li, M., Jia, D., Yang, G., Wei, Z., Pan, J., Chang, P., Danabasoglu, G., Yeager, S., Rosenbloom, N., and Guo, Y.: Optimizing high-resolution Community Earth System Model on a heterogeneous many-core supercomputing platform, Geosci. Model Dev., 13, 4809–4829, https://doi.org/10.5194/gmd-13-4809-2020, 2020. a