
the Creative Commons Attribution 4.0 License.
the Creative Commons Attribution 4.0 License.
 | 03 Aug 2026
Sensitivity of Arctic mixed-phase cloud simulations to ice microphysical modifications in the WDM6 scheme of WRF (v4.3.1)
Hyun-Joon Sung
Kyo-Sun Lim
Song-You Hong
JiHoon Shin
Baek-Min Kim
Ji-Hun Choi
Arctic mixed-phase clouds (MPCs) remain challenging to represent in atmospheric models, with bulk microphysics schemes typically biased toward either excessive glaciation or inadequate ice formation. This study evaluates the behavior of the Weather Research and Forecasting (WRF) Double-Moment 6-class (WDM6) scheme and its modified version (WDM6_ICE), which incorporates spherical ice shape, constrained nucleation, and prognostic cloud ice number concentration, under Arctic conditions using the Mixed-Phase Arctic Cloud Experiment (M-PACE) case (9–10 October 2004).
WDM6 severely underestimates liquid water through efficient vapor deposition onto bullet-shaped ice. WDM6_ICE exhibits the opposite behavior, maintaining persistent liquid as cloud ice deposition is reduced by about 98 %. The suppressed cloud ice is partially compensated by enhanced snow deposition, resulting in a reduction in total ice water content of about 70 % rather than complete ice elimination. Sensitivity experiments show that ice shape modification is the dominant factor, while nucleation modification alone redistributes ice among hydrometeor categories without reducing total ice content. Comparison with mid-latitude evaluations of the same scheme indicates a regime-dependent response, in which modifications that produce a moderate ice adjustment in mid-latitude cases lead to a more pronounced restructuring of the ice budget under Arctic conditions. Surface energy analysis indicates that balanced phase partitioning is more relevant than liquid water maximization for radiative bias reduction. All configurations underestimate total water path, suggesting that accurate Arctic MPC representation requires coordinated improvements in ice particle properties, ice-nucleating particle recycling, and boundary-layer coupling. These results are based on a single Arctic case and demonstrate a mechanism that remains to be tested across a broader range of conditions.
- Article
(3418 KB) - Full-text XML
-
Supplement
(1978 KB) - BibTeX
- EndNote


The representation of mixed-phase cloud (MPC) processes remains a persistent challenge for cloud microphysics parameterizations. This challenge is particularly evident in the Arctic, where MPCs exhibit remarkable persistence despite the thermodynamic instability associated with the coexistence of supercooled liquid and ice (Morrison et al., 2012, 2020).
Most bulk microphysics schemes produce either excessive ice or excessive liquid under Arctic conditions, rarely achieving the observed balanced mixed-phase state (Klein et al., 2009; Morrison et al., 2009; Possner et al., 2024). These systematic biases reflect fundamental difficulties in parameterizing the competition for water vapor between ice and liquid phases, the coupling between cloud microphysics and boundary-layer turbulence, and the sensitivity of phase partitioning to ice nucleation and growth assumptions (Shupe and Intrieri, 2004; Morrison and Pinto, 2006; Turner et al., 2007)
Among the bulk microphysics schemes available in the Weather Research and Forecasting (WRF) model, the Double-Moment 6-Class (WDM6) scheme (Lim and Hong, 2010) is widely used for cloud and precipitation forecasting. WDM6 diagnoses cloud ice number concentration from ice mixing ratio and assumes bullet-shaped cloud ice with ice nucleation following the Hong et al. (2004). Unlike double-moment schemes such as Morrison et al. (2005) and Thompson et al. (2008) that predict ice number concentration prognostically, the diagnostic treatment in WDM6 creates tight coupling between ice mass and number concentration, preventing independent evolution of particle size distributions. These structural characteristics cause WDM6 to produce more cloud ice than other microphysics schemes in mid-latitude environments (Comin et al., 2018; McMillen and Steenburgh, 2015). In the Arctic, WDM6 shows smaller biases in ice water content (IWC) but significantly underestimates supercooled liquid water (Nam et al., 2024), highlighting the complex regional dependencies in scheme performance.
To improve the ice representation in WDM6, the WDM6_ICE scheme (Park and Lim, 2023) incorporates three key modifications: prognostic cloud ice number concentration, spherical cloud ice shape, and updated ice nucleation parameterizations based on the Cooper (1986) curve with an observationally constrained upper limit (DeMott et al., 2010). WDM6_ICE also includes additional ice-phase processes such as contact freezing, enhanced riming, and secondary ice production via the Hallett–Mossop mechanism. These modifications were developed and validated using mid-latitude precipitation cases over the Korean Peninsula, where they reduced cloud ice mixing ratio and produced mixed improvements in precipitation skill scores (Park and Lim, 2023).
Cloud microphysics parameterizations are typically developed and validated within specific climate regimes. While their overall performance has been evaluated across diverse environments, how individual microphysical modifications respond to fundamentally different environmental conditions has received less attention. Whether microphysical corrections optimized for one regime maintain their physical validity under fundamentally different conditions remains an open question. This concern is particularly relevant for ice microphysics modifications, where the balance between ice and liquid phases depends jointly on the temperature range, aerosol availability, boundary-layer structure, and moisture supply, all of which vary widely across climate regimes. Parameterizations that successfully correct ice overproduction in mid-latitude systems, for example, may produce qualitatively different responses in shallow Arctic stratiform clouds where temperature ranges are narrow, ice-nucleating particle concentrations are low, and boundary-layer coupling plays a dominant role in cloud maintenance (Fridlind et al., 2012; Morrison et al., 2012).
This study evaluates the behavior of WDM6 and WDM6_ICE under Arctic conditions using the Mixed-Phase Arctic Cloud Experiment (M-PACE) case observed on 9–10 October 2004. M-PACE provides a well-documented benchmark for evaluating microphysics schemes in the Arctic, with studies consistently identifying challenges in ice nucleation representation (Fridlind et al., 2007), liquid water maintenance (Klein et al., 2009; Luo et al., 2008), secondary ice production (Possner et al., 2024), and ice shape sensitivity (Ong et al., 2024). The study aims to: (1) evaluate the cloud phase partitioning produced by WDM6 and WDM6_ICE under Arctic conditions; (2) decompose the contributions of ice shape and nucleation modifications to the phase partitioning transition through controlled sensitivity experiments; and (3) elucidate the feedback mechanisms that govern the sensitivity of Arctic cloud phase partitioning to these structural modifications, including the additional effect of prognostic ice number treatment inferred from comparison between WDM6_SP_IN and the full WDM6_ICE scheme. These objectives are pursued through a single, well-documented M-PACE case rather than a multi-case climatology. This case-study design is intended to isolate and mechanistically interpret the microphysical pathways governing phase partitioning under one representative set of Arctic conditions; accordingly, the regime-dependent behavior reported here is presented as a mechanism demonstrated for this case, whose quantitative generality across other Arctic regimes should be tested in future work.
2.1 Case description
The M-PACE campaign was conducted in autumn 2004 to investigate the characteristics and processes of Arctic MPCs. The campaign was based at Utqiagvik (formerly Barrow; Verlinde et al., 2007) and provided extensive observations describing the microphysics, radiative effects, and life cycle of these clouds. The observed clouds were predominantly stratiform MPCs containing both supercooled liquid water and ice (McFarquhar et al., 2007; Shupe et al., 2008). During the analysis period, a single-layer MPC embedded in the boundary layer was observed over the study region.
ECMWF Reanalysis 5 (ERA5) at 00:00 UTC 9 October 2004 shows a strong low-pressure system near the Bering Sea coast of southern Alaska (Fig. 1a). This system interacted with a high-pressure region extending from the Chukchi Sea toward Alaska, creating a pronounced pressure gradient over the study region. The synoptic configuration drove cold air (below −6 °C) from the pack ice southward over the relatively warm open ocean (above 0 °C), establishing a strong temperature gradient. The high-pressure system formed over the pack ice on 4 October and persisted until 15 October, maintaining this advection pattern. As the sea ice edge advanced southward, the cooled air reached the Alaskan coast, triggering roll-cloud formation visible in satellite imagery (Fig. 1b). Detailed synoptic-scale characteristics for this period are described in Solomon et al. (2009) and Verlinde et al. (2007).
This case has been studied extensively since the GCSS/ARM single-layer model intercomparison of Klein et al. (2009), through subsequent large-eddy, cloud-resolving, and mesoscale studies (Solomon et al., 2009; Fu et al., 2019). Its single-layer, well-mixed boundary-layer structure under steady cold-air-outbreak flow makes it particularly suitable for isolating the individual effects of ice-shape and nucleation modifications, by minimizing the multi-layer and strong-synoptic-forcing interactions that would otherwise confound the attribution of microphysical sensitivities. The extensive observational record additionally supplies a comprehensive in-situ and surface dataset for quantitative constraint of the simulations. The observed cloud is a persistent, liquid-dominated single-layer mixed-phase cloud in which the liquid water path greatly exceeds the ice water path, reflecting a supercooled-liquid-dominated structure (Klein et al., 2009; McFarquhar et al., 2007). This case is therefore treated as one well-characterized example of an Arctic mixed-phase regime rather than as representative of the full range of Arctic conditions, and the results are accordingly interpreted as a case study.
2.2 Data
This study uses aircraft measurements and surface-based observational datasets to evaluate simulations of Arctic MPCs.
Aircraft observations were obtained from the M-PACE campaign. Specifically, this study analyzes measurements from Flight 10a, conducted on 10 October 2004. While the flight track extended along the northern coast of Alaska (Fig. S1 in the Supplement), the analysis focuses on the segment collected between 01:10-02:00 UTC over Utqiagvik (Barrow; BAR), consistent with Fu et al. (2019).
These aircraft observations provide a comprehensive in situ microphysics dataset (McFarquhar et al., 2007) containing quality-controlled estimates of IWC, liquid water content (LWC), effective radius, and number concentration for both liquid and ice phases. McFarquhar et al. (2007) reported that the observed ice particles included a variety of habits such as columns, plates, bullet rosettes, and heavily rimed particles, with graupel also present particularly near cloud base. The observed IWC and number concentration represent the combined contribution from all ice-phase particles, as aircraft probes measure a continuous size distribution without distinguishing model-specific hydrometeor categories.
Surface measurements at BAR were derived from the Department of Energy (DOE) Atmospheric Radiation Measurement (ARM) North Slope of Alaska (NSA) facility. To characterize atmospheric and cloud properties, the following ARM data products were utilized: ARM Best Estimate Atmospheric Measurements (ARMBEATM) for 2 m air temperature (T2M), Microwave Radiometer Retrievals (MWRRET) for liquid water path (LWP), and Quality Controlled Radiation (QCRAD) value-added product for surface radiative fluxes (downward shortwave radiation, SWDOWN; downward longwave radiation, LWDOWN), Ice water path (IWP) was obtained from the multisensor Arctic Cloud Radiative Effects Dataset (ACRED). Additionally, radiosonde profiles at BAR were used to evaluate the vertical thermodynamic and moisture structure of ERA5 boundary conditions (Fig. S5).
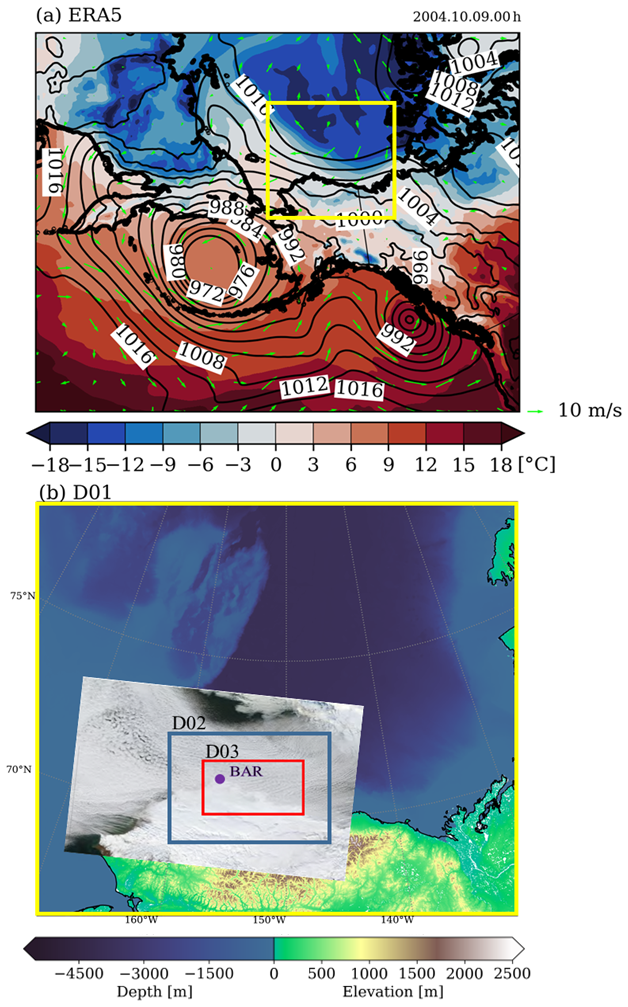
Figure 1(a) ERA5 data showing sea level pressure (contours), 2 m temperature (shading), and 10 m wind (vectors) at 00:00 UTC 9 October 2004. The yellow box indicates the WRF model domain (D01). (b) Nested model domains with D01 (18 km resolution), D02 (6 km resolution), and D03 (1-km resolution). Ocean depth and land elevation are shaded using the GEBCO_2023 grid (color bar at bottom), overlaid with the MODIS visible image at 00:00 UTC 9 October 2004 over the Arctic Ocean and northern Alaska. The location of Utqiagvik (Barrow; BAR) is marked.
2.3 Experimental setup
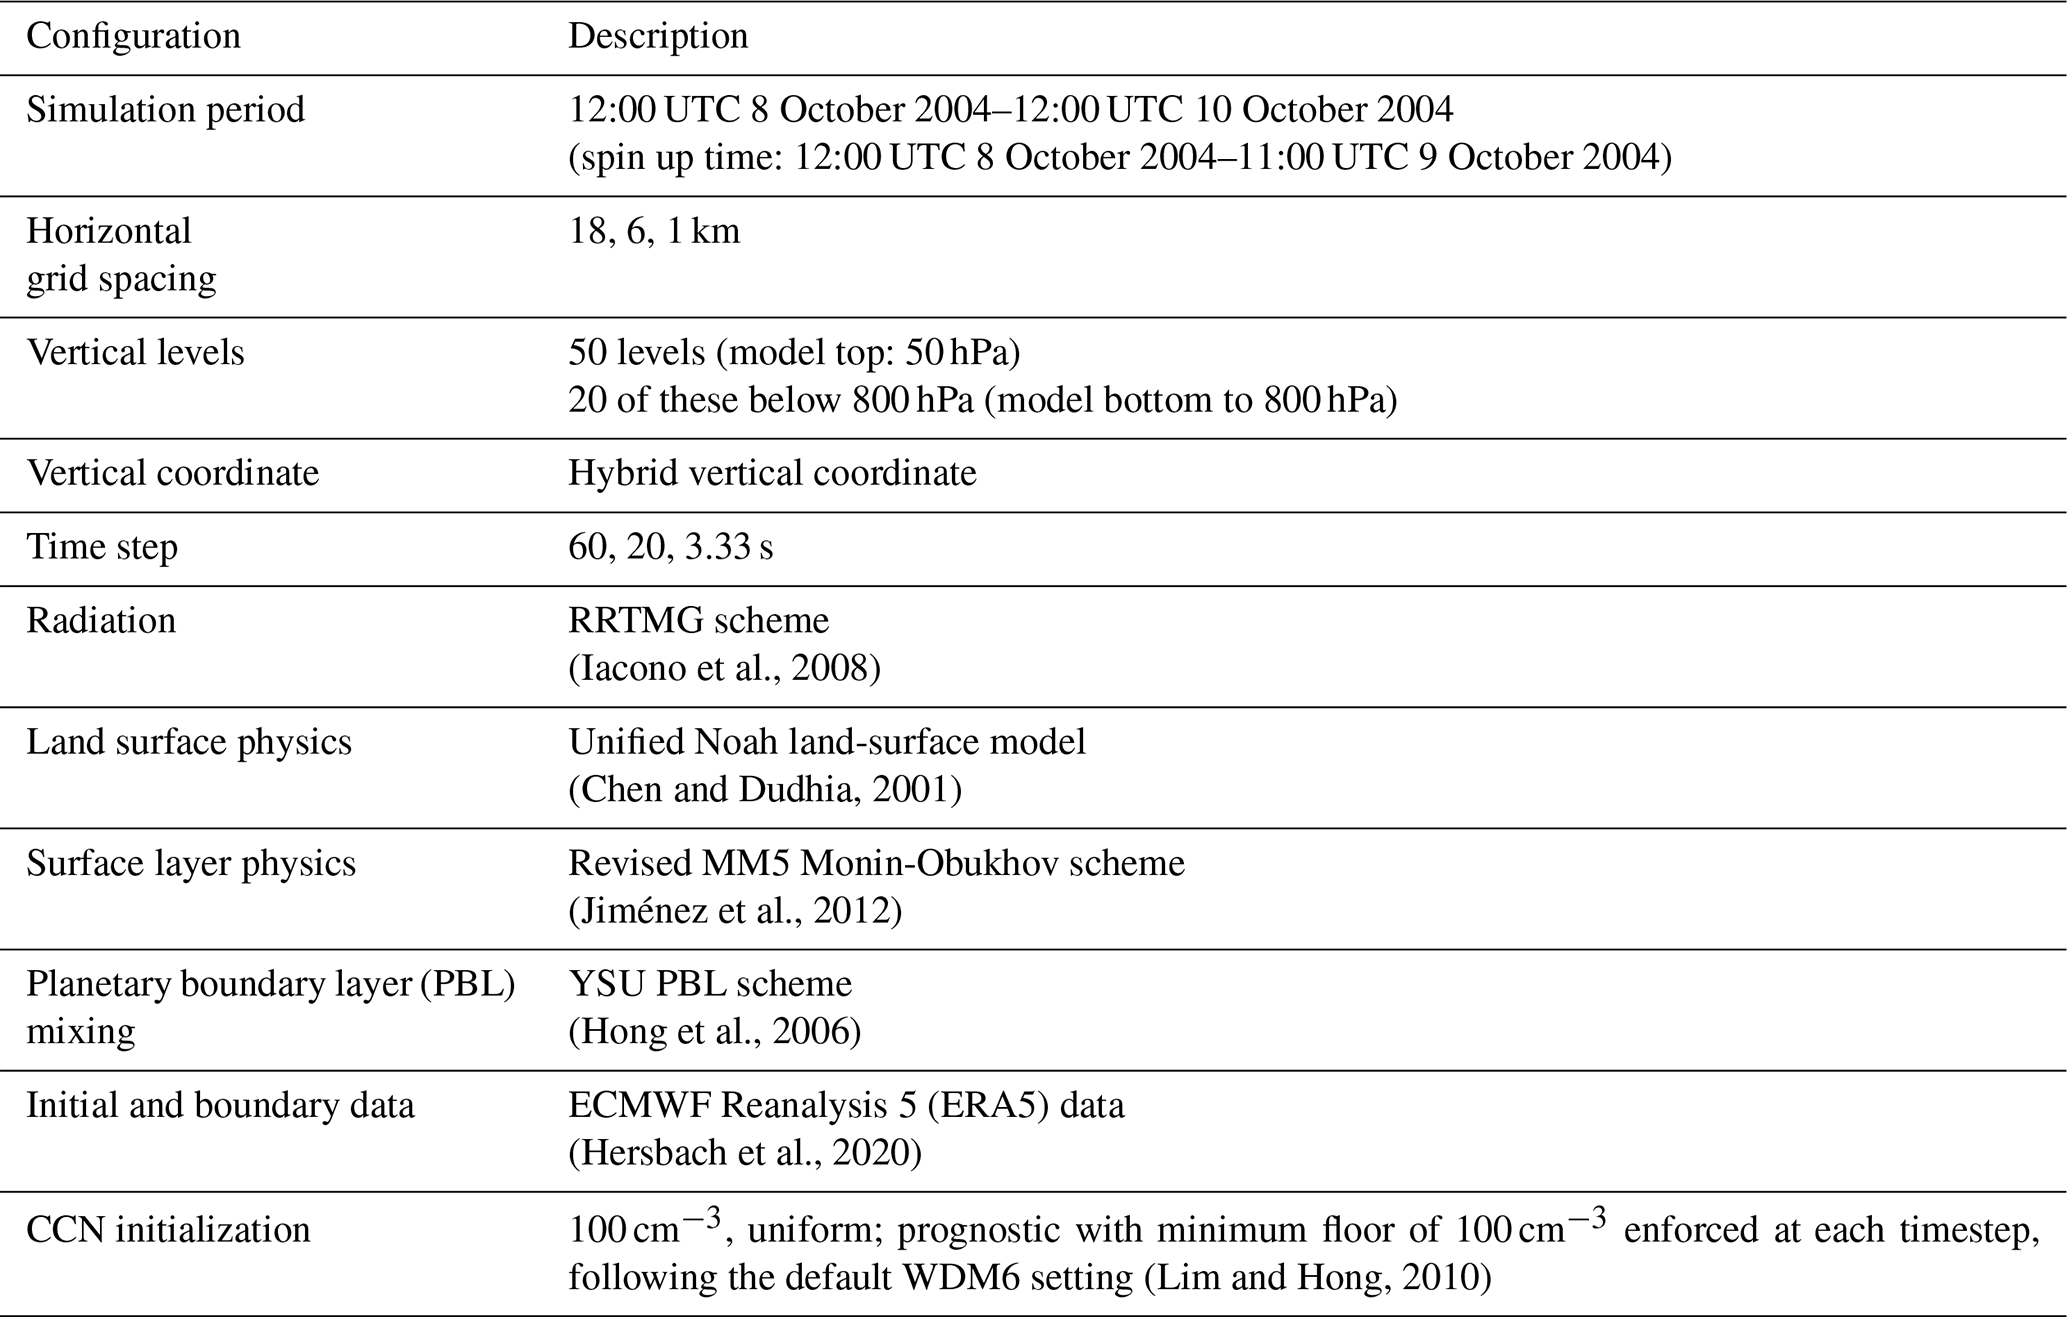
The simulations were performed using the WRF model version 4.3.1 (Skamarock et al., 2021). The model integrated for the period 8–10 October 2004 to simulate the M-PACE case, with the initial 24 hours serving as a spin-up period to establish stable atmospheric conditions independent of initial conditions. The analysis focused on the subsequent 24 h period (12:00 UTC 9 October–11:00 UTC 10 October 2004). The horizontal grid spacing for the domains is set at 18, 6, and 1 km, following the configuration of Solomon et al. (2009). Initial and boundary conditions were obtained from ERA5 data (Hersbach et al., 2020). The vertical grid consists of 50 levels in total, of which 20 are located below 800 hPa with enhanced boundary layer resolution (Table 1).
Table 1Description of the WRF configuration used in the model experiments.
Model outputs were extracted using two distinct approaches for validation. For surface-based validation, the WRF tslist utility was used to extract data at the grid point nearest to the BAR observation site, ensuring spatial consistency with ground measurements. For comparison with aircraft observations, the model fields were sampled to match the aircraft sampling. During the analysis window, the UND Citation flew repeated vertical spirals over a confined area near BAR (McFarquhar et al., 2007), so the observed profile represents a time-averaged sounding over a small horizontal area rather than a long horizontal transect. The model fields were therefore averaged over the D03 grid cells crossed by the flight track and over the 01:00 and 02:00 UTC outputs that bracket the analysis window. Following Solomon et al. (2009), model IWC is calculated as the sum of cloud ice (qi), snow (qs), and graupel (qg) mixing ratios to ensure consistency with aircraft observations, which measure the total ice-phase size distribution without distinguishing model-specific hydrometeor categories.
The WDM6 (Lim and Hong, 2010) and WDM6_ICE (Park and Lim, 2023) microphysics schemes served as the primary comparison pair. WDM6_ICE incorporates spherical ice shape, modified ice nucleation, and prognostic cloud ice number concentration. It also includes additional ice-enhancing processes such as contact freezing (Cotton et al., 1986), enhanced riming efficiency (Pruppacher and Klett, 2010), and secondary ice production via the Hallett–Mossop mechanism (Hallett and Mossop, 1974).
Three additional sensitivity experiments were designed to decompose the individual and combined effects of ice shape and nucleation modifications (Table 2). Since the WDM6_ICE scheme incorporates multiple processes alongside structural changes, this study isolates the two factors most directly responsible for constraining ice growth, ice particle shape and INP availability. The spherical ice shape is one of the structural choices of the WDM6_ICE scheme rather than an assumption introduced here, and although the observed ice particles during M-PACE included a variety of non-spherical habits (McFarquhar et al., 2007), these experiments are designed to isolate its effect on phase partitioning rather than to evaluate the physical realism of the spherical assumption. Secondary ice production and other ice-multiplying mechanisms were excluded from the sensitivity decomposition to avoid compensating interactions that would obscure the primary drivers of phase partitioning changes. The complete microphysical formulation of WDM6_ICE is documented in Park and Lim (2023), with key modifications summarized in Appendix A.
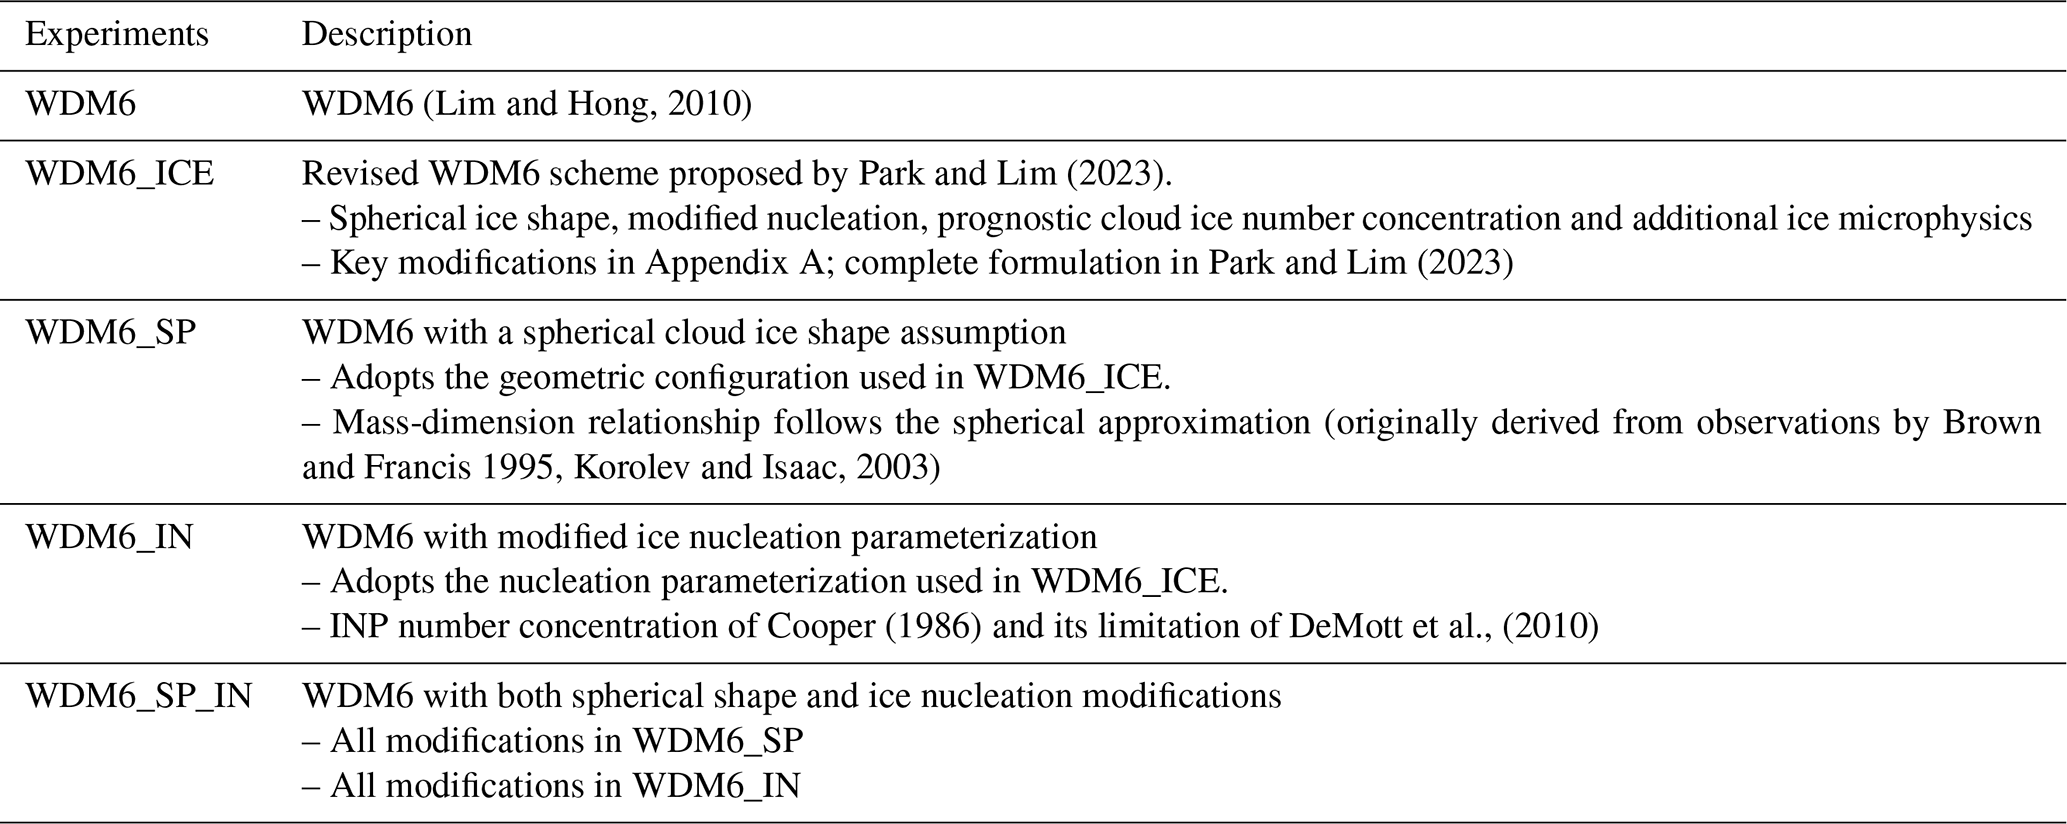
WDM6_SP isolates the impact of cloud ice shape. The spherical assumption implies a higher effective density compared to the bullet shape in WDM6. For a given ice mass, this results in a smaller effective diameter and capacitance, which reduces the vapor depositional growth rate (Pruppacher and Klett, 2010). WDM6_IN isolates the impact of ice nucleation. The default parameterization in WDM6 (Hong et al., 2004) diagnoses INP number concentration as an exponential function of temperature. WDM6_IN adopts the Cooper curve (Cooper, 1986) with an upper limit of 500 L−1 (DeMott et al., 2010), which restricts INP number concentration at temperatures warmer than about −22 °C relative to WDM6. WDM6_SP_IN combines both modifications to examine potential non-linear interactions between particle growth efficiency and number concentration constraints. Since WDM6_SP_IN and WDM6_ICE share the same ice shape and nucleation formulations but differ in ice number treatment (diagnostic vs. prognostic) and in the inclusion of additional processes (contact freezing, Hallett–Mossop mechanism, and temperature threshold for vapor deposition nucleation; see Appendix A3), their comparison provides an indication of how these remaining structural differences affect the overall phase partitioning.
3.1 Spatial and Vertical Cloud Structure in WDM6 and WDM6_ICE
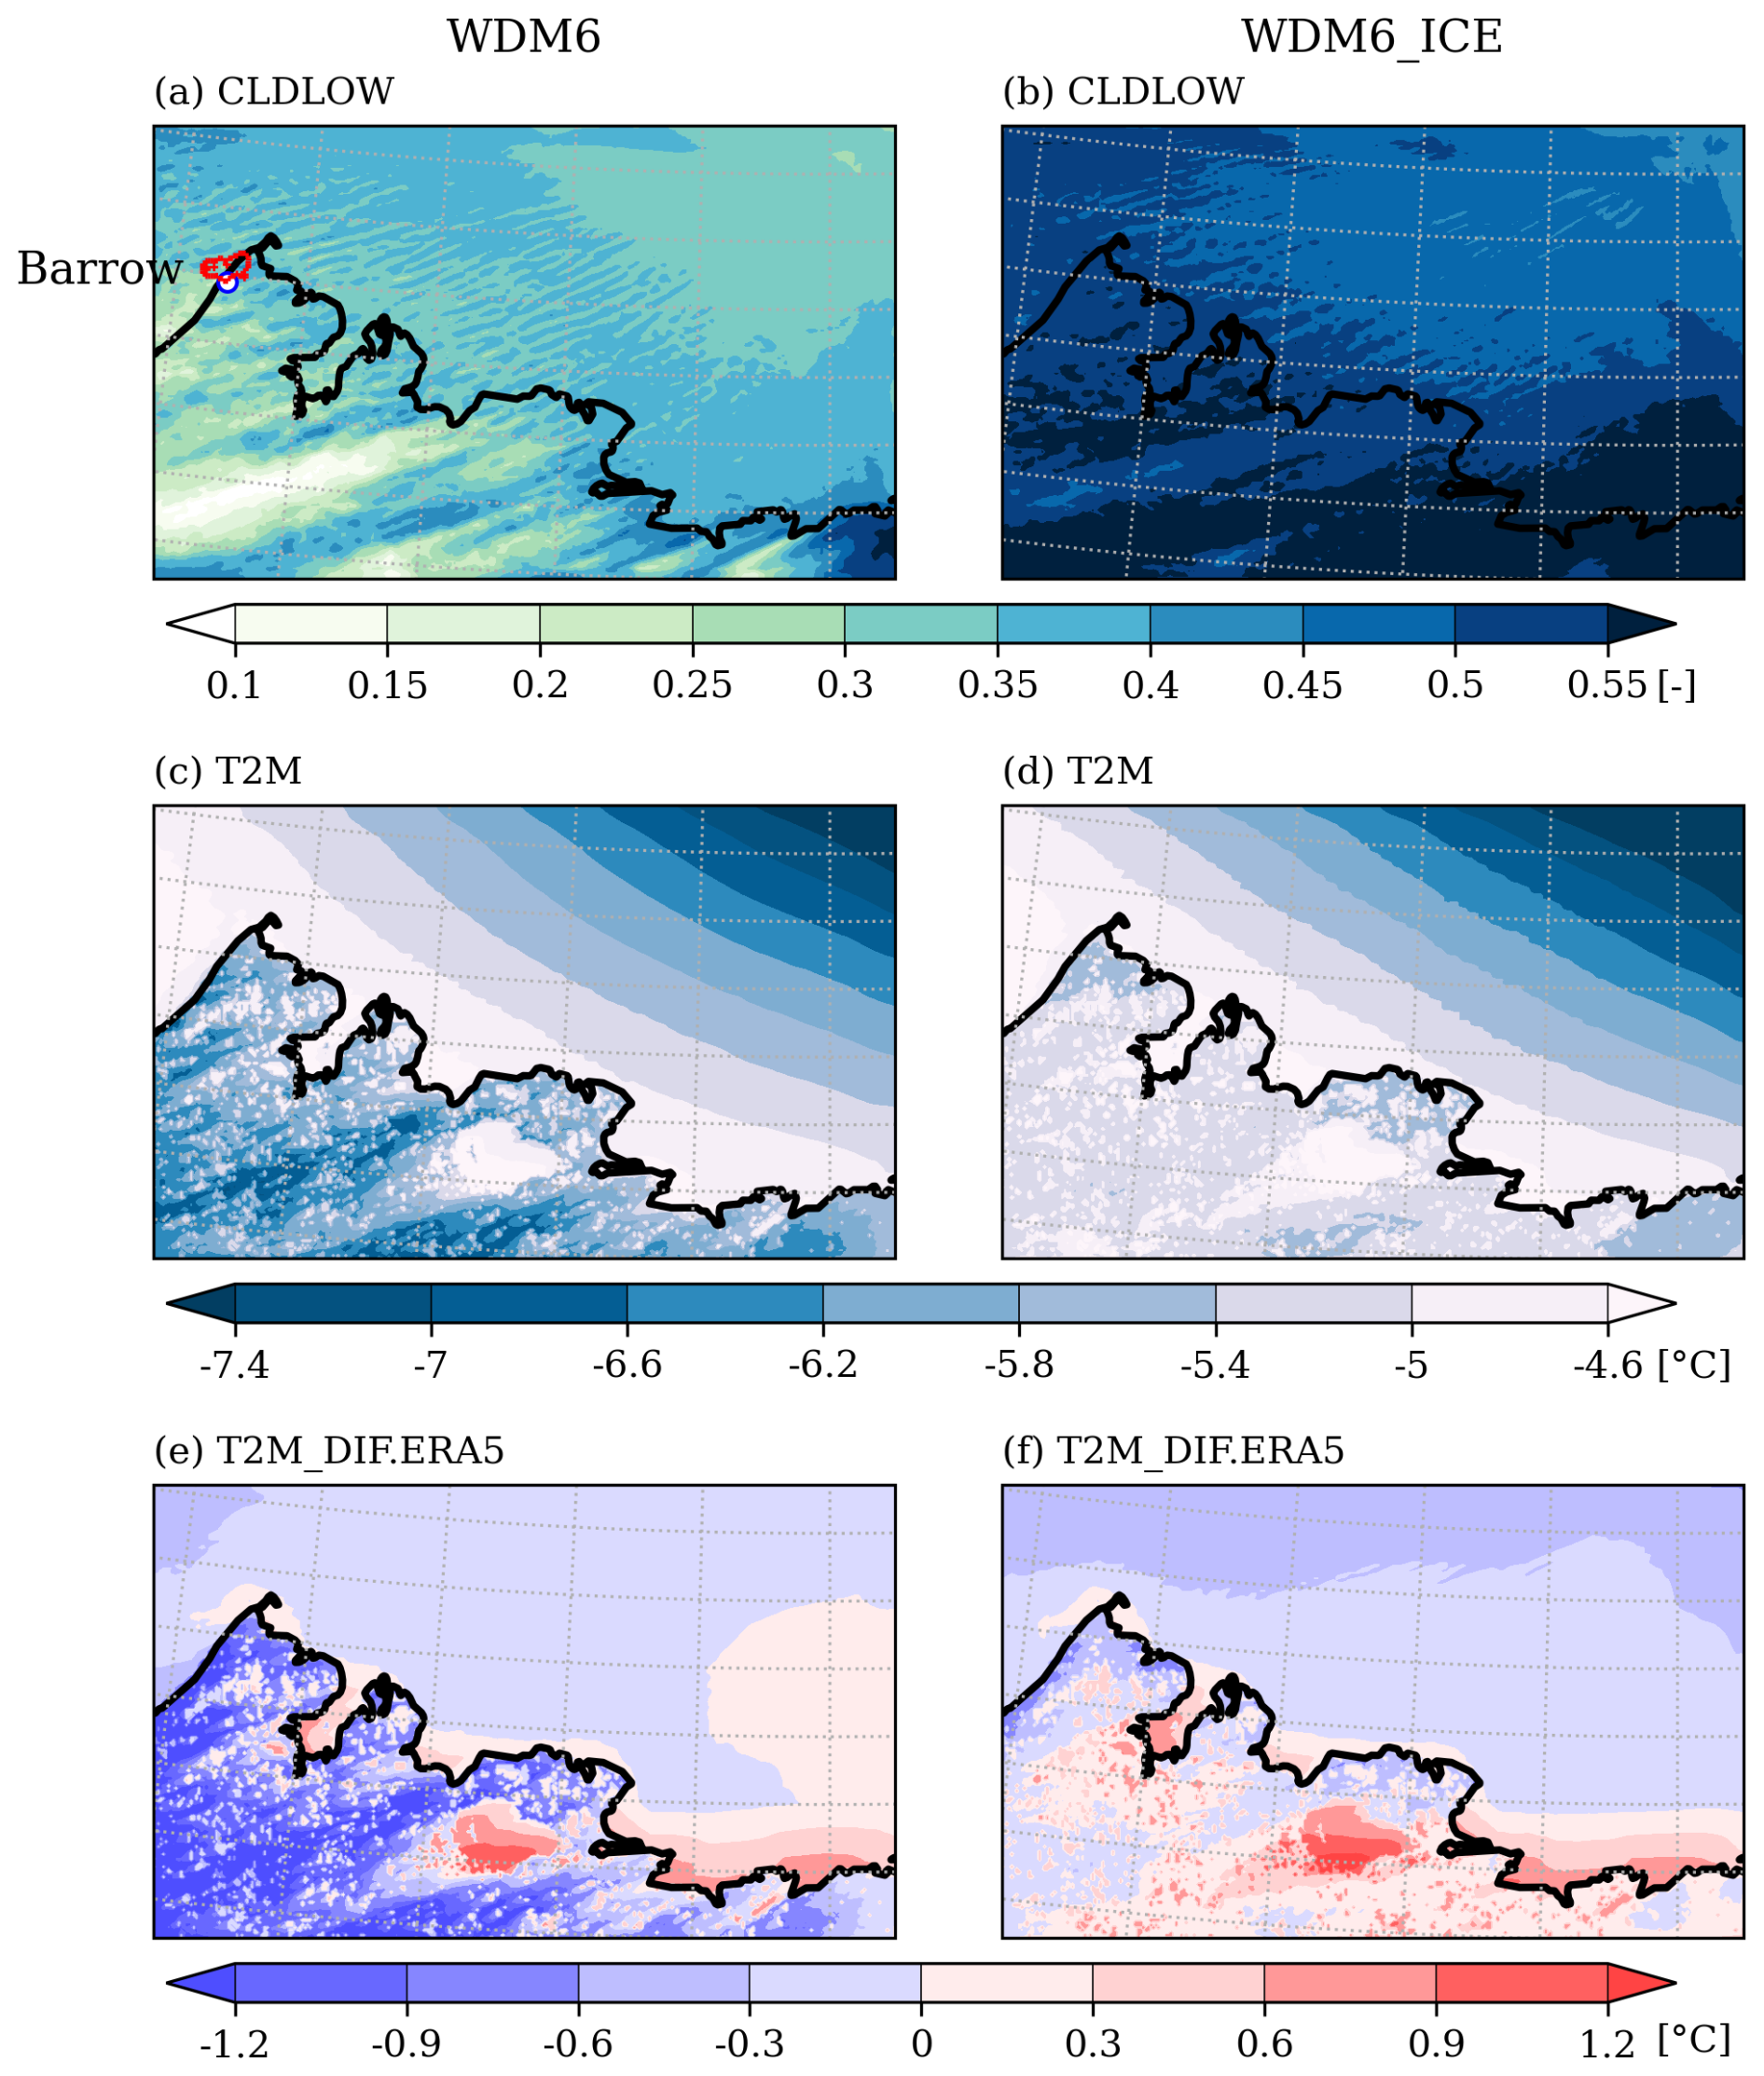
Figure 2Time-averaged (12:00 UTC 9 October–11:00 UTC 10 October 2004) spatial distributions over domain D03 from (left column) WDM6 and (right column) WDM6_ICE simulations: (a, b) low-level cloud fraction (CLDLOW; below 1500 m), (c, d) T2M, and (e, f) T2M differences (simulation – ERA5). The red box in (a) indicates the flight track area during the analysis period (01:00–02:00 UTC 10 October 2004).
WDM6 produces limited low-level cloud fractions (0.1–0.3) across domain D03, with slightly higher values along the coastal regions (Fig. 2a). These low cloud fractions correspond to widespread cold T2M (−7.0 to −6.6 °C), with the coldest values occurring in cloud-free areas (Fig. 2c). In contrast, WDM6_ICE exhibits higher cloud fractions (0.4–0.55), with more uniform coverage extending into regions that are cloud-free in WDM6 (Fig. 2b). The increased cloud fraction is associated with warmer T2M ranging from −5.9 to −5.5 °C (Fig. 2d).
The T2M bias patterns relative to ERA5 illustrate the regional impact of these cloud differences (Fig. 2e, f). WDM6 exhibits predominantly negative biases (−1.2 to −0.3 °C) across the domain.
While WDM6_ICE shows smaller negative biases (−0.7 to 0 °C). Point-based validation at the BAR observation site confirms this pattern, with T2M bias decreasing from −1.3 °C in WDM6 to −0.9 °C in WDM6_ICE relative to the observed mean of −4.6 °C.
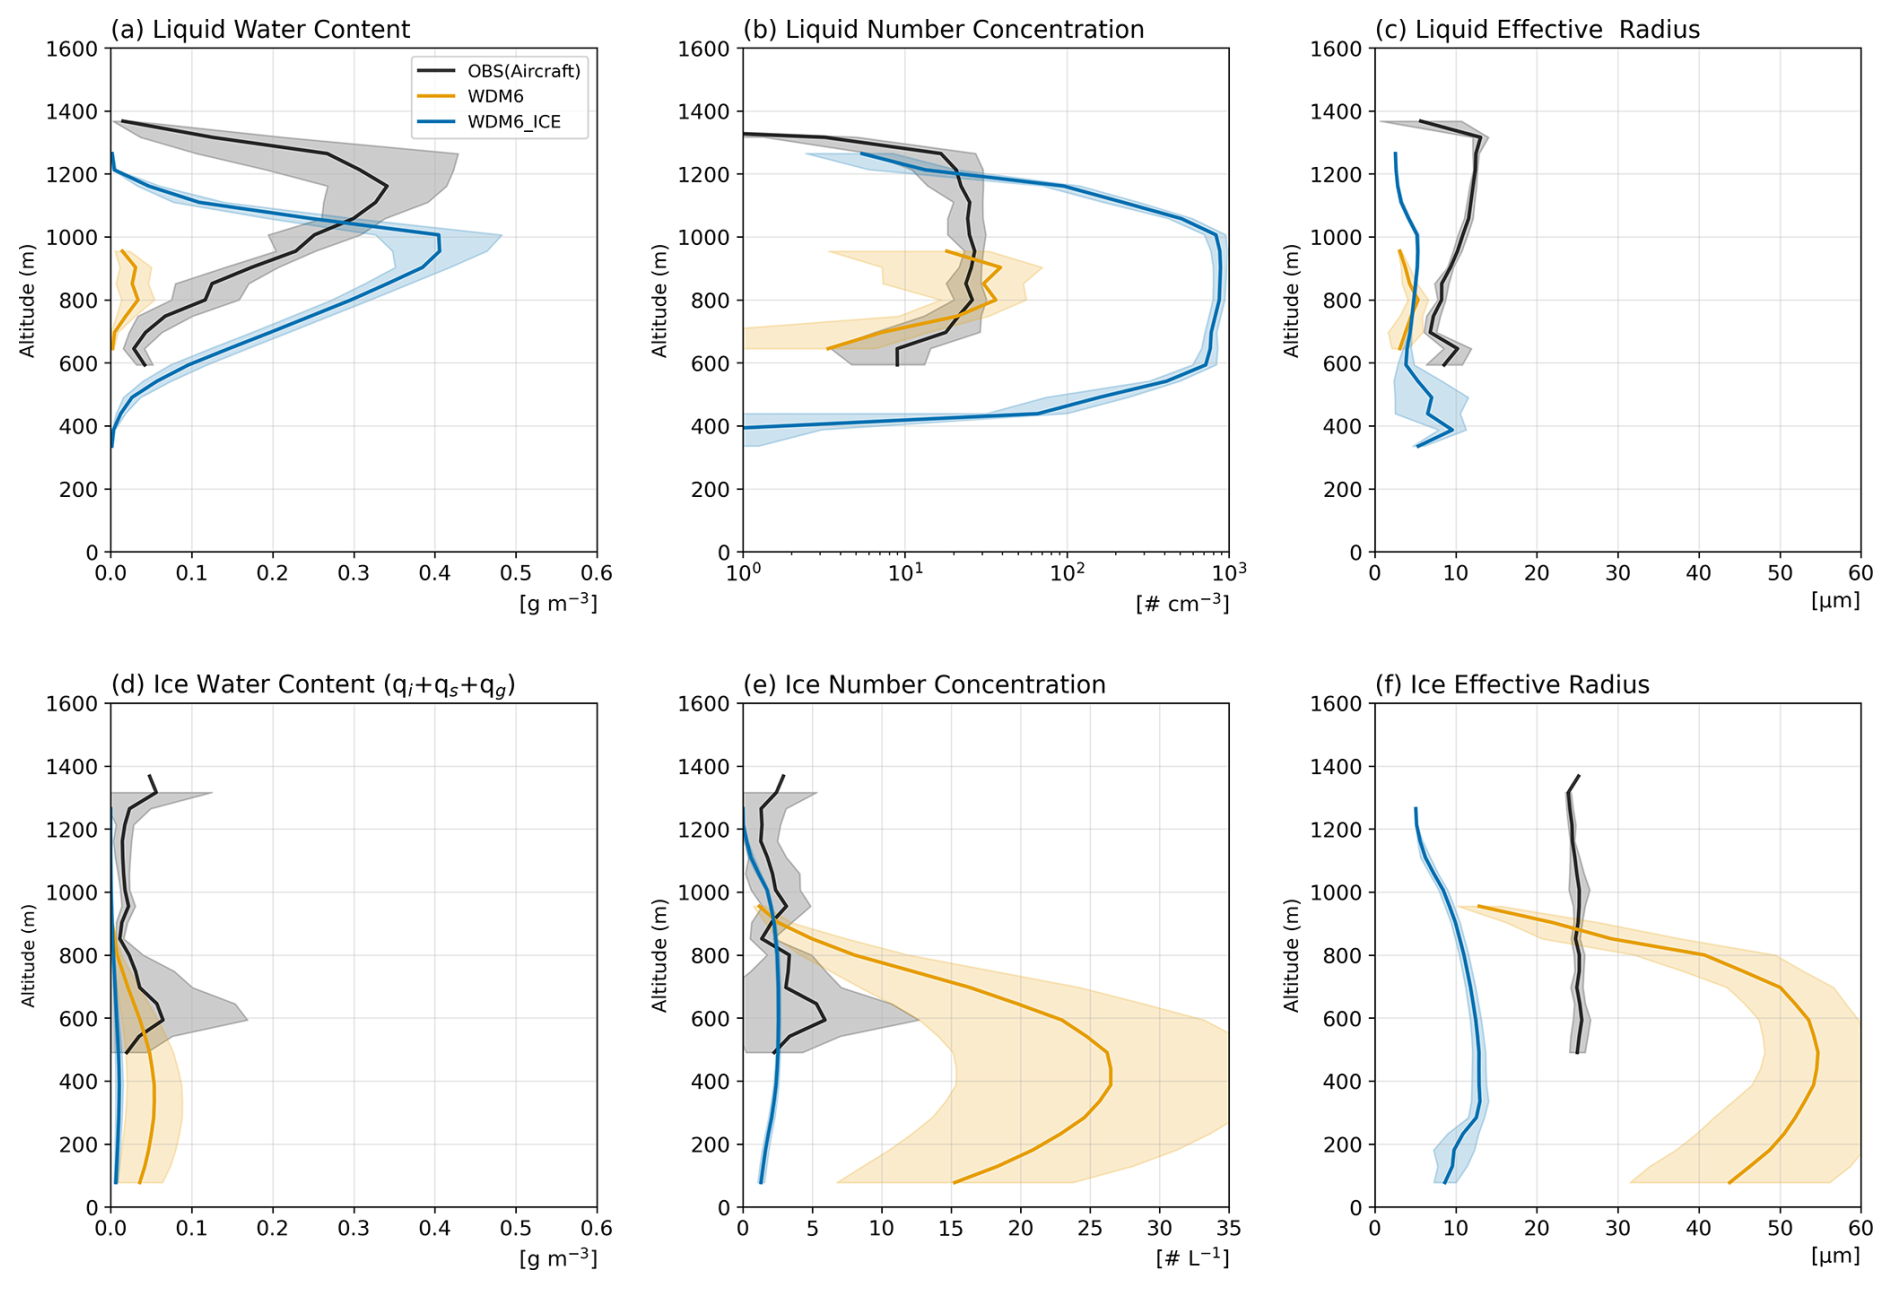
Figure 3Vertical profiles of cloud microphysical properties along the flight track (Flight 10a). Panels show (a–c) liquid water content (LWC), number concentration, and effective radius, and (d–f) ice water content (IWC: ), number concentration, and effective radius. Black lines represent aircraft observations (01:10–02:00 UTC 10 October 2004) with gray shading indicating ±1 standard deviation (σ). Colored lines denote model simulations sampled along the track between the 01:10–02:00 UTC, WDM6 (orange) and WDM6_ICE (blue) with shading indicating ±1σ across the track grid cells.
To evaluate the simulated vertical hydrometeor structure, model results were sampled along the flight track and compared with aircraft observations (Fig. 3). The observations show a liquid-dominated mixed-phase cloud. LWC peaks at 0.34 g m−3 around 1160 m, whereas IWC remains below 0.1 g m−3 throughout the cloud layer (Fig. 3a, d). Liquid droplets are characterized by moderate number concentrations (20–27 cm−3) and effective radii of 8–12 µm (Fig. 3b, c). Ice particles are sparse (mean ∼ 2.7 L−1, peak < 6 L−1) with effective radii of ∼ 25 µm (Fig. 3e, f). WDM6 produces an ice-dominated vertical structure. Total ice number concentration reaches ∼ 26 L−1 (mean ∼ 18 L−1) in the lower part of the sampled layer, exceeding observations by roughly sixfold. The ice mass is carried almost entirely by cloud ice, with snow and graupel contributing little (Fig. S3a). Cloud ice effective radius ranges from ∼ 13 to ∼ 55 µm, increasing toward lower levels and exceeding observations (∼ 25 µm) (Fig. 3f). The simulation generates minimal LWC (peak ≈ 0.03 g m−3 at 800–950 m) while maintaining substantial IWC (∼ 0.05 g m−3; Fig. 3d). The liquid phase remains restricted, exhibiting small droplet sizes (3–5 µm; Fig. 3c).
WDM6_ICE shifts the structure toward a liquid-dominated state, with simulated LWC peaking at 0.41 g m−3 around 1000 m, close to that observed although the peak occurs about 150 m lower (Fig. 3a). However, WDM6_ICE simulates higher liquid number concentrations (reaching ∼ 890 cm−3; Fig. 3b), exceeding observations (∼ 27 cm−3) by more than an order of magnitude, with correspondingly small effective radii (about 2.5–6 µm; Fig. 3c) well below observed values (∼ 7–13 µm). Total IWC is reduced relative to both WDM6 and observations, with peak values of about 0.01 g m−3 (Fig. 3d). This reduction is accompanied by a pronounced restructuring of the ice composition, with cloud ice becoming negligible while snow becomes the dominant ice category (Fig. S3b). The total ice number concentration (mean ∼ 1.8 L−1; Fig. 3e) is low but within the same order of magnitude as the observed mean (∼ 2.7 L−1), and is maintained primarily by snow rather than cloud ice, the opposite of the WDM6 partitioning. Cloud ice effective radius is small (5–13 µm; Fig. 3f). Note that the effective radius comparison is restricted to the cloud ice category, and the structural implications of this constraint are discussed in Sect. 4.4.
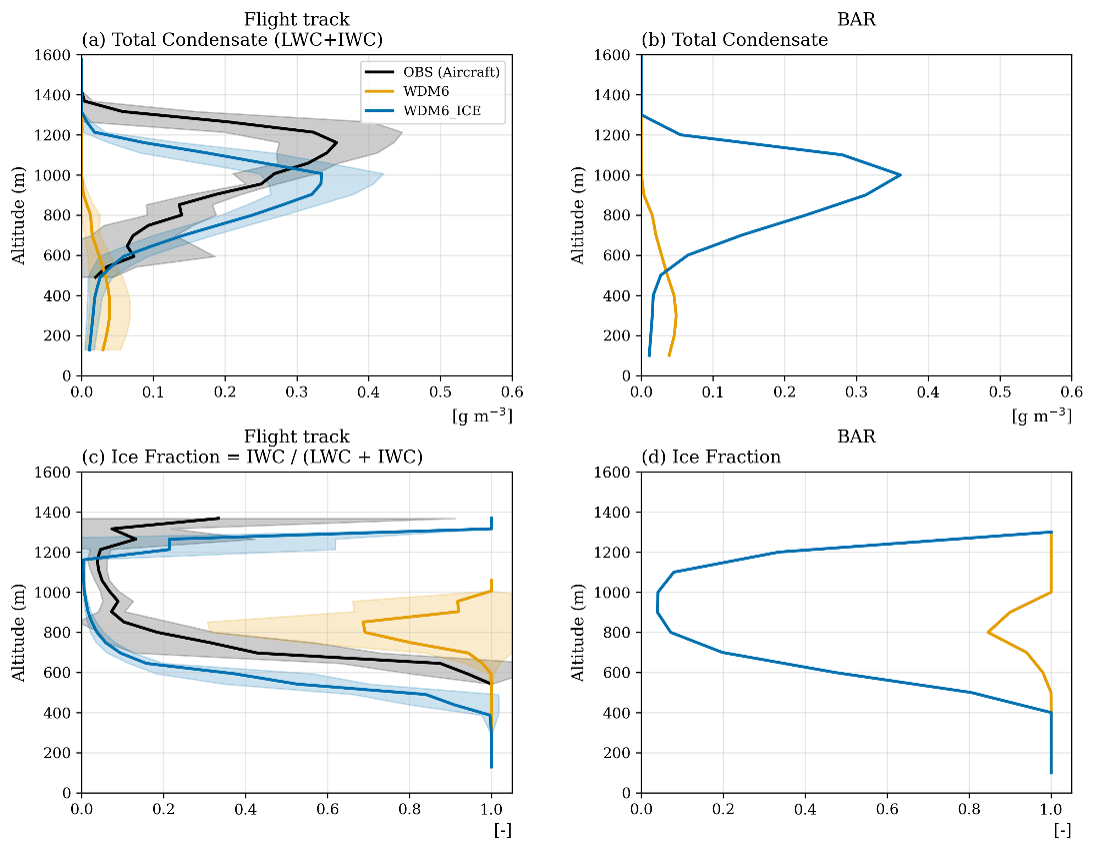
Figure 4Vertical profiles of (a, b) total condensate (LWC + IWC) and (c, d) ice fraction (IWC(LWC+IWC); IWC: ). The left column (a, c) shows profiles sampled along the flight track of Flight 10a, and the right column (b, d) shows the time-averaged (12:00 UTC 9 October–11:00 UTC 10 October 2004) profiles at BAR. Black lines represent aircraft observations (01:10–02:00 UTC 10 October 2004) with gray shading indicating ±1σ. Colored lines denote model simulations sampled along the track between 01:00–02:00 UTC, WDM6 (orange) and WDM6_ICE (blue).
The total condensate and ice fraction profiles further characterize the phase partitioning of the two schemes (Fig. 4). Along the flight track, the observed ice fraction decreases from near unity at cloud base to about 0.04–0.09 in the upper cloud (Fig. 4c). WDM6 retains a high ice fraction (about 0.8–1.0) in the lower part of the layer, consistent with its ice-dominated structure, but the fraction decreases toward the small liquid maximum near 800–950 m, whereas WDM6_ICE follows the observed decrease toward low values aloft, reaching about 0.01 above 900 m and falling below the observed fraction in the upper cloud (Fig. 4c). The total condensate shows that this difference in partitioning is accompanied by very different total cloud water amounts: WDM6 produces a near-negligible total condensate (peak about 0.04 g m−3), whereas WDM6_ICE recovers a pronounced peak of about 0.33 g m−3 near 1000 m, which remains below the observed peak of about 0.36 g m−3 near 1160 m and occurs about 150 m lower in altitude (Fig. 4a). The time-averaged profiles at BAR show the same behavior (Fig. 4b, d). WDM6_ICE thus recovers the total condensate toward the observed magnitude, but the ice fraction shows that it does so by shifting almost entirely to the liquid phase, in contrast to the observed mixed-phase layer in which ice and liquid coexist.
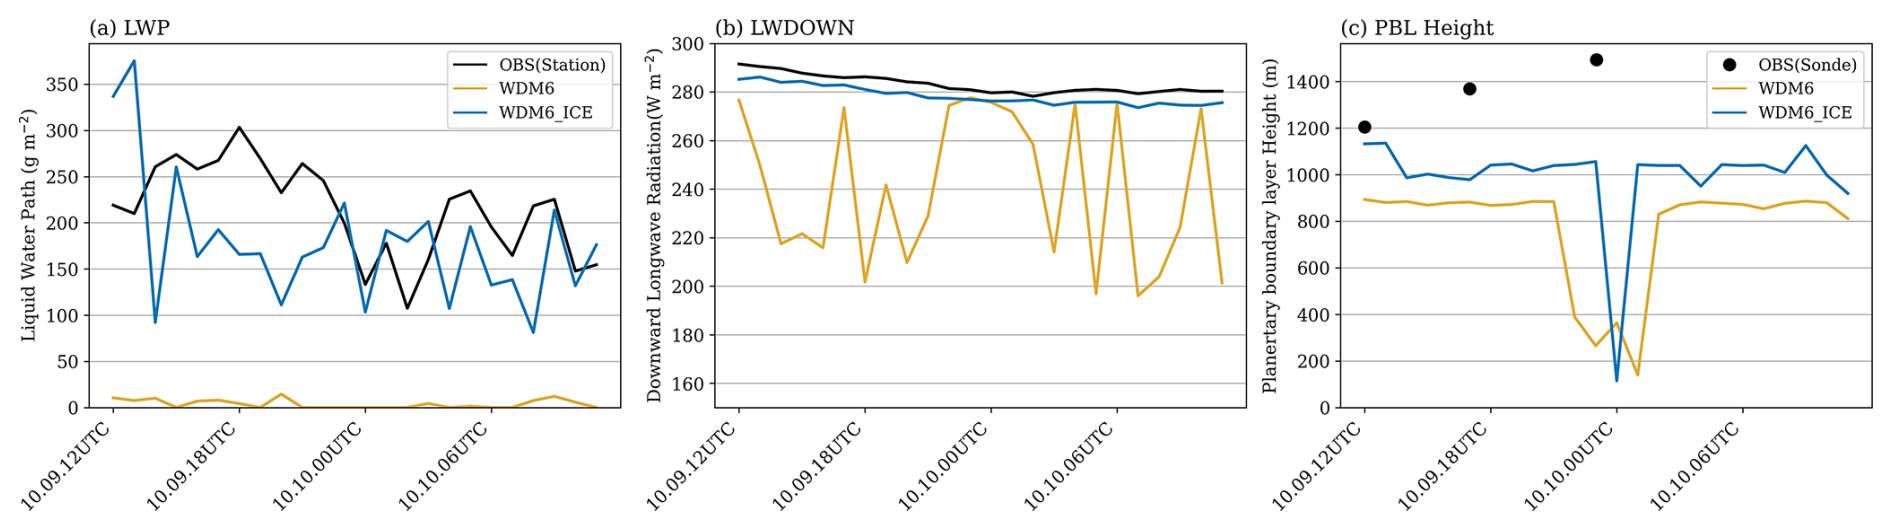
Figure 5Time series (12:00 UTC 9 October–11:00 UTC 10 October 2004) at BAR of (a) liquid water path (LWP), (b) downward longwave radiation (LWDOWN), and (c) planetary boundary layer (PBL) height. Observations are shown in black, with station time series in (a) and (b) and radiosonde-derived estimates in (c) as filled circles for the three radiosonde times (12:00, 17:00, and 23:00 UTC 9 October 2004).
At BAR, observations indicate persistent liquid-containing clouds throughout the 24 h period, with LWP averaging 214.5 g m−2 (Fig. 5a). WDM6 exhibits intermittent behavior with sporadic peaks reaching 14.5 g m−2 and a period average of only 3.8 g m−2. WDM6_ICE maintains a continuous liquid phase averaging 178.1 g m−2. LWDOWN shows corresponding differences (Fig. 5b): observed values remain stable near 283.1 W m−2, WDM6 produces 239.8 W m−2, and WDM6_ICE reproduces 278.4 W m−2. PBL height also differs between the schemes, with WDM6 simulating 774.4 m and WDM6_ICE producing 992.3 m (Fig. 5c). The radiosonde-derived estimates at BAR (1205, 1369, and 1494 m) are higher than both simulations, so both schemes underestimate the observed PBL height, although WDM6_ICE is closer to the observations.
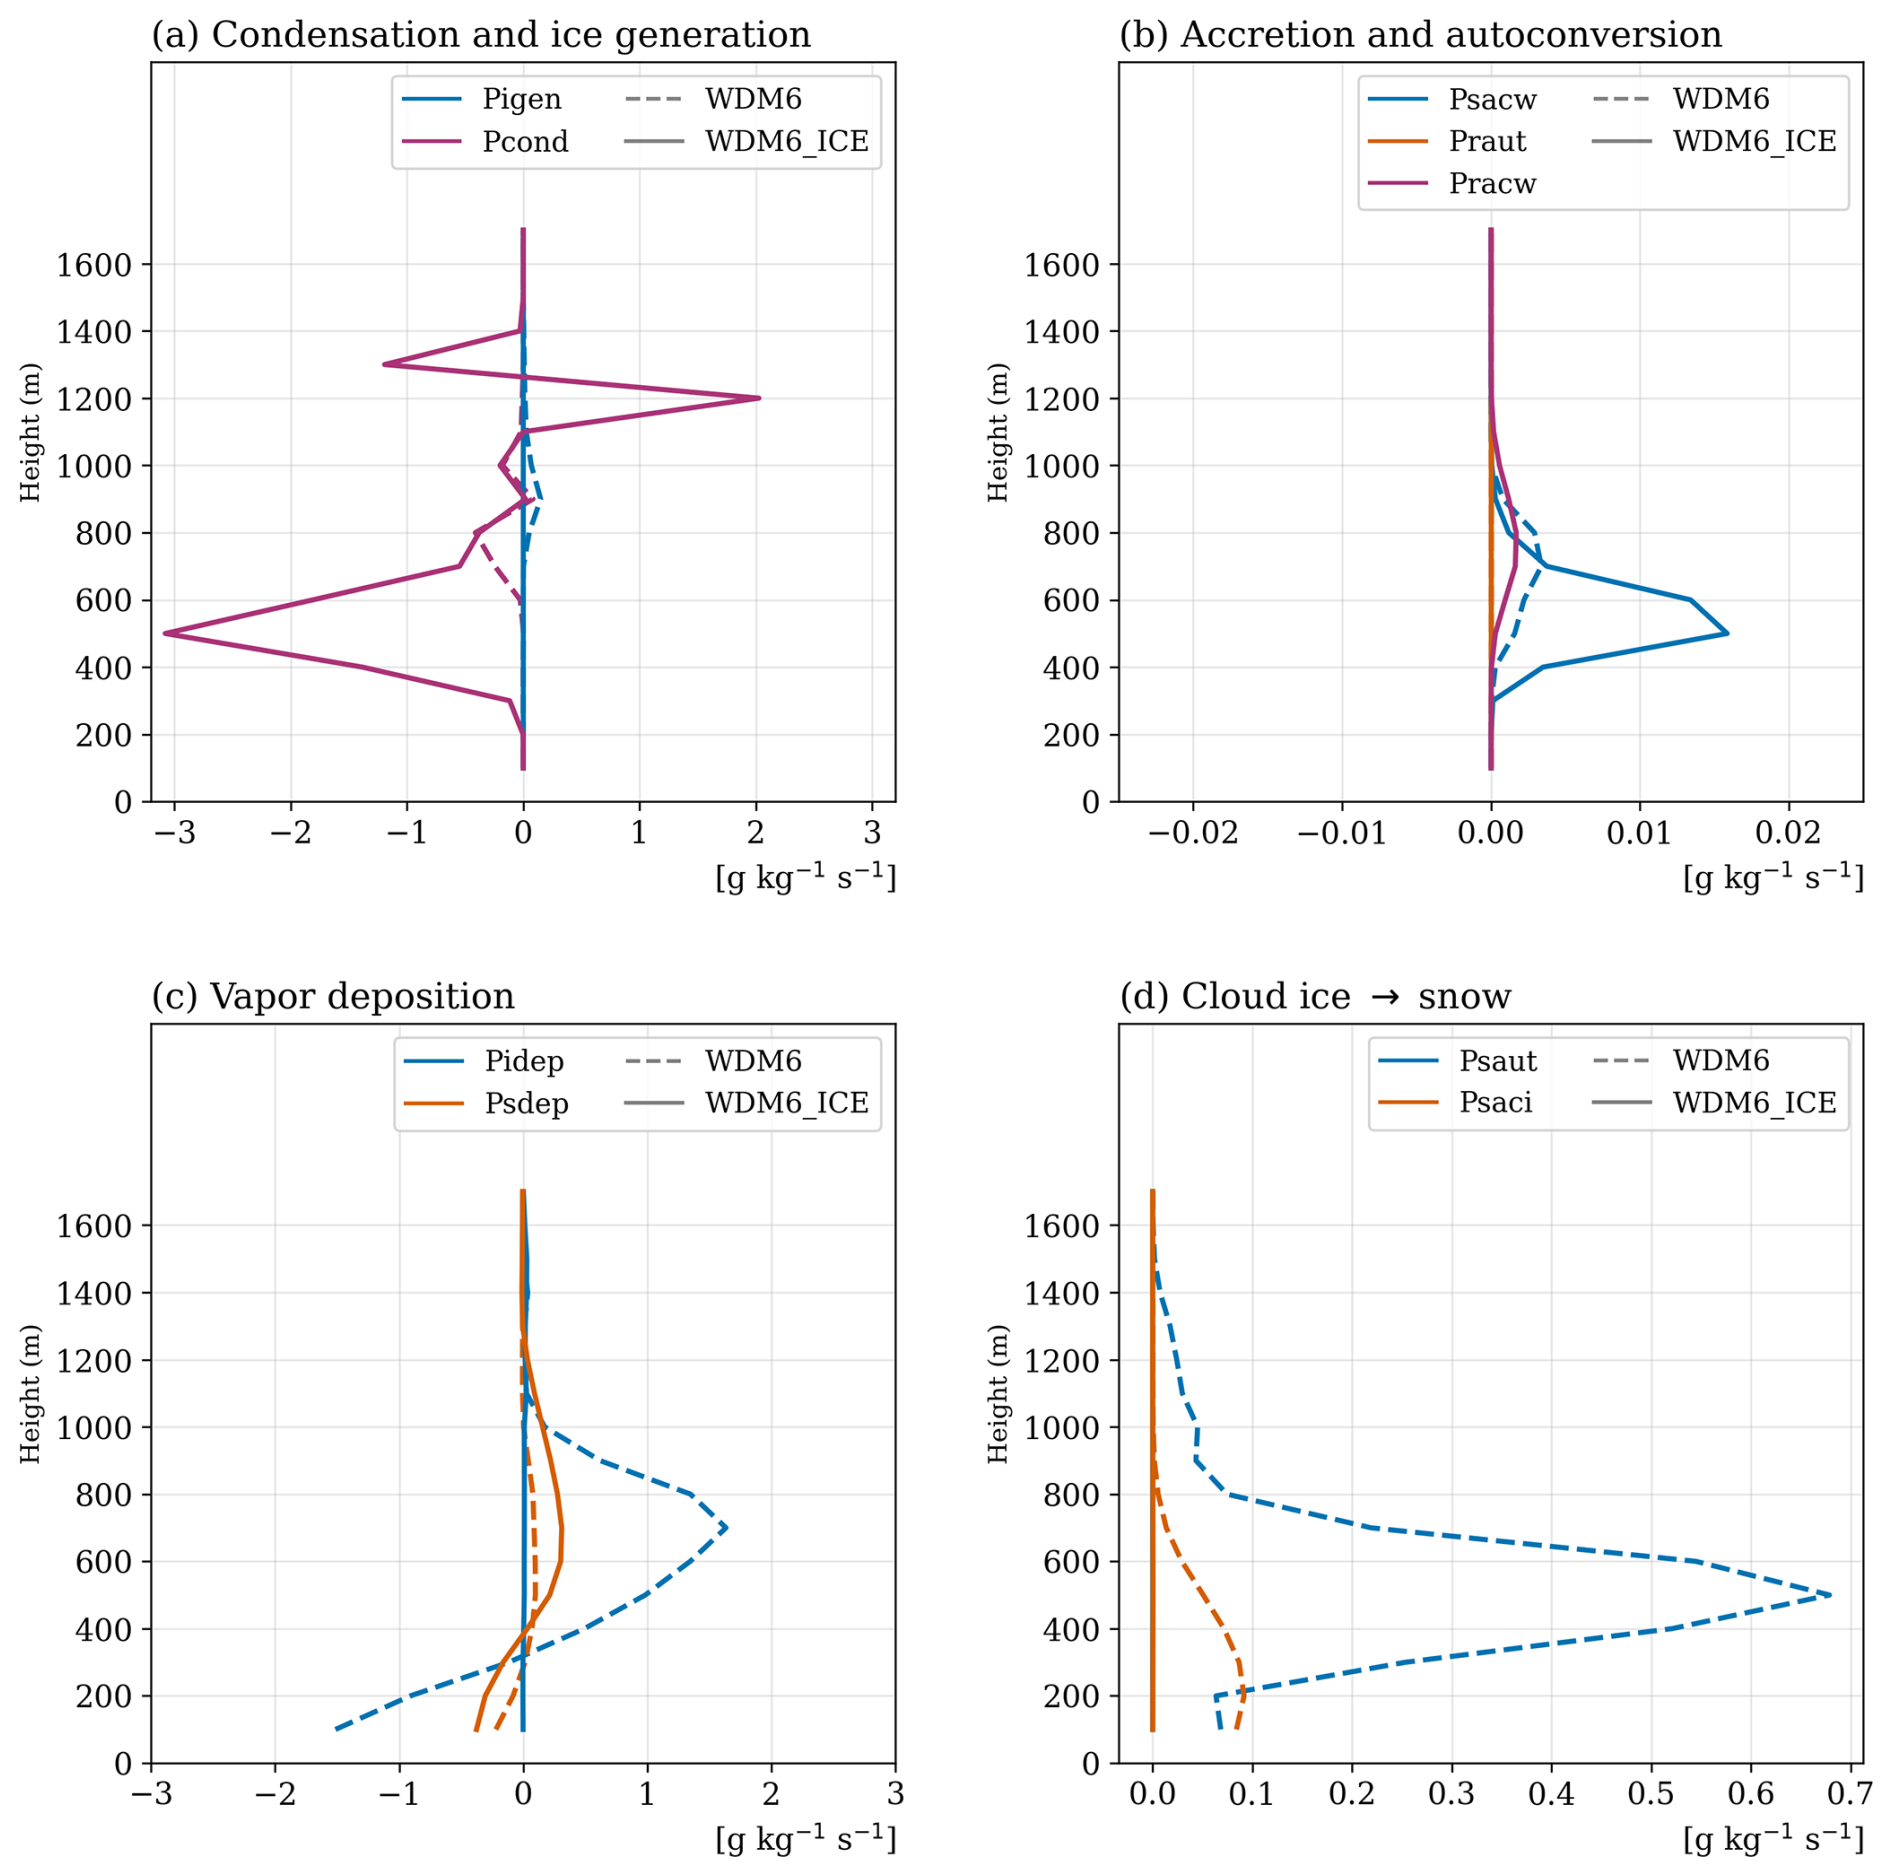
Figure 6Time-averaged (12:00 UTC 9 October–11:00 UTC 10 October 2004) vertical profiles of microphysical process rates at BAR: (a) condensation and ice generation (Pigen, Pcond), (b) accretion and autoconversion (Psacw, Praut, Pracw), (c) vapor deposition (Pidep, Psdep), and (d) cloud ice to snow conversion (Psaut, Psaci). Dashed lines represent WDM6, and solid lines represent WDM6_ICE. Note that negative values in (a) indicate evaporation.
Vertical profiles of microphysical process rates show distinct distributions between the two schemes (Fig. 6). Ice generation (Pigen) reaches 0.15 g kg−1 s−1 in WDM6 while remaining near zero in WDM6_ICE (Fig. 6a). Conversely, liquid condensation (Pcond) is suppressed in WDM6 (< 0.08 g kg−1 s−1), whereas in WDM6_ICE Pcond dominates as the primary source term, exceeding 2.0 g kg−1 s−1.
WDM6 exhibits minimal accretion of cloud liquid by snow (Psacw < 0.003 g kg−1 s−1; Fig. 6b), consistent with the low liquid water content shown in Fig. 3a. WDM6_ICE shows Psacw reaching 0.016 g kg−1 s−1, a five-fold increase. Note that this elevated Psacw transfers mass from the liquid to snow category rather than to cloud ice, so it does not contradict the reduced IWC in WDM6_ICE. Rain mixing ratio is negligible in both simulations throughout the analysis period (not shown).
Deposition onto cloud ice (Pidep) dominates in WDM6, with peak rates of 1.6 g kg−1 s−1 (Fig. 6c). In WDM6_ICE, Pidep remains below 0.03 g kg−1 s−1, representing a reduction of roughly 98 %. Deposition onto snow (Psdep) increases threefold in WDM6_ICE, from 0.1 to 0.31 g kg−1 s−1. The strong Pidep in WDM6 feeds an efficient conversion of cloud ice to snow, with autoconversion (Psaut) peaking at about 0.68 g kg−1 s−1 and accretion of cloud ice by snow (Psaci) reaching about 0.09 g kg−1 s−1 (Fig. 6d), whereas both terms are effectively absent in WDM6_ICE.
3.2 Sensitivity to Individual Microphysical Modifications
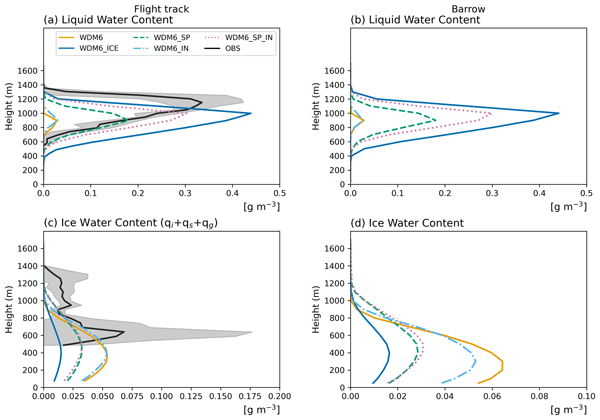
The sensitivity experiments show systematic differences in cloud phase partitioning (Fig. 7). LWC increases in the order WDM6 < WDM6_IN < WDM6_SP < WDM6_SP_IN < WDM6_ICE (Fig. 7a, b), with WDM6 and WDM6_IN remaining similar to each other. The IWC response is more complex: ice shape modification (WDM6_SP) substantially reduces IWC, whereas nucleation modification alone (WDM6_IN) produces IWC close to that of WDM6, suggesting that the Cooper curve redistributes ice among hydrometeor categories rather than reducing total ice content (Fig. 7c, d).
Over the aircraft sampling region, WDM6_SP increases peak LWC to 0.18 g m−3 compared to 0.03 g m−3 in WDM6 (Fig. 7a). WDM6_IN produces minimal enhancement, reaching 0.03 g m−3. WDM6_SP_IN combines both modifications, yielding 0.30 g m−3. WDM6_ICE reaches 0.44 g m−3. For IWC, WDM6 produces about 0.05 g m−3, comparable to observations (∼ 0.07 g m−3; Fig. 7c). WDM6_SP and WDM6_SP_IN reduce IWC to around 0.03 g m−3, while WDM6_IN maintains IWC near the WDM6 level (∼ 0.05 g m−3). WDM6_ICE reduces IWC to roughly 0.01 g m−3, a reduction relative to WDM6. The time-averaged profiles at BAR show essentially the same magnitudes and progression (Fig. 7b, d).
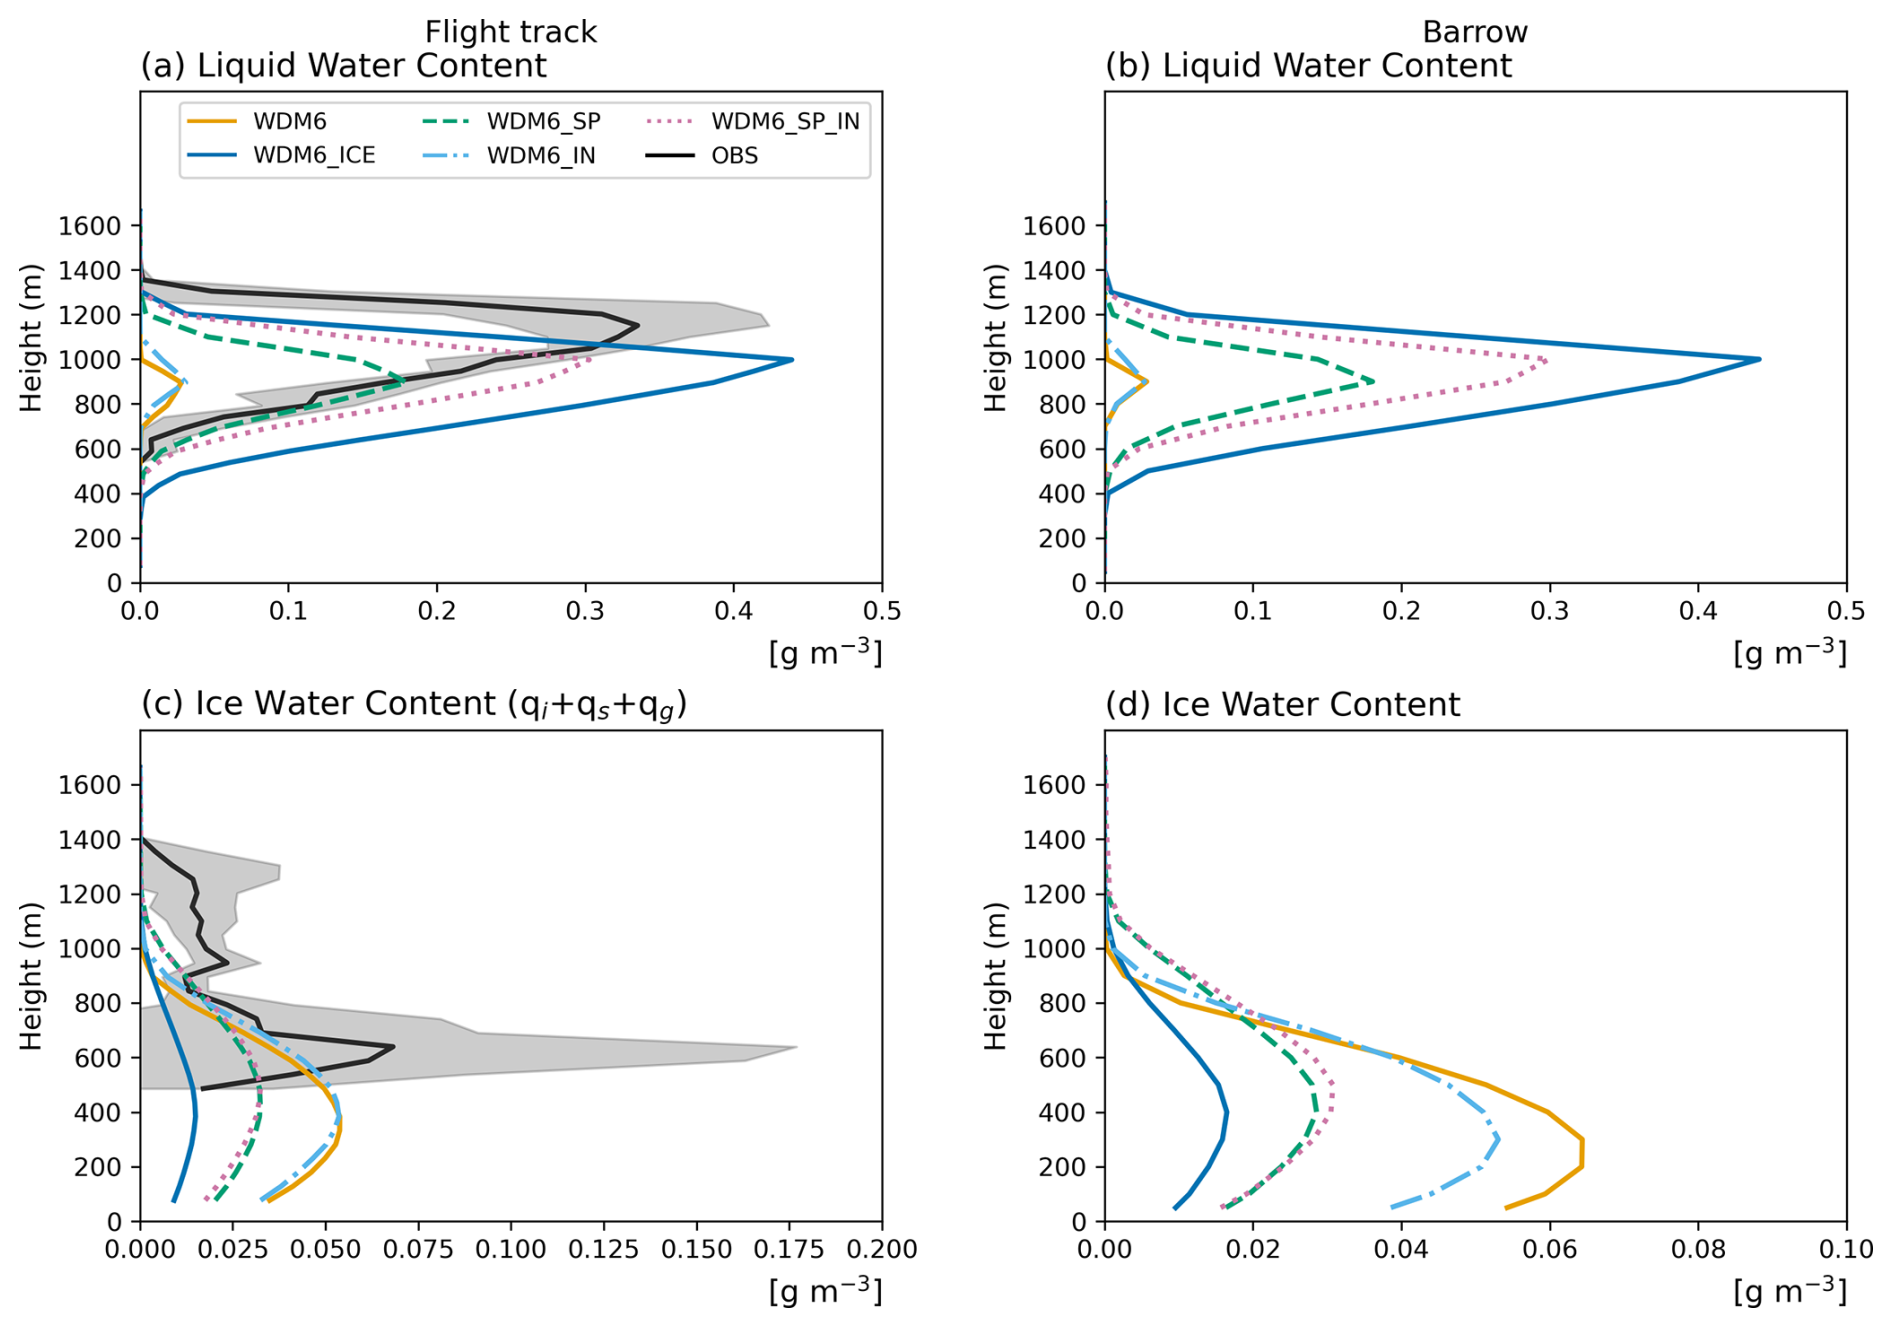
Figure 7Vertical profiles of (a, b) LWC and (c, d) IWC. The left column (a, c) shows the profile over the flight region (red domainin Fig. 2a) during 01:00–02:00 UTC 10 October 2004, and the right column (b, d) shows the time-averaged (12:00 UTC 9 October–11:00 UTC 10 October 2004) profile at BAR. Black lines with gray shading indicate observations (±1σ), and colored lines represent sensitivity experiments: WDM6 (orange, solid), WDM6_ICE (blue, solid), WDM6_SP (bluish green, dashed), WDM6_IN (sky blue, dash-dot), and WDM6_SP_IN (purple, dotted).
Notably, WDM6_ICE produces a higher LWC than WDM6_SP_IN even though it includes additional ice-formation processes such as contact freezing and Hallett–Mossop multiplication. This counterintuitive behavior coincides with a lower IWC in WDM6_ICE than in WDM6_SP_IN (Fig. 6c, d), so that the additional ice processes do not translate into more ice in this case. The mechanisms responsible for this behavior are discussed in Sect. 4.4.
Table 3Time-averaged (12:00 UTC 9 October–11:00 UTC 10 October 2004) surface variables (SWDOWN, LWDOWN, T2M), column-integrated variables (IWP, LWP) at BAR, and PRECIP is the accumulated surface precipitation (mm) over the same period. OBS values are from ground-based measurements. Values in parentheses for SWDOWN and LWDOWN indicate the bias relative to the observations (simulation − OBS).

SWDOWN and LWDOWN vary systematically across experiments. SWDOWN decreases from 25.9 W m−2 (WDM6) to 8.7 W m−2 (WDM6_ICE), while LWDOWN increases from 239.8 to 278.4 W m−2, approaching the observed 283.1 W m−2. LWP shows consistent enhancement across the hierarchy. At BAR, values rise from 3.8 g m−2 (WDM6) to 5.0 (WDM6_IN), 55.7 (WDM6_SP), 103.5 (WDM6_SP_IN), and 178.1 (WDM6_ICE), close to the observed 214.5 g m−2 (Table 3). IWP shows a different pattern from LWC: WDM6 produces 38.0 g m−2, exceeding the observed value of 31.5 g m−2, while WDM6_IN maintains a comparable level (33.5 g m−2). The shape-modified configurations reduce IWP (WDM6_SP: 20.8, WDM6_SP_IN: 22.5 g m−2), and WDM6_ICE produces the lowest IWP (10.6 g m−2). This pattern is consistent with the IWC profiles (Fig. 7c, d): nucleation modification alone redistributes ice among hydrometeor categories without reducing total ice content, whereas ice shape modification drives the primary IWP reduction.
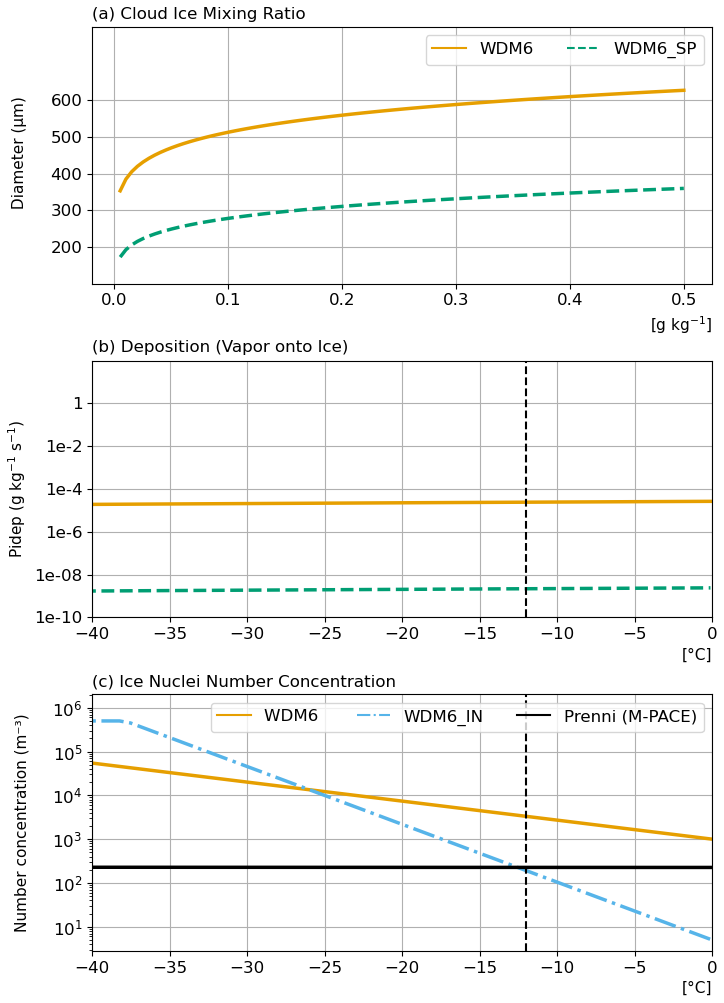
Figure 8(a) Relationship between cloud ice mixing ratio and diameter in WDM6 (orange, solid) and WDM6_SP (bluish green, dashed). (b) Deposition rate of water vapor onto ice (assuming ice mixing ratio of 0.1 g kg−1 and supersaturation of 10 %) as a function of temperature. (c) INP number concentration (m−3) as a function of temperature for WDM6 and WDM6_IN (sky blue, dash-dot). The black line shows M-PACE observations (Prenni et al., 2007). Note that the observational upper limit of 500 L−1 (DeMott et al., 2010) corresponds to 5 × 10⁵ m−3. The vertical dashed line marks −12 °C, representing the approximate cloud-top temperature during M-PACE.
The spherical ice assumption reduces particle diameter by about 40 %. At an ice content of 0.1 g kg−1, diameters decrease from 500 µm m in WDM6 to 300 µm in WDM6_SP (Fig. 8a), reducing surface area for vapor deposition.
The size change reduces deposition efficiency (Fig. 8b). At −12 °C, deposition rates decrease from 104 to 108 g kg−1 s−1, a four-order-of-magnitude reduction. This is consistent with the reduced Pidep in WDM6_ICE (Fig. 6c).
Ice-nucleating particle (INP) concentration further modulates ice production (Fig. 8c). At the M-PACE cloud-top temperature of around −12 °C (Fu et al., 2019), WDM6 produces 3320 m−3 INPs, overestimating M-PACE observations (∼ 200 m−3; Prenni et al., 2007) by more than an order of magnitude. WDM6_IN reduces concentrations to 191 m−3, closely matching observations. This represents a 17-fold reduction relative to WDM6. The differences between WDM6_SP_IN and WDM6_ICE (Figs. 3 and 7) indicate that the remaining structural differences in WDM6_ICE produce additional ice reduction beyond the combined effects of shape and nucleation modifications alone.
4.1 Mechanisms Driving Phase Partitioning Differences
The behaviors of WDM6 and WDM6_ICE reflect a fundamental difference in how available water vapor is partitioned between ice and liquid phases. WDM6 retains the classical Arctic modeling bias of severely underestimating supercooled liquid water (Klein et al., 2009), producing negligible LWP and intermittent cloud coverage because rapid ice growth through the Wegener–Bergeron–Findeisen (WBF) process efficiently drains available liquid water. In WDM6, intense vapor deposition onto bullet-shaped ice particles (Pidep ∼ 1.6 g kg−1 s−1) consumes vapor rapidly, creating subsaturated conditions with respect to water that inhibit liquid maintenance and suppress condensation (Pcond < 0.08 g kg−1 s−1). These process rates are shown in Fig. 6.
A related feature of WDM6 is that, despite producing high cloud ice number concentrations and large effective radii along the flight track (Fig. 3), the simulated IWC remains below the observed values. This may partly reflect the low effective mass of the assumed bullet-shaped cloud ice, since for a given particle dimension the WDM6 mass–diameter relationship (M ∝ D2, Eq. A3) implies less mass than the denser, frequently rimed ice habits observed during M-PACE (McFarquhar et al., 2007).
In WDM6_ICE, the near-complete suppression of Pidep (reduced to ∼ 0.03 g kg−1 s−1, a 98 % reduction) redirects the available vapor toward condensation (Pcond > 2.0 g kg−1 s−1), sustaining the liquid layer. The dominant vapor consumption pathway shifts from deposition onto cloud ice followed by aggregation into snow to direct snow deposition via Psdep, which increases threefold. This pathway shift is reflected in the total IWC, as cloud ice is reduced to negligible values while snow maintains the residual ice content, so that total IWC is only partially reduced relative to WDM6 rather than being eliminated. Although this enhanced liquid water improves radiative and thermal agreement with observations, the substantial reduction of cloud ice and the shift in the ice budget from a cloud-ice-dominated to a snow-dominated ice budget highlight the challenge of maintaining a balanced mixed-phase state.
The reduced ice growth in WDM6_ICE also alters the surface precipitation, which under the subzero conditions of this case is almost entirely snowfall. The accumulated surface precipitation differs among the configurations (PRECIP in Table 3; Fig. S4). WDM6 and WDM6_IN produce the largest amounts (about 2.6 mm), WDM6_ICE the smallest (0.39 mm), and WDM6_SP and WDM6_SP_IN are intermediate (about 0.9 mm). In WDM6, the strong vapor deposition onto cloud ice (Pidep; Fig. 6c) generates abundant cloud ice that is efficiently converted to snow (Psaut; Fig. 6d) and removed by sedimentation. In WDM6_ICE, the suppression of Pidep limits cloud ice and weakens Psaut, so that little snow forms and reaches the surface. These precipitation differences contribute to the total water path differences among the configurations. The configurations that precipitate most efficiently (WDM6, WDM6_IN) remove column water through deposition-grown snow and sedimentation, which lowers their total water path, whereas WDM6_ICE produces little snow and sustains a persistent liquid layer with a higher total water path. The reduced precipitation in WDM6_ICE and the shift of the in-cloud ice composition toward snow both follow from the same suppression of vapor deposition onto cloud ice and are not treated here as independent effects. The snow-dominated ice budget described in Sect. 3.1 refers to the in-cloud composition, in which snow exceeds cloud ice within the residual ice phase, and is distinct from the surface snowfall rate.
4.2 Regime-Dependent Response of Ice Microphysical Modifications
The regime-dependent nature of these responses becomes evident when comparing the present Arctic results with the mid-latitude evaluations of Park and Lim (2023). In their study, the same WDM6_ICE modifications reduced cloud ice mixing ratio through inefficient Pidep and Pinud processes, and the resulting surplus water vapor enhanced liquid water production through condensation (their Figs. 8 and 10). Notably, WDM6_ICE simulated higher cloud ice number concentrations despite lower mixing ratios in the mid-latitude cases, indicating that ice particles became more numerous but smaller. The vapor pathway shift from cloud ice deposition to snow deposition was also evident in their warm-low cases, where enhanced Psdep partially compensated for the reduced cloud ice (their Fig. 13). Precipitation skill scores showed mixed results, with notable bias reduction for the cold-low cases but deterioration in some warm-low cases (their Table 3). However, the magnitude and consequences of this pathway diverge between the two regimes. In the mid-latitude ICE-POP cases, hydrometeors extended through deep layers, reaching the 10 km level in warm-low cases (their Fig. 11), implying a broader temperature range over which the Cooper curve still permits substantial nucleation, and synoptic-scale forcing continuously supplied moisture. Under these conditions, cloud ice mixing ratio decreased but ice remained present throughout the cloud layer with increased number concentrations, and the total ice budget was moderated rather than fundamentally restructured. In the present Arctic case, cloud-layer temperatures remain within a narrow range (−15 to −10 °C) where nucleation rates under the Cooper curve are inherently limited. Combined with the shallow boundary-layer circulation characteristic of Arctic stratiform systems, which confines moisture supply and nucleation opportunities to a narrow vertical extent unlike the deep tropospheric lifting in mid-latitude cyclonic systems, and the absence of INP recycling, the same modifications produce a more pronounced response: cloud ice is nearly depleted, ice number concentration decreases rather than increases, and the residual ice content is maintained almost entirely through snow deposition (IWP reduced from 38.0 to 10.6 g m−2). While the underlying mechanism is similar to the mid-latitude warm-low cases, the Arctic environment amplifies the response from a moderate adjustment to a fundamental restructuring of the ice budget. This asymmetric response indicates regime-dependent behavior of the microphysical modifications, although it is based on a single Arctic case and should be interpreted with caution. Whether the contrast persists across the broader range of Arctic mixed-phase conditions remains to be tested in future work.
4.3 Radiative Bias Characteristics Across Configurations
The different microphysical configurations produce systematic variations in surface radiative biases (Table 3). WDM6 permits excessive shortwave transmission and insufficient longwave emission, consistent with its sparse cloud coverage and reduced liquid content, with a downward shortwave bias of +12.9 W m−2 and a downward longwave bias of −43.3 W m−2. WDM6_ICE reproduces LWDOWN values closely matching observations (a bias of −4.7 W m−2) through the maintenance of persistent liquid-containing clouds, consistent with earlier findings that supercooled liquid water dominates the radiative coupling between clouds and the surface in the Arctic (Cesana et al., 2012). However, the substantial reduction of cloud ice in WDM6_ICE, with total ice content maintained primarily through snow rather than distributed across multiple ice categories (IWP of 10.6 g m−2 vs. observed 31.5 g m−2), raises questions about whether this radiative agreement is achieved for physically consistent reasons.
The sensitivity experiments reveal a non-linear relationship between LWP and surface temperature. Configurations with intermediate LWP (WDM6_SP, WDM6_SP_IN) produce the warmest simulated surface temperatures (−5.4 °C) despite having smaller LWP than WDM6_ICE (Table 3). This behavior is consistent with the longwave opacity threshold identified by Shupe and Intrieri (2004), in which clouds become effectively opaque to longwave radiation once LWP exceeds about 30 g m−2, so that LWDOWN is then governed primarily by cloud base temperature and height rather than by LWP magnitude. Above this threshold, further LWP increases primarily enhance cloud optical depth and reduce shortwave transmission, partially offsetting the longwave warming effect. The higher cloud fractions in these configurations (Fig. S2) further contribute to the shortwave differences. This compensation indicates that, from a surface energy perspective, configurations with intermediate LWP can produce temperature biases similar to or smaller than those of configurations that maximize liquid water.
4.4 Structural Constraints and Future Directions
Despite improved agreement with observed surface radiative forcing, all configurations underestimate total water path (TWP = LWP + IWP; 189 g m−2 versus 246 g m−2 observed at BAR). This underestimation reflects contributions from several sources.
Several microphysical processes contribute to this underestimation. WDM6 retains more moisture in the lower boundary layer than WDM6_ICE yet does not maintain liquid water, confirming that the ice-dominated behavior in WDM6 results from excessive vapor consumption by ice deposition rather than from insufficient moisture supply. The absence of INP recycling may also contribute, since when ice particles sublimate the released nuclei are not returned to the available INP population, permanently reducing the capacity for subsequent ice formation (Fu et al., 2019). Although WDM6_IN reproduces observed INP concentrations (Fig. 8c), total IWP remains comparable to WDM6 (33.5 versus 38.0 g m−2) because the Cooper curve redistributes ice from cloud ice to snow rather than reducing total ice content, indicating that correcting INP number alone is insufficient to improve Arctic ice representation when the ice growth pathway remains unconstrained.
The comparison between WDM6_SP_IN and WDM6_ICE demonstrates that structural differences beyond ice shape and nucleation introduce additional ice suppression. Although WDM6_ICE incorporates ice-enhancing mechanisms absent in WDM6_SP_IN (specifically contact freezing active below −2 °C and secondary ice production via the Hallett–Mossop process from −8 to −3 °C), its total ice content remains lower (IWP 10.6 vs. 22.5 g m−2 at BAR). This difference arises from several factors that act with differing importance in this case. The first is the prognostic treatment of cloud ice number concentration. Diagnostic schemes instantaneously recalculate ice number concentration from ice mass at each timestep, so that ice particles are replenished whenever mass recovers through deposition, creating a resilient ice number concentration. In contrast, prognostic treatment tracks cloud ice number concentration through explicit source and sink terms, so that once particles are removed by sublimation the number concentration stays low unless new nucleation occurs, rather than being restored from the ice mass at each step. Under the constrained nucleation and suppressed growth rates shown in Fig. 8, the prognostic formulation therefore keeps the cloud ice number concentration persistently low in this case. The second factor is the restricted temperature threshold for vapor deposition nucleation (−8 °C in WDM6_ICE vs. 0 °C in WDM6_SP_IN; see Appendix A3.2), which prevents the nucleation of new cloud ice over the warmer part of the cloud layer and thereby narrows the range over which the depleted ice number can be replenished. The third factor is the set of additional ice-phase processes (contact freezing, riming, and Hallett–Mossop multiplication), which in principle add ice but contribute little in this case, as detailed in the following paragraph. Among these, the prognostic treatment represents the most fundamental structural change, since it governs whether the ice number concentration can recover at all.
The limited influence of contact freezing and Hallett–Mossop mechanisms in WDM6_ICE reflects the compound effect of unfavorable environmental conditions and constrained particle growth. The cloud-layer temperatures in the M-PACE case ranged from −15 to −10 °C, outside the Hallett–Mossop activation window of −8 to −3 °C (Hallett and Mossop, 1974). As noted by Luo et al. (2008), M-PACE cloud temperatures fall outside this range. Additionally, the simulated mean effective ice radius remains small (5–13 µm; Fig. 3f), which is smaller than the particle sizes typically required for efficient riming (> 25–50 µm; Pruppacher and Klett, 2010). The riming process in WDM6_ICE (Piacw, accretion of cloud water by cloud ice) is parameterized to activate only when the mean-volume diameter of cloud ice exceeds 50 µm (Park and Lim, 2023), which the simulated sizes never satisfy, effectively precluding riming as a growth pathway. The spherical shape assumption thus creates a self-reinforcing constraint, since by limiting depositional growth it prevents cloud ice from reaching the sizes needed for riming and multiplication, confining the budget to a state dominated by snow in which cloud ice is nearly absent. The Hallett–Mossop mechanism represented in WDM6_ICE is therefore limited under the temperature range of this case, but secondary ice production has been reported to be important in many Arctic mixed-phase clouds, including for the M-PACE period when other mechanisms such as droplet shattering and ice–ice collisional breakup are considered (Zhao et al., 2021; Pasquier et al., 2022). The limited role identified here thus reflects both the specific conditions of this case and the particular secondary ice mechanism represented in the scheme, rather than a general inactivity of secondary ice production. Consistent with the regime-dependent response discussed in Sect. 4.2, this constraint acts differently across environments, moderating excessive ice production in mid-latitude systems (Park and Lim, 2023) while producing a more pronounced restructuring of the ice budget under the narrow Arctic temperature range.
The excessive droplet production in WDM6_ICE (∼ 890 cm−3) introduces additional feedback loops that reinforce ice suppression. In WDM6_ICE, immersion freezing following the Bigg (1953) parameterization contributes negligibly to ice production. Although the droplet number concentration is high, the small droplet sizes (effective radii ∼ 2.5–6 µm) reduce the per-droplet freezing probability, and the net immersion freezing rate remains insufficient to sustain ice formation. The prescribed CCN floor of 100 cm−3, which is the default value of the WDM6 scheme (Lim and Hong, 2010) amplifies this feedback asymmetrically. In WDM6, strong vapor deposition prevents sustained water supersaturation so the CCN reservoir remains largely inactive, with droplet concentrations below ∼ 7 cm−3 along the flight track, whereas in WDM6_ICE the suppressed Pidep allows sustained supersaturation and repeated CCN activation (Fig. 6a). Since Arctic CCN concentrations are generally well below 100 cm−3 (Mauritsen et al., 2011; Jung et al., 2018), the enforced minimum maintains a CCN source above observed values, sustaining droplet concentrations that reach ∼ 890 cm−3 along the flight track in WDM6_ICE, well above the observed ∼ 27 cm−3 (Fig. 3b). Systematic investigation of CCN sensitivity constitutes a separate research question beyond the scope of the present study. More fundamentally, the Bigg parameterization treats immersion freezing as a purely stochastic process without considering aerosol composition. Frameworks such as de Boer et al. (2010), which couple ice nucleation to insoluble material within droplets, or Ong et al. (2024), which incorporate cloud ice shape dependence, represent nucleation pathways structurally absent from WDM6_ICE and may be a useful direction for simulating cases such as the one examined here.
Beyond these microphysical factors, external conditions also influence the simulated clouds and provide a check on the robustness of the results. The water vapor profiles show that the ERA5 boundary conditions are drier than the observations within the cloud layer (Fig. S5), providing insufficient moisture for all configurations. The simulated clouds are also systematically lower than observed. The observed cloud top is near 1371 m, whereas the simulated cloud tops are lower, at 1162 m in WDM6_ICE and 873 m in WDM6 (Fig. S5). The potential temperature profiles indicate that the modelled inversion and boundary layer top are lower than observed, and this bias is already present in the ERA5 boundary conditions, whose cloud top (1182 m) also lies below the observed value. Because all experiments share the same ERA5 forcing and boundary layer scheme, this low bias is common to every configuration. Because the relative comparison of microphysical sensitivities is the focus of this study rather than the absolute cloud height, this bias does not alter the conclusions, which rest on the relative differences between configurations. The upward shift of the LWC peak from WDM6 to WDM6_ICE (Fig. 7) follows from this difference in cloud top. The suppression of ice deposition in WDM6_ICE allows more supercooled liquid to persist and the cloud top to remain higher and colder, and the LWC peak, which forms near the cloud top below the inversion, rises accordingly, whereas the stronger depletion of liquid by ice deposition in WDM6 lowers its cloud top further. The stronger radiative cooling at the colder cloud top is in turn consistent with a deeper and more thoroughly mixed boundary layer, since the circulation in stratocumulus layers is driven largely by radiative cooling near the cloud top (Wood, 2012). To further assess robustness to the boundary layer parameterization, additional simulations used the Shin and Hong (2015) PBL scheme. The overall LWC sensitivity hierarchy and the dominant role of ice shape modification are consistent across both schemes (Fig. S6). The magnitude of IWC reduction in WDM6_ICE varies between schemes (peak IWC ∼ 0.01 g m−3 with YSU versus ∼ 0.03 g m−3 with Shin and Hong, 2015), indicating some interaction between the prognostic ice treatment and boundary layer mixing, while the qualitative regime-dependent responses remain robust.
This study evaluated the behavior of the WDM6 and WDM6_ICE microphysics schemes under Arctic mixed-phase cloud conditions using the M-PACE case (9–10 October 2004), with sensitivity experiments isolating the effects of ice shape and nucleation modifications. The two schemes produce opposing biases: WDM6 severely underestimates liquid water due to excessive ice deposition, while WDM6_ICE substantially suppresses cloud ice and shifts the ice budget to a snow-dominated state, maintaining persistent liquid water but with droplet concentrations well above those observed. The sensitivity decomposition shows that ice shape modification is the dominant factor, reducing vapor deposition onto cloud ice (Pidep) by approximately 98 % and total IWC approximately 70 %. Nucleation modification alone (WDM6_IN) does not reduce total ice content but instead redistributes ice from the cloud ice to the snow category, indicating that correcting INP number without constraining ice growth pathways is insufficient for improving Arctic ice representation. The comparison between WDM6_SP_IN and WDM6_ICE indicates that the remaining structural differences, primarily the prognostic ice number treatment, produce additional cloud ice suppression, as irreversible particle loss through sublimation is not compensated by sufficient nucleation under Arctic conditions. While Park and Lim (2023) showed that the same WDM6_ICE modifications reduced cloud ice mixing ratio but maintained cloud ice throughout the cloud layer in mid-latitude cases, the present results show a more pronounced response under Arctic conditions, with cloud ice nearly depleted and ice number concentration decreased rather than increased, suggesting that the response to these modifications is regime-dependent. This interpretation rests on a single M-PACE case, and additional cases under different Arctic conditions, including cases within the Hallett–Mossop temperature window or with stronger primary nucleation, are needed to test whether the contrast persists more generally.
Surface energy analysis indicates that balanced phase partitioning matters more than liquid water maximization for radiative bias reduction, since configurations with intermediate LWP yield surface temperature biases no larger than those of the configuration that maximizes liquid water.
These results highlight several structural characteristics of the current WDM6_ICE framework that constrain its Arctic application: the absence of INP recycling, the CCN floor that sustains droplet concentration above observed values under suppressed ice conditions, the lack of aerosol-aware immersion freezing, and the fixed spherical ice shape that prevents cloud ice particles from reaching sizes necessary for secondary ice production. These constraints suggest that improving Arctic MPC representation in bulk microphysics schemes may benefit from shape-dependent ice growth formulations and closer coupling between aerosol properties and ice nucleation, though the effectiveness of such approaches remains to be tested.
The prognostic treatment of cloud ice number concentration in WDM6_ICE represents a physically meaningful advancement over the diagnostic approach, as demonstrated by its improved performance in mid-latitude environments (Park and Lim, 2023). Building on this foundation, future development toward Arctic application may benefit from incorporating mechanisms such as INP recycling (Fu et al., 2019), shape-dependent ice growth formulations (e.g., Morrison and Milbrandt, 2015), and aerosol-aware ice nucleation (e.g., de Boer et al., 2010; Ong et al., 2024). Such extensions would help bridge the gap between mid-latitude and Arctic performance, contributing to more physically consistent scheme behavior across diverse climate regimes. These findings are based on a single M-PACE case and should be interpreted accordingly. The case was selected as a persistent, single-layer mixed-phase cloud under a steady cold-air outbreak, which isolates the microphysical pathways governing phase partitioning. The regime-dependent behavior reported here is therefore presented as a mechanism demonstrated for this case, and its quantitative generality across the broader range of Arctic mixed-phase conditions remains to be tested with additional cases in future work.
This appendix focuses on the parameterizations most relevant to the present sensitivity experiments.
A1 WDM6 parameterizations
The baseline WDM6 scheme uses temperature-based ice nucleation and ice-mass-dependent cloud ice number concentration. Ice particles are assumed to have bullet shapes with coefficients from Heymsfield and Iaquinta (2000).
A1.1 Ice-nucleating particle (INP) number concentration (Diagnostic)
(Note: INP number concentration presented as Ni0 in Hong et al., 2004, Nind in Park and Lim, 2023.)
A1.2 Cloud ice number concentration (Diagnostic)
-
Ni has no memory of previous timesteps
-
Any change in qI immediately adjusts Ni
-
Ice number population recovers instantly when ice mass increases
-
Sink terms (sublimation, sedimentation) affect qi, which then diagnostically adjusts Ni. This formulation creates tight coupling between ice mass and number, preventing independent evolution of particle size distributions.
A1.3 Ice particle properties (Single bullet Shape)
Mass-diameter relationship
Fall velocity-diameter relationship
A2 Sensitivity Experiment Modifications
A2.1 Spherical ice shape
Based on Brown and Francis (1995) and Korolev and Isaac (2003), ice particles are assumed spherical with bulk density (ρi).
Mass-diameter relationship
Fall velocity-diameter relationship
A2.2 Modified Ice Nucleation
Based on Cooper (1986) temperature-dependent nucleation with observational upper limit (DeMott et al., 2010), active at T < 0 °C. Vapor depositional/condensation freezing.
A3 WDM6_ICE Parameterizations
WDM6_ICE combines spherical ice shape (Appendix A2.1) with prognostic cloud ice number concentration treatment and modified nucleation implementation. Although WDM6_ICE includes additional processes such as contact freezing, Hallett-Mossop multiplication, and graupel category (see Park and Lim, 2023 for complete detail), this appendix focuses on the parameterizations most relevant to the present sensitivity experiments.
A3.1 Prognostic Cloud Ice Number Concentration
WDM6_ICE treats cloud ice number concentration (Ni) as a prognostic variable. The ice size distribution is represented by a gamma function:
Where the intercept (N0i) and slope (λi) are diagnosed from prognostic Ni and ice mixing ratio (qi) through mass-diameter relationships (Sect. A2.1). The shape parameter (μi) is prescribed. The prognostic Ni evolves through nucleation (vapor deposition, contact freezing, immersion freezing), ice multiplication (Hallett–Mossop), sublimation, melting, aggregation, and sedimentation.
This prognostic treatment fundamentally differs from the diagnostic approach (Appendix A1.2) in how Ni responds to changes in ice mass:
-
Diagnostic (WDM6): Ni recalculated every timestep → if qi recovers through deposition, Ni instantly recovers
-
Prognostic (WDM6_ICE): Ni evolves through explicit source/sink terms → if particles sublimate or sediment, they are permanently removed from Ni; recovery requires new nucleation events.
This decoupling creates potential for irreversible Ni depletion when: (1) nucleation is constrained (e.g., WDM6_IN: 191 vs 3320 m−3), limiting the source term, and (2) particle growth is suppressed (e.g., WDM6_SP: spherical ice reducing deposition), increasing relative importance of sink terms (sublimation, sedimentation).
A3.2 Modified Ice Nucleation Implementation
INP number concentration (Nind) remains diagnostic following the Cooper curve (Appendix A2.2), but vapor depositional/condensational freezing (Ninud) is implemented differently from WDM6_IN and WDM6_SP_IN. The key difference is the temperature threshold: WDM6_IN and WDM6_SP_IN activate Ninud at T < 0 °C, while WDM6_ICE restricts activation to T < −8 °C.
The prognostic formulation calculates cloud ice number and mass increments as:
Where Mind is the initial mass of the nucleated cloud ice, calculated as with Rind (10 µm) being initial radius of the nucleated cloud ice. This approach directly updates prognostic Ni, which then affects size distribution parameters and subsequent microphysical processes.
This differs from WDM6_IN (Appendix A2.2), which converts Nind directly to ice mass (Pigen) and diagnoses Ni from qi at each time step. Between 0 and −8 °C, WDM6_ICE does not nucleate new cloud ice through vapor deposition, but existing ice particles continue to grow via vapor deposition (Pidep, active at T< 0 °C), immersion freezing, and contact freezing (T< −2 °C).
The WRF model version 4.3.1 is described in Skamarock et al. (2021) and available at https://doi.org/10.5065/1dfh-6p97.
Initial and boundary conditions were obtained from the ERA5 reanalysis: ERA5 pressure level data (https://doi.org/10.24381/cds.bd0915c6, Hersbach et al., 2023a) and ERA5 single level data (https://doi.org/10.24381/cds.adbb2d47, Hersbach et al., 2023b).
Observation data can be accessed through the Atmospheric Radiation Measurement (ARM) User Facility. Aircraft in-situ microphysics data from the M-PACE campaign (McFarquhar, 2008) are available from the ARM Data Center at https://adc.arm.gov/discovery/results/iopShortName::nsa2004arcticcld (last access: 20 July 2026). Access requires free registration at https://adc.arm.gov (last access: 20 July 2026). Surface station data are available from the ARM Data Center: ARMBEATM (https://doi.org/10.5439/1333748, Chen and Xie, 2001), ACRED (https://doi.org/10.5439/1995948, Xie, 1999), MWRRET (https://doi.org/10.5439/1027369, Zhang, 2001), QCRAD (https://doi.org/10.5439/1027372, Zhang, 1998), and radiosonde (https://doi.org/10.5439/1595321, Keeler et al., 2002).
The bathymetry and land elevation shown in Fig. 1b are from the GEBCO_2023 Grid (GEBCO Compilation Group, 2023; https://doi.org/10.5285/f98b053b-0cbc-6c23-e053-6c86abc0af7b).
The model code for WDM6_ICE is publicly available at Zenodo (https://doi.org/10.5281/zenodo.7395819, Park, 2023). The model codes for WDM6_SP and WDM6_SP_IN experiments, along with figure generation scripts, are archived at Zenodo (https://doi.org/10.5281/zenodo.19049015, Sung, 2026). Model outputs are available upon request (Hyun-Joon Sung via sereno2359@gmail.com).
The supplement related to this article is available online at https://doi.org/10.5194/gmd-19-7069-2026-supplement.
Hyun-Joon Sung: Conceptualization, Formal analysis, Visualization, Writing – original draft, Kyo-Sun Sunny Lim: Validation, Writing – review and editing, Song-You Hong: Validation, Writing – review and editing, JiHoon Shin: Validation, Baek-Min Kim: Supervision, Funding acquisition, Ji-Hun Choi: Visualization
The contact author has declared that none of the authors has any competing interests.
Publisher's note: Copernicus Publications remains neutral with regard to jurisdictional claims made in the text, published maps, institutional affiliations, or any other geographical representation in this paper. The authors bear the ultimate responsibility for providing appropriate place names. Views expressed in the text are those of the authors and do not necessarily reflect the views of the publisher.
This research was supported by the Korea Polar Research Institute (KOPRI) grant funded by the Ministry of Oceans and Fisheries (grant nos. RS-2021-KS211500 and PE25010).
This paper was edited by Ulas Im and reviewed by two anonymous referees.
Bigg, E. K.: The Supercooling of Water, Proc. Phys. Soc. Sect. B, 66, 688, https://doi.org/10.1088/0370-1301/66/8/309, 1953.
Brown, P. R. A. and Francis, P. N.: Improved Measurements of the Ice Water Content in Cirrus Using a Total-Water Probe, J. Atmos. Ocean. Tech., 12, 410–414, https://doi.org/10.1175/1520-0426(1995)012<0410:IMOTIW>2.0.CO;2, 1995.
Cesana, G., Kay, J. E., Chepfer, H., English, J. M., and De Boer, G.: Ubiquitous low-level liquid-containing Arctic clouds: New observations and climate model constraints from CALIPSO-GOCCP, Geophys. Res. Lett., 39, https://doi.org/10.1029/2012GL053385, 2012.
Chen, F. and Dudhia, J.: Coupling and advanced land surface-hydrology model with the Penn State-NCAR MM5 modeling system. Part I: Model implementation and sensitivity, Mon. Weather Rev., 129, 569–585, https://doi.org/10.1175/1520-0493(2001)129<0569:CAALSH>2.0.CO;2, 2001.
Chen, X. and Xie, S.: ARM Best Estimate Data Products (ARMBEATM), 2001-01-01 to 2023-12-31, North Slope Alaska (NSA), Central Facility, Barrow AK (C1), Atmospheric Radiation Measurement (ARM) User Facility [data set], https://doi.org/10.5439/1333748, 2001.
Comin, A. N., Schumacher, V., and Justino, F.: Impact of different microphysical parameterizations on extreme snowfall events in the Southern Andes, Weather Clim. Extrem., 21, 65–75, https://doi.org/10.1016/J.WACE.2018.07.001, 2018.
Cooper, W. A.: Ice Initiation in Natural Clouds, Meteorol. Monogr., 21, 29–32, https://doi.org/10.1175/0065-9401-21.43.29, 1986.
Cotton, W. R., Tripoli, G. J., Rauber, R. M., and Mulvihill, E. A.: Numerical Simulation of the Effects of Varying Ice Crystal Nucleation Rates and Aggregation Processes on Orographic Snowfall, J. Appl. Meteorol. Climatol., 25, 1658–1680, https://doi.org/10.1175/1520-0450(1986)025<1658:NSOTEO>2.0.CO;2, 1986.
de Boer, G., Hashino, T., and Tripoli, G. J.: Ice nucleation through immersion freezing in mixed-phase stratiform clouds: Theory and numerical simulations, Atmos. Res., 96, 315–324, https://doi.org/10.1016/j.atmosres.2009.09.012, 2010.
DeMott, P. J., Prenni, A. J., Liu, X., Kreidenweis, S. M., Petters, M. D., Twohy, C. H., Richardson, M. S., Eidhammer, T., and Rogers, D. C.: Predicting global atmospheric ice nuclei distributions and their impacts on climate, P. Natl. Acad. Sci. USA, 107, 11217–11222, https://doi.org/10.1073/pnas.0910818107, 2010.
Fridlind, A. M., Ackerman, A. S., McFarquhar, G., Zhang, G., Poellot, M. R., DeMott, P. J., Prenni, A. J., and Heymsfield, A. J.: Ice properties of single-layer stratocumulus during the Mixed-Phase Arctic Cloud Experiment: 2. Model results, J. Geophys. Res.-Atmos., 112, D24202, https://doi.org/10.1029/2007JD008646, 2007.
Fridlind, A. M., Ackerman, A. S., Chaboureau, J. P., Fan, J., Grabowski, W. W., Hill, A. A., Jones, T. R., Khaiyer, M. M., Liu, G., Minnis, P., Morrison, H., Nguyen, L., Park, S., Petch, J. C., Pinty, J. P., Schumacher, C., Shipway, B. J., Varble, A. C., Wu, X., Xie, S., and Zhang, M.: A comparison of TWP-ICE observational data with cloud-resolving model results, J. Geophys. Res.-Atmos., 117, https://doi.org/10.1029/2011JD016595, 2012.
Fu, S., Deng, X., Shupe, M. D., and Xue, H.: A modelling study of the continuous ice formation in an autumnal Arctic mixed-phase cloud case, Atmos. Res., 228, 77–85, https://doi.org/10.1016/J.ATMOSRES.2019.05.021, 2019.
GEBCO Compilation Group: The GEBCO_2023 Grid – a continuous terrain model of the global oceans and land, NERC EDS British Oceanographic Data Centre NOC [data set], https://doi.org/10.5285/f98b053b-0cbc-6c23-e053-6c86abc0af7b, 2023.
Hallett, J. and Mossop, S. C.: Production of secondary ice particles during the riming process, Nature, 249, 26–28, https://doi.org/10.1038/249026A0, 1974.
Hersbach, H., Bell, B., Berrisford, P., Hirahara, S., Horányi, A., Muñoz-Sabater, J., Nicolas, J., Peubey, C., Radu, R., Schepers, D., Simmons, A., Soci, C., Abdalla, S., Abellan, X., Balsamo, G., Bechtold, P., Biavati, G., Bidlot, J., Bonavita, M., De Chiara, G., Dahlgren, P., Dee, D., Diamantakis, M., Dragani, R., Flemming, J., Forbes, R., Fuentes, M., Geer, A., Haimberger, L., Healy, S., Hogan, R. J., Hólm, E., Janisková, M., Keeley, S., Laloyaux, P., Lopez, P., Lupu, C., Radnoti, G., de Rosnay, P., Rozum, I., Vamborg, F., Villaume, S., and Thépaut, J. N.: The ERA5 global reanalysis, Q. J. Roy. Meteor. Soc., 146, 1999–2049, https://doi.org/10.1002/QJ.3803, 2020.
Hersbach, H., Bell, B., Berrisford, P., Biavati, G., Horányi, A., Muñoz Sabater, J., Nicolas, J., Peubey, C., Radu, R., Rozum, I., Schepers, D., Simmons, A., Soci, C., Dee, D., and Thépaut, J.-N.: ERA5 hourly data on pressure levels from 1940 to present, Copernicus Climate Change Service (C3S) Climate Data Store (CDS) [data set], https://doi.org/10.24381/cds.bd0915c6, 2023a.
Hersbach, H., Bell, B., Berrisford, P., Biavati, G., Horányi, A., Muñoz Sabater, J., Nicolas, J., Peubey, C., Radu, R., Rozum, I., Schepers, D., Simmons, A., Soci, C., Dee, D., and Thépaut, J.-N.: ERA5 hourly data on single levels from 1940 to present, Copernicus Climate Change Service (C3S) Climate Data Store (CDS) [data set], https://doi.org/10.24381/cds.adbb2d47, 2023b.
Heymsfield, A. J. and Iaquinta, J.: Cirrus Crystal Terminal Velocities, J. Atmos. Sci., 57, 916–938, https://doi.org/10.1175/1520-0469(2000)057<0916:CCTV>2.0.CO;2, 2000.
Hong, S.-Y., Dudhia, J., and Chen, S.-H.: A Revised Approach to Ice Microphysical Processes for the Bulk Parameterization of Clouds and Precipitation, Mon. Weather Rev., 132, 103–120, https://doi.org/10.1175/1520-0493(2004)132<0103:ARATIM>2.0.CO;2, 2004.
Hong, S. Y., Noh, Y., and Dudhia, J.: A New Vertical Diffusion Package with an Explicit Treatment of Entrainment Processes, Mon. Weather Rev., 134, 2318–2341, https://doi.org/10.1175/MWR3199.1, 2006.
Iacono, M. J., Delamere, J. S., Mlawer, E. J., Shephard, M. W., Clough, S. A., and Collins, W. D.: Radiative forcing by long-lived greenhouse gases: Calculations with the AER radiative transfer models, J. Geophys. Res.-Atmos., 113, https://doi.org/10.1029/2008JD009944, 2008.
Jiménez, P. A., Dudhia, J., González-Rouco, J. F., Navarro, J., Montávez, J. P., and García-Bustamante, E.: A Revised Scheme for the WRF Surface Layer Formulation, Mon. Weather Rev., 140, 898–918, https://doi.org/10.1175/MWR-D-11-00056.1, 2012.
Jung, C. H., Yoon, Y. J., Kang, H. J., Gim, Y., Lee, B. Y., Ström, J., Krejci, R., and Tunved, P.: The seasonal characteristics of cloud condensation nuclei (CCN) in the arctic lower troposphere, Tellus B, 70, 1–13, https://doi.org/10.1080/16000889.2018.1513291, 2018.
Keeler, E., Burk, K., and Kyrouac, J.: Balloon-Borne Sounding System (SONDEWNPN), 2002-04-28 to 2026-07-17, North Slope Alaska (NSA), Central Facility, Barrow AK (C1), Atmospheric Radiation Measurement (ARM) User Facility [data set], https://doi.org/10.5439/1595321, 2002.
Klein, S. A., McCoy, R. B., Morrison, H., Ackerman, A. S., Avramov, A., de Boer, G., Chen, M., Cole, J. N. S., del Genio, A. D., Falk, M., Foster, M. J., Fridlind, A., Golaz, J. C., Hashino, T., Harrington, J. Y., Hoose, C., Khairoutdinov, M. F., Larson, V. E., Liu, X., Luo, Y., McFarquhar, G. M., Menon, S., Neggers, R. A. J., Park, S., Poellot, M. R., Schmidt, J. M., Sednev, I., Shipway, B. J., Shupe, M. D., Spangenberg, D. A., Sud, Y. C., Turner, D. D., Veron, D. E., von Salzen, K., Walker, G. K., Wang, Z., Wolf, A. B., Xie, S., Xu, K. M., Yang, F., and Zhang, G.: Intercomparison of model simulations of mixed-phase clouds observed during the ARM Mixed-Phase Arctic Cloud Experiment. I: Single-layer cloud, Q. J. Roy. Meteor. Soc., 135, 979–1002, https://doi.org/10.1002/qj.416, 2009.
Korolev, A. and Isaac, G.: Roundness and Aspect Ratio of Particles in Ice Clouds, J. Atmos. Sci., 60, 1795–1808, https://doi.org/10.1175/1520-0469(2003)060<1795:RAAROP>2.0.CO;2, 2003.
Lim, K. S. S. and Hong, S. Y.: Development of an Effective Double-Moment Cloud Microphysics Scheme with Prognostic Cloud Condensation Nuclei (CCN) for Weather and Climate Models, Mon. Weather Rev., 138, 1587–1612, https://doi.org/10.1175/2009MWR2968.1, 2010.
Luo, Y., Xu, K. M., Morrison, H., and McFarquhar, G.: Arctic Mixed-Phase Clouds Simulated by a Cloud-Resolving Model: Comparison with ARM Observations and Sensitivity to Microphysics Parameterizations, J. Atmos. Sci., 65, 1285–1303, https://doi.org/10.1175/2007JAS2467.1, 2008.
Mauritsen, T., Sedlar, J., Tjernström, M., Leck, C., Martin, M., Shupe, M., Sjogren, S., Sierau, B., Persson, P. O. G., Brooks, I. M., and Swietlicki, E.: An Arctic CCN-limited cloud-aerosol regime, Atmos. Chem. Phys., 11, 165–173, https://doi.org/10.5194/acp-11-165-2011, 2011.
McFarquhar, G.: In-Situ Microphysics from the MPACE IOP, Atmospheric Radiation Measurement (ARM) User Facility [data set], https://doi.org/10.5439/1171943, 2008.
McFarquhar, G. M., Zhang, G., Poellot, M. R., Kok, G. L., McCoy, R., Tooman, T., Fridlind, A., and Heymsfield, A. J.: Ice properties of single-layer stratocumulus during the Mixed-Phase Arctic Cloud Experiment: 1. Observations, J. Geophys. Res.-Atmos., 112, https://doi.org/10.1029/2007JD008633, 2007.
McMillen, J. D. and James Steenburgh, W.: Impact of Microphysics Parameterizations on Simulations of the 27 October 2010 Great Salt Lake–Effect Snowstorm, Weather Forecast., 30, 136–152, https://doi.org/10.1175/WAF-D-14-00060.1, 2015.
Morrison, H. and Milbrandt, J. A.: Parameterization of Cloud Microphysics Based on the Prediction of Bulk Ice Particle Properties. Part I: Scheme Description and Idealized Tests, J. Atmos. Sci., 72, 287–311, https://doi.org/10.1175/JAS-D-14-0065.1, 2015.
Morrison, H. and Pinto, J. O.: Intercomparison of Bulk Cloud Microphysics Schemes in Mesoscale Simulations of Springtime Arctic Mixed-Phase Stratiform Clouds, Mon. Weather Rev., 134, 1880–1900, https://doi.org/10.1175/MWR3154.1, 2006.
Morrison, H., Curry, J. A., Khvorostyanov, V. I., Morrison, H., Curry, J. A., and Khvorostyanov, V. I.: A New Double-Moment Microphysics Parameterization for Application in Cloud and Climate Models. Part I: Description, J. Atmos. Sci., 62, 1665–1677, https://doi.org/10.1175/JAS3446.1, 2005.
Morrison, H., McCoy, R. B., Klein, S. A., Xie, S., Luo, Y., Avramov, A., Chen, M., Cole, J. N. S., Falk, M., Foster, M. J., del Genio, A. D., Harrington, J. Y., Hoose, C., Khairoutdinov, M. F., Larson, V. E., Liu, X., McFarquhar, G. M., Poellot, M. R., von Salzen, K., Shipway, B. J., Shupe, M. D., Sud, Y. C., Turner, D. D., Veron, D. E., Walker, G. K., Wang, Z., Wolf, A. B., Xu, K. M., Yang, F., and Zhang, G.: Intercomparison of model simulations of mixed-phase clouds observed during the ARM Mixed-Phase Arctic Cloud Experiment. II: Multilayer cloud, Q. J. Roy. Meteor. Soc., 135, 1003–1019, https://doi.org/10.1002/qj.415, 2009.
Morrison, H., De Boer, G., Feingold, G., Harrington, J., Shupe, M. D., and Sulia, K.: Resilience of persistent Arctic mixed-phase clouds, Nat. Geosci., 5, 11–17, https://doi.org/10.1038/ngeo1332, 2012.
Morrison, H., van Lier-Walqui, M., Fridlind, A. M., Grabowski, W. W., Harrington, J. Y., Hoose, C., Korolev, A., Kumjian, M. R., Milbrandt, J. A., Pawlowska, H., Posselt, D. J., Prat, O. P., Reimel, K. J., Shima, S. I., van Diedenhoven, B., and Xue, L.: Confronting the Challenge of Modeling Cloud and Precipitation Microphysics, J. Adv. Model. Earth Sy., 12, https://doi.org/10.1029/2019MS001689, 2020.
Nam, J., Cho, Y., Lim, K. S., Jun, S. Y., Kim, J. H., Park, S. J., and Kim, S. W.: Evaluation of Four Cloud Microphysical Schemes Simulating Arctic Low-Level Clouds Observed During the ACLOUD Experiment, Asia-Pacific J. Atmos. Sci., 60, 727–740, https://doi.org/10.1007/s13143-024-00378-0, 2024.
Ong, C. R. U. I., Koike, M., Hashino, T., and Miura, H.: Responses of Simulated Arctic Mixed-Phase Clouds to Parameterized Ice Particle Shape, J. Atmos. Sci., 81, 125–152, https://doi.org/10.1175/JAS-D-23-0015.1, 2024.
Park, S.-Y.: Code for JAMES publication – Implementation of prognostic cloud ice number concentrations for the Weather Research and Forecasting (WRF) Double-Moment 6-class (WDM6) microphysics scheme, Zenodo [code and data set], https://doi.org/10.5281/zenodo.7395819, 2023.
Park, S. Y. and Lim, K. S. S.: Implementation of Prognostic Cloud Ice Number Concentrations for the Weather Research and Forecasting (WRF) Double-Moment 6-Class (WDM6) Microphysics Scheme, J. Adv. Model. Earth Sy., 15, e2022MS003009, https://doi.org/10.1029/2022MS003009, 2023.
Pasquier, J. T., Henneberger, J., Ramelli, F., Lauber, A., David, R. O., Wieder, J., Carlsen, T., Gierens, R., Maturilli, M., and Lohmann, U.: Conditions favorable for secondary ice production in Arctic mixed-phase clouds, Atmos. Chem. Phys., 22, 15579–15601, https://doi.org/10.5194/acp-22-15579-2022, 2022.
Possner, A., Pfannkuch, K., and Ramadoss, V.: Cloud-Resolving ICON Simulations of Secondary Ice Production in Arctic Mixed-Phase Stratocumuli Observed during M-PACE, J. Atmos. Sci., 81, 417–434, https://doi.org/10.1175/JAS-D-23-0069.1, 2024.
Prenni, A. J., Harrington, J. Y., Tjernström, M., DeMott, P. J., Avramov, A., Long, C. N., Kreidenweis, S. M., Olsson, P. Q., and Verlinde, J.: Can Ice-Nucleating Aerosols Affect Arctic Seasonal Climate?, B. Am. Meteorol. Soc., 88, 541–550, https://doi.org/10.1175/BAMS-88-4-541, 2007.
Pruppacher, H. R. and Klett, J. D.:Microphysics of Clouds and Precipitation, 2nd Edn., Atmospheric and Oceanographic Sciences Library, Vol. 18, Springer, https://doi.org/10.1007/978-0-306-48100-0, 2010.
Shin, H. H. and Hong, S. Y.: Representation of the Subgrid-Scale Turbulent Transport in Convective Boundary Layers at Gray-Zone Resolutions, Mon. Weather Rev., 143, 250–271, https://doi.org/10.1175/MWR-D-14-00116.1, 2015.
Shupe, M. D. and Intrieri, J. M.: Cloud Radiative Forcing of the Arctic Surface: The Influence of Cloud Properties, Surface Albedo, and Solar Zenith Angle, J. Climate, 17, 616–628, https://doi.org/10.1175/1520-0442(2004)017<0616:CRFOTA>2.0.CO;2, 2004.
Shupe, M. D., Daniel, J. S., de Boer, G., Eloranta, E. W., Kollias, P., Long, C. N., Luke, E. P., Turner, D. D., and Verlinde, J.: A Focus On Mixed-Phase Clouds: The Status of Ground-Based Observational Methods, B. Am. Meteorol. Soc., 89, 1549–1562, https://doi.org/10.1175/2008BAMS2378.1, 2008.
Skamarock, W. C., Klemp, J. B., Dudhia, J., Gill, D. O., Liu, Z., Berner, J., Wang, W., Powers, J. G., Duda, M. G., Barker, D. M., and Huang, X.-Y.: A Description of the Advanced Research WRF Model Version 4.3, NCAR Tech. Note NCAR/TN-556+STR, https://doi.org/10.5065/1dfh-6p97, 2021.
Solomon, A., Morrison, H., Persson, O., Shupe, M. D., and Bao, J. W.: Investigation of microphysical parameterizations of snow and ice in arctic clouds during M-PACE through model observation comparisons, Mon. Weather Rev., 137, 3110–3128, https://doi.org/10.1175/2009MWR2688.1, 2009.
Sung, H.-J.: Code for: Sensitivity of Arctic mixed-phase cloud simulations to ice microphysical modifications in the WDM6 scheme of WRF (v4.3.1), Zenodo [code], https://doi.org/10.5281/zenodo.19049015, 2026.
hompson, G., Field, P. R., Rasmussen, R. M., and Hall, W. D.: Explicit Forecasts of Winter Precipitation Using an Improved Bulk Microphysics Scheme. Part II: Implementation of a New Snow Parameterization, Mon. Weather Rev., 136, 5095–5115, https://doi.org/10.1175/2008MWR2387.1, 2008.
Turner, D. D., Vogelmann, A. M., Austin, R. T., Barnard, J. C., Cady-Pereira, K., Chiu, J. C., Clough, S. A., Flynn, C., Khaiyer, M. M., Liljegren, J., Johnson, K., Lin, B., Long, C., Marshak, A., Matrosov, S. Y., McFarlane, S. A., Miller, M., Min, Q., Minnis, P., O'Hirok, W., Wang, Z., and Wiscombe, W.: Thin Liquid Water Clouds: Their Importance and Our Challenge, B. Am. Meteorol. Soc., 88, 177–190, https://doi.org/10.1175/BAMS-88-2-177, 2007.
Verlinde, J., Harrington, J. Y., McFarquhar, G. M., Yannuzzi, V. T., Avramov, A., Greenberg, S., Johnson, N., Zhang, G., Poellot, M. R., Mather, J. H., Turner, D. D., Eloranta, E. W., Zak, B. D., Prenni, A. J., Daniel, J. S., Kok, G. L., Tobin, D. C., Holz, R., Sassen, K., Spangenberg, D., Minnis, P., Tooman, T. P., Ivey, M. D., Richardson, S. J., Bahrmann, C. P., Shupe, M., DeMott, P. J., Heymsfield, A. J., and Schofield, R.: The Mixed-Phase Arctic Cloud Experiment, B. Am. Meteorol. Soc., 88, 205–222, https://doi.org/10.1175/BAMS-88-2-205, 2007.
Wood, R.: Stratocumulus Clouds, Mon. Weather Rev., 140, 2373–2423, https://doi.org/10.1175/MWR-D-11-00121.1, 2012.
Xie, S.: ARM Cloud Retrieval Ensemble Data (ACRED), 1999-01-01 to 2008-12-31, North Slope Alaska (NSA), Central Facility, Barrow AK (C1), Atmospheric Radiation Measurement (ARM) User Facility [data set], https://doi.org/10.5439/1995948, 1999.
Zhang, D.: Data Quality Assessment for ARM Radiation Data (QCRAD1LONG), 1998-02-15 to 2026-07-16, North Slope Alaska (NSA), Central Facility, Barrow AK (C1), Atmospheric Radiation Measurement (ARM) User Facility [data set], https://doi.org/10.5439/1027372, 1998.
Zhang, D.: MWR Retrievals (MWRRET1LILJCLOU), 2001-04-01 to 2025-12-31, North Slope Alaska (NSA), Central Facility, Barrow AK (C1), Atmospheric Radiation Measurement (ARM) User Facility [data set], https://doi.org/10.5439/1027369, 2001.
Zhao, X., Liu, X., Phillips, V. T. J., and Patade, S.: Impacts of secondary ice production on Arctic mixed-phase clouds based on ARM observations and CAM6 single-column model simulations, Atmos. Chem. Phys., 21, 5685–5703, https://doi.org/10.5194/acp-21-5685-2021, 2021.