
the Creative Commons Attribution 4.0 License.
the Creative Commons Attribution 4.0 License.
 | 30 Jul 2026
GEE-DisALEXI: cloud-based implementation of the DisALEXI model for evapotranspiration monitoring using Google Earth Engine
Yun Yang
Martha Anderson
Charles Morton
Yanghui Kang
Feng Gao
Weina Duan
Hui Liu
John Volk
Christopher Hain
Evapotranspiration (ET), a key component of the terrestrial water and energy cycles, is essential for understanding ecosystem productivity, water supplies, vegetation water use, and vegetation health. While traditional ground-based methods offer direct ET measurements, they are limited in spatial coverage and scalability. Two Source Energy Balance (TSEB) based satellite remote sensing ET retrieval algorithms have emerged as a powerful tool for estimating ET across diverse landscapes, providing robust field-to-regional ET estimates. With increasing needs for field-scale ET data for applications in agriculture, forest and water resources management, traditional ET computing relying on local servers is challenged for data storage and computing capability. The integration of ET models into the cloud-based platform via Google Earth Engine (GEE) enables scalable, high-resolution ET data production and delivery to stakeholders. This paper presents the cloud implementation of Disaggregation of the Atmosphere Land Exchange Inverse model (DisALEXI) on GEE, detailing technical enhancements, model evaluation across biomes and climate zones, and comparison with water balance estimated ET at basin-scale. Among all the land cover types assessed, GEE-DisALEXI consistently exhibited the best performance in croplands across all time scales, particularly during the growing season, where the model achieves a normalized MAE of 16.8 % at monthly timesteps. The annual bias of DisALEXI ET comparing with water balance estimated ET at Hydrologic Unit Code (HUC) 08 basins is −0.36 %. An anomaly of the ratio between ET and reference ET is calculated at regional scale and is compared with US. Drought Monitor data to explore the capability of using ET metrics for drought monitoring over different climate zones. The ET metric shows good correlation with US. Drought Monitor drought signal and is the strongest over humid areas. We also discuss the unique features, current limitations, and future directions for improving GEE-DisALEXI, including opportunities for enhanced forcing data and parameterization, to advance cloud-based ET modeling for water and agriculture management.
- Article
(7015 KB) - Full-text XML
- BibTeX
- EndNote


Evapotranspiration (ET), the combined process of evaporation and transpiration, plays a central role in the terrestrial water and energy cycles (Anderson et al., 2012; Yang et al., 2023). Because the process of ET takes a large amount of energy to convert liquid water into vapor, it contributes to the Earth's surface energy redistribution (Brutsaert, 2023). ET directly influences weather and climate patterns and is a key determinant in understanding ecosystem productivity (Xiao et al., 2021), water supplies (Liu et al., 2025), vegetation water use (Gowda et al., 2008; Yang et al., 2017a) and vegetation health (Yang et al., 2021a). As such, field-scale ET information at regional scale is fundamental for applications ranging from precision agriculture (Aragon et al., 2018; Kustas et al., 2022) to forest management (Isaacson et al., 2023; Yang et al., 2017a). Particularly in water-limited regions, ET serves as a critical indicator of water stress, making it an essential variable for supporting agriculture and water resource management (Melton et al., 2021). ET can also provide critical early warning signals regarding vegetation stress onset, which can be important for agriculture and forest management (Anderson et al., 2016; Otkin et al., 2014; Yang et al., 2021b).
Traditionally, ET measurements have relied on ground-based methods such as sap flow sensor, lysimeters and eddy covariance systems providing plant-based to footprint-scale (100–1000 m, depending on tower height) measurements. While these methods offer high accuracy, they are often time and labor consuming and limited in spatial coverage and scalability. In response to these limitations, satellite remote sensing provides sub-field-to-regional observations for scalable ET estimation, offering unique insights into the spatial variability and temporal dynamics of water use across diverse landscapes globally (Anderson et al., 2024; Wulder et al., 2022). Widely used satellite-retrieval ET methods can be generally grouped into energy balance-based algorithms (Allen et al., 2007; Kustas and Norman, 2000; Laipelt et al., 2021), Penman–Monteith based methods (Monteith, 1965; Zheng et al., 2022), Priestley–Taylor based methods (Fisher et al., 2008), and reflectance-based methods (Melton et al., 2012). While Penman-Monteith and Priestley–Taylor-based methods are also physically based formulations, they are listed separately here because of their distinct representations of surface and atmospheric controls on ET. With increases in computational power and access to cloud computing, purely data-driven ET models are emerging (Agrawal et al., 2022). Among the various satellite-based ET retrieval methods, the energy balance-based algorithms, such as the Two Source Energy Balance (TSEB) model (Norman et al., 1995; Kustas and Norman, 2000; Anderson et al., 2024), have been widely used for ET retrieval. Unlike single-source energy balance models, TSEB partitions the incoming radiometric energy into soil and vegetation components, providing estimates of E and T separately. The Atmosphere-Land Exchange Inverse (ALEXI) and associated spatial disaggregated method, DisALEXI, provide field-to-global ET estimation based on the TSEB partitioning scheme (Anderson et al., 2004a, 1997). Using Landsat thermal and optical observations as the key inputs, DisALEXI downscales regional ALEXI ET maps to 30 m spatial resolution on the Landsat overpass days. Several studies have used ALEXI/DisALEXI for various applications over different land cover types and climate zones, including irrigation scheduling, yield prediction, forest management and disturbance monitoring, and assessing drought impacts on ecosystems (Knipper et al., 2019; Liu et al., 2025; Yang et al., 2018, 2021a, b).
Despite these advancements, challenges remain in making satellite-based ET data accessible, and operational for stakeholders such as water managers, policymakers, and growers, especially at regional scales where data production is limited by computational capability. The growing demand for scientifically credible field-scale ET estimates that are easy to use has spurred the development of cloud-computing platforms. One such initiative is OpenET, a collaborative effort among the remote sensing ET community that aims to provide open, accurate, and easy-to-access ET products through a web-based platform (Melton et al., 2021). OpenET hosts six ET models, including DisALEXI (Anderson et al., 2004b), eeMETRIC (Allen et al., 2007), PT-JPL (Fisher et al., 2008), geeSEBAL (Laipelt et al., 2021), SSEBop (Senay et al., 2023) and SIMS (Melton et al., 2012), which are used to generate model-specific and ensemble 30 m, daily, monthly, and annual ET estimates across the United States. Built on Google Earth Engine (GEE) (Gorelick et al., 2017), OpenET leverages cloud computing and satellite data archives to operationally produce ET data with high spatial and temporal resolution that are suitable for field-scale applications. Data produced from OpenET can be accessed directly from GEE, through the OpenET website, and through the OpenET application programming interface (API). OpenET data have been evaluated at ∼150 eddy covariance stations in a variety of land cover types at multiple time scales (Volk et al., 2024). Many applications are already actively using OpenET data, including vineyard irrigation management (Knipper et al., 2024), water conservation programs (Wobus et al., 2024), and monitoring forest recovery after wildfire (Ahmad et al., 2024).
DisALEXI was integrated into GEE through the OpenET effort as one of the six ensemble ET models. Due to the multi-scale architecture and two source energy balance framework of ALEXI/DisALEXI, it is unique in comparison with the other OpenET models in many aspects including model structure, GEE integration and interpolation from ET on overpass days to daily and longer time steps. In this paper, we focus on the cloud-based implementation of the DisALEXI model on GEE, aiming to provide a thorough overview of the cloud-based model structure and evaluation of model results, showcase potential applications of GEE-DisALEXI, and discuss remaining challenges and future improvements. While there are papers focusing on OpenET as a whole (Melton et al., 2021; Volk et al., 2024), our study can contribute to a deeper understanding of GEE-DisALEXI data and build a baseline for future evolution of the GEE version of the DisALEXI model. The objectives of this paper are threefold: (1) to describe the technical modifications and enhancements made to DisALEXI for integration into the cloud computing environment on GEE, (2) to evaluate the model's performance against ground observations across multiple biomes and climate zones, and (3) to demonstrate the practical utility of GEE-DisALEXI ET products for drought monitoring and other potential applications in agricultural, forest and water management contexts. Through this paper, we aim to inform both the scientific community and end-users about the design, capabilities, and future directions of GEE-DisALEXI.
This section begins with an overview of the GEE-DisALEXI algorithm, followed by a description of its implementation and model structure within the GEE platform. The key input variables required by GEE-DisALEXI, along with ancillary datasets used for model evaluation, are described subsequently.
2.1 GEE-DisALEXI model
GEE-DisALEXI is the disaggregation of ALEXI data and uses a TSEB land-surface representation that is consistent with previous published DisALEXI studies. A brief description of the model is included in the following sub-sections, while additional details about the multi-scale ALEXI/DisALEXI modeling approach are provided by Anderson et al. (1997, 2004b).
2.1.1 TSEB
The TSEB model (Kustas and Norman, 2000; Norman et al., 1995) forms the foundational framework of the ALEXI/DisALEXI modeling system and is based on principles of surface energy balance applied to both the canopy (subscript “c”) and soil (subscript “s”) components of the model pixel:
where Rn is net radiation, H is sensible heat, LE is latent heat, and G is the soil heat flux. Latent heat is calculated as a residual in the energy balance equation. A key input to TSEB is the land surface temperature (LST), which provides direct information on surface thermal conditions and serves as the primary constraint for partitioning available energy between sensible and latent heat fluxes. Because satellite observations measure a composite radiometric temperature from both soil and vegetation, the bulk directional surface radiometric temperature (TRAD) is first partitioned between soil and canopy components using Eq. (2).
Here, Tc and Ts are canopy and soil temperatures, respectively, and fφ is the apparent fractional vegetation cover at sensor view angle φ, parameterized using vegetation index and a view angle-dependent clumping index using Eq. (3).
where LAI is the leaf area index derived from Landsat data (more details in Sect. 2.2) and Ω(θ) is a clumping factor dependent on the vegetation class (Anderson et al., 2005). Tc and Ts constrain the sensible heat, net radiation fluxes, and soil heat in Eq. (1), while soil latent heat is computed as a residual to Eq (1). TSEB uses an iterative adjustment procedure to account for canopy water stress. The model first assumes potential canopy transpiration and solves the energy balance. If the resulting soil latent heat flux is negative, canopy transpiration is iteratively reduced until soil latent heat flux is larger or equal to zero, reflecting the assumption that soil evaporation near midday should not be negative.
Comparing with other remote sensing-based ET models, TSEB explicitly solves the soil and canopy energy balance using LST as a primary constraint. In contrast, many other models either rely on empirical stress functions or treat the land surface as a single source, providing less direct information on soil and canopy fluxes.
2.1.2 ALEXI
As shown in Fig. 1, ALEXI model integrates TSEB with a simplified atmospheric boundary layer (ABL) model to estimate regional ET at a spatial resolution of approximately 4–5 km at daily time-step (Anderson et al., 2007b). Over the Conterminous United States (CONUS), ALEXI utilizes LST inputs from geostationary satellite observations (GOES) and LAI derived from MODIS or VIIRS products. The GOES-East and -West Imager instruments provide 11um brightness temperature observations that are used to generate TRAD inputs to ALEXI (Hain et al., 2015). The model specifically uses time-differential measurements of TRAD acquired during the period of morning ABL rise (at approximately 1.5 h after local sunrise and 1.0 h before local noon), which helps reduce sensitivity to potential biases in the absolute LST values, thereby enhancing the robustness and stability of ET retrievals. Gaps caused by cloud cover are filled using the technique described by Sun et al. (2017). This technique applies Savitzky-Golay filter to smooth and gap-fill timeseries of ET normalized by solar radiation. Daily ET is then recovered by multiplying the gapfilled timeseries with daily insolation.
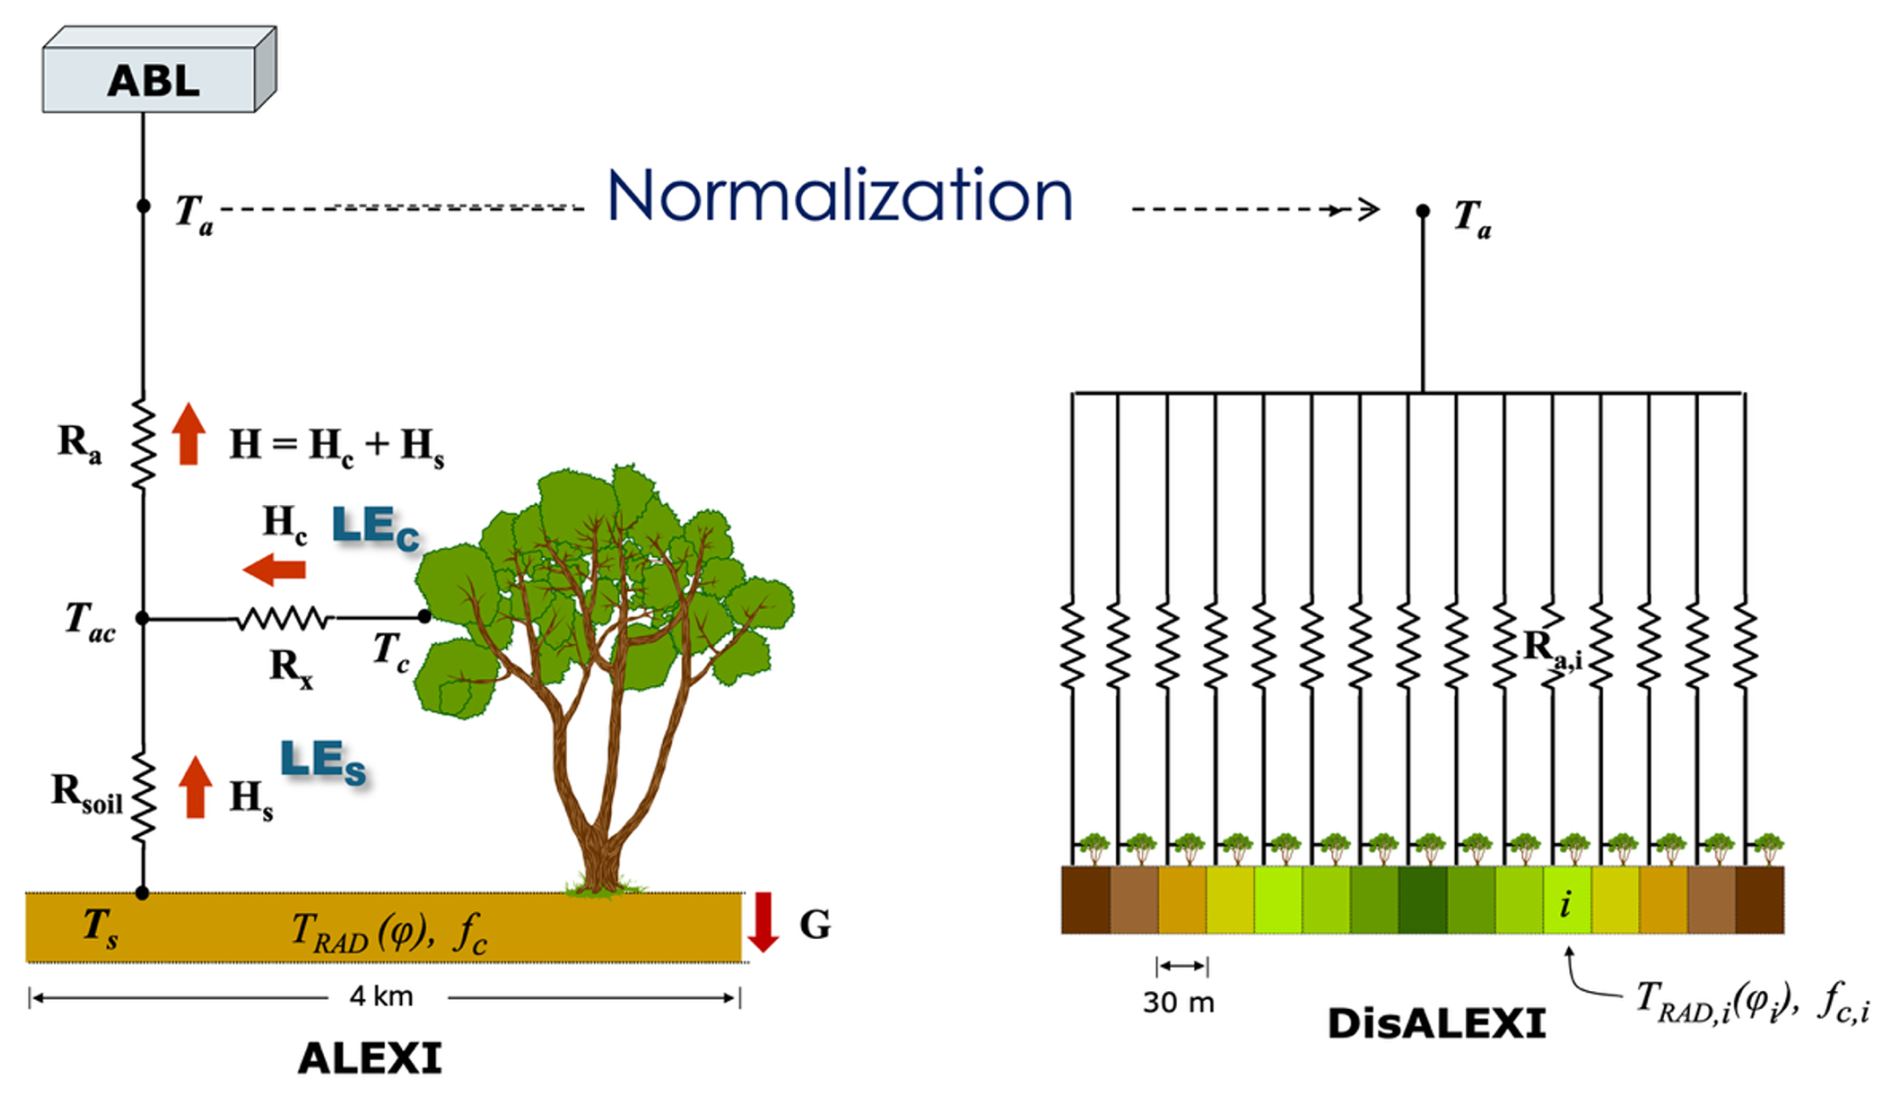
Figure 1Structure of ALEXI/DisALEXI model. The DisALEXI process disaggregates coarse-scale (4 km resolution over the Conterminous United States – CONUS) ALEXI data to finer spatial resolution. Ta is air temperature. Ra, Rsoil and Rx are aerodynamic resistance, soil resistance, and canopy resistance, respectively. ABL represents the atmospheric boundary layer model providing closure to the regional ALEXI model.
2.1.3 DisALEXI
DisALEXI was designed to downscale ALEXI-derived ET from the coarse (4–5 km) resolution of geostationary satellites to finer spatial scales by incorporating higher-resolution satellite observations, such as those from MODIS, VIIRS, Landsat, and ECOSTRESS (Anderson et al., 2004b, 2020; Yang et al., 2017a). LST and LAI for TSEB are from these higher spatial resolution satellite observations, while the meteorological inputs are the same as inputs of ALEXI to keep consistency between the two steps. The upper boundary layer air temperature to DisALEXI, Ta in Fig. 1, is estimated through an iterative process. The disaggregated ET at fine resolution is spatially aggregated and compared with the original coarse-resolution ALEXI ET. Through the iterative process, Ta is adjusted until convergence is achieved, ensuring consistency between the fine- and coarse-scale ET estimates.
2.2 Implementation of DisALEXI in GEE
The original offline version of DisALEXI provides the baseline for the implementation in GEE (Yang et al., 2022). While the offline version uses a mix of multiple computer languages, including C, Fortran and IDL, the GEE version uses Python. The languages and platform differences in GEE necessitated several modifications to the original version of DisALEXI code, which are described in the following sections.
2.2.1 GEE-DisALEXI technical architecture
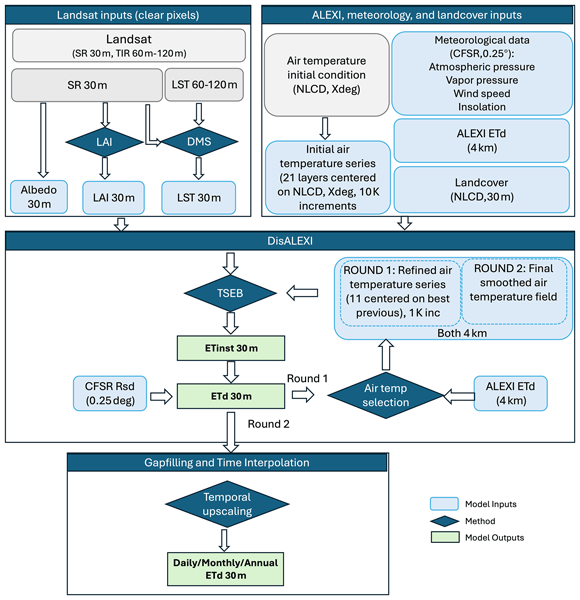
The cloud-based implementation of the DisALEXI model on GEE is organized to support large-scale, automated ET retrievals using Landsat Collection 2 Level 2 surface temperature and reflectance as the key inputs. The processing pipeline is modular, allowing for extensibility, efficient scaling and easy modification to accept potentially different inputs (Fig. 2). In addition, the iterative modification of air temperature used to achieve ALEXI convergence in the off-line version of DisALEXI is replaced with a series testing of an incremental air temperature series. This is implemented to improve efficiency, as GEE iteration is consumptive of compute resources.
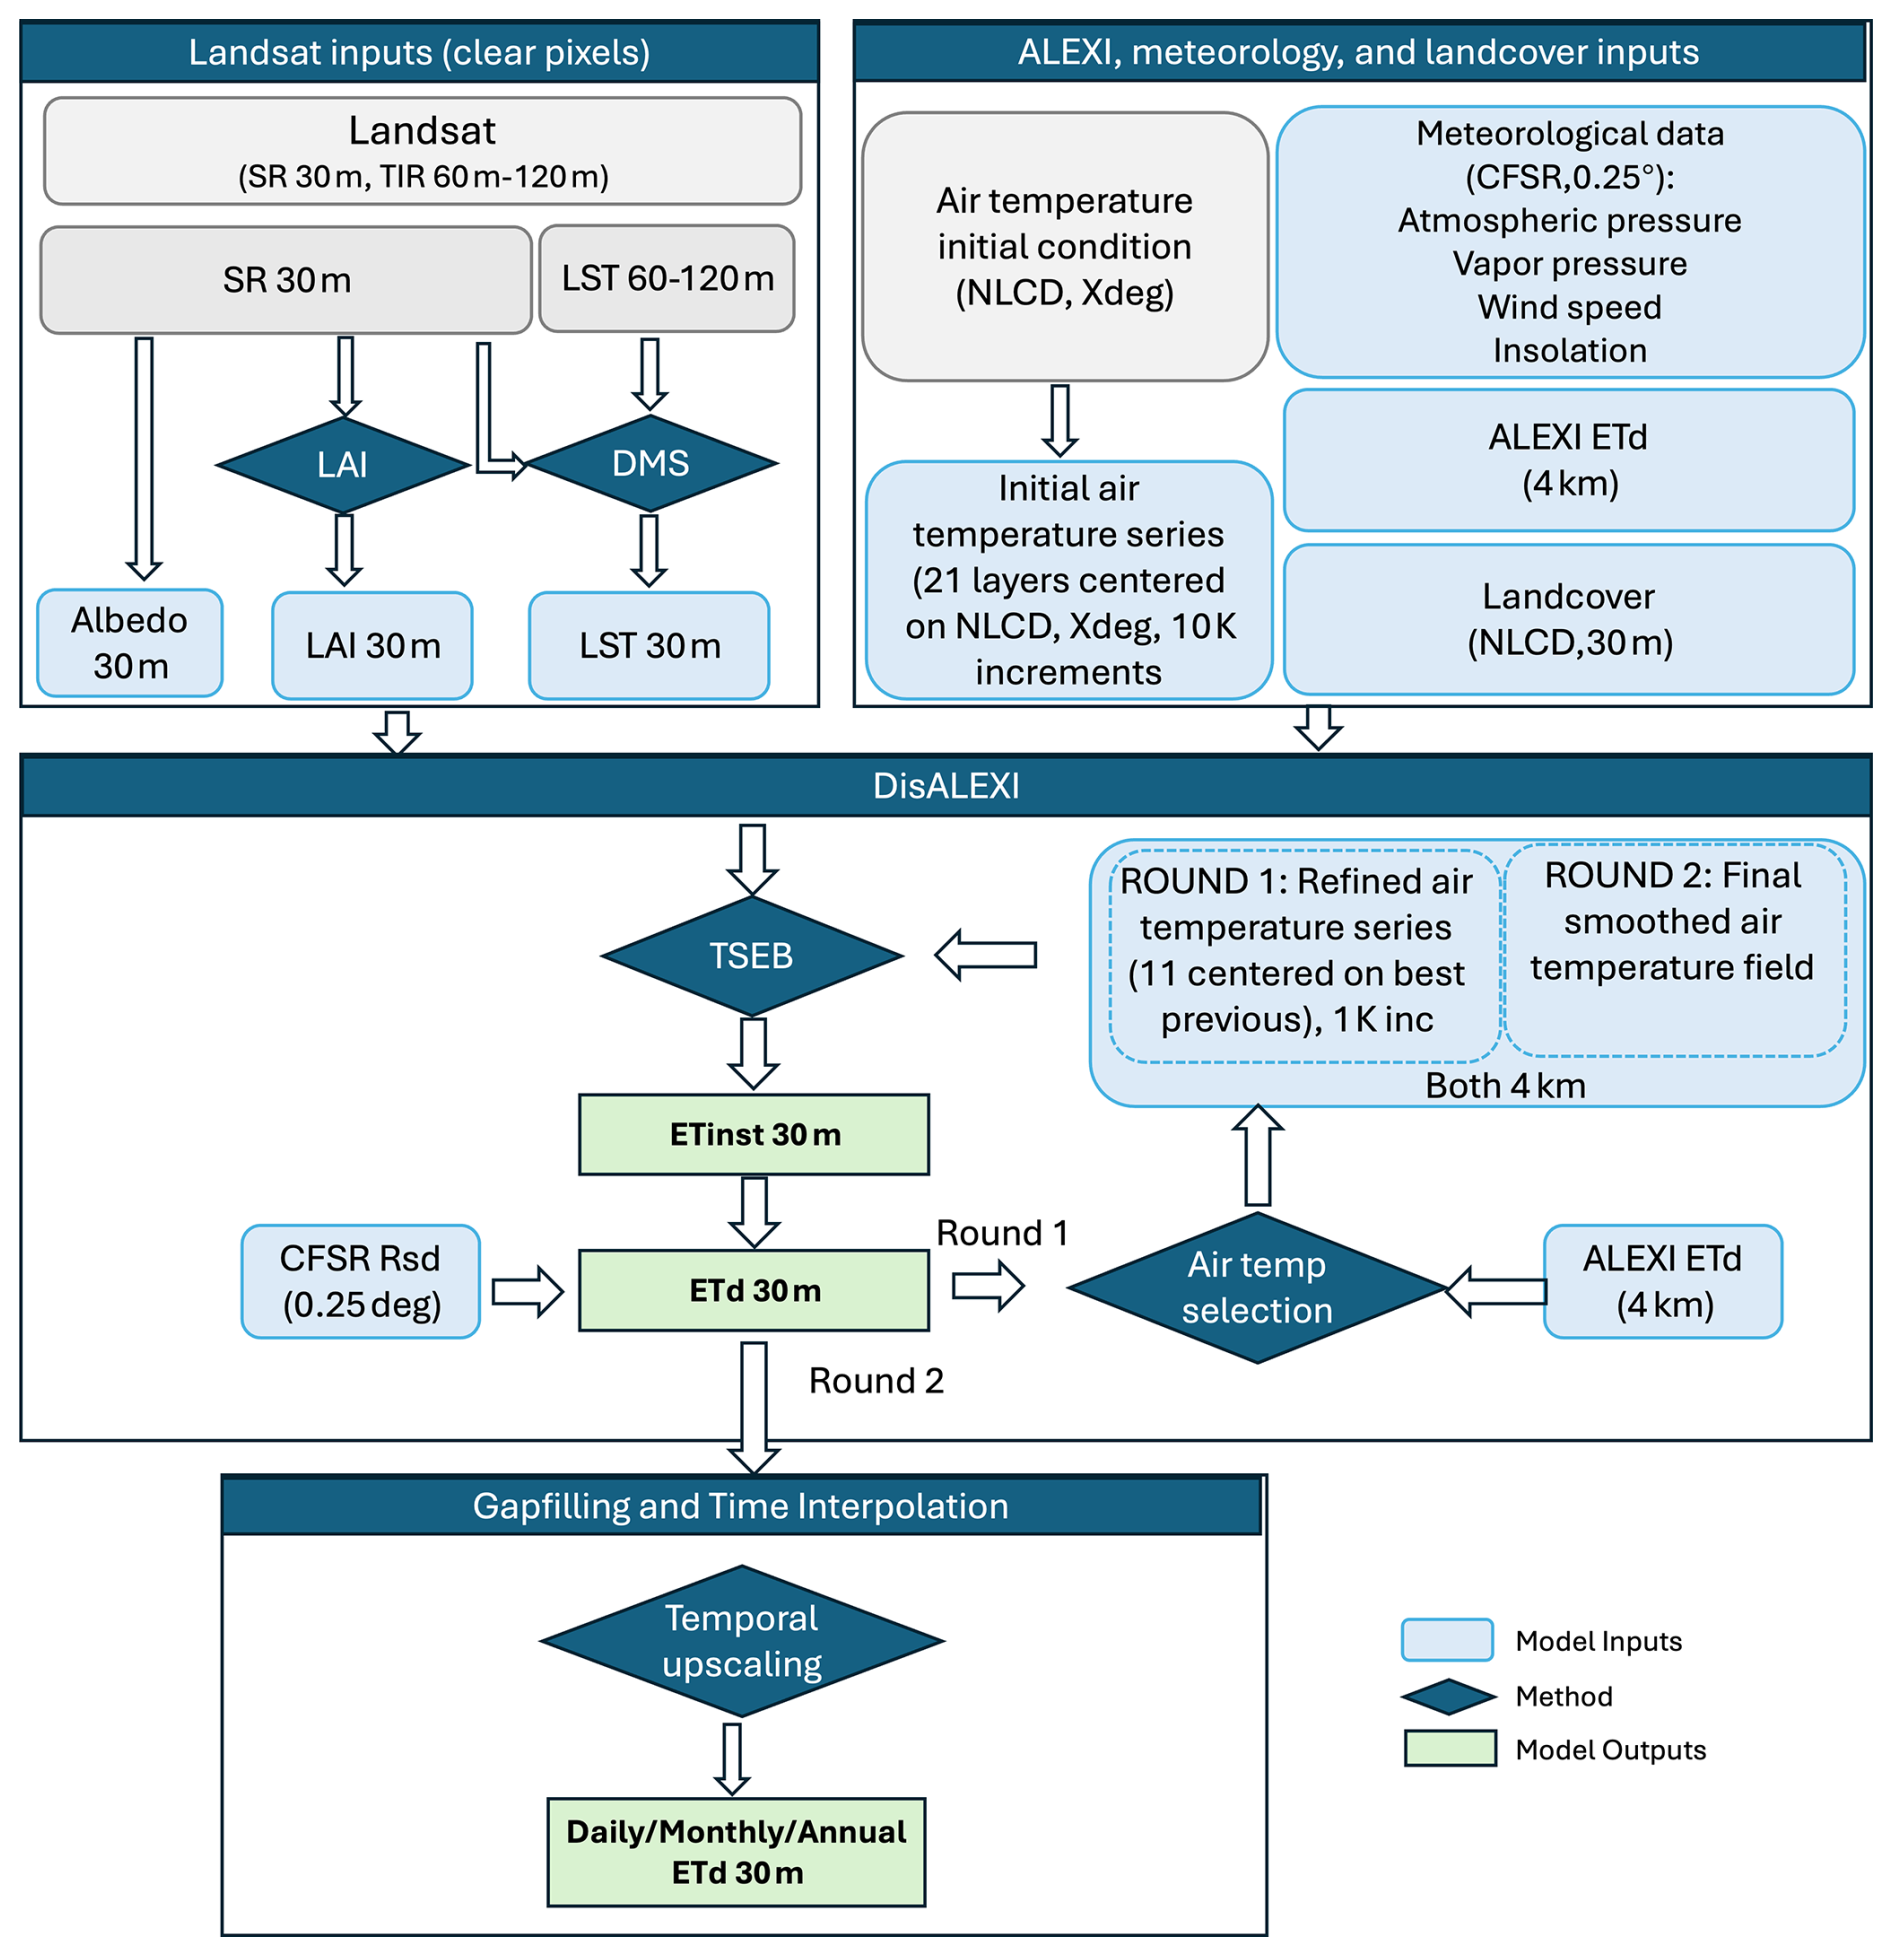
Figure 2Flow chart of GEE-DisALEXI. Grey color boxes are data from Landsat used to prepare inputs for DisALEXI. The inputs are fed into the TSEB model to estimate instantaneous ET (ETinst) at 30 m spatial resolution, which is further upscaled to 24 h ET (ETd) using insolation. This field is compared with the baseline ALEXI ETd at the 4 km pixel level and used to refine the air temperature inputs in two rounds, as described further in the text.
The core structure is built around a “disalexi” module, which integrates inputs, parameterization, and execution of the DisALEXI algorithm. The implementation begins with the preprocessing of the Landsat Collection 2 surface reflectance and surface temperature products on GEE. Cloud, snow, and water masking are applied based on pixel quality attributes, and scenes with less than 70 % cloud are used for further model processing. Surface albedo data are derived from reflectance bands following the algorithm in Liang (2001). The LAI and LST sharpening (DMS) preprocessing modules are required before running the “disalexi” module. This module includes optimal air temperature selection over each ALEXI pixel area within the DisALEXI modeling domain. These key steps are described below.
30 m LAI module
LAI is calculated at 30 m resolution using the reference-based algorithm based on Gao et al. (2012b) and follows the detailed method in Kang et al. (2021). First, a training dataset was created by linking Landsat surface reflectance (SR) data aggregated to 500 m with co-located MODIS LAI 500 m data and land cover information. Random forest models were trained on these 500 m SR-LAI pairs, and then applied to the SR data at native resolution in GEE to generate 30 m LAI. The resulting sub-field-scale LAI estimates demonstrate strong performance across tested National Ecological Observatory Network (NEON) sites. This LAI calculation is a separate module, executed as one of the preprocessing steps.
30 m LST module
LST products from the Landsat suite of satellites have native spatial resolution ranging from 60 m (Landsat 7) to 120 m (Landsat 5), with the most recent platforms (Landsats 8 and 9) carrying thermal sensors with nominal 100 m resolution. The LST sharpening module is employed to sharpen LST products these various platforms from their native resolution to consistent 30 m spatial resolution using the Data Mining Sharpener (DMS) method described by Gao et al. (2012a). The DMS algorithm implemented on GEE builds scene-based random forest models between LST and Landsat visible and shortwave infrared (VSWIR) bands, aggregated to the coarser resolution. Sample selection strategy follows the original DMS algorithm, identifying relatively homogeneous coarse-scale pixels with low covariation in 30-m reflectance. Both a global model, developed over the entire Landsat scene, and a local model defined within a moving-window kernel are built and fused together according to residual agreement. Energy conservation is enforced at the end of the sharpening process to make sure thermal energy is conserved at the coarse native thermal resolution. More details about LST sharpening and DMS can be found in Gao et al. (2012a) and Liu et al. (2026).
DisALEXI module
The core component of the DisALEXI module executes the TSEB at each 30 m pixel within the target Landsat scene that has valid inputs using ALEXI as the benchmark data at 4 km spatial resolution. Execution is limited to scenes with less than 70 % cloud cover. For clear pixels, instantaneous ET (ETinst) at the time of the Landsat overpass is upscaled to 24 h ET (ETd) using daily solar radiation by preserving the ratio between instantaneous latent heat flux and solar radiation.
To replicate the iterative process in the offline version of DisALEXI used to define the air temperature boundary condition for the TSEB model, the GEE-based implementation of DisALEXI adopts a hierarchical framework to enhance computational efficiency. This structure avoids the inefficiency of the expensive iteration processes on GEE. Rather than iteratively adjusting air temperature at each pixel, GEE-DisALEXI performs a series of TSEB simulations using multiple candidate air temperature fields. The workflow consists of three primary steps to generate the final ET product. First, DisALEXI is executed using a sequence of 11 different air temperature maps, centered around the air temperature from the North American Land Data Assimilation System (NLDAS) and incremented/decremented in 5 steps of 10 K each. This produces a set of 11 ETd maps (with cloud gaps) at 30 m resolution. The next step estimates the bias over each 4 km ALEXI pixel area between the aggregated fine-resolution ET and the ALEXI ET at that pixel. The air temperature that produces the least bias in each ALEXI pixel is selected to create an input map for a finer search in the second step. Here, 11 additional simulations are run using ±1 K increments around the output air temperature map from the 10 K step. Again, the temperature minimizing bias in DisALEXI-ALEXI ETd is selected at each ALEXI pixel to create a final air temperature field. This temperature field is spatially smoothed before running TSEB one final time to avoid boxy artifacts at the 4 km scale. The use of 11 temperature steps is not a physically prescribed requirement, but rather a practical choice to ensure that a sufficiently broad range of potential air temperature solutions is sampled while maintaining computational efficiency within the GEE environment.
This process of enforcing match between DisALEXI and ALEXI at the 4 km helps to minimize platform-related inconsistencies across various Landsat sensors. To generate daily ET time series from the overpass day ET, the ratio of Landsat ETd to daily insolation on Landsat days is interpolated in time, and this interpolated ratio is multiplied by daily insolation to produce continuous daily estimates. These daily ET values are then aggregated in time to generate multi-temporal composites (e.g., weekly, monthly, annual ET). In the current implementation on GEE, no cloud-gapfilling for Landsat overpass day ET is performed. When computing multi-temporal composites, all missing or masked overpass ET pixels are computed by linearly interpolating between the nearest unmasked, cloud-free pixels in time window within 32 d, following Volk et al. (2024).
This architecture used in GEE-DisALEXI leverages the distributed computation capabilities of GEE to support larger-scale ET generation at high spatial resolution, while remaining modular enough for future integration of additional sensors or algorithm enhancements.
2.2.2 Key inputs for GEE-DisALEXI
Key inputs for GEE-DisALEXI include LST, LAI, albedo, ALEXI ET, land cover type, and meteorological data. ALEXI 4 km data are produced at NASA Marshall Space Flight Center using GOES LST and meteorological inputs from CFSR (Dee et al., 2014). Both ALEXI data and CFSR data, including air temperature, wind speed, vapor pressure and air pressure at 3 h temporal resolution are ingested into GEE every day at a predefined time. The ingest time can be modified to daily time step to support the near real time efforts (Yang et al., 2024). The land cover data are from National Land Cover Database (NLCD), which is used to define surface roughness and leaf optical properties for different vegetation types. Landsat atmospherically corrected surface reflectance and LST data (native resolution) are from the Landsat Collection 2 Level 2 products; and LAI and sharpened LST are produced from Landsat Collection 2 data using the methods described in Sect. 2.2.1.
2.3 Dataset for model evaluation
At the time of writing, GEE-DisALEXI data were available over the western states from 2016 to 2022. To better understand GEE-DisALEXI performance over different vegetation types and climate zones, multiple datasets were used in the assessment presented here. These datasets include eddy covariance flux tower measurements, water balance ET estimates, and drought severity data from the US Drought Monitor (USDM) to test DisALEXI response to regional water stress. Flux tower data are compared with DisALEXI timeseries extracted within the tower footprint, while the water balance analysis considering precipitation and US Geological Survey (USGS) streamflow observations was applied at watershed HUC08 scale for regional evaluation. Details are included in the following sub-sections.
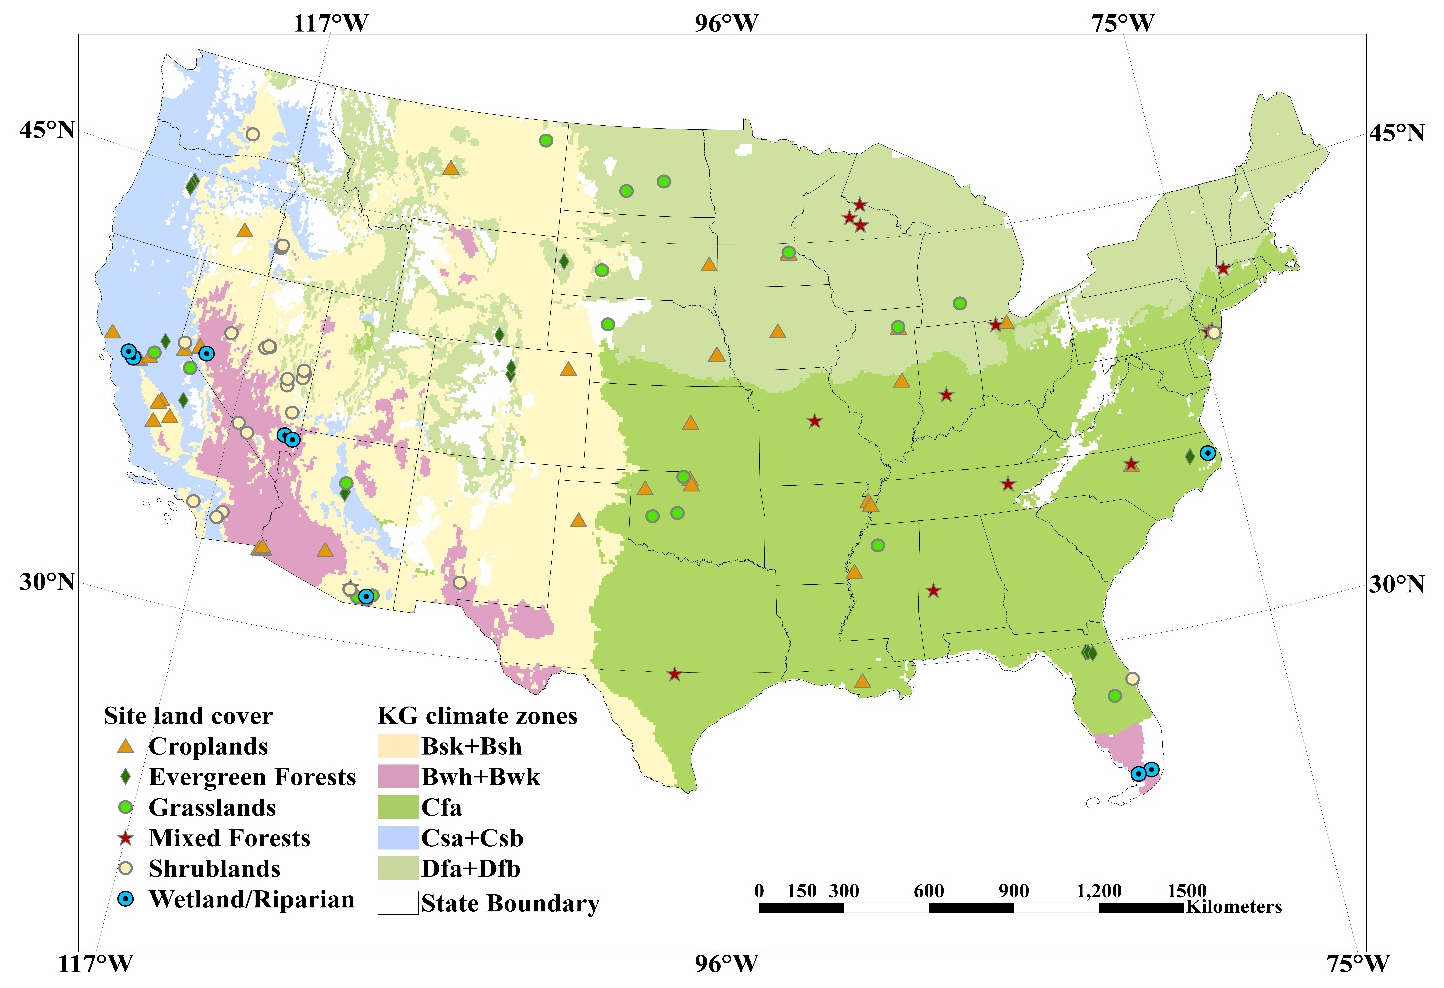
Figure 3Locations and dominant vegetation type associated with ground observations used in the evaluation, overlaid on Köppen–Geiger climate zones.
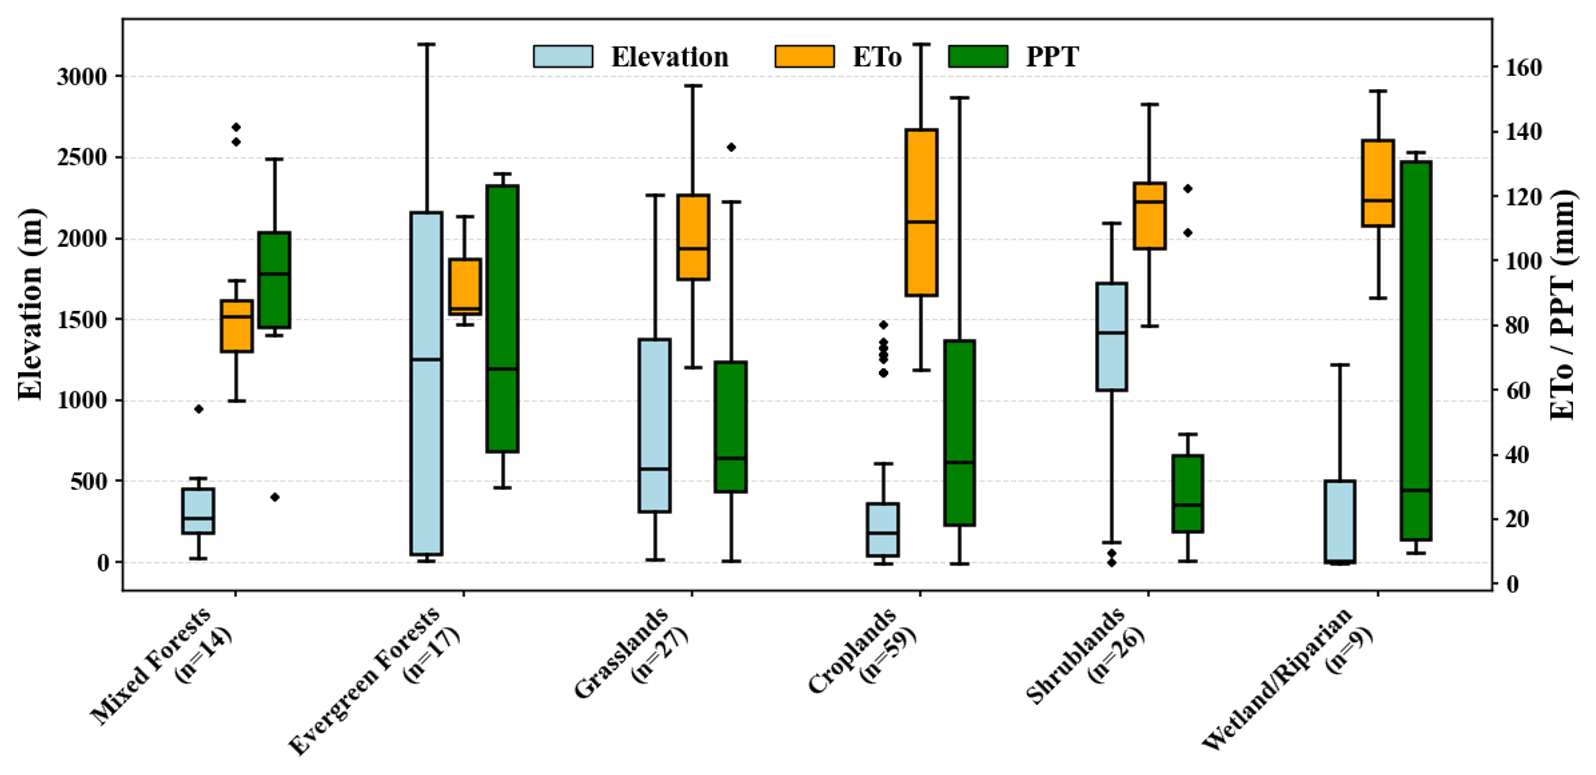
Figure 4Box plots of describing range of elevation, average precipitation and reference ET from 2016 to 2022 at ground observation sites used in the model evaluation, separated by vegetation type.
2.3.1 Flux tower observations
We utilized eddy flux tower observations from the dataset published by Volk et al. (2023) which provides benchmark ET observations derived mainly from eddy covariance systems distributed across CONUS. All data underwent standardized post-processing including gap-filling, temporal aggregation and energy balance closure correction. An energy balance ratio closure method () was used to adjust both LE and H to maintain the ratio as one over 15 d windows. The energy balance closure correction method that was applied follows the FLUXNET2015 approach, however limits were added to exclude very large (more than doubling or less halving) adjustments to daily ET estimates (Pastorello et al., 2020; Volk et al., 2023). The energy balance closure corrected flux tower ET is mentioned as closed flux tower ET in this manuscript. More details about the process and the eddy flux tower ET dataset can be found in Volk et al. (2024). Figure 3 shows the locations of the flux towers used in different climate zones over the CONUS, while Fig. 4 summarize the elevation ranges, and average reference ET and precipitation from 2016 to 2022 for towers in six different key vegetation types. A detailed list of the flux towers is provided as supplement in Table A2. Flux tower measurements represent fluxes integrated over a source footprint, which typically extends over several hundred meters depending on atmospheric conditions, wind direction, and surface characteristics. To extract GEE-DisALEXI pixels around the observation sites for comparison, we used the methods adopted by Volk et al. (2023) for the full OpenET ensemble evaluation. This method involved using a temporally dynamic footprint model (Kljun et al., 2015) for sites with sufficient data or static grid footprints (e.g., 77 Landsat pixels). These nominal extraction sites were sometimes slightly shifted to consider predominant fetch area and land cover while still maintaining the flux tower within the grid.
2.3.2 Land cover type and climate zones
To characterize land surface conditions at the evaluation sites, we used land cover information from NLCD, focusing on dominant classes including cropland, evergreen forest, grassland, mixed forest, shrubland, and wetland. Climate classification was based on the Köppen–Geiger system, emphasizing five representative climate zones across the CONUS. These climate zone abbreviations are Bsk + Bsh for cold and hot semi-arid steppe, Bwh + Bwk for hot and cold desert, Cfa for humid subtropical, Csa + Csb for hot and warm summer Mediterranean, and Dfa + Dfb for hot and warm summer humid continental.
2.3.3 Drought condition data
The US Drought Monitor (USDM) provides weekly drought condition maps that classify drought severity across the United States and its territories. The USDM is jointly produced by the National Drought Mitigation Center (NDMC), the National Oceanic and Atmospheric Administration (NOAA), and the US Department of Agriculture (USDA), utilizing a convergence of evidence approach that integrates multiple indicators including temperature, evaporative demand, precipitation, vegetation health, streamflow, soil moisture, reservoir levels, and observed impact. These factors are combined with expert assessment to assign drought severity classifications (Svoboda et al., 2015). The USDM defines six categories: normal conditions, abnormally dry (D0), and four escalating drought severity levels: moderate (D1), severe (D2), extreme (D3), and exceptional drought (D4).
In this study, we evaluated response of DisALEXI ET for different vegetation types to drought conditions reported in the USDM over the western US (consistent with DisALEXI coverage) from 2001 to 2025. To quantify regional drought severity, we computed the Drought Severity and Coverage Index (DSCI, ranging from 0 to 500) following Eq. (4) as recommended on USDM website, to create a single composite metric for each vegetation time. The DSCI is calculated as a weighted sum of the percentage area affected by each drought level over vegetation type area represented in the NLCD dataset:
where D0 through D4 represent the proportion of area classified under each respective drought severity level. DSCI timeseries were generated for different climate zones and compared with average DisALEXI ET extracted for each climate zone.
2.3.4 Water-balance ET
To evaluate GEE-DisALEXI ET over regional scale from a water-balance perspective, we employed a basin-scale approach using observed streamflow from USGS and precipitation data (Caldwell et al., 2012; Li et al., 2020). Streamflow records were obtained from USGS gauge stations and precipitation inputs were derived from the PRISM dataset (Daly et al., 1994), which offers gridded daily precipitation estimates at 4 km spatial resolution, incorporating station observations and accounting for orographic effects. For each CONUS HUC08 basin used in the evaluation, total precipitation and streamflow were aggregated to assess temporal relationship and consistency with DisALEXI ET estimates at monthly and seasonal time steps.
The analysis was carried out over watersheds with available USGS streamflow observations. There are 1548 HUC8 watersheds over our study area, of which 1520 have stream flow data, leaving 28 without runoff data. After removing boundary watersheds, there are 1412 watersheds left. Following Senay et al. (2023), we further applied a series of thresholds to identify appropriate watersheds to be included in the study. We first filtered out the watersheds with mean elevation larger than 2000 m and standard deviation in elevation larger than 250 m (strong topographic variability). Basins with annual run off larger than 40 % precipitation were also removed from the analysis to reduce effects of regional groundwater flow. Basins with ET exceeding precipitation with 10 % tolerance (ET > 1.1 P) were excluded to avoid physically implausible water balance conditions. In the remaining basins, water-balance ET (WBET) was computed as the difference between precipitation and runoff. We then compared WBET with reference ET and precipitation and further filtered out basins where WBET exceeds either reference ET or precipitation at the annual timestep. This water balance framework enables cross-validation of ET dynamics against independent hydrologic observations and enhances understanding of land-atmosphere water exchanges under varying climate and land cover conditions.
2.4 Methods for model evaluation
To evaluate the performance of GEE-DisALEXI, we employed multiple methods ranging from time series statistics to spatial pattern analysis. The 30 m ET results on overpass days and at a monthly and growing season time step were compared with ground observations mainly from eddy covariance flux towers across the CONUS. All statistics were calculated on a site-by-site basis pairing modeled with observed ET. The resulting statistical metrics have been organized by general vegetation types (6) and by climate zones (5). Spatial pattern analysis was employed to compare WBET with GEE-DisALEXI ET regionally. The response of ET metrics to drought was analyzed by climate zones at the annual and monthly timesteps. Statistical metrics include R2, slope, Mean Bias Error (MBE), Mean Absolute Error (MAE), Root Mean Square Error (RMSE) and normalized percentage of MBE, MAE and RMSE using weighted mean closed flux tower ET observations.
The GEE-DisALEXI ET results on Landsat overpass dates and aggregated monthly ET were evaluated in comparison with ground observations from flux towers and lysimeters for various climate regions and different vegetation types. While Volk et al. (2024) evaluated all the six models and the ensemble values of OpenET, this study takes a more detailed look at the performance of GEE-DisALEXI.
3.1 Evaluation of ET results on Landsat overpass dates
Over the 2016 to 2022 study period considered, there were a total of 11 723 Landsat scenes collected over the113 flux sites. Comparing tower ET (with corrections described in Sect. 2.3.1; ET_corr) on these overpass days with model ET estimates extracted in each tower footprint, the MBE is −0.00 mm d−1, the MAE is 0.86 mm d−1, and the RMSE is 1.02 mm d−1. In terms of the tower fluxes themselves, the average observed ET is 2.40 and 2.10 mm d−1 with and without closure correction, respectively. Statistical evaluation was further partitioned between seasons to better understand changes in model performance over the course of a year. Figure 5 shows the seasonal box plot of RMSE, MAE and MBE values as well as the average corrected observed ET (ET_corr) for four seasons: December, January, and February as Winter (DJF); March, April, and May as Spring (MAM); June, July, and August as Summer (JJA); and September, October, and November as Fall (SON). MAE and RMSE follow a similar seasonal pattern as observed ET, peaking in the summer months, while MBE is more consistent throughout the year. Among the seasons, MAM has the largest number of outliers, which suggests higher biases over the spring comparing with ground observations.
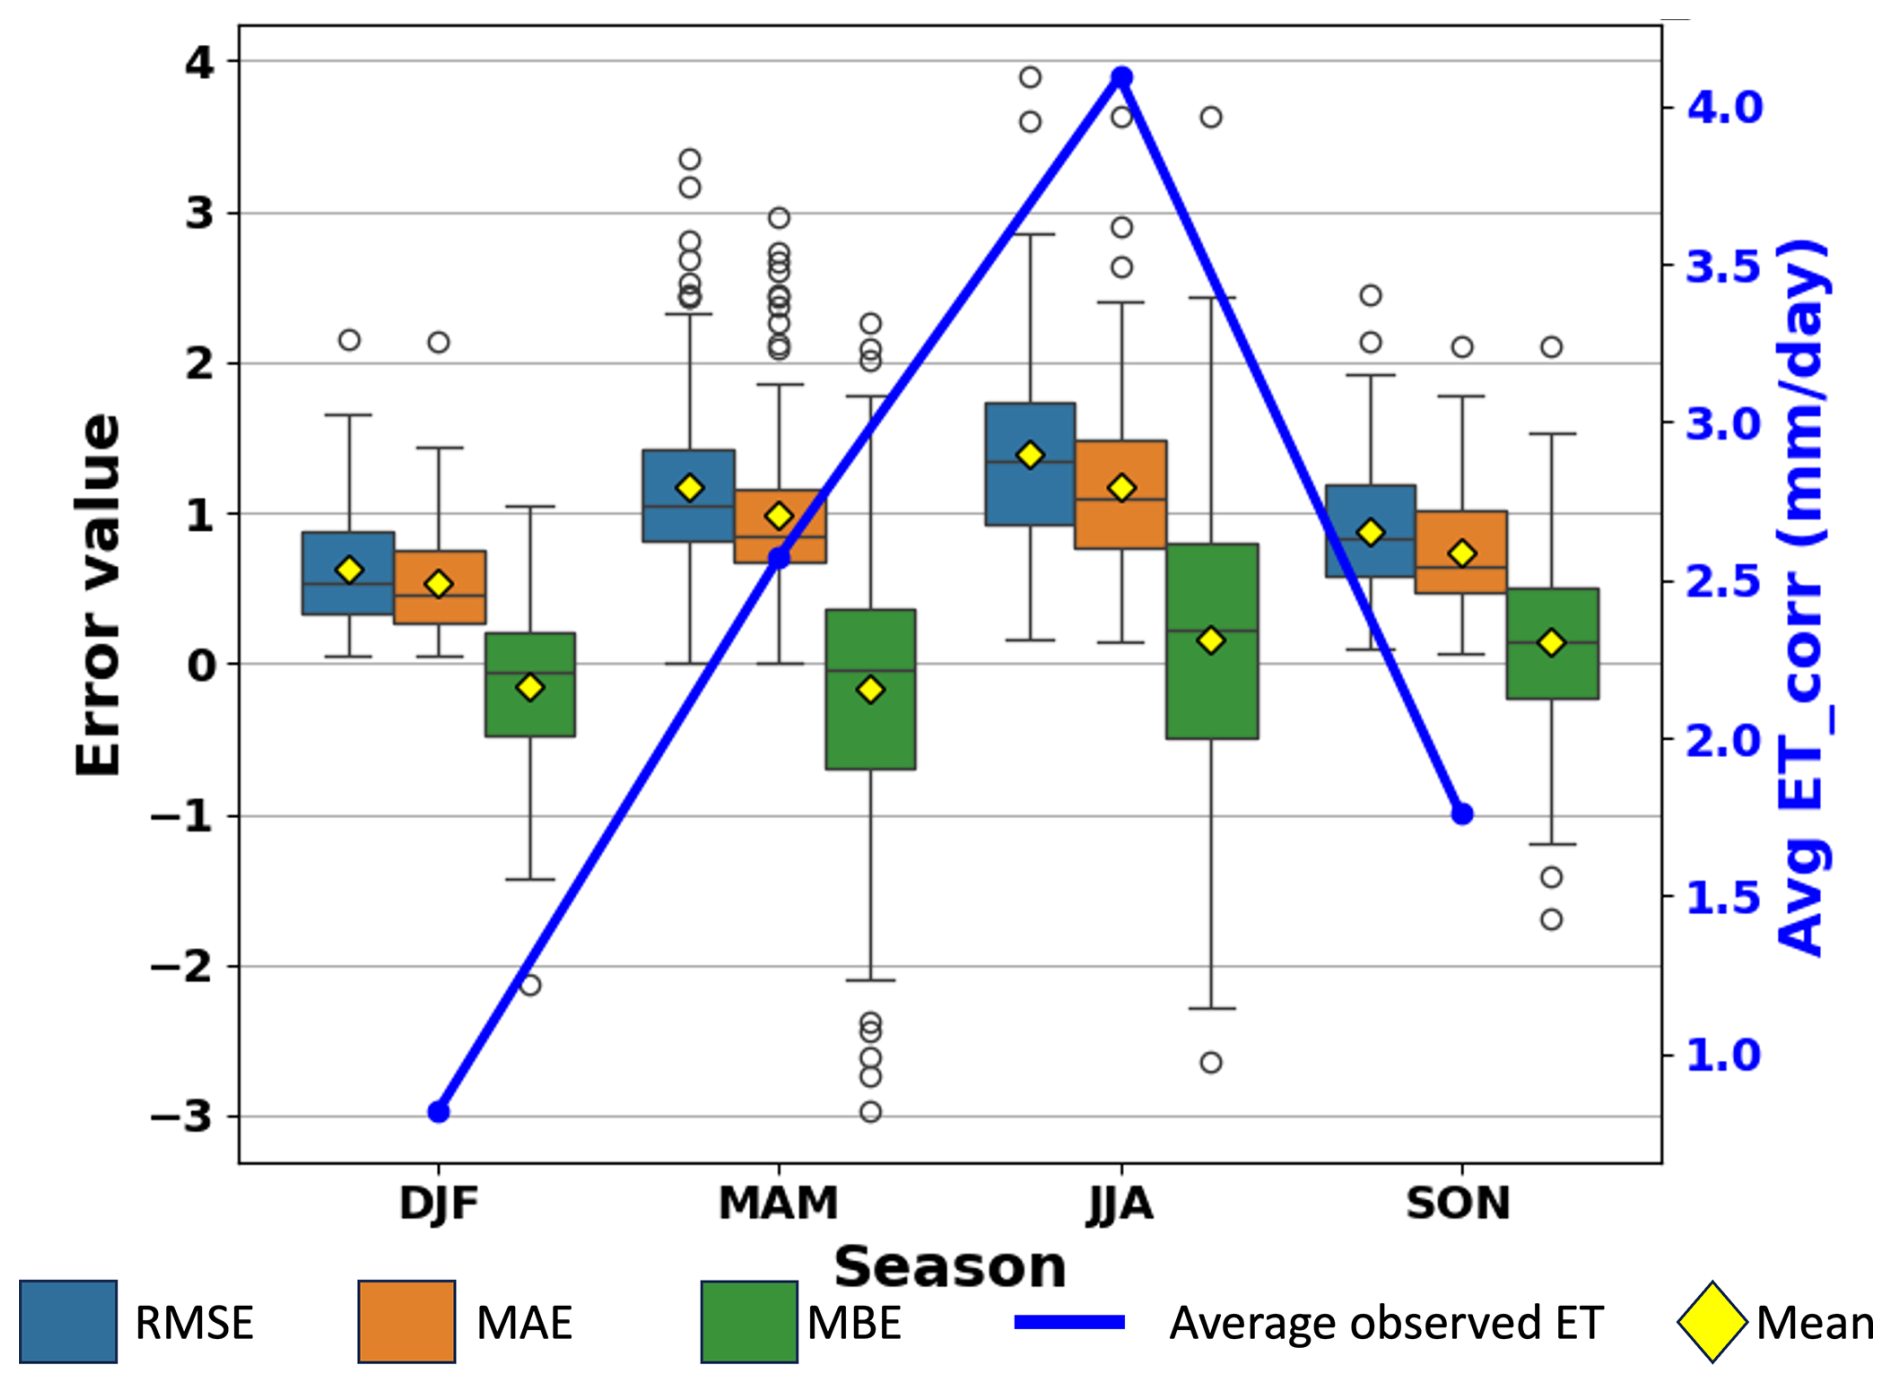
Figure 5Statistical metrics comparing GEE-DisALEXI ETd on overpass days with closure-corrected flux tower observations (ET_corr) by seasons.
3.2 Evaluation of ET results by vegetation types and climate zones
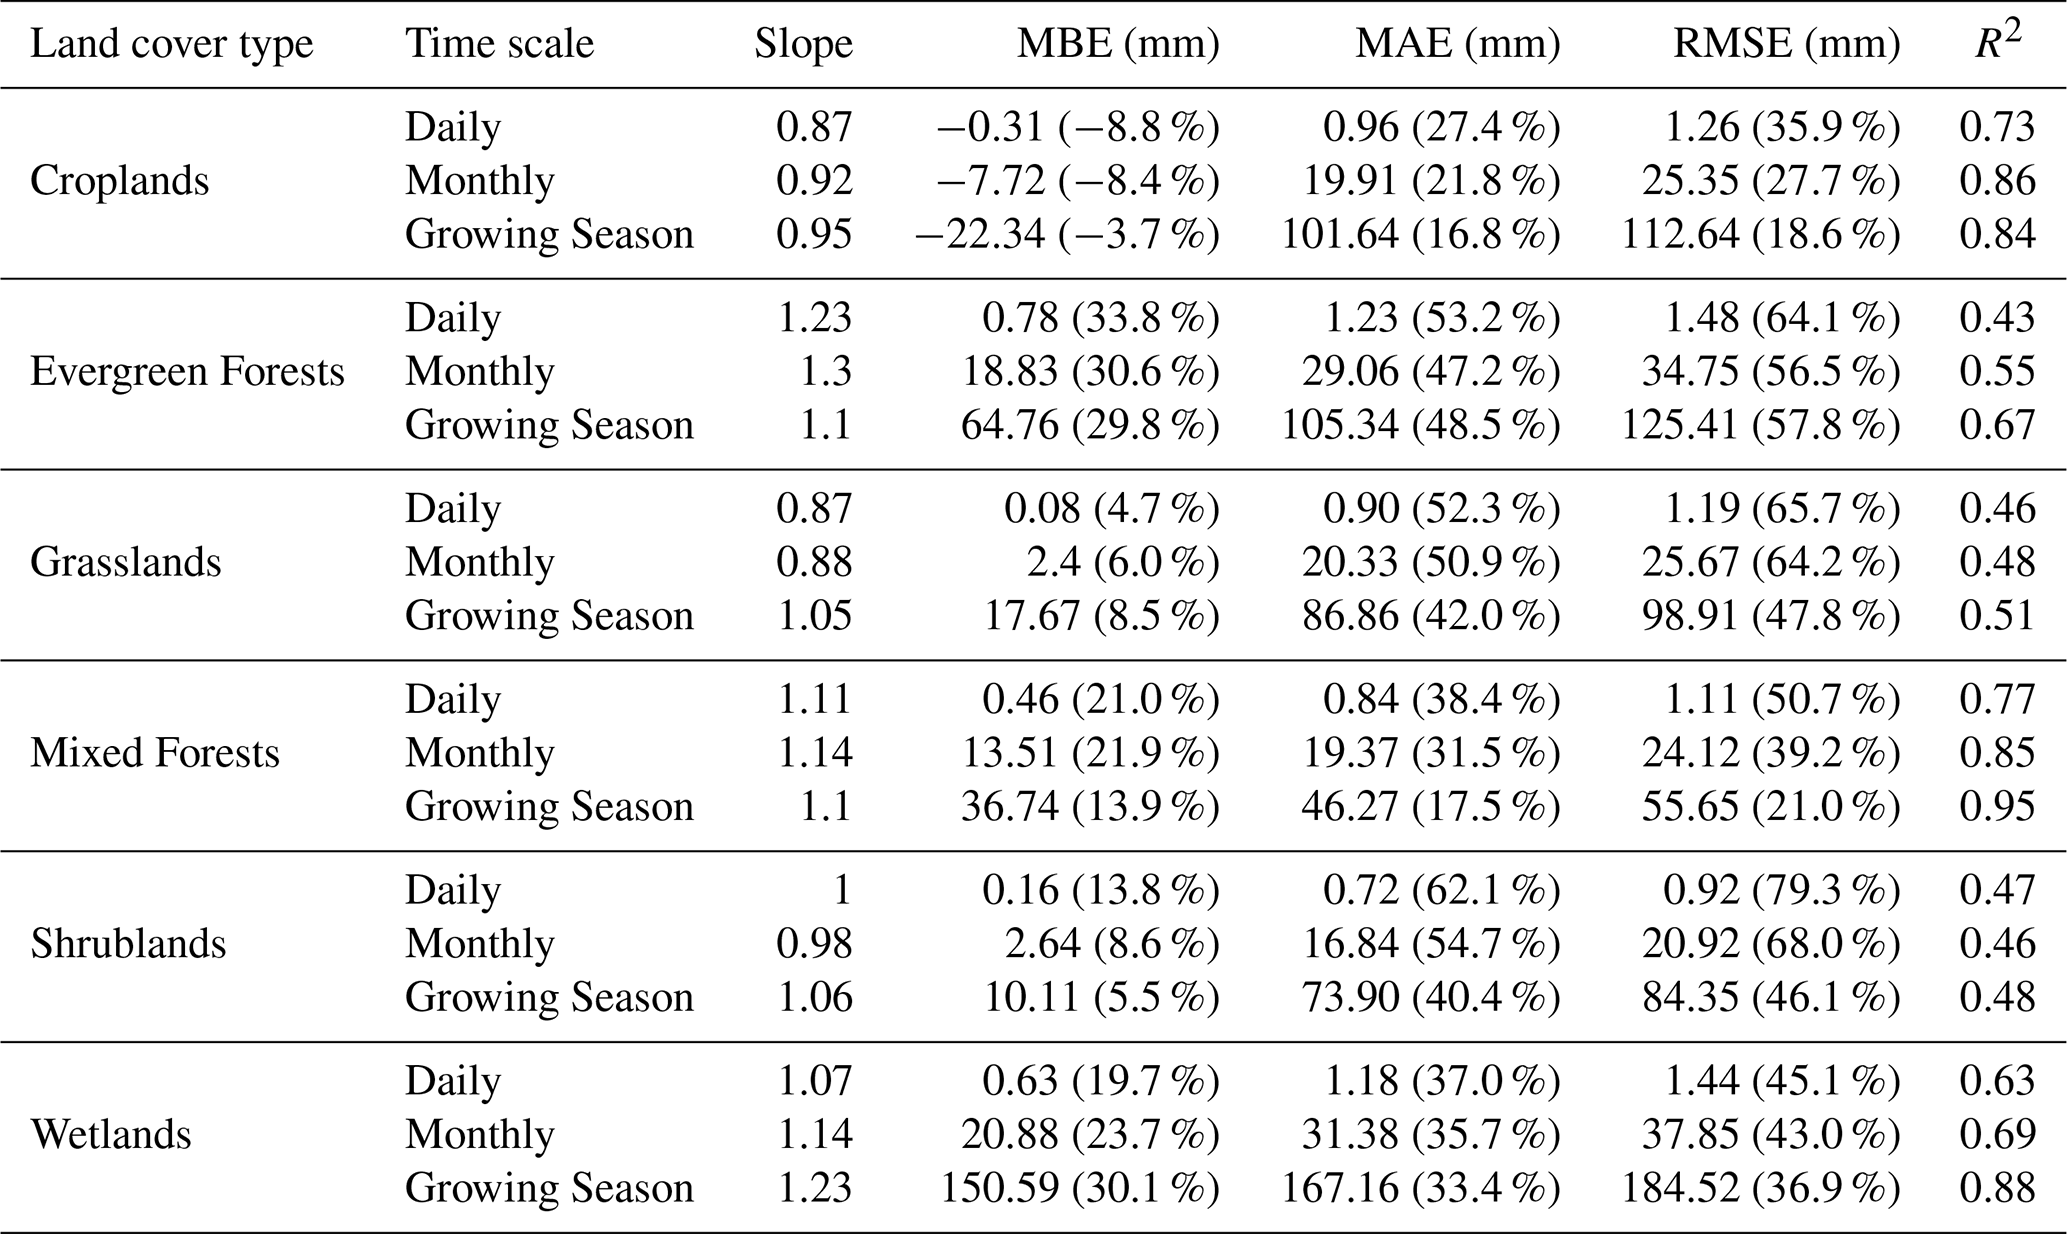
The radar plots and bar charts in Fig. 6 provide a comparative evaluation of GEE-DisALEXI model performance across six land cover types (grasslands, evergreen forests, croplands, wetlands, shrublands, and mixed forests) at overpass day, monthly, and growing season time steps. Key performance metrics include R2 and slope (linear regression slope forced through the origin). The metrics also include measures of MAE, MBE, and RMSE including the error in mm per month and normalized as a percentage of the weighted mean closed flux tower ET (Table A1). Among these land cover types, croplands consistently exhibit the best performance across all time scales, particularly during the growing season, where the model achieves a relative RMSE of 18.6 %. In contrast, wetlands show the greatest uncertainty, especially at longer timescales. Evergreen forests also show a relatively low performance, but is better over growing season timescale. As shown in Fig. 4 that evergreen forest and shrubland flux tower sites have the highest average elevation, which shows the potential relationship between biases and elevation and indicates future work is needed on improving ET over complex terrains.
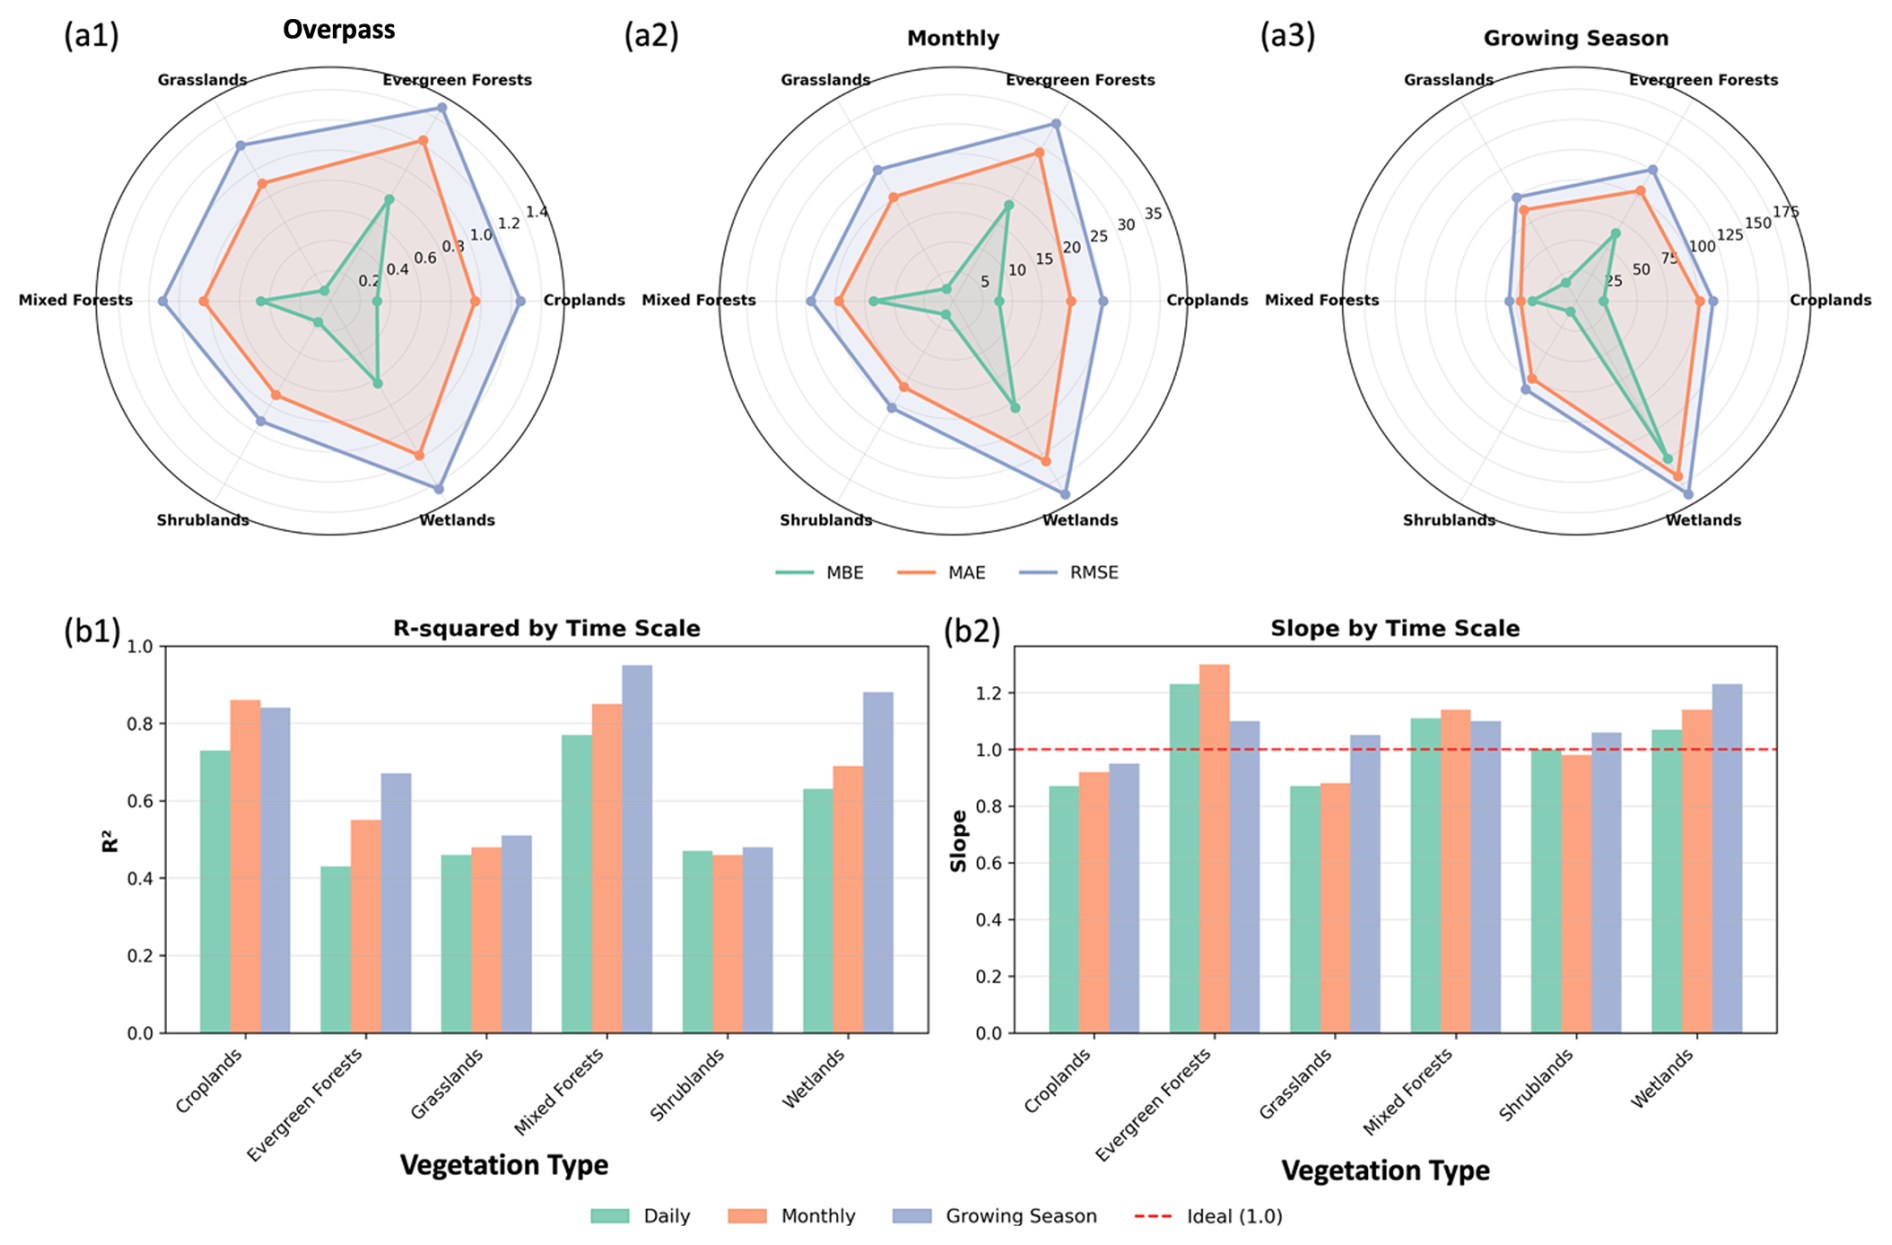
Figure 6Performance of GEE-DisALEXI at overpass day (a1), monthly (a2) and growing season (a3) time steps for the six major vegetation types. Panels (b1) and (b2) show the R2 and slope for each vegetation types, respectively.
Temporal aggregation significantly improves model accuracy, with growing season averages outperforming daily and monthly estimates across most land covers and metrics. This trend suggests that smoothing over longer time periods helps reduce variability and noise, especially in complex ecosystems like forests. For example, Evergreen Forests show a reduction in relative RMSE from 64.1 % (Daily) to 57.8 % (Growing Season) and a drop in relative MAE from 53.2 % to 48.5 %. However, wetlands errors stand out as not dropping as much, particularly at the growing season scale, which suggests persistent bias.
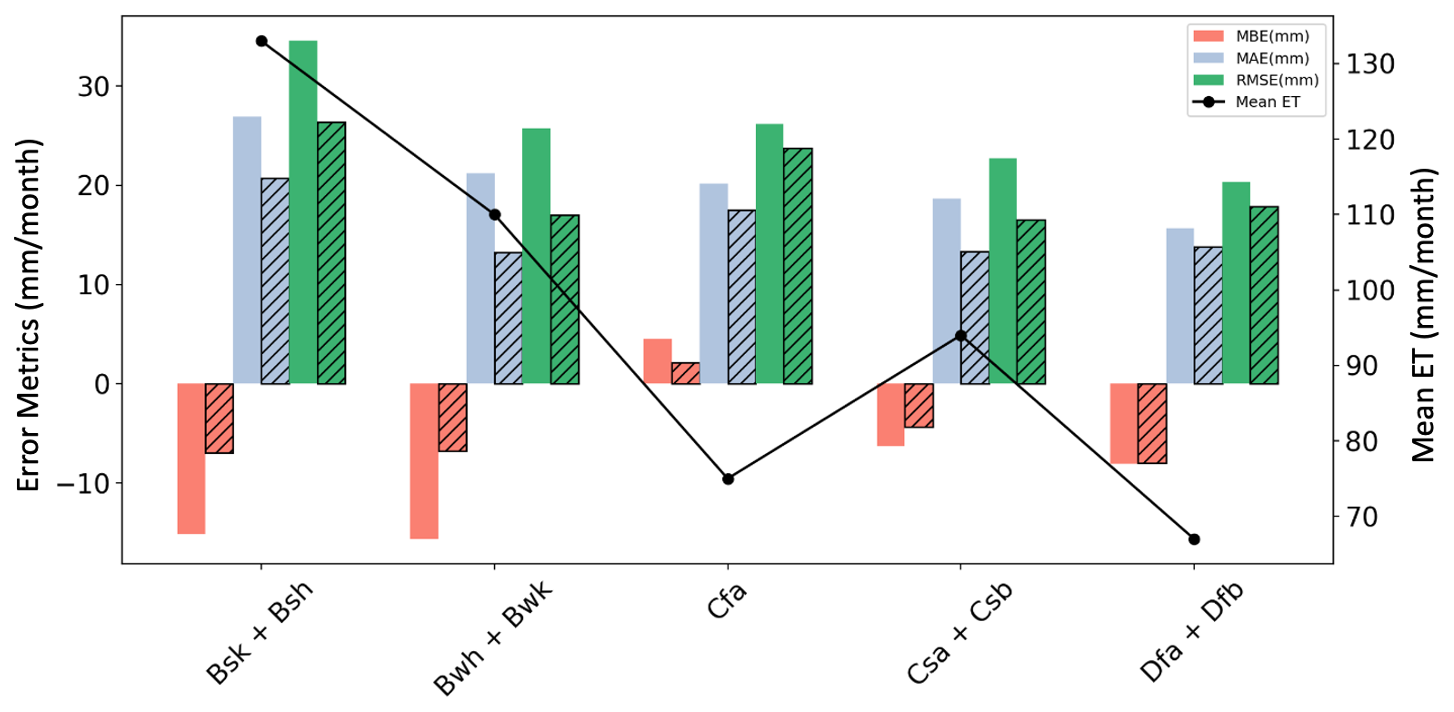
Figure 7Bar chart of the error metrics for monthly GEE-DisALEXI and OpenET-ensemble over different climate zones. Bars with cross-hatching represent error metrics associated with the ensemble value. The line represents the average observed monthly ET over each of the climate zones.
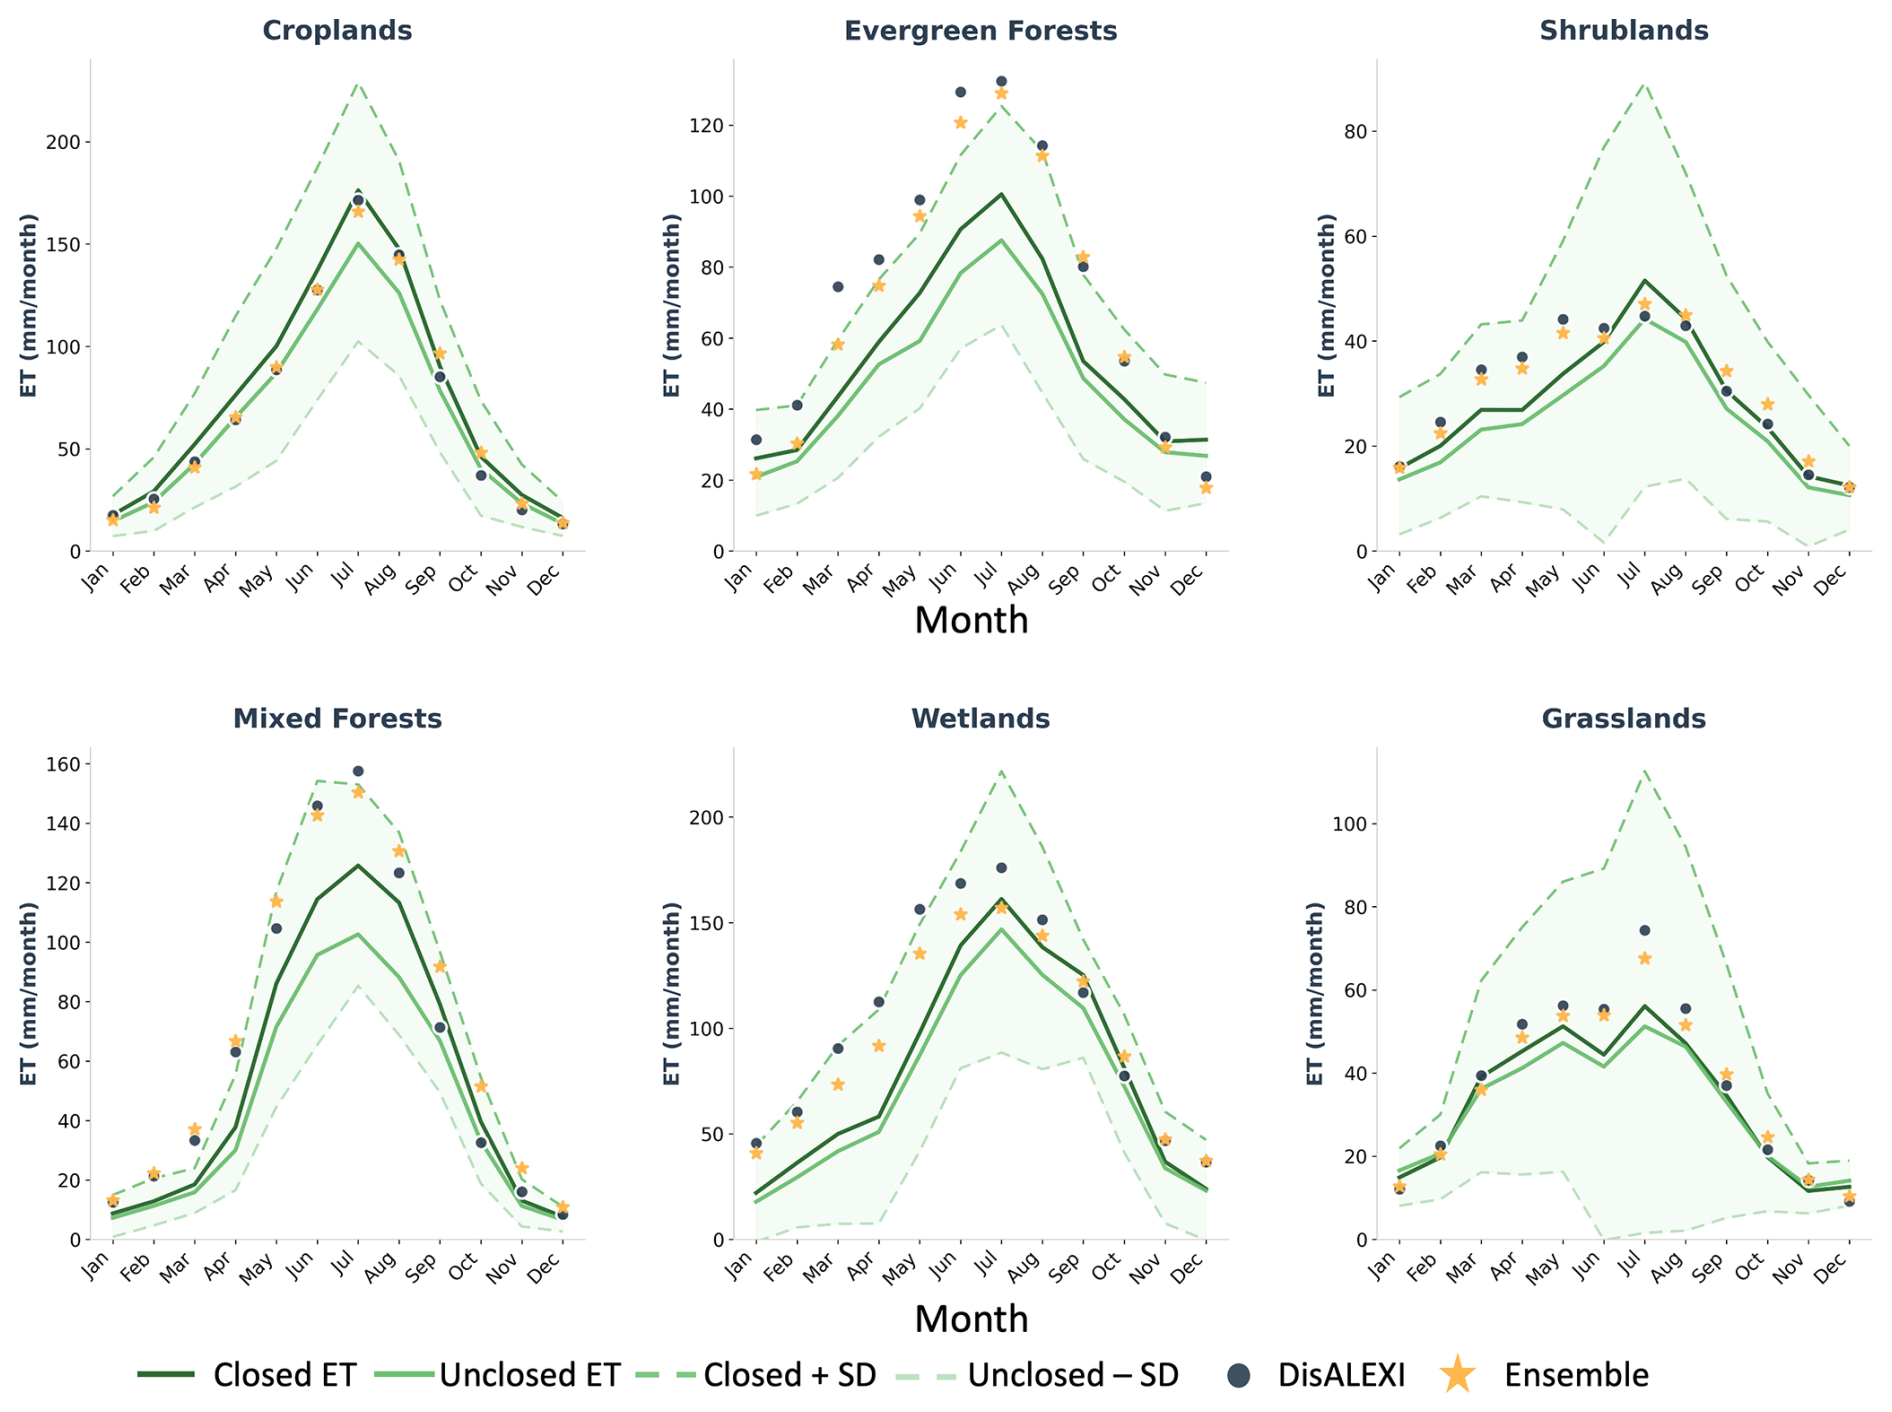
Figure 8Time series of monthly GEE-DisALEXI ET for different vegetation types, comparing with flux tower observations and ensemble values. The upper bound represents the average closure-corrected observed value plus one standard deviation (SD) among sites while the lower bound represents uncorrected ET observations minus one standard deviation.
Figure 7 evaluates model performance in estimating monthly ET across five Köppen climate zone groupings using three error metrics: MBE, MAE, and RMSE, all expressed in millimeters per month. Error metrics for OpenET-ensemble results are also shown in Fig. 7 as a reference. Overall, the performance of GEE-DisALEXI shows a similar trend and relatively higher biases comparing with OpenET-ensemble. The model performs best in temperate and humid climates, especially in humid continental regions (Dfa + Dfb), where R2 reaches 0.90, the slope is 0.93, and MAE is relatively low at around 15.68 mm per month. This region also shows a modest negative bias (MBE ≈ −7 mm per month). Mediterranean climates (Csa + Csb) follow closely, with R2=0.87, a near-unity slope, and similarly low error magnitudes. Model performance is relatively lower in arid climates. Semi-arid (Bsk + Bsh) and desert (Bwh + Bwk) zones exhibit lower R2 values between 0.81 and 0.85, underestimation bias (MBE less than −10 mm), and MAE values exceeding 21 mm. The humid subtropical zone (Cfa) presents a mixed result: the slope (1.03) indicates good proportionality, the R2 value (0.72) reflecting higher scatter. The results demonstrates that the model performs better in humid and temperate climates, while arid regions remain more challenging due to their complex surface and atmospheric conditions.
Across different vegetation types, monthly ET exhibits strong seasonality (Fig. 8). For the flux tower observed ET, shrubland and grassland show a larger variation between the closed and unclosed ET comparing with other vegetation types. Most vegetations types show a single peak value in the summer, while both model and observations indicate a double peak in the ET phenology curve in grasslands. While the modeled monthly ET from croplands, shrublands, wetlands, and grasslands are mostly inside the range between closed flux tower ET plus standard deviation and unclosed ET minus standard deviation, modeled monthly ET from evergreen forests and mixed forests tend to be around the upper boundary. This suggests the overestimation of modeled ET for both evergreen forests and mixed forests. Model fluxes in wetlands and shrublands show a positive bias in the spring and early summer but match observed fluxes well in the second half of the year.

Figure 9Maps showing the (a) WBET, (b) GEE-DisALEXI ET, (c) OpenET-ensemble ET, and (d) relative difference between GEE-DisALEXI ET and WBET at HUC08 watersheds. The marked HUC08 watersheds in (d) are the retained watersheds after applying all the filters.
3.3 WBET evaluation of spatial patterns in GEE-DisALEXI ET
Comparing the spatial pattern of HUC08 ET from WBET, annual GEE-DisALEXI and OpenET-ensemble ET from 2016 to 2022, all three ET maps show a similar east-to-west gradient, with higher ET in the humid south-central US and Pacific Northwest and lower ET in the arid interior west (Fig. 9). GEE-DisALEXI and OpenET-ensemble ET are larger than WBET for the arid interior west area. The map in Fig. 9 shows differences between WBET and GEE-DisALEXI, applying the filtering criteria described in Sect. 2.3.4 applied to ensure the WBET estimate is not missing critical sources or sinks in the water balance equation. After filtering, the remaining HUC08 watersheds show lower DisALEXI ET relative to WBET in the Mississippi Alluvial Plain, whereas higher DisALEXI ET is observed in watersheds across the central US.
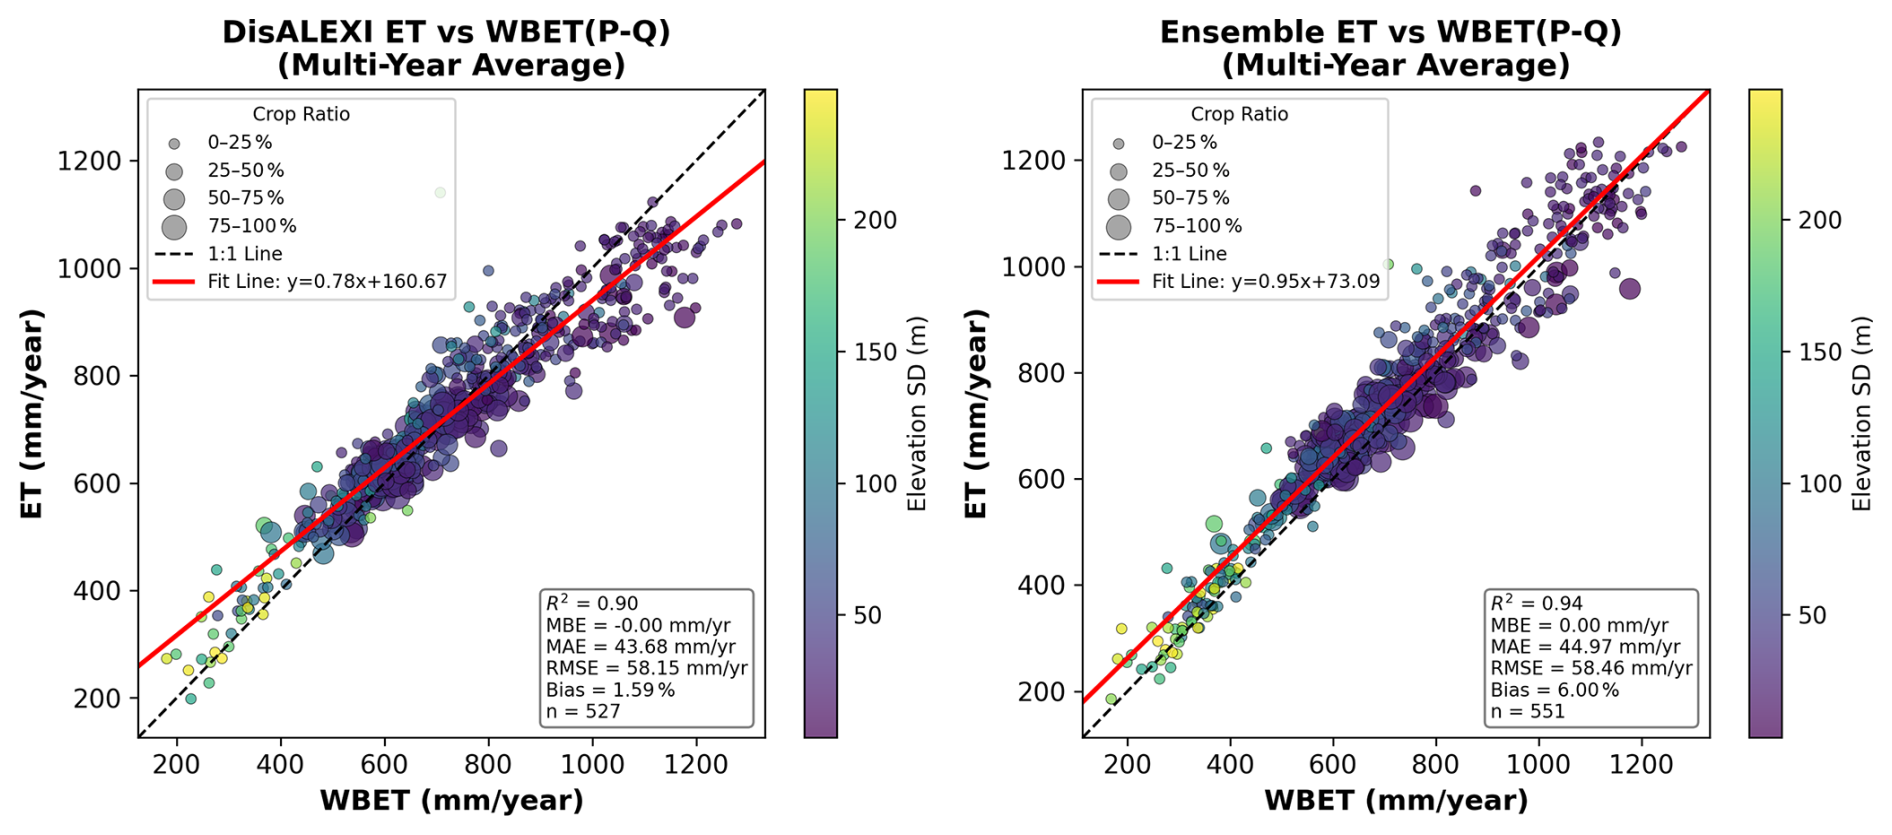
Figure 10Scatter plots of DisALEXI ET and Ensemble ET vs. WBET for all the filtered HUC08 watersheds. The size of the points represents crop land ratio in the watershed, with larger points corresponding to higher crop land ratios. The color of the points shows the elevation standard deviation in the watershed.
The scatterplots in Fig. 10 compare modeled ET from GEE-DisALEXI (left) and the OpenET-ensemble (right) with the water balance ET (WBET, P−Q) across more than 500 US HUC08 basins, using multi-year averages. Each point represents a HUC08 basin, with symbol size indicating cropland fraction and color representing standard deviation of elevation. GEE-DisALEXI ET shows a strong correlation (R2=0.90) with WBET with a slight underestimation of ET in watersheds with higher ET. OpenET-ensemble ET performs similarly, with slightly better performance (R2=0.94). At the low ET end, biases may be related to uncertainties in precipitation and streamflow data in water-limited basins, where small absolute errors can translate into larger relative differences. At the high ET end, the tendency toward underestimation may reflect limitations in representing complex and dense vegetation canopies. In addition, both models show higher biases in basins with high elevation variability and lower cropland proportions. While WBET provides an independent estimate of long-term basin scale ET, it is subject to uncertainties associated with precipitation, streamflow observations, groundwater exchanges, and inter-basin water transfers, which may also contribute to the biases in the scatterplot in Fig. 10.
3.4 Relationships between ET metrics and drought
Because ET is closely linked to vegetation physiological processes, variations in ET can provide valuable information on vegetation water stress and response to water availability, making ET a useful indicator of drought conditions. However, ET is also strongly influenced by meteorological forcing. To minimize the effects of weather variability and better isolate vegetation response, drought indicators often use the ratio of actual ET to reference ET or its anomaly. Previous studies have demonstrated responsiveness of ALEXI/DisALEXI ET estimates to drought and drought impacts (Anderson et al., 2011, 2013; Anderson and Kustas, 2008; Otkin et al., 2018; Yang et al., 2020). The Evaporative Stress Index (ESI) represents anomalies in the ratio between ET and reference ET (fRET), often normalized by fRET standard deviation (Anderson et al., 2007a). ESI response has been evaluated at coarse (ALEXI; 4–10 km) resolution over country scales, showing good relationship with crop yield anomalies and indicating value as a metric of vegetation health (Yang et al., 2020, 2021b). Analyses to date of ESI at DisALEXI resolution (30 m) have been confined to small area due to computational constraints, but also indicate value for yield prediction (Yang et al., 2018, 2021a) and forest management (Isaacson et al., 2023; Yang et al., 2020).
The compute power offered by GEE now enables assessment of DisALEXI ESI at regional scales. Figure 11 shows the temporal variation and relationship between ESI and DSCI mean values from 2001 to 2024 across five Köppen climate classes in the western US. In each subplot, the ESI (blue) and mean DSCI (green) are plotted as a function of year. While we do not expect perfect agreement between these indicators, particularly at these scales, the comparison demonstrates responsiveness to major regional drought events over the period of record.
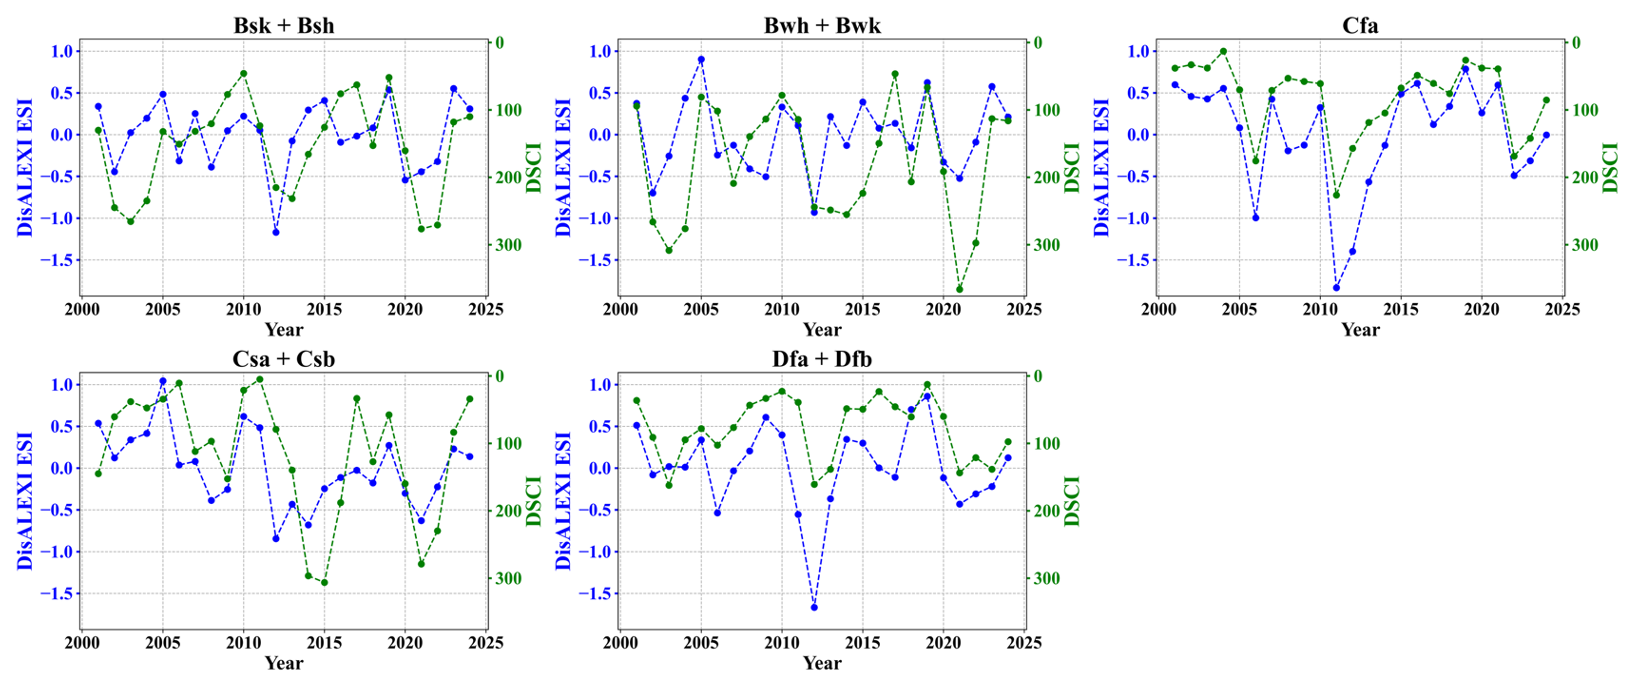
Relatively strong correlations between ESI and DSCI are observed for the Cfa, Bsk_Bsh and Dfa+Dfb climate zones, highlighting the Texas and south-central drought in 2011 (Cfa, Bsk_Bsh) and the 2012 flash drought that impacted the Midwest and Corn Belt (Dfa + Dfb). Drought cycles on the West Coast (Csa+Csb) are captured, with some mitigation of ET anomalies at the peak of the mega-drought in 2014–2015, perhaps due to irrigation captured by ESI. Correlations are less strong in the arid southwest desert (Bwh + Bwk) where the ET signal is low.
4.1 Uniqueness of GEE-DisALEXI among OpenET models
From both a model-structure and physical-process perspective, GEE-DisALEXI exhibits distinct characteristics among the OpenET models. The GEE-DisALEXI links the coarse-scale ALEXI solution with field-scale DisALEXI retrievals and explicitly partitions soil and canopy fluxes. The nested design constrains fine-resolution flux estimates to be consistent with regional energy balance and relies primarily on thermal infrared land surface temperature, in contrast to models that depend more heavily on crop coefficients or reference ET scaling. A key distinction of GEE-DisALEXI is its use of TSEB model as the core, which separately solves the energy balance for soil and canopy components using LST as the primary constraint. By explicitly estimating soil and canopy contributions, GEE-DisALEXI can better characterize heterogeneous vegetation canopies and mixed soil-vegetation conditions that are common in agricultural and natural ecosystems.
Previous assessments have found that the OpenET ensemble generally outperforms individual models under many conditions by reducing the impact of model-specific biases and enhancing robust signals. GEE-DisALEXI ranks near the top of the OpenET models in terms of accuracy for the woody perennial cropland flux sites (Volk et al., 2024). In vineyards, the ensemble has monthly MAE and RMSE of 13.7 and 16.2 mm per month (12.2 % and 14.5 % of flux ET, R2=0.90), while GEE-DisALEXI has MAE and RMSE of 13.0 and 15.9 mm per month (11.6 % and 14.2 % of lux ET, R2=0.90). For orchards, the ensemble has monthly MAE and RMSE of 21.2 and 27.9 mm per month (16.8 % and 22.1 % of flux ET, slope 0.87, MBE −11.9 mm per month), and DisALEXI has MAE and RMSE of 22.2 and 27.9 mm per month (17.6 % and 22.1 % of observed ET, slope 0.86, MBE −8.5 mm per month), ranking among the lowest-error individual models along with SSEBop. These results suggest that the relatively strong performance of GEE-DisALEXI in vineyards and orchards is consistent with its TSEB structure, which explicitly partitions soil and canopy fluxes and may better capture ET dynamics in vegetation with more structured canopy architectures (Knipper et al., 2023, 2024).
Another important distinction of GEE-DisALEXI is less sensitive to errors in reference evapotranspiration inputs. While the other OpenET models incorporate reference ET, either directly for estimating overpass-day ET or indirectly for interpolating ET from satellite overpasses to daily and monthly timescales, GEE-DisALEXI uses solar radiation from CFSR for both upscaling to 24 h ET and for daily interpolation between overpasses, based on the findings of Cammalleri et al. (2013) who tested multiple scaling fluxes including insolation, reference ET, and available energy. Reference ET-based interpolation can be sensitive and prone to positive bias in water-limited conditions even after gridded reference ET is corrected for bias. Therefore, GEE-DisALEXI provides an independent and physically based estimate of ET, which can serve as a useful benchmark for evaluating ensemble and reference-ET-dependent products. Optimization of scaling/interpolation technique may be regionally dependent and sensitive to the temporal sampling of the anchoring clear-sky direct ET retrievals.
4.2 Strengths of cloud implementation
Implementing GEE-DisALEXI on a cloud-based platform such as GEE provides several practical advantages for data production and dissemination compared with traditional local computing environments. The cloud implementation enables efficient and scalable processing of high-resolution ET data across large spatial and temporal domains without the need for local data storage or dedicated high-performance computing resources. The required satellite imagery and meteorological inputs are accessed directly from GEE's public data catalog, which reduces data handling complexity and ensures consistent use of input datasets. In addition, cloud-based execution supports reproducibility and transparency, as standardized workflows and version-controlled code can be executed consistently across regions and time periods. The modular model structure, together with Python–GEE integration, facilitates automated processing, routine updates, and both near-real-time and retrospective analyses. These characteristics support long-term product maintenance and improve the accessibility of the GEE-DisALEXI dataset for community use.
4.3 Limitations and known issues
Despite the advantages of implementing GEE-DisALEXI on a cloud-based platform, several limitations and known issues for the current version of GEE-DisALEXI must be acknowledged. First, inconsistencies in GOES satellite observations – such as differences in sensor calibration or viewing geometry across platforms (e.g., GOES-east vs. GOES-west) – can introduce variability in ALEXI land surface temperature (LST) inputs and resulting ET fluxes. In particular, spatial consistency between GOES ET and Landsat LST and LAI inputs to DisALEXI varies over the period of record, but improves with more recent and advanced GOES sensors.
Mountainous and complex terrain regions pose challenges due to elevation-induced differences in temperature and radiation, terrain shading, resulting in reduced accuracy of modeled energy fluxes over sloped surfaces. The current version of GEE-DisALEXI ET has higher biases over regions of complex terrain, and slope/aspect/elevation corrections will be implemented in future updates to the algorithm. Forest and wetland represent another challenging environment for RS-based models, including GEE-DisALEXI. In forests, the relationship between radiometric surface temperature observed by satellites and the aerodynamic temperature governing turbulent heat exchange can become more complex due to canopy structure, multiple scattering, and within-canopy temperature gradients. Wetlands may exhibit unique energy balance characteristics associated with standing water and enhanced heat storage that are not fully represented in the current model framework. Future model updates improving representation of forest canopy structure and wetland energy balance processes are needed.
Due to the disaggregation approach at the core of GEE-DisALEXI, small areas with very strong contrast in moisture conditions, for example, small irrigated patches in desert, can have higher biases. This is because these areas may have little impact at the 4 km ALEXI pixel scale, making ALEXI ET a less useful constraint in these cases. A hybrid method with direct implementation of TSEB over areas with highly localized contrast in LST and LAI may provide better performance. In addition, advection from the surrounding hot and dry bare soil over adjacent small irrigated areas can result in a strong enhancement in evaporative fluxes. These lateral fluxes may not be well captured by other members of the OpenET ensemble as well, and will be a focus of future study.
Open water bodies are often excluded from analysis due to the current model version of the ALEXI/GEE-DisALEXI over water surfaces, which lack the typical soil-canopy structure assumed by the model and the estimation of heat stored in water body. Simple corrections accounting for higher heat storage in wetlands can be applied (Anderson et al., 2018), but require further evaluation and an accurate map of wetland landcovers. Finally, cloud, snow, and water masking remain a persistent issue causing biases in ET estimation; while masking algorithms are implemented to exclude contaminated pixels, misclassification can occur, especially in transitional zones, leading to erroneous ET retrievals or spatial gaps in the final product. Over regions have large area of snow coverage, the regional ET summary from pixel-level ET can be underestimated since the snow areas are masked out. This could impact the comparison of GEE-DisALEXI ET with other method calculated ET (for example, water balance method) at regional scale.
4.4 Potential applications
DisALEXI has been extensively evaluated and applied across a wide range of land cover types and climatic regions using its offline version. For instance, studies have successfully applied DisALEXI to estimate ET in California vineyards and almond orchards (Knipper et al., 2023, 2024, 2018, 2019; Semmens et al., 2016), to help with irrigation scheduling. Anderson et al. (2018) utilized DisALEXI for a detailed water accounting over different crop types at field scale in the California Delta region. In the US Corn Belt, DisALEXI has shown robust performance, revealing a strong correlation between peak-season water stress and end-of-season crop yield (Yang et al., 2018, 2021a). Other than applications in agriculture, DisALEXI has been applied to other vegetation types, including forest and grassland (Yang et al., 2017b). For example, DisALEXI has been applied to pine plantations in North Carolina and temperate forests in Missouri, where the model performed well in both cases, further supporting its applicability across diverse ecosystems and for drought impact related studies. Recently, DisALEXI has also been utilized over the southeastern US. to study the impacts of longleaf pine restoration (Liu et al., 2025), that identified potential for augmenting water yield due to lower ET rates in comparison with introduced loblolly pine stands. Another study used GEE-DisALEXI to explore changes in forest water use dynamics due to southern pine beetle infection in loblolly pine (Goodnow et al., 2025). While these applications are demonstrated over small areas, GEE-DisALEXI is much more powerful through the cloud computing platform to conduct similar studies but at larger regional scale while keeping the fine spatial resolution.
4.5 Future directions
Several promising avenues exist for enhancing the utility and accuracy of the GEE-DisALEXI model implementation, which can also be helpful to improve other satellite derived ET models. First, data fusion techniques integrating observations from high-resolution satellites (e.g., Landsat, Sentinel-2) with thermal imagery from other sensors (e.g., ECOSTRESS, VIIRS) can provide improved spatial and temporal coverage of ET estimates. The integration of these additional thermal observations can help to fill observational gaps in Landsat, especially over areas with persistent cloud cover. With new thermal sensors (e.g. Landsat Next, LSTM, SBG, and TRISHNA) are planned for launch in the near future, and integration of these observations is expected to further improve the ability of thermal-based OpenET models to capture rapid changes in surface moisture fluxes. Second, partitioning of evapotranspiration into its components, evaporation (E) and transpiration (T), remains a critical area of development, particularly for better understanding water use efficiency and supporting precision agriculture applications and forest management. While all OpenET models tend to overestimate ET in forest, improved understanding of the partitioning between E and T could be helpful to identify key model modifications. Third, continued refinement of the core ALEXI model, including improved land surface temperature inputs from various satellites, will further increase robustness. Improvement of model efficiency, particularly in the air temperature refinement process, could reduce computational cost and runtime. Finally, efforts to improve the interpolation of daily ET, especially for cloudy regions, will enhance the accuracy of ET estimation at weekly, monthly and annual steps. Better understanding of the performance of various interpolation methods is needed for improved daily ET interpolation, which is also helpful for ET estimation at monthly and annual steps.
The cloud-based implementation of GEE-DisALEXI represents a major step toward operational, high-resolution ET monitoring at field-to-regional scales. Our evaluation demonstrates that GEE-DisALEXI performs robustly across diverse land cover types and climate zones, with notable strengths and limitations. Croplands consistently exhibit the highest accuracy across all temporal scales. Climate zone analysis reveals strong performance in humid and temperate regions, particularly humid continental climates, while arid zones remain challenging, with higher biases. Watershed-scale comparisons confirm that GEE-DisALEXI correlates well with water balance estimated ET, though biases persist in areas with high elevation variability and low cropland fractions. Additionally, time serious of fractional ET and drought severity indicate good correlations over various climate zones, especially over the humid regions. Overall, GEE-DisALEXI provides field-scale ET estimates suitable for agricultural water management, drought monitoring, and ecosystem studies. Future work should focus on further improving model efficiency on cloud compute platforms, enhancing model adaptability across complex terrain landscapes and integrating additional satellite observations with higher spatial or temporal resolutions.
Table A1Summary statistics between DisALEXI ET and observed ET for all sites.

The GEE-DisALEXI model is fully integrated into the OpenET platform and the outputs are saved as an asset on GEE. The GEE-DisALEXI model code is available on Zenodo at https://doi.org/10.5281/zenodo.18675103 (Yang et al., 2026). The monthly GEE-DisALEXI ET data can be found as open-access GEE asset (projects/openet/assets/disalexi/conus/gridmet/monthly/v2_0). The data can also be browsed over OpenET website (https://etdata.org/, last access: 24 February 2026) and can be accessed through code using OpenET API. The data for evaluation about water balance based ET is available on Zenodo at https://doi.org/10.5281/zenodo.18762901 (Yang and Duan, 2026).
YY designed the model experiments, integrated model into GEE, performed the evaluations, and contributed to investigation, data curation, and visualization. MA contributed to investigation and scientific discussions. CM, YK, CH and FG contributed to model integration. WD, HL and JV contributed to model evaluation. YY drafted the original paper and all co-authors contributed to the revisions.
The contact author has declared that none of the authors has any competing interests.
Publisher's note: Copernicus Publications remains neutral with regard to jurisdictional claims made in the text, published maps, institutional affiliations, or any other geographical representation in this paper. The authors bear the ultimate responsibility for providing appropriate place names. Views expressed in the text are those of the authors and do not necessarily reflect the views of the publisher.
GEE-DisALEXI data used in this study was produced on Google Earth Engine and we gratefully acknowledge Google. Inc. for the computing support and resources used to produce and process these data. The implementation of GEE-DisALEXI was partially supported by the Walton Family Foundation. The analysis of this work was partially supported by NASA ECOSTRESS (grant 80NSS23K0642), NASA ACRES (grant 80NSSC23M0034) and USGS OpenET Project Coorperative Agreement (G23AC00676). We acknowledge and thank the long-term data collection efforts by the AmeriFlux program.
Work on this analysis was supported by OpenET, National Aeronautics and Space Administration (NASA) Applied Science Program (grant no. 80NSSC23K1134); NASA ECOSTRESS program (grant no. 80NSSC23K0642); NASA ACRES program (grant no. 80NSSC23M0034); United States Geological Survey (USGS) Water Resources Research Institute (grant no. G23AC00676). In-kind support is provided by Environmental Defense Fund and Google Earth Engine.
This paper was edited by Di Tian and reviewed by two anonymous referees.
Agrawal, Y., Kumar, M., Ananthakrishnan, S., and Kumarapuram, G.: Evapotranspiration Modeling Using Different Tree Based Ensembled Machine Learning Algorithm, Water Resour. Manage., 36, https://doi.org/10.1007/s11269-022-03067-7, 2022.
Ahmad, S. K., Holmes, T. R., Kumar, S. V., Lahmers, T. M., Liu, P. W., Nie, W., Getirana, A., Orland, E., Bindlish, R., Guzman, A., Hain, C. R., Melton, F. S., Locke, K. A., and Yang, Y.: Droughts impede water balance recovery from fires in the Western United States, Nat. Ecol. Evol., 8, https://doi.org/10.1038/s41559-023-02266-8, 2024.
Allen, R. G., Tasumi, M., and Trezza, R.: Satellite-based energy balance for mapping evapotranspiration with internalized calibration (METRIC) – Model, J. Irrig. Drain. Eng., 133, 380–394, 2007.
Anderson, M. and Kustas, W.: Thermal Remote Sensing of Drought and Evapotranspiration, Eos Trans. Am. Geophysi. Union, 89, 233, https://doi.org/10.1029/2008EO260001, 2008.
Anderson, M., Neale, C., Li, F., Norman, J., Kustas, W., Jayanthi, H., and Chavez, J.: Upscaling ground observations of vegetation water content, canopy height, and leaf area index during SMEX02 using aircraft and Landsat imagery, Remote Sens. Environ., 92, 447–464, https://doi.org/10.1016/j.rse.2004.03.019, 2004a.
Anderson, M., Gao, F., Knipper, K., Hain, C., Dulaney, W., Baldocchi, D., Eichelmann, E., Hemes, K., Yang, Y., and Medellin-Azuara, J.: Field-Scale Assessment of Land and Water Use Change over the California Delta Using Remote Sensing, Remote Sens., 10, 889, https://doi.org/10.3390/rs10060889, 2018.
Anderson, M., Yang, Y., Xue, J., Knipper, K., Yang, Y., Gao, F., Hain, C., Kustas, W. P., Cawse-Nicholson, K., Hulley, G., Fisher, J. B., Alfieri, J., Meyers, T., Prueger, J. H., Baldocchi, D., and Sanchez, C.: Interoperability of ECOSTRESS and Landsat for mapping evapotranpiration time series at sub-field scales, Remote Sens. Environ., 252, 112189, https://doi.org/10.1016/J.RSE.2020.112189, 2020.
Anderson, M. C., Norman, J. M., Diak, G. R., Kustas, W. P., and Mecikalski, J. R.: A two-source time-integrated model for estimating surface fluxes using thermal infrared remote sensing, Remote Sens. Environ., 60, 195–216, 1997.
Anderson, M. C., Norman, J. M., Mecikalski, J. R., Torn, R. D., Kustas, W. P., and Basara, J. B.: A multiscale remote sensing model for disaggregating regional fluxes to micrometeorological scales, J. Hydrometeorol., 5, 343–363, 2004b.
Anderson, M. C., Norman, J. M., Kustas, W. P., Li, F., Prueger, J. H., and Mecikalski, J. R.: Effects of vegetation clumping on two–source model estimates of surface energy fluxes from an agricultural landscape during SMACEX, J. Hydrometeorol., 6, 892–909, 2005.
Anderson, M. C., Norman, J. M., Mecikalski, J. R., Otkin, J. a., and Kustas, W. P.: A climatological study of evapotranspiration and moisture stress across the continental United States based on thermal remote sensing: 1. Model formulation, J. Geophys. Res., 112, D10117, https://doi.org/10.1029/2006JD007506, 2007a.
Anderson, M. C., Kustas, W. P., and Norman, J. M.: Upscaling Flux Observations from Local to Continental Scales Using Thermal Remote Sensing, Agron. J., 99, 240, https://doi.org/10.2134/agronj2005.0096S, 2007b.
Anderson, M. C., Hain, C., Wardlow, B., Pimstein, A., Mecikalski, J. R., and Kustas, W. P.: Evaluation of Drought Indices Based on Thermal Remote Sensing of Evapotranspiration over the Continental United States, J. Climate, 24, 2025–2044, https://doi.org/10.1175/2010JCLI3812.1, 2011.
Anderson, M. C., Allen, R. G., Morse, A., and Kustas, W. P.: Use of Landsat thermal imagery in monitoring evapotranspiration and managing water resources, Remote Sens. Environ., 122, 50–65, https://doi.org/10.1016/j.rse.2011.08.025, 2012.
Anderson, M. C., Cammalleri, C., Hain, C. R., Otkin, J., Zhan, X., and Kustas, W.: Using a Diagnostic Soil-Plant-Atmosphere Model for Monitoring Drought at Field to Continental Scales, Proced. Environ. Sci., 19, 47–56, https://doi.org/10.1016/j.proenv.2013.06.006, 2013.
Anderson, M. C., Zolin, C. A., Sentelhas, P. C., Hain, C. R., Semmens, K., Yilmaz, M. T., Gao, F., Otkin, J. A., and Tetrault, R.: The Evaporative Stress Index as an indicator of agricultural drought in Brazil: An assessment based on crop yield impacts, Remote Sens. Environ., 174, 82–99, 2016.
Anderson, M. C., Kustas, W. P., Norman, J. M., Diak, G. T., Hain, C. R., Gao, F., Yang, Y., Knipper, K. R., Xue, J., Yang, Y., Crow, W. T., Holmes, T. R. H., Nieto, H., Guzinski, R., Otkin, J. A., Mecikalski, J. R., Cammalleri, C., Torres-Rua, A. T., Zhan, X., Fang, L., Colaizzi, P. D., and Agam, N.: A brief history of the thermal IR-based Two-Source Energy Balance (TSEB) model – diagnosing evapotranspiration from plant to global scales, Agr. Forest Meteorol., 350, 109951, https://doi.org/10.1016/j.agrformet.2024.109951, 2024.
Aragon, B., Houborg, R., Tu, K., Fisher, J. B., and McCabe, M.: Cubesats enable high spatiotemporal retrievals of crop-water use for precision agriculture, Remote Sens., 10, https://doi.org/10.3390/rs10121867, 2018.
Brutsaert, W.: Hydrology: an introduction, in: 3rd Edn., Cambridge University Press, Cambridge, https://doi.org/10.1017/9781316471562, 2023.
Cammalleri, C., Anderson, M. C., Gao, F., Hain, C. R., and Kustas, W. P.: A data fusion approach for mapping daily evapotranspiration at field scale, Water Resour. Res., 49, 4672–4686, https://doi.org/10.1002/wrcr.20349, 2013.
Caldwell, P. V., Sun, G., McNulty, S. G., Cohen, E. C., and Moore Myers, J. A.: Impacts of impervious cover, water withdrawals, and climate change on river flows in the conterminous US, Hydrol. Earth Syst. Sci., 16, 2839–2857, https://doi.org/10.5194/hess-16-2839-2012, 2012.
Daly, C., Neilson, R. P., and Phillips, D. L.: A statistical-topographic model for mapping climatological precipitation over mountainous terrain, J. Appl. Meteorol., 33, 140–158, 1994.
Dee, D. P., Balmaseda, M., Balsamo, G., Engelen, R., Simmons, A. J., and Thépaut, J. N.: Toward a consistent reanalysis of the climate system, B. Am. Meteorol. Soc., 95, https://doi.org/10.1175/BAMS-D-13-00043.1, 2014.
Fisher, J. B., Tu, K. P., and Baldocchi, D. D.: Global estimates of the land–atmosphere water flux based on monthly AVHRR and ISLSCP-II data, validated at 16 FLUXNET sites, Remote Sens. Environ., 112, 901–919, 2008.
Gao, F., Kustas, W. P., and Anderson, M. C.: A data mining approach for sharpening thermal satellite imagery over land, Remote Sens., 4, 3287–3319, 2012a.
Gao, F., Anderson, M. C., Kustas, W. P., and Wang, Y.: Simple method for retrieving leaf area index from Landsat using MODIS leaf area index products as reference, J. Appl. Remote Sens., 6, 63551–63554, 2012b.
Goodnow, S., Yang, Y., Liu, H., and Schulz, A.: Impacts of Southern Pine Beetle (Dendroctonus frontalis Zimmerman) on Loblolly Pine (Pinus taeda L.) Canopy and Water Use in the Homochitto National Forest, Mississippi, USA, Endeavors, 1, 2, https://doi.org/10.55533/3071-012X.1008, 2025.
Gorelick, N., Hancher, M., Dixon, M., Ilyushchenko, S., Thau, D., and Moore, R.: Google Earth Engine: Planetary-scale geospatial analysis for everyone, Remote Sens. Environ., 202, https://doi.org/10.1016/j.rse.2017.06.031, 2017.
Gowda, P. H., Chavez, J. L., Colaizzi, P. D., Evett, S. R., Howell, T. A., and Tolk, J. A.: ET mapping for agricultural water management: Present status and challenges, Irrig. Sci., 26, 223–237, https://doi.org/10.1007/s00271-007-0088-6, 2008.
Hain, C. R., Crow, W. T., Anderson, M. C., and Yilmaz, M. T.: Diagnosing Neglected Soil Moisture Source/Sink Processes via a Thermal Infrared-based Two-Source Energy Balance Model, J. Hydrometeorol., 16, 1070–1086, https://doi.org/10.1175/JHM-D-14-0017.1, 2015.
Isaacson, B. N., Yang, Y., Anderson, M. C., Clark, K. L., and Grabosky, J. C.: The effects of forest composition and management on evapotranspiration in the New Jersey Pinelands, Agr. Forest Meteorol., 339, 109588, https://doi.org/10.1016/j.agrformet.2023.109588, 2023.
Kang, Y., Ozdogan, M., Gao, F., Anderson, M. C., White, W. A., Yang, Y., Yang, Y., and Erickson, T. A.: A data-driven approach to estimate leaf area index for Landsat images over the contiguous US, Remote Sens. Environ., 258, 112383, https://doi.org/10.1016/J.RSE.2021.112383, 2021.
Kljun, N., Calanca, P., Rotach, M. W., and Schmid, H. P.: A simple two-dimensional parameterisation for Flux Footprint Prediction (FFP), Geosci. Model Dev., 8, 3695–3713, https://doi.org/10.5194/gmd-8-3695-2015, 2015.
Knipper, K., Anderson, M., Bambach, N., Kustas, W., Gao, F., Zahn, E., Hain, C., McElrone, A., Belfiore, O. R., Castro, S., Alsina, M. M., and Saa, S.: Evaluation of Partitioned Evaporation and Transpiration Estimates within the DisALEXI Modeling Framework over Irrigated Crops in California, Remote Sens., 15, https://doi.org/10.3390/rs15010068, 2023.
Knipper, K., Anderson, M., Bambach, N., Melton, F., Ellis, Z., Yang, Y., Volk, J., McElrone, A. J., Kustas, W., and Roby, M.: A comparative analysis of OpenET for evaluating evapotranspiration in California almond orchards, Agr. Forest Meteorol., 355, 110146, https://doi.org/10.1016/j.agrformet.2024.110146, 2024.
Knipper, K. R., Kustas, W. P., Anderson, M. C., Alfieri, J. G., Prueger, J. H., Hain, C. R., Gao, F., Yang, Y., McKee, L. G., Nieto, H., Hipps, L. E., Alsina, M. M., and Sanchez, L.: Evapotranspiration estimates derived using thermal-based satellite remote sensing and data fusion for irrigation management in California vineyards, Irrig. Sci., 37, 431–449, https://doi.org/10.1007/s00271-018-0591-y, 2018.
Knipper, K. R., Kustas, W. P., Anderson, M. C., Alsina, M. M., Hain, C. R., Alfieri, J. G., Prueger, J. H., Gao, F., McKee, L. G., and Sanchez, L. A.: Using High-Spatiotemporal Thermal Satellite ET Retrievals for Operational Water Use and Stress Monitoring in a California Vineyard, Remote Sens., 11, 2124, https://doi.org/10.3390/rs11182124, 2019.
Kustas, W. P. and Norman, J. M.: A two-source energy balance approach using directional radiometric temperature observations for sparse canopy covered surfaces, Agron. J., 92, 847–854, 2000.
Kustas, W. P., McElrone, A. J., Agam, N., and Knipper, K.: From vine to vineyard: the GRAPEX multi-scale remote sensing experiment for improving vineyard irrigation management, Irrig. Sci., 40, 435–444, https://doi.org/10.1007/s00271-022-00816-9, 2022.
Laipelt, L., Kayser, R. H. B., Fleischmann, A. S., Ruhoff, A., Bastiaanssen, W., Erickson, T. A., and Melton, F.: Long-term monitoring of evapotranspiration using the SEBAL algorithm and Google Earth Engine cloud computing, ISPRS J. Photogram. Remote Sens., 178, 81–96, 2021.
Li, C., Sun, G., Caldwell, P. V, Cohen, E., Fang, Y., Zhang, Y., Oudin, L., Sanchez, G. M., and Meentemeyer, R. K.: Impacts of urbanization on watershed water balances across the conterminous United States, Water Resour. Res., 56, e2019WR026574, https://doi.org/10.1029/2019WR026574, 2020.
Liang, S.: Narrowband to broadband conversions of land surface albedo I: Algorithms, Remote Sens. Environ., 76, 213–238, 2001.
Liu, H., Yang, Y., Anderson, M. C., Gao, F., Hain, C. R., Mishra, V., Volk, J. M., and Kang, Y.: Multi-satellite data fusion for improved field-scale evapotranspiration mapping on Google Earth Engine, Remote Sens. Environ., 336, 115299, https://doi.org/10.1016/j.rse.2026.115299, 2026.
Liu, N., Sun, G., Yang, Y., Aguilos, M., Starr, G., O'Halloran, T. L., Amatya, D. M., Oishi, A. C., Zhang, Y., and Trettin, C.: Potential for augmenting water yield by restoring longleaf pine (Pinus palustris) forests in the southeastern United States, Water Resour. Res., 61, e2024WR037444, https://doi.org/10.1029/2024WR037444, 2025.
Melton, F. S., Johnson, L. F., Lund, C. P., Pierce, L. L., Michaelis, A. R., Hiatt, S. H., Guzman, A., Adhikari, D. D., Purdy, A. J., and Rosevelt, C.: Satellite irrigation management support with the terrestrial observation and prediction system: A framework for integration of satellite and surface observations to support improvements in agricultural water resource management, IEEE J. Select. Top. Appl. Earth Obs. Remote Sens., 5, 1709–1721, 2012.
Melton, F. S., Huntington, J., Grimm, R., Herring, J., Hall, M., Rollison, D., Erickson, T., Allen, R., Anderson, M., Fisher, J. B., Kilic, A., Senay, G. B., Volk, J., Hain, C., Johnson, L., Ruhoff, A., Blankenau, P., Bromley, M., Carrara, W., Daudert, B., Doherty, C., Dunkerly, C., Friedrichs, M., Guzman, A., Halverson, G., Hansen, J., Harding, J., Kang, Y., Ketchum, D., Minor, B., Morton, C., Ortega-Salazar, S., Ott, T., Ozdogan, M., ReVelle, P. M., Schull, M., Wang, C., Yang, Y., and Anderson, R. G.: OpenET: Filling a Critical Data Gap in Water Management for the Western United States, J. Am. Water Resour. Assoc., 58., 971–994, https://doi.org/10.1111/1752-1688.12956, 2021.
Monteith, J. L.: Evaporation and environment, Symp. Soc. Exp. Biol., 19, 205–234, 1965.
Norman, J. M., Kustas, W. P., and Humes, K. S.: Source approach for estimating soil and vegetation energy fluxes in observations of directional radiometric surface temperature, Agr. Forest Meteorol., 77, 263–293, https://doi.org/10.1016/0168-1923(95)02265-Y, 1995.
Otkin, J., Svoboda, M., Hunt, E., Anderson, M., Hain, C. R., and Basara, J.: Flash droughts: A review and assessment of the challenges imposed by rapid onset droughts in the United States, B. Am. Meteorol. Soc., 99, 911–919, https://doi.org/10.1175/BAMS-D-17-0149.1, 2018.
Otkin, J. A., Anderson, M. C., Hain, C., and Svoboda, M.: Examining the relationship between drought development and rapid changes in the evaporative stress index, J. Hydrometeorol., 15, 938–956, 2014.
Pastorello, G., Trotta, C., Canfora, E., Chu, H., Christianson, D., Cheah, Y.-W., Poindexter, C., Chen, J., Elbashandy, A., and Humphrey, M.: The FLUXNET2015 dataset and the ONEFlux processing pipeline for eddy covariance data, Sci. Data, 7, 1–27, 2020.
Semmens, K. A., Anderson, M. C., Kustas, W. P., Gao, F., Alfieri, J. G., McKee, L., Prueger, J. H., Hain, C. R., Cammalleri, C., and Yang, Y.: Monitoring daily evapotranspiration over two California vineyards using Landsat 8 in a multi-sensor data fusion approach, Remote Sens. Environ., 185, 155–170, 2016.
Senay, G. B., Parrish, G. E. L., Schauer, M., Friedrichs, M., Khand, K., Boiko, O., Kagone, S., Dittmeier, R., Arab, S., and Ji, L.: Improving the Operational Simplified Surface Energy Balance Evapotranspiration Model Using the Forcing and Normalizing Operation, Remote Sens., 15, https://doi.org/10.3390/rs15010260, 2023.
Sun, L., Anderson, M. C., Gao, F., Hain, C., Alfieri, J. G., Sharifi, A., McCarty, G. W., Yang, Y., Yang, Y., and Kustas, W. P.: Investigating water use over the Choptank River Watershed using a multisatellite data fusion approach, Water Resour. Res., 53, 5298–5319, https://doi.org/10.1002/2017WR020700, 2017.
Svoboda, M. D., Fuchs, B. A., Poulsen, C. C., and Nothwehr, J. R.: The drought risk atlas: Enhancing decision support for drought risk management in the United States, J. Hydrol., 526, https://doi.org/10.1016/j.jhydrol.2015.01.006, 2015.
Volk, J. M., Huntington, J., Melton, F. S., Allen, R., Anderson, M. C., Fisher, J. B., Kilic, A., Senay, G., Halverson, G., and Knipper, K.: Development of a benchmark Eddy flux evapotranspiration dataset for evaluation of satellite-driven evapotranspiration models over the CONUS, Agr. Forest Meteorol., 331, 109307, https://doi.org/10.1016/j.agrformet.2023.109307, 2023.
Volk, J. M., Huntington, J. L., Melton, F. S., Allen, R., Anderson, M., Fisher, J. B., Kilic, A., Ruhoff, A., Senay, G. B., Minor, B., Morton, C., Ott, T., Johnson, L., Comini de Andrade, B., Carrara, W., Doherty, C. T., Dunkerly, C., Friedrichs, M., Guzman, A., Hain, C., Halverson, G., Kang, Y., Knipper, K., Laipelt, L., Ortega-Salazar, S., Pearson, C., Parrish, G. E. L., Purdy, A., ReVelle, P., Wang, T., and Yang, Y.: Assessing the accuracy of OpenET satellite-based evapotranspiration data to support water resource and land management applications, Nat. Water, 2, https://doi.org/10.1038/s44221-023-00181-7, 2024.
Wobus, C., Nash, C., Culp, P., Kelly, M., and Kennedy, K.: Simplified agricultural water use accounting in the Colorado River Basin using OpenET, Environ. Res. Lett., 20, 014020, https://doi.org/10.1088/1748-9326/ad984b, 2024.
Wulder, M. A., Roy, D. P., Radeloff, V. C., Loveland, T. R., Anderson, M. C., Johnson, D. M., Healey, S., Zhu, Z., Scambos, T. A., and Pahlevan, N.: Fifty years of Landsat science and impacts, Remote Sens. Environ., 280, 113195, https://doi.org/10.1016/j.rse.2022.113195, 2022.
Xiao, J., Fisher, J. B., Hashimoto, H., Ichii, K., and Parazoo, N. C.: Emerging satellite observations for diurnal cycling of ecosystem processes, Nat. Plants, 7, 877–887, https://doi.org/10.1038/s41477-021-00952-8, 2021.
Yang, Y. and Duan, W.: Water Balance Based Evapotranspiration for HUC08 Basins in Western United States [Dataset], Zenodo [data set], https://doi.org/10.5281/zenodo.18762901, 2026.
Yang, Y., Anderson, M. C., Gao, F., Hain, C. R., Semmens, K. A., Kustas, W. P., Noormets, A., Wynne, R. H., Thomas, V. A., and Sun, G.: Daily Landsat-scale evapotranspiration estimation over a forested landscape in North Carolina, USA using multi-satellite data fusion, Hydrol. Earth Syst. Sci., 21, 1017–1037, https://doi.org/10.5194/hess-21-1017-2017, 2017a.
Yang, Y., Anderson, M., Gao, F., Hain, C., Kustas, W., Meyers, T., Crow, W., Finocchiaro, R., Otkin, J., and Sun, L.: Impact of Tile Drainage on Evapotranspiration in South Dakota, USA, Based on High Spatiotemporal Resolution Evapotranspiration Time Series From a Multisatellite Data Fusion System, IEEE J. Select. Top. Appl. Earth Obs. Remote Sens., 10, 2550–2564, https://doi.org/10.1109/JSTARS.2017.2680411, 2017b.
Yang, Y., Anderson, M. C., Gao, F., Wardlow, B., Hain, C. R., Otkin, J. A., Alfieri, J., Yang, Y., Sun, L., and Dulaney, W.: Field-scale mapping of evaporative stress indicators of crop yield: An application over Mead, NE, USA, Remote Sens. Environ., 210, 387–402, 2018.
Yang, Y., Anderson, M., Gao, F., Hain, C., Noormets, A., Sun, G., Wynne, R., Thomas, V., and Sun, L.: Investigating impacts of drought and disturbance on evapotranspiration over a forested landscape in North Carolina, USA using high spatiotemporal resolution remotely sensed data, Remote Sens. Environ., 238, 111018, https://doi.org/10.1016/j.rse.2018.12.017, 2020.
Yang, Y., Anderson, M. C., Gao, F., Johnson, D. M., Yang, Y., Sun, L., Dulaney, W., Hain, C. R., Otkin, J. A., Prueger, J., Meyers, T. P., Bernacchi, C. J., and Moore, C. E.: Phenological corrections to a field-scale, ET-based crop stress indicator: An application to yield forecasting across the U.S. Corn Belt, Remote Sens. Environ., 257, 112337, https://doi.org/10.1016/j.rse.2021.112337, 2021a.
Yang, Y., Anderson, M. C., Gao, F., Wood, J. D., Gu, L., and Hain, C.: Studying drought-induced forest mortality using high spatiotemporal resolution evapotranspiration data from thermal satellite imaging, Remote Sens. Environ., 265, 112640, https://doi.org/10.1016/j.rse.2021.112640, 2021b.
Yang, Y., Anderson, M., Gao, F., Xue, J., Knipper, K., and Hain, C.: Improved daily evapotranspiration estimation using remotely sensed data in a data fusion system, Remote Sens., 14, 1772, https://doi.org/10.3390/rs14081772, 2022.
Yang, Y., Roderick, M. L., Guo, H., Miralles, D. G., Zhang, L., Fatichi, S., Luo, X., Zhang, Y., McVicar, T. R., Tu, Z., Keenan, T. F., Fisher, J. B., Gan, R., Zhang, X., Piao, S., Zhang, B., and Yang, D.: Evapotranspiration on a greening Earth, Nat. Rev. Earth Environ., 4, 626–641, https://doi.org/10.1038/s43017-023-00464-3, 2023.
Yang, Y., Anderson, M., Knipper, K., Gao, F., Hain, C., Duan, W., Melton, F., Morton, C., Volk, J., and Wang, Z.: Decreased Latency in Landsat Derived Evapotranspiration Products Using Machine Learning on Google Earth Engine, in: IGARSS 2024–2024 IEEE International Geoscience and Remote Sensing Symposium, 3054–3057, https://doi.org/10.1109/IGARSS53475.2024.10641995, 2024.
Yang, Y., Anderson, M., Morton, C., Kang, Y., Gao, F., Volk, J., Duan, W., Liu, H., and Hain, C.: GEE-DisALEXI V0.0.33 ET Model [Figure], Zenodo [code], https://doi.org/10.5281/zenodo.18675103, 2026.
Zheng, C., Jia, L., and Hu, G.: Global land surface evapotranspiration monitoring by ETMonitor model driven by multi-source satellite earth observations, J. Hydrol., 613, https://doi.org/10.1016/j.jhydrol.2022.128444, 2022.