
the Creative Commons Attribution 4.0 License.
the Creative Commons Attribution 4.0 License.
 | 21 Jul 2026
Modelling diffusion, decay and ingrowth of U–Pb isotopes in zircon
Ben S. Knight
Chris Clark
Understanding the thermal evolution of geological terranes provides essential insights into tectonic processes, crustal evolution, and mineral resource formation. Zircon U–Pb geochronology is widely used to date geological events, yet these dates are altered by a wide-range of processes, including diffusion of radiogenic isotopes at high (>800 °C) temperatures. This study utilises the underworld3 numerical code to couple diffusion processes with radioactive decay and ingrowth in two-dimensions. We assess the numerical solutions against a series of benchmarks to test the implementation, and apply the models to examine lead-loss due to thermal events and complexities that arise from multiple zircon growth episodes. Our approach bridges analytical U–Pb isotope measurements with a diffusion–decay–ingrowth numerical model, providing insights into how the thermal evolution of a region alters zircon U–Pb isotope ratios. We apply the methodology to the Trivandrum block in southern India, a region characterised by a prolonged high-temperature event, comparing multiple temperature–time paths with analytical U–Pb isotope data to provide constraints on the thermal evolution of the region. We provide a modelling framework, through the package UWDiffusion, that can be easily modified to investigate diffusion–decay–ingrowth across various minerals and isotopic systems, providing a tool to decipher the thermal history of a region recorded in isotopic data.
- Article
(5908 KB) - Full-text XML
-
Supplement
(53581 KB) - BibTeX
- EndNote


Geochronology is essential for understanding Earth's history, as it constrains the timing and duration of geological events and processes. One of the most widely utilised geochronometers is the mineral zircon (ZrSiO4) due to its ability to preserve radiogenic uranium–lead (U–Pb) isotopes over a wide range of pressures and temperatures throughout geological time (Strutt, 1909; Kulp, 1955; Liu and Liou, 2011; Gehrels, 2014; Rubatto, 2017). U–Pb zircon geochronology has been crucial in unravelling the evolution of metamorphic and igneous terranes by providing key chronological constraints.
Radioactive decay of uranium and the concurrent ingrowth of radiogenic lead underpin the U–Pb dating method. When zircon contains uranium isotopes, it gradually accumulates radiogenic lead, a process that occurs over the long half-lives of 238U and 235U, making the U–Pb system a reliable chronological tool for dating geological events (e.g. Gehrels, 2014; Jaffey et al., 1971). However, post-crystallisation processes, such as the diffusion of uranium and lead isotopes at high temperatures, can alter U–Pb ratios in zircon and complicate age determinations as well as the reconstruction of a region's geological history (Wetherill, 1963; Wasserburg, 1963).
Temperature plays a central role in modification of isotopes due to diffusion. Temperatures that exceed a mineral's closure temperature facilitate diffusion, causing lead loss that yields discordant measurements that skew age estimates. The closure temperature marks the threshold above which an isotopic system is open to diffusion, and below which they become closed, thereby recording the timing of cooling through modification of isotopes due to diffusion (Dodson, 1973) where the closure temperature can potentially be decreased due to radiation damage (Cherniak et al., 1991; Cherniak and Watson, 2001). Under prolonged (ultra-)high temperature conditions (>900 °C), diffusion can be so extensive that it resets the U–Pb clock altogether (Clark et al., 2011; Cherniak and Watson, 2001). Previous studies have quantified diffusion rates for both uranium (Cherniak et al., 1997; Lee et al., 1997) and lead (Lee et al., 1997; Cherniak and Watson, 2001; Cherniak et al., 1991; Cherniak and Watson, 2003), providing a basis for understanding these effects in zircon.
Although diffusion experiments have provided valuable insights (Cherniak et al., 1991; Cherniak and Watson, 2001; Cherniak et al., 1997; Cherniak and Watson, 2003; Bea and Montero, 2013), a key challenge remains. Limited attempts have been made to combine results with numerical models to assess temperature–time evolution and resulting lead loss experienced by zircon crystals in geological terranes. This limitation introduces uncertainties in interpreting discordant U–Pb data and restricts the ability to reconstruct detailed thermal histories. Integrating experimental and analytical data with numerical simulations is essential to address these issues.
In this study, we evaluate the interplay between diffusion, radioactive decay, and daughter isotope ingrowth in zircon to improve the interpretation of U–Pb geochronological data and provide temperature-time constraints based on analytical observations. We have two main objectives: (1) develop and validate a two-dimensional numerical model that captures the coupled diffusion–decay–ingrowth processes, and (2) apply the model to a case study of the Trivandrum block in Southern India to assess how a prolonged high-temperature event affects the zircon U–Pb record. Numerical simulations are compared to analytical U–Pb data to obtain estimates of the temperature-time path and peak temperatures during the metamorphic event.
This study employs the underworld3 numerical code (Moresi et al., 2025a) to simulate the diffusion–decay–ingrowth processes in zircon, and have developed a dedicated package, UWDiffusion (Knight, 2026), to streamline model setup and execution. This initial iteration focuses on diffusion, decay-ingrowth and diffusion–decay–ingrowth models, with plans to incorporate additional complexities, such as multicomponent diffusion. The scripts are designed to be flexible, with adjustable parameters and meshing including varying zircon crystal size, multiple growth events, diffusion coefficients, and temperature–time paths. It can be modified to investigate diffusion–decay–ingrowth effects in other minerals and their impact on additional isotopic systems, thereby offering a flexible tool for geochronological modelling.
2.1 Diffusion-decay-ingrowth equations
The diffusion-decay and diffusion-ingrowth equations for uranium and lead are implemented in the finite element code underworld3 (Moresi et al., 2025a) developed by the underworld group (Moresi et al., 2003; Mansour et al., 2020), that leverages the PETSc computational framework (Balay et al., 1997, 2019). The release of underworld3 has facilitated the development of UWDiffusion, which streamlines modelling various diffusion-based problems. The diffusion-decay and diffusion-ingrowth equations describe the spatial and temporal evolution of the concentration of isotopes undergoing diffusion, along with either decay or ingrowth (production). For the parent (PI) or daughter (DI) isotope, the decay-diffusion equation is expressed as:
where C is the concentration of either parent or daughter isotope, t is the time in s, D is the diffusion coefficient in m2 s−1, ∇2C is the Laplacian of the function C, λ is the decay constant of the parent isotope in s−1.
In 2D, ∇2C represents which are the second partial derivatives of C with respect to x and y, respectively. The inclusion of decay or ingrowth (λCPI) is included as a source term.
Zircon naturally incorporates uranium atoms into its crystal structure as a substitute for zirconium but excludes lead (almost) entirely when it forms (Krogh, 1993). This makes zircon an ideal candidate for U–Pb dating because any lead found in a zircon crystal is likely due to the radioactive decay of uranium and the U–Pb ratio can be used for dating.
When modelling diffusion-decay or diffusion-ingrowth, both U and Pb concentrations are set to zero at the boundary, enforcing a Dirichlet (essential) boundary condition that represents an infinite reservoir into which U and Pb can diffuse. This aligns with closure temperature estimates, above which the daughter product (Pb) is expected to escape from zircon (Dodson, 1973). However, previous studies have shown that radiogenic Pb can be retained within zircon at temperatures exceeding the closure temperature due to surrounding minerals or melt reducing Pb flux at the zircon grain boundary (Bea and Montero, 2013; Bea et al., 2018). Consequently, a zero concentration boundary condition represents the maximum possible Pb loss through diffusion. The rate of diffusion can be modified by damaged crystal structure due to deformation (Timms et al., 2012), radioactive decay (Cherniak and Watson, 2003; Ullah et al., 2023), or through annealing of the crystal (Cherniak and Watson, 2003). underworld3 can also accommodate Neumann (natural) boundary conditions (), where the model ensures that there is no net flux of concentration across the boundary, effectively representing an impermeable or insulated surface. This can be used to model the flux between minerals by utilising partition coefficients of U and Pb between zircon and other minerals, although it is not explored here.
The temperature-dependent diffusion coefficient is calculated by:
where D0 is the pre-exponent factor in m2 s−1. Ea is the activation energy in J mol−1. R is the gas constant in J mol−1 K−1. T is the temperature in K.
To solve time-dependent diffusion problems, the first-order backward differentiation formula (BDF1), also known as the backward Euler method, may be employed. The update equation for BDF1 is:
where C is the concentration of the scalar field. Cn is the value of C at the current time step n. Cn+1 is the value of C at the next time step n+1. Δt is time increment between steps n and n+1.
The model supports time integration using the backward differentiation formula (BDF) of up to third order. We use an unstructured irregular (triangle) mesh and use linear shape functions by defining C with a polynomial degree of 1, as we use the first order BDF which restricts the convergence of higher order shape functions. All mesh geometries to replicate the zircon mineral shape are created using gmsh (Geuzaine and Remacle, 2009).
Diffusion values for U and Pb are calculated using Eq. (2) and values outlined in Table 1. The values in Table 1 represent a zircon with low uranium content that has not exceeded its alpha damage percolation threshold which would result in faster diffusion due to radiation damage. Other work has utilised radiation-damaged zircons (Cherniak et al., 1991; Ullah et al., 2023) that have much higher diffusion coefficients, resulting in rapid Pb loss and lower closure temperatures.
Cherniak et al. (1997)Cherniak and Watson (2001)Table 1Variables used to determine the diffusion coefficients of U and Pb in zircon.
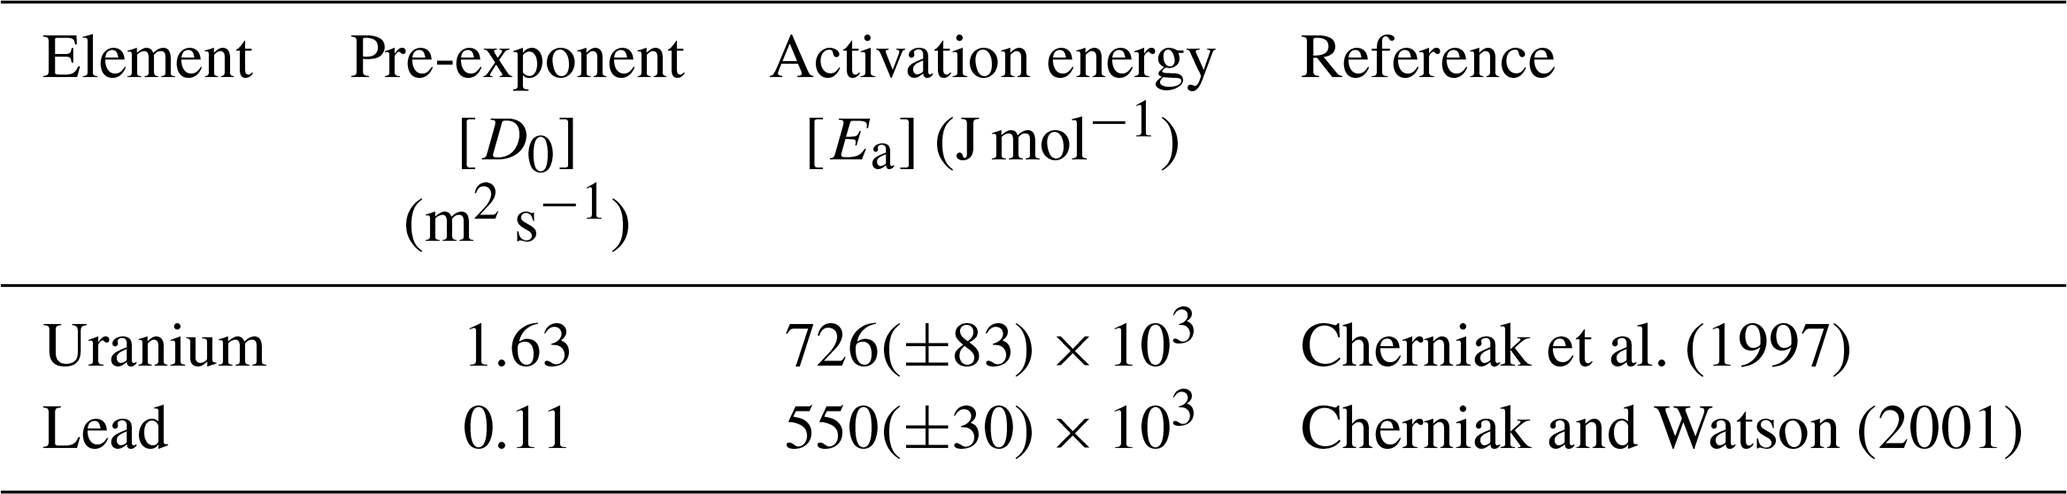
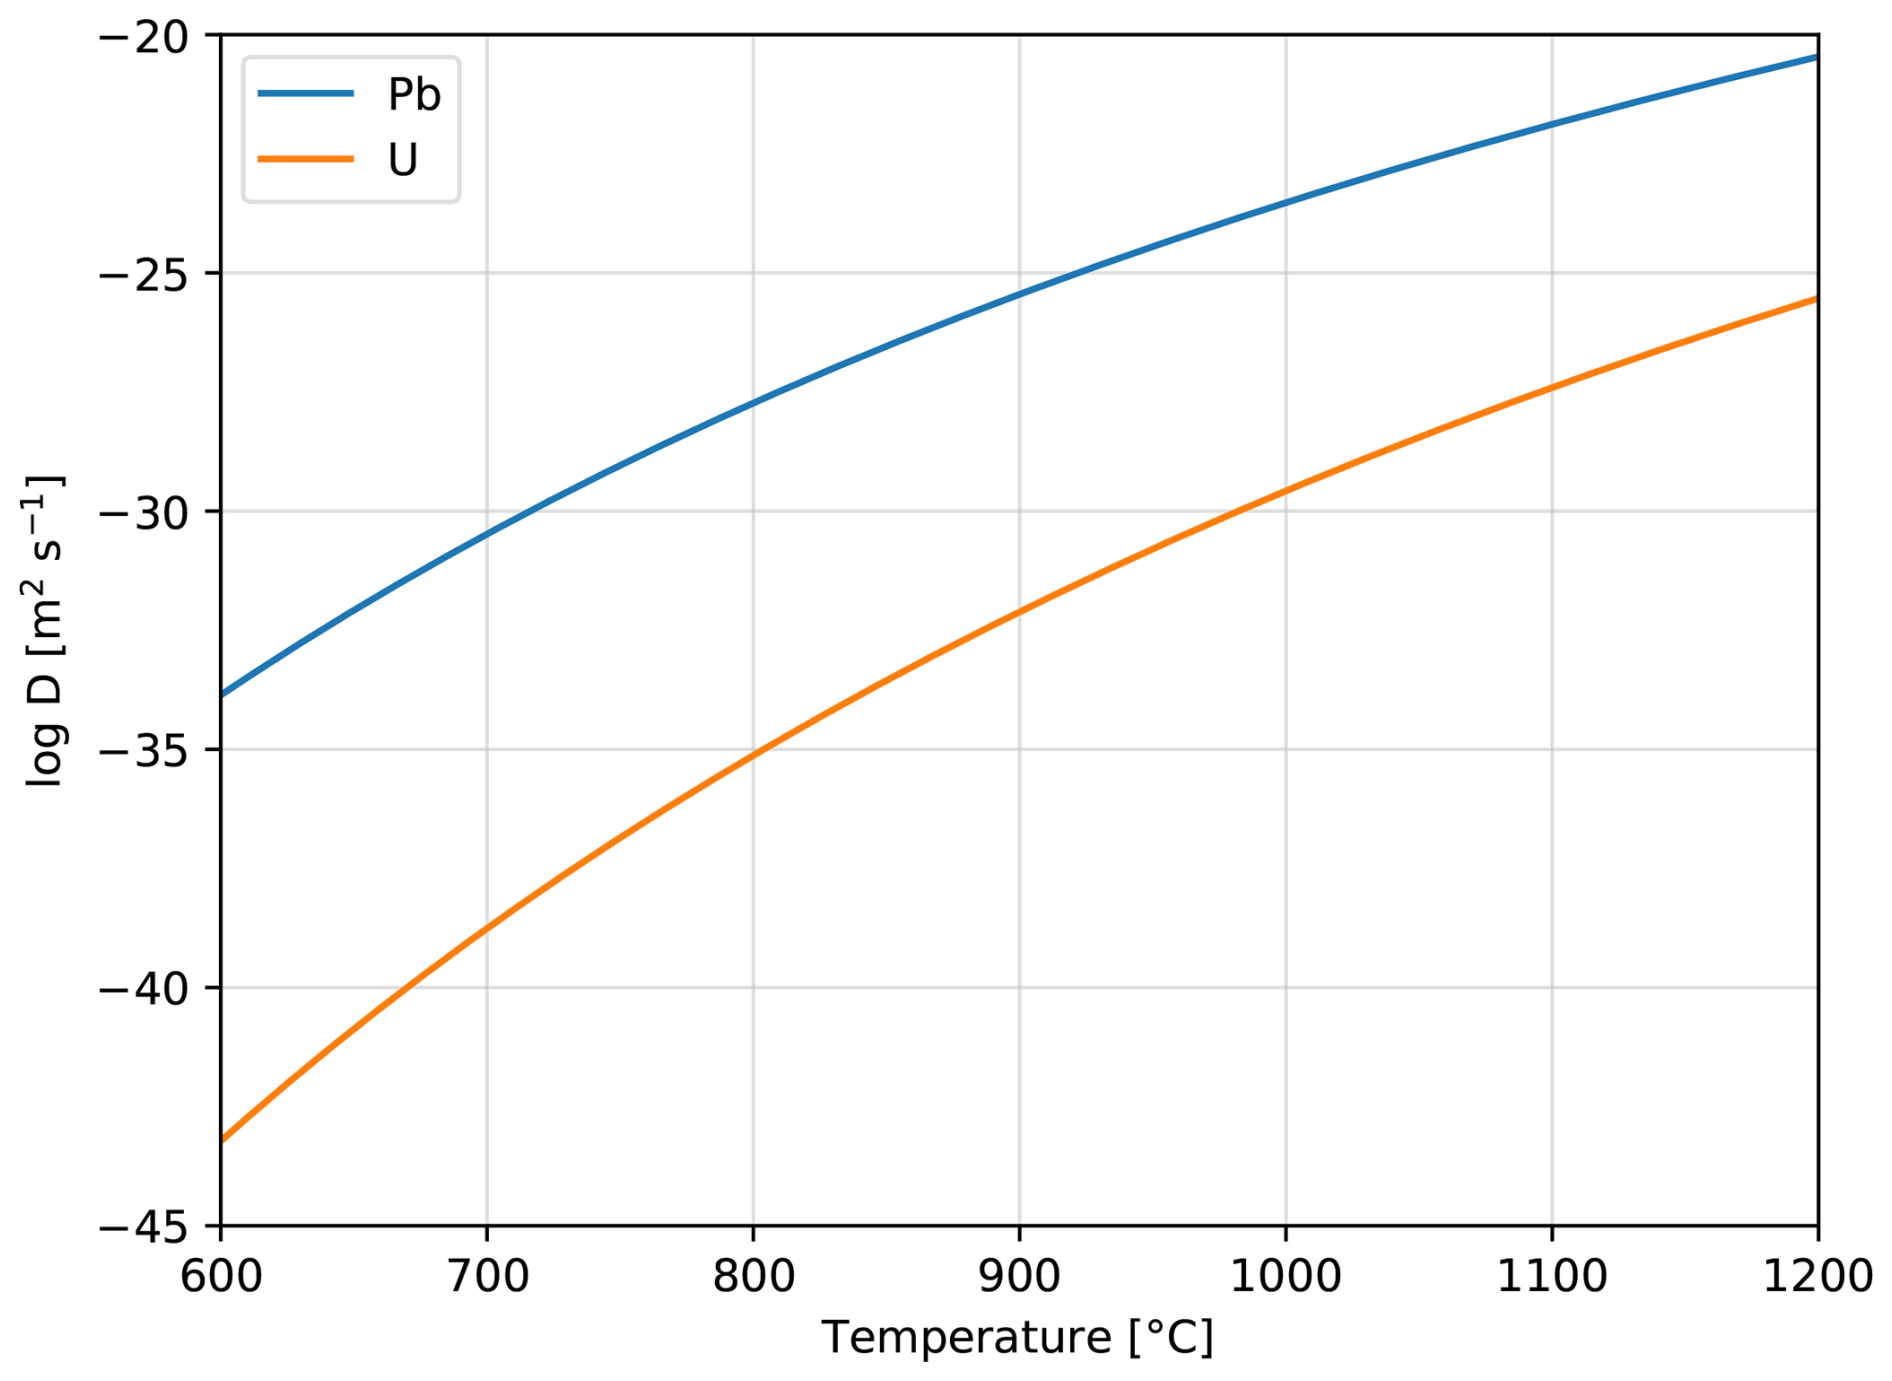
Figure 1Diffusion coefficients for uranium (U) and lead (Pb) from values in Table 1 and Eq. (3) over a temperature range of 600 to 1200 °C.
3.1 Decay and ingrowth
Radioactive decay is the spontaneous decay of a parent isotope into a daughter isotope (Hodges, 2013), where the half-life is the time it takes for half of the parent isotope population to decay. The half-life is part of the decay constant and can be used to determine the total amount of decayed material over a time-step by:
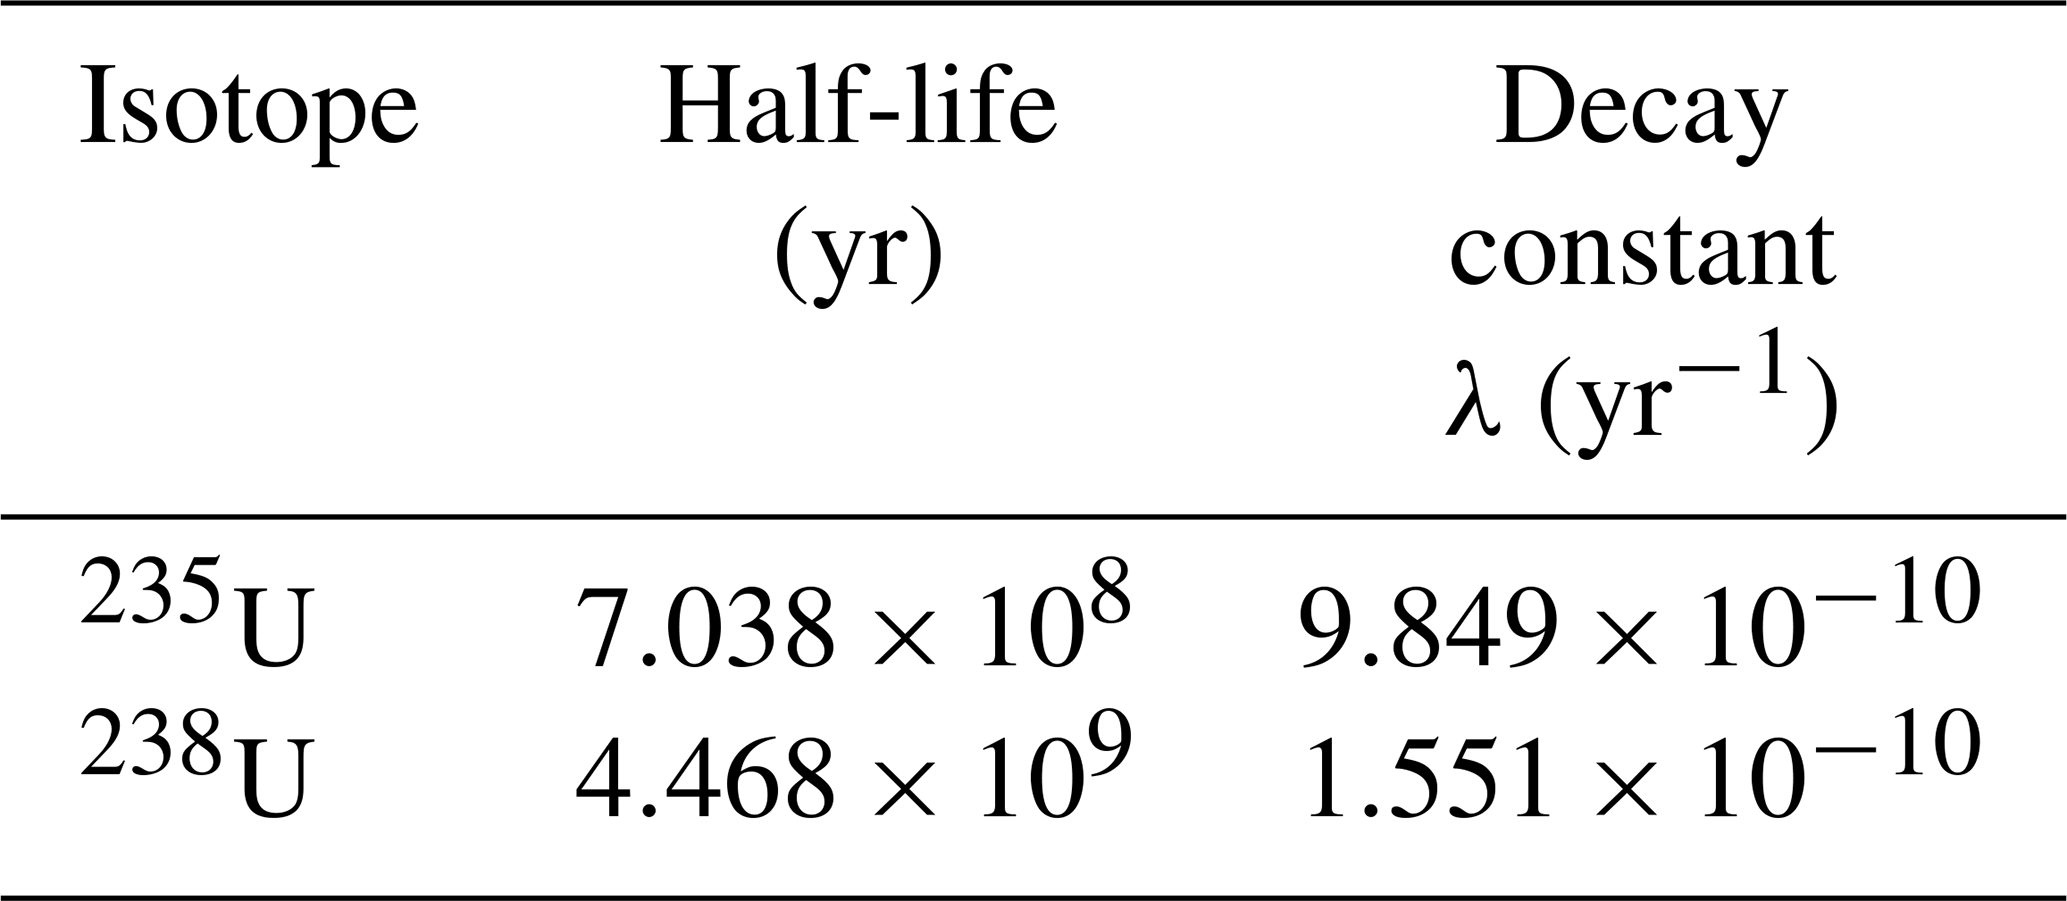
Table 2Half-lives and decay constants (λ) for isotopes 235U and 238U from Jaffey et al. (1971).
In the decay and ingrowth calculation the decay chain is ignored and is assumed to be under secular equilibrium, where the parent decays directly into the stable daughter without any intermediate decay products. This is commonly assumed in uranium–lead (U–Pb) dating as intermediate decay products in the uranium decay series are short lived and do not significantly impact the overall age calculations at geological timescales (Ludwig, 1998; Schoene, 2014).
To test the implementation of the decay and ingrowth equation, the 238U to 206Pb and 235U to 207Pb decay chains are tested, as both are commonly used to determine the age of a zircon. The required ratios can be calculated at a given point in time (t) as follows:
where 0.0072 is the current ratio of 235U to 238U (Hiess et al., 2012).
Plotting the ratios of uranium and lead isotopes as a function of time produces a Concordia diagram, which is a key tool for visualising results and determining the crystallisation age of zircon, which are typically constructed using either a Wetherill (Wetherill, 1963) or Tera-Wasserburg (Tera and Wasserburg, 1972) plot. If the zircon mineral has remained in a closed system since the time of its crystallisation, meaning that neither uranium nor lead isotopes have been gained or lost due to geological processes, the isotope ratios will plot along a curve known as the Concordia line. This method relies on the principle that zircon minerals retain uranium and exclude lead at formation and accumulate lead over time as uranium decays. The Concordia plot is constructed by plotting the ratio of two isotopes of uranium, 238U and 235U, against the ratios of their respective lead decay products, 206Pb and 207Pb. By comparing the measured ratios of uranium and lead isotopes in a zircon sample with this curve, the age of the zircon can be determined. Any deviations from the Concordia line (discordance) can indicate episodes of lead loss or gain, providing insights into the thermal history and geological events that the zircon has experienced.
Table 3Numerical (N) vs. analytical (A) ratios at 1000 and 500 Ma for three timestep sizes, where timestep is determined by taking the largest decay constant (λ) between 235U and 238U. Values rounded to 3 significant figures. .

Figure 2 shows a comparison between the Concordia plot and the results obtained from the numerical solution at selected ages. We model decay of parent isotopes into daughter isotopes in a box domain, with zero flux boundaries applied to every wall. We determine the stable timestep for both decay chains by using the isotope with the shortest half-life (235U) as we found using differing timesteps between chains results in inaccurate results. We start by calculating the expected 238U and 235U at the model start time (in Ma). We then solve either Eq. (1a) for the parent or Eq. (1b) with D=0, to determine the accuracy of the decay and ingrowth implementation. We find that the accuracy of decay and ingrowth when decay and ingrowth is included as a source term is dependent on the time-step size, where . Errors outlined in Table 3 show the ratio is much more sensitive to the time-step size than the ratio. Our results show that the time-step should be limited to to minimise the error when included as a source term.
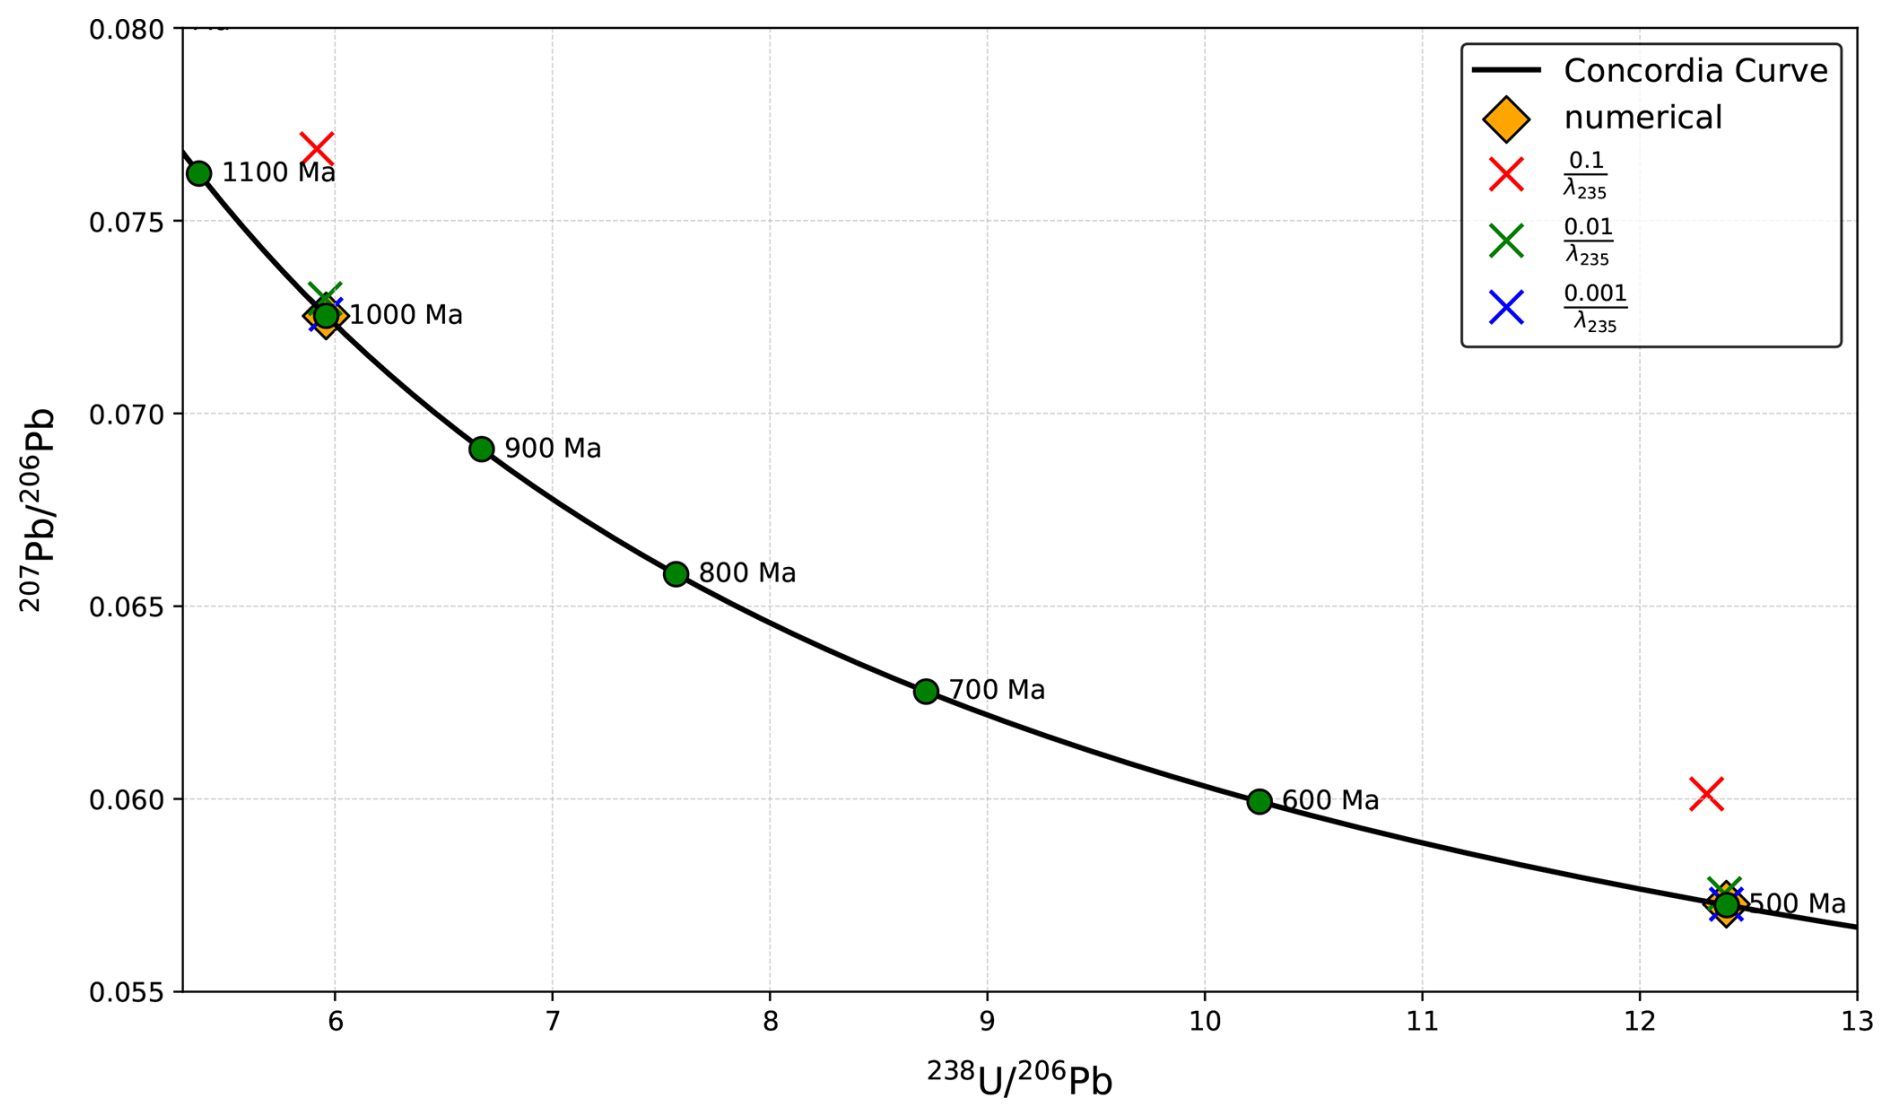
Figure 2Tera-Wasserburg plot of against showing the concordia line (solid black line) 100 Ma increments between 1000 and 500 Ma (green dots) and results of models at 1000 and 500 Ma (various symbols) solving for the decay and ingrowth only plot on the concordia line based on different timesteps when including the decay and ingrowth as a source term (Eqs. 1a and 1b), or calculating it numerically (Eqs. 4 and 5).
3.2 Diffusion
3.2.1 Convergence of diffusion solver
The advection-diffusion of a of a rectangular pulse benchmark is utilised to determine the order of convergence of the diffusion solver. To solve for diffusion only, the advection term is removed, which results in the analytical solution for diffusion only (Crank, 1975):
where Ua is the analytical solution, x0 is the start of the initial elevated concentration region, x1 is the end of the initial elevated concentration region, x is the x coordinate, t is the time, D is the thermal diffusivity.
For the rectangular pulse diffusion benchmark, the initial conditions are: x0=0.35 and x1=0.65, t=0 and D=1. The benchmark is performed in a square box (Fig. 3a), with analytical solution valid across the entire domain as it is extended in the vertical direction, with diffusion occurring in the horizontal plane (Fig. 3b). No boundary conditions are enforced, with zero flux across the boundary ().
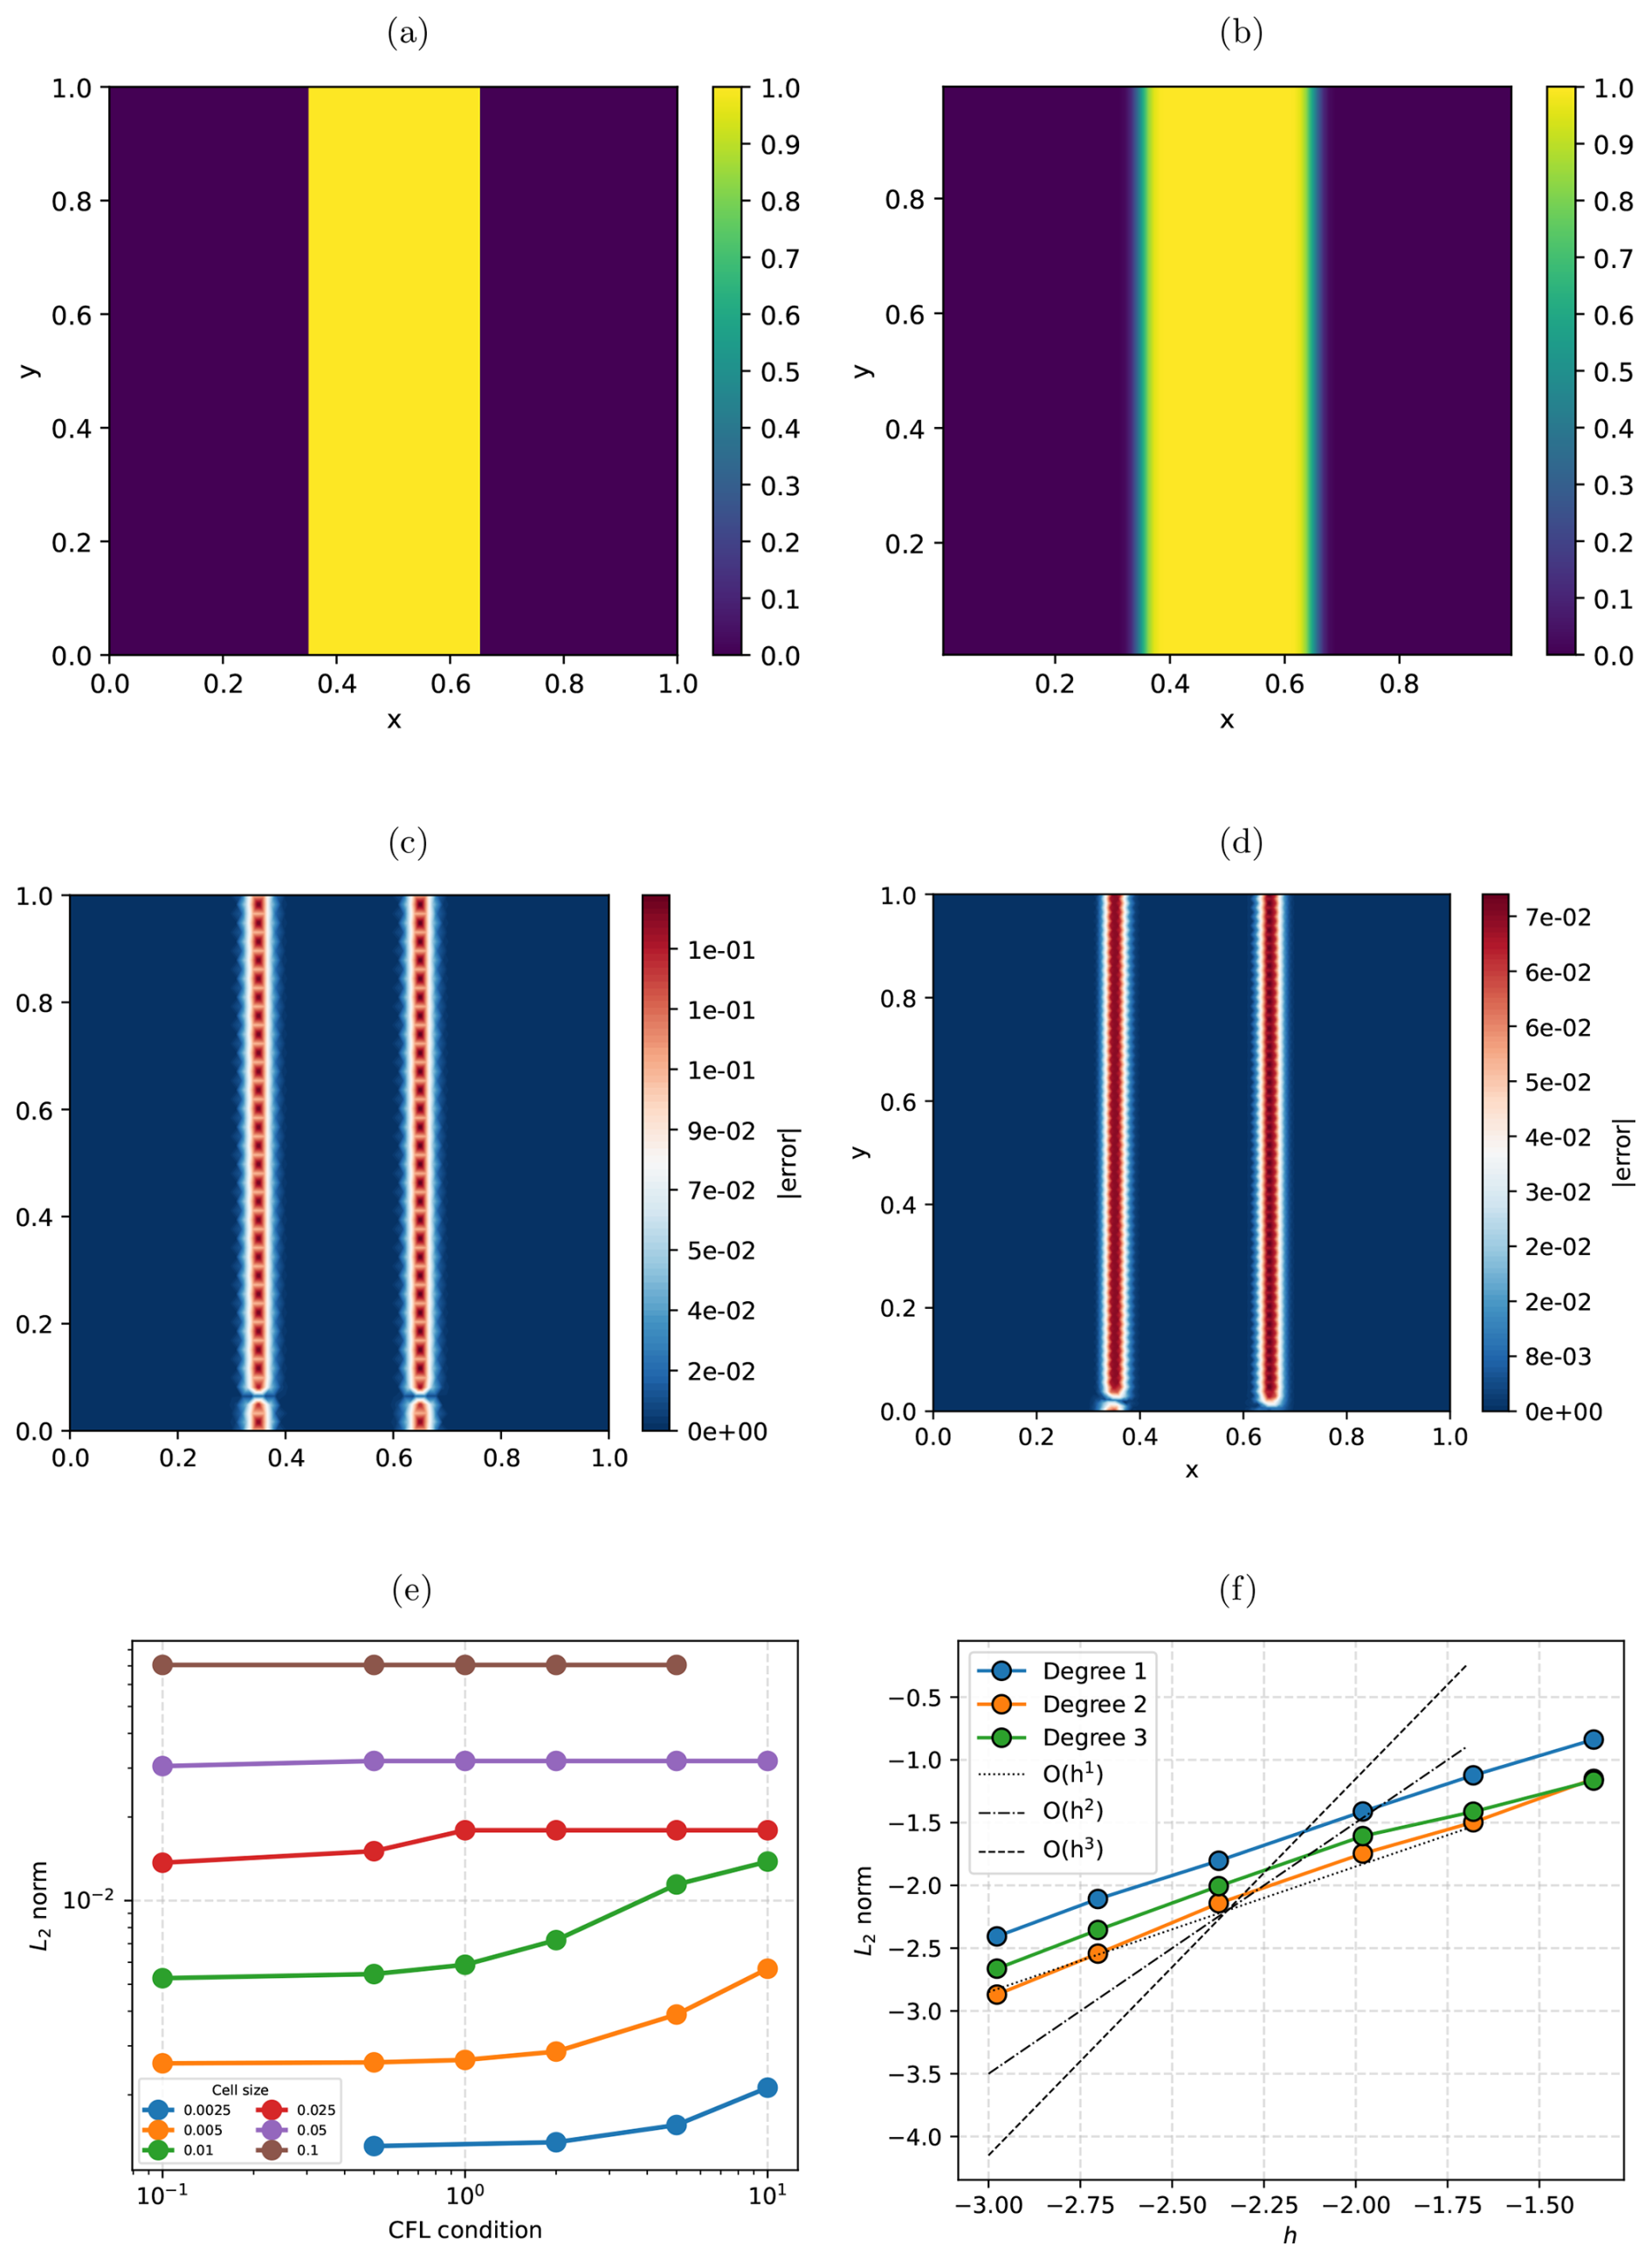
Figure 3Diffusion convergence order from rectangular pulse benchmark. (a) Initial distribution of unknown at t=0. (b) Final distribution of unknown at . L2-norm when cell size is (c) 0.02 and (d) 0.01. (e) shows the L2-norm based on cell size and factor of CFL condition. (f) Shows the convergence of the solver.
The results presented in Fig. 3 demonstrate underworld3 is able to accurately model diffusion across the domain. The results indicate that errors are concentrated near the diffusive interface (Fig. 3c and d). At larger cell sizes (>0.1), corresponding to lower resolution, the numerical model produces a less accurate result due to inadequate spatial discretisation. However, as the cell size decreases to around 0.025 or below, the accuracy of the result improves as the diffusing interface is better constrained (Fig. 3c and d). In these cases, a first-order convergence is observed across all tested polynomial degrees (Fig. 3f). We find that the CFL condition imposed does not have a major influence on the accuracy (Fig. 3e).
Based on these results, all following benchmarks are performed with a cell size of at least 0.01 and a polynomial of 2 to balance the accuracy of the solution and the time to solve the problem.
3.2.2 Isotropic diffusion
The diffusion of uranium and lead in zircon has been observed to be isotropic (Cherniak and Watson, 2003). The diffusion component of the solver is benchmarked by isolating the diffusion process from decay and ingrowth effects, with the initial distribution of U and Pb matching that used in the diffusion benchmark (Fig. 3a). The initial benchmarking is conducted under isothermal conditions, at temperatures of 750, 800, and 850 °C, for a duration of 500 Myr (million years). We benchmark the results using the analytical solution from Eq. (10) by substituting D for U or Pb at the given temperature using Eq. (2) and the values from Table 1.
To test the numerical models ability to replicate the diffusion process in geological conditions, i.e. as temperate decreases over time, models are also conducted where the temperature decreased linearly from 850 to 750 °C over 500 Myr. We utilise the analytical solution presented in Eq. (10) to benchmark the model, with a modification to account for the time-dependent diffusivity arising from temperature variations. The cumulative diffusivity (Dc), defined as the time integral of D over the time-step dt. This integrated value replaces the constant diffusivity (D) in Eq. (10), thereby enabling Eq. (10) to accurately reflect the evolving diffusion for both U and Pb as a function of the thermal history. We set zero flux () on all boundaries for the benchmark.
The numerical results match those produced by the analytical solution, with the model replicating the expected diffusion profile in the horizontal plane (Fig. 4). The consistency of results (Fig. 4) demonstrate the numerical model captures the transport of uranium and lead isotopes within the zircon matrix due to diffusion reliably and the model can be used to simulate long-term isotope diffusion over geological timescales.
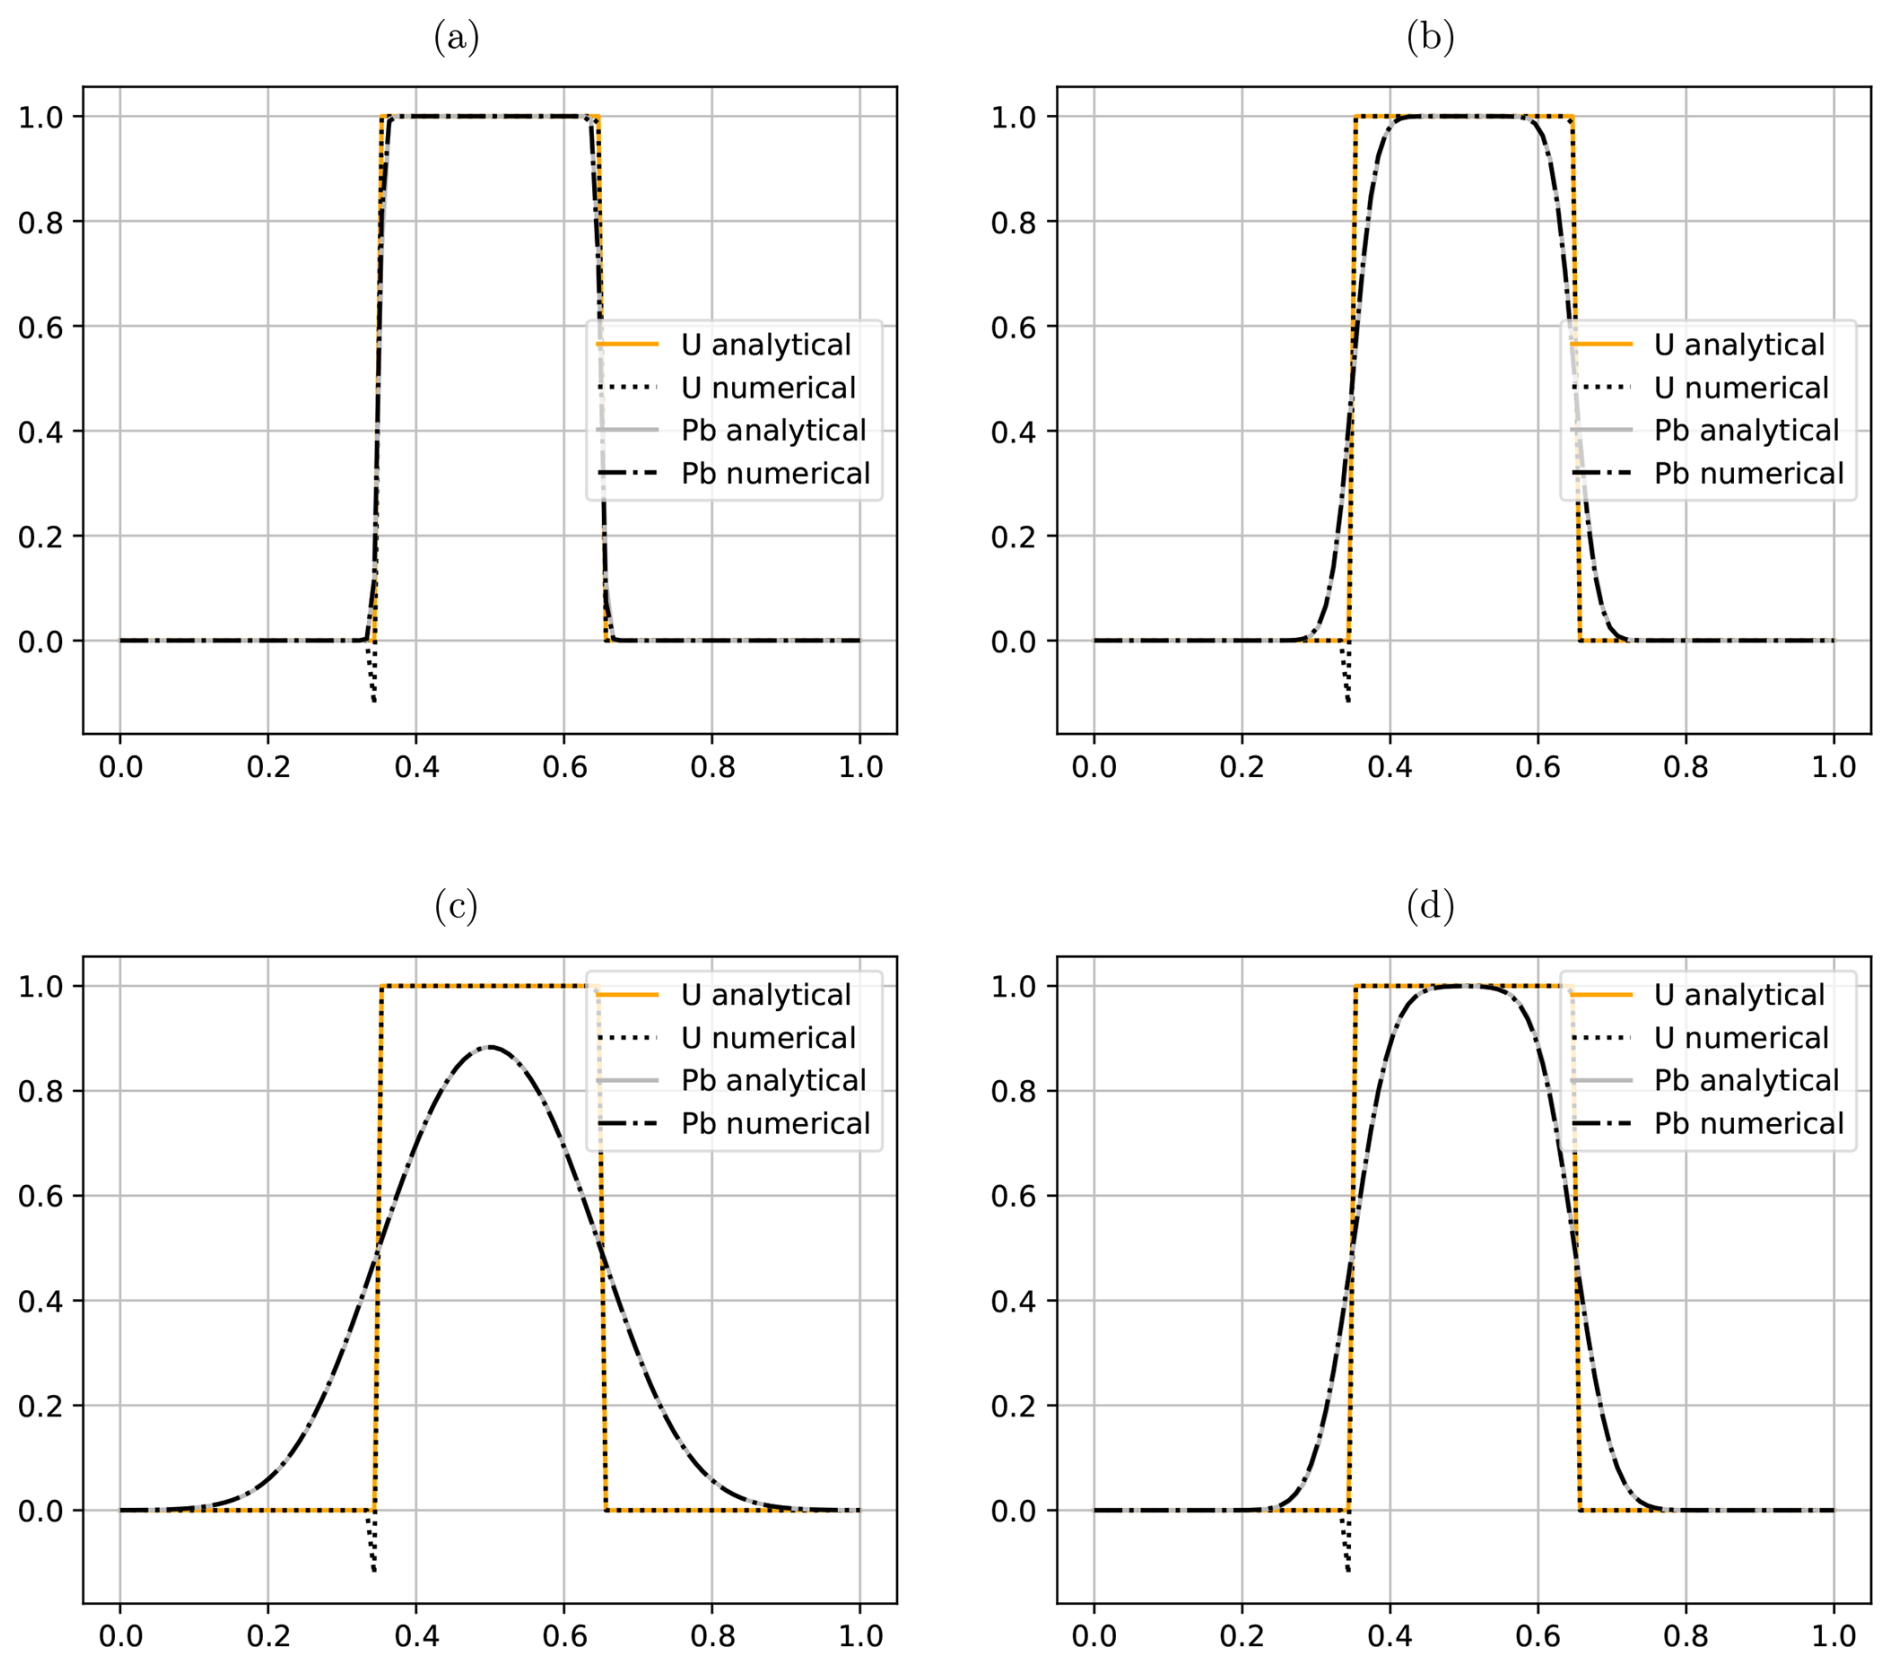
Figure 4Diffusion benchmark results with cell size of 0.01 and degree of 2 for both U and Pb. Errors observed in U profile at the interface are interpolation errors rather than numerical errors. Diffusion profile after 500 Myr at (a) 750 °C, (b) 800 °C, (c) 850 °C. (d) Diffusion profile after decreasing temperature from 850 to 750 °C over 500 Myr. Errors are concentrated at the diffusing front, as observed in Fig. 3b–e.
A minor amount of diffusion of lead is observed at 750 °C over 500 Myr (Fig. 4a), whilst at 850 °C (Fig. 4c), diffusion affects most of the initially elevated region, whilst the uranium concentration remains unaffected up to 850 °C for 500 Myr. These results emphasise the varying diffusion rates for uranium and lead, with increases in temperature significantly alter the distribution of lead isotopes across a zircon crystal over geological time due to the exponential dependence of the diffusion coefficient on temperature (Eq. 2). The results also highlight that lead is the primary isotope lost due to diffusion as the diffusion rates of lead are much higher than uranium at the same temperature (Fig. 1).
3.3 Diffusion-decay-ingrowth
The diffusion-decay example models the isotropic diffusion and the decay of uranium to lead over a period of 500 Myr (million years). Unlike the diffusion-only benchmark that focus solely on the movement of isotopes through the crystal, these models integrate decay and ingrowth with diffusion. During decay and ingrowth, the concentration of uranium isotopes decrease (decay) while lead isotopes start from zero and increases (ingrowth), whilst the concentrations are also altered due to diffusion of uranium and lead across the zircon. All boundaries are set to 0 for both U and Pb.
At 750 °C maintained over 500 Myr, diffusion of both U and Pb slow. As a result, the isotopic concentrations within the zircon are governed by the decay of uranium and ingrowth of radiogenic lead. This ensures that the sample locations across the zircon plot on the Concordia line, thereby providing an accurate age constraint on the growth of the zircon (Fig. 5a and d). When the temperature is elevated to 800 °C for the same duration, the distribution of lead isotopes across the profile begins to exhibit a distinctive diffusive front close to the rim of the zircon (Fig. 5b). This pattern is due lead loss close to the rim of the zircon, while the core preserves lead values.
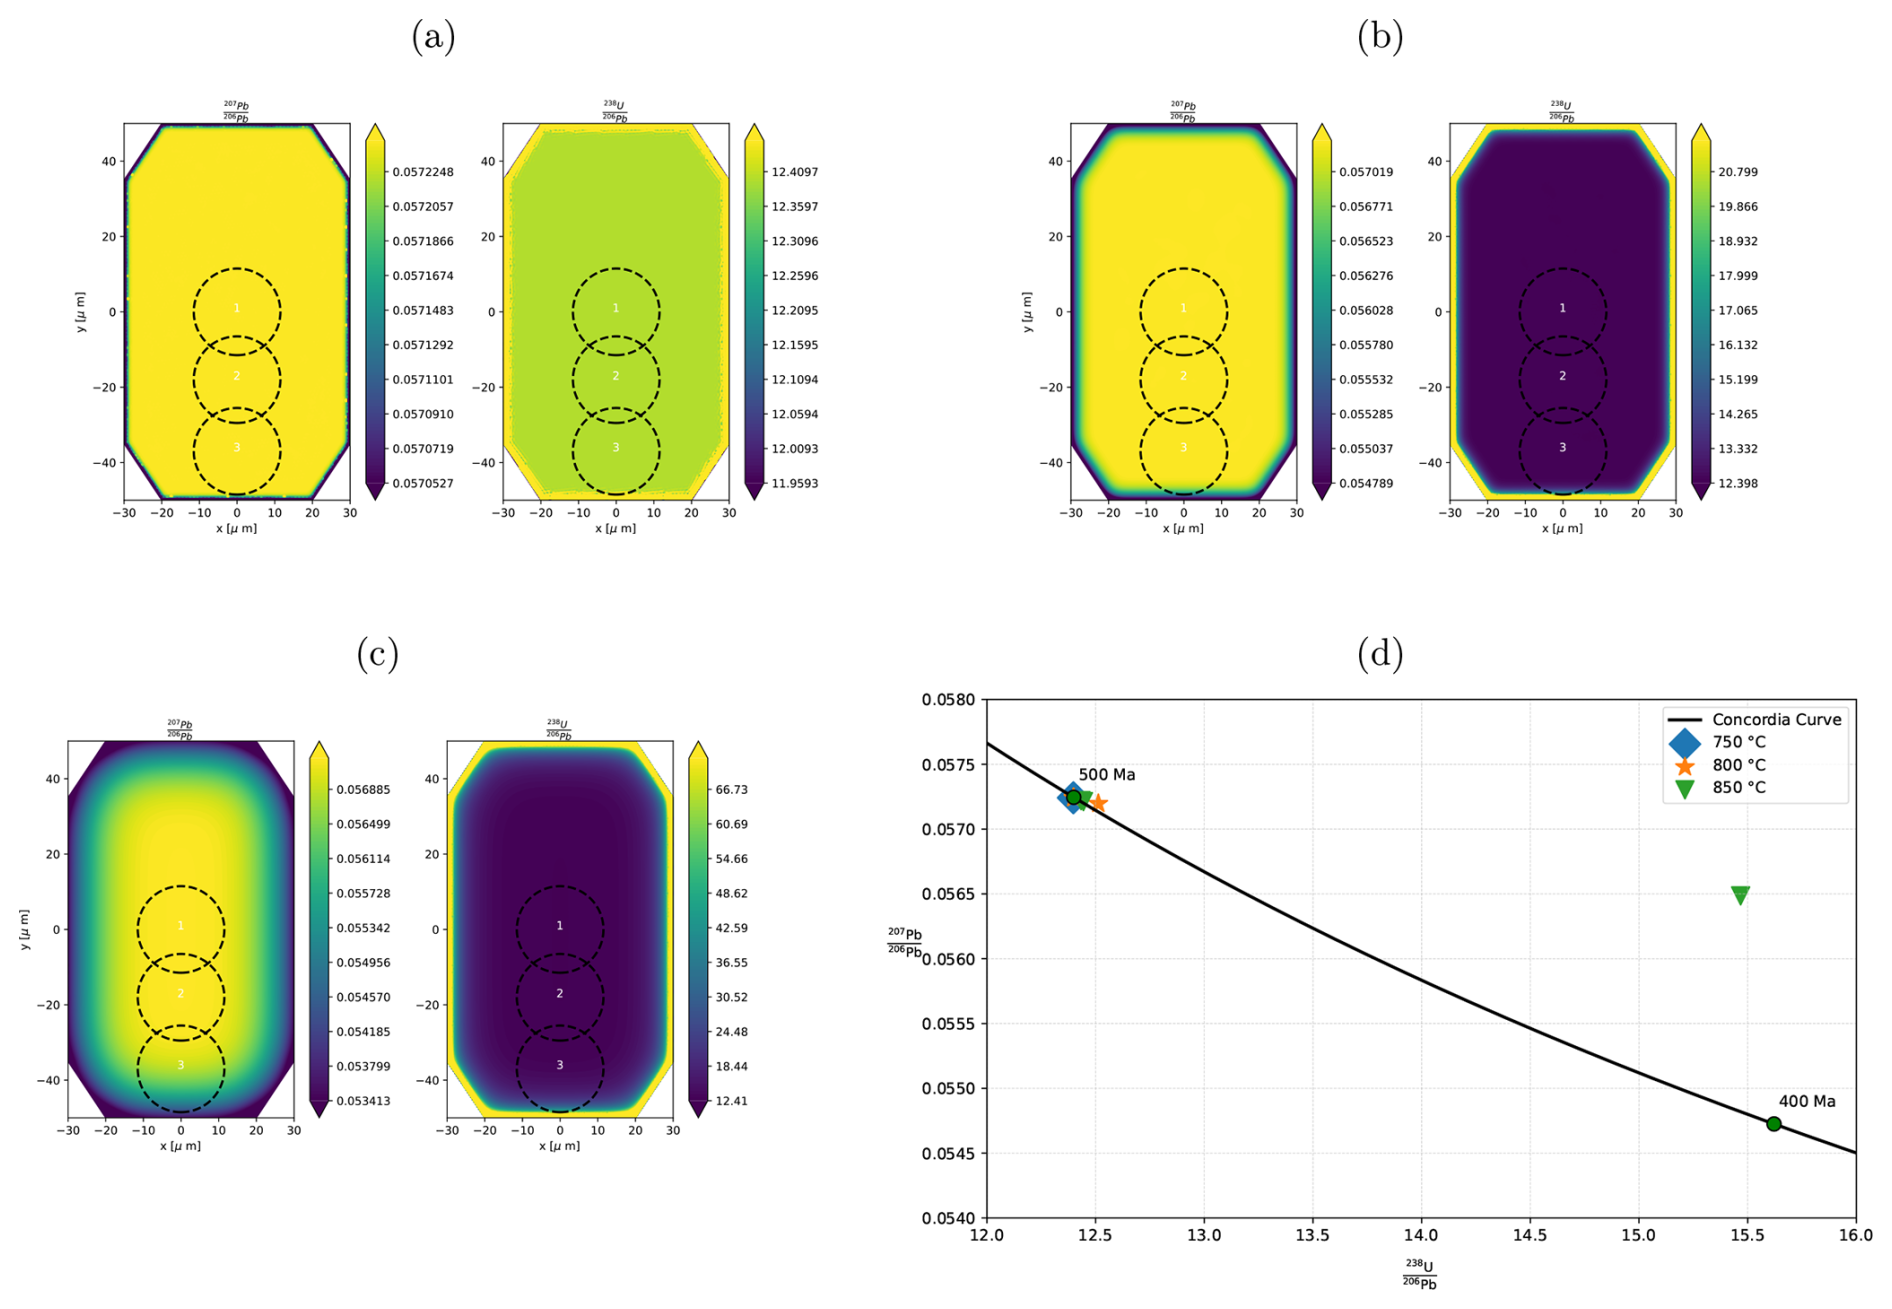
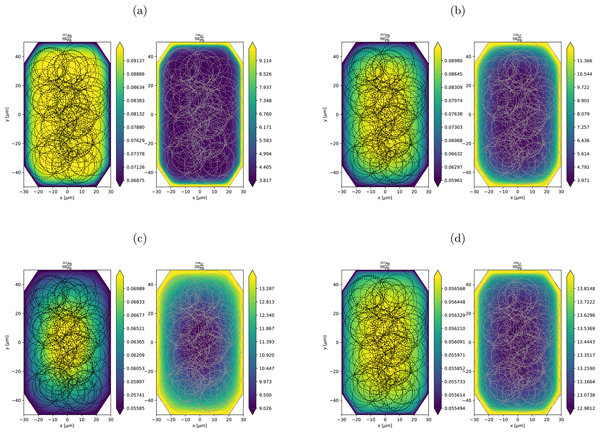
Figure 5Diffusion-decay and diffusion-ingrowth test results in a zircon mesh geometry for a cell size of 0.01 and degree of 2 for uranium and lead. U–Pb isotope profiles after 500 Myr at (a) 750 °C, (b) 800 °C, (c) 850 °C. (d) Effect of sample location on age data. Discordance increases closest to the rims and at elevated temperatures for longer.
Elevating the temperature to 850 °C over a period of 500 Myr significantly enhances the diffusion of lead within the zircon. Under these conditions, the lead isotopes display pronounced diffusion, indicative of considerable lead loss, whereas the uranium isotopes remain undisturbed. The core region of the zircon (radius < 10 µm) remains unaffected, whilst lead values decrease towards the rim due to diffusion (Fig. 5c). The effect of diffusion is observed in both ratios but is more pronounced in the ratio. This highlights the spatial variation in isotopic ratio within the zircon crystal due to diffusion at elevated temperatures. Three sample spots each with a diameter of 23 µm, comparable to data acquisition from laser ablation sampling, are also selected. The results presented in Fig. 5 highlight the effect of diffusion and sample location on discordant ages within a zircon.
These experiments reflect the significant influence temperature can have on zircon ages due to the diffusion of lead within zircon. Higher temperatures result in increased diffusion rates, which results in disparities in and ratios between the core and rim of the zircon, creating discordant values. This discordance is crucial for interpreting the thermal history and subsequent geological events that the zircon has undergone.
4.1 Partial and full lead loss events
The benchmarks presented above demonstrate Underowrld3 can accurately represent the evolution of radiogenic uranium and lead isotopes in zircons, accounting for radioactive decay, ingrowth, and diffusion across geological timescales and temperatures. The lead loss at temperatures above 800 °C are responsible for the discordant values observed above, with the degree of lead loss dependent on the intensity and duration of the thermal event, where higher temperatures accelerate diffusion rates, potentially leading to significant lead loss, or prolonged thermal events can also result in lead loss.
Partial lead loss in the models tested above occurs with temperatures above 800 °C over 500 Myr, with higher lead loss experienced at higher temperatures (Fig. 5). However, regions do not experience constant elevated temperatures for extended periods of time, instead these thermal events may occur over a wide range of time and reach varying peak temperatures, depending on the geological conditions. To simulate partial and full lead loss events due to varying temporal and thermal conditions, four temperature-time paths are tested. The zircon is assumed to have formed at 1500 Ma and cooled to below 800 °C over the first 100 Myr, which then experiences a subsequent thermal event that peaks at 500 Ma, with different peak temperatures and durations, but all result in an average temperature of ∼770 °C over the entire evolution (Fig. 6a). Temperatures are decreased to 750 °C which is below the closure temperature for zircon and no diffusion will occur in the mineral.
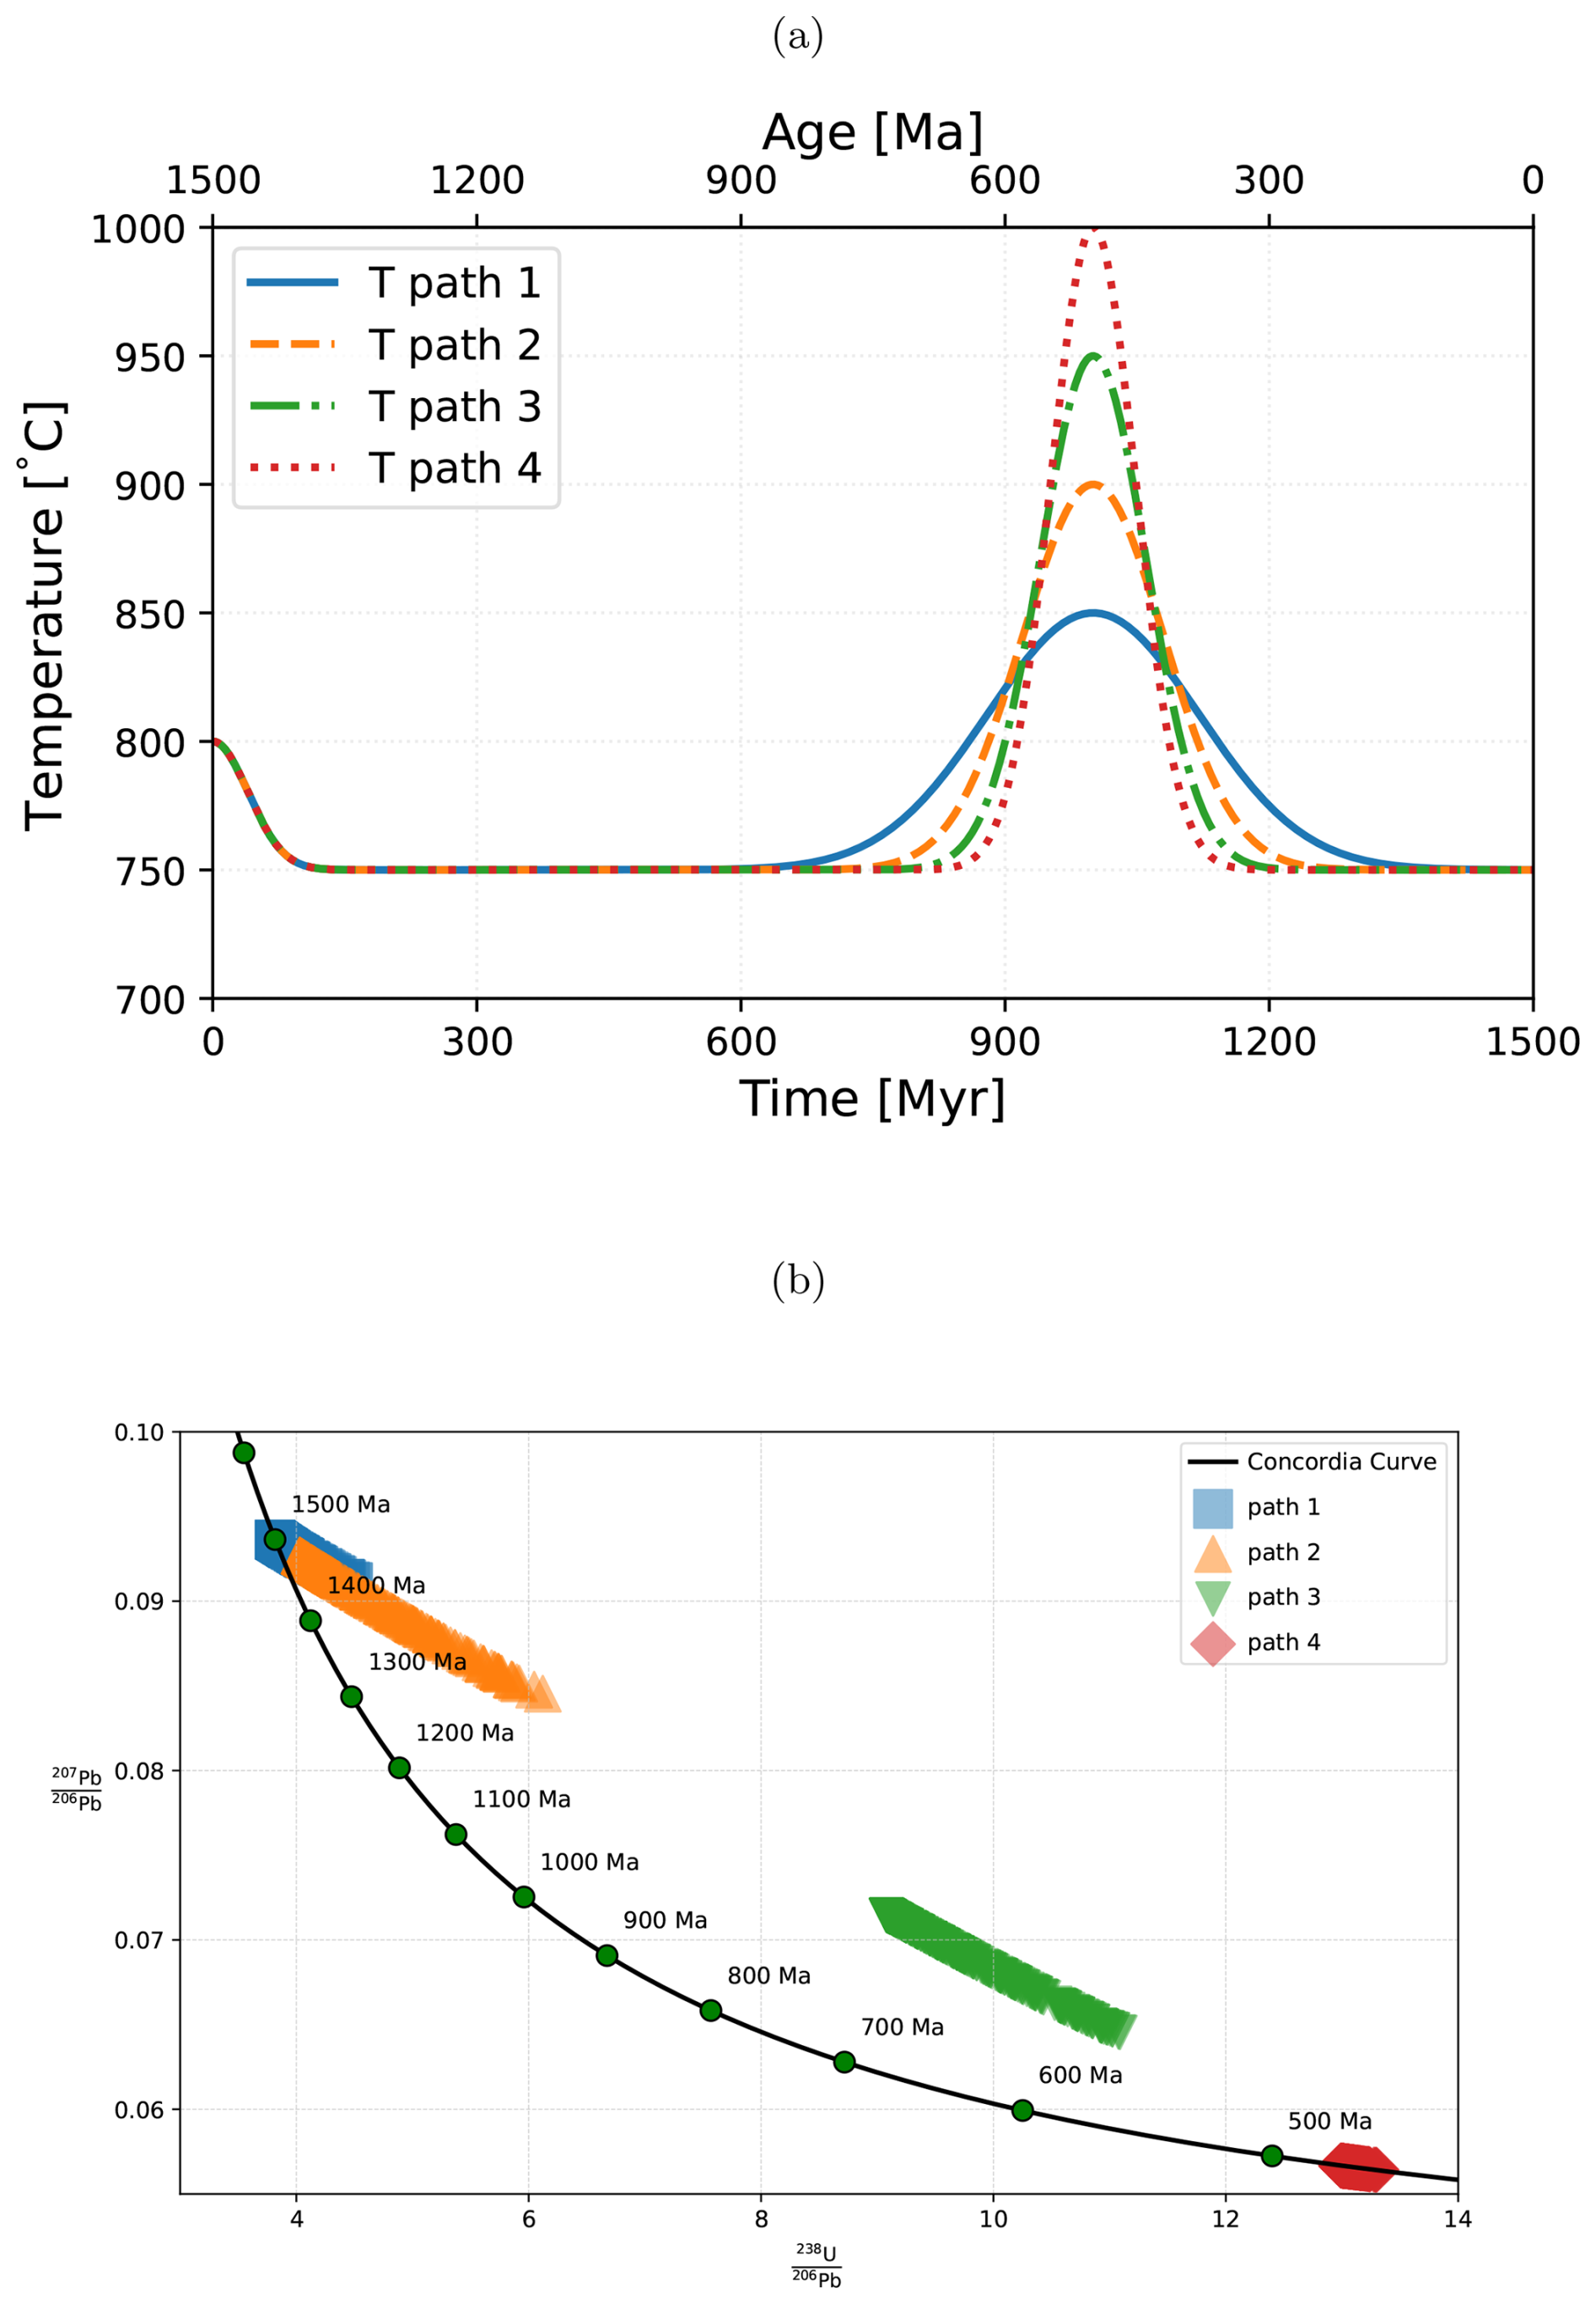
Figure 6(a) Different temperature-time (Tt) paths tested. (b) Effects of different temperature-time paths on U–Pb ratios and ages based on sample location. Spot locations are presented in Fig. S1.
The findings illustrated in Fig. 6b highlight the influence of peak temperature and duration of a thermal event on isotopic ratios, for a zircon measuring 60 µm in width and 100 µm in height. The results highlight peak temperatures of ∼1000 °C (T path 4) over a ∼20 Myr can result in complete lead loss of the zircon, with the ages recorded in the zircon representing the time at which the closure temperature is passed, which vary from core to rim, resulting a spread of ages that appear concordant. In contrast, elevated temperatures up to ∼850 °C (T path 1) result in minimal lead loss, with some discordant values towards the rim of the zircon and original concordant ages close to the core, however all values fit along the discordant line between 1500 and 500 Ma as the zircon exceeds the closure temperature for a short amount of time during the thermal event. Temperatures up to 900 and 950 °C (T paths 2 and 3) leads to a considerable amount of lead loss, and produces a curved discordant line. This is similar to T path 4 and is a result of varied lead loss from core to rim, with the rim values converging towards the closure temperature age whilst core values lie along the discordant line between 1500 and 500 Ma.
From the modelling results, the distribution of discordant values on a Tera-Wasserburg diagram (Fig. 6b) can be used to infer minimum peak temperatures during subsequent heating events. However, peak temperature impacts estimated age due to varied amounts of lead loss from core to rim, which creates a curved array on (Fig. 6b) at temperatures above the closure temperature (∼800 °C) but below the total lead loss temperature (∼1000 °C) for the zircon size tested. The U–Pb ratios can be coupled with Ti-in-zircon thermometry (Ferry and Watson, 2007; Crisp et al., 2023) to determine potential Temperature-time paths for zircon-bearing rocks (e.g. Clark et al., 2024), however this may be complicated due to the potential diffusion heterogeneity of Ti observed in zircon (Bloch et al., 2022).
4.2 Multiple zircon growth events and intra-grain diffusion
Temperature path one is re-run, where the zircon forms at 1500 Ma that subsequently experiences a thermal event up to 850 °C at 500 Ma. In this model, a new zircon nucleates around the pre-existing grain when the temperature reaches 850 °C at 500 Ma. The mesh contains an inner boundary, with the Dirichlet boundary condition for uranium and lead isotopic concentrations set to 0 between the formation age (1500 Ma) and second growth age (500 Ma). At the second growth, the inner boundary condition is removed and the uranium and lead isotope values are updated in the outer region with the uranium isotopic values for formation of a zircon at 500 Ma, with the Dirichlet boundary then applied to the outer zircon edge. This approach highlights that underworld3 can handle the diffusion of heterogenous isotope values across a crystal and is used to investigate the effects of a second growth event as well as intra-grain diffusion on discordant U–Pb isotopic values. The U–Pb ratios between zircons that have undergone a single growth event and those that have experienced double growth along the specified temperature-time (T-t) path are assessed, ensuring that the dimensions of the inner zircon remain consistent with those of the single growth zircon.
Figure 7a illustrates how a second growth event influences U–Pb ratios across the zircon and the corresponding ages observed on the Tera-Wasserburg plot (Fig. 7b). Sample spots from the inner zircon cluster near the formation age, with minor diffusion occurring across the original 60 µm zircon over the first 1000 Myr. These spots plot similarly to the single-event values (Fig. 6b), though the single-growth zircon experiences slightly more diffusion due to its smaller size over the entire model duration. Sample spots from the interface span the formation and second growth ages, reflecting a mix of inner and outer zircon material. However, they are biased toward the second growth age due to prior Pb206 diffusion and subsequent lead mixing across the inner and outer zircon after the second growth event. This mixing results in decreased and ratios near the inner boundary. The outer zircon exhibits some diffusion at the rim, but it does not penetrate significantly and remains undersampled in the selected spot locations. Consequently, the measured ages primarily reflect the zircon growth event on the Tera-Wasserburg plot (Fig. 7b). These findings emphasize how secondary zircon growth can preserve the metamorphic age while also influencing the original growth age near the intra-grain boundary.
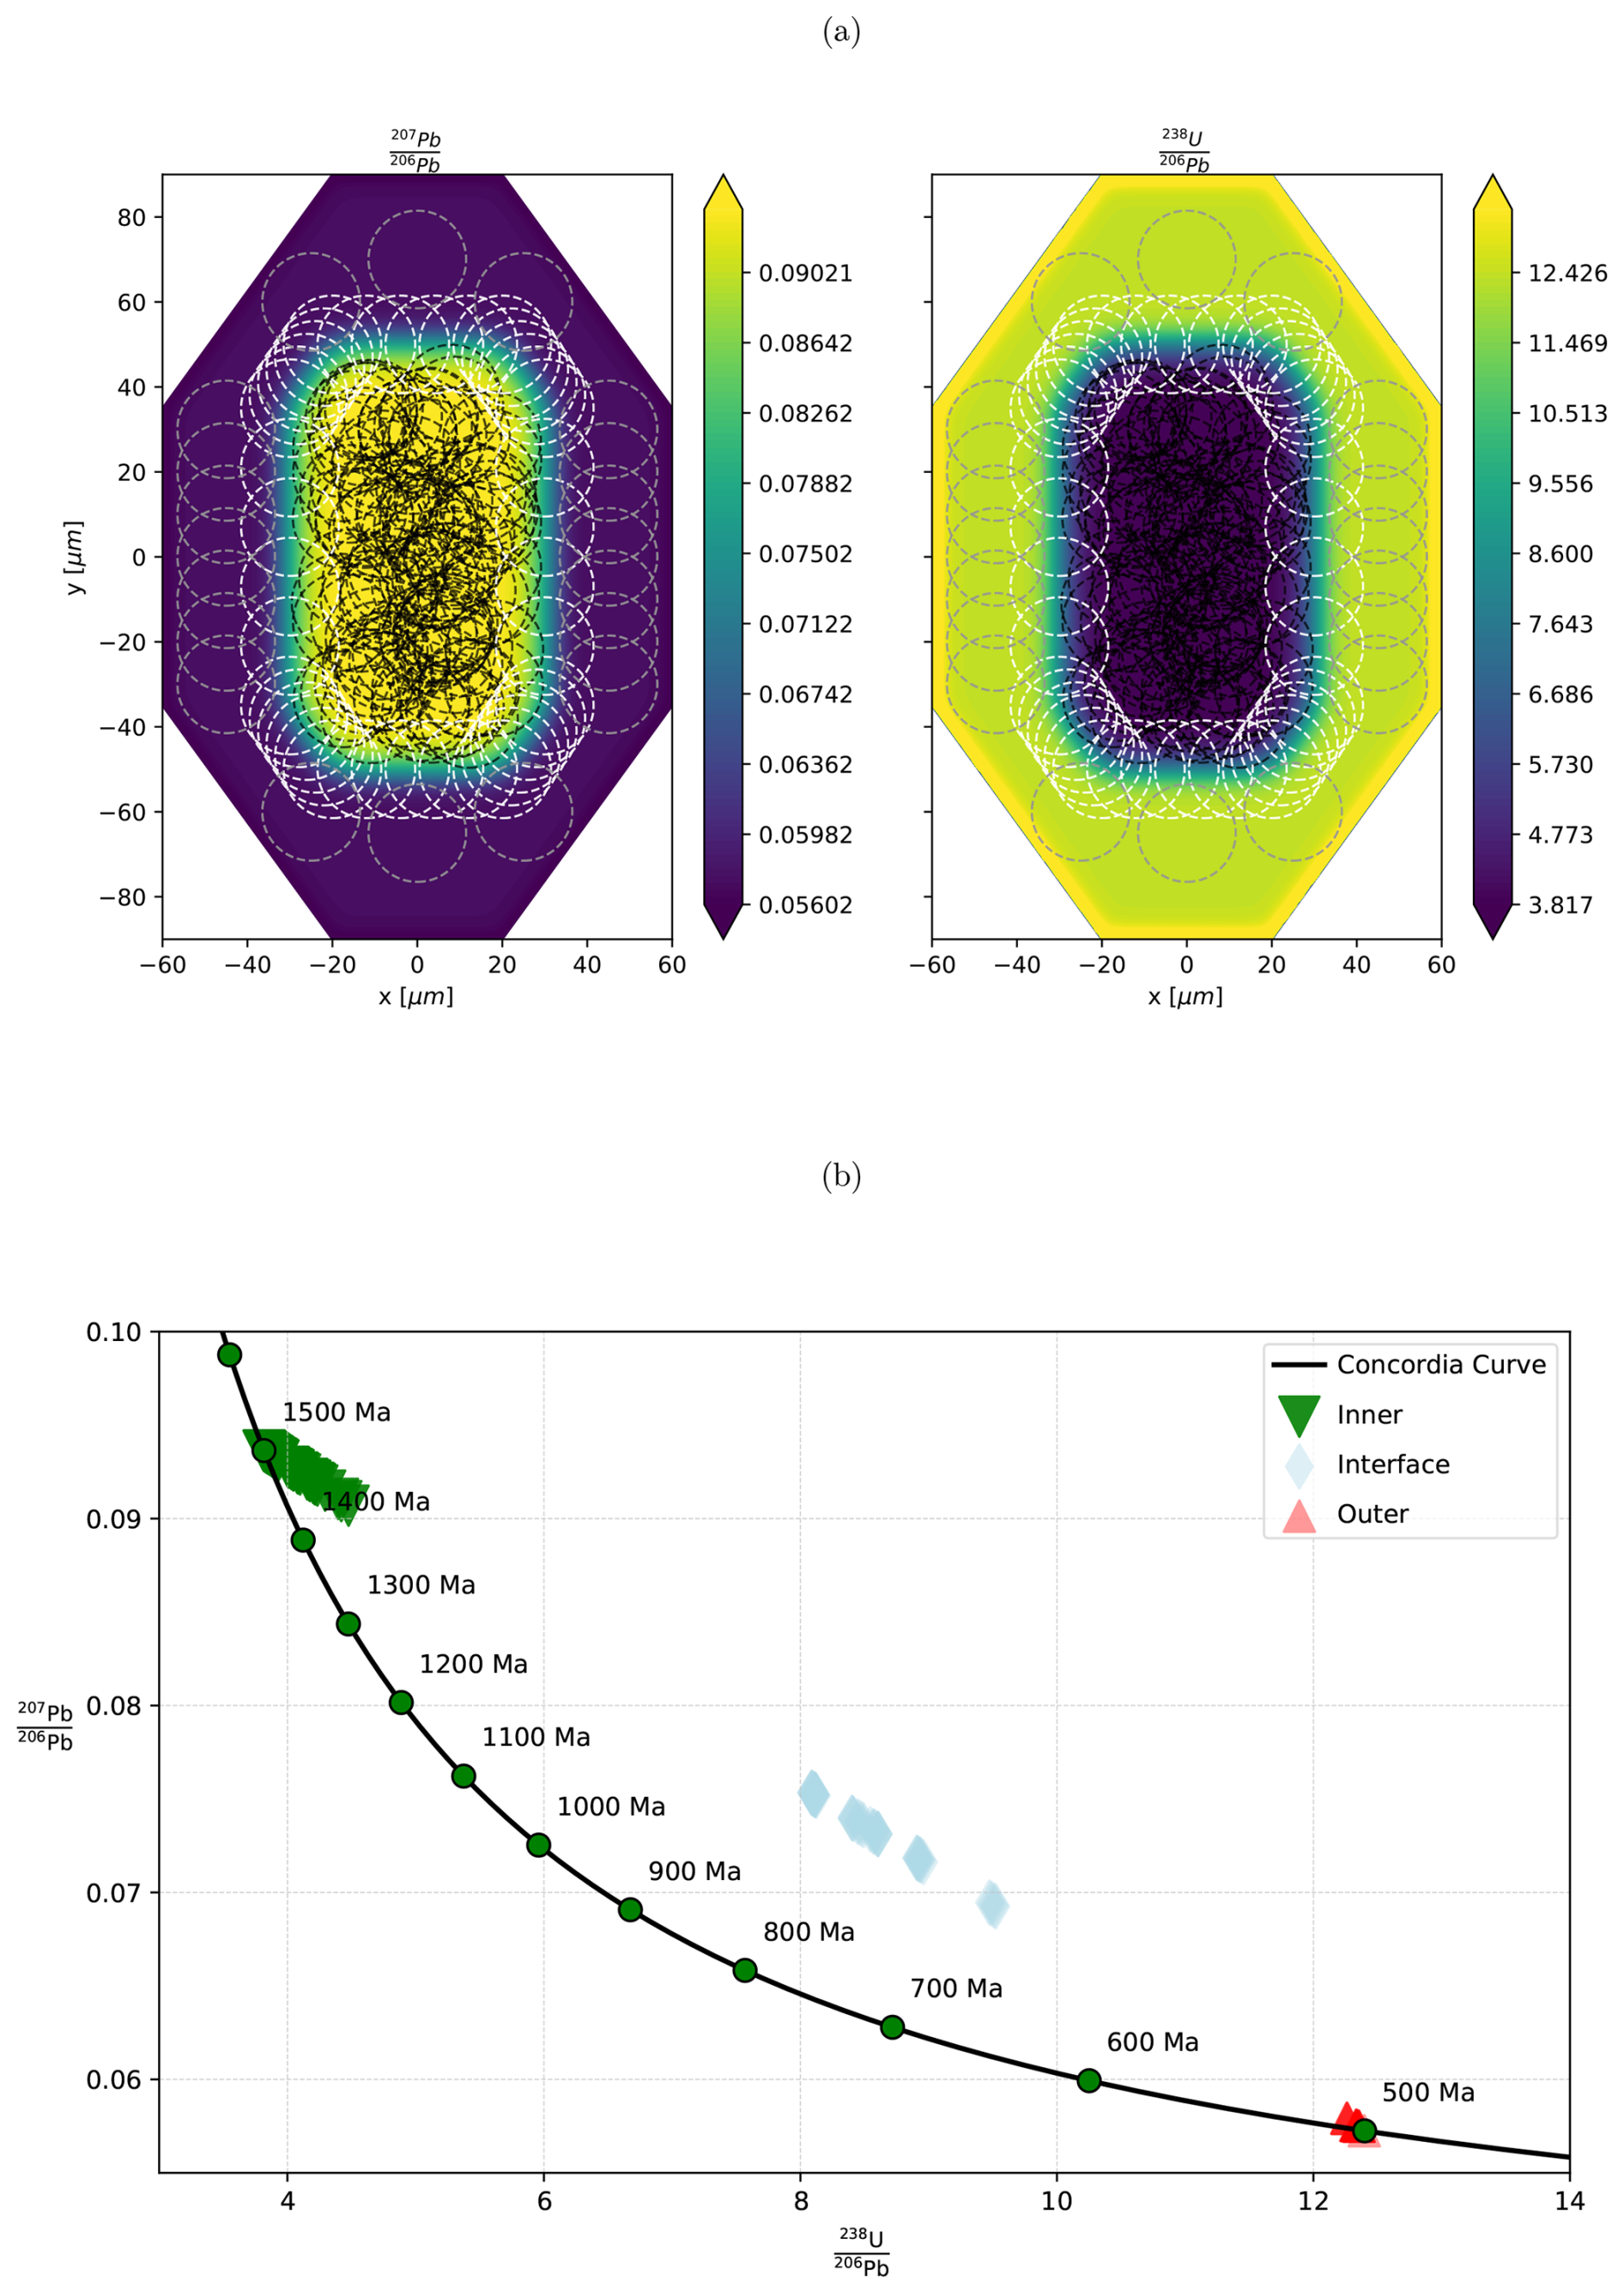
Figure 7Effects of secondary zircon growth on U–Pb ratios and age based on sample location. (a) Dual growth zircon sample spot locations. (b) Tera-Wasserburg plot from sample spots.
4.3 Assessing the metamorphic history of the Trivandrum Block, southern India
The Trivandrum Block in Southern India provides an excellent case study for applying U–Pb geochronology modelling to estimate peak temperatures during high temperature metamorphism. The Trivandrum Block experienced granulite-facies metamorphism during the late Neoproterozoic to Early Cambrian, coinciding with the amalgamation of Gondwana. High temperature metamorphism is thought to have occurred between 580 and 490 Ma based on U–Pb ages from zircon and monazite (Taylor et al., 2014; Blereau et al., 2016; Praharaj and Rekha, 2022; Kadowaki et al., 2019), with peak temperatures in the range of 800–1000 °C, primarily based on overlapping peak mineral assemblage fields from phase equilibria modelling (Blereau et al., 2016; Praharaj and Rekha, 2022; Kadowaki et al., 2019).
To reconstruct the temperature–time history of the Trivandrum Block, four temperature–time paths are analysed to evaluate the distribution of U–Pb ratios from zircons in sample TB14-093. This sample was selected because all zircons are interpreted to be magmatic, as indicated by their steep heavy rare-earth element profiles, with analysed U–Pb values suggesting zircon formation between 2.0 and 1.8 Ga. This sample also preserves little evidence for widespread partial melting associated with the high temperature event as it is a more enderbitic (orthopyroxene + plagioclase) composition. This minimises the effect of fluid/melt–rock interactions that facilitates Pb-loss via dissolution-precipitation processes i.e. diffusion-related processes are the dominant mechanism for Pb mobility rather than reaction mechanisms. See the supplementary material for a full sample description and analytical methods associated with the zircon geochronology.
Using the Ti-in-zircon thermometer of Ferry and Watson (2007), and assuming an of 1.0 and of 0.7 (activity of Silica and Titanium, respectively, based on the stability of ilmenite in the sample rather than rutile), zircons in sample TB14-093 record temperatures ranging from approximately 725 to 900 °C, with most recording a temperature of ∼800 °C (Fig. 8a) at formation. Minor variations in the estimated temperatures (within tens of degrees) are observed when adjusting . These temperatures are interpreted to represent the majority of zircons forming at 800 °C, although the range of Ti-in-zircon temperatures and U–Pb ratios suggest zircon formation between temperatures of 700 and 1000 °C that may have occurred over a period of 200 Myr (Taylor et al., 2014). For the modelling, we assume that all zircons form at 1.95 Ga at an initial temperature of 800 °C as most of the U–Pb ratios fit along a discordant array between ∼1950 and ∼555 Ma, which represents the estimated time of peak metamorphism.
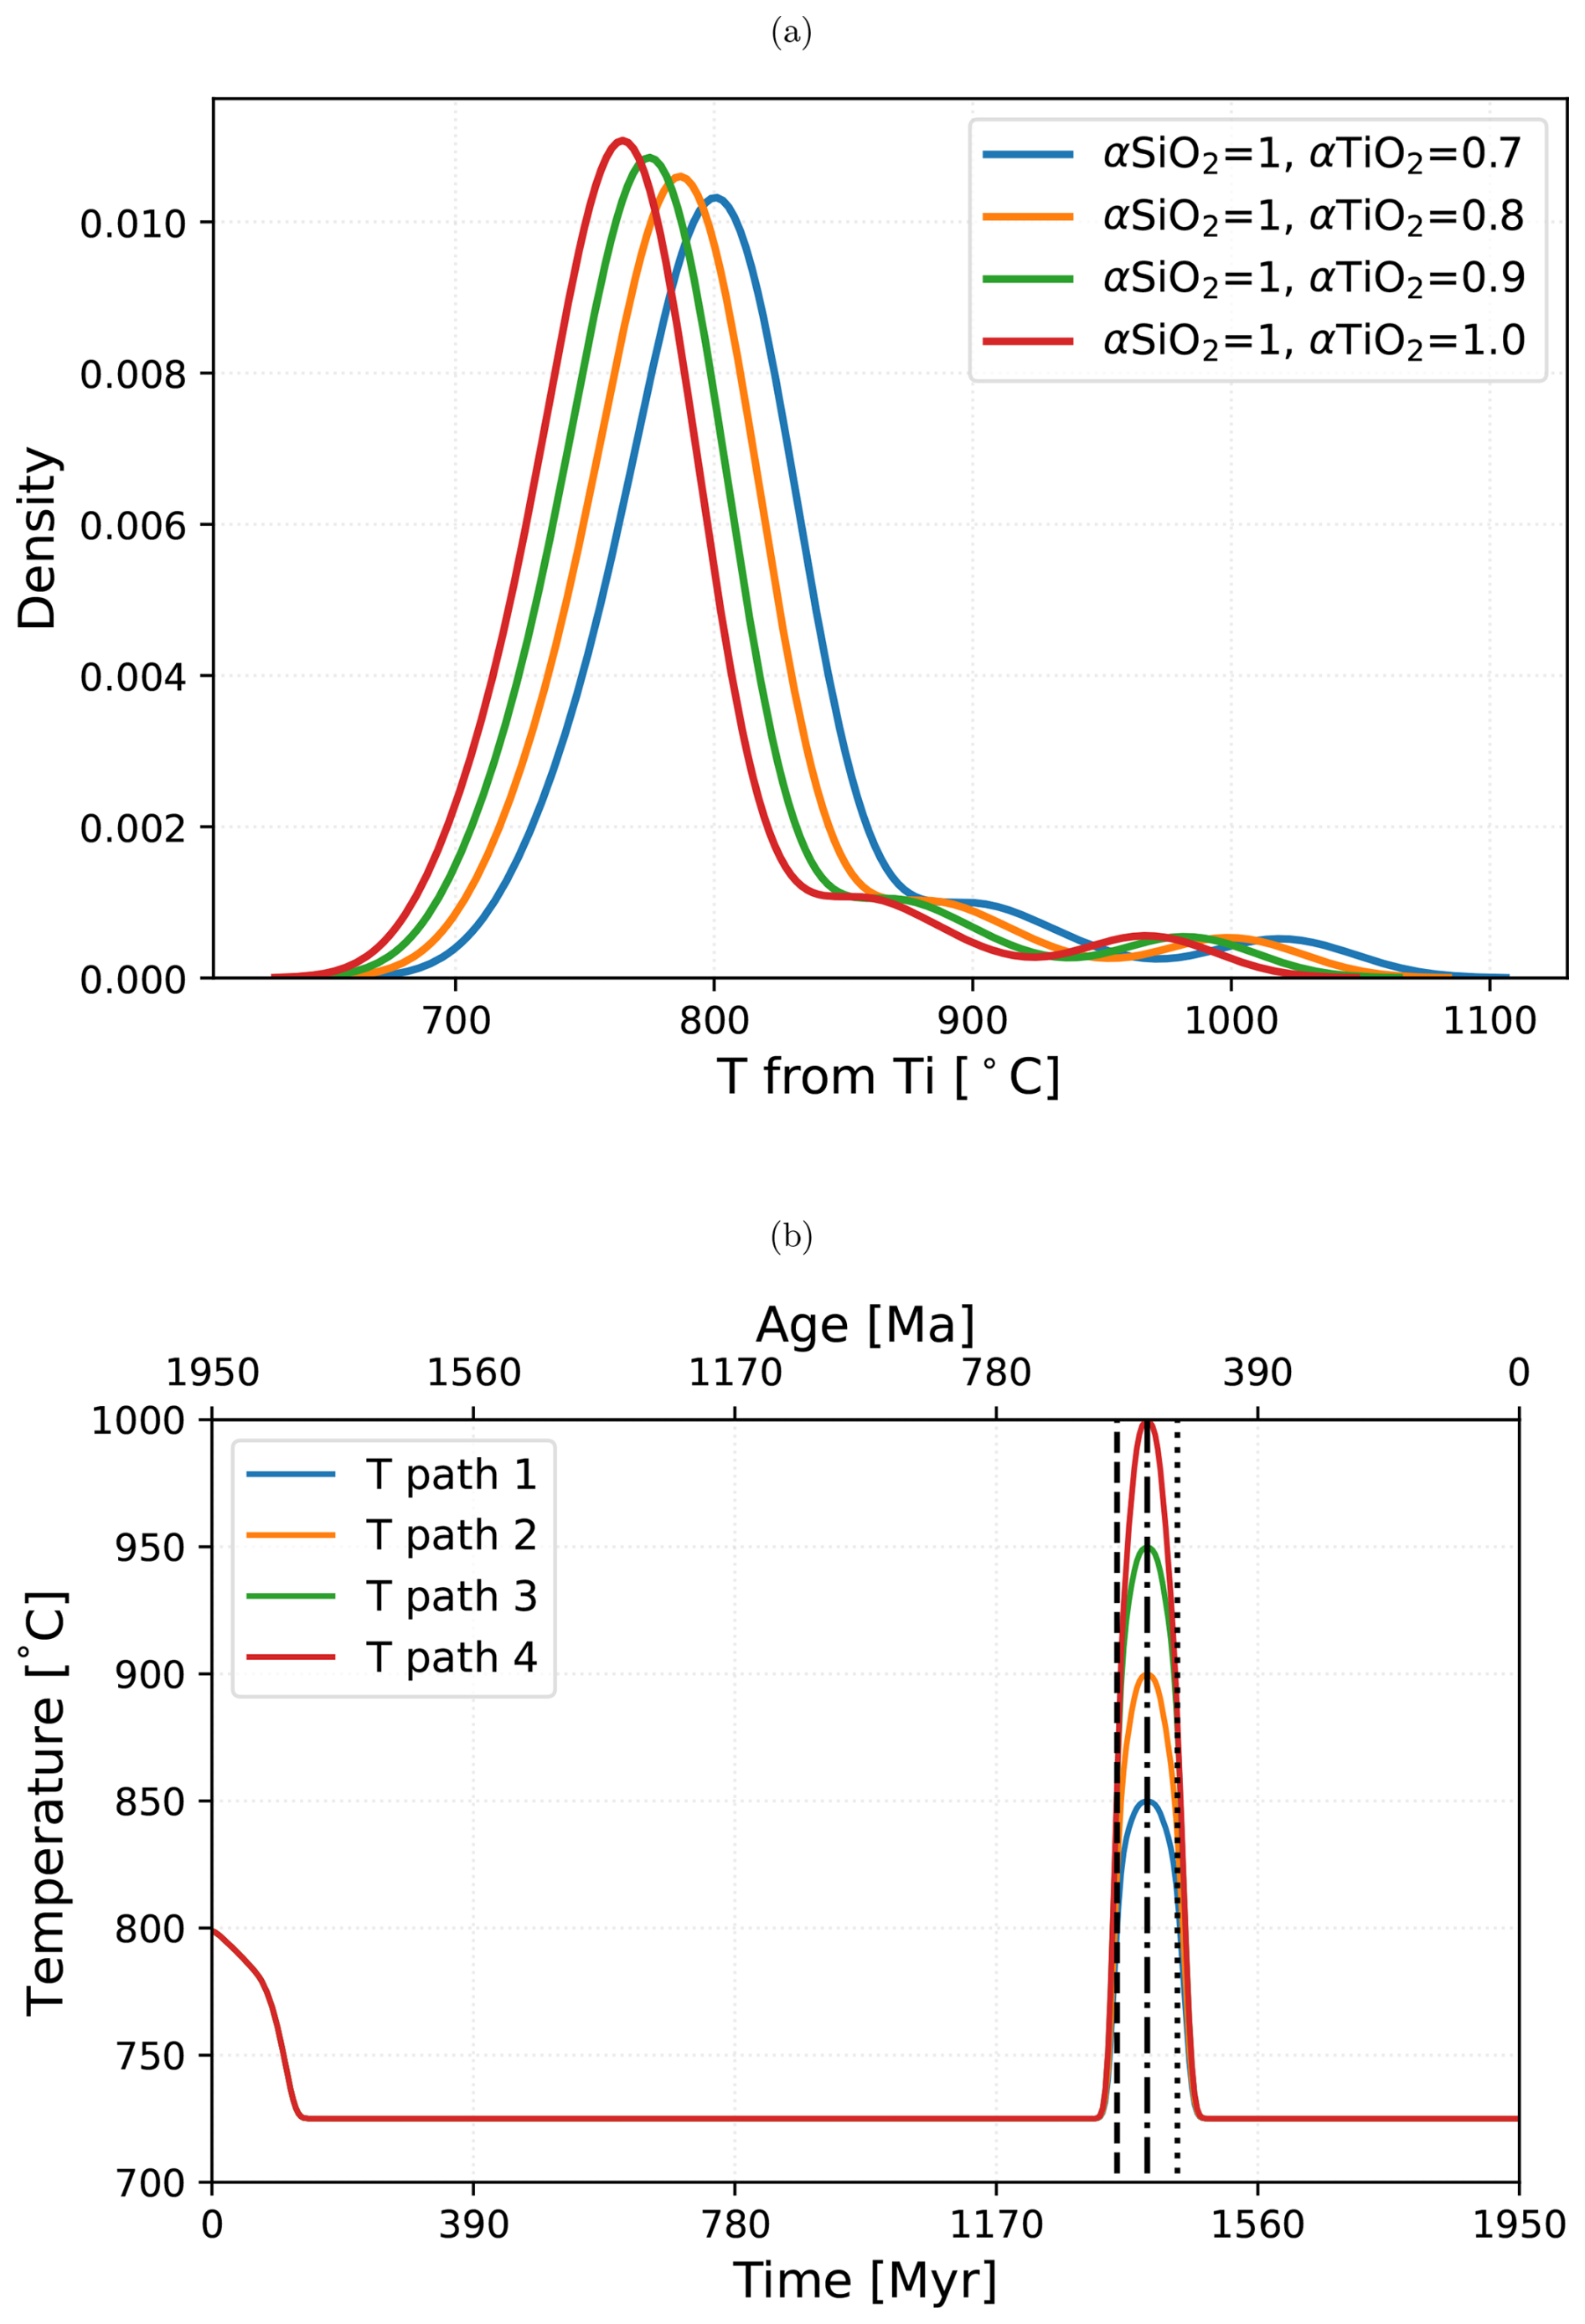
Figure 8(a) Kernel density estimate (KDE) plot showing the bulk of zircons record a temperature of ∼800 °C at formation based on the Ti-in-zircon thermometer. (b) Range of temperature-time paths tested for the Trivandrum block based on Ti-in-zircon thermometry and analytical data. Dotted lines represent the estimated start (600 Ma), peak (555 Ma) and end (520 Ma) of UHT metamorphism.
The four temperature-time paths (Fig. 8b) represent the expected range of peak temperatures of the metamorphic event at ∼555 Ma (Kadowaki et al., 2019), which range between 850 and 1000 °C with a temperature above 800 °C between 600 and 500 Ma (Praharaj and Rekha, 2022; Taylor et al., 2014). Temperatures are decreased to 750 °C as this is below the closure temperature, with the same results obtained with lower minimum temperatures as diffusion effectively stops below ∼800 °C using the parameters outlined in Table 1.
Four zircon geometries are tested, 70×70, 80×120, 90×160 and 100×200 µm, which encompasses the range of zircon grains analysed. The estimated duration of metamorphism is in agreement with limits placed by various geochronological ages. An upper age estimate of metamorphism is constrained by depleted HREE zircon growth at 582±17 Ma (inferred temperature > 810°) (Kadowaki et al., 2019) and monazite formation at 585 Ma, characterised by variable REE profiles (Taylor et al., 2014). The depleted zircon HREE signature reflects the simultaneous growth of zircon and garnet during prograde metamorphism (Kadowaki et al., 2019). The lower age limit is marked by the growth of REE-enriched zircons at 489±12 Ma, interpreted to be due to the breakdown of garnet during retrograde metamorphism (Taylor et al., 2014; Kadowaki et al., 2019).
The results indicate that the diffusion–decay–ingrowth modelling is able to reproduce some of the observed U–Pb ratios from TB14-093, but none of the Tt paths tested exactly match the analytical data. Models peaking at 950 °C (Fig. 9c) and 1000 °C (Fig. 9d) show partial agreement with analytical data, with Fig. 9c capturing the range of discordant U–Pb ratios between formation at 1950 Ma and peak metamorphism at 555 Ma, whilst Fig. 9d shows full lead loss and resetting of ages in the small modelled zircon grains and close to the rims in the larger grains.
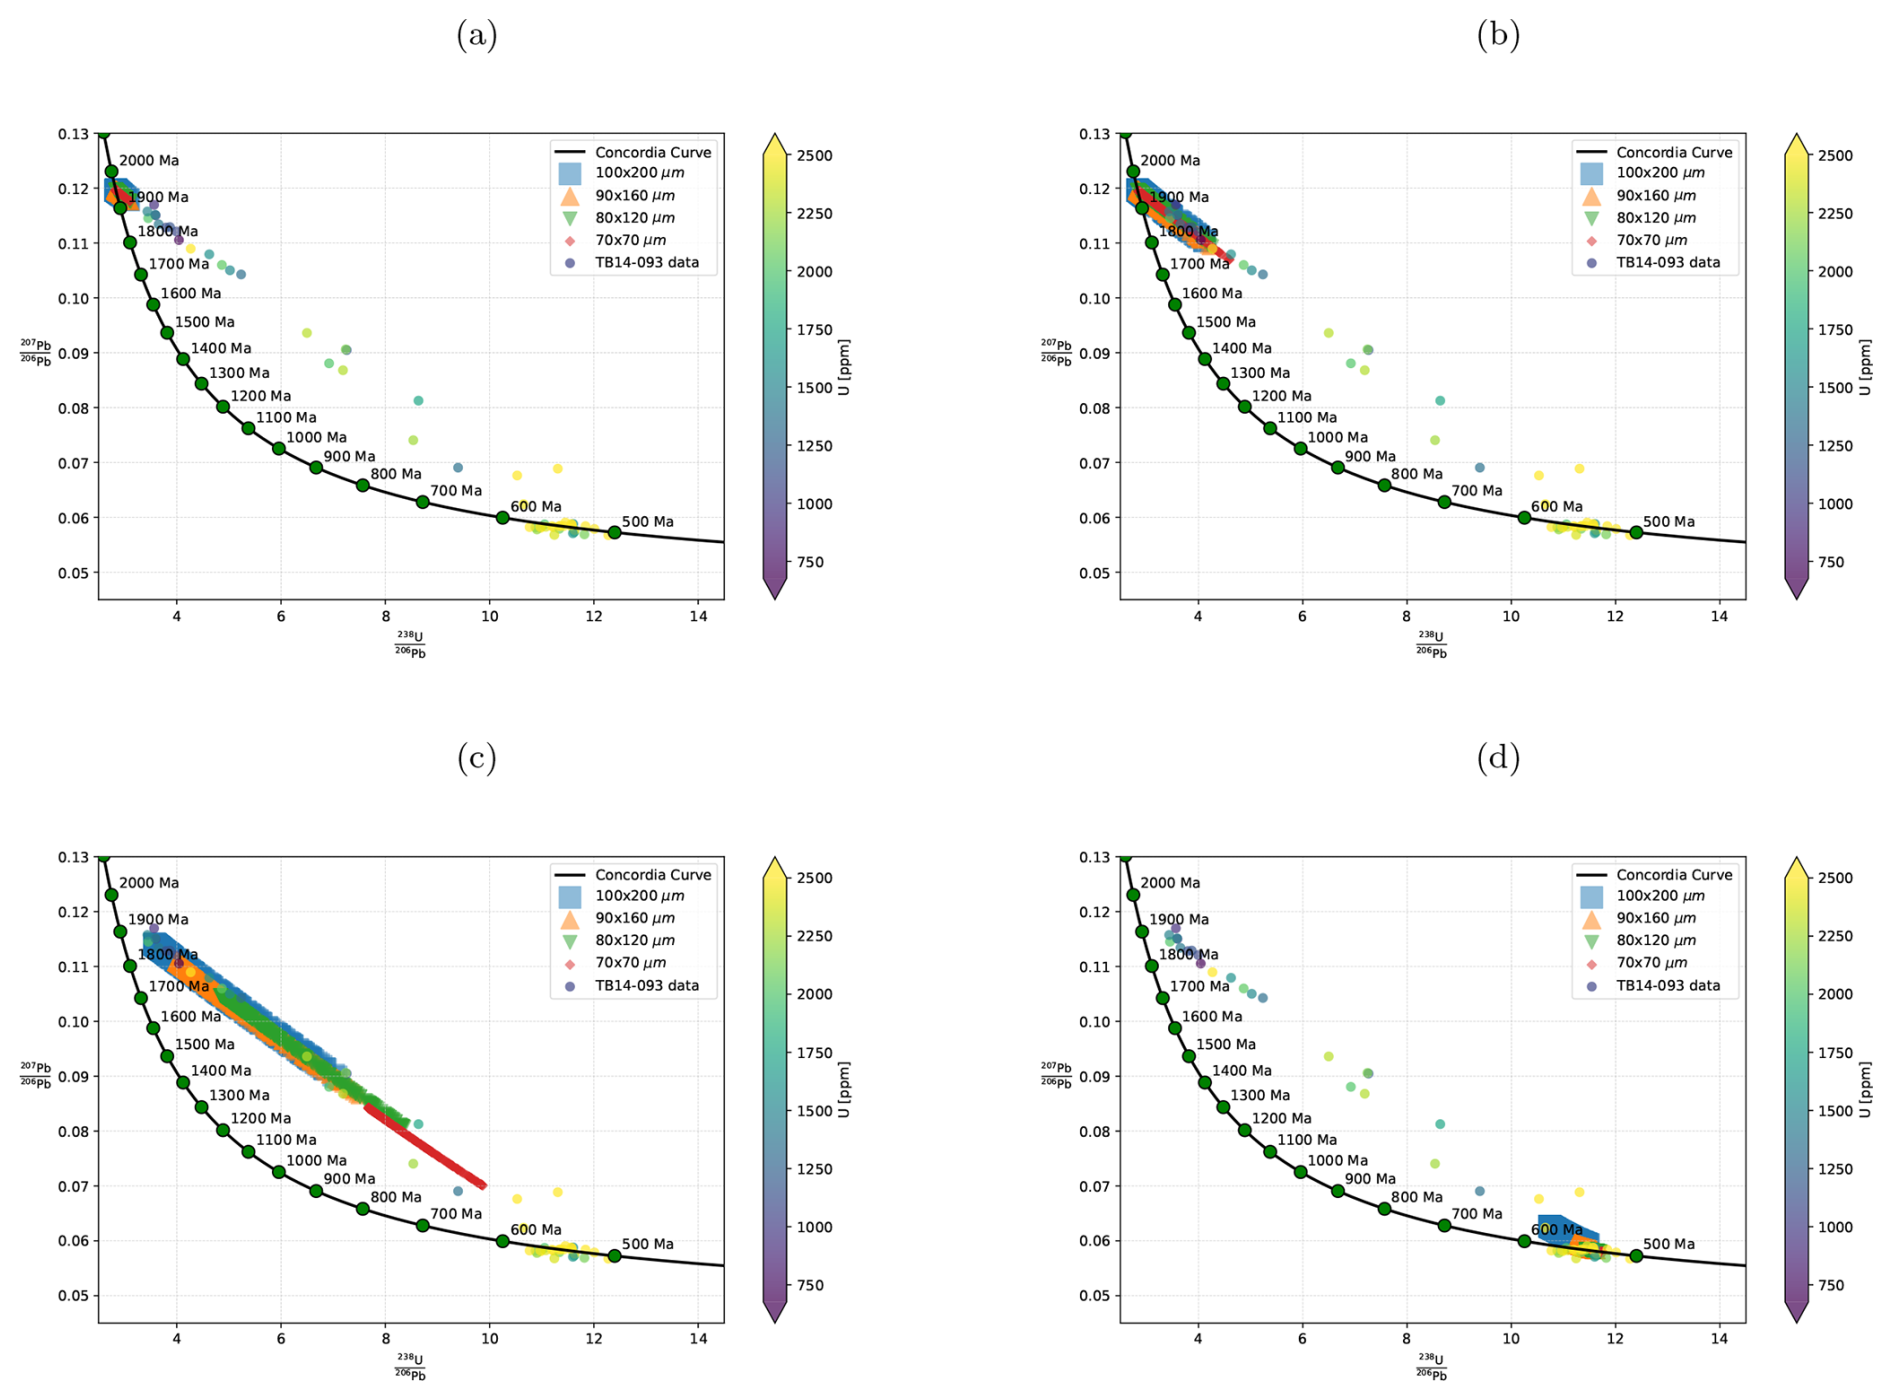
Figure 9Comparison of analytical data sampled from TB13-093 and modelled zircons. (a) Tpeak=850 °C, (b) Tpeak=900 °C, (c) Tpeak=950 °C, (d) Tpeak=1000 °C.
The model not being able to replicate the data from sample TB14-093 completely may be due to the Tt path not accurately representing the thermal history. To replicate the discordant ages observed between 600 and 500 Ma, temperatures may need to be higher or sustained for a longer period, exceeding 900 °C between 600 and 500 Ma, rather than the 800 °C assumed in the models. However, a longer duration of elevated temperatures does not agree with the geochronological constraints from monazite, zircon and garnet, which are outlined above. Alternatively, additional processes not accounted for in the modelling may be able to explain the complete lead loss. The zircons grains analysed from sample TB14-093 that show complete lead loss and “concordant” ages between 600 and 500 Ma typically have high uranium content (Fig. 9). The high uranium content can cause radiation damage, damaging the crystal structure and enhancing lead diffusion rates beyond those considered in the modelling, potentially resulting in complete lead loss during metamorphism. This has been observed in experimental data used to determine the diffusion coefficient of Pb using zircons that have experienced significant radiation damage (Cherniak et al., 1991). However, the effect of radiation damage on diffusion rates may be mitigated by annealing at elevated temperatures, with critical amorphization temperature (i.e. the threshold above which Pb diffusion is unaffected by radiation damage from high U content) is estimated at 360 °C for a U concentration of 1000 ppm and approximately 380 °C for a U concentration of 10 000 ppm (Cherniak and Watson, 2003). These temperatures are well below the estimated peak temperature, however the radiation damage may result in lead loss at much lower temperatures. Alternatively, the zircon crystals may have undergone deformation, resulting in a damaged crystal structure that results in fast diffusion pathways through the crystal (Timms et al., 2012). Both processes have the ability to enhance diffusion that may have resulted in the complete lead loss observed in some of the sampled zircons.
We propose that diffusion decay and ingrowth modelling of U and Pb and the resulting isotopic ratios can is a viable method to estimate peak temperature conditions during metamorphism. Modelling of the U–Pb system suggests that peak metamorphic temperatures in the Trivandrum Block may have reached 950 °C and potentially 1000 °C during peak UHT metamorphism ∼555 Ma. 950 °C is necessary to reproduce the discordant array observed between protolith formation at ∼1950 Ma and subsequent metamorphism at ∼555 Ma, whilst temperatures of 1000 °C are needed to explain the complete lead loss observed when not taking other processes into account.
Our results suggest higher peak temperatures than some previous estimates, with proposed maximum temperatures below 900 °C (Blereau et al., 2016; Praharaj and Rekha, 2022), based on peak stable mineral assemblages derived from thermodynamic modelling of charnockites. However, our results are consistent with higher temperature estimates of 950 to 1000 °C from Taylor et al. (2014) which is based on heavy rare earth element partitioning between zircon and garnet, with partitioning values close to those observed in high temperature (1000 °C) experimental estimates from Rubatto and Hermann (2007). The higher temperatures have also been estimated from thermodynamic modelling of khondalite found in the region (Kadowaki et al., 2019), with peak temperatures estimated to be between 920 and 1030 °C.
This study benchmarks the diffusion-decay and diffusion-ingrowth using underworld3, focusing on the U–Pb isotopic system within zircons that may experience modification in lead values due to diffusion or a secondary growth event. Our results demonstrate the model effectively captures the complex interplay of diffusion and radiogenic decay and ingrowth in zircons subjected to varied thermal and temporal histories. The model is able to accurately reconstruct U–Pb ratios that undergo lead loss due to diffusion at elevated temperatures, providing insight into how the thermal and temporal history of a region can modify isotopic ratios due to diffusion that are crucial for precise age dating in geochronological studies. Additionally, secondary zircon growth events can have a the significant impact on U–Pb isotopic ratios, especially close to the intragrain boundary. The double growth model highlights the broadening of U–Pb discordant values between the first and second growth ages, which arise from sampling both the inner and outer zircons as lead transfer between them. This effect underscores the necessity of considering sample location in zircon geochronology when estimating growth ages. We also highlight how U–Pb geochronology can be used to infer maximum peak temperatures during metamorphic events, providing an upper limit of ∼950 to 1000 °C in the Trivandrum block during the amalgamation of Gondwana ∼555 Ma.
Overall, the model presented is a robust tool for modelling the isotopic evolution of U–Pb in zircons under varying thermal conditions and can be applied to any other isoptotic system in any other mineral. The results presented validate the use of underworld3 and UWDiffusion to model isotope diffusion at the mineral scale and can be used to enhance our ability to interpret complex thermal histories and their impact on age estimations from zircon U–Pb dating. The script can be also easily modified to model diffusion–decay–ingrowth in different mineral systems. Future work will encompass modelling a population of zircon grains in 3D which are cut at various locations through the crystal to better constrain the Temperature-time history obtained from analytical measurements.
underworld3 v0.99.1 is available from Moresi et al. (2025b) (https://doi.org/10.5281/zenodo.16838572) and UWDiffusion is availble from Knight (2026) (https://doi.org/10.5281/zenodo.18870452), both licensed under LGPL Version 3. Scripts to replicate the research presented are available at Knight (2025) (https://doi.org/10.5281/zenodo.17936675), licensed under Creative Commons Attribution 4.0 International. Figures were made with Matplotlib v3.10.1 (https://doi.org/10.5281/zenodo.14940554, The Matplotlib Development Team, 2025; Hunter, 2007), available under the Matplotlib license at https://matplotlib.org/ (last access: 2 March 2026).
The supplement related to this article is available online at https://doi.org/10.5194/gmd-19-6571-2026-supplement.
BSK: Conceptualization, Methodology, Software, Validation, Formal analysis, Investigation, Writing - Original Draft, Writing –Review & Editing, Visualization, Resources. CC: Conceptualization, Formal analysis, Investigation, Writing – Review & Editing, Visualization, Supervision, Project administration, Funding acquisition, Resources.
The contact author has declared that neither of the authors has any competing interests.
Publisher's note: Copernicus Publications remains neutral with regard to jurisdictional claims made in the text, published maps, institutional affiliations, or any other geographical representation in this paper. The authors bear the ultimate responsibility for providing appropriate place names. Views expressed in the text are those of the authors and do not necessarily reflect the views of the publisher.
The authors acknowledge and pay our respects to the Whadjuk Nyungar people who are the Traditional Custodians of the land this research was conducted on. The authors acknowledge AuScope for their continued support in the development of the underworld code. This work was supported by resources provided by the Pawsey Supercomputing Research Centre's Setonix Supercomputer (https://doi.org/10.48569/18sb-8s43), with funding from the Australian Government and the Government of Western Australia. We gratefully acknowledge the constructive feedback provided by anonymous reviewers, whose comments significantly improved the quality of this manuscript. We also thank the editor for the handling of the manuscript.
This research has been supported by the Australian Research Council (grant no. FT220100566).
This paper was edited by Boris Kaus and reviewed by two anonymous referees.
Balay, S., Gropp, W. D., McInnes, L. C., and Smith, B. F.: Efficient Management of Parallelism in Object-Oriented Numerical Software Libraries, in: Modern Software Tools for Scientific Computing, Springer, 163–202, ISBN 978-1-4612-1986-6, https://doi.org/10.1007/978-1-4612-1986-6_8, 1997. a
Balay, S., Abhyankar, S., Adams, M., Brown, J., Brune, P., Buschelman, K., Dalcin, L., Dener, A., Eijkhout, V., Gropp, W., Karpeyev, D., Kaushik, D., Knepley, M., May, D., Curfman McInnes, L., Mills, R., Munson, T., Rupp, K., Sanan, P., Smith, B., Zampini, S., Zhang, H., and Zhang, H.: PETSc Users Manual, https://ora.ox.ac.uk/objects/uuid:fa2b9e7c-1c58-429c-90fd-f780a3c3dc7d (last access: 2 March 2026), 2019. a
Bea, F. and Montero, P.: Diffusion-induced disturbances of the U–Pb isotope system in pre-magmatic zircon and their influence on SIMS dating. A numerical study, Chem. Geol., 349, 1–17, 2013. a, b
Bea, F., Montero, P., and Palma, J. F. M.: Experimental evidence for the preservation of U-Pb isotope ratios in mantle-recycled crustal zircon grains, Scient. Rep., 8, 12904, https://doi.org/10.1038/s41598-018-30934-4, 2018. a
Blereau, E., Clark, C., Taylor, R. J., Johnson, T., Fitzsimons, I., and Santosh, M.: Constraints on the timing and conditions of high-grade metamorphism, charnockite formation and fluid–rock interaction in the Trivandrum Block, southern India, J. Metamorph. Geol., 34, 527–549, 2016. a, b, c
Bloch, E. M., Jollands, M. C., Tollan, P., Plane, F., Bouvier, A.-S., Hervig, R., Berry, A. J., Zaubitzer, C., Escrig, S., Müntener, O., Ibañez-Mejia, M., Alleon, J., Meibom, A., Baumgartner, L. P., Marin-Carbonne, J., and Newville, M.: Diffusion Anisotropy of Ti in Zircon and Implications for Ti-in-Zircon Thermometry, Earth Planet. Sc. Lett., 578, 117317, https://doi.org/10.1016/j.epsl.2021.117317, 2022. a
Cherniak, D. J. and Watson, E. B.: Pb Diffusion in Zircon, Chem. Geol., 172, 5–24, https://doi.org/10.1016/S0009-2541(00)00233-3, 2001. a, b, c, d, e
Cherniak, D. J. and Watson, E. B.: Diffusion in Zircon, Rev. Mineral. Geochem., 53, 113–143, https://doi.org/10.2113/0530113, 2003. a, b, c, d, e, f
Cherniak, D. J., Lanford, W. A., and Ryerson, F.: Lead diffusion in apatite and zircon using ion implantation and Rutherford backscattering techniques, Geochim. Cosmochim. Ac., 55, 1663–1673, 1991. a, b, c, d, e
Cherniak, D. J., Hanchar, J. M., and Watson, E. B.: Diffusion of Tetravalent Cations in Zircon, Contrib. Mineral. Petrol., 127, 383–390, https://doi.org/10.1007/s004100050287, 1997. a, b, c
Clark, C., Fitzsimons, I. C., Healy, D., and Harley, S. L.: How does the continental crust get really hot?, Elements, 7, 235–240, 2011. a
Clark, C., Brown, M., Knight, B., Johnson, T. E., Mitchell, R. J., and Gupta, S.: Ultraslow cooling of an ultrahot orogen, Geology, 52, 880–884, https://doi.org/10.1130/G52442.1, 2024. a
Crank, J.: The mathematics of diffusion, in: 2nd Edn., Clarendon Press, Oxford, UK, ISBN 978-0-19-853344-3, 1975. a
Crisp, L. J., Berry, A. J., Burnham, A. D., Miller, L. A., and Newville, M.: The Ti-in-zircon thermometer revised: The effect of pressure on the Ti site in zircon, Geochim. Cosmochim. Ac., 360, 241–258, 2023. a
Dodson, M. H.: Closure temperature in cooling geochronological and petrological systems, Contrib. Mineral. Petrol., 40, 259–274, 1973. a, b
Ferry, J. and Watson, E.: New thermodynamic models and revised calibrations for the Ti-in-zircon and Zr-in-rutile thermometers, Contrib. Mineral. Petrol., 154, 429–437, 2007. a, b
Gehrels, G.: Detrital zircon U-Pb geochronology applied to tectonics, Annu. Rev. Earth Planet. Sci., 42, 127–149, 2014. a, b
Geuzaine, C. and Remacle, J.-F.: Gmsh: A 3-D finite element mesh generator with built-in pre-and post-processing facilities, Int. J. Numer. Meth. Eng., 79, 1309–1331, https://doi.org/10.1002/nme.2579, 2009. a
Hiess, J., Condon, D. J., McLean, N., and Noble, S. R.: 238U/235U systematics in terrestrial uranium-bearing minerals, Science, 335, 1610–1614, 2012. a
Hodges, K.: Thermochronology in orogenic systems, in: The Crust, Volume 3, Elsevier Inc., 263–292, ISBN 0-08-044338-9, https://doi.org/10.1016/B0-08-043751-6/03024-3, 2013. a
Hunter, J. D.: Matplotlib: A 2D Graphics Environment, Comput. Sci. Eng., 9, 90–95, https://doi.org/10.1109/MCSE.2007.55, 2007. a
Jaffey, A. H., Flynn, K. F., Glendenin, L. E., Bentley, W. C., and Essling, A. M.: Precision Measurement of Half-Lives and Specific Activities of 235U and 238U, Phys. Rev. C, 4, 1889–1906, https://doi.org/10.1103/PhysRevC.4.1889, 1971. a, b
Kadowaki, H., Tsunogae, T., He, X.-F., Santosh, M., Takamura, Y., Shaji, E., and Tsutsumi, Y.: Pressure-temperature-time evolution of ultrahigh-temperature granulites from the Trivandrum Block, southern India: Implications for long-lived high-grade metamorphism, Geol. J., 54, 3041–3059, 2019. a, b, c, d, e, f, g
Knight, B.: bknight1/diffusion_problems: GMD resubmission, Zenodo [code], https://doi.org/10.5281/zenodo.17936675, 2025. a
Knight, B.: bknight1/UWDiffusion: Multicomponent diffusion, Zenodo [code], https://doi.org/10.5281/zenodo.18870452, 2026. a, b
Krogh, T.: High precision U-Pb ages for granulite metamorphism and deformation in the Archean Kapuskasing structural zone, Ontario: implications for structure and development of the lower crust, Earth Planet. Sc. Lett., 119, 1–18, 1993. a
Kulp, J. L.: Isotopic dating and the geologic time scale, in: Crust of the Earth: A Symposium, GSA Special Paper 62, 609–630, ISBN 9780813720623, https://doi.org/10.1130/SPE62-p609, 1955. a
Lee, J. K. W., Williams, I. S., and Ellis, D. J.: Pb, U and Th Diffusion in Natural Zircon, Nature, 390, 159–162, https://doi.org/10.1038/36554, 1997. a, b
Liu, F. and Liou, J.: Zircon as the best mineral for P–T–time history of UHP metamorphism: a review on mineral inclusions and U–Pb SHRIMP ages of zircons from the Dabie–Sulu UHP rocks, J. Asian Earth Sci., 40, 1–39, 2011. a
Ludwig, K. R.: On the treatment of concordant uranium-lead ages, Geochim. Cosmochim. Ac., 62, 665–676, 1998. a
Mansour, J., Giordani, J., Moresi, L., Beucher, R., Kaluza, O., Velic, M., Farrington, R., Quenette, S., and Beall, A.: Underworld2: Python geodynamics modelling for desktop, HPC and cloud, J. Open Source Softw., 5, 1797, https://doi.org/10.21105/joss.01797, 2020. a
Moresi, L., Dufour, F., and Mühlhaus, H.-B.: A Lagrangian integration point finite element method for large deformation modeling of viscoelastic geomaterials, J. Comput. Phys., 184, 476–497, 2003. a
Moresi, L., Mansour, J., Giordani, J., Knepley, M., Knight, B., Graciosa, J. C., Gollapalli, T., Lu, N., and Beucher, R.: Underworld3: Mathematically Self-Describing Modelling in Python for Desktop, HPC and Cloud, J. Open Source Softw., 10, 7831, https://doi.org/10.21105/joss.07831, 2025a. a, b
Moresi, L., Mansour, J., Giordani, J., Knepley, M., Knight, B., Graciosa, J. C., Gollapalli, T., Lu, N., and Beucher, R.: Underworld3: Mathematically Self-Describing Modelling in Python for Desktop, HPC and Cloud, Zenodo, Zenodo [code], https://doi.org/10.5281/zenodo.16838572, 2025b. a
Praharaj, P. and Rekha, S.: Tectonometamorphic evolution of the Trivandrum and Southern Madurai blocks in the Southern Granulite Terrane, south India: correlation with south-central Madagascar, Geol. Mag., 159, 1569–1600, 2022. a, b, c, d
Rubatto, D.: Zircon: The metamorphic mineral, Rev. Mineral. Geochem., 83, 261–295, 2017. a
Rubatto, D. and Hermann, J.: Experimental zircon/melt and zircon/garnet trace element partitioning and implications for the geochronology of crustal rocks, Chem. Geol., 241, 38–61, 2007. a
Schoene, B.: 4.10-u–th–pb geochronology, Treat. Geochem., 4, 341–378, 2014. a
Strutt, R. J.: The accumulation of helium in geological time. – II, P. Roy. Soc. Lond. A, 83, 96–99, 1909. a
Taylor, R. J., Clark, C., Fitzsimons, I. C., Santosh, M., Hand, M., Evans, N., and McDonald, B.: Post-peak, fluid-mediated modification of granulite facies zircon and monazite in the Trivandrum Block, southern India, Contrib. Mineral. Petrol., 168, 1–17, 2014. a, b, c, d, e, f
Tera, F. and Wasserburg, G.: U-Th-Pb systematics in three Apollo 14 basalts and the problem of initial Pb in lunar rocks, Earth Planet. Sc. Lett., 14, 281–304, 1972. a
The Matplotlib Development Team: Matplotlib: Visualization with Python, Zenodo [code], https://doi.org/10.5281/zenodo.14940554, 2025. a
Timms, N. E., Reddy, S. M., Fitz Gerald, J. D., Green, L., and Muhling, J. R.: Inclusion-localised crystal-plasticity, dynamic porosity, and fast-diffusion pathway generation in zircon, J. Struct. Geol., 35, 78–89, https://doi.org/10.1016/j.jsg.2011.11.005, 2012. a, b
Ullah, M., Klötzli, U., Wadood, B., Khubab, M., Islam, F., Shehzad, K., and Ahmad, R.: Pb diffusion in perfect and defective zircon for thermo/petro-chronological investigations: An atomistic approach, Chem. Geol., 640, 121750, https://doi.org/10.1016/j.chemgeo.2023.121750, 2023. a, b
Wasserburg, G.: Diffusion processes in lead-uranium systems, J. Geophys. Res., 68, 4823–4846, 1963. a
Wetherill, G.: Discordant uranium-lead ages: 2. Disordant ages resulting from diffusion of lead and uranium, J. Geophys. Res., 68, 2957–2965, 1963. a, b