
the Creative Commons Attribution 4.0 License.
the Creative Commons Attribution 4.0 License.
 | 15 Jul 2026
mLDNDCv1.0: a machine learning-based surrogate of LandscapeDNDC for optimising cropping systems in Denmark
Meshach Ojo Aderele
Edwin Haas
Licheng Liu
João Serra
David Kraus
Klaus Butterbach-Bahl
Optimising Danish arable management is critical for reducing greenhouse-gas (GHG) emissions and nitrogen (N) losses while maintaining or even improving crop productivity and soil health. Process-based models such as LandscapeDNDC can simulate the effects of management on agroecosystem functioning. However, their computational demand limits large-scale optimisation. Here we present mLDNDCv1.0, a tree-based machine-learning surrogate of LandscapeDNDC that allows for the rapid exploration of large decision spaces while maintaining high fidelity to the parent process-based model's input-output behaviour. We generated a synthetic training set of >45 million LandscapeDNDC simulations from a full factorial of soils, climate (2011–2020), and management options for winter wheat. We benchmarked gradient-boosted tree algorithms (LightGBM, XGBoost, CatBoost) on predictive performance. XGBoost and LightGBM outperformed CatBoost and achieved similar predictive performance for the core indicators in this study. XGBoost, selected as the final model for its much faster inference in our implementation, achieved: soil N2O emissions (R2=0.81), leaching (R2=0.84), yield (R2=0.93), and for soil-organic-carbon stock changes (R2=0.86). When evaluated on real field activity data from Denmark, the surrogate model closely reproduced the process-based model outputs, with particularly strong agreement for crop yield, which was further corroborated by independent observational data. Coupling mLDNDC with the multi-objective evolutionary algorithm NSGA-II allowed us to optimise millions of management combinations within a predefined decision boundary across all winter wheat fields in Denmark. Pareto-optimal solutions reduced N2O emissions by 27.5±4.5 %, and leaching by 27±3.0 %. These solutions also increased grain yield by 8.5±1.5 % and soil-organic-carbon stocks by 1.2±0.1 %, and improving nitrogen-use efficiency (NUE) by 10±2 %, while turning the system into a net GHG sink (). These gains were achieved without increasing total fertiliser input. They arose from re-allocating mineral and organic fertliser N input, adjusting incorporation depth, and optimising residue, catch-crop, and irrigation practices. Thus, mLDNDC provides a scalable, transparent framework for country-wide scenario comparison and strategic planning at an annual time scale in climate-smart agriculture.
- Article
(5518 KB) - Full-text XML
-
Supplement
(1123 KB) - BibTeX
- EndNote


Optimising cropping systems is critical for increasing agricultural productivity while reducing environmental impacts. Agriculture accounts for 20 %–25 % of global anthropogenic greenhouse gas (GHG) emissions and is a major driver of climate change (Vermeulen et al., 2012). In Denmark, where agriculture covers more than 55 % of the total land area (Hansen et al., 2025), improving management practices is both necessary and urgent. The Danish agricultural sector plays a central role in national food, yet it is also responsible for about 23 % of national greenhouse gas emissions (Nielsen et al., 2020), while being a major contributor to nutrient runoff and land-use pressures (Pugliese et al., 2023). As global demand for food continues to rise, Danish agriculture faces the dual challenge of sustaining high yields while meeting environmental and climate commitments.
Without optimisation, farming systems risk becoming inefficient and environmentally unsustainable (Wezel et al., 2020). Variability in soil conditions, weather patterns, and management intensity often leads to uneven resource use and suboptimal productivity (Abdu et al., 2023). Moreover, climate change is intensifying these challenges by altering growing conditions and increasing the frequency of extreme events such as droughts and floods (Baker and Anttila-Hughes, 2020). This makes it increasingly important to identify management strategies that can maintain productivity, enhance resilience, and reduce environmental footprints.
For exploratory scenario testing, process-based models (PBMs) such as LandscapeDNDC (LDNDC) (Haas et al., 2013) – remain the tools of choice. PBMs represent the biophysical and biogeochemical processes that regulate crop growth, soil dynamics, water balance, and nutrient cycling (Zhang et al., 2022). By explicitly simulating interactions among crops, soils, and the atmosphere, they improve system understanding, challenge theoretical assumptions, and predict responses to management or climate drivers (Jeong et al., 2020). When run across diverse environments, PBMs quantify trade-offs among yield, nitrogen losses, GHG emissions, and soil-carbon dynamics, thereby providing a science-based foundation for sustainability assessments (Shi et al., 2025).
Yet the same mechanistic richness that gives PBMs their credibility also makes them computationally heavy, especially when thousands of management permutations must be tested at national scale (Lu and Ricciuto, 2019). Machine-learning (ML) methods can overcome the runtime barrier, but, when used in isolation, they lack an intrinsic grasp of soil–plant–atmosphere processes. Merging ML with PBMs therefore offers an attractive compromise of process realism with substantial speed-ups (Droutsas et al., 2022). One promising avenue is surrogate (or meta-) modelling, in which an ML algorithm is trained on PBM outputs, and subsequently emulates the PBM at a fraction of the computational cost (Aderele et al., 2025a).
Surrogate techniques are now being increasingly adopted across agri-environmental sciences (e.g., Aderele et al., 2025a). Applications include predicting crop yield (Nguyen et al., 2019; Shahhosseini et al., 2019), gaseous-nitrogen fluxes such as nitrous oxide (N2O) and ammonia (NH3) (Perlman et al., 2014; Villa-Vialaneix et al., 2012), assessing nitrate-leaching (Piñeros Garcet et al., 2006), studying the terrestrial carbon-cycle (Luo et al., 2011; Xiao et al., 2022), investigating crop physiology and water dynamics (Attia et al., 2022), or grasslands (Pylianidis et al., 2022). However, these efforts have largely focused on field or landscape-scale applications and often target single sustainability indicators.
To date, no study has carried out a nationwide optimisation of agriculture that simultaneously considers yield, nitrous oxide (N2O) emissions, nitrate () leaching, and soil organic carbon (SOC) dynamics. Building on this gap, the present work addresses two questions: (i) can a functional machine learning–based surrogate model be developed for LandscapeDNDC, and (ii) can such surrogates be used to optimise Danish agriculture at national scale in a way that reduces environmental impacts while enhancing productivity and soil health, without compromising scientific rigour? Danish agriculture is used as a case study due to data availability, while the methodology is general and can be applied to other countries, continents, or even global-scale analyses. Filling these gaps demands both an accurate biogeochemical representation and an optimisation engine capable of searching a vast management decision space.
Exploratory scenario applications, where a range of management options are defined and simulated using PBMs, remain an interesting and potentially useful option (Aderele et al., 2025b). While informative, such “fixed-scenario” approaches restrict discovery to strategies already envisioned. Search-based optimisation, by contrast, defines broad decision boundaries and allows an algorithm to find novel solutions within them. This paradigm has been applied to climate-smart crop production elsewhere (Xiao et al., 2024) and is adopted here.
Coupling an evolutionary optimiser with a PBM such as LandscapeDNDC would require thousands to millions of simulations, rendering the process impractical. Therefore, we introduce mLDNDC, a machine-learning surrogate of LandscapeDNDC that maintains high fidelity to the parent process-based model's input-output behaviour, while reducing computation time. mLDNDC allows for the thorough exploration of management options and, when paired with an optimiser, can identify strategies that improve productivity, resilience and environmental sustainability. This study showcases mLDNDC application to winter wheat, the most widely grown and economically important cereal in Denmark (Barua et al., 2014), accounting for over 23 % of the cropping area, and demonstrate its use in optimising management under contemporary Danish conditions. The analysis tracks four core outputs: N2O emissions, leaching, grain yield, and SOC change. Together, these variables capture the essential balance between productivity and environmental impact, forming the basis of our optimisation exercise.
This study was conducted through four main stages, summarized in Fig. 1. The workflow comprised (i) Synthetic data generation for winter wheat at field level in Denmark, (ii) Simulation using LandscapeDNDC, (iii) Training of machine learning models on the synthetic input–output datasets produced by LandscapeDNDC, and (iv) Optimization, where the trained surrogate model was applied to achieve the study objectives.
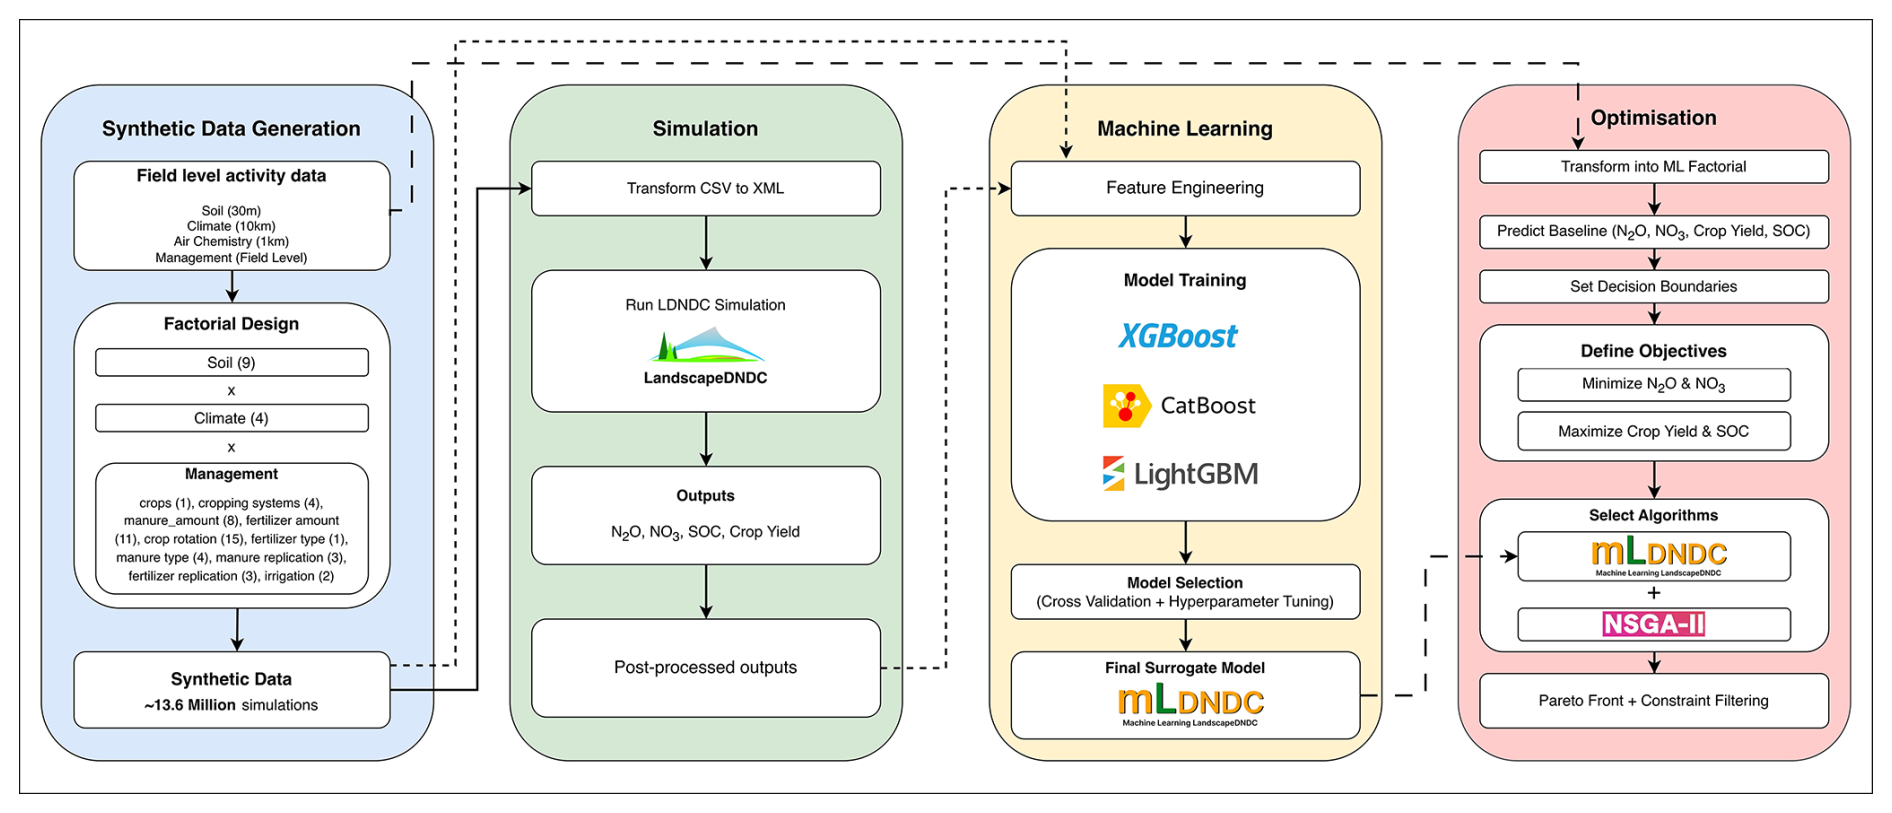
Figure 1Overview of the methodological framework for developing mLDNDC and its application for optimising cropping systems in Denmark.
2.1 Synthetic Data Generation
Developing a robust surrogate model demands a dataset that goes beyond what is available from field observations. Although empirical data is valuable, it only covers a narrow slice of the management practices currently used, missing much of the plausible decision space needed for trade-off analysis and optimisation. We bridge this gap by creating a synthetic dataset that combines observed and hypothetical management scenarios. This broader coverage enables the surrogate model to generalise beyond management boundaries of current management practices.
The construction of the dataset involved two steps. First, we defined plausible ranges for numeric predictors (e.g., fertiliser amount) and alternative possibilities for categorical (e.g., fertiliser type) options for all key management variables, drawing on field-level records and agronomic knowledge. Second, we varied these variables within their agronomic limits using a full factorial design to generate a large set of unique management combinations representing the full range of plausible practices within the Danish agricultural context. While the factorial design is comprehensive by nature, it inevitably produces unrealistic combinations. These were systematically filtered out based on agronomic constraints and consistency with observed field practice. For instance, fertiliser replication (the number of times fertiliser is applied) was set to zero wherever both synthetic and organic fertiliser amounts were 0 kg, and application frequency was constrained by realistic quantity thresholds. For example, a total fertiliser amount of 30 kg would not feasibly support two or three separate applications.
2.1.1 Field Level Activity Data
We used the harmonized field-level data from the SmartField project to drive the process-based model representing Danish agriculture. This dataset was developed to generate the Tier-3 GHG emission inventory and the dataset was used as baseline to represent variations in crop sequences and rotations and management practices (e.g., fertilisation, irrigation, tillage, cover cropping, and residue management).
The dataset is based on information on crop types and cropland boundaries available at field scale from 2011–2020 from the General Farm Register (Rolighed, 2023), combined with total amounts of synthetic (e.g., ammonium-based inputs) and organic (e.g., livestock slurry) fertilizers reported at the farm scale. The fertiliser inputs were distributed to fields within each farm based on the allowed rates for specific crop and soil types defined by the Danish AgriFish Agency to fulfill national regulations (Dalgaard et al., 2014).
Management boundaries were identified from Danish agricultural registry data and agronomic guidelines to represent the observed range of current agricultural practices in Denmark. These boundaries served as reference points for defining the limits of each management variable. A management library was then constructed, encapsulating all possible combinations of these management parameters for further use in the factorial design stage. The optimisation algorithm operates within these boundaries, ensuring that identified management strategies are grounded in current agricultural reality while still revealing unexplored but feasible options.
2.1.2 Factorial Design
The factorial design was developed to generate a comprehensive and representative set of synthetic management scenarios. This was accomplished by systematically combining soil, climate, crop management, and fertilisation.
Soil (9 levels): Soil properties, including texture, soil organic carbon (SOC) and bulk density (BD), were extracted as geospatial raster layers at 30.4 m resolution for five standard depth intervals (0–5, 5–15, 15–30, 30–60 and 60–100 cm). Soil pH for the same depths was obtained from a separate dataset at 100 m resolution. Saturated hydraulic conductivity (Ks) was derived using a pedotransfer function based on relevant soil attributes (Rahimi et al., 2024). The soil classes used for factorial design was derived from a 30 m resolution national soil map classified according to the Jordbær soil classification system in Denmark (Fig. S2 in the Supplement). This classification system resulted in 9 distinct soil classes that represent the dominant soil types in Danish agricultural landscapes.
Climate (4 levels): Climate data, including (daily mean air temperature, global radiation, and precipitation) were obtained from the Danish Meteorological Institute (DMI) at a spatial resolution of 10 km (https://www.dmi.dk/, last access: 9 July 2026). The DMI IDs were categorized into 4 climate zones based on the De Martonne aridity index (Fig. S3), capturing the spatial variability of moisture availability and its potential impact on crop growth and soil processes (e.g., potential evapotranspiration). To simulate the synthetic dataset, one DMI ID was randomly selected from each class. For atmospheric N deposition, regional-scale outputs from the atmospheric chemical transport model, the Danish Eulerian Hemispheric Model (Rahimi et al., 2024), were used to provide nitrogen deposition inputs for our model. For simulation purposes, the air-chemistry inputs were taken from the same randomly selected DMI ID.
Cropping Systems (4 levels): Cropping systems were adapted from Aderele et al. (2025b) and represent different combinations of crop residue and catch crop management. Four distinct categories were defined: (i) complete residue removal without a catch crop, (ii) complete residue retention with a catch crop, (iii) complete residue removal with a catch crop, and (iv) complete residue retention without a catch crop. For all cropping systems, tillage was carried out five days before crop establishment to prepare the seedbed. These combinations capture the most relevant residue – catch crop interactions observed in Danish agricultural systems.
Fertilization amount (11×8 levels): Synthetic fertilizer application rates were defined in 30 kg N ha−1 increments from 0–330 kg N ha−1, resulting in 11 levels. Organic fertilizer application rates followed a similar structure, ranging from 0–240 kg N ha−1 in 30 kg intervals, resulting in 8 levels. The upper bounds for both fertilizer types were intentionally set higher than the maximum levels typically observed in national practice to allow simulations beyond the baseline and support optimisation and sensitivity analyses.
Fertilization type (1×4 levels): Ammonium nitrate () was selected as the sole synthetic fertilizer type as it accounts for dominant share of the total synthetic fertilisers used in Denmark. Four organic fertilizer types were considered: compost, farmyard manure, slurry (injected), and slurry (surface applied).
Fertilization splits (3×3 levels): Both synthetic and organic fertilization were represented by three application-frequency levels (one to three applications per growing season). For each synthetic scenario, the corresponding organic scenario was combined to create realistic split combinations. To ensure realistic application timing, data from the Danish catchments from the National Monitoring Program for Water Environment and Nature, NOVANA (LOOP-program; In Danish: Landovervågningsprogrammet) was used for the timing and per-split rates. One matching field-year was randomly selected from this dataset for each synthetic management record. For example, if a winter wheat scenario in 2017 required one organic split and two synthetic splits, a field-year with the same split structure (1 organic + 2 synthetic) would be randomly selected from the dataset and its observed timing and per-application rate pattern would be adopted. This approach preserves realistic within-season fertilization schedules while allowing for the systematic exploration of total N levels.
Crop Rotation (15 levels): Crop rotations were defined using a two-year rotation system that precede the main crop, winter wheat. Five primary crop categories were considered: cereals, legumes, leafy crops, root crops, and grasses. Combining these categories across two preceding years produced 15 unique rotation types, ensuring a broad range of agronomic sequences was represented (Fig. S4).
Irrigation (2 levels): We represented irrigation as a binary factor (irrigated vs. non-irrigated), and triggered applications based on crop water demand. This was preferred to dynamically calculating irrigation needs according to climate × management interactions to reduce the number of factorial scenarios and its computational demand both for LDNDC and ML.
Although a factorial design is comprehensive by nature, it can generate unrealistic or inconsistent combinations. For example, very high fertilization levels may not be agronomically plausible when represented with a single split as e.g. certain synthetic–organic pairings can produce excessively high total N inputs. When amount of organic fertilizer is zero, the “type” of an organic fertilizer is not meaningful. Therefore, the synthetic dataset was systematically screened and cleaned using rule-based plausibility checks to eliminate such combinations and ensure that the remaining scenarios reflect realistic and interpretable management configurations. Rather than undermining the training distribution, this step refines it by concentrating the training data on agronomically plausible scenarios, improving both model reliability and the interpretability of optimisation results.
2.2 Simulation With LandscapeDNDC
The synthetic data generation process produced approximately 13.6 million rows, which were subsequently reduced to about 4.5 million rows per simulation year during preprocessing (Table S3 in the Supplement). This yielded a total of about 45 million rows spanning the ten-year period from 2011–2020. These rows served as the input dataset for the simulation stage. All simulations were performed using the LandscapeDNDC.
2.2.1 Process-based Model Description
LandscapeDNDC (LDNDC) is a process-based framework that simulates the coupled cycles of carbon, nitrogen, and water cycles in cropland, grassland, and forest systems (Haas et al., 2013). It links five core modules: (i) PlaMox for crop growth (Kraus et al., 2016; Liebermann et al., 2019); (ii) CanopyECM for micro-climate processes (Grote et al., 2009); (iii) WatercycleDNDC for soil water and hydrology (Kiese et al., 2011); (iv) AirchemistryDNDC for atmospheric chemistry; and (v) MeTrx for soil biogeochemistry (Kraus et al., 2015).
The model has been applied and tested in a range of contexts. Across Europe, Haas et al. (2022) explored long-term residue-management effects on soil organic carbon (SOC) and N2O emissions. Kraus et al. (2022) validated national-scale simulations in the Philippines for alternate wetting and drying in rice systems, while Smerald et al. (2023) used LDNDC to examine global nitrogen-redistribution options for closing yield gaps with minimal environmental damage.
For its application in Danish conditions, LDNDC has undergone detailed calibration and testing. Kollmer (2023) calibrated plant-physiological and soil parameters using data from the long-term Askov experiment and successfully reproduced the observed SOC accumulation in dependence of different field management regimes. Grados et al. (2024) compared modelled N2O fluxes with field measurements from the Foulum and reported a standardised RMSE of 2.03 . Rahimi et al. (2024) evaluated LDNDC across the six LOOP catchments in Denmark and achieved an overall R2 of 0.77 for yield predictions. The present study adopts the same parameter bounds and input settings as used in the listed studies. Finally, Aderele et al. (2025b) assessed twelve alternative Danish cropping regimes combining fertiliser, residue, and catch-crop strategies. They analysed trade-offs among GHG emissions, nitrogen leaching, SOC changes, and yield.
Given the extensive international and Danish-level validation of LDNDC cited above, and its demonstrated agreement with observations for multiple quantities (e.g., SOC dynamics, N2O fluxes, crop yields) under diverse conditions, the model's process representation is well-supported across a range of conditions. LDNDC therefore provides a defensible foundation for the surrogate-modelling work carried out here. Nevertheless, neither LDNDC nor its surrogate can be assumed valid for every variable, management regime, or environmental condition considered. Applications of the surrogate therefore require careful evaluation, as would be expected for the parent process-based model itself.
2.2.2 Process-based Model Simulation
The simulations covered the period from 2011–2020 and focused on winter wheat. Next, we converted the generated synthetic management scenarios (Sect. 2.1.2) to LDNDC data requirements in Extensive Markup Language (XML). We took planting dates, harvest dates, and fertiliser schedules from the field-level activity dataset described in Sect. 2.1.1, so that model settings would reflect typical Danish practices across the main cropping regions. Every synthetic management combination from the factorial design was run as a separate LDNDC job. To manage the large workload, we used an HPC cluster, launching 40 parallel tasks, each with one (CPU cores each, 600 GB shared memory). With this setup the full batch finished in roughly seven days; running on a desktop machine would have taken several weeks.
LDNDC was configured for daily time steps, but the simulations were run at subdaily intervals, generating outputs for N2O emissions, leaching, grain yield, and changes in soil organic carbon (SOC).
2.3 Machine Learning
2.3.1 Feature Engineering
Developing the surrogate model required a comprehensive set of predictor variables capturing the key biophysical, climatic, and management processes that regulate crop performance, nitrogen dynamics, and soil-carbon outcomes. These features were derived from LDNDC simulations and combined with processed soil and climate data. They were engineered to represent both long-term system characteristics and short-term, management-sensitive drivers.
Management practices: One primary management variable, additional feature such as total nitrogen input, was calculated by summing all mineral fertiliser nitrogen and manure nitrogen applied within a given year; this measure represents the total nitrogen supply entering the cropping system and is a critical determinant of crop productivity, nitrate leaching, and nitrous oxide emissions. To capture nonlinear response behaviour associated with nitrogen inputs, a squared term or second order polynomial of total nitrogen and each manure and synthetic fertiliser inputs were also included as an additional feature (Sutton and Matheus, 1991).
Climate: To characterise rainfall patterns, we constructed a rainfall-frequency indicator by counting the number of days per year with measurable precipitation. This captures moisture intermittency which strongly influences soil mineralisation, denitrification, and crop-growth cycles. A suite of additional climate variables were engineered to capture both seasonal and crop-stage specific conditions, including annual precipitation, total precipitation during the crop's growing season, and seasonal precipitation for autumn, winter, and spring; equivalent temperature metrics – mean annual temperature and mean temperatures for the growing season and each major season – were generated to reflect the climatic environment governing crop development, soil biological activity, and nitrogen turnover.
Short-term climate effects: Short-term hydrological conditions surrounding nutrient applications were incorporated through event-based precipitation indicators that quantify accumulated rainfall in the seven days preceding each fertiliser and manure application. We also included rainfall in the three days following each application to capture conditions that influence nitrogen-loss pathways such as volatilisation, rapid infiltration, or surface runoff. These pathways are known to affect both nitrate leaching and nitrous oxide emissions.
Soil: We constructed soil features by aggregating the properties of the upper three soil layers (0–20 cm depth), which represent the active root zone most relevant for crop growth and nutrient cycling. We calculated the mean values of field capacity, wilting point, sand, silt, and clay fractions, organic carbon, organic nitrogen, pH, bulk density, and saturated hydraulic conductivity for each field. These aggregated variables provide a representative profile of the soil's physical and biogeochemical characteristics to be used in the surrogate model.
Target variables: The target variables were transformed prior to training recognising that variable transformation is a well-established strategy for improving the performance of supervised-learning models when target variables are highly skewed or exhibit heteroscedasticity. Nitrous oxide emissions, nitrate leaching, and crop yield were log-transformed to address strong skewness. Soil-organic carbon change was transformed using the Yeo–Johnson power-transformation method (Weisberg, 2001) to accommodate both positive and negative values.
The full list of features used for the model training can be found in Table S4.
2.3.2 Model training
Benchmarking
Before training on the full data, it is vital to select which model will be used for this final training. The dataset was therefore split into two parts: 80 % for model training and the remaining 20 % withheld as an independent test set for evaluating generalisation performance. This ratio is widely adopted in machine learning practice as it balances the data available for learning with the need for reliable evaluation (Kuhn and Johnson, 2013).
To identify the most suitable surrogate model for the target variables agroecosystem indicators, three gradient-boosting decision-tree algorithms (Sect. S1 in the Supplement) were benchmarked: LightGBM, XGBoost, and CatBoost. Light Gradient Boosting Machine (LightGBM; Ke et al., 2017) accelerates training via histogram-based splits and leaf-wise growth; Extreme Gradient Boosting (XGBoost; Chen and Guestrin, 2016) adds regularisation, parallel execution, and efficient sparse-matrix handling; and CatBoost (Prokhorenkova et al., 2018) employs ordered boosting with target statistics to mitigate overfitting and handle categorical inputs. First, each candidate model was initially trained using its default hyperparameters (Table S1), and baseline performance was evaluated on two test sets: the withheld 20 % of the synthetic training data (possibility space) and an independent real-world dataset (actual space). Based on this initial comparison, the best-performing algorithm was selected and subsequently subjected to intensive hyperparameter tuning combined with further cross-validation. This staged workflow avoids unnecessary optimisation of weaker candidates and substantially reduces computational cost while maintaining methodological rigour in model selection and evaluation.
Hyperparameter Tuning
Hyper-parameter optimisation was carried out with Optuna (Akiba et al., 2019), which uses a Tree-structured Parzen Estimator (TPE) Bayesian-optimisation engine coupled with early-stopping “pruners” to traverse the search space efficiently. The objective function minimised the validation error, and wall-clock time was kept in check by running each trial on a random 1 % subsample of the training data to reduce the tuning time and computational requirements. This choice follows the findings of Kapoor and Perrone (2021), who showed that tuning on as little as 1 % of a large dataset yields validation-metric differences below 0.5 % relative to tuning on the full dataset.
Once the hyperparameter search converged, the selected configuration was used to train the selected model using five-fold cross-validation on the full dataset, i.e., the original 80 % training partition plus the 20 % test set used in the benchmarking stage (Sect. “Benchmarking”). The data were randomly shuffled and partitioned into five equally sized folds; in each iteration, four folds were used for training and the remaining fold served as validation. This procedure ensured that every observation contributed to both model fitting and validation, providing robust estimates of predictive performance. Reported performance metrics were derived from the cross-validation results.
After confirming stable performance across folds, the final surrogate model was trained on the complete dataset using the optimised hyperparameters. This final refit maximised the use of available information and produced the mLDNDC model used for downstream large-scale prediction and management optimisation. This is consistent with standard practice when the objective is the operational deployment of a single, fully trained model (Hastie et al., 2009).
Model Explanation
To interpret the relative influence of management and environmental variables on each agroecosystem indicator, we computed SHapley Additive exPlanations (SHAP) values for the optimised XGBoost models. Using TreeSHAP (Lundberg and Lee, 2017), each prediction was decomposed into additive feature attributions whose magnitudes indicate the strength of the effect and whose signs indicate the direction (positive or negative) of the contribution, thereby offering a consistent, locally accurate measure of variable importance across the entire dataset.
Model Validation
To ensure the generalizability and external validity of the surrogate model, an independent validation was performed using data not involved in model training or simulation by LandscapeDNDC. For this purpose, national-scale crop yield data obtained from the National Statistics Denmark were employed as an external benchmark. This dataset represents real-world observations across diverse management and environmental conditions, providing a meaningful basis for evaluating model transferability with respect to winter wheat yield beyond the simulation domain. While site-scale observations for N2O, NO3, and SOC exist in Denmark and have been previously evaluated (Aderele et al., 2025b; Grados et al., 2024; Kollmer, 2023; Rahimi et al., 2024), national-scale validation data for these variables were unavailable, precluding transferability assessment at the scale considered in this study. It should be noted, however, that LDNDC has been evaluated at site scale for winter wheat systems in other European contexts, including Germany (Haas et al., 2021; Kasper et al., 2018; Molina-Herrera et al., 2016), as well, supporting confidence in its broader process representation. Nonetheless, transferability claims in this study remain limited to yield, and this is acknowledged as a key limitation. Future work should seek to validate surrogate performance across the full set of agroecosystem indicators as suitable observational datasets become available.
2.4 Optimisation
2.4.1 Decision Boundaries
The optimization process was constrained within predefined decision boundaries, representing the range of controllable management variables. These boundaries define the feasible search space for identifying optimal agroecosystem management strategies.
Specifically, the manure application rate was varied from 0–210 kg N ha−1, and the synthetic fertilizer rate ranged from 0–300 kg N ha−1. These ranges were selected to encompass the typical and extreme management practices observed in Danish cropping systems while ensuring agronomic plausibility.
Categorical management factors, as described in Sect. 2.1.2, were also included in the optimization search space. These comprised crop rotation, cropping systems, synthetic fertilizer types, manure types, replication schemes (for both manure and synthetic fertilizer, showing how many times they were applied), irrigation, and manure depth. Optimizing these continuous and categorical decision variables allows the optimization framework to capture a broad spectrum of feasible management combinations aimed that balance productivity and environmental outcomes.
The optimisation was conducted at the individual winter wheat field level across Denmark using national inventory data, with results subsequently aggregated to a 10 km×10 km grid to facilitate spatial visualisation. Accordingly, the baseline represents the current, field-specific management practices and associated outcomes under current farming conditions.
2.4.2 Objectives
The optimization problem was formulated as a multi-objective task aimed at simultaneously improving environmental and agronomic outcomes. Specifically, the objectives were to minimize N2O emissions and leaching, while maximizing crop yield and SOC change.
These four objectives collectively represent the key dimensions of sustainable agricultural management, enhancing productivity while mitigating greenhouse gas emissions and nutrient losses The formulation can be expressed as:
There is no explicit weighting scheme applied to the target variables; in the current setup, none of the objectives is prioritized over the others, so N2O, , yield, and annual SOC are all treated equally.
The multi-objective optimization was conducted under the decision boundaries defined in Sect. 2.4.1, allowing the identification of Pareto-optimal solutions that represent trade-offs between environmental protection and agricultural productivity.
2.4.3 Optimisation Algorithm
The Non-dominated Sorting Genetic Algorithm II (NSGA-II) (Deb et al., 2002) was employed to solve the multi-objective optimization problem. NSGA-II is a widely adopted evolutionary algorithm designed for identifying Pareto-optimal solutions in problems with conflicting objectives. It maintains population diversity through a crowding distance mechanism and ensures computational efficiency via fast non-dominated sorting.
The implementation was carried out in Python using the pymoo optimization framework (Blank and Deb, 2020). Each generation of the algorithm evolved candidate management strategies through processes of selection, crossover, and mutation, iteratively improving the trade-offs between environmental and productivity objectives. The algorithm efficiently explored the multi-dimensional decision space defined in Sect. 2.4.1, identifying optimal combinations of manure rate, fertilizer rate, and other categorical management variables that balanced N2O emissions, leaching, crop yield, and SOC change. At the end of the optimization, the pareto front is returned which is the top 50 management practices that fulfils our objectives for a specific field.
2.4.4 Constraint Based Filtering
After generating the Pareto-optimal solutions for each field, a constraint-based filtering step was applied to identify management strategies that are both environmentally beneficial and agronomically feasible. Two sets of constraints were used in this study.
The first ensured that any selected management strategy outperformed the field's current baseline. Specifically, an optimised solution was retained only if it produced lower nitrous oxide emissions and lower nitrate leaching while achieving higher crop yield and greater soil organic carbon content than the baseline management for that field. This requirement ensured that recommended solutions deliver clear improvements across all key sustainability indicators rather than merely redistributing environmental impact. It is important to note that the reported improvements therefore reflect a filtered subset of the full Pareto space, specifically those solutions meeting all four criteria simultaneously, and should be interpreted as such rather than as a representation of all available trade-off solutions.
The second constraint addressed regional manure-use feasibility. To reflect realistic resource availability, the total manure applied in any optimised solution was required to remain at or below the total manure availability for the corresponding NUTS2 region in Denmark. This ensured that the optimisation results did not rely on manure inputs that exceed what is currently accessible within regional nutrient cycling systems.
These constraints guaranteed that the final set of optimised management strategies were both environmentally superior and grounded in practical resource limitations, thereby increasing the likelihood of real-world applicability and policy relevance.
2.5 Performance evaluation
Model performance was evaluated using the coefficient of determination (R2) and the root mean square error (RMSE) to quantify both predictive accuracy and the magnitude of prediction error. It should be noted that this assessment was conducted in two phases, each of which aligned with the conceptual distinction between the possibility space and the actual space of management practices.
The first phase (possibility space) measured training accuracy by evaluating the model on the same synthetic dataset used for model development. This dataset represents the “possibility space”, which encompasses the full range of management combinations that could theoretically occur. The aim was to determine how well the model captures relationships within this synthetic generated domain.
The second phase (actual space) measured validation accuracy using an independent dataset derived from reported national field management records for winter wheat. This dataset reflects the “actual space” i.e., the management practices that have been implemented under real-world conditions, and all the necessary response variables for this dataset were produced through LDNDC simulations. Consequently, this phase provides a more realistic test of the model's generalizability, since it evaluates performance under the management strategies that occur in practice rather than only in theory.
2.6 GHG Balance Calculation
The soil net greenhouse gas (GHG) balance was estimated to evaluate the overall climate impact of the baseline and optimised cropping system. The balance was calculated as the difference between soil organic carbon (SOC) – derived CO2 sequestration and the sum of direct and indirect N2O emissions, expressed on a CO2-equivalent (CO2equ) basis. A negative GHG balance indicates that the cropping system acts as a net sink of GHGs (i.e., net CO2 removal). This approach allows for integrating changes in soil carbon storage with gaseous emissions to provide a comprehensive measure of the system's overall climate performance.
3.1 Model Performance
Table 1 summarises the predictive performance of the three tree-based models evaluated in this study and shows that all models achieved generally acceptable accuracy across the target variables. However, XGBoost and LightGBM consistently outperformed CatBoost, exhibiting higher coefficients of determination and lower error metrics. Although XGBoost and LightGBM achieved very similar predictive performance across all target variables, XGBoost was selected as the final model due to its substantially faster inference time as observed in this implementation. On average, XGBoost took approximately three minutes to generate predictions for all four variables in this setup, whereas LightGBM took nearly one hour to produce the same outputs under identical computational conditions. This difference likely reflects implementation-specific factors such as hardware, batching, and model size, and may not generalise across all settings. For applications with different setups and computational constraints, LightGBM remains a viable surrogate option. This difference in inference efficiency is critical given the scale of simulations in this study involving millions of management combinations and the need for timely generation of management scenario outcomes. The markedly lower inference cost makes XGBoost cheaper to deploy at scale and thus more suitable as a surrogate model within computationally intensive optimisation loops.
Table 1Performance of CatBoost, XGBoost, and LightGBM across possibility and actual spaces.
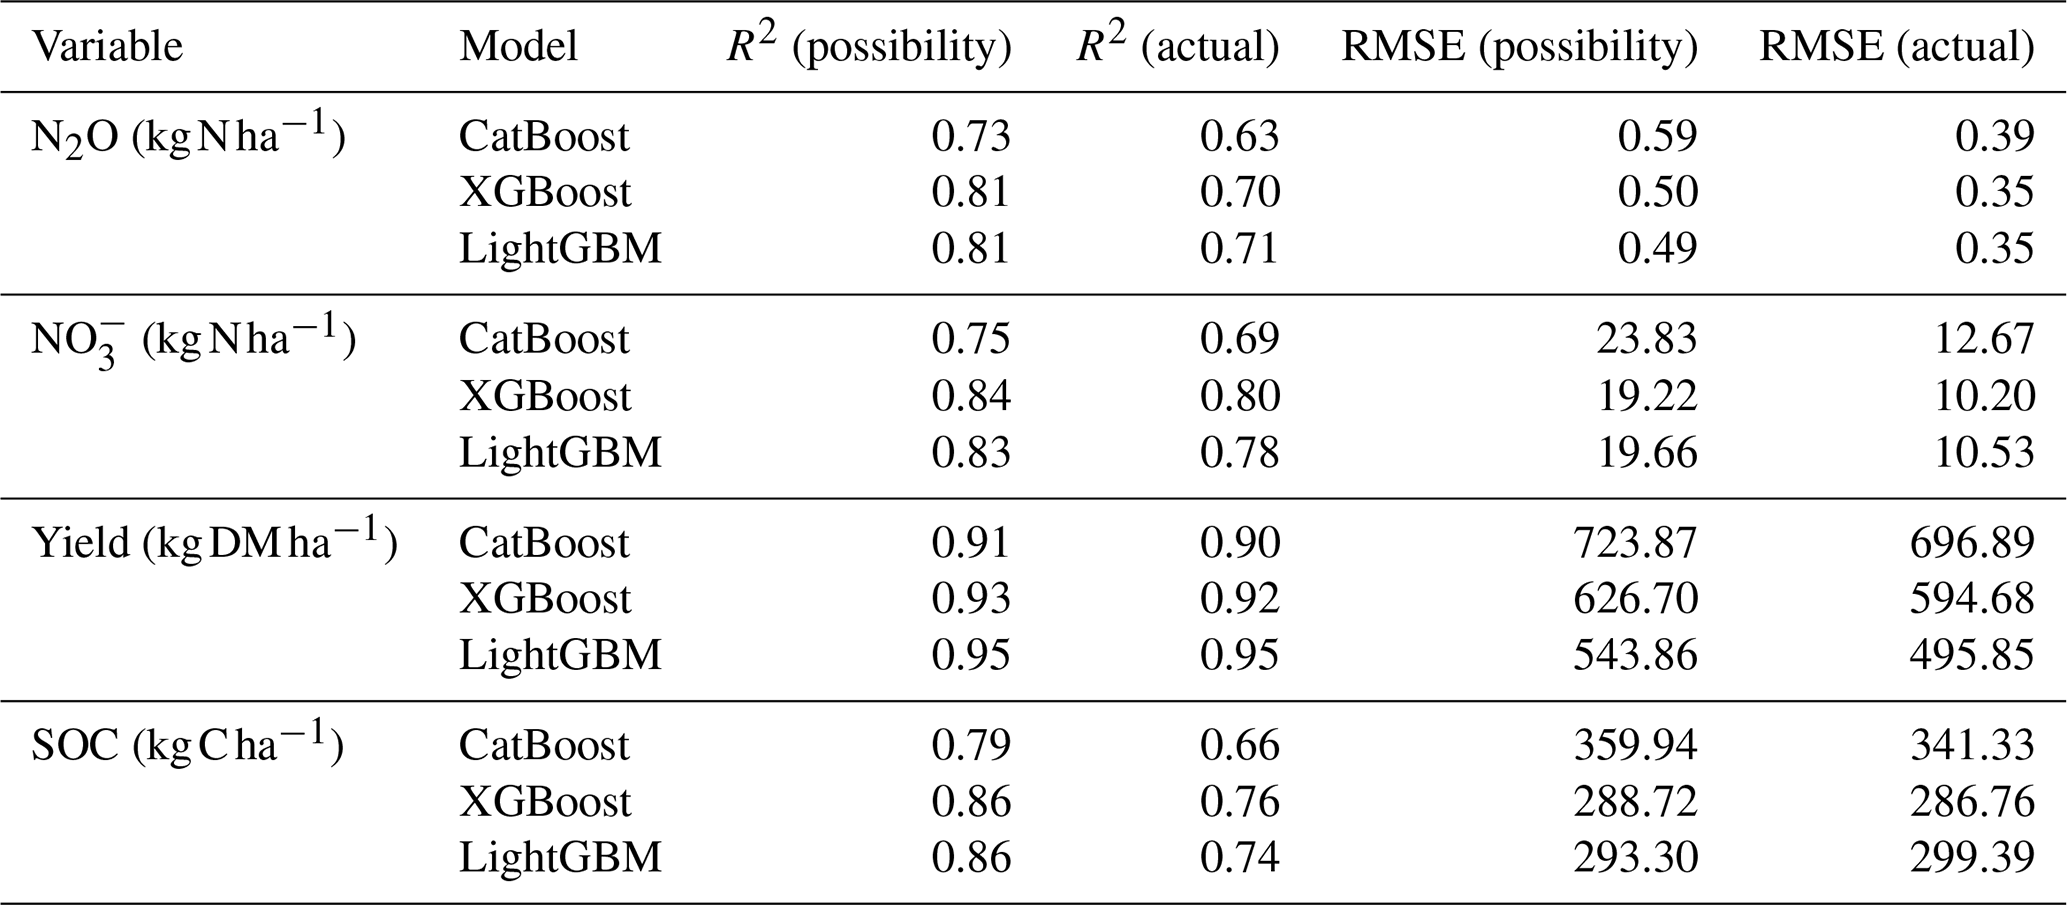
Note: “Possibility space” refers to model evaluation on the synthetic dataset, and “actual space” refers to evaluation on an independent dataset that reflects real-world conditions.
Figure 2A and B complements the quantitative metrics reported in Table 1 by providing a diagnostic comparison of predicted versus simulated values for all target variables across the three tree-based models. The scatter density plots show a strong alignment along the 1:1 line for yield and soil organic carbon, indicating stable predictions across the full value range. For nitrous oxide emissions and nitrate leaching, a wider dispersion is observed, particularly at higher values, reflecting the greater intrinsic variability of these processes and the presence of episodic extremes. Nevertheless, no pronounced systematic over or underestimation is evident, and prediction errors remain broadly symmetric.
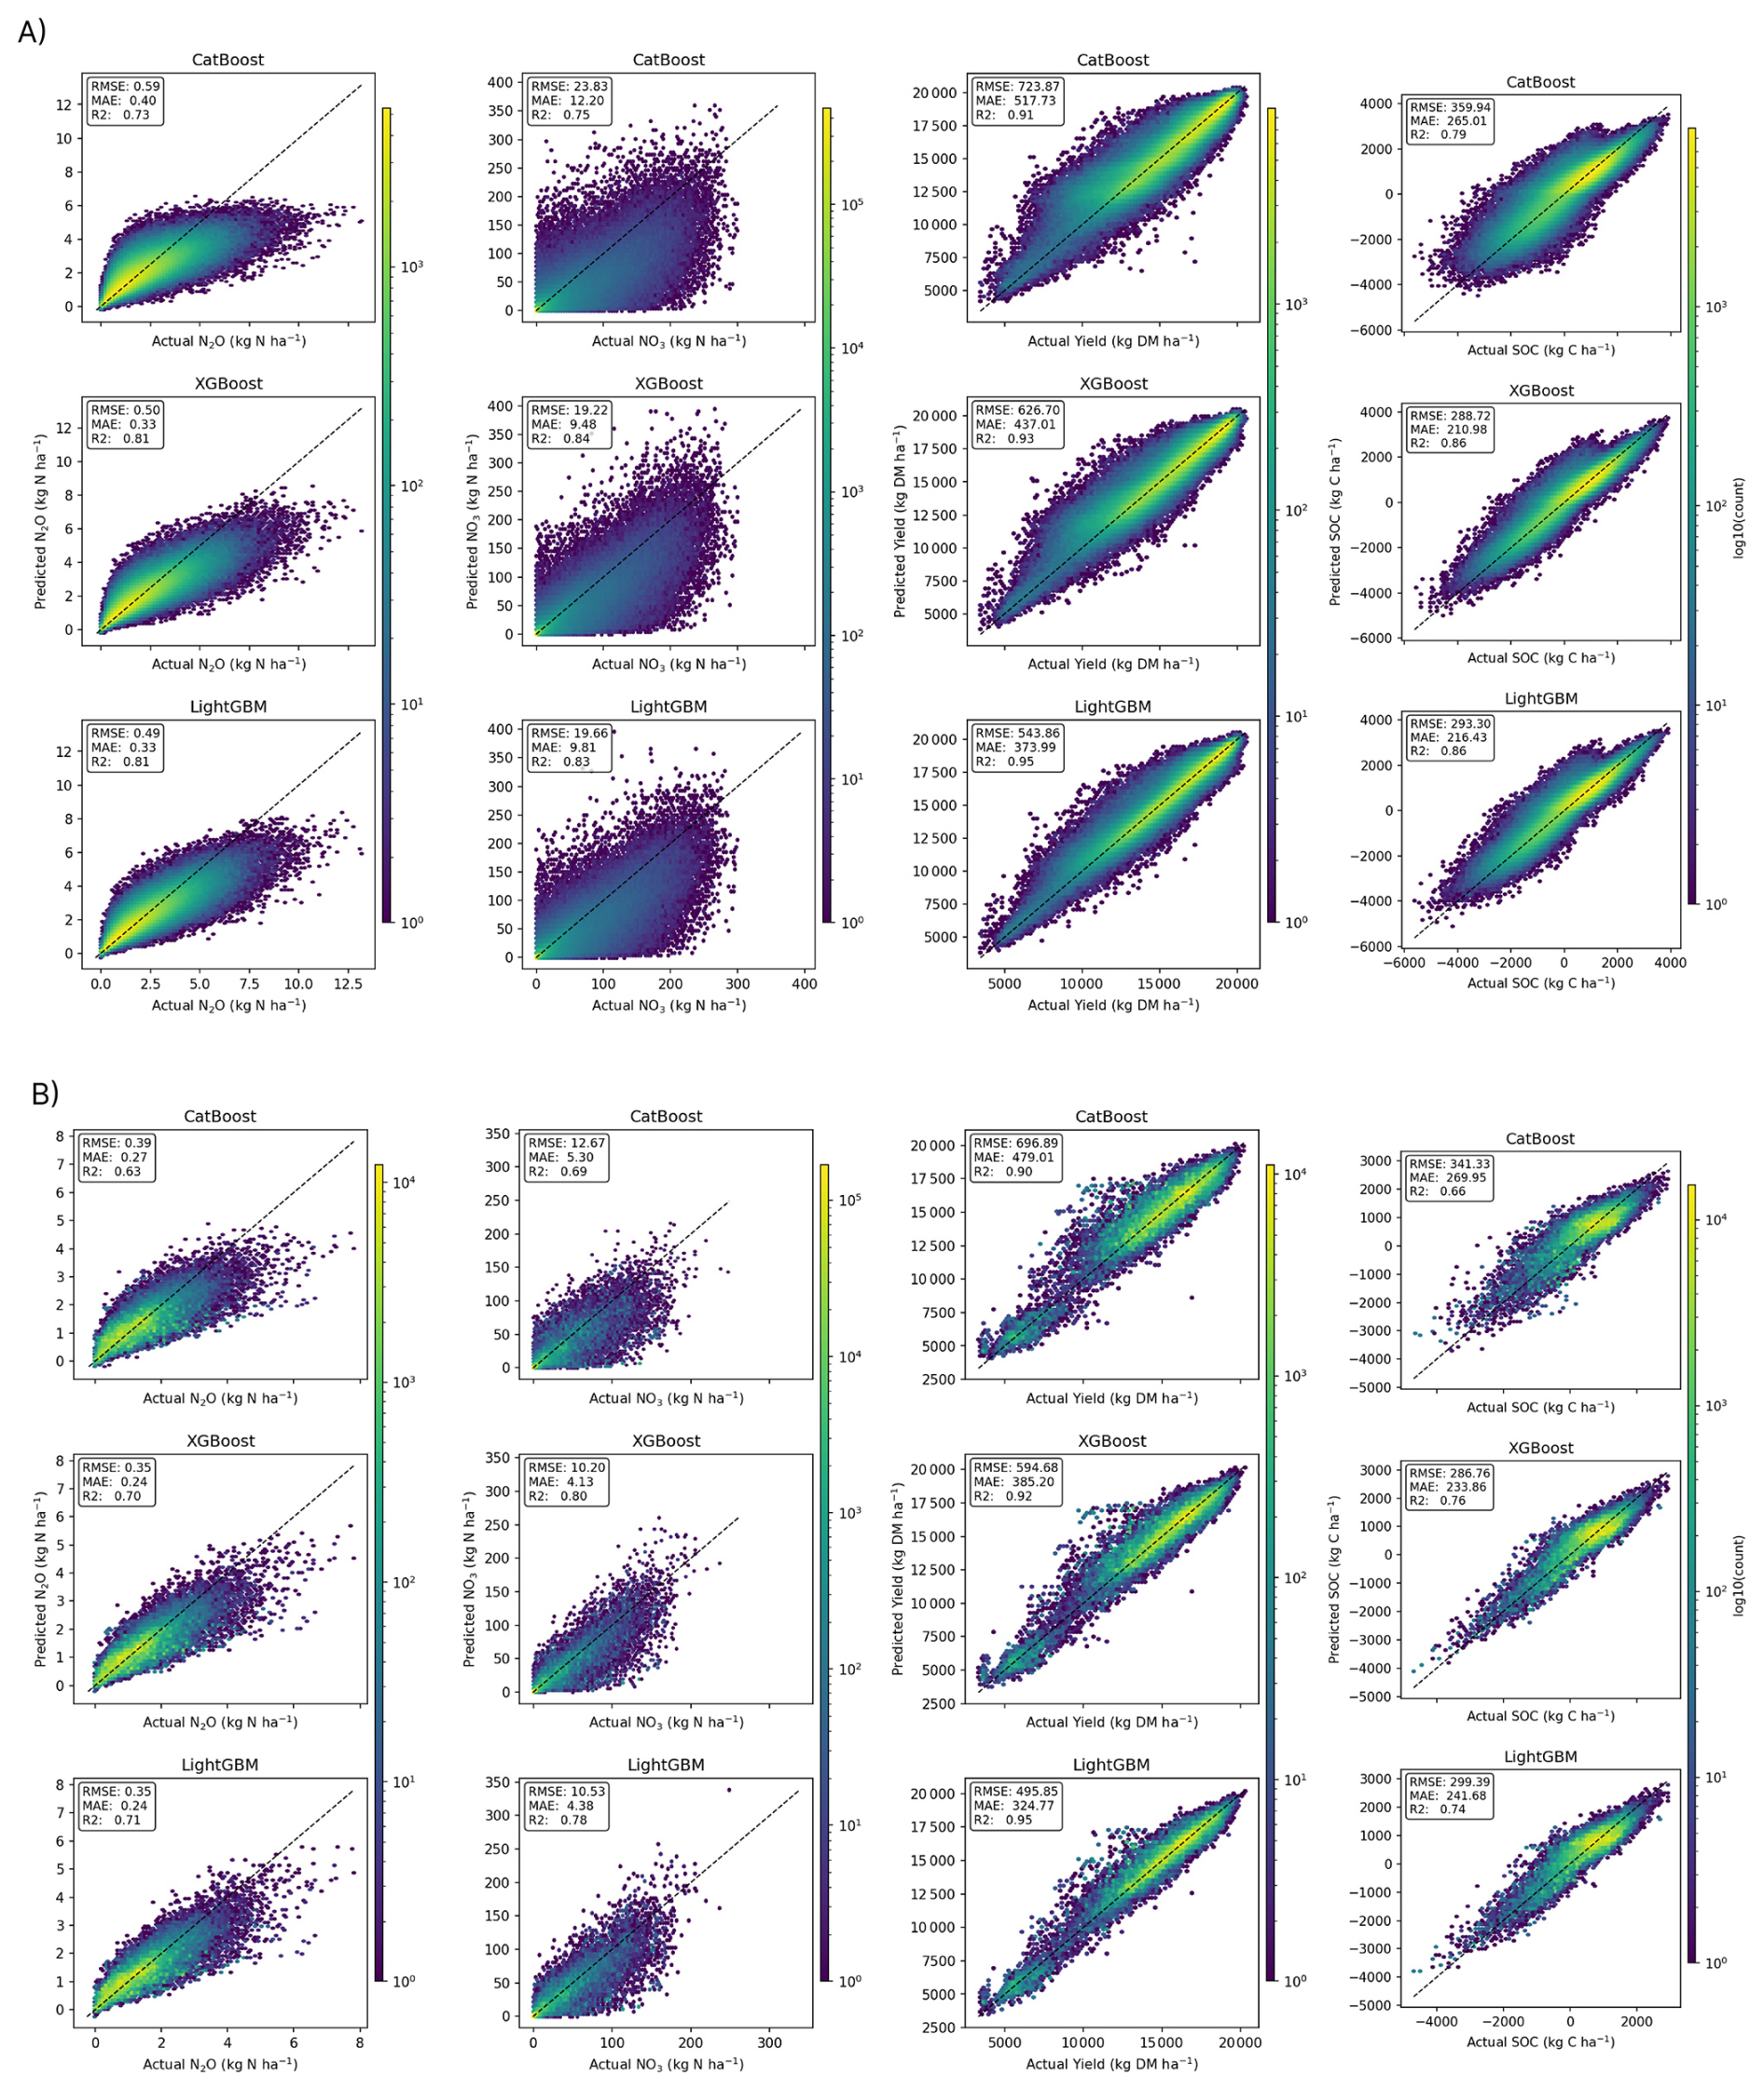
Figure 2Performance metrics for CatBoost, XGBoost, and LightGBM across the four predicted variables (N2O, , SOC, and yield). Panel (A) shows RMSE, MAE, and R2 in the possibility space, and (B) shows the corresponding metrics in the actual space.
Figure 3 presents the cross-validation results, indicating an extremely narrow range between the mean and standard deviation of the cross-validated R2 values. This shows a consistent performance across folds, suggesting minimal overfitting and strong generalization capacity. When model predictions on national data were compared to Denmark national yield data for winter wheat from Statistics Denmark (https://www.dst.dk, last access: 9 July 2026), the fully trained XGBoost model achieved an R2 of 0.77, indicating strong agreement between predicted and observed winter wheat yields (Fig. S1). This independent validation was limited to yield, as national-scale estimates for the remaining target variables are unavailable at the crop level. However, the surrogate model's close reproduction of LandscapeDNDC outputs across all target variables in cross-validation suggests reliable predictive performance beyond yield, though independent confirmation remains a priority for future work. This level of performance demonstrates the surrogate model's predictive skill for winter wheat yield at a national scale and, together with the strong cross-validation agreement across all target variables, supports the model's capacity to faithfully approximate LandscapeDNDC's process-based outputs. Since the surrogate inherits its representation of nitrogen and carbon dynamics from the parent model, whose process fidelity has been established through extensive prior validation, agreement with independent yield observations provides additional confidence in the overall modelling framework. Comprehensive validation of nitrogen and carbon indicators against independent estimates at the crop level remains a priority for future work as suitable datasets become available.
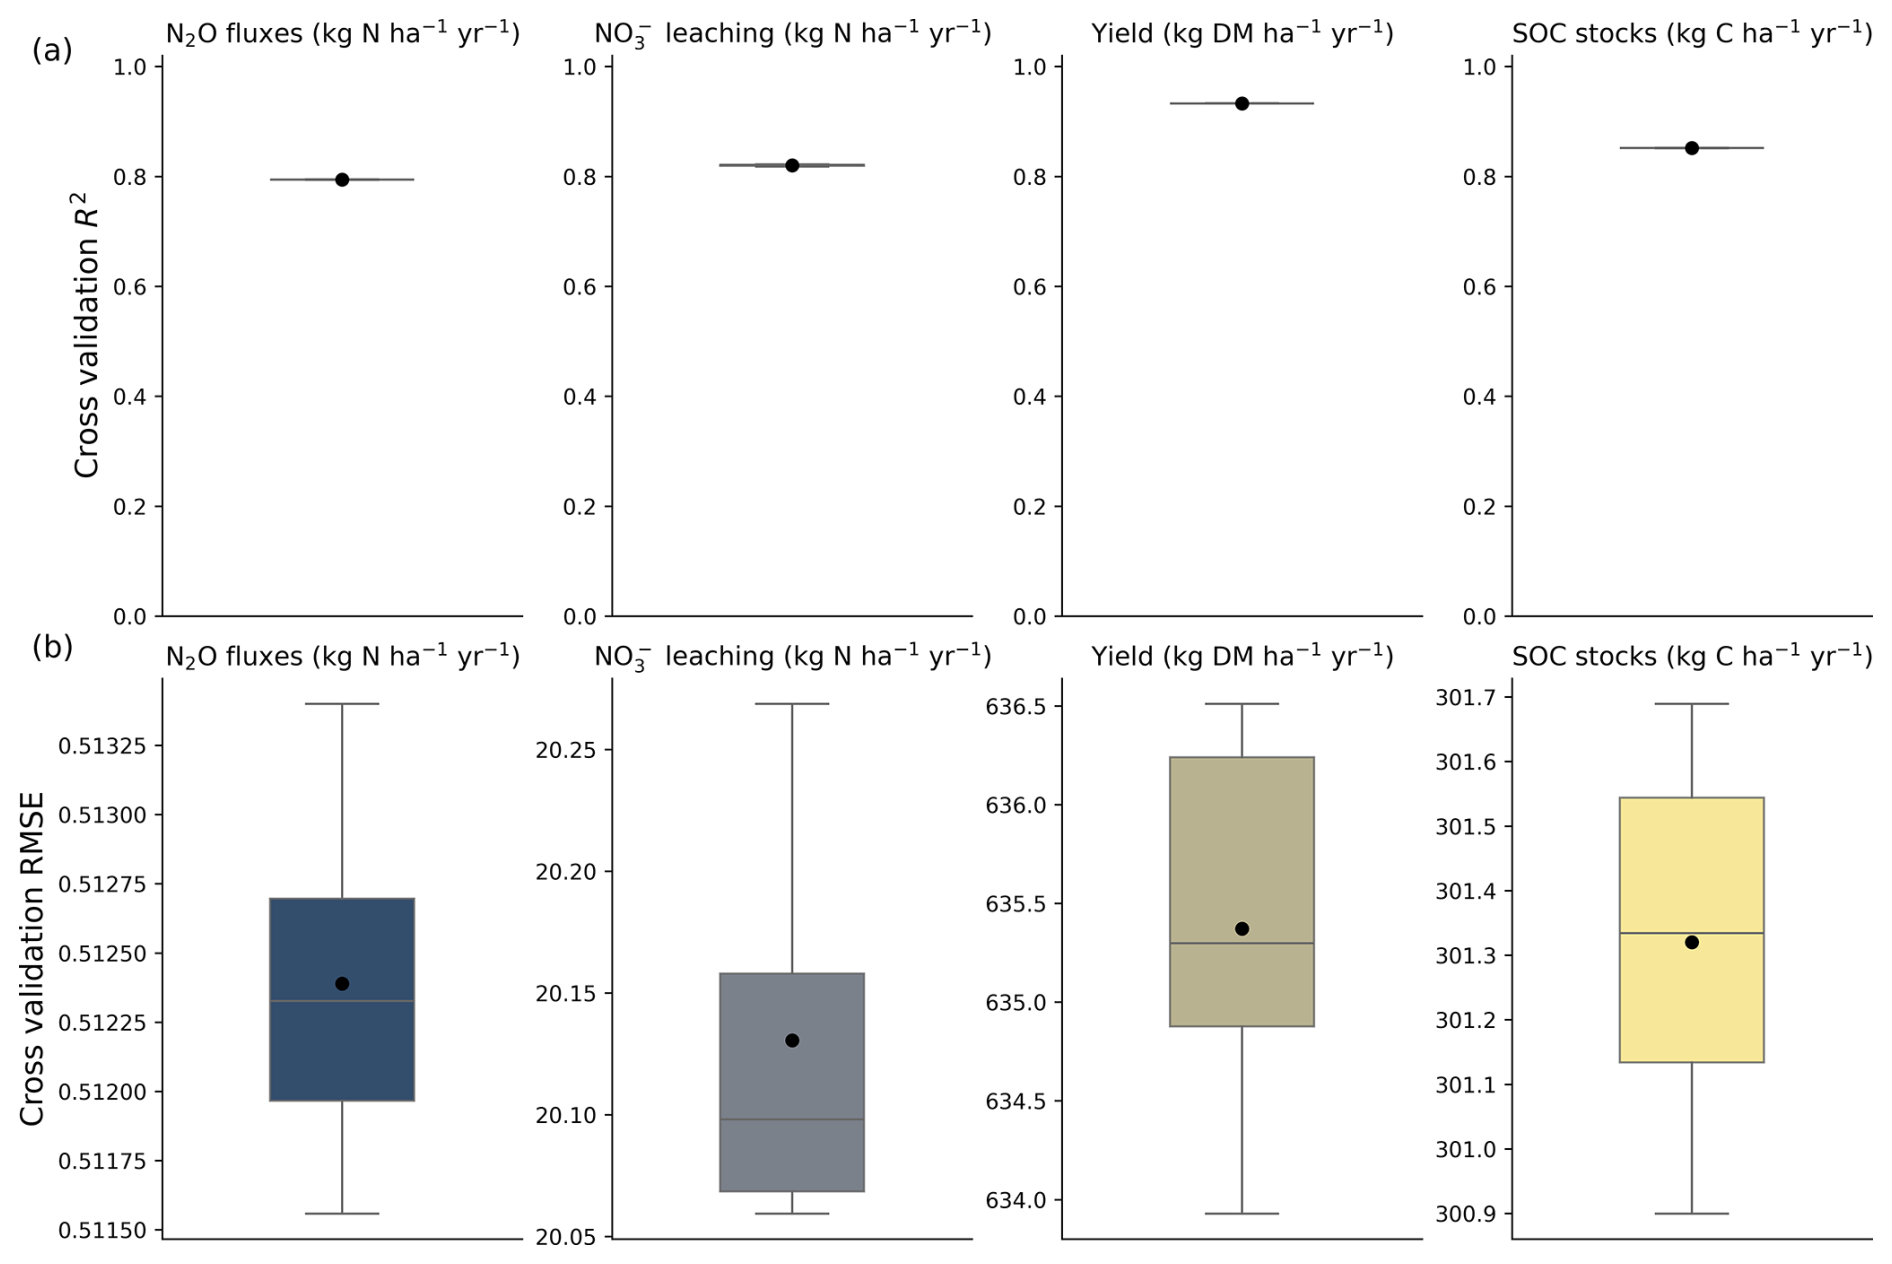
Figure 3Stability of R2 across 5-fold cross validation for N2O, , yield, and SOC. It illustrates the variability and consistency of model performance within each fold, providing insight into the robustness and generalizability of the selected model across different subsets of the data. We highlight how in (b) the variability is artificial due to the extremely small variation (e.g., 0.51150 and 0.51325 ).
An important highlight in the development of mLDNDC is the importance of incorporating seasonal climate descriptors and detailed soil variables into the feature set. Although the surrogate model produces annual predictions, several of the target variables, particularly nitrous oxide emissions, operate at much finer temporal scales and are strongly shaped by short term environmental fluctuations and episodic “hot moments”. Without information that captures seasonal temperature and precipitation dynamics, as well as conditions immediately surrounding nutrient applications, the model was unable to fully represent the drivers of these sub-annual processes. Early versions of the model relied primarily on soil texture classes alongside a limited selection of soil physical and chemical properties. Under this simplified representation, the surrogate achieved moderate performance, with R2 values of approximately 0.64 for N2O emissions, 0.70 for nitrate leaching, 0.88 for yield, and 0.65 for soil organic carbon. When the feature set was expanded to include seasonal precipitation and temperature patterns, climatic conditions during the crop growth period, and rainfall events before and after fertiliser and manure applications, along with key soil variables such as available carbon, soil nitrogen concentration, field capacity, wilting point, bulk density, and pH; the performance improved substantially. The corresponding R2 values increased to 0.81, 0.84, 0.93, and 0.86 for N2O, , yield, and SOC respectively. These improvements reinforce the well-established understanding that soil nitrogen availability, soil carbon content, moisture status, aeration, temperature, and pH jointly regulate nitrogen cycling processes and N2O production. This has been consistently reported in the literature, including (Wang et al., 2021a), that highlight the strong direct and indirect influence of soil carbon, soil nitrogen concentration, soil moisture, temperature, and pH on N2O emissions.
Another important finding to consider with respect to feature engineering is that response variable transformation to deal with heteroscedasticity improved model performance. For gradient-boosted decision trees, stabilising the distribution of the response variable enhances model performance because the underlying optimisation uses a stage-wise additive framework that is sensitive to the scale and variance of residuals. Friedman (2001), who introduced gradient boosting, emphasised that reducing skewness and variance asymmetry in the target variable improves the convergence and stability of boosted models. Kuhn and Johnson (2013) similarly showed that transformations improve predictive accuracy by reducing the influence of extreme values and enabling tree-based models to make more effective splits. A more recent study by Karwowska et al. (2025) show that data transformation can address data challenges in machine learning tasks.
The enhanced performance of mLDNDC after integrating these variables demonstrates that surrogate models can successfully capture the sensitivity of nitrogen and carbon processes to dynamic environmental conditions when provided with appropriately engineered features.
It is also important to note that neural networks were explored during the early stages of model development, but their performance was consistently poor across both the training and validation phases making them excluded from this study. This behaviour is consistent with observations in the broader machine learning literature, where conventional feed forward neural networks often struggle with tabular datasets, particularly when the underlying relationships are non-sequential and dominated by heterogeneous feature interactions rather than spatial or temporal dependency structures (Borisov et al., 2024; Shwartz-Ziv and Armon, 2022). Deep learning architectures such as Long Short-Term Memory network (LSTM), Gated Recurrent Unit (GRU), and Transformers typically offer advantages when modelling sequential or high dimensional unstructured data, which was not the case in this study. In contrast, tree-based ensemble methods such as XGBoost are well known for their superior performance on structured agricultural and environmental datasets, which likely explains their substantial advantage in the present application.
3.2 Model Interpretation Using SHAP
To interpret the associations and interactions underlying the model predictions for each target variable, we computed SHAP values for samples drawn randomly from synthetic observations (Fig. 4). The SHAP summary plots show the relative importance, intensity of influence, and model response on feature magnitude by showing the distribution of SHAP values for each feature across all samples. Since the surrogate is trained on LandscapeDNDC-generated outputs, the SHAP analysis presented here reflects the learned behaviour of the parent model rather than providing independent empirical evidence of biophysical processes. This is by design: the analysis serves to verify that the surrogate faithfully captures the process logic of the parent model rather than fitting to spurious patterns. The consistency of the resulting SHAP attributions with agronomically established relationships reported in the referenced literature provides confidence in both the surrogate's fidelity and the coherence of the parent model's process representations.
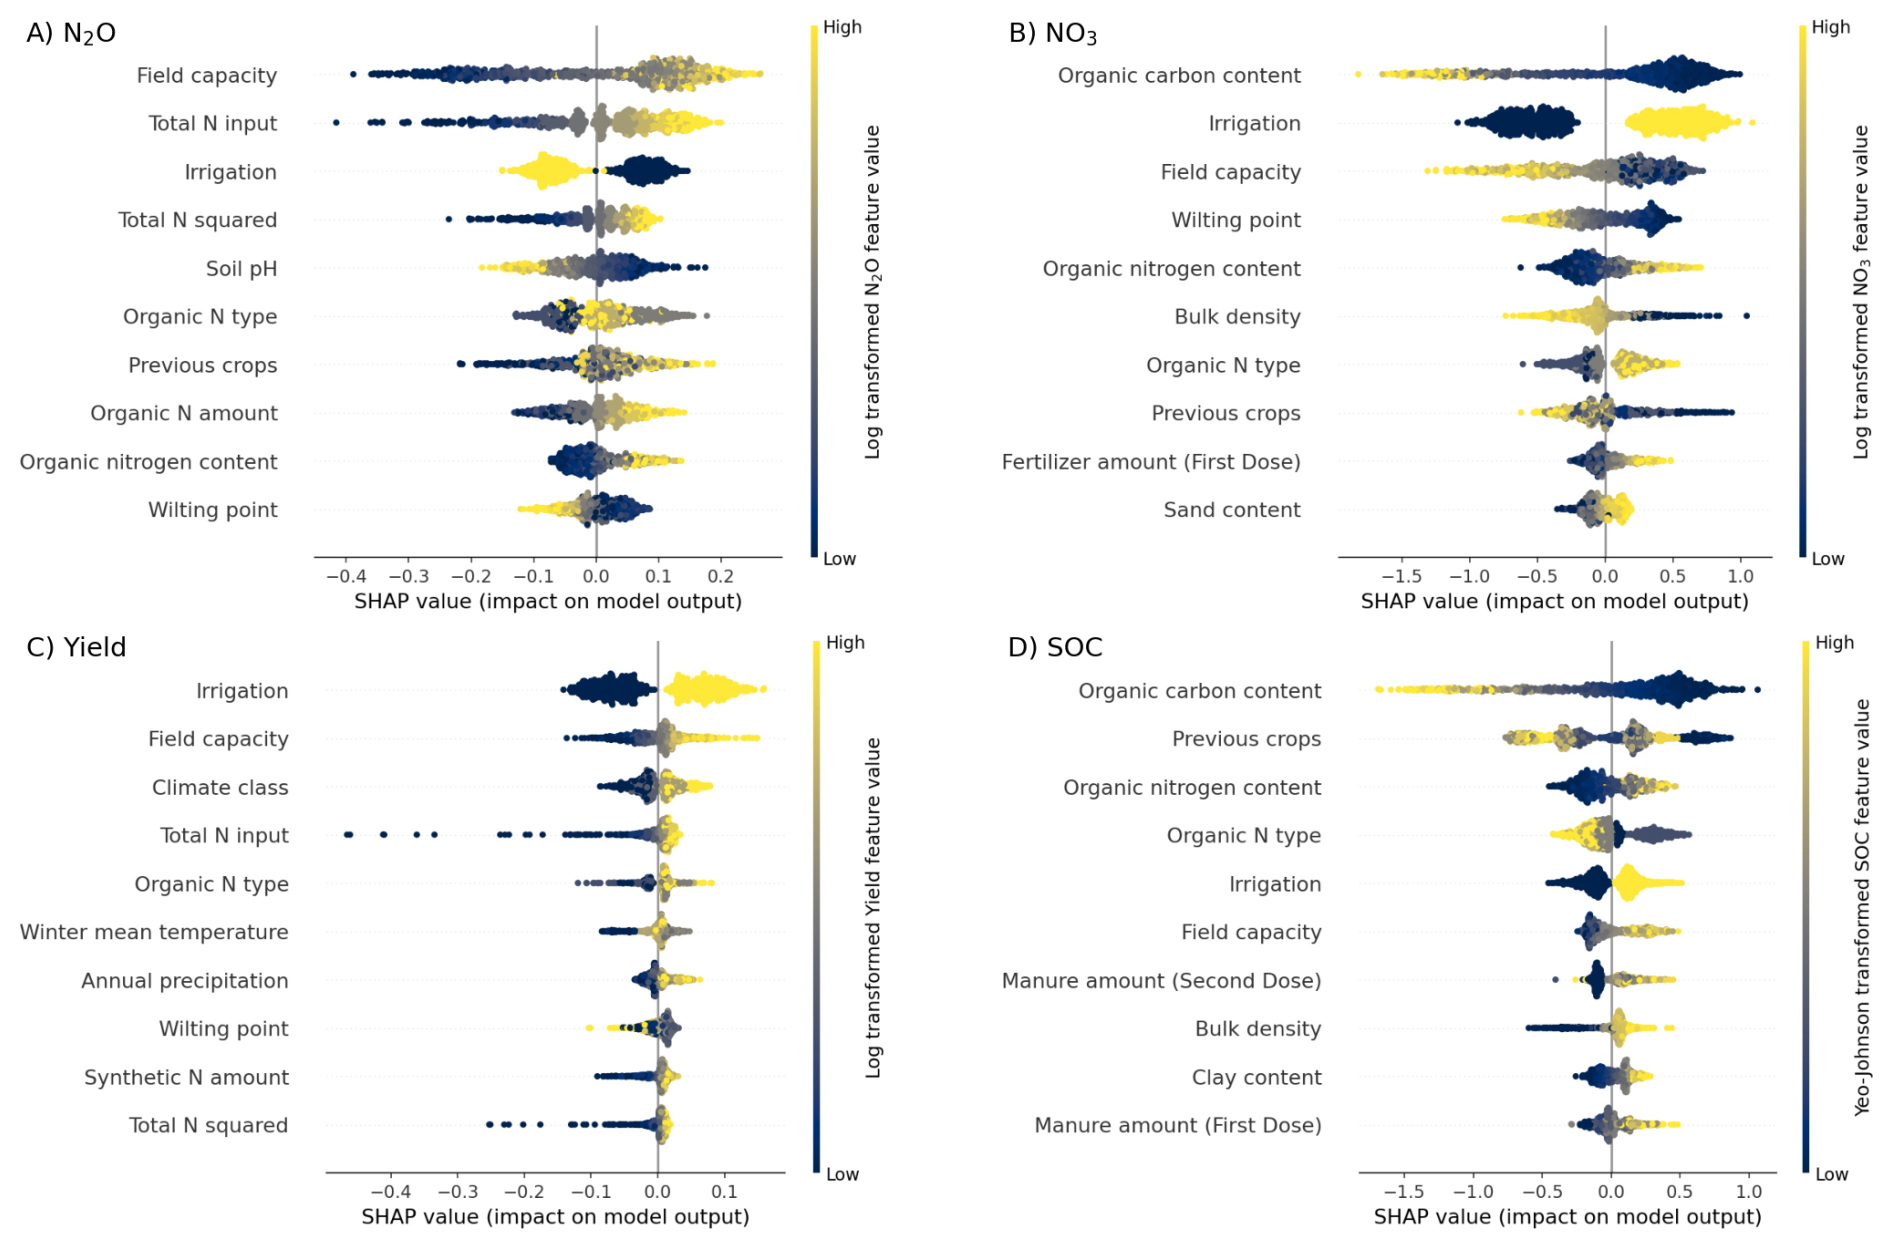
Figure 4SHapley Additive exPlanations (SHAP) values of the four predicted variables (N2O, , Crop Yield and SOC). The vertical position of a feature reflects its overall importance, while the horizontal spread and colour show the direction and strength of its effect across all observations.
Below we highlight the five key drivers per SHAP analysis for each one of the target variables:
N2O. The five most influential predictors of N2O emissions are field capacity, total N input (represented by both linear and squared terms to reflect the nonlinear increase in emissions at higher nitrogen application levels), irrigation, soil pH, and type of organic (e.g., slurry, farmyard manure).
Soils with high water holding capacity tend to have higher predicted N2O emissions, as indicated by positive SHAP values. This is consistent with the central role of soil moisture in regulating nitrification and denitrification via controlling soil oxygen diffusion and redox conditions. N2O fluxes increase as water-filled pore space approaches field capacity (Ciarlo et al., 2006; Diba et al., 2011). At this point, anaerobic microsites become more frequent but complete reduction to N2 is still limited (Ciarlo et al., 2006). Total N input and its squared term show that higher fertiliser N rates significantly increase predicted N2O emissions. The squared term captures the well-known non-linear, accelerating response of N2O emissions to N addition. Global meta-analyses report that N2O emissions rise disproportionately at high N rates, with emission factors increasing when fertiliser inputs exceed crop demand (Maaz et al., 2021; Shcherbak et al., 2014). Therefore, the model behaviour aligns with the established understanding that efficient N management is critical for N2O mitigation.
Interestingly, Irrigation, encoded as a binary factor, shows that irrigated sites (high feature value) tend to have negative SHAP values, implying lower predicted N2O emissions than non-irrigated sites. Many experiments report increased N2O under excessive wetting, especially when soils remain close to saturation (Huang and Gerber, 2015). However, there is also evidence that controlled irrigation around field capacity can suppress denitrification and N2O emissions compared to extremes of very dry or very wet conditions, particularly in drip-irrigated systems where water is applied in small doses (Zhang et al., 2024).
Soil pH is strongly negatively associated with N2O emissions: higher pH values produce negative SHAP values, indicating reduced predicted emissions. This aligns with experimental and meta-analytic evidence that liming acidic soils enhances the activity of N2O reductase and shifts denitrification end-products from N2O to N2, reducing total N2O emissions (Hénault et al., 2019; Wang et al., 2021b; Žurovec et al., 2021).
Organic N type, a categorical variable describing the form of organic fertiliser, also ranks among the leading predictors. Some organic N types are associated with positive SHAP values (higher N2O), while others are associated with negative SHAP values. This is in line with comparative studies that show different fertiliser forms and C:N ratios alter N turnover and gaseous losses (Yao et al., 2022).
NO leaching. The dominant predictors of leaching are organic carbon content, irrigation, field capacity, wilting point, and organic N content. Low soil organic carbon content corresponds to positive SHAP values and higher predicted leaching losses, whereas high organic carbon content tends to reduce leaching. This agrees with experimental studies showing that increased soil organic matter can enhance microbial immobilisation of nitrate and improve soil structure, thereby reducing leaching losses (Malcolm et al., 2019).
The capacity to irrigate is strongly positively associated with leaching, with irrigated fields showing large positive SHAP values. Global meta-analyses of irrigated systems demonstrate that nitrate leaching risk is inherently high when water inputs exceed crop demand, and that both irrigation amount and timing are key determinants of leaching losses (Quemada et al., 2013). Thus, the model therefore captures the trade-off between yield benefits of irrigation and increased risk of leaching.
Both field capacity and wilting point, clearly demonstrates the effects of soil water holding properties and texture. Soils with low field capacity and low wilting point (i.e., coarse, free-draining soils) have positive SHAP values and higher predicted leaching. In contrast, finer textured soils with greater water holding ability tend to have lower losses. This is consistent with field and meta-analytic studies that link high leaching risks to sandy or structurally weak soils with poor water and nutrient retention, especially in areas of high rainfall or irrigation (Pacheco and Sumreen Hina, 2024; Schuster et al., 2022).
Organic N content, representing the amount of organic N in the soil, is positively associated with leaching. High organic N content increases the pool of mineralisable N, which under moist conditions and sufficient aeration leads to increased nitrate formation and a larger leachable pool. Recent work has shown that soil C and N contents, and their ratios, are pivotal in regulating mineralisation, immobilisation, and nitrate availability (Kuśmierz et al., 2023; Ma et al., 2018).
Winter wheat yield. The five leading predictors of yield are irrigation, field capacity, climate class, total N input (including its squared term), and organic N type. Irrigation has large positive SHAP values when the field is irrigated, indicating substantial yield benefits relative to non-irrigated conditions. Meta-analyses of wheat production consistently show that well managed irrigation increases grain yield and water productivity compared to rainfed systems, especially in water-limited environments. Reported yield gains range from 10 %–30 % depending on deficit level and environment (Li et al., 2022; Ren et al., 2025; Zhou et al., 2022). Therefore, the model performance is fully aligned with empirical evidence. Field capacity emerges as a critical soil property, with higher field capacity associated with positive SHAP values and higher predicted yields. Soils with greater plant-available water storage buffer crops against intra-seasonal drought, thereby stabilising and increasing yield. Recent analyses of long-term experiments and meta-studies on soil water storage (Lessmann et al., 2022; Slessarev et al., 2022) confirm that improved soil structure and water retention are strongly linked to wheat yield and stability.
Climate class, which summarises the prevailing temperature and precipitation regime through aridity index classification, is also highly influential. This mirrors established knowledge that winter wheat yields in northern Europe are strongly constrained by temperature and water availability during critical growth stages, and that inter-annual climate variability is a major driver of yield variation.
Total N input, represented by both linear and squared terms, shows the expected yield response curve as moderate N rates increase predicted yield (positive SHAP values) while very high rates are associated with neutral or even negative contributions once the squared term dominates. Trials of yield response in Scandinavia including Denmark demonstrate that grain yield increases with N up to an economically optimal rate. Beyond this rate, additional N has little effect on yield but increases environmental losses (Styczen et al., 2020; Vogeler et al., 2022). The model captures this diminishing return and embeds it through the quadratic N term. In the case of Organic N type, the influence on the prediction is based on the different C:N ratios of the different organic manure applied.
Changes in soil organic carbon. The five most important predictors of SOC changes are initial organic carbon content, previous crops, organic nitrogen content, organic N type, and irrigation. The SHAP pattern for organic carbon content shows that soils with low initial SOC tend to have positive SHAP values, indicating a greater predicted SOC gain. In contrast, soils with high initial SOC often have negative contributions. This is consistent with recent global analyses demonstrating that SOC-poor soils generally exhibit higher sequestration potential and gain carbon more readily in response to improved management than SOC-rich soils, which are closer to saturation (Lessmann et al., 2022; Slessarev et al., 2022).
Previous crops, representing the two crops grown before winter wheat, have a strong effect on SOC. Long-term rotation experiments and recent global syntheses show that diversified rotations especially with legumes enhance SOC stocks and soil health relative to continuous cereal systems (Al-Musawi et al., 2025; Yang et al., 2024).
Organic nitrogen content, which reflects cumulative organic inputs and soil organic N, contributes positively to SOC predictions when high. This is consistent with evidence that increased organic inputs from manure, crop residues, or combined mineral-organic fertilisation increase soil C stocks while also supporting higher yields (Ma et al., 2018). The influence of organic N type is based on the C:N ratios of the applied manure.
Finally, there is positive relationship between irrigation and SOC. Irrigated sites showed higher predicted SOC than non-irrigated sites. Meta-analyses of irrigated agriculture indicate that irrigation generally increases SOC stocks, especially in surface soils, by promoting greater biomass production and residue return. However, the magnitude of this effect depends on climate and management practices (Antón et al., 2022; Emde et al., 2021; Sun et al., 2024). The SHAP result suggests that, in the Danish context considered here, irrigation contributes to higher SOC through enhanced primary productivity and associated organic input.
3.3 Baseline-to-Optimised Differences at the National Scale
3.3.1 Changes in N2O Emissions, NO Leaching, Grain Yield, and SOC
Figure 5a illustrates the spatial distribution of the optimisation benefits for N2O emissions across Denmark. Because the optimisation objective for both N2O and is minimisation, the percentage changes shown on the map indicate the extent to which emissions can be reduced relative to the baseline (Fig. S6). Depending on their location within the 10 km×10 km grid, many grid cells across the country show reductions ranging from approximately 15 % to more than 35 %. Figure 5e's national-level summary further confirms this pattern. The N2O emission bar indicates that an average reduction of about 26 % can be achieved through optimised cropping system management.
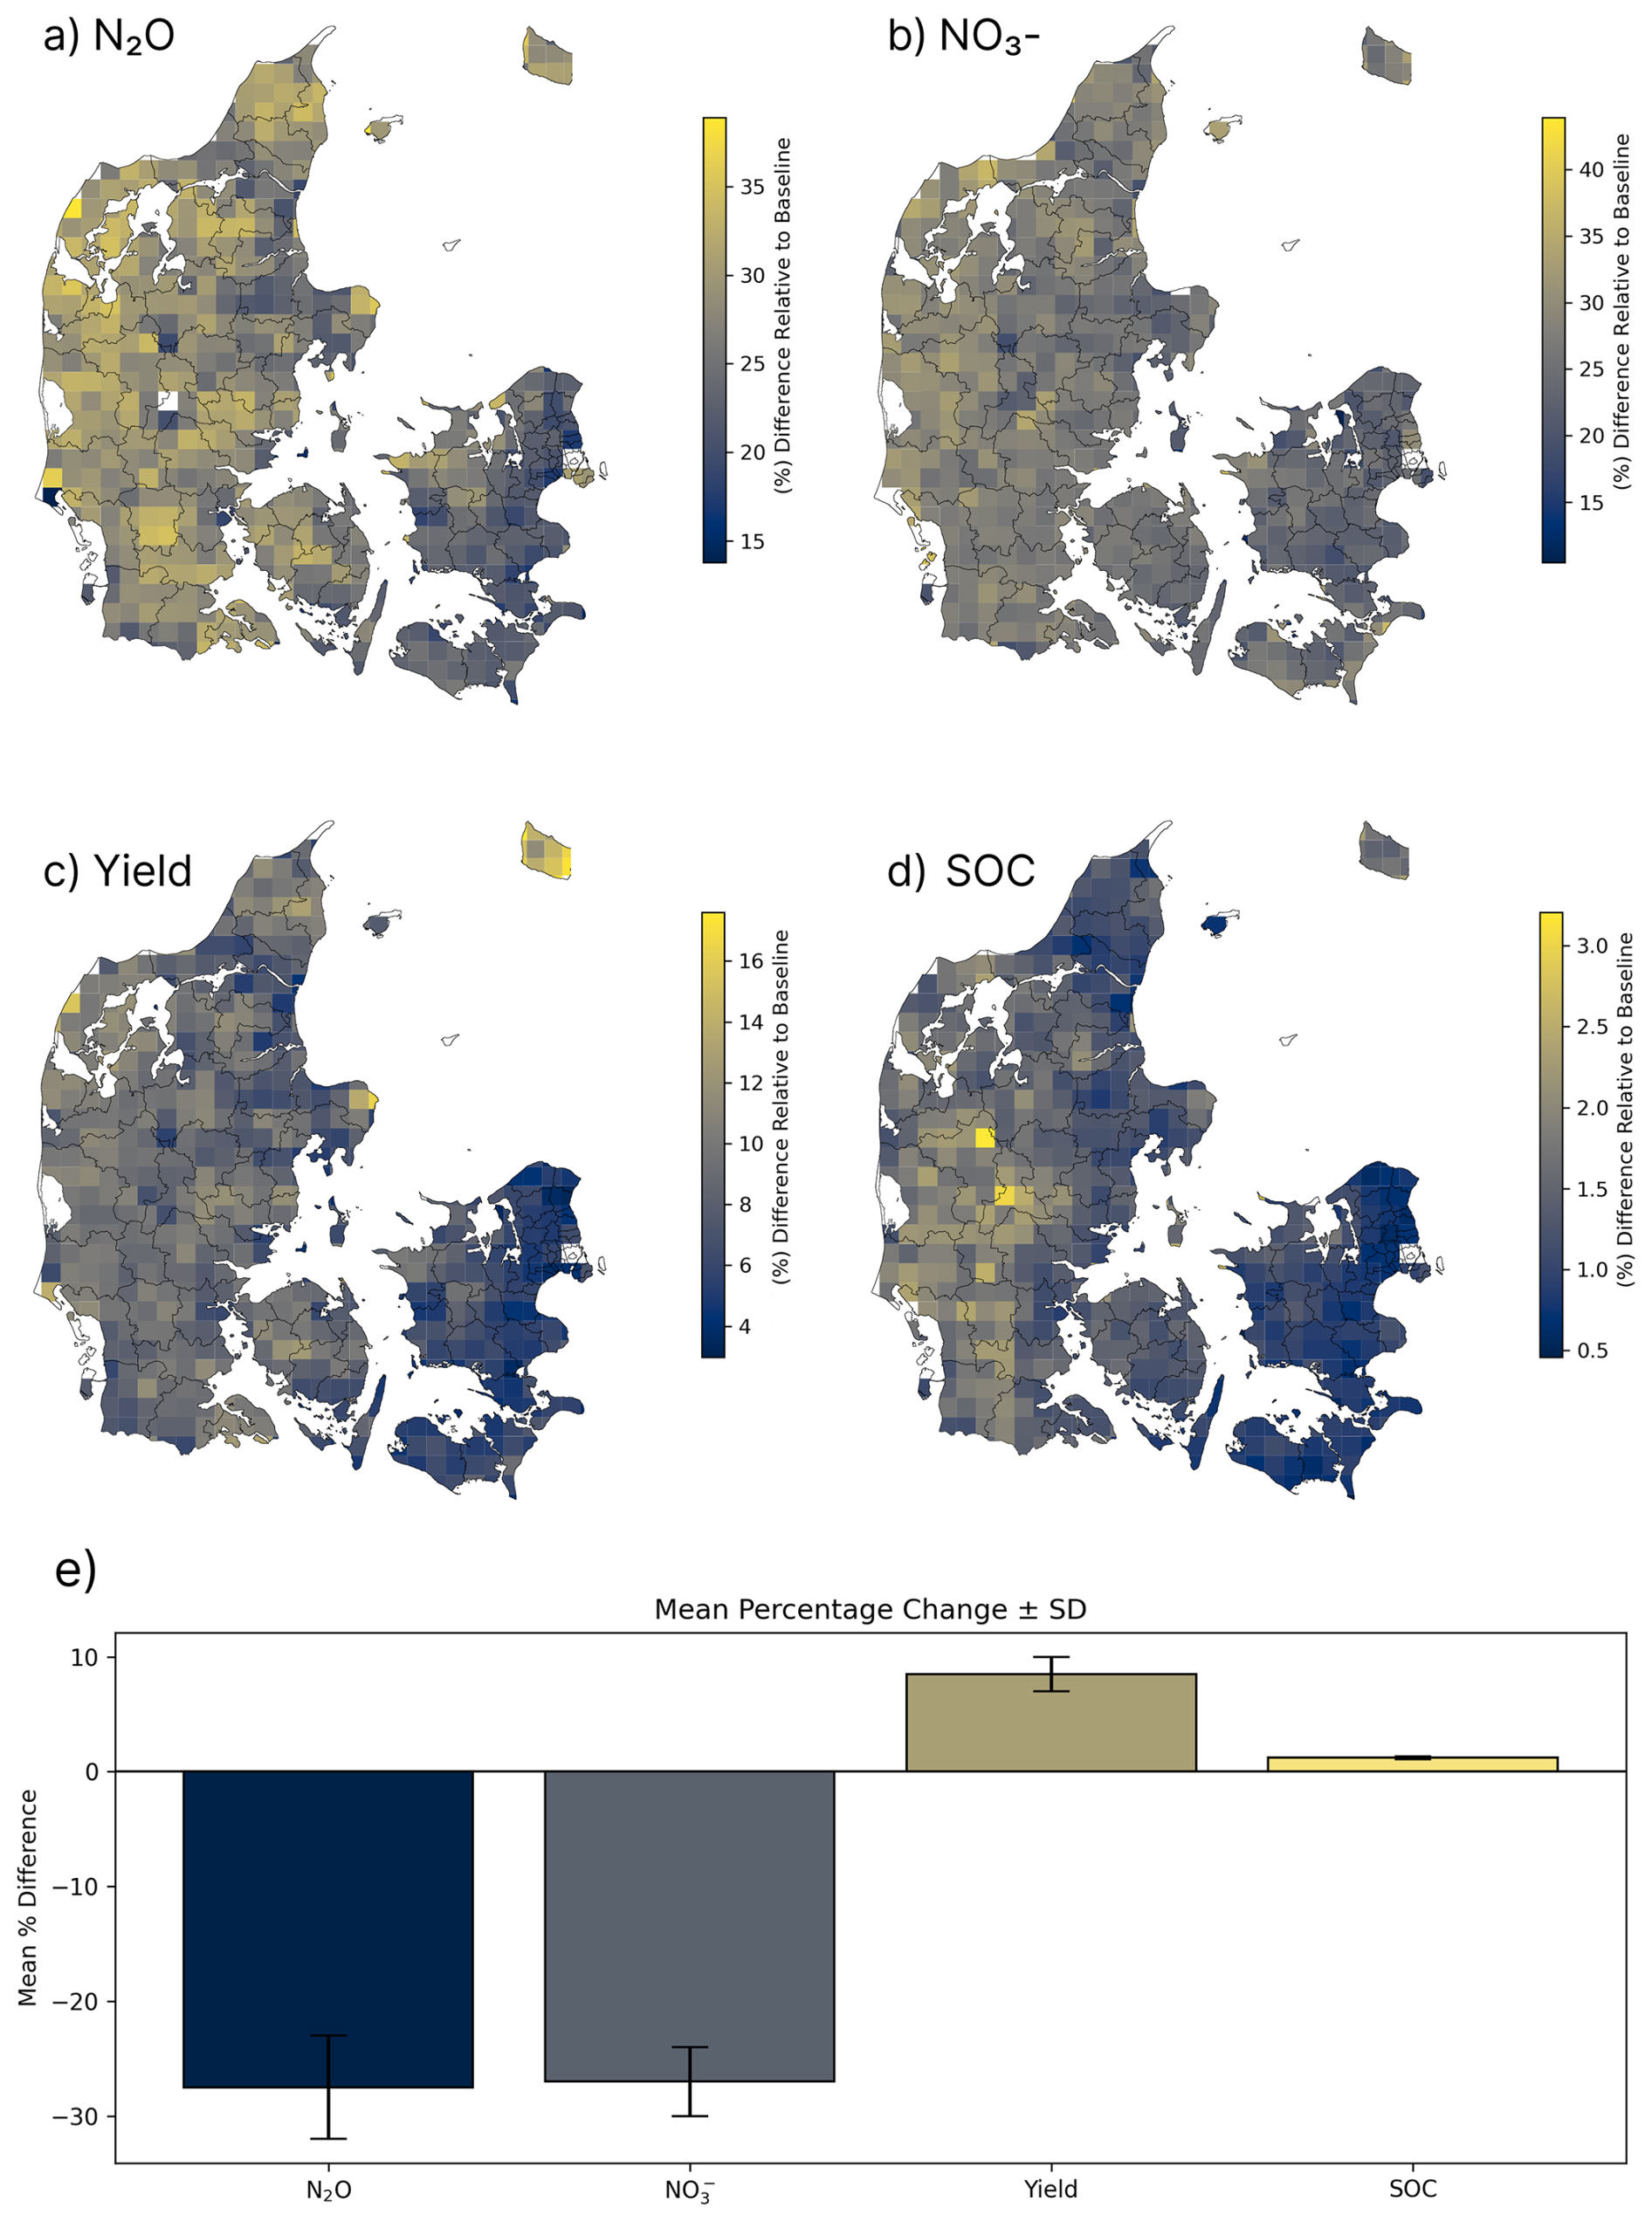
Figure 5Panels (a)–(d) show the percentage difference between optimised management and the baseline scenario over the 10 year period from 2011–2020, aggregated to a 10 km×10 km grid, with decreases shown for N2O emissions and leaching and increases shown for yield and soil organic carbon. Panel (e) presents the corresponding mean percentage change at the national scale.
Similarly, Fig. 5b shows that nitrate leaching can also be substantially reduced. In some grid cells, reductions reach up to about 40 %, while most areas show improvements of roughly 30 %. The national aggregation in Fig. 5e indicates an average reduction of approximately 27 %. These reductions in both N2O emissions and leaching is achieved without compromising yield or soil organic carbon, demonstrating the potential for environmentally beneficial optimisation of Danish cropping systems.
The optimization objective for yield and SOC is maximisation. The spatial pattern in Fig. 5c reveals that crop yield can increase by up to 16 % in some grid cells, with most areas showing improvements of around 10 %. The national average, shown in Fig. 5e, is approximately 8 %. Importantly, these gains are achieved without increasing N2O emissions or leaching, indicating that higher productivity can coexist with reduced environmental impacts.
SOC shows a similar pattern of improvement. As illustrated in Fig. 5d, SOC can be increased by up to 3 % in some areas, with most regions showing increases of around 2 %. The national mean, as reflected in Fig. 5e, is about 1 %, which is close to the noise level of measurement and should be interpreted as marginal improvements rather than large changes. Although this magnitude is smaller than the yield response, it represents a meaningful improvement given the slow dynamics of soil carbon accumulation.
These results demonstrate that optimised management strategies can simultaneously reduce N2O emissions and leaching while enhancing crop yield and SOC. It further highlights the potential for integrated, multi-objective optimisation to support both environmental and agronomic goals within Danish cropping systems. The percentage of specific management changes in each 10 km×10 km grid are shown in Fig. S5.
3.3.2 Nitrogen and Greenhouse Gas Performance Indicators
Nitrogen Use Efficiency
In addition to the environmental and productivity gains identified in the multi-objective optimisation, the results also demonstrate clear improvements in nitrogen use efficiency (NUE) defined as follows:
where Y is the crop yield (kg N ha−1), and FN is the amount of fertiliser nitrogen applied (kg N ha−1).
As shown in Fig. 6, optimised management strategies increase NUE across most regions of Denmark, with national level gains averaging approximately 10 % relative to the baseline. This indicates that the optimised cropping systems can produce more yield per unit of nitrogen applied, reflecting more efficient nitrogen utilisation without increasing N2O emissions or nitrate leaching. Such improvements in NUE align with the broader goals of enhancing nitrogen productivity while reducing surplus nitrogen in agricultural landscapes.
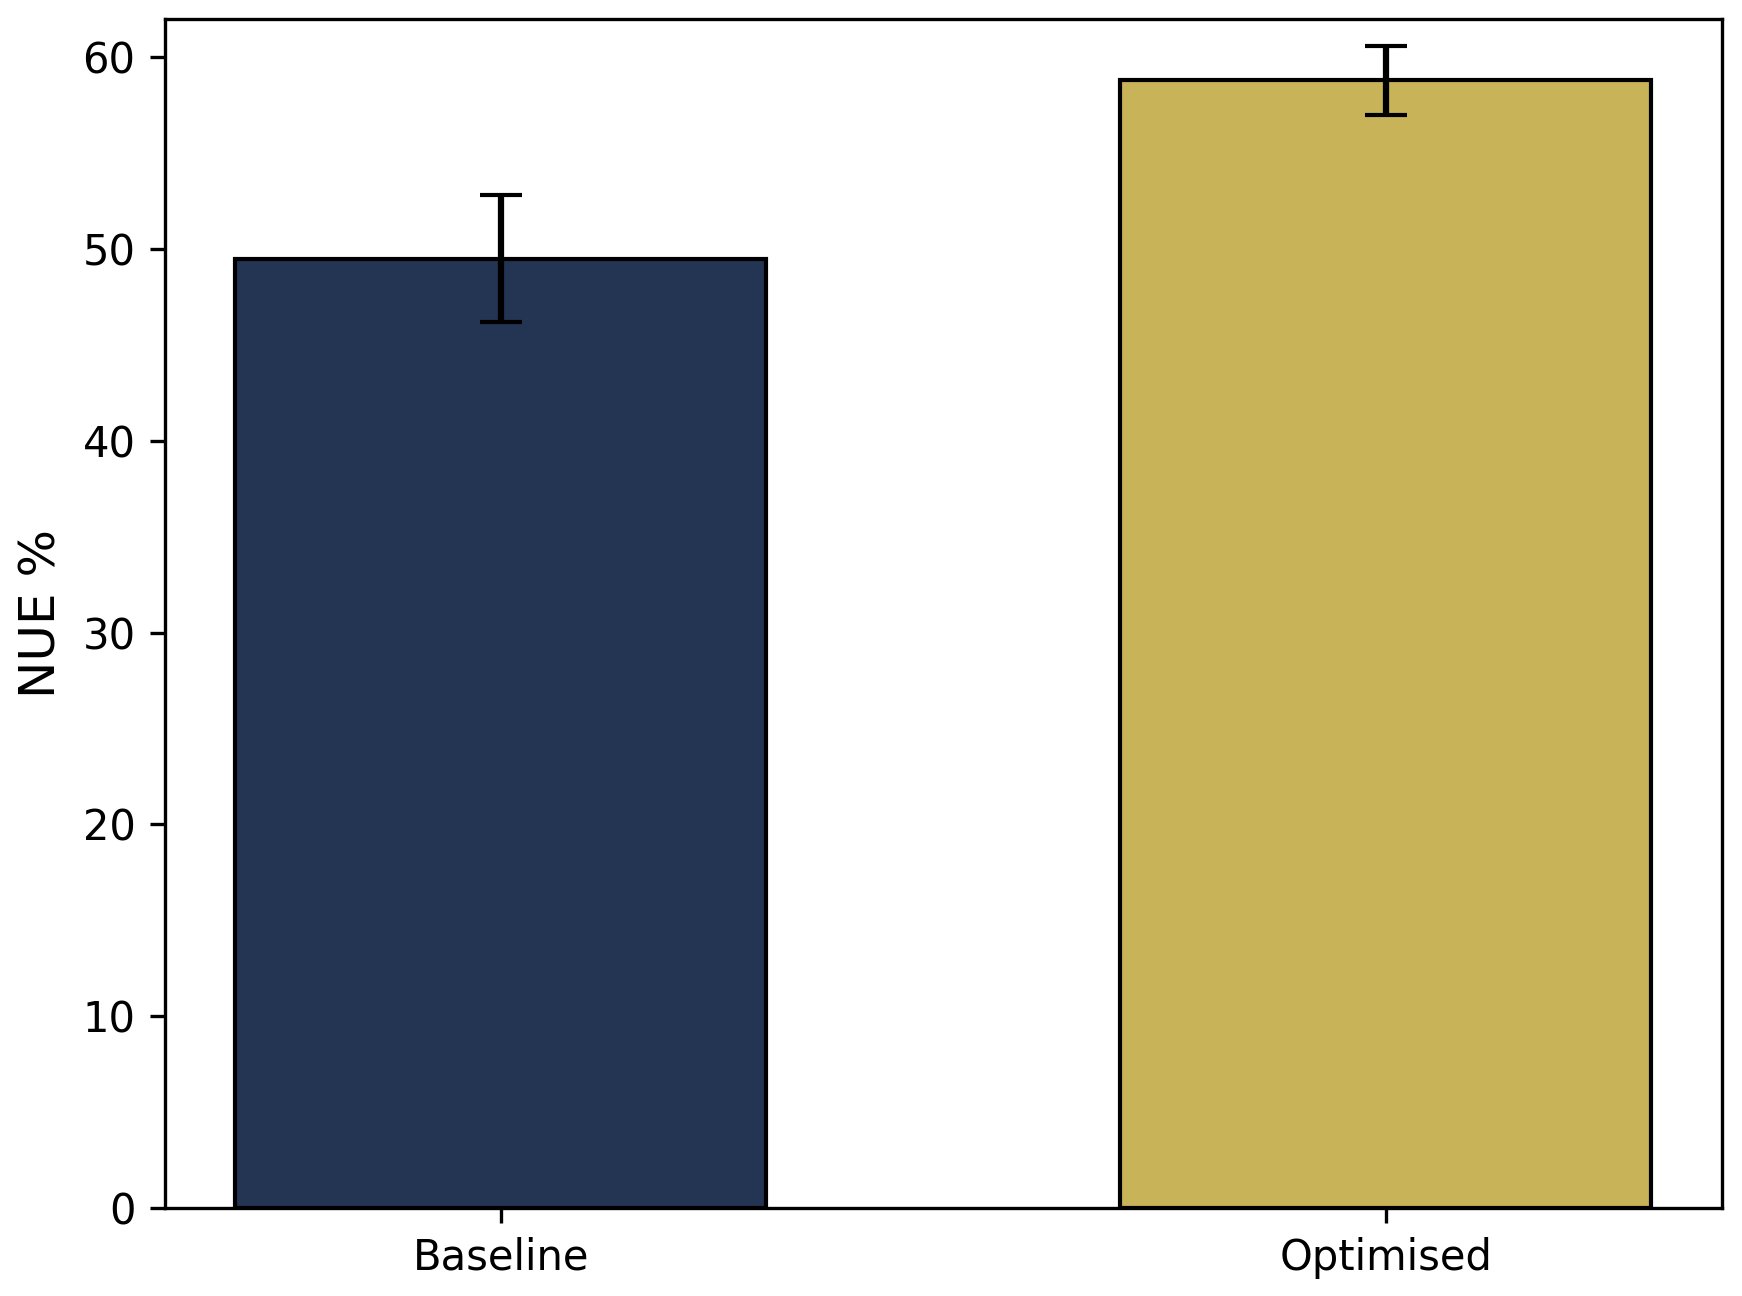
Figure 6Nitrogen Use Efficiency of baseline and optimized management over 10 years (2011–2020).
Soil Net GHG Balance
Figure 7 compares the CO2-equivalent (CO2-eq) soil-net GHG balance of the baseline and optimised management scenarios over the 10 year period 2011–2020. The optimised scenario exhibits a substantially more negative CO2-eq value than the baseline, indicating greater net climate benefits through enhanced carbon sequestration and reduced emissions. Moreover, the wider negative range shown by the error bar suggests that optimisation improves mitigation potential consistently across spatial and inter-annual variability over the 10 year period. Overall, the results demonstrate that systematically optimising management practices can meaningfully strengthen the climate mitigation capacity of Danish cropping systems.
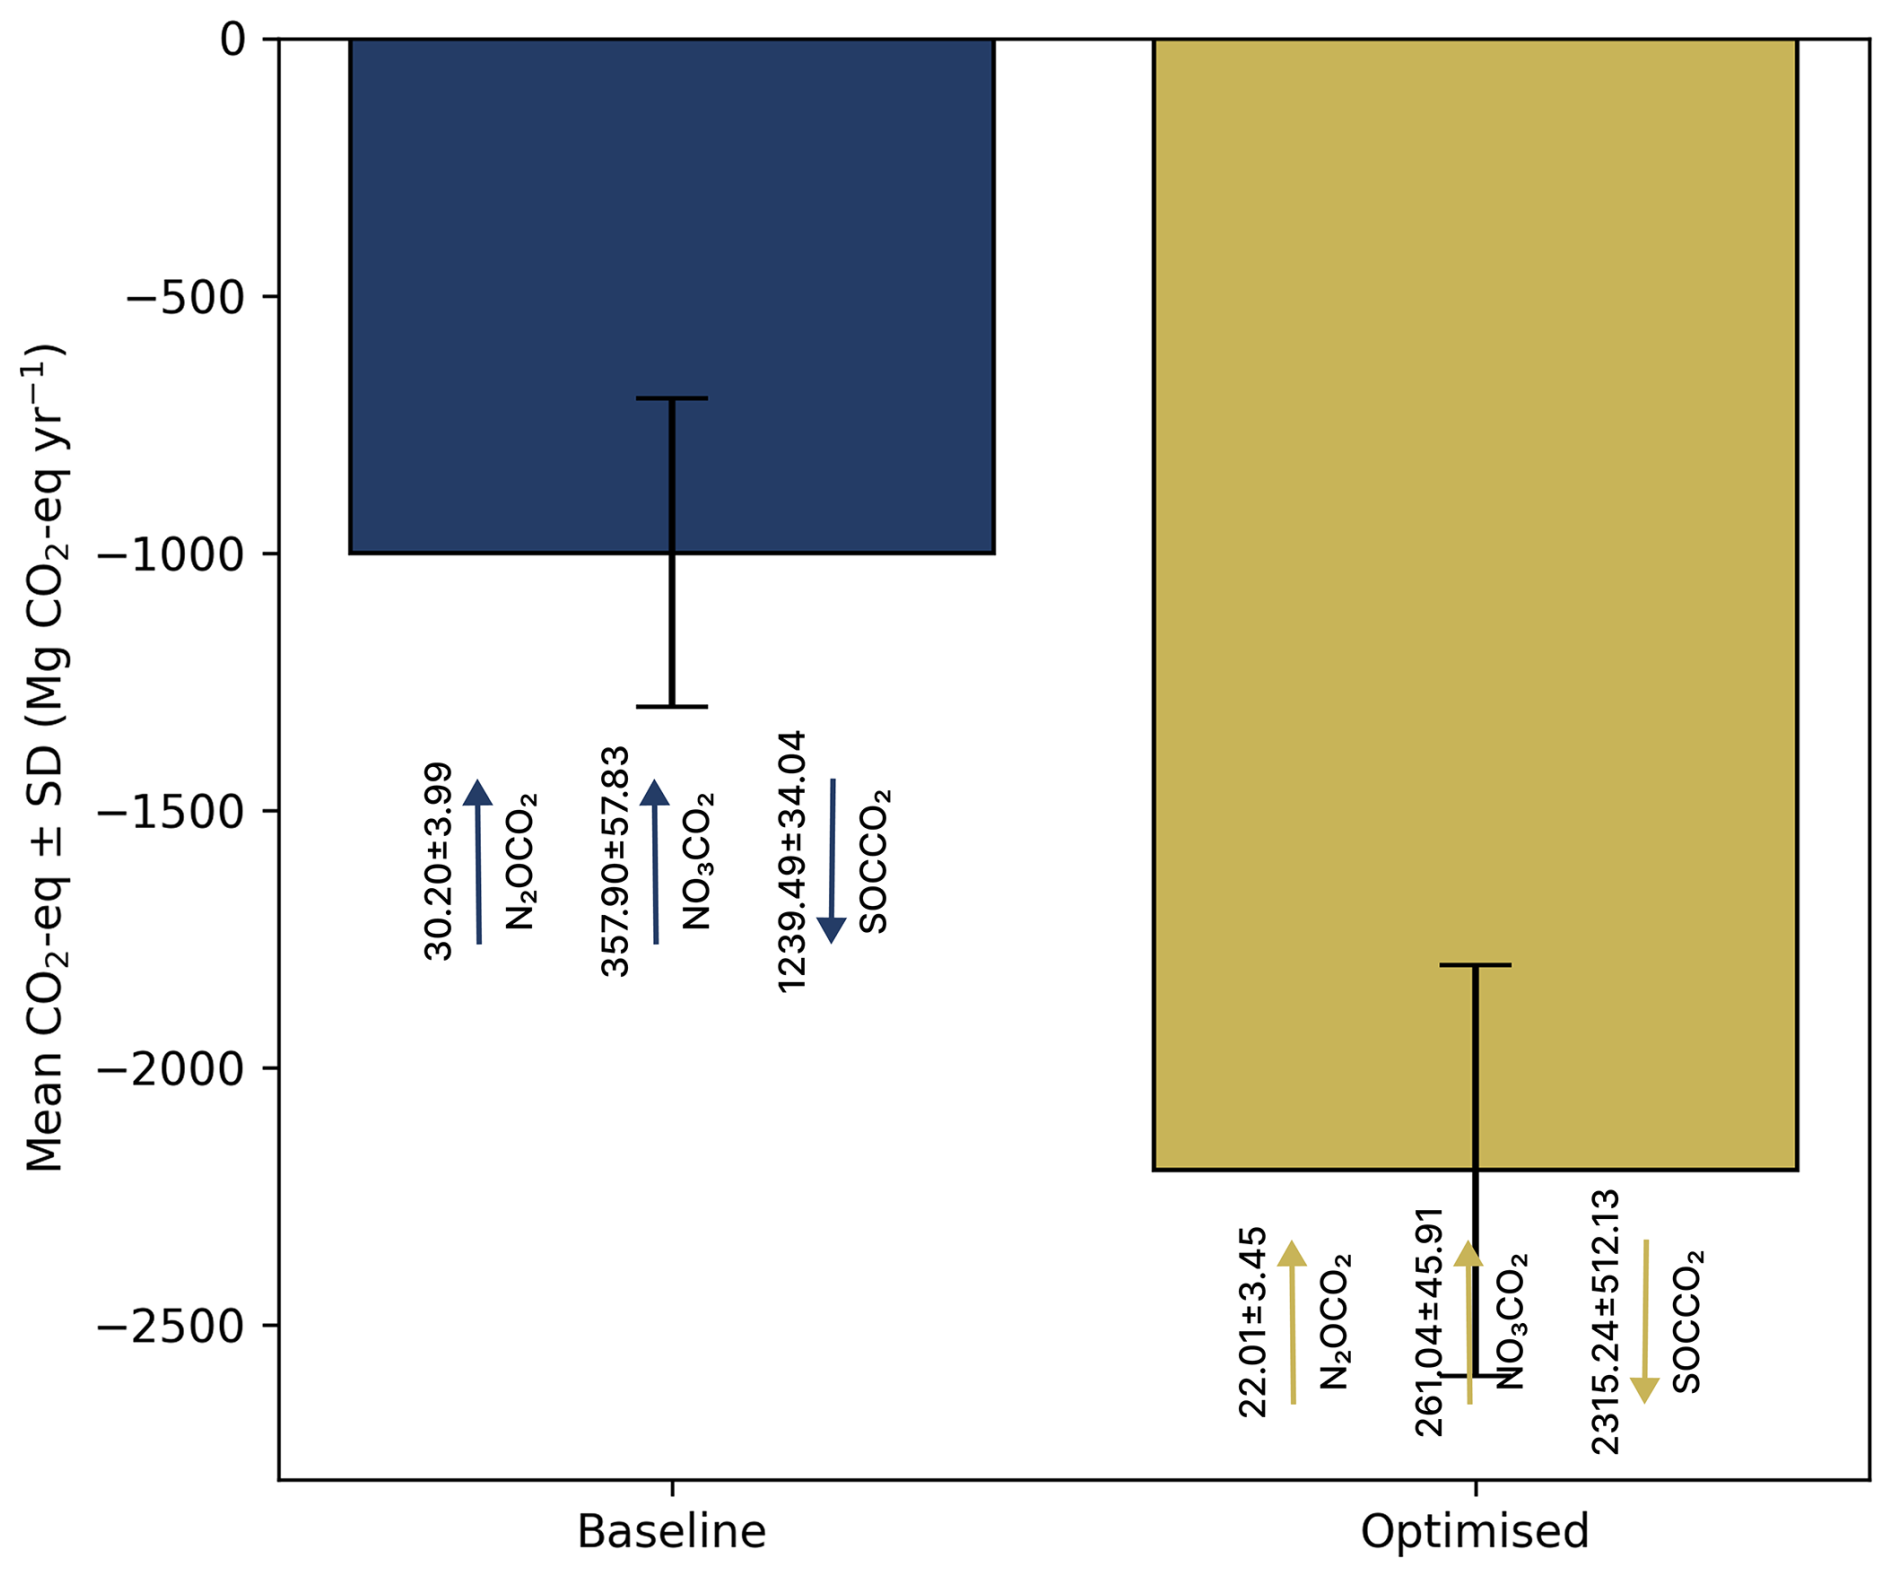
Figure 7Soil-net GHG balance (Mg CO2-eq yr−1) under baseline and optimised management scenarios, averaged over the 10 year period 2011–2020; negative values indicate greater net climate-mitigation potential.
Total N2O and NO per Nitrogen Yield
Figure 8 illustrates the relationship between total nitrogen exported as yield and the corresponding annual N2O emissions and losses for both the baseline and optimised scenarios. The optimised management consistently shifts observations upward and to the right, indicating higher nitrogen export through increased yield while simultaneously reducing N2O emissions and leaching relative to the baseline. This pattern shows that the optimised system achieves greater nitrogen productivity without incurring additional gaseous or leaching losses, demonstrating improved overall nitrogen stewardship in Danish cropping systems.
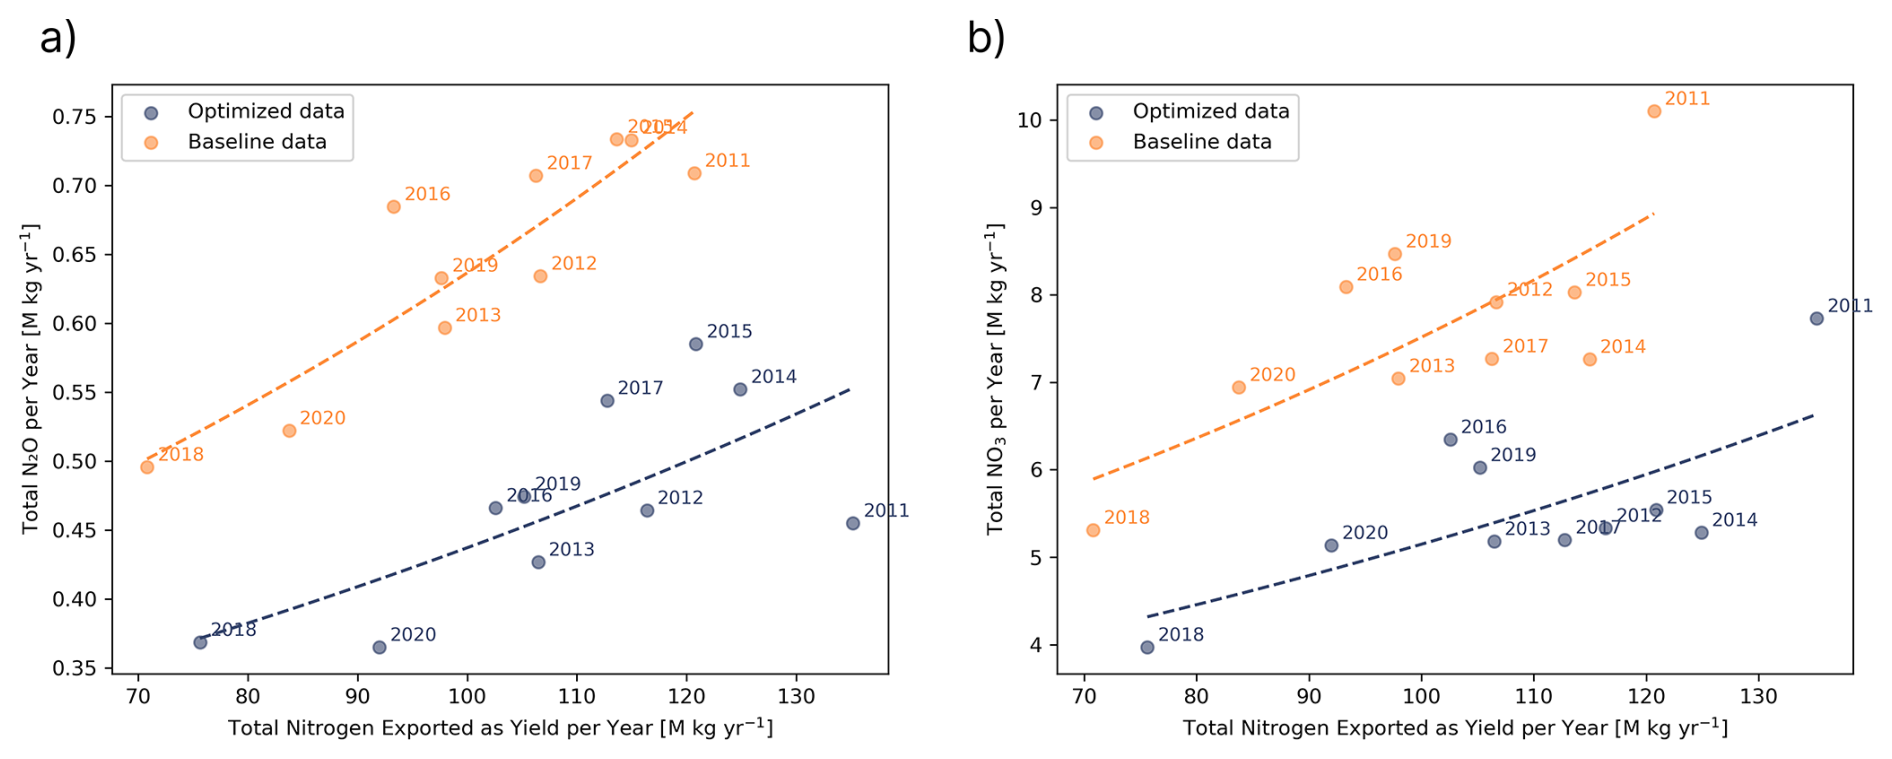
Figure 8Total nitrogen exported as yield per year compared with (a) total N2O emissions per year and (b) total leaching per year for baseline and optimised management.
The development of the surrogate model mLDNDC was motivated by the need for a computationally efficient alternative to full process-based simulations when conducting multi-objective optimisation at scale. While process-based models provide detailed mechanistic representations of agroecosystem dynamics, they remain computationally demanding when thousands of management scenarios must be evaluated repeatedly. mLDNDC preserves the core behavioural response of the LandscapeDNDC model while reducing runtime by several orders of magnitude. This computational gain enables optimisation across large spatial domains, allows the evaluation of a far broader range of management combinations, and supports systematic exploration of trade-offs and synergies among multiple environmental and productivity outcomes.
Importantly, the surrogate model does not replace the process-based model but supplements it by making national-scale optimisation feasible in practice. As a data-driven approximation, the surrogate can reliably predict only the outputs and objectives included in its training data. If additional objectives, such as new biogeochemical indicators or management goals, are introduced, the surrogate must be retrained using corresponding simulations from the process-based model. In contrast, process-based models explicitly simulate the underlying biophysical processes governing system behaviour. They embed mathematical representations of physical, chemical, and biological processes, including soil water dynamics, plant growth, nutrient cycling, and greenhouse gas fluxes. As a result, they generate intermediate state variables, such as microbial activity or nitrification and denitrification rates, that provide explanatory insight into system functioning beyond final outputs like yield or emissions (Kim et al., 2025). This fundamental difference in model design leads to distinct but complementary roles. Process-based models offer broad scope, interpretability, and flexibility, whereas surrogate models provide speed and scalability but limited process transparency.
This study was designed as a multi-objective optimisation experiment to assess whether agronomic management can simultaneously sustain high crop productivity while delivering substantial environmental co-benefits at national scale. The underlying premise is that sustainable arable systems must balance yield with reductions in greenhouse gas emissions, nitrogen losses, and soil degradation, rather than optimising any single outcome in isolation. A single-objective formulation, such as yield maximisation alone, would have obscured potential win-win solutions and provided limited insight into trade-offs or synergies among productivity, nitrogen use efficiency, and environmental performance relative to current practice in Denmark.
To the best of current knowledge, no previous study in Denmark has applied a standard multi-objective optimisation framework to crop management using a surrogate-based approach capable of evaluating thousands of spatially explicit management combinations. In contrast to studies based on a limited set of predefined scenarios, this work demonstrates that more balanced outcomes are achievable. The optimisation identified management strategies that reduced N2O emissions by 27.5±4.5 % and leaching by 27±3.0 %, while simultaneously increasing grain yield by 8.5±1.5 % and soil organic carbon stocks by 1.2±0.1 %, alongside a 10±2 % improvement in nitrogen use efficiency. These improvements were achieved without increasing total fertiliser inputs. Instead, gains arose from reallocating mineral and organic nitrogen, adjusting incorporation depth, and optimising residue management, catch-crop use, and irrigation practices. Collectively, these changes shifted the system towards a substantially lower net greenhouse gas balance relative to current practices.
Despite its strengths, the surrogate modelling approach has limitations. Model performance depends on the breadth and quality of the synthetic training data generated from the process-based model, and gaps in the simulation design may reduce accuracy when the surrogate extrapolates beyond the training domain. In addition, the optimisation framework does not currently account for economic costs, labour availability, or machinery constraints, which are important determinants of real-world adoption. Incorporating these factors in future work would improve the practical relevance of the results. Furthermore, while the present study focuses on winter wheat systems, extending the surrogate framework to full crop rotations would provide a more comprehensive representation of Danish arable agriculture. Also, external validation was only conducted for crop yield as observational datasets were accessible at the time of study, future work should seek to validate surrogate performance across the full set of agroecosystem indicators as suitable observational datasets become available.
The development of mLDNDC also highlighted the importance of including detailed seasonal climate information and soil variables to faithfully replicate the behaviour of the full process-based model. The marked improvement in surrogate performance following the inclusion of these variables demonstrates that careful feature engineering is essential when using machine learning to emulate complex biogeochemical processes.
Collectively, the results show that mLDNDC is an effective and computationally efficient tool for exploring management scenarios and supporting multi-objective optimisation at national scale. When coupled with appropriate decision-making frameworks, it offers substantial potential to inform policy development, advisory services, and strategic planning aimed at balancing agricultural productivity with environmental sustainability.
Several avenues for future research emerge from this work. Linking mLDNDC with socioeconomic and land-use models would enable assessment of national-scale policy interventions, including nitrogen quotas, carbon pricing mechanisms, fertiliser price changes, and incentives for manure redistribution. The computational efficiency of the surrogate makes it well suited for integration with economic optimisation or agent-based modelling frameworks to explore behavioural responses across farming systems. In addition, incorporating climate change scenarios would allow evaluation of the robustness of optimised management strategies under projected changes in temperature and precipitation, which is essential for designing resilient cropping systems.
Furthermore, the current surrogate framework represents management history through a categorical two-year crop rotation variable, which indexes distinct management trajectories as simulated by LandscapeDNDC. Because the process-based model tracks trajectory-dependent state variables, including soil organic carbon accrual and microbial community development, internally over the full modelling period, the surrogate's training data implicitly reflects their influence on modelled outputs for the rotation sequences considered. However, the surrogate does not explicitly represent the evolution of these slow state variables, and its applicability is therefore bounded by the management histories included in the training simulations. Future development could extend the framework by incorporating temporally explicit management sequences or slow state variables as additional inputs, further enhancing its capacity to represent path-dependent system behaviour across a broader range of management histories.
Finally, the strong spatial heterogeneity observed in optimisation outcomes highlights the need for regionalised advisory tools and policy support. mLDNDC could serve as the computational core of interactive decision-support systems that provide grid-specific recommendations tailored to local soils, climate, and management histories. Overall, the methodological framework developed in this study provides a scalable and robust foundation for next-generation agricultural assessment and optimisation. With further integration of socioeconomic factors, climate projections and temporally explicit management sequences, mLDNDC has the potential to support Denmark's transition toward climate-smart and resource-efficient agricultural systems.
The code used for training all machine learning models presented in this manuscript are publicly available on Zenodo at https://doi.org/10.5281/zenodo.18278474 (Aderele et al., 2026a). The datasets are publicly available on Zenodo at https://doi.org/10.5281/zenodo.18573225 (Aderele et al., 2026b).
The supplement related to this article is available online at https://doi.org/10.5194/gmd-19-6335-2026-supplement.
MOA and JR conceived and designed the study, prepared model input data, performed the analysis. MOA and JR wrote the first draft, while all co-authors (EH, LL, JS, and KB-B) have contributed to improving the manuscript.
The contact author has declared that none of the authors has any competing interests.
Publisher's note: Copernicus Publications remains neutral with regard to jurisdictional claims made in the text, published maps, institutional affiliations, or any other geographical representation in this paper. The authors bear the ultimate responsibility for providing appropriate place names. Views expressed in the text are those of the authors and do not necessarily reflect the views of the publisher.
We acknowledge the computing support from DeiC National HPC (Interactive HPC and Throughput HPC) through grants DeiC-AU-N1-2024070 and DeiC-AU-N1-2024071.
This study was supported by the Pioneer Center for Research in Sustainable Agricultural Futures (Land-CRAFT), DNRF grant number P2, Aarhus University, Denmark. This research has been funded by the SmartField initiative (supported by Novo Nordisk Foundation under grant number NNF24SA0091172) and the European Union through the Mission Soil project, MARVIC (Grant Agreement: 101112942). It has also been partially supported by the German Federal Ministry of Research, Technology and Space (BMFTR) project “Integrated Greenhouse Gas Monitoring System for Germany” – Module Sources and Sinks (ITMS-QS) under grant number 01LK2105A.
This paper was edited by Christian Folberth and reviewed by two anonymous referees.
Abdu, A., Laekemariam, F., Gidago, G., Kebede, A., and Getaneh, L.: Variability analysis of soil properties, mapping, and crop test responses in Southern Ethiopia, Heliyon, 9, e14013, https://doi.org/10.1016/j.heliyon.2023.e14013, 2023.
Aderele, M. O., Srivastava, A. K., Butterbach-Bahl, K., and Rahimi, J.: Integrating machine learning with agroecosystem modelling: Current state and future challenges, Eur. J. Agron., 168, 127610, https://doi.org/10.1016/j.eja.2025.127610, 2025a.
Aderele, M. O., Haas, E., Smerald, A., Blicher-Mathiesen, G., Butterbach-Bahl, K., and Rahimi, J.: The environmental trade-off of fertiliser, residue and catch crop management in Danish cropping systems, Agr. Syst., 229, 104433, https://doi.org/10.1016/j.agsy.2025.104433, 2025b.
Aderele, M. O., Haas, E., Liu, L., Serra, J., Kraus, D., Butterbach-Bahl, K., and Rahimi, J.: mLDNDCv1.0: A Machine Learning-based Surrogate of LandscapeDNDC for Optimising Cropping Systems in Denmark, Zenodo [code], https://doi.org/10.5281/zenodo.18278475, 2026a.
Aderele, M. O., Haas, E., Liu, L., Serra, J., Kraus, D., Butterbach-Bahl, K., and Rahimi, J.: mLDNDCv1.0: A Machine Learning-based Surrogate of LandscapeDNDC for Optimising Cropping Systems in Denmark, Zenodo [data set], https://doi.org/10.5281/zenodo.18573226, 2026b.
Akiba, T., Sano, S., Yanase, T., Ohta, T., and Koyama, M.: Optuna: A next-generation hyperparameter optimization framework, Adv. Intel. Soft. Compu., 2623–2631, https://doi.org/10.1145/3292500.3330701, 2019.
Al-Musawi, Z. K., Vona, V., and Kulmány, I. M.: Utilizing different crop rotation systems for agricultural and environmental sustainability: A review, Agronomy, 15, 1966, https://doi.org/10.3390/agronomy15081966, 2025.
Antón, R., Derrien, D., Urmeneta, H., van der Heijden, G., Enrique, A., and Virto, I.: Organic carbon storage and dynamics as affected by the adoption of irrigation in a cultivated calcareous Mediterranean Soil, Frontiers in Soil Science, 2, 831775, https://doi.org/10.3389/fsoil.2022.831775, 2022.
Attia, A., Govind, A., Qureshi, A. S., Feike, T., Rizk, M. S., Shabana, M. M. A., and Kheir, A. M. S.: Coupling process-based models and machine learning algorithms for predicting yield and evapotranspiration of maize in arid environments, Water (Switzerland), 14, https://doi.org/10.3390/w14223647, 2022.
Baker, R. E. and Anttila-Hughes, J.: Characterizing the contribution of high temperatures to child undernourishment in Sub-Saharan Africa, Sci. Rep.-UK, 10, 1–10, https://doi.org/10.1038/s41598-020-74942-9, 2020.
Barua, S. K., Berg, P., Bruvoll, A., Cederberg, C., Drinkwater, K. F., Eide, A., Eythorsdottir, E., Guðjónsson, S., Gudmundsson, L. A., Gundersen, P., Hoel, A. H., Jarp, J., Jørgensen, R. B., Kantanen, J., Kettunen-Præbel, A., Løvendahl, P., Meuwissen, T., Olesen, J. E., Portin, A., Rognli, O. A., and Stiansen, J. E.: Climate change and primary industries: Impacts, adaptation and mitigation in the Nordic countries, Nordisk Ministerråd, https://doi.org/10.6027/tn2014-552, 2014.
Blank, J. and Deb, K.: Pymoo: Multi-Objective Optimization in Python, IEEE Access, 8, 89497–89509, https://doi.org/10.1109/access.2020.2990567, 2020.
Borisov, V., Leemann, T., Sebler, K., Haug, J., Pawelczyk, M., and Kasneci, G.: Deep neural networks and tabular data: A survey, IEEE T. Neur. Net. Lear., 35, 7499–7519, https://doi.org/10.1109/tnnls.2022.3229161, 2024.
Chen, T. and Guestrin, C.: XGBoost: A Scalable tree boosting system, Adv. Intel. Soft. Compu., 13–17 August 2016, 785–794, https://doi.org/10.1145/2939672.2939785, 2016.
Ciarlo, E., Conti, M., Bartoloni, N., and Rubio, G.: The effect of moisture on nitrous oxide emissions from soil and the ratio under laboratory conditions, Biol. Fert. Soils, 43, 675–681, https://doi.org/10.1007/s00374-006-0147-9, 2006.
Dalgaard, T., Hansen, B., Hasler, B., Hertel, O., Hutchings, N. J., Jacobsen, B. H., Jensen, L. S., Kronvang, B., Olesen, J. E., Schjørring, J. K., Kristensen, I. S., Graversgaard, M., Termansen, M., and Vejre, H.: Policies for agricultural nitrogen management – trends, challenges and prospects for improved efficiency in Denmark, Environ. Res. Lett., 9, 115002, https://doi.org/10.1088/1748-9326/9/11/115002, 2014.
Deb, K., Pratap, A., Agarwal, S., and Meyarivan, T.: A fast and elitist multiobjective genetic algorithm: NSGA-II, IEEE T. Evolut. Comput., 6, 182–197, https://doi.org/10.1109/4235.996017, 2002.
Diba, F., Shimizu, M., and Hatano, R.: Effects of soil aggregate size, moisture content and fertilizer management on nitrous oxide production in a volcanic ash soil, Soil Sci. Plant Nutr., 57, 733–747, https://doi.org/10.1080/00380768.2011.604767, 2011.
Droutsas, I., Challinor, A. J., Deva, C. R., and Wang, E.: Integration of machine learning into process-based modelling to improve simulation of complex crop responses, In Silico Plants, 4, 1–16, https://doi.org/10.1093/insilicoplants/diac017, 2022.
Emde, D., Hannam, K. D., Most, I., Nelson, L. M., and Jones, M. D.: Soil organic carbon in irrigated agricultural systems: A meta-analysis, Global Change. Biol., 27, 3898, https://doi.org/10.1111/gcb.15680, 2021.
Friedman, J. H.: Greedy function approximation: A gradient boosting machine, Ann. Statist., 29, 1189–1232, https://doi.org/10.1214/aos/1013203451, 2001.
Grados, D., Kraus, D., Haas, E., Butterbach-Bahl, K., Olesen, J. E., and Abalos, D.: Common agronomic adaptation strategies to climate change may increase soil greenhouse gas emission in Northern Europe, Agr. Forest. Meteorol., 349, 109966, https://doi.org/10.1016/j.agrformet.2024.109966, 2024.
Grote, R., Lavoir, A. V., Rambal, S., Staudt, M., Zimmer, I., and Schnitzler, J. P.: Modelling the drought impact on monoterpene fluxes from an evergreen Mediterranean forest canopy, Oecologia, 160, 213–223, https://doi.org/10.1007/s00442-009-1298-9, 2009.
Haas, E., Klatt, S., Fröhlich, A., Kraft, P., Werner, C., Kiese, R., Grote, R., Breuer, L., and Butterbach-Bahl, K.: LandscapeDNDC: A process model for simulation of biosphere–atmosphere-hydrosphere exchange processes at site and regional scale, Landsc. Ecol., 28, 615–636, https://doi.org/10.1007/s10980-012-9772-x, 2013.
Haas, E., Carozzi, M., Massad, R. S., Scheer, C., and Butterbach-Bahl, K.: Testing the performance of CERES-EGC and LandscapeDNDC to simulate effects of residue management on soil N2O emissions, ResidueGas deliverable report 4.1, https://projects.au.dk/fileadmin/projects/residuegas/D_reports/ResidueGas_D4.1.pdf (last access: 9 July 2026), 2021.
Haas, E., Carozzi, M., Massad, R. S., Butterbach-Bahl, K., and Scheer, C.: Long term impact of residue management on soil organic carbon stocks and nitrous oxide emissions from European croplands, Sci. Total Environ., 836, 154932, https://doi.org/10.1016/j.scitotenv.2022.154932, 2022.
Hansen, L. B., Callesen, G. M., Schou, J. S., Filippelli, R., Hasler, B., Lundhede, T., Termansen, M., and Levin, G.: Land use allocation to achieve multiple goals for climate, aquatic environment, and biodiversity: A scenario analysis for Denmark, Danish Journal of Economics, 2025, 65–77, 2025.
Hastie, T., Tibshirani, R., and Friedman, J.: The elements of statistical learning: data mining, inference, and prediction, 2nd Edn., Springer, 1–764, https://doi.org/10.1007/b94608, 2009.
Hénault, C., Bourennane, H., Ayzac, A., Ratié, C., Saby, N. P. A., Cohan, J. P., Eglin, T., and Gall, C. Le: Management of soil pH promotes nitrous oxide reduction and thus mitigates soil emissions of this greenhouse gas, Sci. Rep., 9, 20182, https://doi.org/10.1038/s41598-019-56694-3, 2019.
Huang, Y. and Gerber, S.: Global soil nitrous oxide emissions in a dynamic carbon-nitrogen model, Biogeosciences, 12, 6405–6427, https://doi.org/10.5194/bg-12-6405-2015, 2015.
Jeong, D., Kim, D., Choi, T., and Seo, Y.: A process-based modeling method for describing production processes of ship block assembly planning, Processes, 8, 880, https://doi.org/10.3390/pr8070880, 2020.
Kapoor, S. and Perrone, V.: A simple and fast baseline for tuning large XGBoost models, arXiv [preprint], https://doi.org/10.48550/arXiv.2111.06924, 12 November 2021.
Karwowska, Z., Aasmets, O., Esko, T., Milani, L., Metspalu, A., Metspalu, M., Kosciolek, T., and Org, E.: Effects of data transformation and model selection on feature importance in microbiome classification data, Microbiome, 13, 2, https://doi.org/10.1186/S40168-024-01996-6, 2025.
Kasper, M., Foldal, C., Kitzler, B., Haas, E., Strauss, P., Eder, A., Zechmeister-Boltenstern, S., and Amon, B.: N2O emissions and leaching from two contrasting regions in Austria and influence of soil, crops and climate: a modelling approach, Nutr. Cycl. Agroecosys., 113, 95–111, https://doi.org/10.1007/s10705-018-9965-z, 2018.
Ke, G., Meng, Q., Finley, T., Wang, T., Chen, W., Ma, W., Ye, Q., and Liu, T.-Y.: LightGBM: a highly efficient gradient boosting decision tree, in: Proceedings of the 31st International Conference on Neural Information Processing Systems (NIPS'17), Curran Associates Inc., Red Hook, NY, USA, 3149–3157, https://papers.nips.cc/paper/6907-lightgbm-a-highly-efficient-gradient-boosting-decision-tree.pdf (last access: 9 July 2026), 2017.
Kiese, R., Heinzeller, C., Werner, C., Wochele, S., Grote, R., and Butterbach-Bahl, K.: Quantification of nitrate leaching from German forest ecosystems by use of a process oriented biogeochemical model, Environ. Pollut., 159, 3204–3214, https://doi.org/10.1016/j.envpol.2011.05.004, 2011.
Kim, Y. W., Cha, Y. K., and Shin, J.: A modular deep learning surrogate model for simulating harmful algal blooms in complex process-based systems, Water Res., 285, 124059, https://doi.org/10.1016/j.watres.2025.124059, 2025.
Kollmer, M.: Carbon sequestration dynamics of agricultural soils: constraining a biogeochemical model with long-term field measurements, MSc thesis, Faculty of Environment and Natural Resources, Albert-Ludwigs-University Freiburg, Freiburg im Breisgau, Germany, 2023.
Kraus, D., Weller, S., Klatt, S., Haas, E., Wassmann, R., Kiese, R., and Butterbach-Bahl, K.: A new LandscapeDNDC biogeochemical module to predict CH4 and N2O emissions from lowland rice and upland cropping systems, Plant Soil, 386, 125–149, https://doi.org/10.1007/s11104-014-2255-x, 2015.
Kraus, D., Weller, S., Klatt, S., Santabárbara, I., Haas, E., Wassmann, R., Werner, C., Kiese, R., and Butterbach-Bahl, K.: How well can we assess impacts of agricultural land management changes on the total greenhouse gas balance (CO2, CH4 and N2O) of tropical rice-cropping systems with a biogeochemical model?, Agr. Ecosyst. Environ., 224, 104–115, https://doi.org/10.1016/j.agee.2016.03.037, 2016.
Kraus, D., Werner, C., Janz, B., Klatt, S., Sander, B. O., Wassmann, R., Kiese, R., and Butterbach-Bahl, K.: Greenhouse Gas Mitigation Potential of Alternate Wetting and Drying for Rice Production at National Scale – A Modeling Case Study for the Philippines, J. Geophys. Res.-Biogeosci., 127, https://doi.org/10.1029/2022jg006848, 2022.
Kuhn, M. and Johnson, K.: Applied predictive modeling, Springer, New York, Heidelberg, Dordrecht, London, 1–600, https://doi.org/10.1007/978-1-4614-6849-3, 2013.
Kuśmierz, S., Skowrońska, M., Tkaczyk, P., Lipiński, W., and Mielniczuk, J.: Soil organic carbon and mineral nitrogen contents in soils as affected by their pH, texture and fertilization, Agronomy, 13, 267, https://doi.org/10.3390/agronomy13010267, 2023.
Lessmann, M., Ros, G. H., Young, M. D., and de Vries, W.: Global variation in soil carbon sequestration potential through improved cropland management, Global Change Biol., 28, 1162–1177, https://doi.org/10.1111/GCB.15954, 2022.
Li, Z., Cui, S., Zhang, Q., Xu, G., Feng, Q., Chen, C., and Li, Y.: Optimizing wheat yield, water, and nitrogen use efficiency with water and nitrogen inputs in china: A synthesis and life cycle assessment, Front. Plant Sci., 13, 930484, https://doi.org/10.3389/FPLS.2022.930484, 2022.
Liebermann, R., Breuer, L., Houska, T., Kraus, D., Moser, G., and Kraft, P.: Simulating long-term development of greenhouse gas emissions, plant biomass, and soil moisture of a temperate grassland ecosystem under elevated atmospheric CO2, Agronomy, 10, 50, https://doi.org/10.3390/agronomy10010050, 2019.
Lu, D. and Ricciuto, D.: Efficient surrogate modeling methods for large-scale Earth system models based on machine-learning techniques, Geosci. Model Dev., 12, 1791–1807, https://doi.org/10.5194/gmd-12-1791-2019, 2019.
Lundberg, S. M. and Lee, S.-I.: A unified approach to interpreting model predictions, in: Proceedings of the 31st International Conference on Neural Information Processing Systems (NIPS'17), Curran Associates Inc., Red Hook, NY, USA, 4768–4777, https://proceedings.neurips.cc/paper_files/paper/2017/file/8a20a8621978632d76c43dfd28b67767-Paper.pdf (last access: 9 July 2026), 2017.
Luo, Z., Wang, E., and Bryan, B.: A meta-model for soil carbon stock in agricultural soils, in: Proceedings of the 19th International Congress on Modelling and Simulation (MODSIM2011), Perth, Australia, 12–16 December 2011, Modelling and Simulation Society of Australia and New Zealand, https://doi.org/10.36334/modsim.2011.b1.luo, 2011.
Ma, J., Kang, F., Cheng, X., and Han, H.: Response of soil organic carbon and nitrogen to nitrogen deposition in a Larix principis-rupprechtii plantation, Sci. Rep., 8, 8638, https://doi.org/10.1038/s41598-018-26966-5, 2018.
Maaz, T. M., Sapkota, T. B., Eagle, A. J., Kantar, M. B., Bruulsema, T. W., and Majumdar, K.: Meta-analysis of yield and nitrous oxide outcomes for nitrogen management in agriculture, Global Change Biol., 27, 2343, https://doi.org/10.1111/GCB.15588, 2021.
Malcolm, B. J., Cameron, K. C., Curtin, D., Di, H. J., Beare, M. H., Johnstone, P. R., and Edwards, G. R.: Organic matter amendments to soil can reduce nitrate leaching losses from livestock urine under simulated fodder beet grazing, Agr. Ecosyst. Environ., 272, 10–18, https://doi.org/10.1016/j.agee.2018.11.003, 2019.
Molina-Herrera, S., Haas, E., Klatt, S., Kraus, D., Augustin, J., Magliulo, V., Tallec, T., Ceschia, E., Ammann, C., Loubet, B., Skiba, U., Jones, S., Brümmer, C., Butterbach-Bahl, K., and Kiese, R.: A modeling study on mitigation of N2O emissions and NO3 leaching at different agricultural sites across Europe using LandscapeDNDC, Sci. Total Environ., 553, 128–140, https://doi.org/10.1016/j.scitotenv.2015.12.099, 2016.
Nguyen, T. H., Nong, D., and Paustian, K.: Surrogate-based multi-objective optimization of management options for agricultural landscapes using artificial neural networks, Ecol. Model., 400, 1–13, https://doi.org/10.1016/j.ecolmodel.2019.02.018, 2019.
Nielsen, O.-K., Plejdrup, M. S., Winther, M., Nielsen, M., Gyldenkærne, S., Mikkelsen, M. H., Albrektsen, R., Thomsen, M., Hjelgaard, K., Fauser, P., Bruun, H. G., Johannsen, V. K., Nord-Larsen, T., Vesterdal, L., Callesen, I., Caspersen, O. H., Scott-Bentsen, N., Rasmussen, E., Petersen, S. B., Olsen, T. M., and Hansen, M. G.: Denmark's national inventory report 2020: Emission inventories 1990–2018 – Submitted under the United Nations Framework Convention on Climate Change and the Kyoto Protocol, Aarhus University, DCE – Danish Centre for Environment and Energy, Aarhus, Denmark, Scientific Report No. 372, 904 pp., http://dce2.au.dk/pub/SR372.pdf (last access: 9 July 2026), 2020.
Pacheco, A. L. and Sumreen Hina, N.: Global meta-analysis of nitrate leaching vulnerability in synthetic and organic fertilizers over the past four decades, Water, 16, 457, https://doi.org/10.3390/w16030457, 2024.
Perlman, J., Hijmans, R. J., and Horwath, W. R.: A metamodelling approach to estimate global N2O emissions from agricultural soils, Global Ecol. Biogeogr., 23, 912–924, https://doi.org/10.1111/geb.12166, 2014.
Piñeros Garcet, J. D., Ordoñez, A., Roosen, J., and Vanclooster, M.: Metamodelling: Theory, concepts and application to nitrate leaching modelling, Ecol. Model., 193, 629–644, https://doi.org/10.1016/j.ecolmodel.2005.08.045, 2006.
Prokhorenkova, L., Gusev, G., Vorobev, A., Dorogush, A. V., and Gulin, A.: CatBoost: unbiased boosting with categorical features, in: Proceedings of the 32nd International Conference on Neural Information Processing Systems (NIPS'18), Montréal, Canada, 3–8 December 2018, Curran Associates Inc., Red Hook, NY, USA, 6639–6649, https://papers.neurips.cc/paper/7898-catboost-unbiased-boosting-with-categorical-features.pdf (last access: 9 July 2026), 2018.
Pugliese, L., Heckrath, G. J., Iversen, B. V., and Straface, S.: Treatment systems for agricultural drainage water and farmyard runoff in Denmark: Case studies, Handbook of Environmental Chemistry, 117, 45–65, https://doi.org/10.1007/698_2021_784, 2023.
Pylianidis, C., Snow, V., Overweg, H., Osinga, S., Kean, J., and Athanasiadis, I. N.: Simulation-assisted machine learning for operational digital twins, Environ. Modell. Softw., 148, https://doi.org/10.1016/j.envsoft.2021.105274, 2022.
Quemada, M., Baranski, M., Nobel-de Lange, M. N. J., Vallejo, A., and Cooper, J. M.: Meta-analysis of strategies to control nitrate leaching in irrigated agricultural systems and their effects on crop yield, Agr. Ecosyst. Environ., 174, 1–10, https://doi.org/10.1016/j.agee.2013.04.018, 2013.
Rahimi, J., Haas, E., Scheer, C., Grados, D., Abalos, D., Aderele, M. O., Blicher-Mathiesen, G., and Butterbach-Bahl, K.: Aggregation of activity data on crop management can induce large uncertainties in estimates of regional nitrogen budgets, npj Sustainable Agriculture, 2, 1–10, https://doi.org/10.1038/s44264-024-00015-3, 2024.
Ren, K., Wang, Z., Wu, J., Zhao, K., Huang, M., and Li, Y.: One-off irrigation enhances wheat yield and water productivity: Evidence from meta-analysis and a three-year and three-site field experiment, Agr. Water Manage., 317, 109628, https://doi.org/10.1016/j.agwat.2025.109628, 2025.
Rolighed, J.: Processing of agricultural register data and calculation of reference leaching for nitrate with NLES5, Aarhus University, DCE – Danish Centre for Environment and Energy, Aarhus, Denmark, Technical Note No. 62, 34 pp., https://dce.au.dk/fileadmin/dce.au.dk/Udgivelser/Notater_2023/N2023_62.pdf (last access: 9 July 2026), 2023.
Schuster, J., Mittermayer, M., Maidl, F. X., Nätscher, L., and Hülsbergen, K. J.: Spatial variability of soil properties, nitrogen balance and nitrate leaching using digital methods on heterogeneous arable fields in southern Germany, Precis. Agric., 24, 647–676, https://doi.org/10.1007/s11119-022-09967-3, 2022.
Shahhosseini, M., Martinez-Feria, R. A., Hu, G., and Archontoulis, S. V.: Maize yield and nitrate loss prediction with machine learning algorithms, Environ. Res. Lett., 14, https://doi.org/10.1088/1748-9326/ab5268, 2019.
Shcherbak, I., Millar, N., and Robertson, G. P.: Global metaanalysis of the nonlinear response of soil nitrous oxide (N2O) emissions to fertilizer nitrogen, P. Natl. Acad. Sci. USA, 111, 9199–9204, https://doi.org/10.1073/pnas.1322434111, 2014.
Shi, Y., Han, L., Zhang, X., Sobeih, T., Gaiser, T., Thuy, N. H., Behrend, D., Srivastava, A. K., Halder, K., and Ewert, F.: Deep learning meets process-based models: a hybrid approach to agricultural challenges, arXiv [preprint], https://doi.org/10.48550/arXiv.2504.16141, 22 April 2025.
Shwartz-Ziv, R. and Armon, A.: Tabular data: Deep learning is not all you need, Inform. Fusion, 81, 84–90, https://doi.org/10.1016/J.INFFUS.2021.11.011, 2022.
Slessarev, E. W., Mayer, A., Kelly, C., Georgiou, K., Pett-Ridge, J., and Nuccio, E. E.: Initial soil organic carbon stocks govern changes in soil carbon: Reality or artifact?, Global Change Biol., 29, 1239, https://doi.org/10.1111/gcb.16491, 2022.
Smerald, A., Kraus, D., Rahimi, J., Fuchs, K., Kiese, R., Butterbach-Bahl, K., and Scheer, C.: A redistribution of nitrogen fertiliser across global croplands can help achieve food security within environmental boundaries, Commun. Earth Environ., 4, https://doi.org/10.1038/s43247-023-00970-8, 2023.
Styczen, M. E., Abrahamsen, P., Hansen, S., and Knudsen, L.: Analysis of the significant drop in protein content in Danish grain crops from 1990–2015 based on N-response in fertilizer trials, Eur. J. Agron., 115, 126013, https://doi.org/10.1016/j.eja.2020.126013, 2020.
Sun, W., He, Z., Ma, D., Liu, B., Li, R., Wang, S., and Malekian, A.: Response of soil carbon and nitrogen stocks to irrigation – A global meta-analysis, Sci. Total Environ., 957, 177641, https://doi.org/10.1016/j.scitotenv.2024.177641, 2024.
Sutton, R. S. and Matheus, C. J.: Learning polynomial functions by feature construction, Proceedings of the 8th International Workshop on Machine Learning, ICML, 1991, 208–212, https://doi.org/10.1016/b978-1-55860-200-7.50045-3, 1991.
Vermeulen, S. J., Campbell, B. M., and Ingram, J. S. I.: Climate change and food systems, Annu. Rev. Env. Resour., 37, 195–222, https://doi.org/10.1146/annurev-environ-020411-130608, 2012.
Villa-Vialaneix, N., Follador, M., Ratto, M., and Leip, A.: A comparison of eight metamodeling techniques for the simulation of N2O fluxes and N leaching from corn crops, Environ. Modell. Softw., 34, 51–66, https://doi.org/10.1016/j.envsoft.2011.05.003, 2012.
Vogeler, I., Thomsen, I. K., Jensen, J. L., and Hansen, E. M.: Marginal nitrate leaching around the recommended nitrogen fertilizer rate in winter cereals, Soil Use Manage., 38, 503–514, https://doi.org/10.1111/sum.12673, 2022.
Wang, C., Amon, B., Schulz, K., and Mehdi, B.: Factors that influence nitrous oxide emissions from agricultural soils as well as their representation in simulation models: A review, Agronomy, 11, 770, https://doi.org/10.3390/agronomy11040770, 2021a.
Wang, Y., Yao, Z., Zhan, Y., Zheng, X., Zhou, M., Yan, G., Wang, L., Werner, C., and Butterbach-Bahl, K.: Potential benefits of liming to acid soils on climate change mitigation and food security, Global Change Biol., 27, 2807–2821, https://doi.org/10.1111/gcb.15607, 2021b.
Weisberg, S.: Yeo-Johnson power transformations, Department of Applied Statistics, University of Minnesota, St. Paul, MN, USA, 4 pp., https://www.stat.umn.edu/arc/yjpower.pdf (last access: 9 July 2026), 2001.
Wezel, A., Herren, B. G., Kerr, R. B., Barrios, E., Gonçalves, A. L. R., and Sinclair, F.: Agroecological principles and elements and their implications for transitioning to sustainable food systems. A review, Agron. Sustain. Dev., 40, 1–13, https://doi.org/10.1007/s13593-020-00646-z, 2020.
Xiao, L., Wang, G., Zhou, H., Jin, X., and Luo, Z.: Coupling agricultural system models with machine learning to facilitate regional predictions of management practices and crop production, Environ. Res. Lett., 17, https://doi.org/10.1088/1748-9326/ac9c71, 2022.
Xiao, L., Wang, G., Wang, E., Liu, S., Chang, J., Zhang, P., Zhou, H., Wei, Y., Zhang, H., Zhu, Y., Shi, Z., and Luo, Z.: Spatiotemporal co-optimization of agricultural management practices towards climate-smart crop production, Nat. Food, 5, 59–71, https://doi.org/10.1038/s43016-023-00891-x, 2024.
Yang, X., Xiong, J., Du, T., Ju, X., Gan, Y., Li, S., Xia, L., Shen, Y., Pacenka, S., Steenhuis, T. S., Siddique, K. H. M., Kang, S., and Butterbach-Bahl, K.: Diversifying crop rotation increases food production, reduces net greenhouse gas emissions and improves soil health, Nat. Commun., 15, 198, https://doi.org/10.1038/s41467-023-44464-9, 2024.
Yao, Z., Yan, G., Ma, L., Wang, Y., Zhang, H., Zheng, X., Wang, R., Liu, C., Wang, Y., Zhu, B., Zhou, M., Rahimi, J., and Butterbach-Bahl, K.: Soil C/N ratio is the dominant control of annual N2O fluxes from organic soils of natural and semi-natural ecosystems, Agr. Forest. Meteorol., 327, 109198, https://doi.org/10.1016/j.agrformet.2022.109198, 2022.
Zhang, F., Qu, Z., Zhao, Q., Xi, Z., and Liu, Z.: Mechanisms of N2O emission in drip-irrigated saline soils: Unraveling the role of soil moisture variation in nitrification and denitrification, Agronomy, 15, 10, https://doi.org/10.3390/agronomy15010010, 2024.
Zhang, N., Zhou, X., Kang, M., Hu, B. G., Heuvelink, E., and Marcelis, L. F. M.: Machine learning versus crop growth models: an ally, not a rival, AoB Plants, 15, plac061, https://doi.org/10.1093/aobpla/plac061, 2022.
Zhou, L. T., Sun, S., Zhang, Z. T., Zhang, F. L., Guo, S. B., Shi, Y. Y., and Yang, X. G.: High yield and water use efficiency synergistical improvement irrigation scheme of winter wheat in North China Plain based on meta-analysis, Chinese Journal of Agrometeorology, 43, 515, https://doi.org/10.3969/j.issn.1000-6362.2022.07.001, 2022.
Žurovec, O., Wall, D. P., Brennan, F. P., Krol, D. J., Forrestal, P. J., and Richards, K. G.: Increasing soil pH reduces fertiliser derived N2O emissions in intensively managed temperate grassland, Agr. Ecosyst. Environ., 311, 107319, https://doi.org/10.1016/j.agee.2021.107319, 2021.