
the Creative Commons Attribution 4.0 License.
the Creative Commons Attribution 4.0 License.
 | 06 Jul 2026
A food crop yield emulator for integration in the compact Earth system model OSCAR (OSCAR-crop v1.0)

Thomas Gasser
Jianmin Ma
Junfeng Liu
Jonas Jägermeyr
Christoph Müller
Christian Folberth
Florian Zabel
Atul K. Jain
Wenfeng Liu
Heidi Webber
This paper presents the development, validation, and preliminary application of a sub-national scale crop yield emulator to be integrated into the compact Earth system model OSCAR. The emulator simulates yields for four major food crops: maize, rice (two growing seasons), soybean, and wheat (spring and winter varieties), in alignment with the Agricultural Model Intercomparison and Improvement Project (AgMIP) and the Inter-Sectoral Impact Model Intercomparison Project (ISIMIP) framework. Key drivers include atmospheric CO2 concentration (represented as C), growing season temperature (T), water availability (W), and nitrogen fertilization (N). The emulator is trained on an ensemble of process-based crop model simulations from AgMIP's Global Gridded Crop Model Intercomparison Projects (GGCMI), which is based on the ISIMIP Phase 3 protocol. These crop models used bias-corrected historical and future (SSP126, SSP370, and SSP585) climate scenarios under fixed human direct forcing to estimate yield responses to C, T and W. Evaluation of the emulator against the crop model outputs demonstrates the emulator's ability to replicate complex model behavior with high fidelity. Additionally, the emulator-derived yield sensitivities to CO2 and temperature are consistent with those observed in field experiments, reinforcing its empirical robustness. Historical simulations incorporating time-varying nitrogen inputs show significantly improved agreement with FAO yield statistics, underscoring the emulator's reliability over the historical period and its potential for future impact assessments. This study provides a computationally efficient yet empirically grounded tool for representing crop yield responses, providing a middle-ground between complex crop models and statistic models. The developed crop emulator facilitates probabilistic projections across large ensembles of climatic and socio-economic scenarios at policy-relevant, sub-national scales. Potential applications include integrated assessments of future food security under climate and land-use change, as well as evaluations of bioenergy with carbon capture and storage (BECCS) potential from crop residues.
- Article
(3045 KB) - Full-text XML
-
Supplement
(10088 KB) - BibTeX
- EndNote


As the global population grows and climate change poses increasing risks to agricultural productivity, ensuring food security becomes increasingly critical and challenging. Robust projections of major food crop yields under future climate conditions are essential. Crop models are fundamental tools for such projections and are broadly classified into statistical models and process-based models. Statistical models (Lobell and Asseng, 2017) largely built upon historical relationships between climatic variables and crop yields. However, their predictive power diminishes under future high-emission scenarios where conditions are outside of the historical range (Ciscar et al., 2018). In contrast, process-based models simulate the biophysical processes underlying crop growth and responses to management and climate factors (Franke et al., 2020a; Di Paola et al., 2016). However, their computational cost limits their application to large scenario ensembles. To address this trade-off between complexity and computational efficiency, crop yield emulators have emerged as a promising alternative (Abramoff et al., 2023; Blanc, 2017; Folberth et al., 2025; Franke et al., 2020a; Liu et al., 2023; Ringeval et al., 2021). These emulators approximate the behavior of more complex crop models, thereby enabling large-ensemble simulations for robust impact assessments (Folberth et al., 2025).
The Global Gridded Crop Model Intercomparison Project (GGCMI), part of the Agricultural Model Intercomparison and Improvement Project (AgMIP) (Rosenzweig et al., 2013), provides harmonized projections of food crops across diverse climate scenarios (Franke et al., 2020a; Jägermeyr et al., 2021; Müller et al., 2017). GGCMI Phase 1 enabled the development of a phenology-based crop emulator for potential yields (Ringeval et al., 2021), and GGCMI Phase 2 facilitated the development of a crop emulator trained on historical weather inputs with perturbations to CTWN at grid cell level (Franke et al., 2020a; Müller et al., 2024). In GGCMI Phase 3, aligned with the Inter-Sectoral Impact Model Intercomparison Project (ISIMIP) (Frieler et al., 2024), crop yield simulations are generated using the latest generation of complex crop models forced by bias-adjusted CMIP6 climate simulations (Jägermeyr et al., 2021). Despite the wide range of outcomes due to different model structures, parameterization schemes, calibration processes and input data quality (Folberth et al., 2019; Müller et al., 2024), the projections in GGCMI Phase 3 exhibit reduced uncertainty for rice and soybean and enhanced robustness for maize and wheat (Jägermeyr et al., 2021). Therefore, a sub-national crop emulator calibrated against the state-of-the-art GGCMs and integrating information from long-term field experiments is developed in this study. Through a multi-ensemble approach, the crop emulator covers inter-model uncertainties from both climate and crop models and provides probabilistic distributions of crop yields rather than deterministic yields, improving the reliability of future yield projection (Maiorano et al., 2017).
This paper provides a comprehensive description of this crop emulator, named OSCAR-crop v1.0, regarding its design, calibration, and validation. Section 2 outlines the emulator framework and data preprocessing procedures. Section 3 details the calibration methodology and driver-specific yield responses. Section 4 evaluates model performance through both in-sample (ISIMIP3b) and out-of-sample (ISIMIP3a) validation against original GGCMs' results. Section 5 presents a comparative analysis of emulator-derived sensitivities against experimental data, and the comparison of simulated crop yields with FAO national records to further validate the emulator. Finally, Sect. 6 synthesizes key findings, discusses uncertainties, and presents potential future applications.
2.1 Overview
The OSCAR-crop v1.0 is developed at a regional level with annual temporal resolution to facilitate region-specific applications. The emulator encompasses 311 regions in total, providing sub-national modelling capabilities for six large-area countries – Australia, Brazil, Canada, China, Russia, and the USA – to capture internal spatial heterogeneity. For the remainder of the globe, the model operates at a national level. The emulator incorporates maize (mai), rice from the first and second growing seasons (ri1 and ri2), soybean (soy), and two types of wheat (spring wheat and winter wheat, swh and wwh). Its design aligns with the probabilistic framework of the compact Earth system model OSCAR, enabling robust numerical projections for large ensembles of climatic and socio-economic scenarios (Gasser et al., 2017; Quilcaille et al., 2023). The model offers two operational modes: a standalone application requiring external CTWN inputs, and integration within a simple climate model (SCM) framework. For integration with OSCAR, the crop emulator acts as a module, receiving its CTW inputs from the host. This coupling requires the SCM to provide necessary variables to drive the emulator. Moreover, it allows for easy adaptation to coarser regional scales, making it a valuable tool for integrated assessment modelling (Ruane et al., 2017).
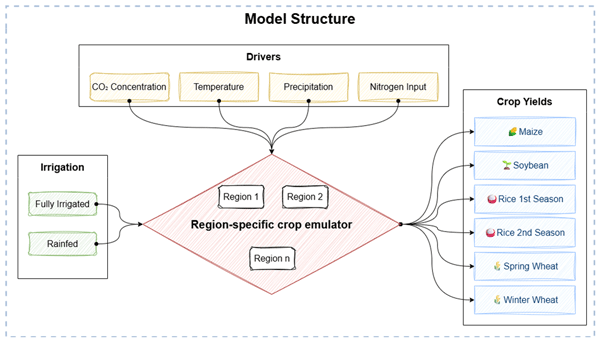
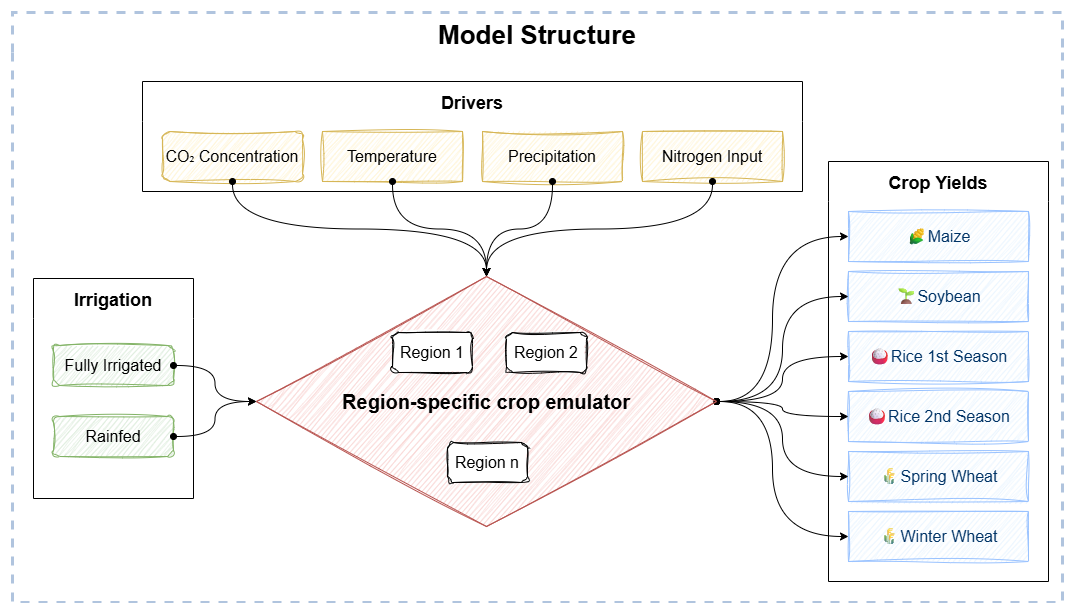
Crop yields are influenced by a range of factors, including temperature (Wang et al., 2017), water availability (Proctor et al., 2022), solar radiation (Laub et al., 2022), ambient CO2 (Toreti et al., 2020), soil quality (Qiao et al., 2022), and human management (Ahvo et al., 2023). Four key drivers including atmospheric CO2 concentration ([CO2]), growing season temperature, water input, and nitrogen fertilization are incorporated to streamline the crop emulator, representing critical climatic and management variables. All crops are classified into two categories based on the irrigation system: rainfed (noirr) and fully irrigated (firr). The core outputs of the emulator are crop yields. The structure of the emulator is shown in Fig. 1.
For illustration purposes only, a tiered aggregation strategy is employed to improve the presentation of regional results in this study, drawing attention to the significance of major-producing regions. First, sub-national regions are aggregated to the national level, and EU27 countries are combined into a single entity. Subsequently, the five leading crop-producing regions (R1 to R5), identified based on current production data (Fig. S2 and Table S1 in the Supplement), are presented individually for each crop, while all other regions are collectively aggregated (R6).
2.2 Data preprocessing
The emulator development utilizes data from the ISIMIP repository (https://data.isimip.org/search/, ISIMIP repository, 2024). The raw input variables provided in the repository encompass daily temperature and precipitation, annual nitrogen fertilizer inputs, crop-specific land areas, and crop calendars, all at the grid cell level. Raw output variables include crop yield responses and crop yields simulated by eight state-of-the-art GGCMs, including CYGMA1p74 (Iizumi et al., 2017), EPIC-IIASA (Balkovič et al., 2014), ISAM (Gahlot et al., 2020), LDNDC (Haas et al., 2013), LPJmL (von Bloh et al., 2018; Lutz et al., 2019), PEPIC (Liu et al., 2016), PROMET (Hank et al., 2015; Mauser et al., 2015; Zabel et al., 2019), and SIMPLACE-LINTUL5 (Webber et al., 2018). These GGCMs are run under pre-industrial (picontrol), historical, and future (SSP126, SSP370, and SSP585) climate scenarios, projected by five Earth system models (ESMs), namely GFDL-ESM4, IPSL-CM6A-LR, MPI-ESM1-2-HR, MRI-ESM2-0 and UKESM1-0-LL. The default experiments in ISIMIP3 fix direct human forcing (e.g., land-use, nitrogen fertilizer use) at the 2015 level (Frieler et al., 2024), while [CO2] and climate variables vary according to the specified climate scenario. To specifically assess the impact of CO2 on long-term crop yield projections, sensitivity experiments are conducted with [CO2] fixed at the 2015 level (defined as 2015co2 experiments). Finally, to ensure the availability of picontrol and 2015co2 sensitivity simulations, the emulator calibration is limited to the aforementioned eight GGCMs that participated in ISIMIP3b.
During the preprocessing, all necessary data is sourced from the ISIMIP repository. Consecutive time series (temperatures and precipitations) and static planting and maturity dates from crop calendars are used to derive growing season temperature and accumulated precipitation for each crop. For grid points where the planting date measured by Day of Year (DOY) occurs later than the maturity date, it indicates the crop is planted in one calendar year and harvested in the next. In such cases, the planting year is consistently assigned as the temporal index for all corresponding variables, accounting for the temporal offset in the original GGCM outputs that report consequences of full growing seasons, not of calendar year. GGCMs simulate crop yields across nearly all land areas, even though certain regions do not cultivate all modelled crops, leading to in part unrealistic or invalid data points. Static crop-specific cropland areas (Frieler et al., 2024), irrespective of irrigation conditions, are used as weighting factors to aggregate gridded variables to regional and global scales. This approach excludes grid cells without cropland from the aggregation, thereby improving the representativeness of the results for actual cultivated areas. Detailed information on the crops and corresponding land-use categories is provided in Table S2.
2.3 Updated regional climate
In the OSCAR-crop v1.0, regional growing season climate is derived from the regional climate, which can be provided by OSCAR. To ensure the coherence between the emulator and OSCAR, we update the existing regional climate parameters in OSCAR and further establish relationships between regional and growing season climate variables in the crop emulator. This update is necessitated by two factors: (1) OSCAR v3 utilizes regional climate variables calibrated on CMIP5 data, whereas the Phase 3 GGCMs employ CMIP6 climate data which exhibit higher [CO2] and warming levels (Jägermeyr et al., 2021; Tebaldi et al., 2021); and (2) the crop emulator operates at a sub-national resolution, creating a scale mismatch with OSCAR v3's broader regional scale (Gasser et al., 2017). Therefore, recalibrating the regional climate is essential for harmonizing the input data across models and resolutions.
A pattern scaling approach (Herger et al., 2015) is employed to derive the relationship between annual global (subscript G) climate (temperature and precipitation, TG and PG) and annual regional climate ( and ) at a sub-national scale across climate scenarios (Gasser et al., 2017). Herein, the baseline climate is fixed at pre-industrial level, calculated as the average over 1850–2100 from picontrol scenarios. Climate data derived from five ESMs results in five sets of regional climate parameters.
Then, the relationship between region-specific (superscript i) land surface (subscript L) climate and crop-specific (superscript c, including mai, ri1, ri2, soy, swh, and wwh) growing season (subscript gs) climate ( and ) is derived as follows. The growing season variables ( and ) are calculated following the preprocessing steps described in Sect. 2.2:
These parameters are calibrated based on ISIMIP3b climate scenarios across historical and future periods. The chosen concatenation scheme for the fitting process is to merge all historical and future data directly. We demonstrate the limited impact of this choice in the Supplementary Information (SI). Our investigation considers two schemes for data concatenation. First, a direct merge of all historical and future datasets; second, concatenating each future period specifically with its historical counterpart before merging. As illustrated in Figs. S3–S6, the fitting results show only minor sensitivity, indicating that the fitted parameters are largely unaffected by the choice of scheme. Given this minimal impact, the direct merging scheme is adopted for all calibration procedures due to its simplicity.
3.1 Response functions
The crop yield responses (Rc) are calculated by dividing crop yields (YDc) under any given climate and management scenarios by a reference crop yield under a baseline scenario (), as expressed by Eq. (5):
The baseline scenario represents pre-industrial temperature and precipitation conditions (as in OSCAR) combined with 2015 levels of [CO2] and direct human forcing (as defined in the ISIMIP3 experiment design). The total crop yield response can be further broken down into responses to four drivers: [CO2] (), growing season temperature (), accumulated precipitation (), and nitrogen input ():
It should be noted that all the responses are positive by definition. A driver-specific crop yield response with a value greater than 1 indicates a net positive yield impact, while a value less than 1 indicates a net negative yield impact.
Functional forms for crop yield responses differ across crops, irrigation systems, drivers, and regions, as the fundamental purpose of the emulator is to replicate the outputs of process-based crop models with the highest possible fidelity. To fit the specific response function for each crop-irrigation-driver-region combination, we evaluate seven distinct functional forms, including linear and non-linear regression models, to capture monotonic or unimodal relationships between independent and dependent variables. Under reference conditions, the calculated crop yield responses using these functional forms are intrinsically constrained such that the resulting crop yield response equals 1. Detailed information about functional forms and their mathematical properties is given in Table S3. The functional forms represent four characteristic curve shapes: linear (1), exponential (2), peak-and-decline (3, 4, 6), and level-off (5, 7). Functions (2) through (7) are designed to produce non-negative outputs. When function (1) is employed, any negative yield response values are set to zero.
The calibration of the crop emulator represents a substantial advancement in both functionality and regional specificity. Unlike other modules of the current OSCAR model, which apply uniform functional forms across regions and other module-specific dimensions (optimizing for computational efficiency at the expense of regional relevance), our emulator employs different functional form combinations for each region. This approach enhances the accuracy of regional impact representation, enabling a more nuanced and reliable simulation of crop yield responses under diverse environmental and management conditions.
3.2 Emulator development
3.2.1 Initial quality control
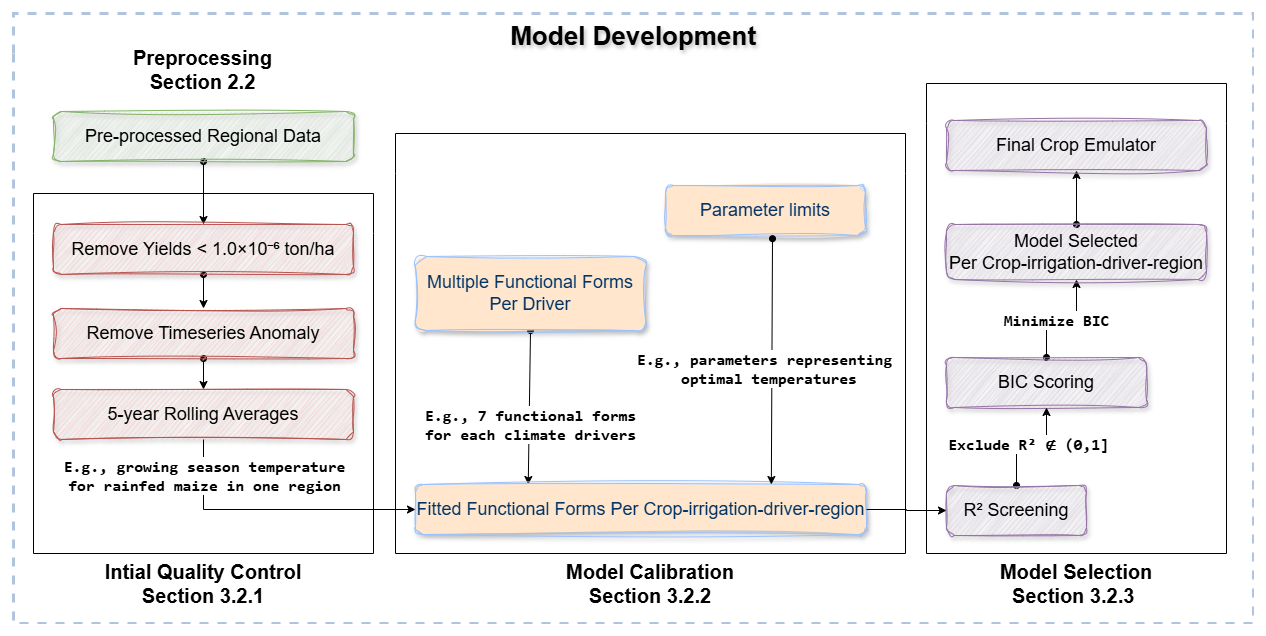
The pre-processed data undergoes initial quality control to remove anomalies or extreme values that could compromise model fitting. After the preprocessing of regional aggregation, the ratios between regional crop yields and their corresponding 5-year rolling averages are calculated before fitting the yield. Data points exhibiting ratios exceeding one order of magnitude (either > 10 or < 0.1) are identified as anomalies in this study and excluded from the training data (Choi et al., 2021). Additionally, all yield values below 1.0 × 10⁻⁶ tDM ha−1 are removed from the dataset to enhance fitting stability. 5-year rolling averages of input and output variables are utilized for subsequent GGCM-based calibration, filtering out short-term data oscillation, as our primary goal is to capture long-term trends and not interannual variability. In the following sections involving GGCMs-related data, original data refers to the regionally aggregated and quality-controlled data, unless stated otherwise.
3.2.2 Parameter limits
To ensure physical validity, parameter limits are integrated into the fitting process of functional forms. Loose upper and lower bounds are imposed on all parameters during the fitting process, informed by prior knowledge regarding the functional form characteristics and the physical interpretation of input variables. For example, in the bell-shaped function (3) (Table S3), the range of parameter β, representing the optimal input level for crop yields, is limited based on established domain knowledge, such as the temperature range for crop growth (Table S4).
3.2.3 Performance metrics
Two metrics, R-squared (R2) and Bayesian Information Criterion (BIC), offering complementary insights, are used to evaluate the emulator's ability to replicate GGCMI Phase 3 simulations during calibration. R2, quantifying the variance explained by the emulator, verifies the emulator's ability to reproduce the behavior of complex crop models. Functional forms yielding R2 values outside the 0 to 1 range, indicative of inappropriate model fitting, are excluded from the final selection. BIC, a widely used statistical criterion for model selection, balances goodness of fit with model complexity by introducing a penalty term proportional to the number of parameters in the model (Hansen, 2008). This penalty discourages overfitting, ensuring that the selected model not only captures the underlying relationships between variables but also generalizes well to unseen data. By minimizing the BIC scores, we identify functional forms that achieve a trade-off between accuracy and parsimony, ensuring the robustness and computational efficiency of the crop emulator for large-scale applications. The final selection of the optimal functional form for each crop-irrigation-driver-region combination is based on the lowest BIC score identified among all evaluated combinations. The model selection workflow is detailed in Fig. 2.
The final selected emulator is further validated against the original GGCMs using an additional metric, the relative root mean square error (RRMSE), which quantifies the average magnitude of errors normalized by the mean of the reference values. This normalization enables comparison across crops, regions, and irrigation setups with different yield magnitudes and emphasizes proportional rather than absolute deviations. RRMSE is widely used for model validation in agriculture and climate sciences (Falconnier et al., 2020; Yang et al., 2025; Zheng et al., 2025).
3.3 Main drivers
3.3.1 Atmospheric CO2 concentrations
[CO2] is an essential driver of crop yield change through the carbon fertilization effect. Many experiments including Free Air CO2 Enrichment (FACE) and Open-Top Chamber (OTC) experiments have proved positive crop yield response to elevated [CO2] (Abebe et al., 2016; Ainsworth and Long, 2021; Bunce, 2016; Cai et al., 2016; Ruiz-Vera et al., 2015). These experiments are conducted under discrete [CO2] levels (normally one ambient [CO2] level and one or two elevated [CO2] levels) using different crop cultivars, mostly in temperate regions with varying soil characteristics, elevation, and regional climate, making it difficult to isolate the impacts of [CO2] across experiments and establish the relationship between [CO2] and crop yield response. Additionally, the experimental elevated [CO2] typically ranges from 550 to 700 ppm, significantly lower than the peak [CO2] assumed in high-emission scenarios like SSP585 (Toreti et al., 2020). Under the new phase of GGCMI, exploring sensitivities of crop yields to [CO2] to account for its large uncertainties became one of the main goals (Jägermeyr et al., 2021).
In the crop emulator, ΔCO2 is the difference between [CO2] and its reference value at the 2015 level (400 ppm) to ensure consistency with the ISIMIP3b sensitivity experiments, as expressed in Eq. (7). This value is further scaled by reference [CO2] for model input. Notably, the difference in pre-industrial [CO2] between ISIMIP3b (285 ppm) and OSCAR (278 ppm) arises from the use of different baseline years – 1850 in ISIMIP3b versus 1750 in OSCAR. Maximum [CO2] in ISIMIP3b experiments reaches 397 ppm (historical), 474 ppm (SSP126), 867 ppm (SSP370), and 1135 ppm (SSP585).
Then, is quantified as the ratios of crop yields between default sensitivity scenarios and corresponding 2015co2 scenarios per region, so that the impact from temperature and precipitation can be offset according to Eq. (6). Figure S7 presents the cumulative probability distribution of regional CO2-induced yield responses across all scenarios and regions, disaggregated by GGCM, irrigation and crop type. The values of 95th percentiles of yield responses across crops and GGCMs remain below 3 (typically value of the response < 2). While extreme yield responses (defined as values > 10) account for only 0.02 % of the data, their potential to skew global aggregated results necessitates further investigations. In addition to extreme values inherited from the original data, the emulated yield response can exceed the threshold of 10 even when the original data remains below this level. We therefore consider extreme-value regions arising from both the original data and the best-fit functions. Table S5 provides a detailed breakdown of the specific GGCM-crop-irrigation combinations with regional occurrences associated with these extremes. Only EPIC-IIASA do not produce extreme regional yield responses. Extreme-value occurrences are substantially fewer for firr crops than for noirr crops. Among noirr crops, CYGMA1p74 (swh) and LPJmL (ri1 and ri2) show the highest regional occurrences of extremes. A sensitivity analysis of extreme-value regions on global aggregated result is given in Sect. S1 in the Supplement.
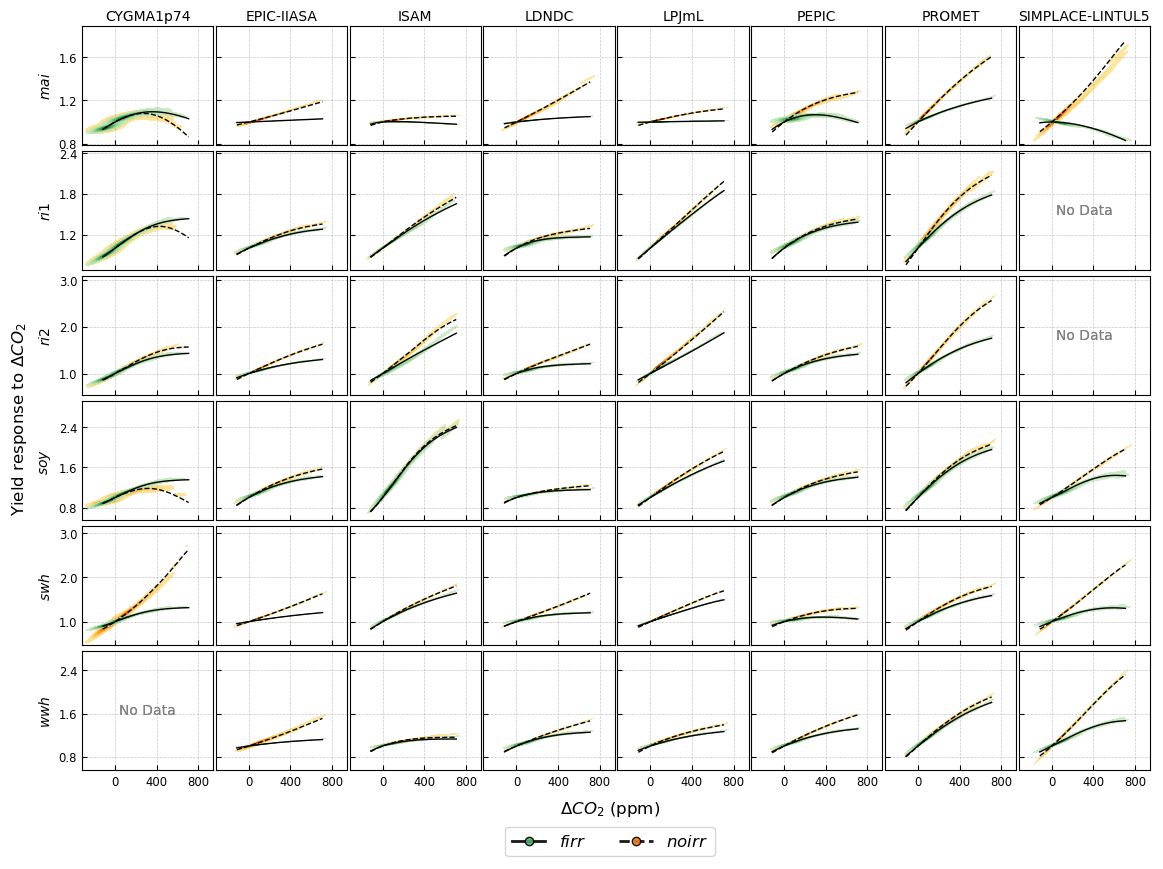
Figure 3Kernel density estimation of global crop yield responses to [CO2] change (ppm) across eight GGCMs under historical, SSP126, SSP370, and SSP585, with extreme-value regions masked. Black lines indicate aggregated results from the crop emulator. Green shades and orange shades represent firr and noirr conditions, separately. Darker shades suggest higher density.
We compare original and emulated global yield responses both with (Fig. 3) and without (Fig. S8) masking these extreme-value regions. Kernel density distributions of ΔCO2 and (shaded areas), derived from original simulations, are shown alongside emulator-based global results (black lines). Reflecting similarities between Figs. 3 and S8, most data cluster around 500 ppm, indicating a strong influence of higher [CO2] in SSP370 and SSP585 on yield responses. CO2 fertilization exerts a more pronounced impact on noirr crop yields than firr crop yields, aligning with the water-saving effects of CO2 fertilization besides higher photosynthesis rates in C3 crops (Deryng et al., 2016; Elliott et al., 2014), though representations of CO2 fertilization effects vary significantly among GGCMs (Jägermeyr et al., 2021; Rosenzweig et al., 2014). Among the crops herein, maize, a C4 crop, exhibits a relatively small yield response to CO2. While a general positive trend of CO2-yield correlation exists, peak-and-decline patterns occur for mai in CYGMA1p74 (both irrigation conditions) and for mai and swh in PEPIC under firr, with SIMPLACE-LINTUL5 simulating a significant decrease in mai yield responses at high [CO2] under firr. Masking extreme-value regions improves the stability of global yield response emulation at high [CO2] for swh in CYGMA1p74 and ri1 in LPJmL than unmasked results. Although the emulation's performance at elevated [CO2] in extreme-value regions is uncertain, we retain the calibrated parameters for these regions in the crop emulator because they reflect the original GGCM simulations. Users of the crop emulator can choose whether to include or disregard results from these regions based on their needs. To mitigate potential bias, this study excludes these regions from regional aggregation during model validation. The strong agreement between kernel density distributions and emulated curves demonstrates the crop emulator's effectiveness in accurately reproducing GGCM behavior.
CO2 impact on crop yields varies regionally as it is subject to the overall climate regime and crop management (Deryng et al., 2016; McGrath and Lobell, 2013). Figure S9 presents emulated regional crop yield responses to ΔCO2 across GGCMs under SSP585. The estimation of end-of-century (2069–2099) crop yield responses is performed by computing the mean yield response under future scenarios. End-of-century standard deviations indicate that emulated yield responses for noirr crops demonstrate greater uncertainty than those for firr crops. Of all emulated crops, soy exhibits the largest range of yield responses across GGCMs and regions, indicating larger inter-model uncertainty, while mai shows the narrowest range, suggesting better consistency. Despite the general trend of yield gains due to CO2 fertilization among all crops (, the standard deviation of net yield responses ( is greater than their average for certain crop-region combinations. For instance, mai yields under firr in all the selected regions, and soy yields under noirr in Brazil and India display net yield response ranges with mixed signs, indicative of potential yield reductions under high [CO2].
3.3.2 Climate
Climate variability accounts for a significant percentage of annual crop yield variance (Anderson et al., 2019; Ray et al., 2015), and the ongoing warming trend exacerbates the yield fluctuations (Ostberg et al., 2018). Field warming experiments generally demonstrate negative yield responses for maize, rice, soybean and wheat under elevated temperatures (Wang et al., 2020; Zhao et al., 2016). Furthermore, the couplings between rising temperature and decreased moisture intensify crop yield sensitivities (Lesk et al., 2021). While extreme weather events pose significant threats to crop production, their impacts and associated crop yield responses are underestimated by climate and crop models (Kornhuber et al., 2023), a factor not explored in this study. In water-limited regions, irrigation is an intensification strategy to enhance crop production under various levels of warming. However, its potential in buffering climate change is constrained by water availability, thereby limiting its agricultural benefits (Elliott et al., 2014; Li and Troy, 2018; Minoli et al., 2019; Wang et al., 2021).
The crop emulator utilizes temperature differences () and relative precipitation changes () as input variables. Reference growing season temperature () and precipitation () are obtained from picontrol climate scenarios.
For firr crops, where water availability is non-limiting, the water stress term in Eq. (6) is excluded (taken equal to 1). Given that nitrogen input is fixed at the 2015 level, meaning also equals to 1 in current ISIMIP3 simulations, is equivalent to the ratio of composite Rc to the fitted for firr crops with . For noirr crops, where the water stress term is not constant, the functions of growing season temperature and precipitation are fitted simultaneously through multivariate regression, as experiments isolating the individual impacts of temperature and precipitation are lacking. The combined effect of and is calculated as . Seven functional forms (Table S3) are applied to each driver, resulting in 49 and 343 possible functional form combinations for firr and noirr crops, respectively, per region. The optimal combinations of functional forms are subsequently determined based on the selection criteria described above.
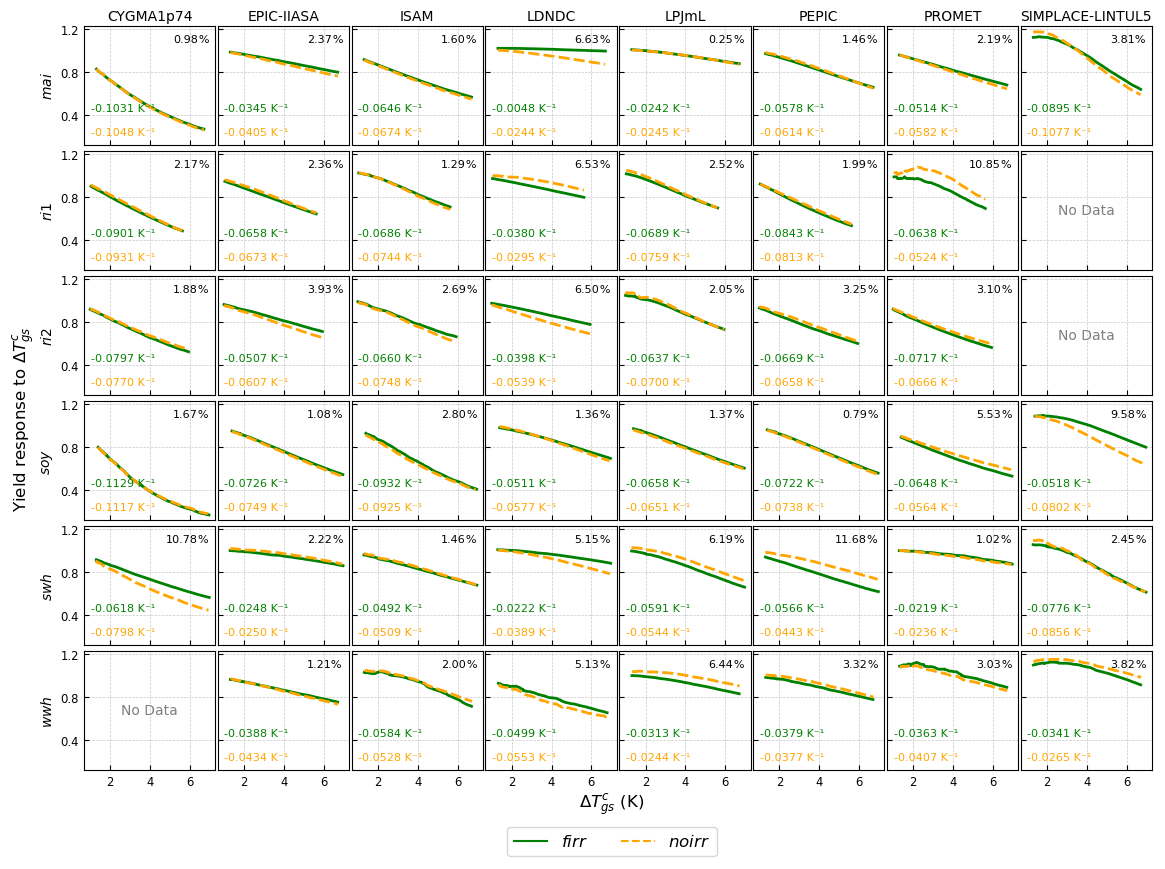
Figure 4Global crop yield responses to growing season temperature change (K) across eight GGCMs (extreme-value regions masked), showing firr (green solid lines) and noirr (orange dashed lines) crop yield response sensitivity to growing season temperature change under SSP585, and RRMSE (%) between firr and noirr crops across GGCM-crop combinations. Sensitivity values for firr and noirr crops are shown in green and orange, respectively, with their RRMSE values reported in the upper-right corner.
Figure 4 displays the emulated global crop yield responses to under SSP585 which shows the widest temperature change among scenarios. Across all GGCMs, rising , caused by increasing land temperature, generally drives yield declines in the emulation. However, crop yields exhibit peak-and-decline trends as growing season temperature increases for some GGCM-crop combinations such as all SIMPLACE-LINTUL5-based crops and PROMET-based wwh. Furthermore, the sensitivity of yield response is quantified as the ratio of yield response differences between 2100 and 2015 to corresponding growing season temperature differences. Under temperature change in SSP585, CYGMA1p74-based emulations show the strongest yield response sensitivities for all crops, except for swh. Among all crops, soy is the most sensitive to rising temperature, while wwh demonstrates more consistent and less sensitive responses. Despite a moderate average response, mai shows more divergent response sensitivities across GGCMs. Globally, firr and noirr crops exhibit generally comparable yield responses induced by across most GGCM-crop combinations, especially for mai in LPJmL and swh in PROMET, as indicated by the smallest RRMSE. More significant divergences emerge for ri1 in PROMET, soy in SIMPLACE-LINTUL5, and swh in CYGMA1p74 and PEPIC.
Regional emulations of crop yield responses to are shown in Fig. S10. End-of-century crop yield responses across the majority of GGCM-crop-irrigation-region combinations suggest a temperature-induced decrease in mai, ri1, ri2, soy, and swh yields across major producing regions, compared to the pre-industrial reference climate. In contrast, potential yield gains are projected for wwh in Russia, predominantly influenced by high emulation results derived from PROMET. Among all crops, end-of-century soy yield is the most negatively impacted by rising temperature, especially in Brazil, the USA, and India, while wwh yield is more resistant to temperature change in most major producing regions, except for India.
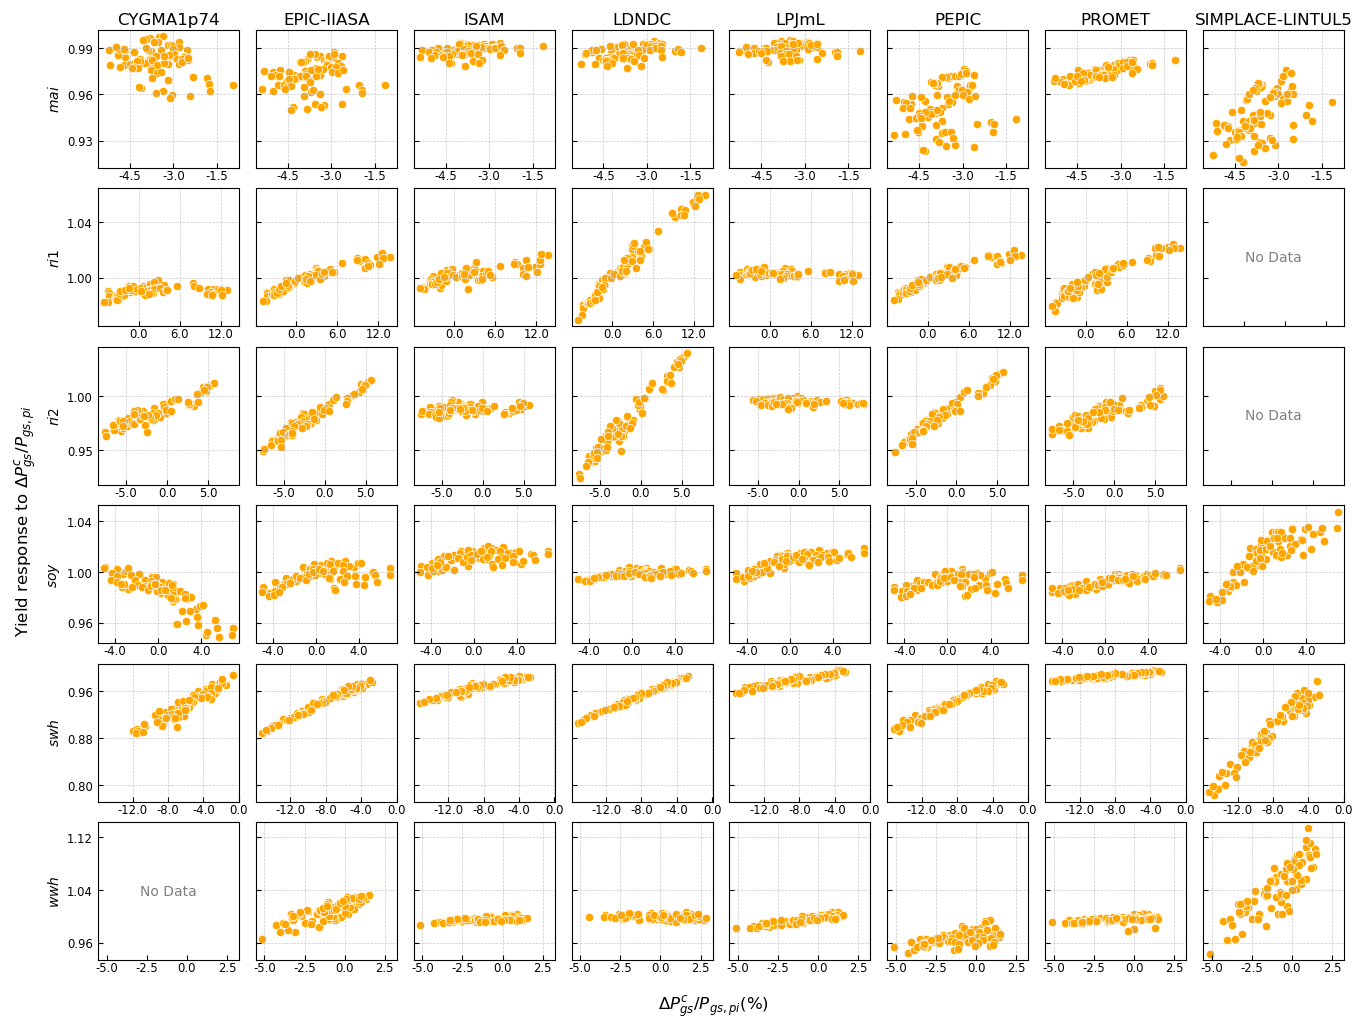
Figure 5Global crop yield responses to relative precipitation change (%) across eight GGCMs under SSP585 (extreme-value regions masked).
The aggregated emulations of global crop yield responses to relative precipitation changes under SSP585 show considerable variability, as depicted in Fig. 5. Most GGCM-crop combinations indicate positive yield responses to increased precipitation. Notably, there is a significant increasing trend of swh yield responses across all GGCM-based emulations. However, global soy yield responses emulated from CYGMA1p74 decrease with enhanced precipitation, consistent with the findings that excessive water reduces legume yields (Iizumi et al., 2024). Additionally, global mai and soy yield responses show substantial inter- and intra-GGCM uncertainties. These patterns underscore the necessity of representing the spatially heterogeneous nature of precipitation changes and corresponding impacts.
Figure S11 illustrates the emulated regional noirr yield responses to relative growing season precipitation change. Under SSP585, global end-of-century swh yield exhibits the greatest response to precipitation change, followed by mai. At the regional level, mai and swh in EU27 show significant negative impacts from precipitation, whereas mai and soy in Argentina, and swh and wwh in China benefit from precipitation increase. Notably, SIMPLACE-LINTUL5-based emulations consistently predict the most pronounced yield responses to precipitation for mai, swh and wwh across most major production regions.
3.3.3 Nitrogen input
Nitrogen fertilizer significantly influences crop yields, particularly in nitrogen-limited regions like Africa (Falconnier et al., 2020; Olin et al., 2015). Nitrogen management, balancing use efficiency and environmental impact, has become a central focus in the development of sustainable agricultural practices (Springmann et al., 2018; Wang et al., 2019). While the interaction between the nitrogen cycle and climate affects the nitrogen uptake by crops (Liu et al., 2024; Wang et al., 2025), GGCM-based simulations exploring crop yield responses to varying nitrogen fertilizer applications remain insufficient to support robust emulation. During GGCM Phase 1, historical crop yields were simulated under three harmonization levels with model-specific assumptions about nitrogen stress (Elliott et al., 2015; Müller et al., 2019). GGCMI Phase 2 simulations evaluated crop yield responses to three discrete nitrogen fertilizer input levels; however, the limited sample size precludes reliable model fitting (Franke et al., 2020a, b). In GGCM Phase 3, the impact of nitrogen fertilizer is not considered in the available simulations, as fixed nitrogen input levels according to present spatial patterns are applied across all historical and future scenarios.
To facilitate nitrogen impact assessment in the crop emulator, data from long-term field experiments are employed to quantify crop yield responses to nitrogen inputs following van Grinsven et al. (2022), where the relationship between nitrogen inputs and crop yield response is described by a quadratic function for cereal crops, assuming constant soil nitrogen supply during the experimental periods. As for nitrogen-fixing soybeans, biological nitrogen fixation (BNF) exhibits a negative correlation with fertilization rate (Ma et al., 2022; Salvagiotti et al., 2008), leading to large uncertainty in the prediction of soybean yield response to nitrogen (Luiz et al., 2023; Pannecoucque et al., 2022). Furthermore, the variability in soybean yields attributed to nitrogen management is marginal compared to climatic and irrigation factors (Mourtzinis et al., 2018). Consistent with this, an existing GGCMI Phase 2 crop emulator indicates a very limited GGCM-based nitrogen response for soybean (Franke et al., 2020a; Liu et al., 2023). Therefore, nitrogen input is not considered a yield determinant for soybean in our crop emulator for now, resulting in a constant yield response ().
For cereal crops in the emulator, total nitrogen input comprises fertilizer application, BNF, and atmospheric deposition (Zhang et al., 2015). Nitrogen fertilization rates are spatially and temporally variable throughout the historical period. BNF for non-symbiotic cereal crops is assumed to be crop- and region-specific and constant over time (Ladha et al., 2022). Also, nitrogen deposition is treated as static, despite observed temporal variations (Ackerman et al., 2019; Yu et al., 2019).
Crop-specific response functions are refitted using Michaelis-Menten, Mitscherlich, and George models (Table S6), replacing the generic second-order polynomial form utilized in the original study to ensure non-negative yield responses. The optimal functional form is subsequently selected based on the R2 and BIC criteria discussed previously. Due to the limited size of sampling data, the response function for the nitrogen driver is not region-specific. To ensure consistent estimation of total nitrogen input, the extrapolated left x-intercept of the second-order polynomial function is used to approximate soil nitrogen supply during the fitting of nitrogen yield responses using the three alternative models. The nitrogen inputs are normalized by a scaling factor of 100 kgN ha−1 () to ensure physical interpretability of the exponent in the George model. As illustrated in Fig. 6, both 2nd order and George models exhibit peak-and-decline yield response. Michaelis-Menten and Mitscherlich models level off after nitrogen input exceeding 200 kgN ha−1, aligning with the saturation effect of nitrogen input for GGCMI Phase 2 emulators (Franke et al., 2020a). Similarly, simulated global wheat yield responses to increasing nitrogen fertilizer application rates also saturate at approximately 200 kgN ha−1 for wheat (Martre et al., 2024).
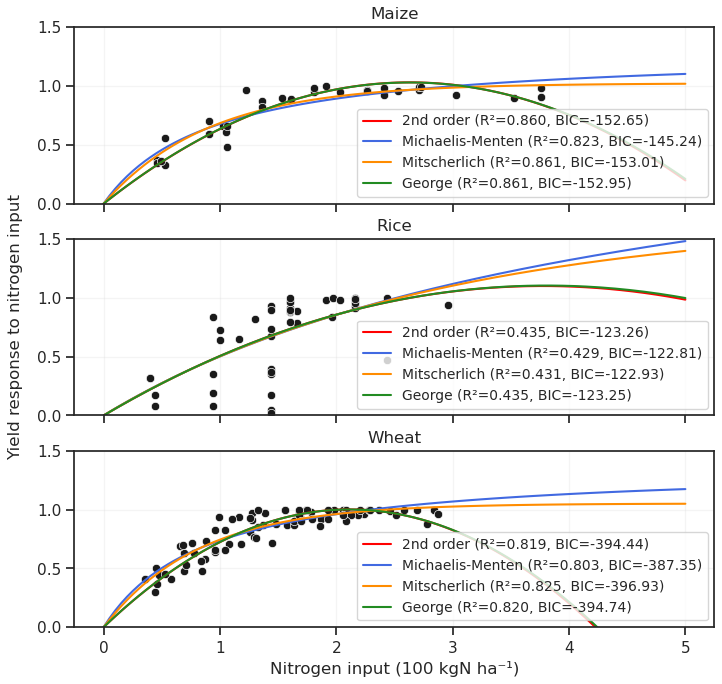
Figure 6Crop-specific yield responses to nitrogen inputs (100 kgN ha−1). Maize and wheat data are from van Grinsven et al. (2022) Table S2; rice data compiled from sources in Note 8.
While there might be negative impacts of nitrogen fertilizer on crop yields (van Grinsven et al., 2022; Maaz et al., 2021), current GGCMs don't incorporate functions resulting in yield penalties at high nitrogen inputs. Moreover, excessive nitrogen application rate above 450 kgN ha−1 results in zero yield for wheat in the 2nd order and George models, which is not typically observed in experiments or real-life applications (Yokamo et al., 2023). Therefore, Mitscherlich function with better performance is selected to represent the nitrogen-yield response in the crop emulator.
4.1 In-sample validation
To examine the validity of the crop emulator, the RRMSEs between our emulations and the original ISIMIP3b GGCM simulations across all climate scenarios are calculated at different regional levels. As depicted in Fig. 7, RRMSEs for global crop yields across all GGCM-crop-irrigation combinations remain below 12 %, with most values clustered below 5 %. Under firr, mai exhibits the widest range of RRMSE across GGCMs, whereas soy and swh show tighter distributions. Under noirr, swh displays the largest spread and the highest RRMSE derived from SIMPLACE-LINTUL-based results, while the RRMSE distribution for ri1 is the most compact. The lowest errors are consistently associated with LDNDC-based mai, ri1, ri2, soy and swh yields under firr. Overall, our crop emulator reproduces the GGCM outputs with high fidelity on a global scale.
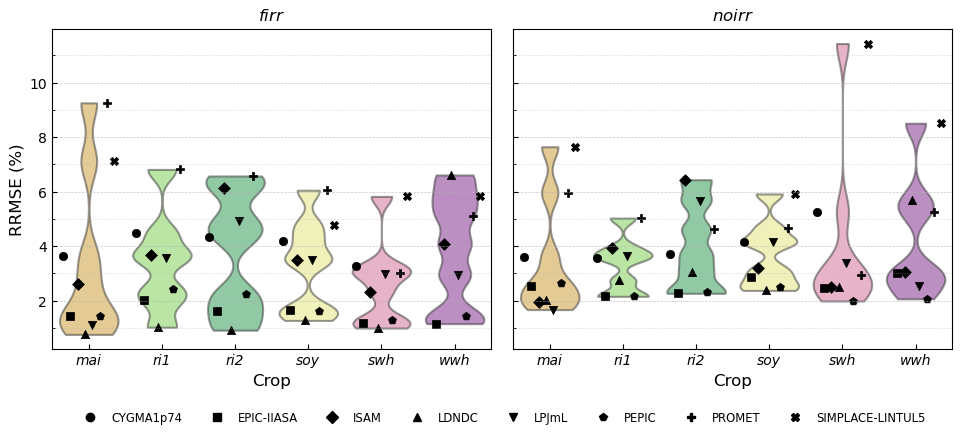
Figure 7RRMSE (%) between global area-weighted emulated and original crop yields across crop-GGCM combinations under historical, SSP126, SSP370, and SSP585 scenarios. For each crop, the markers along the horizontal axis follow the alphabetic order of the eight GGCMs.
Moreover, the RRMSE for the six producing regions is visualized as heatmaps in Fig. 8. Most GGCM-irrigation-crop-region combinations exhibit low RRMSE values (< 10 %) between the emulated and original simulation results, especially for ri1 yields which displays good consistency across GGCMs, irrigation regimes, and regions. Regionally, the RRMSE values for the rest of the world (R6) are consistently low. Under noirr, swh and wwh yields in India, as well as ri2 yields in Bangladesh demonstrate relatively large deviations from original GGCMs. Under firr, wwh yields in India exhibit moderate RRMSEs. Notably, CYGMA1p74-based swh yields in India under noirr shows the highest RRMSE, reaching 41 %. In addition, SIMPLACE-LINTUL5-based emulations for mai, swh, and wwh under noirr show comparably high RRMSE values. Overall, our crop emulator demonstrates robust performance over the most important producing regions.
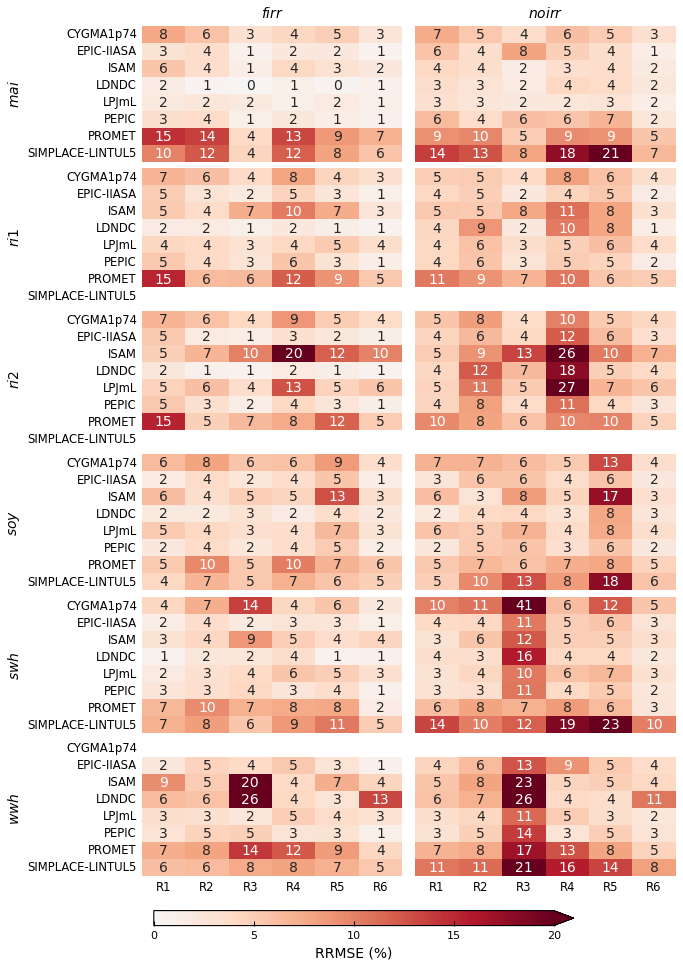
Figure 8RRMSE (%) between emulated and original crop yields in six producing regions (R1 to R6 from Table S1) for each crop-GGCM combination under historical, SSP126, SSP370, and SSP585 scenarios.
To provide a more detailed assessment of the crop emulator's performance at its native spatial resolution, Figs. S12–S19 present sub-national, end-of-century crop yield differences between our emulations and original simulations under SSP585. These figures are accompanied by the global weighted absolute and relative yield differences, the latter given in percentages. Under SSP585, the extreme changes in [CO2], temperature, and precipitation lead to correspondingly large variations in crop yield responses. At the crop emulator's finest regional scale, absolute crop yield differences are less than 0.5 tDM ha−1 for the majority of GGCM-crop-irrigation combinations, demonstrating the emulator's capability to reproduce the results of GGCMs at a sub-national level. When aggregated globally, the largest absolute global yield difference occurs in SIMPLACE-LINTUL5 for swh yield under noirr, resulting in a relative yield difference of less than 8 % between our emulator and the original GGCM (Fig. S19), while ISAM for mai yield under noirr shows the smallest relative yield difference (Fig. S14). The low percentage of yield differences relative to original yields suggests that the discrepancies between emulated and original end-of-century yields are, for the most part, negligible. Overall, the emulation results at both sub-national and aggregated levels show good consistency with the original GGCMs' simulations in terms of general trends and absolute values.
These results also illustrate the interaction effects inherent in our multiplicative model structure. The SSP585 scenario represents a high-stress regime where elevated CO2, high temperatures, and potential drought conditions co-occur – precisely the conditions where interactions between drivers are expected to be largest. The good agreement between emulator and GGCM outputs under this extreme scenario indicates that the implicit interactions arising from our nonlinear component functions capture the coupled responses present in the original process-based models.
4.2 Out-of-sample validation
To further validate our crop emulator, historical simulations are performed using observation-driven ISIMIP3a GSWP3-W5E5 climate data as inputs. Daily climate variables are preprocessed into annual resolution and then offset by subtracting their averages over the 1901–1930 period (approximating pre-industrial baseline climate). The pattern scaling method (Sect. 2.2) is then applied to derive regional and growing season climate variables within the crop emulator. The resulting outputs, averaged over the period of 1980–2010, are compared against original ISIMIP3a historical simulations. Because the emulator is calibrated using simulations from multiple GGCMs simultaneously, it is designed to reproduce the collective response space of the GGCM ensemble rather than the behavior of any individual model. The out-of-sample validation therefore evaluates emulator performance under independent climate forcings while remaining within the range of crop responses represented by the GGCM ensemble.
Global maps in Fig. 9 show the ensemble means of the yield differences between our emulations and GGCM simulations, which are generally within ±0.5 tDM ha−1 among most national or sub-national regions. Among top five producing regions, the most significant underestimation of multi-model mean occurs for mai yields under noirr in Argentina with an absolute yield difference of −0.6 tDM ha−1. The violin plots in Fig. 9 reveal that global SIMPLACE-LINTUL5-based crop yields exhibit the largest relative deviations from the original GGCM under both firr and noirr, except for ri1 and ri1 which SIMPLACE-LINTUL5 does not simulate. For ri1 and ri2, the PROMET-based and CYGMA1p75-based results show the most significant deviations from the original GGCMs under firr and noirr, respectively. Notably, the crop emulator demonstrates the highest consistency with GGCMs for global wwh yields under noirr, indicated by the smallest range of global relative yield difference in the violin plot, while the largest discrepancy is observed for global ri2 yields under firr. Generally, the multi-model means show small differences between the crop emulator and original GGCMs during the recent decades.
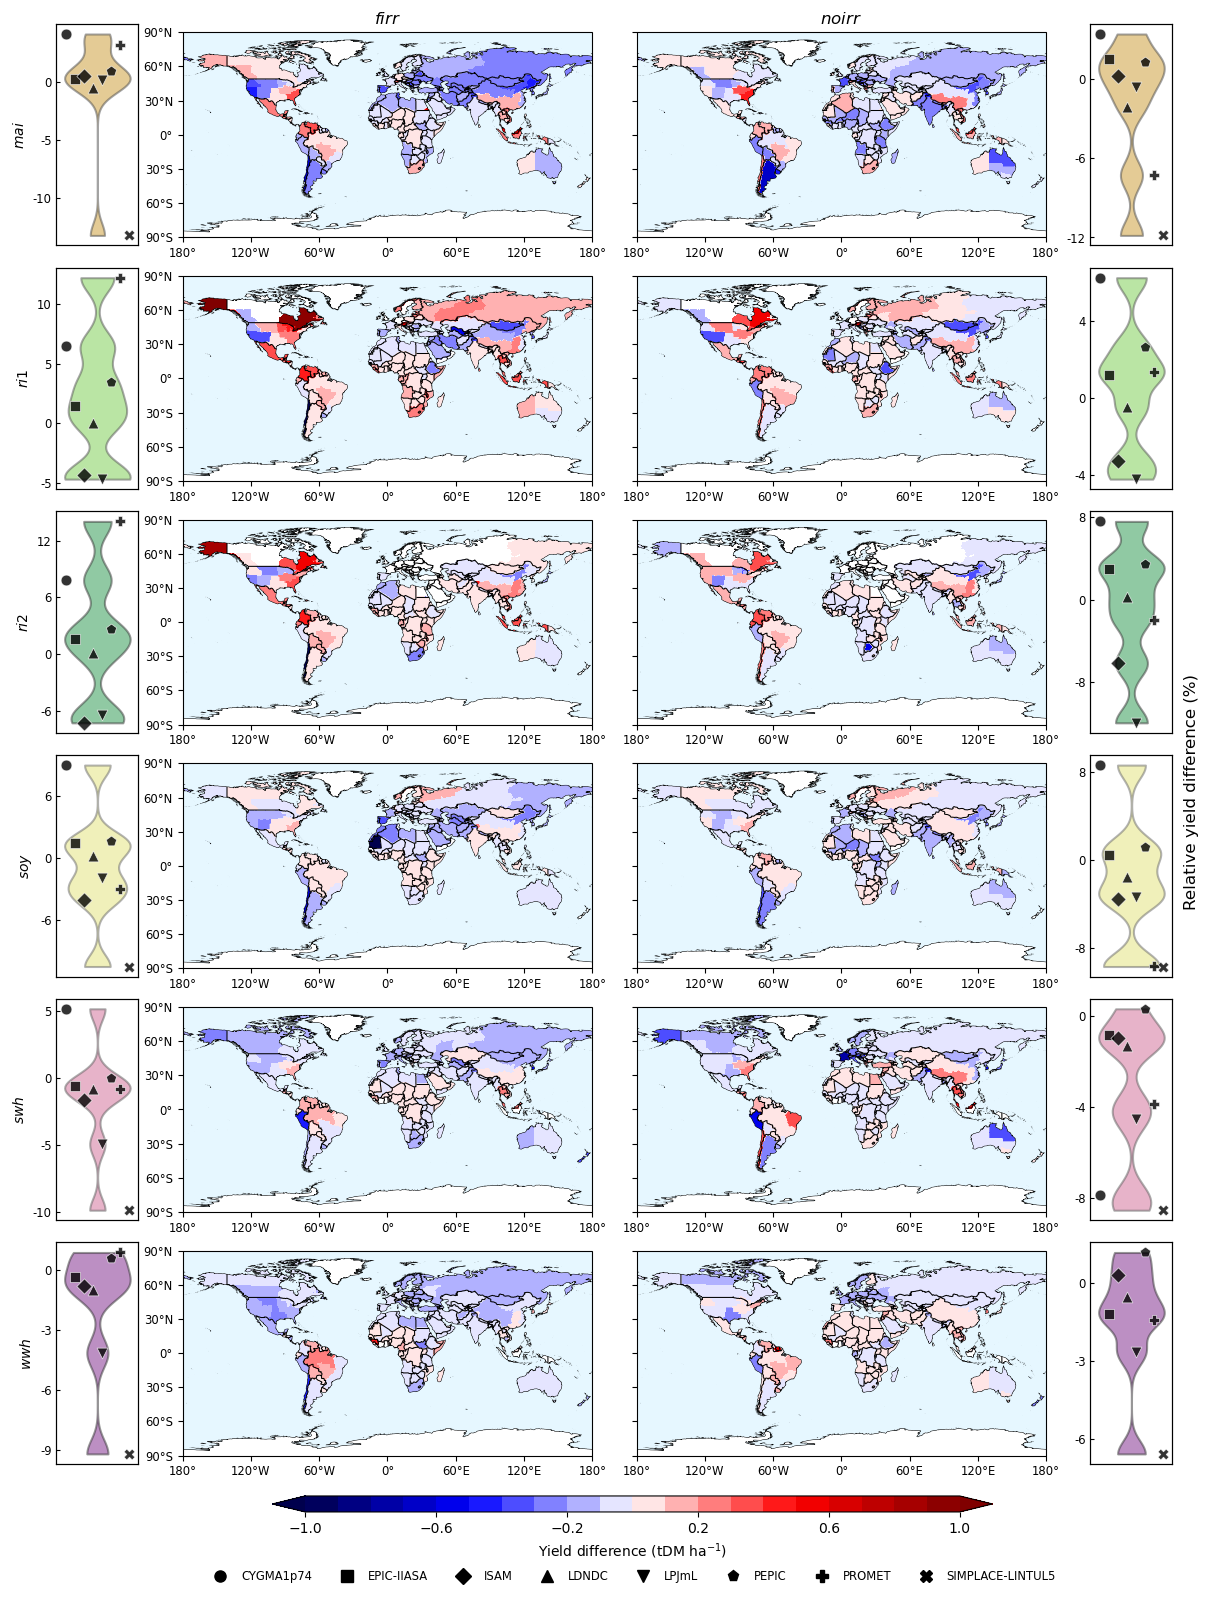
Figure 9Yield differences between crop emulator and original ISIMIP3a historical simulations shown as: global maps of GGCM-averaged sub-national absolute differences (tDM ha−1) and violin plots of relative differences (%) for global average values across crop-GGCM combinations. For each crop in the violin plots, the markers along the horizontal axis follow the alphabetic order of the eight GGCMs.
Individual GGCM-emulator yield discrepancies are displayed in Figs. S20–S27. Our emulator exhibits the largest absolute underestimation for SIMPLACE-LINTUL5 mai yields under firr, where the percentage of global yield difference is approximately −13 % (Fig. S27). Nevertheless, the most significant relative yield difference is observed for PROMET ri2 yields under firr, where the relative percentage difference is around 14 % (Fig. S26). Compared with original GGCMs, the crop emulator tends to overestimate CYGMA1p74 crop yields in the recent historical period, with a less than 10 % increase in the global crop yield estimations (Fig. S20). On the contrary, SIMPLACE-LINTUL5 regional emulations are generally lower than the original results (Fig. S27). The crop emulator demonstrates high performance for EPIC-IIASA, LDNDC, and PEPIC emulations, with absolute yield differences being less than 5 % of the GGCMs' results. A comparison of the multi-model ensemble average with individual GGCM outputs demonstrates both the robustness of ensemble-based projections and the emulator's fidelity in replicating complex model behavior.
5.1 Comparison with field experiments
To ground the emulator's projections in real-world experimental evidence, distributions of crop yield sensitivities derived from FACE, OTC, and field warming experiments are compared with diagnostic outputs from the crop emulator. This sensitivity analysis is conducted at global scale, with regional outputs from the emulator aggregated before comparison. For CO2 fertilization effects, crop yield sensitivities to elevated [CO2] are quantified by first computing the relative yield difference between a historical baseline period (1991–2010) and a future period under the SSP585 high-emissions scenario, characterized by the experiments' elevated [CO2] levels. This relative difference is then normalized by the [CO2] increment, thereby aligning the emulator-based sensitivities with the experimental design of FACE and OTC studies in which ambient [CO2] typically ranges from 320–420 ppm and elevated levels span 500–800 ppm. A 20-year analysis window under SSP585 is dynamically selected to match the [CO2] enrichment levels observed in experiments. For example, if experimental studies for maize report an average enrichment of +200 ppm, the emulator's future period is chosen as the 20-year interval in which SSP585 [CO2] levels are closest to the historical baseline plus 200 ppm. A similar approach is applied to temperature sensitivity. Experimental yield sensitivities to warming are compared against emulator-based sensitivities, calculated as the relative yield change per degree Kelvin increase in growing season temperature.
To generate the probabilistic distribution of yield sensitivities, the emulator is run with a Monte Carlo (MC) ensemble of 1000 parameter configurations. Input datasets are consistent with those of ISIMIP3b. Parameters are randomly drawn from five regional and growing-season parameter sets and eight crop yield response parameter sets. To extend parametric uncertainty, each sampled parameter value is perturbed by an additional noise covering a 10 % relative standard deviation, thereby capturing a wider range of plausible yield responses.
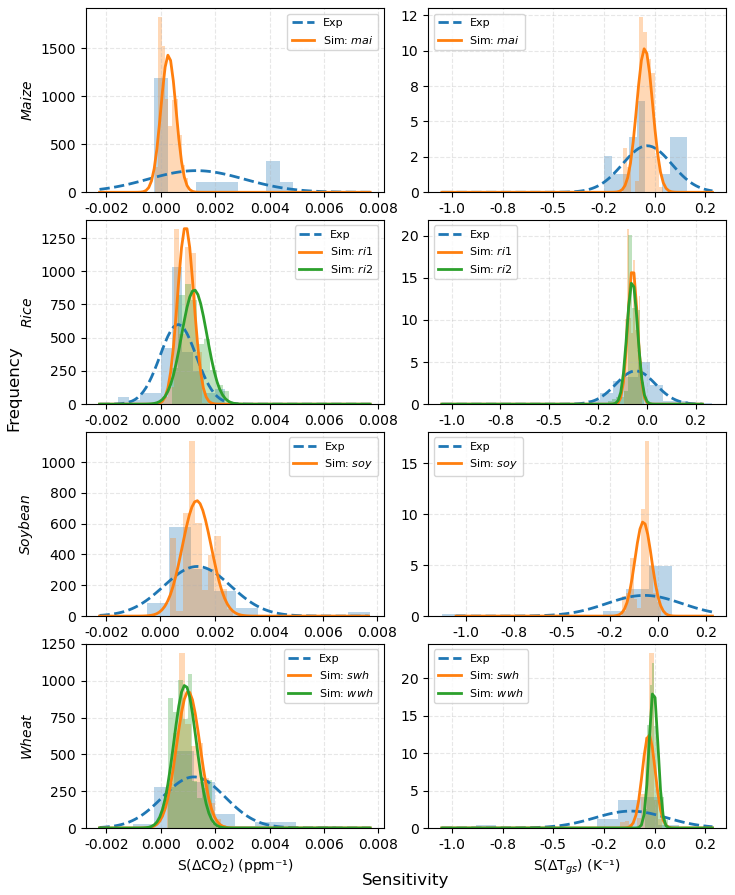
Figure 10Frequency (patches) and corresponding fitted normal distributions (lines) of global crop yield sensitivities to elevated [CO2] and growing season temperature from experiments (dotted blue lines) and simulations (solid lines) from the crop emulator.
Figure 10 presents the distributions of global crop yield sensitivities to elevated [CO2] and growing season temperature. Overall, the emulator's yield sensitivity estimates demonstrate good agreement with experimental results in terms of the average values. Compared to field experiments, emulator-derived sensitivities exhibit narrower distributions, suggesting the GGCMs may not cover the full range of possibilities measured in the field. Field experiments reveal greater uncertainty in maize crop yield sensitivities to [CO2], with the emulator-based sensitivities aligning with the majority of experimental data. While the experimental data employed does not distinguish between the two rice growing seasons or the spring and winter wheat types, higher sensitivity to [CO2] for ri2 than ri1 is identified based on the crop emulator, whereas the sensitivity to growing season temperatures is comparable for both growing seasons. For the two wheat types, swh displays a higher sensitivity to [CO2] than wwh, and its negative response to growing season temperature for swh is also more pronounced than that of wwh. The substantial consistency observed between the emulated and experimentally derived crop yield sensitivities provides compelling evidence for the robust performance of the emulator in representing real-world crop yield behavior under changing climatic conditions, although this could be expected as GGCMs are calibrated on this or similar observational data.
5.2 Comparison with FAOSTAT
Historical simulations incorporating dynamic climate forcing and both time-varying or fixed 2015-level nitrogen inputs are conducted to enhance our crop emulator's real-life applicability. Temperature and precipitation inputs are taken from 20CRv3-ERA5 (Compo et al., 2011; Hersbach et al., 2020; Slivinski et al., 2019) and CRU-TS4.09 (Harris et al., 2020) for the period 1901–2021, with the 1901–1930 average climate used as the pre-industrial baseline to calculate temperature and precipitation changes. Crop-type-specific nitrogen fertilizer application rates from LUH2 (Hurtt et al., 2020) and crop-specific nitrogen fertilizer application rates from GGCMI Phase 3 (Heinke et al., 2021) are employed to better represent regional and crop-type disparities in nitrogen inputs. Since both datasets lack data beyond 2015, nitrogen inputs for 2015–2021 are estimated using 5-year rolling totals from FAO, scaled by the nitrogen application ratios between FAO and the two datasets over the 2010–2014 period. For direct comparison with FAO statistics, simulated yields for ri1 and ri2 are aggregated based on their respective harvested areas (Jägermeyr et al., 2021; Laborte et al., 2017; Waha et al., 2020), with a similar aggregation approach applied to swh and wwh (Becker-Reshef et al., 2023). Furthermore, firr and noirr crop yields are combined based on irrigated fractions of cropland (Frieler et al., 2024). Following this post-processing, the yields of the four major crops are validated against FAO records, using only countries with valid data from both FAO and our emulations to avoid mismatches.
Including nitrogen substantially improves the crop emulator's capability to replicate historical crop yield trends as shown in Fig. 11, where the lines exhibit multi-ensemble mean crop yields, and the shades show the ±1 standard deviation uncertainty range induced by 1000 MC configurations. Without nitrogen inputs, simulated yields exhibit notable discrepancies from FAO data, particularly in capturing temporal trends, highlighting nitrogen's key role in historical yield changes. Maize, rice, and wheat yield trends are well-captured with nitrogen inputs. In some crop-region combinations, such as rice in Indonesia, the emulated crop yields with nitrogen impact are highly consistent with FAO data, indicating a significant improvement in crop yield dynamics after nitrogen impact. Nevertheless, rice yields are well estimated across most major producing regions, while soybean yields are overestimated under the assumption of insignificant nitrogen soybean yield responses as described previously. Stagnant or declining yields in several regions are estimated by the crop emulator since 1990s such as maize in the USA and EU27, in consistent with the findings of yield stagnation in some major crop growing regions (Gerber et al., 2024; Ray et al., 2012), while the FAO data suggest continued increase in yield in the meantime.
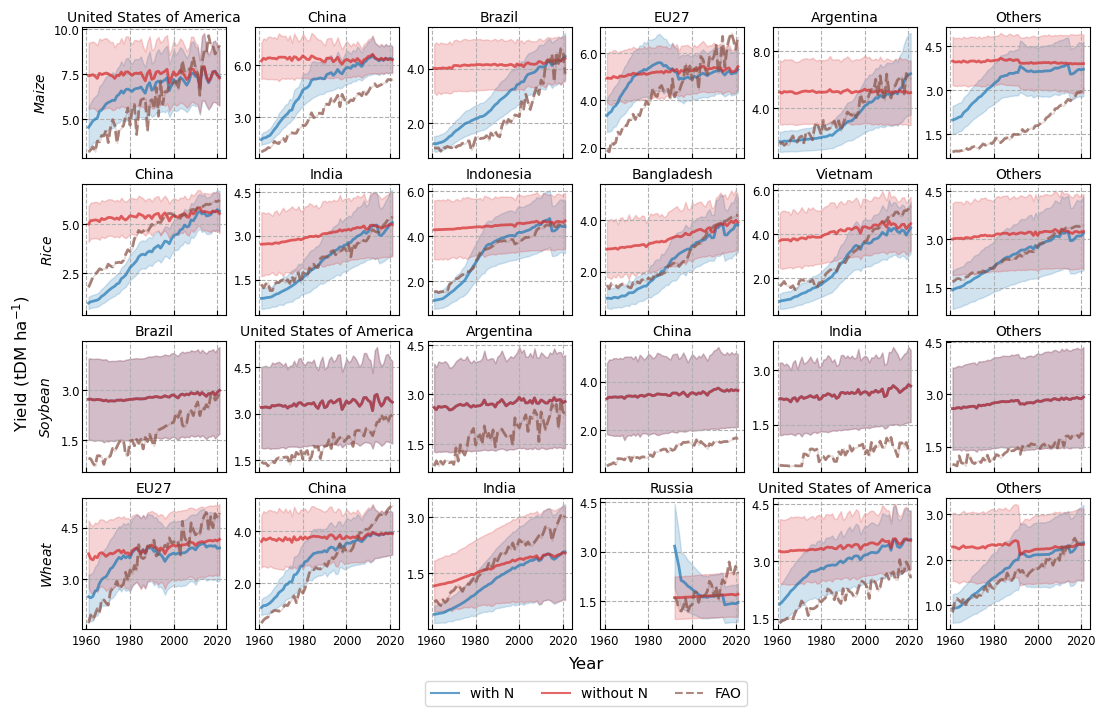
Figure 11Regional crop yields (tDM ha−1) of maize, rice, soybean and wheat simulated by the crop emulator. Blue lines represent simulations with nitrogen impacts, and red lines represent simulations without nitrogen impacts. FAO data are shown as brown dotted lines. The shaded areas indicate ±1 standard deviation of uncertainty arising for multi-model differences embedded in the crop emulator.
Moreover, discrepancies between simulated and FAO yields arise from several factors. While the emulator accounts for nitrogen inputs, it currently does not incorporate other influencing factors such as labor availability, cultivar improvements, adaptation-related crop calendar and growing region shifts, or pesticide/herbicide use, all of which impact yield outcomes (Abramoff et al., 2023; Yang et al., 2024). Also, triple-cropping of rice in South Asia, where rice yields and productions are high, is not represented in current GGCMs thus not included in the crop emulator. Furthermore, the crop emulator's current formulation does not consider the impact of extreme weather events and therefore only represent multi-year trends. This limitation comes from both the modeling paradigm of OSCAR and the limited capacity of GGCMs to accurately simulate these phenomena (Liu et al., 2023). Additional sources of uncertainties encompassing the input datasets, such as fertilizer inputs and irrigated land fractions, also contribute to the discrepancies. Despite these limitations, the crop emulator effectively demonstrates its ability to reproduce some key temporal yield patterns that show good consistency with observations during the historical period.
This study presents the development and evaluation of a sub-national scale crop yield emulator integrated within the compact Earth system model OSCAR. By leveraging outputs from eight state-of-the-art GGCMs driven by five CMIP6 ESMs, the emulator simulates yields of four major crops under varying climatic and management conditions. Through a multi-step calibration process and the statistical selection of empirical functional forms, the emulator captures key biophysical yield responses to [CO2], growing season temperature, water availability, and nitrogen inputs. The emulator's region-specific functional forms and sub-national resolution offer significant advantages in terms of regional representation, overall performance, and policy relevance.
Performance evaluations against GGCMI Phase 3b (in-sample) and GGCMI Phase 3a (out-of-sample) simulations confirm the emulator's ability to precisely replicate complex crop model behavior. Correlation coefficients across most regions and GGCMs are good, and the emulator effectively reproduces yield distributions at global and regional scales. Importantly, the comparison with field experiments corroborates the emulator's robustness. Comparisons with FAO data further validate the importance of nitrogen representation in the emulator to reproduce observed historical yield patterns, although there remains room to introduce additional driving factors to better reproduce these historical yields.
One of the key strengths of the crop emulator lies in its balance between biophysical accuracy and computational efficiency, making it especially suitable for large-scale scenario analysis, probabilistic impact assessments, and integration into SCMs or integrated assessment models (IAMs). For example, reanalysis of existing scenario databases, such as the Sixth Assessment Report (AR6) scenario database (Kikstra et al., 2022), can provide insights into disparities between projections made by IAMs and GGCMs (Calvin and Fisher-Vanden, 2017). The emulator also enables assessment of negative emissions derived from crop residues utilized for bioenergy under various land-use scenarios (Xu et al., 2022). Coupling or linking the emulator with IAMs can further improve their representation of climate impacts on agriculture (Ruane et al., 2017). The probabilistic framework, based on Monte Carlo sampling, enables ensemble projections that capture uncertainty across multi-model specifications (Gasser et al., 2017; Quilcaille et al., 2023), thereby informing risk assessments and scenario planning (Kephe et al., 2021; Lesk et al., 2022). Moreover, the emulator's regional flexibility and resolution allow for detailed assessments of spatial yield variability and inter-country differences, which are often critical for regional policy and adaptation strategies.
Despite its strengths, the current version of the emulator lacks some socioeconomic drivers such as seed technology (e.g., Hasegawa et al., 2019), pest and disease management (e.g., Sheng et al., 2025), and labor availability (Orlov et al., 2024; Sheng et al., 2025), all of which may influence crop yield dynamics. These factors are closely linked to Agricultural Research and Development (R&D), which is recognized as a key driver of yield growth (Hultgren et al., 2025; Iizumi et al., 2025). Additionally, while the emulator simulates nitrogen impacts using long-term field experiments, uncertainty remains for crops like soybeans that rely on biological nitrogen fixation (Mourtzinis et al., 2018).
While our emulator aims to represent real-world conditions, the fully irrigated (firr) assumption implies irrigation water is supplied whenever required to prevent soil moisture stress. This simplification does not reflect real-world irrigated croplands, where water resources and infrastructure constrain irrigation (Elliott et al., 2014). Moreover, it should be noted that the emulator is suited for applications focusing on long-term climate responses and scenario exploration rather than assessments of extreme events such as droughts and heatwaves (Lesk et al., 2016; Zampieri et al., 2017).
Future work should aim to enhance the crop emulator's versatility and accuracy by (1) incorporating additional agronomic adaptation practices, such as crop switching (Kling et al., 2024); (2) extending the crop emulator to include bioenergy crops to improve its relevance for the IAM community (Ewert et al., 2015); (3) integrating higher-quality inputs including land-use and crop calendar data to improve the parameterization and interpretation (Nóia-Júnior et al., 2025); and (4) implementing crop-specific thresholds for extreme climate events to facilitate more detailed assessments of risk management (Hasegawa et al., 2021; Nóia-Júnior et al., 2025).
In conclusion, the crop emulator developed in this study demonstrates strong capability in reproducing GGCM simulations, offering a computationally efficient yet accurate tool for projecting crop productivity under climate change. Its integration into OSCAR paves the way for comprehensive assessments of future food security and land-based mitigation strategies in Earth system modeling frameworks. Continued refinement and expansion of this emulator will enhance its utility for informing policy and research at global, regional, and sub-national levels.
The OSCAR-crop emulator source code, scripts and input data are publicly available at GitHub repository: https://github.com/Xinrui-Rea/OSCAR-crop (last access: 1 July 2026). A frozen version of the code and data can be found on Zenodo at https://doi.org/10.5281/zenodo.17228924 (Liu, 2025).
The supplement related to this article is available online at https://doi.org/10.5194/gmd-19-5857-2026-supplement.
XL and TG conceptualized the study. XL developed the model, conducted simulations and analysis, and wrote the original draft. TG, JM and JL supervised this work. JJ, CM, CF, FZ, AKJ, WL and HW provided critical expertise in GGCMs and result interpretation. All authors reviewed and edited the manuscript.
At least one of the (co-)authors is a member of the editorial board of Geoscientific Model Development. The peer-review process was guided by an independent editor, and the authors also have no other competing interests to declare.
Publisher's note: Copernicus Publications remains neutral with regard to jurisdictional claims made in the text, published maps, institutional affiliations, or any other geographical representation in this paper. The authors bear the ultimate responsibility for providing appropriate place names. Views expressed in the text are those of the authors and do not necessarily reflect the views of the publisher.
JJ was supported by the NASA GISS Climate Impacts Group, the Future of Life Institute, Columbia University, and the US Department of Agriculture. CF was supported by the Austrian Science Fund (grant no. 10.55776/P36220) and the Future of Life Institute. WL was supported by the National Natural Science Foundation of China (grant nos. 52239002 and 32361143871). We thank GGCMI Phase 3 modelling teams for the simulations.
This research has been supported by the National Key Research and Development Program of China (grant no. 2023YFE0112900) and the HORIZON EUROPE Climate, Energy and Mobility (grant no. 101056939).
This paper was edited by Amos Tai and reviewed by Eun-Sung Chung and one anonymous referee.
Abebe, A., Pathak, H., Singh, S. D., Bhatia, A., Harit, R. C., and Kumar, V.: Growth, yield and quality of maize with elevated atmospheric carbon dioxide and temperature in north-west India, Agric. Ecosyst. Environ., 218, 66–72, https://doi.org/10.1016/j.agee.2015.11.014, 2016.
Abramoff, R. Z., Ciais, P., Zhu, P., Hasegawa, T., Wakatsuki, H., and Makowski, D.: Adaptation Strategies Strongly Reduce the Future Impacts of Climate Change on Simulated Crop Yields, Earths Future, 11, 2022–003190, https://doi.org/10.1029/2022EF003190, 2023.
Ackerman, D., Millet, D. B., and Chen, X.: Global Estimates of Inorganic Nitrogen Deposition Across Four Decades, Global Biogeochem. Cy., 33, 100–107, https://doi.org/10.1029/2018GB005990, 2019.
Ahvo, A., Heino, M., Sandström, V., Chrisendo, D., Jalava, M., and Kummu, M.: Agricultural input shocks affect crop yields more in the high-yielding areas of the world, Nat. Food, https://doi.org/10.1038/s43016-023-00873-z, 2023.
Ainsworth, E. A. and Long, S. P.: 30 years of free-air carbon dioxide enrichment (FACE): What have we learned about future crop productivity and its potential for adaptation?, Glob. Change Biol., 27, 27–49, https://doi.org/10.1111/gcb.15375, 2021.
Anderson, W. B., Seager, R., Baethgen, W., Cane, M., and You, L.: Synchronous crop failures and climate-forced production variability, Sci. Adv., 5, https://doi.org/10.1126/sciadv.aaw1976, 2019.
Balkovič, J., van der Velde, M., Skalský, R., Xiong, W., Folberth, C., Khabarov, N., Smirnov, A., Mueller, N. D., and Obersteiner, M.: Global wheat production potentials and management flexibility under the representative concentration pathways, Global Planet. Change, 122, 107–121, https://doi.org/10.1016/j.gloplacha.2014.08.010, 2014.
Becker-Reshef, I., Barker, B., Whitcraft, A., Oliva, P., Mobley, K., Justice, C., and Sahajpal, R.: Crop Type Maps for Operational Global Agricultural Monitoring, Sci. Data, 10, 1–12, https://doi.org/10.1038/s41597-023-02047-9, 2023.
Blanc, É.: Statistical emulators of maize, rice, soybean and wheat yields from global gridded crop models, Agr. Forest Meteorol., 236, 145–161, https://doi.org/10.1016/j.agrformet.2016.12.022, 2017.
Bunce, J. A.: Responses of soybeans and wheat to elevated CO2 in free-air and open top chamber systems, Field Crops Res., 186, 78–85, https://doi.org/10.1016/j.fcr.2015.11.010, 2016.
Cai, C., Yin, X., He, S., Jiang, W., Si, C., Struik, P. C., Luo, W., Li, G., Xie, Y., Xiong, Y., and Pan, G.: Responses of wheat and rice to factorial combinations of ambient and elevated CO2 and temperature in FACE experiments, Glob. Change Biol., 22, 856–874, https://doi.org/10.1111/gcb.13065, 2016.
Calvin, K. and Fisher-Vanden, K.: Quantifying the indirect impacts of climate on agriculture: An inter-method comparison, Environ. Res. Lett., 12, https://doi.org/10.1088/1748-9326/aa843c, 2017.
Choi, K., Yi, J., Park, C., and Yoon, S.: Deep Learning for Anomaly Detection in Time-Series Data: Review, Analysis, and Guidelines, IEEE Access, 9, 120043–120065, https://doi.org/10.1109/ACCESS.2021.3107975, 2021.
Ciscar, J.-C., Fisher-Vanden, K., and Lobell, D. B.: Synthesis and Review: an inter-method comparison of climate change impacts on agriculture, Environ. Res. Lett., 13, 070401, https://doi.org/10.1088/1748-9326/aac7cb, 2018.
Compo, G. P., Whitaker, J. S., Sardeshmukh, P. D., Matsui, N., Allan, R. J., Yin, X., Gleason, B. E., Vose, R. S., Rutledge, G., Bessemoulin, P., BroNnimann, S., Brunet, M., Crouthamel, R. I., Grant, A. N., Groisman, P. Y., Jones, P. D., Kruk, M. C., Kruger, A. C., Marshall, G. J., Maugeri, M., Mok, H. Y., Nordli, O., Ross, T. F., Trigo, R. M., Wang, X. L., Woodruff, S. D., and Worley, S. J.: The Twentieth Century Reanalysis Project, Q. J. Roy. Meteor. Soc., 137, https://doi.org/10.1002/qj.776, 2011.
Deryng, D., Elliott, J., Folberth, C., Müller, C., Pugh, T. A. M., Boote, K. J., Conway, D., Ruane, A. C., Gerten, D., Jones, J. W., Khabarov, N., Olin, S., Schaphoff, S., Schmid, E., Yang, H., and Rosenzweig, C.: Regional disparities in the beneficial effects of rising CO2 concentrations on crop water productivity, Nat. Clim. Change, 6, 786–790, https://doi.org/10.1038/nclimate2995, 2016.
Di Paola, A., Valentini, R., and Santini, M.: An overview of available crop growth and yield models for studies and assessments in agriculture, J. Sci. Food Agric., https://doi.org/10.1002/jsfa.7359, 2016.
Elliott, J., Deryng, D., Müller, C., Frieler, K., Konzmann, M., Gerten, D., Glotter, M., Flörke, M., Wada, Y., Best, N., Eisner, S., Fekete, B. M., Folberth, C., Foster, I., Gosling, S. N., Haddeland, I., Khabarov, N., Ludwig, F., Masaki, Y., Olin, S., Rosenzweig, C., Ruane, A. C., Satoh, Y., Schmid, E., Stacke, T., Tang, Q., and Wisser, D.: Constraints and potentials of future irrigation water availability on agricultural production under climate change, P. Natl. Acad. Sci. USA, 111, 3239–3244, https://doi.org/10.1073/pnas.1222474110, 2014.
Elliott, J., Müller, C., Deryng, D., Chryssanthacopoulos, J., Boote, K. J., Büchner, M., Foster, I., Glotter, M., Heinke, J., Iizumi, T., Izaurralde, R. C., Mueller, N. D., Ray, D. K., Rosenzweig, C., Ruane, A. C., and Sheffield, J.: The Global Gridded Crop Model Intercomparison: data and modeling protocols for Phase 1 (v1.0), Geosci. Model Dev., 8, 261–277, https://doi.org/10.5194/gmd-8-261-2015, 2015.
Ewert, F., Rötter, R. P., Bindi, M., Webber, H., Trnka, M., Kersebaum, K. C., Olesen, J. E., van Ittersum, M. K., Janssen, S., Rivington, M., Semenov, M. A., Wallach, D., Porter, J. R., Stewart, D., Verhagen, J., Gaiser, T., Palosuo, T., Tao, F., Nendel, C., Roggero, P. P., Bartošová, L., and Asseng, S.: Crop modelling for integrated assessment of risk to food production from climate change, Environ. Model. Softw., 72, 287–303, https://doi.org/10.1016/j.envsoft.2014.12.003, 2015.
Falconnier, G. N., Corbeels, M., Boote, K. J., Affholder, F., Adam, M., MacCarthy, D. S., Ruane, A. C., Nendel, C., Whitbread, A. M., Justes, É., Ahuja, L. R., Akinseye, F. M., Alou, I. N., Amouzou, K. A., Anapalli, S. S., Baron, C., Basso, B., Baudron, F., Bertuzzi, P., Challinor, A. J., Chen, Y., Deryng, D., Elsayed, M. L., Faye, B., Gaiser, T., Galdos, M., Gayler, S., Gerardeaux, E., Giner, M., Grant, B., Hoogenboom, G., Ibrahim, E. S., Kamali, B., Kersebaum, K. C., Kim, S. H., van der Laan, M., Leroux, L., Lizaso, J. I., Maestrini, B., Meier, E. A., Mequanint, F., Ndoli, A., Porter, C. H., Priesack, E., Ripoche, D., Sida, T. S., Singh, U., Smith, W. N., Srivastava, A., Sinha, S., Tao, F., Thorburn, P. J., Timlin, D., Traore, B., Twine, T., and Webber, H.: Modelling climate change impacts on maize yields under low nitrogen input conditions in sub-Saharan Africa, Glob. Change Biol., 26, 5942–5964, https://doi.org/10.1111/gcb.15261, 2020.
Folberth, C., Elliott, J., Müller, C., Balkovič, J., Chryssanthacopoulos, J., Izaurralde, R. C., Jones, C. D., Khabarov, N., Liu, W., Reddy, A., Schmid, E., Skalský, R., Yang, H., Arneth, A., Ciais, P., Deryng, D., Lawrence, P. J., Olin, S., Pugh, T. A. M., Ruane, A. C., and Wang, X.: Parameterization-induced uncertainties and impacts of crop management harmonization in a global gridded crop model ensemble, PLoS One, 14, https://doi.org/10.1371/journal.pone.0221862, 2019.
Folberth, C., Baklanov, A., Khabarov, N., Oberleitner, T., Balkovič, J., and Skalský, R.: CROMES v1.0: a flexible CROp Model Emulator Suite for climate impact assessment, Geosci. Model Dev., 18, 5759–5779, https://doi.org/10.5194/gmd-18-5759-2025, 2025.
Franke, J. A., Müller, C., Elliott, J., Ruane, A. C., Jägermeyr, J., Snyder, A., Dury, M., Falloon, P. D., Folberth, C., François, L., Hank, T., Izaurralde, R. C., Jacquemin, I., Jones, C., Li, M., Liu, W., Olin, S., Phillips, M., Pugh, T. A. M., Reddy, A., Williams, K., Wang, Z., Zabel, F., and Moyer, E. J.: The GGCMI Phase 2 emulators: global gridded crop model responses to changes in CO2, temperature, water, and nitrogen (version 1.0), Geosci. Model Dev., 13, 3995–4018, https://doi.org/10.5194/gmd-13-3995-2020, 2020a.
Franke, J. A., Müller, C., Elliott, J., Ruane, A. C., Jägermeyr, J., Balkovic, J., Ciais, P., Dury, M., Falloon, P. D., Folberth, C., François, L., Hank, T., Hoffmann, M., Izaurralde, R. C., Jacquemin, I., Jones, C., Khabarov, N., Koch, M., Li, M., Liu, W., Olin, S., Phillips, M., Pugh, T. A. M., Reddy, A., Wang, X., Williams, K., Zabel, F., and Moyer, E. J.: The GGCMI Phase 2 experiment: global gridded crop model simulations under uniform changes in CO2, temperature, water, and nitrogen levels (protocol version 1.0), Geosci. Model Dev., 13, 2315–2336, https://doi.org/10.5194/gmd-13-2315-2020, 2020b.
Frieler, K., Volkholz, J., Lange, S., Schewe, J., Mengel, M., del Rocío Rivas López, M., Otto, C., Reyer, C. P. O., Karger, D. N., Malle, J. T., Treu, S., Menz, C., Blanchard, J. L., Harrison, C. S., Petrik, C. M., Eddy, T. D., Ortega-Cisneros, K., Novaglio, C., Rousseau, Y., Watson, R. A., Stock, C., Liu, X., Heneghan, R., Tittensor, D., Maury, O., Büchner, M., Vogt, T., Wang, T., Sun, F., Sauer, I. J., Koch, J., Vanderkelen, I., Jägermeyr, J., Müller, C., Rabin, S., Klar, J., Vega del Valle, I. D., Lasslop, G., Chadburn, S., Burke, E., Gallego-Sala, A., Smith, N., Chang, J., Hantson, S., Burton, C., Gädeke, A., Li, F., Gosling, S. N., Müller Schmied, H., Hattermann, F., Wang, J., Yao, F., Hickler, T., Marcé, R., Pierson, D., Thiery, W., Mercado-Bettín, D., Ladwig, R., Ayala-Zamora, A. I., Forrest, M., and Bechtold, M.: Scenario setup and forcing data for impact model evaluation and impact attribution within the third round of the Inter-Sectoral Impact Model Intercomparison Project (ISIMIP3a), Geosci. Model Dev., 17, 1–51, https://doi.org/10.5194/gmd-17-1-2024, 2024.
Gahlot, S., Lin, T.-S., Jain, A. K., Baidya Roy, S., Sehgal, V. K., and Dhakar, R.: Impact of environmental changes and land management practices on wheat production in India, Earth Syst. Dynam., 11, 641–652, https://doi.org/10.5194/esd-11-641-2020, 2020.
Gasser, T., Ciais, P., Boucher, O., Quilcaille, Y., Tortora, M., Bopp, L., and Hauglustaine, D.: The compact Earth system model OSCAR v2.2: description and first results, Geosci. Model Dev., 10, 271–319, https://doi.org/10.5194/gmd-10-271-2017, 2017.
Gerber, J. S., Ray, D. K., Makowski, D., Butler, E. E., Mueller, N. D., West, P. C., Johnson, J. A., Polasky, S., Samberg, L. H., Siebert, S., and Sloat, L.: Global spatially explicit yield gap time trends reveal regions at risk of future crop yield stagnation, Nat. Food, 5, 125–135, https://doi.org/10.1038/s43016-023-00913-8, 2024.
Haas, E., Klatt, S., Fröhlich, A., Kraft, P., Werner, C., Kiese, R., Grote, R., Breuer, L., and Butterbach-Bahl, K.: LandscapeDNDC: A process model for simulation of biosphere-atmosphere-hydrosphere exchange processes at site and regional scale, Landsc. Ecol., 28, 615–636, https://doi.org/10.1007/s10980-012-9772-x, 2013.
Hank, T. B., Bach, H., and Mauser, W.: Using a remote sensing-supported hydro-agroecological model for field-scale simulation of heterogeneous crop growth and yield: Application for wheat in central europe, Remote Sens., 7, 3934–3965, https://doi.org/10.3390/rs70403934, 2015.
Hansen, B. E.: Least-squares forecast averaging, J. Econom., 146, 342–350, https://doi.org/10.1016/j.jeconom.2008.08.022, 2008.
Harris, I., Osborn, T. J., Jones, P., and Lister, D.: Version 4 of the CRU TS monthly high-resolution gridded multivariate climate dataset, Sci. Data, 7, 1–18, https://doi.org/10.1038/s41597-020-0453-3, 2020.
Hasegawa, T., Sakai, H., Tokida, T., Usui, Y., Nakamura, H., Wakatsuki, H., Chen, C. P., Ikawa, H., Zhang, G., Nakano, H., Matsushima, M. Y., and Hayashi, K.: A high-yielding rice cultivar “takanari” shows no N constraints on CO2 fertilization, Front. Plant Sci., 10, 1–15, https://doi.org/10.3389/fpls.2019.00361, 2019.
Hasegawa, T., Sakurai, G., Fujimori, S., Takahashi, K., Hijioka, Y., and Masui, T.: Extreme climate events increase risk of global food insecurity and adaptation needs, Nat. Food, 2, 587–595, https://doi.org/10.1038/s43016-021-00335-4, 2021.
Heinke, J., Müller, C., Mueller, N. D., and Jägermeyr, J.: N application rates from mineral fertiliser and manure, Zenodo [data set], https://doi.org/10.5281/zenodo.5176008, 15 June 2021.
Herger, N., Sanderson, B. M., and Knutti, R.: Improved pattern scaling approaches for the use in climate impact studies, Geophys. Res. Lett., 42, 3486–3494, https://doi.org/10.1002/2015GL063569, 2015.
Hersbach, H., Bell, B., Berrisford, P., Hirahara, S., Horányi, A., Muñoz-Sabater, J., Nicolas, J., Peubey, C., Radu, R., Schepers, D., Simmons, A., Soci, C., Abdalla, S., Abellan, X., Balsamo, G., Bechtold, P., Biavati, G., Bidlot, J., Bonavita, M., De Chiara, G., Dahlgren, P., Dee, D., Diamantakis, M., Dragani, R., Flemming, J., Forbes, R., Fuentes, M., Geer, A., Haimberger, L., Healy, S., Hogan, R. J., Hólm, E., Janisková, M., Keeley, S., Laloyaux, P., Lopez, P., Lupu, C., Radnoti, G., de Rosnay, P., Rozum, I., Vamborg, F., Villaume, S., and Thépaut, J. N.: The ERA5 global reanalysis, Q. J. Roy. Meteor. Soc., 146, 1999–2049, https://doi.org/10.1002/qj.3803, 2020.
Hultgren, A., Carleton, T., Delgado, M., Gergel, D. R., Greenstone, M., Houser, T., Hsiang, S., Jina, A., Kopp, R. E., Malevich, S. B., McCusker, K. E., Mayer, T., Nath, I., Rising, J., Rode, A., and Yuan, J.: Impacts of climate change on global agriculture accounting for adaptation, Nature, 642, 644–652, https://doi.org/10.1038/s41586-025-09085-w, 2025.
Hurtt, G. C., Chini, L., Sahajpal, R., Frolking, S., Bodirsky, B. L., Calvin, K., Doelman, J. C., Fisk, J., Fujimori, S., Klein Goldewijk, K., Hasegawa, T., Havlik, P., Heinimann, A., Humpenöder, F., Jungclaus, J., Kaplan, J. O., Kennedy, J., Krisztin, T., Lawrence, D., Lawrence, P., Ma, L., Mertz, O., Pongratz, J., Popp, A., Poulter, B., Riahi, K., Shevliakova, E., Stehfest, E., Thornton, P., Tubiello, F. N., van Vuuren, D. P., and Zhang, X.: Harmonization of global land use change and management for the period 850–2100 (LUH2) for CMIP6, Geosci. Model Dev., 13, 5425–5464, https://doi.org/10.5194/gmd-13-5425-2020, 2020.
Iizumi, T., Furuya, J., Shen, Z., Kim, W., Okada, M., Fujimori, S., Hasegawa, T., and Nishimori, M.: Responses of crop yield growth to global temperature and socioeconomic changes, Sci. Rep., 7, https://doi.org/10.1038/s41598-017-08214-4, 2017.
Iizumi, T., Iseki, K., Ikazaki, K., Sakai, T., Shiogama, H., Imada, Y., and Batieno, B. J.: Increasing heavy rainfall events and associated excessive soil water threaten a protein-source legume in dry environments of West Africa, Agr. Forest Meteorol., 344, https://doi.org/10.1016/j.agrformet.2023.109783, 2024.
Iizumi, T., Sakai, T., Masaki, Y., Oyoshi, K., Takimoto, T., Shiogama, H., Imada, Y., and Makowski, D.: Assessing the capacity of agricultural research and development to increase the stability of global crop yields under climate change, PNAS Nexus, 4, https://doi.org/10.1093/pnasnexus/pgaf099, 2025.
ISIMIP repository: https://data.isimip.org/, last access: 20 November 2024.
Jägermeyr, J., Müller, C., Ruane, A. C., Elliott, J., Balkovic, J., Castillo, O., Faye, B., Foster, I., Folberth, C., Franke, J. A., Fuchs, K., Guarin, J. R., Heinke, J., Hoogenboom, G., Iizumi, T., Jain, A. K., Kelly, D., Khabarov, N., Lange, S., Lin, T.-S., Liu, W., Mialyk, O., Minoli, S., Moyer, E. J., Okada, M., Phillips, M., Porter, C., Rabin, S. S., Scheer, C., Schneider, J. M., Schyns, J. F., Skalsky, R., Smerald, A., Stella, T., Stephens, H., Webber, H., Zabel, F., and Rosenzweig, C.: Climate impacts on global agriculture emerge earlier in new generation of climate and crop models, Nat. Food, 2, 873–885, https://doi.org/10.1038/s43016-021-00400-y, 2021.
Kephe, P. N., Ayisi, K. K., and Petja, B. M.: Challenges and opportunities in crop simulation modelling under seasonal and projected climate change scenarios for crop production in South Africa, Agr. Food Security, https://doi.org/10.1186/s40066-020-00283-5, 2021.
Kikstra, J. S., Nicholls, Z. R. J., Smith, C. J., Lewis, J., Lamboll, R. D., Byers, E., Sandstad, M., Meinshausen, M., Gidden, M. J., Rogelj, J., Kriegler, E., Peters, G. P., Fuglestvedt, J. S., Skeie, R. B., Samset, B. H., Wienpahl, L., van Vuuren, D. P., van der Wijst, K.-I., Al Khourdajie, A., Forster, P. M., Reisinger, A., Schaeffer, R., and Riahi, K.: The IPCC Sixth Assessment Report WGIII climate assessment of mitigation pathways: from emissions to global temperatures, Geosci. Model Dev., 15, 9075–9109, https://doi.org/10.5194/gmd-15-9075-2022, 2022.
Kling, M. M., Brittain, C. T., Galford, G. L., Waring, T. M., Hébert-Dufresne, L., Dube, M. P., Sabzian, H., Gotelli, N. J., McGill, B. J., and Niles, M. T.: Innovations through crop switching happen on the diverse margins of US agriculture, P. Natl. Acad. Sci. USA, 121, https://doi.org/10.1073/pnas.2402195121, 2024.
Kornhuber, K., Lesk, C., Schleussner, C. F., Jägermeyr, J., Pfleiderer, P., and Horton, R. M.: Risks of synchronized low yields are underestimated in climate and crop model projections, Nat. Commun., 14, 1–10, https://doi.org/10.1038/s41467-023-38906-7, 2023.
Laborte, A. G., Gutierrez, M. A., Balanza, J. G., Saito, K., Zwart, S. J., Boschetti, M., Murty, M. V. R., Villano, L., Aunario, J. K., Reinke, R., Koo, J., Hijmans, R. J., and Nelson, A.: RiceAtlas, a spatial database of global rice calendars and production, Sci. Data, 4, 1–10, https://doi.org/10.1038/sdata.2017.74, 2017.
Ladha, J. K., Peoples, M. B., Reddy, P. M., Biswas, J. C., Bennett, A., Jat, M. L., and Krupnik, T. J.: Biological nitrogen fixation and prospects for ecological intensification in cereal-based cropping systems, Field Crops Res., 283, 108541, https://doi.org/10.1016/j.fcr.2022.108541, 2022.
Laub, M., Pataczek, L., Feuerbacher, A., Zikeli, S., and Högy, P.: Contrasting yield responses at varying levels of shade suggest different suitability of crops for dual land-use systems: a meta-analysis, Agron. Sustain. Dev., 42, 51, https://doi.org/10.1007/s13593-022-00783-7, 2022.
Lesk, C., Rowhani, P., and Ramankutty, N.: Influence of extreme weather disasters on global crop production, Nature, 529, 84–87, https://doi.org/10.1038/nature16467, 2016.
Lesk, C., Coffel, E., Winter, J., Ray, D., Zscheischler, J., Seneviratne, S. I., and Horton, R.: Stronger temperature–moisture couplings exacerbate the impact of climate warming on global crop yields, Nat. Food, 2, 683–691, https://doi.org/10.1038/s43016-021-00341-6, 2021.
Lesk, C., Anderson, W., Rigden, A., Coast, O., Jägermeyr, J., McDermid, S., Davis, K. F., and Konar, M.: Compound heat and moisture extreme impacts on global crop yields under climate change, Nat. Rev. Earth Environ., 3, 872–889, https://doi.org/10.1038/s43017-022-00368-8, 2022.
Li, X. and Troy, T. J.: Changes in rainfed and irrigated crop yield response to climate in the western US, Environ. Res. Lett., 13, https://doi.org/10.1088/1748-9326/aac4b1, 2018.
Liu, W., Yang, H., Folberth, C., Wang, X., Luo, Q., and Schulin, R.: Global investigation of impacts of PET methods on simulating crop-water relations for maize, Agr. Forest Meteorol., 221, 164–175, https://doi.org/10.1016/j.agrformet.2016.02.017, 2016.
Liu, W., Ye, T., Müller, C., Jägermeyr, J., Franke, J. A., Stephens, H., and Chen, S.: The statistical emulators of GGCMI phase 2: responses of year-to-year variation of crop yield to CO2, temperature, water, and nitrogen perturbations, Geosci. Model Dev., 16, 7203–7221, https://doi.org/10.5194/gmd-16-7203-2023, 2023.
Liu, W., Li, M., Huang, Y., Makowski, D., Su, Y., Bai, Y., Schauberger, B., Du, T., Abbaspour, K. C., Yang, K., Yang, H., and Ciais, P.: Mitigating nitrogen losses with almost no crop yield penalty during extremely wet years, Sci. Adv., 10, 9325, https://doi.org/10.1126/sciadv.adi9325, 2024.
Liu, X.: OSCAR-crop v1.0, Zenodo [code], https://doi.org/10.5281/zenodo.17228924, 2025.
Lobell, D. B. and Asseng, S.: Comparing estimates of climate change impacts from process-based and statistical crop models, Environ. Res. Lett., 12, 015001, https://doi.org/10.1088/1748-9326/aa518a, 2017.
Luiz, L. F., Correndo, A., Ross, J., Licht, M., Casteel, S., Singh, M., Naeve, S., Vann, R., Bais, J., Kandel, H., Lindsey, L., Conley, S., Kleinjan, J., Kovács, P., Dan Berning, Hefley, T., Reiter, M., Holshouser, D., and Ciampitti, I. A.: Soybean yield response to nitrogen and sulfur fertilization in the United States: contribution of soil N and N fixation processes, Eur. J. Agron., 145, https://doi.org/10.1016/j.eja.2023.126791, 2023.
Lutz, F., Herzfeld, T., Heinke, J., Rolinski, S., Schaphoff, S., von Bloh, W., Stoorvogel, J. J., and Müller, C.: Simulating the effect of tillage practices with the global ecosystem model LPJmL (version 5.0-tillage), Geosci. Model Dev., 12, 2419–2440, https://doi.org/10.5194/gmd-12-2419-2019, 2019.
Ma, J., Olin, S., Anthoni, P., Rabin, S. S., Bayer, A. D., Nyawira, S. S., and Arneth, A.: Modeling symbiotic biological nitrogen fixation in grain legumes globally with LPJ-GUESS (v4.0, r10285), Geosci. Model Dev., 15, 815–839, https://doi.org/10.5194/gmd-15-815-2022, 2022.
Maaz, T. M., Sapkota, T. B., Eagle, A. J., Kantar, M. B., Bruulsema, T. W., and Majumdar, K.: Meta-analysis of yield and nitrous oxide outcomes for nitrogen management in agriculture, Glob. Change Biol., 27, 2343–2360, https://doi.org/10.1111/gcb.15588, 2021.
Maiorano, A., Martre, P., Asseng, S., Ewert, F., Müller, C., Rötter, R. P., Ruane, A. C., Semenov, M. A., Wallach, D., Wang, E., Alderman, P. D., Kassie, B. T., Biernath, C., Basso, B., Cammarano, D., Challinor, A. J., Doltra, J., Dumont, B., Rezaei, E. E., Gayler, S., Kersebaum, K. C., Kimball, B. A., Koehler, A. K., Liu, B., O'Leary, G. J., Olesen, J. E., Ottman, M. J., Priesack, E., Reynolds, M., Stratonovitch, P., Streck, T., Thorburn, P. J., Waha, K., Wall, G. W., White, J. W., Zhao, Z., and Zhu, Y.: Crop model improvement reduces the uncertainty of the response to temperature of multi-model ensembles, Field Crops Res., 202, 5–20, https://doi.org/10.1016/j.fcr.2016.05.001, 2017.
Martre, P., Dueri, S., Guarin, J. R., Ewert, F., Webber, H., Calderini, D., Molero, G., Reynolds, M., Miralles, D., Garcia, G., Brown, H., George, M., Craigie, R., Cohan, J.-P., Deswarte, J.-C., Slafer, G., Giunta, F., Cammarano, D., Ferrise, R., Gaiser, T., Gao, Y., Hochman, Z., Hoogenboom, G., Hunt, L. A., Kersebaum, K. C., Nendel, C., Padovan, G., Ruane, A. C., Srivastava, A. K., Stella, T., Supit, I., Thorburn, P., Wang, E., Wolf, J., Zhao, C., Zhao, Z., and Asseng, S.: Global needs for nitrogen fertilizer to improve wheat yield under climate change, Nat. Plants, 10, 1081–1090, https://doi.org/10.1038/s41477-024-01739-3, 2024.
Mauser, W., Klepper, G., Zabel, F., Delzeit, R., Hank, T., Putzenlechner, B., and Calzadilla, A.: Global biomass production potentials exceed expected future demand without the need for cropland expansion, Nat. Commun., 6, https://doi.org/10.1038/ncomms9946, 2015.
McGrath, J. M. and Lobell, D. B.: Regional disparities in the CO2 fertilization effect and implications for crop yields, Environ. Res. Lett., 8, https://doi.org/10.1088/1748-9326/8/1/014054, 2013.
Minoli, S., Müller, C., Elliott, J., Ruane, A. C., Jägermeyr, J., Zabel, F., Dury, M., Folberth, C., François, L., Hank, T., Jacquemin, I., Liu, W., Olin, S., and Pugh, T. A. M.: Global Response Patterns of Major Rainfed Crops to Adaptation by Maintaining Current Growing Periods and Irrigation, Earths Future, 7, 1464–1480, https://doi.org/10.1029/2018EF001130, 2019.
Mourtzinis, S., Kaur, G., Orlowski, J. M., Shapiro, C. A., Lee, C. D., Wortmann, C., Holshouser, D., Nafziger, E. D., Kandel, H., Niekamp, J., Ross, W. J., Lofton, J., Vonk, J., Roozeboom, K. L., Thelen, K. D., Lindsey, L. E., Staton, M., Naeve, S. L., Casteel, S. N., Wiebold, W. J., and Conley, S. P.: Soybean response to nitrogen application across the United States: A synthesis-analysis, Field Crops Res., 215, 74–82, https://doi.org/10.1016/j.fcr.2017.09.035, 2018.
Müller, C., Elliott, J., Chryssanthacopoulos, J., Arneth, A., Balkovic, J., Ciais, P., Deryng, D., Folberth, C., Glotter, M., Hoek, S., Iizumi, T., Izaurralde, R. C., Jones, C., Khabarov, N., Lawrence, P., Liu, W., Olin, S., Pugh, T. A. M., Ray, D. K., Reddy, A., Rosenzweig, C., Ruane, A. C., Sakurai, G., Schmid, E., Skalsky, R., Song, C. X., Wang, X., de Wit, A., and Yang, H.: Global gridded crop model evaluation: benchmarking, skills, deficiencies and implications, Geosci. Model Dev., 10, 1403–1422, https://doi.org/10.5194/gmd-10-1403-2017, 2017.
Müller, C., Elliott, J., Kelly, D., Arneth, A., Balkovic, J., Ciais, P., Deryng, D., Folberth, C., Hoek, S., Izaurralde, R. C., Jones, C. D., Khabarov, N., Lawrence, P., Liu, W., Olin, S., Pugh, T. A. M., Reddy, A., Rosenzweig, C., Ruane, A. C., Sakurai, G., Schmid, E., Skalsky, R., Wang, X., de Wit, A., and Yang, H.: The Global Gridded Crop Model Intercomparison phase 1 simulation dataset, Sci. Data, 6, 50, https://doi.org/10.1038/s41597-019-0023-8, 2019.
Müller, C., Jägermeyr, J., Franke, J. A., Ruane, A. C., Balkovic, J., Ciais, P., Dury, M., Falloon, P., Folberth, C., Hank, T., Hoffmann, M., Izaurralde, R. C., Jacquemin, I., Khabarov, N., Liu, W., Olin, S., Pugh, T. A. M., Wang, X., Williams, K., Zabel, F., and Elliott, J. W.: Substantial Differences in Crop Yield Sensitivities Between Models Call for Functionality-Based Model Evaluation, Earths Future, 12, 1–21, https://doi.org/10.1029/2023EF003773, 2024.
Nóia-Júnior, R. de S., Ruane, A. C., Athanasiadis, I. N., Ewert, F., Harrison, M. T., Jägermeyr, J., Martre, P., Müller, C., Palosuo, T., Salmerón, M., Webber, H., Maccarthy, D. S., and Asseng, S.: Crop models for future food systems, One Earth, 8, 101487, https://doi.org/10.1016/j.oneear.2025.101487, 2025.
Olin, S., Schurgers, G., Lindeskog, M., Wårlind, D., Smith, B., Bodin, P., Holmér, J., and Arneth, A.: Modelling the response of yields and tissue C : N to changes in atmospheric CO2 and N management in the main wheat regions of western Europe, Biogeosciences, 12, 2489–2515, https://doi.org/10.5194/bg-12-2489-2015, 2015.
Orlov, A., Jägermeyr, J., Müller, C., Daloz, A. S., Zabel, F., Minoli, S., Liu, W., Lin, T. S., Jain, A. K., Folberth, C., Okada, M., Poschlod, B., Smerald, A., Schneider, J. M., and Sillmann, J.: Human heat stress could offset potential economic benefits of CO2 fertilization in crop production under a high-emissions scenario, One Earth, 7, 1250–1265, https://doi.org/10.1016/j.oneear.2024.06.012, 2024.
Ostberg, S., Schewe, J., Childers, K., and Frieler, K.: Changes in crop yields and their variability at different levels of global warming, Earth Syst. Dynam., 9, 479–496, https://doi.org/10.5194/esd-9-479-2018, 2018.
Pannecoucque, J., Goormachtigh, S., Ceusters, N., Bode, S., Boeckx, P., and Roldan-Ruiz, I.: Soybean response and profitability upon inoculation and nitrogen fertilisation in Belgium, Eur. J. Agron., 132, https://doi.org/10.1016/j.eja.2021.126390, 2022.
Proctor, J., Rigden, A., Chan, D., and Huybers, P.: More accurate specification of water supply shows its importance for global crop production, Nat. Food, 3, 753–763, https://doi.org/10.1038/s43016-022-00592-x, 2022.
Qiao, L., Wang, X., Smith, P., Fan, J., Lu, Y., Emmett, B., Li, R., Dorling, S., Chen, H., Liu, S., Benton, T. G., Wang, Y., Ma, Y., Jiang, R., Zhang, F., Piao, S., Mller, C., Yang, H., Hao, Y., Li, W., and Fan, M.: Soil quality both increases crop production and improves resilience to climate change, Nat. Clim. Change, 12, 574–580, https://doi.org/10.1038/s41558-022-01376-8, 2022.
Quilcaille, Y., Gasser, T., Ciais, P., and Boucher, O.: CMIP6 simulations with the compact Earth system model OSCAR v3.1, Geosci. Model Dev., 16, 1129–1161, https://doi.org/10.5194/gmd-16-1129-2023, 2023.
Ray, D. K., Ramankutty, N., Mueller, N. D., West, P. C., and Foley, J. A.: Recent patterns of crop yield growth and stagnation, Nat. Commun., 3, https://doi.org/10.1038/ncomms2296, 2012.
Ray, D. K., Gerber, J. S., Macdonald, G. K., and West, P. C.: Climate variation explains a third of global crop yield variability, Nat. Commun., 6, 1–9, https://doi.org/10.1038/ncomms6989, 2015.
Ringeval, B., Müller, C., Pugh, T. A. M., Mueller, N. D., Ciais, P., Folberth, C., Liu, W., Debaeke, P., and Pellerin, S.: Potential yield simulated by global gridded crop models: using a process-based emulator to explain their differences, Geosci. Model Dev., 14, 1639–1656, https://doi.org/10.5194/gmd-14-1639-2021, 2021.
Rosenzweig, C., Jones, J. W., Hatfield, J. L., Ruane, A. C., Boote, K. J., Thorburn, P., Antle, J. M., Nelson, G. C., Porter, C., Janssen, S., Asseng, S., Basso, B., Ewert, F., Wallach, D., Baigorria, G., and Winter, J. M.: The Agricultural Model Intercomparison and Improvement Project (AgMIP): Protocols and pilot studies, Agr. Forest Meteorol., 170, 166–182, https://doi.org/10.1016/j.agrformet.2012.09.011, 2013.
Rosenzweig, C., Elliott, J., Deryng, D., Ruane, A. C., Müller, C., Arneth, A., Boote, K. J., Folberth, C., Glotter, M., Khabarov, N., Neumann, K., Piontek, F., Pugh, T. A. M., Schmid, E., Stehfest, E., Yang, H., and Jones, J. W.: Assessing agricultural risks of climate change in the 21st century in a global gridded crop model intercomparison, P. Natl. Acad. Sci. USA, 111, 3268–3273, https://doi.org/10.1073/pnas.1222463110, 2014.
Ruane, A. C., Rosenzweig, C., Asseng, S., Boote, K. J., Elliott, J., Ewert, F., Jones, J. W., Martre, P., McDermid, S. P., Müller, C., Snyder, A., and Thorburn, P. J.: An AgMIP framework for improved agricultural representation in integrated assessment models, Environ. Res. Lett., 12, https://doi.org/10.1088/1748-9326/aa8da6, 2017.
Ruiz-Vera, U. M., Siebers, M. H., Drag, D. W., Ort, D. R., and Bernacchi, C. J.: Canopy warming caused photosynthetic acclimation and reduced seed yield in maize grown at ambient and elevated [CO2], Glob. Change Biol., 21, 4237–4249, https://doi.org/10.1111/gcb.13013, 2015.
Salvagiotti, F., Cassman, K. G., Specht, J. E., Walters, D. T., Weiss, A., and Dobermann, A.: Nitrogen uptake, fixation and response to fertilizer N in soybeans: A review, Field Crops Res., 108, 1–13, https://doi.org/10.1016/j.fcr.2008.03.001, 2008.
Sheng, D., Zhao, X., Edmonds, J. A., Morris, S. T., Patel, P., O'Neill, B. C., Tebaldi, C., and Wise, M. A.: Omitting labor responses underestimates the effects of future heat stress on agriculture, Commun. Earth Environ., 6, https://doi.org/10.1038/s43247-025-02318-w, 2025.
Slivinski, L. C., Compo, G. P., Whitaker, J. S., Sardeshmukh, P. D., Giese, B. S., McColl, C., Allan, R., Yin, X., Vose, R., Titchner, H., Kennedy, J., Spencer, L. J., Ashcroft, L., Brönnimann, S., Brunet, M., Camuffo, D., Cornes, R., Cram, T. A., Crouthamel, R., Domínguez-Castro, F., Freeman, J. E., Gergis, J., Hawkins, E., Jones, P. D., Jourdain, S., Kaplan, A., Kubota, H., Blancq, F. Le, Lee, T. C., Lorrey, A., Luterbacher, J., Maugeri, M., Mock, C. J., Moore, G. W. K., Przybylak, R., Pudmenzky, C., Reason, C., Slonosky, V. C., Smith, C. A., Tinz, B., Trewin, B., Valente, M. A., Wang, X. L., Wilkinson, C., Wood, K., and Wyszyński, P.: Towards a more reliable historical reanalysis: Improvements for version 3 of the Twentieth Century Reanalysis system, Q. J. Roy. Meteor. Soc., 145, 2876–2908, https://doi.org/10.1002/qj.3598, 2019.
Springmann, M., Clark, M., Mason-D'Croz, D., Wiebe, K., Bodirsky, B. L., Lassaletta, L., de Vries, W., Vermeulen, S. J., Herrero, M., Carlson, K. M., Jonell, M., Troell, M., DeClerck, F., Gordon, L. J., Zurayk, R., Scarborough, P., Rayner, M., Loken, B., Fanzo, J., Godfray, H. C. J., Tilman, D., Rockström, J., and Willett, W.: Options for keeping the food system within environmental limits, Nature, 562, 519–525, https://doi.org/10.1038/s41586-018-0594-0, 2018.
Tebaldi, C., Debeire, K., Eyring, V., Fischer, E., Fyfe, J., Friedlingstein, P., Knutti, R., Lowe, J., O'Neill, B., Sanderson, B., van Vuuren, D., Riahi, K., Meinshausen, M., Nicholls, Z., Tokarska, K. B., Hurtt, G., Kriegler, E., Lamarque, J.-F., Meehl, G., Moss, R., Bauer, S. E., Boucher, O., Brovkin, V., Byun, Y.-H., Dix, M., Gualdi, S., Guo, H., John, J. G., Kharin, S., Kim, Y., Koshiro, T., Ma, L., Olivié, D., Panickal, S., Qiao, F., Rong, X., Rosenbloom, N., Schupfner, M., Séférian, R., Sellar, A., Semmler, T., Shi, X., Song, Z., Steger, C., Stouffer, R., Swart, N., Tachiiri, K., Tang, Q., Tatebe, H., Voldoire, A., Volodin, E., Wyser, K., Xin, X., Yang, S., Yu, Y., and Ziehn, T.: Climate model projections from the Scenario Model Intercomparison Project (ScenarioMIP) of CMIP6, Earth Syst. Dynam., 12, 253–293, https://doi.org/10.5194/esd-12-253-2021, 2021.
Toreti, A., Deryng, D., Tubiello, F. N., Müller, C., Kimball, B. A., Moser, G., Boote, K., Asseng, S., Pugh, T. A. M., Vanuytrecht, E., Pleijel, H., Webber, H., Durand, J. L., Dentener, F., Ceglar, A., Wang, X., Badeck, F., Lecerf, R., Wall, G. W., van den Berg, M., Hoegy, P., Lopez-Lozano, R., Zampieri, M., Galmarini, S., O'Leary, G. J., Manderscheid, R., Mencos Contreras, E., and Rosenzweig, C.: Narrowing uncertainties in the effects of elevated CO2 on crops, Nat. Food, 1, 775–782, https://doi.org/10.1038/s43016-020-00195-4, 2020.
van Grinsven, H. J. M., Ebanyat, P., Glendining, M., Gu, B., Hijbeek, R., Lam, S. K., Lassaletta, L., Mueller, N. D., Pacheco, F. S., Quemada, M., Bruulsema, T. W., Jacobsen, B. H., and ten Berge, H. F. M.: Establishing long-term nitrogen response of global cereals to assess sustainable fertilizer rates, Nat. Food, 3, 122–132, https://doi.org/10.1038/s43016-021-00447-x, 2022.
von Bloh, W., Schaphoff, S., Müller, C., Rolinski, S., Waha, K., and Zaehle, S.: Implementing the nitrogen cycle into the dynamic global vegetation, hydrology, and crop growth model LPJmL (version 5.0), Geosci. Model Dev., 11, 2789–2812, https://doi.org/10.5194/gmd-11-2789-2018, 2018.
Waha, K., Dietrich, J. P., Portmann, F. T., Siebert, S., Thornton, P. K., Bondeau, A., and Herrero, M.: Multiple cropping systems of the world and the potential for increasing cropping intensity, Global Environ. Change, 64, 102131, https://doi.org/10.1016/j.gloenvcha.2020.102131, 2020.
Wang, E., Martre, P., Zhao, Z., Ewert, F., Maiorano, A., Rötter, R. P., Kimball, B. A., Ottman, M. J., Wall, G. W., White, J. W., Reynolds, M. P., Alderman, P. D., Aggarwal, P. K., Anothai, J., Basso, B., Biernath, C., Cammarano, D., Challinor, A. J., De Sanctis, G., Doltra, J., Fereres, E., Garcia-Vila, M., Gayler, S., Hoogenboom, G., Hunt, L. A., Izaurralde, R. C., Jabloun, M., Jones, C. D., Kersebaum, K. C., Koehler, A. K., Liu, L., Müller, C., Naresh Kumar, S., Nendel, C., O'Leary, G., Olesen, J. E., Palosuo, T., Priesack, E., Eyshi Rezaei, E., Ripoche, D., Ruane, A. C., Semenov, M. A., Shcherbak, I., Stöckle, C., Stratonovitch, P., Streck, T., Supit, I., Tao, F., Thorburn, P., Waha, K., Wallach, D., Wang, Z., Wolf, J., Zhu, Y., and Asseng, S.: The uncertainty of crop yield projections is reduced by improved temperature response functions, Nat. Plants, 3, https://doi.org/10.1038/nplants.2017.102, 2017.
Wang, X., Fan, J., Xing, Y., Xu, G., Wang, H., Deng, J., Wang, Y., Zhang, F., Li, P., and Li, Z.: The Effects of Mulch and Nitrogen Fertilizer on the Soil Environment of Crop Plants, Adv, Agron,, 153, 121–173, https://doi.org/10.1016/bs.agron.2018.08.003, 2019.
Wang, X., Zhao, C., Müller, C., Wang, C., Ciais, P., Janssens, I., Peñuelas, J., Asseng, S., Li, T., Elliott, J., Huang, Y., Li, L., and Piao, S.: Emergent constraint on crop yield response to warmer temperature from field experiments, Nat. Sustain., 3, 908–916, https://doi.org/10.1038/s41893-020-0569-7, 2020.
Wang, X., Müller, C., Elliot, J., Mueller, N. D., Ciais, P., Jägermeyr, J., Gerber, J., Dumas, P., Wang, C., Yang, H., Li, L., Deryng, D., Folberth, C., Liu, W., Makowski, D., Olin, S., Pugh, T. A. M., Reddy, A., Schmid, E., Jeong, S., Zhou, F., and Piao, S.: Global irrigation contribution to wheat and maize yield, Nat. Commun., 12, 1235, https://doi.org/10.1038/s41467-021-21498-5, 2021.
Wang, Y., Liu, Y., Xia, L., Akiyama, H., Chen, X., Chen, J., Fang, Y., Vancov, T., Li, Y., Yao, Y., Wu, D., Yu, B., Chang, S. X., and Cai, Y.: Accounting for differences between crops and regions reduces estimates of nitrate leaching from nitrogen-fertilized soils, Commun. Earth Environ., 6, 29, https://doi.org/10.1038/s43247-025-02001-0, 2025.
Webber, H., Ewert, F., Olesen, J. E., Müller, C., Fronzek, S., Ruane, A. C., Bourgault, M., Martre, P., Ababaei, B., Bindi, M., Ferrise, R., Finger, R., Fodor, N., Gabaldón-Leal, C., Gaiser, T., Jabloun, M., Kersebaum, K. C., Lizaso, J. I., Lorite, I. J., Manceau, L., Moriondo, M., Nendel, C., Rodríguez, A., Ruiz-Ramos, M., Semenov, M. A., Siebert, S., Stella, T., Stratonovitch, P., Trombi, G., and Wallach, D.: Diverging importance of drought stress for maize and winter wheat in Europe, Nat. Commun., 9, https://doi.org/10.1038/s41467-018-06525-2, 2018.
Xu, S., Wang, R., Gasser, T., Ciais, P., Peñuelas, J., Balkanski, Y., Boucher, O., Janssens, I. A., Sardans, J., Clark, J. H., Cao, J., Xing, X., Chen, J., Wang, L., Tang, X., and Zhang, R.: Delayed use of bioenergy crops might threaten climate and food security, Nature, 609, 299–306, https://doi.org/10.1038/s41586-022-05055-8, 2022.
Yang, M., Guarin, J. R., Freduah, B. S., Wesley, G. O., MacCarthy, D. S., Narh, S., Castellano, A., Jägermeyr, J., Karl, K., Mendez Leal, E., Asseng, S., Zhao, C., Ruane, A. C., and Rosenzweig, C. E.: Climate-crop models to support opportunity crop adaptation in Africa, Nat. Commun., 16, https://doi.org/10.1038/s41467-025-66180-2, 2025.
Yang, Y., Tilman, D., Jin, Z., Smith, P., Barrett, C. B., Zhu, Y.-G., Burney, J., D'Odorico, P., Fantke, P., Fargione, J., Finlay, J. C., Rulli, M. C., Sloat, L., Jan van Groenigen, K., West, P. C., Ziska, L., Michalak, A. M., Lobell, D. B., Clark, M., Colquhoun, J., Garg, T., Garrett, K. A., Geels, C., Hernandez, R. R., Herrero, M., Hutchison, W. D., Jain, M., Jungers, J. M., Liu, B., Mueller, N. D., Ortiz-Bobea, A., Schewe, J., Song, J., Verheyen, J., Vitousek, P., Wada, Y., Xia, L., Zhang, X., and Zhuang, M.: Climate change exacerbates the environmental impacts of agriculture, Science, 385, eadn3747, https://doi.org/10.1126/science.adn3747, 2024.
Yokamo, S., Irfan, M., Huan, W., Wang, B., Wang, Y., Ishfaq, M., Lu, D., Chen, X., Cai, Q., and Wang, H.: Global evaluation of key factors influencing nitrogen fertilization efficiency in wheat: a recent meta-analysis (2000–2022), Sec. Plant Nutrition, https://doi.org/10.3389/fpls.2023.1272098, 2023.
Yu, G., Jia, Y., He, N., Zhu, J., Chen, Z., Wang, Q., Piao, S., Liu, X., He, H., Guo, X., Wen, Z., Li, P., Ding, G., and Goulding, K.: Stabilization of atmospheric nitrogen deposition in China over the past decade, Nat. Geosci., 12, 424–429, https://doi.org/10.1038/s41561-019-0352-4, 2019.
Zabel, F., Delzeit, R., Schneider, J. M., Seppelt, R., Mauser, W., and Václavík, T.: Global impacts of future cropland expansion and intensification on agricultural markets and biodiversity, Nat. Commun., 10, https://doi.org/10.1038/s41467-019-10775-z, 2019.
Zampieri, M., Ceglar, A., Dentener, F., and Toreti, A.: Wheat yield loss attributable to heat waves, drought and water excess at the global, national and subnational scales, Environ. Res. Lett., 12, https://doi.org/10.1088/1748-9326/aa723b, 2017.
Zhang, X., Davidson, E. A., Mauzerall, D. L., Searchinger, T. D., Dumas, P., and Shen, Y.: Managing nitrogen for sustainable development, Nature, 528, 51–59, https://doi.org/10.1038/nature15743, 2015.
Zhao, C., Piao, S., Huang, Y., Wang, X., Ciais, P., Huang, M., Zeng, Z., and Peng, S.: Field warming experiments shed light on the wheat yield response to temperature in China, Nat. Commun., 7, 1–8, https://doi.org/10.1038/ncomms13530, 2016.
Zheng, J., Yu, L., Du, Z., Xiao, L., and Huang, X.: Modeling wheat development under extreme weather with WOFOST-EW v1, Geosci. Model Dev., 18, 8379–8400, https://doi.org/10.5194/gmd-18-8379-2025, 2025.
- Abstract
- Introduction
- Model overview and preprocessing
- Model description and calibration
- Emulator validation
- First results
- Discussion and conclusion
- Code and data availability
- Author contributions
- Competing interests
- Disclaimer
- Acknowledgements
- Financial support
- Review statement
- References
- Supplement
- Abstract
- Introduction
- Model overview and preprocessing
- Model description and calibration
- Emulator validation
- First results
- Discussion and conclusion
- Code and data availability
- Author contributions
- Competing interests
- Disclaimer
- Acknowledgements
- Financial support
- Review statement
- References
- Supplement