the Creative Commons Attribution 4.0 License.
the Creative Commons Attribution 4.0 License.
 | 16 Jun 2026
Evaluating modifications to Tiedtke cumulus parameterization for improving summer precipitation forecasts in the nested grid of Taiwan Global Forecast System (TGFS v1.1)
Chang-Hung Lin
Guo-Yuan Lien
Ling-Feng Hsiao
The Taiwan Global Forecast System (TGFS), which is a global numerical weather prediction system equipped with a nested regional domain, has become operational at Taiwan's Central Weather Administration since September 2023. To improve summertime precipitation forecasts in the 4.8 km-resolution nested simulations of TGFS, numerous modifications to the Tiedtke cumulus parameterization are made. First, scale-aware treatments to the convective mass flux and trigger condition are applied in the Tiedtke scheme to enhance the role of grid-scale microphysics processes, which effectively improves the pattern and location of afternoon thunderstorm precipitation. Based on the scale-aware Tiedtke version, further changes are made to reduce the precipitation biases. Constraints on convective updrafts are modified to reduce the occurrence and intensity of convection. The definition of convective cloud tops is revised to reduce their height to a more reasonable level. Additionally, the convective trigger function, entrainment, and detrainment rates are assumed to be more sensitive to environmental relative humidity, resulting in a further reduction in precipitation. The combination of these modifications successfully improves the precipitation forecast skill for summer rainfall events.
- Article
(11351 KB) - Full-text XML
- BibTeX
- EndNote


During summer, Taiwan frequently experiences heavy rainfall from afternoon thunderstorms, southwesterly monsoon flow, and typhoons, which can lead to severe flash flooding, landslides, and significant economic losses. Improving the forecasts of convection initiation, evolution, and associated rainfall is essential for the numerical weather prediction (NWP) development in this area. Several studies have carried out substantial work on observational and numerical research related to heavy rainfall events in Taiwan (Lin et al., 2011; Xu et al., 2012; Chang et al., 2014; Tu et al., 2014; Chien and Chiu, 2023; Wang et al., 2005). The complex interactions between various scales of weather systems, along with the complex topography of Taiwan that influences the environmental flow, present significant challenges for the NWP.
At Taiwan's Central Weather Administration (CWA), the Taiwan Global Forecast System (TGFS; Lien et al., 2023; Chen et al., 2024) was recently developed based on the version 15 of the National Centers for Environmental Prediction (NCEP) Global Forecast System (GFS), which is part of the Unified Forecast System (UFS) Weather Model (https://github.com/ufs-community/ufs-weather-model, last access: 29 October 2025). The TGFS became operational in September 2023, replacing CWA's previous operational global model (Liou et al., 1997; Liu et al., 2018). Considering that higher resolution models, which better represent convective processes, are essential for capturing the complex nature of atmospheric circulations (e.g., Wagner et al., 2018; Weber et al., 2020), a 4.8 km-resolution nested-grid domain (Harris and Lin, 2013) covering the region surrounding Taiwan is embedded in the first version of TGFS. The TGFS nested domain aims to provide finer details on location, structure, and evaluation of weather systems, offering a better representation of the convective-scale phenomena than the TGFS global domain.
The use and improvement of convective parameterization schemes can be a critical issue in improving the performance of the TGFS nested domain. Conventionally, numerical models with horizontal grid spacings greater than 10 km activate convective parameterization to account for unresolved convective transport and cloud processes, enabling the models to reproduce accurate atmospheric conditions (Wang, 2022). For models with a grid size smaller than 10 km but greater than approximately 2 to 4 km, they are typically considered to lie within the “gray zone”, where the model's grid size approaches the convective scale and can partially resolve convective processes but the subgrid-scale convective effects remain considerable (Hong and Dudhia, 2012; Tomassini et al., 2023). In recent studies, modifications to convection schemes by adopting various scale-aware parameterizations have been demonstrated to successfully improve precipitation forecasts in models at this resolution range. Zheng et al. (2016) introduced scale-aware parameterization into the Kain-Fritsch convection scheme (Kain, 2004) in the Weather Research and Forecasting (WRF) model, resulting in better location and intensity of precipitation simulations with 9 and 3 km grid sizes. Kwon and Hong (2017) designed scale-aware parameters based on the ratio of grid-scale to the subgrid-scale vertical velocity and the model grid size. They applied these parameters to the Simplified Arakawa-Schubert scheme (Lim et al., 2014) at the 3 km grid size in WRF, making the revised convection scheme produce more accurate results for summer monsoon precipitation over the Korean Peninsula. Wang (2022) developed a scale-aware parameterization for the Tiedtke scheme (Zhang and Wang, 2017) in the WRF model and the Model for Prediction Across Scales (MPAS), demonstrating that simulations at 1.5–4.5 km grid sizes with the modified Tiedtke scheme improved precipitation forecasts.
The 4.8 km grid spacing of the TGFS nested domain makes it right within the gray-zone range. With some initial evaluation at the early stage of the TGFS development, the Tiedtke cumulus convective parameterization (Bechtold et al., 2014; hereafter TDK) was chosen to be used in the TGFS nested domain, instead of the scale-aware Simplified Arakawa-Schubert convection scheme (hereafter sa-SAS) used in the TGFS global domain. This choice was made because the nested simulations with the sa-SAS scheme tended to underpredict the strength of convective updrafts associated with southwesterly monsoon flow and struggled to capture the characteristics of convective cells in afternoon thunderstorms. The implementation of the TDK scheme in the TGFS model (Lin and Hsiao, 2024; Chen et al., 2024) was adapted from that in a version of the MPAS model in 2016. Based on the original implementation, the TDK scheme in the TGFS nested domain underwent a series of developments, aimed at improving the precipitation forecast in Taiwan. First, following the experience of improving the sa-SAS in the global domain of the TGFS (Lin et al., 2022), similar modifications of the scale-aware treatment were also applied to the TDK scheme used in the nested domain. This scale-awareness-enabled TDK version was used in the nested domain in the first operational version of TGFS (TGFS v1.0), which began operations in September 2023. However, although this modified TDK scheme in TGFS v1.0 was already able to perform reasonably well for the precipitation forecast, it tended to produce overactive convective updrafts and unrealistic extreme rainfall amounts, particularly during periods of strong atmospheric instability in summer, resulting in significant heavy rainfall bias (Fig. 1) in the 4.8 km nested grid. To address these deficiencies, numerous modifications were further made to reduce the rainfall bias and improve overall precipitation forecasts. Eventually, an improved version has been used in the TGFS operational version 1.1 (v1.1) since May 2024.
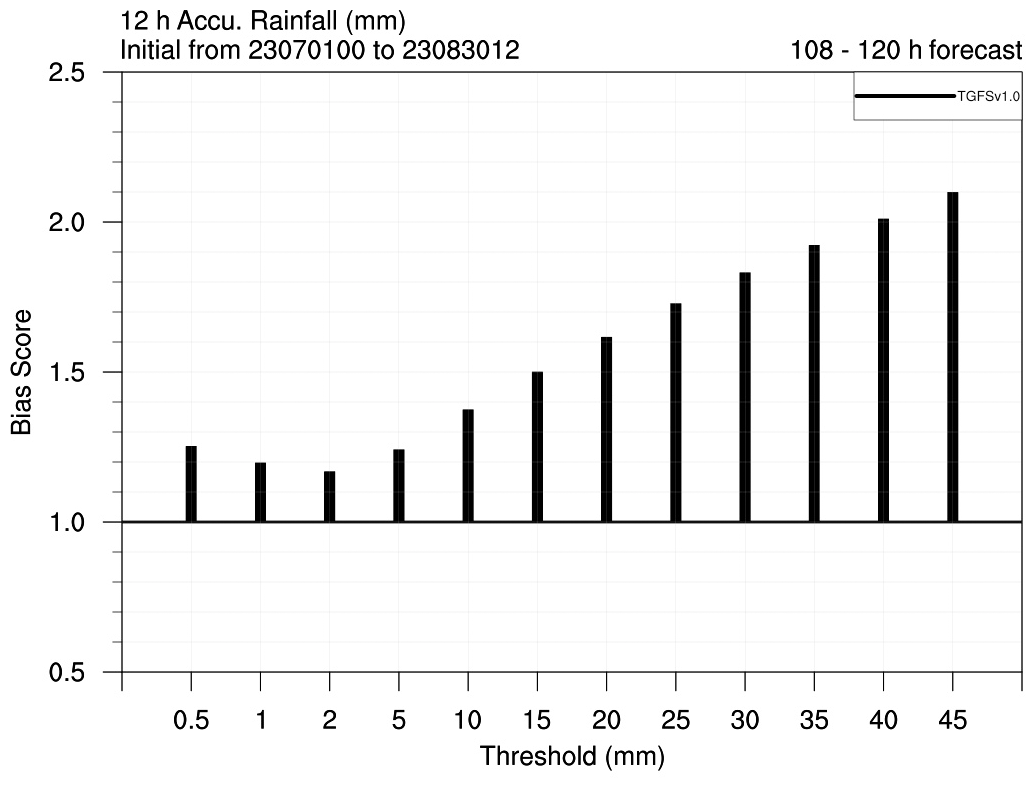
Figure 1Bias scores of 12 h accumulated precipitation during 108–120 h forecasts from TGFS v1.0 nested domain, verified over Taiwan's land area as a function of different thresholds and against Quantitative Precipitation Estimation and Segregation Using Multiple Sensors (QPESUMS; described later in Sect. 4) data. The forecast sample includes forecasts initialized at 00:00 and 12:00 UTC daily from 1 July to 30 August 2023.
This study encompasses descriptions and evaluations of the series of modifications to the TDK scheme in TGFS, from its initial adoption to the recent versions. The TGFS model configurations are presented in Sect. 2. Section 3 provides a detailed description of the various modifications made to the TDK scheme. Section 4 provides the experimental design. The evaluation results for an afternoon thunderstorm case and a southwesterly monsoon flow event are discussed in Sect. 5. Summary and conclusions are given in Sect. 6.
Developed based on the NCEP GFS model, the TGFS employs the National Oceanic and Atmospheric Administration (NOAA)/Geophysical Fluid Dynamics Laboratory (GFDL) Finite-Volume Cubed-Sphere dynamical core (FV3; Lin and Rood, 1997; Lin, 2004). Figure 2 illustrates the arrangement of tiles in the TGFS. The six cubed-sphere tiles for global simulation are configured with a C384 grid, equivalent to approximately 25 km horizontal resolution, and they are placed to position Taiwan at the center of one of the tiles. Additionally, a one-way nested-grid tile (Harris and Lin, 2013) is designed to encompass a small area in the vicinity of Taiwan, which runs at a 4.8 km resolution with 216×240 grid points. Both the global and nested tiles have 64 vertical semi-Lagrangian layers extending to 0.2 hPa.
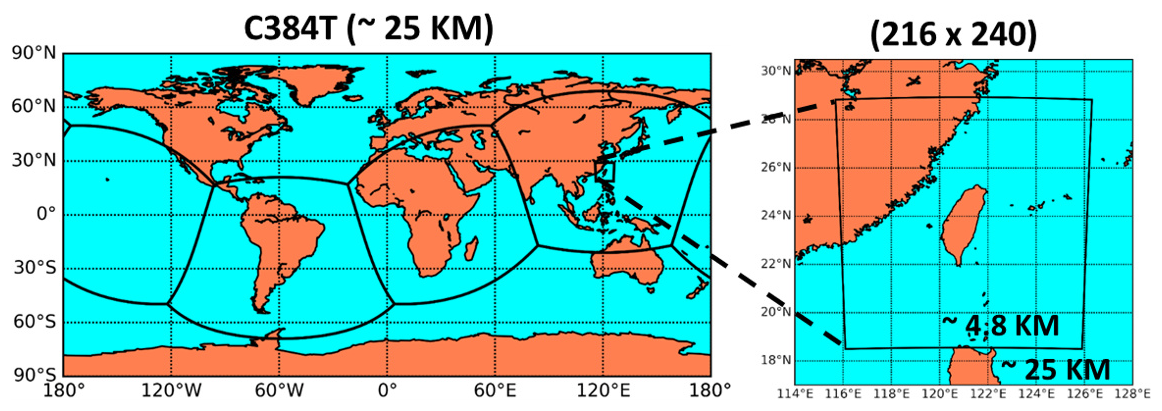
Figure 2Illustration of TGFS tiles for global (left) and nested (right) domains. Thick black lines in the global domain indicate the boundaries of cubed-sphere tiles. The nested-grid tile, located at the center of one of the six tiles, covers the vicinity of Taiwan. The horizontal grid sizes in global and nested tiles are approximately 25 and 4.8 km, respectively.
The physics suite for the global domain is mainly based on NCEP GFS version 15, including planetary boundary layer vertical diffusion scheme (Han et al., 2016), sa-SAS shallow and deep convection schemes (Grell, 1993; Arakawa and Schubert, 1974; Han and Pan, 2011; Han et al., 2017), orographic and convective gravity wave drag schemes (Chun and Baik, 1994; Kim and Arakawa, 1995; Kim and Doyle, 2005), GFDL microphysics scheme (Chen and Lin, 2011; Chen and Lin, 2013), and the rapid radiative transfer model for general circulation models (RRTMG) shortwave and longwave radiation schemes (Clough et al., 2005). One exception is that the sa-SAS convection schemes in GFS version 15 have been modified for their scale-aware treatments, based on Kwon and Hong (2017), to reduce the systematic temperature warm bias over tropical regions (Lin et al., 2022). The nested domain uses similar physics configurations to those in the global domain to implement medium-range forecasts, except that the sa-SAS deep convection scheme has been replaced by the TDK scheme to achieve better overall precipitation performance. The details of the TDK scheme used in the nested domain, which is the main focus of this study, are presented in the next section.
The TDK scheme uses a bulk mass flux approach to simulate subgrid-scale convective processes and considers three convective cloud types, including deep, shallow, and mid-level convection. Only one cloud type is considered at a grid point. A new convective available potential energy (CAPE) closure, proposed by Bechtold et al. (2014), is employed to determine the convective mass flux. This closure considers the boundary layer forcing, which improves coupling between free atmosphere and the boundary layer, contributing to a better representation of the diurnal cycle.
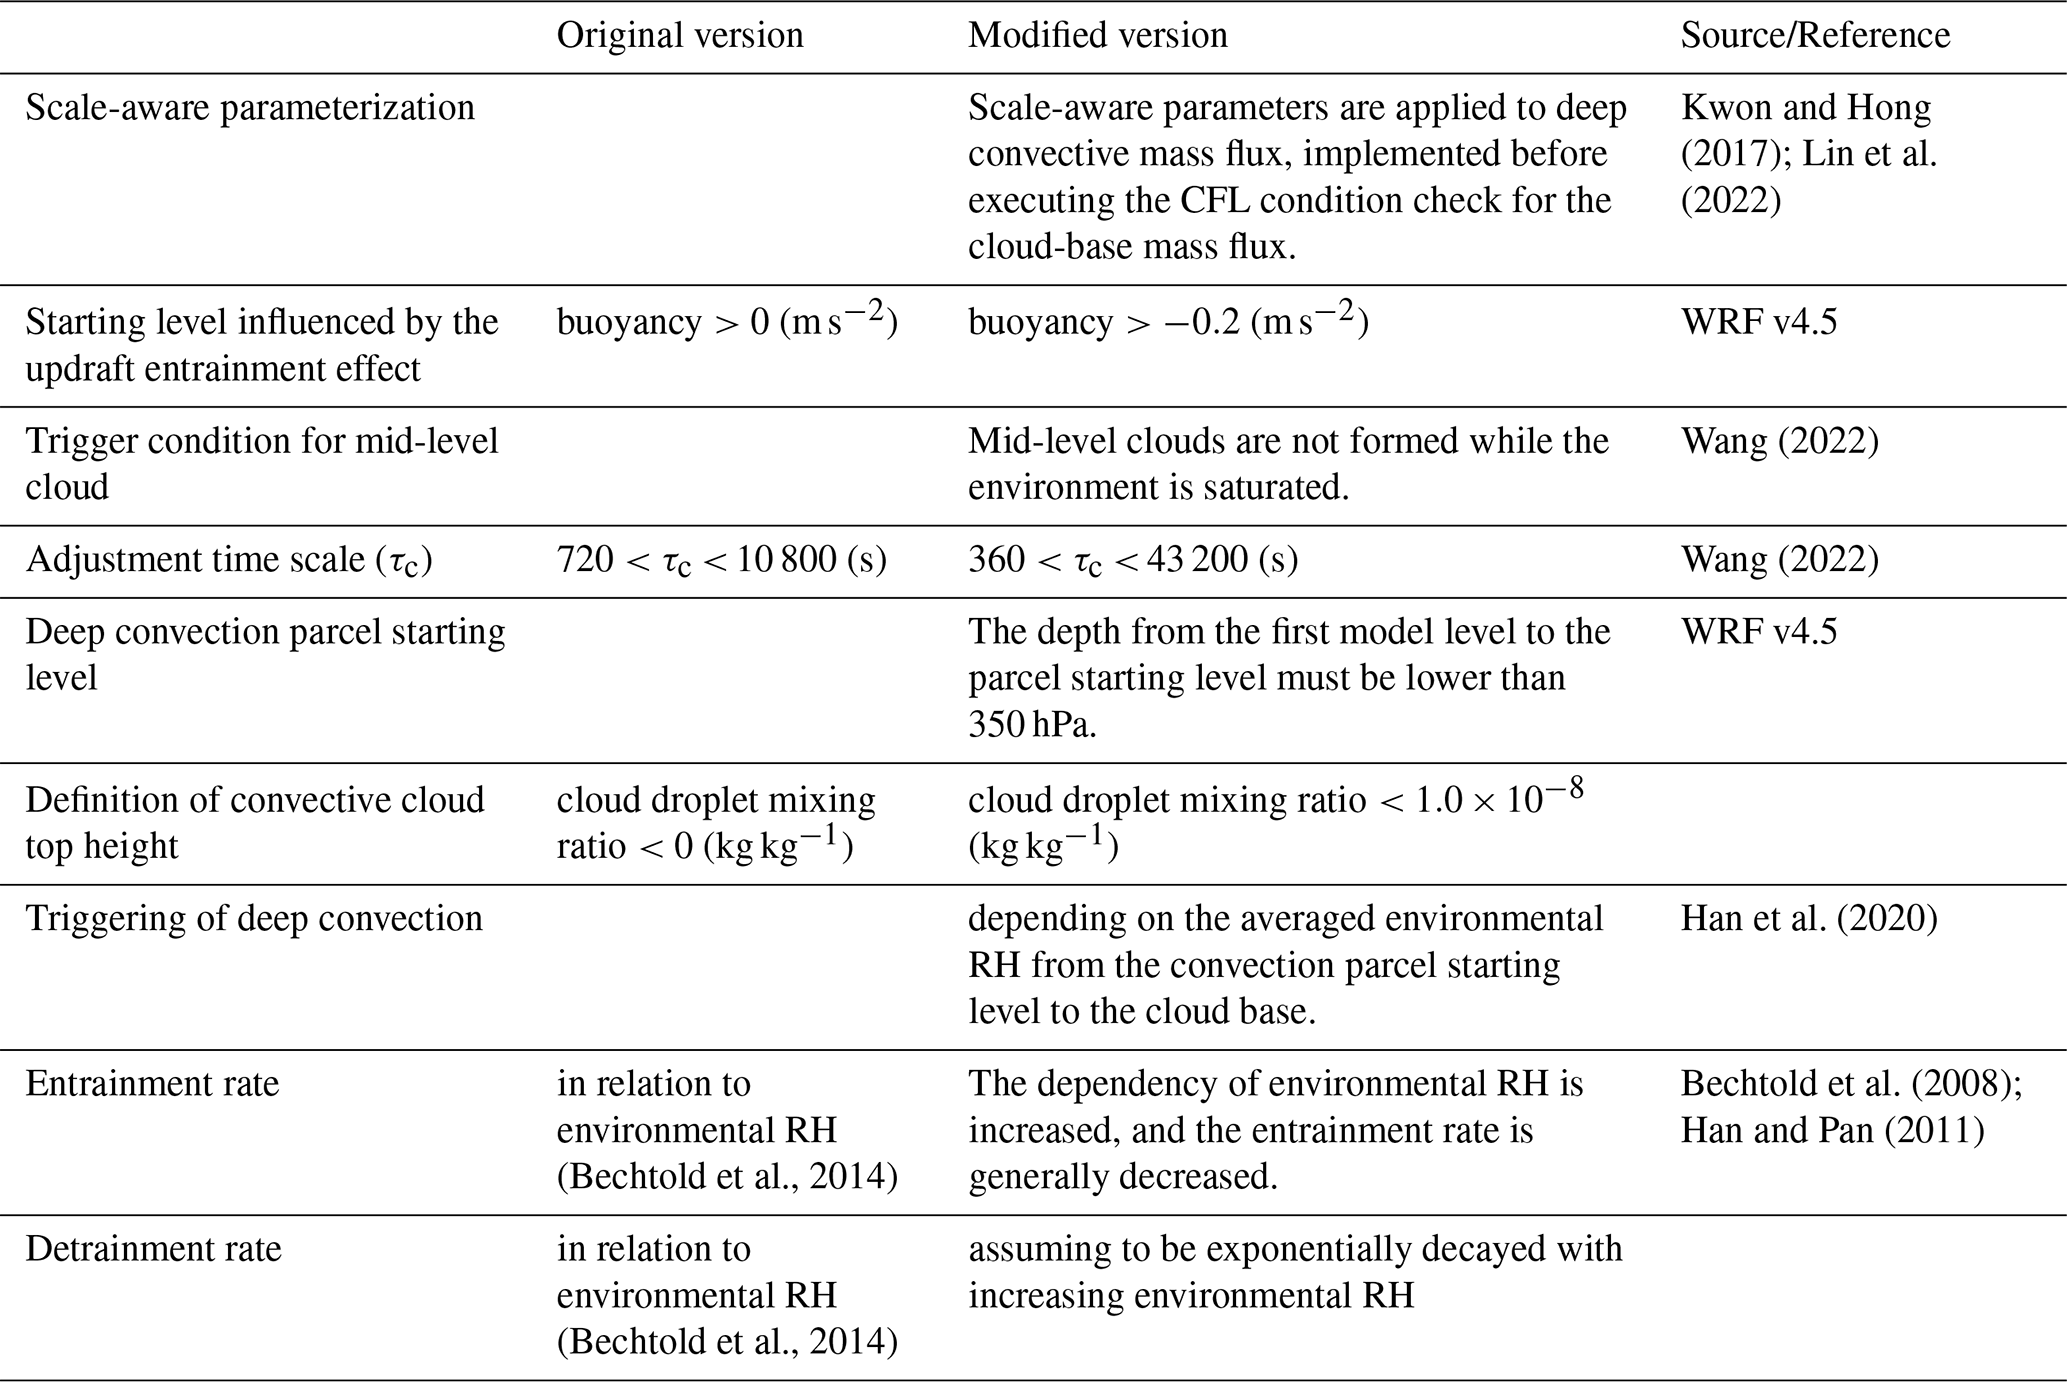
This study examines the impacts of a series of modifications to the TDK scheme implemented in the TGFS nested domain. First, the scale-aware parameters are introduced into the TDK scheme to improve accuracy in reproducing the detailed features of afternoon thunderstorms. Subsequent modifications to the convective processes in the TDK cumulus scheme are then made to alleviate the issues of overestimated convective updrafts and the widespread occurrence of unrealistic heavy rainfall during summer, resulting in a disorganized rainfall pattern and a positive precipitation bias (Fig. 1). Table 1 summarizes the differences between the original Tiedtke scheme (based on a version of MPAS in 2016) and the modified version described in this study for the TGFS nested domain. These modifications can be categorized into four components: (1) applying scale-aware parameters to the convective mass flux based on Kwon and Hong (2017) and Lin et al. (2022); (2) updating the criteria for constraints on convective updrafts based on the settings in WRF version 4.5 (v4.5) and those described in Wang (2022); (3) decreasing the convective cloud top height; and (4) enhancing the dependency on the environmental relative humidity (RH) for the convective trigger condition (Han et al., 2020), entrainment (Bechtold et al., 2008; Han and Pan, 2011), and detrainment rates. The details of each modification in the convection scheme are described in the following subsections.
Table 1Summary of the differences between the original Tiedtke scheme (based on a version of MPAS in 2016) and the modified version in this study for the TGFS nested domain.
3.1 Scale-aware parameterization
In the TGFS nested domain, with the horizontal grid size of approximately 4.8 km, convective updrafts are not sufficiently resolved by grid-scale processes at this model resolution. Therefore, the nested simulations without convection schemes can lead to less organized convective structures and excessive extreme rainfall due to excessive environmental instability. On the other hand, when convective parameterization is implemented at this resolution, the fractional areas of convective updrafts in a grid box are not negligibly small, invalidating the assumption of traditional convection schemes. As a result, the TGFS nested simulations with the convection schemes are unable to accurately represent the features of the rainfall events, especially for afternoon thunderstorms, leading to greater precipitation errors. The above difficulties make this range of model resolutions known as a gray zone. To mitigate the gray zone issue, several scale-aware parameterizations for convection schemes, e.g., Arakawa and Wu (2013), Kwon and Hong (2017), Wang (2022), have been developed, which reduce the convective mass flux depending on the model resolution to allow the convection schemes to be suitably used in the gray-zone resolutions.
This study follows the methodology based on Kwon and Hong (2017) to introduce the scale-awareness into the TDK scheme in the TGFS nested domain. Their approach adds scale-aware parameters into the cloud-base mass flux, the convective trigger function, and convective cloud water detrainment. However, we apply the scale-aware parameters only to the mass flux and the trigger function following our previous work (the “EXPM” experiment in Lin et al., 2022) that implemented the above scale-aware capabilities within the sa-SAS scheme used in the global domain of TGFS. Specifically, the scale-aware formulations for the cloud-base mass flux, Mu, and the trigger function, TRG, are defined as follows:
where the superscript “org” represents their original values before applying the scale-aware treatments. The first scale-aware parameter σ1 is defined as:
where Δx is the horizontal grid size in meters, and Δ1 and Δ2 are constants whose values are set to 5000 m (4000 m in one sensitivity experiment) and 1000 m, respectively. It is noted that Eq. (2) in Kwon and Hong (2017), as well as Eq. (4) in Lin et al. (2022), appear to contain a typo, and the correct formulation is given in Eq. (3) here. The other scale-aware parameter σ2 is defined as the ratio of the grid scale vertical velocity, , to the subgrid-scale vertical velocity, :
where the overbar denotes the mean value over the layer between the cloud base and the cloud top.
However, it is important to note that in the TDK scheme, a conditional statement is executed when the cloud-base mass flux (M) exceeds the maximum value (Mmax) defined by the Courant-Friedrichs-Lewy (CFL) condition (Jakob and Siebesma, 2003). When this condition is met, the M is reduced to Mmax to prevent model instability. Under a strongly unstable environment, if the scale-aware parameters are applied after executing the conditional statement, M may first be reduced to Mmax and then further reduced by the scale-aware parameters; conversely, if the scale-aware parameters are implemented before executing the conditional statement, M is likely only reduced by the scale-aware parameters and may satisfy the CFL condition, resulting in a larger M value with the scale-aware adjustment. The latter approach is used in this study because it enhances the contribution of the convection scheme and improves the accuracy of precipitation forecasts, as later shown in Sect. 5.2.
3.2 Constraints on convective updrafts
The modifications related to the constraints on convective updrafts follow the TDK scheme in WRF v4.5 (also implemented in MPAS version 8.0) and Wang (2022). These include the changes to the determination of the starting level influenced by the updraft entrainment effect, the trigger condition for mid-level clouds, the adjustment time scale, and the restriction on the updraft parcel's starting level. The criterion for determining the level at which the rising parcel begins to be affected by organized entrainment is adjusted from buoyancy >0 m s−2 to buoyancy m s−2 (negative values indicate that the air parcel is forced downward). Additionally, based on the description in Wang (2022), the formation of mid-level clouds is prohibited when the environment is saturated, and the lower and upper bounds of the convective adjustment time scale are extended from 720 and 10 800 s to 360 and 43 200 s, respectively. The extension of the adjustment time scale allows the parameterization to consume environmental instability more slowly, resulting in weaker convective updrafts. Furthermore, a restriction is added to ensure that the depth between the first model level and the level where updrafts originate is less than 350 hPa. This is intended to prevent the convection from being lifted at excessive altitude.
3.3 Definition of convective cloud top
Convective cloud tops are determined by finding the level where both the kinetic energy and the cloud droplet mixing ratio decrease to exactly zero. However, based on some experimental evidence (described in Sect. 5.2), this cloud droplet mixing ratio criterion is considered to be too stringent for the TGFS nested model, presumably due to the coarser vertical resolution at higher levels and also the numerical errors, leading to overestimated cloud top heights. In the TDK scheme, the cloud-base mass flux is determined by the required consumption of CAPE within a given adjustment time scale (Bechtold et al., 2014). Therefore, a higher cloud top level can lead to a greater vertical integration depth for buoyancy. Consequently, the updraft mass flux computed under this convective cloud top threshold can potentially become too intense, leading to overestimated condensation rates and precipitation. Therefore, the threshold of cloud droplet mixing ratio is adjusted to a very small value of kg kg−1. This modification significantly reduces the convective cloud top height to a more reasonable level, weakens the intensity of updrafts, and thereby leads to a decline in the rain rate.
3.4 Dependency on environmental relative humidity for convection triggering, entrainment, and detrainment
To further eliminate some excessive heavy rainfall in the TGFS nested simulations, the convective trigger condition, entrainment, and detrainment rates are modified by enhancing their dependencies on environmental RH. First, following the modifications described in Kwon and Hong (2017) and Han et al. (2020), a restriction is imposed on the convection triggering in the TDK scheme when the pressure difference (ΔP) between the convection-starting level (CSL) and the level of free convection (LFC) is less than a threshold value determined by the average RH between CSL and LFC () and a parameter β:
where
Pmin and Pmax are set to 120 and 240 hPa, respectively (Lim et al., 2014), and σ1 is a scale-aware parameter previously defined in Eqs. (3) and (4). This added trigger condition inhibits convection in dry environments below the sub-cloud layer.
Regarding the updraft entrainment and detrainment rates for deep convection ( and , respectively), they are originally assumed to be in relation to environmental RH by Bechtold et al. (2014):
where εup and δup are constant values of m−1 and m−1, respectively. fs is a vertical scaling function that strongly decreases with height. and are the saturation specific humidity at the pressure level and the cloud base, respectively, where the overbar denotes the environmental or grid mean value. The dependency on RH for entrainment and detrainment rates indicates that drier environments lead to higher entrainment and detrainment rates and thus suppression of convection. In order to suppress unrealistic grid-scale heavy rainfall in TGFS nested simulations, both the entrainment and detrainment rates are modified to be more sensitive to environmental RH, resulting in more significant suppression of extreme rainfall. The revised entrainment rate is parameterized based on Bechtold et al. (2008):
where
E0 is the entrainment mixing that is inversely proportional to the height H (m) within cloud levels; ce is an empirical coefficient set to 0.1 in this study; d1 is a parameter with a value of 10−4 m−1. The vertical scaling functions F0 and F1 are defined similarly to fs in Eq. (8). On the other hand, the detrainment rate is revised to exponentially decrease with the cube of environmental RH:
The revised formulations generally decrease the entrainment and detrainment rates, leading to a more active convection scheme and allowing the convection to consume more moisture and environmental instability. Consequently, the environment is more stabilized to prevent overestimated precipitation.
As mentioned earlier, this study aims to improve the precipitation forecasts during summer in TGFS nested simulations. Two heavy rainfall cases in August 2023 are selected to investigate the impacts of convection parameterization schemes following a series of modifications described in the previous sections. First, an afternoon thunderstorm event on 26 August 2023 is selected to evaluate the impact of scale-aware implementations in the TDK scheme (Sect. 3.1). An afternoon thunderstorm case is suitable for this purpose because it presents challenges for numerical models with convection parameterization in simulating the spatial and temporal distributions of precipitation. Second, a southwesterly flow event that produced intense rainfall over southwestern Taiwan on 10 August 2023 is selected to evaluate the impacts of the other modifications in the scale-aware TDK scheme (Sect. 3.1: changing the order of applying the scale-aware parameters; Sect. 3.2, 3.3, 3.4), focusing on their effects on mitigating the heavy rainfall bias at medium-range (48–60 h) forecast lead times.
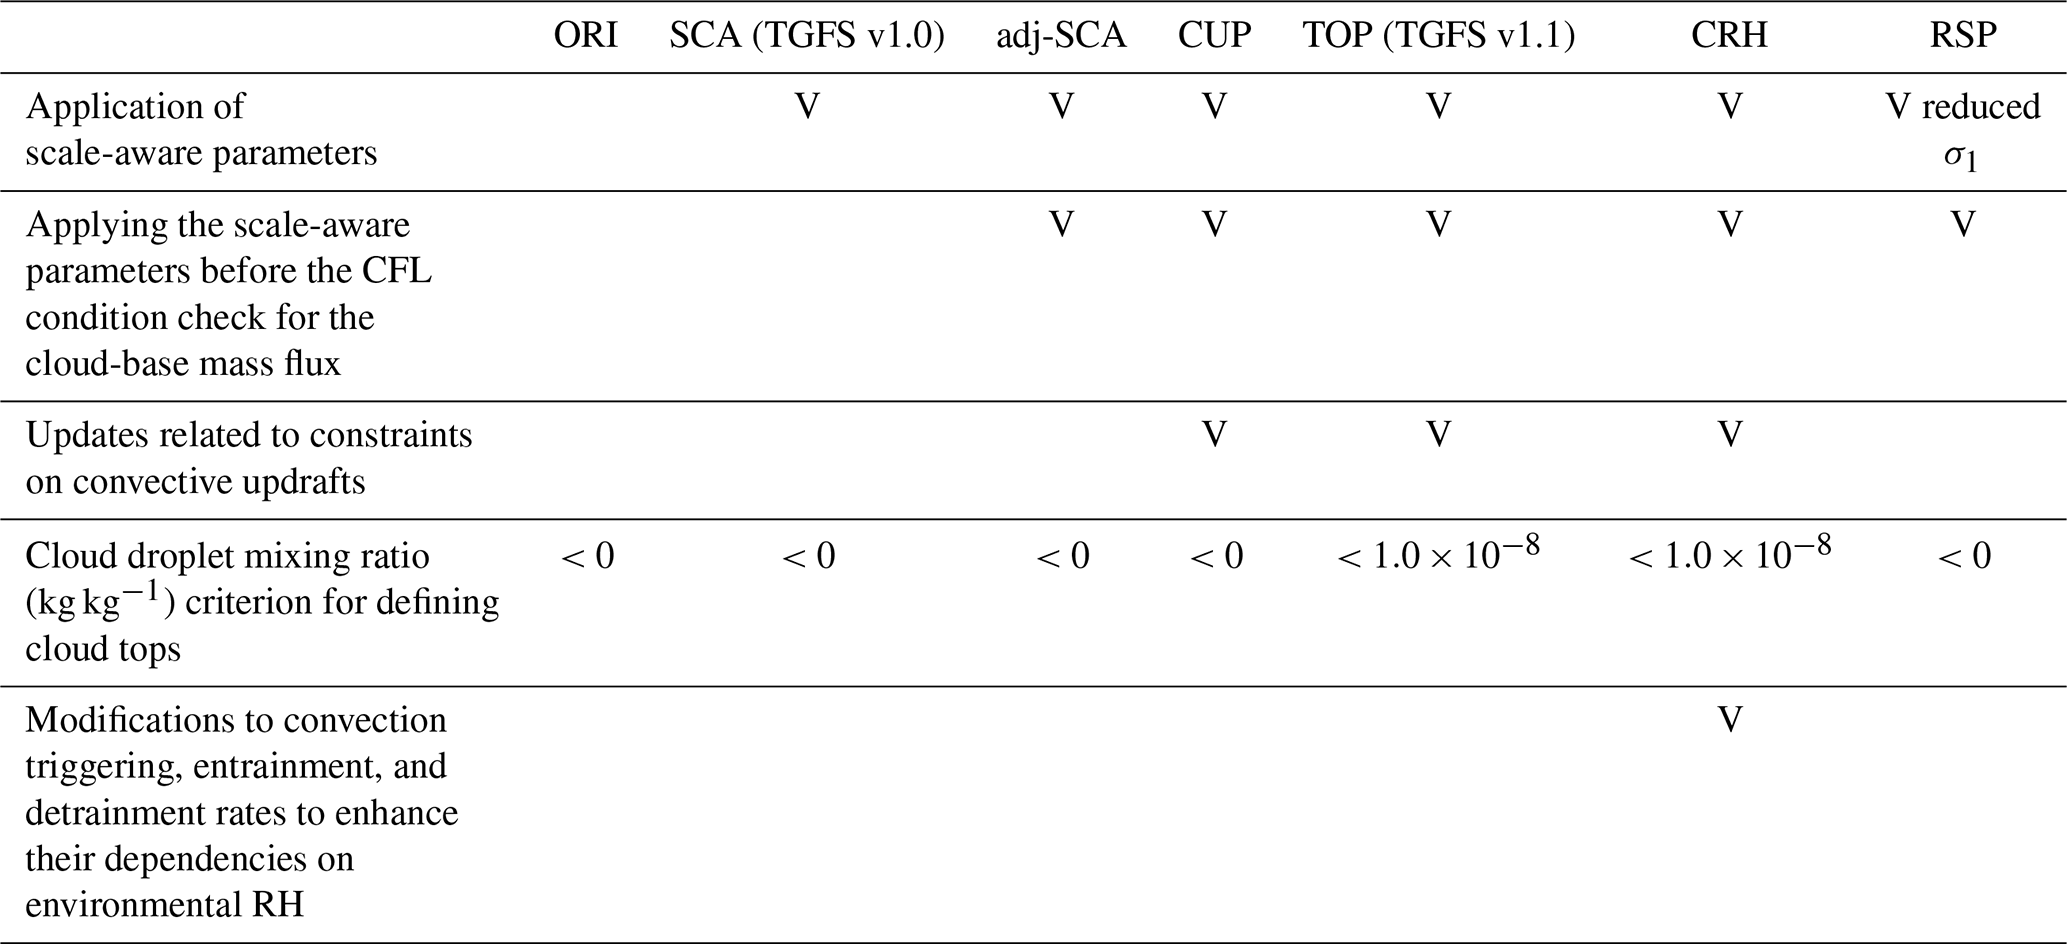
Table 2 summarizes the experiments. The ORI experiment uses the original TDK scheme (Table 1) in the nested domain. Then, the series of modifications described in Sect. 3 are organized into five experiments: The experiment with the scale-aware parameterization in the TDK scheme is referred to as SCA, which implements the scale-aware parameters after the CFL condition check for the cloud-base mass flux. This experiment is identical to the first operational version (v1.0) of the TGFS. By adjusting the order of applying the scale-aware parameters so they are before the CFL condition check, the experiment is referred to as adj-SCA. Based on this version, all modifications related to the constraints on convective updrafts following Wang (2022) and WRF v4.5 (Sect. 3.2) are applied in the CUP experiment. Additionally, based on CUP, the experiment adjusting the criterion for convective cloud tops (Sect. 3.3) is referred to as TOP. Then, further modifications to deep convection triggering, entrainment, and detrainment rates (Sect. 3.4) are tested with the CRH experiment. It is noted that the TOP configuration has been used in the TGFS v1.1 operation, updated in May 2024, based on the evaluation at the time. Lastly, based on adj-SCA, a sensitivity experiment, RSP, is conducted with a smaller value of the scale-aware parameter σ1 in Eqs. (3) and (4). The value of Δ1 is changed from 5000 to 4000 m, which effectively reduces σ1 from 0.55 to 0.28 at the grid size in the TGFS nested domain, 4.8 km.
The ORI and SCA experiments are studied with the afternoon thunderstorm case, and the SCA, adj-SCA, CUP, TOP, CRH, and RSP experiments are analyzed with the southwesterly flow case. In addition to the above case studies, to objectively evaluate the precipitation forecast skill over a long period during summer, 120 h forecasts are conducted twice a day during the two-month period from 1 July to 30 August 2023 for the SCA and CRH experiments. All forecasts are initialized from the TGFS analysis data at the resolution of its global grids (i.e., 25 km).
The gauge-corrected radar rainfall estimate data from the Quantitative Precipitation Estimation and Segregation Using Multiple Sensors (QPESUMS) system (Chang et al., 2021) are used to verify precipitation forecasts in the TGFS nested domain. The spatial and temporal resolutions of the QPESUMS data are 1 km and 10 min, respectively. The wind forecast results are validated against the European Centre for Medium-Range Weather Forecasts (ECMWF) Integrated Forecasting System (IFS) analysis data, which have a spatial resolution of 0.1°. The cloud top height data, retrieved at CWA from Himawari-9 satellite observation using the Clouds from AVHRR Extended (CLAVR-x) processing system (Thomas et al., 2004), are also used to evaluate the nested simulations. The horizontal resolution of these data is 0.04°.
5.1 Afternoon thunderstorm case
Figure 3 shows the 0–12 h accumulated precipitation forecasts initialized at 00:00 UTC on 26 August 2023 from the ORI (Fig. 3b) and SCA (Fig. 3c) experiments. Compared to QPESUMS observations (Fig. 3a), ORI without scale-aware parameterization exhibits spurious widespread light rain and underestimates heavy rainfall intensity. The QPESUMS observations show a maximum accumulated precipitation amount of 160 mm, whereas ORI only reaches 101 mm, with the maximum rainfall incorrectly distributed along the ridge of the Central Mountain Range (CMR) rather than on its western slope as observed (the terrain height of Taiwan is indicated in Fig. 3d). Meanwhile, the characteristics of rainfall distribution with many individual convective cells are not reproduced by ORI. This issue could be attributed to the overactive convection scheme, which suppresses realistic convection events due to the invalid assumption that the convective updrafts occupy a negligible portion of the grid area. After introducing the scale-aware parameters to the TDK scheme, SCA successfully captures the precipitation distribution for the afternoon thunderstorms despite a structure that remains too coarse owing to the moderate resolution of 4.8 km, revealing the model's ability to partially resolve the convective processes. However, although the rainfall distribution in SCA is better than ORI, its rainfall intensity is overestimated, exhibiting a maximum of 176 mm within 12 h.
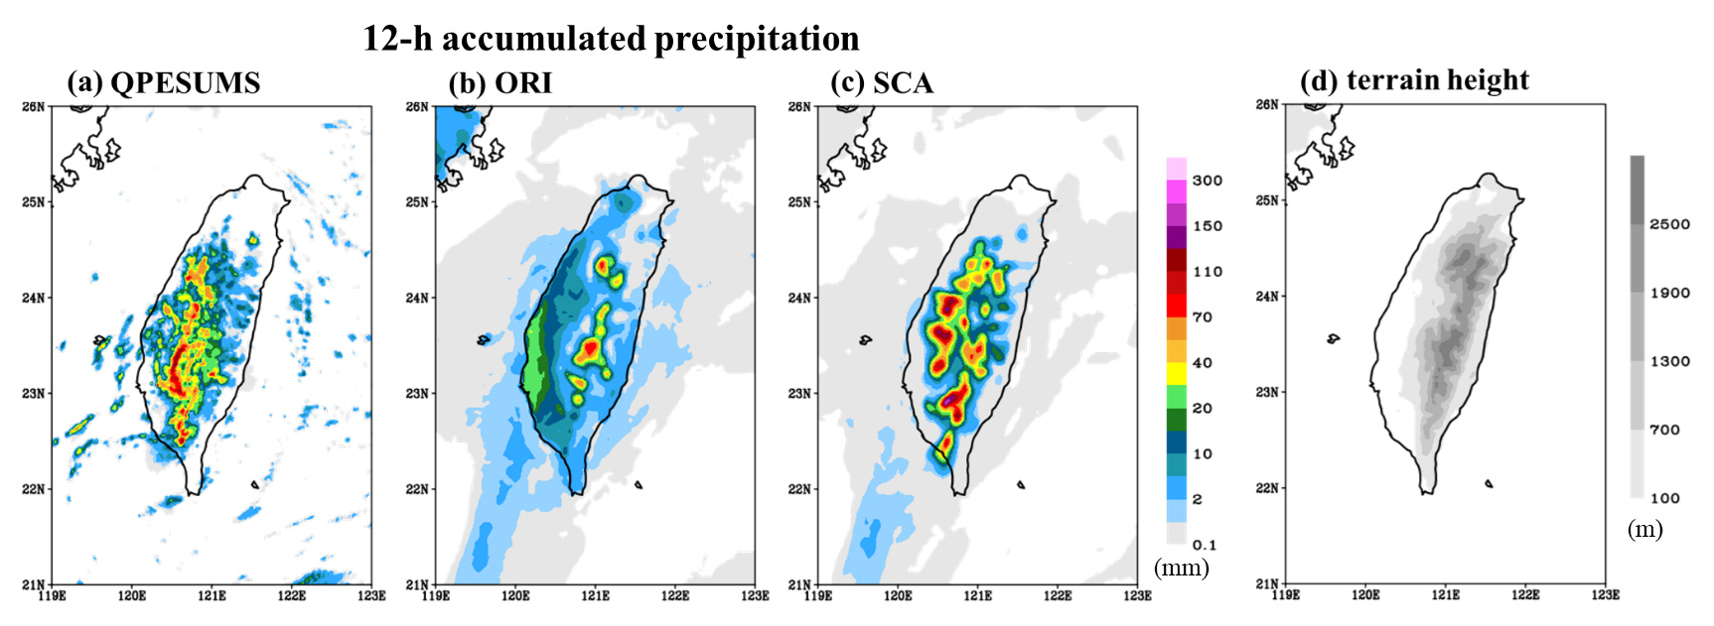
Figure 312 h accumulated precipitation (mm) from 00:00 to 12:00 UTC on 26 August 2023 in (a) QPESUMS observation and TGFS nested-domain forecasts from the (b) ORI and (c) SCA experiments initialized at 00:00 UTC on 26 August 2023. (d) Terrain height (m) in the TGFS nested domain.
Figure 4 shows the evolution of hourly precipitation rates for subgrid-scale and grid-scale precipitation as well as total precipitation (sum of the former two), averaged over Taiwan's land area from the ORI and SCA experiments. It is evident that rainfall in ORI initiates too early and its peak value is underestimated compared to the QPESUMS observations. The precipitation incorrectly starts at 09:00 local time in the morning, primarily driven by subgrid-scale processes (convection scheme), and it exhibits an abrupt enhancement at 14:00 local time and reaches its maximum around 16:00 local time as the grid-scale processes (microphysics scheme) begin to contribute. During the period from 15:00 to 21:00 local time, the grid-scale and subgrid-scale precipitation each contribute about 50 % of the total precipitation. In contrast, the contribution from subgrid-scale precipitation is substantially reduced in SCA, making grid-scale precipitation the dominant component in the precipitation forecast. The initiation of the precipitation is delayed until 14:00 local time, closer to the observed time. However, the total rainfall intensity is significantly greater than the observation. The same evaluation is further performed with other 18 selected days in July 2023 characterized by afternoon thunderstorm-type weather (figure not shown). The mean diurnal evolution of precipitation reveals that the peak time of precipitation, on average, is consistent with the observation (unlike this specific case), but the early initiation issue remains clear in ORI, with a time lead of about 2 to 3 h, and the issue is largely solved in SCA. At the same time, the significant overestimation of the maximum rainfall in SCA is also evident in the 18-case average result.
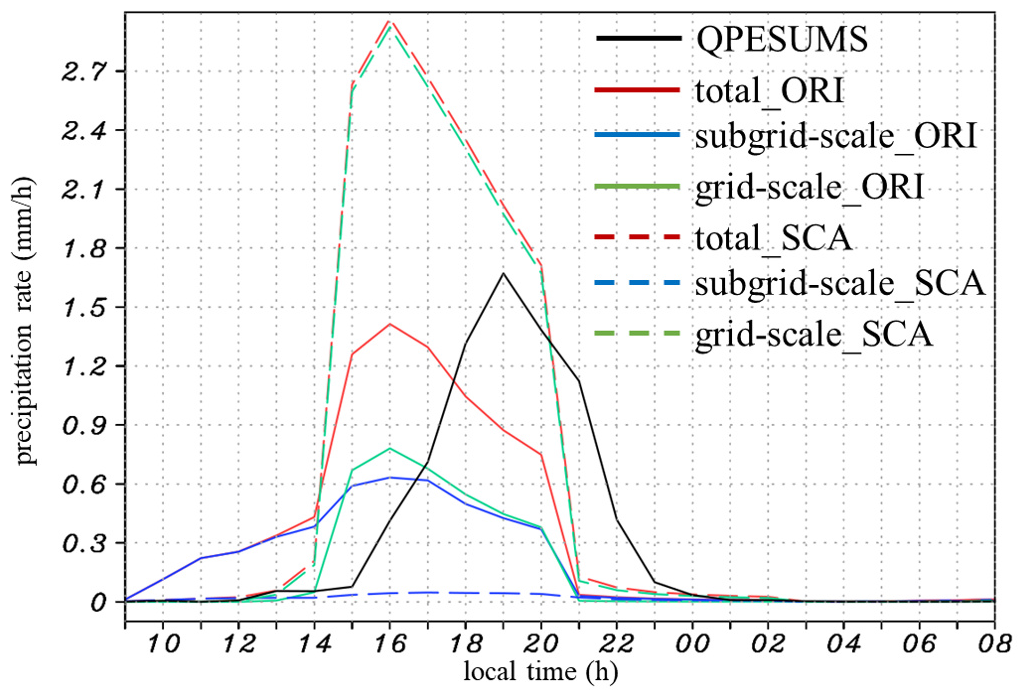
Figure 4Evolution of hourly precipitation rates (mm h−1) of total (red), subgrid-scale (blue) and grid-scale (green) precipitation averaged over Taiwan's land area during the 24 h period starting from 00:00 UTC (08:00 local time) on 26 August 2023 from the ORI (solid line) and SCA (dashed line) experiments. The black line shows the observed precipitation rate from QPESUMS.
The 925 hPa wind fields and horizontal divergence in ORI and SCA are shown in Fig. 5, in comparison with the ECMWF IFS analysis data. The IFS analysis (Fig. 5a) reveals that Taiwan is under an easterly environment, and two lee-side vortices form over the northwestern and southwestern offshore regions. Low-level convergence is observed not only along the ridge but also on the western slope of CMR, corresponding to the rainfall areas (Fig. 3a). ORI fails to simulate the low-level convergence over the southwestern slope of CMR (Fig. 5b), causing weaker updrafts and an underestimated precipitation amount. After applying the scale-aware parameters to the updraft mass flux and trigger condition, the spatial distribution of convergence is better captured in SCA (Fig. 5c), indicating that the scale-aware implementation can also improve the dynamical fields in this afternoon thunderstorm case.
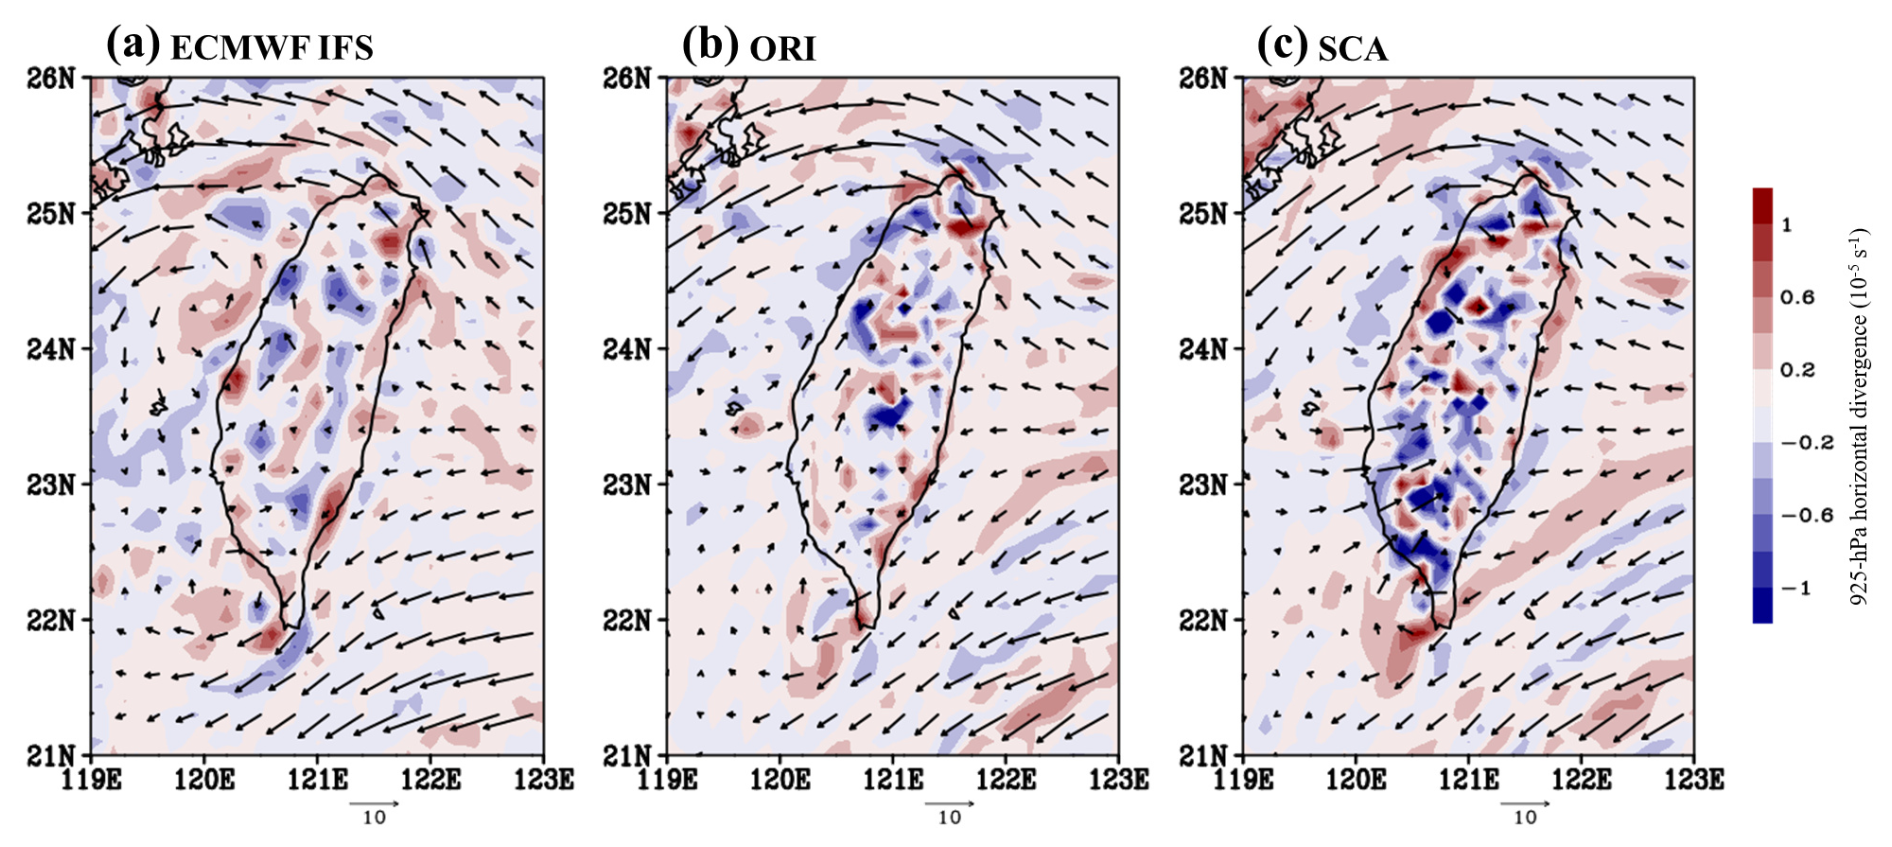
Figure 5925 hPa wind vectors (m s−1) and 925 hPa horizontal divergence (shading; 10−5 s−1) at 06:00 UTC 26 August 2023 from (a) ECMWF IFS analysis data and 6 h forecasts from the (b) ORI and (c) SCA experiments.
5.2 Southwesterly flow case
As shown in the previous subsection, the SCA experiment successfully represents key characteristics of the afternoon thunderstorm event, including its high intensity, localized rainfall, and temporal evolution. However, it significantly overpredicts the maximum rainfall. This overprediction of rainfall is recurrently found during the summer. As the SCA configuration was used in the TGFS v1.0 operation, this emerged as the top issue in feedback from the forecasters at CWA. Therefore, a series of modifications to the TDK scheme are made to limit convection activity, intending to reduce the heavy rainfall biases. Here, a southwesterly flow heavy rainfall event is selected to demonstrate the impacts of these modifications, as it represents a typical case of the rainfall overprediction issue.
Figure 6a shows the 12 h accumulated rainfall during the period from 00:00 to 12:00 UTC on 10 August 2023 from QPESUMS observations, and Fig. 6b–g show the corresponding precipitation forecasts in the TGFS nested domain from the 48–60 h forecasts initialized at 00:00 UTC on 8 August 2023 in the SCA, adj-SCA, CUP, TOP, CRH, and RSP experiments, respectively. The observation shows two main precipitation areas during this 12 h period: one is located along the southwestern coast of Taiwan, and another is located over northern Taiwan. These two rainfall sections were caused by different mechanisms, with the rain primarily occurring at slightly different times: The former was associated with a convective line developed along the southwestern coast of Taiwan within a prevailing southwesterly flow environment, with maximum 12 h accumulated rainfall reaching around 200 mm, peaking in the morning; The latter was primarily caused by afternoon thunderstorms (occurred in the afternoon).
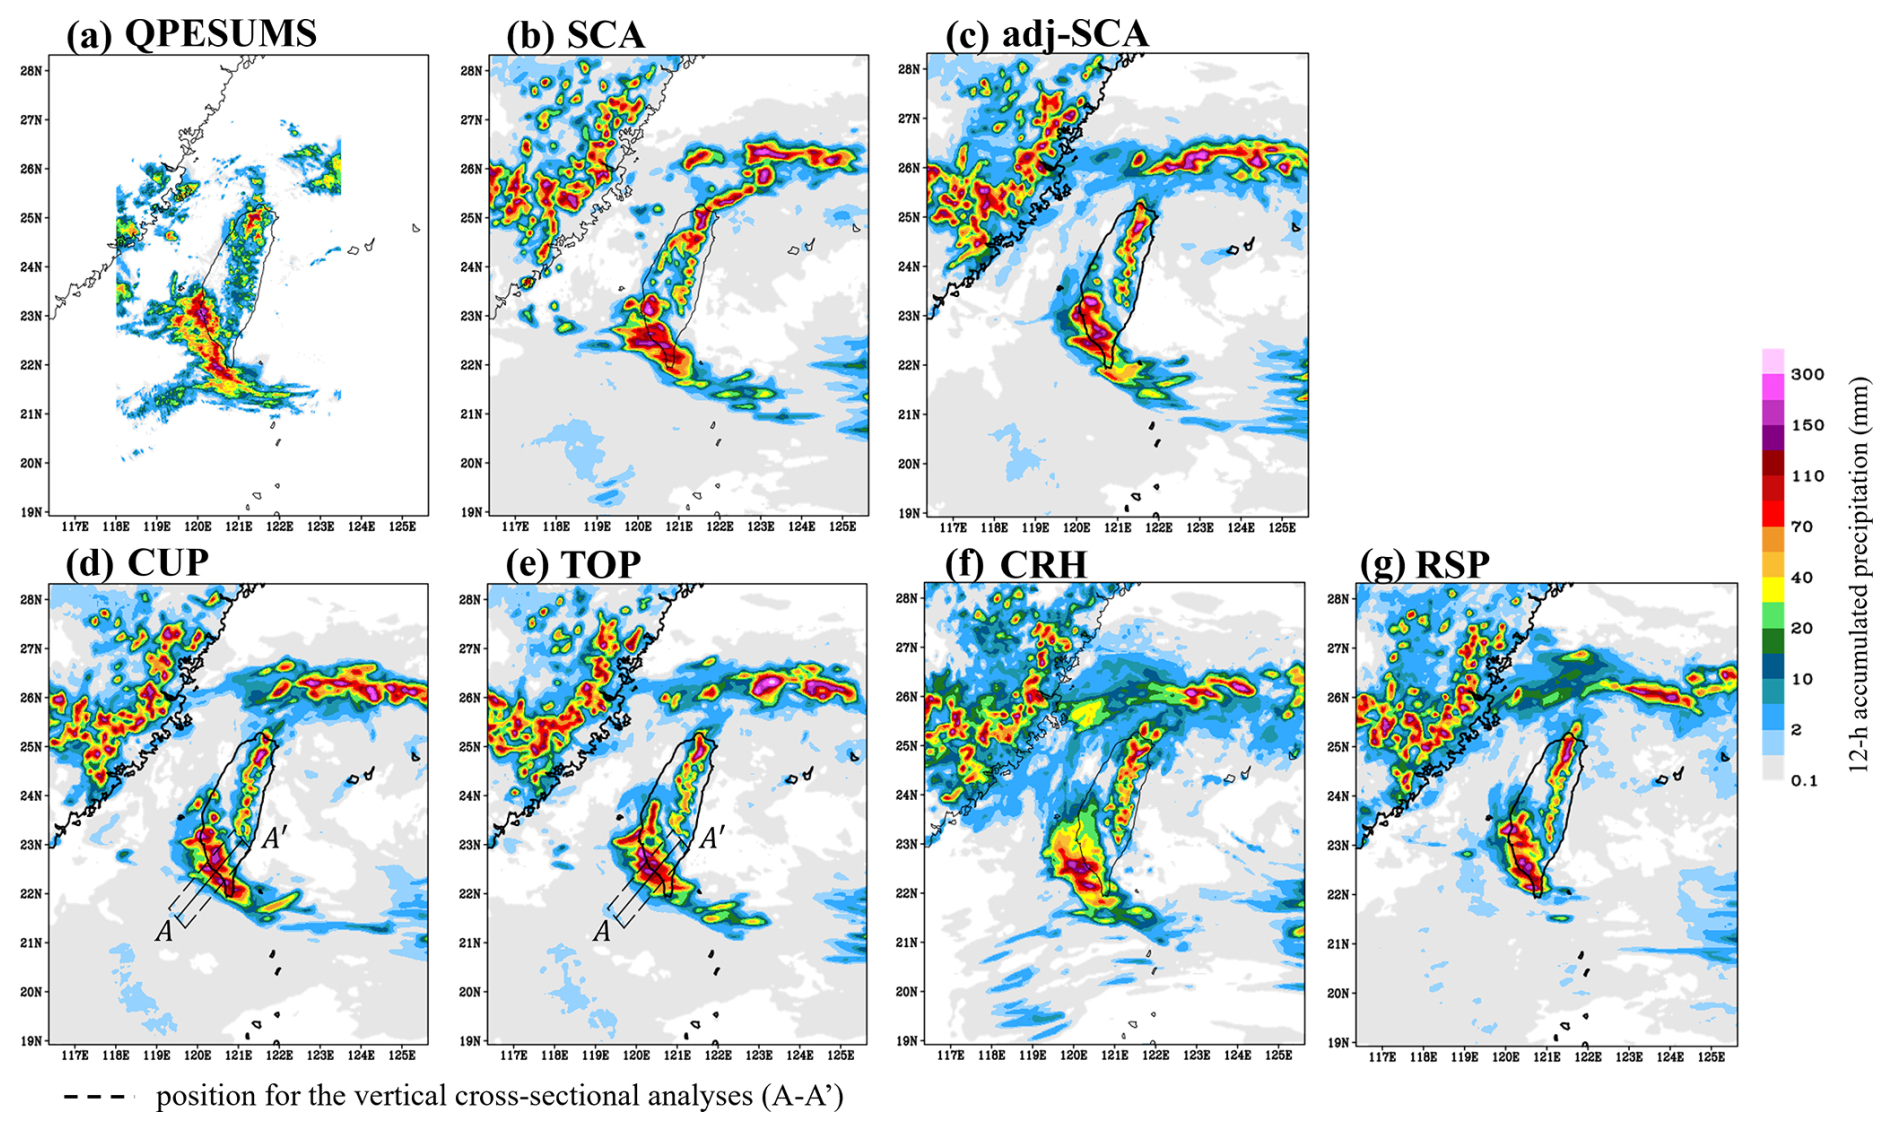
Figure 6(a) 12 h accumulated precipitation (mm) from 00:00 to 12:00 UTC on 10 August 2023 based on QPESUMS observation. The 48–60 h accumulated precipitation forecasts valid at the same period from the (b) SCA, (c) adj-SCA, (d) CUP, (e) TOP, (f) CRH, and (g) RSP experiments. The solid line (A–A′) in (d) and (e) denotes the position for the vertical cross-sectional analyses, while the dashed box indicates the average range.
In the SCA experiment (TGFS v1.0; Fig. 6b), although its 48–60 h accumulated precipitation forecast reasonably captures the characteristics of rainfall patterns influenced by the southwesterly flow and afternoon thunderstorms, the precipitation amount is noticeably overpredicted across the entire nested domain. Additionally, the rain band produced by the southwesterly flow is located further inland and distributed more widely compared to the observation.
After adjusting the order of operations for the scale-aware parameters (i.e., applying them before the CFL condition check for the cloud-base mass flux), the adj-SCA experiment (Fig. 6c) presents a significant reduction in the occurrence of heavy rainfall. By analyzing the contribution of subgrid-scale precipitation (Fig. 7), the results show that the ratio of subgrid-scale precipitation in SCA (Fig. 7f) is less than 10 % in the heavy rainfall region (12 h accumulated rainfall >70 mm), indicating that the heavy rainfall primarily stems from the microphysics scheme. The contribution from the convection scheme is small due to the implementation of scale-aware parameterization. In adj-SCA (Fig. 7b), the precipitation from the convection scheme is significantly higher than in SCA, especially for the heavy rainfall over southwestern Taiwan, where the ratio of subgrid-scale precipitation substantially increases to around 40 % (Fig. 7g). The enhanced contribution from the convection scheme consumes more environmental instability by subgrid-scale processes, resulting in the suppression of convective updrafts.
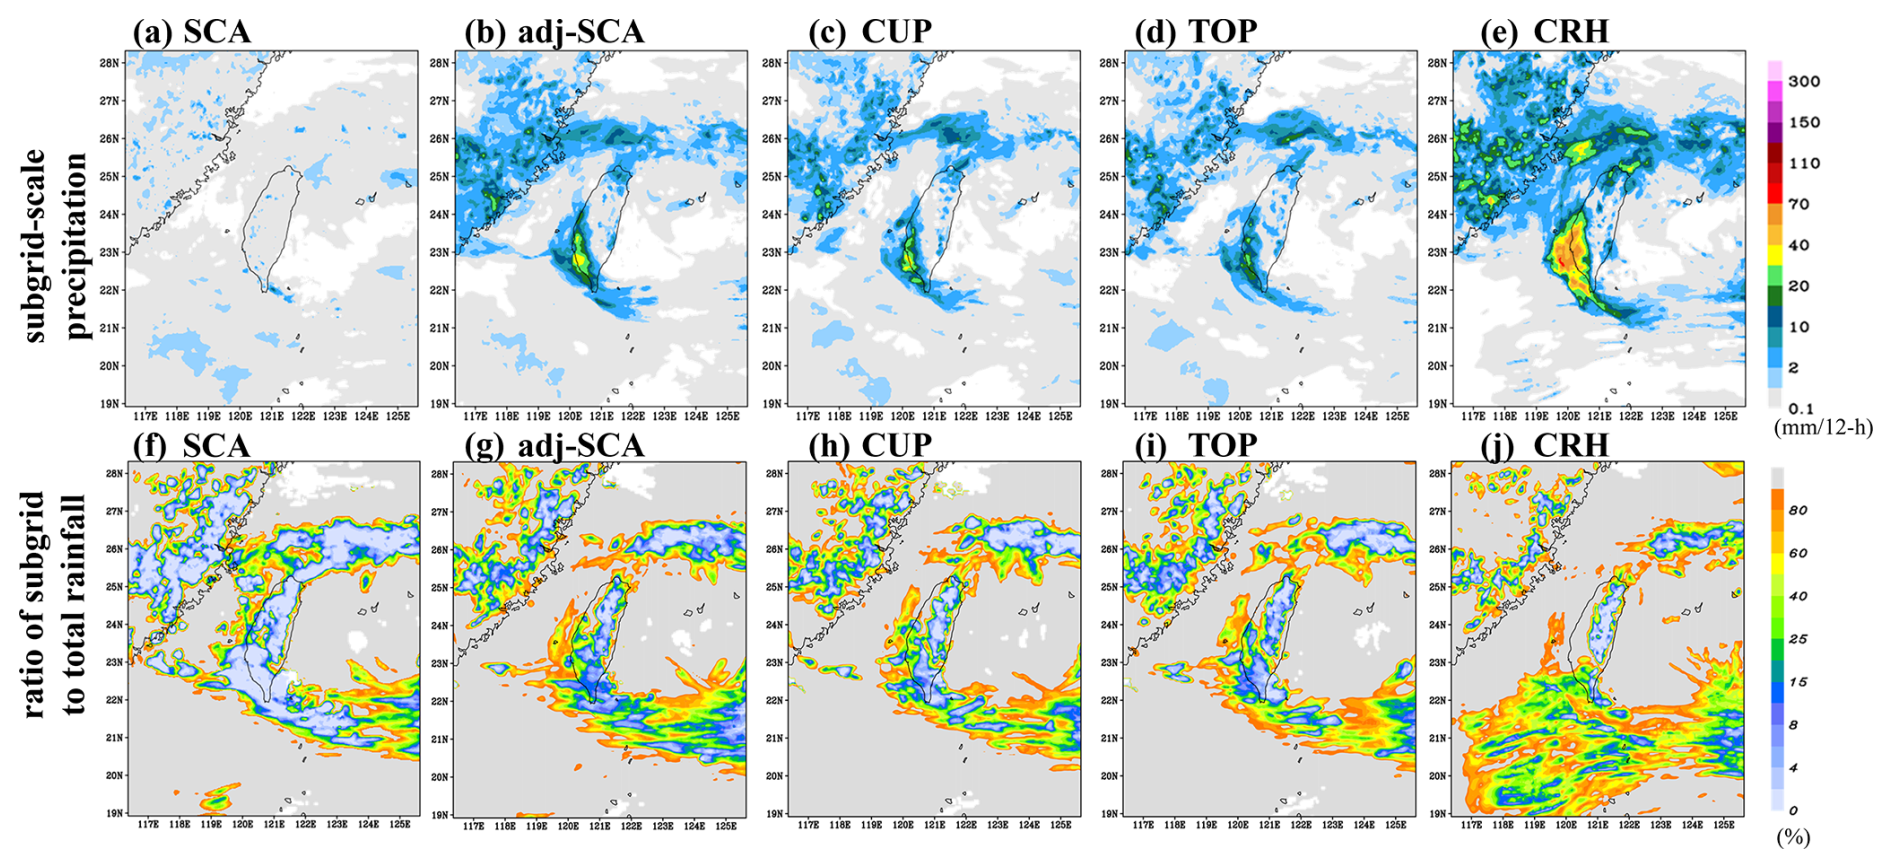
Figure 7Same as the 48–60 h precipitation forecast in Fig. 6, but for (a–e) subgrid-scale precipitation (mm) and (f–j) the ratio (%) of subgrid-scale precipitation to total (subgrid + grid) precipitation from the (a, f) SCA, (b, g) adj-SCA, (c, h) CUP, (d, i) TOP and (e, j) CRH experiments.
By adjusting several constraints on convective updrafts, the CUP experiment (Fig. 6d) shows a more accurate precipitation forecast than adj-SCA, with the convective system correctly aligning along the southwestern coastline of Taiwan and a general reduction in the amount of precipitation. It is verified that each individual modification involved in CUP (Sect. 3.2), based on WRF v4.5 and Wang (2022), contributes to a slight inhibition of unrealistic convection and a reduction in the strength of convective updrafts (not shown). Consequently, the combined modifications in CUP provide a better match with the observations. In contrast to adj-SCA, the contribution of subgrid-scale precipitation in CUP (Fig. 7c, h) is slightly reduced. However, this suppression of subgrid-scale convection does not lead to an increase in total precipitation, likely due to the complex interaction between the convection and microphysics schemes. Although the subgrid-scale convection is relatively suppressed, the overall environmental instability may not be sufficiently favorable or efficient for the microphysics scheme to create grid-scale rainfall. The results suggest that the instability retained by the weakened subgrid-scale processes might be converted into cloud water or light stratiform rain rather than heavy precipitation.
Based on CUP, by modifying the definition of convective cloud top (Sect. 3.3) in the TOP experiment, a similar effect as that achieved in CUP is further created, which reduces the subgird-scale precipitation (Fig. 7d) as well as the peak intensity of total precipitation (Fig. 6e) produced. Additionally, TOP shows a notable improvement in precipitation location, as the rain band over southwestern Taiwan shifts slightly offshore, aligning more closely with the observed rain band (Fig. 6a, e).
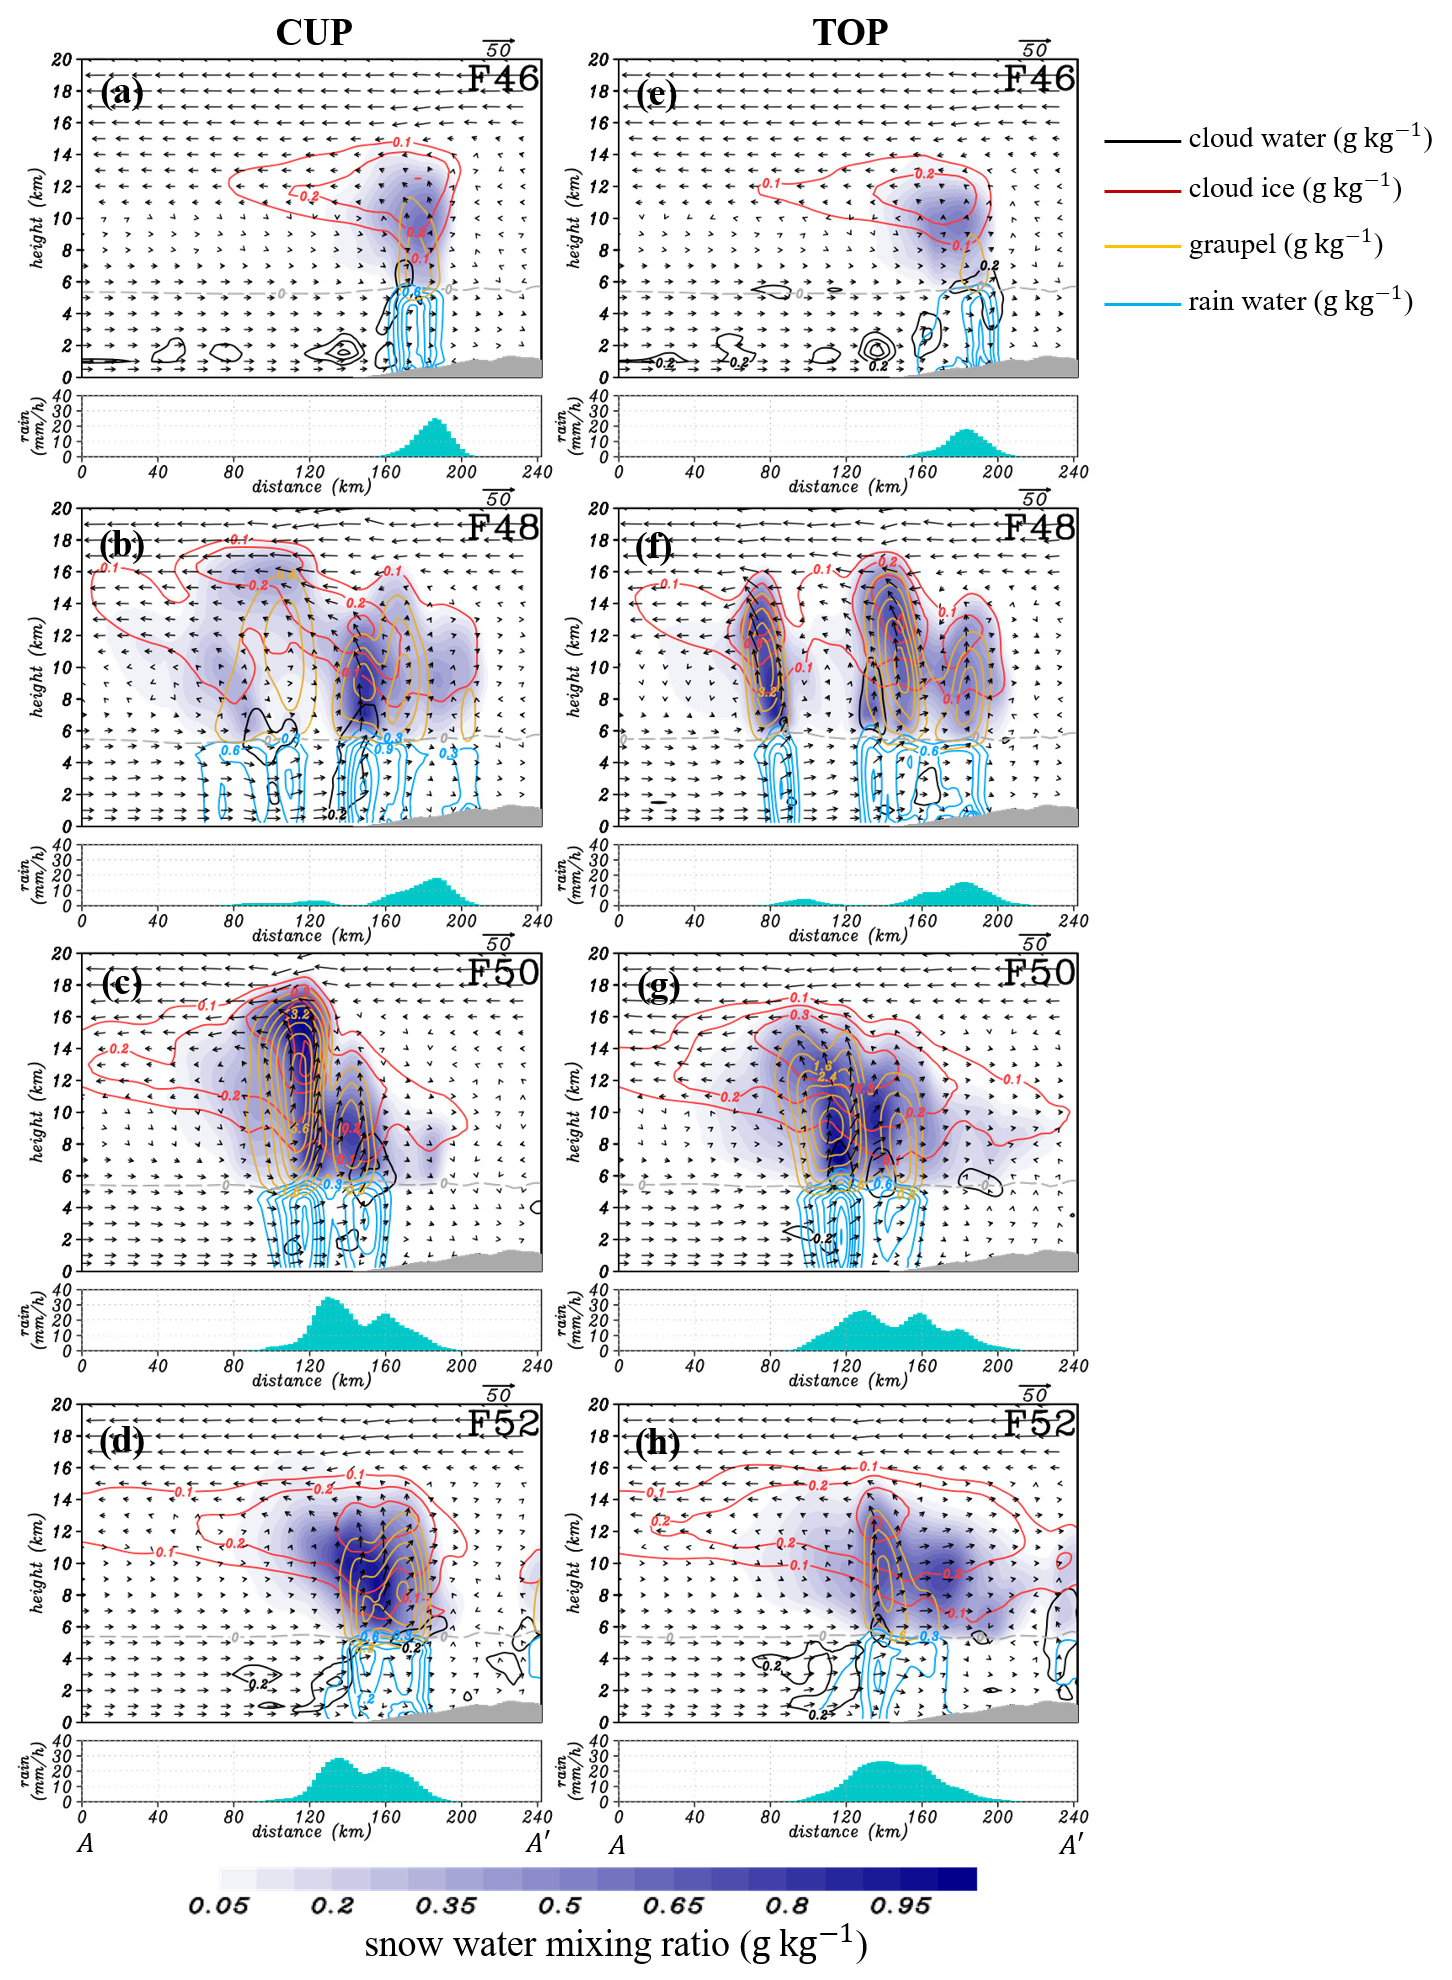
Figure 8Vertical cross sections along the A–A′ line in Fig. 6d, e of hydrometeor mixing ratios (g kg−1) and along-section vertical circulations (vectors; m s−1; scale shown in the top-right corner) for (a–d) CUP and (e–h) TOP at (a, e) 46 h, (b, f) 48 h, (c, g) 50 h, (d, h) 52 h forecasts. The cross sections are computed by averaging along the short axis of the dashed box denoted in Fig. 6d, e. Gray shading represents the averaged terrain height. Different contour colors represent the mixing ratios of cloud water (black; 0.2 g kg−1 interval), rain water (blue; 0.3 g kg−1 interval), cloud ice (red; 0.1 g kg−1 interval), and graupel (yellow; 0.8 g kg−1 interval), while the purple shading denotes the snow mixing ratio (g kg−1). The greenish-blue histogram denotes the rain rate (mm h−1).
To understand the mechanisms behind the offshore shift of the rain band, vertical cross-sectional analyses are performed along the A–A′ line shown in Fig. 6d, e, which is chosen to be perpendicular to the coastline. Figure 8 shows averaged (along the width of the dashed box) vertical cross-sections of hydrometeor mixing ratios at forecast times ranging from 46 to 52 h. Overall, they indicate that the development of convective systems in CUP and TOP presents a similar evolutionary trend. In the 46 h forecast (Fig. 8a, e), the convective cells develop near the coastline because of horizontal convergence at low levels, induced by the onshore winds slowing down due to surface friction. The cloud water is created at the leading edge of the deep convective systems (around the 160 km mark) and is advected upward by the convective updraft. The lighter particles of ice and snow are distributed at higher levels, while the distribution of snow extends over a wider range due to the convective outflow at upper levels. The graupel is concentrated above the melting level and below the heights where ice and snow particles present their maxima, due to its heavier mass. Two hours later (Fig. 8b, f), new convective cells are generated in the upstream region (around the 80 to 100 km marks) and propagate northeastward. Meanwhile, the inland convection begins to propagate southwestward, presumably influenced by the downslope movement of the cold pool over the land area. Subsequently, in the 50 h forecast (Fig. 8c, g), these two convective cells merge around the 120 km mark, evolving into intensive convection. The hydrometeor concentration in the deep convection significantly increases, producing heavy rainfall. After reaching its mature stage, the intensity of convective updrafts and the concentration of cloud droplets gradually subside (Fig. 8d, h).
Although the overall evolution of the convective systems is similar in CUP and TOP, there are some differences that are associated with the subtle shift of the rain band offshore in TOP. As shown in Fig. 8b and c, when the convective system reaches its mature stage, the vertical extent of cloud droplets in CUP with concentrations greater than 0.1 g kg−1 extends up to 19 km height. However, the satellite observations (Fig. 9) show that the maximum cloud top height for the convective system over the ocean southwest of Taiwan is only approximately 15 km, indicating that CUP substantially overestimates the cloud top height. With the modification in the definition of convective cloud top in the TOP experiment, the vertical extent of cloud droplets is successfully lowered to approximately 17 km, aligning better with observations. Moreover, during the mature stage, the altitude of the maximum graupel concentration decreases from 13 km in CUP to 9 km in TOP (Fig. 8c, g; at the 120 km mark). This reduction is related to a more moderate convective updraft, resulting in a less intense rainfall rate, decreasing from a maximum of around 35 to 27 mm h−1. On the other hand, the newly generated convective cell in the 48 h forecast is located around the 80 km mark in TOP, in contrast to the 100 km mark in CUP (Fig. 8b, f). This new convection in TOP is both farther from the coastline and more intensified than that in CUP. In all, with a reduced cloud top height in TOP, the intense precipitation is predominantly produced over the ocean rather than near the coast.
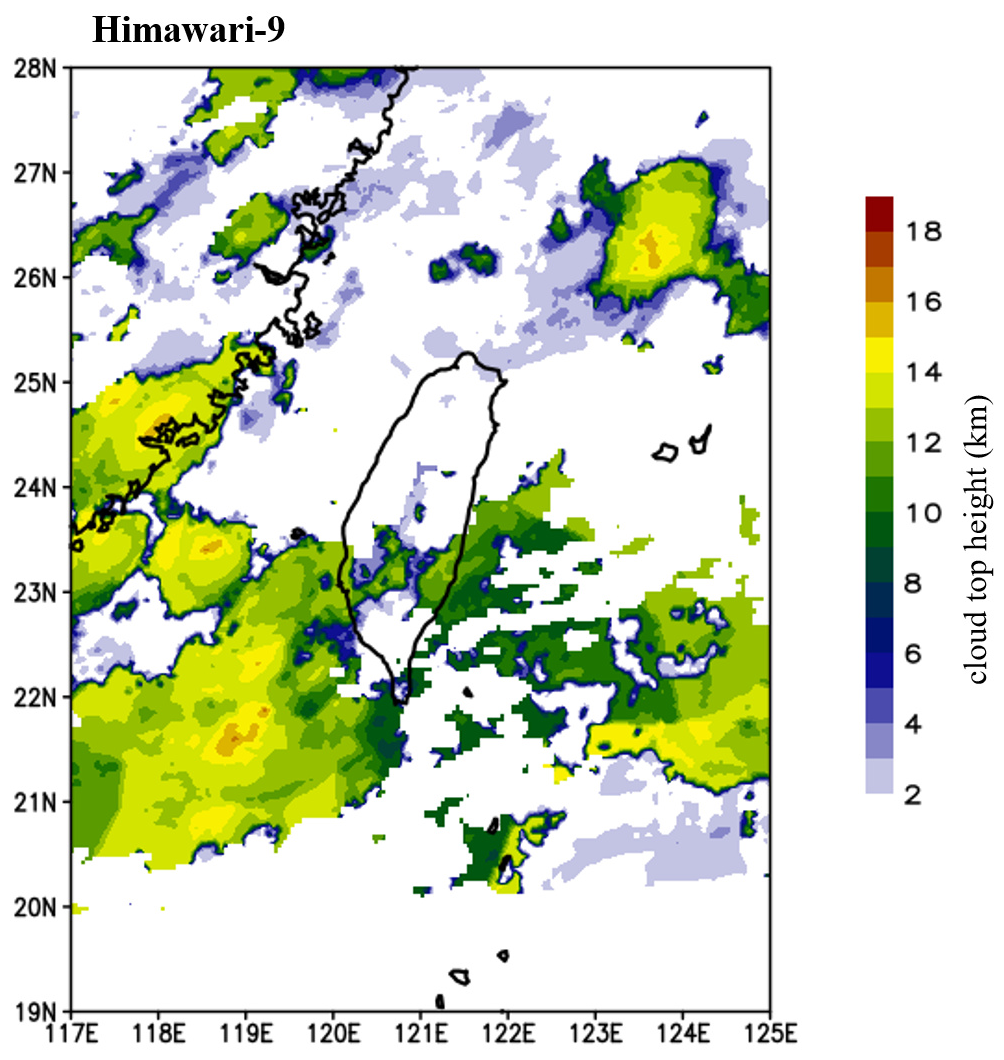
Figure 9Cloud top height (km) derived from Himawari-9 satellite data at 23:00 UTC on 9 August 2023, corresponding to the time when the observed cloud top height reached its maximum.
The perturbation fields are analyzed to identify the differences between CUP and TOP in the evolution of the new convection generated in the upstream environment (Fig. 10). Following the method described in the Appendix of Miao and Yang (2020) for calculating perturbation fields, the basic state is defined as the horizontal mean of the ambient environment where the convective systems are embedded. In this study, the horizontal mean is computed over the region within 20–24° N and 117–122° E. In the 46 h forecast, both CUP and TOP show that the deep convection, with intense vertical velocity located near the coast (at the 180 km mark), induces compensating subsidence on both sides. The downdraft produced by the storms spreads out at lower levels and encounters the onshore winds in the southwesterly environment, forcing the air to lift and creating new updrafts in the upstream region. However, in CUP, the deep convection near the 180 km mark, peaking at around 11 km height, is more intense and covers a broader area than that in TOP. As a result, the stronger downdraft (−1.6 to −3.6 m s−1) near the 150 km mark suppresses new convection and weakens updrafts in the southwesterly flow. In contrast, TOP produces less suppression, creating a more favorable environment for new updrafts to generate in the upstream region, making the new convection form farther from the coast and develop more rapidly than in CUP. Consequently, as shown in Fig. 8, the location where the convective systems merge through the eastward propagation of newly generated convection and the westward propagation of inland convection is farther from the coast in TOP, leading to heavy rainfall in the offshore region. We note that although the cold pool dynamics can also influence air parcel lifting and propagation of deep convection, results from both simulations show that the cold pool (where K; red dashed lines in Fig. 10) is similarly confined to the nearshore coast; therefore, it contributes no new convection in the upstream region.
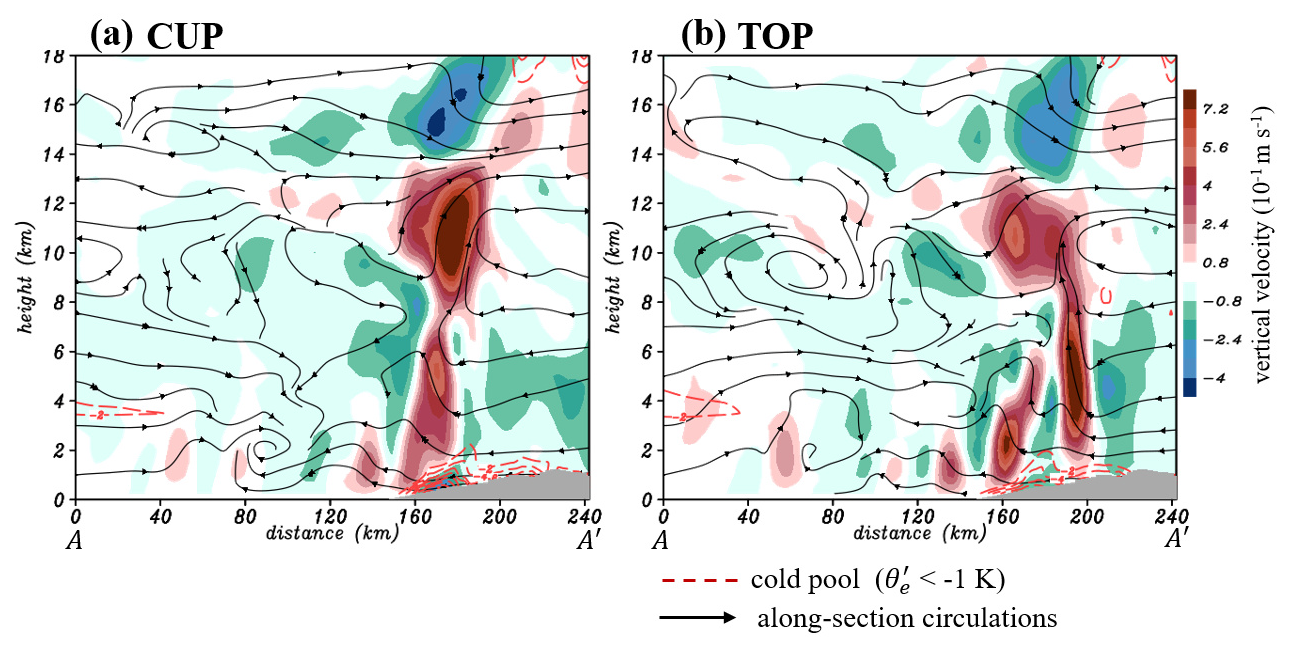
Figure 10Same as Fig. 8, but for the averaged perturbation fields of along-section circulations (streamlines), vertical velocity (shaded; 10−1 m s−1; a positive value indicates updraft) at 22:00 UTC on 9 August 2023 (46 h forecast) in (a) CUP and (b) TOP. Red dashed lines denote the coverage of cold pool ( K).
In addition to TOP, with further modifications to the convective trigger function, entrainment, and detrainment rates by increasing their dependencies on environmental RH (Sect. 3.4), the CRH experiment (Fig. 6f) shows an even greater reduction in heavy rainfall and more accurate initiation of convection. The significant reduction in heavy rainfall is achieved primarily by the decreasing entrainment and detrainment rates, allowing more active convection to consume more environmental instability by the subgrid-scale processes. Therefore, while this more active convection scheme produces more widespread light precipitation, mainly contributed by the subgrid-scale process (Fig. 7e, j), the unrealistic extreme rainfall is significantly suppressed compared to the other experiments. This effect appears to outweigh the modification to the convective trigger, which was intended to suppress the convection in lower-RH environments and thereby hopefully reduce the production of light rain.
Although the series of modifications beyond SCA (i.e., adj-SCA, CUP, TOP, CRH) were primarily developed for the southwesterly flow case, which represents a typical case of the summertime rainfall overprediction issue, experiments applying these modifications to the afternoon thunderstorm case discussed in Sect. 5.1 were also conducted. The results suggest that their impacts on afternoon thunderstorm forecasts are relatively smaller, with no consistent improvement or degradation in the overall rainfall intensity and distribution (figure not shown).
Furthermore, it is essential to question whether the dominant precipitation forecast issues with the convection scheme can be alleviated solely by optimizing the scale-aware treatment in the SCA or adj-SCA experiment without the modifications beyond. Therefore, a sensitivity experiment, RSP, is conducted based on adj-SCA but with a reduced scale-aware parameter σ1 (Table 2), attempting to address the primary goal of reducing the overestimates of precipitation. By reducing the value of σ1 by almost half at a 4.8 km grid size, RSP exhibits changes in rainfall forecasts compare to adj-SCA (Fig. 6g). However, the overestimates of heavy precipitation (>200 mm/12 h) are not much mitigated, and the location of the rain band along the southwestern coastal area is not changed and thus the onshore bias of the rain band is not corrected. This result supports that the various modifications in this study, including the constraints on convection, the revised cloud top criterion, and the increased dependency on RH, are necessary, as they not only reduce overestimated precipitation but also inhibit unrealistic convective initiation, improve spatial distribution, and achieve a more reasonable convective structure. Merely lowering the scale-aware parameter is insufficient to address all the issues.
With all the modifications combined, the improvement in CRH compared to SCA (TGFS v1.0) is substantial (Fig. 6b, f), and the improvement is consistently observed in several other cases during the two-month summer period in 2023. As another example, for the event on 17 August 2023 (Fig. 11), the 96–108 h accumulated precipitation forecast from CRH (Fig. 11c) also demonstrates a substantial decrease in rainfall and improved accuracy in rainfall prediction compared to SCA (Fig. 11b). While, for this event, the forecast with 96–108 h lead time can best demonstrate the improvements in CRH over SCA, consistent improvements are observed across a range of forecast lead times from 24 to 108 h (figure not shown).
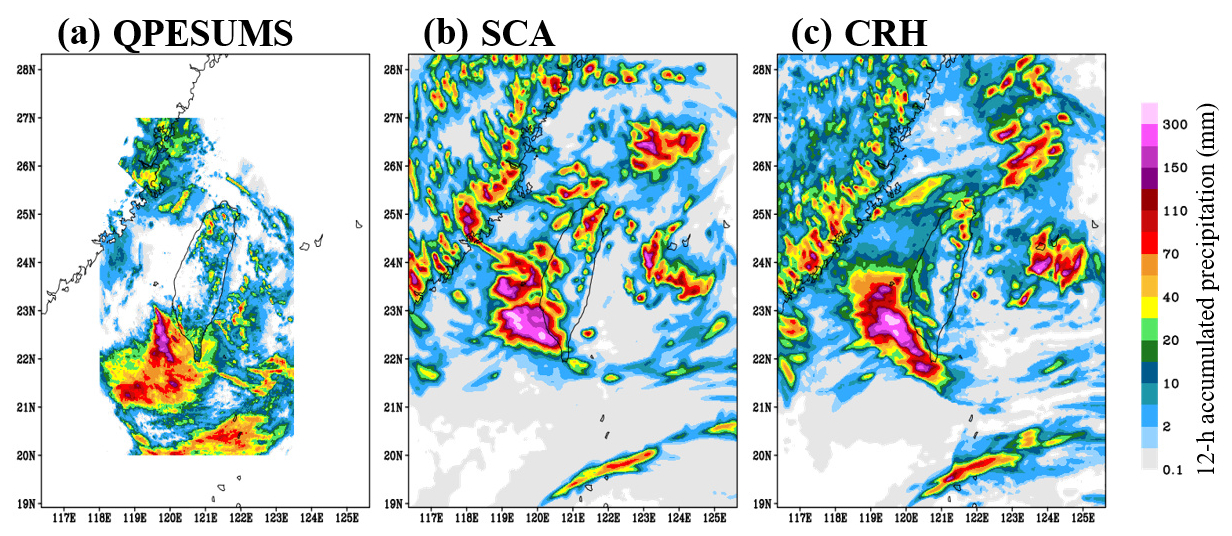
Figure 11(a) 12 h accumulated precipitation (mm) from 00:00 to 12:00 UTC on 17 August 2023 based on QPESUMS observation. The 96–108 h accumulated precipitation forecasts valid at the same period from the (b) SCA and (c) CRH experiments.
5.3 Two-month evaluation of precipitation forecast skill
The precipitation forecast skills are objectively evaluated over a 2-month summer period for the SCA and CRH experiments. Five-day forecasts are initialized at 00:00 and 12:00 UTC daily from 1 July to 30 August 2023 (122 cases in total). During this period, aside from the southwesterly flow events studied previously, other major weather systems affecting Taiwan include typhoons and frequent afternoon thunderstorms. SCA is chosen as a baseline experiment because, unlike ORI, it has already demonstrated the ability to reasonably simulate convective systems such as afternoon thunderstorms, making any improvement over it more meaningful. In addition, SCA also represents a previous operational version of the TGFS (v1.0). On the other hand, CRH represents a combination of numerous modifications made to the TDK scheme in this study.
Figure 12 shows fractions skill scores (FSS; Roberts and Lean, 2008) and bias scores for 12 h accumulated precipitation at different forecast lead times, calculated over Taiwan's land area using an aggregate method (Mittermaier, 2021) over the 122 forecasts. These long-term results of FSS and bias scores are generally consistent with the case study results in Figs. 6 and 11, showing that moderate-to-heavy precipitation forecasts (at 10 and 40 mm/12 h thresholds) in CRH are more accurate (Fig. 12b, c) and less positively biased (Fig. 12e, f) than those in SCA. In particular, for heavy rainfall with a 40 mm/12 h threshold, the reduction in overprediction biases in CRH compared to SCA is statistically significant at a 95 % confidence level throughout the 120 h forecast (Fig. 12f), and its improvement in FSS is also statistically significant at most forecast times (before 48 h and after 72 h; Fig. 12c). For moderate rainfall (at a 10 mm/12 h threshold), the FSS in CRH is slightly improved but with limited statistical significance (Fig. 12b), and the bias scores are improved at later forecast times but degraded in the first 24 h forecast (Fig. 12e). However, for light precipitation forecasts (at a 1 mm/12 h threshold), the CRH is not better than SCA, showing greater overprediction biases for light precipitation (Fig. 12d). Overall, the two-month quantitative precipitation forecast verification clearly demonstrate that the goal of correcting the summertime heavy rainfall bias in the TGFS nested domain is successfully achieved in CRH, despite the fact that it tends to produce more widespread light rain.
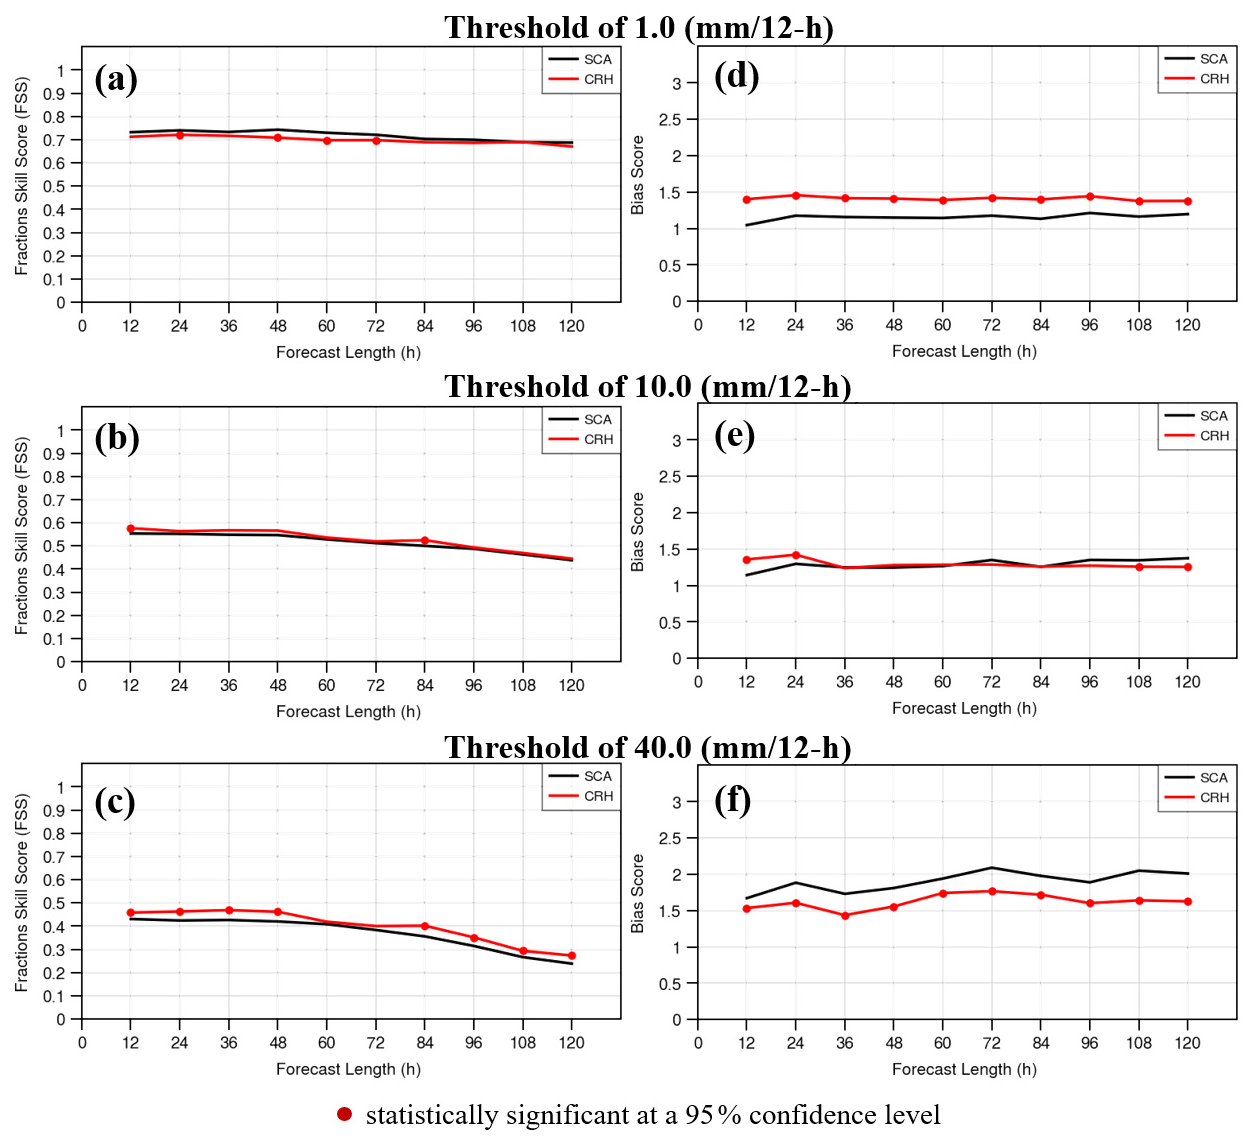
Figure 12(a–c) Aggregated fractions skill scores, verified with a 20 km neighborhood size, and (d–f) bias scores of precipitation forecasts in the SCA (black lines) and CRH (red lines) experiments. The scores are calculated over Taiwan's land area and for every 12 h accumulated amount within the 120 h forecasts at thresholds of (a, d) 1.0, (b, e) 10.0, and (c, f) 40.0 mm/12 h, respectively. Verifications are based on simulations initialized at 00:00 and 12:00 UTC daily from 1 July to 30 August 2023 (122 cases in total), compared against QPESUMS observations. Filled circles indicate that the differences between SCA and CRH are statistically significant at a 95 % confidence level, determined by a bootstrap test using 1000 resamples.
This study aims to suppress overactive convective updrafts and excessive heavy rainfall in the 4.8 km TGFS nested simulations to improve summer rainfall forecasts. Numerous modifications are made to the original implementation of the TDK convection scheme, which was adapted from a 2016 version of MPAS, to address the above issues. Evaluation of the modifications to the TDK scheme, based on two case studies and forecast skill assessments over a two-month period, demonstrates that they effectively reduce overpredicted rainfall and improve precipitation patterns, thereby enhancing the overall forecast skill for summertime rainfall.
The modifications to the TDK scheme are grouped into four categories, with their effects summarized below: (1) Applying scale-aware parameters to the convective mass flux (Kwon and Hong, 2017; Lin et al., 2022) to enhance the contribution of grid-scale precipitation. The scale-aware parameters are implemented before checking the CFL condition to prevent successive reductions of the convective mass flux by both the scale-aware parameters and the CFL condition. (2) Updating the constraints on convective updrafts based on WRF v4.5 and Wang (2022), including adjustments to the starting level influenced by updraft entrainment, inhibition for mid-level clouds, extension of the convective adjustment time scale, and a restriction on the starting level of the updraft parcel. These changes aim to reduce convection frequency and intensity. (3) Adjusting the cloud droplet mixing ratio criterion to lower the convective cloud top height to a more reasonable level. (4) Enhancing the sensitivities of the convective trigger condition (Han et al., 2020), entrainment (Bechtold et al., 2008; Han and Pan, 2011), and detrainment rates to the environmental RH, which generally decreases the entrainment rate, to alleviate overestimated rainfall.
The series of modifications are sequentially evaluated through case studies of an afternoon thunderstorm on 26 August 2023 and a southwesterly flow event on 10 August 2023. The experiment implementing the scale-aware parameters (SCA) better captures the key characteristics of individual convective cells in afternoon thunderstorms, compared to the experiment using the original TDK scheme (ORI), which shows widespread light rain. Eventually, after incorporating all the modifications, the experiment (CRH) further improves precipitation forecasts compared to SCA for the southwesterly flow case by addressing excessive heavy rainfall and inaccurate precipitation patterns. An objective evaluation of the precipitation forecast skill for SCA and CRH is conducted over a two-month summer period (1 July to 30 August 2023), during which major weather systems affecting Taiwan included afternoon thunderstorms, southwesterly flows, and typhoons. The long-term FSS and bias scores clearly show that CRH significantly reduces the positive rainfall bias and improves the spatial accuracy of moderate-to-heavy precipitation forecasts. For heavy rainfall (≥40 mm/12 h), the reduction in overprediction bias is statistically significant at the 95 % confidence level throughout the entire 120 h forecast period. However, CRH tends to overpredict light precipitation (≥1 mm/12 h). In addition, a sensitivity experiment attempting to address the precipitation forecast issues solely through the SCA approach, by lowering the scale-aware parameter σ1 to further reduce the convective mass flux, demonstrates that this method alone is insufficient to address all the issues, thereby highlighting the importance of the additional modifications beyond SCA.
This study successfully improves summertime rainfall forecasts in the TGFS nested domain. The modified TDK scheme has been implemented in the TGFS v1.1 operation, although due to the operational implementation timeline, the TOP configuration was adopted instead of CRH. Nevertheless, issues with rainfall forecasts in other seasons in the TGFS nested domain have also been noticed. For example, the model is prone to producing unrealistic heavy rainfall along Taiwan's east coastline under certain weather conditions in the winter. These issues remain unresolved and require further investigation in future studies.
The source code of the TGFS model is available on GitHub (https://github.com/CWA-NWP/ufs-weather-model, last access: 29 October 2025). The TGFS v1.1 and the CRH version used in this study are archived on Zenodo at https://doi.org/10.5281/zenodo.17452036 (The Unified Forecast System, 2025a) and https://doi.org/10.5281/zenodo.17452254 (The Unified Forecast System, 2025b), respectively.
All raw data can be provided by the corresponding authors upon request.
CHL carried out all development related to the enhancement of the Tiedtke cumulus parameterization in the TGFS nested domain, designed and conducted the experiments, analyzed the results, and wrote the manuscript draft. LFH and GYL supervised the work and contributed to the preparation of the manuscript. All authors reviewed the manuscript, with GYL providing essential editorial revisions.
The contact author has declared that none of the authors has any competing interests.
Publisher's note: Copernicus Publications remains neutral with regard to jurisdictional claims made in the text, published maps, institutional affiliations, or any other geographical representation in this paper. The authors bear the ultimate responsibility for providing appropriate place names. Views expressed in the text are those of the authors and do not necessarily reflect the views of the publisher.
The TGFS was developed based on the NOAA/NCEP GFS model version 15. All numerical experiments were conducted using CWA's high-performance computer. The authors thank Ms. Mei-Hui Liao (CWA) and Dr. Wei-Tin Fang (CWA) for providing the satellite retrieval data for cloud top height and Dr. Ting-Chi Wu (CWA) for assistance with the bootstrap test. Appreciation is also extended to the CWA NWP team for the support and shared resources that contributed to this work. The authors are grateful to Dr. Wei Wang (National Center for Atmospheric Research, NCAR) for sharing her code of the scale-aware Tiedtke convection scheme. The authors also thank Drs. Fang-Lin Yang (NOAA), Jian-Wen Bao (NOAA), and Peter Bechtold (ECMWF) for their discussions and suggestions on this study. The authors also appreciate Mr. Jyong-En Miao (National Taiwan University; NTU) for providing the method to calculate perturbation fields in Fig. 10.
This research has been partially supported by the National Science and Technology Council of Taiwan (grant no. NSTC 112-2111-M-052-002).
This paper was edited by Yang Tian and reviewed by Peter Bechtold, J. M. Piriou, and two anonymous referees.
Arakawa, A. and Schubert, W. H.: Interaction of a Cumulus Cloud Ensemble with the Large-Scale Environment, Part I, J. Atmos. Sci., 31, 674–701, https://doi.org/10.1175/1520-0469(1974)031<0674:IOACCE>2.0.CO;2, 1974.
Arakawa, A. and Wu, C.-M.: A Unified representation of deep moist convection in numerical modeling of the Atmosphere. Part I, J. Atmos. Sci., 70, 1977–1992, https://doi.org/10.1175/JAS-D-12-0330.1, 2013.
Bechtold, P., Kohler, M., Jung, T., Doblas-Reyes, F., Leutbecher, M., Rodwell, M., Vitart, F., and Balsamo, G.: Advances in simulating atmospheric variability with the ECMWF model: From synoptic to decadal time-scales, Q. J. Roy. Meteor. Soc., 134, 1337–1351, https://doi.org/10.1002/qj.289, 2008.
Bechtold, P., Semane, N., Lopez, P., Chaboureau, J.-P., Beljaars, A., and Bormann, N.: Representing equilibrium and nonequilibrium convection in large-scale models, J. Atmos. Sci., 71, 734–753, https://doi.org/10.1175/JAS-D-13-0163.1, 2014.
Chang, P.-L., Zhang, J., Tang, Y.-S., Tang, L., Lin, P.-F., Langston, C., Kaney, B., Chen, C.-R., and Howard, K.: An Operational Multi-Radar Multi-Sensor QPE System in Taiwan, B. Am. Meteorol. Soc., 102, E555–E577, https://doi.org/10.1175/BAMS-D-20-0043.1, 2021.
Chang, W.-Y., Lee, W.-C., and Liou, Y.-C.: The Kinematic and Microphysical Characteristics and Associated Precipitation Efficiency of Subtropical Convection during SoWMEX/TiMREX, Mon. Weather Rev., 143, 317–340, https://doi.org/10.1175/MWR-D-14-00081.1, 2014.
Chen, J. H. and Lin, S. J.: The remarkable predictability of inter-annual variability of Atlantic hurricanes during the past decade, Geophys. Res. Lett., 38, L11804, https://doi.org/10.1029/2011GL047629, 2011.
Chen, J. H. and Lin, S. J.: Seasonal predictions of tropical cyclones using a 25-km-resolution general circulation model, J. Climate, 26, 380–398, https://doi.org/10.1175/JCLI-D-12-00061.1, 2013.
Chen, Y.-H., Sha, S.-H., Lin, C.-H., Hsiao, L.-F., Huang, C.-Y., and Kuo, H.-C.: Performance Evaluation of TGFS Typhoon Track Forecasts over the Western North Pacific with Sensitivity Tests on Cumulus Parameterization, Atmosphere-Basel, 15, 1075, https://doi.org/10.3390/atmos15091075, 2024.
Chien, F.-C. and Chiu, Y.-C.: Factors Leading to Heavy Rainfall in Southern Taiwan in the Early Mei-Yu Season of 2020, Mon. Weather. Rev., 151, 1885–1908, https://doi.org/10.1175/MWR-D-22-0226.1, 2023.
Chun, H.-Y. and Baik, J.-J.: Weakly nonlinear response of a stably stratified atmosphere to diabatic forcing in a uniform flow, J. Atmos. Sci., 51, 3109–3121, 1994.
Clough, S. A., Shephard, M. W., Mlawer, E. J., Delamere, J. S., Iacono, M. J., Cady-Pereira, K., Boukabara, S., and Brown, P. D.: Atmospheric radiative transfer modeling: A summary of the AER codes, J. Quant. Spectrosc. Ra., 91, 233–244, https://doi.org/10.1016/j.jqsrt.2004.05.058, 2005.
Grell, G. A.: Prognostic evaluation of assumptions used by cumulus parameterizations, Mon. Weather Rev., 121, 764–787, https://doi.org/10.1175/1520-0493(1993)121<0764:PEOAUB>2.0.CO;2, 1993.
Han, J. and Pan, H.-L.: Revision of convection and vertical diffusion schemes in the NCEP global forecast system, Weather Forecast., 26, 520–533, https://doi.org/10.1175/WAF-D-10-05038.1, 2011.
Han, J., Wang, W., Kwon, Y. C., Hong, S.-Y., Tallapragada, V., and Yang, F.: Updated in the NCEP GFS cumulus convection schemes with scale and aerosol awareness, Weather Forecast., 32, 2005–2017, https://doi.org/10.1175/WAF-D-17-0046.1, 2017.
Han, J.-Y., Hong, S.-Y., and Kwon, Y. C.: The performance of a revised simplified Arakawa-Schubert (SAS) convection scheme in the medium-range forecasts of the Korean Integrated Model (KIM), Weather Forecast., 35, 1113–1128, https://doi.org/10.1175/WAF-D-19-0219.1, 2020.
Han, M. L., Witek, J., Teixeira, R., Sun, R., Pan, H. L., Fletcher, J. K., and Bretherton, C. S.: Implementation in the NCEP GFS of a hybrid eddy-diffusivity mass-flux (EDMF) boundary layer parameterization with dissipative heating and modified stable boundary layer mixing, Weather Forecast., 31, 341–352, https://doi.org/10.1175/WAF-D-15-0053.1, 2016.
Harris, L. M. and Lin, S.-J.: A two-way nested global-regional dynamical core on the cubed-sphere grid, Mon. Weather Rev., 141, 283–306, https://doi.org/10.1175/MWR-D-11-00201.1, 2013.
Hong, S.-Y. and Dudhia, J.: Next-generation numerical weather prediction: Bridging parameterization, explicit clouds, and large eddies, B. Am. Meteorol. Soc., 93, ES6–ES9, https://doi.org/10.1175/2011BAMS3224.1, 2012.
Jakob, C. and Siebesma, A. P.: A new subcloud model for mass-flux convection schemes: Influence on triggering, updraft properties, and model climate, Mon. Weather Rev., 131, 2765–2778, https://doi.org/10.1175/1520-0493(2003)131<2765:ANSMFM>2.0.CO;2, 2003.
Kain, J. S.: The Kain-Fritsch convective parameterization: An update, J. Appl. Meteorol., 43, 170–181, https://doi.org/10.1175/1520-0450(2004)043<0170:TKCPAU>2.0.CO;2, 2004.
Kim, Y.-J. and Arakawa, A.: Improvement of orographic gravity wave parameterization using a mesoscale gravity wave model, J. Atmos. Sci., 52, 1875–1902, https://doi.org/10.1175/1520-0469(1995)052<1875:IOOGWP>2.0.CO;2, 1995.
Kim, Y.-J. and Doyle, J. D.: Extension of an orographic-drag parameterization scheme to incorporate orographic anisotropy and flow blocking, Q. J. Roy. Meteorol. Soc., 131, 1893–1921, https://doi.org/10.1256/qj.04.160, 2005.
Kwon, Y.-C. and Hong, S.-Y.: A mass-flux cumulus parameterization scheme across gray-zone resolutions, Mon. Weather Rev., 145, 583–598, https://doi.org/10.1175/MWR-D-16-0034.1, 2017.
Lien, G.-Y., Hsiao, L.-F., Lin, C.-H., Wang, F.-J., Chen, Y.-H., Chen, J.-H., Hong, J.-S., Kleist, D., Yang, F., and Tallapragada, V.: The Operational Use and Local Development of UFS MRW-GSI System at Central Weather Bureau of Taiwan, Unifying Innovations in Forecasting Capabilities Workshop (UIFCW) 2023, Boulder, USA, 24–28 July 2023, https://www.epic.noaa.gov/uifcw-summer-workshop-2023/?playlist=7459441&video=a4bd9db (last access: 12 June 2026), 2023.
Lim, K.-S., Hong, S.-Y., Yoon, J.-H., and Han, J.: Simulation of the summer monsoon rainfall over East Asia using the NCEP GFS cumulus parameterization at different horizontal resolutions, Weather Forecast., 29, 1143–1154, https://doi.org/10.1175/WAF-D-13-00143.1, 2014.
Lin, C.-H. and Hsiao, L.-F.: Evaluating the modification of the convection scheme in the nested simulation of the Taiwan Global Forecast System (TGFS), 2nd Annual UFS Physics Workshop, Norman, Oklahoma, USA, 9–12 July 2024, https://psl.noaa.gov/events/2024/ufs_physics_workshop/2ndAnnualUFSPhysicsWorkshopAgenda-Revised.pdf (last access: 12 June 2026), 2024.
Lin, C.-H., Yang, M.-J., Hsiao, L.-F., and Chen, J.-H.: The Impact of Scale-Aware Parameterization on the Next-Generation Global Prediction System in Taiwan for Front Predictions, Atmosphere-Basel, 13, 1063, https://doi.org/10.3390/atmos13071063, 2022.
Lin, P.-F., Chang, P.-L., Jou, B. J.-D., Wilson, J. W., and Roberts, R. D.: Warm season afternoon thunderstorm characteristics under weak synoptic-scale forcing over Taiwan Island, Weather Forecast., 26, 44–60, https://doi.org/10.1175/2010WAF2222386.1, 2011.
Lin, S.-J.: A “Vertically Lagrangian” finite-volume dynamical core for global models, Mon. Weather Rev., 132, 2293–2307, https://doi.org/10.1175/1520-0493(2004)132<2293:AVLFDC>2.0.CO;2, 2004.
Lin, S.-J. and Rood, R. B.: An explicit flux-form semi-Lagrangian shallow-water model on the sphere, Q. J. Roy. Meteor. Soc., 123, 2477–2498, https://doi.org/10.1002/qj.49712354416, 1997.
Liou, C.-S., Chen, J.-H., Terng, C.-T., Wang, F.-J., Fong, C.-T., Rosmond, T. E., Kuo, H.-C., Shiao, C.-H., and Cheng, M.-D.: The Second-Generation Global Forecast System at the Central Weather Bureau in Taiwan, Weather Forecast., 12, 653–663, https://doi.org/10.1175/1520-0434(1997)012<0653:TSGGFS>2.0.CO;2, 1997.
Liu, P.-Y., Chen, J.-H., and Juang, H.-M.: Use of Non-iteration Dimensional-split Semi-Lagrangian (NDSL) in Central Weather Bureau Global Forecast System, 25th Conf. on Numerical Weather Prediction, Denver, CO, Amer. Meteor. Soc., 12B.6, https://ams.confex.com/ams/29WAF25NWP/webprogram/Paper345373.html (last access: 12 June 2026), 2018.
Miao, J.-E. and Yang, M.-J.: A Modeling Study of the Severe Afternoon Thunderstorm Event at Taipei on 14 June 2015: The Roles of Sea Breeze, Microphysics, and Terrain, J. Meteorol. Soc. Jpn., 98, 129–152, https://doi.org/10.2151/jmsj.2020-008, 2020.
Mittermaier, M. P.: A “Meta” Analysis of the Fractions Skill Score: The Limiting Case and Implications for Aggregation, Mon. Weather Rev., 149, 3491–3504, https://doi.org/10.1175/MWR-D-18-0106.1, 2021.
Roberts, N. M. and Lean, H. W.: Scale-selective verification of rainfall accumulations from high-resolution forecasts of convective events, Mon. Weather Rev., 136, 78–97, https://doi.org/10.1175/2007MWR2123.1, 2008.
The Unified Forecast System: CWA TGFS v1.1 model, Zenodo [code], https://doi.org/10.5281/zenodo.17452036, 2025a.
The Unified Forecast System: CWA TGFS v1.1_CRH model, Zenodo [code], https://doi.org/10.5281/zenodo.17452254, 2025b.
Thomas, S. M., Heidinger, A. K., and Pavolonis, M. J.: Comparison of NOAA's Operational AVHRR-Derived Cloud Amount to Other Satellite-Derived Cloud Climatologies, Mon. Weather Rev., 17, 4805–4822, https://doi.org/10.1175/JCLI-3242.1, 2004.
Tomassini, L., Willett, M., Sellar, A., Lock, A., Walters, D., Whitall, M., Sanchez, C., Heming, J., Earnshaw, P., Rodriguez, J. M., Ackerley, D., Xavier, P., Franklin, C., and Senior, C. A.: Confronting the convective gray zone in the global configuration of the Met Office Unified Model, J. Adv. Model. Earth Sy., 15, e2022MS003418, https://doi.org/10.1029/2022MS003418, 2023.
Tu, C.-C., Chen, Y.-L., Chen, C.-S., Lin, P.-L., and Lin, P.-H.: A Comparison of Two Heavy Rainfall Events during the Terrain-Influenced Monsoon Rainfall Experiment (TiMREX) 2008, Mon. Weather Rev., 142, 2436–2462, https://doi.org/10.1175/MWR-D-13-00293.1, 2014.
Wagner, A., Heinzeller, D., Wagner, S., Rummler, T., and Kunstmann, H.: Explicit Convection and Scale-Aware Cumulus Parameterizations: High-Resolution Simulations over Areas of Different Topography in Germany, Mon. Weather Rev., 146, 1925–1944, https://doi.org/10.1175/MWR-D-17-0238.1, 2018.
Wang, C.-C., Chen, T.-J., Chen, T.-C., and Tsuboki, K.: A Numerical Study on the Effects of Taiwan Topography on a Convective Line during the Mei-Yu Season, Mon. Weather Rev., 133, 3217–3242, https://doi.org/10.1175/MWR3028.1, 2005.
Wang, W.: Forecasting Convection with a “Scale-Aware” Tiedtke Cumulus Parameterization Scheme at Kilometer Scales, Mon. Weather Rev., 37, 1491–1507, https://doi.org/10.1175/WAF-D-21-0179.1, 2022.
Weber, N. J., Mass, C. F., and Kim, D.: The impacts of horizontal grid spacing and cumulus parameterization on subseasonal prediction in a global convection-permitting model, Mon. Weather Rev., 148, 4747–4765, https://doi.org/10.1175/MWR-D-20-0171.1, 2020.
Xu, W., Zipser, E. J., Chen, Y.-L., Liu, C., Liou, Y.-C., L, W.-C., and Jou, B. J.-D.: An Orography-Associated Extreme Rainfall Event during TiMREX: Initiation, Storm Evolution, and Maintenance, Mon. Weather Rev., 140, 2555–2574, https://doi.org/10.1175/MWR-D-11-00208.1, 2012.
Zhang, C. and Wang, Y.: Projected future changes of tropical cyclone activity over the western North and South Pacific in a 20-km-mesh regional climate model, J. Climate, 30, 5923–5941, https://doi.org/10.1175/JCLI-D-16-0597.1, 2017.
Zheng, Y., Alapaty, K. J., Herwehe, A., Del Genio, A. D., and Niyogi, D.: Improving high-resolution weather forecasts using the Weather Research and Forecasting (WRF) Model with an updated Kain–Fritsch scheme, Mon. Weather. Rev., 144, 833–860, https://doi.org/10.1175/MWR-D-15-0005.1, 2016.