the Creative Commons Attribution 4.0 License.
the Creative Commons Attribution 4.0 License.
 | 18 May 2026
Parameterization and evaluation of nonhydrostatic effect in the orographic gravity wave drag in China Meteorological Administration Global Forecast System (CMA-GFS) v4.0 model
Rongrong Zhang
Zhenzhen Ai
Qiying Chen
The China Meteorological Administration Global Forecast System (CMA-GFS) v4.0 model was upgraded to a higher resolution of 0.125° in May 2023. To be compatible with its fine resolution, the parameterization scheme of orographic gravity wave drag (OGWD) in CAM-GFS is revised herein by accounting for the nonhydrostatic effect (NHE) on the wave momentum flux of subgrid-scale orographic gravity waves. The performance of the revised OGWD scheme is then evaluated for the 10 d medium-range forecast in December 2023. Results show that the revised OGWD scheme can better capture the large-scale circulation in the Northern Hemisphere (NH), particularly in the high latitudes. The easterly (westerly) wind biases in the NH polar stratosphere (troposphere) are decreased. The underestimation of East Asia subtropical jet is also alleviated. Quantitative evaluation shows that the revised OGWD scheme reduces both the mean bias and root mean square error of 500 hPa geopotential height in the NH after the 6th forecast day, reaching 11.59 % and 5.06 %, respectively, by day 10. The decrease of easterly biases in the polar stratosphere is owing to the weakening of stratospheric zonal OGWD by the NHE. For the decrease of westerly biases in the NH polar troposphere, it is due to the fact that the enhanced stratospheric winds suppress the upward propagation of Rossby waves into the stratosphere, resulting in greater convergence of Eliassen-Palm flux in the mid-upper troposphere.
- Article
(9549 KB) - Full-text XML
- BibTeX
- EndNote


Orographic gravity wave drag (OGWD) is an important process in atmospheric dynamics, arising from the interaction of airflow with complex terrain (Kim et al., 2003; Teixeira, 2014). When airstream flows over mountains, it generates orographic gravity waves (OGWs) which propagate vertically. As these waves break, they generate OGWD on the high-level atmosphere (Fritts and Alexander, 2003). The OGWD plays a crucial role in driving the atmospheric circulation, influencing both tropospheric and stratospheric dynamics (Alexander et al., 2010).
In numerical weather prediction (NWP) and climate models, the OGWD is typically a subgrid-scale process which needs to be parameterized. Various OGWD parameterization schemes have been developed over the past few decades (e.g., Palmer et al., 1986; McFarlane, 1987; Kim and Arakawa, 1995; Lott and Miller, 1997; Scinocca and McFarlane, 2000; Kim and Doyle, 2005) based on both linear and nonlinear OGW dynamics. Their implementation has been shown to help alleviate the systematic biases in both NWP and climate models, ranging from general circulation to regional climate and weather (e.g., Kim, 2007; McLandress et al., 2012; Choi and Hong, 2015; Zhong and Chen, 2015; Chen et al., 2016; Lu et al., 2020; Zhang et al., 2020; Li et al., 2023; Xu et al., 2023; Wei et al., 2025).
While accurate representation of OGWD is essential for weather forecast and climate simulation/projection, traditional OGWD parameterization schemes rely on the assumption of hydrostatic balance which can significantly simplify the formulae of OGW dynamics. This assumption is appropriate for coarse-resolution numerical models where subgrid-scale OGWs are dominated by hydrostatic GWs as the dominant subgrid “mountains” are large. However, as the model resolution increases, the hydrostatic assumption becomes less valid because the subgrid-scale orography (SSO) becomes smaller, so that the unresolved GWs have shorter wavelengths. In this situation, the nonhydrostatic effects (NHEs) will exert remarkable influences on the subgrid-scale OGWs. Compared with hydrostatic OGWs, nonhydrostatic OGWs experience stronger horizontal dispersion of wave energy, which reduces wave amplitude and can suppress wave breaking and momentum deposition into the mean flow (Smith, 1979; Klemp and Durran, 1983; Zängl, 2003). These NHEs are thus critical for accurately representing the dynamical impacts of subgrid-scale OGWs in high-resolution models, e.g., the state-of-the-art global NWP models.
Recently, Xu et al. (2021) theoretically derived the analytical expressions for the surface wave momentum flux (WMF) of nonhydrostatic OGWs generated by idealized three-dimensional orography. They found that the degree of nonhydrostaticity can be measured by a nondimensional parameter of Froude number which is equal to the wind speed over the mountain half width and buoyancy frequency, i.e., the inverse of the nondimensional half-width Na/U (e.g., Zängl, 2003). Physically, this parameter represents the ratio between the period of buoyancy oscillation and the time for airflow travelling through the mountain. The larger the horizontal Froude number, the more important the NHE is. Based upon the theoretical study, Xu et al. (2023, 2024) revised the OGWD parameterization scheme developed by Kim and Doyle (2005, hereafter KD05) by accounting for the NHE on the surface WMF of upward-propagating OGWs. Then the new OGWD scheme was implemented in the Model for Prediction Across Scales (MPAS), which was shown to improve the seasonal simulation of the stratospheric polar night jet and reduce the wet biases over the western Tibetan Plateau in winter. Li et al. (2024) further evaluated the revised OGWD scheme in the Weather Research and Forecasting (WRF) model for short-range forecast of Northeast China cold vortices (NECVs). The underestimation of the NECV intensity (in terms of minimum 500 hPa geopotential height) is alleviated as the NHE decreases the lower-tropospheric OGWD.
The Global Forecast System in China Meteorological Administration (CMA-GFS), the global component of the Global/Regional Assimilation and Prediction System (GRAPES), was developed in early 2000s (Shen et al., 2017). Operationally running at the CMA Earth System Modeling and Prediction Center, the CMA-GFS was upgraded to a new version of v4.0 in May 2023, with its horizontal resolution increasing from 0.25 to 0.125° (about 13 km), along with many other improvements in the model dynamics and physics (Shen et al., 2023). For instance, the convective triggering function and quasi-equilibrium closure conditions are improved to reduce biases in tropics and enhance forecast skill of precipitation in East Asia. In CMA-GFS, three components of subgrid scale orography effects have been implemented, i.e., the blocking-flow drag (BFD), the OGWD and turbulent orographic form drag (TOFD). The TOFD scheme was implemented CMA-GFS based on Beljaars et al. (2004) and Xue et al. (2011) and will not be further discussed as it is not relevant to the NHE effect studied in this study. The BFD component based on Lott and Miller (1997, hereafter LM97) and OGWD component from Kim and Arakawa (1995, hereafter KA95) were implemented in CMA-GFS similar to that in Alpert (2004) and was described in Chen et al. (2016). It is noticed that in the existing implementation, nonhydrostatic effects are only partly reflected through a Scorer-parameter-based partitioning of the momentum stress when the model grid point is located downstream of the subgrid orography. However, the launch-level surface WMF itself still follows the original hydrostatic KA95 formulation. In order to be compatible with its high resolution, this hydrostatic OGWD parameterization scheme needs to be upgraded to account for the NHE.
Note that the present study extends the evaluation of the nonhydrostatic OGWD scheme in the MPAS model presented in Xu et al. (2024) by transitioning it into a practical, operational NWP. Although Xu et al. (2024) demonstrated the beneficial impact of the revised OGWD scheme for long-term, large-scale circulation simulations, its performance and value within a state-of-the-art, high-resolution global forecasting system performing routine medium-range forecasts had not been tested. This work provides this critical assessment using the CMA-GFS v4.0 model, with a specific focus on forecast skill improvements for several quantitative metrics. The primary advance lies in evaluating the revised OGWD scheme in reducing systematic forecast biases on timescales directly relevant to weather prediction (1–10 d), demonstrating the tangible benefits of incorporating nonhydrostatic effects to improve medium-range weather forecasting accuracy.
The remainder of the paper is organized as follows. Section 2 firstly introduces the revision of the OGWD parameterization scheme and then describes the setup of the numerical experiments. Section 3 gives an overall evaluation for the medium-range forecast of large-scale atmospheric circulation by the CMA-GFS model. The NHE effects on parameterized OGWD and large-scale circulation are examined in Sect. 4. Finally, the paper is summarized in Sect. 5 along with discussions.
2.1 Revision of the KA95 OGWD parameterization scheme
The KA95 OGWD considers various aspects of the SSO including its standard deviation (σh), orographic asymmetry (OA) and orographic convexity (OC). The surface WMF of OGWs is given by
where
The variables ρ0, |V0| and N0 are the low-level (from the surface to 2σh) mean air density, horizontal wind speed and buoyancy frequency. The parameter m denotes the “number of mountains” within the grid cell, characterizing the total volume of SSO associated with the orography length (Lx). The coefficient λeff acts as a tunable parameter denoting the effective grid length. The transition function G is an enhancement factor for sharp mountains as OC is large. This scheme also considers the effects of low-level wave breaking and/or lee wave trapping through the factor E, which is a function of the shape and location of the SSO within the model grid cell (i.e., OA), and the flow nonlinearity (i.e., ). The two empirical constants are set to CE=0.8 and CG=0.5, which are obtained empirically through a series of numerical simulations conducted in Kim and Arakawa (1995).
The surface WMF is transported upward level by level until reaching the model top or critical level. At each model level, airflow instability is checked according to the hypothesis of wave saturation (Lindzen, 1981) and wave-breaking (Miller and Palmer, 1986).
Once the subgrid-scale OGWs saturate and break, they will exert a body force on the mean flow through the deposition of wave momentum, namely,
where V(z) and τ(z) are the mean flow velocity and the WMF at height z, respectively. Note that both the directions of V(z) and τ(z) are parallel to the mean flow at the low level (i.e., VL). Readers are referred to KA95 for more details about the scheme.
The hydrostatic KA95 scheme above is revised by taking into account the NHE on the surface WMF of OGWs, i.e.,
represents the nonhydrostatic surface WMF, where the NHE correction depends only on the horizontal Froude number
Equation (5) is adopted from Xu et al. (2021) for three-dimensional isotropic terrain. Specifically, the nonhydrostatic correction is defined as the ratio of the analytically derived nonhydrostatic surface WMF to its hydrostatic counterpart, which yields an algebraic correction factor depending only on the horizontal Froude number. Note that the horizontal Froude number is different from the traditional Froude number Fr0 above which measures the flow nonlinearity. While Xu et al. (2021) have derived the fully NHE for anisotropic terrain, the expressions involve complicated integrals that are not suitable for practical use in parameterization (cf. their Eqs. 14 to 17). Xu et al. (2021) demonstrated that terrain anisotropy only has a very weak influence on the NHE, so the expression of NHE for isotropic terrain, i.e., Eq. (5), is used because of simplicity, since only algebraic manipulations are involved. This is in agreement with Xu et al. (2023, 2024) and Li et al. (2024).
2.2 Setup of numerical experiments
The CMA-GFSv4.0 dynamical core is based upon the nonhydrostatic and shallow atmospheric governing equations in spherical polar coordinates with full physics packages (Shen et al., 2020). It adopts a regular latitude-longitude grid of 0.125° × 0.125° with C-grid staggering. In the vertical, a terrain-following height-based grid is utilized along with Charney-Phillips staggering. There are 87 vertical levels, with the model top located at 73 km. For model physics, the Liu-Ma microphysics scheme (Ma et al., 2018) is employed, along with the RRTMG longwave and shortwave radiation schemes (Morcrette et al., 2008), the MRF planetary boundary layer scheme (Chen et al., 2020; Hong and Pan, 1996), the CoLM land surface model (Dai et al., 2003), NSAS convection scheme (Han and Pan, 2011; Liu et al., 2015), the combined KA95 OGWD and LM97 FBD parameterization scheme (Chen et al., 2016), and modified Beljaars's TOFD scheme (Xue et al., 2011).
In order to examine the impact of the revised OGWD scheme on the medium-range forecast, two sets of numerical simulations (i.e., EXP_CTL and EXP_NHE) are conducted with different OGWD parameterization schemes, using the original KA95 scheme and the revised nonhydrostatic one, respectively. Both experiments consist of 31 individual forecasts, each initialized at 00:00 UTC for the days from 1 to 31 December 2023. Herein, a winter month is chosen because the OGWD, which is mainly located in the Northern Hemisphere (NH) given the pronounced orography, is the strongest in this season (e.g., Xu et al., 2020; Lu et al., 2024). In each experiment, the CMA-GFS model is integrated for 10 d, i.e., medium-range forecast, with 6 h output interval. The model initial conditions are derived from the 0.25° × 0.25° ECMWF Reanalysis v5 (ERA5) dataset (Hersbach et al., 2020), which are also used as reference for the evaluation of the CMA-GFS forecasts. Although the horizontal resolution of ERA5 is coarser than that of the CMA-GFS v4.0 simulations, ERA5 is adopted here as the verification reference because it is a dynamically consistent reanalysis constrained by a broad range of assimilated observations. In this study, ERA5 is not used to resolve the non-hydrostatic subgrid-scale orographic gravity waves themselves. Instead, it serves as a benchmark for evaluating the large-scale circulation response and medium-range forecast skill associated with the revised OGWD parameterization.
3.1 Atmospheric circulation
Figure 1 shows the zonal-mean zonal wind composited from the day 10 forecast output of the 31 simulations initialized at 00:00 UTC on 1–31 December 2023. Accordingly, the valid times of these day-10 forecasts span 10 December 2023 to 10 January 2024 (i.e., the 10th day of the medium-range forecast). In the winter of NH, as revealed by the ERA5 reanalysis (Fig. 1a), there is a subtropical jet in the midlatitudes troposphere and stratosphere, with the jet core located at about 200 hPa and 30° N. The maximum zonal wind speed exceeds 35 m s−1. In the stratosphere of high latitudes, there is another wind maxima near 1 hPa and 60° N, which is the well-known polar-night jet (e.g., Kim, 2007). In the Southern Hemisphere (SH), which is in summer, there is also a upper tropospheric lower stratospheric jet but relatively weaker and lower than in the NH. The SH jet core is located at about 50° S, with a secondary one near 30° S. During austral summer, the SH stratosphere is dominated by easterlies, which is distinctly different from the NH. With a center located near 1 hPa and 20° S, the stratospheric easterlies extend downward and equatorward to the tropics. An easterly jet of over −30 m s−1 can be found near 20 hPa and 5° S.
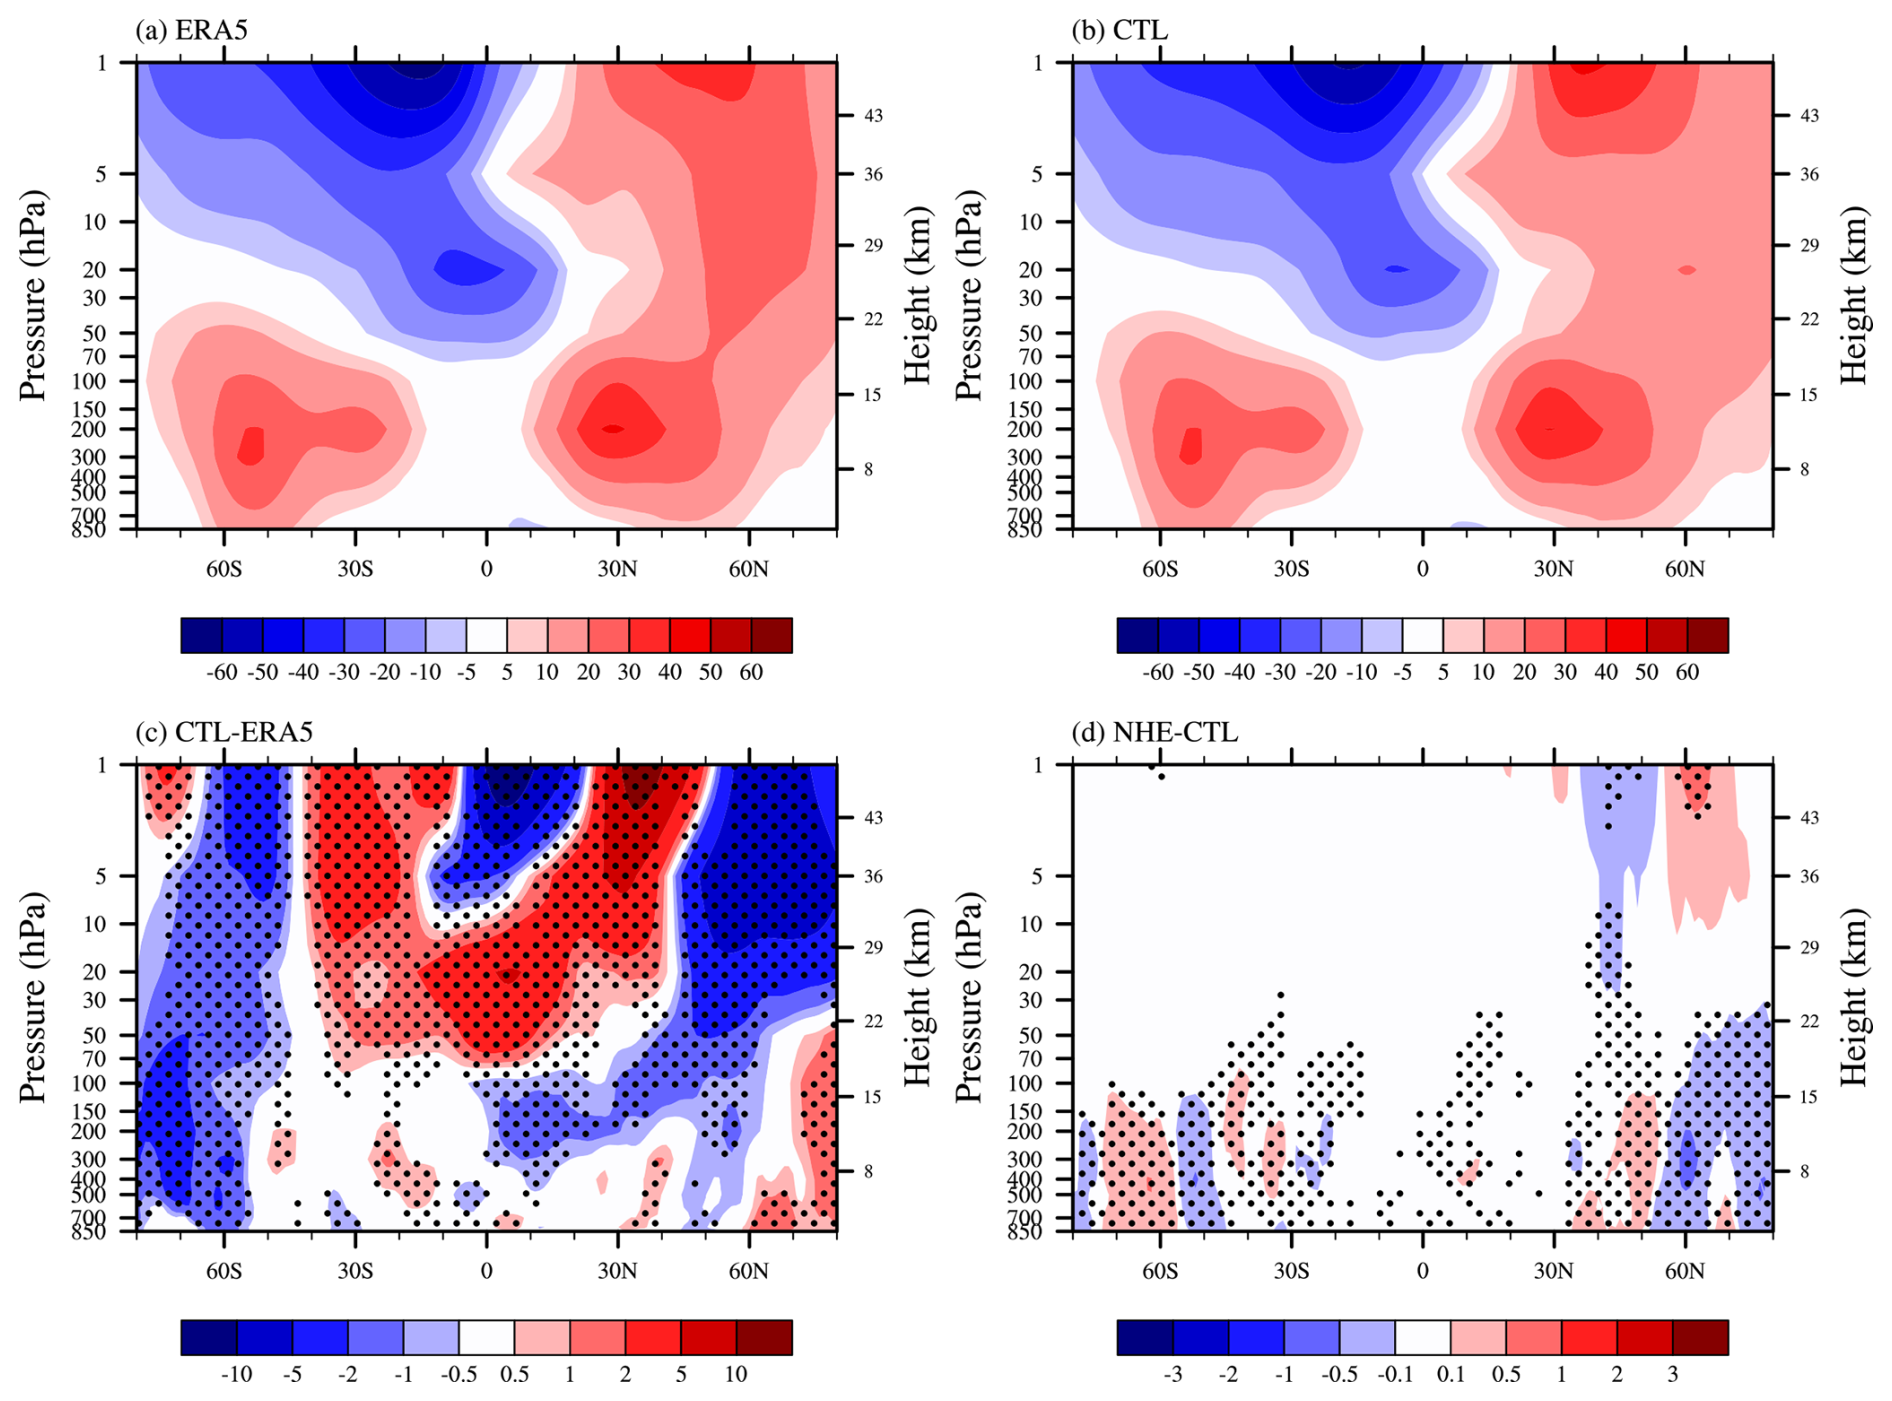
Figure 1Vertical distributions of zonal-mean zonal wind (units: m s−1) averaged in the period of 10 December 2023 to 10 January 2024 obtained from (a) ERA5 and (b) EXP_CTL, with their difference (i.e., EXP_CTL minus ERA5) given in (c). Panel (d) is similar to (c) but for the difference between the two experiments of EXP_NHE and EXP_CTL (i.e., EXP_NHE minus EXP_CTL). Stippling in (c) and (d) denote differences statistically significant at the 95 % confidence level.
Figure 1b is similar to Fig. 1a but for the zonal-mean zonal winds obtained in the EXP_CTL experiment. In general, the CMA-GFS model can capture the overall pattern of the zonal-mean zonal winds, such as the tropospheric westerly jets in both hemispheres and the easterly winds in the SH stratosphere. The polar night jet in the NH, however, is underestimated by the model, with the jet core shifted southward by about 10 latitudes. As shown in Fig. 1c, there are notable easterly biases of over −5 m s−1 in the stratosphere of the NH high latitudes (north of 50° N). By contrast, westerly biases are present in the upper stratosphere of the NH midlatitudes (25–50° N) which can exceed 10 m s−1, extending downward and equatorward to the lower stratosphere of the tropics. Similarly, the zonal-mean zonal winds in the NH troposphere are overestimated in the Arctic region, but with easterly biases in the mid-lower latitudes. In the SH, the stratospheric easterlies are shifted northward, leading to westerly biases in the mid-lower latitudes (40–5° S) and easterly biases in the tropics and lower latitudes of the NH (5° S–20° N). In the high latitudes, there are predominantly easterly biases in both troposphere and stratosphere except in the upper stratosphere over the polar cap.
When taking into account the NHE in the OGWD parameterization scheme, the CMA-GFS model can better capture the large-scale circulation. Figure 1d presents the differences between the zonal-mean zonal winds in the two numerical experiments (i.e., EXP_NHE minus EXP_CTL). In the stratosphere above ∼ 10 hPa, positive and negative wind differences are found to the north and south of 60° N, respectively, which are just opposed to the wind biases in Fig. 1c. It suggests that both the magnitude and location of the polar night jet are improved. For example, the NH easterly biases in the mid-upper stratosphere (∼ 10 to 1 hPa) are reduced by about 3 %. The westerly biases in the troposphere of Arctica region are also reduced, which reaches up to about 42 % of the total bias. At the same time, the easterly wind biases in the mid-latitude troposphere have also reduced.
For the zonal-mean zonal wind biases in the SH stratosphere, they are hardly alleviated, however. This is because the stratospheric OGWD is very weak in summer (see Fig. 5a of Xu et al., 2024; see also Fig. 3 below), given the absorption of OGWs at the critical level (Booker and Bretherton, 1967), that is, the zero-wind level between the tropospheric westerlies and the stratospheric easterlies (Fig. 1a). The easterly biases in the troposphere of the high latitudes are reduced, especially around 60° S.
Although there is no significant improvement for the zonal-mean zonal wind in the NH mid-lower latitudes (Fig. 1d), the wind circulation can be improved regionally, such as the East Asia subtropical jet (EASJ). Figure 2a shows the horizontal wind field and speed at 200 hPa averaged in the period of 10 December 2023 to 10 January 2024 from the ERA5 reanalysis. In boreal winter, the EASJ stretches from about 110 to 160° E in the latitudes between about 25 and 45° N. The jet core is located near Japan, showing a high wind speed of over 70 m s−1. The simulated EASJ in the EXP_CTL experiment generally aligns well with the ERA5 reanalysis, in terms of its location and orientation (Fig. 2b). But the jet intensity is underestimated, showing easterly biases of over −4 m s−1 (Fig. 2c). In the EXP_NHE experiment, the underestimation of the EASJ is alleviated, with the mean bias decreased by about 6 % (Fig. 2d).
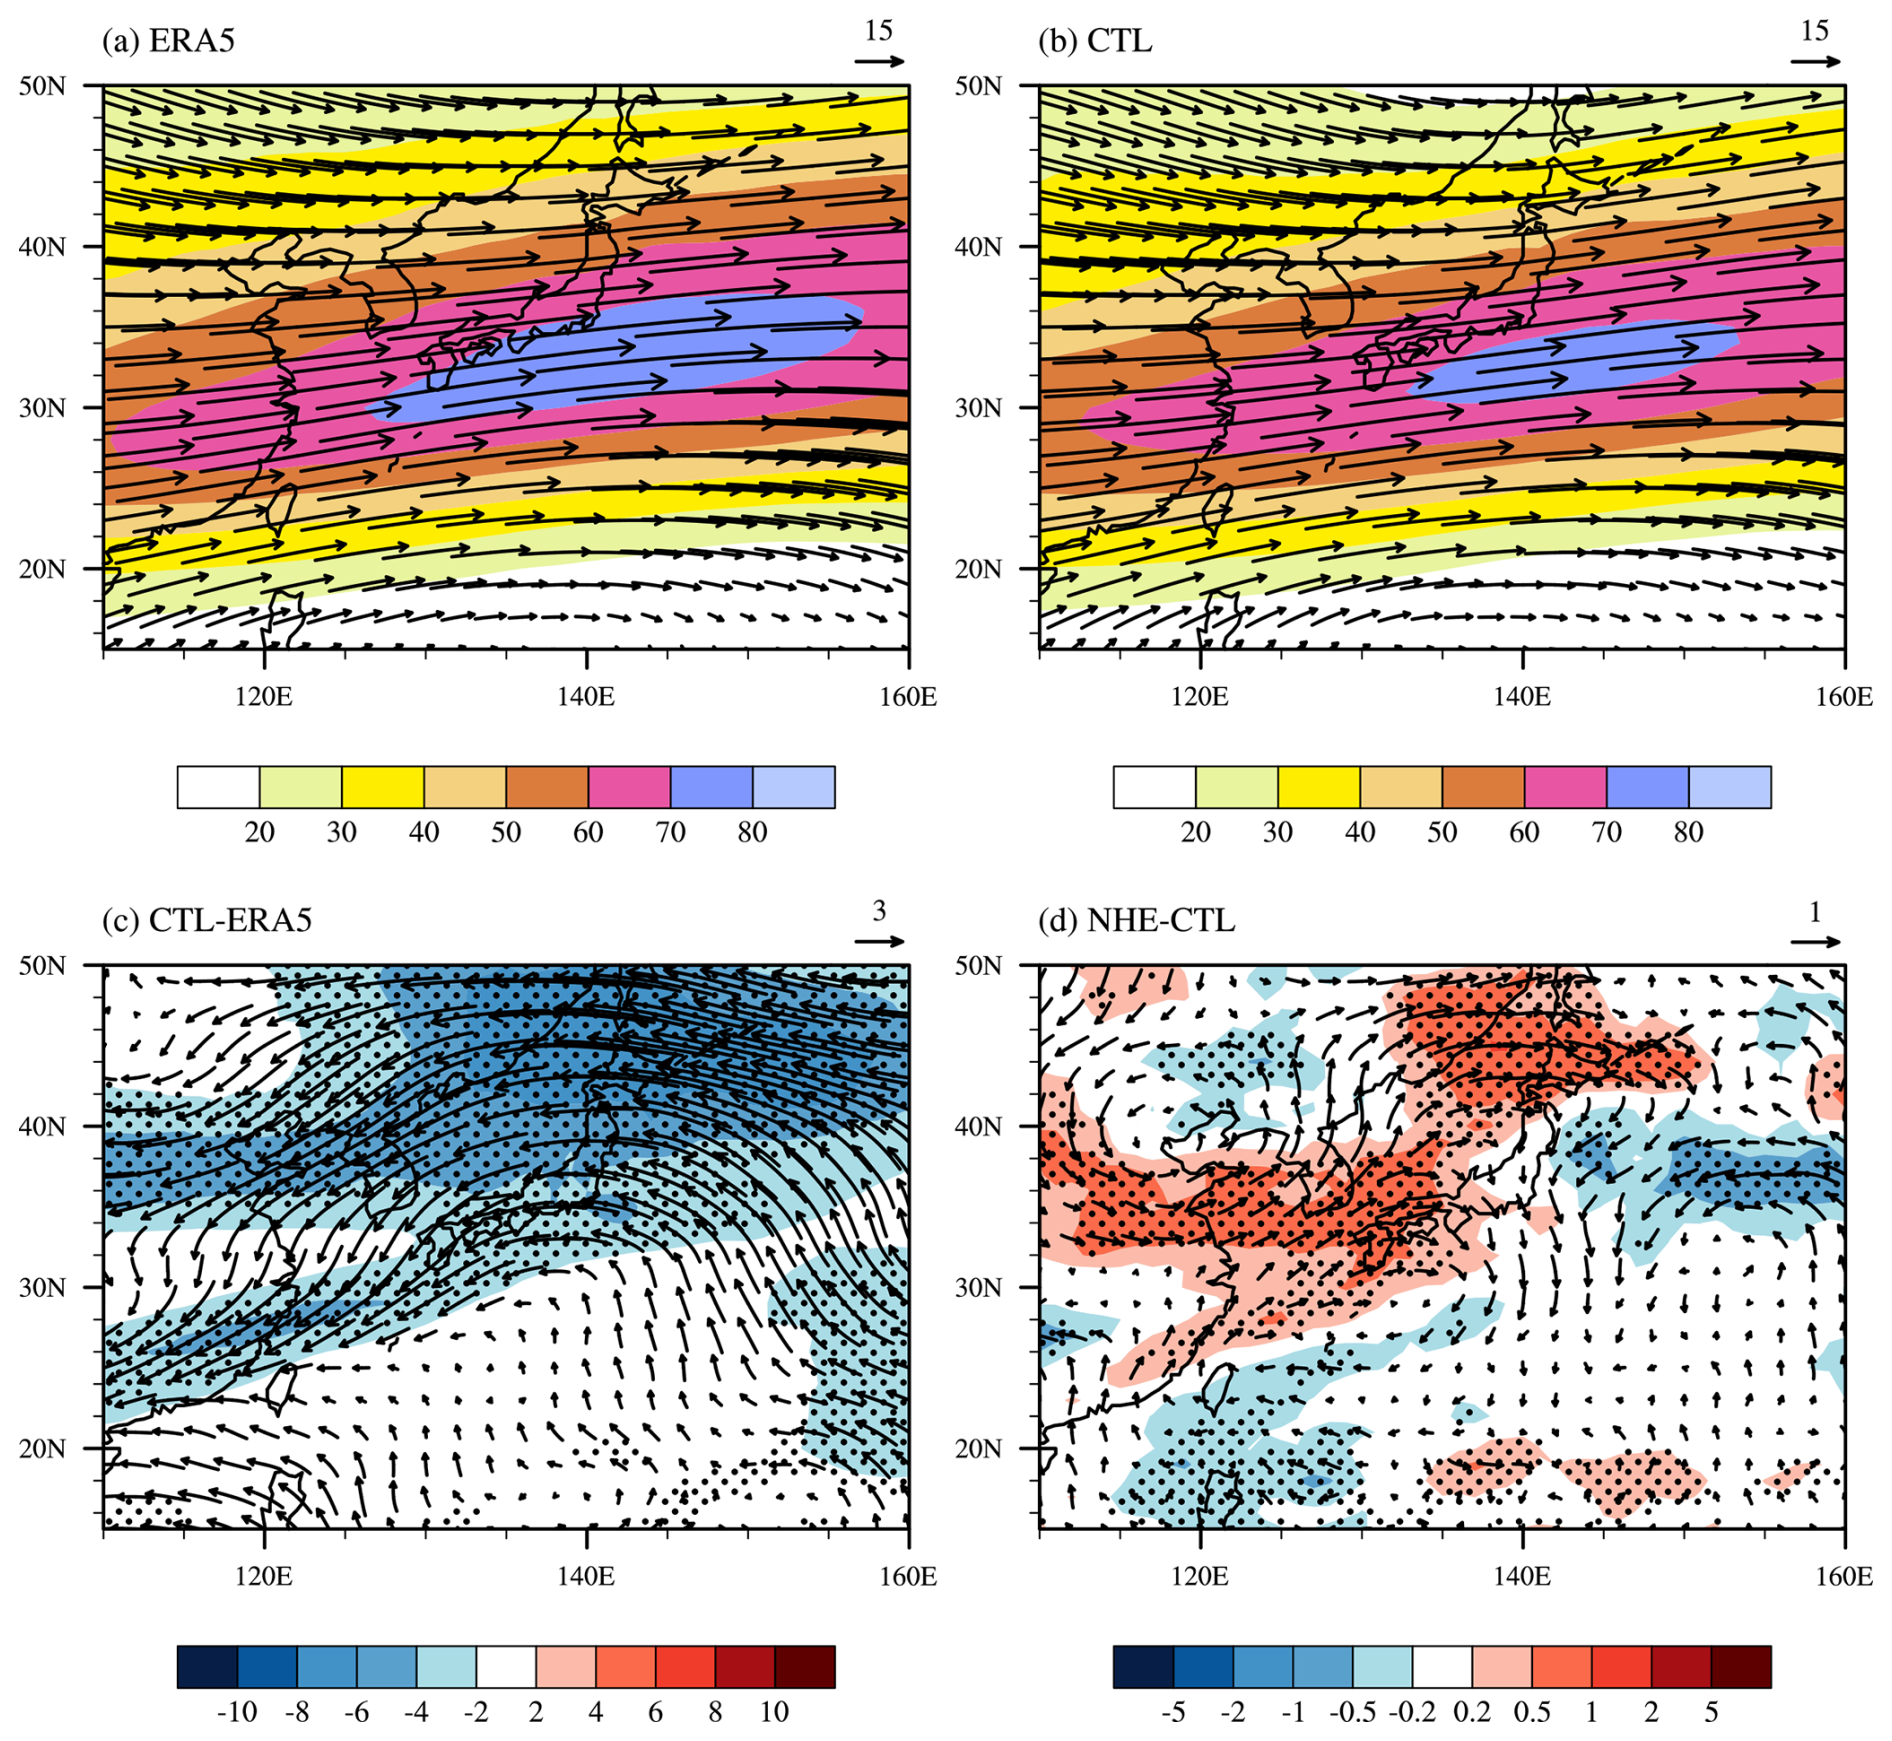
Figure 2Horizontal distributions of wind speed (shading; units: m s−1) and wind filed (arrow) at 200 hPa averaged in the period of 10 December 2023 to 10 January 2024 obtained from (a) ERA5 and (b) EXP_CTL, with their difference (i.e., EXP_CTL minus ERA5) given in (c). Panel (d) is similar to (c) but for the difference between the two experiments of EXP_NHE and EXP_CTL (i.e., EXP_NHE minus EXP_CTL). Stippling in (c) and (d) denote differences statistically significant at the 95 % confidence level.
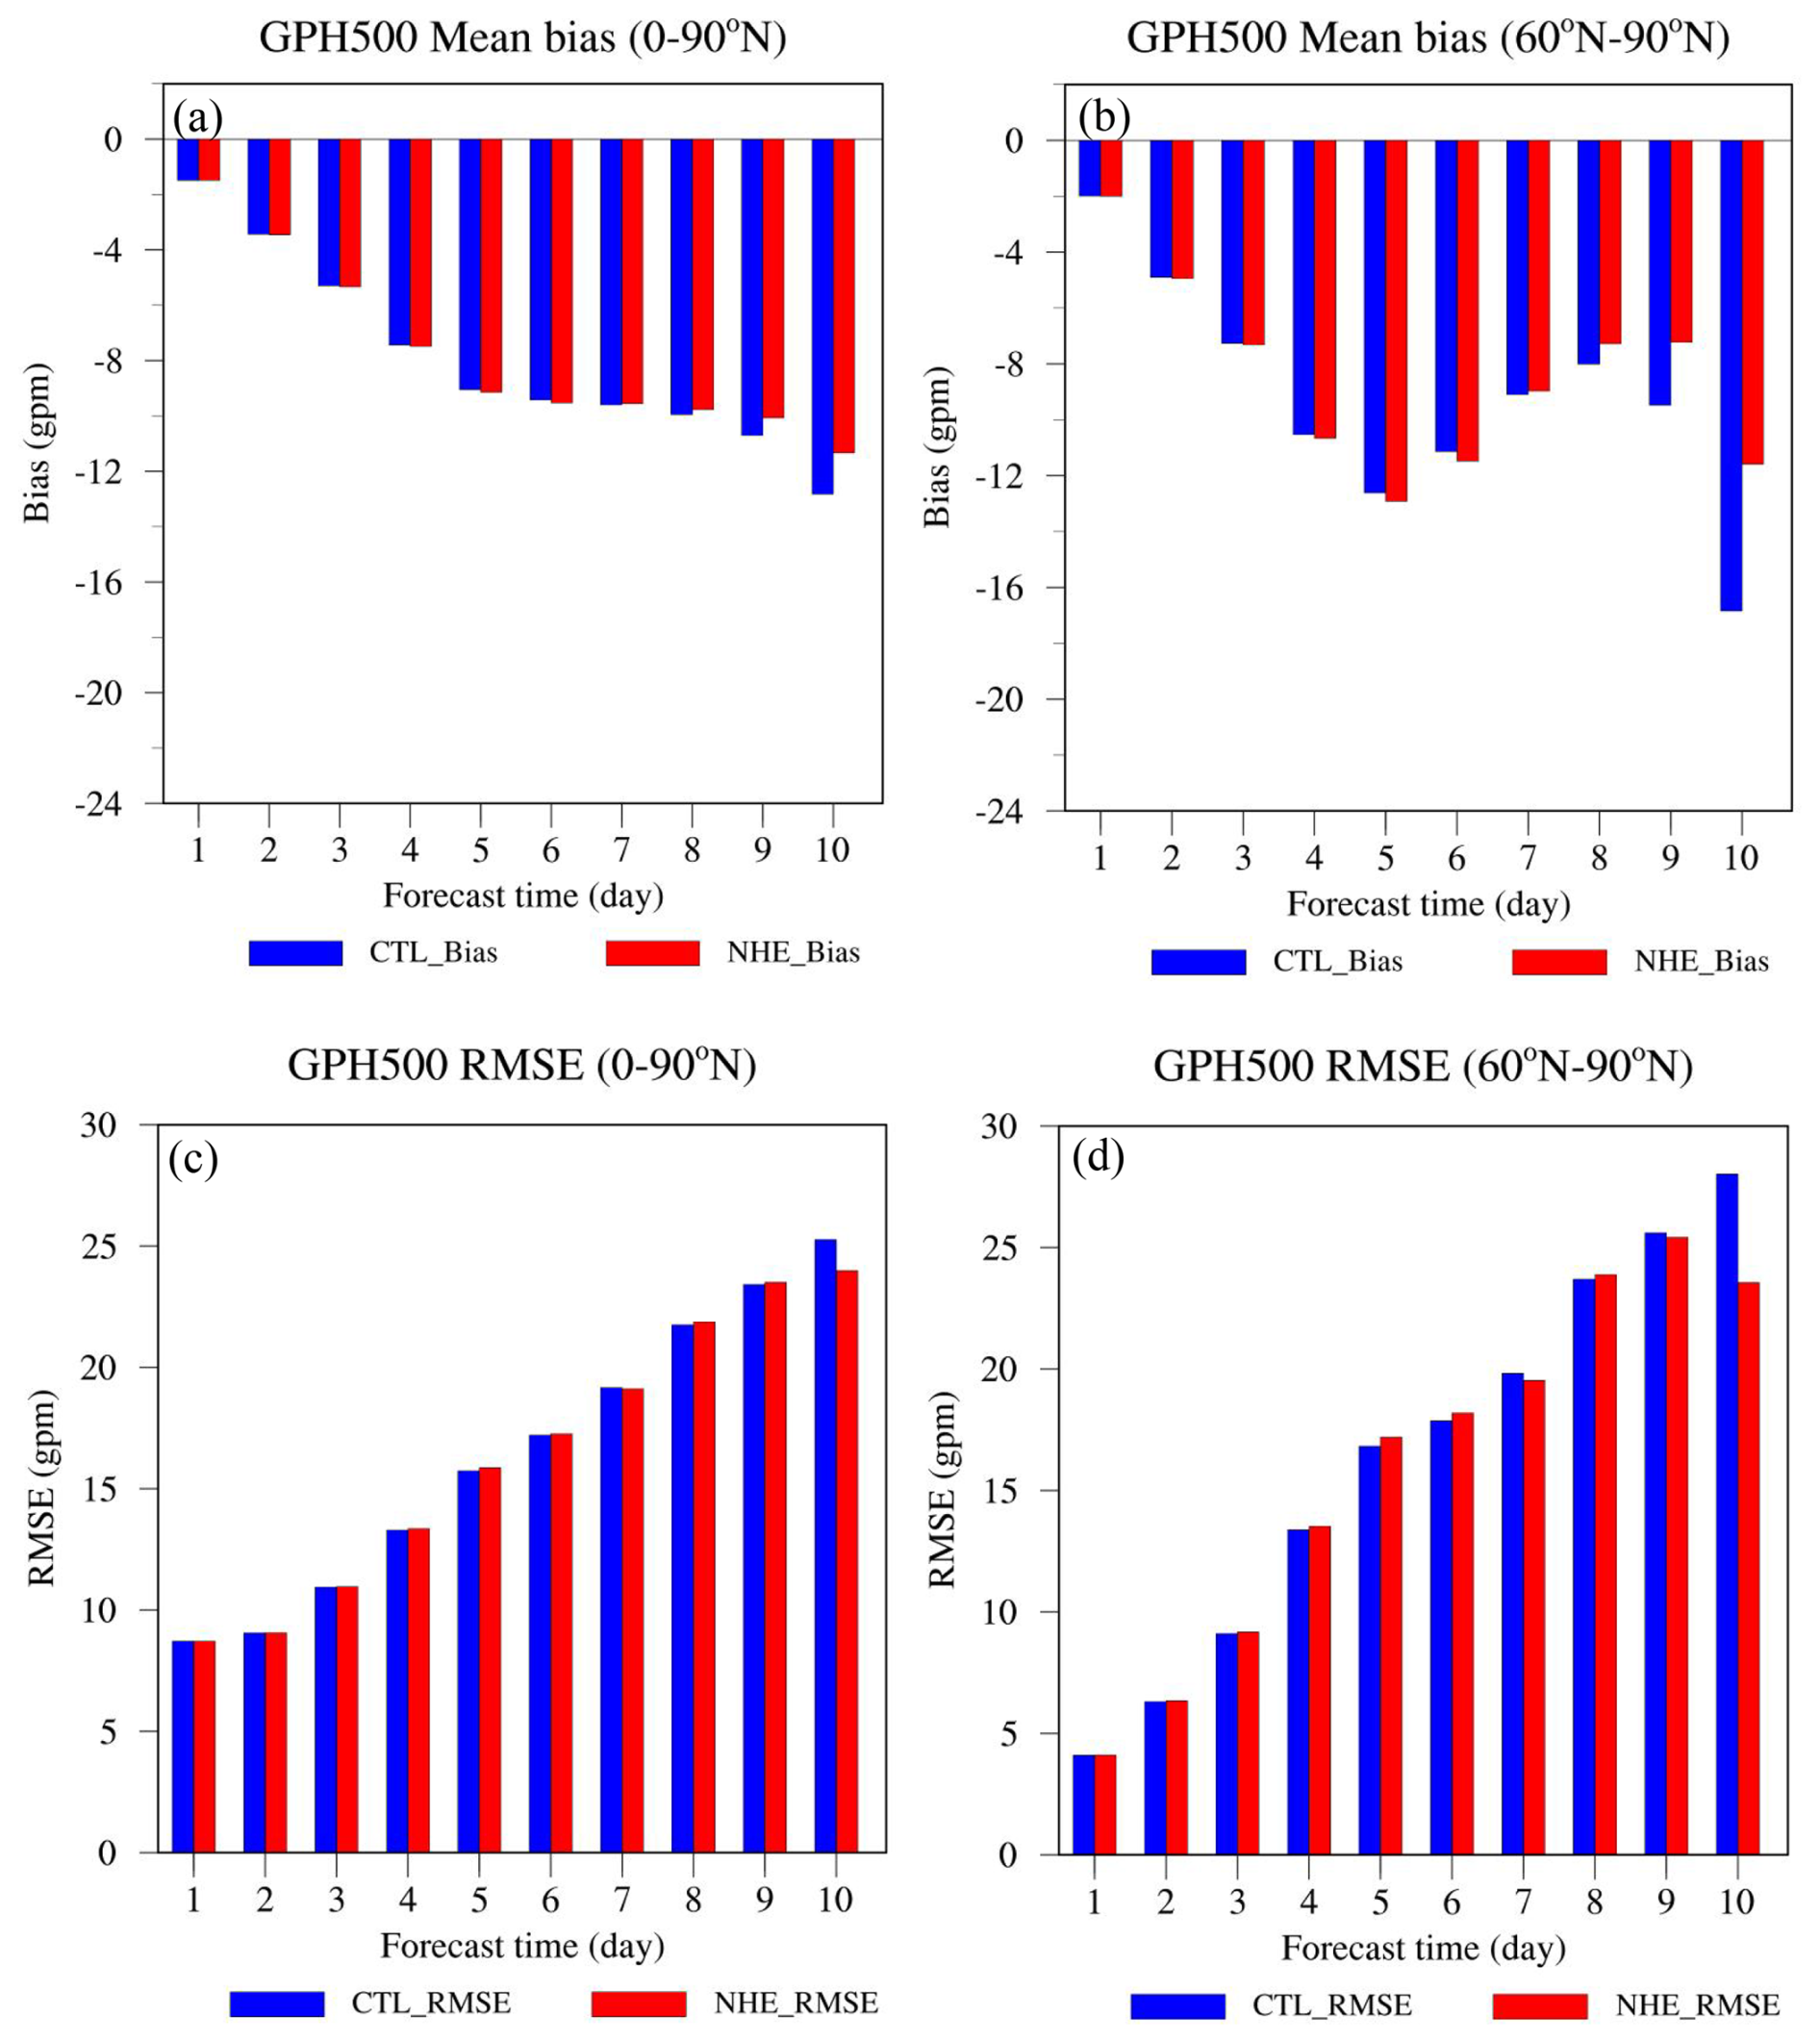
Figure 3(a) Mean bias and (c) RMSE of the GPH500 in the NH at different forecast lead time. Panels (b) and (d) are similar to (a) and (c) but in the region north of 60° N.
3.2 Quantitative evaluation of forecast skills
For medium-range forecast, the wind circulation in the troposphere is often of greater interest than in the stratosphere. To better evaluate the performance of the revised OGWD scheme, Fig. 3a and b depict the mean bias (MB) and root mean square error (RMSE) for the 500 hPa geopotential height (GPH500) in the two experiments. Herein, we are interested in the NH because of the relatively weak wind differences in the SH (Fig. 1d) which is mainly covered by the ocean. Moreover, as will be shown below, the parameterized OGWD changes little in the SH.
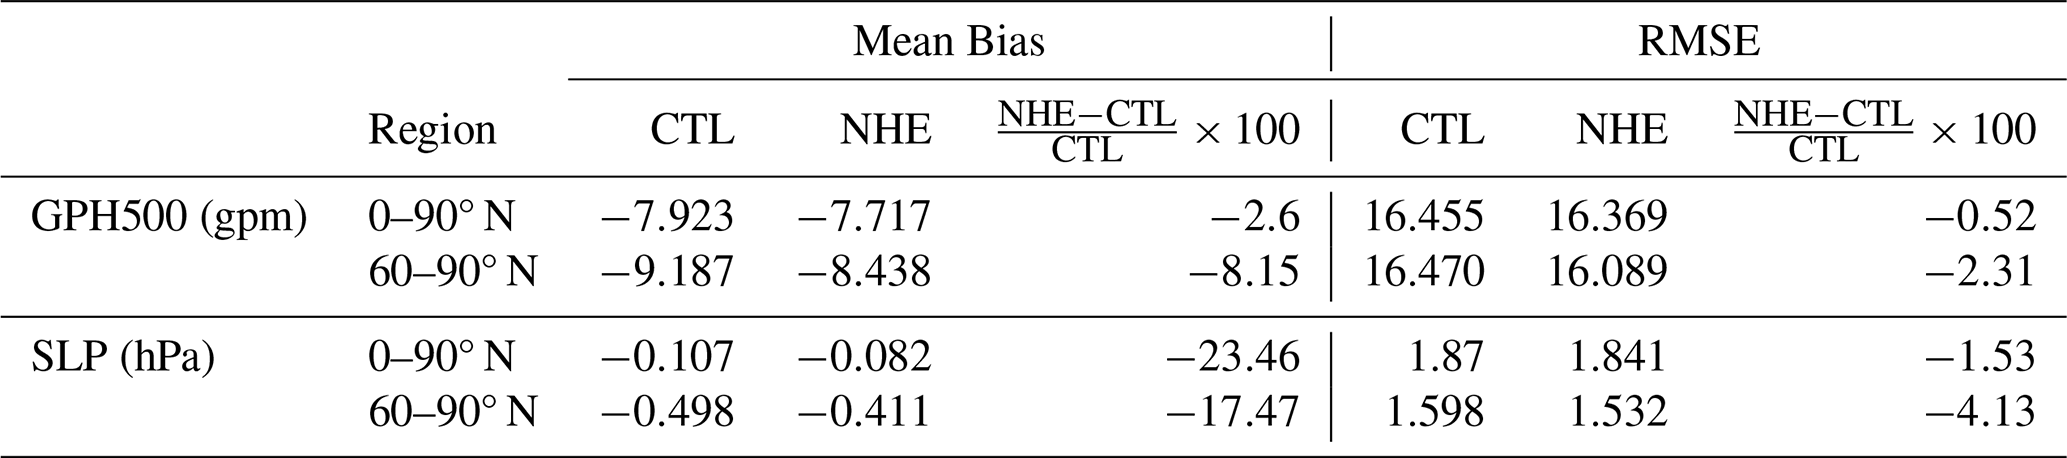
In both experiments, the model GPH500 is lower than the ERA5 reanalysis, with the MB and RMSE increasing with the forecast lead time (Fig. 3a, c). The GPH500 shows obvious underestimation in the EXP_CTL experiment which are significantly reduced in EXP_NHE. This improvement is particularly evident in high latitudes north of 60° N which is overall statistically significant at the 95 % confidence level (Fig. 4a, b). Compared to EXP_CTL, EXP_NHE exhibits even greater MB and RMSE of GPH500 till the 6th forecast day. Nevertheless, both the MB and RMSE of the GPH500 decrease quickly afterwards, which are reduced by 11.59 % and 5.06 %, respectively, at the 10th day of the forecast (Table 1). Greater improvements are found for the GPH500 between 60 and 90° N, the MB and RMSE of which are decreased by 31.18 % and 15.93 %, respectively, at the 10th forecast day (Table 1). All the values shown in Table 1 are statistically significant at the 95 % confidence level. For the total 10 forecast days as a whole, the MB and RMSE of GPH500 are separately reduced by 2.6 % and 0.52 %, indicating an overall improvement in the simulation of the large-scale circulation in the NH when using the revised OGWD scheme (see Table 2).
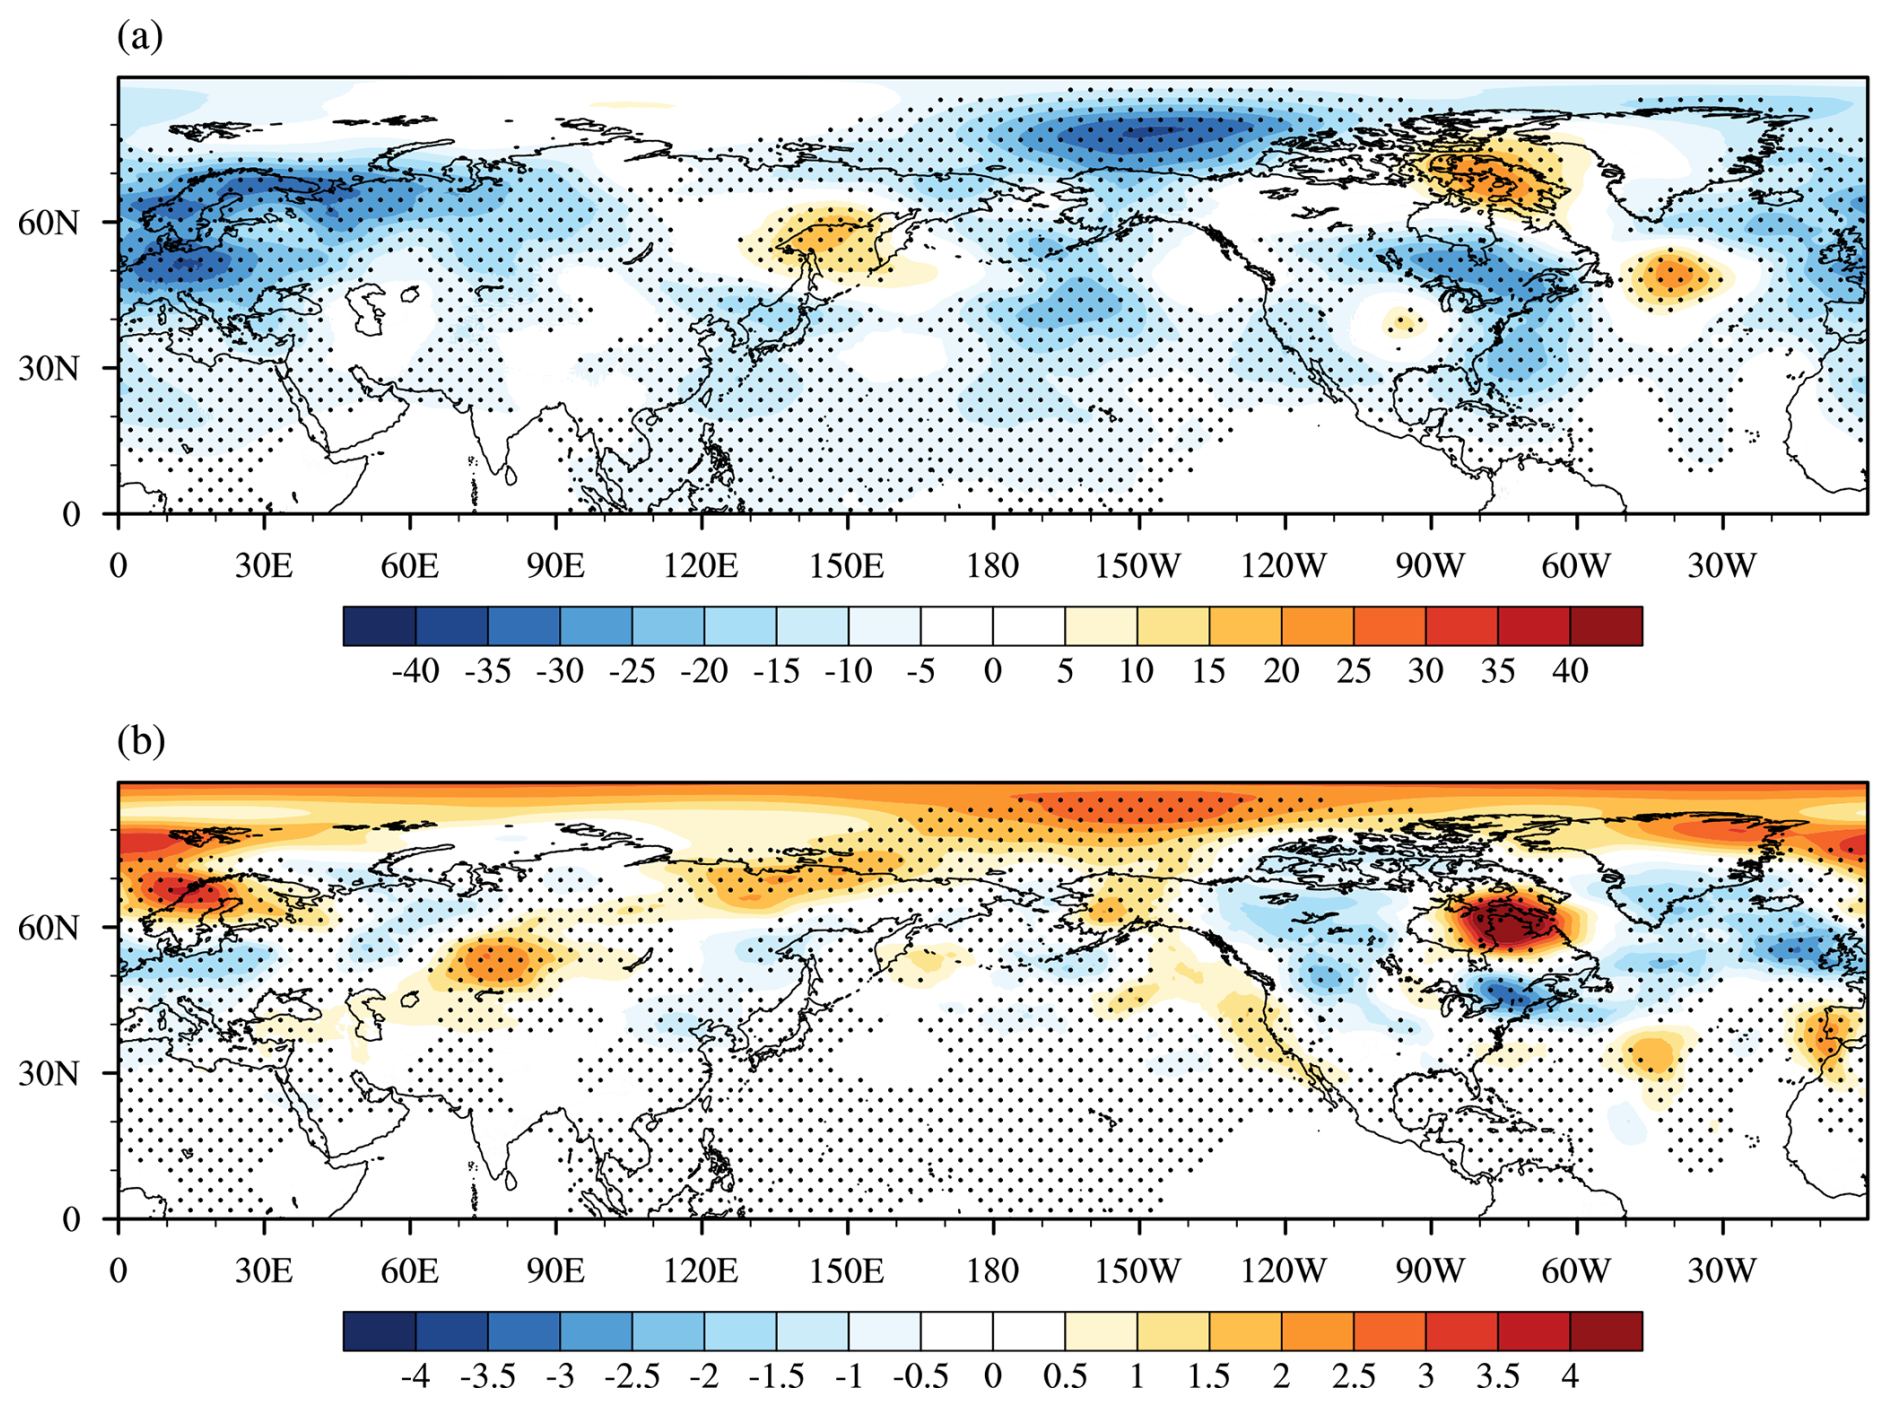
Figure 4(a) Mean biases of GPH500 (shading; units: gpm) in EXP_CTL experiment as compared to ERA5 averaged over the ten forecast days. Panel (b) is similar to (a) but for the differences between the GPH500 (shading; units: gpm) in EXP_CTL and EXP_NHE experiments (i.e., EXP_NHE minus EXP_CTL). Stippling in (a) and (b) denote differences statistically significant at the 95 % confidence level.
Table 1Mean bias and RMSE of the 500 hPa geopotential height (GPH500) and sea level pressure (SLP) at the 10th forecast day.
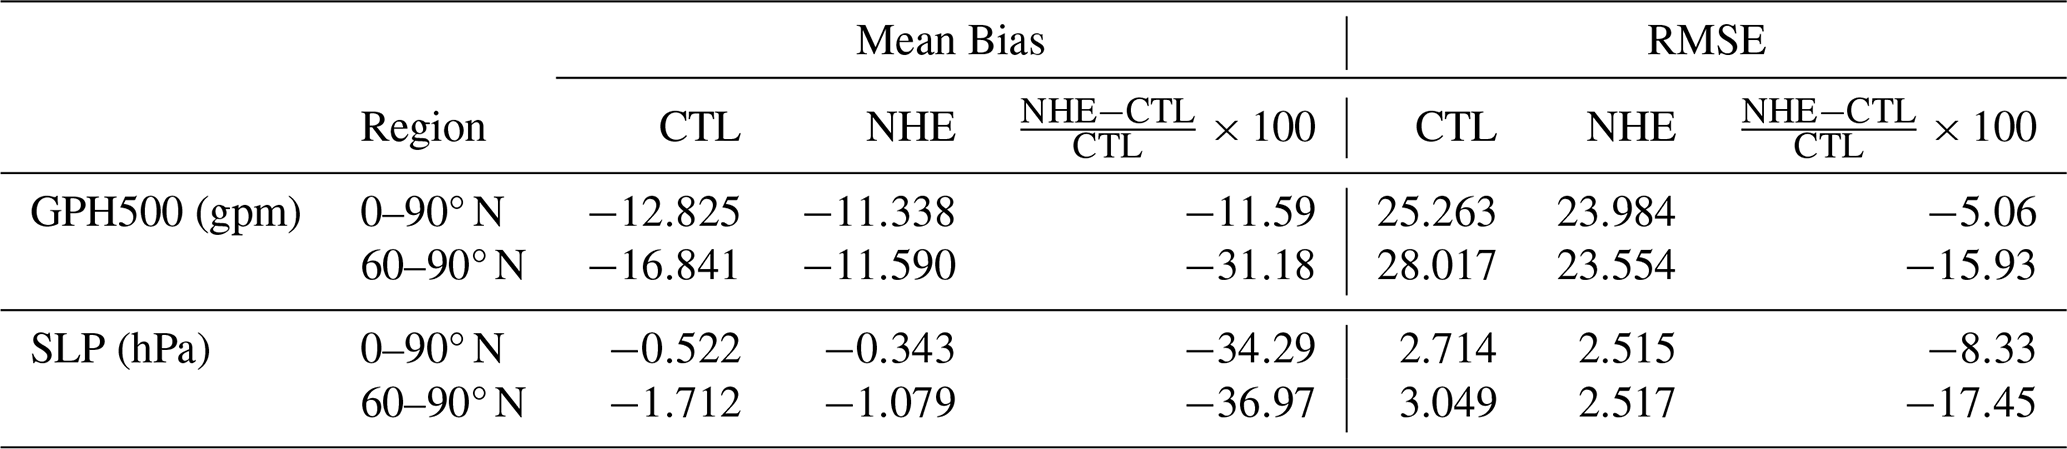
Table 2Mean bias and RMSE of the 500 hPa geopotential height (GPH500) and sea level pressure (SLP) for the overall ten forecast days.
Besides the GPH500, the forecast skill is also examined for the SLP in the NH. As shown in Fig. 5a, the EXP_CTL experiment systematically underestimates the SLP over East Asia and the Arctic, while overestimating SLP across North America and the northern Atlantic. These biases are substantially corrected in the EXP_NHE experiment, particularly in high-latitude regions north of 60° N (Fig. 5b). Similarly, the EXP_NHE experiment firstly experiences a degradation in the early 6 d compared to EXP_CTL, but it shows significant improvement at the end of the 10th forecast day, with the MB reduced by 34.29 % and the RMSE by 8.33 %, respectively (Table 1). Greater decreases of 36.97 % (for MB) and 17.45 % (for RMSE) are found in the high latitudes north of 60° N as well.
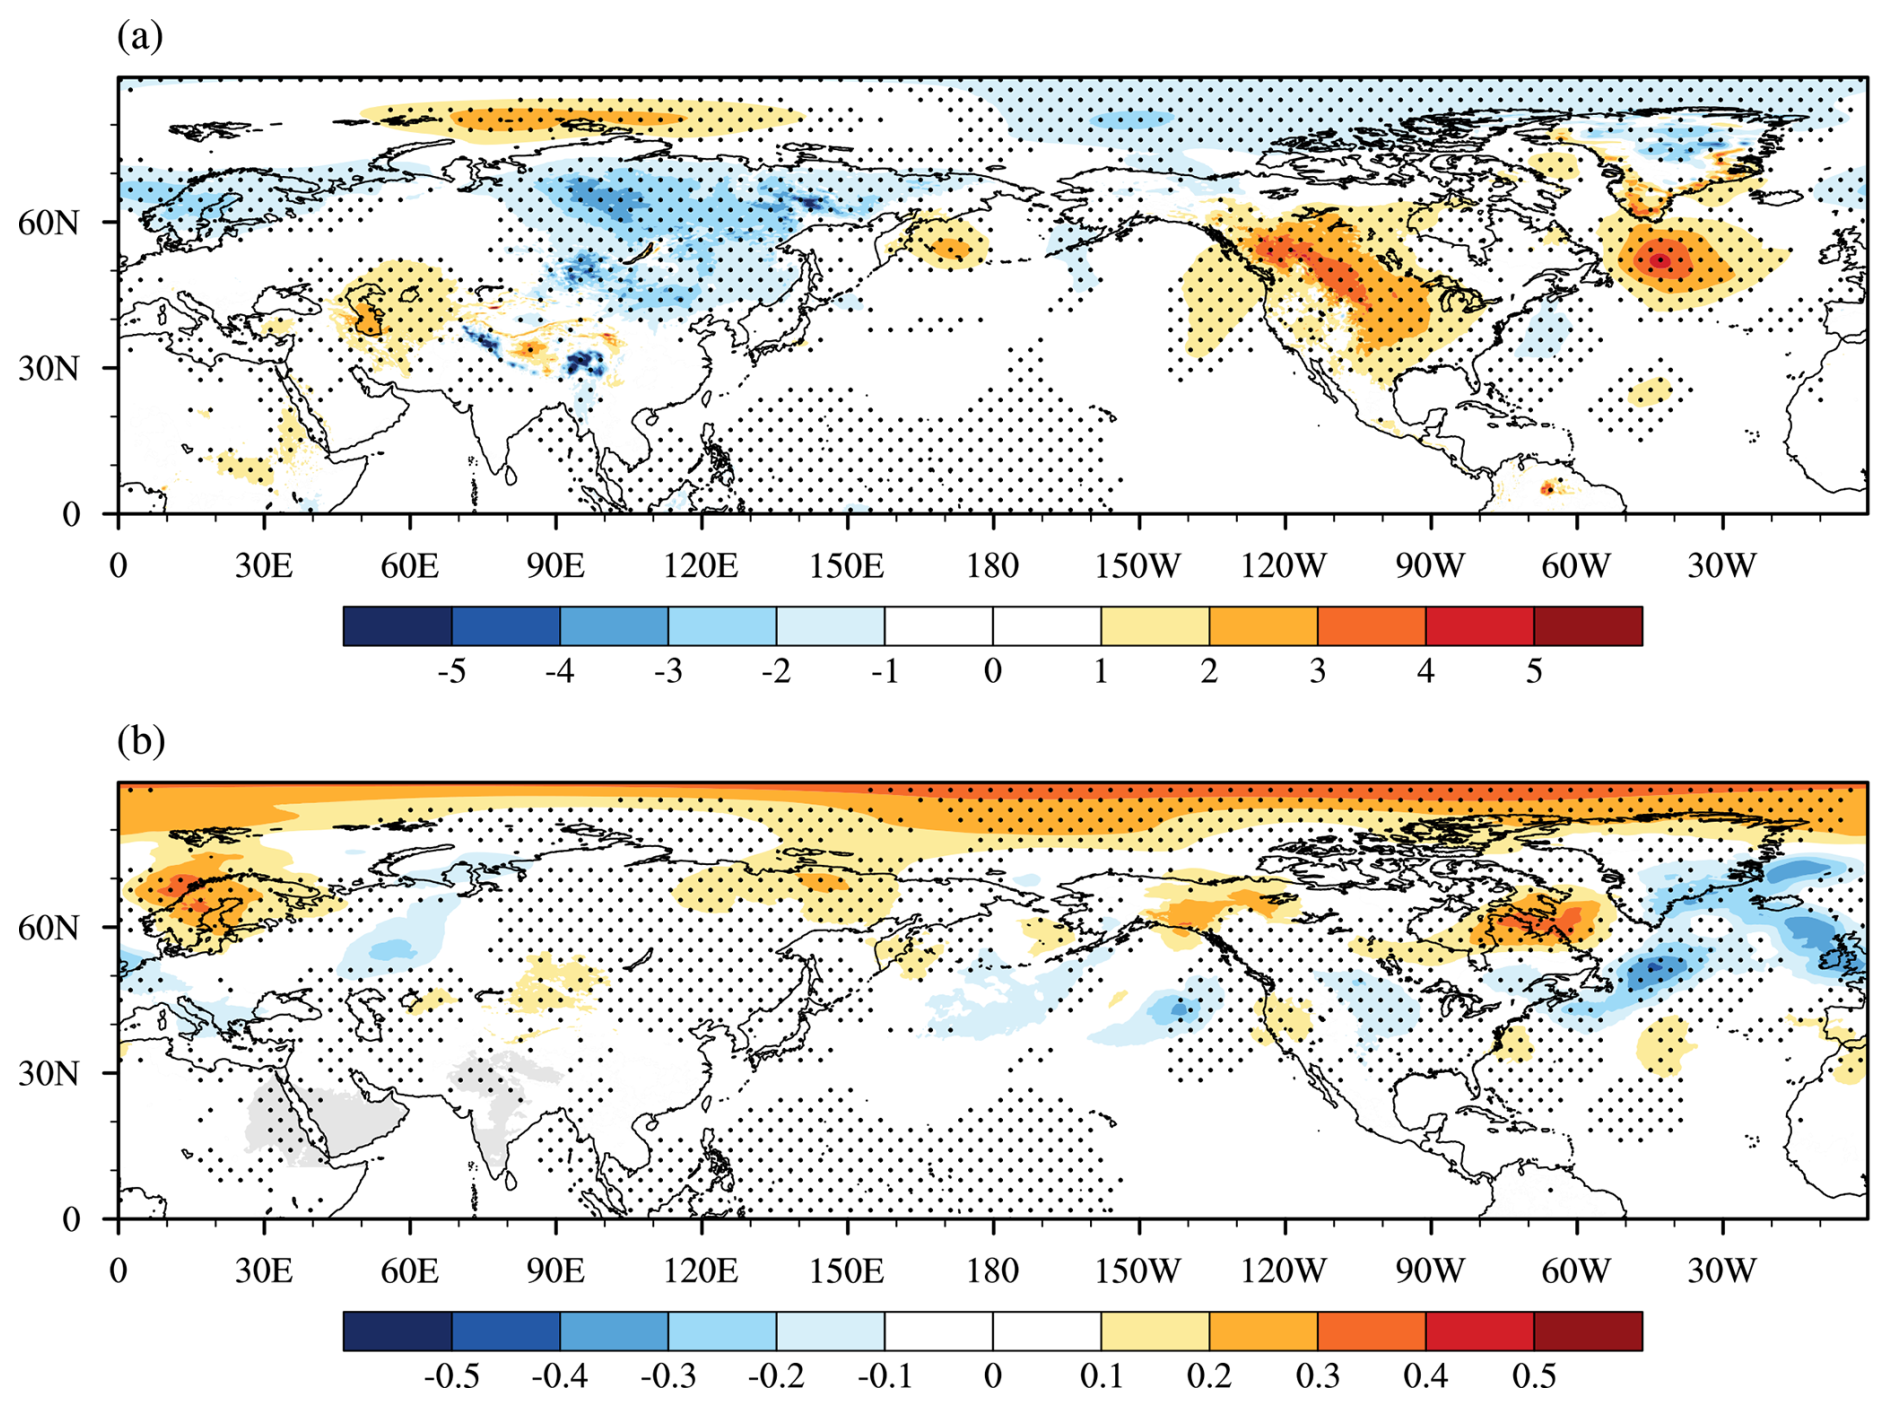
Figure 5(a) Mean biases of SLP (shading; units: hPa) in the EXP_CTL experiment as compared to ERA5 averaged over the ten forecast days. Panel (b) is similar to (a) but for the differences between the SLP (shading; units: hPa) in the EXP_CTL and EXP_NHE experiments (i.e., EXP_NHE minus EXP_CTL). Stippling in (a) and (b) denote differences statistically significant at the 95 % confidence level.
From the above analyses, implementing the revised OGWD scheme in the high-resolution CMA-GFS model can help improve the medium range forecast of the NH large-scale circulation, especially in the high latitudes. In the next section, we will examine the underlying mechanisms responsible for the improvement of the circulation.
4.1 Changes of parameterized OGWD
The changes of wind circulation arise from the revision of the OGWD scheme. It is thus straightforward to study the parameterized OGWD in these two experiments. Figure 6a shows the vertical distribution of zonal-mean zonal OGWD averaged in the period of 10 December 2023 to 10 January 2024 in the EXP_CTL experiment. The differences between the parameterized OGWD in the two experiments (i.e., EXP_NHE minus EXP_CTL) are given in Fig. 6b. In boreal winter, there exists prominent OGWD in the stratosphere of the NH mid-to-high latitudes, which is favored by the decrease of air density with height (e.g., Lindzen, 1981) and the relatively weak winds between the tropospheric jet and polar night jet. The latter is called as the “valve layer” by Kruse et al. (2016). The maximum OGWD occurs between about 20 and 1 hPa. In contrast, there is very weak OGWD in the SH stratosphere owing to the critical level absorption as mentioned above.
Compared to that in EXP_CTL, the zonal-mean zonal OGWD in EXP_NHE is generally weakened in the high latitudes of the NH (north of about 55° N), especially in the stratosphere (Fig. 6b). Note that the positive difference indicates a decrease of OGWD as the drag itself is negative. This is due to the fact that the NHE acts to decrease the surface WMF (see Eqs. 4 and 5), i.e., the source of parameterized OGWs which determines the maximum wave momentum that can be deposited into the mean flow. Therefore, the decrease of surface WMF is prone to reduce the OGWD. Note that there is also enhancement of OGWD, e.g., in the stratosphere near 50° N. This may be attributed to a decrease in surface WMF, which suppresses tropospheric wave breaking by lowering the gravity-wave amplitude limit for breaking at lower levels and thus shifts the wave-breaking altitude upward. Consequently, a vertical structure characterized by alternating positive-negative-positive anomalies from the surface to the stratosphere would be expected. In consequence, more WMF is transported to the stratosphere where the OGWs break owing to the decay of air density and lead to stronger OGWD. This is similar to the redistribution of WMF in the vertical owing to selective critical level filtering of OGWs in directional shear flows (Shutts, 1995; Xu et al., 2012, 2019; van Niekerk et al., 2023). Generally, the changes in the vertical structure of parameterized OGWD in the CMA-GFS model are similar to that in the MPAS seasonal simulations conducted in Xu et al. (2024) which also considers the NHE correction to the OGWD (cf. their Fig. 5). Instead, the lower-tropospheric OGWD is also affected by the interaction and feedback between model dynamics and physical parameterizations. Changes in the simulated low-level circulation, including possible meridional displacement of drag-producing flow configurations, can modify the wind speed, stability, and mountain-flow orientation sampled by the OGWD scheme, thereby producing localized enhancement of the near-surface drag in EXP_NHE.
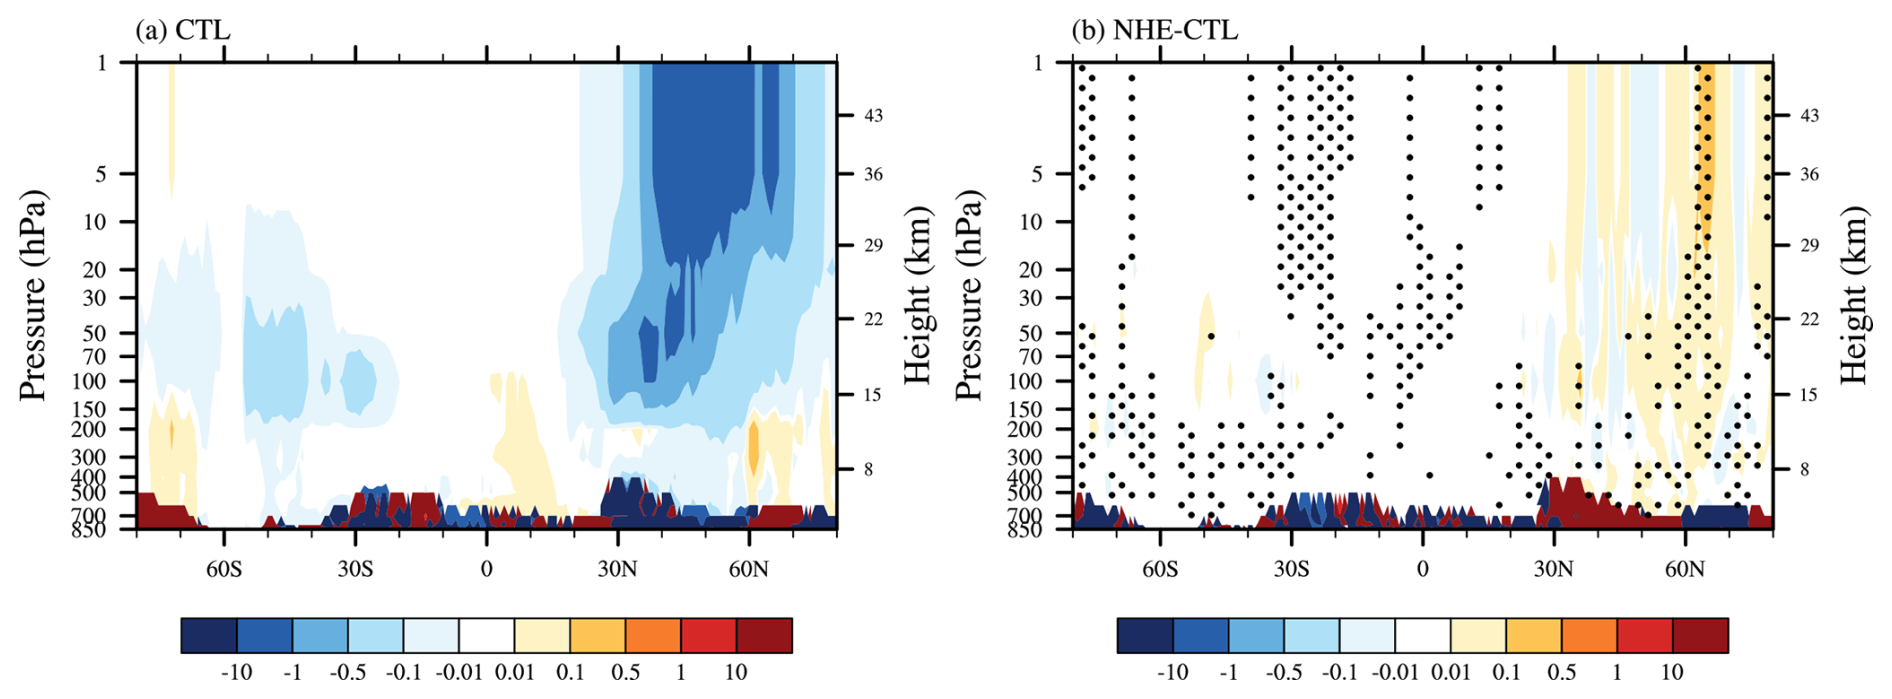
Figure 6Vertical distributions of (a) zonal-mean zonal OGWD (units: m s−1 d−1) averaged in the period of 10 December 2023 to 10 January 2024 obtained from EXP_CTL, and (b) zonal-mean OGWD difference between the two experiments of EXP_NHE and EXP_CTL (i.e., EXP_NHE minus EXP_CTL). Stippling in (b) denotes differences statistically significant at the 95 % confidence level.
The weakening of OGWD can directly increase the zonal winds in the polar stratosphere and the mid-latitude troposphere of the NH, thus leading to a recover of the weakened westerly jet. Conversely, the enhancement of OGWD can directly weaken the zonal winds in the mid-latitude stratosphere and the polar troposphere of the NH, thereby reducing the westerly biases (Fig. 1c, d). The parameterized OGWD in East Asia is also examined to explain the changes of EASJ. As shown in Fig. 7a, there is notable westward OGWD at 200 hPa in the high latitudes of East Asia where the underlying terrain is very complex, such as the Taihang, Yanshan, Changbai, Greater Khingan and Lesser Khingan Mountains. Thus, the largest easterly biases of the EASJ occur in this region (Fig. 2c). When accounting for the NHE in the OGWD parameterization scheme, the 200 hPa OGWD is mainly reduced (Fig. 7b). Clearly, the enhanced EASJ is owing to the weakening of the parameterized OGWD.
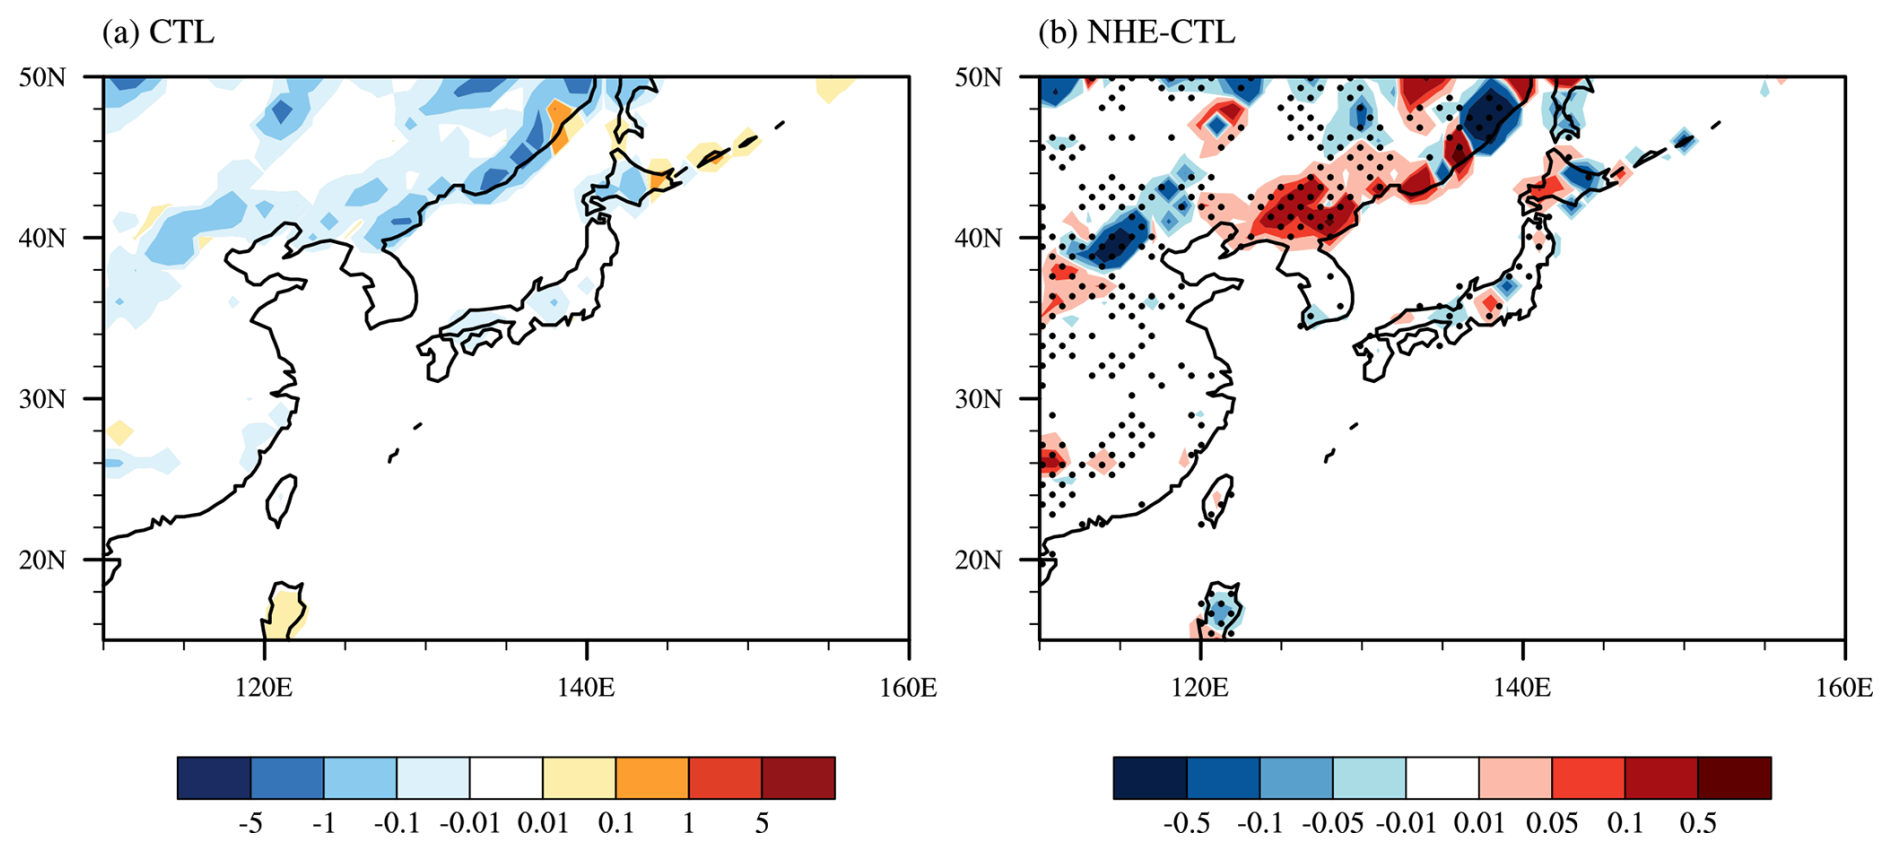
Figure 7Horizontal distributions of (a) zonal OGWD (units: m s−1 d−1) at 200 hPa averaged in the period of 10 December 2023 to 10 January 2024 obtained from EXP_CTL, and (b) zonal OGWD difference between the two experiments of EXP_NHE and EXP_CTL (i.e., EXP_NHE minus EXP_CTL) at 200 hPa. Stippling in (b) denotes differences statistically significant at the 95 % confidence level.
4.2 Resolved Rossby-wave adjustment
In addition to the direct effect of the modified OGWD, the tropospheric response in the Northern Hemisphere is also associated with an adjustment of resolved large-scale Rossby waves. This interpretation is consistent with the wave-drag compensation and propagation-adjustment mechanisms discussed in previous studies (e.g., Cohen et al., 2013; Sigmond and Shepherd, 2014). In particular, changes in the background zonal wind may alter the propagation conditions for planetary waves and thereby redistribute the resolved wave forcing between the troposphere and stratosphere.
It is well known that the impacts of large-scale Rossby waves on the mean flow can be measured by the convergence of the zonal-mean Eliassen-Palm (EP) flux. Figure 8a illustrates the distribution of the zonal-mean EP flux in the EXP_CTL experiment which is calculated following Edmon et al. (1980). In the NH middle-to-high latitudes, Rossby waves originate from the lower troposphere which propagate upward and converge in the upper troposphere. These waves split into two branches in the lower stratosphere. The first branch turns to propagate equatorward across the tropospheric jet. The other branch continues to propagate upward to the upper stratosphere where the EP flux is converged and decelerates the mean flow. As in the SH, the Rossby waves cannot propagate into the stratosphere (not shown) because of the presence of easterlies there during austral summer (Fig. 1a).
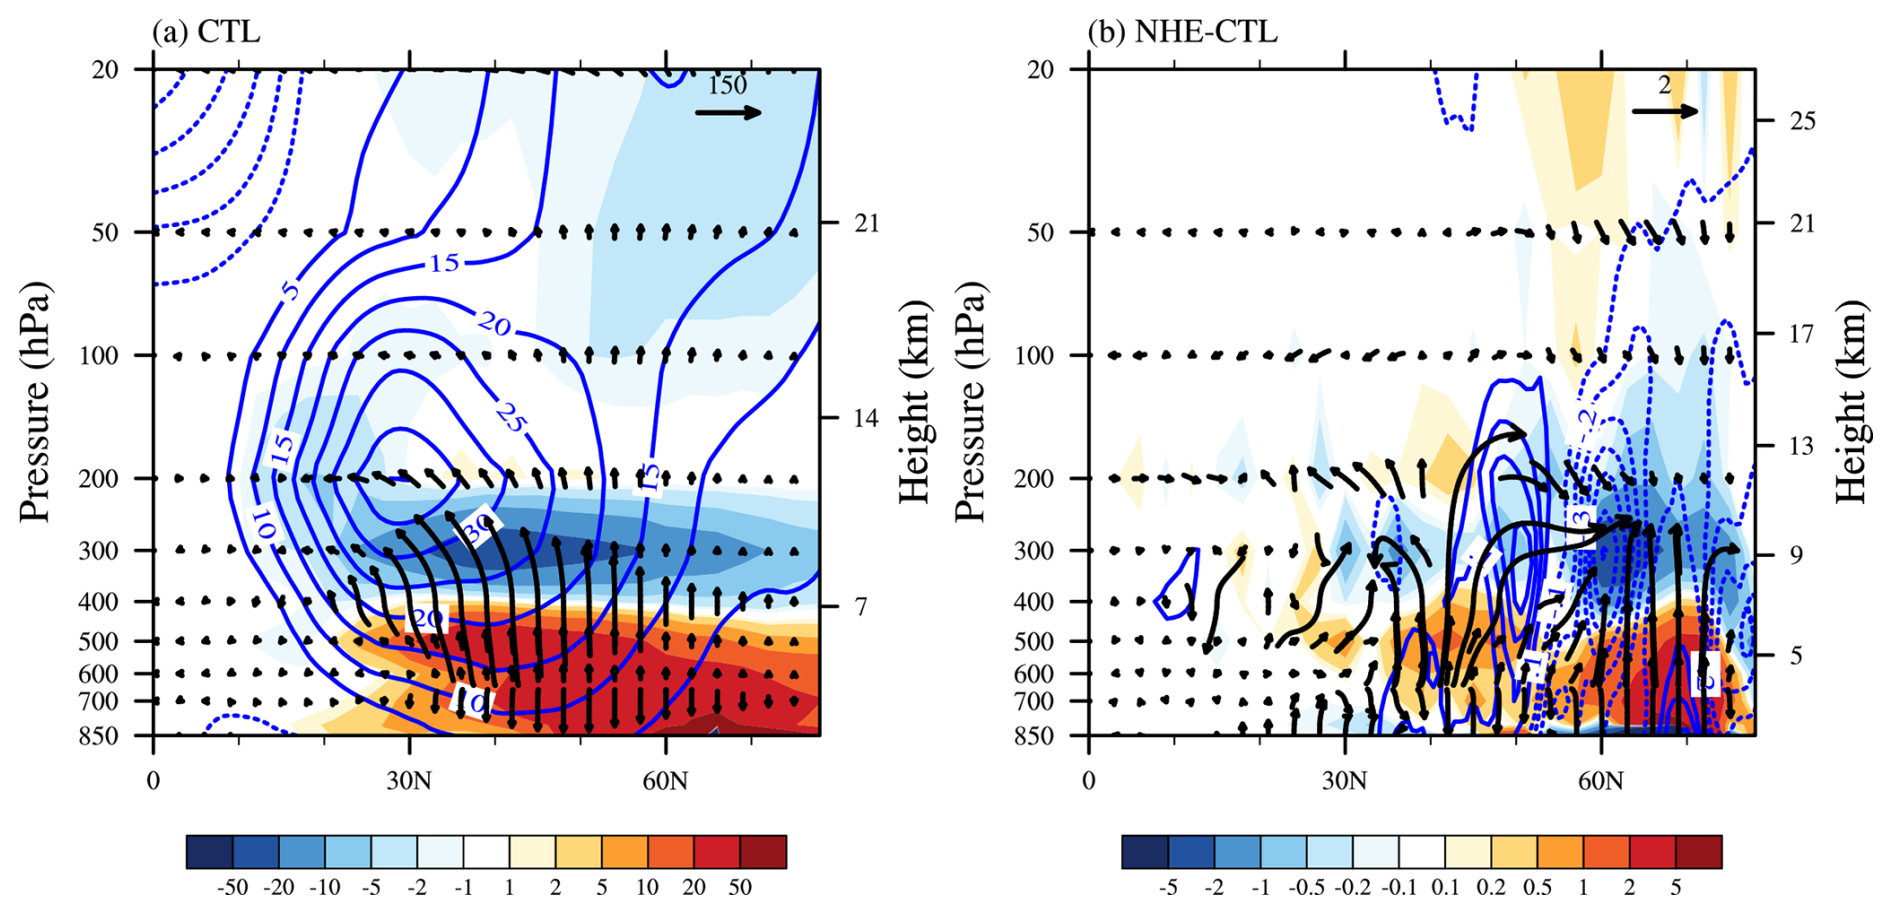
Figure 8Vertical distributions of zonal-mean EP flux (vectors) and its divergence (shading; m s−1 d−1) due to resolved waves averaged in the period of 10 December 2023 to 10 January 2024 obtained from (a) EXP_CTL, and (b) the difference between the two experiments of EXP_NHE and EXP_CTL (i.e., EXP_NHE minus EXP_CTL). Contours are the corresponding zonal-mean zonal wind (units: m s−1).
Figure 8b is similar to Fig. 8a but gives the differences between the zonal-mean EP fluxes in the two experiments (i.e., EXP_NHE minus EXP_CTL). Compared to EXP_CTL, the upward propagation of Rossby waves into the stratosphere is suppressed in the high latitudes of the NH, leading to an enhanced convergence of EP flux in the troposphere. As a result, the zonal-mean zonal winds in the NH polar troposphere are decelerated by the large-scale Rossby wave forcing, which contributes to the alleviation of westerly biases there (Fig. 1c, d). This may explain why the improvements in the GPH 500 forecast emerge after 6 d in EXP_NHE (Fig. 2). The Rossby waves and their interaction with the mean flow require several days to develop fully and influence the large-scale circulation.
The suppressed upward propagation of Rossby waves can be understood from the changes of the refractive index (RFI) that measures the ability of Rossby wave propagation (e.g., Chen and Robinson, 1992; Hu et al., 2019), which is defined as
where , k and H are the resolved zonal-mean zonal wind, zonal wave number and density scale height, respectively. represents the meridional gradient of the potential vorticity, which is expressed in the following form of
where Ω, θ and Rd being the Earth's angular frequency, potential temperature and dry gas constant, respectively. The subscripts φ and p represent the partial derivatives with respect to latitude and pressure, respectively. The overbars indicate temporal and zonal averages. From Eq. (6), the increase of zonal wind will narrow the range of Rossby wave numbers that can propagate into the stratosphere (Charney and Drazin, 1961; Xu et al., 2024).
As shown in Fig. 9, positive RFI values for both zonal wavenumbers 1 and 2 are found over the northern mid- to high latitudes in EXP_CTL, indicating that the basic-state flow is favorable for the upward propagation of planetary waves (Fig. 9a, c). In EXP_NHE, however, the RFI is generally reduced over the same region, especially in the upper troposphere and lower stratosphere. These negative RFI anomalies suggest that the strengthened background westerlies in the polar stratosphere make the environment less conducive to the vertical propagation of Rossby waves (Fig. 9b, d). Similar behavior is found for both wavenumber-1 and wavenumber-2 components, although the wavenumber-1 signal appears more spatially coherent. Therefore, the reduction of RFI provides a dynamical explanation for the weakened upward EP-flux branch seen in Fig. 8b.
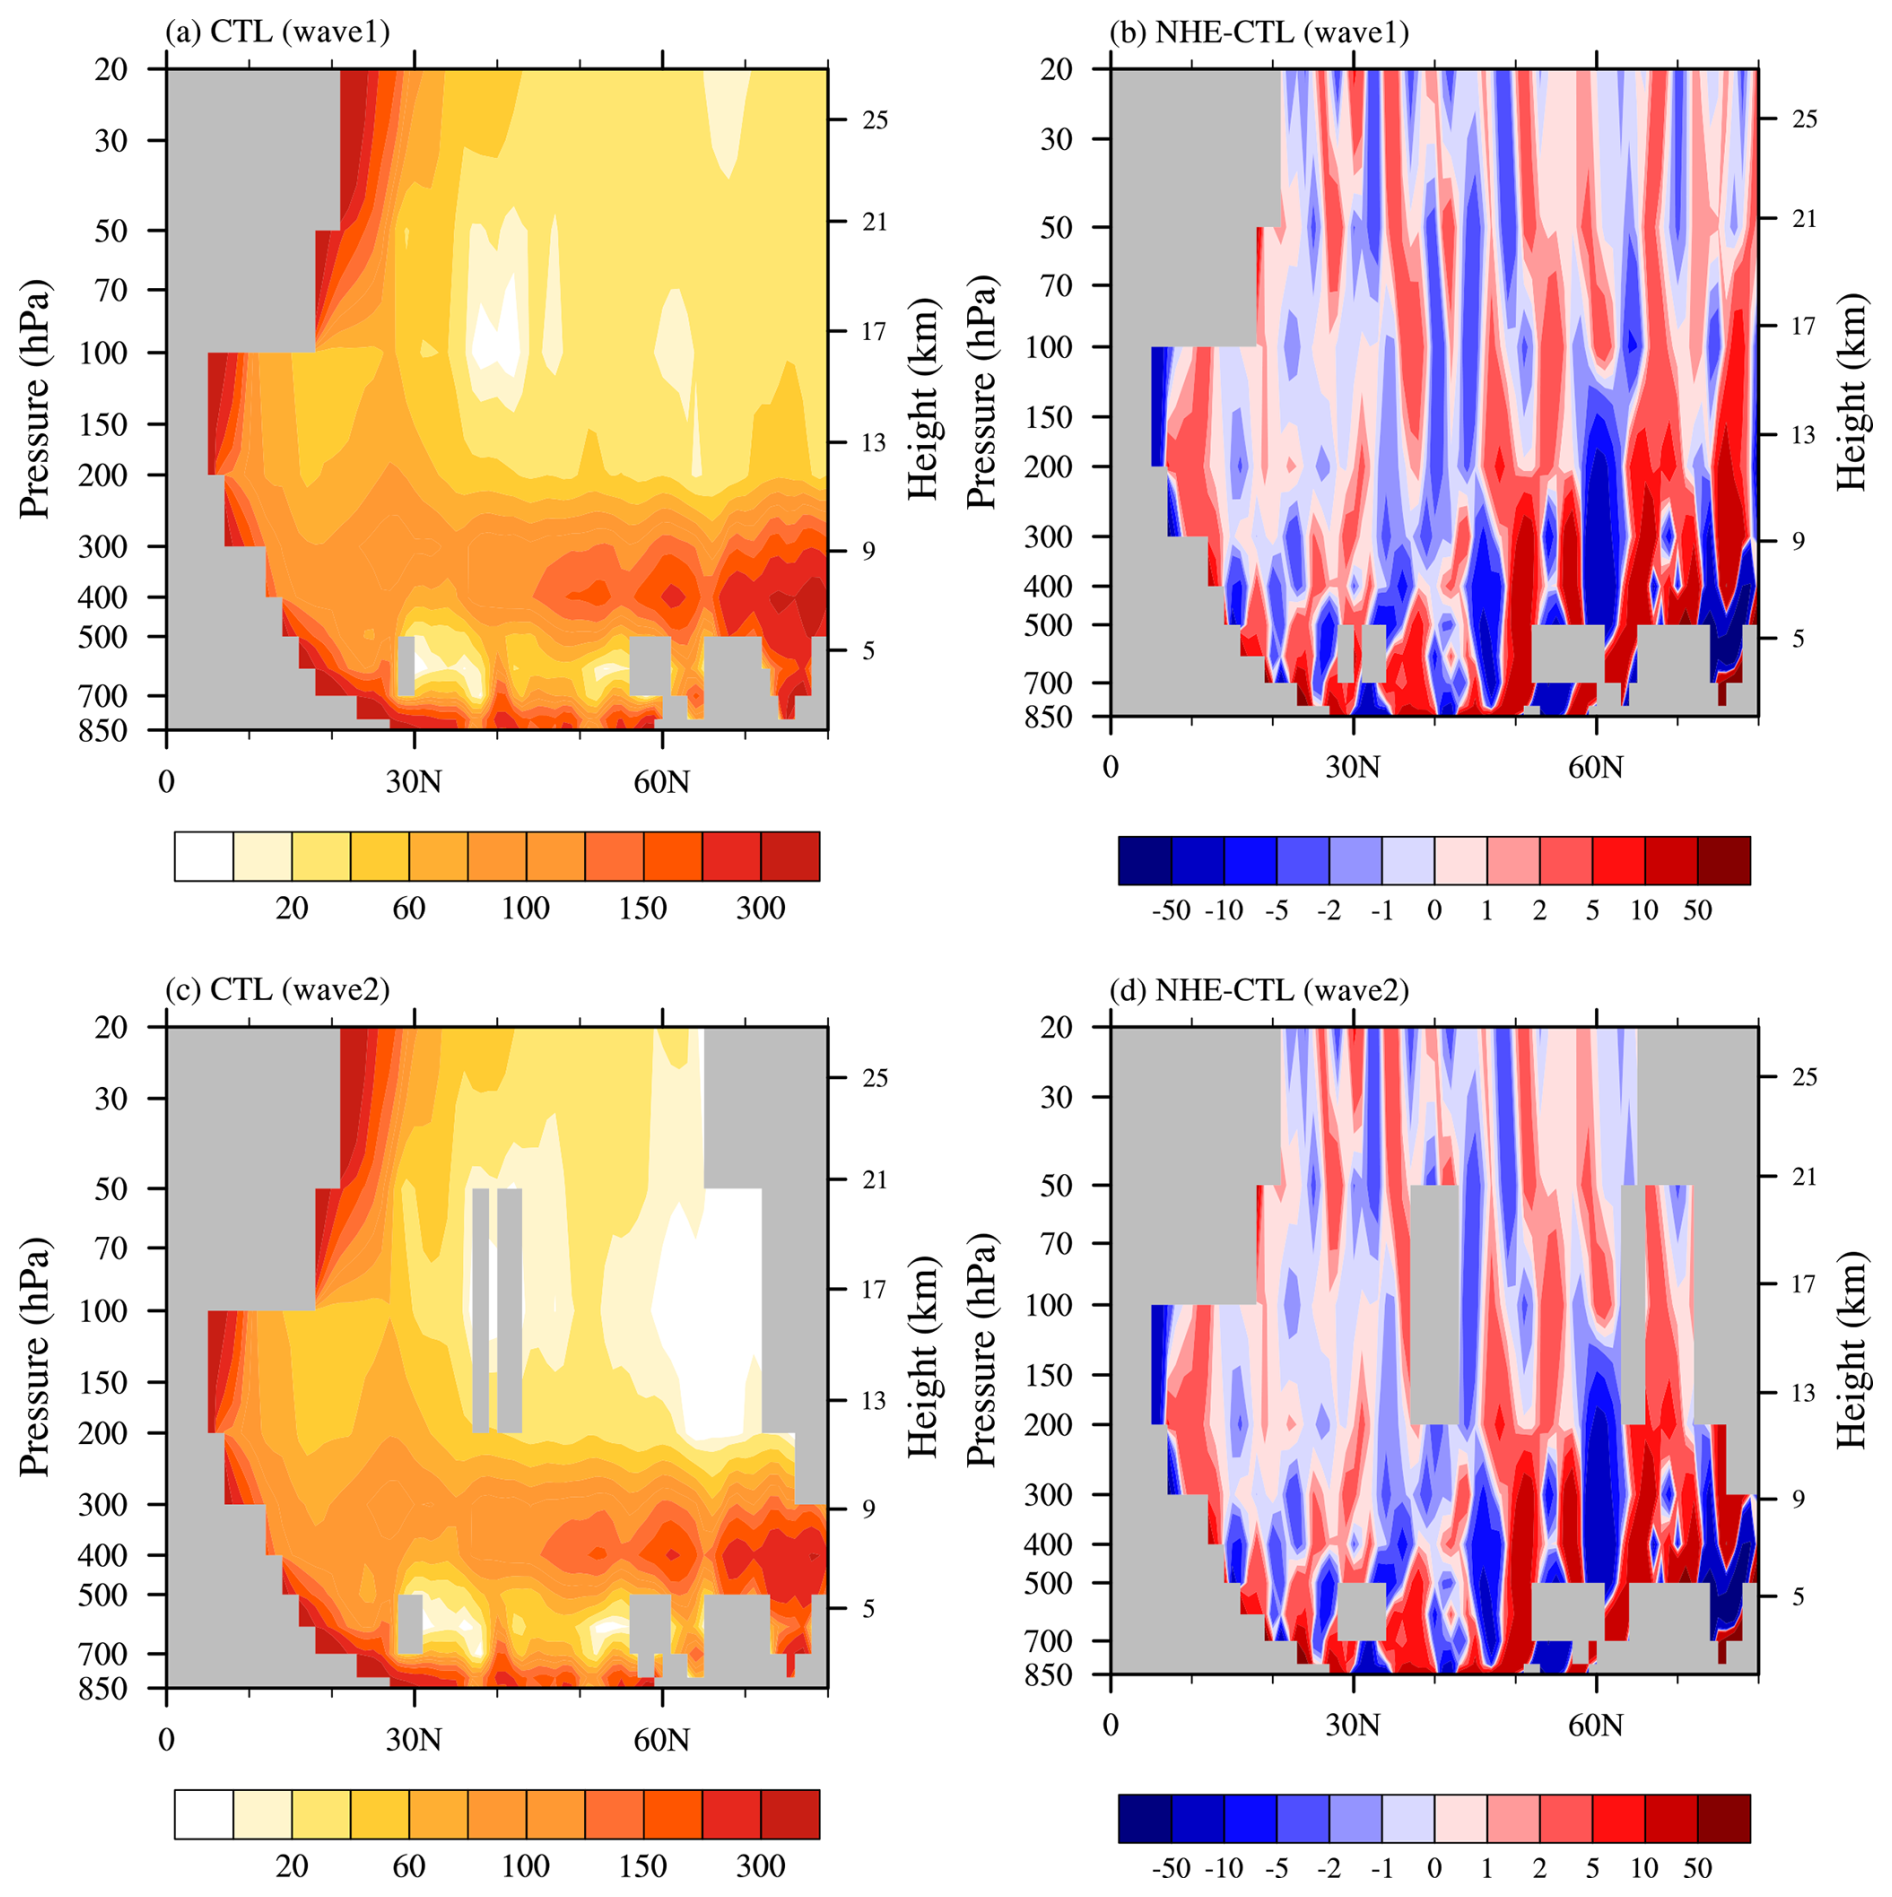
Figure 9Refractive index for the (a) wavenumber-1 and (c) wavenumber-2 resolved waves averaged over the period of 10 December 2023 to 10 January 2024 in the EXP_CTL experiment. (b) The difference between the refractive indices of wavenumber 1 in EXP_NHE and EXP_CTL (EXP_NHE minus EXP_CTL). (d) As in (b), but for wavenumber 2.
Physically, the revised OGWD scheme weakens the parameterized drag in the northern polar stratosphere, which strengthens the local westerlies. Stronger background westerlies narrow the range of planetary-wave numbers that can propagate vertically into the stratosphere. Consequently, the upward propagation of resolved Rossby waves is suppressed, and less resolved wave forcing reaches the polar stratosphere. This effect acts together with the weakened parameterized OGWD to reduce the easterly wind bias in the polar stratosphere. At the same time, the associated redistribution of resolved wave forcing favors a weakening of the polar-tropospheric westerlies, thereby contributing to the improvement of the large-scale circulation over the northern high latitudes.
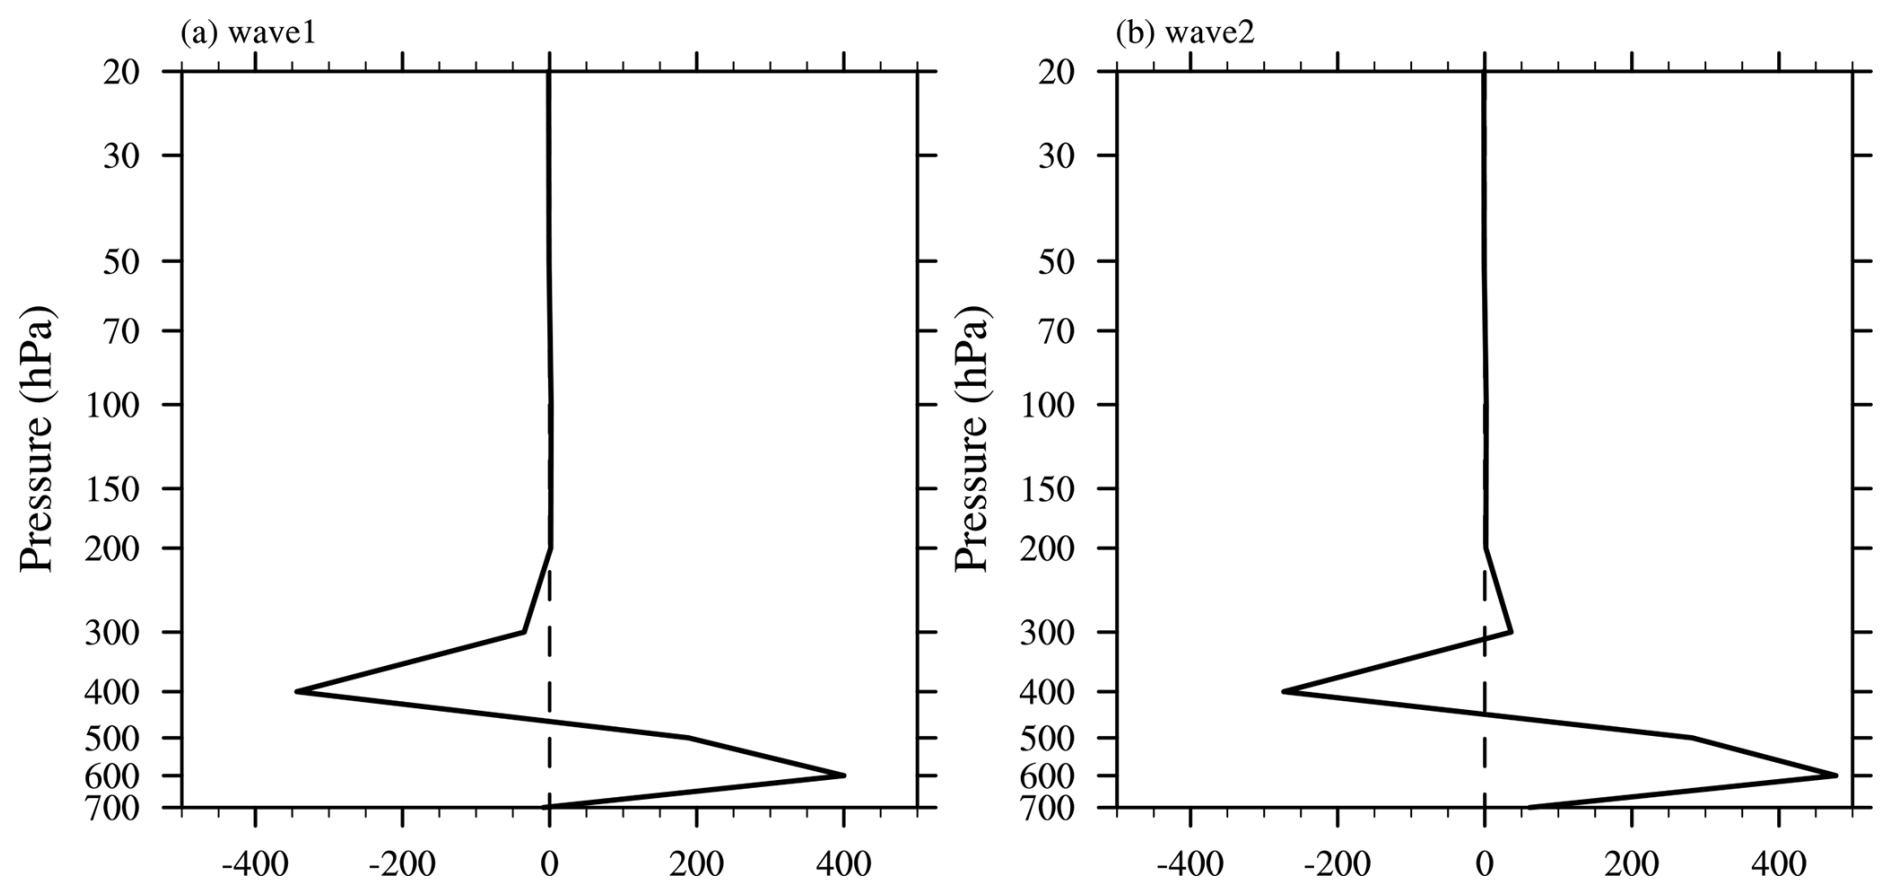
Figure 10(a) The difference between the refractive indices of wavenumber 1 in EXP_NHE and EXP_CTL (EXP_NHE minus EXP_CTL), averaged over 50–80° N. (b) As in (a), but for wavenumber 2.
To provide a more robust diagnosis of the bulk propagation conditions, the zonal-mean refractive-index diagnostic averaged over 50–80° N is further presented in Fig. 10. The averaged RFI anomalies are positive mainly below about 500 hPa, whereas negative anomalies dominate above 500 hPa for both wavenumber 1 and wavenumber 2. This vertical contrast is consistent with the EP-flux response in Fig. 8b. The lower-tropospheric environment tends to favor the initial upward propagation of resolved Rossby waves, while the upper-tropospheric and lower-stratospheric background state becomes less favorable for their continued propagation into the stratosphere.
The latest China Meteorological Administration Global Forecast System (CMA-GFS) v4.0 model has been upgraded to a higher resolution of 0.125° in 2023. However, this high-resolution global model still uses the parameterization scheme of orographic gravity wave drag (OGWD) developed by Kim and Arakawa (1995; KA95) which is based on hydrostatic orographic gravity wave (OGW) theory. In this study, the KA95 OGWD scheme is revised by taking into account the nonhydrostatic effect (NHE) on the surface wave momentum flux (WMF) of OGWs, according to the nonhydrostatic OGW theory derived in our earlier study of Xu et al. (2021). The performance of the revised OGWD scheme is then evaluated for the medium-range forecast of the CMA-GFSv4.0 model. Two sets of numerical experiments (i.e., EXP_CTL and EXP_NHE) are conducted by using the original KA95 scheme and the revised NHE scheme, respectively. In each numerical experiment, there are in total 31 forecasts of 10 d forecasts. In each numerical experiment, there are in total 31 independent 10 d forecasts which are initiated at 00:00 UTC on each day of December 2023.
The results show that the revised OGWD scheme can improve the medium-range forecast of large-scale circulation in the Northern Hemisphere (NH), especially in the high latitudes. The easterly biases of zonal-mean zonal wind in the NH stratosphere are reduced, with both the magnitude and location of the polar night jet being better captured. The underestimation of the East Asia subtropical jet (EASJ) is also alleviated. In contrast, the revised OGWD scheme shows little influence on the stratospheric circulation in the Southern Hemisphere (SH). This is because, in boreal winter (i.e., austral summer), there is hardly OGWD in the SH stratosphere owing to the effect of critical-level absorption, leading to comparatively smaller circulation responses. Therefore, the quantitative evaluation of forecast skill is mainly performed for the NH, where the impact of the revised OGWD scheme is physically more pronounced and statistically more robust.
Quantitative evaluation is performed for the medium-range forecast skills in the NH, taking the ERA5 reanalysis dataset as reference. Both experiments showed lower geopotential height (GPH) at 500 hPa than ERA5 reanalysis, with the mean bias (MB) and root mean square error (RMSE) increasing with forecast lead time. EXP_NHE initially has greater MB and RMSE than EXP_CTL until the 6th forecast day, but these metrics decrease more rapidly afterwards, resulting in an 11.59 % reduction in MB and a 5.06 % reduction in RMSE by day 10. Over the total 10 forecast days, the MB and RMSE of the GPH 500 in the NH are reduced by 2.6 % and 0.52 %, respectively, indicating improved simulation of large-scale circulation in the NH. The improvement is more noticeable in the high latitudes north of about 60° N, where the MB and RMSE of GPH 500 are decreased by 31.18 % and 15.93 % at the 10th forecast day. Similar results are found for the sea level pressure (SLP) in the NH, the MB and RMSE of which are reduced by 34.29 % and 8.33 %, respectively, by day 10 in EXP_NHE.
The dynamics responsible for the improvement of large-scale wind circulation are examined. The NHEs act to decrease the surface WMF of OGWs, which leads to a general weakening of the parameterized OGWD in the midlatitudes and high latitudes of the NH. This weakening of OGWD directly increases the zonal winds in the mid-latitude troposphere and polar stratosphere, reducing the easterly biases. The enhanced zonal wind in the polar stratosphere acts to narrow the range of large-scale Rossby wave numbers that can propagate into the stratosphere by reducing the refractive index of Rossby waves. The suppressed upward propagation of Rossby waves leads to greater convergence of Eliassen-Palm (EP) flux (i.e., resolved wave forcing) in the NH polar troposphere, which decelerates the zonal winds and thus alleviates the westerly biases there.
To sum up, this study demonstrates that incorporating the NHE into the OGWD parameterization scheme can help improve the simulation of large-scale atmospheric circulation in high-resolution global NWP models, which is thus important for accurate weather forecasts and/or climate simulations. However, there are still some limitations in this work. For example, this study pays much attention to the medium-range forecast of large-scale circulation in winter of NH. To further validate its effectiveness and robustness, it is necessary to conduct more comprehensive evaluations of the nonhydrostatic OGWD scheme in various numerical models focusing on different weather and climate systems. Additionally, this work only takes into account the effects of NHE on the OGWD. Other factors such as the vertical wind shear and moisture could also greatly affect the OGWD (e.g., Xu et al., 2019, 2020; Wang et al., 2025; Zhang et al., 2025). While Xu et al. (2021) explored the nonhydrostatic OGWs generated in a constant flow, it remains unclear how the vertical wind shear and moisture affects the behavior of nonhydrostatic OGWs which needs further study.
The China Meteorological Administration Global Forecast System (CMA-GFS) model is archived on Zenodo under https://doi.org/10.5281/zenodo.18476721 (Zhang, 2026a). The CMA-GFS outputs and the ERA5 reanalysis data used for the comparison, along with the codes for orographic gravity wave scheme are uploaded to https://doi.org/10.5281/zenodo.18529537 (Zhang, 2026b).
RRZ was responsible for formal analysis, writing the original draft and visualization. ZZA carried out data analyses. XX developed the code and conducted the analysis. HLX and QYC provided the resources and data curation.
The contact author has declared that none of the authors has any competing interests.
Publisher's note: Copernicus Publications remains neutral with regard to jurisdictional claims made in the text, published maps, institutional affiliations, or any other geographical representation in this paper. The authors bear the ultimate responsibility for providing appropriate place names. Views expressed in the text are those of the authors and do not necessarily reflect the views of the publisher.
The authors would like to express their sincere thanks to the anonymous referees.
This work is mainly supported by the National Natural Science Foundation of China (grants no. U2342226, 42275163), the Joint Research Project for Meteorological Capacity Improvement (grant no. 22NLTSZ006), and Jiangsu Meteorological Observatory (grant no. KQ202502).
This paper was edited by Juan Antonio Añel and reviewed by two anonymous referees.
Alexander, M. J., Geller, M., McLandress, C., Polavarapu, S., Preusse, P., Sassi, F., Sato, K., Eckermann, S., Ern, M., Hertzog, A., Kawatani, Y., Pulido, M., Shaw, T. A., Sigmond, M., Vincent, R., and Watanabe, S.: Recent developments in gravity-wave effects in climate models and the global distribution of gravity-wave momentum flux from observations and models, Q. J. Roy. Meteor. Soc., 136, 1103–1124, https://doi.org/10.1002/qj.637, 2010.
Alpert, J.: Sub-grid scale mountain blocking at NCEP, 20th Conference on Weather Analysis and Forecasting/16th Conference on Numerical Weather Prediction, https://ams.confex.com/ams/84Annual/techprogram/program_185.htm (last access: 12 May 2026), 2004.
Beljaars, A. C. M., Brown, A. R., and Wood, N.: A new parametrization of turbulent orographic form drag, Q. J. Roy. Meteor. Soc., 130, 1327–1347, https://doi.org/10.1256/qj.03.73, 2004.
Booker, J. R. and Bretherton, F. P.: The critical layer for internal gravity waves in a shear flow, J. Fluid Mech., 27, 513–539, https://doi.org/10.1017/S0022112067000515, 1967.
Charney, J. G. and Drazin, P. G.: Propagation of planetary-scale disturbances from the lower into the upper atmosphere, J. Geophys. Res., 66, 83–109, https://doi.org/10.1029/JZ066i001p00083, 1961.
Chen, J., Ma, Z., Li, Z., Shen, X., Su, Y., Chen, Q., and Liu, Y.: Vertical diffusion and cloud scheme coupling to the Charney-Phillips vertical grid in GRAPES global forecast system, Q. J. Roy. Meteor. Soc., 146, 2191–2204, https://doi.org/10.1002/qj.3787, 2020.
Chen, Q., Shen, X., Sun, J., and Liu, K.: Momentum budget diagnosis and the parameterization of subgrid-scale orographic drag in global GRAPES, J. Meteorol. Res., 30, 771–788, https://doi.org/10.1007/s13351-016-6033-y, 2016.
Chen, P. and Robinson, W. A.: Propagation of Planetary Waves between the Troposphere and Stratosphere, J. Atmos. Sci., 49, 2533–2545, https://doi.org/10.1175/1520-0469(1992)049<2533:POPWBT>2.0.CO;2, 1992.
Choi, H. J. and Hong, S. Y.: An updated subgrid orographic parameterization for global atmospheric forecast models, J. Geophys. Res.-Atmos., 120, 12445–12457, https://doi.org/10.1002/2015JD024230, 2015.
Cohen, N. Y., Gerber, E. P., and Buhler, O.: Compensation between resolved and unresolved wave driving in the stratosphere: Implications for downward control, J. Atmos. Sci., 70, 3780–3798, https://doi.org/10.1175/JAS-D-12-0346.1, 2013.
Dai, Y., Zeng, X., Robert, E. D., Baker, L., Bonan, G. B., Bosilovich, M. G., Denning A. S., Dirmeyer, P. A., Houser, P. R., Niu, G., Oleson, K. W., Schlosser, C. A., and Yang, Z.: The Common Land Model, B. Am. Meteorol. Soc., 84, 1013–1024, https://doi.org/10.1175/BAMS-84-8-1013, 2003.
Edmon, H. J., Hoskins, B. J., and McIntyre, M. E.: Eliassen-Palm Cross Sections for the Troposphere, J. Atmos. Sci., 37, 2600–2616, https://doi.org/10.1175/1520-0469(1980)037<2600:EPCSFT>2.0.CO;2, 1980.
Fritts, D. C. and Alexander, M. J.: Gravity wave dynamics and effects in the middle atmosphere, Rev. Geophys., 41, https://doi.org/10.1029/2001RG000106, 2003.
Han, J. and Pan, H. L.: Revision of Convection and Vertical Diffusion Schemes in the NCEP Global Forecast System, Weather Forecast., 26, 520–533, https://doi.org/10.1175/WAF-D-10-05038.1, 2011.
Hersbach, H., Bell, B., Berrisford, P., et al.: The ERA5 global reanalysis, Q. J. Roy. Meteor. Soc., 146, 1999–2049, https://doi.org/10.1002/qj.3803, 2020.
Hong, S. Y. and Pan, H. L.: Nonlocal Boundary Layer Vertical Diffusion in a Medium-Range Forecast Model, Mon. Weather Rev., 124, 2322–2339, https://doi.org/10.1175/1520-0493(1996)124<2322:NBLVDI>2.0.CO;2, 1996.
Hu, D., Guo, Y., and Guan, Z.: Recent Weakening in the Stratospheric Planetary Wave Intensity in Early Winter, Geophys. Res. Lett., 46, 3953–3962, https://doi.org/10.1029/2019GL082113, 2019.
Kim, Y. J.: Balance of drag between the middle and lower atmospheres in a global atmospheric forecast model, J. Geophys. Res.-Atmos., 112, https://doi.org/10.1029/2007JD008647, 2007.
Kim, Y. J. and Arakawa, A.: Improvement of Orographic Gravity Wave Parameterization Using a Mesoscale Gravity Wave Model, J. Atmos. Sci., 52, 1875–1902, https://doi.org/10.1175/1520-0469(1995)052<1875:IOOGWP>2.0.CO;2, 1995.
Kim, Y. J. and Doyle, J. D.: Extension of an orographic-drag parametrization scheme to incorporate orographic anisotropy and flow blocking, Q. J. Roy. Meteor. Soc., 131, 1893–1921, https://doi.org/10.1256/qj.04.160, 2005.
Kim, Y. J., Eckermann, S., and Chun, H. Y.: An overview of the past, present and future of gravity-wave drag parametrization for numerical climate and weather prediction models – Survey article, Atmos. Ocean, 41, 65–98, https://doi.org/10.3137/ao.410105, 2003.
Klemp, J. B. and Durran, D. R.: An Upper Boundary Condition Permitting Internal Gravity Wave Radiation in Numerical Mesoscale Models, Mon. Weather Rev., 111, 430–444, https://doi.org/10.1175/1520-0493(1983)111<0430:AUBCPI>2.0.CO;2, 1983.
Kruse, C. G., Smith, R. B., and Eckermann, S. D.: The Midlatitude Lower-Stratospheric Mountain Wave “Valve Layer”, J. Atmos. Sci., 73, 5081–5100, https://doi.org/10.1175/JAS-D-16-0173.1, 2016.
Li, M., Xu, X., Teixeira, M. A. C., Xue, M., Xue, H., Zhu, K., and Huang, H.: Improved Orographic Gravity Wave Drag Parameterization Accounting for the Nonhydrostatic Effect in the Weather Research and Forecasting Model: Tests for Short-Range Forecast of Northeast China Cold Vortices, Mon. Weather Rev., 152, 2623–2637, https://doi.org/10.1175/MWR-D-24-0097.1, 2024.
Li, R., Xu, X., Xu, X., Shepherd, T. G., and Wang, Y.: Importance of orographic gravity waves over the Tibetan Plateau on the spring rainfall in East Asia, Sci. China Earth Sci., 66, 2594–2602, https://doi.org/10.1007/s11430-023-1204-6, 2023.
Lindzen, R. S.: Turbulence and stress owing to gravity wave and tidal breakdown, J. Geophys. Res.-Oceans, 86, 9707–9714, https://doi.org/10.1029/JC086iC10p09707, 1981.
Liu, K., Chen, Q., and Sun, J.: Modification of cumulus convection and planetary boundary layer schemes in the GRAPES global model, J. Meteorol. Res., 29, 806–822, https://doi.org/10.1007/s13351-015-5043-5, 2015.
Lott, F. and Miller, M. J.: A new subgrid-scale orographic drag parametrization: Its formulation and testing, Q. J. Roy. Meteor. Soc., 123, 101–127, https://doi.org/10.1002/qj.49712353704, 1997.
Lu, Y., Wu, T., Xu, X., Zhang, L., and Chu, M.: Improved Simulation of the Antarctic Stratospheric Final Warming by Modifying the Orographic Gravity Wave Parameterization in the Beijing Climate Center Atmospheric General Circulation Model, Atmosphere, 11, 576, https://doi.org/10.3390/atmos11060576, 2020.
Lu, Y., Xu, X., Wang, L., Liu, Y., Wu, T., Jie, W., and Sun, J.: Machine Learning Emulation of Subgrid-Scale Orographic Gravity Wave Drag in a General Circulation Model with Middle Atmosphere Extension, J. Adv. Model. Earth Sy., 16, e2023MS003611, https://doi.org/10.1029/2023MS003611, 2024.
Ma, Z., Liu, Q., Zhao, C., Shen, X., Wang, Y., Jiang, J. H., Zhe, L., and Yung, Y.: Application and Evaluation of an Explicit Prognostic Cloud-Cover Scheme in GRAPES Global Forecast System, J. Adv. Model. Earth Sy., 10, 652—667, https://doi.org/10.1002/2017MS001234, 2018.
McFarlane, N. A.: The Effect of Orographically Excited Gravity Wave Drag on the General Circulation of the Lower Stratosphere and Troposphere, J. Atmos. Sci., 44, 1775–1800, https://doi.org/10.1175/1520-0469(1987)044<1775:TEOOEG>2.0.CO;2, 1987.
McLandress, C., Shepherd, T. G., Polavarapu, S., and Beagley, S. R.: Is Missing Orographic Gravity Wave Drag near 60° S the Cause of the Stratospheric Zonal Wind Biases in Chemistry-Climate Models? J. Atmos. Sci., 69, 802–818, https://doi.org/10.1175/JAS-D-11-0159.1, 2012.
Miller, M. J. and Palmer, T. N.: Orographic gravity wave drag: Its parameterization and influence in general circulation and numerical weather prediction models, Presented at the ECWMF Workshop on Observation, Theory and Modelling of Orographic Effects, 1, 283–333, 1986.
Morcrette, J. J., Barker, H. W. J., Cole, N. S., Iacono, M. J., and Pincus, R.: Impact of a New Radiation Package, McRad, in the ECMWF Integrated Forecasting System, Mon. Weather Rev., 136, 4773–4798, https://doi.org/10.1175/2008MWR2363.1, 2008.
Palmer, T. N., Shutts, G. J., and Swinbank, R.: Alleviation of a systematic westerly bias in general circulation and numerical weather prediction models through an orographic gravity wave drag parametrization, Q. J. Roy. Meteor. Soc., 112, 1001–1039, https://doi.org/10.1002/qj.49711247406, 1986.
Scinocca, J. and McFarlane, N.: The parametrization of drag induced by stratified flow over anisotropic orography, Q. J. Roy. Meteor. Soc., 126, 2353–2393, https://doi.org/10.1002/qj.49712656802, 2000.
Shen, X., Su, Y., Hu, J., Wang, J., Sun, J., Xue, J., Han, W., Zhang, H., Lu, H., Zhang, H., Chen, Q., Liu, Y., Liu, Q., Ma, Z., Jin, Z., Li, X., Liu, K., Zhao, B., Zhou, B., Gong, J., Chen, D., and Wang, J.: Development and Operation Transformation of GRAPES Global Middle-range Forecast System, Journal of Applied Meteorological Science, 28, 1–10, https://doi.org/10.11898/1001-7313.20170101, 2017.
Shen, X., Wang, J., Li, Z., Chen, D., and Gong, J.: Research and operational development of numerical weather prediction in China, J. Meteorol. Res., 34, 675–698, https://doi.org/10.1007/s13351-020-9847-6, 2020.
Shen, X. S., Su, Y., Zhang, H. L., and Hu, J. L.: New version of the CMA-GFS dynamical core based on the predictor-corrector time integration scheme, J. Meteorol. Res., 37, 273–285, https://doi.org/10.1007/s13351-023-3002-0, 2023.
Shutts, G.: Gravity-wave drag parametrization over complex terrain: The effect of critical-level absorption in directional wind-shear, Q. J. Roy. Meteor. Soc., 121, 1005–1021, https://doi.org/10.1002/qj.49712152504, 1995.
Sigmond, M. and Shepherd, T. G.: Compensation between resolved wave driving and parameterized orographic gravity wave driving of the Brewer-Dobson circulation and its response to climate change, J. Climate, 27, 5601–5610, https://doi.org/10.1175/JCLI-D-13-00644.1, 2014.
Smith, R. B.: The Influence of Mountains on the Atmosphere, in: Advances in Geophysics, edited by: Saltzman, B., Vol. 21, 87–230, Elsevier, https://doi.org/10.1016/S0065-2687(08)60262-9, 1979.
Teixeira, M. A. C.: The physics of orographic gravity wave drag, Front. Phys., 2, https://doi.org/10.3389/fphy.2014.00043, 2014.
van Niekerk, A., Vosper, S. B., and Teixeira, M. A. C.: Accounting for the three-dimensional nature of mountain waves: Parametrising partial critical-level filtering, Q. J. Roy. Meteor. Soc., 149, 515–536, https://doi.org/10.1002/qj.4421, 2023.
Wang, Y., Xu, X., Yang, X., Wei, P., Li, C., Wu, J., and Ren, K.: Moist Orographic Gravity Wave Drag Parameterization Reduces Wet Bias of Summer Rainfall Over Tibetan Plateau, npj Climate and Atmospheric Science, 8, 367, https://doi.org/10.1038/s41612-025-01245-z, 2025.
Wei, P., Xu, X., Xue, M., Li, J., Zhao, K., and Zhang, Q.: Complex Terrain Causes Global Model Prediction Biases of 21.7 Zhengzhou Extreme Precipitation, Sci. Bull., https://doi.org/10.1016/j.scib.2025.09.015, 2025.
Xu, X., Wang, Y., and Xue, M.: Momentum Flux and Flux Divergence of Gravity Waves in Directional Shear Flows over Three-Dimensional Mountains, J. Atmos. Sci., 69, 3733–3744, https://doi.org/10.1175/JAS-D-12-044.1, 2012.
Xu, X., Xue, M., Teixeira, M. A. C., Tang, J., and Wang, Y.: Parameterization of Directional Absorption of Orographic Gravity Waves and Its Impact on the Atmospheric General Circulation Simulated by the Weather Research and Forecasting Model, J. Atmos. Sci., 76, 3435–3453, https://doi.org/10.1175/JAS-D-18-0365.1, 2019.
Xu, X., Teixeira, M. A. C., Xue, M., Lu, Y., and Tang, J.: Impacts of wind profile shear and curvature on the parameterized orographic gravity wave stress in the Weather Research and Forecasting model, Q. J. Roy. Meteor. Soc., 146, 3086–3100, https://doi.org/10.1002/qj.3828, 2020.
Xu, X., Li, R., Teixeira, M. A. C., and Lu, Y.: On the Momentum Flux of Vertically Propagating Orographic Gravity Waves Excited in Nonhydrostatic Flow over Three-Dimensional Orography, J. Atmos. Sci., 78, 1807–1822, https://doi.org/10.1175/JAS-D-20-0370.1, 2021.
Xu, X., Zhou, X., Yang, K., Lu, Y., Zhang, R., Yang, B., Tang, J., and Wang, Y.: Reducing Winter Precipitation Biases Over the Western Tibetan Plateau in the Model for Prediction Across Scales (MPAS) With a Revised Parameterization of Orographic Gravity Wave Drag, J. Geophys. Res.-Atmos., 128, e2023JD039123, https://doi.org/10.1029/2023JD039123, 2023.
Xu, X., Zhang, R., Teixeira, M. A. C., van Niekerk, A., Xue, M., Lu, Y., Xue, H., Li, R., and Wang, Y.: A Parameterization Scheme Accounting for Nonhydrostatic Effects on the Momentum Flux of Vertically Propagating Orographic Gravity Waves: Formulas and Preliminary Tests in the Model for Prediction Across Scales (MPAS), J. Atmos. Sci., 81, 805–817, https://doi.org/10.1175/JAS-D-23-0020.1, 2024.
Xue, H., Shen, X., and Su, Y.: Parameterization of Turbulent Orographic Form Drag and Implementation in GRAPES, J. Appl. Meteorol. Sci., 22, 169–181, 2011.
Zängl, G.: Orographic Gravity Waves Close to the Nonhydrostatic Limit of Vertical Propagation, J. Atmos. Sci., 60, 2045–2063, https://doi.org/10.1175/1520-0469(2003)060<2045:OGWCTT>2.0.CO;2, 2003.
Zhang, R.: CMA-GFS Model, Zenodo [code], https://doi.org/10.5281/zenodo.18476721, 2026a.
Zhang, R.: CMA-GFS outputs, Zenodo [data set], https://doi.org/10.5281/zenodo.18529537, 2026b.
Zhang, R., Xu, X., and Wang, Y.: Impacts of Subgrid Orographic Drag on the Summer Monsoon Circulation and Precipitation in East Asia, J. Geophys. Res.-Atmos., 125, e2019JD032337, https://doi.org/10.1029/2019JD032337, 2020.
Zhang, R., Lu, Y., Xu, X., and Wang, Y.: Impacts of wind profile shear and curvature on the parameterized orographic gravity wave stress in a middle atmosphere resolving general circulation model, J. Adv. Model. Earth Sy., 17, e2024MS004232, https://doi.org/10.1029/2024MS004232, 2025.
Zhong, S. and Chen, Z.: Improved wind and precipitation forecasts over South China using a modified orographic drag parameterization scheme, J. Meteorol. Res., 29, 132–143, https://doi.org/10.1007/s13351-014-4934-1, 2015.
- Abstract
- Introduction
- OGWD parameterization scheme and numerical experiments
- Evaluation of the medium-range forecast
- Physical interpretation
- Summary and discussions
- Code and data availability
- Author contributions
- Competing interests
- Disclaimer
- Acknowledgements
- Financial support
- Review statement
- References