the Creative Commons Attribution 4.0 License.
the Creative Commons Attribution 4.0 License.
 | 08 May 2026
Stratospheric aerosol forcing for CMIP7 – Part 1: optical properties for pre-industrial, historical, and scenario simulations
Thomas J. Aubry
Matthew Toohey
Sujan Khanal
Man Mei Chim
Magali Verkerk
Ben Johnson
Anja Schmidt
Mahesh Kovilakam
Michael Sigl
Zebedee Nicholls
Larry Thomason
Vaishali Naik
Landon Rieger
Dominik Stiller
Elisa Ziegler
Paul Durack
Isabel H. Smith
Stratospheric aerosols, most of which originate from explosive volcanic sulfur emissions into the stratosphere, are a key natural driver of climate variability. They are thus a forcing provided by the Coupled Model Intercomparison Project (CMIP) Climate Forcings Task Team to climate modelling groups participating in phase 7 of CMIP. For the historical period, we provide two datasets covering 1750–2023: (i) a volcanic upper tropospheric-stratospheric sulfur emission dataset, documented in a companion paper; and (ii) a stratospheric sulfate aerosol optical property dataset, documented in this paper. For the satellite era (from 1979 onwards), stratospheric aerosol optical properties are derived from the Global Space-based Stratospheric Aerosol Climatology (GloSSAC) dataset. For the pre-satellite era (1750–1978), optical properties are derived from our volcanic SO2 emission dataset using a new version of the reduced-complexity volcanic aerosol model Easy Volcanic Aerosol (Height) (EVA_H v2). A background, non-volcanic stratospheric aerosol climatology is derived from the 1998–2001 period with a trend over 1850–1978 accounting for increasing anthropogenic aerosols. A monthly stratospheric aerosol climatology is derived from the 1850–2021 average for both pre-industrial and scenario (future) simulations, with a 9-year ramp over 2022–2030 for scenario simulations to ensure a smooth transition from the historical period. CMIP7 simulations should use version 2.2.1 of our pre-industrial and historical datasets, and version 2.2.2 of our scenario dataset. Our methodology to produce historical aerosol optical properties significantly differs from CMIP6 for the pre-satellite era, and the resulting forcings in turn largely differ. In particular, the CMIP6 dataset was mostly based on the sparse and uncertain pyrheliometer record, which resulted in strongly underrepresented emissions from small-to-moderate magnitude eruptions. The resulting bias is addressed in CMIP7, which is entirely emission-derived in the pre-satellite era and uses more recent ice-core-based volcanic sulfur emission inventories than CMIP6. Our approach results in an overall larger volcanic aerosol forcing for CMIP7, with the 1850–2014 mean mid-visible global mean stratospheric aerosol optical depth (SAOD) in CMIP7 (0.0138) being 29 % higher than in CMIP6 (0.0107). The pre-industrial mean of the same variable is 26 % higher in CMIP7 (0.0135, derived from the historical 1850–2021) than CMIP6 (0.0107, derived from the historical 1850–2014 mean). Using a reduced-complexity climate model, we simulate a global mean surface temperature that is 0.07 °C colder for 1850–1900 when using the CMIP7 dataset instead of CMIP6, whereas 2000–2014 is 0.03 °C warmer in CMIP7. Our dataset also exhibits lower forcing for 1960–1980, resulting in temperatures 0.06 °C warmer when averaged over 1960–1990, a period for which CMIP6 climate models exhibit a cold bias. Given the large uncertainties characterizing the dataset, in particular for the pre-satellite era, we advise against treating the CMIP7 or CMIP6 dataset as uniquely superior for any specific year and highlight the need for further evaluation. We conclude the study by discussing sources of uncertainty for the dataset, future research avenues to improve it, as well as requirements to operationalize the production of the dataset, i.e. extend it and update it on an annual basis instead of every 5–7 years following CMIP cycles.
- Article
(5081 KB) - Full-text XML
-
Supplement
(314 KB) - BibTeX
- EndNote


1.1 Climate forcings for the CMIP7 Assessment Fast Track
The Assessment Fast Track (AFT) of Phase 7 of the Coupled Model Intercomparison Project (CMIP7) is delivering a set of key climate model experiments across all participating modelling centers, including pre-industrial control simulations, historical (1850–2021) simulations and scenario simulations (2022 to 2100 and beyond) (Dunne et al., 2025). Key to these experiments is the provision of forcing datasets used consistently by all participating models. To this end, a CMIP Climate Forcing Task Team (https://wcrp-cmip.org/cmip7-task-teams/forcings/, last access: 5 May 2026) was formed to provide key forcings, i.e. external drivers of climate change prescribed in climate model simulations. In addition to forcing provision, the documentation of forcing datasets and progress towards operationalization of forcing production (Durack et al., 2025; Naik et al., 2025) are key objectives of the task team. Among the forcings provided, stratospheric aerosol represents one of the most important natural drivers of climate variability (e.g. Santer et al., 2015; Sigl et al., 2015). Sulfate aerosols formed from sulfur gases injected by high-intensity volcanic eruptions are the main contributor to stratospheric aerosols (Kremser et al., 2016). Other contributions include injections by pyrocumulonimbus (pyroCb, e.g. Peterson et al., 2021; Damany-Pearce et al., 2022), aerosols from meteorites (e.g. Schneider et al., 2021), and transport of aerosol or aerosol precursors from the troposphere, some of which originate from anthropogenic emissions (e.g. Hannigan et al., 2022; Brodowsky et al., 2024). Stratospheric aerosols originating from spacecraft have recently been measured in-situ and their contribution to stratospheric aerosol loading is expected to increase in the future (Murphy et al., 2023).
1.2 Overview of the CMIP6 stratospheric aerosol optical property dataset
Unlike in CMIP5 (Taylor et al., 2012), for CMIP6 (Eyring et al., 2016) the then new input datasets for Model Intercomparison Projects (input4MIPs; Durack et al., 2018) initiative was established, and for the first time a consistent dataset suite was provided to all modelling centres, representing a major coordinated undertaking. As part of this effort, a new historical stratospheric aerosol forcing was generated, comprising a set of aerosol properties which were provided customized to bespoke wavelengths for each target model (Luo, 2018; Fig. 1). No peer-reviewed documentation of the full dataset is available to our knowledge, and the following description represents our best understanding of the CMIP6 dataset based on Jörimann et al. (2025) and Thomason et al. (2018) who document the 1960–2015 dataset, the existing brief documentation of the full dataset (Luo, 2017, 2018), and the data provided. For the satellite era (from 1979), aerosol optical properties were derived from the Global Space-based Stratospheric Aerosol Climatology version 1.1 (GloSSAC, Thomason et al., 2018), which provides extinction at two wavelengths (525 and 1020 nm) (Fig. 1a). Before the satellite era, aerosol optical properties were derived from a combination of the following (Fig. 1a):
- i.
For seven large eruptions, they were derived from an ice-core-based volcanic emission inventory (Gao et al., 2008) using the AER2D aerosol model (Arfeuille et al., 2014) (Fig. 1c). The considered eruptions are an eruption in the early 1860s with uncertain attribution, Krakatau (1883), Tarawera (1886), Santa Maria (1902), Katmai (1912), Agung (1963), and Fuego (1974). Some of the simulations, or injection parameters used, might have been rescaled to better match available pyrheliometer measurements (Stothers, 1996).
- ii.
Outside of the periods associated with the above seven eruptions, the CMIP6 documentation states that pyrheliometer data from Stothers (1996) were used to reconstruct “minor” volcanic perturbations if a significant perturbation was detected in these instruments. From Stothers (1996), we understand that over 1881–1960, this approach was used for a total of 97 months distributed within 11 years. To obtain a stratospheric aerosol optical depth (SAOD) at 550 nm, the pyrheliometer optical depth was scaled by an unspecified size dependent conversion factor taking values typically between 1.2–1.5. SAOD at the station(s) location(s) are then used to derive SAOD perturbation over 90–0° S, 0–90° N or 30–90° N (Fig. 1b and d). Based on Luo (2018) and Stothers (1996), we understand that for most of the months where pyrheliometer data was used, only 1–3 stations were available. Although the CMIP6 documentation only mentions “pyrheliometer” or “photometer” data and cites Stothers (1996), this paper only covers 1881–1960. 1850–1881 SAOD perturbations that are not model-derived might have been derived from lunar eclipse measurements (Stothers, 2007). 1961–1978 SAOD perturbations that are not model-derived have likely been derived from the pyrheliometer measurements compiled in Stothers (2001).
- iii.
For any other time period (i.e. pre-1979 and not covered by (i) or (ii)), a climatology derived from the volcanically quiescent 1999–2005 period was imposed, with a linear trend between 1850 and 1978 to represent increasing anthropogenic tropospheric aerosol emissions, some of which is transported into the stratosphere. The climatology was added to volcanic perturbations assessed for large ((i), emission and model derived) and small ((ii), mostly pyrheliometer derived) eruptions.
No matter the source dataset used in CMIP6, the REMAPv1 algorithm (Jörimann et al., 2025) was used to convert available data to full aerosol optical properties (e.g. extinction coefficient, single-scattering albedo, asymmetry factor, or surface area density) at wavelengths requested by each modelling center (for wavelength-dependent variable). The pre-industrial stratospheric aerosol forcing (Eyring et al., 2016), also imposed in scenario simulations (O'Neill et al., 2016), was taken as the average of the historical dataset, i.e. 1850–2014 average.
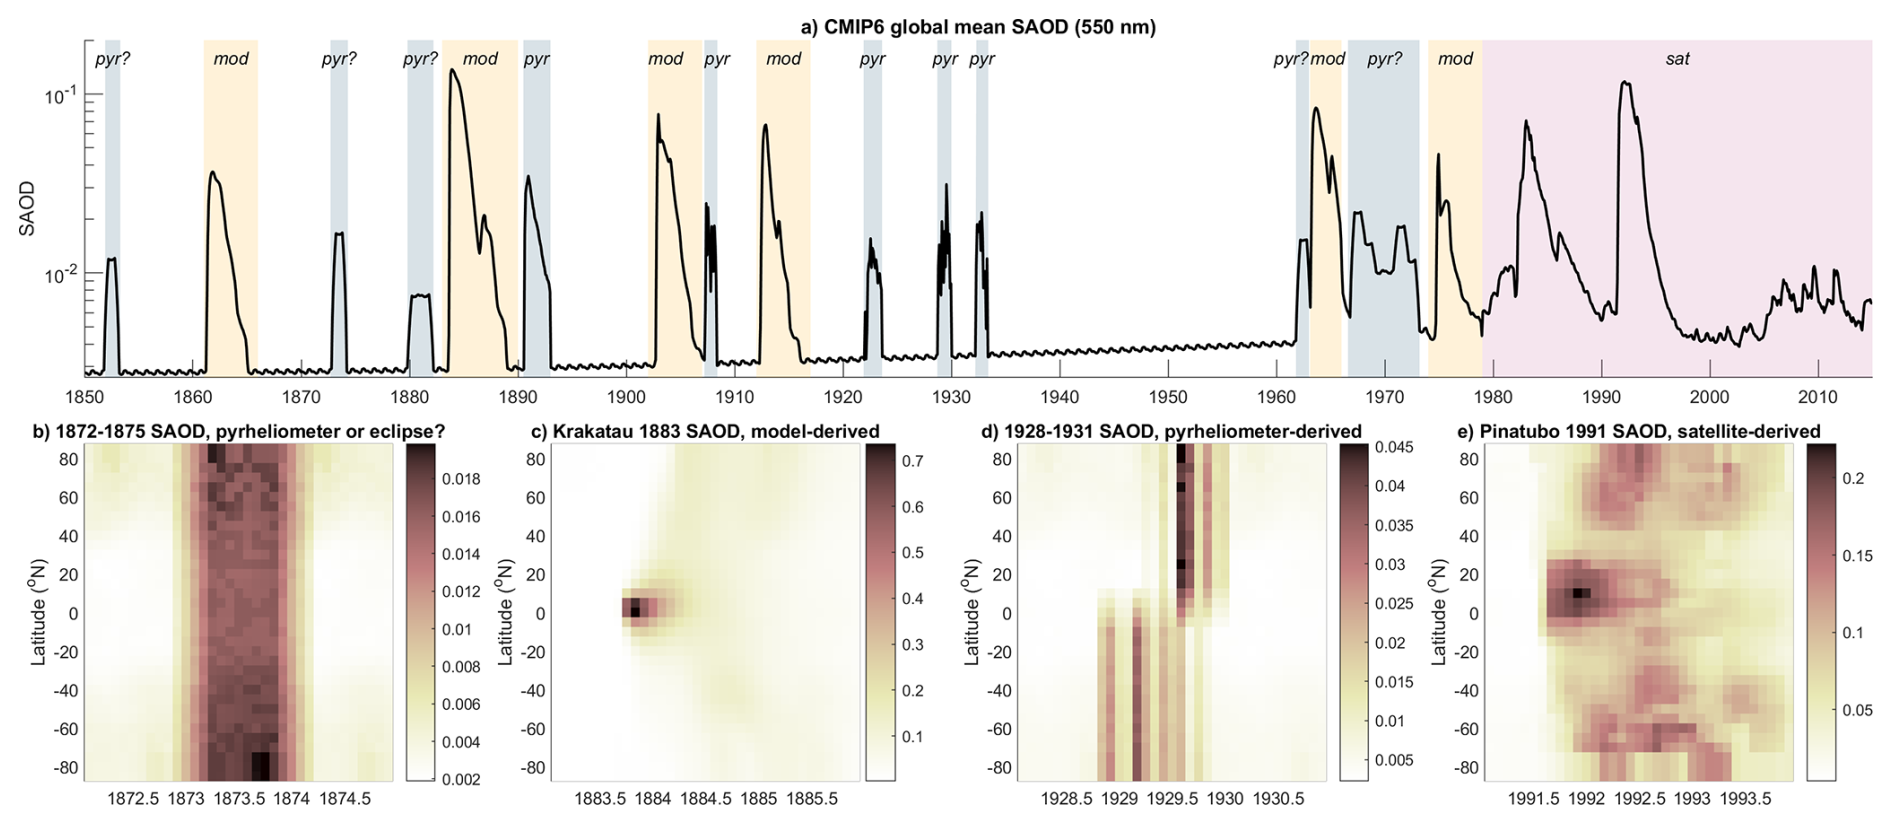
Figure 1(a) CMIP6 global mean SAOD at 550 nm. Shaded labelled periods show where the data is primarily derived from pyrheliometer measurements (blue shading, labelled “pyr” or “pyr?” if CMIP6 reports pyrheliometer use but we suspect a different data source), model simulations (yellow shading, labelled “mod”) or satellite measurements (purple shading, labelled “sat”). For any other period, there is no volcanic SAOD perturbation. Panels (b)–(e) show the latitudinal SAOD distribution for four selected 3-year periods, illustrating examples for which the data was primarily derived from pyrheliometer measurements, model simulations or satellite measurements.
The CMIP6 dataset is characterized by long periods with no perturbation in stratospheric aerosol optical properties prior to the satellite era. Over 1850–1978, we estimate that 78 years have no perturbation, with the longest period with no perturbation lasting 28 years, and seven periods with no perturbation that are at least 5-year long. The satellite record evidences that small-to-moderate magnitude eruptions (defined here as injecting less than 3 Tg SO2) injecting sulfur into the stratosphere in fact typically occur multiple times per year (e.g. Carn et al., 2016; Schmidt et al., 2018; Chim et al., 2023). In addition to contributing to the mean stratospheric aerosol forcing, these eruptions also contribute to decadal climate variability (Santer et al., 2015). For example, the 1998–2007 period was relatively quiescent, whereas the 2008–2017 period saw several small-to-moderate magnitude eruptions contributing a radiative forcing of −0.1 W m−2 (Schmidt et al., 2018). The lack of representation of small-to-moderate magnitude eruptions for the pre-satellite era in CMIP6 is likely caused by the difficulty of detecting these eruptions in the sparse and uncertain pyrheliometer and lunar eclipse record. Recently, Chim et al. (2023, 2025) demonstrated that even for lower-end scenarios for volcanic stratospheric sulfur emissions for the rest of the century, the CMIP6 ScenarioMIP 2015–2100 mean stratospheric aerosol forcing is very likely to be exceeded. The primary reason is that both the CMIP6 pre-industrial (Eyring et al., 2016) and 2015–2100 scenario (O'Neill et al., 2016) stratospheric aerosol forcing are the 1850–2014 average of the historical forcing, and that this average value largely does not account for small-to-moderate magnitude eruptions before 1979. Such bias would thus affect scenario simulations, pre-industrial control simulations as well as forcing mean level and trends in historical simulations.
Whereas the CMIP6 historical stratospheric aerosol forcing dataset was generated from a range of methods, for some CMIP6 community MIPs, stratospheric aerosol forcing was derived from volcanic emissions using the reduced-complexity aerosol model Easy Volcanic Aerosol model (EVA, Toohey et al., 2016). This includes the Paleoclimate Model Intercomparison Project last millennium experiment (Jungclaus et al., 2017) for which the recommended volcanic forcing dataset was EVA-eVolv2k (Toohey and Sigl, 2017), as well as experiments from the Model Intercomparison Project on the climatic response to Volcanic forcing (VolMIP, Zanchettin et al., 2016), such as volc-long and volc-cluster experiment series. One important technical evolution since the creation of the CMIP6 dataset is the increasing number of climate models capable of interactively simulating stratospheric aerosol from precursor emissions, including those participating to the Interactive Stratospheric Aerosol MIP (ISA-MIP, Timmreck et al., 2018; Clyne et al., 2021; Quaglia et al., 2023) and more recent additions (e.g. Gao et al., 2023; Ke et al., 2025). These models push the frontiers of our understanding of stratospheric aerosol processes and are critical to understand volcanic impacts on climate (e.g. Marshall et al., 2022), the potential forcing and impacts of climate intervention through stratospheric aerosol injections (e.g. Visioni et al., 2021), and the forcing of increasingly frequent pyrocumulonimbus emissions into the stratosphere (e.g. Yu et al., 2023). No stratospheric aerosol precursor emission dataset was provided for CMIP6, although Neely and Schmidt (2016) curated the VolcanEESM volcanic SO2 emission dataset, which was used by one modelling group to run historical simulations (Davis et al., 2023).
1.3 Overview of the CMIP7 stratospheric aerosol optical property dataset
To make progress on the challenges identified for CMIP6, the CMIP7 stratospheric aerosol dataset was created with the following objectives:
-
Provide detailed documentation of the dataset in peer-reviewed publications.
-
Cater to the needs of models with interactive stratospheric aerosol models by providing a corresponding volcanic SO2 emission dataset.
-
Ensure consistency between the provided emission and aerosol optical property datasets, as well as between the methodology used to provide our datasets, and that expected to be used in community MIPs.
-
Minimize biases in the representation of small-to-moderate magnitude eruptions in the pre-satellite era.
-
Produce the dataset from 1750 to support potential extended historical simulations starting from 1750, as well as simulations from reduced-complexity climate models which commonly start in 1750.
Here we document the aerosol optical property dataset produced for CMIP7 (Fig. 2). This includes a brief overview of the CMIP7 upper tropospheric-stratospheric (UTS) volcanic sulfur emission dataset, documented in detail in the same special issue (Aubry et al., 2026). Version 2.2.1 of both historical datasets are documented, i.e. the version frozen for use in the CMIP7 AFT. The CMIP7 stratospheric aerosol optical property dataset is derived from GloSSAC for 1979–2023 (Sect. 2.2). For 1750–1978, volcanic perturbations are derived from the CMIP7 UTS volcanic sulfur emission dataset (Sect. 2.1 and Aubry et al., 2026) using version 2 of the EVA_H model (Sect. 3). Consistency between the satellite and pre-satellite era parts of the datasets as well as between the emission and aerosol optical property dataset is maximized by calibrating EVA_H v2 against the satellite-era portion of both datasets. Section 4 provides details on the production of the dataset including merging of satellite and pre-satellite era products, making of pre-industrial (v2.2.1) and scenario (v2.2.2) datasets, and provision of scripts to interpolate our dataset at arbitrary wavelength. A brief comparison between the CMIP6 and CMIP7 datasets is presented in Sect. 5. Last, Sect. 6 discusses requirements to operationalize the production of our aerosol optical property dataset, as well as key uncertainties and directions for future improvements.
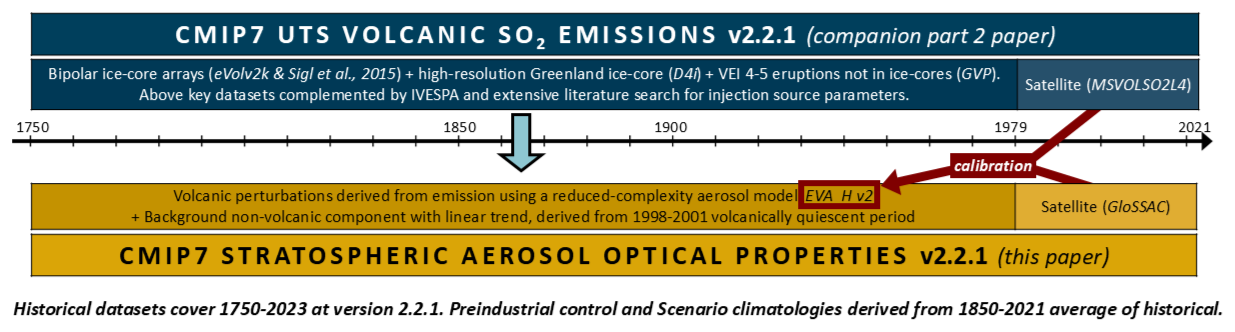
Figure 2Graphical depiction of the CMIP7 stratospheric aerosol forcing datasets, i.e. the upper tropospheric-stratospheric (UTS) volcanic SO2 emission dataset (see overview in Sect. 2.1, Aubry et al., 2026, and upcoming documentation in a companion paper) and the stratospheric aerosol optical property dataset (documented here). Key source datasets for pre-satellite (1750–1978) and satellite (1979–2023) era emissions as well as satellite-era aerosol optical properties are indicated. Version 2 of the EVA_H volcanic aerosol model (Sect. 3) used to derive pre-satellite era aerosol optical properties is calibrated against satellite-era emission and optical property datasets.
2.1 Overview of the upper tropospheric-stratospheric volcanic SO2 emission dataset
Version 2.2.1 of our emission dataset (Fig. 3) is documented in a companion paper (Aubry et al., 2026) and only briefly summarized here. In short, it provides the SO2 injection mass, altitude, location (latitude and longitude) and date for all eruptions that led to potential stratospheric aerosol enhancement for 1750–2023 (Fig. 3). These include eruptions with upper-tropospheric volcanic plume heights, although their emissions largely will not contribute to stratospheric aerosol enhancement in the CMIP7 stratospheric aerosol optical property dataset, or in interactive stratospheric aerosol models that will use the CMIP7 emission inventory. For the satellite era (1979–2023), we use the Multi-Satellite Volcanic Sulfur Dioxide L4 Long-Term Global Database (MSVOLSO2L4, Carn, 2022). Prior to the satellite era, we rely on the following emission datasets:
eVolv2k (Toohey and Sigl, 2017) for 1750–1900 and Sigl et al. (2015) for 1901–1978, which are both derived from bipolar ice-core arrays. These datasets capture large-magnitude eruptions and enable one to constrain the date, SO2 mass and broad latitudinal band of emission (northern hemisphere, tropical and southern hemisphere).
The D4i high-resolution Greenland core (Fang et al., 2023) for 1750–1900. This dataset captures numerous northern hemisphere and tropical small-to-moderate magnitude eruptions not detected in the above (i) datasets, and enables one to constrain the date and SO2 mass.
The Global Volcanism Program (GVP) Volcanoes of the World database (Global Volcanism Program, 2025), for which we use Volcanic Explosivity Index 4 and 5 eruptions not identified in (i) and (ii). This dataset enables us to account for more small-to-moderate magnitude eruptions, which remain difficult to detect in bipolar ice-core arrays (i) and are still largely underrepresented even in high-time resolution D4i Greenland ice-core (ii), especially for eruptions in the southern hemisphere (expected to not be captured at all in D4i) and tropics. The GVP database provides the exact volcano and, in some instances, detailed information on eruption date or plume altitude, but it does not provide information on SO2 mass. To minimize reliance on the GVP database, we matched detected volcanic sulfur injection events in (i) and (ii) to eruptions from the GVP whenever a plausible match existed, with more details on matching provided by Aubry et al. (2026). This resulted in 4 VEI 5 eruptions and 64 VEI 4 eruptions added over 1750–1978 from the GVP database. The chosen VEI 5 SO2 mass for GVP events is 2.78 Tg SO2, i.e. the average of the SO2 mass for all other VEI 5 eruptions in the dataset, where the mass was constrained from satellite or ice-core data. The chosen VEI 4 SO2 mass for GVP events is 0.08 Tg SO2, and it was chosen so that the time-averaged volcanic SAOD over 1750–1978 for small-to-moderate magnitude eruptions is equal to the satellite constrained mean SAOD anomaly over 1998–2023, a period with no large-magnitude eruptions. The 1998–2023 global mean SAOD anomaly is defined as the deviation from its minimum monthly value of 0.0040 reached in April 2002.
Regardless of the source dataset used for emissions (MSVOLSO2L4, eVolv2k, Sigl et al., 2015, D4i and GVP), numerous injection parameters are not directly constrained (e.g. SO2 injection altitude or latitude for unattributed ice-core events). We attributed these parameters based on detailed literature review for each eruption or from empirical relationships detailed in Aubry et al. (2026). The emission dataset is affected by one known error in parameter attribution (see Sect. IV.3 in Aubry et al., 2026). When the eruption month is unknown, the CMIP7 dataset was supposed to always follow the convention adopted in Toohey and Sigl (2017) and Sigl et al. (2022) and assign January as the emission month. However, a typo for D4i-derived eruptions resulted in a default month of December for 13 eruptions injecting 1.6–6.5 Tg SO2 between 1750 and 1849, as well as eruptions in 1868 (2.9 Tg SO2), 1885 (4.2 Tg SO2) and 1894 (1.9 Tg SO2). Emission dates associated with these 16 eruptions are thus likely ∼ 1 year too late. This will have little impacts for the CMIP7 1850–2021 historical period with only three eruptions injecting 1.9–4.2 Tg SO2 affected, but represents a notable error for any modelling group using the early extension of the historical period (1750–1849) we provide.
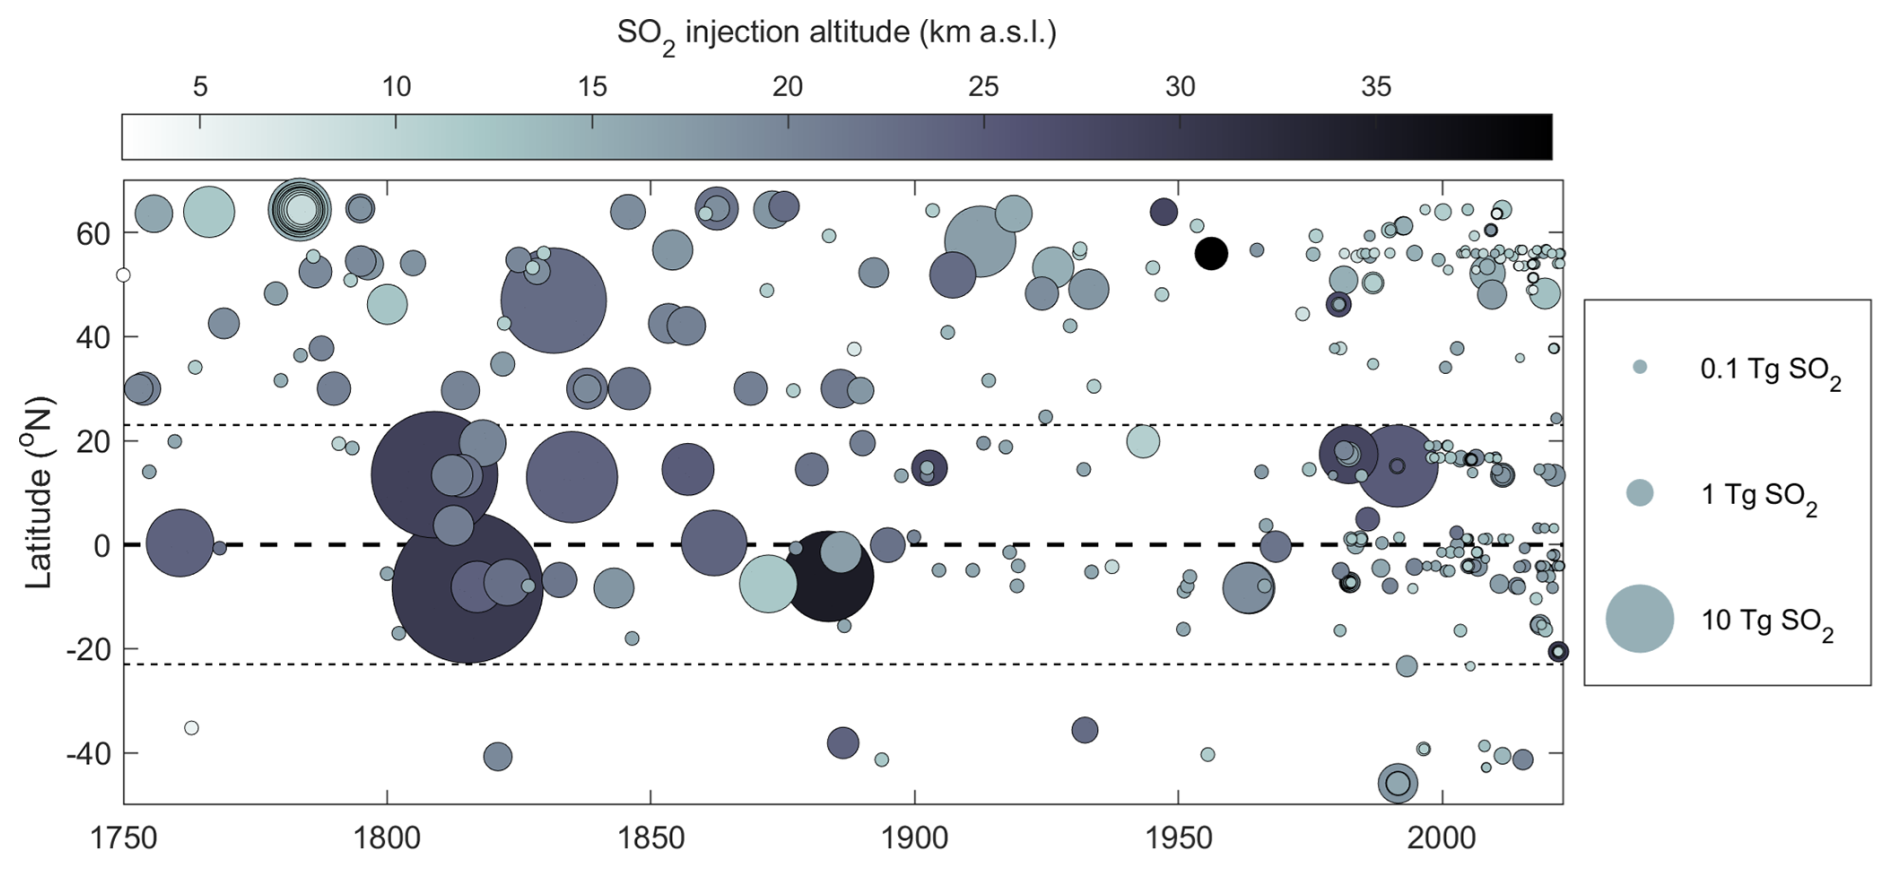
Figure 3CMIP7 upper tropospheric and stratospheric volcanic SO2 emission dataset (version 2.2.1). Each circle represents an eruptive event shown as a function of latitude and time, with the circle size indicating the mass of SO2 and the shading the injection height. Dashed lines show the equator and tropic lines. Modified from Aubry et al. (2026).
2.2 GloSSAC dataset
The Global Space-based Stratospheric Aerosol Climatology (GloSSAC) was first introduced in 2018 (Thomason et al., 2018) as an extension of the SPARC Assessment of Stratospheric Aerosol Properties (ASAP) (SPARC, 2006). It provides a multi-sensor record of stratospheric aerosol optical properties from 1979 onward and has been extensively used in modelling (e.g., Timmreck et al., 2018; Aubry et al., 2020; Quaglia et al., 2023) and observational studies (e.g., Stocker et al., 2019). The dataset consists primarily of aerosol extinction coefficients at 525 and 1020 nm (although three or four wavelengths are available for specific periods), reported on a monthly 5° latitude by 0.5 km altitude grid. GloSSAC includes a zonal mean tropopause height climatology, derived from the SAGE II 1984–2006 period using the MERRA reanalysis (Rienecker et al., 2011) and WMO thermal tropopause height definition (Thomason et al., 2018). CMIP7 datasets used version v2.22 of GloSSAC (https://doi.org/10.5067/GLOSSAC-L3-V2.22, NASA/LARC/SD/ASDC, 2023). The latest GloSSAC release, version 2.23, spans 1979–2024 (NASA/LARC/SD/ASDC, 2025).
The Stratospheric Aerosol and Gas Experiment (SAGE) series provides the foundation for GloSSAC, with measurements from 1979–1981 (SAGE), 1984–2005 (SAGE II), and 2017–present (SAGE III/ISS). High-latitude regions not observed across the SAGE missions are supplemented by complementary spaceborne and ground-based observations (Thomason et al., 2018; Kovilakam et al., 2020), producing a continuous long-term record. Remaining gaps, particularly between December 1981 and September 1984 overlapping the perturbation resulting from the 1982 El Chichón eruption, and in the aftermath of the 1991 Pinatubo eruption, have been reconstructed from multiple data sources (Thomason et al., 2018; Kovilakam et al., 2020), with ongoing work to improve their representation. Additionally, single-wavelength extinction coefficients from the Optical Spectrograph and Infrared Imaging System (OSIRIS, Rieger et al., 2019) and Cloud Aerosol Lidar and Infrared Pathfinder Satellite Observations (CALIPSO, Kar et al., 2019) were used to bridge post-SAGE II period (August 2005–May 2017), with a conformance procedure to reduce instrument biases (Kovilakam et al., 2020). Current efforts focus on applying reconstruction methods based on Thomason et al. (2021) to improve extinction coefficient estimates during volcanic events in this period, and on evaluating Ozone Mapping and Profiler Suite Limb Profiler (OMPS) aerosol extinction products (Kovilakam et al., 2025) to improve coverage following the termination of CALIPSO and the decline in OSIRIS observations.
To produce the CMIP7 aerosol optical property dataset, three pre-processing steps were applied to GloSSAC's extinction at 525 and 1020 nm, the two variables we used. First, we masked any data strictly below the altitude of the tropopause height provided in GloSSAC. Second, we corrected a few values of 1020 nm/525 nm extinction ratios, mostly in the lowermost tropical stratosphere, in the aftermath of the Pinatubo 1991 eruption. Very low values of this extinction ratio, highly localized in periods and areas of the stratosphere with relatively high values, resulted in unrealistically small values of effective radius when processed through our Mie scattering code. We chose to correct any datapoint with 525 nm extinction > 0.0028 km−1 and with 1020 nm/525 nm extinction ratio < 0.25. We left the value of 525 nm extinction unchanged and corrected the 1020 nm extinction value by setting the extinction ratio equal to that of the closest data point with an uncorrected value, where we defined “closest” as closest in altitude, at the same time and latitude. This resulted in correcting a total of 974 data points (0.1 % of the dataset), with 95 % of them in the extratropical lowermost stratosphere. Less than 4 % of the data was corrected for any given month over 1991–1994, and less than 0.6 % of data for the handful of months affected over 2005–2021. Overall, this correction prevents unrealistic values of effective radius, surface area density, volume density and H2SO4 number density whilst having no effect on the mid-visible extinction from GloSSAC. Third, the GloSSAC dataset covers 77.5° S–77.5° N with 5° resolution. To produce a global dataset, we added data at 82.5 and 87.5° S/N by simply assuming the same value of extinction at these latitudes as at 77.5° S/N. This ad-hoc assumption to obtain global coverage affects less than 1.5 % of Earth's surface area.
3.1 EVA_H v1: overview and challenges
The aerosol model we employ (EVA_H version 2) is an update to EVA_H version 1 (Aubry et al., 2020), which was itself an extension of the Easy Volcanic Aerosol (EVA) model, a reduced-complexity volcanic aerosol model developed by Toohey et al. (2016). Using simple parameterizations for stratospheric sulfate aerosol production, loss, effective radius and SAOD, EVA takes as input volcanic SO2 injection parameters (SO2 injection mass, latitude and date) to produce 4-dimensional (latitude, altitude, time and wavelength) aerosol optical properties. In EVA, the stratosphere is divided into three boxes corresponding to three latitudinal bands, and shape functions are used to produce spatially resolved output. EVA was originally calibrated using the Pinatubo 1991 eruption. The model is extremely simple compared to global atmospheric models simulating the chemical, microphysical and transport processes required to simulate the life cycle of stratospheric aerosols, and much simpler than the AER2D model (Arfeuille et al., 2014) used to generate the forcing associated with a few eruptions in CMIP6 (Fig. 1). However, the VolMIP Tambora experiment demonstrated major discrepancies between complex interactive stratospheric aerosol models (Zanchettin et al., 2016; Clyne et al., 2021) and EVA represents a computationally inexpensive, semi empirical middle-ground between them. It has been used in numerous climate modelling applications including CMIP6 VolMIP (Zanchettin et al., 2016), PMIP (Jungclaus et al., 2017), and decadal projections (Sospedra-Alfonso et al., 2024). Employing a low-cost model was also critical in producing the CMIP7 dataset, allowing us to easily revise the numerous dataset versions produced e.g. when revisions to the emission dataset were decided.
From EVA, Aubry et al. (2020) developed the EVA_H (version 1) extension, going from a 3-box to an 8-box model by adding three vertical bands corresponding to the lowermost extratropical stratosphere, the lower stratosphere (16–20 km), and the middle stratosphere (20–40 km). With aerosol loss timescales dependent on both latitude and altitude, the simulated evolution of total sulfate aerosol burden and global mean aerosol optical properties is dependent on SO2 injection latitude and altitude, which was not the case in EVA. The vertical structure of the aerosol optical properties also evolves in time, whereas only the latitudinal structure was evolving in EVA. Last, EVA_H v1 was calibrated against the 1979–2015 eruption time series using an earlier version of MSVOLSO2L4 (for volcanic SO2 emissions) and GloSSAC (for stratospheric aerosol optical properties) instead of Pinatubo 1991 only for EVA. Differences between EVA and EVA_H v1 generated forcing and their implications for simulating the climate response to volcanic eruptions are investigated in Bilbao et al. (2025).
When calibrating EVA_H v1, one of the main challenges was to implement parameterizations better capturing the forcing evolution for eruptions spanning a broad range of injection mass, latitude, altitude and season. Aerosol loss timescale dependent on altitude and latitude significantly improved the model performance. However, this was not the case for the aerosol production timescale which led to a single, prescribed aerosol production timescale of 7.8 months, whose value was largely driven by the good resulting fit for the Pinatubo 1991 eruption. Despite EVA_H v1 loss timescales dependence on injection latitude and altitude, the long, prescribed aerosol production timescale limits the sensitivity of the model to eruption characteristics and led to overestimated aerosol lifetime for relatively small eruptions over the 2001–2015 (Aubry et al., 2020). The same issue was evident for the 2019 Raikoke eruption, for which a production timescale of 2.8 months was more adequate (Vernier et al., 2024). More sophisticated parameterization of aerosol production timescale did not significantly improve model performance because of the difficulties in reconciling the MSVOLSO2L4 emission inventory and GloSSAC aerosol optical property dataset, with important trade-offs between more realistic temporal evolution of SAOD perturbations and better matching of SAOD perturbation magnitude. For example, EVA_H v1 already tends to overestimate the peak SAOD of numerous eruptions over 2001–2015, which could largely be caused by biases in MSVOLSO2L4 or GloSSAC, both for Pinatubo 1991 (the eruption with the largest SAOD perturbation and thus the most weight in the calibration) and small-to-moderate magnitude eruptions (challenging to simulate with EVA_H v1 when matching Pinatubo). When decreasing the model aerosol production timescale, peak SAOD becomes even larger which thus decreased the model performance despite a more realistic time-evolution of SAOD perturbation.
In the following, we describe all updates to EVA_H v1 made to develop EVA_H v2 used to produce the CMIP7 dataset. Although we strive to provide a basic understanding of EVA_H v1 in this paper, we refer to Aubry et al. (2020) for an extensive documentation of v1 of the model.
3.2 Updates to aerosol production timescale and model calibration
To improve EVA_H v1, we introduce a new parameterization of the aerosol production timescale dependent on SO2 injection parameters. Fitting EVA_H v1 to single eruptions instead of the full 1979–2023 sequence suggested that the aerosol production timescale was a power-law function of the injected SO2 mass (), and a linear function of the injection height (). The latter is consistent with previous findings that the SO2 e-folding time increases linearly with altitude (Carn et al., 2016). Consequently, we parameterize the aerosol production timescale as:
where a1, a2 and a3 are three model parameters replacing the previous single value of the production timescale, and imposing a minimum value for τprod of 0.1 month.
As in Aubry et al. (2020), we used a genetic algorithm to calibrate EVA_H v2 using MSVOLSO2L4 as model input, and minimizing the error on the aerosol optical depth (AOD) in each EVA_H v2 box when compared to GloSSAC. Whereas calibration of EVA_H v1 was against the 1979–2015 period, we used the 1979–2023 period to calibrate EVA_H v2, a significant extension of the calibration dataset given the short duration of our satellite record. GloSSAC was pre-processed by removing the 1998–2001 monthly mean climatology of extinction to obtain extinction anomaly, and tropospheric extinction values were masked using the GloSSAC-provided tropopause height (Fig. 4a, black line). MSVOLSO2L4 was pre-processed by grouping together injections from the same volcano and eruption, by summing SO2 masses, averaging SO2 injection height weighted by SO2 mass, and taking the date of the first injection. Additionally, we introduced an ad-hoc SO2 injection of 0.7 Tg SO2 at 20 km above sea level (a.s.l.), 33° S in December 2019 to represent Australia's Black Summer pyrocumulonimbus (e.g. Peterson et al., 2021). EVA_H v2 does not presently have the capability to represent wildfire injections which are primarily organic and black carbon (e.g. Yu et al., 2023). Introducing an ad-hoc SO2 injection enables us to not bias the model calibration. The absence of significant injection to realistically reproduce the large Southern Hemisphere SAOD perturbation in 2020–2021 (e.g. Kloss et al., 2021) could indeed have been compensated during calibration by biases in values of model parameters such as fast aerosol transport from the tropics to the extra tropics, or long production and/or loss timescales for 2019 eruptions of Raikoke and Ulawun which would have biased values of a1−a3 (Eq. 1). A very large uncertainty was used for the SO2 mass of the Australia's Black Summer pyrocumulonimbus to ensure that it has minimal influence on the calibration. Numerous other pyrocumulonimbus perturbations could have been introduced (e.g. 2017 Canadian pyrocumulonimbus, Kloss et al., 2019, 2021). However, owing to their smaller magnitudes, these events are less likely to have driven SAOD perturbations that would strongly bias the model calibration in the absence of corresponding SO2 injection. The processed emission inventory used to calibrate EVA_H v2 is provided in Table S1 in the Supplement.
Critically, we modified the calibration process to ensure that it does not favor closest matching of GloSSAC aerosol optical properties given specific SO2 injection estimate from MSVOLSO2L4 at the expense of realistic time evolution of aerosol optical property perturbations. In addition to model parameters, calibration parameters for v2 include the SO2 mass of all eruptions considered in the calibration. We calculate an uncertainty on injected stratospheric mass by assuming that eruptions other than Pinatubo have a factor 2 uncertainty on mass reported in MSVOLSO2L4, and 4 km uncertainty on plume height. Pinatubo has the most weight in the calibration so no matter what the SO2 mass used, the resulting model will fit the Pinatubo signal. Consequently, we fix the Pinatubo mass to its best estimate in MSVOLSO2L4 (15 Tg SO2), but add an uncertainty of 33 % for all other masses (corresponding to an assumed 33 % uncertainty on Pinatubo mass). When calibrating the model, we then look for the combination of model parameter values and erupted SO2 mass, within uncertainty for each eruption, minimizing our error metric. This enables the genetic algorithm to adjust SO2 masses within a realistic range, facilitating matching of both SAOD perturbation magnitude and time-evolution. To keep the model calibration reasonably quick, we first did an initial model parameter search allowing for adjustment of SO2 masses for the 44 eruptions (out of 182) with a best estimate of stratospheric SO2 mass higher than 0.1 Tg SO2. We then did a refined search allowing for adjustment of SO2 masses for the 88 eruptions with an upper end (as opposed to best) estimate of stratospheric SO2 mass higher than 0.1 Tg SO2.
Table 1 shows all calibrated model parameter values. The resulting global mean SAOD predicted by EVA_H v2, the newly calibrated model, is shown as a red-dotted line on Fig. 4a, The red continuous line showing the same model run without adjusted SO2 masses. When running EVA_H v2 with MSVOLSO2L4 unadjusted SO2 masses, both v1 (yellow line on Fig. 4a) and v2 typically overestimate SAOD perturbations associated with 21st century small-to-moderate magnitude eruptions, with v2 typically worst. However, thanks to the implementation of a new parameterization for the production timescale (Eq. 1) combined with the new calibration process, EVA_H v2 clearly captures much better than EVA_H v1 the rise and decay timescales of SAOD perturbations associated with a broad range of eruptions (Fig. 4b–f). EVA is not shown in these figures, but it would exhibit the same time evolution of global mean SAOD independently from SO2 injection parameters. Comparing model parameters in EVA_H v1 vs v2, v1 has an 18 % smaller scaling factor to convert the total stratospheric sulfate aerosol burden into global mean SAOD at 525 nm. This difference is largely consistent with the fact that the estimated Pinatubo 1991 SO2 injection mass decreased by 17 %, from 18 to 15 Tg SO2, between the MSVOLSO2L4 used to calibrate v1 and v2 versions of EVA_H. The difference between tropical and extra-tropical aerosol loss timescales is greater in EVA_H v2 compared to v1, which is an improvement given the lack of sensitivity to eruption latitude of EVA_H v1 compared to interactive stratospheric aerosol models (Aubry et al., 2020). The aerosol production timescale of 7.8 months in EVA_H v1 is now Eq. (1) with months. For Pinatubo 1991 (15 Tg SO2, 25 km a.s.l.), this results in a production timescale of 6.8 months. For Soufriere Hills 2006 (0.2 Tg SO2, 18 km a.s.l.), this results in a production timescale of 1.3 months. Overall, the production timescale scales linearly with height and increases by a factor of 2 when SO2 mass increases by a factor of 10. Last, we updated the effective radius calibration (Table 1) in line with both changes to the model equations (this section) and aerosol size distribution and resulting Mie look-up table (Sect. 3.3). We also allow local effective radius as small as 0.06 µm instead of 0.1 µm in EVA_H v1, which enables us to better match high 525 nm/1020 nm extinction ratios from GloSSAC.
Table 1Parameterization and parameter values used in v1 and v2 of EVA_H. Symbols in parenthesis refer to symbol used in the EVA_H v1 documentation paper (Aubry et al., 2020), with superscripts for loss timescales referring to model boxes. For the aerosol production timescale parameterization, refers to the SO2 injection height in km a.s.l., and to the mass of SO2 in Tg S. For the effective radius parameterization, refers to the mass of sulfate aerosol in Tg S.
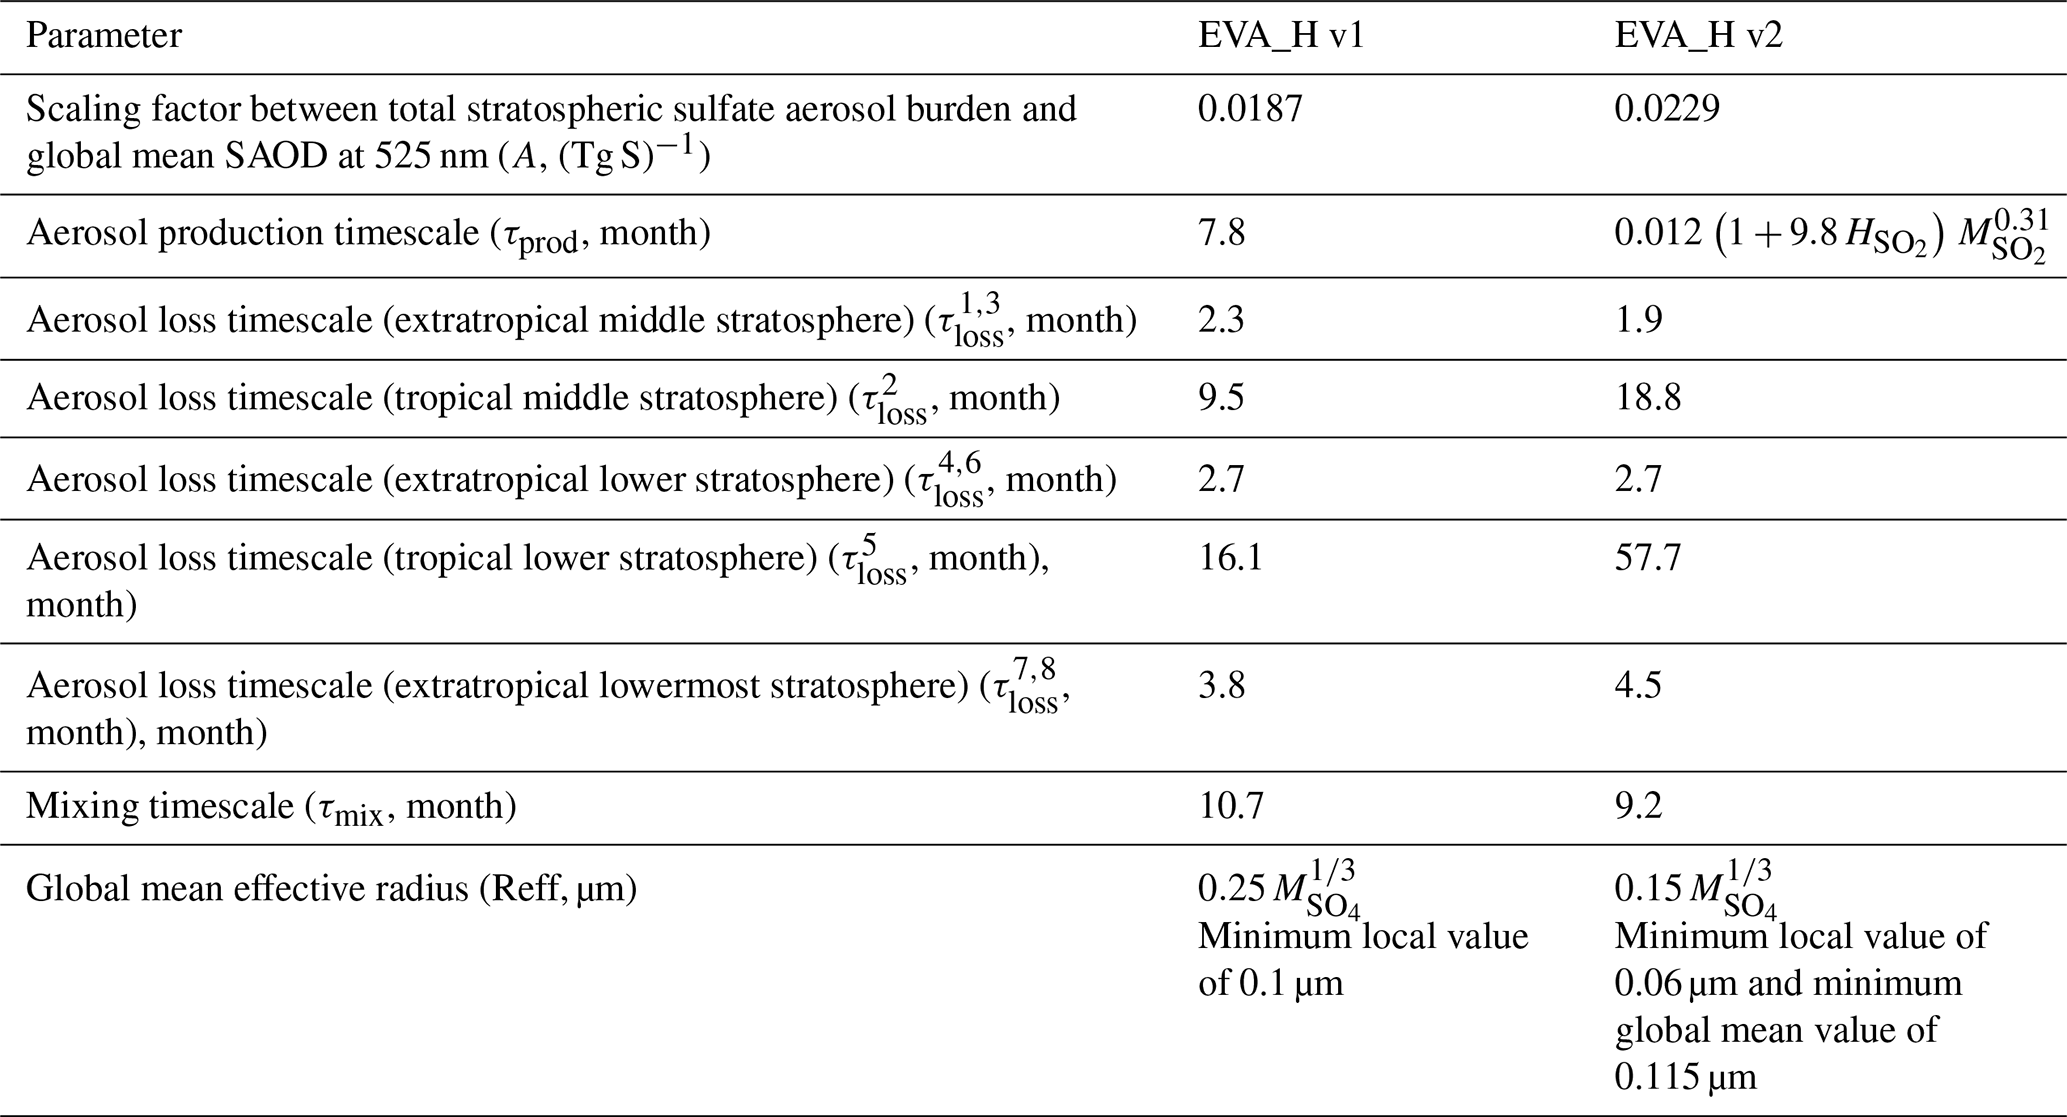
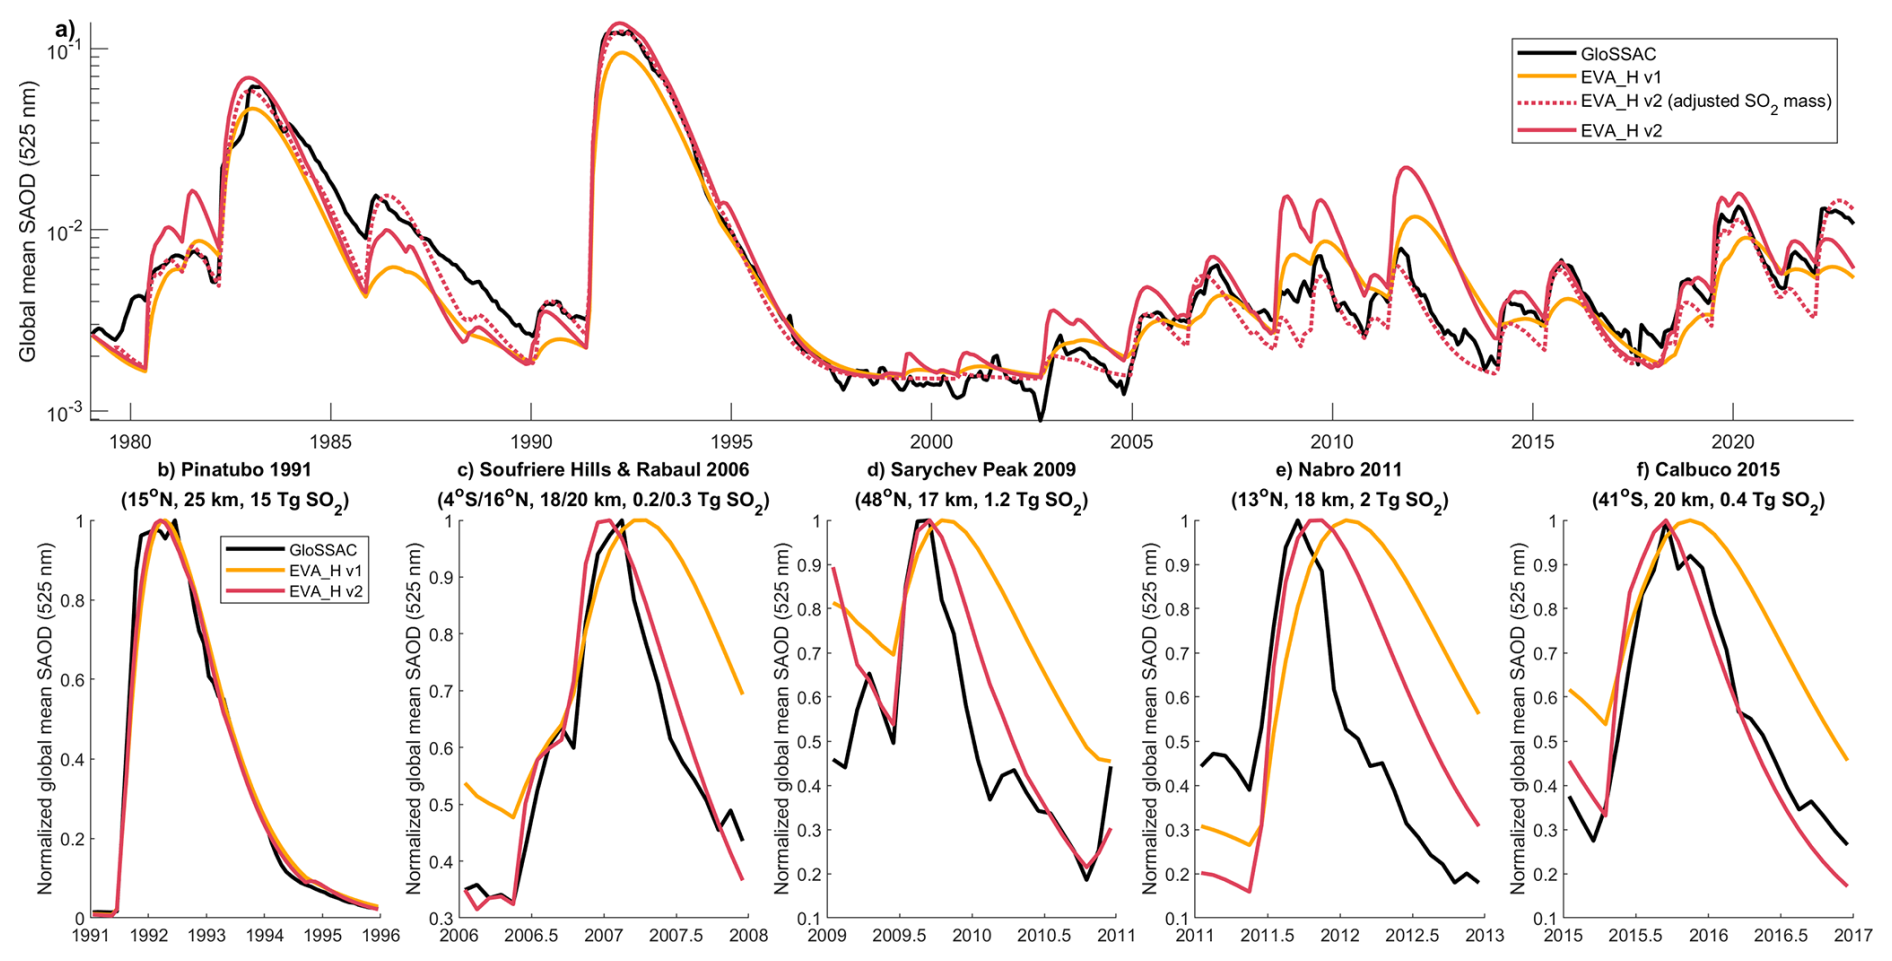
Figure 4Global mean SAOD time series for GloSSAC, EVA_H v1 and EVA_H v2 (the newly calibrated model), run using the MSVOLSO2L4 emission inventory modified as specified in Sect. 3.3. In panel (a), we additionally show EVA_H v2 run with adjusted SO2 masses constrained as part of the calibration process (Sect. 3.3). Panels (b)–(f) shows selected time periods with SAOD normalized by its maximum, highlighting how SAOD time evolution compares between models and GloSSAC. Eruptions dominating the sulfur budget for each period and their SO2 injection parameters are labelled above each panel.
3.3 Updates to aerosol size distribution and Mie look-up tables
As in EVA, the EVA_H v1 reduced-complexity volcanic aerosol model produces an estimate of the sulfate aerosol mass, effective radius and extinction at 525 nm, then uses a lookup table to convert this extinction to other wavelengths and other optical and physical properties. This lookup table is produced using Mie theory, which requires assumptions about the complex refractive index of the aerosol solution, and the aerosol size distribution. For EVA_H v2, the complex refractive index of sulfuric acid solution in water is taken from Biermann et al. (2000), which provides values for a temperature of 215 K and a sulfate-water solution with sulfate concentration of 75 %. The complex refractive index data was then interpolated to a wavelength grid with 298 data points between 0.15 to 100 µm using the Akima interpolation method (Akima, 1970). The imaginary part of the complex refractive index for wavelengths smaller than 2.65 µm are all set to equal values from Hummel et al. (1988). This value is around 0.004 at 2.5 µm and decreases to near zero at shorter wavelengths indicating negligible absorption by sulfuric acid solution in this part of the spectrum. In comparison, EVA and EVA_H v1 lookup tables were produced using complex refractive index values from Palmer and Williams (1975) and a coarser spectral resolution complex refractive index with only 29 data points.
Another important update that was made for EVA_H v2 is the use of a more representative aerosol particle size distribution. EVA_H v1 used a unimodal lognormal distribution with a geometric standard deviation of 1.2. In-situ measurements from ballon-borne measurements have shown that the particle size distribution of volcanic aerosols following the Pinatubo eruption is better represented by a bimodal distribution (Deshler et al., 1993). Furthermore, recent multi-wavelength SAGE III measurements indicate that particle size distributions following small-to-moderate eruptions have a geometric standard deviation around 1.6–2.0 (Wrana et al., 2023). To simultaneously account for eruptions at these different scales, EVA_H v2 uses a bimodal lognormal distribution with a geometric standard deviation of 1.8 and 1.25 for the smaller and larger sized modes respectively. The bimodal distribution becomes relevant for the EVA_H v2 in the effective radius range of 0.4–0.75 µm, i.e., the bimodal assumption is applicable only for larger eruptions like the El Chichón 1982 and Pinatubo 1991 eruptions, whereas for smaller sized eruptions where aerosol effective radii are below 0.4 µm, it is consistent with a unimodal distribution with a geometric standard deviation of 1.8. The complex refractive index along with the particle size distribution function are then input into the Mie scattering code PyMieScatt (Sumlin et al., 2018) to compute look-up tables of extinction efficiency, single scattering albedo and asymmetry parameter as a function of wavelength and effective radius. Figure 5 shows the resulting dependency of the 1020/525 nm extinction efficiency ratio on effective radius.
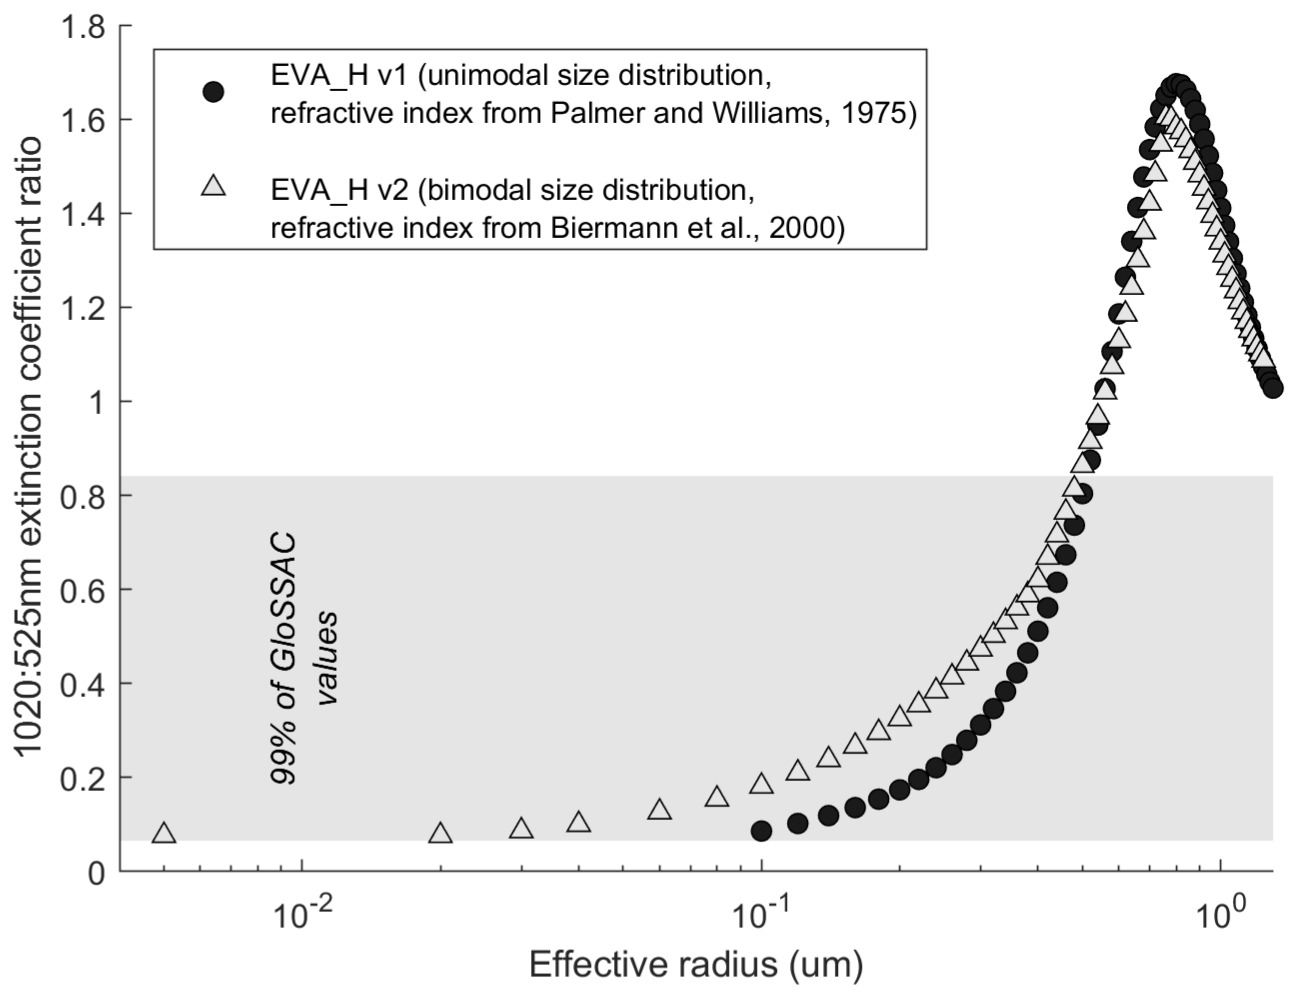
Figure 51020:525 nm (GloSSAC wavelengths) extinction efficiency ratio as a function of effective radius for the Mie look-up tables used in EVA_H v1 and v2. The shading shows the 0.5–99.5 interquantile range of values in GloSSAC.
Beyond optical properties, climate models running with prescribed stratospheric aerosol properties might require the aerosol surface area density, volume density and the H2SO4 number density. These properties were not output in EVA_H v1, which is addressed in v2. The look-up tables described above include values for the volume and surface area density for a nominal sulfate aerosol number density of 1 cm−3. We calculate the sulfate aerosol number density as the ratio of the extinction efficiency at 550 nm and the aerosol effective cross section, which is also calculated as part of the look-up table. Last, the H2SO4 number density (nd) is calculated as:
where vd is the aerosol volume density, wa=0.75 is the assumed fraction of sulfate in the aerosol, ρa is the aerosol density, Nav the Avogadro number, and the H2SO4 molar weight. The aerosol density is calculated following Sandvik et al. (2019) as:
where Ta=215 K is the assumed temperature, and ρa is expressed in kg m−3.
4.1 Non-volcanic background stratospheric aerosol optical properties
Section 3 introduces the model used to derive volcanic aerosol optical property perturbation during the pre-satellite era. However, stratospheric aerosol optical properties also include a background, non-volcanic component (Kremser et al., 2016). Note that “non-volcanic” refers to the fact that these aerosols did not originate from eruptions injecting sulfur directly into the stratosphere, nor from eruptions that injected sulfur into the upper troposphere that was rapidly (typically within weeks) transported into the stratosphere, e.g. through radiative lofting (e.g. Muser et al., 2020) or Monsoon circulation (e.g. Bourassa et al., 2012). Some sulfur originating from tropospheric volcanic plumes, along with tropospheric sulfur originating from other sources (e.g. anthropogenic), might still be slowly transported into the stratosphere and contribute to this “non-volcanic” background. The non-volcanic background is directly measured for the satellite era in GloSSAC, but must be accounted for during the pre-satellite era. The late 1990s/early 2000s are commonly used to derive a relatively volcanically-quiescent background stratospheric aerosol optical property climatology owing to the few and small eruptions detected during that time period (e.g. Carn et al., 2016; Schmidt et al., 2018). In CMIP6, 1999–2005, which has an average global mean SAOD at 525 nm of 0.0047, was used to derive a non-volcanic climatology. For CMIP7, we make a slightly different choice of using 1998–2001, which has an average global mean SAOD at 525 nm of 0.0044. We exclude year 2002, even though the minimum global mean monthly SAOD value (at 525 nm) over the satellite era is reached in April 2002 (0.0040), because three eruptions injecting nearly 0.1 Tg SO2 into the stratosphere occur near the end of that year (Ruang in September, Etna in October and Reventador in November). These eruptions are followed by a small but clear increase in tropical and Northern Hemisphere SAOD in late 2002 (Fig. 6a). We also include year 1998 because no eruption injecting more than 0.01 Tg SO2 occured over 1996–1998 and although a weak SAOD decay trend is still visible over 1996–1997 as a consequence of the 1991 Pinatubo eruption, it is strongly dampened by 1998 (Fig. 6a). Both for extinction at 525 and 1020 nm, monthly mean volcanically-quiescent climatologies were thus calculated from the 1998–2001 average. Figure 6b shows the corresponding climatology of 525 nm SAOD, with expected lower SAOD over the tropics, and a seasonal cycle mostly characterized by an increase in SAOD at northern high latitudes over April–July and an increase in SAOD at southern high latitudes over October–January.
In EVA_H v1, non-volcanic background aerosol optical properties were generated by injecting a steady SO2 flux in each of the model boxes, with these fluxes calibrated to best match the background aerosol optical properties. This approach resulted in the absence of seasonal cycle, and also caused the background aerosol spatial distribution to be determined by the model shape functions. This approach would have resulted in inconsistencies for the non-volcanic background between the pre-satellite and satellite era part of the dataset, which was flagged as a major concern by the group within the CMIP Climate Forcing Task Team in charge of producing the ozone forcing for CMIP7 (Michaela Hegglin, personal communication, 2025). Consequently, for EVA_H v2, to produce full stratospheric aerosol optical property fields, we directly add the GloSSAC-derived 1998–2001 climatologies in extinction at 525 and 1020 nm (Fig. 6b) to volcanic perturbations in extinction generated by running the model from volcanic emissions (Sect. 3).
Last, direct observations show an increase in stratospheric carbonyl sulfide (OCS), one of the most important non-volcanic sources of stratospheric sulfur, over 1986–2016, driven by anthropogenic sulfur emissions (Hannigan et al., 2022). This is consistent with model simulations showing an increasing trend in non-volcanic background stratospheric aerosol throughout the historical period (Luo, 2018, based on a personal communication by Mike Mills; Davis et al., 2023). In CMIP6 (Luo, 2018), based on Sheng et al. (2015), it was estimated that the total background stratospheric sulfur burden was 0.074 Tg S in 1850 and 0.11 Tg S for modern times. Luo (2018) assumed a linear trend in background extinction proportional to these burdens to scale the GloSSAC derived background aerosol optical properties back in time. We follow the same assumption to produce the CMIP7 dataset, i.e. we assume that in year 2000, the background extinction at 525 and 1020 nm is the 1998–2001 mean climatology (Fig. 6a), and that in year 1850, it was % of the 2000 values. We linearly scale background extinction between these two years, and assume a steady climatology before 1850 and after 2000. Although the resulting non-volcanic stratospheric aerosol background has an increasing trend consistent with limited observations and model simulations, it might remain too simplistic. The prescribed trend in CMIP7 background SAOD over the historical period is half the magnitude of the trend in interactive stratospheric aerosol simulations from the UK Earth System Model (UKESM) (Fig. 6c). This is caused in particular by UKESM simulating much lower background SAOD in 1850 ( instead of in CMIP7), and a lower background in 1979 ( instead of in CMIP7). The UKESM simulations also imply that most of the change occurs between approximately 1950 and 1978. After 1978, when we use directly observed stratospheric aerosol optical properties in CMIP7, UKESM shows a slow-down and plateau of SAOD increase, followed by an apparent decrease from around 2008. Brodowsky et al. (2024), using the ISA-MIP experimental protocol (Timmreck et al., 2018), show that there is a 33 % discrepancy in stratospheric aerosol burden simulated by nine interactive stratospheric aerosol models under year 2000, volcanically quiescent conditions. UKESM is at the lower-end of these models, which might cause some of the discrepancies observed in Fig. 6c. However, an interactive stratospheric aerosol, multi-model ensemble of full historical simulations with no explosive volcanic emission would help constraining the non-volcanic background stratospheric aerosol, its historical evolution and its uncertainty in future forcing dataset.
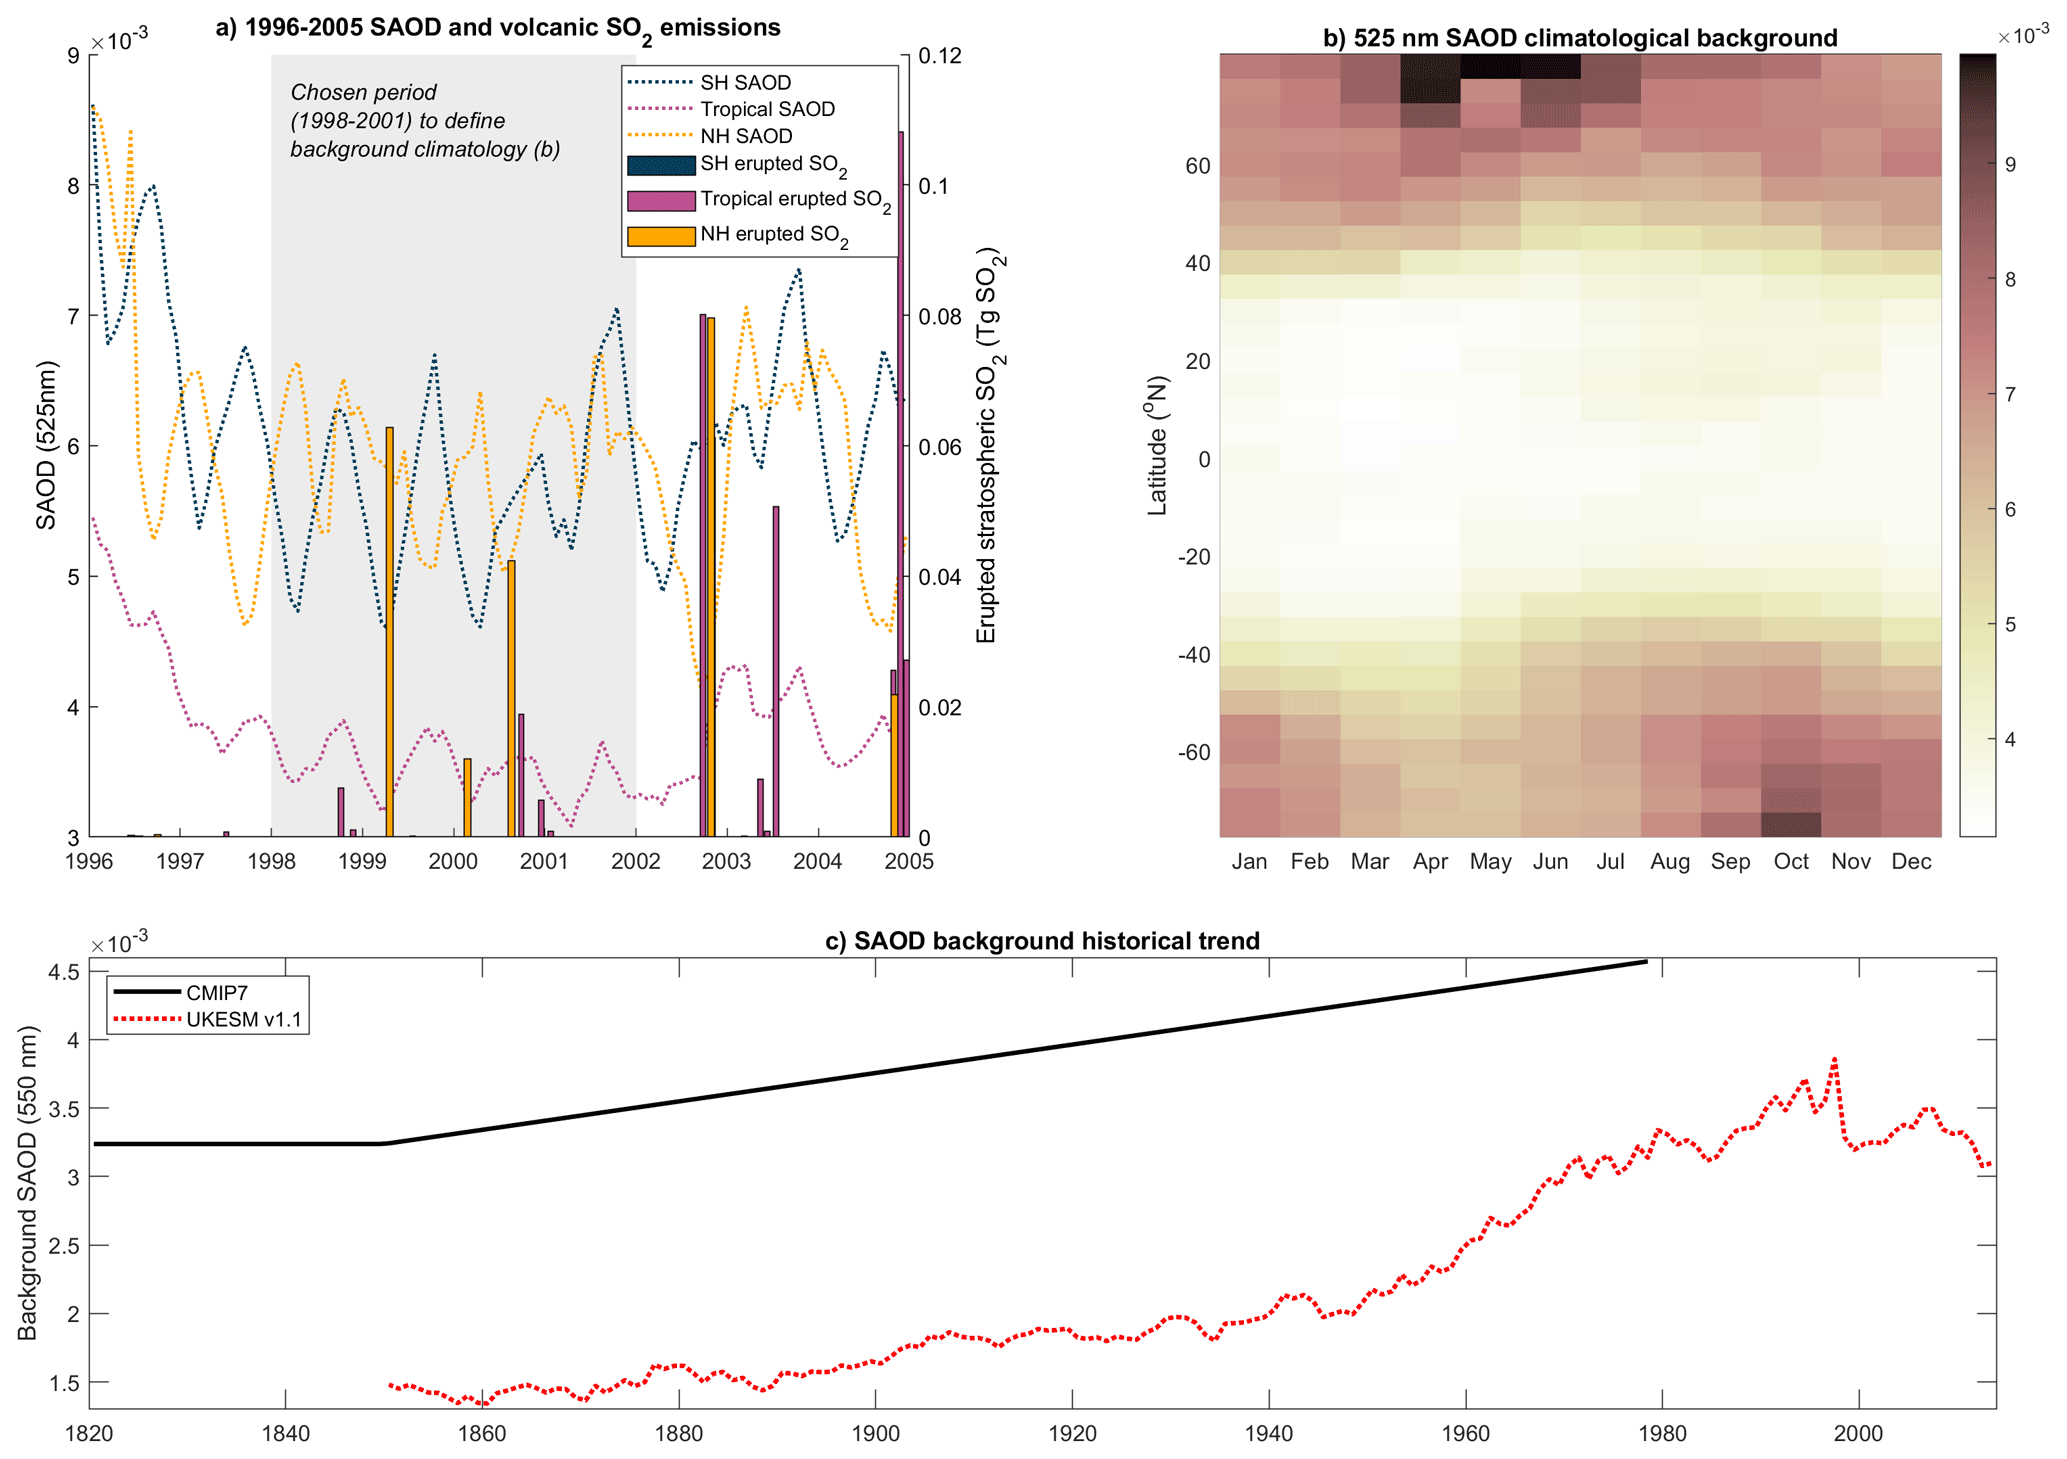
Figure 6(a) SAOD (left axis, dotted lines) and stratospheric volcanic SO2 emissions (right axis, bars) for the relatively volcanically quiescent 1996–2005 period. Both SAOD and emissions are split over southern hemisphere (90–25° S), tropical (25° S–25° N) and northern hemisphere (25–90° N). (b) 1998–2001 (shaded in grey on panel (a)) climatological SAOD at 525 nm. (c) Annual global mean background SAOD at 550 nm in CMIP7 (shown for 1820–1978) and as simulated by UKESM v1.0 (Sellar et al., 2019) using CMIP6 emissions and forcings. The UKESM background SAOD was obtained by running historical simulations with interactive stratospheric aerosols, but with no volcanic SO2 emissions.
4.2 Production of historical 525 and 1020 nm extinction
Extinction at 525 and 1020 nm are the key variables on which production of the CMIP7 aerosol optical property dataset relies. To produce these variables for 1750–1981, we summed the non-volcanic background (Sect. 4.1) and volcanic perturbations obtained by running EVA_H v2 (Sect. 3) using the CMIP7 volcanic SO2 emission inventory (Sect. 2.1 and Aubry et al., 2026). One modification was made to the emission inventory before running EVA_H v2. We injected SO2 associated with the Agung 1963 eruptions at 27° S (Fig. 7b) instead of the actual latitude of 8.3° S (Fig. 7a). This ensures that most of the Agung aerosol is in the Southern Hemisphere and tropics, instead of a hemispherically symmetric spreading, which results in a better agreement with pyrheliometer measurements (Stothers, 2001) and the CMIP6 dataset (Fig. 7c, SO2 injected between 0–15° S).
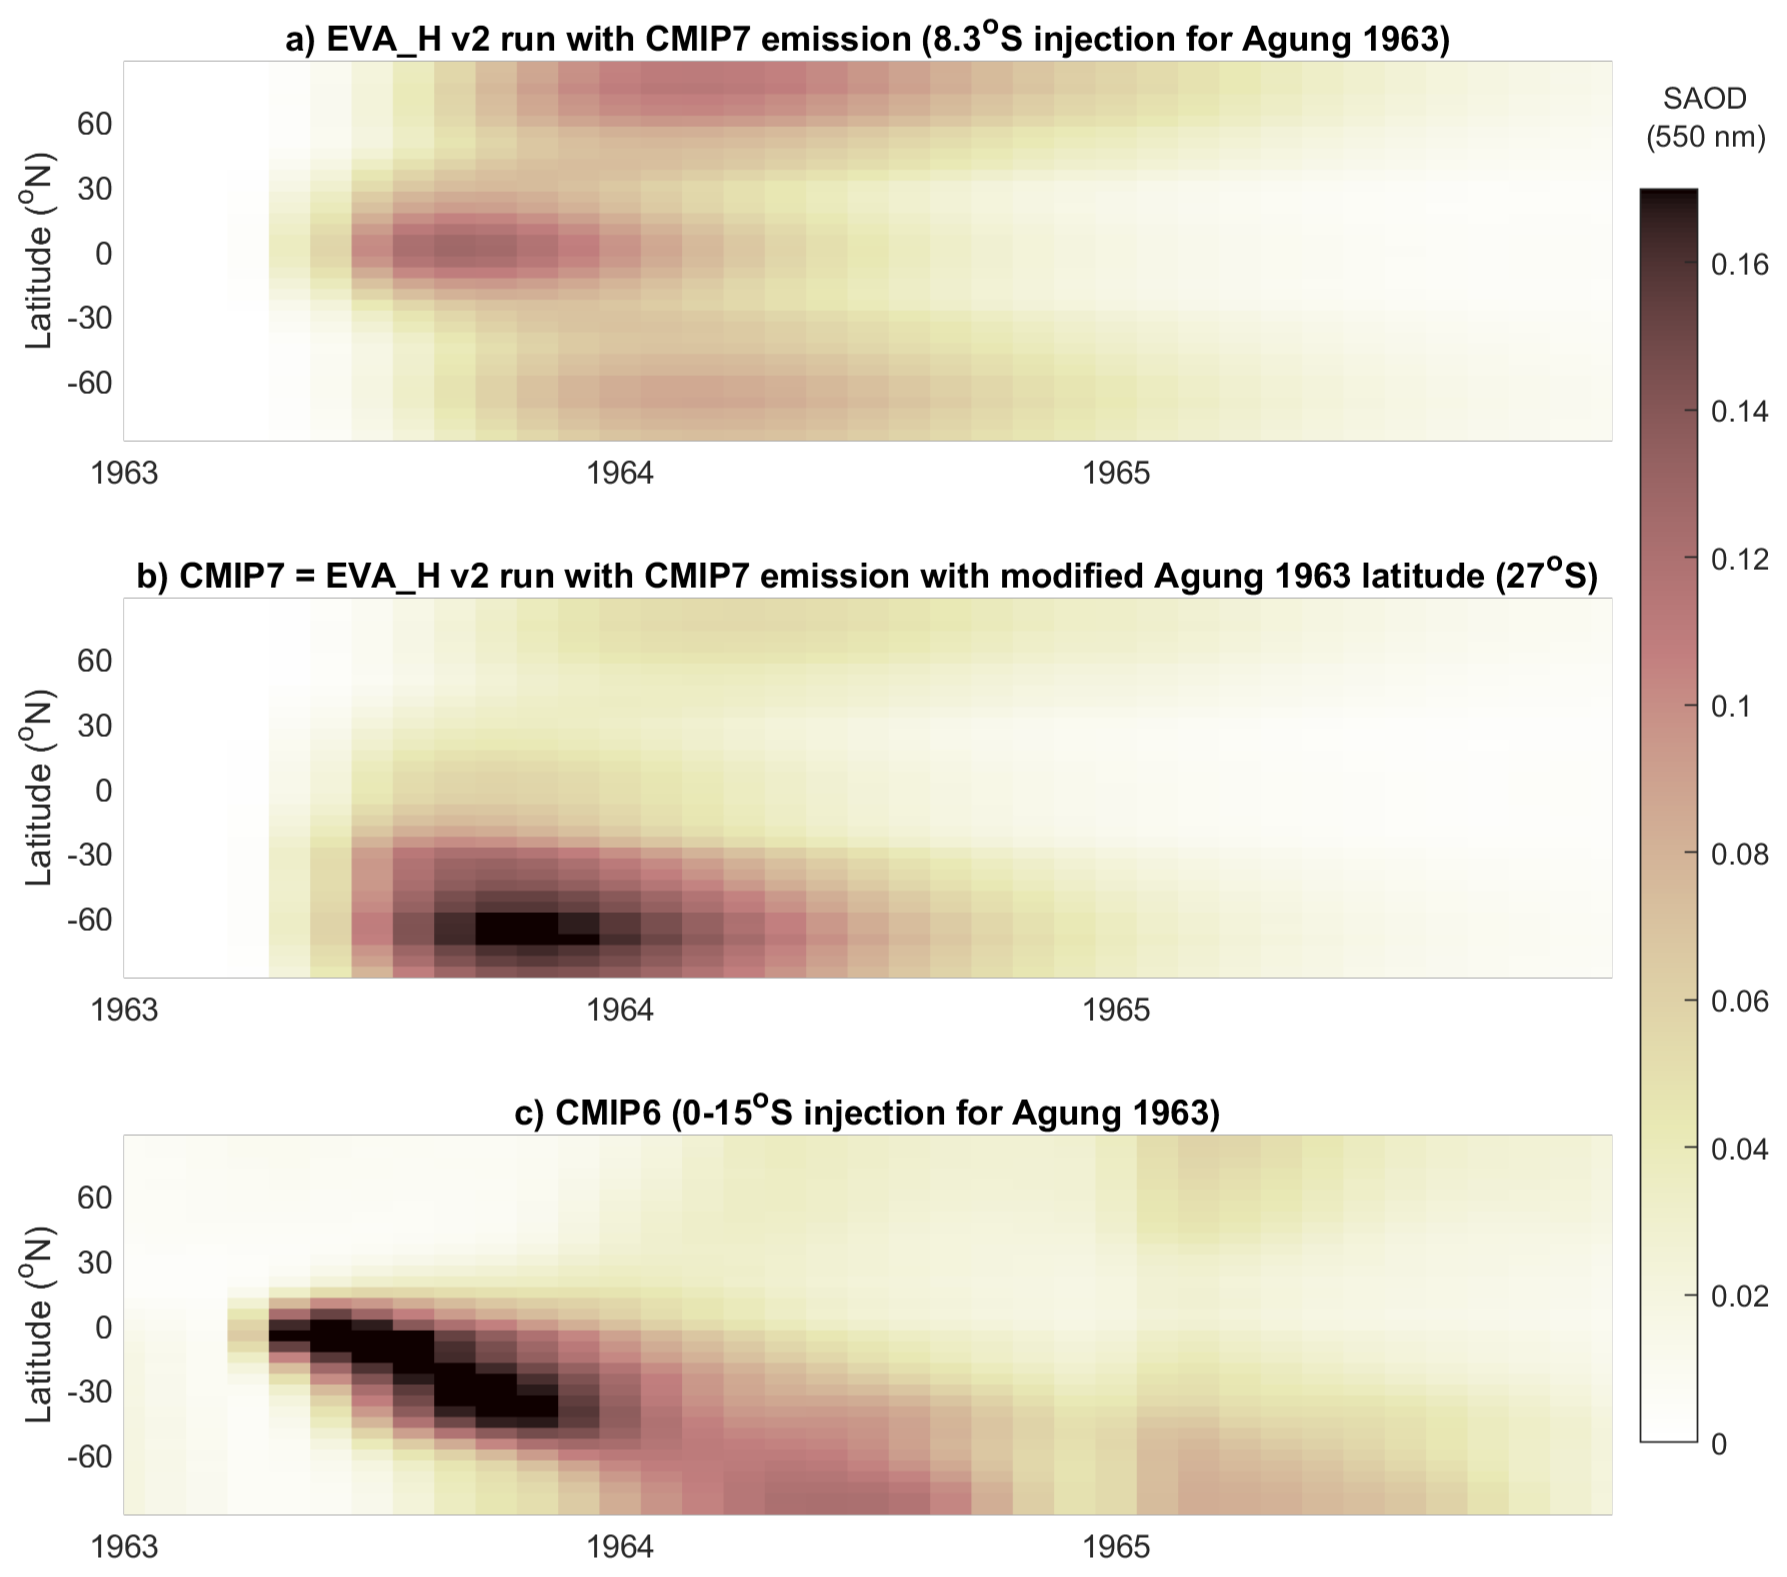
Figure 7SAOD (550 nm) for the 1963–1966 period, mostly characterized by the Agung 1963 eruptions. Panel (b) and (c) respectively show the CMIP7 and CMIP6 datasets, whereas panel a shows what the CMIP7 dataset would have been if we had not used a modified latitude for Agung SO2 injection (27° S instead of 8.3° S) to ensure a stronger Southern Hemisphere forcing.
To produce the full (1750–2023) extinction dataset, we simply merge the 1979–2023 extinction dataset from GloSSAC (Sect. 2.2 and Kovilakam et al., 2020) with the 1750–1981 emission-derived extinction dataset. To harmonize both datasets and avoid a small but steep jump in extinction values at the start of the GloSSAC period (January 1979), for 1979–1981, extinction coefficients are a weighted average of the emission-derived (using EVA_H v2) and GloSSAC extinction coefficients, with the GloSSAC weight linearly increasing from 0 in January 1979 to 1 in December 1981 (Fig. 8). The start of the period is imposed by the start of the GloSSAC dataset, whereas we chose December 1981 to avoid merging over a period with large SAOD perturbations associated with the El Chichón eruptions in 1982. Over 1979–1981, GloSSAC and the emission-derived extinction are in good agreement in terms of latitudinal distribution (Fig. 8c–f). However, both at 525 (Fig. 8a) and 1020 nm (Fig. 8b), the emission derived-dataset has ≈ 25 %–30 % smaller SAOD values over the volcanically quiescent 1979 year. This discrepancy comes from differences in GloSSAC between SAOD values for volcanically quiescent year 1979 and years 1998–2001, our chosen period to define the non-volcanic background. The differences might either be caused by trends in background stratospheric aerosols not matching the assumptions we made (Sect. 4.1 and Fig. 6), and/or by inconsistencies or quality issues in the GloSSAC dataset before and after 1984, from when SAGE II measurements are used (Kovilakam et al., 2020). Furthermore, for small-to-moderate magnitude eruptions in 1980 (including St Helens, ≈ 0.9 Tg SO2 at 27 km and 46° N, and Ulawun, ≈ 0.2 Tg SO2 at 20 km and 5° S) and 1981 (including Alaid, ≈ 1.1 Tg SO2 at 15 km and 51° N and Pagan, ≈ 0.3 Tg SO2 at 20 km and 18° N), the emission-derived SAOD perturbations are greater than GloSSAC. This could be caused by errors in GloSSAC, in the emission dataset, or/and biases in EVA_H v2. Altogether, although these differences are relatively small in absolute term (< 0.01 in terms of global mean SAOD, Fig. 8), they show why a smooth transition from the emission-derived dataset to GloSSAC extinction is required.
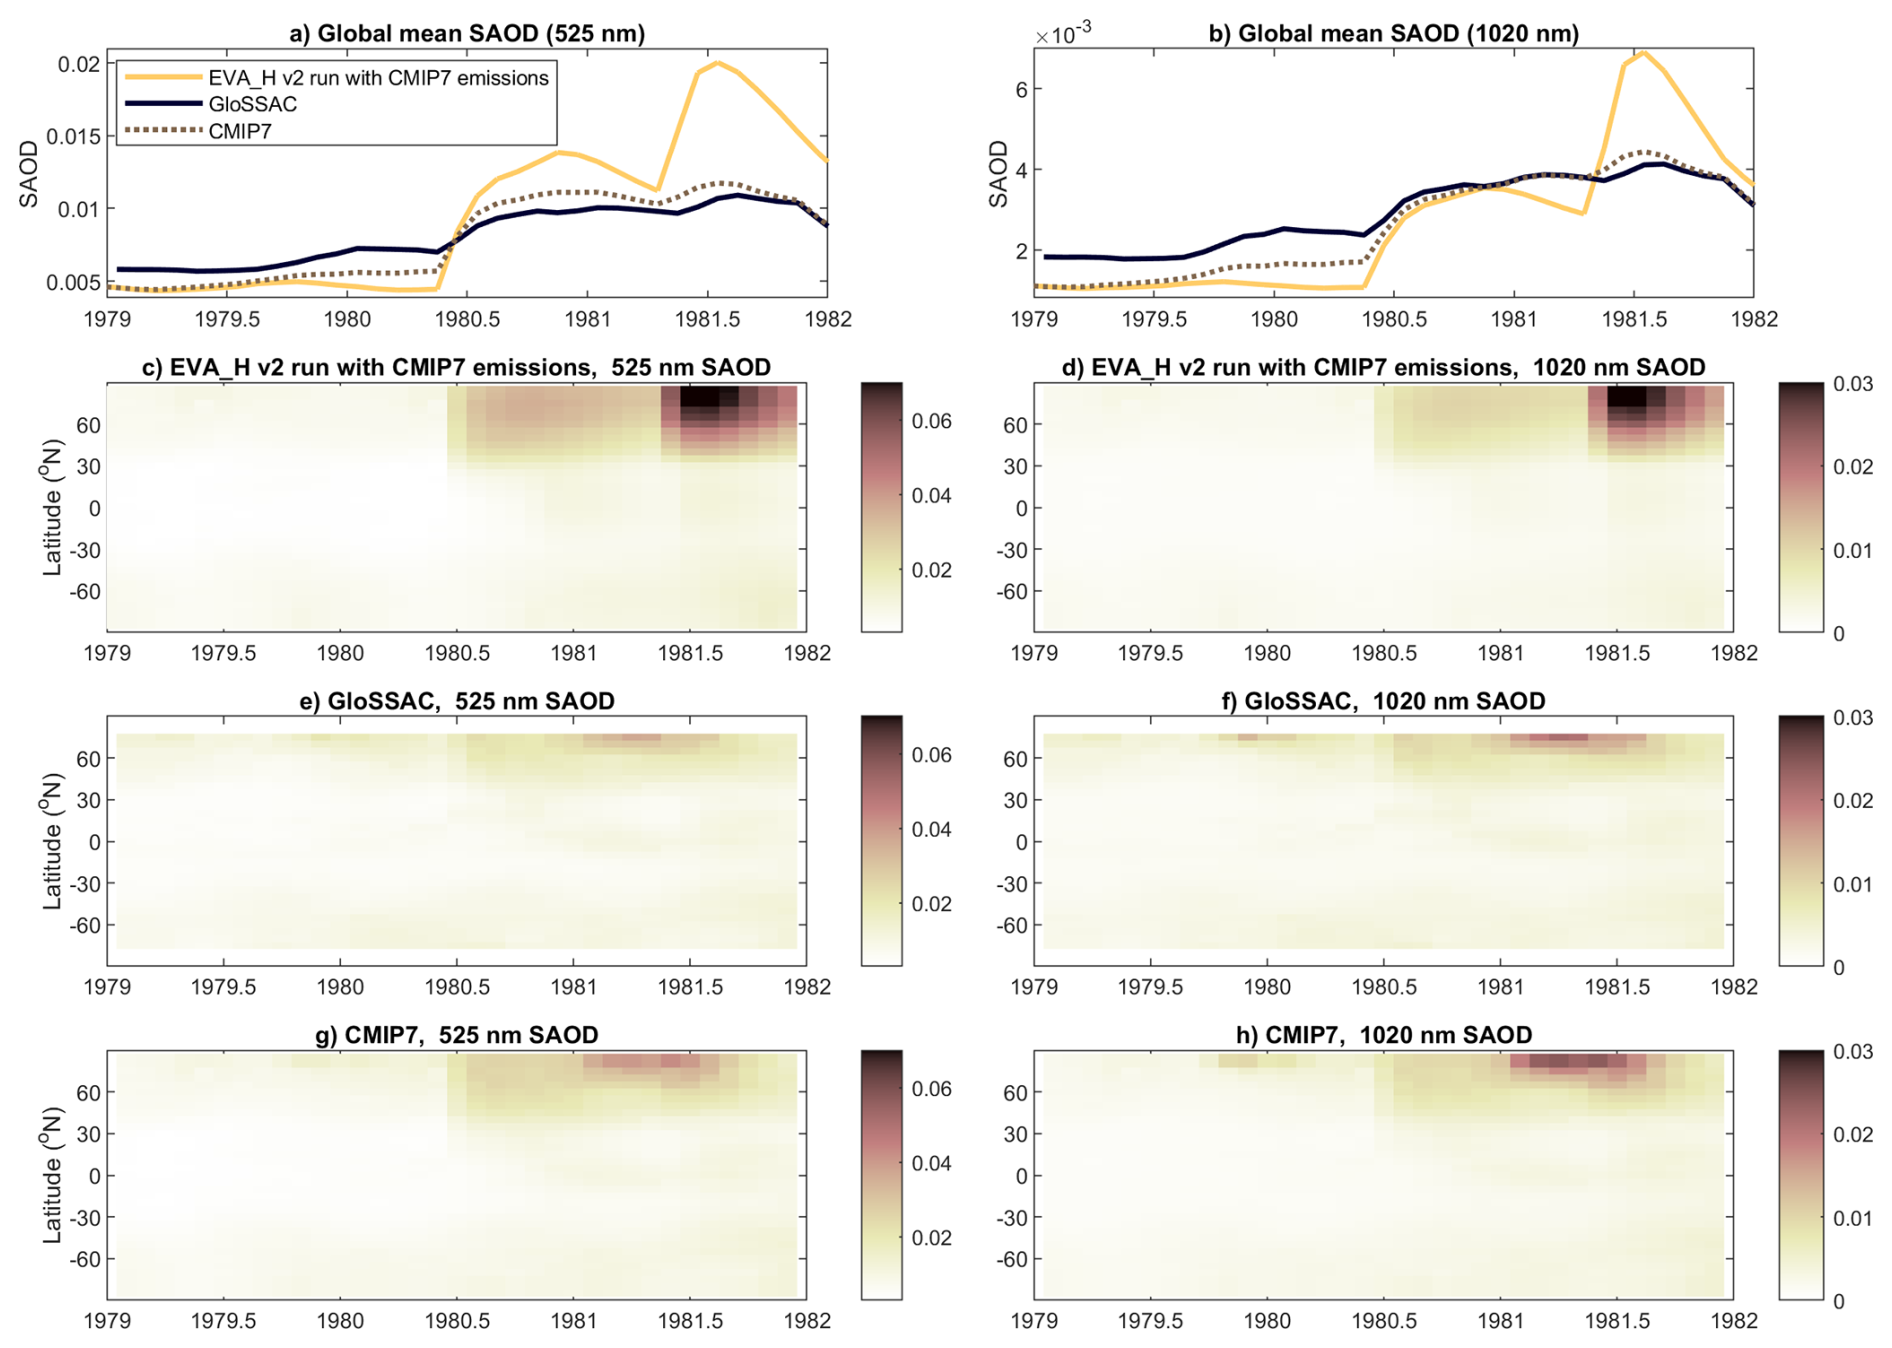
Figure 8Merging of CMIP7 pre-satellite (EVA_H v2 run from CMIP7 emissions) and satellite (GloSSAC) era datasets over 1979–1981, illustrated for SAOD at 525 nm (left) and 1020 nm (right). The top panels (a, b) show the global mean SAOD, whereas bottom panels (c–h) show the SAOD.
4.3 Production of historical stratospheric aerosol optical properties
Table 2Summary of variables provided in the CMIP7 stratospheric aerosol optical property dataset.
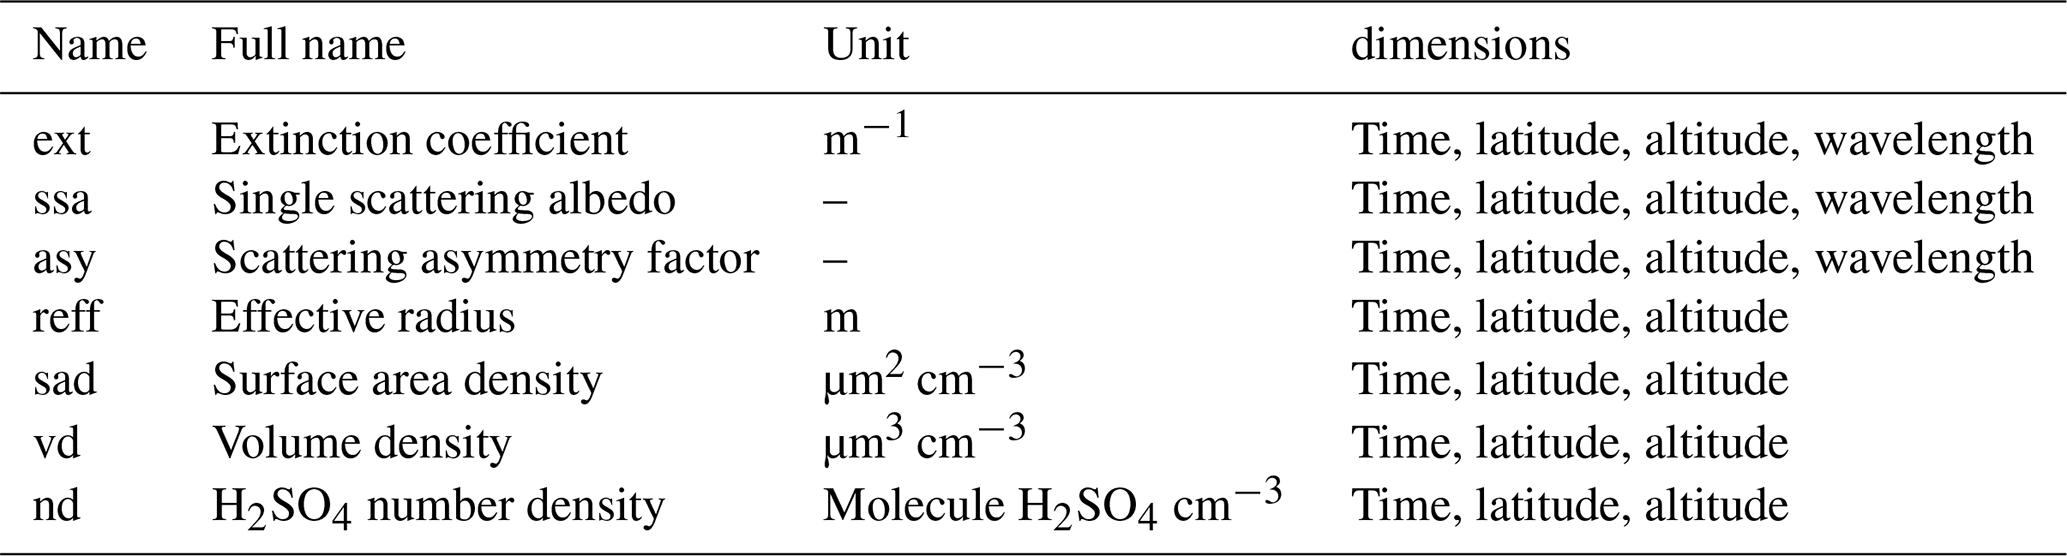
Table 2 shows the variables provided in the CMIP7 aerosol optical property dataset. All variables are provided as zonal averages. Each variable has dimensions of time, latitude and height, with ext, ssa and asy additionally depending on wavelength. Time ranges from January 1750 to December 2023 with monthly resolution. Latitude ranges from −87.5° S to 87.5° N with resolution of 5°. Height ranges from 5 to 39.5 km a.s.l. with a resolution of 0.5 km. We provide ext, ssa and asy at the following 41 wavelengths (in µm): 0.16, 0.23, 0.3, 0.39, 0.46, 0.525, 0.53, 0.55, 0.61, 0.7, 0.8, 0.9, 1.01, 1.02, 1.27, 1.46, 1.78, 2.05, 2.33, 2.79, 3.418, 4.016, 4.319, 4.618, 5.154, 6.097, 6.8, 7.782, 8.02, 8.849, 9.708, 11.111, 13.157, 15.037, 17.699, 20.0, 23.529, 35, 50, 75, and 100. This list includes:
- i.
wavelengths required by the Rapid Radiative Transfer Model commonly used in multiple climate models, e.g., by EC-Earth (Serva et al., 2024).
- ii.
wavelengths that are key to building the dataset, i.e., GloSSAC wavelengths (0.525 and 1.02 µm) and 0.550 used by the reduced-complexity aerosol model EVA_H v2.
- iii.
Additional wavelengths chosen to have a relatively regularly spaced (in logarithmic space) set of wavelengths.
To produce the full aerosol optical property dataset (Table 2, with wavelengths listed above) from the extinction at 525 and 1020 nm dataset (Sect. 4.2), we:
-
Derived the effective radius from the ratio of 525 to 1020 nm extinction coefficient using the EVA_H v2 Mie look-up table (Sect. 3.3). As in EVA_H v2, we impose a minimum local effective radius of 0.06 µm.
-
Derived all other properties at the list of wavelength provided above from the extinction at 525 nm and the effective radius using the same look-up tables. These properties are provided at the specified wavelength, and do not reflect an average over any wavelength band.
Select examples of other variables are compared with CMIP6 in Sect. 5.
4.4 Production of pre-industrial and scenario aerosol optical properties
As in CMIP6 (Eyring et al., 2016), the pre-industrial control stratospheric aerosol optical property climatology is chosen to be the monthly mean climatology averaged over the period covered by historical simulations, i.e. 1850–2021 (Dunne et al., 2025). For each variable provided (Table 2), we thus provide a 12-month climatology directly calculated from the 1850–2021 average of the corresponding variable in the historical dataset. We took an unweighted average for all variables provided, which is different from CMIP6 where the climatology for single scattering albedo and asymetry were calculated as weighted averages (the weights for single scattering albedo being the extinction; the weights for assymetry being the product of extinction and single scattering albedo). Although such averaging would be preferable, we expect it to have moderate impacts on pre-industrial forcing, with initial testing with the NorESM model suggesting a pre-industrial net top-of-the-atmosphere radiative forcing of −0.28 W m−2 when using the files we provided, vs −0.23 W m−2 when using weights to calculate historical averages of single scattering albedo and asymmetry (communication from Dirk Olivié through the Input4MIPs GitHub, https://github.com/PCMDI/input4MIPs_CVs/discussions/175#discussioncomment-16397980, last access: 5 May 2026). Because this mistake was detected too late and for consistency with the ozone forcing dataset that was created using our unweighted pre-industrial climatologies, we recommend that modelling centers use our pre-industrial files as provided and do not create their own pre-industrial files with weighted averages for variables other than extinctions.
The pre-industrial dataset to be used in CMIP7 is version 2.2.1. As in CMIP6 ScenarioMIP (O'Neill et al., 2016), stratospheric aerosol optical properties are the same as in pre-industrial simulations, with a 9-year linear ramp (instead of 10 in CMIP6 ScenarioMIP) to that climatology from the end of the historical period (i.e. December 2021) (Fig. 9). The scenario dataset to be used in CMIP7 is version 2.2.2. Note that the scenario files version 2.2.2 start in January 2022 even though version 2.2.1 of historical datasets go up to December 2023 and source datasets for extension to December 2024 are already available. In particular, over 2022–2023, scenario forcings will not include the stratospheric aerosol forcing associated with the Hunga Tonga Hunga Ha'apai 2022 eruption, characterized by a global mean SAOD perturbation of ≈ 0.008 (Fig. 9), around 15 times less than the Pinatubo 1991 eruption. In addition to the stratospheric aerosol net negative radiative forcing, the Hunga eruption injected 146 Tg of water into the stratosphere (Millán et al., 2022), which was associated with a positive radiative forcing. Although our scenario dataset and ScenarioMIP forcing will not account for this eruption, the surface temperature impacts of both the aerosol and water vapor forcing are expected to be negligible, with the combined impact assessed to be a net surface cooling (APARC, 2025) despite initial debates on whether water warming or aerosol cooling would dominate (e.g. Jenkins et al., 2023; Schoeberl et al., 2024). Should the CMIP7 Climate Forcing Task Team provide regular update of their datasets and a dataset for Hunga Tonga water forcing, as recommended by Hewitt et al. (2025) and Naik et al. (2025), modelling groups will be able to extend CMIP7 Fast Track historical simulations and account for this unique eruption.
The current stratospheric aerosol forcing implementation in ScenarioMIP has two main limitations:
-
First, a constant volcanic forcing equal to the historical average. Bethke et al. (2017) and Chim et al. (2025) show the key role volcanic forcing could have on climate variability in ScenarioMIP projections, with Chim et al. (2025) demonstrating that projection uncertainty associated with volcanic forcing exceeds that associated with internal climate variability. The mean 1850–2021 volcanic forcing might also underestimate the true mean forcing expected from long-term records of volcanic eruptions (e.g. Sigl et al., 2022; Chim et al., 2025).
-
Second, as in CMIP6, pre-industrial experiments and any ScenarioMIP experiment will have the same prescribed stratospheric aerosol forcing. However, both the non-volcanic stratospheric aerosol background (Fig. 9, UKESM simulations from Chim et al., 2023) and volcanic forcing (Aubry et al., 2021a) are dependent on other forcings and/or the background climate state. Further work is required to constrain these dependencies and provide modelling groups with stratospheric aerosol dataset accounting for these feedbacks and for emission of emergent stratospheric aerosol sources (e.g. spacecraft emission, Murphy et al., 2023) in future CMIP versions. Models with interactive stratospheric aerosol capabilities, which can perform emissions-driven historical runs consistently thanks to the provision of a dedicated volcanic SO2 historical emission dataset (Sect. 2.1 and Aubry et al., 2026) and stochastic future volcanic SO2 emission scenarios (upcoming in Romero-Prieto et al., 2025), will account for these feedbacks.
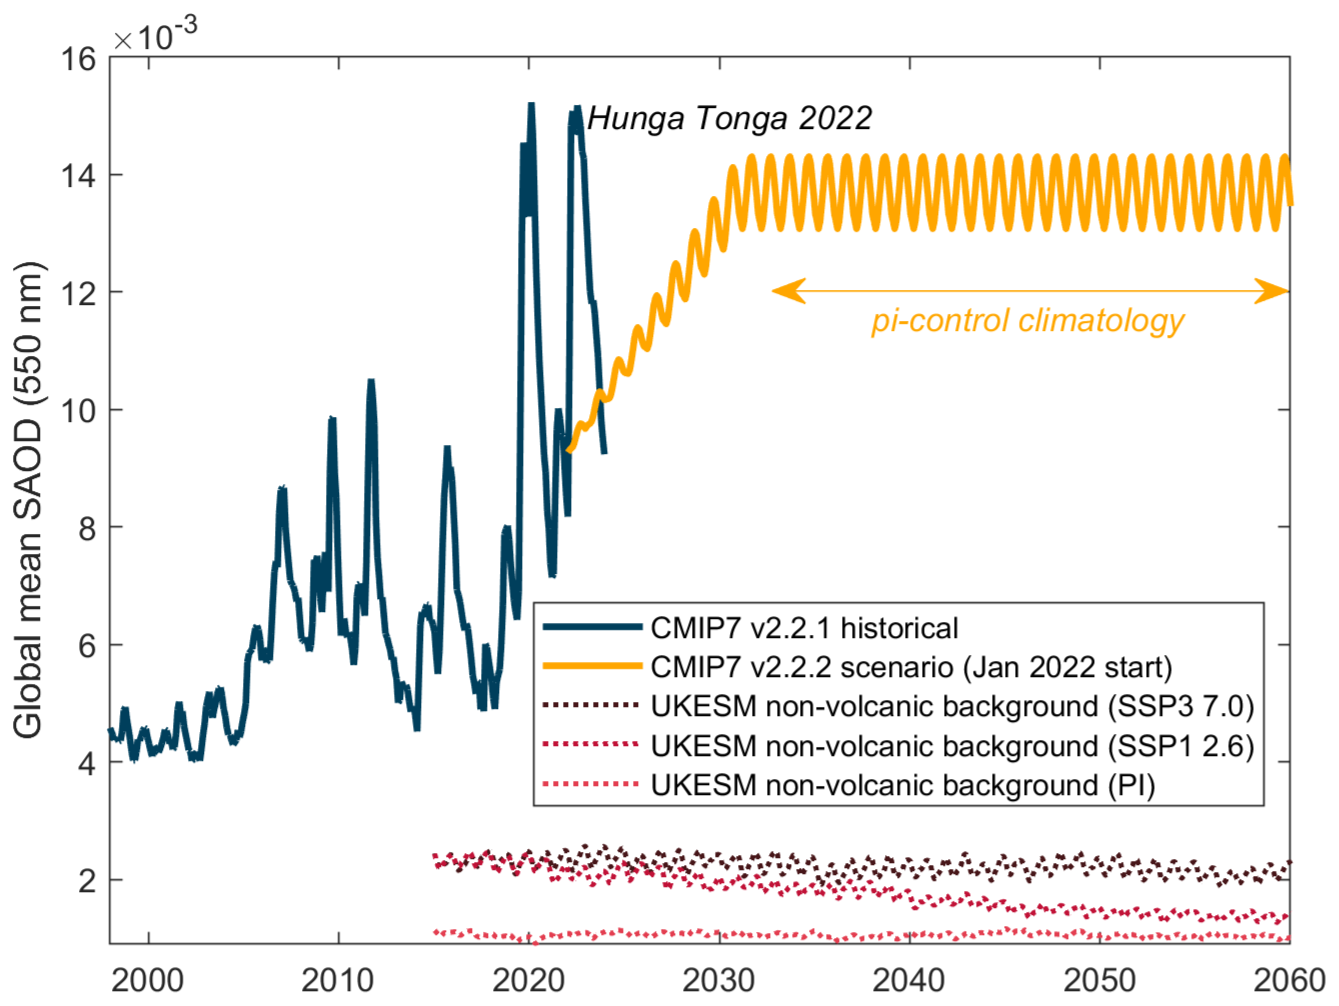
Figure 9Transition from historical (blue) to scenario (yellow) SAOD. From 2033 onwards, the scenario optical properties are also the same as the pre-industrial ones. Dotted lines show the non-volcanic stratospheric aerosol background as simulated by UKESM v1.1 (with interactive stratospheric aerosol, Chim et al., 2023) using CMIP6 SSP3-7.0 (dark red), SSP1-2.6 (red) and preindustrial control (light red, arbitrary time axis) forcings.
4.5 Production of dataset on bespoke wavelength grid
To facilitate use of our dataset in any radiative model, we provide the community with scripts that can be used to interpolate the files we provide on Earth System Grid Federation (ESGF) to any list of wavelength ranges inputted by the user. Optical property, p, at wavelength band i is computed from the weighted integral over the band wavelength range λ0 to λ1 as
where Bλ is the spectral irradiance, and w is a property dependent weight. For extinction, w=1, for the single scattering albedo, w is the extinction, and for the asymmetry factor, w is the extinction multiplied by the single scattering albedo. This is implemented by assuming a Planck function for the irradiance and linearly interpolating the original dataset onto a higher-resolution grid that is used for numerical summation. A simpler, less costly, linear interpolation method using band midpoints is also provided, but this is less accurate, particularly over broad bands, and therefore not generally recommended. All scripts are accessible at https://github.com/MetOffice/CMIP7_volcanic_aerosol_forcing/ (last access: 5 May 2026). Modelling groups tweaking these scripts or using a different approach should simply document it.
5.1 Historical (1750–2023) 550 nm stratospheric aerosol optical depth
Figure 10 compares CMIP6 and CMIP7 global mean 550 nm SAOD time series, focusing on 1850 onwards. The two datasets are unsurprisingly in close agreement for the satellite era, a period for which they both used GloSSAC. Minor disagreements are apparent over: (i) 1979–1982, the period over which our dataset is a weighted average of GloSSAC and our emission-derived dataset (Sect. 4.2, Fig. 8); (ii) the Pinatubo 1991 eruption, with peak SAOD roughly 10 % higher in CMIP7 owing to GloSSAC revisions (Aubry et al., 2020; Kovilakam et al., 2020); (iii) the El Chichón 1982 eruption, with peak SAOD roughly 15 % higher in CMIP6 due to revisions in the handling of airborne lidar data used in the tropics in GloSSAC; (iv) the 2005–2017 period, where minor discrepancies likely originate from a combination of differing treatment of the tropopause height and dataset masking, as well as differing effective radius values, with CMIP7's values unrealistic owing to the lack of multiwavelength information in GloSSAC for that period (Sect. 2.2). However, the most important discrepancies are before 1979, the onset of the satellite era. There are numerous instances in which only one dataset exhibits a SAOD perturbation, including for perturbations larger than 0.02. Overall, the CMIP7 dataset contains more eruptions for the 1850–1960 period, whereas the CMIP6 dataset contains more for 1960–1980. This results in a global mean SAOD of 0.0135 for CMIP7 piControl climatology, 26 % higher than the 0.0107 value for CMIP6. Beyond eruption occurrence, disagreements also exist on the magnitude of SAOD perturbations, with the CMIP7 dataset having notably higher perturbations for the early 1860's unidentified eruption (attributed to Kie Besi 1861 in CMIP7, Aubry et al., 2026), a cluster of eruptions injecting 0.6–3 Tg SO2 in 1885–1886, the Tarawera 1886 eruption or the Ksudach 1907 eruption. CMIP6 has greater perturbations for the Suwanosejima 1889 and Santa Maria 1902 eruptions. Furthermore, the latitudinal distribution of SAOD can also disagree between the two datasets, even for eruptions they have in common (Fig. 11b–i), e.g. in the early 1860s, or late 1890s. Hemispherically uniform perturbations in CMIP6, caused by scaling of single-station pyrheliometer measurements to entire hemispheres (Fig. 1), are absent in CMIP7. Last, CMIP7 also includes the 1750–1849 period (Fig. 11a) to facilitate the running of historical simulations starting in 1750. This period is characterized by much stronger forcing than the “standard” CMIP historical period (1850–present day), with eruptions of Kie Besi (1760), Laki (1783–1784), an unidentified volcano (1809), Tambora (1815), Zavaritzki (1831) and Cosiguina (1835) ranging from 10–56 Tg SO2 and totaling 190 Tg SO2 among them.
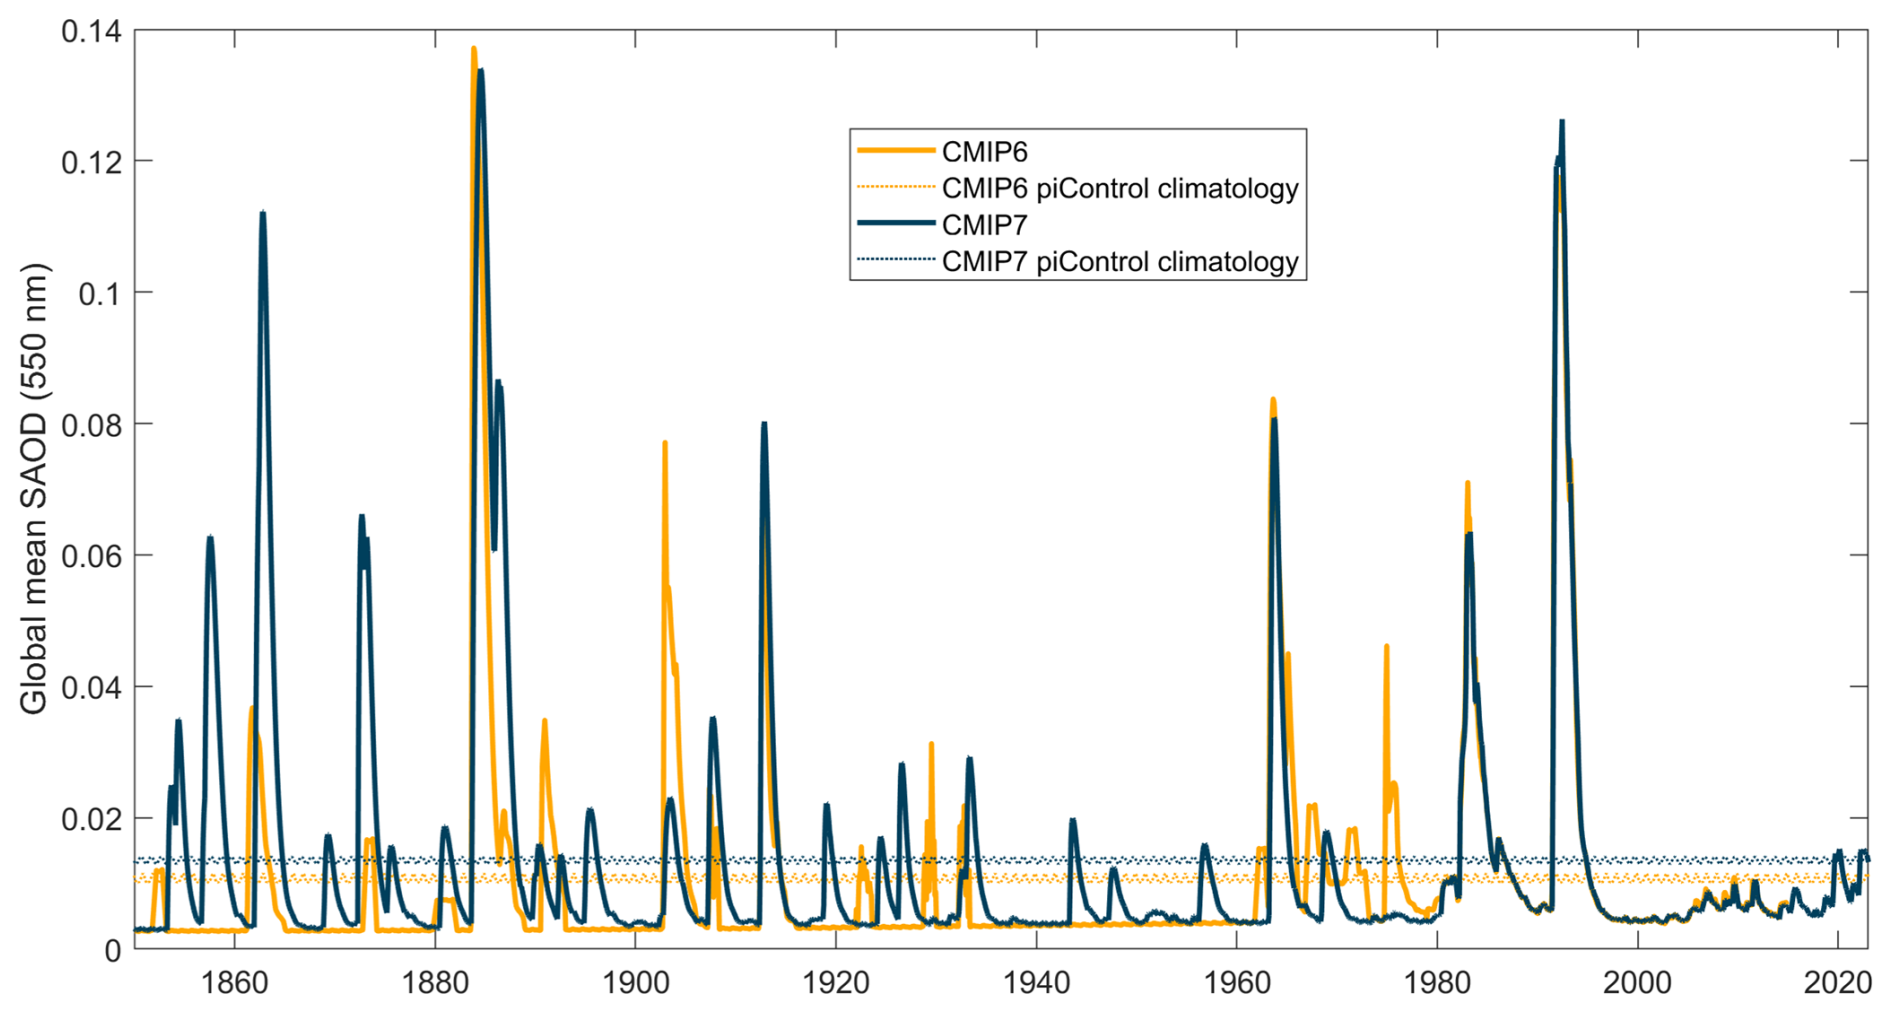
Figure 10Global mean SAOD at 550 nm for CMIP6 and CMIP7, from 1850 onwards. Thin lines show the piControl climatology, obtained from the 1850–2014 and 1850–2021 climatology for CMIP6 and CMIP7, respectively.
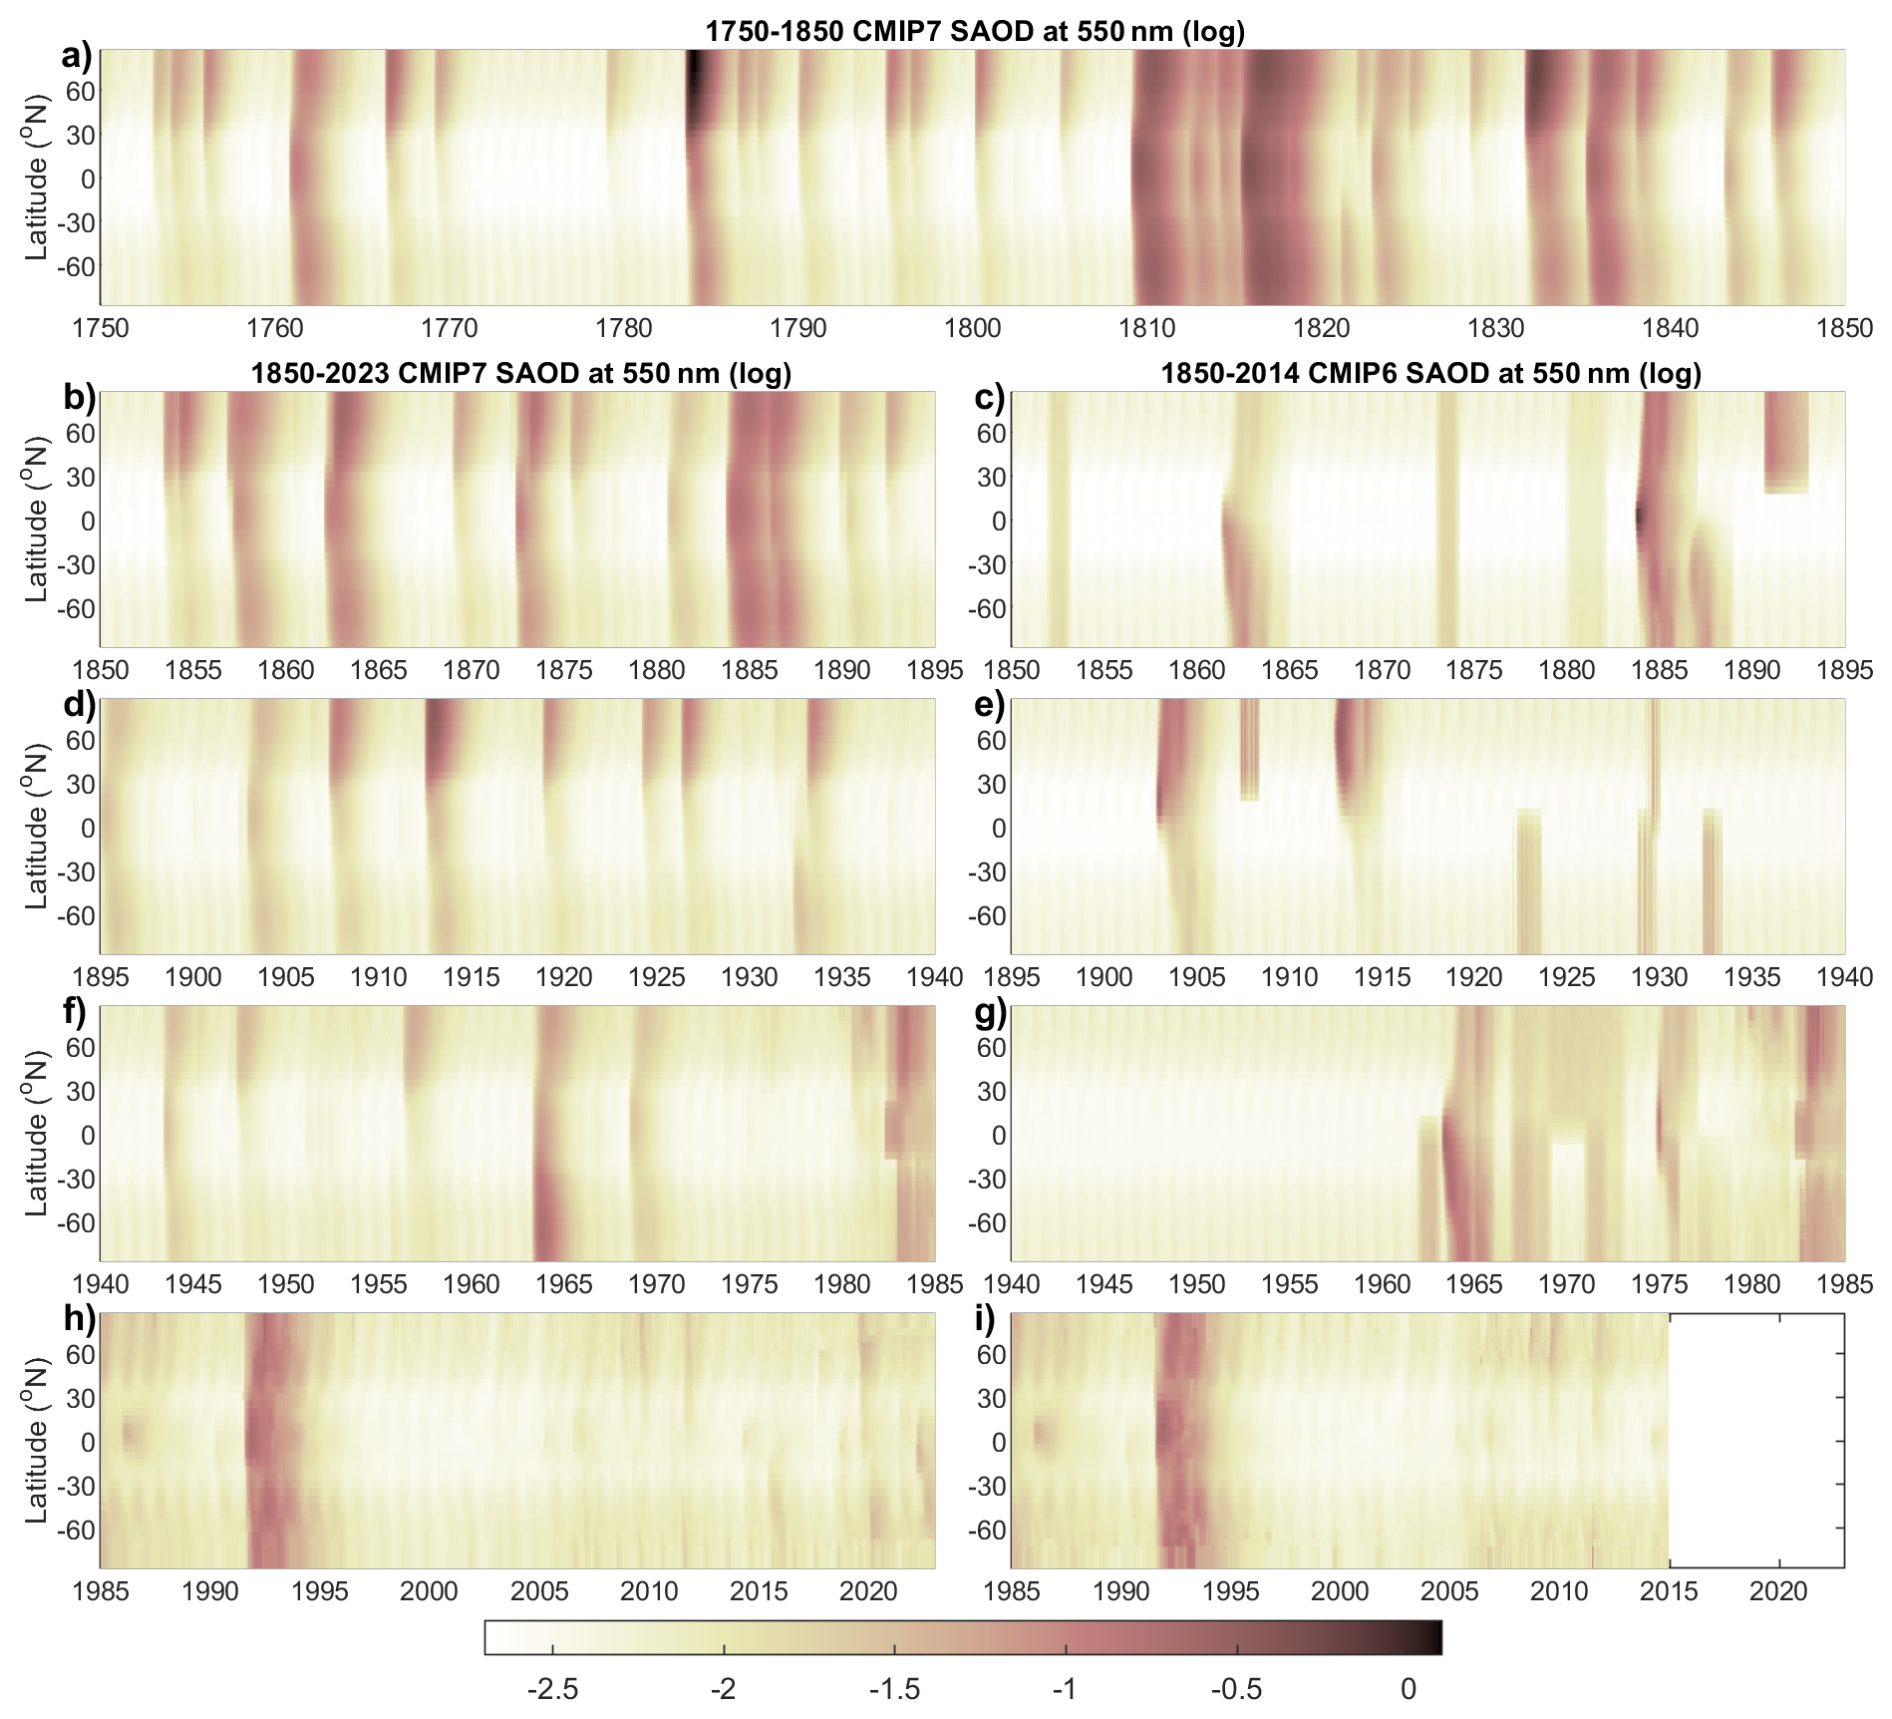
Figure 11Latitudinal distribution of SAOD at 550 nm (logarithmic scale) for CMIP7 (left, panels a, b, d, f and h) and CMIP6 (right, panel c, e, g and i). For CMIP7, the top panel (a) shows 1750–1850 which is not included in CMIP6.
We acknowledge that the differences between the CMIP6 and CMIP7 datasets will motivate questions regarding which dataset is better, especially for the pre-satellite era. When it comes to the magnitude and spatial distribution of the forcing at any specific time, both datasets are highly uncertain. Volcanic SO2 emission parameters used in both CMIP6 (for 7 eruptions) and CMIP7 are uncertain (e.g., Verkerk et al., 2025), although the CMIP7 emission inventory (Aubry et al., 2026) relies on source datasets that better reflect the state of the art in the ice-core and volcanological communities (Sigl et al., 2015; Toohey and Sigl, 2017; Aubry et al., 2021b; Fang et al., 2023; Global Volcanism Program, 2025) compared to CMIP6, which used Gao et al. (2008) as primary source for emissions. In particular, the CMIP7 approach enables us to make progress on the strong bias in the representation of small-to-moderate magnitude eruptions in CMIP6, albeit this is achieved by relying on an ice-core characterized by very high uncertainties (Fang et al., 2023) complemented by the geological record (Global Volcanism Program, 2025), which requires ad-hoc assumptions for SO2 masses. CMIP6 used a more sophisticated aerosol model (AER2D, Arfeuille et al., 2014) than CMIP7 (EVA_H v2, Sect. 3) to translate emissions into stratospheric aerosol optical properties. However, given large uncertainties in state-of-the-art interactive stratospheric aerosol models (Clyne et al., 2021; Quaglia et al., 2023), the use of a more sophisticated model does not imply greater accuracy. The provision of a volcanic SO2 emission dataset for CMIP7 (Fig. 3 and Aubry et al., 2026) will ultimately foster the development of interactive stratospheric aerosol models, and in turn inform our understanding of stratospheric aerosol forcing and climate impacts. Last, unlike CMIP7, CMIP6 attempted to make use of observational pyrheliometer data to constrain pre-satellite era forcing (Fig. 1). However, the scarcity of measurements, the reliance on single stations (for most months) to derive global-scale aerosol optical properties, and the conversion of pyrheliometer measurement into SAOD are also subject to high uncertainties. Overall, we thus recommend to not consider either dataset superior to the other for any specific month or year, and highlight the need for further evaluation.
5.2 Potential implications for simulating historical climate in CMIP7
The changes in mid-visible SAOD in CMIP7 relative to CMIP6 might have implications for simulating the historical climate in CMIP7. To provide an initial assessment, we estimate the global annual mean top-of-the-atmosphere effective radiative forcing (ERF) associated with each forcing dataset using the scaling from Marshall et al. (2020):
where ΔSAOD is the global annual mean 550 nm SAOD anomaly, calculated with respect to the minimum historical value. We then simulate global mean surface temperature using FaIR v2.1.4 (Smith et al., 2018; Leach et al., 2021), a reduced-complexity climate model calibrated using emissions from the IPCC Sixth Assessment Report (calibration 1.4.1, Smith et al., 2024). We force FaIR with historical CMIP6 greenhouse gases, ozone and aerosol precursor emissions and solar and land use forcings from the RCMIP dataset (Nicholls et al., 2020). Forcings linked to aerosol-radiation interaction, aerosol-cloud interaction, ozone, light absorbing particles on snow and ice, and stratospheric water vapor are calculated by the model based on emissions. We run two ensembles of simulations for the CMIP6 and CMIP7 volcanic forcing time series, where volcanic forcing is expressed in FaIR as an anomaly with respect to the pre-industrial climatology, i.e. 1850–2014 mean and 1850–2021 mean for the CMIP6 and CMIP7, respectively.
Consistent with SAOD (Fig. 10), both the stratospheric aerosol radiative forcing (Fig. 12a) and simulated global mean surface temperature (Fig. 12b) are lower in CMIP7 for 1850–1900, with CMIP7 forcing being more negative by up to 1.5 W m−2, and associated temperatures cooler by up to 0.2 °C. The greatest change occurs after the unidentified 1860 eruption, but overall, over 1850–1900, the radiative forcing is typically more negative in CMIP7. Also consistent with SAOD changes, for 1963–1982, CMIP6 radiative forcing is more negative by up to 1 W m−2, and associated temperatures cooler by up to 0.05 °C.
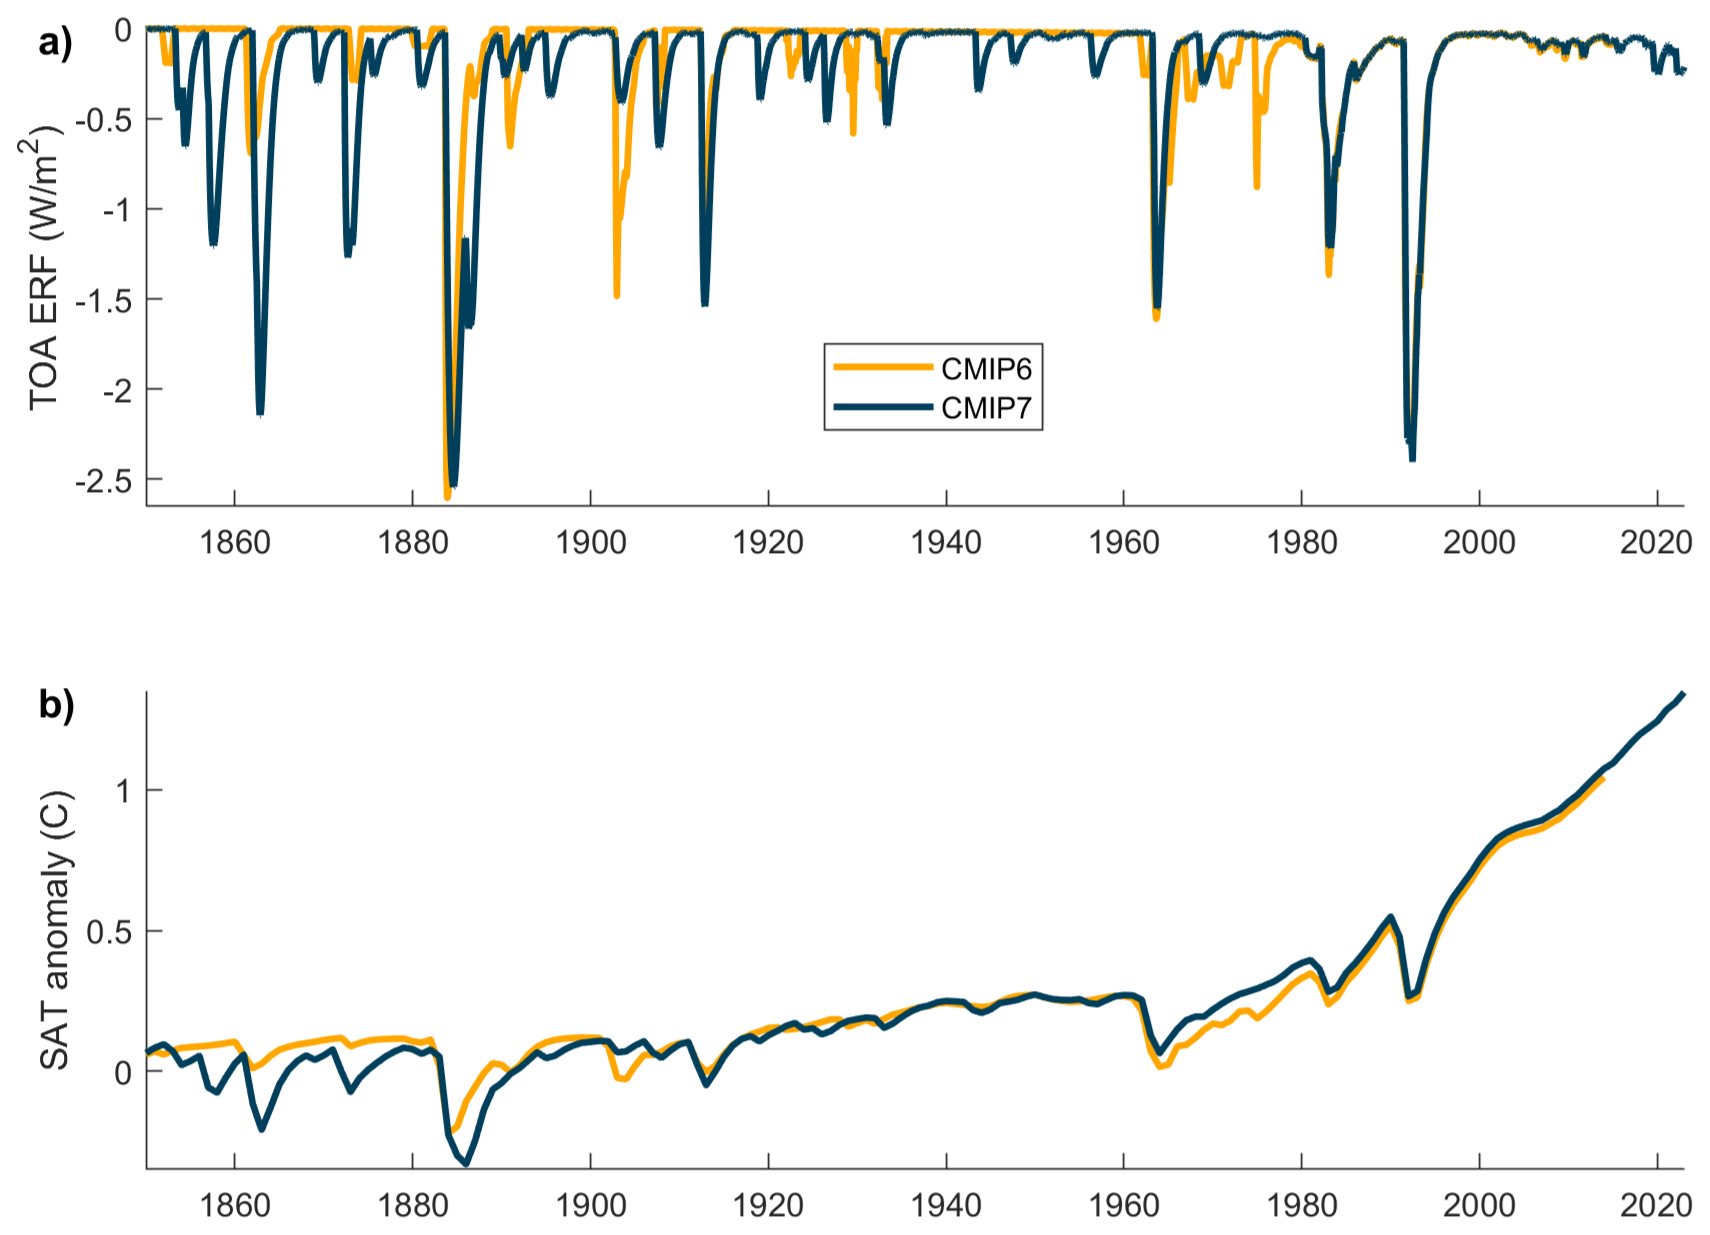
Figure 12Global mean top of the atmosphere (TOA) effective radiative forcing (ERF) (top, a) and surface air temperature (SAT) anomaly relative to pre-industrial (bottom, b) for CMIP6 and CMIP7, for 1850–2023.
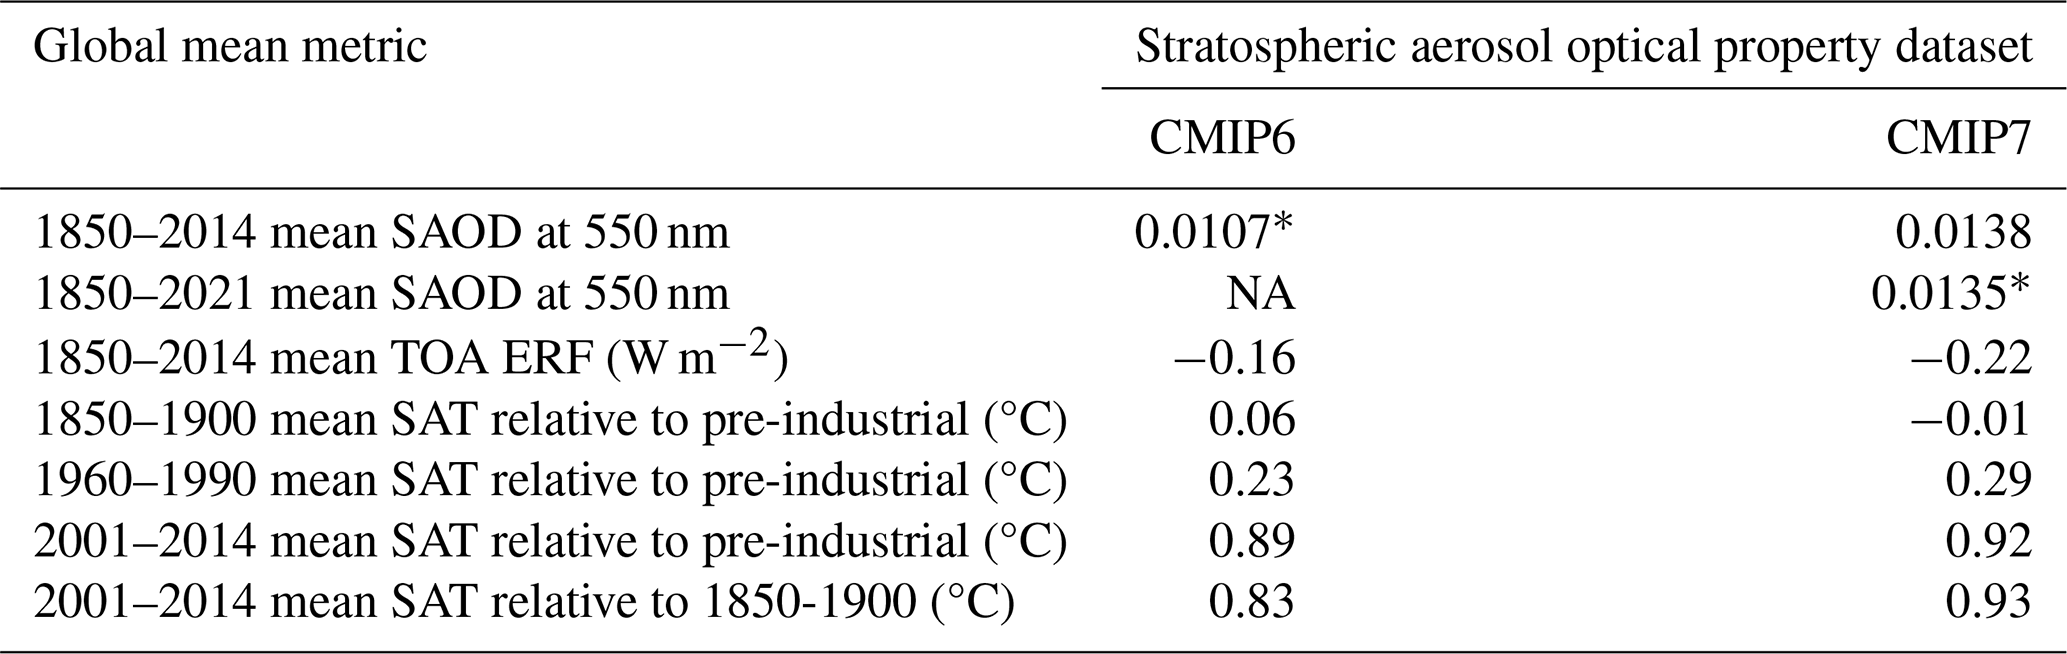
Table 3 summarizes key metrics in terms of global mean SAOD, effective radiative forcing and surface air temperature associated with each dataset. Over 1850–2014 (the period common to CMIP6 and CMIP7), the CMIP7 mean SAOD (0.0138) and radiative forcing (−0.22 W m−2) are amplified by 29 % and 37 % compared to CMIP6 (0.0107 SAOD, −0.16 W m−2 forcing). Preindustrial control simulations, forced by the historical mean forcing, are cooler by 0.03 °C in CMIP7 compared to CMIP6 (not shown). Last, relative to their respective pre-industrial baseline, simulations forced by the CMIP7 stratospheric aerosol dataset are 0.07 °C cooler than CMIP6 over 1850–1900, but 0.03 °C warmer over 2001–2014. Relative to 1850–1900, a key reference period for assessment reports by the Intergovernmental Panel on Climate Change (IPCC, 2021), simulated 2000–2014 global mean surface temperatures are thus warmer by 0.1 °C when using the CMIP7 stratospheric aerosol dataset instead of the CMIP6 one. Over 1960–1990, the period in which CMIP6 models are affected by a cold bias (e.g. Flynn and Mauritsen, 2020; Zhang et al., 2021), simulations forced by the CMIP7 dataset are 0.06 °C warmer relative to pre-industrial (0.13 °C warmer relative to 1850–1900) compared to simulations forced by the CMIP6 dataset. Our new dataset could thus affect tuning of CMIP7 climate models, and/or for their performance in reproducing historical temperature trends.
Table 3Global mean of key metrics (SAOD, TOA ERF and SAT anomaly) for selected time period, when using CMIP6 or CMIP7 stratospheric aerosol optical properties (all other forcings as in CMIP6). The asterisks (*) highlight the global mean SAOD value characterizing the preindustrial climatology for each dataset. NA – not available
5.3 Other stratospheric aerosol properties
To complement the 550 nm SAOD comparison between CMIP6 and CMIP7 presented in Sect. 5.1, Fig. 13 compares the global stratospheric mean effective radius, surface area density, and H2SO4 number density for CMIP6 and CMIP7. The CMIP7 global mean effective radius (0.132 µm) is 12 % larger than that of CMIP6 (0.118 µm) over the common period (1850–2014). This difference is largely driven by the difference in non-volcanic background effective radius, which is 0.115 µm in CMIP7 with no trend (inconsistent with the trend in non-volcanic background SAOD), and exhibits a linear trend in CMIP6 (0.09 in 1850, reaching 0.115 in 1978). The datasets also exhibit large discrepancies over the satellite era, despite good agreement on peak effective radius for the El Chichón (1982) and Pinatubo (1991) eruptions. First, over 1980–2004, CMIP7 has larger effective radius with the notable exception of good agreement for the peak effective radius following the El Chichón (1982) and Pinatubo (1991) eruptions. Given that both datasets use GloSSAC for this time period, differences are driven by differences in methodologies to derive effective radius from multiwavelength extinction efficiency measurement. In particular, the REMAP algorithm (Jörimann et al., 2025) used in CMIP6 fits a single-mode log-normal size distribution with a variable geometric standard deviation to fit extinction efficiency measurements, whereas CMIP7 uses a bimodal lognormal distribution with fixed geometric standard deviation of 1.8 and 1.25 for smaller and larger size mode respectively (Sect. 3.3). Second, over 2005–2017, the effective radius exhibits no variability in GloSSAC because this period only has constraint on 1020 nm extinction efficiency, with 525 nm scaled from it, resulting in constant extinction ratio and thus effective radius using our methodology. In contrast, the effective radius or the standard deviation was parameterized in CMIP6 for periods with single wavelength (Jörimann et al., 2025), resulting in a more realistic, time-varying effective radius.
The CMIP7 mean surface area density (1.31 µm2 cm−3) is similar to the CMIP6 mean (1.30 µm2 cm−3) over 1850–2014. This is caused by a ≈35 % lower non-volcanic background surface area density in CMIP7 compared to CMIP6 (e.g. 0.65 µm2 cm−3 vs 1.06 µm2 cm−3 over 1998–2001) compensated by the increased number of small-to-moderate magnitude eruption pre-satellite era in CMIP7. The global 1850–2014 mean H2SO4 number density in CMIP7 (8.0×10⁸ molecules cm−3) is 60 % higher than in CMIP6 (5.4×10⁸ molecules cm−3), which is again largely driven by the increased number of eruptions pre-satellite era, with a good agreement between CMIP6 and CMIP7 over the satellite era. The enhanced H2SO4 number density over 1850–1978 might influence stratospheric ozone forcing. Overall, for all three variables shown in Fig. 13, peak values associated with the Agung (1963), El Chichón (1982) and Pinatubo (1991) eruptions are in reasonable agreement.
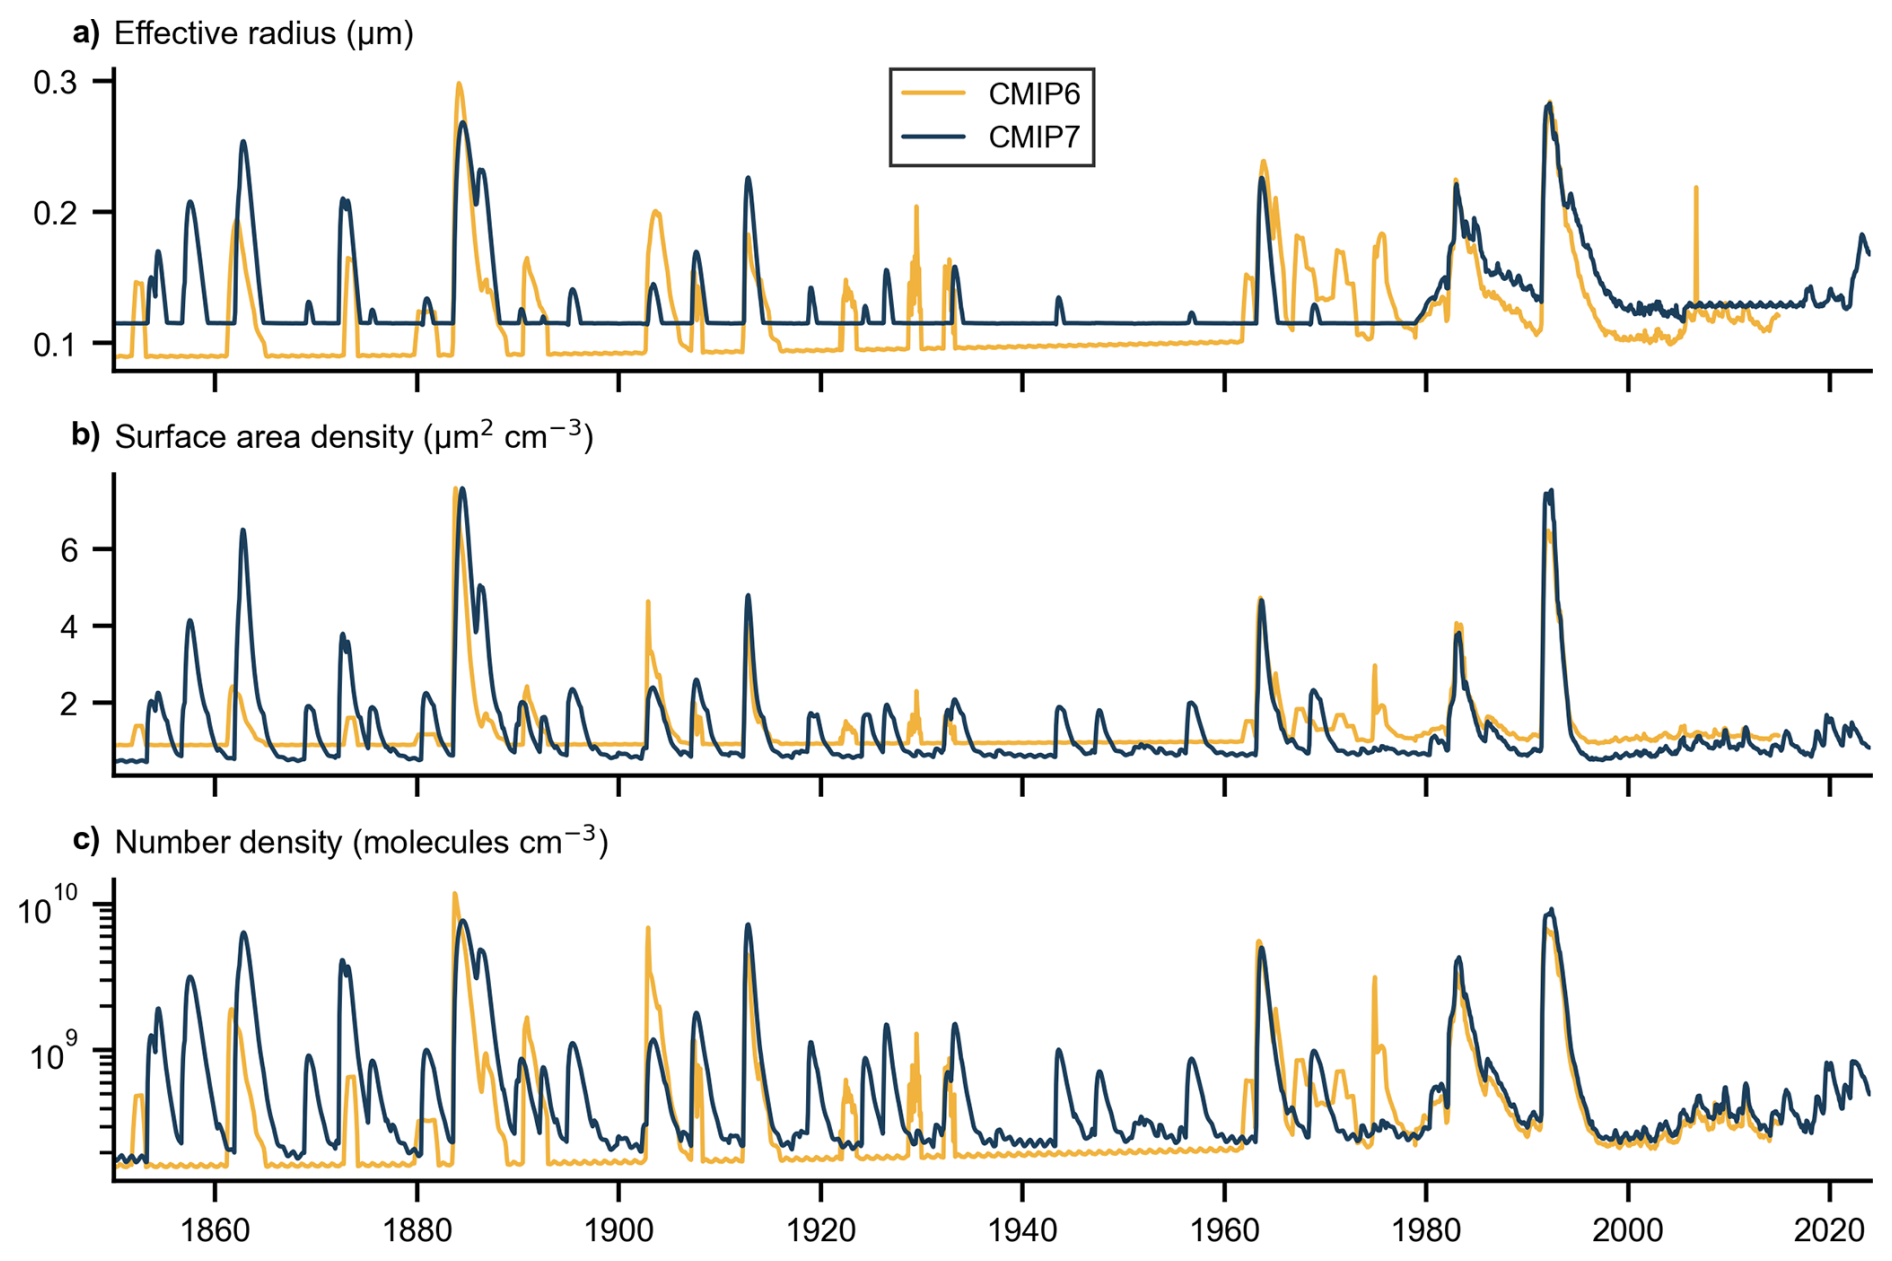
Figure 13Global stratospheric mean (a) effective radius (in µm), (b) surface area density (in µm2 cm−3), and (c) H2SO4 number density (in molecules cm−3, log scale) for CMIP6 and CMIP7, for 1850–2023.
6.1 Key uncertainties and challenges in the CMIP7 dataset
This study focuses on documenting the CMIP7 stratospheric aerosol optical properties and preliminary comparison to CMIP6, especially for SAOD. However, a comprehensive evaluation of the CMIP7 dataset remains required, and such evaluation is currently being undertaken as part of the Fresh Eyes on CMIP Modern Forcing project (https://wcrp-cmip.org/cmip7-task-teams/fresh-eyes-on-cmip/, last access: 5 May 2025). It will include comparisons of climatology and background aerosols between CMIP6 and CMIP7, and evaluation of CMIP7 aerosol optical properties against independent observational measurements such as pyrheliometers, total lunar eclipses, and stellar extinction (Sato et al., 1993; Stothers, 1996, 2001), and satellite datasets such as Scanning Imaging Absorption Spectrometer for Atmospheric Chartography (SCIAMACHY) and Climate Data Record of Stratospheric Aerosols (CREST) (Bovensmann et al., 1999; Pohl et al., 2024; Sofieva et al., 2024). This work will shed light on the main limitations and uncertainties of our dataset, and on differences in stratospheric aerosol forcing between forcing generations.
Despite the pending evaluation of our dataset against independent data, the major sources of uncertainties are well identified. Whilst the satellite-era aerosol optical properties are subject to uncertainties, in particular before the Pinatubo 1991 eruption, the much longer pre-satellite era part of the dataset is without doubt more uncertain, with volcanic contributions dominating uncertainties. Pre-satellite era volcanic SO2 emission uncertainties, which are discussed in more details in Aubry et al. (2026) are highly uncertain whether in terms of how much SO2 was injected, its emission height and how much reached the stratosphere, and even its emission location (in particular latitude) and date. Despite our best efforts to correct biases in small-to-moderate magnitude eruptions (injecting less than 3 Tg SO2) in CMIP7, it is also clear that many such eruptions are missing in the pre-satellite era. These emission uncertainties are compounded by volcanic aerosol modelling uncertainties, with simulated global mean SAOD differing by over a factor of 2 among different interactive stratospheric aerosol models (Clyne et al., 2021). Our use of a reduced-complexity aerosol model (EVA_H v2, Sect. 3), calibrated against the CMIP7 satellite-based volcanic SO2 emission and stratospheric aerosol optical properties datasets, ensures consistency of the model output with recent observations. However, these are subject to significant uncertainties too. For the 1991 eruption of Pinatubo, the SO2 mass is 15 Tg SO2 in our emission dataset (Aubry et al., 2026). However, observational estimates of SO2 mass reach up to 22 Tg SO2 (Guo et al., 2004), whereas a recent model inversion suggest that only 10.4 Tg SO2 was injected into the stratosphere (Ukhov et al., 2023), with other modelling studies suggesting that an “effective” mass of 10 Tg SO2 is justified by the fact that a large fraction of SO2 was scavenged rapidly by ash and ice in the volcanic cloud (e.g. Mills et al., 2016; Dhomse et al., 2020; Quaglia et al., 2023). This range of plausible SO2 mass for the eruption with the most weight in the EVA_H v2 calibration translates into a 50 % uncertainty for 525 nm extinction and SAOD pre-satellite era in the CMIP7 aerosol optical property dataset, without even accounting for emission uncertainties of pre-satellite era eruptions. This is illustrated by the change in aerosol mass-SAOD scaling factor (Table 1) from 0.0187 to 0.0229 (Tg S)−1 from EVA_H v1 to EVA_H v2, largely driven by a corresponding update of the Pinatubo SO2 mass from 18 to 15 Tg SO2 in MSVOLSO2L4. The combined changes in model parameterization (Eq. 1), calibration method (Sect. 3.2) and updates and extension of calibration datasets also resulted in a change in EVA_H's lowermost tropical aerosol loss timescale from 16.1 months in v1 (i.e. relatively moderate aerosol loss in the tropics given the 10.7 months latitudinal transport timescale and 2.3 months extratropical lowermost stratosphere loss timescale) to 57.7 months in v2 (i.e. virtually no aerosol loss in the tropics). This further illustrates the large volcanic aerosol modelling uncertainties, even when using a reduced-complexity, empirical model.
Beyond pre-satellite volcanic uncertainties, the pre-satellite non-volcanic stratospheric aerosols, which contribute 20 % of the global mean 550 nm piControl SAOD (i.e. the 1850–2021 historical average), is a highly uncertain component of our dataset. First, defining a non-volcanic background from satellite-era measurements is challenging (Fig. 6a). Second, assessing how this background has evolved throughout the historical period is difficult. Historical simulations from multiple interactive stratospheric aerosol models with no volcanic emission would support this, with UKESM run suggesting that the linear trend imposed in CMIP7 is inadequate (Fig. 6c). Third, scenario and piControl climatologies are currently equal and constant, even though the non-volcanic background stratospheric aerosol levels are expected to be different (Fig. 6c), and evolving in time for scenario simulations with the evolution dependent on the underlying shared socioeconomic pathway (SSP) considered (Fig. 9). Fourth, developing datasets that isolate the volcanic and non-volcanic contributions to stratospheric aerosols should be considered in the future. For example, some models generate stratospheric aerosol interactively but choose to run historical simulations with prescribed stratospheric aerosol optical properties (and zeroed volcanic emissions) to ensure a stratospheric aerosol forcing consistent among simulations, and with other CMIP models. However, unless the radiative transfer models within these climate models ignore the optical properties of non-volcanic stratospheric aerosols simulated interactively, the contribution of non-volcanic aerosol would be double-counted when imposing the CMIP7 (or CMIP6) stratospheric aerosol optical properties. As another example, existence of a single dataset accounting for both volcanic forcing and a non-volcanic background influenced by anthropogenic aerosol emission biases the hist-nat and hist-aer experiments of the Detection and Attribution MIP (DAMIP, Gillett et al., 2016), which are part of the CMIP7 AFT (Dunne et al., 2025). Fifth, we currently do not account for any significant non-volcanic emission of stratospheric aerosol precursor pre-satellite era (e.g. pyroCb emissions, Kloss et al., 2019; Peterson et al., 2021, 2025) nor do we account for volcanic emission other than SO2 (e.g. water, LeGrande et al., 2016; Millán et al., 2022).
Altogether, the development of an uncertainty product for our dataset is important. Although differences between CMIP6 and CMIP7 stratospheric aerosol optical properties might be partially indicative of uncertainties, both datasets are subject to specific biases and a more comprehensive uncertainty assessment is required.
6.2 Opportunities for future improvements
Key future directions to improve the volcanic SO2 emissions dataset, and in turn the stratospheric aerosol optical properties dataset, are discussed in detail in a companion paper on the emission dataset (Aubry et al., 2026). Three selected highlights are:
Enhance efforts to have a multidisciplinary perspective on emissions by incorporating together ice-core, remote-sensing and geological datasets. This was key in CMIP7 to better capture small-to-moderate magnitude eruptions underrepresented in ice-core datasets using the GVP database, as well as to constrain emission heights. For the latter, the use of the Independent Volcanic Eruption Source Parameter Archive (IVESPA, Aubry et al., 2021b) curated by the International Association of Volcanology and Chemistry of the Earth Interior (IAVCEI) enabled us to: (i) use well-constrained values for SO2 injection height for numerous events from 1900; (ii) through IVESPA-derived relationships (Engwell et al., 2023), correct heights derived from isopleths, the most common method to estimate plume height from deposit, but which typically overestimates SO2 injection height by 50 %.
Analyze more ice cores, and at high resolution. The datasets we use incorporate a relatively low number of ice cores, in particular in Greenland with 1 (Fang et al., 2023) to 3 (Toohey and Sigl, 2017) used over 1750–1900. There is a strong potential to produce a continuous historical volcanic SO2 record using a larger number of cores (e.g. Gao et al., 2007; Crowley and Unterman, 2013; Gabriel et al., 2024). The use of the high-resolution D4i ice-core (Fang et al., 2023) was key in CMIP7 to better capture small-to-moderate magnitude eruptions and have direct constraints on their SO2 mass, which is not the case with geological datasets (e.g. GVP). However, the fact that the D4i dataset is based on a single Greenland core means it is characterized by very high uncertainties, that it does not provide any constraint on eruption latitude, and that it only records some tropical eruptions and no southern hemisphere eruptions.
Incorporate existing information from ice-core isotope analyses, and push for new analyses focused on the historical period. Analysis of sulfur isotopes in ice cores provides information about the height of the sulfate aerosol perturbation (e.g. Burke et al., 2019), which would be a crucial addition to our pre-satellite era dataset. These analyses suggest that even for large-magnitude eruptions, a large fraction of sulfate deposited in ice cores might originate from the troposphere (Lee et al., 2024). For small-to-moderate magnitude eruptions, e.g. those constrained from D4i, we expect that this fraction might be even higher.
Future versions of the CMIP stratospheric aerosol dataset could make an important step forward for the pre-satellite era by combining the approaches used for CMIP7, i.e. entirely deriving the dataset from emissions, and CMIP6, i.e. relying as much as possible on pyrheliometer measurements, which are characterized by high uncertainties (Sect. 1) but are the main observational source pre-satellite era. Should this approach be followed, it will be crucial to not let aerosol optical property measurements affect future version of the emission dataset, but instead to derive the aerosol optical dataset from a modified version of the emission dataset, with modifications rigorously documented and aimed at better matching the pyrheliometer record. Beyond pyrheliometer data, future dataset versions could consider in-situ measurements coming out from the SSiRC “data rescue of stratospheric aerosol measurements” effort (https://www.aparc-stratosphericaerosol.org/activities/data_rescue, last access: 5 May 2026; Antuña-Marrero et al., 2020, 2021, 2024; Dhomse et al., 2020), and indirect evidence from lunar eclipses (Guillet et al., 2023). In addition to data, advancing interactive stratospheric aerosol models and reducing uncertainties among them (e.g. Clyne et al., 2021) is a key priority as it will in turn improve estimates of stratospheric aerosol optical properties from emissions. Future versions of our dataset are likely to continue to use a reduced-complexity volcanic aerosol model such as EVA_H, because the trivial computational cost is key to facilitate the exploring of new developments and to operationalizing dataset production (see next section). In particular, should the ozone CMIP Climate Forcing team continue to use complex models with prescribed stratospheric aerosol optical properties to produce the ozone dataset, the use of computationally expensive interactive stratospheric aerosol models to produce these aerosol optical property would result in two time-consuming, dependent forcing datasets which would significantly slow down forcing production. A future alternative could be that both the stratospheric aerosol optical properties and ozone datasets are produced by the same set of models, with interactive stratospheric aerosol capability and driven by volcanic sulfur emissions, including for the satellite era. Even if reduced-complexity models continue to be used to produce CMIP stratospheric aerosol optical property, we acknowledge that these simple models inherently rely on full-blown interactive stratospheric aerosol models. For example, the parameterization of the sulfate burden-SAOD scaling used in EVA_H (Aubry et al., 2020) is derived from interactive stratospheric aerosol models. For the satellite-era part of our dataset, pushing for a continued record of multi-wavelength measurements of stratospheric aerosol optical properties is critical to extend the dataset and to be able to use future stratospheric aerosol injection events, such as volcanic eruptions and pyrocumulonimbus, to improve our understanding of stratospheric aerosol processes. The use of existing multispectral satellite observations in the 2005–2017 period (Khanal et al., 2025), for which GloSSAC currently relies on single wavelength measurements, may help resolve biases in effective radius and aerosol properties in the current version of the dataset (Fig. 13).
Beyond stratospheric aerosols, bespoke forcing datasets might need to be developed to account for volcanic water and halogen injection forcing. The former was made particularly important by the Hunga 2022 eruption which injected 146 Tg of water into the stratosphere (Millán et al., 2022) and will have contributed a small annual-decadal scale greenhouse forcing (e.g. Sellitto et al., 2022; Jenkins et al., 2023), even though the associated surface warming is assessed to be dominated by the surface cooling associated with the stratospheric aerosol forcing (APARC, 2025 and e.g., Schoeberl et al., 2024; Stenchikov et al., 2025). Furthermore, as the CMIP Climate Forcing Task Team currently does not include a group dedicated to tropospheric aerosol forcing, modelling groups have no recommendations to implement associated emissions or forcing. Jongebloed et al. (2023) suggests that tropospheric volcanic sulfur emission inventories commonly used by climate models underestimate pre-industrial emissions, which would lead to significant underestimation of tropospheric volcanic aerosol forcing, and in turn overestimation of anthropogenic aerosol forcing (Schmidt et al., 2012; Carslaw et al., 2013). Recent satellite emission inventories (e.g. Carn et al., 2017) also show significant decadal scale variability in tropospheric emissions, which is currently ignored in CMIP.
6.3 Requirements for dataset operationalization
Naik et al. (2025) highlight the critical need to operationalize climate forcing production, i.e. move from the production of standardized climate forcing datasets synchronized with CMIP cycles, every 5–7 years, to annual production. To reach this goal for stratospheric aerosol optical properties, we review below key requirements and vulnerabilities. Our dataset relies on the existence of the following key resources:
- i.
GloSSAC (Thomason et al., 2018; Kovilakam et al., 2020), which to date is the only multiwavelength stratospheric aerosol optical property dataset covering 1979–present day.
- ii.
Version 2 of the EVA_H reduced-complexity aerosol model (Aubry et al., 2020), an extension of the Easy Volcanic Aerosol originally developed by Toohey et al. (2016).
- iii.
MSVOLSO2L4 (Carn, 2022), which to date is the only volcanic emission inventory covering 1979–present day.
- iv.
The eVolv2k (Toohey and Sigl, 2017), Sigl et al. (2015), and D4i (Fang et al., 2023) ice core records of volcanic emissions
- v.
The Global Volcanism Program Volcanoes of the World database (Global Volcanism Program, 2025)
- vi.
Publications from the volcanology community documenting eruption source parameters, and the IVESPA eruption source parameter database (Aubry et al., 2021b)
- vii.
Publications from the volcanology and ice-core communities fingerprinting sulfate deposition peak in ice-core to specific eruptions (e.g. Plunkett et al., 2023).
- viii.
Person time to produce historical, pre-industrial and scenario datasets from the resources listed above.
Data from sources (iii)–(vii) were used to build our stratospheric volcanic SO2 emission dataset (Aubry et al., 2026, briefly described in Sect. 2.1) on which the stratospheric aerosol optical property dataset rely for the pre-satellite era (1750–1978). Furthermore, the MSVOLSO2L4 dataset was key to calibrating EVA_H version 2, and thus for delivering the pre-satellite era aerosol optical property dataset. We suggest that variables and datasets associated with (i), (iii), (iv), (v), (vi) and (vii) could be added to the list of Essential Climate Variables provided by the World Meteorological Organization's Global Climate Observing System.
Among the listed resources, the operationalization of stratospheric aerosol optical property provision is most vulnerable to the continued provision (including extensions) of the GloSSAC dataset. This provision itself is vulnerable to the continued availability of multiwavelength measurements of stratospheric aerosol optical properties (Salawitch et al., 2025), in particular to potential risk of discontinuity in reliable solar occultation records if SAGE III/ISS operations end. Discontinuation of GloSSAC would incur significant additional workload – a barrier to operationalization – to use multiple stratospheric aerosol optical property records and merge them as consistently as possible, or to change method to produce satellite-era optical properties, e.g. by deriving them from emission as for pre-satellite era.
The second most important resource for operationalization might be (viii), i.e. the person time required to produce CMIP datasets from a collection of resources (i–vii). The support of the CMIP International Project Office and European Space Agency was critical to produce this dataset for CMIP7. In the future, even for simple dataset extensions, i.e. with no change to periods included in previous dataset period, regular time investment is required to communicate with source dataset providers, produce the extension, ensure files comply with latest CMIP format requirements, and communicate with users. This workload is significantly enhanced for any update, i.e. changes to the period already covered by the previous version, and their documentation. Reasons for updates include incorporation of new versions of source datasets (iii–vii) and models (ii), incorporation of new source datasets or models in the dataset production workflow (Fig. 2), or major changes to the workflow used to produce the dataset (as was done going from CMIP6 to CMIP7). To facilitate this workload and make it more resilient to future changes in the team producing stratospheric aerosol optical property for the CMIP Climate Forcing Task Team, all scripts used to produce our emission and stratospheric aerosol optical property datasets from resources (i)–(vii) above are available on Zenodo (Aubry, 2025; https://doi.org/10.5281/zenodo.17295697) and GitHub (https://github.com/thomasaubry/CMIP7_stratforcing_v2.2.1, last access: 5 May 2026) (see code availability statement). We estimate that an extension of the dataset requires on the order of 1 month of person time, whereas an update of the dataset requires on the order of 6–12 months of person time, depending on the significance of the update, and not including any time required to update source datasets themselves or create new ones.
Last, although vulnerabilities to the continued availability of resources (ii)–(vii) might be less critical for operationalization, our comparison of the CMIP6 and CMIP7 datasets and associated simulations using a reduced-complexity climate model (Sect. 5) demonstrate that:
-
Some of the most important advances for stratospheric aerosol optical properties might come from new development for the pre-satellite era source datasets and the stratospheric aerosol modelling communities.
-
Such advances significantly affect historical (Fig. 12, Table 3), pre-industrial and scenario (Chim et al., 2025) climate simulations.
The continued provision of best-effort stratospheric aerosol datasets to the climate modelling community thus relies on funding agencies to continue to support the work of the ice-core, satellite, field volcanology and stratospheric aerosol modelling communities, including but by no means limited to supporting data collection effort encapsulated in (iii)–(vii), development of the EVA model family (ii), and the research avenues highlighted in Sect. 6.2.
This paper documents the stratospheric aerosol optical datasets (version 2.2.1 for pre-industrial and historical, version 2.2.2 for scenario) to be used in phase 7 of the Coupled Model Intercomparison Project. The historical dataset covers 1750–2023 and, as in CMIP6 (Luo, 2018), relies on GloSSAC for the satellite era (1979 onwards). For the pre-satellite era, our methodology significantly differs from CMIP6, with volcanic perturbations to aerosol optical properties fully derived from volcanic sulfur emissions using version 2 EVA_H, a reduced-complexity volcanic aerosol model. The volcanic stratospheric sulfur emission dataset, documented in a companion paper (Aubry et al., 2026), primarily relies on bipolar ice-core arrays pre-satellite era, but it is enhanced by the use of high-resolution Greenland ice core and geological databases used to better capture frequent small-to-moderate magnitude eruptions injecting less than 3 Tg SO2. Version 2 of EVA_H includes a more realistic aerosol size distribution, an improved sensitivity of the magnitude and lifetime of forcing to SO2 injection mass, latitude and height, and is calibrated against satellite-derived emission and optical properties for 1979–2023. Volcanic stratospheric aerosol optical property perturbations pre-satellite era were added to a background, non-volcanic climatology derived from the 1998–2001 volcanically quiescent period, with a trend over 1850–1978 accounting for increasing anthropogenic aerosols. A monthly stratospheric aerosol climatology is derived from the 1850–2021 average for both pre-industrial and scenario (future) simulations, with a 9-year ramp over 2022–2031 for scenarios simulations to ensure a smooth transition from the historical period.
Because the historical pre-satellite optical properties are derived differently from CMIP6, the CMIP7 dataset differs in several ways. In particular, the representation of small-to-moderate magnitude eruptions is improved in CMIP7, yielding larger historical forcing. The 1850–2014 global mean 550 nm SAOD is 0.0138 in CMIP7 versus 0.0107 in CMIP6, representing an increase of 29 %. The pre-industrial global annual mean 550 nm SAOD is 0.0135 in CMIP7 (derived from the 1850–2021 mean) versus 0.0107 in CMIP6 (derived from the 1850–2014 mean), representing an increase of 26 %. In reduced-complexity climate model simulations the global-mean surface temperature is colder by 0.07 °C in 1850–1900 using the CMIP7 forcing compared with using the CMIP6 forcing. Over 1960–1990, simulated temperature is 0.06 °C warmer when using the CMIP7 forcing which might partially alleviate the cold bias in that period in CMIP6 models. Despite improvements in small-to-moderate magnitude eruption representation and the use of more recent ice-core emission inventories in CMIP7 (Sigl et al., 2015; Toohey and Sigl, 2017; Fang et al., 2023) compared to CMIP6 (Gao et al., 2008), large uncertainties remain, especially for the pre-satellite era. We therefore advise against treating either dataset as uniquely superior for any specific month or year and highlight the need for further evaluation. We discuss future research avenues to improve the dataset, in particular improvements to the pre-satellite era emission dataset and volcanic aerosol model, the incorporation of indirect stratospheric aerosol optical property observations into the dataset, and addressing the limitation of GloSSAC to single-wavelength measurements over the 2005–2017 period. Finally, we outline requirements to operationalize the dataset production, i.e. update it on an annual basis instead of a CMIP cycle (5–7 years) basis, and stress the critical importance of continuing multi-wavelength stratospheric aerosol optical property measurements from space, as well as continued support to the CMIP Climate Forcing Task Team.
All codes used to produce the CMIP7 pre-industrial and historical datasets and source datasets required to run them are available through Zenodo (Aubry, 2025, https://doi.org/10.5281/zenodo.17295697) and GitHub (https://github.com/thomasaubry/CMIP7_stratforcing_v2.2.1, last access: 5 May 2026). Codes used to interpolate the files we provide on ESGF on any list of wavelength ranges inputted by the user are available at https://github.com/MetOffice/CMIP7_volcanic_aerosol_forcing/ (last access: 5 May 2026).
All dataset produced for this paper are available on the Earth System Grid Federation at https://aims2.llnl.gov/search?project=input4MIPs&versionType=all&&activeFacets=%7B%22source_id%22%3A%5B%22UOEXETER-CMIP-2-2-1%22%5D%7D (last access: 1 March 2026) (pre-industrial and historical datasets, v2.2.1) and https://esgf-node.ornl.gov/search?project=input4MIPs&versionType=all&activeFacets=%7B%22source_id%22%3A%22UOEXETER-ScenarioMIP-2-2-2%22%7D (last access: 1 March 2026) (scenario datasets, v2.2.2), as well as on Zenodo (Aubry and CMIP Climate Forcing Task Team – Stratospheric aerosol team, https://doi.org/10.5281/zenodo.15556387).
The supplement related to this article is available online at https://doi.org/10.5194/gmd-19-3725-2026-supplement.
TJA conceptualized the dataset with support from MT, AS,MS, VN and PD. TJA produced the dataset and MMC, DS, EZ, MV and IS tested and validated early versions of the dataset during production. TJA, MT and SK developed version 2 of EVA_H. MV ran the FaIR simulations. BJ and LR produced the code to adapt our dataset to any radiative transfer model wavelength band. ZN produced the code to make the dataset comply with CMIP data standards. TJA wrote the original draft, and all authors contributed to review and editing. TJA and AS acquired funding.
At least one of the (co-)authors is a guest member of the editorial board of Geoscientific Model Development for the special issue “Coupled Model Intercomparison Project Phase 7 (CMIP7) forcings and inputs – development, documentation, and evaluation (GMD/ESSD inter-journal SI)”. The peer-review process was guided by an independent editor, and the authors also have no other competing interests to declare.
Publisher's note: Copernicus Publications remains neutral with regard to jurisdictional claims made in the text, published maps, institutional affiliations, or any other geographical representation in this paper. The authors bear the ultimate responsibility for providing appropriate place names. Views expressed in the text are those of the authors and do not necessarily reflect the views of the publisher.
We warmly thank the numerous people who gave feedback on the dataset during feedback and production, including the VolImpact 2025 workshop attendees, the “Perspectives on Stratospheric Aerosol Observations” team of the International Space Science Institute, Claudia Timmreck, Claire Macintosh, Jing Feng, Martine Michou, Makoto Deushi, Gareth Jones, Anton Laakso, Jaehee Lee, Chris Smith, Dirk Olivié and many others who contributed through CMIP meetings and workshops or informal discussions with us. TJA and IS thank Jane Mulcahy, Colin Jones, and Jeremy Walton for their support in producing the UKESM simulation show in Fig. 6. We are grateful to Helene Hewitt and an anonymous reviewer for their comments which helped improve the manuscript.
TJA acknowledges generous support from the CMIP International Project Office (project 4000136906), the European Space Agency “Volcanic forcing for CMIP” project of the Climate Change Initiative (CCI) (ESA Contract no. 4000145911/24/I-LR), the University of Exeter (through the Camborne School of Mines and the Department of Earth and Environmental Sciences research funds), and a travel award from the Canada-UK foundation. MT and SK acknowledge support from the Canadian Space Agency (grant no. 21SUASOCSA). MMC is supported by the Croucher Foundation through the Croucher Postdoctoral Fellowship. EZ acknowledges funding through the Deutsche Forschungsgemeinschaft (STACY, grant no. 395588486) and the Federal Ministry of Education and Research of Germany (PalMod III, grant no. 01LP2310A). MS received funding from the European Research Council under the European Union's Horizon 2020 research and innovation programme (grant number: 820047) and from the Swiss State Secretariat for Education, Research and Innovation (SERI) under the contract no. MB22.00030. ZN received funding from the European Space Agency (ESA) as part of the GHG Forcing For CMIP project of the Climate Change Initiative (CCI) (ESA Contract No. 4000146681/24/I-LR-cl) and the European Union's Horizon 2020 research and innovation program (grant agreement no. 101003536) (ESM2025). The work of PJD while based at Lawrence Livermore National Laboratory (LLNL) is supported by the Regional and Global Model Analysis (RGMA) program area under the Earth and Environmental System Modeling (EESM) program within the Earth and Environmental Systems Sciences Division (EESSD) of the United States Department of Energy's (DoE) Office of Science. Work was performed under the auspices of the US DoE by LLNL under contract DE-1180AC52-07NA27344. PJD also acknowledges support of the Western Australian Government for the Climate Science Initiative (CSI), delivered through the Department of Water and Environmental Regulation (DWER). BJ was supported by the Hadley Centre Climate Programme funded by the UK government Department for Science Innovation and Technology. DS acknowledges support by the National Science Foundation under Award No. 2202526.
This paper was edited by Tatiana Egorova and reviewed by Helene Hewitt and one anonymous referee.
Akima, H.: A new method of interpolation and smooth curve fitting based on local procedures, J. ACM, 17, 589–602, https://doi.org/10.1145/321607.321609, 1970.
Antuña-Marrero, J.-C., Mann, G. W., Keckhut, P., Avdyushin, S., Nardi, B., and Thomason, L. W.: Shipborne lidar measurements showing the progression of the tropical reservoir of volcanic aerosol after the June 1991 Pinatubo eruption, Earth Syst. Sci. Data, 12, 2843–2851, https://doi.org/10.5194/essd-12-2843-2020, 2020.
Antuña-Marrero, J.-C., Mann, G. W., Barnes, J., Rodríguez-Vega, A., Shallcross, S., Dhomse, S. S., Fiocco, G., and Grams, G. W.: Recovery of the first ever multi-year lidar dataset of the stratospheric aerosol layer, from Lexington, MA, and Fairbanks, AK, January 1964 to July 1965, Earth Syst. Sci. Data, 13, 4407–4423, https://doi.org/10.5194/essd-13-4407-2021, 2021.
Antuña-Marrero, J.-C., Mann, G. W., Barnes, J., Calle, A., Dhomse, S. S., Cachorro, V. E., Deshler, T., Li, Z., Sharma, N., and Elterman, L.: The recovery and re-calibration of a 13-month aerosol extinction profiles dataset from Searchlight observations from New Mexico, after the 1963 Agung eruption, Atmosphere, 15, 635, https://doi.org/10.3390/atmos15060635, 2024.
APARC: The Hunga Volcanic Eruption Atmospheric Impacts Report, edited by: Zhu, Y., Mann, G., Newman, P. A., and Randel, W., APARC Report No. 11, WCRP-10/2025, https://doi.org/10.34734/FZJ-2025-05237, 2025.
Arfeuille, F., Weisenstein, D., Mack, H., Rozanov, E., Peter, T., and Brönnimann, S.: Volcanic forcing for climate modeling: a new microphysics-based data set covering years 1600–present, Clim. Past, 10, 359–375, https://doi.org/10.5194/cp-10-359-2014, 2014.
Aubry, T.: Scripts and source datasets for CMIP7 stratospheric aerosol forcing datasets (v2.2.1) (version 2.2.1), Zenodo [code and data set], https://doi.org/10.5281/zenodo.17295697, 2025.
Aubry, T. and CMIP Climate Forcing Task Team – Stratospheric aerosol team: CMIP7 historical stratospheric aerosol optical properties and stratospheric volcanic sulfur emissions: version 2.2.1 dataset and preliminary documentation (version 2.2.1), Zenodo [data set], https://doi.org/10.5281/zenodo.15556388, 2025.
Aubry, T. J., Toohey, M., Marshall, L., Schmidt, A., and Jellinek, A. M.: A new volcanic stratospheric sulfate aerosol forcing emulator (EVA_H): Comparison with interactive stratospheric aerosol models, J. Geophys. Res.-Atmos., 125, e2019JD031303, https://doi.org/10.1029/2019JD031303, 2020.
Aubry, T. J., Staunton-Sykes, J., Marshall, L. R., Haywood, J., Abraham, N. L., and Schmidt, A.: Climate change modulates the stratospheric volcanic sulfate aerosol lifecycle and radiative forcing from tropical eruptions, Nat. Commun., 12, 4708, https://doi.org/10.1038/s41467-021-24943-7, 2021a.
Aubry, T. J., Engwell, S., Bonadonna, C., Carazzo, G., Scollo, S., Van Eaton, A. R., Taylor, I. A., Jessop, D., Eychenne, J., Gouhier, M., Mastin, L. G., Wallace, K. L., Biass, S., Bursik, M., Grainger, R. G., Jellinek, A. M., and Schmidt, A.: The Independent Volcanic Eruption Source Parameter Archive (IVESPA, version 1.0): A new observational database to support explosive eruptive column model validation and development, J. Volcanol. Geoth. Res., https://doi.org/10.1016/j.jvolgeores.2021.107295, 2021b.
Aubry, T. J., Sigl, M., Toohey, M., Chim, M. M., Verkerk, M., Schmidt, A., and Carn, S. A.: Stratospheric aerosol forcing for CMIP7 (part 2): Volcanic sulfur dioxide emissions, EGUsphere [preprint], https://doi.org/10.5194/egusphere-2026-546, 2026.
Bethke, I., Outten, S., Otterå, O. H., Hawkins, E., Wagner, S., Sigl, M., and Thorne, P.: Potential volcanic impacts on future climate variability, Nat. Clim. Change, 7, 799–805, https://doi.org/10.1038/nclimate3394, 2017.
Biermann, U. M., Luo, B. P., and Peter, Th.: Absorption spectra and optical constants of binary and ternary solutions of H2SO4, HNO3, and H2O in the mid infrared at atmospheric temperatures, J. Phys. Chem. A, 104, 783–793, https://doi.org/10.1021/jp992349i, 2000.
Bilbao, R., Aubry, T. J., Toohey, M., Ortega, P., Lapin, V., and Tourigny, E.: The sensitivity of EC-Earth3 decadal predictions to the choice of volcanic forcing dataset: insights for the next major eruption, Geosci. Model Dev., 18, 6239–6254, https://doi.org/10.5194/gmd-18-6239-2025, 2025.
Bourassa, A. E., Robock, A., Randel, W. J., Deshler, T., Rieger, L. A., Lloyd, N. D., Llewellyn, E. J., and Degenstein, D. A.: Large volcanic aerosol load in the stratosphere linked to Asian monsoon transport, Science, 337, 78–81, https://doi.org/10.1126/science.1219371, 2012.
Bovensmann, H., Burrows, J. P., Buchwitz, M., Frerick, J., Noël, S., Rozanov, V. V., Chance, K. V., and Goede, A. P. H.: SCIAMACHY: Mission objectives and measurement modes, J. Atmos. Sci., 56, 127–150, https://doi.org/10.1175/1520-0469(1999)056, 1999.
Brodowsky, C. V., Sukhodolov, T., Chiodo, G., Aquila, V., Bekki, S., Dhomse, S. S., Höpfner, M., Laakso, A., Mann, G. W., Niemeier, U., Pitari, G., Quaglia, I., Rozanov, E., Schmidt, A., Sekiya, T., Tilmes, S., Timmreck, C., Vattioni, S., Visioni, D., Yu, P., Zhu, Y., and Peter, T.: Analysis of the global atmospheric background sulfur budget in a multi-model framework, Atmos. Chem. Phys., 24, 5513–5548, https://doi.org/10.5194/acp-24-5513-2024, 2024.
Burke, A., Moore, K. A., Sigl, M., Nita, D. C., McConnell, J. R., and Adkins, J. F.: Stratospheric eruptions from tropical and extra-tropical volcanoes constrained using high-resolution sulfur isotopes in ice cores, Earth Planet. Sc. Lett., 521, 113–119, https://doi.org/10.1016/j.epsl.2019.06.006, 2019.
Carn, S. A., Clarisse, L., and Prata, A. J.: Multi-decadal satellite measurements of global volcanic degassing, J. Volcanol. Geoth. Res., 311, 99–134, https://doi.org/10.1016/j.jvolgeores.2016.01.002, 2016.
Carn, S. A., Fioletov, V. E., McLinden, C. A., Li, C., and Krotkov, N. A.: A decade of global volcanic SO2 emissions measured from space, Sci. Rep., 7, 44095, https://doi.org/10.1038/srep44095, 2017.
Carn, S.: Multi-Satellite Volcanic Sulfur Dioxide L4 Long-Term Global Database V4 (MSVOLSO2L4_4), NASA/GSFC DISC, https://disc.gsfc.nasa.gov/datasets/MSVOLSO2L4_4/summary (last access: 10 April 2026), 2022.
Carslaw, K. S., Lee, L. A., Reddington, C. L., Pringle, K. J., Rap, A., Forster, P. M., Mann, G. W., Spracklen, D. V., Woodhouse, M. T., Regayre, L. A., and Pierce, J. R.: Large contribution of natural aerosols to uncertainty in indirect forcing, Nature, 503, 67–71, https://doi.org/10.1038/nature12674, 2013.
Chim, M. M., Aubry, T. J., Abraham, N. L., Marshall, L., Mulcahy, J., Walton, J., and Schmidt, A.: Climate projections very likely underestimate future volcanic forcing and its climatic effects, Geophys. Res. Lett., 50, e2023GL103743, https://doi.org/10.1029/2023GL103743, 2023.
Chim, M. M., Aubry, T. J., Smith, C., and Schmidt, A.: Neglecting future sporadic volcanic eruptions underestimates climate uncertainty, Commun. Earth Environ., 6, 236, https://doi.org/10.1038/s43247-025-02208-1, 2025.
Clyne, M., Lamarque, J.-F., Mills, M. J., Khodri, M., Ball, W., Bekki, S., Dhomse, S. S., Lebas, N., Mann, G., Marshall, L., Niemeier, U., Poulain, V., Robock, A., Rozanov, E., Schmidt, A., Stenke, A., Sukhodolov, T., Timmreck, C., Toohey, M., Tummon, F., Zanchettin, D., Zhu, Y., and Toon, O. B.: Model physics and chemistry causing intermodel disagreement within the VolMIP-Tambora Interactive Stratospheric Aerosol ensemble, Atmos. Chem. Phys., 21, 3317–3343, https://doi.org/10.5194/acp-21-3317-2021, 2021.
Crowley, T. J. and Unterman, M. B.: Technical details concerning development of a 1200 yr proxy index for global volcanism, Earth Syst. Sci. Data, 5, 187–197, https://doi.org/10.5194/essd-5-187-2013, 2013.
Damany-Pearce, L., Johnson, B., Wells, A., Osborne, M., Allan, J., Belcher, C., Jones, A. and Haywood, J.: Australian wildfires cause the largest stratospheric warming since Pinatubo and extend the lifetime of the Antarctic ozone hole, Sci. Rep., 12, 12665, https://doi.org/10.1038/s41598-022-15794-3, 2022.
Davis, N. A., Visioni, D., Garcia, R. R., Kinnison, D. E., Marsh, D. R., Mills, M., Richter, J. H., Tilmes, S., Bardeen, C. G., Gettelman, A., Glanville, A. A., MacMartin, D. G., Smith, A. K., and Vitt, F.: Climate, variability, and climate sensitivity of “Middle Atmosphere” chemistry configurations of the Community Earth System Model Version 2, Whole Atmosphere Community Climate Model Version 6 (CESM2(WACCM6)), J. Adv. Model. Earth Sy., 15, e2022MS003579, https://doi.org/10.1029/2022MS003579, 2023.
Deshler, T., Johnson, B. J., and Rozier, W. R.: Balloonborne measurements of Pinatubo aerosol during 1991 and 1992 at 41° N: Vertical profiles, size distribution, and volatility, Geophys. Res. Lett., 20, 1435–1438, https://doi.org/10.1029/93GL01337, 1993.
Dhomse, S. S., Mann, G. W., Antuña Marrero, J. C., Shallcross, S. E., Chipperfield, M. P., Carslaw, K. S., Marshall, L., Abraham, N. L., and Johnson, C. E.: Evaluating the simulated radiative forcings, aerosol properties, and stratospheric warmings from the 1963 Mt Agung, 1982 El Chichón, and 1991 Mt Pinatubo volcanic aerosol clouds, Atmos. Chem. Phys., 20, 13627–13654, https://doi.org/10.5194/acp-20-13627-2020, 2020.
Dunne, J. P., Hewitt, H. T., Arblaster, J. M., Bonou, F., Boucher, O., Cavazos, T., Dingley, B., Durack, P. J., Hassler, B., Juckes, M., Miyakawa, T., Mizielinski, M., Naik, V., Nicholls, Z., O'Rourke, E., Pincus, R., Sanderson, B. M., Simpson, I. R., and Taylor, K. E.: An evolving Coupled Model Intercomparison Project phase 7 (CMIP7) and Fast Track in support of future climate assessment, Geosci. Model Dev., 18, 6671–6700, https://doi.org/10.5194/gmd-18-6671-2025, 2025.
Durack, P. J., Taylor, K. E., Eyring, V., Ames, S. K., Hoang, T., Nadeau, D., Doutriaux, C., Stockhause, M., and Gleckler, P. J.: Toward standardized data sets for climate model experimentation, Eos, 99, https://doi.org/10.1029/2018EO101751, 2018.
Durack, P. J., Naik, V., Nicholls, Z., O'Rourke, E., Turner, B., Buontempo, C., Brookshaw, A., Goddard, C., MacIntosh, C., Hewitt, H., and Dunne, J.: Earth system forcing for CMIP7 and beyond, B. Am. Meteorol. Soc., 106, E1580–E1588, https://doi.org/10.1175/BAMS-D-25-0119.1, 2025.
Engwell, S., Aubry, T. J., Bonadonna, C., Mastin, L. G., Carazzo, C., Van Eaton, A. R., Jessop, D., Grainger, R. G., Scollo, S., Taylor, I. A., Jellinek, A. M., and Schmidt, A.: New insights into the relationship between mass eruption rate and volcanic column height based on the IVESPA dataset, Geophys. Res. Lett., 50, https://doi.org/10.1029/2022GL102633, 2023.
Eyring, V., Bony, S., Meehl, G. A., Senior, C. A., Stevens, B., Stouffer, R. J., and Taylor, K. E.: Overview of the Coupled Model Intercomparison Project Phase 6 (CMIP6) experimental design and organization, Geosci. Model Dev., 9, 1937–1958, https://doi.org/10.5194/gmd-9-1937-2016, 2016.
Fang, S.-W., Sigl, M., Toohey, M., Jungclaus, J., Zanchettin, D., and Timmreck, C.: The role of small to moderate volcanic eruptions in the early 19th century climate, Geophys. Res. Lett., 50, e2023GL105307, https://doi.org/10.1029/2023GL105307, 2023.
Flynn, C. M. and Mauritsen, T.: On the climate sensitivity and historical warming evolution in recent coupled model ensembles, Atmos. Chem. Phys., 20, 7829–7842, https://doi.org/10.5194/acp-20-7829-2020, 2020.
Gabriel, I., Plunkett, G., Abbott, P. M., Behrens, M., Burke, A., Chellman, N., Cook, E., Fleitmann, D., Hörhold, M., Hutchison, W., and McConnell, J. R.: Decadal-to-centennial increases of volcanic aerosols from Iceland challenge the concept of a Medieval Quiet Period, Commun. Earth Environ., 5, 194, https://doi.org/10.1038/s43247-024-01350-6, 2024.
Gao, C., Oman, L., Robock, A., and Stenchikov, G. L.: Atmospheric volcanic loading derived from bipolar ice cores: Accounting for the spatial distribution of volcanic deposition, J. Geophys. Res., 112, D09109, https://doi.org/10.1029/2006JD007461, 2007.
Gao, C., Robock, A., and Ammann, C.: Volcanic forcing of climate over the past 1500 years: An improved ice core-based index for climate models, J. Geophys. Res., 113, D23111, https://doi.org/10.1029/2008JD010239, 2008.
Gao, C. Y., Naik, V., Horowitz, L. W., Ginoux, P., Paulot, F., Dunne, J., Mills, M., Aquila, V., and Colarco, P.: Volcanic drivers of stratospheric sulfur in GFDL ESM4, J. Adv. Model. Earth Sy., 15, e2022MS003532, https://doi.org/10.1029/2022MS003532, 2023.
Gillett, N. P., Shiogama, H., Funke, B., Hegerl, G., Knutti, R., Matthes, K., Santer, B. D., Stone, D., and Tebaldi, C.: The Detection and Attribution Model Intercomparison Project (DAMIP v1.0) contribution to CMIP6, Geosci. Model Dev., 9, 3685–3697, https://doi.org/10.5194/gmd-9-3685-2016, 2016.
Global Volcanism Program: Volcanoes of the World (v. 5.3.1; 6 Aug 2025) [Database], Smithsonian Institution, https://doi.org/10.5479/si.GVP.VOTW5-2025.5.3, 2025.
Guillet, S., Corona, C., Oppenheimer, C., Lavigne, F., Khodri, M., Ludlow, F., Sigl, M., Toohey, M., Atkins, P. S., Yang, Z., and Muranaka, T.: Lunar eclipses illuminate timing and climate impact of medieval volcanism, Nature, 616, 90–95, https://doi.org/10.1038/s41586-023-05751-z, 2023.
Guo, S., Bluth, G. J. S., Rose, W. I., Watson, I. M., and Prata, A. J.: Re-evaluation of SO2 release of the 15 June 1991 Pinatubo eruption using ultraviolet and infrared satellite sensors, Geochem. Geophy. Geosy., 5, Q04001, https://doi.org/10.1029/2003GC000654, 2004.
Hannigan, J. W., Ortega, I., Shams, S. B., Blumenstock, T., Campbell, J. E., Conway, S., Flood, V., Garcia, O., Griffith, D., Grutter, M., and Hase, F.: Global atmospheric OCS trend analysis from 22 NDACC stations, J. Geophys. Res.-Atmos., 127, e2021JD035764, https://doi.org/10.1029/2021JD035764, 2022.
Hewitt, H. T., Flato, G., O'Rourke, E., Dunne, J. P., Adloff, F., Arblaster, J. M., Bonou, F., Boucher, O., Cavazos, T., Dingley, B., and Durack, P. J.: Towards provision of regularly updated climate data from the Coupled Model Intercomparison Project, PLOS Climate, 4, e0000708, https://doi.org/10.1371/journal.pclm.0000708, 2025.
Hummel, J. R., Shettle, E. P., and Longtin, D. R.: A new background stratospheric aerosol model for use in atmospheric radiation models, OptiMetrics scientific report No. OMI298, https://apps.dtic.mil/sti/tr/pdf/ADA210110.pdf (last access: 10 April 2026), 1988.
IPCC: Climate Change 2021: The Physical Science Basis, Contribution of Working Group I to the Sixth Assessment Report of the Intergovernmental Panel on Climate Change, edited by: Masson-Delmotte, V., Zhai, P., Pirani, A., Connors, S. L., Péan, C., Berger, S., Caud, N., Chen, Y., Goldfarb, L., Gomis, M. I., Huang, M., Leitzell, K., Lonnoy, E., Matthews, J. B. R., Maycock, T. K., Waterfield, T., Yelekçi, O., Yu, R., and Zhou, B., Cambridge University Press, Cambridge, United Kingdom and New York, NY, USA, 2391 pp., https://doi.org/10.1017/9781009157896, 2021.
Jenkins, S., Smith, C., Allen, M., and Grainger, R.: Tonga eruption increases chance of temporary surface temperature anomaly above 1.5 °C, Nat. Clim. Change, 13, 127–129, https://doi.org/10.1038/s41558-022-01568-2, 2023.
Jongebloed, U. A., Schauer, A. J., Cole-Dai, J., Larrick, C. G., Wood, R., Fischer, T. P., Carn, S. A., Salimi, S., Edouard, S. R., Zhai, S., and Geng, L.: Underestimated passive volcanic sulfur degassing implies overestimated anthropogenic aerosol forcing, Geophys. Res. Lett., 50, e2022GL102061, https://doi.org/10.1029/2022GL102061, 2023.
Jörimann, A., Sukhodolov, T., Luo, B., Chiodo, G., Mann, G., and Peter, T.: REtrieval Method for optical and physical Aerosol Properties in the stratosphere (REMAPv1), Geosci. Model Dev., 18, 6023–6041, https://doi.org/10.5194/gmd-18-6023-2025, 2025.
Jungclaus, J. H., Bard, E., Baroni, M., Braconnot, P., Cao, J., Chini, L. P., Egorova, T., Evans, M., González-Rouco, J. F., Goosse, H., Hurtt, G. C., Joos, F., Kaplan, J. O., Khodri, M., Klein Goldewijk, K., Krivova, N., LeGrande, A. N., Lorenz, S. J., Luterbacher, J., Man, W., Maycock, A. C., Meinshausen, M., Moberg, A., Muscheler, R., Nehrbass-Ahles, C., Otto-Bliesner, B. I., Phipps, S. J., Pongratz, J., Rozanov, E., Schmidt, G. A., Schmidt, H., Schmutz, W., Schurer, A., Shapiro, A. I., Sigl, M., Smerdon, J. E., Solanki, S. K., Timmreck, C., Toohey, M., Usoskin, I. G., Wagner, S., Wu, C.-J., Yeo, K. L., Zanchettin, D., Zhang, Q., and Zorita, E.: The PMIP4 contribution to CMIP6 – Part 3: The last millennium, scientific objective, and experimental design for the PMIP4 past1000 simulations, Geosci. Model Dev., 10, 4005–4033, https://doi.org/10.5194/gmd-10-4005-2017, 2017.
Kar, J., Lee, K.-P., Vaughan, M. A., Tackett, J. L., Trepte, C. R., Winker, D. M., Lucker, P. L., and Getzewich, B. J.: CALIPSO level 3 stratospheric aerosol profile product: version 1.00 algorithm description and initial assessment, Atmos. Meas. Tech., 12, 6173–6191, https://doi.org/10.5194/amt-12-6173-2019, 2019.
Ke, Z., Tang, Q., Golaz, J.-C., Liu, X., and Wang, H.: Assessing the climate impact of an improved volcanic sulfate aerosol representation in E3SM, Geosci. Model Dev., 18, 4137–4153, https://doi.org/10.5194/gmd-18-4137-2025, 2025.
Khanal, S., Toohey, M., Bourassa, A., McElroy, C. T., Sioris, C., and Walker, K. A.: Assessment of ACE-MAESTRO v3.13 multi-wavelength stratospheric aerosol extinction measurements, Atmos. Meas. Tech., 18, 6835–6852, https://doi.org/10.5194/amt-18-6835-2025, 2025.
Kloss, C., Berthet, G., Sellitto, P., Ploeger, F., Bucci, S., Khaykin, S., Jégou, F., Taha, G., Thomason, L. W., Barret, B., Le Flochmoen, E., von Hobe, M., Bossolasco, A., Bègue, N., and Legras, B.: Transport of the 2017 Canadian wildfire plume to the tropics via the Asian monsoon circulation, Atmos. Chem. Phys., 19, 13547–13567, https://doi.org/10.5194/acp-19-13547-2019, 2019.
Kloss, C., Berthet, G., Sellitto, P., Ploeger, F., Taha, G., Tidiga, M., Eremenko, M., Bossolasco, A., Jégou, F., Renard, J.-B., and Legras, B.: Stratospheric aerosol layer perturbation caused by the 2019 Raikoke and Ulawun eruptions and their radiative forcing, Atmos. Chem. Phys., 21, 535–560, https://doi.org/10.5194/acp-21-535-2021, 2021.
Kovilakam, M., Thomason, L. W., Ernest, N., Rieger, L., Bourassa, A., and Millán, L.: The Global Space-based Stratospheric Aerosol Climatology (version 2.0): 1979–2018, Earth Syst. Sci. Data, 12, 2607–2634, https://doi.org/10.5194/essd-12-2607-2020, 2020.
Kovilakam, M., Thomason, L. W., Verkerk, M., Aubry, T., and Knepp, T. N.: OMPS-LP aerosol extinction coefficients and their applicability in GloSSAC, Atmos. Chem. Phys., 25, 535–553, https://doi.org/10.5194/acp-25-535-2025, 2025.
Kremser, S., Thomason, L. W., von Hobe, M., Hermann, M., Deshler, T., Timmreck, C., Toohey, M., Stenke, A., Schwarz, J. P., Weigel, R., Fueglistaler, S., Prata, F. J., Vernier, J. P., Schlager, H., Barnes, J. E., Antuna-Marrero, J. C., Fairlie, D., Palm, M., Mahieu, E., Notholt, J., Rex, M., Bingen, C., Vanhellemont, F., Bourassa, A., Plane, J. M. C., Klocke, D., Carn, S. A., Clarisse, L., Trickl, T., Neely, R., James, A. D., Rieger, L., Wilson, J. C., and Meland, B.: Stratospheric aerosol – Observations, processes, and impact on climate, Rev. Geophys., 54, 278–335, https://doi.org/10.1002/2015RG000511, 2016.
Leach, N. J., Jenkins, S., Nicholls, Z., Smith, C. J., Lynch, J., Cain, M., Walsh, T., Wu, B., Tsutsui, J., and Allen, M. R.: FaIRv2.0.0: a generalized impulse response model for climate uncertainty and future scenario exploration, Geosci. Model Dev., 14, 3007–3036, https://doi.org/10.5194/gmd-14-3007-2021, 2021.
Lee, G., Burke, A., Hutchison, W., Sugden, P., Smith, C., McConnell, J. R., Sigl, M., Oppenheimer, C., Rasmussen, S. O., Steffensen, J. P., and Lee, S. R.: Phasing and climate forcing potential of the Millennium Eruption of Mt. Baekdu, Commun. Earth Environ., 5, 549, https://doi.org/10.1038/s43247-024-01713-z, 2024.
LeGrande, A., Tsigaridis, K., and Bauer, S.: Role of atmospheric chemistry in the climate impacts of stratospheric volcanic injections, Nat. Geosci., 9, 652–655, https://doi.org/10.1038/ngeo2771, 2016.
Luo, B.: SAGE-3λv4: Stratospheric aerosol data for use in CMIP6 models, ETH Research Collection [data set], https://doi.org/10.3929/ethz-b-000715155, previously distributed through ftp://iacftp.ethz.ch/pub_read/luo/CMIP6_SAD_radForcing_v4.0.0 (last access: 8 June 2025), 2017.
Luo, B.: Stratospheric aerosol data for use in CMIP6 models – data description [data description], ftp://iacftp.ethz.ch/pub_read/luo/CMIP6/Readme_Data_Description.pdf (last access: 17 February 2023), 2018.
Marshall, L. R., Smith, C. J., Forster, P. M., Aubry, T. J., Andrews, T., and Schmidt, A.: Large variations in volcanic aerosol forcing efficiency due to eruption source parameters and rapid adjustments, Geophys. Res. Lett., 47, e2020GL090241, https://doi.org/10.1029/2020GL090241, 2020.
Marshall, L. R., Maters, E. C., Schmidt, A., Timmreck, C., Robock, A., and Toohey, M.: Volcanic effects on climate: Recent advances and future avenues, B. Volcanol., 84, 54, https://doi.org/10.1007/s00445-022-01559-3, 2022.
Millán, L., Santee, M. L., Lambert, A., Livesey, N. J., Werner, F., Schwartz, M. J., Pumphrey, H. C., Manney, G. L., Wang, Y., Su, H., and Wu, L.: The Hunga Tonga-Hunga Ha'apai hydration of the stratosphere, Geophys. Res. Lett., 49, e2022GL099381, https://doi.org/10.1029/2022GL099381, 2022.
Mills, M. J., Schmidt, A., Easter, R., Solomon, S., Kinnison, D. E., Ghan, S. J., Neely, R. R., Marsh, D. R., Conley, A., Bardeen, C. G., and Gettelman, A.: Global volcanic aerosol properties derived from emissions, 1990–2014, using CESM1(WACCM), J. Geophys. Res.-Atmos., 121, 2332–2348, https://doi.org/10.1002/2015JD024290, 2016.
Murphy, D. M., Abou-Ghanem, M., Cziczo, D. J., Froyd, K. D., Jacquot, J., Lawler, M. J., Maloney, C., Plane, J. M. C., Ross, M. N., Schill, G. P., and Shen, X.: Metals from spacecraft reentry in stratospheric aerosol particles, P. Natl. Acad. Sci. USA, 120, e2313374120, https://doi.org/10.1073/pnas.2313374120, 2023.
Muser, L. O., Hoshyaripour, G. A., Bruckert, J., Horváth, Á., Malinina, E., Wallis, S., Prata, F. J., Rozanov, A., von Savigny, C., Vogel, H., and Vogel, B.: Particle aging and aerosol–radiation interaction affect volcanic plume dispersion: evidence from the Raikoke 2019 eruption, Atmos. Chem. Phys., 20, 15015–15036, https://doi.org/10.5194/acp-20-15015-2020, 2020.
Naik, V., Durack, P. J., Nicholls, Z., Buontempo, C., Dunne, J. P., Hewitt, H. T., Macintosh, C., and O'Rourke, E.: Climate models need more frequent releases of input data – here's how to do it, Nature, 644, 874–875, https://doi.org/10.1038/d41586-025-02642-3, 2025.
NASA/LARC/SD/ASDC: Global Space-based Stratospheric Aerosol Climatology Version 2.22, NASA Langley Atmospheric Science Data Center DAAC [data set], https://doi.org/10.5067/GLOSSAC-L3-V2.22, 2023.
NASA/LARC/SD/ASDC: Global Space-based Stratospheric Aerosol Climatology Version 2.23, NASA Langley Atmospheric Science Data Center DAAC [data set], https://doi.org/10.5067/GLOSSAC-L3-V2.23, 2025.
Neely III, R. R. and Schmidt, A.: VolcanEESM (Volcanic Emissions for Earth System Models): Volcanic sulphur dioxide (SO2) emissions database from 1850 to present. Centre for Environmental Data Analysis [data set], http://catalogue.ceda.ac.uk/uuid/bfbd5ec825fa422f9a858b14ae7b2a0d (last access: 10 April 2026), 2016.
Nicholls, Z. R. J., Meinshausen, M., Lewis, J., Gieseke, R., Dommenget, D., Dorheim, K., Fan, C.-S., Fuglestvedt, J. S., Gasser, T., Golüke, U., Goodwin, P., Hartin, C., Hope, A. P., Kriegler, E., Leach, N. J., Marchegiani, D., McBride, L. A., Quilcaille, Y., Rogelj, J., Salawitch, R. J., Samset, B. H., Sandstad, M., Shiklomanov, A. N., Skeie, R. B., Smith, C. J., Smith, S., Tanaka, K., Tsutsui, J., and Xie, Z.: Reduced Complexity Model Intercomparison Project Phase 1: introduction and evaluation of global-mean temperature response, Geosci. Model Dev., 13, 5175–5190, https://doi.org/10.5194/gmd-13-5175-2020, 2020.
O'Neill, B. C., Tebaldi, C., van Vuuren, D. P., Eyring, V., Friedlingstein, P., Hurtt, G., Knutti, R., Kriegler, E., Lamarque, J.-F., Lowe, J., Meehl, G. A., Moss, R., Riahi, K., and Sanderson, B. M.: The Scenario Model Intercomparison Project (ScenarioMIP) for CMIP6, Geosci. Model Dev., 9, 3461–3482, https://doi.org/10.5194/gmd-9-3461-2016, 2016.
Palmer, K. F. and Williams, D.: Optical constants of sulfuric acid; Application to the clouds of Venus, Appl. Optics, 14, 208–219, https://doi.org/10.1364/AO.14.000208, 1975.
Peterson, D. A., Fromm, M. D., McRae, R. H., Campbell, J. R., Hyer, E. J., Taha, G., Camacho, C. P., Kablick III, G. P., Schmidt, C. C., and DeLand, M. T.: Australia's Black Summer pyrocumulonimbus super outbreak reveals potential for increasingly extreme stratospheric smoke events, npj Clim. Atmos. Sci., 4, 38, https://doi.org/10.1038/s41612-021-00192-9, 2021.
Peterson, D. A., Berman, M. T., Fromm, M. D., Servranckx, R., Julstrom, W. J., Hyer, E. J., Campbell, J. R., McHardy, T. M., and Lambert, A.: Worldwide inventory reveals the frequency and variability of pyrocumulonimbus and stratospheric smoke plumes during 2013–2023, npj Clim. Atmos. Sci., 8, 325, https://doi.org/10.1038/s41612-025-01188-5, 2025.
Plunkett, G., Sigl, M., McConnell, J. R., Pilcher, J. R., and Chellman, N. J.: The significance of volcanic ash in Greenland ice cores during the Common Era, Quaternary Sci. Rev., 301, 107936, https://doi.org/10.1016/j.quascirev.2022.107936, 2023.
Pohl, C., Wrana, F., Rozanov, A., Deshler, T., Malinina, E., von Savigny, C., Rieger, L. A., Bourassa, A. E., and Burrows, J. P.: Stratospheric aerosol characteristics from SCIAMACHY limb observations: two-parameter retrieval, Atmos. Meas. Tech., 17, 4153–4181, https://doi.org/10.5194/amt-17-4153-2024, 2024.
Quaglia, I., Timmreck, C., Niemeier, U., Visioni, D., Pitari, G., Brodowsky, C., Brühl, C., Dhomse, S. S., Franke, H., Laakso, A., Mann, G. W., Rozanov, E., and Sukhodolov, T.: Interactive stratospheric aerosol models' response to different amounts and altitudes of SO2 injection during the 1991 Pinatubo eruption, Atmos. Chem. Phys., 23, 921–948, https://doi.org/10.5194/acp-23-921-2023, 2023.
Rieger, L. A., Zawada, D. J., Bourassa, A. E., and Degenstein, D. A.: A multiwavelength retrieval approach for improved OSIRIS aerosol extinction retrievals, J. Geophys. Res.-Atmos., 124, 7286–7307, https://doi.org/10.1029/2018JD029897, 2019.
Rienecker, M. M., Suarez, M. J., Gelaro, R., Todling, R., Bacmeister, J., Liu, E., Bosilovich, M. G., Schubert, S. D., Takacs, L., Kim, G. K., Bloom, S., Chen, J. Y., Collins, D., Conaty, A., Da Silva, A., Gu, W., Joiner, J., Koster, R. D., Lucchesi, R., Molod, A., Owens, T., Pawson, S., Pegion, P., Redder, C. R., Reichle, R., Robertson, F. R., Ruddick, A. G., Sienkiewicz, M., and Woollen, J.: MERRA: NASA's Modern-Era Retrospective Analysis for Research and Applications, J. Climate, 24, 3624–3648, https://doi.org/10.1175/JCLI-D-11-00015.1, 2011.
Romero-Prieto, A., Sandstad, M., Sanderson, B. M., Nicholls, Z. R. J., Steinert, N. J., Gasser, T., Mathison, C., Kikstra, J., Aubry, T. J., and Smith, C.: Reduced Complexity Model Intercomparison Project Phase 3: Experimental protocol for coordinated constraining and evaluation of Reduced-Complexity Models, EGUsphere [preprint], https://doi.org/10.5194/egusphere-2025-5775, 2025.
Salawitch, R. J., Smith, J. B., Selkirk, H., Wargan, K., Chipperfield, M. P., Hossaini, R., Levelt, P. F., Livesey, N. J., McBride, L. A., Millán, L. F., and Moyer, E.: The imminent data desert: The future of stratospheric monitoring in a rapidly changing world, B. Am. Meteorol. Soc., 106, E540–E563, https://doi.org/10.1175/BAMS-D-23-0281.1, 2025.
Sandvik, O. S., Friberg, J., Martinsson, B. G., van Velthoven, P. F., Hermann, M., and Zahn, A.: Intercomparison of in-situ aircraft and satellite aerosol measurements in the stratosphere, Sci. Rep., 9, 15576, https://doi.org/10.1038/s41598-019-52089-6, 2019.
Santer, B. D., Solomon, S., Bonfils, C., Zelinka, M. D., Painter, J. F., Beltran, F., Fyfe, J. C., Johannesson, G., Mears, C., Ridley, D. A., and Vernier, J. P.: Observed multivariable signals of late 20th and early 21st century volcanic activity, Geophys. Res. Lett., 42, 500–509, https://doi.org/10.1002/2014GL062366, 2015.
Sato, M., Hansen, J. E., McCormick, M. P., and Pollack, J. B.: Stratospheric aerosol optical depths, 1850–1990, J. Geophys. Res., 98, 22987–22994, https://doi.org/10.1029/93JD02553, 1993.
Schmidt, A., Carslaw, K. S., Mann, G. W., Rap, A., Pringle, K. J., Spracklen, D. V., Wilson, M., and Forster, P. M.: Importance of tropospheric volcanic aerosol for indirect radiative forcing of climate, Atmos. Chem. Phys., 12, 7321–7339, https://doi.org/10.5194/acp-12-7321-2012, 2012.
Schmidt, A., Mills, M. J., Ghan, S., Gregory, J. M., Allan, R. P., Andrews, T., Bardeen, C. G., Conley, A., Forster, P. M., Gettelman, A., and Portmann, R. W.: Volcanic radiative forcing from 1979 to 2015, J. Geophys. Res.-Atmos., 123, 12491–12508, https://doi.org/10.1029/2018JD028776, 2018.
Schneider, J., Weigel, R., Klimach, T., Dragoneas, A., Appel, O., Hünig, A., Molleker, S., Köllner, F., Clemen, H.-C., Eppers, O., Hoppe, P., Hoor, P., Mahnke, C., Krämer, M., Rolf, C., Grooß, J.-U., Zahn, A., Obersteiner, F., Ravegnani, F., Ulanovsky, A., Schlager, H., Scheibe, M., Diskin, G. S., DiGangi, J. P., Nowak, J. B., Zöger, M., and Borrmann, S.: Aircraft-based observation of meteoric material in lower-stratospheric aerosol particles between 15 and 68° N, Atmos. Chem. Phys., 21, 989–1013, https://doi.org/10.5194/acp-21-989-2021, 2021.
Schoeberl, M. R., Wang, Y., Taha, G., Zawada, D. J., Ueyama, R., and Dessler, A.: Evolution of the climate forcing during the two years after the Hunga Tonga-Hunga Ha'apai eruption, J. Geophys. Res.-Atmos., 129, e2024JD041296, https://doi.org/10.1029/2024JD041296, 2024.
Sellar, A. A., Jones, C. G., Mulcahy, J. P., Tang, Y., Yool, A., Wiltshire, A., O'Connor, F. M., Stringer, M., Hill, R., Palmieri, J., Woodward, S., de Mora, L., Kuhlbrodt, T., Rumbold, S. T., Kelley, D. I., Ellis, R., Johnson, C. E., Walton, J., Abraham, N. L., Andrews, M. B., Andrews, T., Archibald, A. T., Berthou, S., Burke, E., Blockley, E., Carslaw, K., Dalvi, M., Edwards, J., Folberth, G. A., Gedney, N., Griffiths, P. T., Harper, A. B., Hendry, M. A., Hewitt, A. J., Johnson, B., Jones, A., Jones, C. D., Keeble, J., Liddicoat, S., Morgenstern, O., Parker, R. J., Predoi, V., Robertson, E., Siahaan, A., Smith, R. S., Swaminathan, R., Woodhouse, M. T., Zeng, G., and Zerroukat, M.: UKESM1: Description and evaluation of the U.K. Earth System Model, J. Adv. Model. Earth Sy., 11, 4513–4558, https://doi.org/10.1029/2019MS001739, 2019.
Sellitto, P., Podglajen, A., Belhadji, R., Boichu, M., Carboni, E., Cuesta, J., Duchamp, C., Kloss, C., Siddans, R., Bègue, N., and Blarel, L.: The unexpected radiative impact of the Hunga Tonga eruption of 15th January 2022, Commun. Earth Environ., 3, 288, https://doi.org/10.1038/s43247-022-00618-z, 2022.
Serva, F., Christiansen, B., Davini, P., Von Hardenberg, J., Van Den Oord, G., Reerink, T. J., Wyser, K., and Yang, S.: Changes in stratospheric dynamics simulated by the EC-Earth model from CMIP5 to CMIP6, J. Adv. Model. Earth Sy., 16, e2023MS003756, https://doi.org/10.1029/2023MS003756, 2024.
Sheng, J.-X., Weisenstein, D. K., Luo, B.-P., Rozanov, E., Stenke, A., Anet, J., Bingemer, H., and Peter, T.: Global atmospheric sulfur budget under volcanically quiescent conditions: Aerosol-chemistry-climate model predictions and validation, J. Geophys. Res.-Atmos., 120, 256–276, https://doi.org/10.1002/2014JD021985, 2015.
Sigl, M., Winstrup, M., McConnell, J. R., Welten, K. C., Plunkett, G., Ludlow, F., Büntgen, U., Caffee, M., Chellman, N., Dahl-Jensen, D., Fischer, H., Kipfstuhl, S., Kostick, C., Maselli, O. J., Mekhaldi, F., Mulvaney, R., Muscheler, R., Pasteris, D. R., Pilcher, J. R., Salzer, M., Schüpbach, S., Steffensen, J. P., Vinther, B. M., and Woodruff, T. E.: Timing and climate forcing of volcanic eruptions for the past 2500 years, Nature, 523, 543–549, https://doi.org/10.1038/nature14565, 2015.
Sigl, M., Toohey, M., McConnell, J. R., Cole-Dai, J., and Severi, M.: Volcanic stratospheric sulfur injections and aerosol optical depth during the Holocene (past 11 500 years) from a bipolar ice-core array, Earth Syst. Sci. Data, 14, 3167–3196, https://doi.org/10.5194/essd-14-3167-2022, 2022.
Smith, C. J., Forster, P. M., Allen, M., Leach, N., Millar, R. J., Passerello, G. A., and Regayre, L. A.: FAIR v1.3: a simple emissions-based impulse response and carbon cycle model, Geosci. Model Dev., 11, 2273–2297, https://doi.org/10.5194/gmd-11-2273-2018, 2018.
Smith, C., Cummins, D. P., Fredriksen, H.-B., Nicholls, Z., Meinshausen, M., Allen, M., Jenkins, S., Leach, N., Mathison, C., and Partanen, A.-I.: fair-calibrate v1.4.1: calibration, constraining, and validation of the FaIR simple climate model for reliable future climate projections, Geosci. Model Dev., 17, 8569–8592, https://doi.org/10.5194/gmd-17-8569-2024, 2024.
Sofieva, V. F., Rozanov, A., Szelag, M., Burrows, J. P., Retscher, C., Damadeo, R., Degenstein, D., Rieger, L. A., and Bourassa, A.: CREST: a Climate Data Record of Stratospheric Aerosols, Earth Syst. Sci. Data, 16, 5227–5241, https://doi.org/10.5194/essd-16-5227-2024, 2024.
Sospedra-Alfonso, R., Merryfield, W., Toohey, M., Timmreck, C., Vernier, J., Bethke, I., Wang, Y., Bilbao, R., Donat, M., Ortega, P., Cole, J., Lee, W., Delworth, T., Paynter, D., Zeng, F., Zhang, L., Khodri, M., Mignot, J., Swingedouw, D., Torres, O., Hu, S., Man, W., Zuo, M., Hermanson, L., Smith, D., Kataoka, T., and Tatebe, H.: Decadal prediction centers prepare for a major volcanic eruption, B. Am. Meteorol. Soc., 105, E2496–E2524, https://doi.org/10.1175/BAMS-D-23-0111.1, 2024.
SPARC (Stratosphere-troposphere Processes And their Role in Climate): Assessment of stratospheric aerosol properties (ASAP) (WCRP-124, WMO/TD No. 1295, SPARC Rep. 4), https://aparc-climate.org/publications/sparc-report-no-4/ (last access: 10 April 2026), 2006.
Stenchikov, G., Ukhov, A., and Osipov, S.: Modeling the radiative forcing and atmospheric temperature perturbations caused by the 2022 Hunga volcano explosion, J. Geophys. Res.-Atmos., 130, e2024JD041940, https://doi.org/10.1029/2024JD041940, 2025.
Stocker, M., Ladstädter, F., Wilhelmsen, H., and Steiner, A. K.: Quantifying stratospheric temperature signals and climate imprints from post-2000 volcanic eruptions, Geophys. Res. Lett., 46, 12486–12494, https://doi.org/10.1029/2019GL084396, 2019.
Stothers, R. B.: Major optical depth perturbations to the stratosphere from volcanic eruptions: Pyrheliometric period, 1881–1960, J. Geophys. Res., 101, 3901–3920, https://doi.org/10.1029/95JD03237, 1996.
Stothers, R. B.: Major optical depth perturbations to the stratosphere from volcanic eruptions: Stellar extinction period, 1961–1978, J. Geophys. Res., 106, 2993–3003, https://doi.org/10.1029/2000JD900652, 2001.
Stothers, R. B.: Three centuries of observation of stratospheric transparency, Climatic Change, 83, 515–521, https://doi.org/10.1007/s10584-007-9238-3, 2007.
Sumlin, B. J., Heinson, W. R., and Chakrabarty, R. K.: Retrieving the aerosol complex refractive index using PyMieScatt: A Mie computational package with visualization capabilities, J. Quant. Spectrosc. Ra., 205, 127–134, https://doi.org/10.1016/j.jqsrt.2017.10.012, 2018.
Taylor, K. E., Stouffer, R. J., and Meehl, G. A.: An overview of CMIP5 and the experiment design, B. Am. Meteorol. Soc., 93, 485–498, https://doi.org/10.1175/BAMS-D-11-00094.1, 2012.
Timmreck, C., Mann, G. W., Aquila, V., Hommel, R., Lee, L. A., Schmidt, A., Brühl, C., Carn, S., Chin, M., Dhomse, S. S., Diehl, T., English, J. M., Mills, M. J., Neely, R., Sheng, J., Toohey, M., and Weisenstein, D.: The Interactive Stratospheric Aerosol Model Intercomparison Project (ISA-MIP): motivation and experimental design, Geosci. Model Dev., 11, 2581–2608, https://doi.org/10.5194/gmd-11-2581-2018, 2018.
Thomason, L. W., Ernest, N., Millán, L., Rieger, L., Bourassa, A., Vernier, J.-P., Manney, G., Luo, B., Arfeuille, F., and Peter, T.: A global space-based stratospheric aerosol climatology: 1979–2016, Earth Syst. Sci. Data, 10, 469–492, https://doi.org/10.5194/essd-10-469-2018, 2018.
Thomason, L. W., Kovilakam, M., Schmidt, A., von Savigny, C., Knepp, T., and Rieger, L.: Evidence for the predictability of changes in the stratospheric aerosol size following volcanic eruptions of diverse magnitudes using space-based instruments, Atmos. Chem. Phys., 21, 1143–1158, https://doi.org/10.5194/acp-21-1143-2021, 2021.
Toohey, M. and Sigl, M.: Volcanic stratospheric sulfur injections and aerosol optical depth from 500 BCE to 1900 CE, Earth Syst. Sci. Data, 9, 809–831, https://doi.org/10.5194/essd-9-809-2017, 2017.
Toohey, M., Stevens, B., Schmidt, H., and Timmreck, C.: Easy Volcanic Aerosol (EVA v1.0): an idealized forcing generator for climate simulations, Geosci. Model Dev., 9, 4049–4070, https://doi.org/10.5194/gmd-9-4049-2016, 2016.
Ukhov, A., Stenchikov, G., Osipov, S., Krotkov, N., Gorkavyi, N., Li, C., Dubovik, O., and Lopatin, A.: Inverse modeling of the initial stage of the 1991 Pinatubo volcanic cloud accounting for radiative feedback of volcanic ash, J. Geophys. Res.-Atmos., 128, e2022JD038446, https://doi.org/10.1029/2022JD038446, 2023.
Verkerk, M., Aubry, T. J., Smith, C., Hopcroft, P. O., Sigl, M., Tierney, J. E., Anchukaitis, K., Osman, M., Schmidt, A., and Toohey, M.: Using reduced-complexity volcanic aerosol and climate models to produce large ensemble simulations of Holocene temperature, Clim. Past, 21, 1755–1778, https://doi.org/10.5194/cp-21-1755-2025, 2025.
Vernier, J.-P., Aubry, T. J., Timmreck, C., Schmidt, A., Clarisse, L., Prata, F., Theys, N., Prata, A. T., Mann, G., Choi, H., Carn, S., Rigby, R., Loughlin, S. C., and Stevenson, J. A.: The 2019 Raikoke eruption as a testbed used by the Volcano Response group for rapid assessment of volcanic atmospheric impacts, Atmos. Chem. Phys., 24, 5765–5782, https://doi.org/10.5194/acp-24-5765-2024, 2024.
Visioni, D., MacMartin, D. G., Kravitz, B., Boucher, O., Jones, A., Lurton, T., Martine, M., Mills, M. J., Nabat, P., Niemeier, U., Séférian, R., and Tilmes, S.: Identifying the sources of uncertainty in climate model simulations of solar radiation modification with the G6sulfur and G6solar Geoengineering Model Intercomparison Project (GeoMIP) simulations, Atmos. Chem. Phys., 21, 10039–10063, https://doi.org/10.5194/acp-21-10039-2021, 2021.
Wrana, F., Niemeier, U., Thomason, L. W., Wallis, S., and von Savigny, C.: Stratospheric aerosol size reduction after volcanic eruptions, Atmos. Chem. Phys., 23, 9725–9743, https://doi.org/10.5194/acp-23-9725-2023, 2023.
Yu, P., Portmann, R. W., Peng, Y., Liu, C. C., Zhu, Y., Asher, E., Bai, Z., Lu, Y., Bian, J., Mills, M., and Schmidt, A.: Radiative forcing from the 2014–2022 volcanic and wildfire injections, Geophys. Res. Lett., 50, e2023GL103791, https://doi.org/10.1029/2023GL103791, 2023.
Zanchettin, D., Khodri, M., Timmreck, C., Toohey, M., Schmidt, A., Gerber, E. P., Hegerl, G., Robock, A., Pausata, F. S. R., Ball, W. T., Bauer, S. E., Bekki, S., Dhomse, S. S., LeGrande, A. N., Mann, G. W., Marshall, L., Mills, M., Marchand, M., Niemeier, U., Poulain, V., Rozanov, E., Rubino, A., Stenke, A., Tsigaridis, K., and Tummon, F.: The Model Intercomparison Project on the climatic response to Volcanic forcing (VolMIP): experimental design and forcing input data for CMIP6, Geosci. Model Dev., 9, 2701–2719, https://doi.org/10.5194/gmd-9-2701-2016, 2016.
Zhang, J., Furtado, K., Turnock, S. T., Mulcahy, J. P., Wilcox, L. J., Booth, B. B., Sexton, D., Wu, T., Zhang, F., and Liu, Q.: The role of anthropogenic aerosols in the anomalous cooling from 1960 to 1990 in the CMIP6 Earth system models, Atmos. Chem. Phys., 21, 18609–18627, https://doi.org/10.5194/acp-21-18609-2021, 2021.
- Abstract
- Introduction
- Source datasets
- Volcanic aerosol model (EVA_H, v2)
- Stratospheric aerosol optical properties for pre-industrial, historical (1750–2023) and scenario simulations
- Comparison with CMIP6
- Stratospheric aerosol optical properties for CMIP: Challenges, opportunities and operationalization
- Conclusions
- Code availability
- Data availability
- Author contributions
- Competing interests
- Disclaimer
- Acknowledgements
- Financial support
- Review statement
- References
- Supplement