the Creative Commons Attribution 4.0 License.
the Creative Commons Attribution 4.0 License.
 | 18 Mar 2026
Assessing the impact of solar climate intervention on future U.S. weather using a convection-permitting WRF model
James W. Hurrell
Kristen L. Rasmussen
Bali Summers
Erin A. Sherman
Ben Kravitz
A primary solar climate intervention (SCI) strategy is stratospheric aerosol injection (SAI). SAI would increase the number of small reflective particles (aerosols) in the upper atmosphere to reduce climate warming by reflecting more incoming solar radiation away from Earth. Research on SCI is growing quickly, but no studies to date have examined the impact of SCI on severe storms using a mesoscale weather model. In this study, we develop a novel framework using the convection-permitting (4-km resolution) Weather Research & Forecasting (WRF) model to assess the potential impact of SCI on future convective weather over the contiguous United States (CONUS). We conduct three types of simulations for the March–August 2011 period, during which widespread convective outbreaks occurred across the CONUS: (1) a control simulation driven by ERA-5 reanalysis; (2) a Pseudo-Global Warming (PGW) simulation representing a future with increasing greenhouse gas concentrations but without SCI; and (3) a novel Pseudo-SAI (PSAI) simulation representing a future with SCI. Future climate perturbations applied to the PGW and PSAI boundary conditions are derived from ensemble-mean differences between baseline and future scenarios in Community Earth System Model (CESM) experiments with and without SCI. These perturbations are taken from two CESM projects featuring different scenarios: the Geoengineering Large Ensemble (GLENS) and the Assessing Responses and Impacts of Solar Climate Intervention on the Earth System with Stratospheric Aerosol Injection (ARISE). The PSAI simulation includes an additional aerosol optical depth perturbation to represent the shortwave radiative impact of SAI. This paper presents the novel experimental design and modeling framework, and shares preliminary results that highlight the feasibility and scientific potential of this approach for assessing potential weather-scale impacts of SCI. In particular, we show that global warming leads to an increase in extreme precipitation and more frequent deep convection over the Eastern U.S., both of which can be mitigated by SAI deployment.
- Article
(15081 KB) - Full-text XML
-
Supplement
(1340 KB) - BibTeX
- EndNote


To potentially avoid some of the worst impacts of global warming, there is increasing interest and research on climate intervention (CI) methods. Significant concerns exist over the possible adverse effects that CI approaches may have if implemented, so it is important to understand their potential impacts. Solar Climate Intervention (SCI), also referred to as solar geoengineering or solar radiation management, has been the subject of growing scientific investigation in the context of climate change (e.g., NASEM, 2021; Patrick, 2022; The Royal Society, 2025). A primary SCI strategy considered is stratospheric aerosol injection (SAI), which would increase the number of small reflective particles (aerosols) in the upper atmosphere to reduce climate warming by reflecting more incoming solar radiation away from Earth.
The natural analogue to SAI is a large volcanic eruption that creates a stratospheric aerosol layer, and the Earth cools as a result (e.g., Budyko, 1977; Robock, 2000). If SAI was pursued, an idea is that aerosol precursors (e.g., SO2) could be injected into the stratosphere with strategic design for injection locations (i.e., latitudes and altitudes), aerosol amounts, and timing (MacMartin et al., 2017; Tilmes et al., 2017; Visioni et al., 2019, 2020), all depending on the intended temperature target (how much to cool the planet or reduce the rate of future warming). MacMartin et al. (2014) developed a feedback-control algorithm to regularly modify the amount of solar irradiance reduction needed to meet the chosen global mean temperature objective, which was further expanded to achieve multiple climate objectives simultaneously (Kravitz et al., 2016, 2017). However, conclusions about the effectiveness and risks of SAI are uncertain, and they are dependent upon the specifics of the modelling scenario (MacMartin et al., 2016; NASEM, 2021). To-date, most assessments of SAI typically consider just one scenario with one particular injection strategy (where and when to inject).
Significant progress in assessing the impacts of SAI on the Earth system and understanding their underlying mechanisms has been achieved through initiatives like the Geoengineering Model Intercomparison Project (GeoMIP; Kravitz et al., 2015; Visioni et al., 2024), the Geoengineering Large Ensemble project (GLENS; Tilmes et al., 2018), and the Assessing Responses and Impacts of Solar climate intervention on the Earth system project (ARISE; Richter et al., 2022). GeoMIP explores a range of idealized and scenario-based SAI experiments using prescribed aerosol or radiative forcing perturbations, while GLENS and ARISE employ feedback-controlled sulfur dioxide injection strategies designed to maintain global temperature targets under increasing greenhouse gas forcing. Together, these coordinated modeling efforts have revealed several robust features of the climate response to SAI. For example, previous studies have shown that SAI can suppress the intensification of the global hydrological cycle under global warming and moderate climate hazards in most regions (Simpson et al., 2019; Cheng et al., 2019; Irvine and Keith, 2020). A number of assessments have also been conducted on the impact of SAI on the polar vortex and tropospheric North Atlantic Oscillation (NAO) (Simpson et al., 2019; Banerjee et al., 2021), tropospheric air pollution (Xia et al., 2017), stratospheric ozone loss (Tilmes et al., 2021; Robrecht et al., 2021), the ocean and the cryosphere (Fasullo et al., 2018; Jiang et al., 2019; Morrison et al., 2024), ecosystems (Hueholt et al., 2024), wildfire risk (Touma et al., 2023), biogeochemistry (Yang et al., 2020), and climate impacts regionally (e.g., Pinto et al., 2020; Da-Allada et al., 2020). Yet, no studies to date (to our knowledge) have examined the impact of SAI on mesoscale processes and hazardous convective weather.
Hazardous convective weather, including severe thunderstorms, tornadoes, strong winds and large hail, is a prominent source of natural disasters and losses across the world, including the contiguous United States (CONUS) (NCEI, 2024; Munich Re., 2024). Potential future changes in frequency and intensity of severe weather have drawn considerable attention due to the economic and societal implications of such changes. Climate models forced by increasing greenhouse gas concentrations suggest that convection and severe weather will increase in a warmer climate from enhanced convective available potential energy (CAPE) – a measure of atmospheric instability that promotes cloud formation and thunderstorm development (e.g., Diffenbaugh et al., 2013; Rasmussen et al., 2017). Figure S1 in the supplementary material, diagnosed from ARISE Shared Socioeconomic Pathway 2–4.5 (SSP2–4.5) future projections with and without SAI, indicates a significant increase (up to 12 %) in the number of days with environments favorable for the formation of severe thunderstorms (NDSEV; a combined proxy critical for the occurrence of several convective storms) under climate change, including potentially intensified convective weather over much of the southeast and eastern U.S. This increase is mostly avoided when SAI is deployed as in ARISE (Fig. S1 in the Supplement). Glade et al. (2023) revealed that while the forced changes in thermodynamic parameters like NDSEV, CAPE and Convective Inhibition (CIN) are significantly reduced under SAI relative to climate change, future changes in kinematic parameters such as wind shear are less certain.
While global climate models are useful to examine future projected changes in the large-scale severe thunderstorm environment (Fig. S1), coarse-resolution models do not adequately represent the fine-scale cloud and mesoscale processes critical for understanding the physical mechanisms that may result in a changing convective population. In contrast, high-resolution (e.g., horizontal grid spacing of ∼ 4 km) convection-permitting models (CPMs) do not rely on convective parameterizations to represent the evolution and life cycle of convective clouds and allow for a more accurate representation of surface fields (Prein et al., 2015), such as topography (Rasmussen et al., 2011) and the diurnal cycle of precipitation (Rasmussen et al., 2017). Research at the interface of climate and mesoscale processes has motivated efforts to conduct convection-permitting climate model simulations that more accurately represent cloud and mesoscale processes under varying climate states, including recent progress in global convection-permitting climate modeling (Stevens et al., 2019; Palmer and Stevens, 2019; Senior et al., 2021). Dynamical downscaling, which utilizes initial and boundary conditions from global climate model projections or reanalysis datasets to drive regional CPMs, has been found to reasonably replicate the climatological distribution and variability of convective storms (Trapp et al., 2011; Gensini and Mote, 2014; Prein et al., 2017a) and precipitation (Liu et al., 2017). One widely used form of dynamical downscaling is the pseudo global warming (PGW) technique, which has been successfully used to demonstrate the impact of climate change on convective weather around the world (Schär et al., 1996; Sato et al., 2007; Hara et al., 2008; Kawase et al., 2009; Lackmann, 2013; Rasmussen et al., 2011, 2014, 2017, 2023; Liu et al., 2017; Trapp and Hoogewind, 2016; Prein et al., 2017a, b; Viceto et al., 2017; Gutmann et al., 2018; Cui et al., 2024; Dominguez et al., 2024). The PGW approach is typically paired with a control simulation driven by reanalysis data to represent present-day conditions. Global climate model projections are used to calculate the climate change signal as the climatological difference between a future period and a baseline period. This “delta signal” is then added to the lateral and lower boundary conditions of the regional model, as well as to greenhouse gas concentrations. PGW simulations represent future thermodynamic environments while maintaining synoptic conditions that are very similar to those in the control run. Thus, the PGW method is particularly well-suited to address the question: “what will today's weather look like in a future warmer climate?” (Rasmussen et al., 2017). This technique can be used to estimate the fine-scale processes and physical mechanisms that explain changes in the full spectrum of clouds and precipitation systems in a future climate. For example, it has been shown that in response to climate change there may be fewer weak storms but more strong storms over the contiguous U.S., which can be largely explained by changes in the thermodynamic environments (Rasmussen et al., 2017). Recent studies have also used this technique to study flash flood producing storms (Dougherty and Rasmussen, 2020, 2021), including atmospheric rivers (Dougherty et al., 2020).
The purpose of this paper is to develop a novel modelling framework using the convection-permitting Weather Research and Forecasting (WRF) model (Skamarock et al., 2008) to assess the potential impact of SAI on hazardous convective weather over the CONUS. The PGW technique is a proven methodology that allows examination of how today's weather might change under future climate states (Rasmussen et al., 2017; Liu et al., 2017). A novel aspect of this study is to conduct parallel pseudo-stratospheric aerosol injection (PSAI) simulations and compare the future changes in weather under climate change to those where SAI has been deployed. To our knowledge, no other studies have examined how SAI might impact fine-scale cloud and mesoscale processes and their thermodynamic environments in a future climate. This paper is organized as follows: Sect. 2 provides an overview of the GLENS and ARISE data used to drive our convection-permitting model. Section 3 describes the WRF model and the detailed setup of PGW and PSAI simulations. Section 4 presents a few preliminary results that highlight the feasibility and scientific potential of this approach for assessing weather-scale impacts of SCI, followed by a summary and conclusions in Sect. 5.
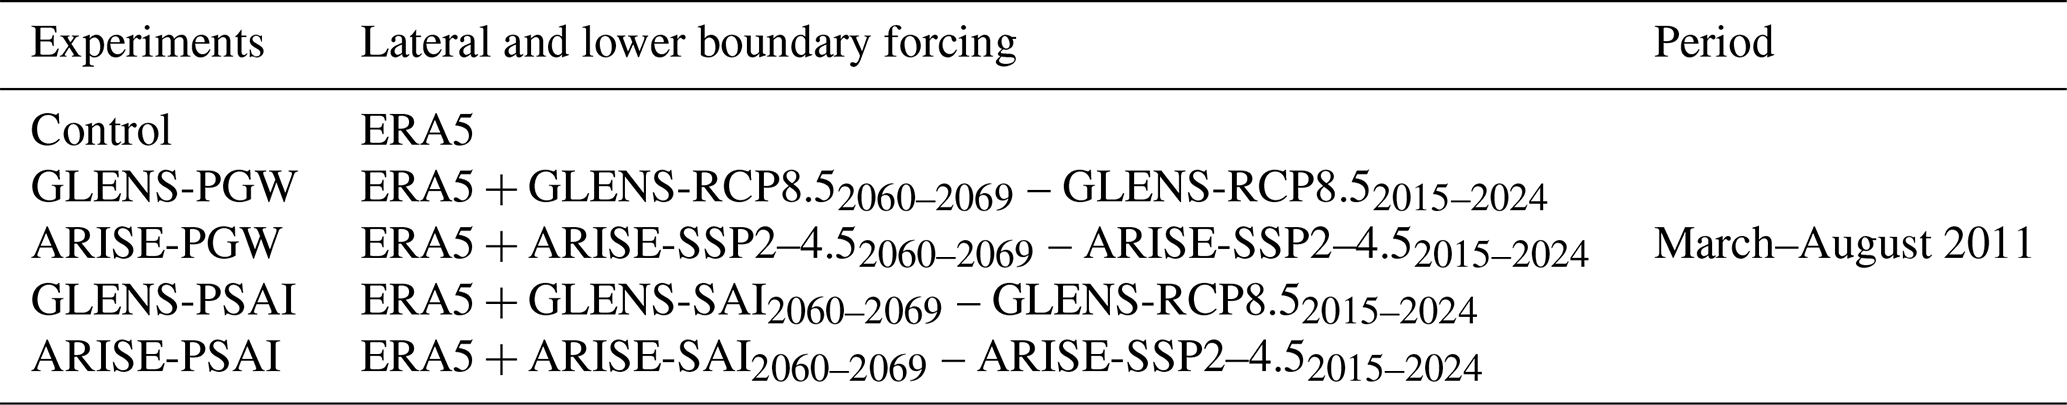
We utilize two CESM-SAI ensembles featuring different climate change and SAI scenarios to drive the WRF model: the GLENS (Tilmes et al., 2018) and ARISE (Richter et al., 2022) simulations, all conducted at a horizontal resolution of 1.25° longitude by 0.9° latitude. Table 1 lists the details for these ensembles. GLENS used the CESM version 1 (Hurrell et al., 2013) with the Whole Atmosphere Community Climate Model as its atmospheric component (CESM1-WACCM; Mills et al., 2017) to complete a 21-member ensemble of stratospheric sulfate aerosol geoengineering simulations between 2020–2099. The time-varying sulphur dioxide (SO2) injections, using the aforementioned feedback algorithm, occur at ∼ 5 km above the tropopause at four locations (15 and 30° N/S). The controller algorithm specifies the amount of SO2 injected, updated annually based on the climate objectives (MacMartin et al., 2014; Kravitz et al., 2017). The climate objectives of GLENS were to maintain the global-mean surface temperature, interhemispheric surface temperature gradient, and equator-to-pole surface temperature gradient at 2020 values under the representative concentration pathway 8.5 (RCP8.5) scenario (Fig. 1; red and blue curves).
Table 1CESM data that was utilized to generate regional climate simulation forcing terms.
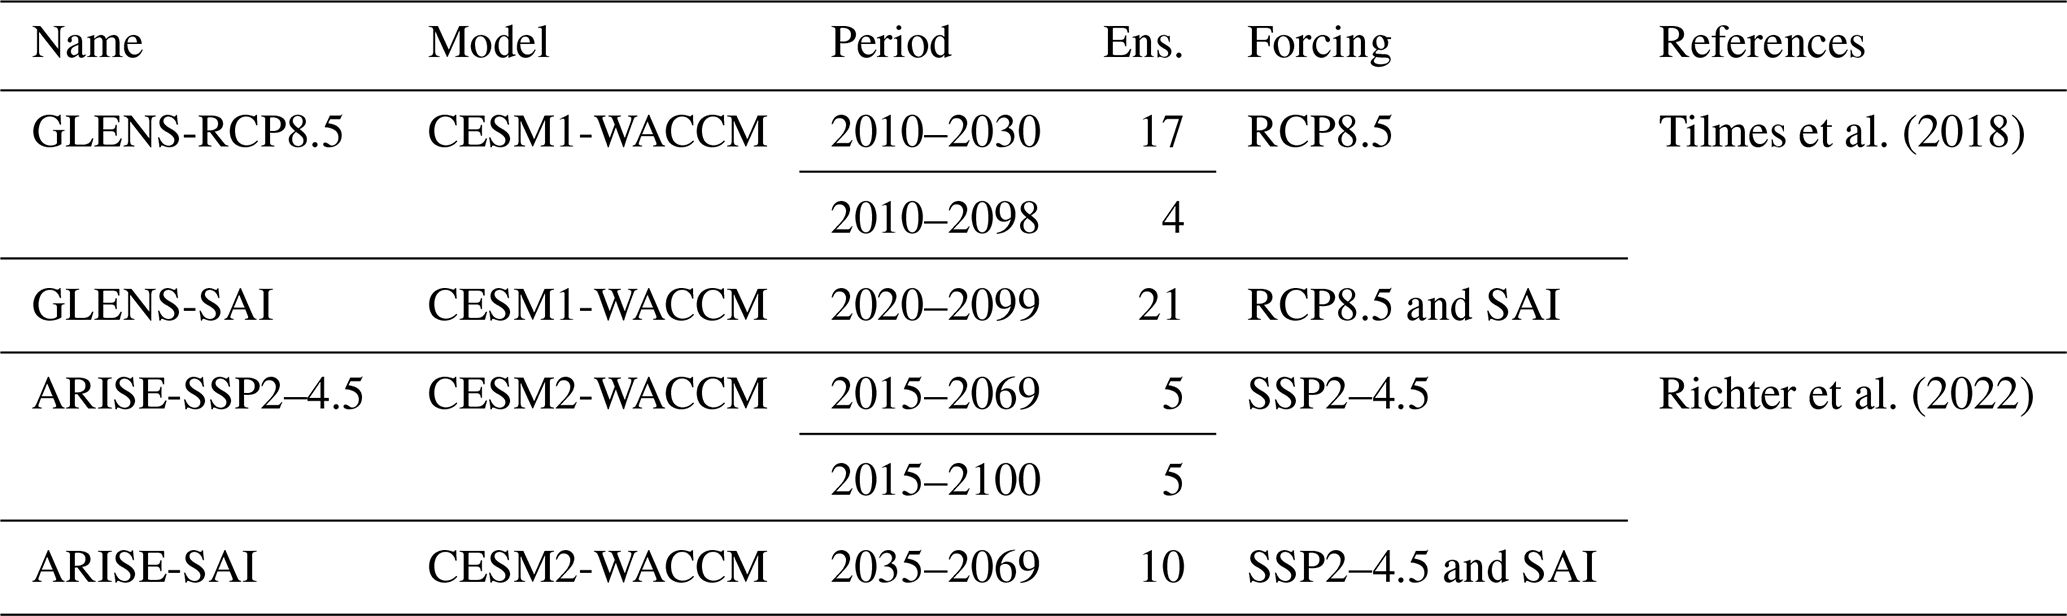
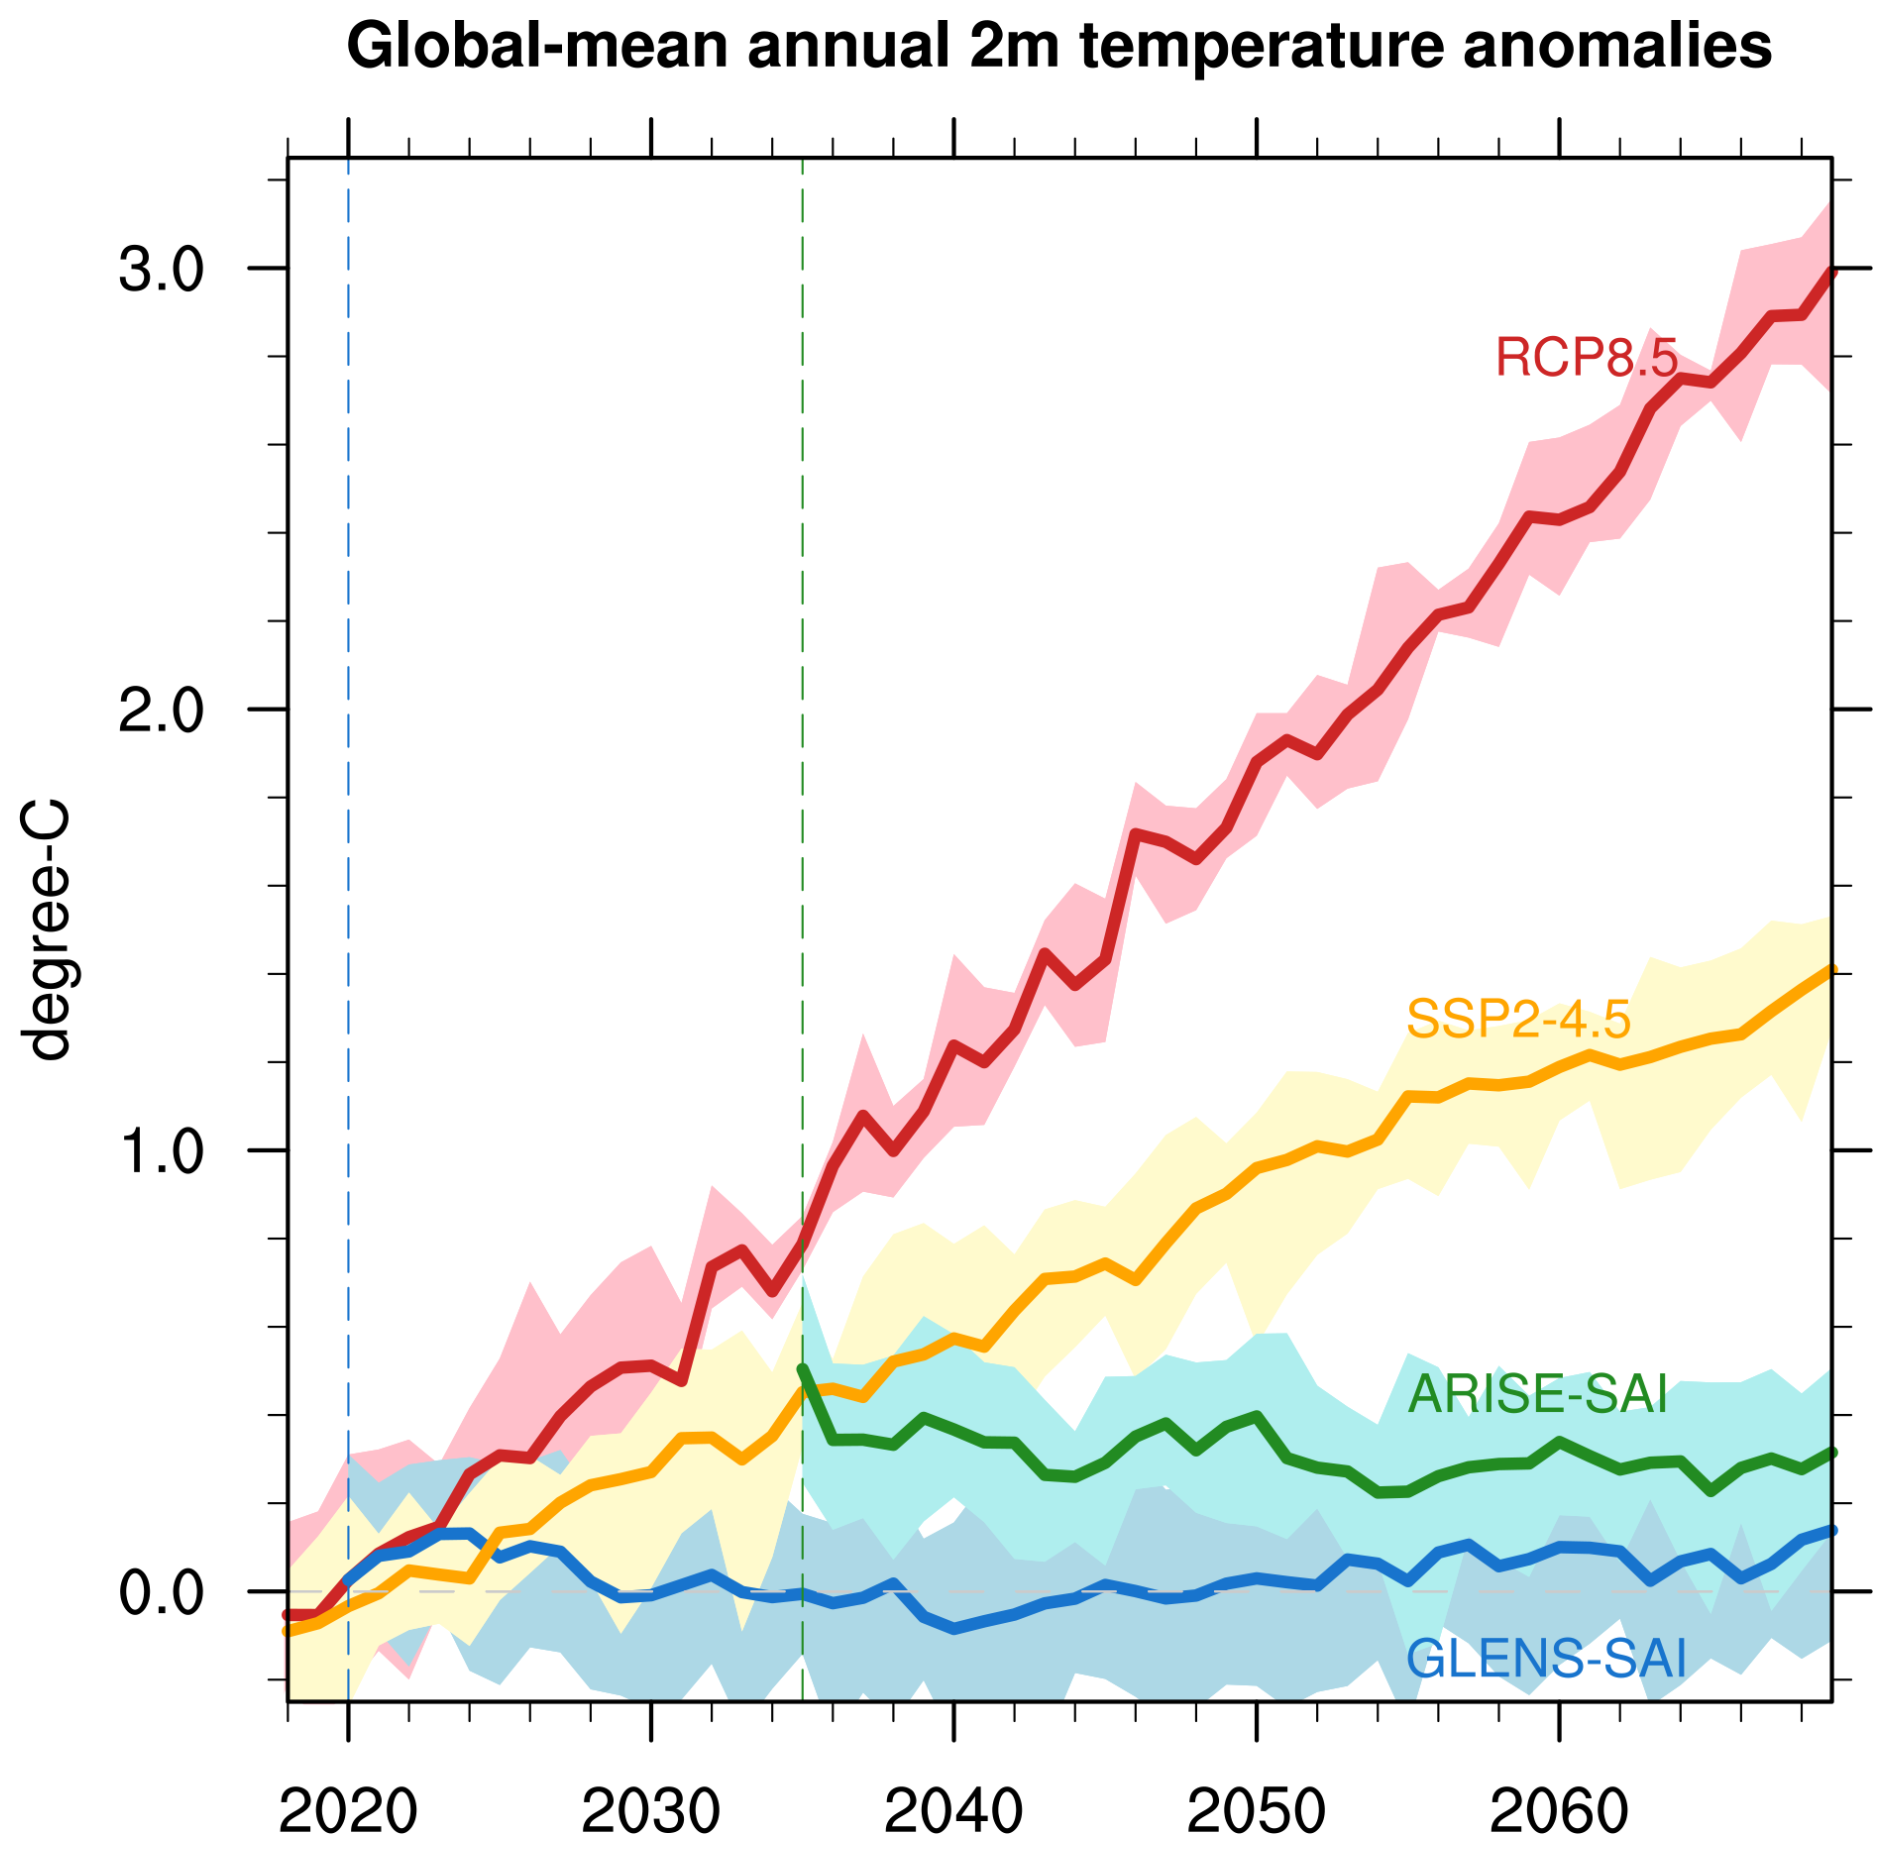
Figure 1Global mean surface air temperature anomalies relative to the 2015–2024 baseline from CESM1-WACCM RCP8.5 (red curve), CESM2-WACCM SSP2–4.5 (orange curve), and their respective GLENS-SAI (blue curve) and ARISE-SAI (green curve) simulations. Shading represents the range of temperature anomalies (maximum to minimum across all available individual members). Vertical blue and green lines indicate the start year of SAI for GLENS (2020) and ARISE (2035), respectively. Adapted from Tilmes et al. (2018) and Richter et al. (2022).
The GLENS project assumes no climate mitigation through 2100; that is, SAI must increase in magnitude through the end of the century to counter warming from ever-increasing concentrations of greenhouse gases. The ARISE-SAI project uses a moderate SSP2–4.5 that more closely tracks current policy scenarios for climate mitigation. ARISE is a 10-member SCI ensemble with version two of the CESM (Danabasoglu et al., 2020), again with the Whole Atmosphere Community Model (CESM2-WACCM; Gettelman et al., 2019) as its atmospheric component. ARISE-SAI assumes that the world would not begin SAI until 2035 (when the CESM2 global surface temperature reaches ∼ 1.5°C above pre-industrial levels following the SSP2–4.5 scenario) and would only continue it until 2070, when carbon levels in the atmosphere reach “safer levels” due to mitigation and the implementation of carbon dioxide removal techniques (Fig. 1; orange and green curves). Sulfur dioxide is injected at the same latitudes in both ARISE-SAI and GLENS-SAI simulations, with an injection altitude in the lower stratosphere near 21.5 km. Considering that GLENS and ARISE have different climate change scenarios (RCP8.5 and SSP2–4.5), strategic design and stratospheric aerosol loadings, there is no reason to assume that the impact of SAI will be the same between them. Therefore, the GLENS and ARISE ensembles span a range of SCI scenarios that we leverage for our project.
3.1 WRF description
Previous efforts have created long-term, convection-permitting regional hydroclimate simulations using the WRF model by dynamically downscaling ERA5 reanalysis (Hersbach et al., 2020), including a 40-year dataset over the conterminous United States (CONUS404; Rasmussen et al., 2023) and 22-year simulations over South America conducted by the South America Affinity Group (SAAG; Dominguez et al., 2024). For this project, we use WRF version 4.1.5 (Skamarock et al., 2008), which is an updated version of that used in CONUS404 and identical to the one used in the SAAG simulations. We conduct all simulations over a domain of 1019 × 863 grid points, using 4 km horizontal grid spacing to encompass most of the CONUS, Southern Canada, Northern Mexico and nearby waters (Fig. 2). The simulations include 61 vertically-stretched levels capped at 10 hPa. The major subgrid parameterizations include the Thompson microphysics scheme (Thompson et al., 2008), the Yonsei University (YSU) planetary boundary layer formulation (Hong et al., 2006), the Noah-MP land surface model (Niu et al., 2011), and the Rapid Radiative Transfer Model (RRTMG) for longwave and shortwave atmospheric radiation (Iacono et al., 2008).
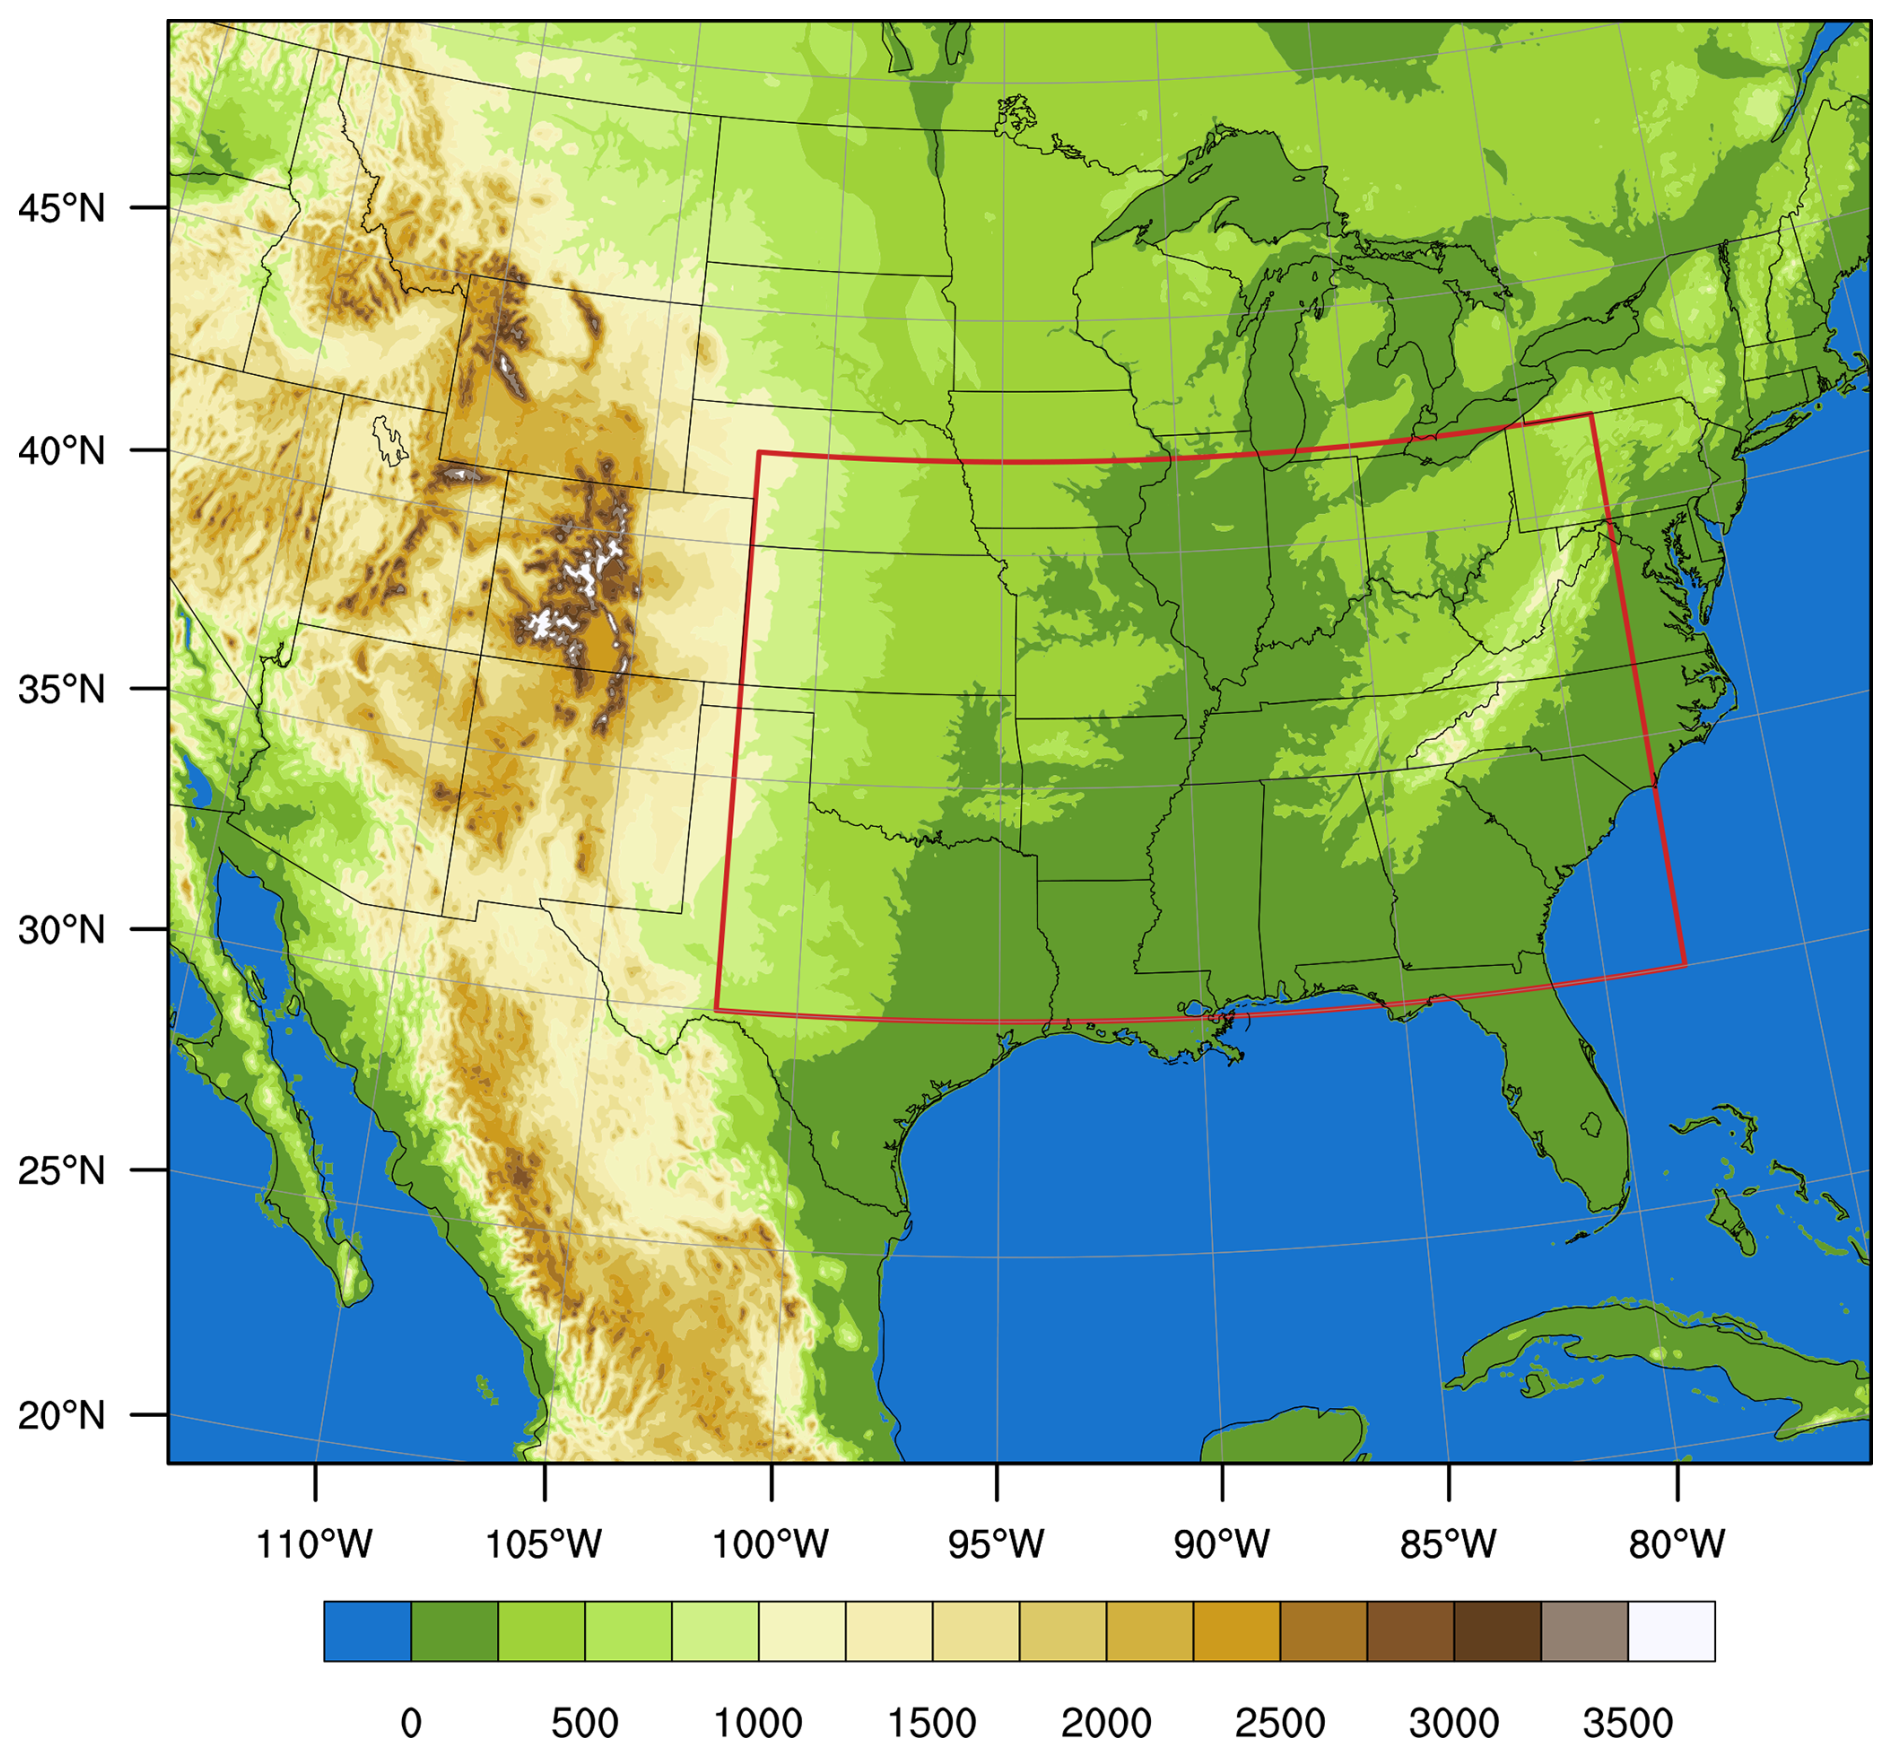
Figure 2Domain of the 4 km WRF simulation with land surface elevation height (m). The red box denotes the eastern U.S. region used in subsequent analyses.
Our control setup and parameterizations are identical to the setup used for the CONUS404. This configuration has been demonstrated to generally well reproduce the diurnal cycle of precipitation (Rasmussen et al., 2017; Scaff et al., 2020), mesoscale convective systems (Prein et al., 2017a), and state variables like temperature and moisture (Liu et al., 2017). In addition, the newly integrated Miguez-Macho groundwater scheme has been shown to significantly reduce the warm air temperature and low moisture biases (Barlage et al., 2021) that were evident during the late warm season in earlier CPM simulations over CONUS (Liu et al., 2017).
This study focuses on the warm season (March–August) of 2011, which includes the U.S. tornado super outbreak that occurred from 25–28 April, resulting in 321 fatalities and an estimated USD 14.3 billion in damages (NCEI, 2024). Using the ERA-5 reanalysis dataset (Hersbach et al., 2020) as the lower and lateral boundary conditions, we conduct a WRF control simulation over this period. Figure 3 compares the mean temperature and precipitation from the control with observations from the Parameter-elevation Regressions on Independent Slopes Model (PRISM) dataset (Daly et al., 1997) at 4 km resolution. The WRF control simulation effectively captures both large-scale and fine-scale temperature and precipitation patterns, including localized cooler regions over the high-elevation western U.S. The model also realistically represents the enhanced precipitation on the windward sides of the Rocky Mountains and Appalachians and reduced on the leeward sides, a pattern shaped by underlying topography. On the other hand, the model still exhibits a warm and dry bias in the Central U.S., particularly during June-August, consistent with findings from Liu et al. (2017) and Rasmussen et al. (2023). Along the East Coast, especially in the Southeast, the model tends to overestimate summer precipitation – a feature also noted in both studies.
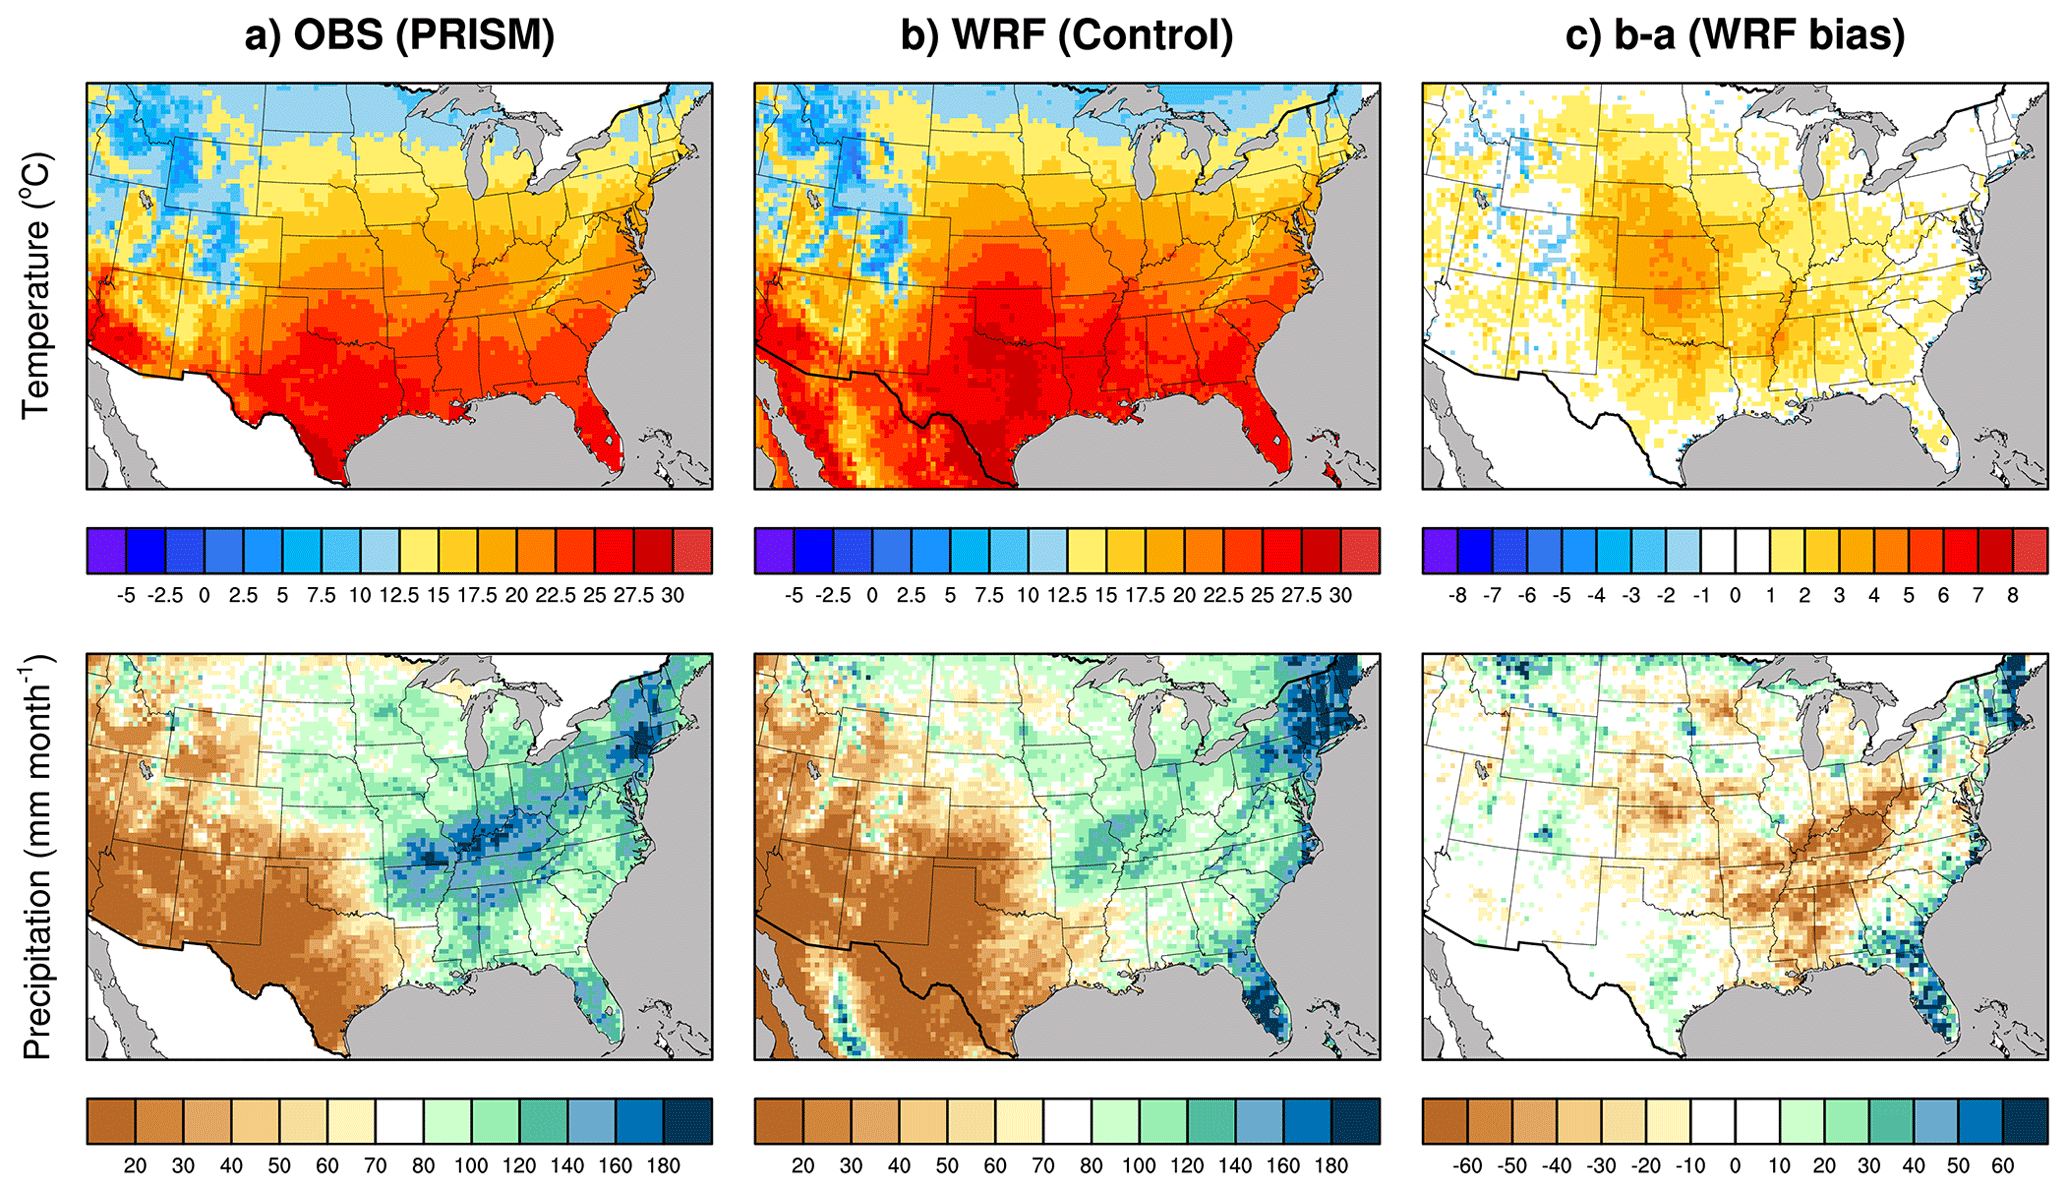
Figure 3March–August 2011 average temperature (°C) and precipitation (mm per month) from (a) PRISM data, (b) WRF control simulations, and (c) their difference.
3.2 PGW and PSAI experimental design
To assess the impact of climate change and SAI on convective storms, two additional types of WRF simulations are conducted: (1) single-member PGW simulations forced with reanalysis plus a future climate perturbation from greenhouse gas forcing; and (2) single-member Pseudo-SAI (PSAI) simulations developed herein that use reanalysis plus a term that incorporates the impacts of both climate change and SAI from ARISE and GLENS. Both the ERA5 reanalysis and the ARISE and GLENS model outputs are interpolated to the same 4 km WRF grid during preprocessing before being used to construct the boundary conditions. Table 2 summarizes the lateral and lower boundary forcing for the suite of WRF simulations used in this study. The GLENS and ARISE monthly mean climate forcing changes from the mid-century time frame (2060–2069) relative to the present (2015–2024) are used to develop the PGW and PSAI forcings that drive the high-resolution convection-permitting WRF simulations. For all simulations, the same baseline and future periods are adopted to facilitate consistent comparison across the five experiments listed in Table 2. The mid-century period is chosen to align with the ARISE-SAI simulations (which end in 2069). For the GLENS simulations under the RCP8.5 scenario, a 21-member ensemble exists for simulations with SAI and a four-member ensemble exists without SAI. For the ARISE simulations under the SSP2–4.5 scenario, 10-member ensembles exist for simulations both with and without SAI (ARISE-SAI and ARISE-SSP2–4.5, respectively). These two ensembles are used to force the PSAI and PGW runs under SSP2–4.5 (Table 1).
For each simulation in Table 2, we calculate the average monthly mean values for horizontal wind, geopotential, temperature, relative humidity, sea surface temperature, soil temperature, and sea level pressure for the periods from 2015–2024 and 2060–2069 and take the difference to calculate the change (delta term) over this period, as has been done in previous PGW simulations (e.g., Liu et al., 2017). Brogli et al. (2023) examined various PGW approaches and found that modifying relative humidity, rather than specific humidity, helps avoid unrealistic precipitation bands along the model boundary. Consistent with their recommendation, we perturb relative humidity while leaving specific humidity unchanged.
Table 2Convection-permitting WRF ensemble experiments performed.
We also calculate the delta term for the lake ice concentration and lake surface temperature, using the output from the CESM land model output. Figures S2 and S3 show the delta changes for these variables for the GLENS and ARISE PGW and PSAI simulations, respectively. These deltas are then added to the ERA5 reanalysis for March–August 2011 (when significant convection was observed over most of the CONUS) to investigate how a future climate state might impact the occurrence of severe weather (Table 2). PSAI and PGW simulations both use lower and lateral boundary conditions from their corresponding future simulations (Table 2 and previous descriptions). For these simulations, delta changes in greenhouse gas (GHG) concentrations from RCP8.5 and SSP2–4.5, including CO2, N2O, CH4, CFC11, CFC12, are applied to the GLENS and ARISE PGW and PSAI scenarios, respectively.
Aerosol changes associated with SAI are also required for the PSAI simulations. The WRF model allows us to prescribe climatological aerosol radiative properties, such as aerosol optical depth (AOD), in its shortwave radiation scheme – the Rapid Radiative Transfer Model (RRTMG; Iacono et al., 2008). This capability enables us to implement the average monthly differences in aerosol extinction coefficients between 2015–2024 and 2060–2069 from the GLENS and ARISE simulations. By setting aer_opt to 1, the model reads aerosol optical data (stored in aerosol.formatted) based on Tegen et al. (1997). We adjust the values for type 6 (stratospheric aerosols), taken from CESM, while setting all other aerosol types to zero. Although the WRF aerosol forcing input has a coarser resolution (4° × 5° lat–lon grid) compared to CESM (0.9° × 1.25° lat–lon grid), the delta AOD exhibits minimal spatial variability, which mitigates potential issues. Figure 4 presents the U.S. averaged aerosol extinction coefficient profiles for GLENS-PSAI (blue curve) and ARISE-PSAI (green curve). The aerosol forcing peaks in the lower stratosphere, near 50 hPa, with the GLENS forcing exceeding the ARISE forcing by more than threefold – consistent with the warming offset required (Fig. 1). Notably, our WRF simulations only account for the radiative effects of stratospheric aerosols: we set aerosol forcing below 400 hPa to zero. Given that the aerosols associated with SAI are primarily confined to the stratosphere (Fig. 4a), we make the assumption that the aerosols have relatively few impacts on the cloud microphysics of tropospheric storm systems. This assumption allows for the direct modification of the shortwave radiation (e.g., reducing the incoming solar radiation) without needing to explicitly simulate aerosol-cloud interactions.
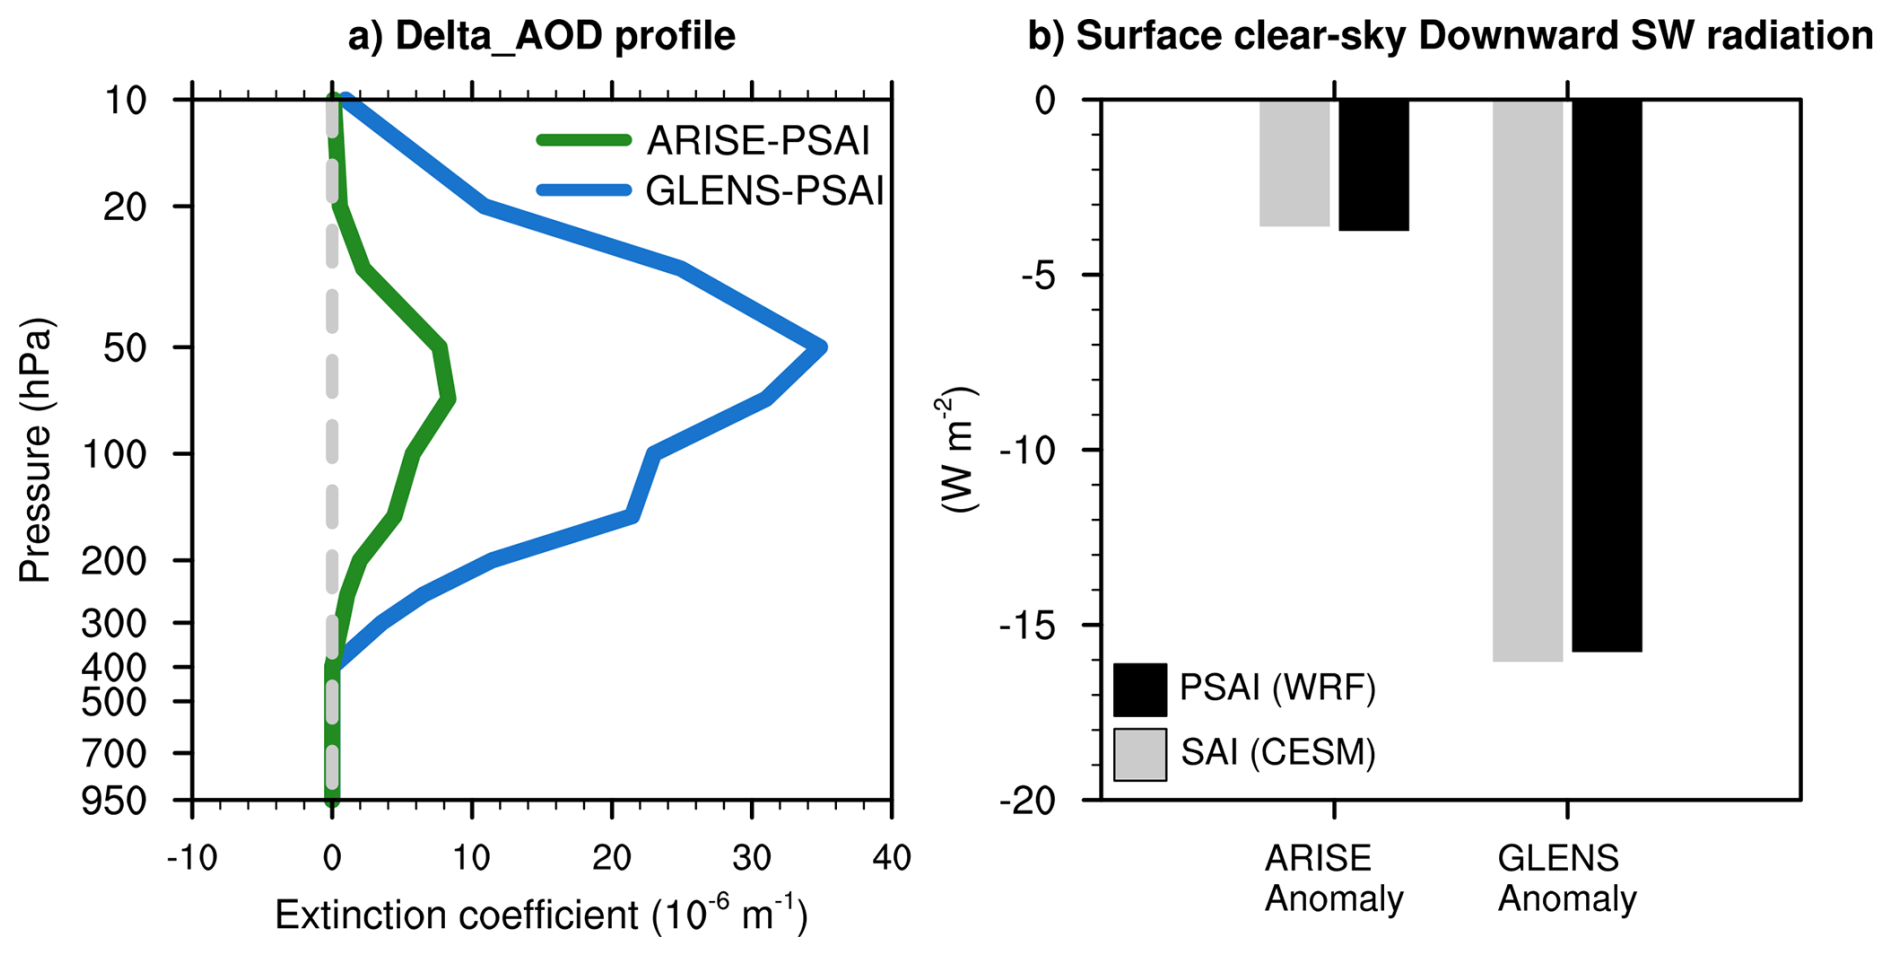
Figure 4(a) Vertical profile of March–August aerosol optical depth (AOD) forcing in WRF GLENS-PSAI (blue) and ARISE-PSAI (green) simulations. ΔAOD, calculated as the 2060–2069 SAI simulations minus the 2015–2024 climatology, is set to zero below 400 hPa to isolate stratospheric aerosol effects. The vertical dashed line indicates the zero-extinction coefficient. (b) Surface clear-sky downward shortwave radiation anomalies in CESM SAI and WRF PSAI simulations. CESM anomalies (2060–2069) are relative to the 2015–2024 baseline, while WRF anomalies are relative to the control simulation. Averages in (a) and (b) are calculated for the WRF domain.
Figure 4b compares the surface clear-sky downward shortwave radiation anomalies averaged over the WRF domain between CESM-SAI and WRF-PSAI simulations for the two SAI scenarios. The reduction in shortwave radiation is ∼ 3.6 W m−2 in ARISE-SAI and ∼ 16 W m−2 in the GLENS-SAI, consistent with the different AOD forcings. Our simplified AOD modification successfully reproduces the magnitudes of the shortwave reduction observed in CESM-SAI simulations. Figure 5 shows the spatial pattern of surface clear-sky downward shortwave radiation anomalies, indicating large reductions over higher latitudes. The PSAI simulations, again, well resemble the changes in CESM-SAI. A more complex test, which involved manually calculating the radiative scattering properties from the CESM and applying them to WRF alongside delta changes in the aerosol extinction coefficient, did not reveal significant differences in the results.
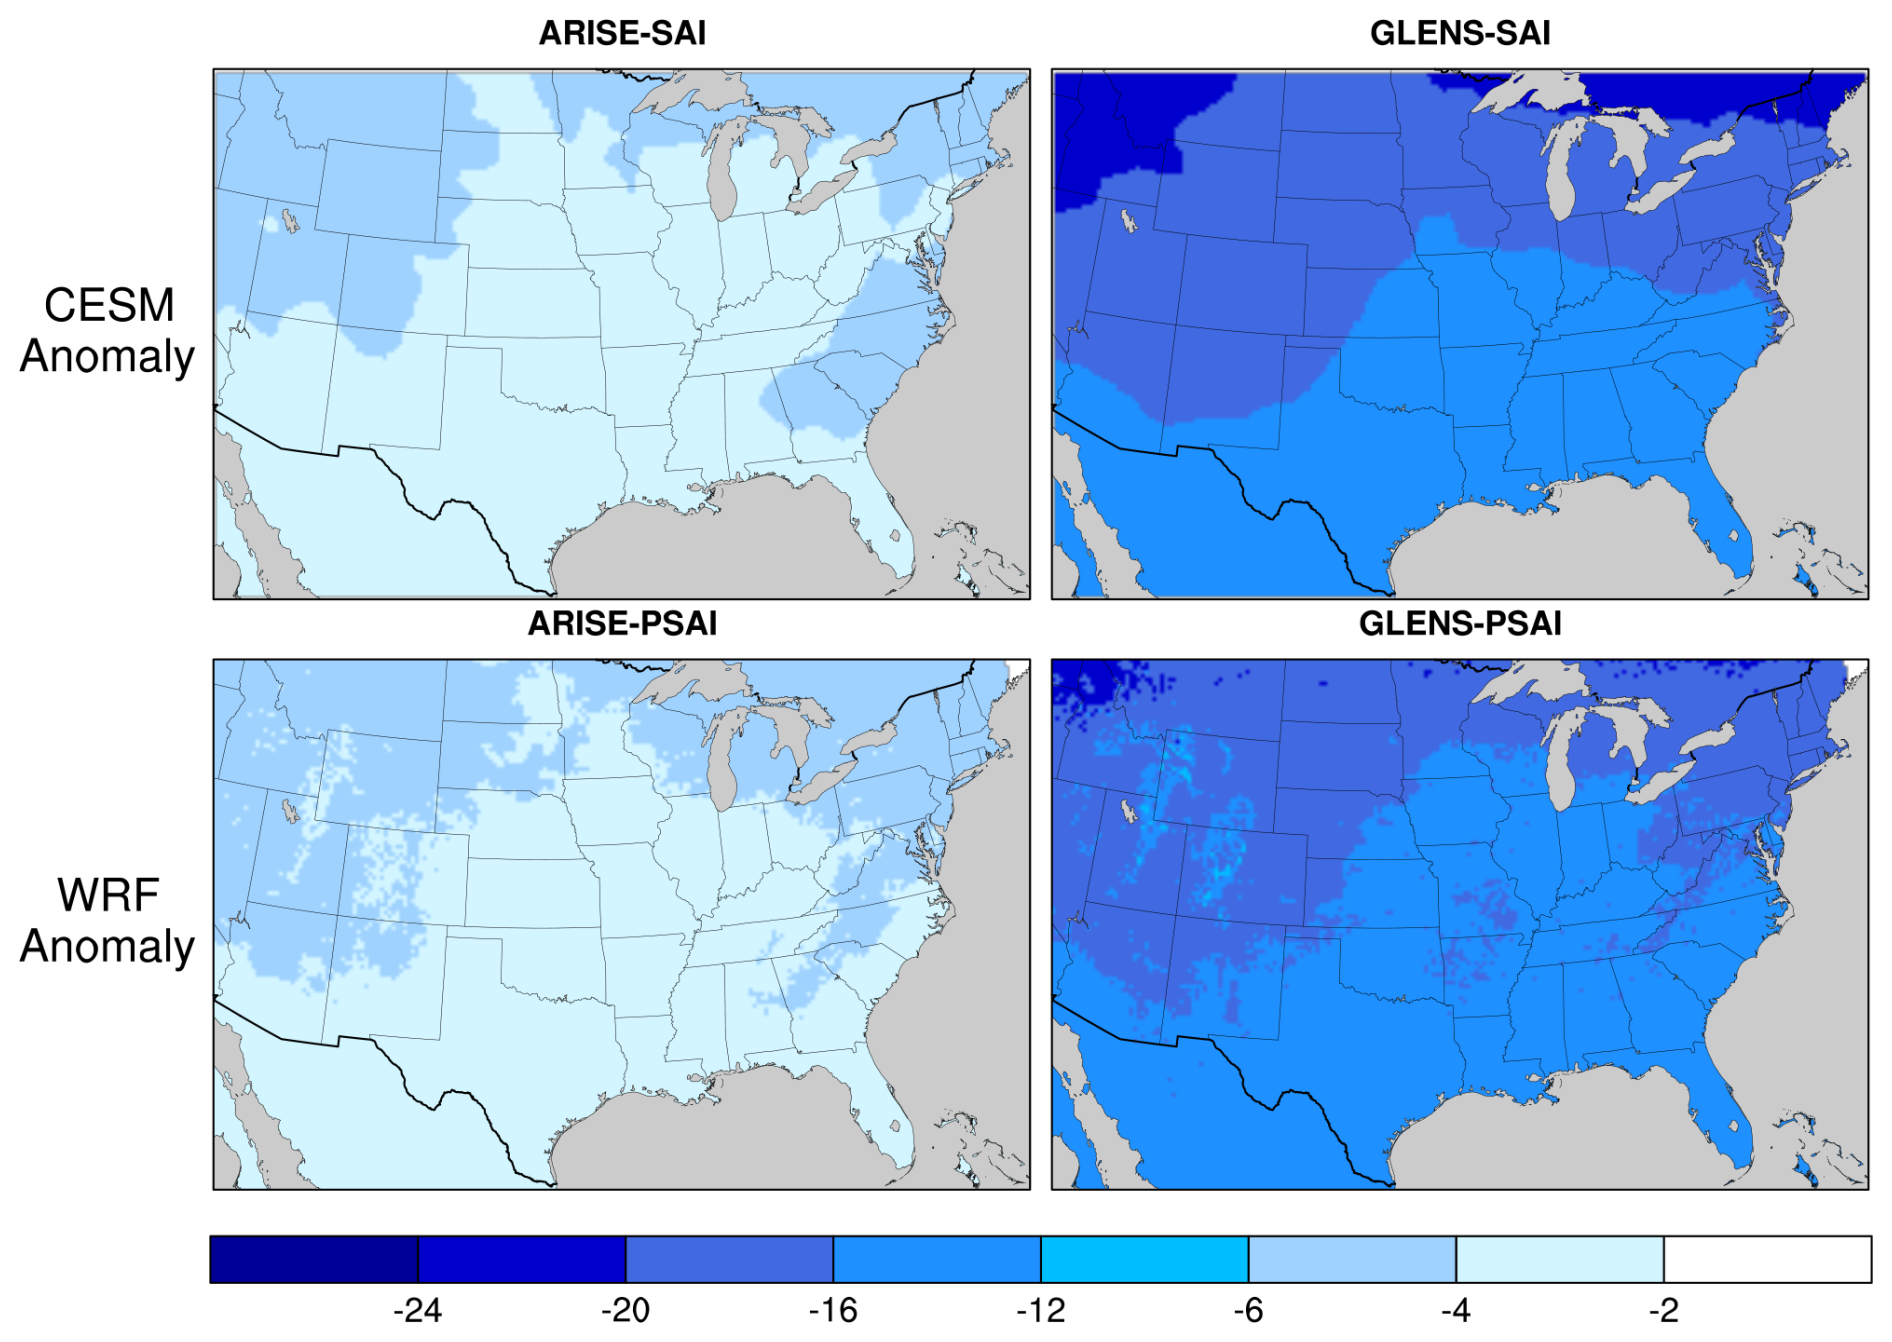
Figure 5(Top) Surface clear-sky downward shortwave radiation anomalies (W m−2) for 2060–2069 relative to the 2015–2024 baseline climatology in ARISE-SAI (left) and GLENS-SAI (right) simulations. (Bottom) Same as the top row, but for ARISE-PSAI and GLENS-PSAI simulations.
The PSAI simulation is driven by lateral and lower boundary forcing, local GHGs, and the radiative effect of stratospheric aerosols. To assess their relative contributions, we conduct one-month sensitivity tests by rerunning the PSAI simulation with either ΔAOD or ΔGHGs set to zero. The differences from the full PSAI simulation isolate the impacts of aerosol and GHG forcing, respectively. Results show that the aerosol forcing accounts for nearly all of the reduction in clear-sky surface downward shortwave radiation, while local GHGs and boundary conditions contribute minimally (not shown). These experiments, importantly, suggest that aerosols in the WRF simulations exert similar effects as in CESM, supporting the validity of our PSAI approach.
To assess how convective storms may evolve under future climate change and SCI scenarios, we apply the established PGW framework together with the new PSAI approach introduced in this study, enabling direct comparison between present-day and future storms. In this section, we present a few high-level analyses of temperature, precipitation, and convection, highlighting the feasibility and scientific potential of this approach for assessing the weather-scale impacts of SCI. More detailed analyses of these simulations are the topic of ongoing research. We begin by examining large-scale environmental changes across models and scenarios. CESM anomalies are calculated as the difference between the 2060–2069 average in future projections and the 2015–2024 baseline climatology. WRF anomalies represent the deviations of the PGW and PSAI simulations relative to their corresponding control baselines.
4.1 Temperature
Figure 6 shows the vertical profiles of March–August temperature anomalies averaged over the Eastern U.S. (30–42° N, 78–102° W). This period includes the record-breaking April 2011 tornado outbreak, which is the focus of our case study, and broadly represents the warm season when convective storms are most frequent in this region. In response to increased greenhouse gases, the tropospheric temperature rises while the stratospheric temperature decreases relative to the baseline climatology, consistent with the known vertical temperature response to anthropogenic climate change (e.g., Fig. 10.8 in IPCC AR5). The RCP8.5 scenario, with higher future concentrations of greenhouse gases, exhibits greater tropospheric warming and stratospheric cooling compared to SSP2–4.5. All these features in CESM are well reproduced in the PGW simulations for both scenarios (Fig. 6a).
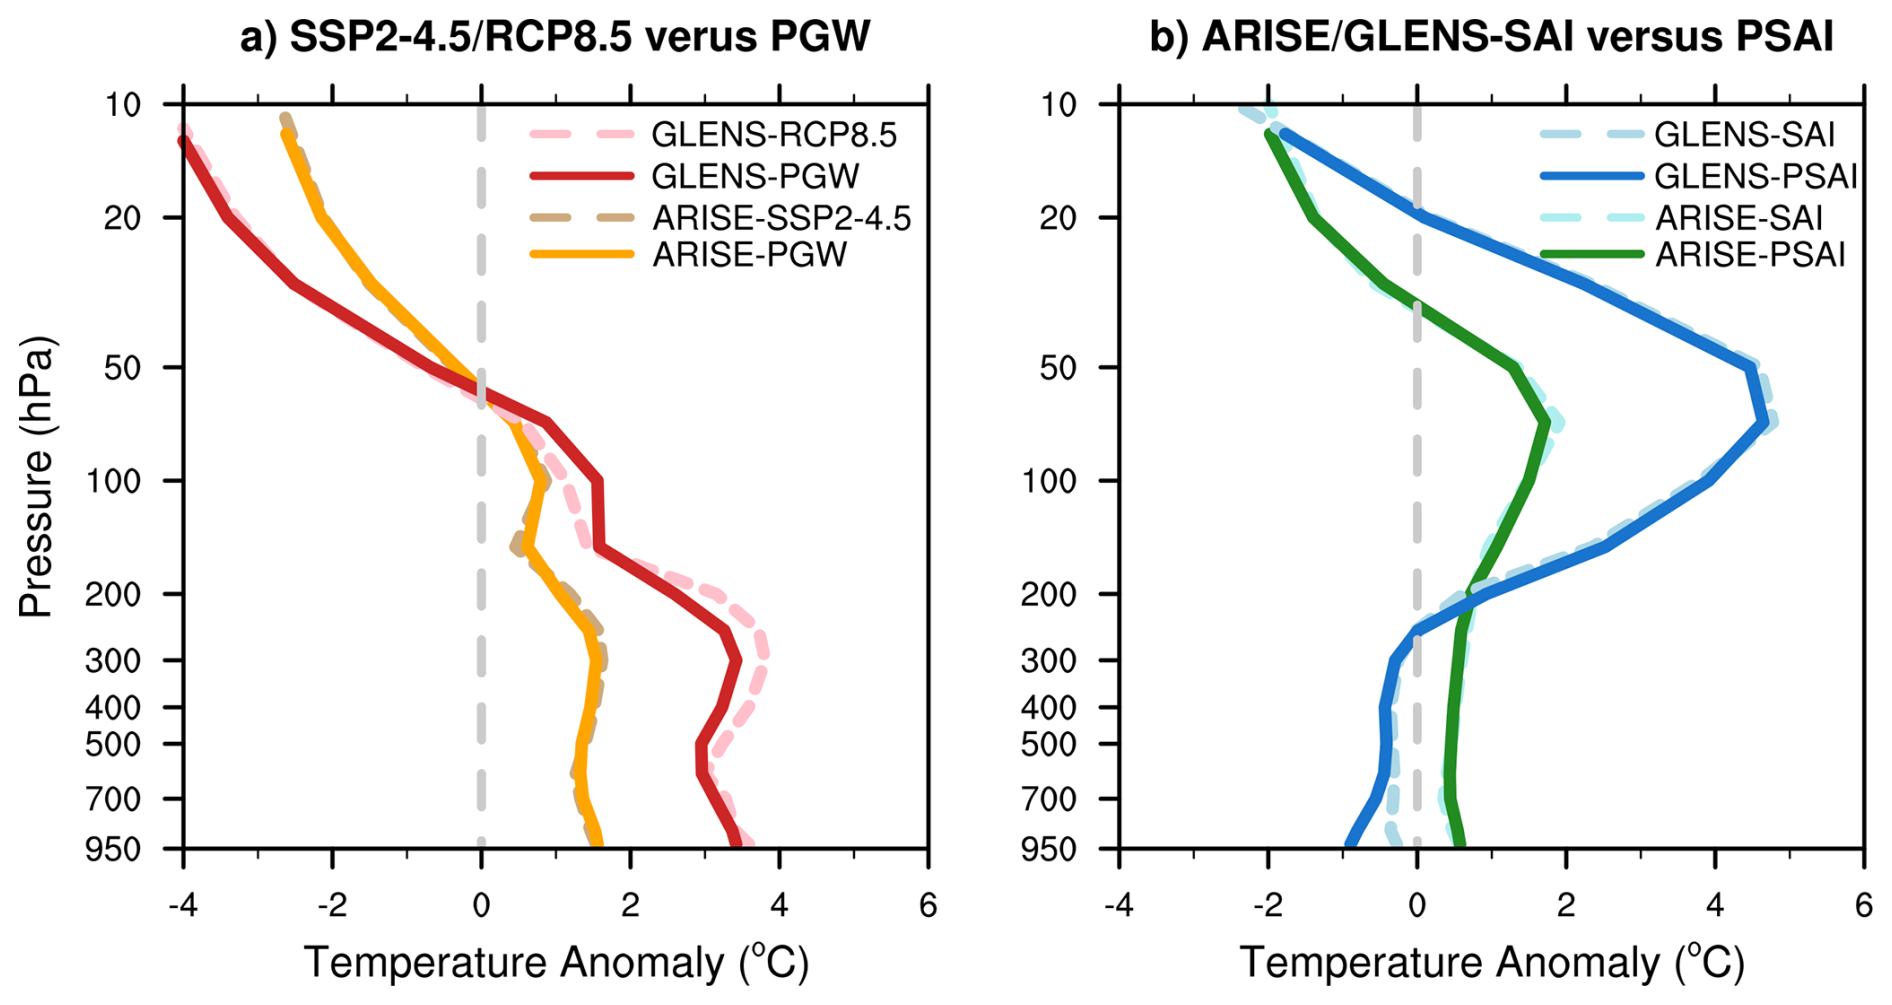
Figure 6(a) Eastern U.S. average temperature anomalies (°C) for 2060–2069 relative to the 2015–2024 baseline climatology from CESM1-WACCM RCP8.5 (dashed red) and CESM2-WACCM SSP2–4.5 (dashed orange) simulations, with the corresponding GLENS-PGW (solid red) and ARISE-PGW (solid orange) WRF simulations overlaid. (b) Same as (a), but for temperature anomalies in GLENS-SAI (dashed blue) and ARISE-SAI (dashed green) simulations, overlaid by the corresponding GLENS-PSAI (solid blue) and ARISE-PSAI (solid green) WRF simulations. The Eastern U.S. is defined by the latitude-longitude bounds 30–42° N and 78–102° W (red box in Fig. 2).
When SAI is deployed, stratospheric aerosols absorb both shortwave and longwave radiation and also reflect sunlight, resulting in significant warming in the lower stratosphere, with greater magnitudes in GLENS-SAI than ARISE-SAI (Fig. 6b), consistent with the aerosol forcing differences between the two scenarios (Fig. 4a). In the middle stratosphere, greenhouse gas-induced cooling persists. In the troposphere, aerosol-induced cooling counteracts greenhouse gas-induced warming, leading to much weaker warming in ARISE-SAI and even slight cooling in GLENS-SAI relative to the 2015–2024 baseline. The weak warming observed in ARISE-SAI can be attributed to the temperature target being 1.5 °C above pre-industrial levels, which is close to the projected 2030 values under SSP2–4.5 (Fig. 1). Interestingly, even though our approach accounts only for the shortwave radiative effect of stratospheric aerosols, the temperature anomalies in CESM-SAI are effectively reproduced by WRF-PSAI for both scenarios (Fig. 6b).
Figure 7 illustrates the spatial variability of surface air temperature anomalies for the CESM and WRF simulations. Without SAI, temperatures increase by approximately 1–1.5 ° C under SSP2–4.5 and exceed 3.5 °C under RCP8.5, with more pronounced warming at higher latitudes. The WRF-PGW simulation effectively captures this warming, further providing finer-scale details. When SAI is implemented, most of the warming is mitigated in ARISE-SAI, and GLENS-SAI even shows slight cooling. The WRF PSAI simulation also reproduces this trend, with GLENS-PSAI displaying greater cooling over the Central U.S. than GLENS-SAI, as also seen in the vertical profile (Fig. 6b, solid blue curve).
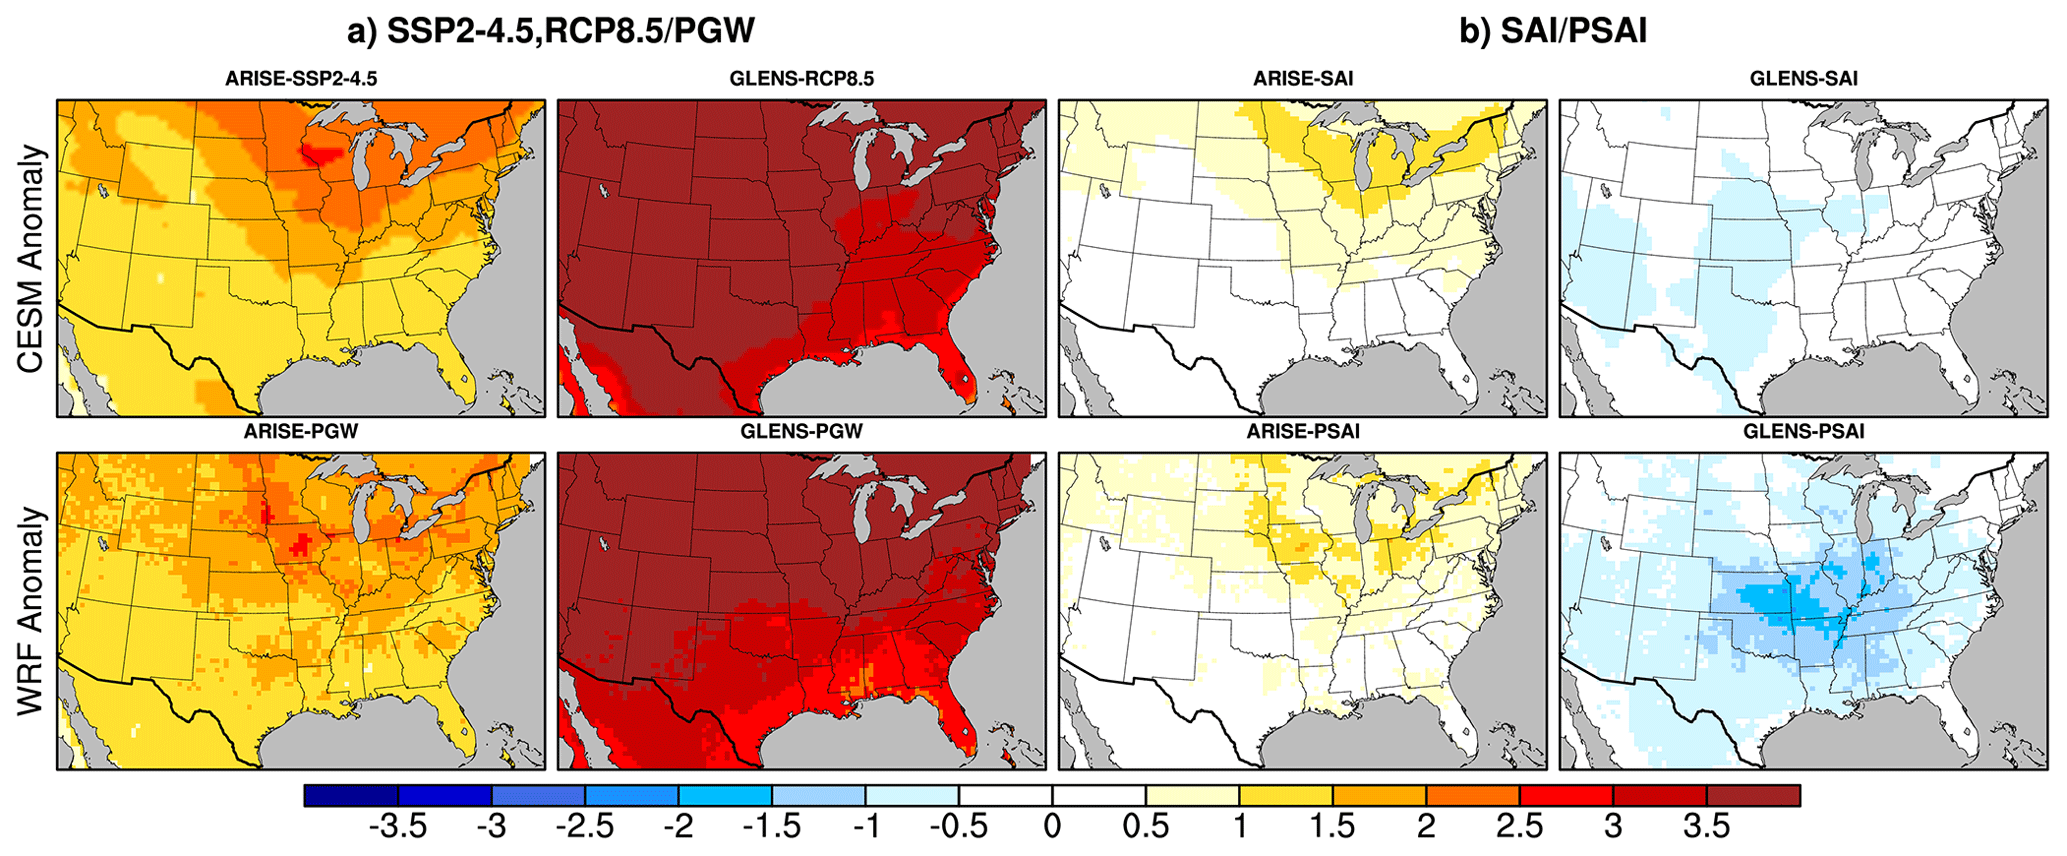
Figure 7(a) Surface air temperature anomalies (°C) for 2060–2069 relative to the 2015–2024 baseline climatology from (top) CESM2-WACCM SSP2–4.5 and CESM1-WACCM RCP8.5 simulations, and (bottom) the corresponding ARISE-PGW and GLENS-PGW WRF simulations. (b) Surface air temperature anomalies for 2060–2069 relative to the 2015–2024 baseline from (top) ARISE-SAI and GLENS-SAI simulations, and (bottom) the corresponding ARISE-PSAI and GLENS-PSAI WRF simulations.
It is important to note that CESM and WRF are two different models with distinct physical configurations. The similar temperature responses observed in both suggest that WRF can effectively reproduce CESM's climate response when provided with consistent boundary conditions and radiative forcings, supporting the validity of our experimental approach. Differences between the models may stem from their respective physical parameterizations and from the different ways in which SAI is implemented. In addition, it is unclear to what extent the model biases may influence the accuracy of the projected future changes and contribute to the differences between CESM and WRF. Further investigation is thus warranted to better understand the mechanisms behind these differences, including potential links to biases in the basic state (Fig. 3).
4.2 Precipitation
Figure S4 shows the spatial variability of mean precipitation anomalies in the CESM and WRF simulations. Without SAI, an increase in precipitation is evident over the eastern United States, particularly under the more extreme GLENS-RCP8.5 scenario. With SAI, this increase is reduced (for example, ARISE-SAI) or nearly eliminated (GLENS-SAI). The WRF simulations generally reproduce this behavior, although with finer-scale but noisier patterns and larger magnitudes. These localized areas of drying and wetting in the WRF results are closely connected to two factors. First, WRF and CESM are distinct models with different physics and resolutions; therefore, the same large-scale environmental changes do not necessarily produce identical precipitation responses. Second, the WRF simulations consist of a single realization, even though they are forced by the CESM ensemble mean. In contrast, the CESM results shown are ensemble means, which naturally yield smoother and more spatially coherent anomaly patterns. We also note that the region where GLENS-PSAI exhibits additional cooling (Fig. 7) coincides with an area of enhanced precipitation, suggesting a possible connection.
Converging evidence from previous PGW studies indicates that extreme precipitation across the U.S. will become more intense, and in many cases, more frequent in a warming future (e.g., Prein et al., 2017b; Gutmann et al., 2018; Cui et al., 2024). Figure 8 presents the probability density function (PDF) of hourly precipitation over the Eastern U.S. during March–August 2011 for the control, PGW, and PSAI simulations, highlighting substantial sensitivity to different scenarios. Notably, both PGW scenarios exhibit a higher likelihood of extreme precipitation events compared to the control, indicating an increase in extreme precipitation intensity under future climate conditions. This effect is more pronounced in GLENS-PGW (RCP8.5) than in ARISE-PGW (SSP2–4.5). With the implementation of SAI, the PDFs for extreme precipitation become much closer to the control, suggesting that the projected increase in extreme precipitation is mitigated, with an exception at the highest rainfall rates (Fig. 8). This result is consistent with previous studies based on global climate models (e.g., Curry et al., 2014; Simpson et al., 2019; Tye et al., 2022).
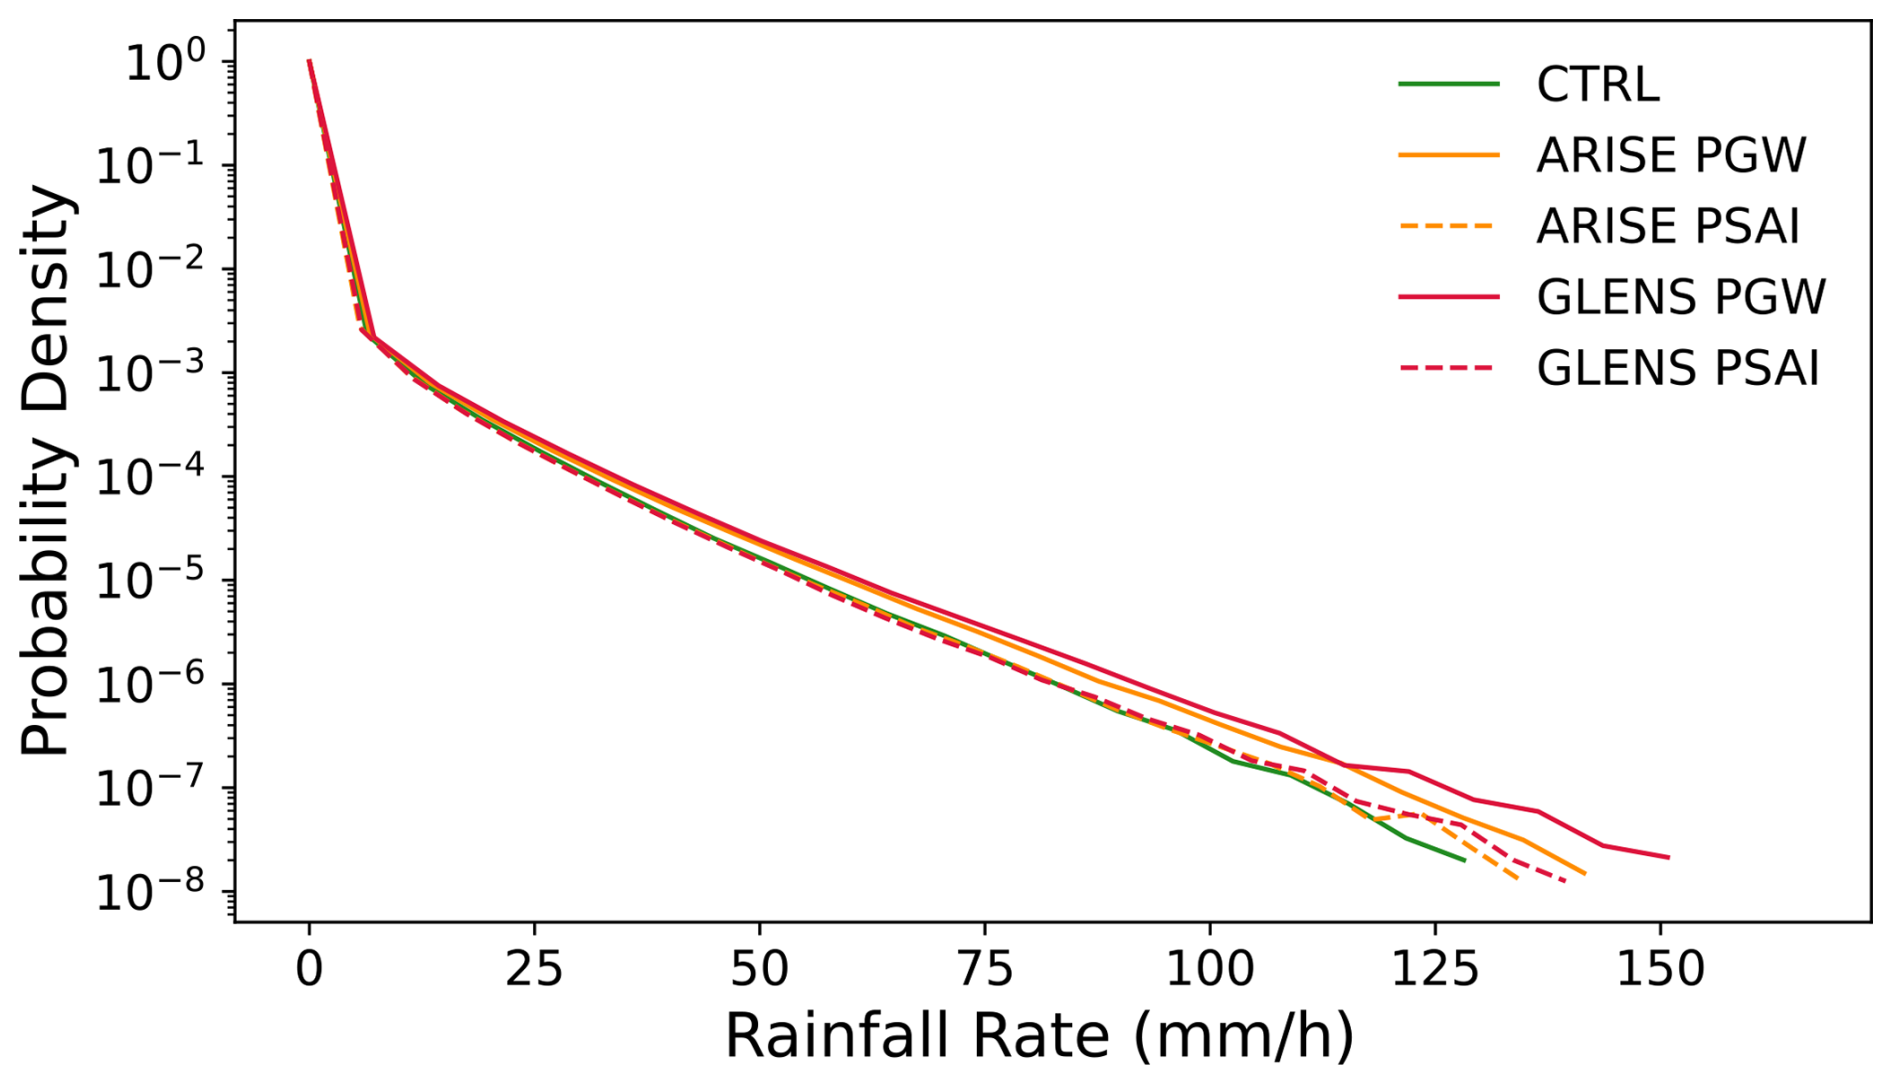
Figure 8Probability density function (PDF) of the Eastern U.S. precipitation spectrum over March–August 2011, in the control, PGW and PSAI simulations.
CESM2 provides hourly precipitation output which we analyze and compare with the WRF simulations (not shown). The 2060–2069 projection without SAI exhibits similarly enhanced extreme precipitation compared to the baseline (2015–2024), resembling ARISE-PGW. With SAI implementation, the PDF shifts closer to the baseline, similar to ARISE-SAI. However, CESM2's hourly precipitation remains about an order of magnitude lower, with a maximum below 20 mm h−1. This is consistent with previous findings that high-resolution models tend to produce stronger precipitation than low-resolution models (e.g., Rauscher et al., 2016; Herrington and Reed, 2020), highlighting WRF's capability in explicitly simulating fine-scale convective precipitation processes.
4.3 Echo-top height
Echo-top height is a commonly used metric to describe the vertical range of the precipitation reflectivities (Wilson and Megenhardt, 1997) and is often used as an indicator of both storm height and intensity. For example, storms with the strongest updrafts tend to produce higher echo tops and are associated with higher lightning flash rates compared to weaker storms (Deierling and Petersen, 2008). Here we investigate changes in convection under climate change and SAI by examining the percentage frequency echo-top heights exceeding 10 km, based on radar reflectivity values of at least 20 dBZ, across different climate scenarios (Fig. 9). From March to August, this frequency generally ranges between 0.5 % and 3.5 %, with higher values over the central U.S., particularly over the Midwest and Southeast (green shades), indicating frequent deep convection (Houze et al., 2015). Climate change leads to increases in the frequency of deep convection across most of the eastern U.S., with a very similar pattern between GLENS-PGW and ARISE-PGW (top right panel). In contrast, this increase is largely reduced or transitions to a decrease in the PSAI simulations. This pattern is evident when comparing ARISE-PGW (SSP2–4.5) with ARISE-PSAI and even more pronounced between GLENS-PGW and GLENS-PSAI. Together, these results suggest that climate warming enhances deep convection consistent with prior studies (Trapp et al., 2007; Rasmussen et al., 2017), while SAI may suppress it, implying a potential mitigating effect on convective intensity. It is important to note that changes in echo-top height do not necessarily correspond directly to precipitation changes (Fig. S4). This distinction underscores the complexity of convective storm responses and highlights the need for further investigation into the mesoscale processes governing severe convection under PGW and PSAI scenarios.
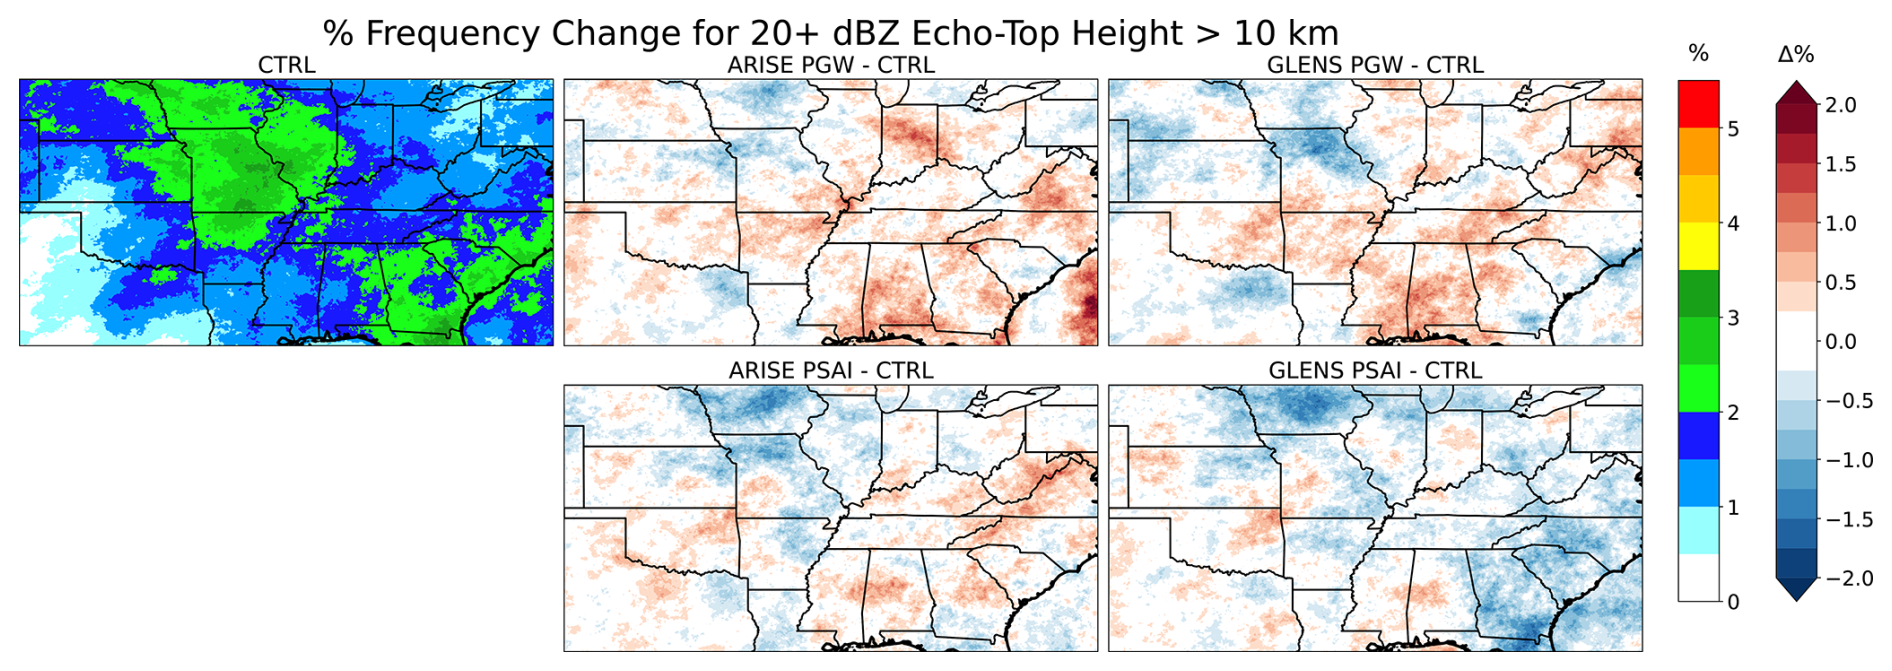
Figure 9Percentage frequency for 20+ dBZ Echo-Top height larger than 10 km for (left) Control and (top middle and right) PGW and (bottom) PSAI anomalies. The frequency is calculated based on hourly data for March–August 2011.
Figure 10 further presents the probability density function of 20+ dBZ echo-top height frequencies over the eastern U.S. Between 1–12 km, the frequency remains nearly constant. Beyond 12–13 km, the probability declines sharply, resembling an exponential drop-off. Both PGW scenarios exhibit slightly higher probabilities of echo tops exceeding 12 km, indicating an increase in deep convection under climate warming. In contrast, PSAI simulations show a reduction in high echo tops compared to both the control and PGW scenarios, suggesting that SAI may suppress extreme convection. There is more reduction in GLENS-PSAI than in ARISE-PSAI because the temperature target is lower in GLENS-SAI (year 2020) than in ARISE-SAI (1.5 °C above pre-industrial level, around 2035). A similar analysis using 40+ dBZ echo-top heights reveals comparable changes (not shown).
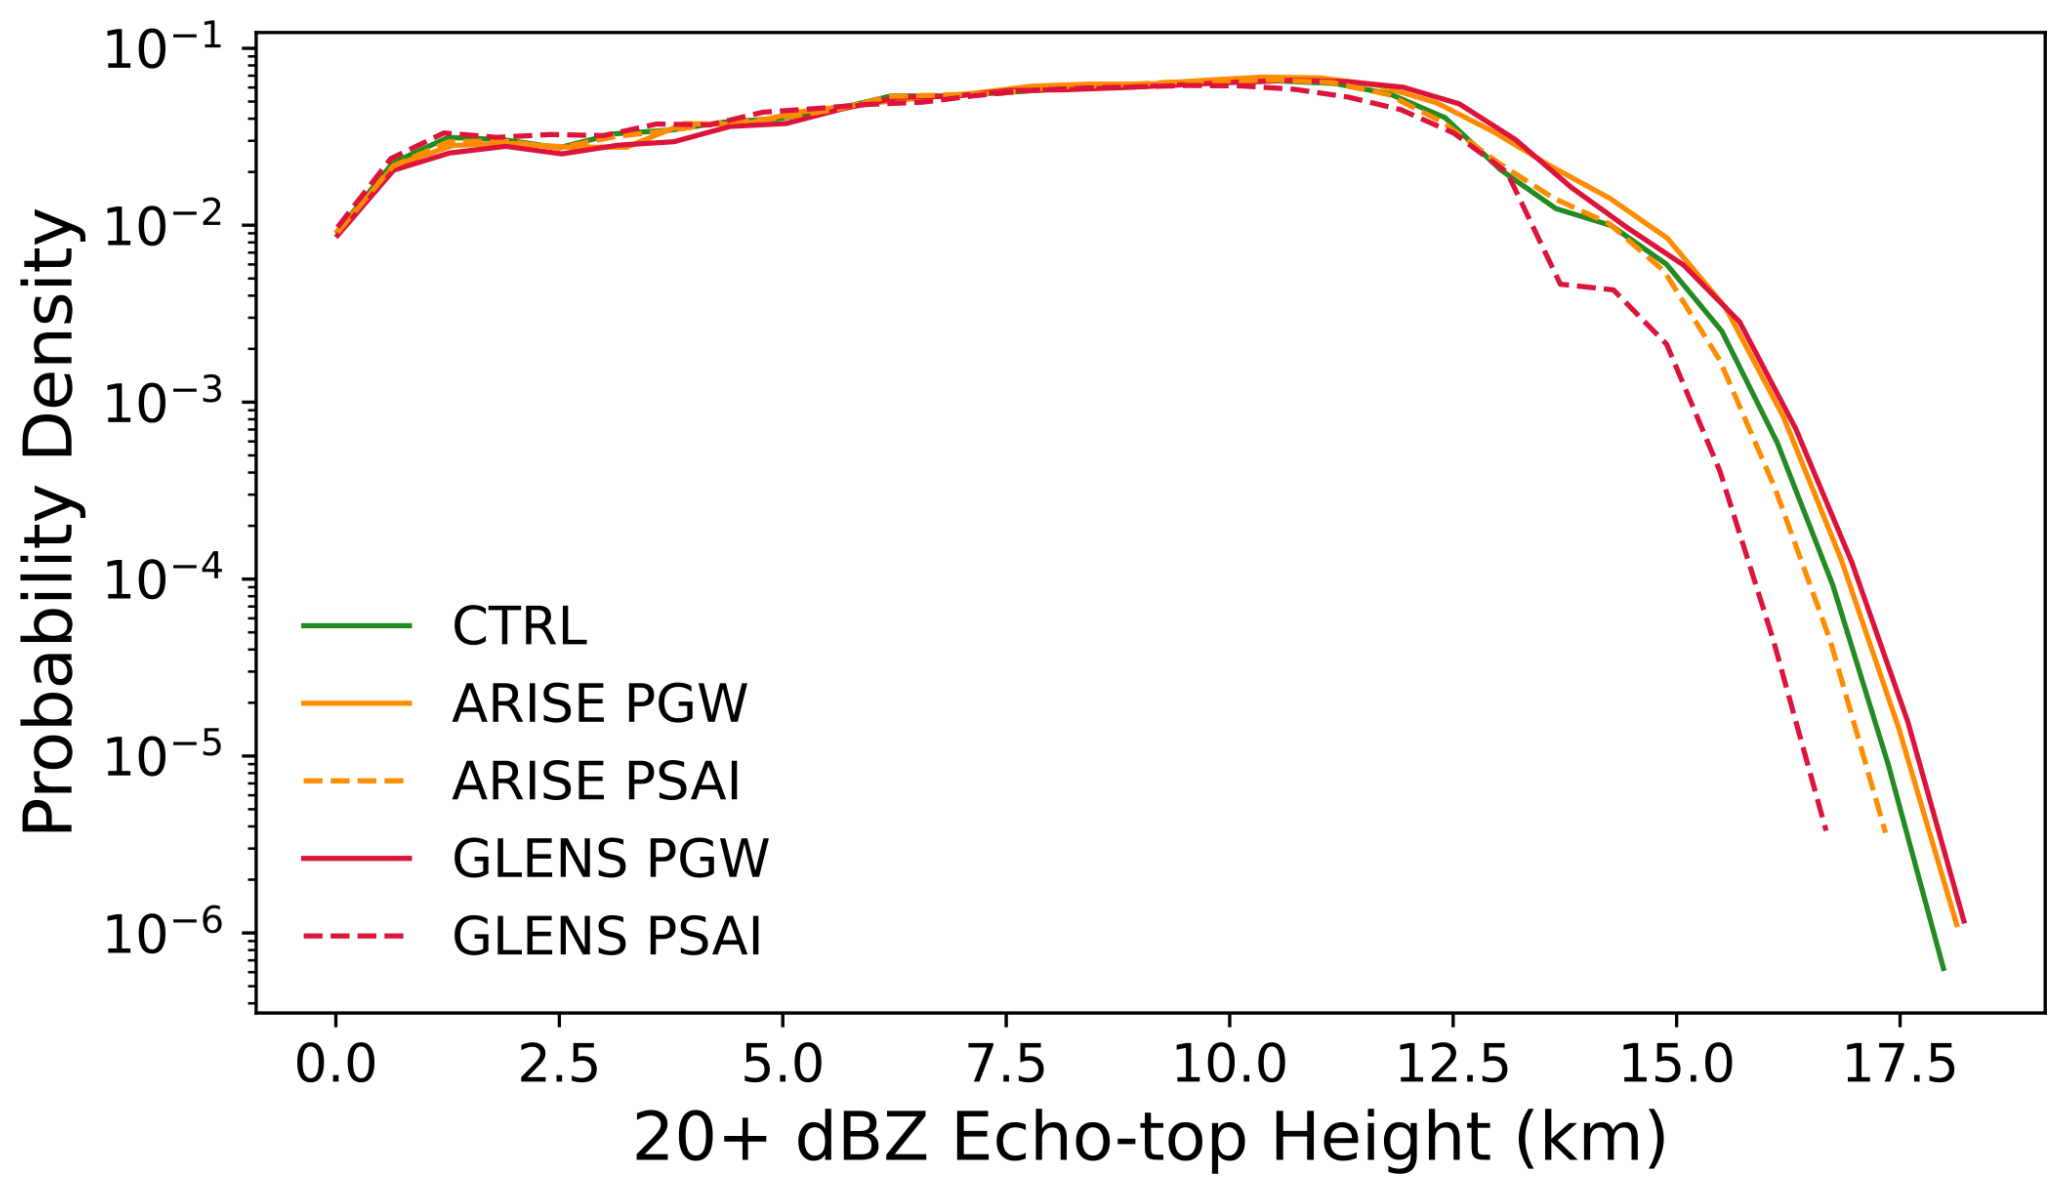
Figure 10Probability density function (PDF) of the fractional occurrence for 20+ dBZ Echo-Top height larger than 10 km over the Eastern U.S. over March–August 2011, in the control, PGW and PSAI simulations.
4.4 Convective population
Rasmussen et al. (2017) examined the convective population change under climate change using 13-year PGW simulations and found that the lower reflectivity ranges occur less frequently, while higher reflectivity ranges are more common in both the CONUS domain and the U.S. Great Plains. Here we do a similar analysis and focus on boreal spring (March, April, May) when severe convective storms occur mostly frequently. In particular, hourly composite reflectivity data from each simulation set is used to calculate the frequency of occurrence in six reflectivity ranges defined as weak convection (0–10, 10–20 dBZ), moderate convection (20–30, 30–40 dBZ), and strong convection (40–50, 50+ dBZ). The change in frequency of occurrence for each reflectivity range can be calculated using the following formulas:
Here, RR denotes the radar reflectivity range calculated from each of the WRF simulations.
Figure 11 shows the changes in occurrence of each reflectivity range in the full domain (Fig. 11a) and in the eastern U.S. (Fig. 11b). For both regions GLENS-PGW (solid blue) shows less frequent convection for 20 dBZ and more frequent convection for 40+ dBZ. A similar change is also observed for ARISE-PGW (solid brown) over the eastern U.S., in agreement with previous findings. ARISE-PSAI (dashed orange) generally exhibits a similar change to ARISE-PGW, but with smaller magnitude. In contrast, the changes in GLENS-PSAI (dashed light blue) and GLENS-PGW are very different. For example, over the eastern U.S., GLENS-PSAI exhibits an increase in the frequency of convection for 20 dBZ and a decrease for 40+ dBZ, opposite to that in its corresponding GLENS-PGW. When considering the entire CONUS, GLENS-PSAI is very close to the baseline, only showing slightly less frequent occurrences for 40+ dBZ. The convective population changes in PGW and PSAI simulations closely follow the changes in thermodynamic environments. In particular, Rasmussen et al. (2017) found that climate change leads to larger values of both CAPE and CIN, a feature also observed in Chen et al. (2020) and Franke et al. (2024). This suggests that the future atmosphere under climate change may support more vigorous convective storms but also requires more energy to initiate given increases in lower-level static stability. As a result, the convective population exhibits fewer weak to moderate storms and more storms that are intense.
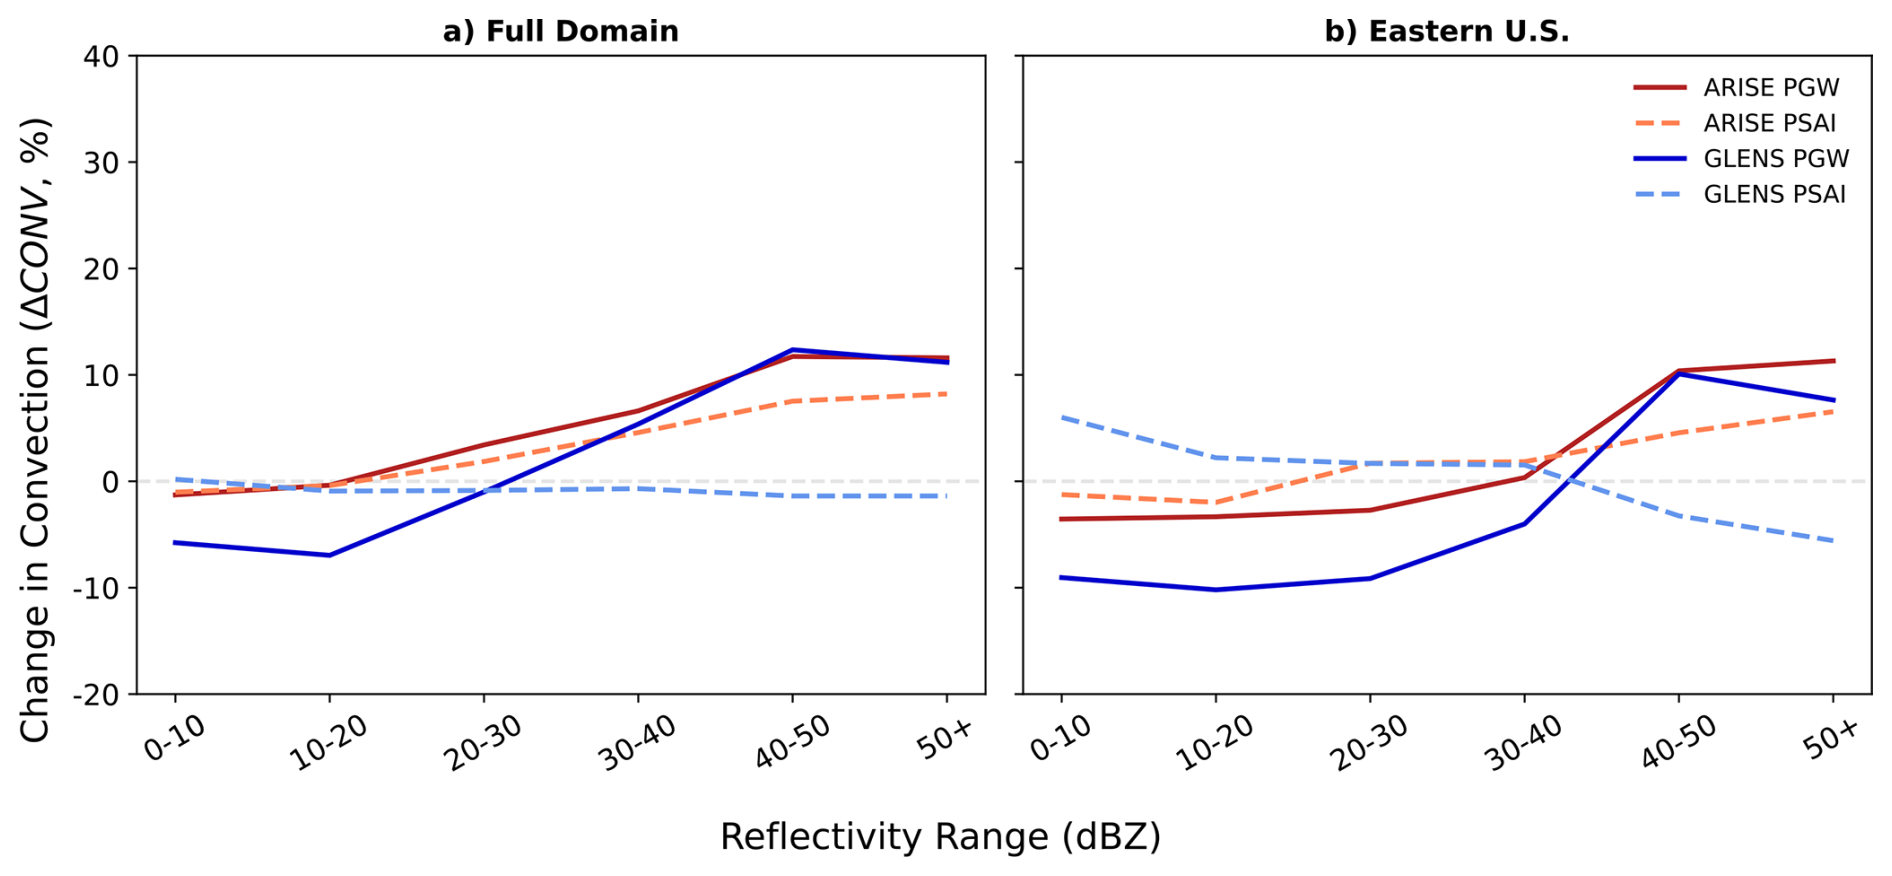
Figure 11March-April-May changes in the occurrence of each reflectivity range over the full domain (left) and the Eastern U.S. (right). The total number of occurrences within each reflectivity bin is summed over each domain, and ΔCONV is computed following Eqs. (1) and (2). This metric represents the percentage change in convective population in the PGW and PSAI simulations relative to the control simulation, shown as a function of radar reflectivity range (dBZ).
As a potential climate mitigation method, SAI may be employed to counteract some of the effects of global warming. Glade et al. (2023) suggested that SAI not only reduces the GHG-induced warming but also effectively minimizes future changes in thermodynamic environmental parameters, such as CAPE and CIN, that are relevant to convection. Recall that the temperature target of ARISE-PSAI is 1.5 °C and thus there is still a global warming effect relative to the 2015–2024 baseline. As a result, the distribution of CAPE and CIN in ARISE-PSAI still resembles ARISE-PGW but with smaller magnitude, which leads to similar but smaller changes in convective populations. In contrast, GLENS-PSAI exhibits slightly cooling relative to the baseline, opposite to the warming evident in GLENS-PGW (Figs. 6 and 7). Consequently, changes in the population of convection in GLENS-PSAI are opposite to those in GLENS-PGW.
5.1 Summary
Climate intervention has been proposed as a possible method to help counteract some of the future consequences of anthropogenic climate change. As one primary solar climate intervention strategy, many studies of SAI have focused on its benefits and risks relative to the risks posed by climate change. These studies, however, have almost exclusively used climate models, and no studies to date have examined how SAI may influence convective weather and mesoscale processes. The goal of this work is to begin to bridge this gap by developing a novel modeling framework using a regional convection-permitting model to investigate the possible impacts of SAI on severe weather in the U.S. We conduct PSAI and PGW simulations to mimic future climate change with and without SAI deployment, and we show some early analyses of temperature, precipitation and convection over the U.S. Our primary purpose is to introduce and demonstrate the methodology for evaluating convective storms under the PGW and PSAI frameworks rather than to analyze individual storm events. For this reason, the March–August 2011 period is used to provide a statistical representation of environmental and storm-related changes without cataloging each severe convective event that occurred over this period. The main results are summarized as follows:
-
Building on previous PGW approaches, this paper develops a novel PSAI method using WRF. Global climate model SAI simulations with CESM are used to generate delta terms, which are then applied to the lower and lateral boundary conditions for WRF. Stratospheric AOD changes in the global model are further applied to WRF to ensure that the radiative effects of SAI are well captured. Six-month simulations for the warm season (March–August) of 2011 were then conducted.
-
The PSAI and PGW simulations capture the large-scale environmental changes evident in the CESM SAI and climate change simulations. In particular, the temperature anomalies in the PSAI and PGW runs well match those in the corresponding CESM simulations, confirming the viability of our methodology. Further, these results suggest that once the boundary forcings are prescribed and radiative forcings are properly configured, the WRF model can be used to study the impact of SAI on convective weather.
-
Our PSAI and PGW simulations reveal that future spring and summer extreme precipitation over the CONUS is likely to increase under climate change, as indicated in earlier studies, but that such increases could be largely avoided if SAI was deployed. This is also broadly consistent with the coarser-grid precipitation changes evident in the CESM simulations (e.g., Tilmes et al., 2019; Richter et al., 2022).
-
Climate change leads to increases in the frequency of deep convection over much of the eastern U.S., which may be largely mitigated by SAI deployment. Moreover, composite analysis of the convective population reveals a decreasing frequency of weak echoes (0–20 dBZ) and an increasing frequency of intense reflectivities (above 40 dBZ) in the future. This shift in convective characteristics may again be reduced or even fully offset under SAI deployment.
5.2 Discussion
Our PSAI and PGW approaches differ from direct dynamical downscaling of global climate models, which often carry inherent biases that are passed down to regional simulations. In contrast, our control simulation is driven by ERA5 reanalysis and thus more closely reflects observed climate conditions, despite its own limitations. Direct downscaling also inherits substantial internal variability from global models, complicating the separation of the forced response unless multiple ensemble members are conducted. This requirement makes it more computationally expensive than PGW-based methods. However, PGW cannot simulate synoptic-scale variability and may underperform in regions where dynamical eddy processes are important (Hall et al., 2024). Since the PSAI method is developed based on the PGW framework, it inherits both its advantages and limitations. Further studies are needed to evaluate PSAI in comparison with direct downscaling of SAI to evaluate their respective strengths.
One caveat of our PSAI approach is that it accounts only for the direct shortwave radiative effects of stratospheric aerosols, without representing their longwave influence. Nevertheless, the model well captures the lower stratospheric heating seen in global climate models (Fig. 6b), suggesting that shortwave perturbations are essential, whereas the omission of longwave effects may be less critical. Our approach excludes near-surface aerosol anomalies because it is unclear whether these signals arise from stratospheric aerosol descent or other processes, and they are therefore not included in the WRF-PSAI forcing. However, further investigation is warranted to assess the potential role of aerosol-radiation and cloud interactions in the troposphere, especially under conditions of stratosphere-troposphere exchange. Further, the WRF bias in environmental conditions may introduce uncertainty in the simulated storm activity and in the projected future changes with and without SAI.
Lastly, we emphasize that the primary goal of this paper is to introduce a methodology for assessing the impact of climate intervention on convective weather using regional models. In this study, the extension of the PGW framework to the SAI scenario is achieved by incorporating the CESM-derived aerosol optical depth forcing into the WRF simulations. The convection-permitting WRF model is particularly well-suited to capturing fine-scale mesoscale processes and physical mechanisms that drive changes in clouds and precipitation systems as it is also used for operational numerical weather prediction (e.g., high-resolution rapid refresh (HRRR) model). Our framework builds on this capability to utilize global climate model output to study future changes in weather under scenarios with and without SAI. More in-depth scientific results will follow. For example, we find that the changes in the occurrence of each reflectivity range exhibit clear seasonal variability (Fig. S5). It will therefore be interesting to further investigate the seasonality of the results as well as the underlying mechanisms. In addition, we are conducting a parallel study focused on the influence of SAI on the super tornado outbreak of 25–28 April 2011 (Summers et al., 2026), including additional ensembles forced by individual global climate model members of future projections to explore the role of internal climate variability. Further PGW and PSAI simulations are underway to extend the analysis over a longer period of record. We hope this framework provides a foundation for future investigations into the regional impacts of climate intervention on high-impact weather events.
WRF version 4.1.5 that was used to carry out the simulations is archived on Zenodo at https://doi.org/10.5281/zenodo.16374211 (Sun et al., 2025a) under the UCAR Open Source License, which is equivalent to the BSD 3-Clause License.
The CESM1-WACCM-RCP8.5, CESM2-WACCM-SSP4.5, and their corresponding GLENS-SAI and ARISE-SAI datasets used in this study are available on Zenodo at https://doi.org/10.5281/zenodo.16374758 (Sun et al., 2025b). Representative WRF output files used in the analysis are archived on Zenodo at https://doi.org/10.5281/zenodo.16376739 (Sun et al., 2025c). The WRF AOD forcing files are also archived on Zenodo at https://doi.org/10.5281/zenodo.16062478 (Sun et al., 2025d).
The supplement related to this article is available online at https://doi.org/10.5194/gmd-19-2239-2026-supplement.
LS, JWH, and KLR designed the experimental setup. LS and KLR led the model development and conducted the simulations. LS, BS and EAS performed the analysis and prepared the figures. LS wrote the manuscript. All authors contributed to in-depth discussions of data analysis and interpretation, and provided editorial feedback.
The contact author has declared that none of the authors has any competing interests.
Publisher's note: Copernicus Publications remains neutral with regard to jurisdictional claims made in the text, published maps, institutional affiliations, or any other geographical representation in this paper. The authors bear the ultimate responsibility for providing appropriate place names. Views expressed in the text are those of the authors and do not necessarily reflect the views of the publisher.
We appreciate the thoughtful comments and suggestions from Long Cao, Chaochao Gao and one anonymous reviewer. This research was supported by the NOAA Earth Radiation Budget (ERB) program (grant no. NA24OARX431C0055-T1-01). JWH also acknowledges support from the LAD Climate Fund and Walter Scott, Jr. College of Engineering at Colorado State University. KLR acknowledges support from the NSF (grant no. 2312317). BK acknowledges support from the NOAA ERB program title “Dynamical Downscaling to Quantify Extreme Events Under Stratospheric Sulfate Aerosol Injection”. We thank Amazon Web Services (AWS) for providing computational resources, with special thanks to Joelle Rossback-Dahl and Joel Morgan (AWS), as well as the team from SilverLining for facilitating this support. We also appreciate the technical assistance from Jimy Dudhia, Chang-hai Liu, and Kyoko Ikeda (NCAR) during the WRF model setup.
This research has been supported by the National Oceanic and Atmospheric Administration, Climate Program Office (grant no. NA24OARX431C0055-T1-01) and the National Science Foundation Directorate for Geosciences, Division of Atmospheric and Geospace Sciences (grant no. 2312317).
This paper was edited by Juan Antonio Añel and reviewed by two anonymous referees.
Banerjee, A., Butler, A. H., Polvani, L. M., Robock, A., Simpson, I. R., and Sun, L.: Robust winter warming over Eurasia under stratospheric sulfate geoengineering – the role of stratospheric dynamics, Atmos. Chem. Phys., 21, 6985–6997, https://doi.org/10.5194/acp-21-6985-2021, 2021.
Barlage, M., Chen, F., Rasmussen, R., Zhang, Z., and Miguez-Macho, G.: The importance of scale-dependent groundwater processes in land-atmosphere interactions over the central United States. Geophys. Res. Lett., 48, e2020GL092171, https://doi.org/10.1029/2020GL092171, 2021.
Brogli, R., Heim, C., Mensch, J., Sørland, S. L., and Schär, C.: The pseudo-global-warming (PGW) approach: methodology, software package PGW4ERA5 v1.1, validation, and sensitivity analyses, Geosci. Model Dev., 16, 907–926, https://doi.org/10.5194/gmd-16-907-2023, 2023.
Budyko, M. I.: On present-day climatic changes, Tellus, 29, 193–204, https://doi.org/10.3402/tellusa.v29i3.11347, 1977.
Chen, J., Dai, A., Zhang, Y., and Rasmussen, K. L.: Changes in Convective Available Potential Energy and Convective Inhibition under Global Warming, J. Climate, 33, https://doi.org/10.1175/JCLI-D-19-0461.1, 2020.
Cheng, W., MacMartin, D. G., Dagon, K., Kravitz, B., Tilmes, S., Richter, J. H., Mills, M. J., and Simpson, I. R.: Soil moisture and other hydrological changes in a stratospheric aerosol geoengineering large ensemble, J. Geophys. Res.-Atmos., 124, https://doi.org/10.1029/2018JD030237, 2019.
Cui, W., Galarneau, T., and Hoogewind, K.: Changes in mesoscale convective system precipitation structures in response to a warming climate, J. Geophys. Res.-Atmos., 128, e2023JD039920, https://doi.org/10.1029/2023JD039920, 2024.
Curry, C. L., Sillmann, J., Bronaugh, D., Alterskjær, K., Cole, J. N. S., Ji, D., Kravitz, B., Link, R. P., Moore, J. C., Muri, H., Niemeier, U., Robock, A., Tilmes, S., and Yang, S.: A multimodel examination of climate extremes in an idealized geoengineering experiment, J. Geophys. Res.-Atmos., 119, 3900–3923, https://doi.org/10.1002/2013JD020648, 2014.
Da-Allada, C. Y., Baloïtcha, E., Alamou, E. A., Awo, F. M., Bonou, F., Pomalegni, Y., Biao, E. I., Obada, E., Zandagba, J. E., Tilmes, S., and Irvine, P. J.: Changes in West African summer monsoon precipitation under stratospheric aerosol geoengineering, Earth's Future, 8, e2020EF001595, https://doi.org/10.1029/2020EF001595, 2020.
Daly, C., Taylor, G. H., and Gibson, W. P.: The PRISM approach to mapping precipitation and temperature, Proceedings of the 10th Conference on Applied Climatology, Reno, NV, American Meteorological Society, 20–23, https://prism.oregonstate.edu/pubs/link/1997_daly-etal_conf-appl-climat.pdf (last access: 26 February 2026), 1997.
Danabasoglu, G., Lamarque, J.-F., Bacmeister, J., Bailey, D. A., DuVivier, A. K., Edwards, J., Emmons, L. K., Fasullo, J., Garcia, R., Gettelman, A., Hannay, C., Holland, M. M., Large, W. G., Lauritzen, P. H., Lawrence, D. M., Lenaerts, J. T. M., Lindsay, K., Lipscomb, W. H., Mills, M. J., Neale, R., Oleson, K. W., Otto-Bliesner, B., Phillips, A. S., Sacks, W., Tilmes, S., van Kampenhout, L., Vertenstein, M., Bertini, A., Dennis, J., Deser, C., Fischer, C., Fox-Kemper, B., Kay, J. E., Kinni- son, D., Kushner, P. J., Larson, V. E., Long, M. C., Mickel- son, S., Moore, J. K., Nienhouse, E., Polvani, L., Rasch, P. J., and Strand, W. G.: The Community Earth System Model Version 2 (CESM2), J. Adv. Model. Earth Sy., 12, e2019MS001916, https://doi.org/10.1029/2019MS001916, 2020.
Deierling, W. and Petersen, W. A.: Total lightning activity as an indicator of updraft characteristics, J. Geophys. Res., 113, D16210, https://doi.org/10.1029/2007JD009598, 2008.
Diffenbaugh, N. S., Scherer, M., and Trapp, R. J.: Robust increases in severe thunderstorm environments in response to greenhouse forcing, Proceedings of the National Academy of Sciences, 110, 16361–16366, https://doi.org/10.1073/pnas.1307758110, 2013.
Dominguez, F., Rasmussen, R., Liu, C., Ikeda, K., Prein, A., Varble, A., Arias, P. A., Bacmeister, J., Bettolli, M. L., Callaghan, P., Carvalho, L. M. V., Castro, C. L., Chen, F., Chug, D., Chun, K. P., Dai, A., Danaila, L., da Rocha, R. P., de Lima Nascimento, E., Dougherty, E., Dudhia, J., Eidhammer, T., Feng, Z., Fita, L., Fu, R., Giles, J., Gilmour, H., Halladay, K., Huang, Y., Iza Wong, A. M., Lagos-Zúñiga, M. Á., Jones, C., Llamocca, J., Llopart, M., Martinez, J. A., Martinez, J. C., Minder, J. R., Morrison, M., Moon, Z. L., Mu, Y., Neale, R. B., Núñez Ocasio, K. M., Pal, S., Potter, E., Poveda, G., Puhales, F., Rasmussen, K. L., Rehbein, A., Rios-Berrios, R., Risanto, C. B., Rosales, A., Scaff, L., Seimon, A., Somos-Valenzuela, M., Tian, Y., Van Oevelen, P., Veloso-Aguila, D., Xue, L., and Schneider, T.: Advancing South American water and climate science through multidecadal convection-permitting modeling, B. Am. Meteorol. Soc., 105, E32–E44, https://doi.org/10.1175/BAMS-D-22-0226.1, 2024.
Dougherty, E. and Rasmussen, K. L.: Changes in flash flood-producing storms in the U.S., Journal of Hydrometeorology, 21, 2221–2236, https://doi.org/10.1175/JHM-D-20-0014.1, 2020.
Dougherty, E. and Rasmussen, K. L.: Variations in flash flood-producing storm characteristics associated with changes in vertical velocity in a future climate in the Mississippi River Basin, Journal of Hydrometeorology, 22, 671–687, 2021.
Dougherty, E., Sherman, E., and Rasmussen, K. L.: Future changes in the hydrologic cycle associated with flood-producing storms in California, Journal of Hydrometeorology, 21, 2607–2621, 2020.
Fasullo, J. T., Tilmes, S., Richter, J. H., Kravitz, B., MacMartin, D. G., Mills, M. J., and Simpson, I. R.: Persistent polar ocean warming in a strategically geoengineered climate, Nature Geoscience, https://doi.org/10.1038/s41561-018-0249-7, 2018.
Franke, M. J., Hurrell, J. W., Rasmussen, K. L., and Sun, L.: Impact of forced and internal climate variability on changes in convective environments over the eastern United States, Front. Clim., 6, 1385527, https://doi.org/10.3389/fclim.2024.1385527, 2024.
Gensini, V. A. and Mote, T. L.: Estimations of hazardous convective weather in the United States using dynamical downscaling, Journal of Climate, 27, 6581–6598, 2014.
Gettelman, A., Mills, M. J., Kinnison, D. E., Garcia, R. R., Smith, A. K., Marsh, D. R., Times, S., Vitt F., Bardeen, C. G., McInerny, J., Liu, H.-L., Solomon, S. C., Polvani, L. M., Emmons, L. K., Lamarque, J.-F., Richter, J. H., Glanville, A. S., Bacmeister, J. T., Philips, A. S., Neale, R. B., Simp- son, I. R., DuVivier, A. K., Hodzic, A., and Randel, W. J.: The whole atmosphere community climate model version 6 (WACCM6), J. Geophys. Res.-Atmos., 124, 12380–12403, https://doi.org/10.1029/2019JD030943, 2019.
Glade, I., Hurrell, J. W., Sun, L., and Rasmussen, K. L.: Assessing the impact of stratospheric aerosol injection on US convective weather environments, Earth's Future, 11, e2023EF004041, https://doi.org/10.1029/2023EF004041, 2023.
Gutmann, E. D., Rasmussen, R. M., Liu, C., Ikeda, K., Bruyère, C. L., Done, J. M., and Clark, M. P.: Changes in hurricanes from a 13-yr convection-permitting pseudo–global warming simulation, J. Climate, 31, 3643–3657, https://doi.org/10.1175/JCLI-D-17-0391.1, 2018.
Hall, A., Rahimi, S., Norris, J., Ban, N., Siler, N., Leung, L. R., Ullrich, P., Reed, K. A., Prein, A. F., and Qian, Y.: An Evaluation of Dynamical Downscaling Methods Used to Project Regional Climate Change, J. Geophys. Res.-Atmos., 129, https://doi.org/10.1029/2023JD040591, 2024.
Hara, M., Yoshikane, T., Kawase, H., and Kimura, F.: Estimation of the impact of global warming on snow depth in Japan by the pseudo-global warming method, Hydrological Research Letters, 2, 61–64, 2008.
Hersbach, H., Bell, B., Berrisford, P., Hirahara, S., Horányi, A., Muñoz-Sabater, J., Nicolas, J., Peubey, C., Radu, R., Schepers, D., Simmons, A., Soci, C., Abdalla, S., Abellan, X., Balsamo, G., Bechtold, P., Biavati, G., Bidlot, J., Bonavita, M., De Chiara, G., Dahlgren, P., Dee, D., Diamantakis, M., Dragani, R., Flemming, J., Forbes, R., Fuentes, M., Geer, A., Haimberger, L., Healy, S., Hogan, R. J., Hólm, E., Janisková, M., Keeley, S., Laloyaux, P., Lopez, P., Lupu, C., Radnoti, G., de Rosnay, P., Rozum, I., Vamborg, F., Villaume, S., and Thépaut, J.-N.: The ERA5 global reanalysis, Quarterly Journal of the Royal Meteorological Society, 146, 1999–2049, https://doi.org/10.1002/qj.3803, 2020.
Herrington, A. R. and Reed, K. A.: On resolution sensitivity in the Community Atmosphere Model, Q. J. Roy. Meteorol. Soc., 146, 3789–3807, https://doi.org/10.1002/qj.3873, 2020.
Hong, S.-Y., Noh, Y., and Dudhia, J.: A new vertical diffusion package with an explicit treatment of entrainment processes, Monthly Weather Review, 134, 2318–2341, https://doi.org/10.1175/MWR3199.1, 2006.
Houze Jr., R. A., Rasmussen, K. L., Zuluaga, M. D., and Brodzik, S. R.: The variable nature of convection in the tropics and subtropics: A legacy of 16 years of the Tropical Rainfall Measuring Mission satellite, Rev. Geophys., 53, 994–1021, https://doi.org/10.1002/2015RG000488, 2015.
Hueholt, D. M., Barnes, E. A., Hurrell, J. W., and Morrison, A. L.: Speed of environmental change frames relative ecological risk in climate change and climate intervention scenarios, Nat. Commun., 15, 3332, https://doi.org/10.1038/s41467-024-47656-z, 2024.
Hurrell, J. W., Holland, M. M., Gent, P. R., Ghan, S., Kay, J. E., Kushner, P. J., Lamarque, J.-F., Large, W. G., Lawrence, D., and Lindsay, K.: The community earth system model: a framework for collaborative research, B. Am. Meteorol. Soc., 94, 1339–1360, 2013.
Iacono, M. J., Delamere, J. S., Mlawer, E. J., Shephard, M. W., Clough, S. A., and Collins, W. D.: Radiative forcing by long-lived greenhouse gases: calculations with the AER radiative transfer models, Journal of Geophysical Research, https://doi.org/10.1029/2008JD009944, 2008.
IPCC: Climate Change 2013 – The Physical Science Basis, Contribution of Working Group I to the Fifth Assessment Report of the Intergovernmental Panel on Climate Change, Chap. 10, edited by: Stocker, T. F., Qin, D., Plattner, G.-K., Tignor, M., Allen, S. K., Boschung, J., Nauels, A., Xia, Y., Bex, V., and Midgley, P. M., Cambridge University Press, Cambridge, UK and New York, NY, USA, https://www.ipcc.ch/site/assets/uploads/2018/02/WG1AR5_Chapter10_FINAL.pdf (last access: 26 February 2026), 2013.
Irvine, P. J. and Keith, D. W.: Halving warming with stratospheric aerosol geoengineering moderates policy-relevant climate hazards, Environmental Research Letters, 15, 044011, https://doi.org/10.1088/1748-9326/ab76de, 2020.
Jiang, J., Cao, L., MacMartin, D. G., Simpson, I. R., Kravitz, B., Cheng, W., Visioni, D., Tilmes, S., Richter, J. H., and Mills, M. J.: Stratospheric sulfate aerosol geoengineering could alter the high-latitude seasonal cycle, Geophys. Res. Lett., 46, 14153–14163, 2019.
Kawase, H., Yoshikane, T., Hara, M., Kimura, F., Yasunari, T., Ailikun, B., Ueda, H., and Inoue, T.: Intermodel variability of future changes in the Baiu rainband estimated by the pseudo global warming downscaling method, Journal of Geophysical Research, 114, D24110, https://doi.org/10.1029/2009JD011803, 2009.
Kravitz, B., Robock, A., Tilmes, S., Boucher, O., English, J. M., Irvine, P. J., Jones, A., Lawrence, M. G., MacCracken, M., Muri, H., Moore, J. C., Niemeier, U., Phipps, S. J., Sillmann, J., Storelvmo, T., Wang, H., and Watanabe, S.: The Geoengineering Model Intercomparison Project Phase 6 (GeoMIP6): simulation design and preliminary results, Geosci. Model Dev., 8, 3379–3392, https://doi.org/10.5194/gmd-8-3379-2015, 2015.
Kravitz, B., MacMartin, D. G., Wang, H., and Rasch, P. J.: Geoengineering as a design problem, Earth Syst. Dynam., 7, 469–497, https://doi.org/10.5194/esd-7-469-2016, 2016.
Kravitz, B., MacMartin, D. G., Mills, M. J., Richter, J. H., Tilmes, S., Lamarque, J. F., Tribbia, J. J., and Vitt, F.: First simulations of designing stratospheric sulfate aerosol geoengineering to meet multiple simultaneous climate objectives, J. Geophys. Res.-Atmos., https://doi.org/10.1002/2017JD026874, 2017.
Lackmann, G. M.: The South-Central US flood of May 2010: present and future, Journal of Climate, 26, 4688–4709, 2013.
Liu, C., Ikeda, K., Rasmussen, R., Barlage, M., Newman, A. J., Prein, A. F., Chen, F., Chen, L., Clark, M., Dai, A., Dudhia, J., Eidhammer, T., Gochis, D., Gutmann, E., Kurkute, S., Li, Y., Thompson, G., and Yates, D.: Continental-scale convection-permitting modeling of the current and future climate of North America, Climate Dynamics, https://doi.org/10.1007/s00382-016-3327-9, 2017.
MacMartin, D. G., Kravitz, B., Keith, D. W., and Jarvis, A.: Dynamics of the coupled human-climate system resulting from closed-loop control of solar geoengineering, Climate Dynamics, 43, 243–258, 2014.
MacMartin, D. G., Kravitz, B., Long, J. C. S., and Rasch, P. J.: Geoengineering with stratospheric aerosols: What don't we know after a decade of research? Earth's Future, 4, 543–548, 2016.
MacMartin, D. G., Kravitz, B., Tilmes, S., Richter, J. H., Mills, M. J., Lamarque, J. F., Tribbia, J. J., and Vitt, F.: The climate response to stratospheric aerosol geoengineering can be tailored using multiple injection locations, J. Geophys. Res.-Atmos., https://doi.org/10.1002/2017JD026868, 2017.
Mills, M. J., Richter, J. H., Tilmes, S., Kravitz, B., MacMartin, D., Glanville, S., Schmidt, A., Tribbia, J. J., Gettelman, A., Hannay, C., Bacmeister, J. T., Kinnison, D. E., Vitt, F., and Lamarque, J. F.: Radiative and chemical response to interactive stratospheric aerosols in fully coupled CESM1(WACCM), J. Geophys. Res.-Atmos., https://doi.org/10.1002/2017JD027006, 2017.
Morrison, A. L., Barnes, E. A., and Hurrell, J. W.: Stratospheric aerosol injection to stabilize Northern Hemisphere terrestrial permafrost under the ARISE-SAI-1.5 scenario, Earth's Future, 12, e2023EF004151, https://doi.org/10.1029/2023EF004151, 2024.
Munich Re.: Thunderstorms, hail and tornadoes, localised but extremely destructive, https://www.munichre.com/en/risks/natural-disasters-losses-are-trending-upwards/thunderstorms-hail-and-tornados.html (last access: 17 November 2024), 2024.
National Academies of Sciences, Engineering, and Medicine: Reflecting Sunlight: Recommendations for Solar Geoengineering Research and Research Governance, Washington, DC, The National Academies Press, https://doi.org/10.17226/25762, 2021.
NCEI: U.S. billion-dollar weather and climate disasters, NOAA, https://doi.org/10.25921/stkw-7w73, 2024.
Niu, G. Y., Yang, Z.-L., Mitchell, K. E., Chen, F., Ek, M. B., Barlage, M., Longuevergne, L., Manning, K., Niyogi, D., Rosero, E., Tewari, M., and Xia, Y.: The community Noah land surface model with multiparameterization options (Noah-MP): 1. Model description and evaluation with local-scale measurements, Journal of Geophysical Research, https://doi.org/10.1029/2010JD015139, 2011.
Palmer, T. and Stevens, B.: The scientific challenge of understanding and estimating climate change, P. Natl. Acad. Sci. USA, 116, 24390–24395, https://doi.org/10.1073/pnas.1906691116, 2019.
Patrick, S. M.: Reflecting Sunlight to Reduce Climate Risk: Priorities for Research and International Cooperation, Council Special Report No. 93, Council on Foreign Relations, New York, USA, https://www.cfr.org/report/reflecting-sunlight-reduce-climate-risk (last access: 26 February 2026), 2022.
Pinto, I., Jack, C., Lennard, C., Tilmes, S., and Odoulami, R. C.: Africa's climate response to solar radiation management with stratospheric aerosol, Geophys. Res. Lett., 47, e2019GL086047, https://doi.org/10.1029/2019GL086047, 2020.
Prein, A. F., Langhans, W., Fosser, G., Ferrone, A., Ban, N., Goergen, K., Keller, M., Tölle, M., Gutjahr, O., Feser, F., Brisson, E., Kollet, S., Schmidli, J., Van Lipzig, N. P. M., and Leung, R.: A review on regional convection-permitting climate modeling: demonstrations, prospects, and challenges, Reviews of Geophysics, 53, 323–361, 2015.
Prein, A. F., Liu, C., Ikeda, K., Bullock, R., Rasmussen, R. M., Holland, G. J., and Clark, M.: Simulating North American mesoscale convective systems with a convection-permitting climate model, Climate Dynamics, https://doi.org/10.1007/s00382-017-3993-2, 2017a.
Prein, A. F., Liu, C., Ikeda, K., Bullock, R., Rasmussen, R. M., Holland, G. J., and Clark, M. P.: The future intensification of hourly precipitation extremes, Nat. Clim. Change, 7, 48–52, https://doi.org/10.1038/nclimate3168, 2017b.
Rasmussen, K. L., Prein, A. F., Rasmussen, R. M., Liu, C., Ikeda, K., and Chen, F.: Changes in the convective population and thermodynamic environments in convection-permitting regional climate simulations over the United States, Climate Dynamics, 55, 383–408, https://doi.org/10.1007/s00382-017-4000-7, 2017.
Rasmussen, R. M., Liu, C., Ikeda, K., Gochis, D., Yates, D., Chen, F., Tewari, M., Barlage, M., Dudhia, J., Yu, W., Miller, K., Arsenault, K., Grubišić, V., Thompson, G., and Gutmann, E.: High-resolution coupled climate runoff simulations of seasonal snowfall over Colorado: a process study of current and warmer climate, Journal of Climate, 24, 3015–3048, 2011.
Rasmussen, R. M., Liu, C., Ikeda, K., Prein, A. F., Chen, F., Chen, L., Barlage, M., Yates, D., and Zhang, G.: Climate change impacts on the water balance of the Colorado headwaters: high-resolution regional climate model simulations, Journal of Hydrometeorology, 15, 1091–1116, 2014.
Rasmussen, R. M., Chen, F., Liu, C. H., Ikeda, K., Prein, A., Kim, J., Schneider, T., Dai, A., Gochis, D., Dugger, A., Zhang, Y., Jaye, A., Dudhia, J., He, C., Harrold, M., Xue, L., Chen, S., Newman, A., Dougherty, E., Abolafia-Rosenzweig, R., Lybarger, N. D., Viger, R., Lesmes, D., Skalak, K., Brakebill, J., Cline, D., Dunne, K., Rasmussen, K., and Miguez-Macho, G.: CONUS404: The NCAR–USGS 4-km Long-Term Regional Hydroclimate Reanalysis over the CONUS, B. Am. Meteorol. Soc., 104, E1382–E1408, https://doi.org/10.1175/BAMS-D-21-0326.1, 2023.
Rauscher, S. A., O'Brien, T. A., Piani, C., Coppola, E., Giorgi, F., Collins, W. D., and Lawston, P. M.: A multimodel intercomparison of resolution effects on precipitation: simulations and theory, Clim. Dynam., 47, 2205–2218, https://doi.org/10.1007/s00382-015-2959-5, 2016.
Richter, J. H., Visioni, D., MacMartin, D. G., Bailey, D. A., Rosenbloom, N., Dobbins, B., Lee, W. R., Tye, M., and Lamarque, J.-F.: Assessing Responses and Impacts of Solar climate intervention on the Earth system with stratospheric aerosol injection (ARISE-SAI): protocol and initial results from the first simulations, Geosci. Model Dev., 15, 8221–8243, https://doi.org/10.5194/gmd-15-8221-2022, 2022.
Robock, A.: Volcanic eruptions and climate, Reviews of Geophysics, 38, 191–219, 2000.
Robrecht, S., Vogel, B., Tilmes, S., and Müller, R.: Potential of future stratospheric ozone loss in the midlatitudes under global warming and sulfate geoengineering, Atmos. Chem. Phys., 21, 2427–2455, https://doi.org/10.5194/acp-21-2427-2021, 2021.
Sato, T., Kimura, F., and Kitoh, A.: Projection of global warming onto regional precipitation over Mongolia using a regional climate model, Journal of Hydrology, 333, 144–154, 2007.
Scaff, L., Prein, A. F., Li, Y., Liu, C., Rasmussen, R., and Ikeda, K.: Simulating the convective precipitation diurnal cycle in North America's current and future climate, Climate Dynamics, 55, 369–382, https://doi.org/10.1007/s00382-019-04754-9, 2020.
Schär, C., Frie, C., Lüthi, D., and Davies, H. C.: Surrogate climate-change scenarios for regional climate models, Geophys. Res. Lett., 23, 669–672, 1996.
Senior, C. A., Marsham, J. H., Berthou, S., Burgin, L. E., Folwell, S. S., Kendon, E. J., Klein, C. M., Jones, R. G., Mittal, N., Rowell, D. P., Tomassini, L., Vischel, T., Becker, B., Birch, C. E., Crook, J., Dougill, A. J., Finney, D. L., Graham, R. J., Hart, N. C. G., Jack, C. D., Jackson, L. S., James, R., Koelle, B., Misiani, H., Mwalukanga, B., Parker, D. J., Stratton, R. A., Taylor, C. M., Tucker, S. O., Wainwright, C. M., Washington, R., and Willet, M. R.: Convection-permitting regional climate change simulations for understanding future climate and informing decision-making in Africa, B. Am. Meteorol. Soc., 102, E1206–E1223, https://doi.org/10.1175/BAMS-D-20-0020.1, 2021.
Simpson, I. R., Tilmes, S., Richter, J. H., Kravitz, B., Mac- Martin, D. G., Mills, M. J., Fasullo, J. T., and Pendergrass, A. G.: The regional hydroclimate response to stratospheric sulfate geoengineering and the role of stratospheric heating, J. Geophys. Res.-Atmos., 124, 12587–12616, https://doi.org/10.1029/2019JD031093, 2019.
Skamarock, W. C., Klemp, J. B., Dudhia, J., Gill, D. O., Barker, D., Duda, M. G., Huang, X.-Y., Wang, W., and Powers, J. G.: A description of the Advanced Research WRF Version 3 (No. NCAR/TN-475+STR), University Corporation for Atmospheric Research, https://doi.org/10.5065/D68S4MVH, 2008.
Stevens, B., Satoh, M., Auger, L., Biercamp, J., Bretherton, C. S., Chen, X., Düben, P., Judt, F., Khairoutdinov, M., Klocke, D., Kodama, C., Kornblueh, L., Lin, S.-J., Neumann, P., Putman, W. M., Röber, N., Shibuya, R., Vanniere, B., Vidale, P. L., Wedi, N., and Zhou, L.: DYAMOND: the DYnamics of the Atmospheric general circulation Modeled On Non-hydrostatic Domains, Prog. Earth Planet. Sci., 6, 61, https://doi.org/10.1186/s40645-019-0304-z, 2019.
Summers, B., Rasmussen, K., Hurrell, J. W., Sun, L., and Yu, H.: Future projections of the 2011 super tornado outbreak under global warming and stratospheric aerosol injection, Earth's Future, submitted, 2026.
Sun, L., Hurrell, J., Rasmussen, K., Kravitz, B., and Summers, B.: Model codes for “Assessing the impact of solar climate intervention on future U.S. weather using a convection-permitting model”, Zenodo [code], https://doi.org/10.5281/zenodo.16374211, 2025a.
Sun, L., Hurrell, J., Rasmussen, K., Kravitz, B., and Summers, B.: Global Climate Model Model codes for “Assessing the impact of solar climate intervention on future U.S. weather using a convection-permitting model”, Zenodo [data set], https://doi.org/10.5281/zenodo.16374758, 2025b.
Sun, L., Hurrell, J., Rasmussen, K., Kravitz, B., and Summers, B.: WRF data for “Assessing the impact of solar climate intervention on future U.S. weather using a convection-permitting model”, Zenodo [data set], https://doi.org/10.5281/zenodo.16376739, 2025c.
Sun, L., Hurrell, J., Rasmussen, K., Kravitz, B., and Summers, B.: Data for “Assessing the impact of solar climate intervention on future U.S. weather using a convection-permitting model”, Zenodo [data set], https://doi.org/10.5281/zenodo.16062478, 2025d.
Tegen, I., Hollrig, P., Chin, M., Fung, I., Jacob, D., and Penner, J.: Contribution of different aerosol species to the global aerosol extinction optical thickness: Estimates from model results, Journal of Geophysical Research, 102, 23895–23915, https://doi.org/10.1029/97JD01864, 1997.
The Royal Society: Solar Radiation Modification: Policy Briefing, The Royal Society, London, UK, https://royalsociety.org/news-resources/projects/solar-radiation-modification/ (last access: 26 February 2026), 2025.
Tilmes, S., Richter, J. H., Mills, M. J., Kravitz, B., MacMartin, D. G., Vitt, F., Tribbia, J. J., and Lamarque, J. F.: Sensitivity of aerosol distribution and climate response to stratospheric SO2 injection locations, J. Geophys. Res.-Atmos., https://doi.org/10.1002/2017JD026888, 2017.
Tilmes, S., Richter, J. H., Kravitz, B., MacMartin, D. G., Mills, M. J., Simpson, I. R., Glanville, A. S., Fasullo, J. T., Phillips, A. S., Lamarque, J., Tribbia, J., Edwards, J., Mickelson, S., and Gosh, S.: CESM1(WACCM) Stratospheric Aerosol Geoengineering Large Ensemble (GLENS) Project, B. Am. Meteorol. Soc., https://doi.org/10.1175/BAMS-D-17-0267.1, 2018.
Tilmes, S., Richter, J. H., Kravitz, B., MacMartin, D. G., Glanville, A. S., Visioni, D., Kinnison, D. E., and Müller, R.: Sensitivity of total column ozone to stratospheric sulfur injection strategies, Geophys. Res. Lett., 48, e2021GL094058, https://doi.org/10.1029/2021GL094058, 2021.
Thompson, G., Field, P., Rasmussen, R. M., and Hall, W. D.: Explicit forecasts of winter precipitation using an improved bulk microphysics scheme. Part II: Implementation of a new snow parameterization, Monthly Weather Review, 136, 5095–5115, 2008.
Touma, D., Hurrell, J. W., Tye, M. R., and Dagon, K.: The impact of stratospheric aerosol injection on extreme fire weather risk, Earth's Future, 11, e2023EF003626, https://doi.org/10.1029/2023EF003626, 2023.
Trapp, R., Diffenbaugh, N. S., Brooks, H. E., Baldwin, M. E., Robinson, E. D., and Pal, J. S.: Changes in severe thunderstorm environment frequency during the 21st century caused by anthropogenically enhanced global radiative forcing, Proceedings of the National Academy of Sciences, 104, 19719–19723, https://doi.org/10.1073/pnas.0705494104, 2007.
Trapp, R. J. and Hoogewind, K. A.: The realization of extreme tornadic storm events under future anthropogenic climate change, Journal of Climate, 29, 5251–5265, 2016.
Trapp, R. J., Robinson, E. D., Baldwin, M. E., Diffenbaugh, N. S., and Schwedler, B. R. J.: Regional climate of hazardous convective weather through high-resolution dynamical downscaling, Climate Dynamics, 37, 677–688, https://doi.org/10.1007/s00382-010-0826-y, 2011.
Tye, M. R., Dagon, K., Molina, M. J., Richter, J. H., Visioni, D., Kravitz, B., and Tilmes, S.: Indices of extremes: geographic patterns of change in extremes and associated vegetation impacts under climate intervention, Earth Syst. Dynam., 13, 1233–1257, https://doi.org/10.5194/esd-13-1233-2022, 2022.
Viceto, C., Marta-Almeida, M., and Rocha, A.: Future climate change of stability indices for the Iberian Peninsula, International Journal of Climatology, 37, 4390-4408, https://doi.org/10.1002/joc.5094, 2017.
Visioni, D., MacMartin, D. G., Kravitz, B., Tilmes, S., Mills, M. J., Richter, J. H., and Boudreau, M. P.: Seasonal injection strategies for stratospheric aerosol geoengineering, Geophys. Res. Lett., 46, 7790–7799, https://doi.org/10.1029/2019GL083680, 2019.
Visioni, D., MacMartin, D. G., Kravitz, B., Richter, J. H., Tilmes, S., and Mills, M. J.: Seasonally modulated stratospheric aerosol geoengineering alters the climate outcomes, Geophys. Res. Lett., 47, e2020GL088337, https://doi.org/10.1029/2020GL088337, 2020.
Visioni, D., Robock, A., Haywood, J., Henry, M., Tilmes, S., MacMartin, D. G., Kravitz, B., Doherty, S. J., Moore, J., Lennard, C., Watanabe, S., Muri, H., Niemeier, U., Boucher, O., Syed, A., Egbebiyi, T. S., Séférian, R., and Quaglia, I.: G6-1.5K-SAI: a new Geoengineering Model Intercomparison Project (GeoMIP) experiment integrating recent advances in solar radiation modification studies, Geosci. Model Dev., 17, 2583–2596, https://doi.org/10.5194/gmd-17-2583-2024, 2024.
Wilson, J. W. and Megenhardt, D. L.: Thunderstorm initiation, organization, and lifetime associated with Florida boundary layer convergence lines, Mon. Weather Rev., 125, 1507–1525, https://doi.org/10.1175/1520-0493(1997)125<1507:TIOALA>2.0.CO;2, 1997.
Xia, L., Nowack, P. J., Tilmes, S., and Robock, A.: Impacts of stratospheric sulfate geoengineering on tropospheric ozone, Atmos. Chem. Phys., 17, 11913–11928, https://doi.org/10.5194/acp-17-11913-2017, 2017.
Yang, C.-E., Hoffman, F. M., Ricciuto, D. M., Tilmes, S., Xia, L., MacMartin, D. G., Richter, J. H., Mills, M., Kravitz, B., and Fu, J. S.: Assessing terrestrial biogeochemical feedbacks in a strategically geoengineered climate, Environmental Research Letters, 15, 104043, https://doi.org/10.1088/1748-9326/abacf7, 2020.
- Abstract
- Introduction
- SAI simulations with Community Earth System Model (CESM)
- WRF model and experimental designs
- Climate change and SAI impact over the CONUS
- Summary and discussion
- Code availability
- Data availability
- Author contributions
- Competing interests
- Disclaimer
- Acknowledgements
- Financial support
- Review statement
- References
- Supplement