the Creative Commons Attribution 4.0 License.
the Creative Commons Attribution 4.0 License.
 | 17 Mar 2026
Assessing and enhancing Noah-MP land surface modeling over tropical forests using machine learning techniques
Yaomin Wang
Kalli Furtado
Cenlin He
Fei Chen
Alan D. Ziegler
Song Chen
Matteo Detto
Yuna Mao
Baoxiang Pan
Yoshiko Kosugi
Marryanna Lion
Shoji Noguchi
Satoru Takanashi
Lulie Melling
Baoqing Zhang
Tropical land-surface processes play a key role in Earth system dynamics, yet evaluation and calibration of land surface models in these regions remain limited. This study addresses this gap through site-specific calibration of the Noah with Multi-Parameterizations (Noah-MP) land surface model at two tropical forest sites: the Panama site with a tropical monsoon climate and the Malaysia site with a tropical rainforest climate. We develop an efficient machine learning-based calibration framework that combines emulator construction with parameter optimization. Site-specific calibration improves the model's ability to simulate key variables, including latent and sensible heat fluxes as well as soil moisture, particularly at daily and seasonal scales. The emulator-based framework enables efficient calibration and shows robust performance during independent validation periods at each site. While the calibrated parameters are not directly transferable between the two sites with different climate regimes, they perform effectively during unseen validation periods at their respective sites, suggesting the potential transferability of parameters across similar climates. Remaining challenges include simulating nighttime sensible heat fluxes, balancing the optimization of latent and sensible heat fluxes, and capturing seasonal soil moisture dynamics. These limitations may stem from structural simplifications in Noah-MP, such as the lack of multi-species vegetation modeling, soil organic layer representation, and detailed tropical subsurface hydrology. Our results demonstrate how the calibration framework can effectively improve Noah-MP performance in tropical forests and provide guidance for future development priorities, which can support broader efforts to generalize model calibration strategies and improve Earth system model fidelity in data-scarce, climatically distinct regions.
- Article
(4390 KB) - Full-text XML
-
Supplement
(2467 KB) - BibTeX
- EndNote


Land surface processes play a vital role in modulating regional and global climate dynamics through mechanisms such as evapotranspiration, the exchange of momentum, albedo, and greenhouse gas emissions (Bonan, 1995; Cheruy et al., 2014; Cox et al., 1999, 2000; Crossley et al., 2000; Dickinson, 1983; Lawrence et al., 2012; Lin et al., 2017; Mahmood et al., 2014; Pielke et al., 2011; Pitman et al., 2009; Unger, 2014; Van Weverberg et al., 2018; Teo et al., 2022; Yan et al., 2022; Zhang et al., 2026). These processes are particularly critical in tropical regions, which act as key drivers of global climate systems (Gentine et al., 2019). Tropical forests, for instance, are the largest terrestrial carbon sinks, regulating the Earth's climate by cycling vast amounts of carbon, water and energy (Pan et al., 2011; Schlesinger and Jasechko, 2014). Additionally, tropical land surfaces significantly impact local weather patterns, monsoon circulation, and extreme weather events such as tropical cyclones and intense convective storms (Gentine et al., 2019). Understanding these processes is essential for predicting climate change and variability, managing water resources, and conserving biodiversity in these ecologically vital regions.
Recent rapid urbanization, deforestation, forestation, agricultural expansion, and wildfires across the tropical regions have profoundly altered land cover and land use patterns (Lambin et al., 2003; Vetrita and Cochrane, 2020). These changes have significant implications for surface energy, water, and carbon cycles, as they modify surface albedo, heat fluxes, soil moisture, vegetation covers, and local climate dynamics (Hasler et al., 2024; Sun et al., 2021b). For example, revegetation can enhance evapotranspiration, leading to a cooling effect (Shao and Zhang, 2019). However, reduced surface albedo associated with revegetation may increase temperature by absorbing more shortwave radiation, potentially outweighing the cooling effect of increased evapotranspiration (Zhang et al., 2022). Such changes are particularly concerning in tropical regions, which are prone to extreme weather events like tropical cyclones, monsoon disturbances, and intense convective storms. Land surface processes can influence the development, intensity, and tracks of these events through land-atmospheric interactions (Ma et al., 2013). Accurate representation of these changes in land surface and land–atmosphere interactive processes is therefore crucial for improving early warning systems, disaster preparedness, and sustainable land management strategies in tropical regions.
Land surface models (LSMs) are essential tools for simulating these complex processes, predicting their changes, and supporting land management interventions and policy maker decisions (Bonan and Doney, 2018; Weiskopf et al., 2022). Over the years, LSMs have evolved from simplified representations of land surface biophysics to sophisticated frameworks that integrate biophysical, biogeochemical, hydrological, and ecological processes (Fisher and Koven, 2020). They are widely used to assess the impacts of land-use changes on water, energy, and carbon cycles, evaluate land–atmosphere interactions, and inform strategies for managing the water-food-energy-carbon nexus (Cheng et al., 2022a, 2024a).
Despite recent advancements, the complex LSMs still require extensive testing and calibration across diverse climate regimes. This issue relates to the fact that default parameterizations, which are often developed using mid-latitude observational data, may not translate well to other biomes with fundamentally different environmental conditions (Lu et al., 2018, 2024). Each region (tropical, temperate, boreal, and arid) differs in key environmental and biological processes, and land cover types such as forests, grasslands, and urban areas exhibit distinct vegetation dynamics and land–atmosphere interactions. Consequently, using default configurations could lead to poor representation of temporal variability in surface fluxes (e.g., latent and sensible heat, photosynthesis) and misrepresentation of biogeochemical and hydrological processes (e.g., soil moisture and streamflow dynamics) (Lu et al., 2018, 2024).
This challenge is pronounced in tropical regions, where high biodiversity, complex canopy structures, and distinct wet-dry seasonality complicate model performance. For example, representing tropical forest diversity in land surface models remains challenging due to ?limited understanding of the mechanisms underlying forest functional diversity. In particular, few studies have calibrated the ecological coexistence of tropical tree species, which are the processes that allow multiple species with differing traits to persist together over time within the same ecosystem (Cheng et al., 2024b). Moreover, the critical role of soil hydrological processes in shaping tropical ecosystem behaviour has been underexplored in model calibration efforts (Cheng et al., 2022b, 2023, 2024b).
To address these limitations, site- or region-specific calibration is essential for improving model accuracy and ensuring reliable simulations at local, regional, and global scales (Cheng et al., 2023; Huang et al., 2016; Lu and Ricciuto, 2019; Müller et al., 2015; Sun et al., 2021a). Particularly important is the joint tuning of soil and vegetation parameters and validation across multiple timescales, especially in regions with pronounced dry-wet seasonality such as the tropics (Ogden et al., 2013).
Effective calibration of LSMs requires optimization approaches that can efficiently explore high-dimensional parameter spaces and avoid becoming trapped in local optima arising from strong nonlinearity and complex parameter interactions (Gupta et al., 1999). To address these challenges, population-based global optimization algorithms have been widely adopted, particularly in hydrological applications. Prominent examples include the Shuffled Complex Evolution (SCE-UA) (Duan et al., 1992) and Differential Evolution (DE) (Storn and Price, 1997), which is particularly robust for navigating the rugged, non-differentiable response surfaces typical of LSMs.
However, these global search algorithms typically require tens of thousands of model evaluations to converge. The computational burden and wall-clock time increase significantly when these simulations cannot be fully parallelized, because each iteration depends on the results of the previous set of simulations. For process-rich LSMs, such computational demands are often prohibitive. To address this challenge, recent studies have increasingly employed machine learning (ML)-based emulators (or surrogates) to reproduce model behaviours with high fidelity but at a fraction of the computational cost, thereby enabling the extensive sampling required for robust global optimization (Lu et al., 2018; Sun et al., 2021b; Lu et al., 2024).
The objective of this study is to assess and enhance the performance of the widely-used Noah with Multi-Parameterization options (Noah-MP) LSM in tropical regions. Noah-MP stands out for its versatility and comprehensive treatment of land surface processes (Chang et al., 2020; He et al., 2023a; Niu et al., 2011; Yang et al., 2011). Its multi-physics framework facilitates the incorporation of diverse parameterizations, enabling its applications across a wide range of environmental conditions. Its seamless integration with numerical weather prediction (NWP) models, such as the Weather Research and Forecasting (WRF) model, the Multiscale Prediction and Analysis System (MPAS), and NOAA's Unified Forecast System (UFS), significantly enhances its utility in climate and weather simulations. However, despite its widespread use, Noah-MP applications remain understudied in tropical environments, resulting in limited application and systematic evaluation under the distinct hydroclimatic, ecological, and land–atmosphere coupling regimes characteristic of the tropics. In this study, we evaluate and calibrate Noah-MP against observational data from two distinct tropical forest sites in Panama (tropical monsoon climate) and Malaysia (tropical rainforest climate). We develop an effective machine learning-based calibration framework for Noah-MP that combines emulator construction with parameter optimization. Using this framework, we assess the model's ability to simulate diurnal, daily, and seasonal dynamics of land surface energy fluxes and soil moisture with calibrated parameters. Recognizing that Noah-MP's performance is sensitive to the choice of key vegetation and soil parameters, we explicitly calibrate these two types of parameters and quantify their individual contributions to overall model performance improvements. We further discuss the transferability of the emulator-based calibration framework and calibrated parameters across different climate regimes, as well as future development directions for Noah-MP.
2.1 Study area and field data for model evaluation and calibration
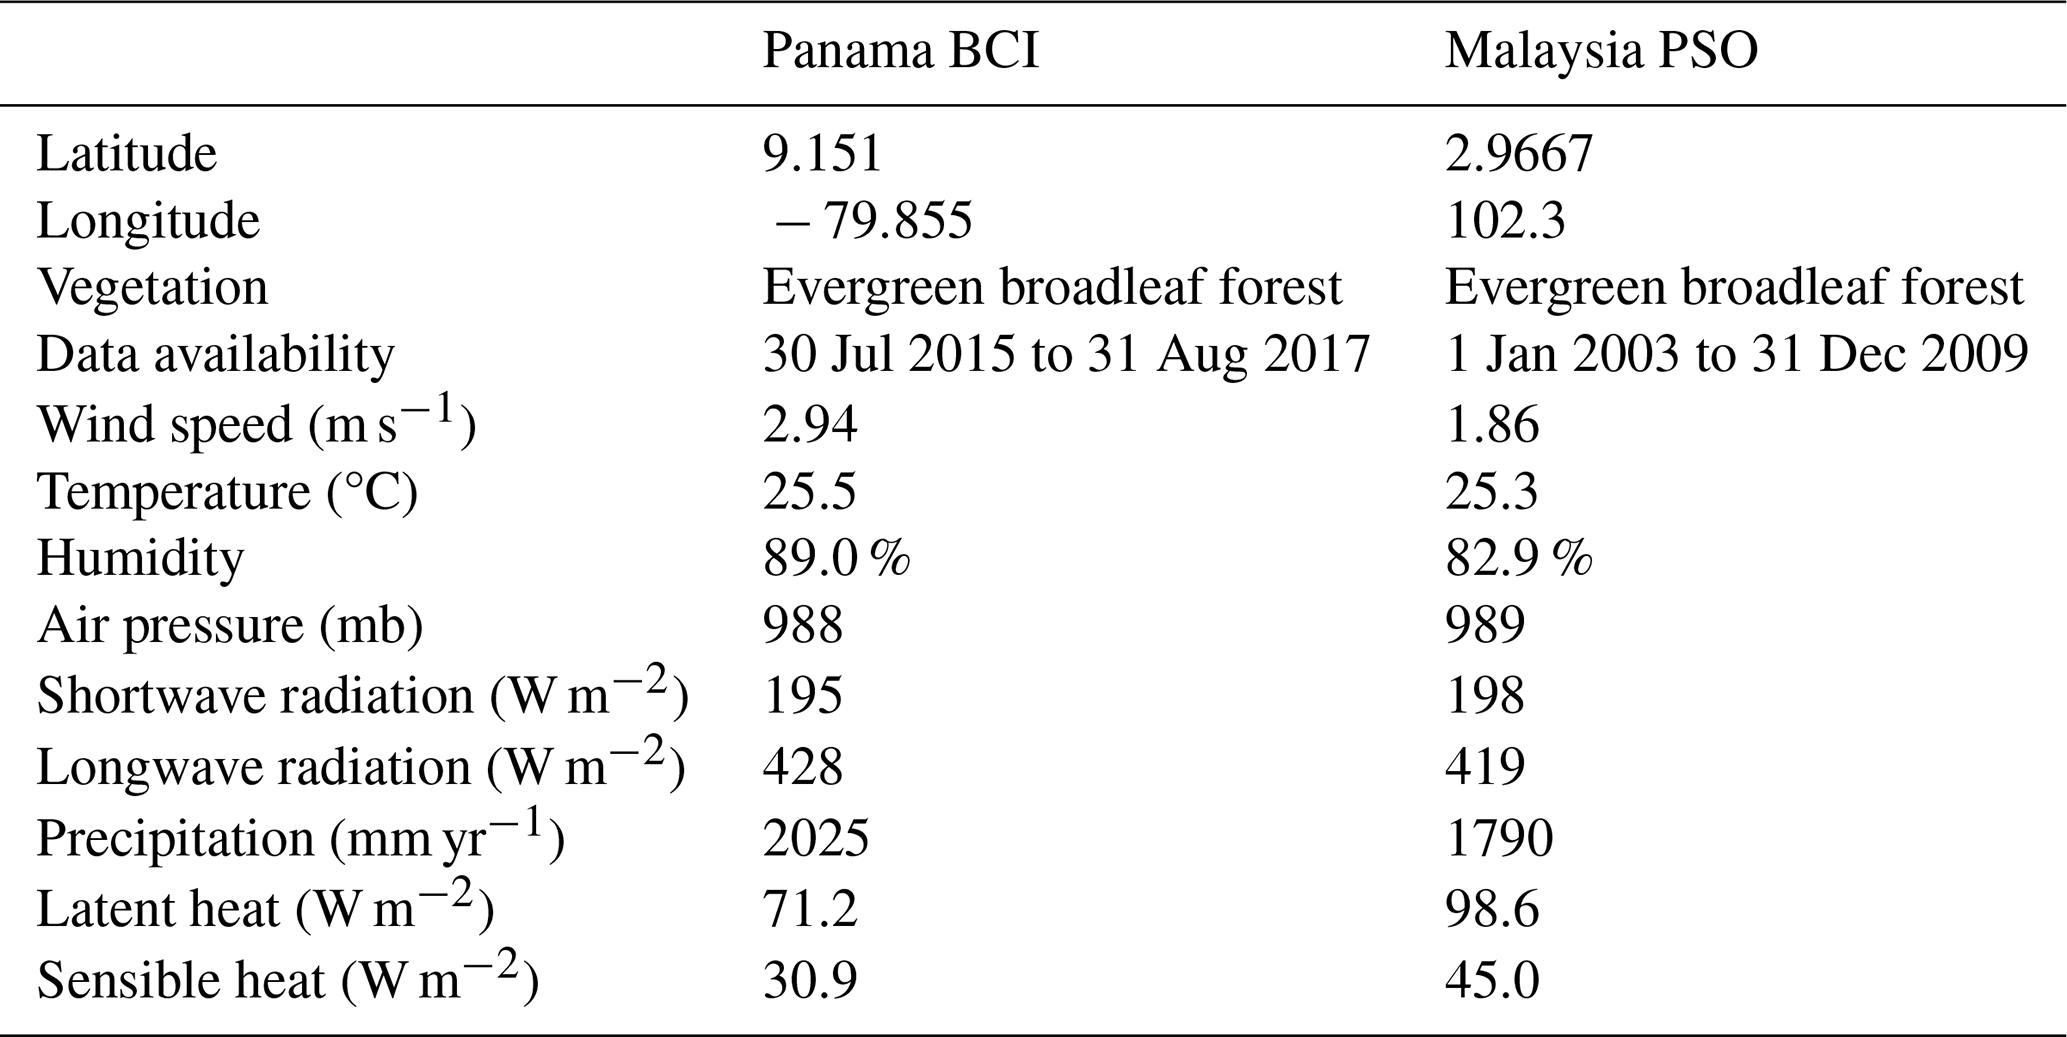
We use observational data from two tropical sites in Panama and Malaysia (Fig. 1, Table 1) to calibrate Noah-MP and improve its performance over tropical forests. Specifically, we evaluate and improve Noah-MP's performance in simulating latent heat (LH), sensible heat (SH), and soil moisture (SM), which are key variables influencing land–atmosphere interactions.
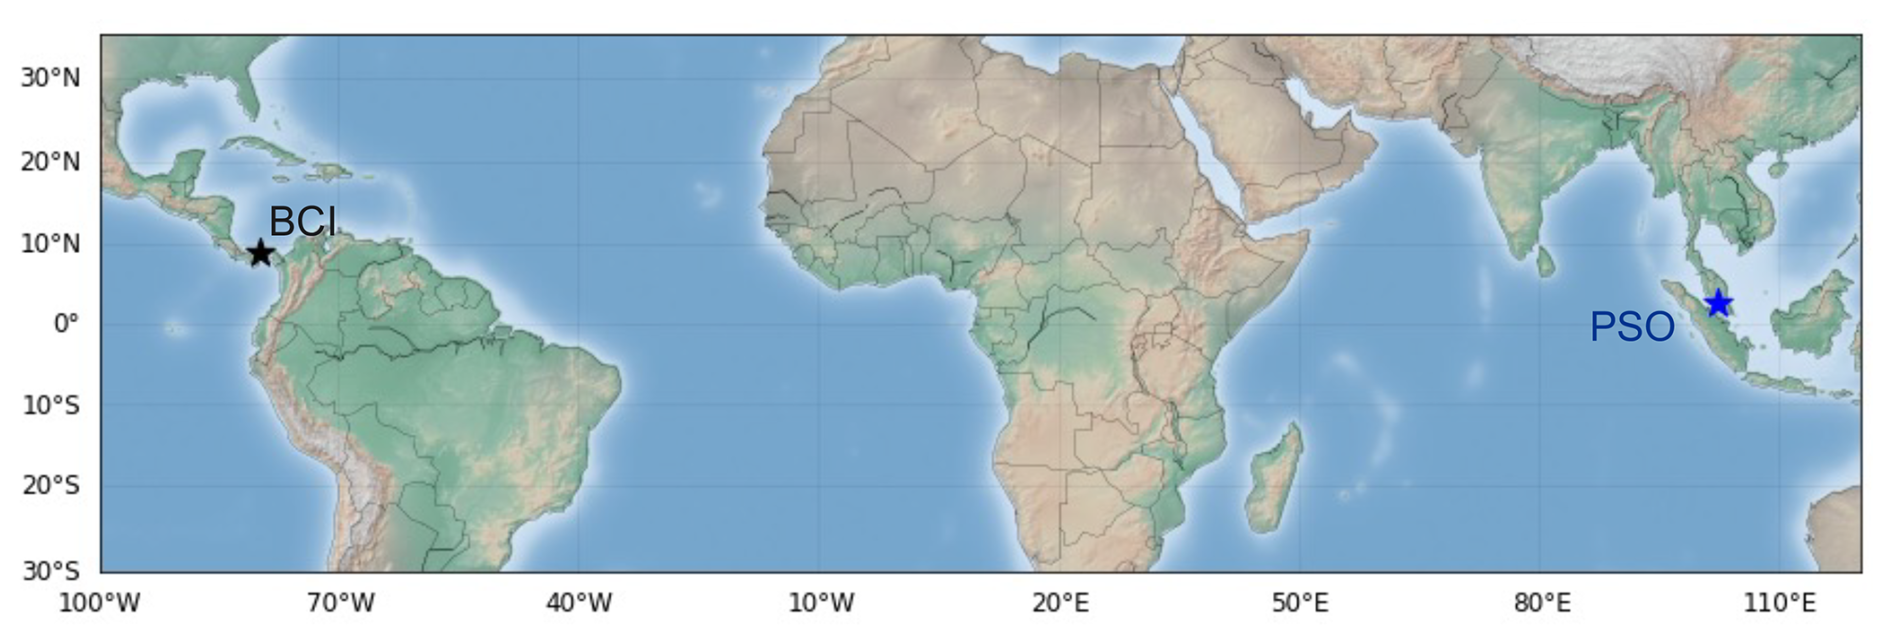
Figure 1Locations of the two tropical forest study sites in Barro Colorado Island, Panama (BCI, black star) and Pasoh Forest Reserve, Malaysia (PSO, blue star).
Table 1Detailed information for the two tropical forest study sites.
2.1.1 Panama tropical forest site
The Barro Colorado Island (BCI) site in Panama is located at 9.151° N, 79.855° W. It is a primary lowland (elevation 120 m) semi-deciduous tropical forest site with a mean canopy height of 30 m and few emergent trees (Cheng et al., 2022b; Detto et al., 2015; Detto and Pacala, 2022; Fang et al., 2022). It has distinct ?dry (mid-December to mid-April) and wet (late-April to early December) seasons (Ogden et al., 2013). The site exhibits a tropical monsoon climate (Am), characterized by a short dry season. The soils are mostly well weathered kaolinitic Oxisols. Meteorological and flux data were collected from a 45 m tower located on the top-plateau at a half-hour temporal resolution (Detto and Pacala, 2022). The mean annual precipitation, wind speed, air temperature, relative humidity, air pressure, shortwave radiation, and longwave radiation during 2015 to 2017 are 2025 mm, 2.94 m s−1, 25.5 °C, 89 %, 98.8 kPa, 195 W m−2, and 428 W m−2, respectively (Table 1). The soil moisture is measured in the top 15 cm of the soil (Cheng et al., 2022b; Detto and Pacala, 2022).
2.1.2 Malaysia tropical forest site
The Pasoh Forest Reserve (PFR), known as the PSO AsiaFlux site, is a tropical forest located in Malaysia at 2.9667° N, 102.3° E. This lowland forest (140 m elevation) boasts a canopy height of 30–40 m, with emergent trees exceeding 45 m. The site is notable for being located within a dry zone of Peninsular Malaysia and receives the lowest annual rainfall among adjacent south-eastern tropical rainforests (Lion et al., 2017; Noguchi et al., 2016). The soils are dominated by Ultisols and Oxisols, which are Haplic Acrisol and Xanthic Ferralsol in FAO classification. The site has a tropical rainforest climate (Af), with consistently high rainfall throughout the year.
The observed data ?were measured at a height of 54 m on the flux tower at a half-hour temporal resolution (Lion et al., 2017). The mean annual precipitation, wind speed, air temperature, relative humidity, air pressure, shortwave radiation, and longwave radiation from 2003 to 2009 are 1790 mm, 1.86 m s−1, 25.3 °C, 82.9 %, 98.9 kPa, 198 W m−2, 419 W m−2, respectively (Table 1). The volumetric soil water content is calculated as the average of observations from nine TDR (time domain reflectometry) sensors placed at depths of 10, 20, and 30 cm at three locations around the flux tower (Noguchi et al., 2016).
2.2 Noah-MP
The community Noah-MP LSM (He et al., 2023a, b; Niu et al., 2011) is designed for a wide range of applications, including uncoupled studies of hydrometeorological and ecohydrological processes, as well as coupled numerical weather prediction and decadal climate simulations. It can operate from point to global scales. The land grid in Noah-MP is divided into two sub-grid tiles: vegetated and non-vegetated areas, determined by vegetation cover fraction. The biogeophysical and biogeochemical processes are treated separately for these two tiles. Noah-MP employs a “big-leaf” canopy approach, with canopy properties varying according to the type of vegetation (He et al., 2023a). More detailed descriptions of Noah-MP have been provided elsewhere (He et al., 2023c).
The core strength of Noah-MP lies in its multi-parameterization design, allowing testing and use of different combinations of parameterization schemes (Li et al., 2020, 2022; Gan et al., 2019). Prior to calibration, we tested several physical options that could potentially impact LH and SH, including stomatal resistance, soil moisture factor, and surface resistance options. No significant difference in model performance was observed at either site (Figs. S1 and S2 in the Supplement); therefore, we adopted the default Noah-MP physics option set (He et al., 2023a) for parameter optimization.
2.3 Model simulations
We configure single-point Noah-MP simulations at the two study sites and calibrate the model at the daily scale. For the Panama tropical forest site, the vegetation type is set as evergreen broadleaf forest and the soil type as clay. The simulated soil moisture for the top 10 cm is used as the closest available depth for validation against the observations at the site in Panama. At the Malaysia site, the vegetation type is also evergreen broadleaf forest, with silty clay soil. The simulated soil moisture averaged over the top 30 cm is used to validate against the observed soil water content at the site.
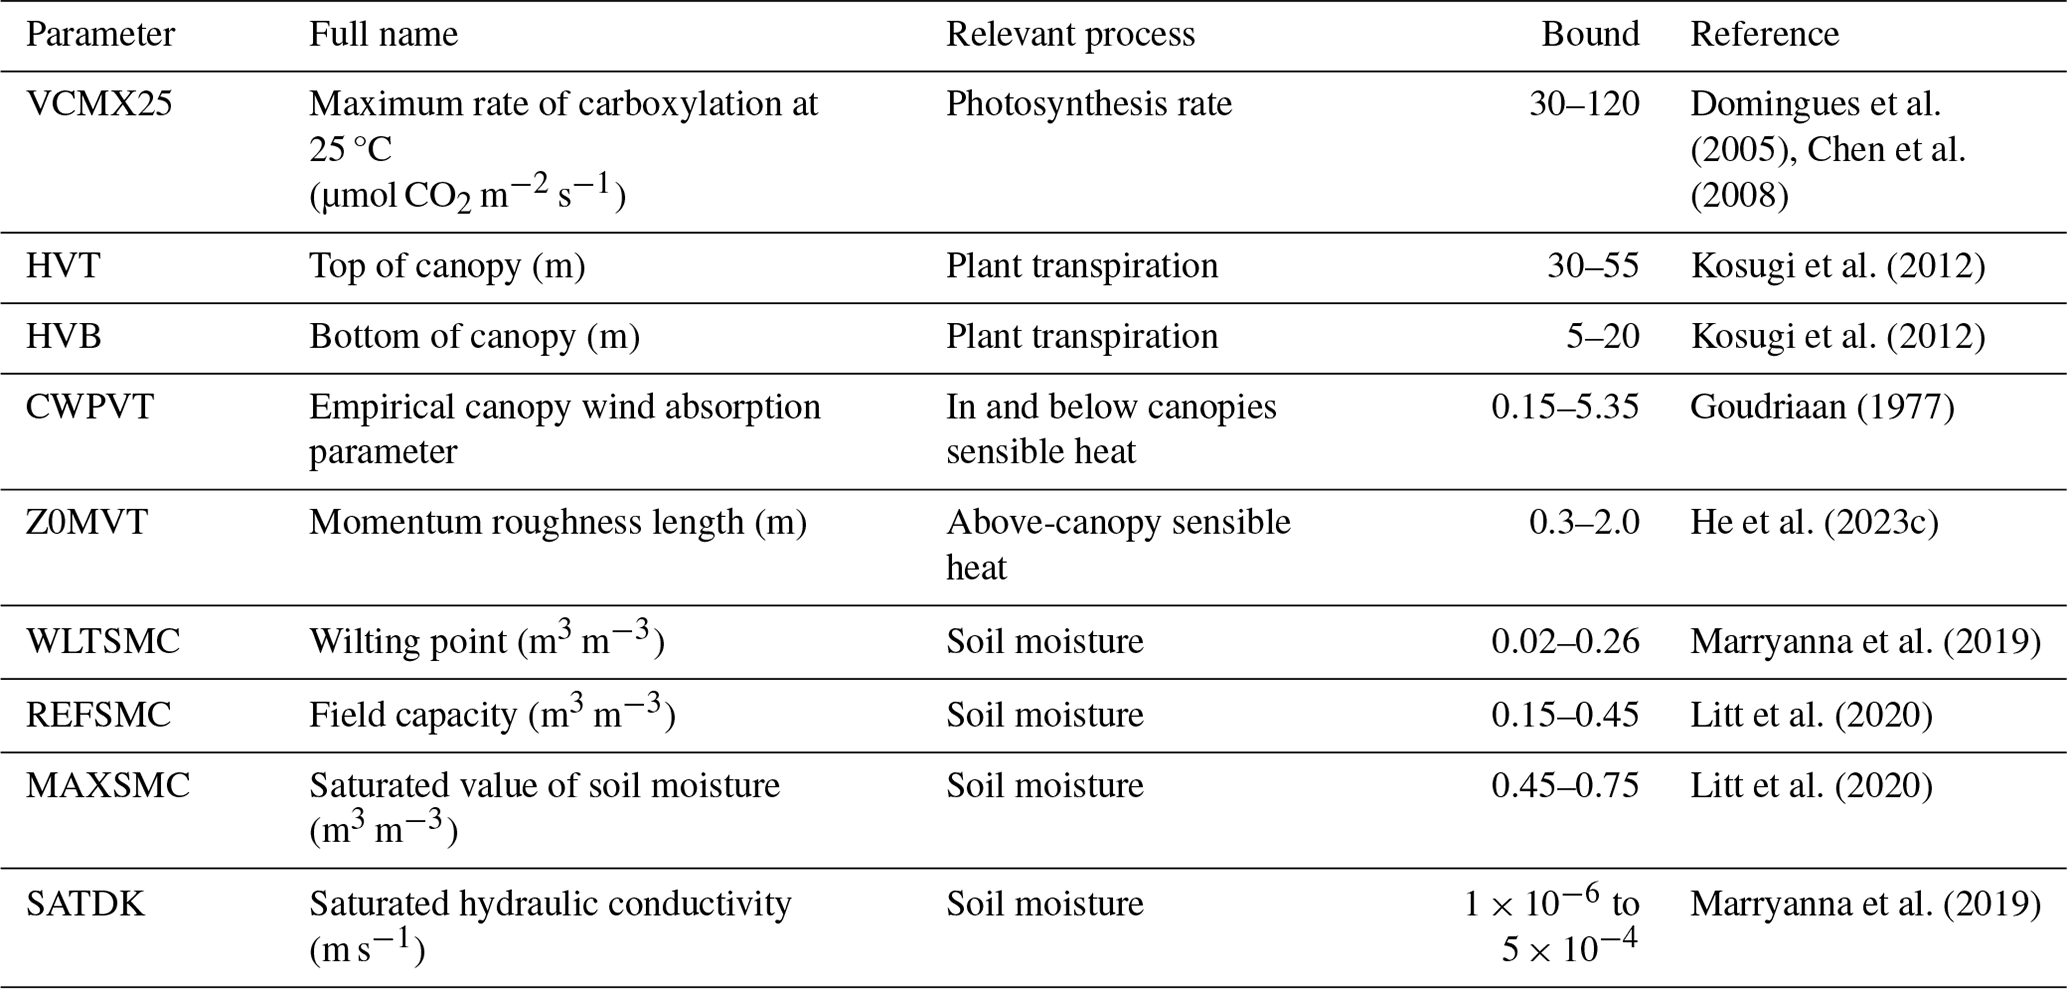
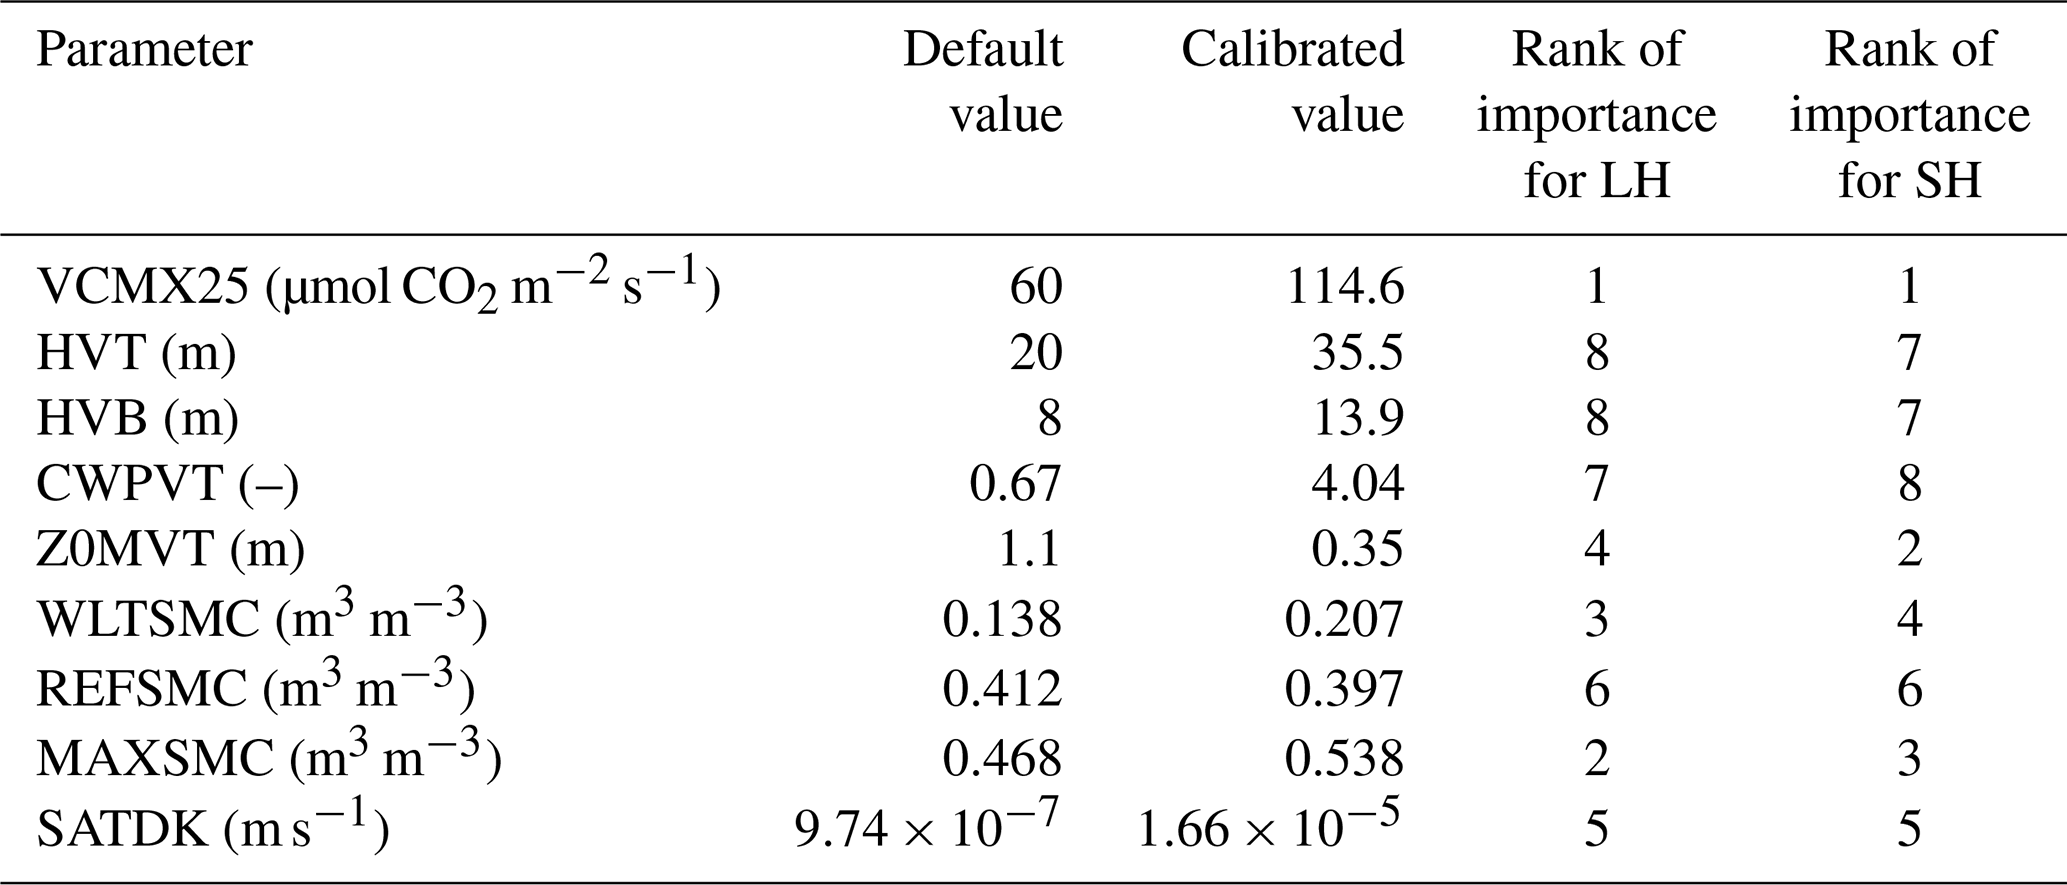
2.4 Calibrated parameters
The key vegetation and soil parameters for calibration are selected based on the past experience and literature reports (Arsenault et al., 2018) (Table 2), which include the maximum rate of carboxylation at 25 °C (VCMX25), top of canopy (HVT), bottom of canopy (HVB), momentum roughness length (Z0MVT), empirical canopy wind absorption parameter (CWPVT), saturated value of soil moisture (MAXSMC), saturated hydraulic conductivity (SATDK), wilting point (WLTSMC), and field capacity (REFSMC). For vegetation parameters, VCMX25 regulates the photosynthesis rate and stomatal resistance, and HVT and HVB determine canopy thickness. CWPVT affects turbulent heat transfer below canopies, while Z0MVT controls sensible and latent heat fluxes above the canopy. For soil parameters, MAXSMC, WLTSMC, and REFSMC determine soil water retention and the amount of water available for plant uptake, while SATDK controls the infiltration rate. The parameter bounds in Table 2 are derived from literature values reported for the Panama BCI and Malaysia PSO sites.
2.5 ML-based calibration framework
2.5.1 Overview
Figure 2 illustrates the algorithmic workflow of the proposed ML-based calibration framework, which integrates machine-learning-based emulation with a population-based global optimization algorithm to efficiently estimate optimal Noah-MP parameters while preserving the model's physical behavior. By replacing repeated expensive model evaluations with a fast emulator, the framework substantially reduces computational cost while maintaining accuracy and robustness.
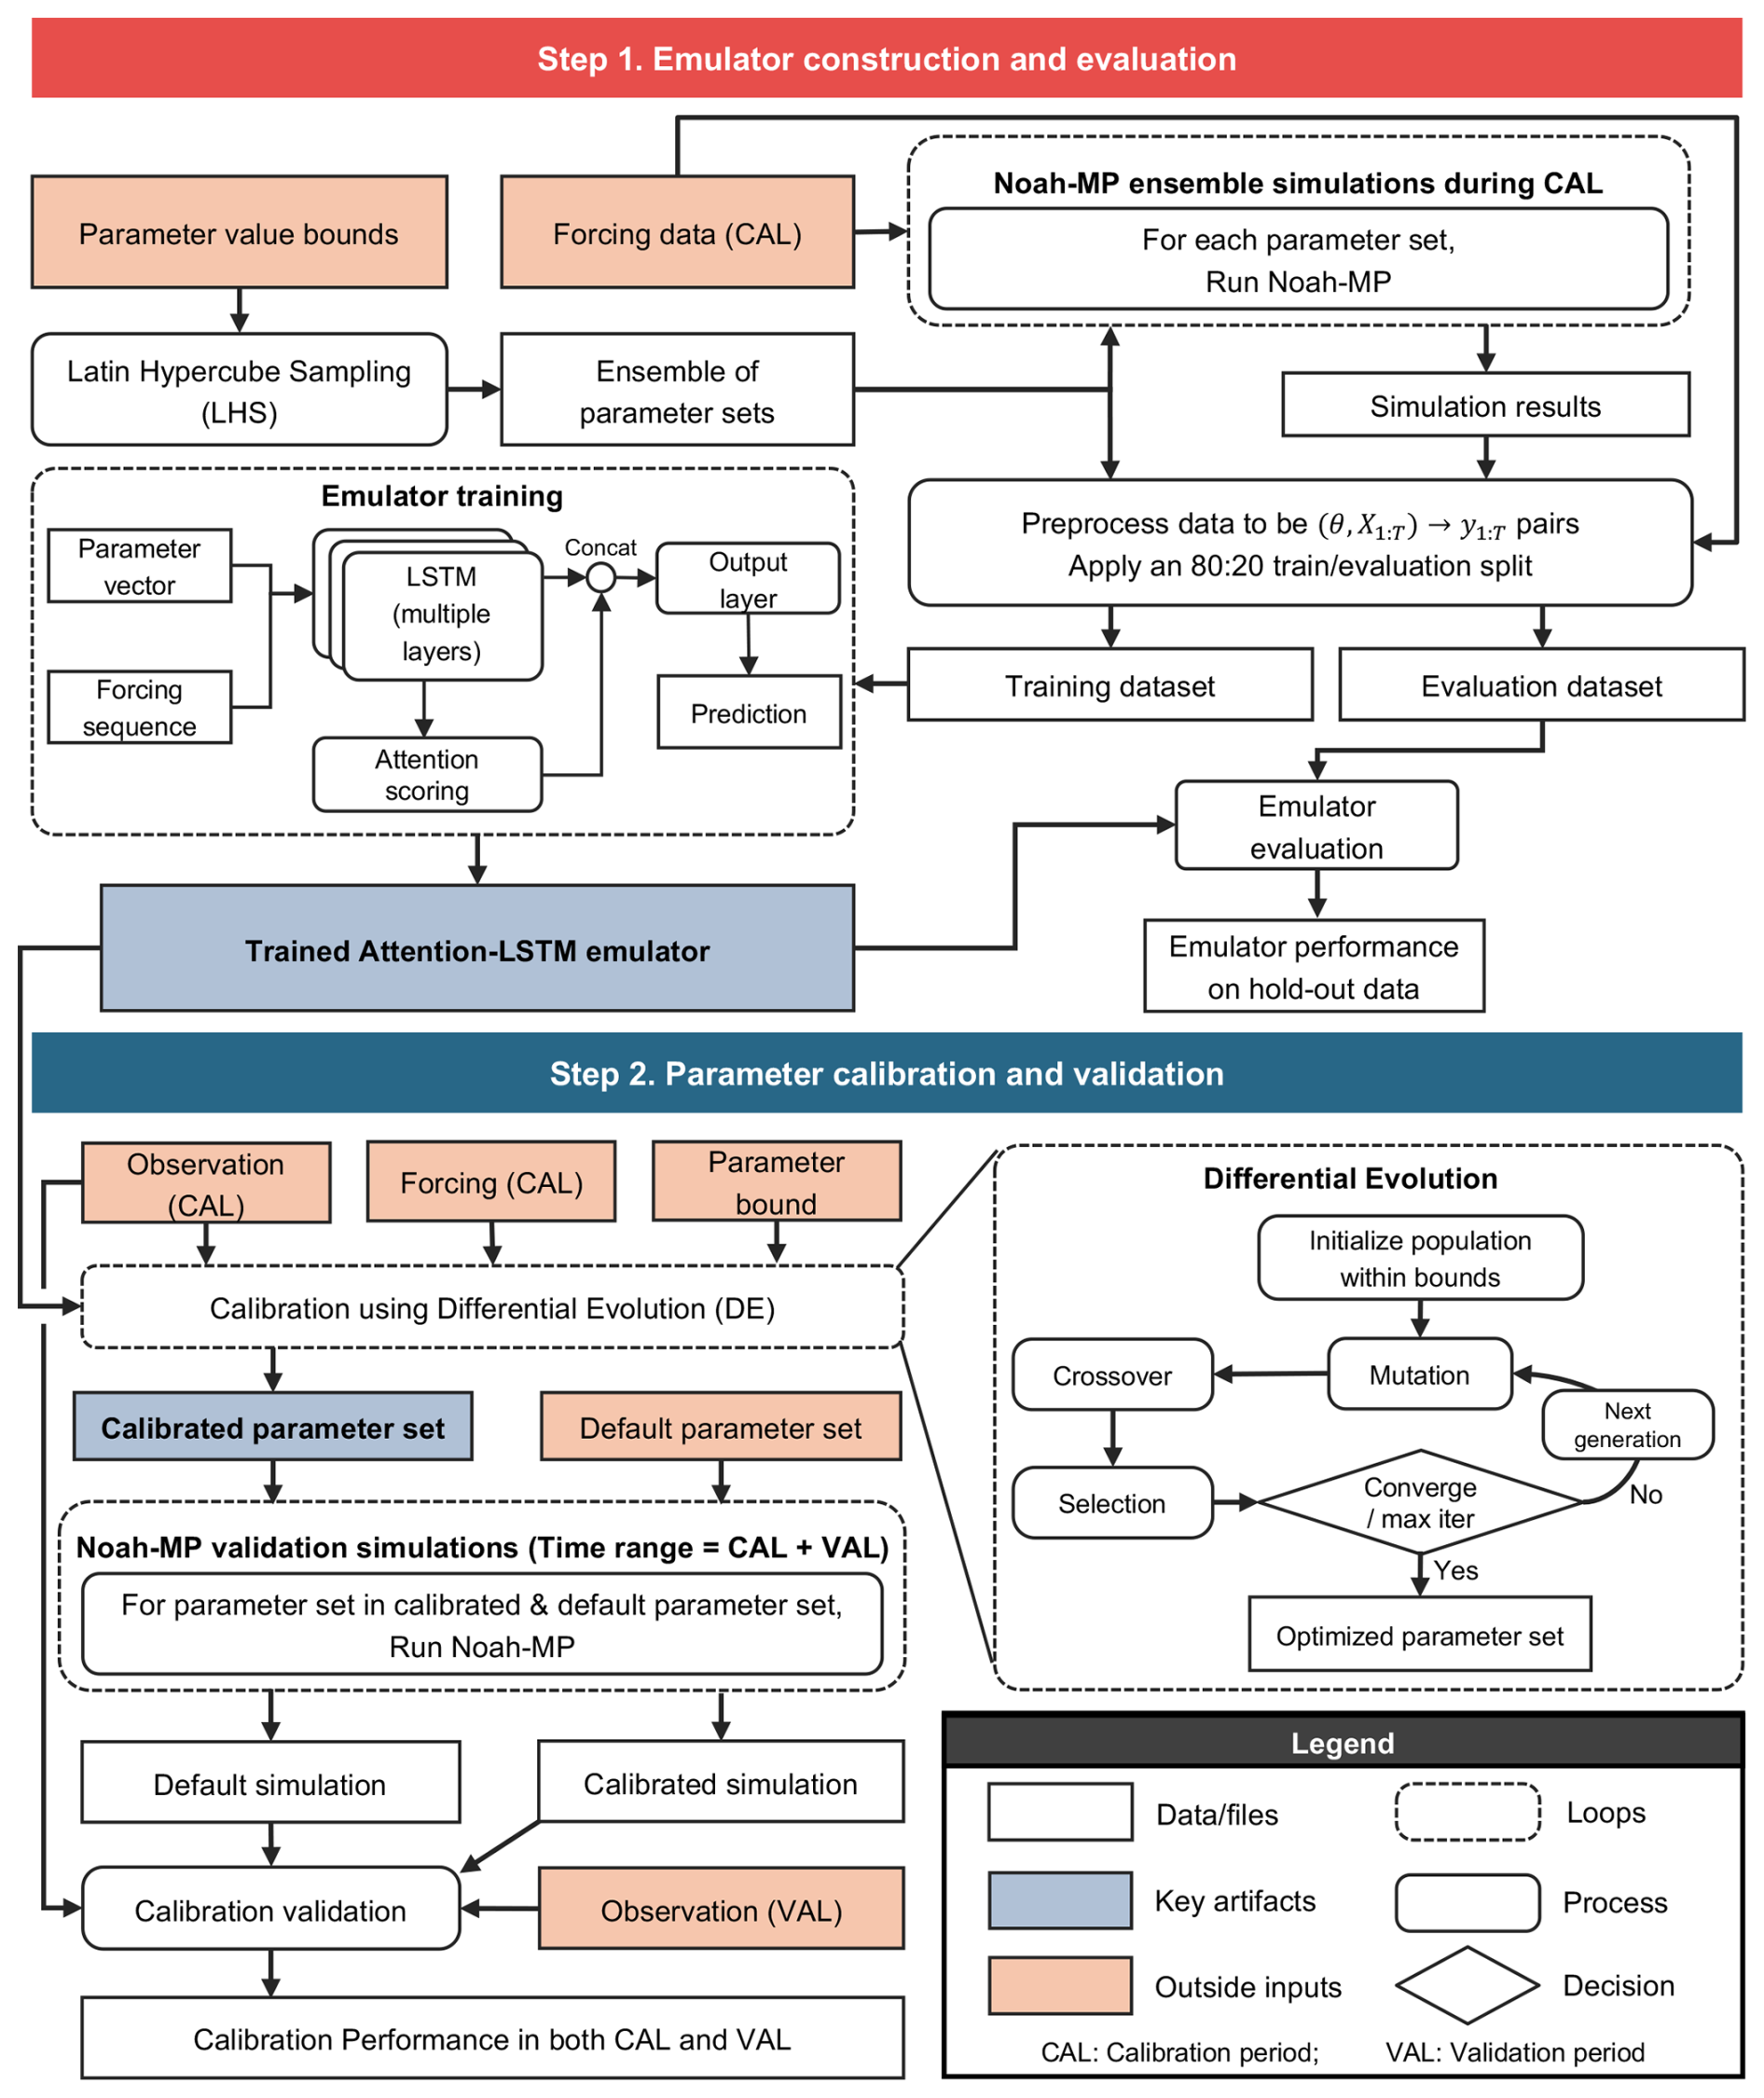
Figure 2The algorithmic workflow of the two-step calibration framework. The pairs in Step 1 represent the mapping from parameter vector θ and meteorological forcing X1:T to the Noah-MP simulated outputs Y1:T.
The framework consists of two main steps. First, an ML-based emulator of Noah-MP is constructed to approximate the mapping from model parameters and meteorological forcing data to simulated land surface variables at each study site. For this purpose, we perform 1000 ensemble Noah-MP simulations using 1000 different parameter combinations sampled from Latin Hypercube Sampling and site-specific climate forcing. For each site, 80 % of these simulations are used to train the emulator, while the remaining 20 % are reserved for independent evaluation of emulator performance.
Second, the trained emulator is used to calibrate model parameters at each study site. Observational data are divided into calibration and validation periods. Parameters are optimized using observations from the calibration period only, and the optimized parameter set is then applied in full simulations with the original Noah-MP model over the entire study period. Model performance is evaluated separately for the calibration and validation periods using standard metrics. Details of the two-step calibration workflow, including emulator construction, evaluation, and calibration procedures, are described below.
2.5.2 Emulator construction and evaluation
Emulator construction
We employ an Attention-Long Short-Term Memory (LSTM) neural network to construct the emulator, which is designed to capture the processes of the Noah-MP land surface model. LSTM networks are well suited for representing short- to medium-term temporal features (Kratzert et al., 2018), such as the memory of soil moisture states, while the attention mechanism further enhances generalization by dynamically weighting the importance of different historical time steps (e.g., antecedent precipitation events) when predicting current states.
The emulator learns a statistical approximation of Noah-MP behaviour, mapping model parameters and meteorological forcing data to simulated land surface states and fluxes. In this study, the emulator inputs consist of eight dynamic meteorological forcing variables, including 2 m temperature (T2M), rain rate (RAINRATE), longwave radiation (LWFORC), shortwave radiation (SWFORC), 2m specific humidity (Q2D), surface pressure (PSFC), 2 m U-wind component (U2D), and 2 m V-wind component (V2D), consistent with the parent Noah-MP model. In addition, nine model parameters, including both vegetation and soil parameters targeted for calibration (Table 2), are also provided as inputs.
The emulator is trained to predict a comprehensive set of 29 output variables (Figs. S3 and S4), including the three primary calibration targets, which are latent heat (LH), sensible heat (SH), and soil moisture (SM), as well as auxiliary diagnostic variables (e.g., ground heat flux, runoff components, and temperature states). Higher loss weights are assigned to the primary targets, while auxiliary variables act as process-aware constraints that respect the underlying conservation laws of energy and mass.
Training data for the emulator are generated data by sampling 1000 parameter combinations within prescribed bounds (Table 2) and running Noah-MP once for each parameter set, using identical site-specific forcing and model configuration. Each simulation produces time series of both primary target variables (LH, SH, and SM) and auxiliary variables (Figs. S3 and S4). The resulting dataset comprises 1000 paired samples of , where θ denotes the parameter vector, X1:T the climate forcing, and Y1:T the Noah-MP simulated outputs. Because observational data are separated into calibration and validation periods for subsequent parameter calibration (Sect 2.5.3), emulator training uses the calibration-period forcing and the corresponding Noah-MP simulations. This dataset is subsequently split into training and evaluation subsets with an 80:20 ratio.
To prevent training instability caused by differing physical magnitudes, all input and output variables are standardized using Z-score normalization. The training loss aggregates weighted RMSE across all predicted variables, allowing the network to learn the coupled evolution of energy and water processes while accounting for differences in physical units. The loss function, Ltrain, is defined as:
where V represents the set of all emulator-predicted variables (29 variables in this study), N is the batch size (N=16 in this study), T is the total number of time steps, and are normalized values of each variable from the emulator-predictions and Noah-MP-simulations, respectively, and wv is variable-specific weighting factor. Both and are normalized values to account for disparate physical magnitudes across variables (e.g., W m−2 for heat fluxes versus m3 m−3 for soil moisture) and to ensure numerical stability.
Emulator evaluation
Before using the machine-learning-based emulator for parameter calibration, its predictive performance is assessed using the evaluation subset (20 % of ensemble Noah-MP simulations). Unlike the training loss (Eq. 1), emulator skill is assessed using denormalized outputs in physical units for each primary target variable (LH, SH, and SM).
The metrics of evaluating emulator performance include the coefficient of determination (R2, Eq. 2), root mean square error (RMSE, Eq. 3), and percent bias (PBIAS, Eq. 4). Only emulators demonstrating sufficient accuracy are used in subsequent calibration in Sect. 2.5.3, ensuring that parameter optimization is based on a reliable approximation of Noah-MP behaviour.
where y and are original values of each variable from the emulator-predictions and Noah-MP-simulations, respectively, and M is the ensemble size used for emulator evaluation (20 % of the ensemble Noah-MP simulations in this study).
2.5.3 Parameter calibration and validation
To ensure the robustness of the calibrated parameters and assess their transferability to unseen temporal conditions, we separate the observational data into calibration and validation periods, conduct the calibration using only the forcing data and observations from the calibration period, and reserve the remaining independent and unseen data for subsequent validation. For the Panama BCI site, the calibration period is 30 July 2015 to 29 July 2016 and the validation period is 30 July 2016 to 30 July 2017. For the Malaysia PSO site, the calibration period is 1 January 2005 to 31 December 2006 and the validation period is 1 January 2007 to 30 December 2009.
Parameter calibration
Following the emulator construction and evaluation, parameter calibration is performed using the Differential Evolution (DE) algorithm (Storn and Price, 1997). DE is a population-based optimization method well suited to highly non-linear and non-differentiable objectives typical of land-surface model calibration.
Starting from an initial population sampled within parameter bounds, DE iteratively proposes new candidates through mutation and crossover operations and retains those that improve the objective function. In our implementation, DE iteratively generates populations of parameter vectors. For each candidate vector, the emulator predicts the corresponding model outputs which are then evaluated against in situ observations using the objective function defined in Equation 7. This objective function is formulated to minimize discrepancies between emulator-predicted fluxes and the observed fluxes. This cycle repeats until convergence criteria are met or the maximum number of generations is reached.
Multiple independent DE runs with different random seeds are conducted to reduce sensitivity to stochastic effects. This yields an ensemble of calibrated parameter sets, from which we report the best-performing solution. This multi-run design also provides a practical diagnostic of identifiability: parameters that consistently converge to similar values across independent runs are more likely to be well constrained by the data and objective.
Calibration is formulated as a joint optimization problem to explicitly account for interactions and trade-offs among energy and water fluxes. For each primary variable, RMSE is first computed in physical units over all valid (non-missing) time steps (Eq. 5) and then normalized by the observed dynamic range to obtain a dimensionless error (Eq. 6). The overall calibration loss is defined as a weighted sum of normalized RMSE across the three primary target variables (LH, SH, and SM) (Eq. 7).
where p is the primary target variable LH, SH, or SM), and z and are flux tower observations and Noah-MP-simulations, respectively.
where P represents the set of primary target variables for calibration (LH, SH, and SM in this study), and wp is the variable-specific weighting factor.
This Lcalibration metric aggregates the errors of different variables by normalizing them, thereby resolving the issue of disparate physical magnitudes. The weighting factor wp allows for flexible prioritization of specific physical processes based on site-specific conditions or measurement reliability. For instance, if observed SH of the study site is suspected to be biased, lower weights can be assigned to SH to ensure the model prioritizes the more credible sources of guidance.
For parameters with prior knowledge, fixed values can be set manually before calibration to impose additional physical constraints. For example, at the PSO site, LAI is fixed at the field-observed value of 6.52 m2 m−2 rather than calibrated.
Parameter validation
Because the emulator is an approximation, the calibrated parameters are validated by applying them in simulations with the original Noah-MP model. The calibrated parameter set is therefore used to rerun Noah-MP over the complete study period.
Model performance is evaluated separately for the calibration and validation periods using standard metrics computed in physical units, including RMSE, R2, and bias (BIAS; Eq. 8). Performance during the calibration assesses whether the emulator-based calibration identifies parameterizations that translate to the physical model, while performance during the independent validation period evaluates generalization and robustness.
2.6 Contribution analysis
To quantify the contribution of each calibrated parameter (or parameter group) to the overall improvement in model performance, we employ Shapley value decomposition, a game-theoretic approach originally developed for fair allocation problems (Shapley, 1953). This method provides a unique and theoretically fair way to distribute the total gain among the parameters.
Formally, let u(A) represent the performance metric (RMSE in this study) achieved when a subset of parameters A is set to their calibrated values, while the remaining parameters are held at their default values. The Shapley value ϕi for a parameter i is defined as the weighted average of its contributions across all possible parameter combinations:
where Z is the set of all calibrated parameters, and j is the number of parameter groups.
For n parameter groups, complete enumeration of all combinations requires 2n model evaluations, corresponding to every possible combination of default and calibrated parameter states. In this study, two parameters (HVT and HVB) are correlated, with HVB constrained to be below HVT, reducing the original nine parameters to eight parameter groups. Accordingly, we conducted 256 model simulations. For each simulation, performance metrics (RMSE in this study) are calculated against observational data. Shapley values are then computed to decompose the total performance change into individual parameter contributions.
Finally, to quantify the absolute influences of each parameter, we define its importance as the absolute value of its Shapley value (Eq. 10). This approach allows direct comparison of the relative impact of each parameter on the model performance improvement.
We first analyse the emulator validation results due to its fundamental functionality of the calibration. For each study site, we examine the optimal parameter values and their individual contributions to model performance to identify the most influential parameters. We also examine how calibrating these parameters affects day-to-day variability in energy and water fluxes, as well as seasonal and diurnal cycles.
3.1 Emulator performance
Prior to calibration, the predictive accuracy of the emulator is rigorously evaluated using the independent validation subset, consisting of 20 % of the ensemble Noah-MP simulations not used during training. The emulator demonstrates high fidelity in reproducing the dynamics of the original Noah-MP model (Fig. 3), achieving high agreement for all target variables (Figs. S3 and S4). Specifically, R2 reaches 0.95 for all the three primary target variables including LH, SH, and SM (Fig. 3), while RMSE and PBIAS remain low, indicating that the emulator effectively captures both the magnitude and temporal variability of the Noah-MP simulations. These results demonstrate that the emulator possesses sufficient precision to capture the complex relationships between meteorological forcing, model parameters, and the resulting Noah-MP outputs, making it a reliable tool for subsequent model calibration.
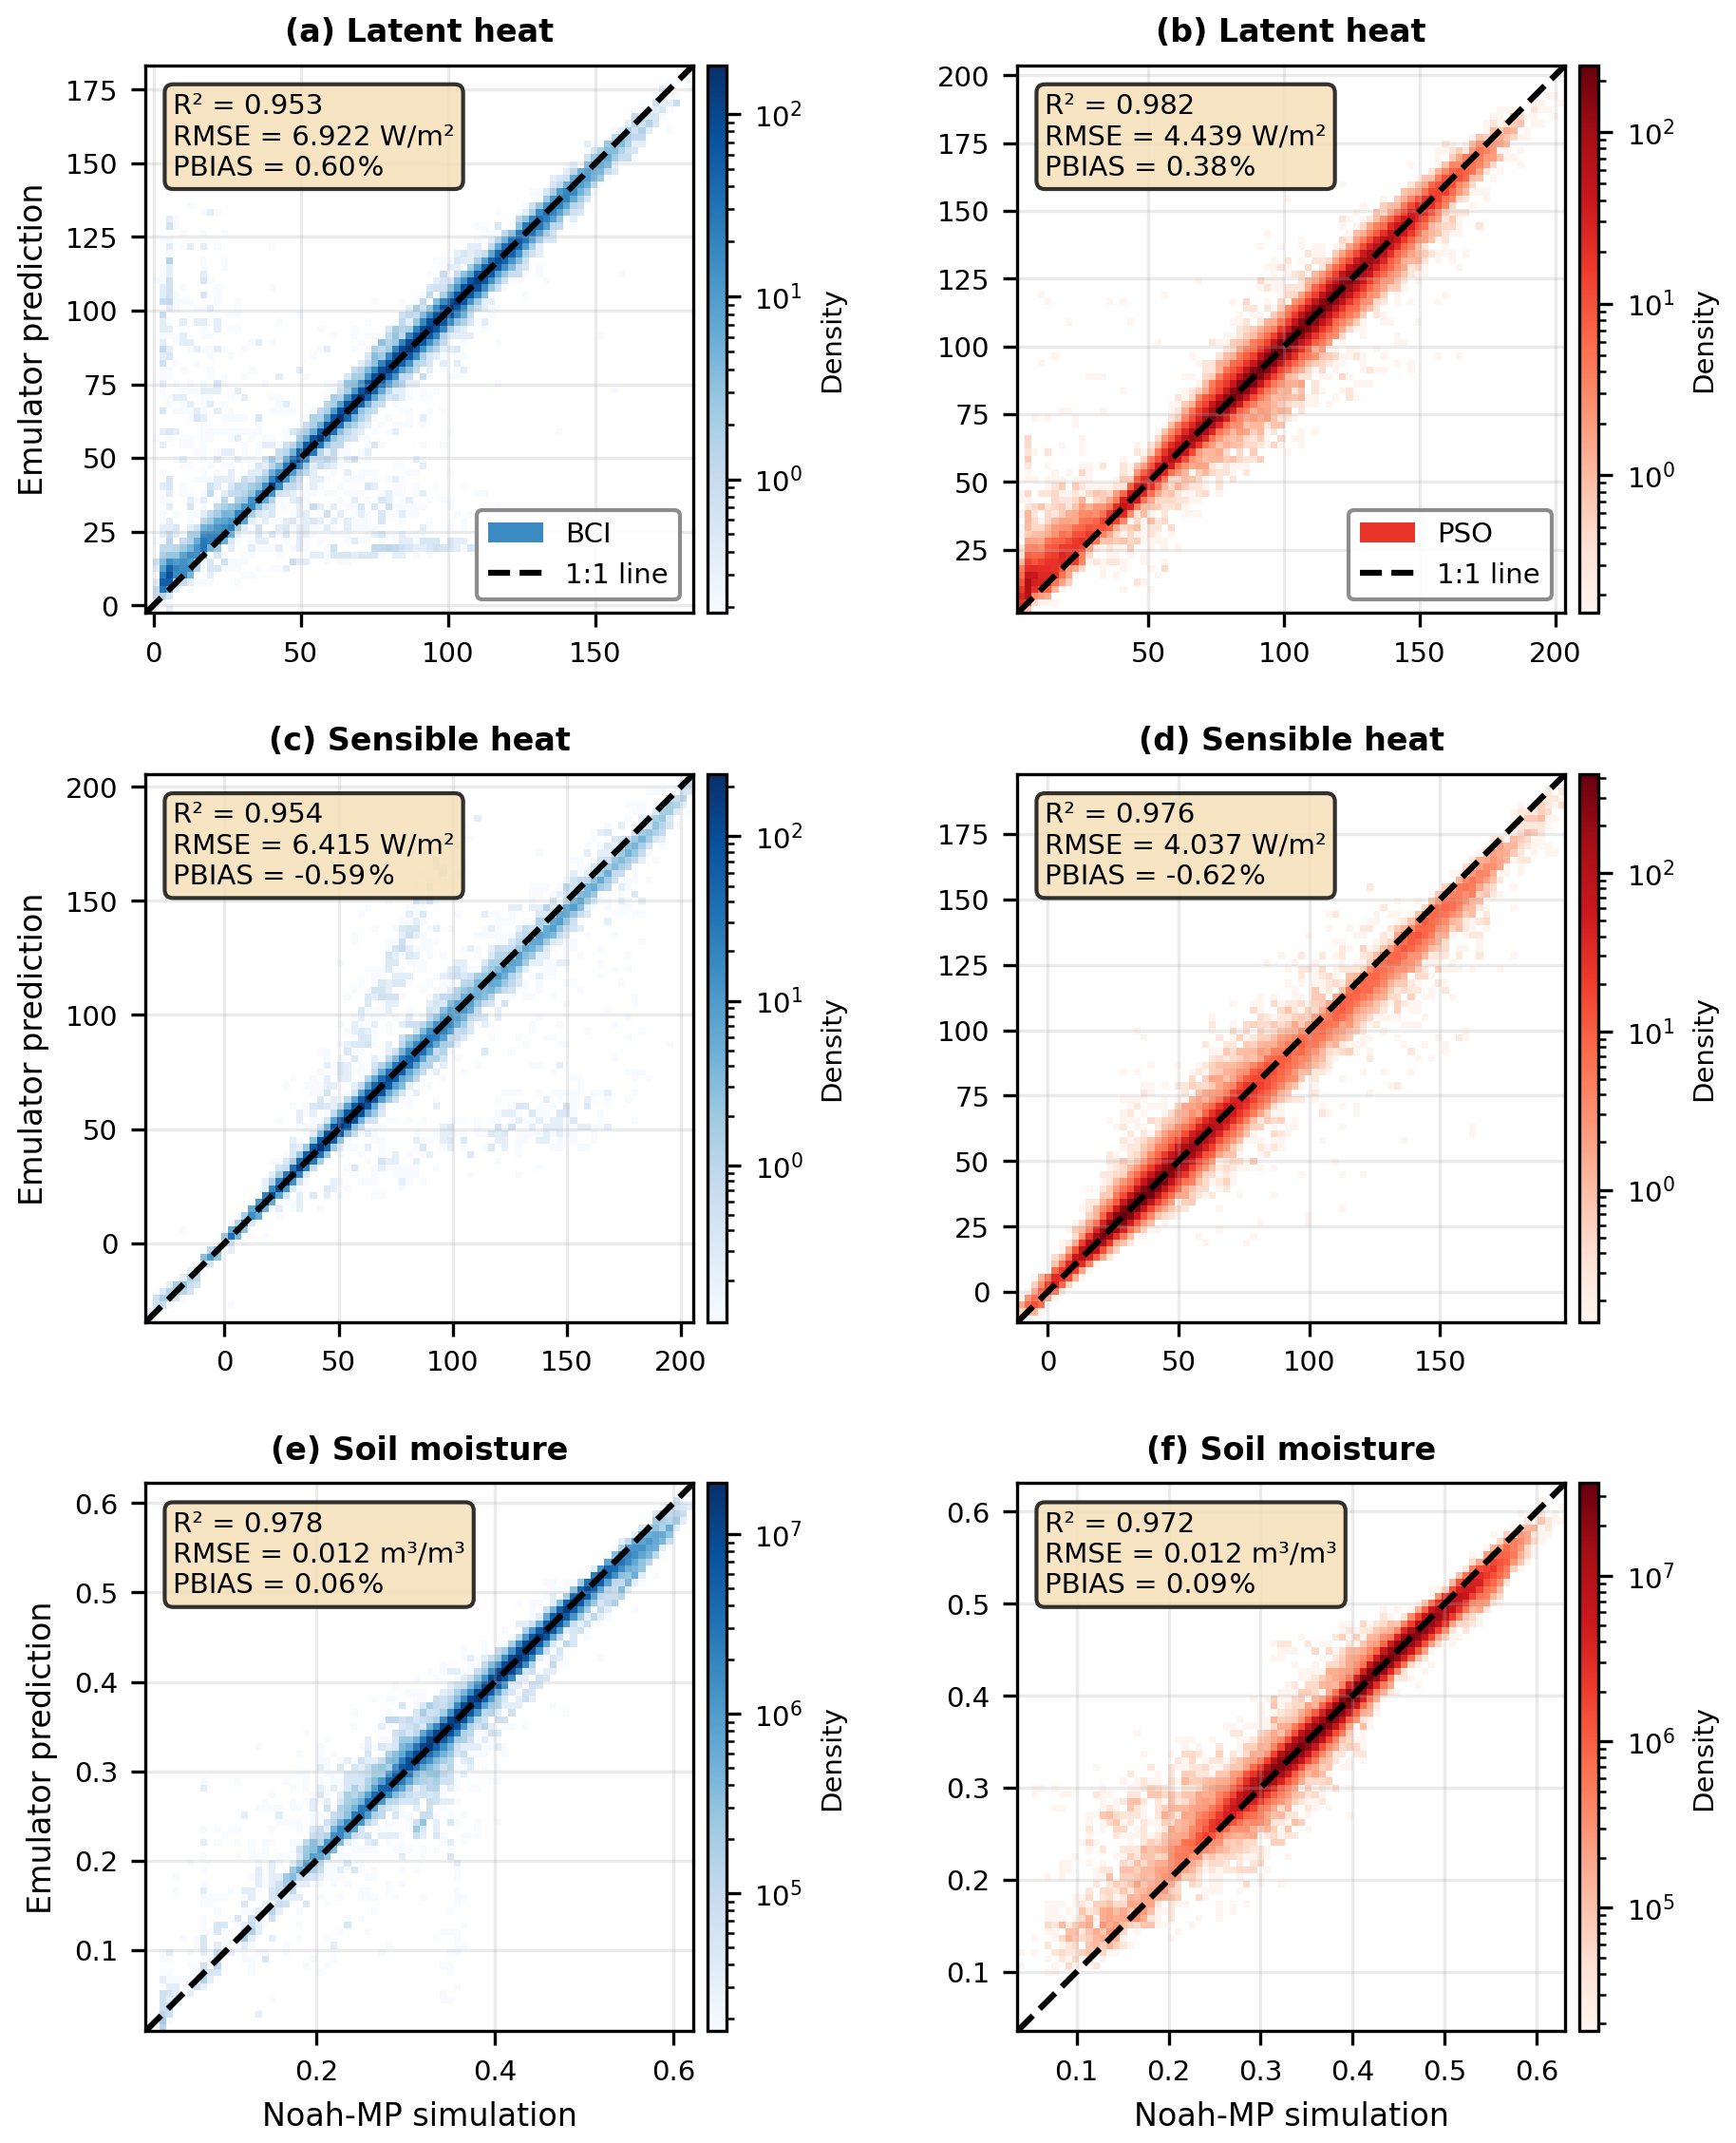
Figure 3Evaluation of the trained Noah-MP emulator for the three primary target variables (a, b) latent heat, (c, d) sensible heat, and (e, f) soil moisture at the Panama BCI site (a, c, e) and the Malaysia PSO site (b, d, f).
3.2 Model performance in simulating energy and water fluxes
3.2.1 Panama tropical forest site
Calibration and contribution analysis results
Different model parameters exert distinct influences on energy and water cycling processes (Table 3). At the Panama BCI tropical forest site, we find that the most important parameter for LH and SH is the maximum rate of carboxylation at 25 °C (VCMX25) (Table 3). VCMX25 controls the photosynthesis rate and stomatal conductance, and thereby also plays a dominant role in regulating carbon assimilation and evapotranspiration. The calibrated VCMX25 value (114.6 µmol CO2 m−2 s−1) is consistent with values reported for Panama BCI tropical forests in previous studies (Cheng et al., 2024b).
Table 3Default and calibrated parameter values, along with parameter importance rankings, at the Panama BCI tropical forest site.
While VCMX25 modulates both heat fluxes primarily through its influence on LH, with corresponding effects on SH via surface energy partitioning, MAXSMC and REFSMC also play a key role in regulating LH and SH, as they determine the soil water storage available for plants to uptake. In addition, Z0MVT directly regulates above-canopy SH flux, which induces a latent heat response by cooling the land surface.
Daily-scale performance
The calibration substantially improves SH simulation at the daily scale during both the calibration and validation periods, demonstrating the effectiveness of the calibrated parameters (Fig. 4, Table 4). Specifically, during the calibration period, the mean bias of SH decreases from 30.6 W m−2 under the default parameterization to 17.4 W m−2 under the calibrated parameterization. During the validation period, the mean bias of SH decreases from 34.9 to 19.0 W m−2. However, this improvement comes with a trade-off in LH performance: over the full period, the mean bias of LH increases from 5.6 W m−2 for the default parameterization to 19.7 W m−2 for the calibrated parameterization, and R2 for LH decreases from 0.80 to 0.65 (Table 4). Nevertheless, the gains in SH are substantial, with mean bias decreasing by 44 % (from 32.7 to 18.3 W m−2) and R2 increasing from 0.63 to 0.84 over the full period. In addition, the R2 under the calibrated parameterization remains stable between the calibration (0.87) and validation (0.81) periods.
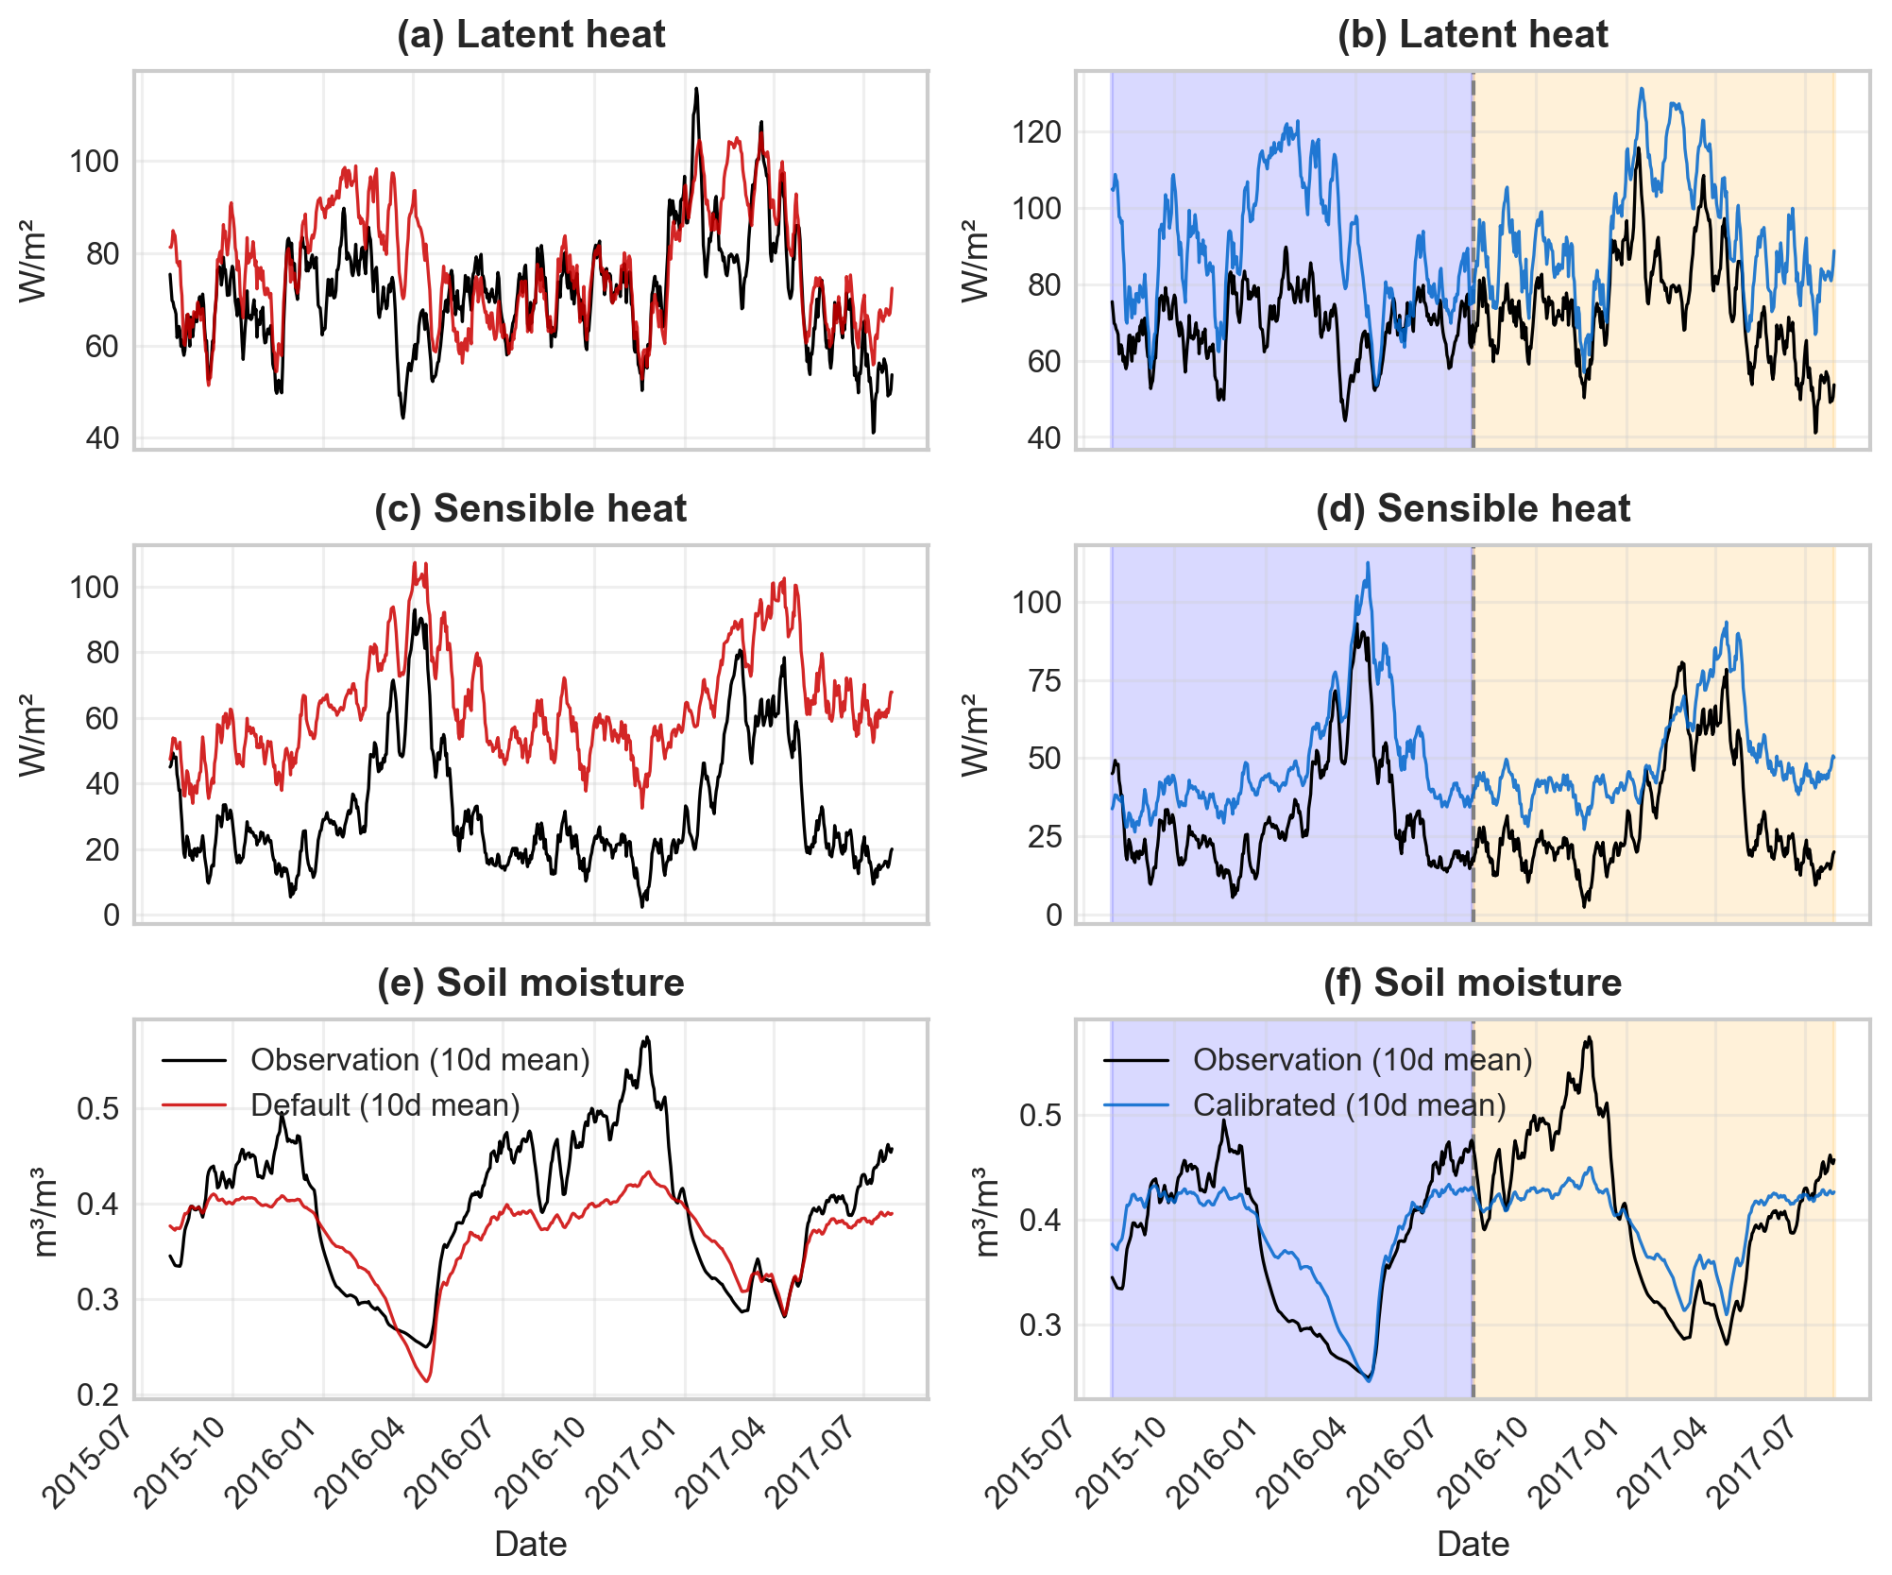
Figure 4Observations (black line) and daily Noah-MP simulation results at the Panama BCI tropical forest site for (a, b) latent heat, (c, d) sensible heat, and (e, f) soil moisture, using default parameters (a, c, e, red line) and calibrated parameters (b, d, f, blue line). The data are separated into calibration (purple background) and validation (yellow background) periods in panels (b), (d), and (f). Both simulated and observed time series are plotted as 10 d running means for clarity.
Table 4Performance metrics (RMSE, MAE, BIAS, and R2) of simulation results at the Panama BCI tropical forest site for latent heat (LH), sensible heat (SH), and soil moisture (SM), using default and calibrated parameters during calibration, validation, and full periods with the original Noah-MP model.
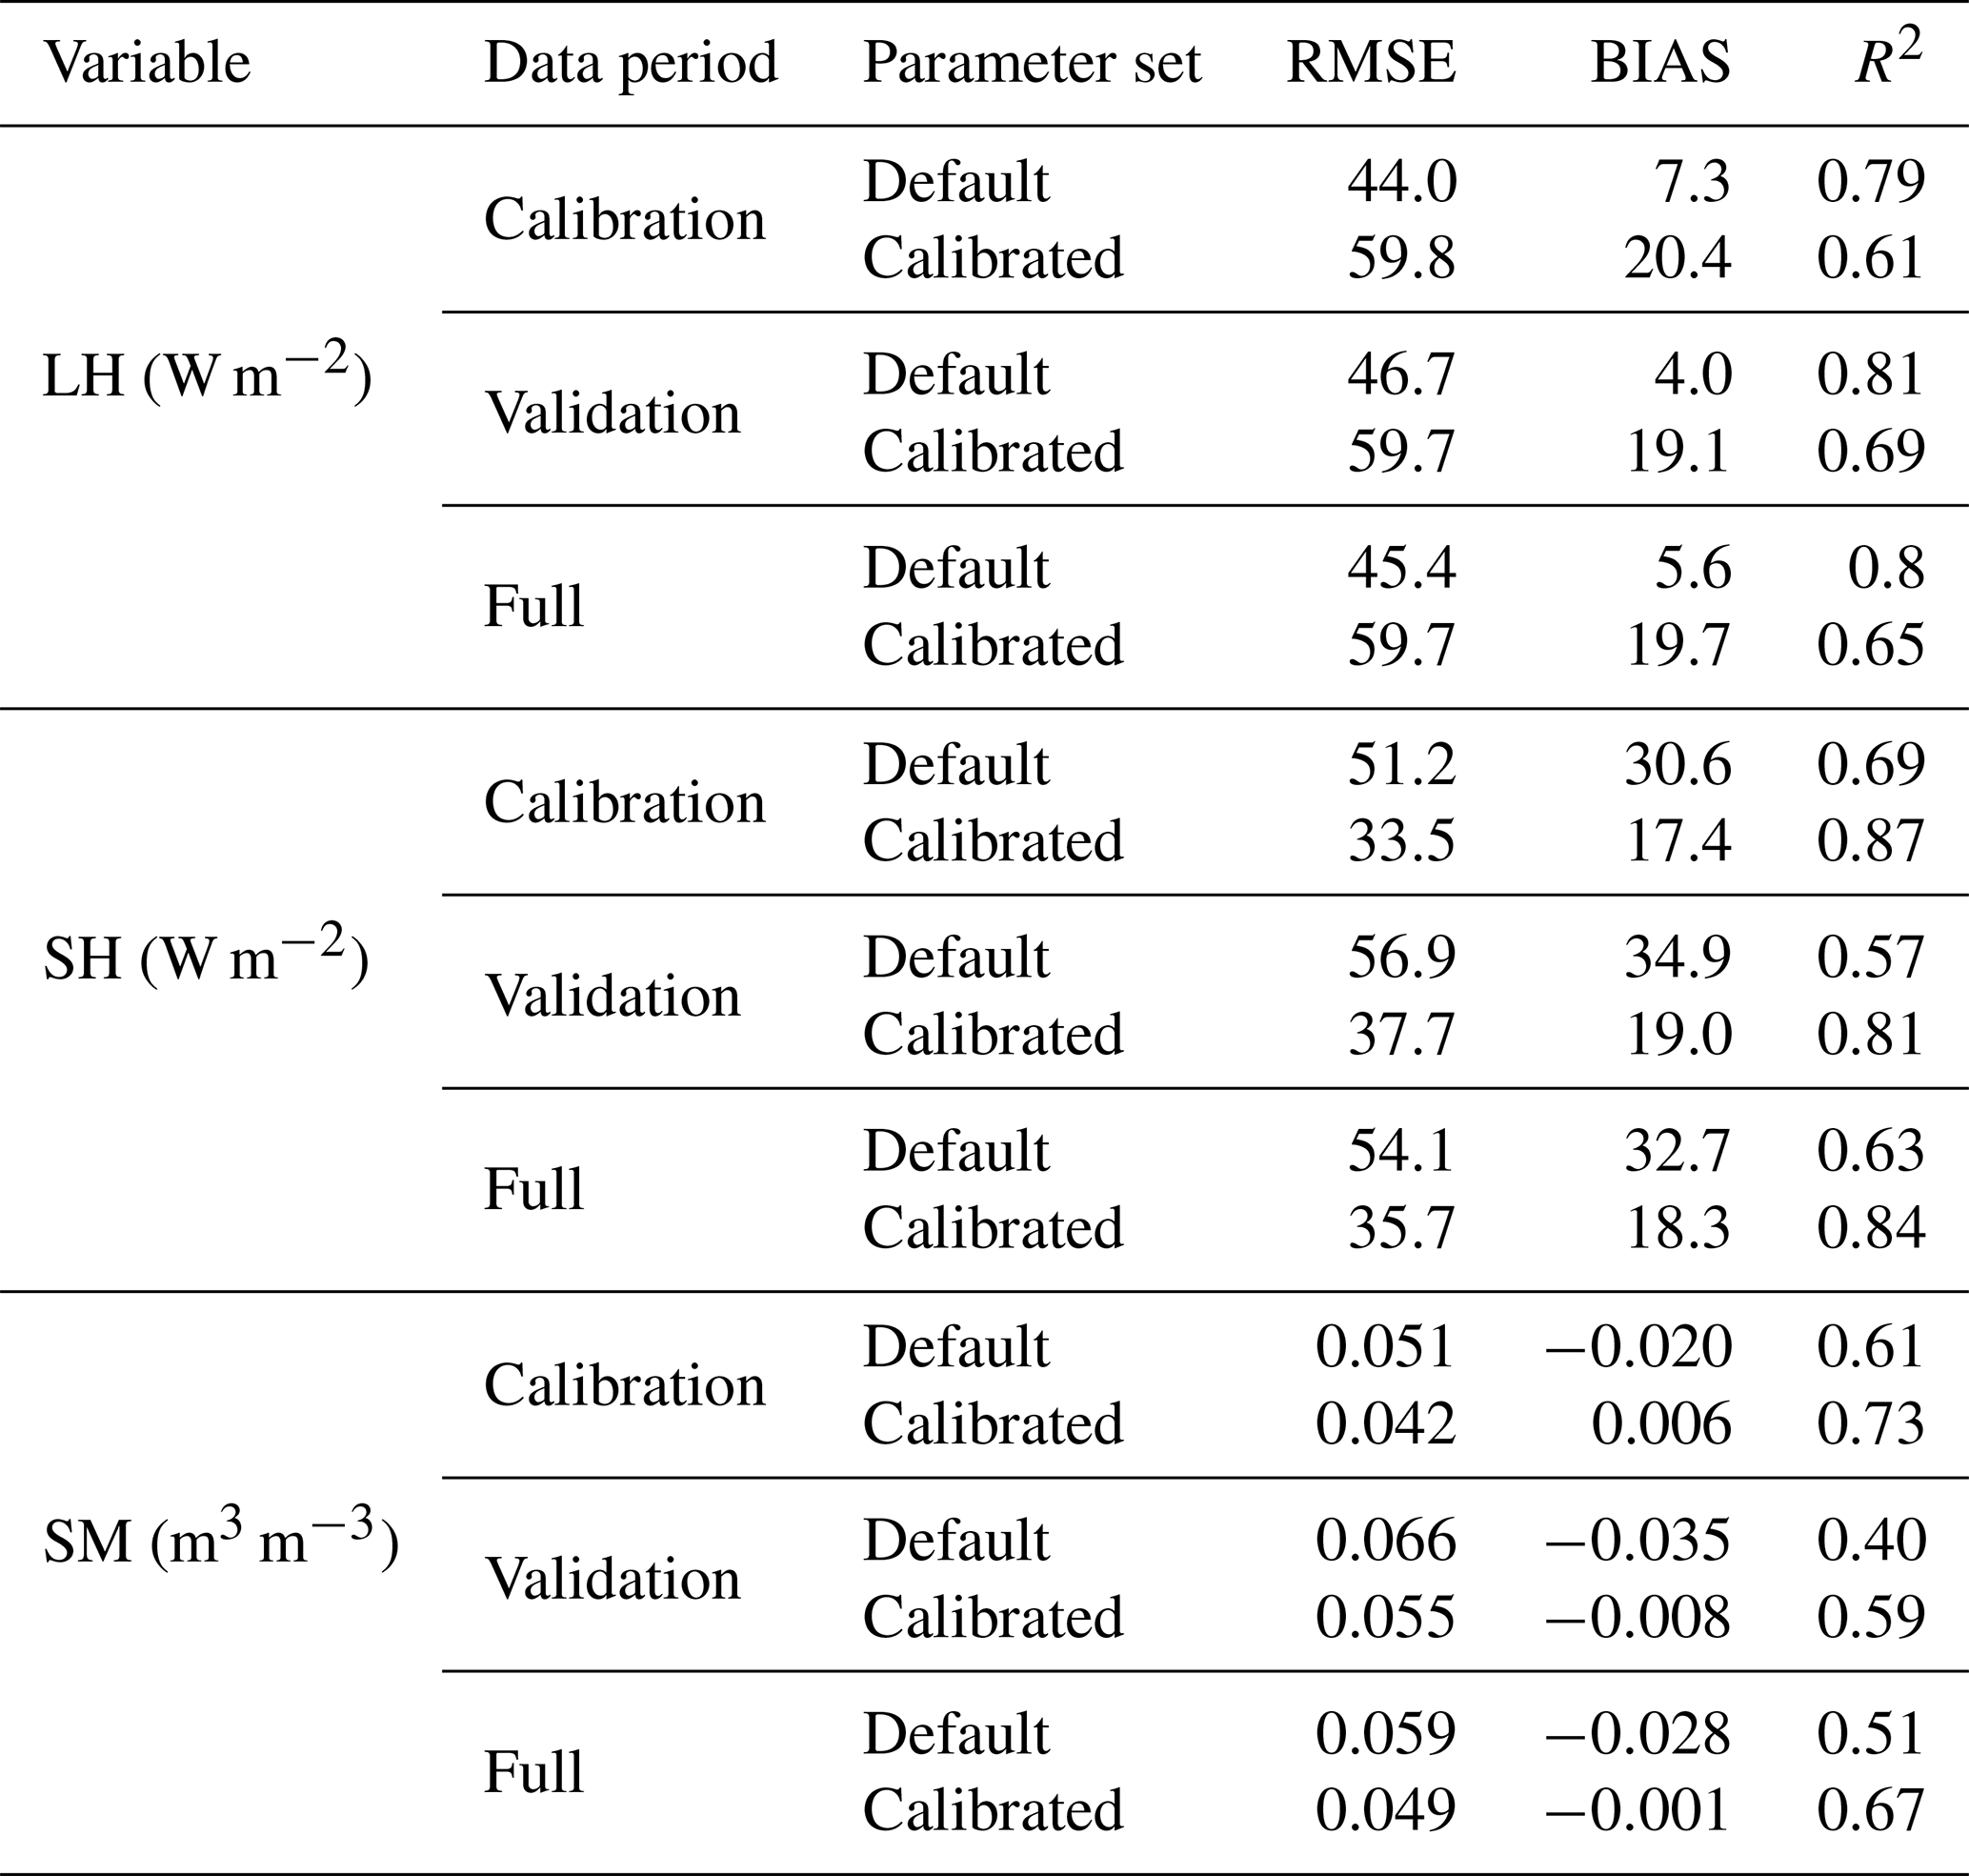
The calibrated parameters improve the simulation of daily soil moisture at the Panama tropical forest site during both the calibration and validation periods (Fig. 4, Table 4). During the calibration period, the mean bias decreases from −0.020 m3 m−3 for default parameterization to 0.006 m3 m−3 for calibrated parameterization, while during the validation period it decreases from −0.035 to −0.008 m3 m−3. Over the full period, the mean bias decreases from −0.028 to −0.001 m3 m−3. RMSE decreases by 16.9 %, from 0.059 to 0.049 m3 m−3, with reductions of 17.6 % during calibration and 16.7 % during validation. R2 values increase from 0.51 under the default parameterization to 0.67 under the calibrated parameterization, rising from 0.61 to 0.73 during calibration and from 0.40 to 0.59 during validation (Table 4).
Seasonal and diurnal-scale performance
Beyond the daily scale, Noah-MP effectively captures the seasonal and diurnal dynamics of surface energy and water fluxes (Fig. 5). Specifically, it captures the seasonal decline in LH (Fig. 5a) and soil moisture (Fig. 5e), as well as the corresponding peak in SH around April (Fig. 5a). However, the model does not fully capture the peak in soil moisture from September to November (Fig. 5e), consistent with its deficiencies in simulating daily soil moisture peaks during the wet season (Fig. 4f). The underestimated wet-season soil moisture may be caused by the deficiencies in subsurface water transport representation, such as the absence of preferential flow simulation in Noah-MP, which is known to govern seasonal sub-surface fluxes of water in tropical rainforests by rapidly transporting water downward (Cheng et al., 2017, 2018, 2019). Preferential flow paths generated by tree root penetration, termite activity, earthworm burrows, or other soil microporosity significantly alter the partitioning of water and energy, affecting not only runoff, but also water storage and plant water uptake in tropical forests. Therefore, their absence in Noah-MP could be an important source of structural error which would further hinder calibrations based on heat fluxes. This critical process has received insufficient attention in the context of land surface modelling and deserves future model development efforts.
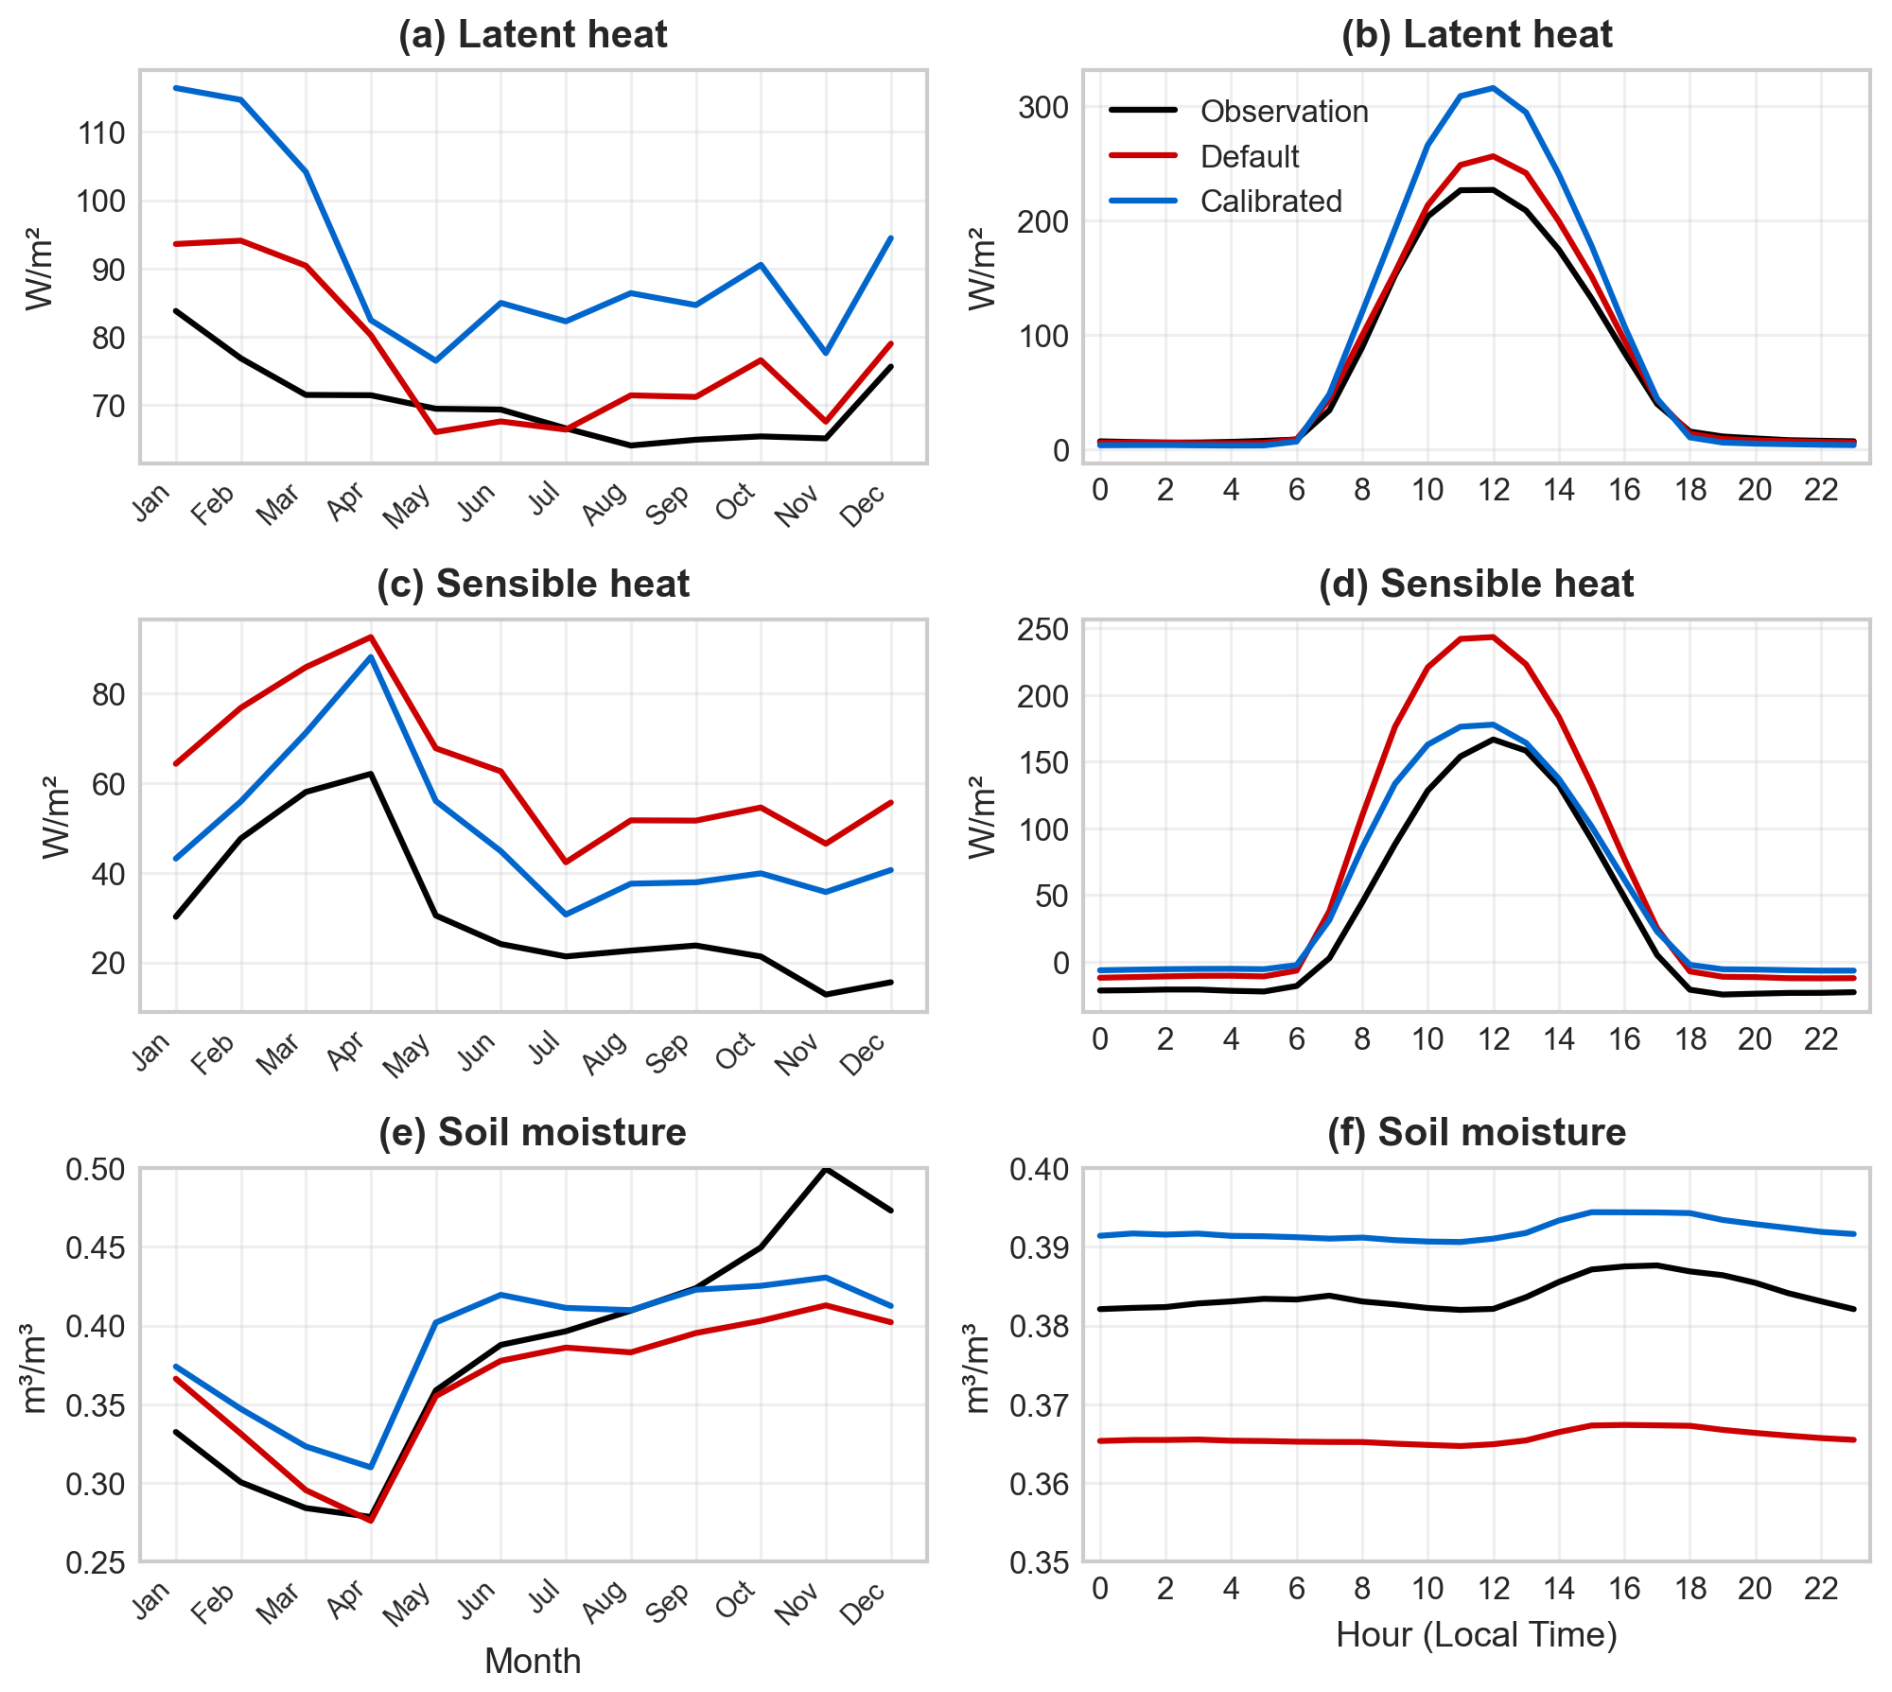
Figure 5Observation (black line) and Noah-MP simulation results at the Panama BCI tropical forest site for (a, b) atent heat, (c, d) sensible heat, and (e, f) soil moisture, using default parameters (red line) and calibrated parameters (blue line) for seasonal (a, c, e) and diurnal (b, d, f) cycles.
The trade-off in optimizing LH and SH at the daily scale (Fig. 4) also persists at the seasonal and diurnal scales (Fig. 5). LH overestimation is most pronounced between January and April, as the dry season develops but simulated LH remains relatively high. We note from Fig. 4e and f that the dry down of soil moisture at these times of year is poorly captured, with both the calibrated and uncalibrated models overestimating soil moisture, which may contribute to LH biases. Additional factors include potential biases in downward solar radiation measurements from the flux tower. If it is overestimated, this could contribute to the overall overestimation of both latent and sensible heat fluxes.
Another possible source of the discrepancy between calibrated LH and SH may be Noah-MP's inability to simulate forest functional diversity, which are prevalent in tropical forests and critical for capturing forest response to environmental variability (Cheng et al., 2024b). Addressing this limitation may require the use of more advanced ecosystem demography models to better capture the interactions of multi-species coexistence in tropical ecosystems.
The model persistently overestimates nighttime SH (Fig. 5d), corresponding to overestimated nighttime soil temperatures (Fig. S5). This discrepancy likely stems from the absence of a soil organic layer parameterization in Noah-MP. Organic layers, with low thermal conductivity and high heat capacity, buffer both daytime heating and nocturnal cooling. Without this buffering effect, the model likely exaggerates diurnal soil temperature amplitudes, inflating both daytime peaks and nighttime minima. This structural limitation, recognized in previous evaluations (Zhang et al., 2021), contributes to systematic SH biases and highlights a priority area for future model development.
3.2.2 Malaysia tropical forest site
Contribution analysis results
The single most important parameters for calibrating LH and SH at the Malaysia PSO tropical forest site are VCMX25 and WLTSMC, due to their roles in controlling photosynthesis and soil water availability (Table 5). Other soil parameters, including WLTSMC and SATDK, also strongly influence Noah-MP simulations of energy and water fluxes by regulating the amount of soil moisture available for plant uptake. LAI is prescribed based on site measurements rather than calibrated, but it is also important for both H and SH due to its role in controlling vegetation phenology.
Table 5Default and calibrated parameter values, along with parameter importance rankings, at the Malaysia PSO tropical forest site.
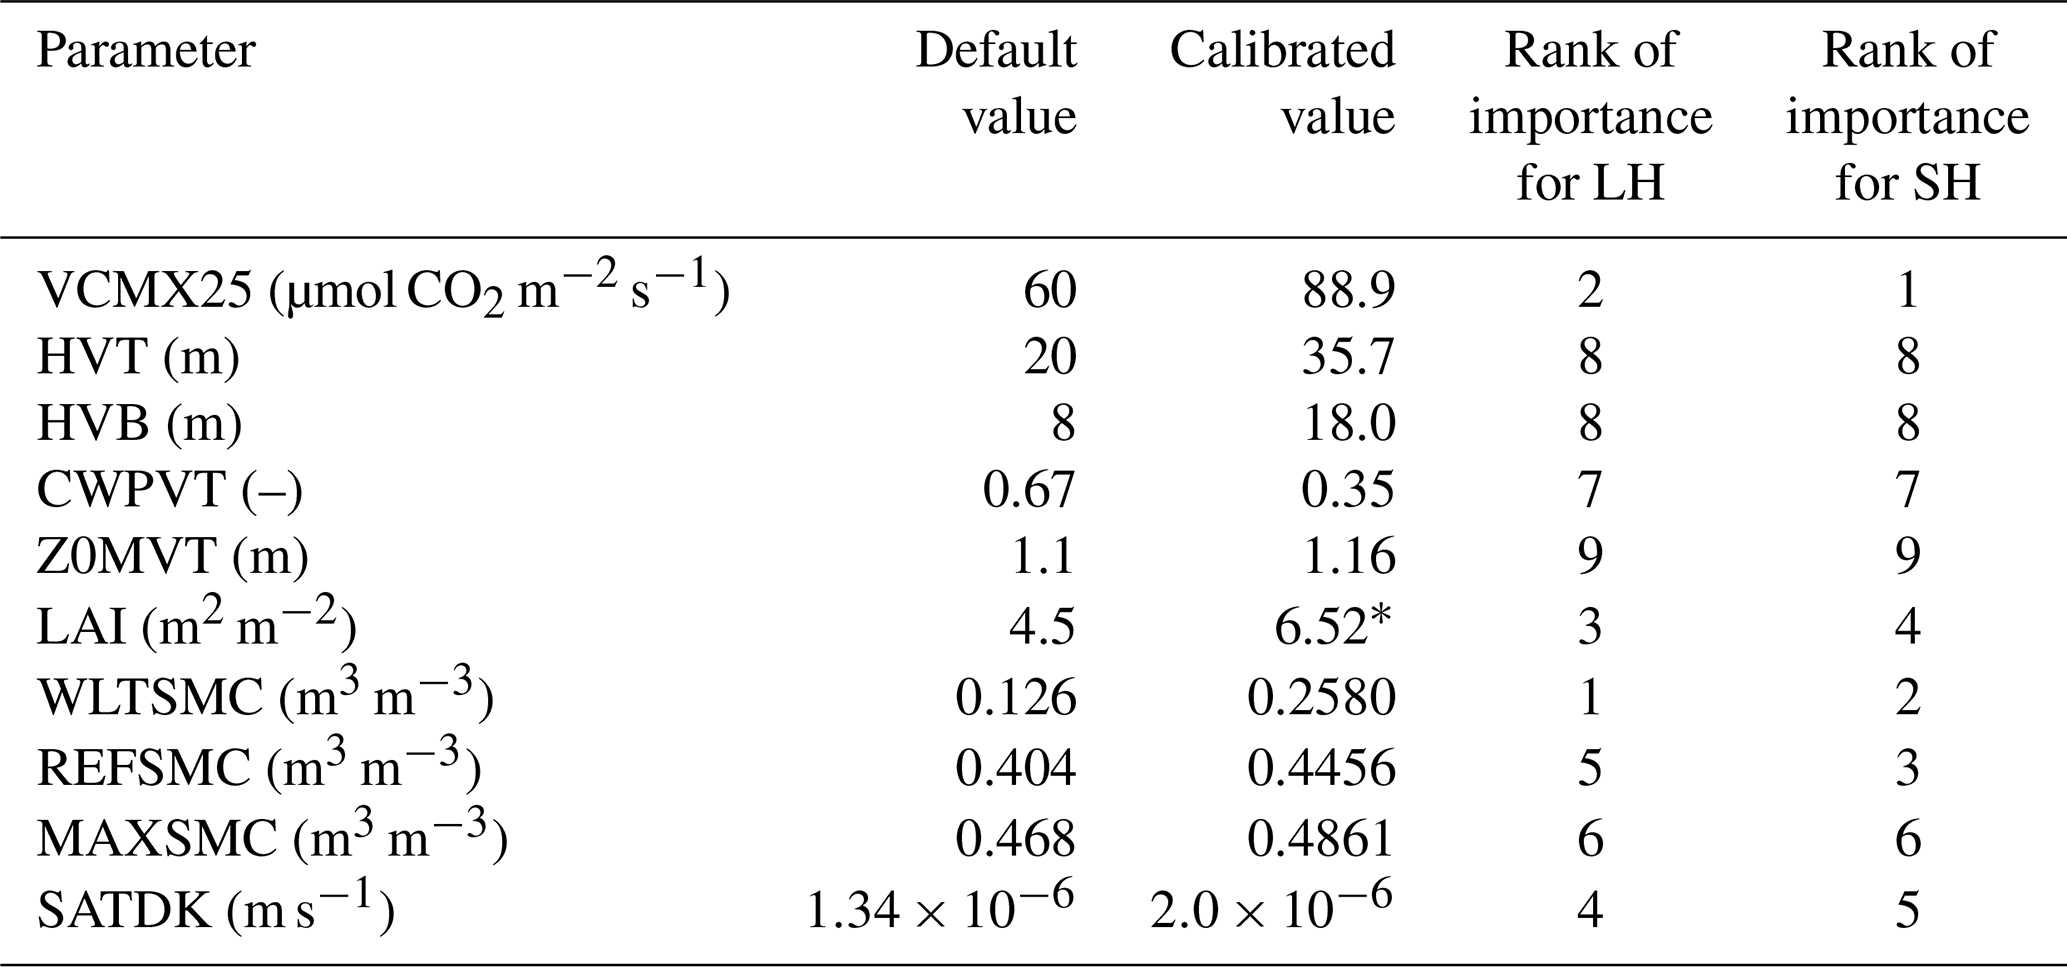
* The modified LAI value of 6.52 m2 m−2 is adopted from field observation at the PSO site (Kosugi et al., 2012) and is prescribed prior to the calibration process rather than being calibrated.
Daily-scale performance
The calibrated parameters substantially improve the simulation of daily energy and water fluxes at the Malaysia PSO tropical forest site, during both the calibration and validation periods (Fig. 6, Table 6). Unlike the Panama BCI site, where improvements in latent and sensible heat exhibit a trade-off, calibration at the PSO site leads to simultaneous improvements in both fluxes. During the calibration period, the mean bias of LH decreases from −14.2 W m−2 under the default parameterization to -8.4 W/m2 after calibration, while mean bias of SH decreases from 7.6 to 3.3 W m−2. During the validation period, mean LH bias decreases from −10.0 to −2.3 W m−2, and mean SH bias decreases from 5.8 to −0.3 W m−2. Over the full period, the mean bias of LH decreases from −11.7 to −4.7 W m−2, and mean SH bias decreases from 6.5 to 1.2 W m−2.
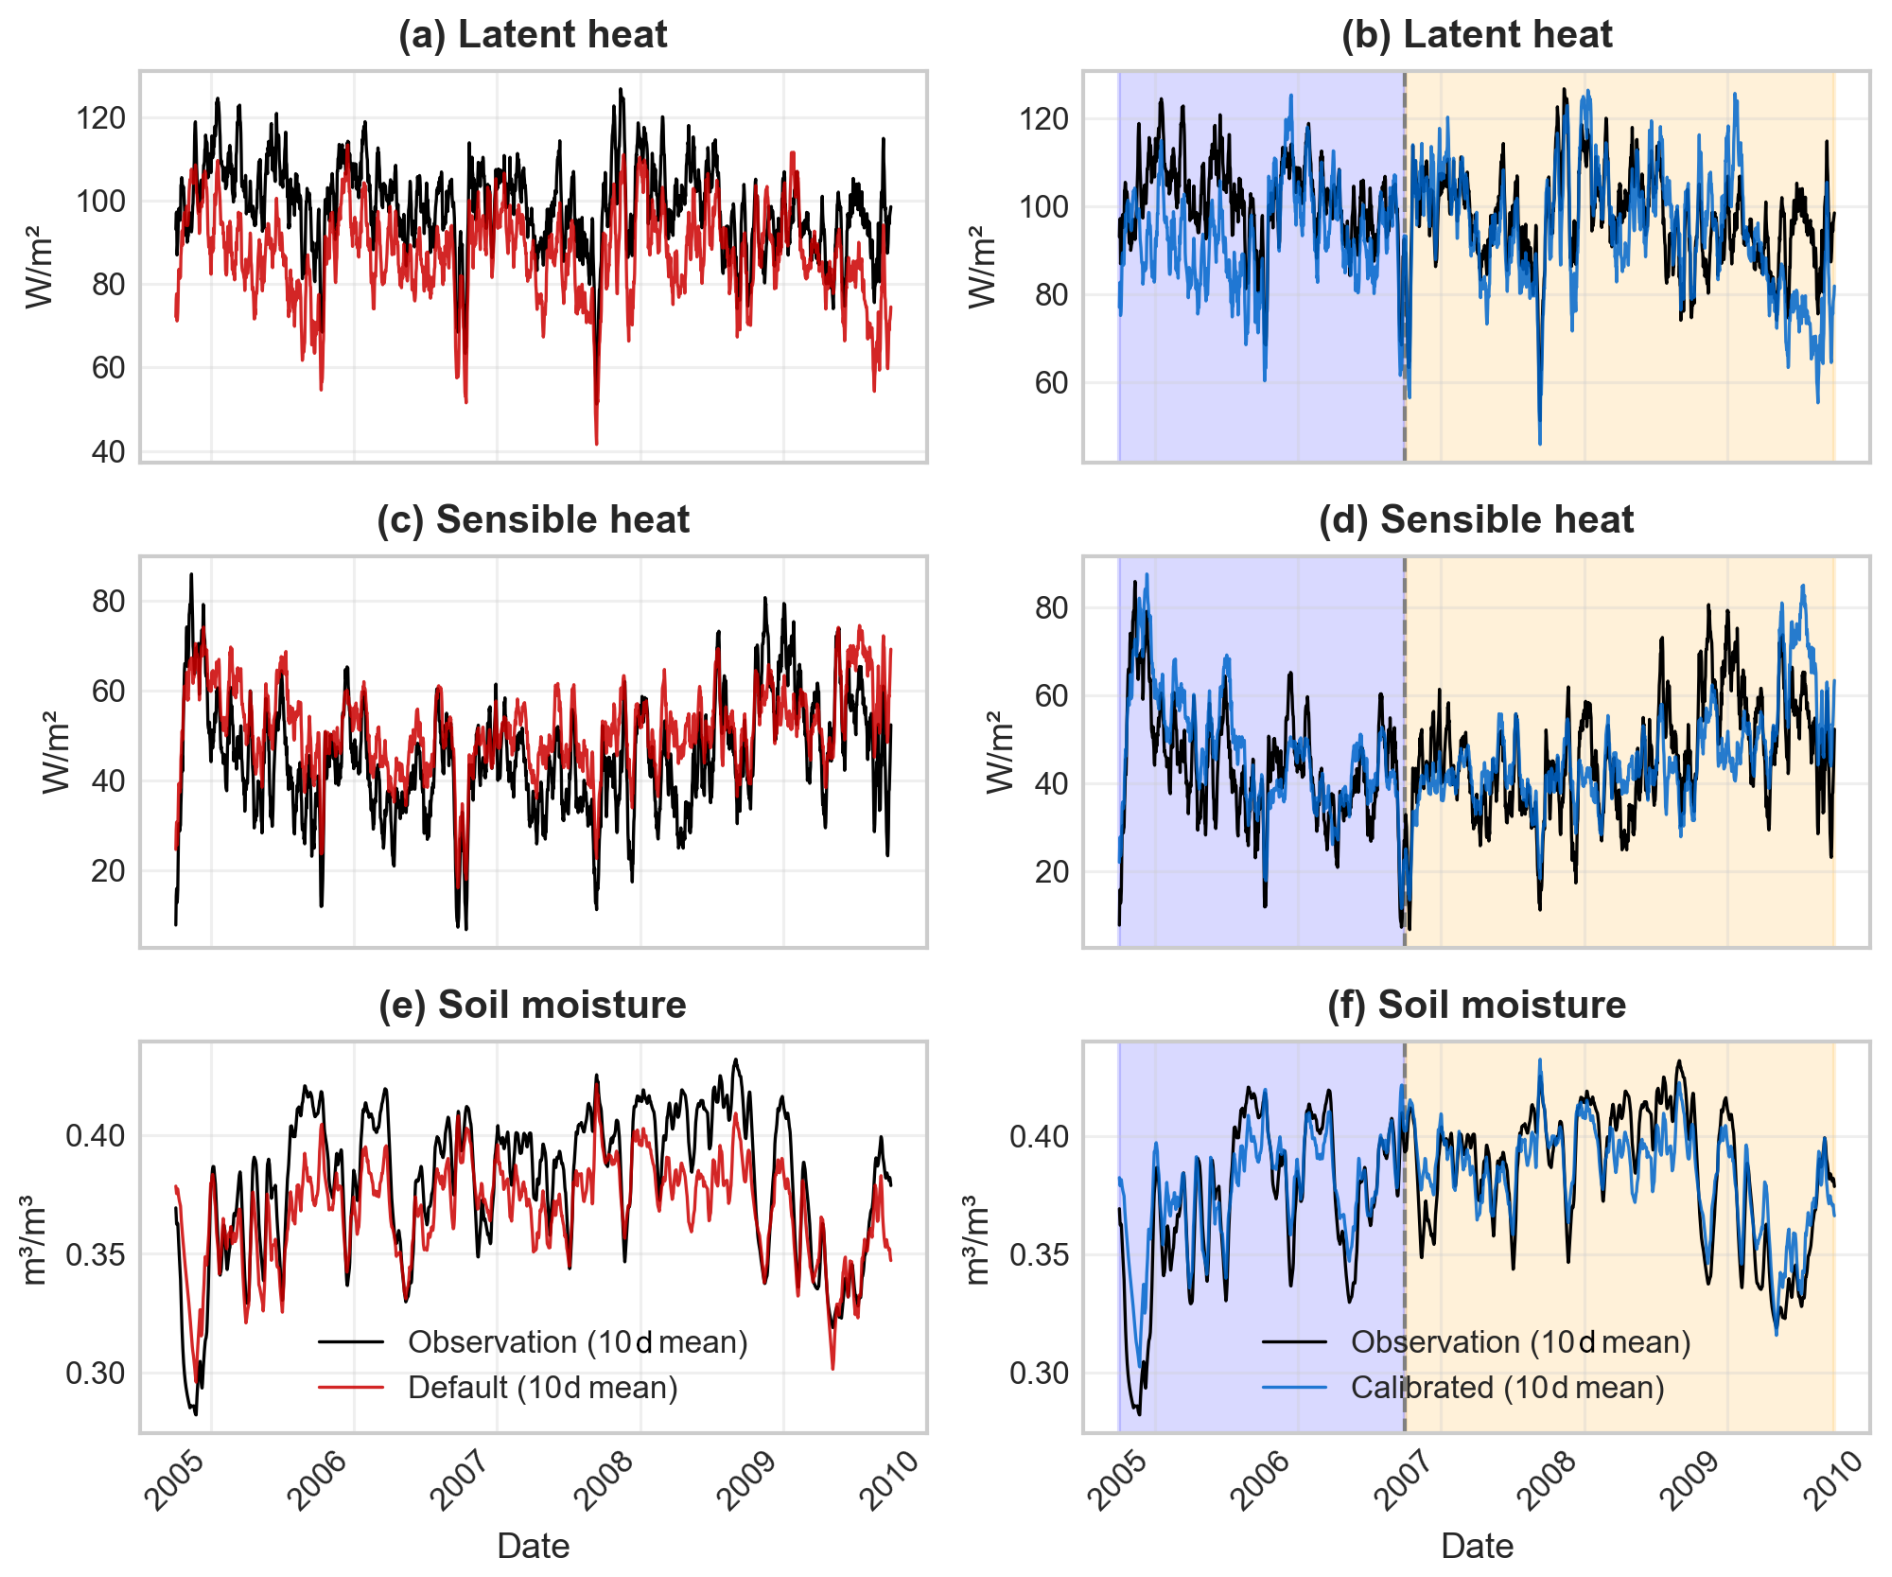
Figure 6Observations (black line) and daily Noah-MP simulation results at the Malaysia PSO tropical forest site for (a, b) latent heat, (c, d) sensible heat, and (e, f) soil moisture, using default parameters a, c, e, red line) and calibrated parameters (b, d, f, blue line). The data are separated into calibration (purple background) and validation (yellow background) periods in panels (b), (d), and (f). Both simulated and observed time series are plotted as 10 d running means for clarity.
Table 6Performance metrics (RMSE, MAE, BIAS, and R2) of simulation results at the Malaysia PSO tropical forest site for latent heat (LH), sensible heat (SH), and soil moisture (SM), using default parameters and calibrated parameters during calibration, validation, and full periods with the original Noah-MP model.
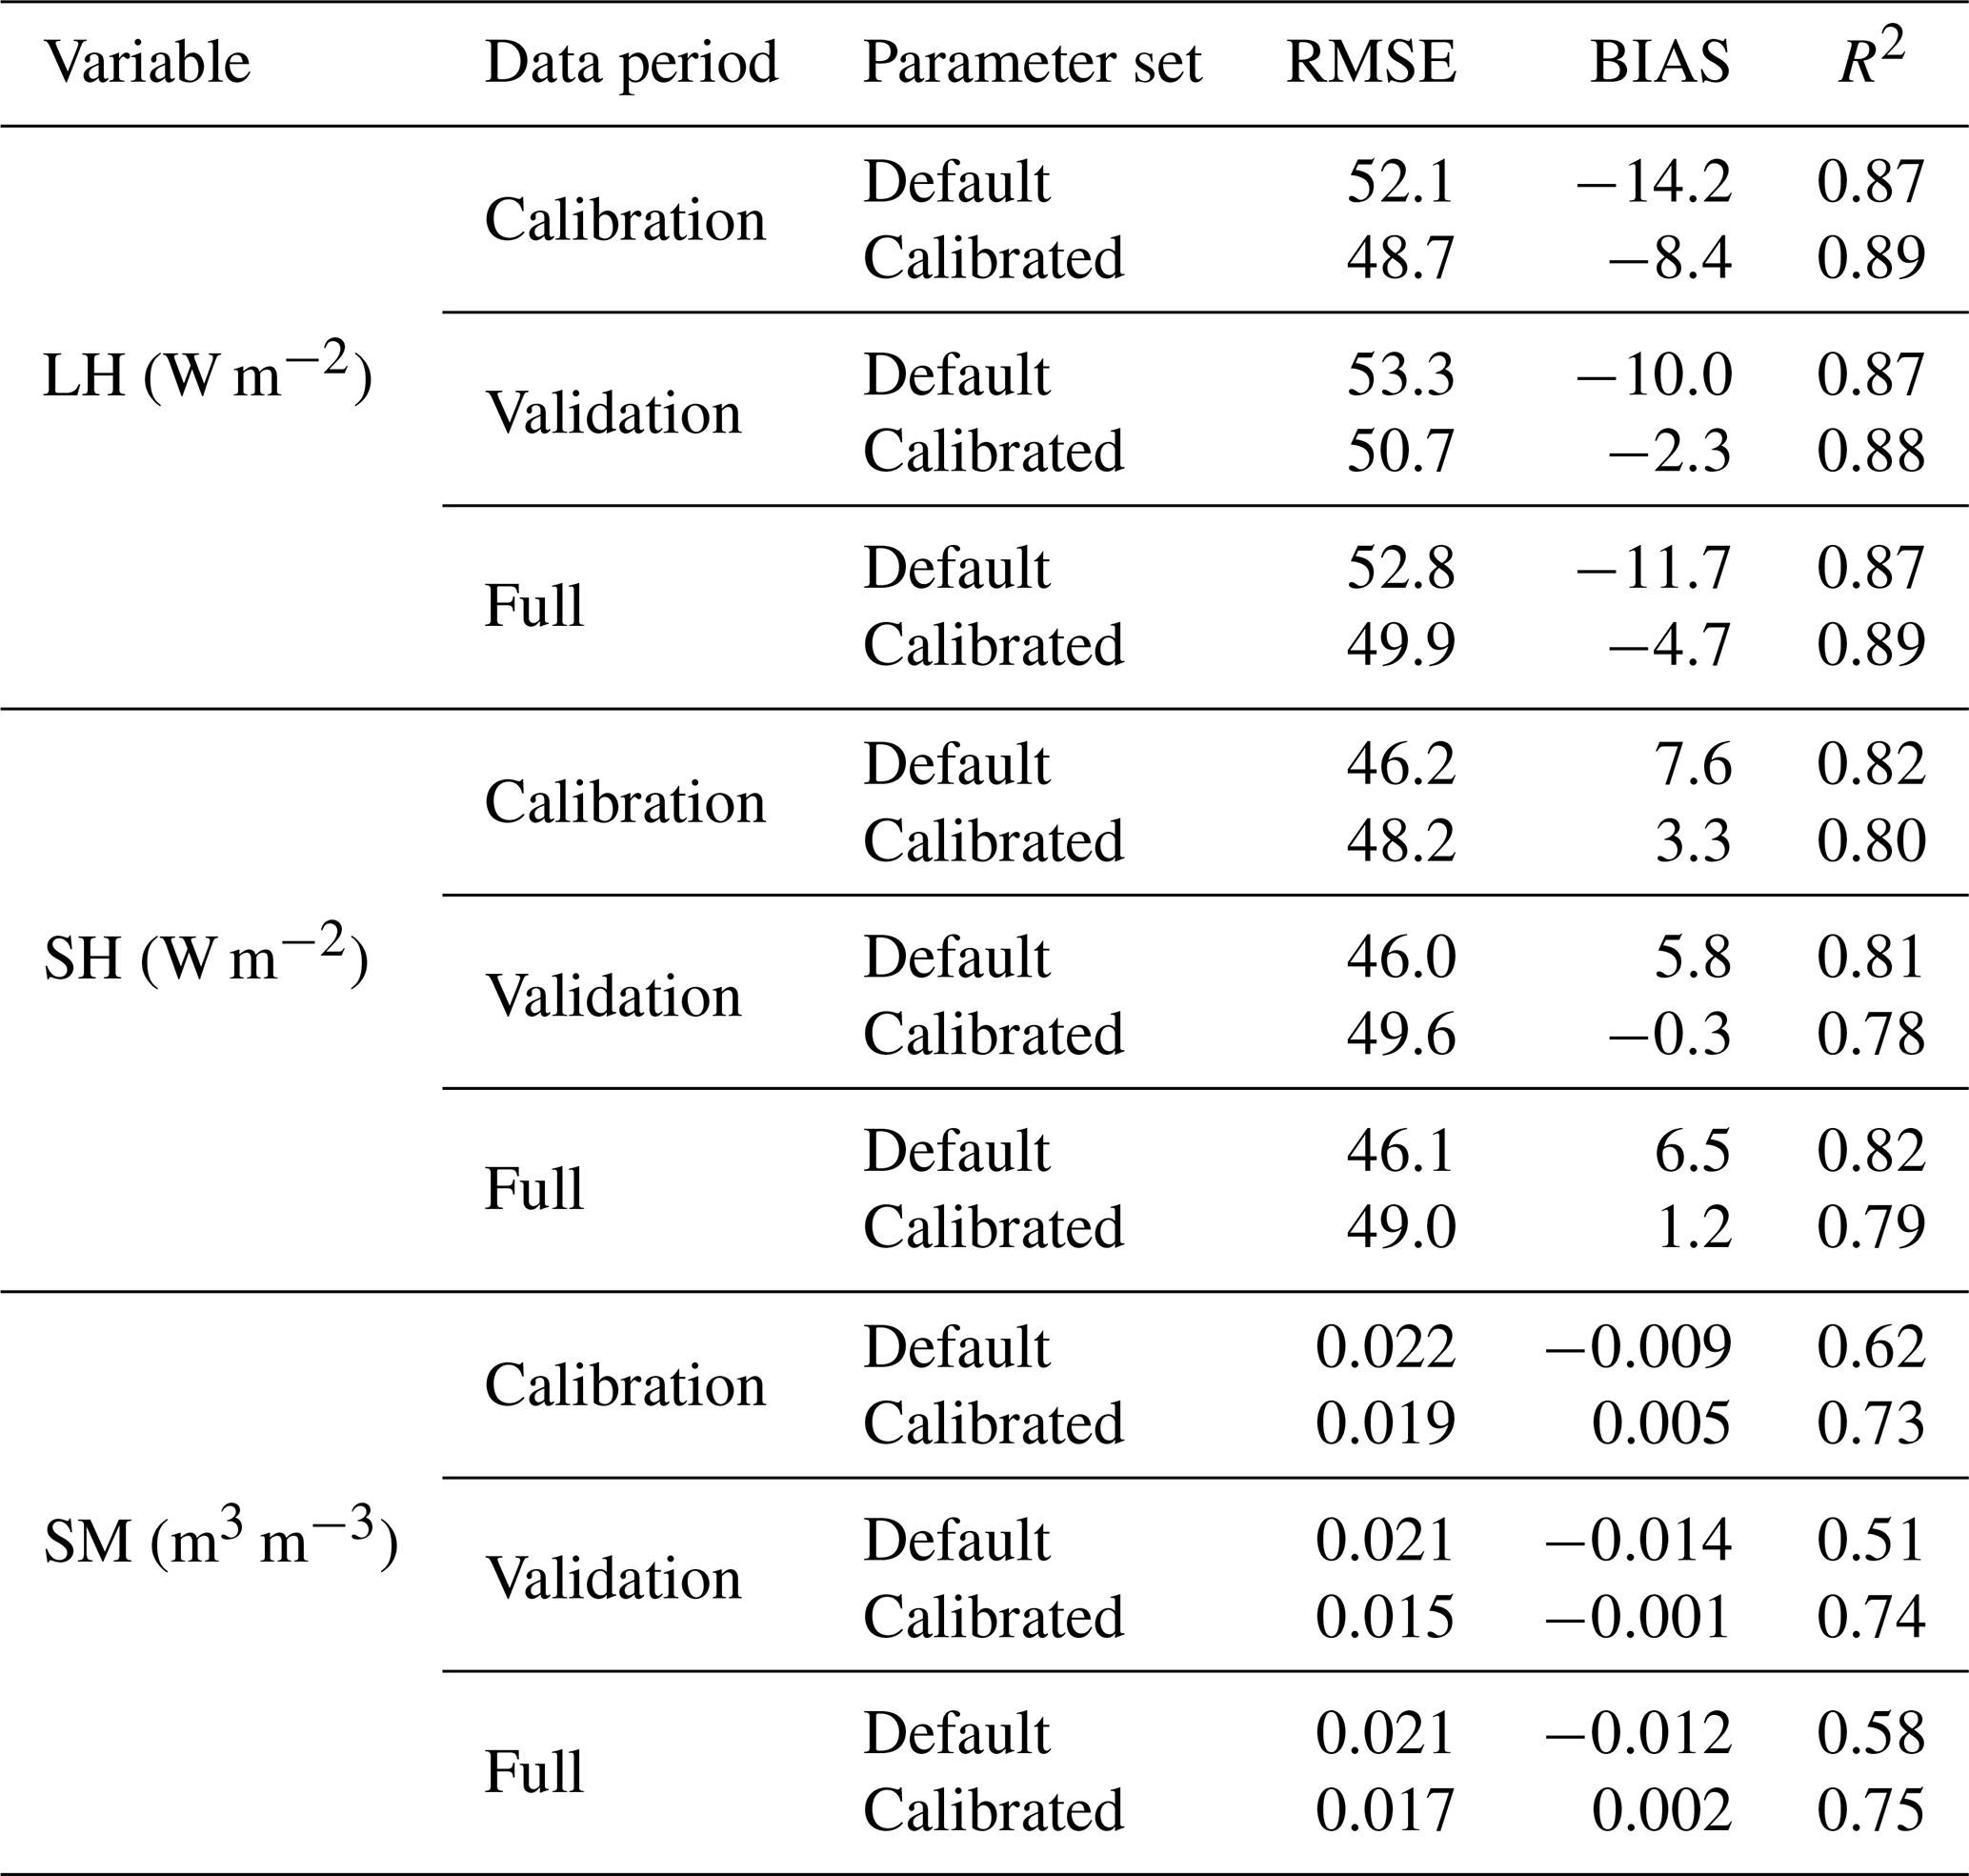
For soil moisture, the emulator-based calibration significantly outperforms the default configuration, particularly during the validation period. The default configuration exhibits reduced stability, with R2 decreasing from 0.62 during the calibration period to 0.51 during validation, while the mean bias increases from −0.009 to −0.014 m3 m−3. In contrast, simulations using calibrated parameter values perform better during the calibration period, achieving a lower RMSE (0.019 m3 m−3 compared to 0.022 m3 m−3 for default parameterization) and a higher R2 (0.73) than default parameterization (0.62). During the validation period, the calibrated configuration not only maintains its predictive skill but further improves, yielding the lowest RMSE of 0.015 m3 m−3 and a stable R2 of 0.74. Overall, calibration attempts can be considered more successful for PSO in Malaysia than for BCI in Panama, possibly because the weaker seasonality at the Malaysia site means that the models do not need to capture distinct wet-dry transitions.
Seasonal and diurnal-scale performance
In addition to daily dynamics, Noah-MP adequately captures both seasonal and diurnal dynamics of energy and water fluxes at the PSO site (Fig. 7). At the seasonal scale, both model configurations capture the decline in LH from April to July and from September to December (Fig. 7a and b). Calibration greatly improves the simulation of LH, by removing a substantial underestimate that is present for all months with the default parameters (Fig. 7a). SH is similarly improved, except between February and April, when the decrease in SH due to calibration leads to an underestimation; however, the seasonal dynamics from May to December are well captured and substantially improved relative to the default parameterization. Soil moisture shows weaker seasonal variability than at the Panama BCI site and is reasonably well captured by both the default and calibrated configurations.
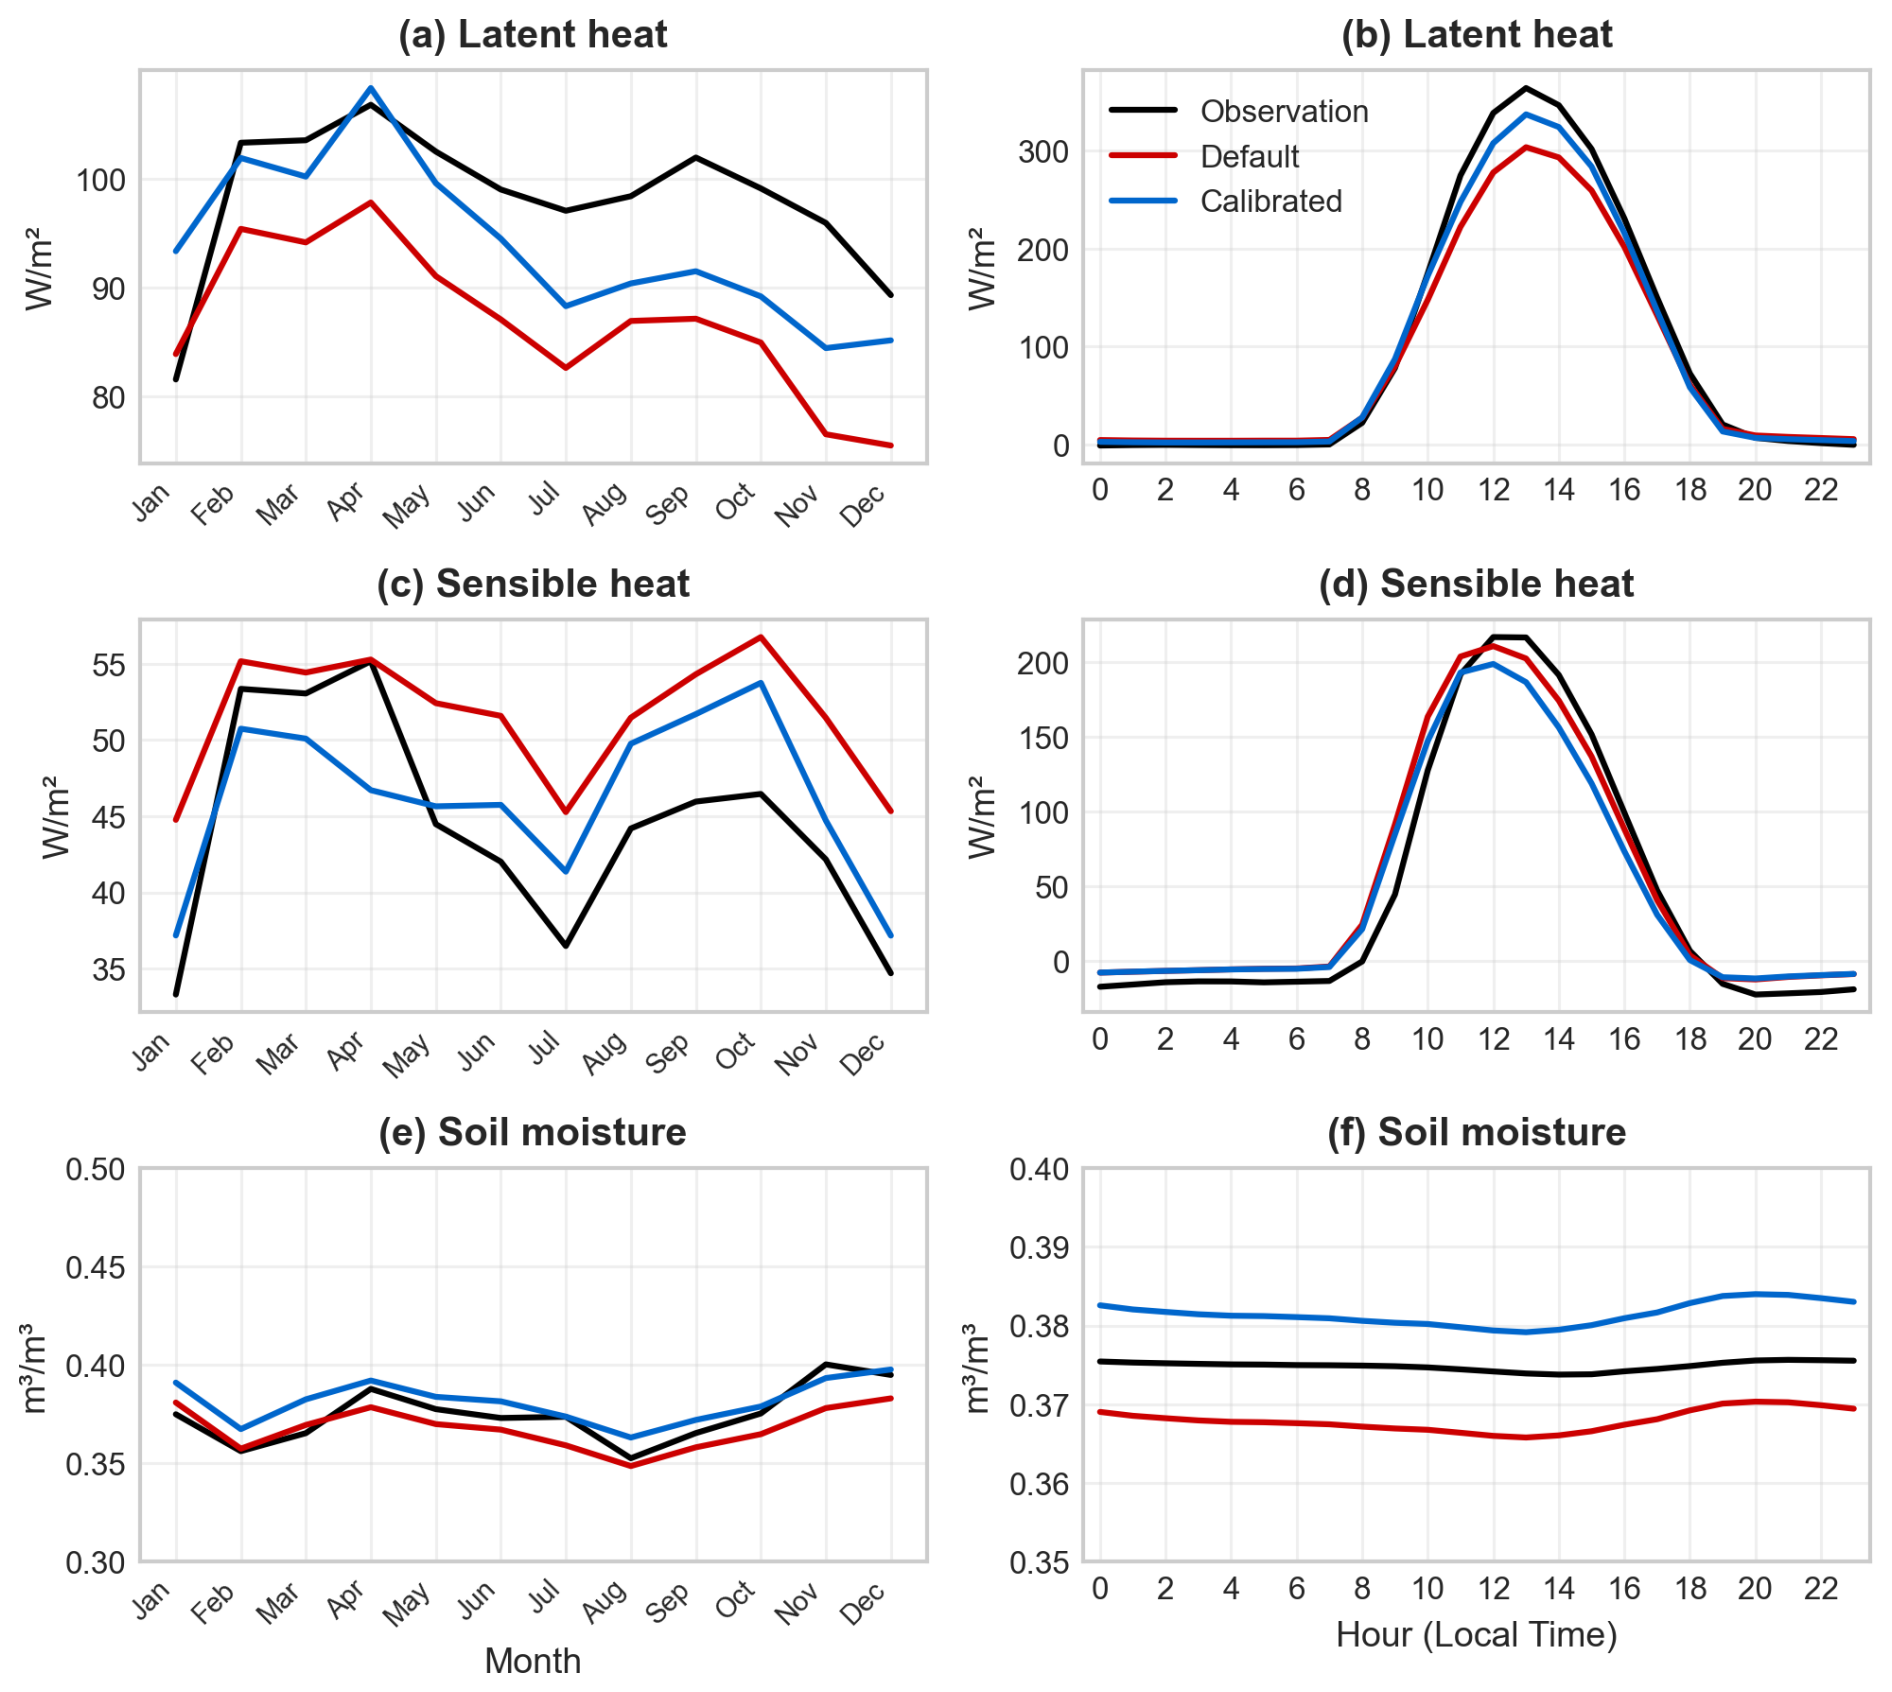
Figure 7Observation (black line) and Noah-MP simulation results at the PSO tropical forest site for (a, b) latent heat, (c, d) sensible heat, and (e, f) soil moisture, using default parameters (red line) and calibrated parameters (blue line) for seasonal (a, c, e) and diurnal (b, d, f) cycles.
At the diurnal scale, Noah-MP with calibrated parameterization better captures the peaks in LH (Fig. 7b) around noon time compared to default parameterization. These improvements indicate that calibration at the daily timescale translates into enhanced model performance at sub-daily scales. Interestingly, for SH, the peak of the diurnal cycle is underestimated after calibration, even though the overall performance on daily and seasonal timescales is improved. This stems from the period from February to April, when the calibrated SH values are further reduced relative to the default, resulting in greater underestimation compared to observations. The variation in model performance in capturing the diurnal cycle across seasons clearly reveals this contrast. Specifically, from February to April, calibration increases the SH mean bias from +1.1 W m−2 (default) to −6.6 W m−2. While in the remaining months, calibration reduces the mean bias from 8.2 W m−2 (default) to 0.02 W m−2.
The notable success of co-calibration of both heat fluxes at PSO in Malaysia, compared to the conflicting results for LH and SH at BCI in Panama, is perhaps due to the large differences in climate and vegetation conditions between the two locations. Specifically, Panama has a tropical monsoon climate (Am), characterized by distinct dry and wet seasons, while Malaysia experiences a tropical rainforest climate (Af), with consistently high rainfall throughout the year. Furthermore, despite receiving less rainfall, the PSO site exhibits higher LH than the BCI site (Table 1), suggesting that structural vegetation differences, such as LAI (represented at PSO by the sensitivity of the model to LAI) and canopy wind effects, are playing a significant role in energy fluxes. For example, the positive LH biases at PSO with default parameters may be partially a result of underestimated damping of in-canopy winds by the relatively denser canopy, in which case calibrating LAI and CWPVT can be expected to improve both LH and SH. As a result, the parameters are not transferable between the two sites.
4.1 Transferability of the emulator-based calibration framework
The generalization and transferability of the calibration framework, including the emulator and optimization strategy, are critical for practical and broader applications. The emulator-based calibration framework developed in this study is inherently flexible and can be applied to any site with available observations. While the current implementation requires constructing a new emulator and performing calibration separately for each site, this workflow remains computationally efficient and scalable compared to traditional calibration approaches. A promising direction for future development is to incorporate static geographical attributes (e.g., elevation, latitude, longitude, soil properties, or vegetation type and properties) as explicit inputs to the emulator. Conditioning the emulator on such spatially specific factors would allow it to better represent spatial heterogeneity and potentially support emulation across multiple locations, reducing the need to retrain site-specific emulators from scratch.
4.2 Parameter transferability across different climate regimes
Parameter transferability is critical for applying Noah-MP across large tropical domains, particularly in regions where site-specific calibration data are unavailable. In this study, we focus on two representative tropical forest sites: the Panama BCI site, which has a tropical monsoon climate (Am), and the Malaysia PSO site, which has a tropical rainforest climate (Af). Results show that parameters calibrated at the Panama BCI site cannot be directly applied to the Malaysia PSO site. This lack of parameter transferability between the two sites suggests that, although the current plant functional type (PFT) framework in Noah-MP captures first-order ecosystem differences, it may be insufficient to represent sub-PFT ecohydrological and physiological heterogeneity in tropical forests, which is critical for accurately simulating soil moisture and surface energy fluxes. Nevertheless, the site-specific calibrated parameter sets perform consistently well during independent validation periods at their respective sites. These findings indicate that, while calibrated parameters are not transferable across sites with different tropical climate regimes, they are potentially transferable among tropical forest sites with similar climate conditions. This finding highlights the potential value of climate regime-based calibration strategies in data-scarce tropical environments. In addition, we identified a consistent set of influential parameters across both sites, particularly those controlling photosynthesis and soil water storage, which could be prioritized for calibration in similar tropical settings.
Beyond site-level calibration, regional calibration offers a practical alternative for parameter estimation across large tropical domains. Instead of relying on parameter sets calibrated at individual locations, which often lack transferability, regional calibration can estimate parameters using multi-site or spatially distributed constraints to estimate parameters more robustly and achieve better performance across the region. The emulator-based framework presented in this study provides a practical foundation for such regional calibration efforts. Where large-scale in situ measurements are scarce, remote sensing products and reanalysis datasets can be leveraged to support regional calibration efforts.
Future work could extend calibration efforts to broader tropical ecosystems, such as peatland forests and mangroves, which have distinct carbon and water cycles. Incorporating these ecosystems into regional calibration frameworks could further improve the accuracy of regional weather forecasts and the reliability of regional climate projections across tropical areas. Such regional calibration efforts would also enhance understanding of land surface processes under the complex tropical climatic and environmental conditions and provide a foundation for applications such as evaluating the climate impacts of land-use change.
4.3 Future model development directions
4.3.1 Inclusion of missing vegetation and soil processes into Noah-MP
Noah-MP's inability to simulate the coexistence of multiple tropical forest species may contribute to discrepancies between calibrated LH and SH. Tropical forests are characterized by high biodiversity, including species with varying ages, sizes, and functional traits. These factors are essential for accurately representing energy, water, and carbon cycling as well as ecosystem functions (Cheng et al., 2024b). Incorporating more advanced ecosystem demography models into Noah-MP would allow for better simulation of these ecosystem dynamics. Additionally, the absence of an organic soil layer can contribute to the model's overestimation of nighttime soil temperatures, highlighting another important area for future development.
4.3.2 Inclusion of missing hydrological processes into Noah-MP
The absence of preferential flow pathways, which are formed by tree roots and earthworm burrows, is another likely source of structural error in Noah-MP. These pathways are prevalent in tropical regions and play a crucial role in rainfall partitioning and hydrological responses (Cheng et al., 2017, 2018). Their exclusion may undermine model calibration efforts for surface heat fluxes. Despite their importance, these processes remain underrepresented in land surface models and should be prioritized in future model improvement efforts. Macropores can be characterized by their size and number, and their distributions are commonly described using normal or log-normal functions (Edwards et al., 1988; Munyankusi et al., 1994; Cheng et al., 2017, 2018). The volumetric flow rate within an individual macropore can be calculated using Poiseuille's law for pipe flow (Sutera and Skalak, 1993; Cheng et al., 2017, 2018). This information provides a basis for future model development efforts to incorporate preferential flow pathways into Noah-MP.
4.4 Model benchmarking and comparative evaluation
This study applies only the default Noah-MP physics option set. Different combinations of physics options may yield different results, which warrants future investigation. Comparative studies could evaluate Noah-MP's performance against other land surface models, such as the Joint UK Land Environment Simulator (JULES) and the Community Terrestrial System Model (CTSM). These comparisons would provide valuable insights into how different land surface schemes influence model performance in tropical regions.
This study serves as a foundational step toward enhancing Noah-MP's performance in tropical forests by establishing a calibration framework to calibrate the model using data from two tropical forests sites in Malaysia (tropical rainforest climate) and Panama (tropical monsoon climate). This study demonstrates the applicability of the calibration framework, showing that site-specific calibration using this framework significantly improves Noah-MP's ability to simulate land surface processes in tropical forests relative to its default parameterization, particularly for latent and sensible heat fluxes and soil moisture at daily and seasonal timescales.
Calibrated parameter sets are not directly transferable across the two study sites, even within similar biome, due to differences in canopy structure, land cover composition, and seasonal behaviour of water and energy fluxes. Nevertheless, the site-specific calibrated parameter sets perform consistently well during independent validation periods at their respective sites. These results suggest that, although calibrated parameters are not directly transferable across sites with different tropical climate regimes, they may be transferable among sites with similar climate conditions. Contribution analyses highlight a consistent set of key vegetation and soil parameters in tropical forests, such as VCMX25, WLTSMC, and SATDK, that often dominate model performance and could be prioritized for tuning in similar settings. Moreover, the emulator-based calibration framework could be extended to support regional-scale calibration efforts.
Despite improvements, persistent model biases reveal structural limitations that cannot always be resolved through calibration alone. Noah-MP fails to adequately capture wet-season soil moisture peaks and latent heat variability in Panama tropical forests under a tropical monsoon climate, likely due to the deficiencies in subsurface water transport representation and the lack of multi-species vegetation representation. Persistent overestimation of nighttime sensible heat further underscores structural deficiencies, such as the omission of organic soil layers that buffer diurnal temperature variations. Furthermore, efforts to improve one energy flux often degrade another, reflecting energy partitioning trade-offs and internal coupling limitations, particularly under strong seasonal forcing, as seen in Panama. These findings underscore the importance of regionally adaptive calibration strategies, while also pointing to the need for structural model development in tropical hydrology and vegetation to ensure reliable land–atmosphere simulations in data-scarce, climate-sensitive tropical regions.
The current version of the Noah-MP model is available from https://github.com/NCAR/hrldas (NCAR, 2025). The exact version of the model used to produce the results used in this paper is archived on a repository under https://doi.org/10.5281/zenodo.16780672 (Cheng, 2025a). The flux tower data at the Malaysia PSO site is available at https://asiaflux.net/index.php?page_id=93 (last access: 19 April 2024). The data produced by the simulations in this study is available from https://doi.org/10.5281/zenodo.18809781 (Wang and Cheng, 2026). The code used in this study is available from https://github.com/Areoreo/Code-for-Assessing-and-enhancing-Noah-MP-over-tropical-forests (Wang, 2026).
The supplement related to this article is available online at https://doi.org/10.5194/gmd-19-2197-2026-supplement.
YC, YW, KF, CH, FC, and AZ contributed to conceptualization, methodology, and investigation. YC and YW led the simulation, investigation, data curation, and visualization. MD, YM, BP, YK, ML, SN, ST, LM, and BZ provided resources. YC led the writing of this manuscript with contributions from all authors. All authors read and approved the final manuscript.
At least one of the (co-)authors is a member of the editorial board of Geoscientific Model Development. The peer-review process was guided by an independent editor, and the authors also have no other competing interests to declare.
Publisher's note: Copernicus Publications remains neutral with regard to jurisdictional claims made in the text, published maps, institutional affiliations, or any other geographical representation in this paper. The authors bear the ultimate responsibility for providing appropriate place names. Views expressed in the text are those of the authors and do not necessarily reflect the views of the publisher.
This research is supported by the Ministry of Education, Singapore, under its Academic Research Fund Tier 1, RS43/25, and by the Start-Up grant in Nanyang Technological University. We thank Hailin Yan (now at Bureau of Meteorology, Australia) and Jerry Liu (Centre for Climate Research Singapore) for technical support. The collection of the PSO data used in this study was supported by the JSPS KAKENHI (grant number 24K01813).
This research has been supported by the Ministry of Education's Academic Research Fund Tier 1, Singapore (grant no. RS43/25) and the Nanyang Technological University Start-Up Grant.
This paper was edited by Lele Shu and reviewed by two anonymous referees.
Arsenault, K. R., Nearing, G. S., Wang, S., Yatheendradas, S., and Peters-Lidard, C. D.: Parameter sensitivity of the Noah-MP land surface model with dynamic vegetation, J. Hydrometeorol., 19, 815–830, https://doi.org/10.1175/JHM-D-17-0205.1, 2018.
Bonan, G. B.: Land-Atmosphere interactions for climate system Models: coupling biophysical, biogeochemical, and ecosystem dynamical processes, Remote Sens. Environ., 51, 57–73, https://doi.org/10.1016/0034-4257(94)00065-U, 1995.
Bonan, G. B. and Doney, S. C.: Climate, ecosystems, and planetary futures: The challenge to predict life in Earth system models, Science, 359, https://doi.org/10.1126/science.aam8328, 2018.
Chang, M., Liao, W., Wang, X., Zhang, Q., Chen, W., Wu, Z., and Hu, Z.: An optimal ensemble of the Noah-MP land surface model for simulating surface heat fluxes over a typical subtropical forest in South China, Agr. Forest Meteorol., 281, 107815, https://doi.org/10.1016/j.agrformet.2019.107815, 2020.
Chen, D., Ban, X., Li, Y., Xiao, W., Luo, T., Lin, M., and Xu, H.: Responses of gas exchange to neighborhood interference in leaves of teak (Tectona grandis L. f.) in a tropical plantation forest, Shengtai Xuebao/Acta Ecol. Sin., 28, 4059–4069, https://doi.org/10.1016/s1872-2032(08)60078-5, 2008.
Cheng, Y.: Noah-MP.Cheng, Zenodo [data set], https://doi.org/10.5281/zenodo.16780672, 2025a.
Cheng, Y., Ogden, F. L., and Zhu, J.: Earthworms and tree roots: A model study of the effect of preferential flow paths on runoff generation and groundwater recharge in steep, saprolitic, tropical lowland catchments, Water Resour. Res., 53, 5400–5419, https://doi.org/10.1002/2016WR020258, 2017.
Cheng, Y., Ogden, F. L., Zhu, J., and Bretfeld, M.: Land use dependent preferential flow paths affect hydrological response of steep tropical lowland catchments with saprolitic soils, Water Resour Res., 54, 5551–5566, https://doi.org/10.1029/2017WR021875, 2018.
Cheng, Y., Ogden, F., and Zhu, J.: Characterization of sudden and sustained base flow jump hydrologic behaviour in the humid seasonal tropics of the Panama Canal Watershed, Hydrol. Process., 34, 569–582, https://doi.org/10.1002/hyp.13604, 2019.
Cheng, Y., Huang, M., Lawrence, D. M., Calvin, K., Lombardozzi, D. L., Sinha, E., Pan, M., and He, X.: Future bioenergy expansion could alter carbon sequestration potential and exacerbate water stress in the United States, Sci. Adv., 8, 1–14, https://doi.org/10.1126/sciadv.abm8237, 2022a.
Cheng, Y., Leung, L. R., Huang, M., Koven, C., Detto, M., Knox, R., Bisht, G., Bretfeld, M., and Fisher, R. A.: Modeling the joint effects of vegetation characteristics and soil properties on ecosystem dynamics in a Panama tropical forest, J. Adv. Model. Earth Syst., 14, e2021MS002603, https://doi.org/10.1029/2021ms002603, 2022b.
Cheng, Y., Xia, W., Detto, M., and Shoemaker, C. A.: A framework to calibrate ecosystem demography models within Earth system models using parallel surrogate global optimization, Water Resour. Res., 59, e2022WR032945, https://doi.org/10.1029/2022WR032945, 2023.
Cheng, Y., Lawrence, D. M., Pan, M., Zhang, B., Graham, N. T., Lawrence, P. J., Liu, Z., and He, X.: A bioenergy-focused versus a reforestation-focused mitigation pathway yields disparate carbon storage and climate responses, P. Natl. Acad. Sci. USA, 121, 1–11, https://doi.org/10.1073/pnas.2306775121, 2024a.
Cheng, Y., Wang, W., Detto, M., Fisher, R., and Shoemaker, C.: Calibrating Tropical Forest Coexistence in Ecosystem Demography Models Using Multi-Objective Optimization Through Population-Based Parallel Surrogate Search, J. Adv. Model. Earth Syst., 16, 1–18, https://doi.org/10.1029/2023MS004195, 2024b.
Cheruy, F., Dufresne, J. L., Hourdin, F., and Ducharne, A.: Role of clouds and land–atmosphere coupling in midlatitude continental summer warm biases and climate change amplification in CMIP5 simulations, Geophys. Res. Lett., 41, 6493–6500, https://doi.org/10.1002/2014GL061145, 2014.
Cox, P. M., Betts, R. A., Bunton, C. B., Essery, R. L. H., Rowntree, P. R., and Smith, J.: The impact of new land surface physics on the GCM simulation of climate and climate sensitivity, Clim. Dynam., 15, 183–203, https://doi.org/10.1007/s003820050276, 1999.
Cox, P. M., Betts, R. A., Jones, C. D., and Spall, S. A.: Acceleration of global warming due to carbon-cycle feedbacks in a coupled climate model, Nature, 408, 184–187, 2000.
Crossley, J. F., Polcher, J., Cox, P. M., Gedney, N., and Planton, S.: Uncertainties linked to land-surface processes in climate change simulations, Clim. Dynam., 16, 949–961, https://doi.org/10.1007/s003820000092, 2000.
Detto, M. and Pacala, S. W.: Plant hydraulics, stomatal control, and the response of a tropical forest to water stress over multiple temporal scales, Global Change Biol., 28, 4359–4376, https://doi.org/10.1111/gcb.16179, 2022.
Detto, M., Asner, G. P., Muller-Landau, H. C., and Sonnentag, O.: Spatial variability in tropical forest leaf area density from multireturn lidar and modeling, J. Geophys. Res.-Biogeo., 120, 965–978, https://doi.org/10.1002/2014JG002774, 2015.
Dickinson, R. E.: Land surface processes and climate–surface albedos and energy balance, Adv. Geophys., 25, 305–353, https://doi.org/10.1016/S0065-2687(08)60176-4, 1983.
Domingues, T. F., Berry, J. A., Martinelli, L. A., Ometto, J. P. H. B., and Ehleringer, J. R.: Parameterization of canopy structure and leaf-level gas exchange for an Eastern Amazonian tropical rain forest (Tapajós national forest, Pará, Brazil), Earth Interact., 9, https://doi.org/10.1175/EI149.1, 2005.
Duan, Q., Sorooshian, S., and Gupta, V. K.: Effective and efficient global optimization for conceptual rainfall-runoff models, Water Resour. Res., 28, 1015–1031, 1992.
Edwards, W. M., Norton, L. D., and Redmond, C. E.: Characterizing macropores that affect infiltration into nontilled soil, Soil Sci. Soc. Am. J., 52, 483–487, https://doi.org/10.2136/sssaj1988.03615995005200020033x, 1988.
Fang, Y., Leung, L. R., Koven, C. D., Bisht, G., Detto, M., Cheng, Y., McDowell, N., Muller-Landau, H., Wright, S. J., and Chambers, J. Q.: Modeling the topographic influence on aboveground biomass using a coupled model of hillslope hydrology and ecosystem dynamics, Geosci. Model Dev., 15, 7879–7901, https://doi.org/10.5194/gmd-15-7879-2022, 2022.
Fisher, R. and Koven, C.: Perspectives on the Future of Land Surface Models and the Challenges of Representing Complex Terrestrial Systems, J. Adv. Model. Earth Syst., 12, https://doi.org/10.1029/2018ms001453, 2020.
Gan, Y., Liang, X. Z., Duan, Q., Chen, F., Li, J., and Zhang, Y.: Assessment and reduction of the physical parameterization uncertainty for Noah-MP land surface model, Water Resour. Res., 55, 5518–5538, 2019.
Gentine, P., Massmann, A., Lintner, B. R., Hamed Alemohammad, S., Fu, R., Green, J. K., Kennedy, D., and Vilà-Guerau de Arellano, J.: Land–atmosphere interactions in the tropics – a review, Hydrol. Earth Syst. Sci., 23, 4171–4197, https://doi.org/10.5194/hess-23-4171-2019, 2019.
Goudriaan, J.: Crop micrometeorology: a simulation study, internal PhD, Wageningen University and Research, Pudoc, https://doi.org/10.18174/166537, 1977.
Gupta, H. V., Sorooshian, S., and Yapo, P. O.: Status of automatic calibration for hydrologic models: Comparison with multilevel expert calibration, J. Hydrol. Eng., 4, 135–143, 1999.
Hasler, N., Williams, C. A., Denney, V. C., Ellis, P. W., Shrestha, S., Hart, D. E. T., Wolff, N. H., Yeo, S., Crowther, T. W., Werden, L. K., and Cook-Patton, S. C.: Accounting for albedo change to identify climate-positive tree cover restoration, Nat. Commun., 15, 2275, https://doi.org/10.1038/s41467-024-46577-1, 2024.
He, C., Valayamkunnath, P., Barlage, M., Chen, F., Gochis, D., Cabell, R., Schneider, T., Rasmussen, R., Niu, G.-Y., Yang, Z.-L., Niyogi, D., and Ek, M.: Modernizing the open-source community Noah with multi-parameterization options (Noah-MP) land surface model (version 5.0) with enhanced modularity, interoperability, and applicability, Geosci. Model Dev., 16, 5131–5151, https://doi.org/10.5194/gmd-16-5131-2023, 2023a.
He, C., Chen, F., Barlage, M., Yang, Z. L., Wegiel, J. W., Niu, G. Y., Gochis, D., Mocko, D. M., Abolafia-Rosenzweig, R., Zhang, Z., Lin, T. S., Valayamkunnath, P., Ek, M., and Niyogi, D.: Enhancing the Community Noah-MP Land Model Capabilities for Earth Sciences and Applications, B. Am. Meteorol. Soc., 104, E2023–E2029, https://doi.org/10.1175/BAMS-D-23-0249.1, 2023b.
He, C., Valayamkunnath, P., Barlage, M., Chen, F., Gochis, D., Cabell, R., Schneider, T., Rasmussen, R., Niu, G.-Y., Yang, Z.-L., Niyogi, D., and Ek, M.: The Community Noah-MP Land Surface Modeling System Technical Description Version 5.0, NCAR Technical Note NCAR/TN-575+STR, NCAR, https://doi.org/10.5065/ew8g-yr95, 2023c.
Huang, M., Ray, J., Hou, Z., Ren, H., Liu, Y., and Swiler, L.: On the applicability of surrogate-based Markov chain Monte Carlo-Bayesian inversion to the Community Land Model: Case studies at flux tower sites, J. Geophys. Res.-Atmos., 121, 7548–7563, https://doi.org/10.1002/2015JD024339, 2016.
Kosugi, Y., Takanashi, S., Yokoyama, N., Philip, E., and Kamakura, M.: Vertical variation in leaf gas exchange parameters for a Southeast Asian tropical rainforest in Peninsular Malaysia, J. Plant Res., 125, 735–748, https://doi.org/10.1007/s10265-012-0495-5, 2012.
Kratzert, F., Klotz, D., Brenner, C., Schulz, K., and Herrnegger, M.: Rainfall–runoff modelling using Long Short-Term Memory (LSTM) networks, Hydrol. Earth Syst. Sci., 22, 6005–6022, https://doi.org/10.5194/hess-22-6005-2018, 2018.
Lambin, E. F., Geist, H. J., and Lepers, E.: Dynamics of Land-Use and Land-Cover Change in Tropical Regions, Annu. Rev. Environ. Resour., 28, 205–241, https://doi.org/10.1146/annurev.energy.28.050302.105459, 2003.
Lawrence, P., Feddema, J., Bonan, G., Meehl, G., O'Neill, B., Oleson, K., Levis, S., and Thornton, P.: Simulating the biogeochemical and biogeophysical impacts of transient land cover change and wood harvest in the Community Climate System Model (CCSM4) from 1850 to 2100, J. Climate, 25, 3071–3095, https://doi.org/10.1175/JCLI-D-11-00256.1, 2012.
Li, J., Chen, F., Lu, X., Gong, W., Zhang, G., and Gan, Y.: Quantifying contributions of uncertainties in physical parameterization schemes and model parameters to overall errors in Noah-MP dynamic vegetation modeling, J. Adv. Model. Earth Syst., 12, e2019MS001914, https://doi.org/10.1029/2019MS001914, 2020.
Li, J., Miao, C., Zhang, G., Fang, Y. H., Shangguan, W., and Niu, G. Y.: Global evaluation of the Noah-MP land surface model and suggestions for selecting parameterization schemes, J. Geophys. Res.-Atmos., 127, e2021JD035753, https://doi.org/10.1029/2021JD035753, 2022.
Lin, Y., Dong, W., Zhang, M., Xie, Y., Xue, W., Huang, J., and Luo, Y.: Causes of model dry and warm bias over central U.S. and impact on climate projections, Nat. Commun., 8, 1–8, https://doi.org/10.1038/s41467-017-01040-2, 2017.
Lion, M., Kosugi, Y., Takanashi, S., Noguchi, S., Itoh, M., Katsuyama, M., Siti-Aisah, S., and Marryanna, L.: Evapotranspiration and water source of a tropical rainforest in peninsular Malaysia, Hydrol. Process., 31, 4338–4353, https://doi.org/10.1002/hyp.11360, 2017.
Litt, G. F., Ogden, F. L., Mojica, A., Hendrickx, J. M. H., Kempema, E. W., Gardner, C. B., and Stallard, R. F.: Land cover effects on soil infiltration capacity measured using plot scale rainfall simulation in steep tropical lowlands of Central Panama, Hydrol. Process., 34, 878–897, https://doi.org/10.1002/hyp.13605, 2020.
Lu, D. and Ricciuto, D.: Efficient surrogate modeling methods for large-scale Earth system models based on machine-learning techniques, Geosci. Model Dev., 12, 1791–1807, https://doi.org/10.5194/gmd-12-1791-2019, 2019.
Lu, D., Ricciuto, D., Stoyanov, M., and Gu, L.: Calibration of the E3SM Land Model Using Surrogate-Based Global Optimization, J. Adv. Model. Earth Syst., 10, 1337–1356, https://doi.org/10.1002/2017MS001134, 2018.
Lu, D., Liu, Y., Zhang, Z., Bao, F., and Zhang, G.: A Diffusion-Based Uncertainty Quantification Method to Advance E3SM Land Model Calibration, J. Geophys. Res.-Mach. Learn. Comput., 1, https://doi.org/10.1029/2024jh000234, 2024.
Ma, H. Y., Mechoso, C. R., Xue, Y., Xiao, H., Neelin, J. D., and Ji, X.: On the connection between continental-scale land surface processes and the tropical climate in a coupled ocean-atmosphere-land system, J. Climate, 26, 9006–9025, https://doi.org/10.1175/JCLI-D-12-00819.1, 2013.
Mahmood, R., Pielke, R. A., Hubbard, K. G., Niyogi, D., Dirmeyer, P. A., Mcalpine, C., Carleton, A. M., Hale, R., Gambill, S., and Manyari, A.: Land cover changes and their biogeophysical effects on climate, Int. J. Climatol., 34, 929–953, https://doi.org/10.1002/joc.3736, 2014.
Marryanna, L., Noguchi, S., Kosugi, Y., Niiyama, K., Itoh, M., Sato, T., Takanashi, S., Siti-Aisah, S., and Abd-Rahman, K.: Spatial Distribution of Soil Moisture and Its Influence on Stand Structure in a Lowland Dipterocarp Forest in Peninsular Malaysia, J. Trop. For. Sci., 31, 135–150, 2019.
Müller, J., Paudel, R., Shoemaker, C. A., Woodbury, J., Wang, Y., and Mahowald, N.: CH4 parameter estimation in CLM4.5bgc using surrogate global optimization, Geosci. Model Dev., 8, 3285–3310, https://doi.org/10.5194/gmd-8-3285-2015, 2015.
Munyankusi, E., Gupta, S. C., Moncrief, J. F., and Berry, E. C.: Earthworm macropores and preferential transport in a long-term manure applied Typic Hapludalf, J. Environ. Qual., 23, 773–784, https://doi.org/10.2134/jeq1994.00472425002300040023x, 1994.
NCAR – National Center for Atmospheric Research: HRLDAS: High Resolution Land Data Assimilation System) Community Model Repository, GitHub [code] https://github.com/NCAR/hrldas (last access: 8 August 2025), 2025.
Niu, G. Y., Yang, Z. L., Mitchell, K. E., Chen, F., Ek, M. B., Barlage, M., Kumar, A., Manning, K., Niyogi, D., Rosero, E., Tewari, M., and Xia, Y.: The community Noah land surface model with multiparameterization options (Noah-MP): 1, Model description and evaluation with local-scale measurements, J. Geophys. Res.-Atmos., 116, 1–19, https://doi.org/10.1029/2010JD015139, 2011.
Noguchi, S., Kosugi, Y., Takanashi, S., Tani, M., Niiyama, K., Siti Aisah, S., and Lion, M.: Long-term variation in soil moisture in Pasoh forest reserve, a lowland tropical rainforest in Malaysia, J. Trop. For. Sci., 28, 324–333, 2016.
Ogden, F. L., Crouch, T. D., Stallard, R. F., and Hall, J. S.: Effect of land cover and use on dry season river runoff, runoff efficiency, and peak storm runoff in the seasonal tropics of Central Panama, Water Resour. Res., 49, 8443–8462, https://doi.org/10.1002/2013WR013956, 2013.
Pan, Y., Birdsey, R. A., Fang, J., Houghton, R., Kauppi, P. E., Kurz, W. A., Phillips, O. L., Shvidenko, A., Lewis, S. L., Canadell, J. G., Ciais, P., Jackson, R. B., Pacala, S. W., McGuire, A. D., Piao, S., Rautiainen, A., Sitch, S., and Hayes, D.: A Large and Persistent Carbon Sink in the World's Forests, Science, 333, 988–993, 2011.
Pielke, R. A., Pitman, A., Niyogi, D., Mahmood, R., McAlpine, C., Hossain, F., Goldewijk, K. K., Nair, U., Betts, R., Fall, S., Reichstein, M., Kabat, P., and de Noblet-Ducoudré, N.: Land use/land cover changes and climate: Modeling analysis and observational evidence, Wiley Interdisciplin. Rev.: Clim. Change, 2, 828–850, https://doi.org/10.1002/wcc.144, 2011.
Pitman, A. J., De Noblet-Ducoudré, N., Cruz, F. T., Davin, E. L., Bonan, G. B., Brovkin, V., Claussen, M., Delire, C., Ganzeveld, L., Gayler, V., van den Hurk, B. J. J. M., Lawrence, P. J., van der Molen, M. K., Müller, C., Reick, C. H., Rowan, A. J., Sandung, B., Seneviratne, S. I., and Voldoire, A.: Uncertainties in climate responses to past land cover change: First results from the LUCID intercomparison study, Geophys. Res. Lett., 36, 1–6, https://doi.org/10.1029/2009GL039076, 2009.
Schlesinger, W. H. and Jasechko, S.: Transpiration in the global water cycle, Agr. Forest Meteorol., 189–190, 115–117, https://doi.org/10.1016/j.agrformet.2014.01.011, 2014.
Shao, R. and Zhang, B.: Estimating the Increase in Regional Evaporative Water Consumption as a Result of Vegetation Restoration Over the Loess Plateau, China, J. Geophys. Res.-Atmos., 783–802, https://doi.org/10.1029/2019JD031295, 2019.
Shapley, L. S.: A value for n-person games, Contrib. Theory Games, 2, 307–317, 1953.
Storn, R. and Price, K.: Differential Evolution – A Simple and Efficient Heuristic for Global Optimization over Continuous Spaces, J. Global Optim., 11, 341–359, https://doi.org/10.1023/A:1008202821328, 1997.
Sun, R., Duan, Q., and Huo, X.: Multi-Objective Adaptive Surrogate Modeling-Based Optimization for Distributed Environmental Models Based on Grid Sampling, Water Resour. Res., 57, https://doi.org/10.1029/2020WR028740, 2021a.
Sun, W., Wang, B., and Wang, Y.: Parameterizing Subgrid Variations of Land Surface Heat Fluxes to the Atmosphere Improves Boreal Summer Land Precipitation Simulation With the NCAR CESM1.2, Geophys. Res. Lett., 48, 1–10, https://doi.org/10.1029/2020GL090715, 2021b.
Sutera, S. P. and Skalak, R.: The history of Poiseuille's law, Annu. Rev. Fluid Mech., 25, 1–20, https://doi.org/10.1146/annurev.fl.25.010193.000245, 1993.
Teo, H. C., Raghavan, S. V., He, X., Zeng, Z., Cheng, Y., Luo, X., Lechner, A. M., Ashfold, M. J., Lamba, A., Sreekar, R., Zheng, Q., Chen, A., and Koh, L. P.: Large-scale reforestation can increase water yield and reduce drought risk for water-insecure regions in the Asia-Pacific, Global Change Biol., 6385–6403, https://doi.org/10.1111/gcb.16404, 2022.
Unger, N.: Human land-use-driven reduction of forest volatiles cools global climate, Nat. Clim. Change, 4, 907–910, https://doi.org/10.1038/nclimate2347, 2014.
Van Weverberg, K., Morcrette, C. J., Petch, J., Klein, S. A., Ma, H. Y., Zhang, C., Bechtold, P., Beljaars, A. C. M., Ek, M. B., Niu, G. Y., and Pan, H. L.: CAUSES: Attribution of Surface Radiation Biases in NWP and Climate Models near the U.S. Southern Great Plains, J. Geophys. Res.-Atmos., 123, 3612–3644, https://doi.org/10.1002/2017JD027188, 2018.
Vetrita, Y. and Cochrane, M. A.: Fire frequency and related land-use and land-cover changes in Indonesia's Peatlands, Remote Sens., 12, https://doi.org/10.3390/RS12010005, 2020.
Wang, Y.: Code-for-Assessing-and-enhancing-Noah-MP-over-tropical-forests, GitHub [code], https://github.com/Areoreo/Code-for-Assessing-and-enhancing-Noah-MP-over-tropical (last access: 28 February 2026), 2026.
Wang, Y. and Cheng, Y.: Simulation results for “Assessing and enhancing Noah-MP land surface modeling over tropical forests using machine learning techniques”, Zenodo [data set], https://doi.org/10.5281/zenodo.18809781, 2026.
Weiskopf, S. R., Harm, Z. V., Miller, B. W., Myers, B. J. E., Pereira, L., Cecilia, M., Arce-plata, M. I., Blanchard, J. L., Ferrier, S., Fulton, E. A., Harfoot, M., Isbell, F., Johnson, J. A., Mori, A. S., Weng, E., Isabel, M., and Rosa, D.: Increasing the uptake of ecological model results in policy decisions to improve biodiversity outcomes, Environ. Model. Softw., 149, https://doi.org/10.1016/j.envsoft.2022.105318, 2022.
Yan, H., Sun, N., Eldardiry, H., Thurber, T. B., Reed, P. M., Malek, K., Gupta, R., Kennedy, D., Swenson, S. C., Hou, Z., Cheng, Y., and Rice, J. S.: Large Ensemble Diagnostic Evaluation of Hydrologic Parameter Uncertainty in the Community Land Model Version 5, J. Adv. Model. Earth Syst., 15, 1–23, https://doi.org/10.1029/2022MS003312, 2022.
Yang, Z. L., Niu, G. Y., Mitchell, K. E., Chen, F., Ek, M. B., Barlage, M., Kumar, A., Manning, K., Niyogi, D., Rosero, E., Tewari, M., and Xia, Y.: The community Noah land surface model with multiparameterization options (Noah-MP): 2, Evaluation over global river basins, J. Geophys. Res.-Atmos., 16, 1–16, https://doi.org/10.1029/2010JD015140, 2011.
Zhang, B., Tian, L., Yang, Y., and He, X.: Revegetation Does Not Decrease Water Yield in the Loess Plateau of China, Geophys. Res. Lett., 49, https://doi.org/10.1029/2022GL098025, 2022.
Zhang, G., Chen, Y., and Li, J.: Effects of organic soil in the Noah-MP land-surface model on simulated skin and soil temperature profiles and surface energy exchanges for China, Atmos. Res., 249, https://doi.org/10.1016/j.atmosres.2020.105284, 2021.
Zhang, J., Zhang, B., Cheng, Y., Wang, X., Yang, F., and Zhao, X.: Revegetation Rebalances Water Resources by Enhancing Rainwater to Increase Vegetation Carrying Capacity in China's Loess Plateau, Water Resour. Res., 1–18, https://doi.org/10.1029/2025WR040307, 2026.