the Creative Commons Attribution 4.0 License.
the Creative Commons Attribution 4.0 License.
Dynamical linkages between planetary boundary layer schemes and wildfire spread processes: a case study using WRF-Fire version 4.6
Yongli Wang
Chun Yang
Lamei Shi
Qichao Yao
Wildfires can significantly enhance surface sensible heat and modify the state of the near-surface atmosphere, becoming key factors in triggering turbulence and restructuring the boundary layer. This study uses high-resolution simulations with WRF-Fire, combined with hourly observational data from six meteorological stations (five national and one emergency stations) during the Jinyun Mountain wildfire in Chongqing, China, to systematically evaluate the performance of five planetary boundary layer (PBL) schemes (MYJ, MYNN2, MYNN3, BouLac, UW) in simulating temperature, wind speed, and turbulence intensity. Results show that all schemes can reproduce the diurnal trends of temperature and wind speed but exhibit significant differences in amplitude response and simulation errors. The MYNN3 scheme captures the spatiotemporal variations of turbulence intensity and wind speed at different heights more accurately, thereby better representing the 2 m temperature and 10 m wind speed response and reduces the model's cold bias in high-temperature simulations. The BouLac and MYNN2 schemes also show some response to thermal disturbances at certain sites but perform poorly under strong perturbations and exhibit large fluctuations. The MYJ and UW schemes show overall weaker turbulence and fail to capture local circulation variations effectively. Turbulent energy budget analysis of MYNN3 indicates a buoyancy-dominated turbulence generation mechanism, with vertical transport promoting upper-level disturbances. This reveals MYNN3's greater sensitivity to wildfire thermal perturbations and more complete feedback processes, providing a scientific basis for selecting PBL schemes in mountainous wildfire simulations.
- Article
(9861 KB) - Full-text XML
- BibTeX
- EndNote
Wildfires are an intrinsic component of Earth's natural systems, yet their destructiveness and unpredictability have intensified under climate change (Brown et al., 2023; Jones et al., 2022; Mulverhill et al., 2024; Richardson et al., 2022, 2025). Climate change is pushing wildfires toward higher frequency, intensity, and spatial heterogeneity. The coupling model WRF-Fire, with its two-way atmosphere-fire coupling capability, has become a powerful tool for analyzing wildfire dynamics in complex regions such as the mountainous areas of Chongqing (Coen et al., 2013; Mandel et al., 2011; Shamsaei et al., 2023). Specifically, WRF-Fire dynamically reflects temporal wildfire responses, represents interactions between fire and surrounding atmosphere, and simulates evolving atmospheric conditions to drive fire behavior, while releasing heat and combustion products into the atmosphere-significantly impacting boundary layer structure and turbulence parameters (Coen, 2018; Finney et al., 2015).
In high-resolution fire-atmosphere coupled simulations, the land surface model (LSM), surface layer scheme, and planetary boundary layer (PBL) scheme collectively form the vertical turbulence exchange system from the surface to the top of the boundary layer. These three are tightly coupled in their physical processes and play crucial roles in wildfire spread simulations (Skamarock et al., 2021). The LSM, such as the Unified Noah land surface model (Campbell et al., 2019), calculates surface energy balance and water budgets, providing key variables like sensible heat, latent heat, surface temperature, and soil moisture, which serve as the surface drivers of fire fluxes. The surface layer scheme, such as the Monin–Obukhov (Janjic) similarity theory (Monin and Obukhov, 1954), diagnoses energy and momentum fluxes between the surface and the near-surface atmosphere based on thermal and dynamic gradients, offering lower-boundary flux conditions to the PBL scheme. The PBL scheme governs turbulence generation and development throughout the boundary layer and characterizes the vertical propagation of surface perturbations into the atmosphere. It is a critical component determining local wind evolution, thermal response, and fire plume structure. After a wildfire breaks out, it dramatically alters surface energy distribution and generates strong thermal perturbations and updrafts. The vertical transport ability of these within the boundary layer directly affects the structure of local circulation, plume development, and the spatial extent of fire spread (Campos et al., 2023; Duane et al., 2021). Different PBL schemes vary significantly in turbulence treatment—such as whether turbulent kinetic energy (TKE) is prognosed, whether nonlocal mixing terms are included, and how buoyancy terms are handled – resulting in divergent responses to thermal perturbations and in wind field reconstruction (Jia et al., 2023; Menezes et al., 2024; Wang et al., 2025a). Thus, evaluating the multidimensional performance of different PBL schemes under unified land surface and surface layer configurations in simulating atmosphere-fire interactions holds significant scientific value.
Chongqing is characterized primarily by hilly and mountainous terrain, which accounts for over 90 % of its total area. Elevation drops steeply from highlands such as the Daba Mountains (northeast), Wuling Mountains (southeast), and Dalou Mountains (south) toward the valleys of the Yangtze River and its tributaries, with elevation differences reaching 2722 m. The region experiences a humid subtropical monsoon climate (Zhou et al., 2024), Due to terrain-blocking effects, wind speeds are generally low and calm winds frequent, leading to poor dispersion and high humidity. Local circulations are uniquely complex (Li et al., 2016). Vegetation types include evergreen broadleaf forests, secondary and warm coniferous forests, bamboo forests, and evergreen broadleaf shrubs, with forest cover exceeding 55 % and altitudinal zonation of vegetation (Yao et al., 2015). Due to its rich vegetation and forest resources, Chongqing is included in the eastern section of the Sichuan–Chongqing wildfire-prone zone. Combined with frequent high temperatures and prolonged dry period, the risk of forest fires is high. Therefore, gaining a deeper understanding of wildfire spread mechanisms in this region is increasingly urgent.
By introducing a real forest fire process and combining near-fire station observational data with MODIS burned area, this study systematically evaluates the performance differences among multiple PBL schemes under fire–atmosphere coupled conditions. The use of a real wildfire case together with near-field observations is essential, because fire-induced thermal forcing fundamentally alters boundary-layer structure and turbulence characteristics, revealing differences among PBL schemes that are not evident under no-fire or weakly forced conditions. Near-fire station observations provide direct and seldom available constraints on these highly disturbed boundary-layer states, enabling a physically meaningful assessment of how different PBL schemes represent turbulence, local circulation, and their feedback on wildfire spread. Through a typical wildfire case in complex terrain, this study clarifies how PBL parameterizations modulate fire spread behavior via their treatment of turbulence under strong surface heating. The results not only fill a research gap in the understanding of wildfire dynamics in the Chongqing region, but also provide valuable observationally grounded evidence for assessing the applicability and limitations of PBL schemes under non-typical, strongly forced conditions, with direct implications for coupled fire–atmosphere model development and regional fire spread forecasting.
This study compares the spatiotemporal variations of local-scale meteorological variables during wildfire spread, using five PBL schemes (MYJ, MYNN2, MYNN3, BouLac, UW), under a unified setup with the Noah land surface scheme and the Monin–Obukhov (Janjic) surface layer scheme.
In WRF, the surface layer scheme serves as the interface between the land surface model and the boundary layer scheme by diagnosing surface momentum, heat, and moisture fluxes based on Monin–Obukhov similarity theory. These diagnosed fluxes and stability parameters provide the lower boundary conditions for boundary layer turbulence and directly control turbulence production and vertical mixing. Therefore, to isolate the impacts of different PBL schemes under fire–atmosphere coupled conditions, a single, consistent surface layer scheme is adopted in all experiments to avoid confounding effects arising from differences in surface flux formulation.
2.1 Model design
To simulate micro-meteorological changes during the wildfire event in Chongqing from 00:00 UTC on 21 August to 00:00 UTC on 27 August 2022, the WRF-Fire model (Version 4.6) is employed. The physics options follow the official CONUS configuration, including the Thompson microphysics scheme (Thompson et al., 2004), Noah land surface model, and RRTMG longwave and shortwave radiation schemes (Iacono et al., 2008).


Figure 1Triple-nested simulation domains (top panel); Terrain (bottom left panel) and Fuel distribution (bottom right panel) in the innermost domain (30 m horizontal resolution). Black inverted triangles represent national automatic weather stations; magenta crosses and dashed lines represent the position and movement of the emergency station; shaded areas indicate the final burned area.
Five simulation experiments are conducted, differing only in their choice of PBL scheme (Table 1). Initial and boundary conditions are derived from ERA5 reanalysis data at 6 h intervals. The simulation domain is centered at 29.80697° N, 106.3242° E, using three nested domains with horizontal resolutions of 7.5 km (D01), 1.5 km (D02), and 300 m (D03), as shown in Fig. 1. The vertical grid comprises 45 levels from the surface to a model top of 50 MB, using hybrid coordinates. Fuel types are mapped from 2010 Tsinghua University landcover data (30 m resolution, 10 types) onto the 13 Anderson fuel categories used in WRF-Fire. Vegetation in the study area mainly includes forests, croplands, and non-burnable surfaces. Model output is saved at hourly intervals.
2.2 Observed meteorological conditions during the fire
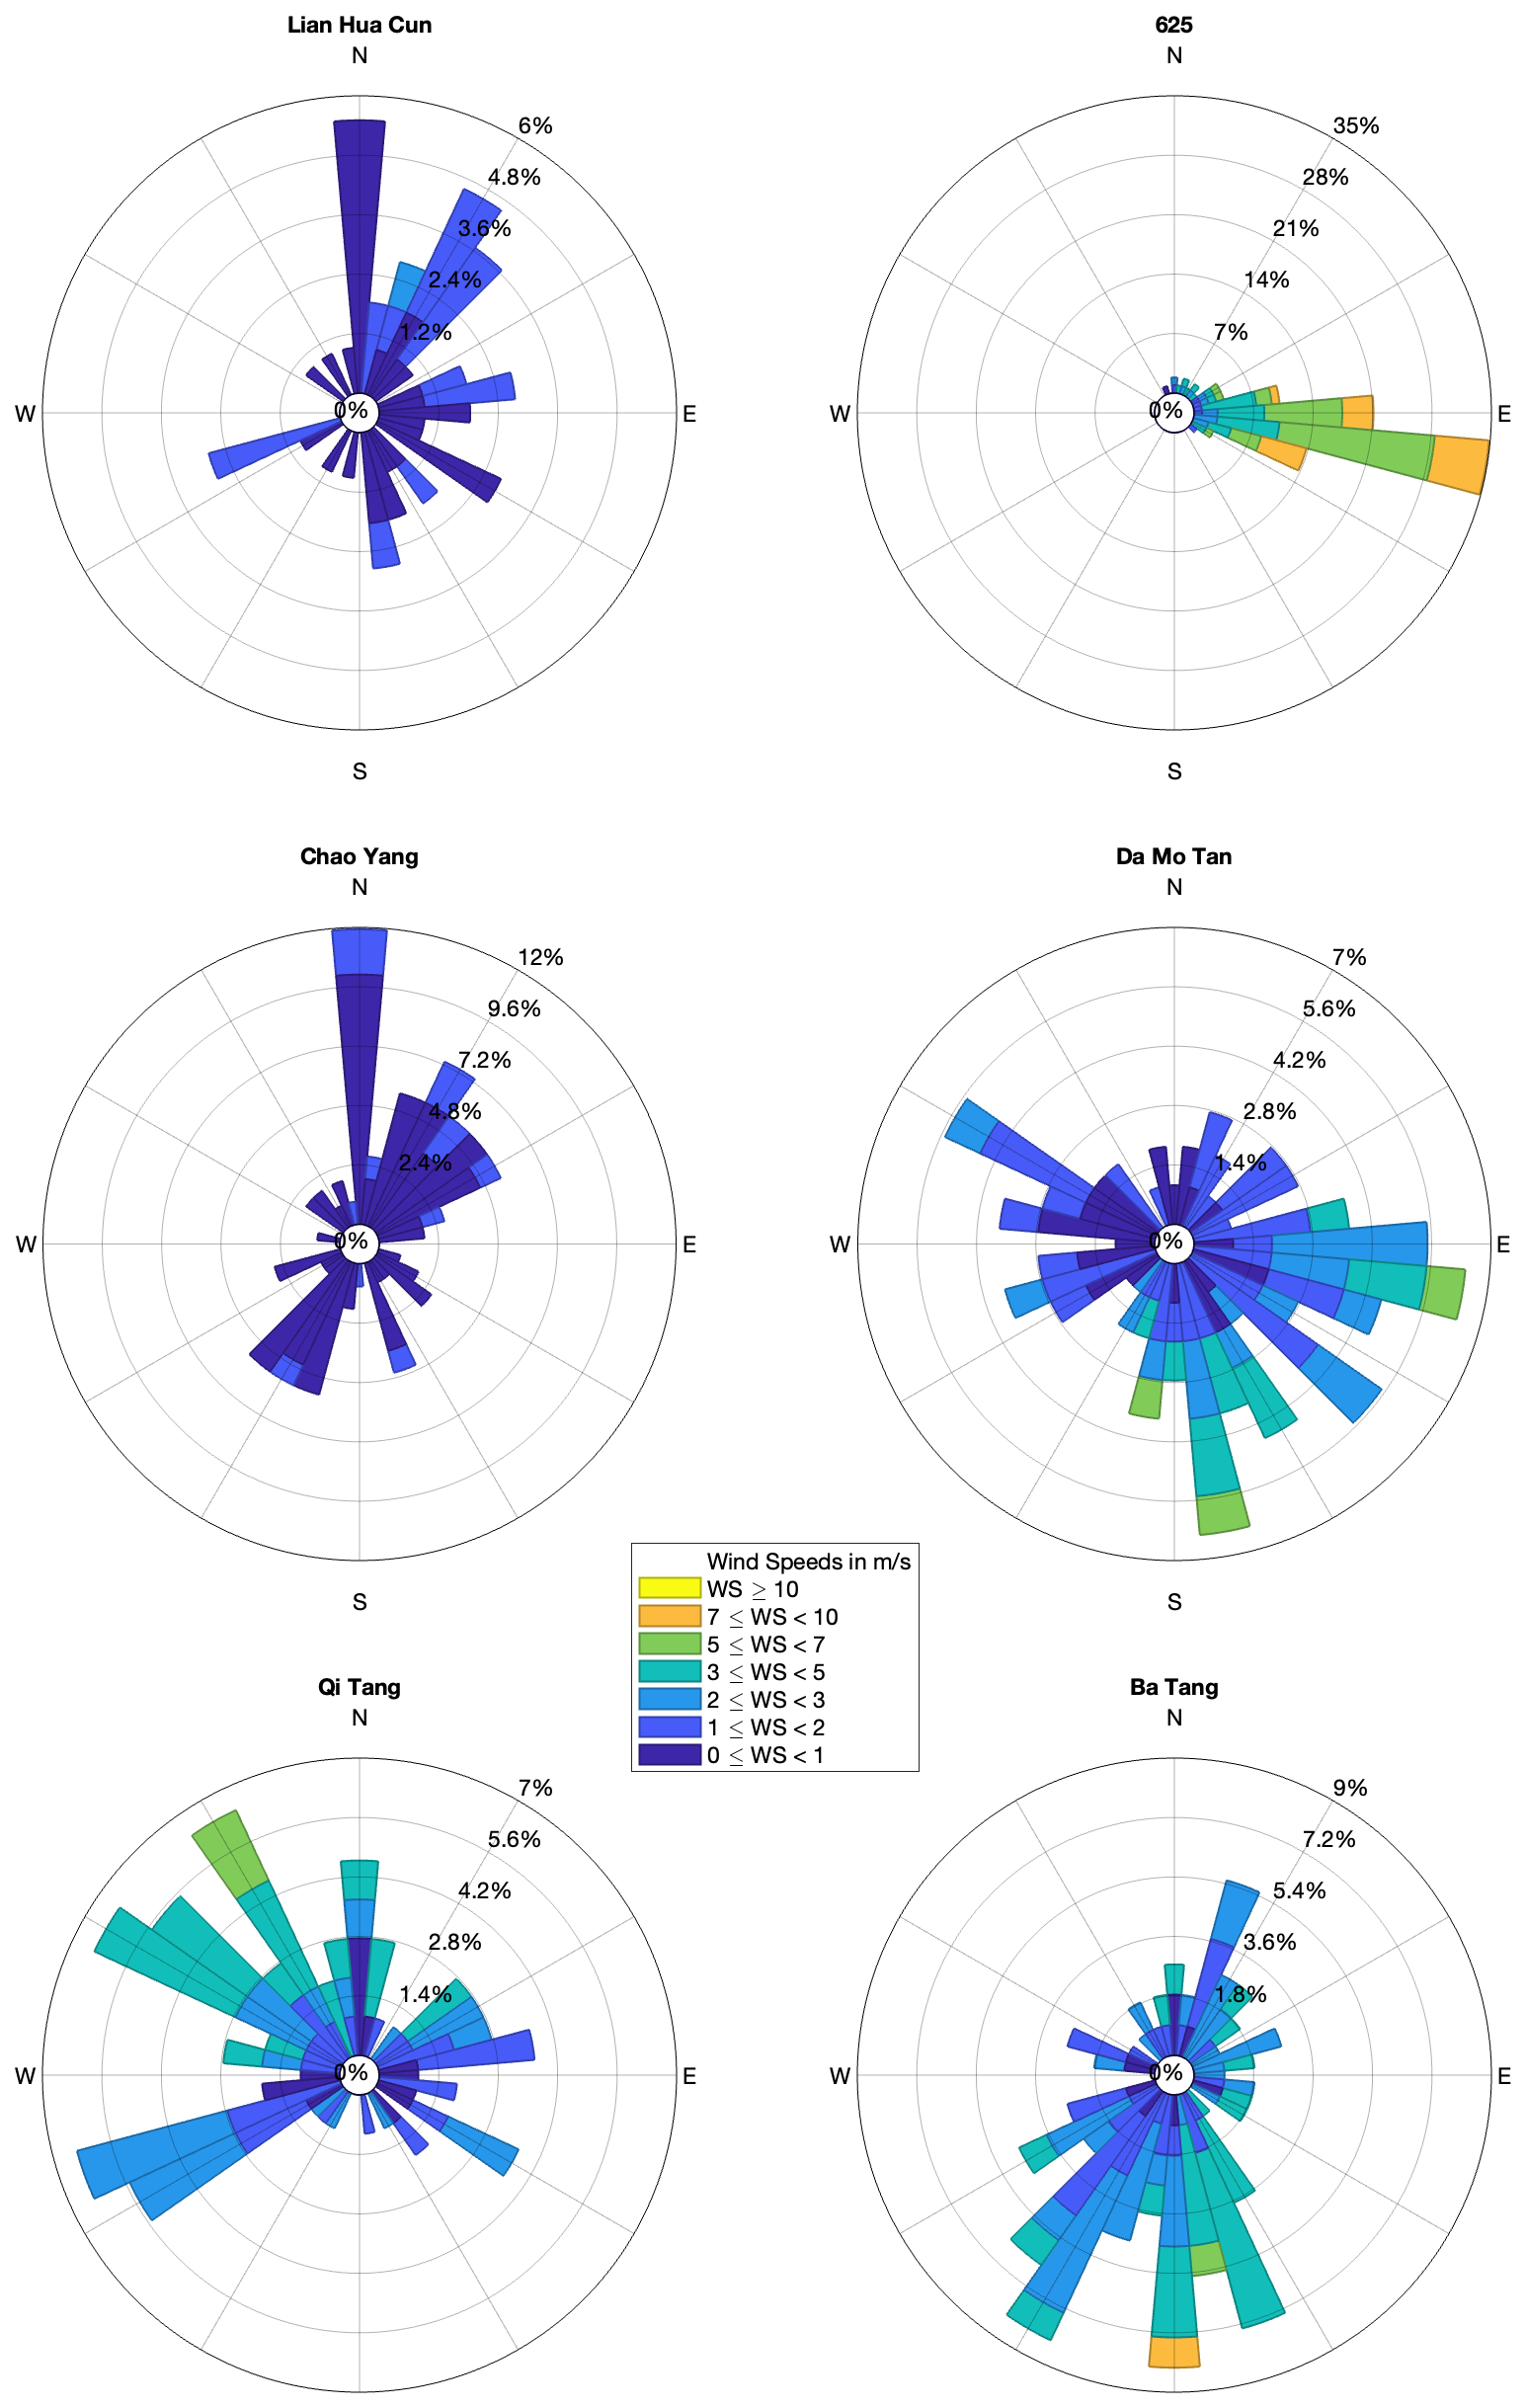
The model outputs are evaluated against observations from five meteorological stations (Qitang, Batang, Chaoyang Primary School, Station 625, Damotan) and one mobile emergency weather station, which is deployed along the fireline at Lianhua Village and Renhe Reservoir in Xiejia Street, Beibei District, which is referred to uniformly as Lianhua Village in this study). These stations are within the innermost simulation domain. Based on the background wind field, the stations (the distances from the fire area range from 1 to 9 km) are categorized into three types: near-fire stations (Station 625 and Lianhua), upwind stations (Chaoyang and Damotan), and downwind stations (Qitang and Batang).
Temperature was recorded every 2 s, wind direction every second, and wind speed four times per second. Temperature values were averaged over 30 1 min measurements; 2 min wind speed and direction were computed as arithmetic and vector averages, respectively. Station 625 is a top Jinyun Mountain, surrounded by forest, while Chaoyang is located at the urban area. Qitang and Batang are situated between Jinyun mountain and Chaoyang in elevation, with mixed land cover. The wind rose diagrams show that wind speeds at the emergency and Chaoyang stations are mostly below 1 m s−1, with predominant northerly winds (Fig. 2). Station 625 records the highest wind speeds, mainly easterly. Damotan is domained by the southeast winds; Qitang and Batang mainly experience westerly and southerly winds, respectively. Despite proximity, wind direction and speed vary considerably due to differences in topography and vegetation cover.
2.3 Event background and climatology
On 21 August 2022, temperatures in Chongqing were extremely high, following several days of persistent heat with maxima above 40 °C, and forest fire danger levels were classified as “extreme”. According to Beibei station data, the nighttime minimum temperature was 32 °C and the daytime maximum 44 °C. At 22:00 LT (local time), temperature was 37.9 °C, with 2 min average wind speed of 8.9 m s−1 and a peak gust of 14.8 m s−1.
Long-term climate data show that Chongqing's average precipitation in August 2022 was 102.0 mm – nearly 60 % lower than the 1991–2020 average (245.6 mm). The probability of extreme heat events in northern and southwestern Chongqing is higher in summer, with an average of 7.4 extreme heat days (8 % of the season). High winds occur mostly in western Chongqing, in a smaller area than heat events. Southwestern Chongqing is a hotspot for the overlap of extreme heat and high wind, while the combined occurrence of heat, drought, and wind is most likely in the southwestern and central areas. These are also the areas with the highest density of fire points in August 2022 (figure not shown).
3.1 The burned area evaluation
To provide an independent spatial-scale evaluation of how different planetary boundary layer (PBL) schemes influence wildfire spread, MODIS-derived burned area is employed as an observational reference to assess the model's ability to reproduce the overall fire extent and spatial pattern.
Figure 3 compares the MODIS-derived burned area (upper left panel) with simulated burned areas obtained using different planetary boundary layer (PBL) schemes (MYJ, MYNN2, MYNN3, BouLac, and UW). Substantial differences are evident among the PBL schemes in terms of burned area extent, spatial pattern, and boundary details. While all simulations reproduce the primary fire spread orientation indicated by the MODIS product, noticeable discrepancies remain in the location of fire edges, local expansion intensity, and the representation of irregular fire perimeters. Quantitative evaluation shows that the burned area estimates produced by the five PBL schemes range from 47.38 % to 92.82 %, with the MYNN3 scheme exhibiting the highest level of agreement with the MODIS-derived burned area. These results indicate that PBL schemes modulate fire–atmosphere coupling and fire spread behavior through their influence on near-surface winds and turbulence. Building on this spatial evaluation, the following section further examines near-surface thermodynamic and dynamic fields by comparing simulated 2 m air temperature and 10 m wind speed against near-fire station observations, providing additional process-level insight into scheme performance.

Figure 3MODIS and simulated burned areas from different boundary layer schemes, with gray shading area indicating terrain elevation.
3.2 Temperature and wind speed evaluation
In this study, 2 m air temperature is diagnosed through the near-surface parameterization schemes of the WRF model, which are coupled with the land surface scheme and planetary boundary layer (PBL) schemes. The 2 m temperature diagnosis is based on Monin–Obukhov Similarity Theory (MOST), extrapolating the thermal gradient between the surface temperature (provided by the Noah LSM) and the lowest atmospheric layer (provided by the PBL schemes) to 2 m above the ground. As previously discussed, since the same near-surface and land surface schemes are used across all experiments, the PBL scheme directly determines the diagnosed 2 m temperature. According to the fire site data provided by the Emergency Management Bureau, the analysis period is unified as 23:00 BJT (Beijing Time) on 21 August to 11:00 BJT 26 August 2022.
Figure 4 shows the time evolution of 2 m temperatures simulated by different PBL schemes. Overall, all schemes reproduce the typical diurnal temperature variation, though differences exist in amplitude and phase. The MYNN3 scheme tends to consistent with the observed data, especially in the afternoon of 22 and 23 August, showing stronger responses to fire-induced disturbances. MYNN2 and UW scheme follow the MYNN3 scheme, while MYJ and UW simulate comparatively lower values, maybe possibly due to weaker turbulent mixing and stronger stability suppression (in Sect. 3.3). In the latter part of the simulation (after Day 4), MYNN3 temperatures drop sharply, even below other schemes. In contrast, other schemes show a more moderate response without abrupt daily mean fluctuations.

Figure 4Hourly evolution of observed and simulated 2 m temperatures (smoothed using an 11-point moving median).
To quantitatively evaluate the performance of the PBL schemes, Mean Error (ME) and Root Mean Square Error (RMSE) were calculated for hourly temperature data over the study period. Figure 5 shows the averaged results.

Figure 5The Mean Error (ME) and Root Mean Square Error (RMSE) between observed and simulated 2 m temperatures at all stations.
Compared with observations, the simulated 2 m temperatures are generally underestimated. Among all the schemes, MYNN3 scheme has the smallest ME, indicating minimal systematic bias and better agreement with observations. In terms of RMSE, BouLac scheme performs best, suggesting better error control and simulation stability. However, MYNN3 scheme, despite its low ME, shows larger RMSE due to more frequent local energy responses.
From a station-based perspective, Qitang station shows the smallest ME differences among schemes, followed by Lianhuacun, indicating weak sensitivity to scheme-induced bias. For RMSE, Lianhuacun again exhibits the smallest differences, followed by Batang, suggesting lower model error response. In contrast, Chaoyang and Damotan show larger differences due to complex terrain and strong boundary layer activity, highlighting the influence of topography, surface conditions, and PBL structure on model performance.
The 10 m wind speed is also diagnosed using the near-surface scheme, combined with land surface and various PBL schemes. The diagnosis is based on the wind speed at the lowest model layer, extrapolated to 10 m using the logarithmic wind profile from Monin–Obukhov theory, accounting for thermal stability effects on momentum exchange. Different PBL schemes yield different low-level wind profiles and turbulent fluxes, significantly impacting the diagnosed 10 m wind speed. Model outputs provide instantaneous values at the end of each hour, while observations are 2 min averages before the hour.
Overall, except for Chaoyang and Lianhuacun stations, almost most schemes reproduce the diurnal wind speed pattern (Fig. 6). The wind difference of the Chaoyang station is derived from its urban setting, while the coupling model lacks a city describing and the 30 m resolution fails to represent roughness contrasts. Lianhuacun records 2 m wind speeds, while the model provides 10 m values, so there is a large difference. Damotan is the upwind of the fire, therefore its disturbance is less apparent in simulations; While the 625 station, located in high mountains altitude, shows the strongest winds. On 23 August, it experiences a sudden wind increase not captured elsewhere, likely due to localized mountain effects. Qitang and Batang are nearby but show differing wind responses; Qitang has calm nights not captured by any scheme, while Batang is better represented across different schemes.

During peak wind periods, significant simulation biases appear. MYJ and UW schemes show smoother curves, whereas BouLac, MYNN3, and MYNN2 schemes often over- or under-estimate wind speed.
The comparison of mean error (ME) and root-mean-square error (RMSE) for 10 m wind speed simulations (Fig. 7) under different PBL schemes shows that most schemes tend to overestimate wind speed at most stations (excluding high-elevation sites, where the height difference between model and observation is approximately 170 m). This overestimation is reflected by positive ME values, with particularly large errors observed at Chaoyang and Damotan stations, where RMSE values approach or exceed 2.5 m s−1. This indicates that complex terrain or localized meteorological conditions significantly affect wind speed simulation accuracy. Overall, the differences between simulated and observed wind speeds are generally small at most times, but occasional extreme deviations markedly increase the overall RMSE. This suggests that PBL schemes may exhibit strong fluctuations or outliers at certain time points, partly due to the fact that model output represents instantaneous wind speed at the end of each hour, while observations reflect a 2 min average. Such high-frequency fluctuations are especially pronounced in the MYNN3 and BouLac schemes, implying that these two are more responsive to wind variability under strong disturbance conditions.

Figure 7The Mean Error (ME) and Root Mean Square Error (RMSE) between observed and simulated 10 m speed at all stations (2 min average).
In summary, absolute error reflects average bias, while RMSE is more sensitive to outliers. Together, they help assess the stability and reliability of each scheme. Differences arise from varying treatments of turbulent mixing and PBL structures, which are further explored in the next section.

Figure 8Height-time evolution of turbulent kinetic energy (TKE), planetary boundary layer height (PBLH), and horizontal wind at Qitang. Colors represent TKE (m2 s−2); magenta line indicates hourly PBLH (m); wind vectors show horizontal winds at various altitudes.
3.3 Vertical structures
To assess the performance of different PBL schemes in simulating turbulent structures under fire-induced disturbances, three representative stations were selected: the downwind of the fire area (Fig. 8), the near the fire area (Fig. 9), and the upwind of the fire area (Fig. 10). Comparisons are consisting of the simulated turbulent kinetic energy (TKE), planetary boundary layer height (PBLH), and horizontal wind fields at different altitudes over time in order to evaluate the fire-atmosphere coupling characteristics under all schemes. Overall, all PBL schemes capture the diurnal evolution of turbulence and PBL height increases and TKE strengthens during the day, including both decrease significantly at night, with the TKE close to zero. This synchronicity demonstrates the physical consistency between the diagnosed PBLH and TKE.

Figure 9Height-time evolution of turbulent kinetic energy (TKE), planetary boundary layer height (PBLH), and horizontal wind at Lianhuacun. Colors represent TKE (m2 s−2); magenta line indicates hourly PBLH (m); wind vectors show horizontal winds at various altitudes.

Figure 10Height-time evolution of turbulent kinetic energy (TKE), planetary boundary layer height (PBLH), and horizontal wind at Damotan. Colors represent TKE (m2 s−2); magenta line indicates hourly PBLH (m); wind vectors show horizontal winds at various altitudes.
The hourly variations of turbulent kinetic energy (TKE), planetary boundary layer height (PBLH), and wind field at the downwind site (Qitang) are shown in Fig. 8. Based on the background wind field over the simulation domain, Qitang lies within the main wind direction and is therefore prone to disturbances induced by fire-related thermal forcing. Figure 8 reveals significant differences in simulated PBL heights and TKE intensities across different PBL schemes. The MYNN2, MYNN3, and BouLac schemes show maximum PBL heights exceeding 2500 m, with TKE values exceeding 1.5 m2 s−2 during most periods. Among them, the MYNN2 scheme is relatively weaker, while the MYNN3 and BouLac schemes exhibit daytime TKE peaks exceeding 2.4 m2 s−2, effectively capturing the thermal disturbances induced by the fire. In contrast, the UW and MYJ schemes show maximum PBL heights generally below 2000 m, with the UW scheme sometimes even under 1500 m. Notably, TKE intensities in both schemes remain mostly below 1.5 m2 s−2, and for MYJ scheme, even below 0.9 m2 s−2 during much of the simulation period, indicating a weak representation of turbulent activity and an inability to capture circulation changes induced by fire-related thermal effects.
The height–time cross sections of wind vectors simulated by each scheme further illustrate the vertical evolution of the wind field structure. All schemes simulate strong wind zones extending from the surface up to about 2000 m on 23 and 24 August, though with substantial differences in wind speed magnitude. On 22 and 25 August, each scheme shows a low-level wind direction shift accompanied by reduced wind speeds, with timing and intensity varying by scheme. The BouLac scheme captures only the initial directional rotation, which is likely associated with mesoscale convective eddies triggered by local thermal heterogeneity that transiently reorganize the wind field. Differences also emerge in the representation of wind shear. The MYNN3 and MYNN2 schemes capture pronounced veering wind vector structures from the surface to higher levels and simulate the formation of a low-level jet within the PBL, especially notable in the MYNN3 scheme-an important mechanism for long-range thermal transport. While the BouLac scheme also shows vertical wind shear, the wind speeds are weaker and directional changes less distinct. The MYJ and UW schemes, in contrast, depict a near-laminar, stratified wind field with insufficient shear structures to support effective vertical development of thermally driven disturbances.
Compared to the downwind site at Qitang, the emergency station (Fig. 9) is located near the fire front and is more directly affected by the thermal disturbances from the fire, leading to a significantly enhanced turbulent structure within the boundary layer. Overall, all PBL schemes show some degree of TKE increase at this site, but with notable differences in response intensity and vertical structure. The MYNN3 scheme exhibits the strongest TKE response, with high TKE values extending from the surface up to 2 km during multiple periods, almost throughout the entire simulation, indicating a typical thermally driven strong convective structure. Although the UW scheme also responds to fire-induced thermal disturbances with some TKE enhancement near the surface, its vertical structure is relatively compact due to a generally lower boundary layer height, and the TKE intensity is weaker than that in the MYNN3 scheme. TKE enhancement under the BouLac and MYNN2 schemes is relatively limited; while they also show a certain response to fire forcing, neither the intensity nor the vertical extent is noticeably stronger than that observed at the downwind Qitang site, suggesting their limited capability to represent fire-induced thermal forcing. The MYJ scheme shows the weakest performance at this site, failing to capture the turbulence enhancement triggered by the fire.
Regarding wind field structures, during 23 and 24 August, the lower atmosphere over the emergency site transitions from a continuous strong wind zone into alternating regions of strong and weak winds, exhibiting significant local disturbance features, consistent with wind field evolution on 22 and 25 August. This indicates that the wind field structure near the fire is strongly driven by thermal disturbances, where locally generated thermal circulations reorganize the low-level wind field. The MYNN3 scheme performs best in representing local circulation structures, successfully simulating abrupt wind field changes and vertical structural variations under thermally driven disturbances, consistent with the typical boundary layer response dominated by sensible heat. The UW scheme can also detect the formation of local circulations, but due to weaker turbulence intensity and lower boundary layer height, its representation is less pronounced than that of MYNN3 scheme. In contrast, MYNN2 and MYJ schemes have inadequate capability in capturing wind field disturbances under fire heat forcing, with little directional variation simulated. The BouLac scheme simulates some vertical wind shear during certain periods, but the overall shear strength is limited, making it difficult to accurately reproduce wind field adjustments triggered by local thermal disturbances.
Compared to the downwind station (Qitang) and the near-fire emergency station (Lianhuacun), the urban station (Damotan) (Fig. 10) located in the upwind region lies upstream of the fire and is not directly affected by thermal disturbances from the heat source. However, due to the combined effects of terrain and the urban heat island effect, its boundary layer structure and turbulence characteristics exhibit a different response mechanism from the other two sites. Simulation results show that the MYNN3 scheme produces higher near-surface TKE intensity at the urban site than at Qitang, exceeding 3.3 m2 s−2 during several periods. However, the boundary layer height does not increase correspondingly, indicating that the enhanced sensible heat flux and surface roughness over the urban surface play a dominant role in near-surface turbulence generation. The MYNN2 scheme also simulates a certain increasing trend in TKE, though its intensity is significantly weaker than that of MYNN3 scheme. The BouLac scheme produces weak TKE in urban areas and fails to effectively capture turbulence enhancement induced by the urban heat island, suggesting inadequate adaptability of its local mixing parameterization under complex surface conditions. The MYJ and UW schemes show little change in TKE and boundary layer height, making them inadequate for reflecting boundary layer structural adjustments driven by urban thermal forcing.
The wind field structure further reveals the differences in each PBL scheme's response to local urban circulations. Both the MYNN3 and MYNN2 schemes simulate clear wind direction rotation structures at the urban site, with the MYNN3 scheme producing larger variations in wind speed. Notably, at altitudes around 2–3 km, significant directional shifts and vertical wind shear structures are simulated, indicating a strong capability to capture non-uniform sensible heat-driven circulations induced by the urban heat island. In contrast, the BouLac scheme simulates generally weaker wind speeds, lacking clear vertical wind shear changes and failing to accurately reproduce wind field responses to local thermal disturbances. The MYJ and UW schemes still present relatively statically stratified wind field structures in this region, lacking effective shear or rotation features, which limits their ability to simulate responses to local thermal disturbances.
The comparison across different regions reveals the spatial heterogeneity and mechanistic differences in boundary layer responses. The upwind urban station, influenced by the urban heat island effect and enhanced surface roughness, shows significantly increased near-surface TKE without a corresponding rise in boundary layer height. The emergency station near the fire site, directly affected by heat release, exhibits generally higher TKE values and elevated boundary layer height, making it a sensitive area for evaluating wildfire-induced disturbances. The downwind station reflects a combined influence of both the background and disturbed wind fields, representing a transitional zone. In summary, the five boundary layer schemes demonstrate varying responses at each site, but the MYNN3 scheme consistently captures strong turbulence structures, distinctive wind direction rotations, and significant vertical wind shear across all three regions, indicating a high sensitivity to local thermally driven processes. In contrast, while MYNN2 and BouLac schemes partially reproduce disturbance characteristics, their ability to capture the combined effects of complex terrain and non-uniform thermal forcing is limited. The UW scheme can detect thermal disturbances at the emergency site, but its vertical extent is restricted due to lower boundary layer heights. The MYJ scheme tends to simulate a more statically stable state overall and fails to effectively characterize the response to thermal disturbances.
3.4 Determination of the turbulent transport term
Based on the MYNN3 scheme's strong performance in simulating heat-induced disturbances, this section further analyzes the time evolution of the TKE budget terms under the MYNN3 scheme. These budget terms include buoyancy production, shear production, vertical transport, and dissipation rate. Buoyancy production represents the generation or suppression of turbulence due to thermal stratification (stable/unstable conditions). Shear production refers to turbulence generation due to vertical gradients in wind speed. Vertical transport of TKE describes the vertical redistribution of turbulence energy within the boundary layer (positive values indicate upward transport from the surface). Dissipation rate indicates the rate at which turbulent kinetic energy is converted into heat and dissipated. These budget terms collectively describe the processes of turbulence generation, maintenance, and dissipation, playing a decisive role in the physical distribution of near-surface meteorological variables. By analyzing the performance of the MYNN3 scheme in simulating these TKE budget components, we can further assess its capability to represent turbulent processes in boundary layer.
Figure 11 illustrates the temporal evolution of TKE budget terms at the emergency station as simulated by the MYNN3 scheme. The buoyancy term shows a pronounced positive distribution near the surface (330–2000 m) during daytime, forming a continuous banded structure. This indicates that the scheme effectively captures thermally driven convective activity. Intense surface heating makes buoyancy the dominant TKE source before 11:00 BJT (Beijing time, UTC+8) on the 25th. At night, this term weakens significantly or even vanishes, reflecting the diurnal variability of buoyancy effects. Shear production remains generally weak, with occasional enhancements in the 300–1000 m layer near the surface (e.g., around 12:00 BJT on the 24th and 25th), suggesting that wind shear contributes only modestly to turbulence generation at this site. The vertical transport term exhibits a distinct bidirectional pattern. Positive values mainly occur during the day (e.g., from 09:00 to 15:00 BJT on the 24th) and extend upward beyond 3000 m, indicating upward transport of TKE that supports upper-layer disturbances. At night or during periods of stable stratification, negative values occasionally appear, implying downward feedback of turbulence toward the surface. This reverse transport highlights the asymmetry and feedback mechanisms in mixed-layer development. The dissipation term is generally weak and localized to near-surface layers (300–800 m) over short time intervals (e.g., at 09:00 BJT on the 24th and 15:00 BJT on the 25th). It represents the conversion of TKE into internal energy via viscous dissipation and indicates that turbulence activity in this scheme relies more on generation terms than on dissipation.

Figure 11Height–time evolution of TKE budget terms (buoyancy, shear, vertical transport, dissipation) at the Lianhuacun station simulated by MYNN3. Unit: m2 s−2.
In summary, the MYNN3 boundary layer scheme demonstrates a buoyancy-dominated turbulence generation mechanism near the fire, with vertical transport playing a bidirectional regulatory role, while shear and dissipation terms are relatively weak. This underscores the scheme's strong responsiveness to thermally driven convection, which serves as an important physical basis for its superior performance in reproducing burned area patterns.
In complex terrain, wildfire behavior is strongly modulated by terrain-induced circulations and fire–atmosphere interactions. In this study, the coupled WRF-Fire model is applied with a 300 m atmospheric grid and a 30 m fire grid, a configuration that enables the representation of fuel heterogeneity and terrain effects on fire spread while resolving mesoscale circulations relevant to wildfire evolution.
At a horizontal resolution of 300 m, the model does not satisfy the requirements for large-eddy simulation (LES), and the strong fire-induced heat fluxes further limit numerical stability and computational efficiency. As a result, the use of planetary boundary layer (PBL) parameterization schemes represents a pragmatic compromise that allows multi-day simulations and systematic sensitivity experiments. The focus of this study is therefore on the response characteristics of near-surface meteorological variables and the relative behavior of different PBL schemes under wildfire conditions, rather than on explicitly resolving fire-induced microscale turbulence.
Consequently, microscale turbulent structures and detailed thermal plume dynamics in the immediate vicinity of the fire are not explicitly resolved. This scale limitation should be considered when interpreting the simulated fire–atmosphere interactions and represents a primary constraint of the present model configuration.
Regarding 10 m wind speed, MYNN3 exhibits relatively larger mean bias and RMSE, which has been showed in the manuscript. A unique mechanism responsible for this bias cannot be unambiguously identified; instead, it likely reflects the combined influence of several factors. First, 10 m wind speed is highly sensitive to sub-grid terrain variability and local channeling effects that are not fully resolved at 300 m resolution. Second, fire-induced thermal perturbations introduce strong spatiotemporal heterogeneity in the near-surface wind field, increasing the susceptibility of station-scale wind errors to local amplification. Third, as 10 m wind speed is diagnosed through surface-layer similarity theory rather than explicitly resolved by the PBL schemes, differences among PBL schemes affect the diagnosed wind indirectly through their influence on turbulence mixing, wind profile shape, and near-surface stability. Under complex terrain and strong fire forcing, this indirect influence may be enhanced, leading to increased uncertainty in the diagnosed 10 m wind speed.
In addition to the enhanced uncertainty in diagnosed near-surface wind speed, MYNN3 shows episodic nonlinear behavior in thermodynamic variables, which can be better understood by examining the evolution of its boundary layer turbulence structure.
After 11:00 BJT on 25 August 2022, the MYNN3 scheme produced a sudden drop in 2 m air temperature across all stations, a pattern that sharply contrasted with the evolution trends of other boundary layer schemes. Analysis of the corresponding TKE budget terms (Fig. 11) reveals that this temperature drop is closely related to a dramatic shift in the turbulence structure within the boundary layer. During this period, the previously buoyancy-driven turbulence generation mechanism abruptly shifted. The buoyancy term of TKE changed from positive to negative, indicating a significant weakening or even suppression of surface convective activity. At the same time, both the shear production and dissipation terms intensified, particularly within the near-surface to 800 m layer, reflecting the transition to a mechanically-driven turbulence regime under enhanced atmospheric stability. Additionally, the vertical transport term turned negative, suggesting a redistribution of turbulent energy from upper levels downward, further suppressing convective activity and heat transport within the boundary layer. The combined effect of these changes led to a sharp decline in boundary layer mixing capacity, limiting the ability of surface energy to maintain thermal equilibrium, which ultimately manifested as a rapid drop in 2 m temperature. This result indicates that although the MYNN3 scheme generally exhibits strong thermal responsiveness, its sensitivity to shear disturbances under specific conditions may induce nonlinear shifts in TKE structure, thereby affecting the stability of near-surface temperature simulations.
The differing performance of boundary layer schemes in variable simulations is closely tied to the design of their physical mechanisms. The MYNN3 scheme, employing a third-order turbulence closure, emphasizes vertical turbulence structure and nonlocal mixing processes, providing strong local adaptability and effectively reducing systematic bias in temperature simulations (Nakanishi and Niino, 2009). However, in complex terrain or under highly unstable conditions, its high sensitivity to local disturbances may also result in increased error fluctuations, leading to higher RMSE values. The BouLac scheme (Bougeault and Lacarrere, 1989), based on diagnostic TKE diffusion, exhibits stronger diffusive capability, which helps suppress error fluctuations arising from small-scale instabilities, thereby lowering RMSE. However, it lacks accuracy in representing local circulation features. As a predecessor to MYNN3, the MYNN2 scheme (Nakanishi and Niino, 2006) also uses a TKE prognostic approach, but with a more conservative turbulence adjustment process, resulting in moderate ME and RMSE values. The UW scheme (Bretherton and Park, 2009), based on the mixing length theory, emphasizes nonlocal mixing processes. However, under conditions of sharp vertical structural change, its simulation accuracy may be limited. The MYJ scheme, based on a local closure approach and relying on vertical gradient calculations, struggles to capture internal boundary layer structure changes accurately, resulting in significant systematic bias and large error fluctuations across most stations (Janjić, 1994).
In this study, a triple-nested simulation system was built using the coupled atmosphere-fire model WRF-Fire (v4.6) to reproduce a forest fire event that occurred in the Jinyun Mountain area of Chongqing, China, from 00:00 UTC on 21 August to 00:00 UTC on 27 August 2022. The innermost domain used an atmospheric resolution of 300 m and a fire model resolution of 30 m. The study systematically evaluated the applicability and performance differences of five commonly used planetary boundary layer (PBL) schemes under complex mountainous terrain. The following main conclusions are yielded through the observational comparisons, statistical analysis, and physical diagnostics.
Analysis of near-surface meteorological temperature and wind speed revealed that the MYNN3 scheme had the smallest systematic bias in simulating 2 m temperature at six observation stations. It best captured the variations in temperature under fire-induced disturbances, making it especially suitable for non-stationary PBLs with frequent thermal perturbations. However, it showed some fictitious volatility during periods of intense local disturbance. In contrast, the BouLac scheme, though exhibiting slightly larger systematic errors, achieved the lowest RMSE in wind speed, demonstrating outstanding stability. But this also makes it not suitable for the local circulation.
Investigation of vertical structures of TKE, PBL and wind vector showed that MYNN3 effectively captured atmospheric instability features induced by fire heating at all stations. It reproduced strong TKE fields, distinct wind direction rotations, and vertical wind shear, particularly in the urban upstream zone and fire-adjacent sites, reflecting classic thermal plume transport and localized circulation. The UW scheme showed insufficient response ability, with generally lower turbulence energy and PBL height. MYJ and MYNN2 schemes lacked sufficient sensitivity to thermal perturbations and could not adequately resolve the plume structure or vertical transport. The BouLac scheme performed well in the downwind areas, but which is less responsive to non-uniform thermal forcing in complex terrain.
Diagnostic analysis revealed strong spatial heterogeneity in disturbance mechanisms among sites. Downwind areas are mainly controlled by thermal plume advection, with turbulence and PBL structures highly scheme dependent. Fire-adjacent areas experienced direct thermal forcing, leading to intense boundary layer disturbances. Urban upstream areas showed enhanced near-surface turbulence and wind field reconstruction due to urban heat island effects and increased surface roughness, forming independent disturbance centers. Accurate simulation in different regions is critical for characterizing fire-related thermal-dynamic feedback.
Further analysis of turbulence budget terms confirmed that MYNN3 scheme reproduced a buoyancy-driven TKE generation mechanism during daytime fire activity. Vertical transport played a key role in plume development and upper-layer disturbance maintenance. Shear production and dissipation remained relatively minor during strong thermal forcing but became more significant in the later decay phase of the fire. These insights support the construction of turbulent energy redistribution frameworks for future research.
In summary, the MYNN3 scheme, featuring nonlocal mixing and TKE prognostic capability, demonstrated the strongest adaptability and performance in coupled fire–atmosphere simulations over complex mountainous and urban terrains. It is particularly effective in environments characterized by intense thermal forcing and multi-scale circulations. Future research should explore its applicability and limitations under varying meteorological backgrounds, fuel types, and surface heterogeneity, and promote its integration into operational wildfire risk forecasting systems.
The WRF-Fire model used in this study is based on version 4.6 (https://doi.org/10.5065/1dfh-6p97, Skamarock et al., 2021) of the WRF modeling system, which is stored at Zenodo: https://doi.org/10.5281/zenodo.15851773 (Wang et al., 2025b). ERA5 reanalysis data (Hersbach et al., 2020) used for meteorological forcing were obtained from the Copernicus Climate Data Store: https://cds.climate.copernicus.eu (last access: June 2025), https://doi.org/10.24381/cds.143582cf (Copernicus Climate Change Service, 2026). The topographic data (Farr and Kobrick, 2000) are available from the Shuttle Radar Topography Mission (SRTM) 30 m DEM Digital Elevation Database (https://portal.opentopography.org/datasetMetadata?otCollectionID=OT.042013.4326.1, last access: June 2025), https://doi.org/10.5066/F7PR7TFT (Farr et al., 2026). All code, configuration files, and datasets necessary to reproduce the results in this study are freely available. The customized namelist configuration file, station data and fire output datasets used in this study are publicly archived on Zenodo: https://doi.org/10.5281/zenodo.15772925 (Wang et al., 2025c).
YL and LH conceptualized the study and conducted the simulations. YC, LM, and QC analyzed the model results, and LH contributed to the interpretations. The original draft of the paper was written by YL, and all authors took part in the editing and revision of the paper.
The contact author has declared that none of the authors has any competing interests.
Publisher's note: Copernicus Publications remains neutral with regard to jurisdictional claims made in the text, published maps, institutional affiliations, or any other geographical representation in this paper. The authors bear the ultimate responsibility for providing appropriate place names. Views expressed in the text are those of the authors and do not necessarily reflect the views of the publisher.
The authors acknowledge NCAR for the WRF model and ECMWF for the ERA5 reanalysis datasets. Fuel type data are derived from the FROM–GLC of Tsinghua University.
This research was funded by the National Key Research and Development Plan (grant no. 2022YFC3003004) and the National Institute of Natural Hazards, Ministry of Emergency Management of China (grant no. ZDJ2025-51).
This paper was edited by Nicola Bodini and reviewed by Harish Gopalan and one anonymous referee.
Bougeault, P. and Lacarrere, P.: Parameterization of Orography-Induced Turbulence in a Mesobeta–Scale Model, Mon. Weather Rev., 117, 1872–1890, https://doi.org/10.1175/1520-0493(1989)117<1872:POOITI>2.0.CO;2, 1989.
Bretherton, C. S. and Park, S.: A New Moist Turbulence Parameterization in the Community Atmosphere Model, J. Climate, 22, 3422–3448, https://doi.org/10.1175/2008JCLI2556.1, 2009.
Brown, P. T., Hanley, H., Mahesh, A., Reed, C., Strenfel, S. J., Davis, S. J., Kochanski, A. K., and Clements, C. B.: Climate warming increases extreme daily wildfire growth risk in California, Nature, 621, 760–766, https://doi.org/10.1038/s41586-023-06444-3, 2023.
Campbell, P. C., Bash, J. O., and Spero, T. L.: Updates to the Noah Land Surface Model in WRF-CMAQ to Improve Simulated Meteorology, Air Quality, and Deposition, J. Adv. Model. Earth Syst., 11, 231–256, https://doi.org/10.1029/2018MS001422, 2019.
Campos, C., Couto, F. T., Filippi, J.-B., Baggio, R., and Salgado, R.: Modelling pyro-convection phenomenon during a mega-fire event in Portugal, Atmos. Res., 290, 106776, https://doi.org/10.1016/j.atmosres.2023.106776, 2023.
Coen, J.: Some Requirements for Simulating Wildland Fire Behavior Using Insight from Coupled Weather–Wildland Fire Models, Fire, 1, 6, https://doi.org/10.3390/fire1010006, 2018.
Coen, J. L., Cameron, M., Michalakes, J., Patton, E. G., Riggan, P. J., and Yedinak, K. M.: WRF-Fire: Coupled Weather–Wildland Fire Modeling with the Weather Research and Forecasting Model, J. Appl. Meteorol. Clim., 52, 16–38, https://doi.org/10.1175/JAMC-D-12-023.1, 2013.
Copernicus Climate Change Service (C3S): ERA5 global reanalysis, Climate Data Store (CDS) [data set], https://doi.org/10.24381/cds.143582cf, 2026.
Duane, A., Castellnou, M., and Brotons, L.: Towards a comprehensive look at global drivers of novel extreme wildfire events, Climatic Change, 165, 43, https://doi.org/10.1007/s10584-021-03066-4, 2021.
Farr, T. G. and Kobrick, M.: Shuttle radar topography mission produces a wealth of data, Eos Trans. Am. Geophys. Union, 81, 583–585, https://doi.org/10.1029/EO081i048p00583, 2000.
Farr, T. G., Rosen, P. A., Caro, E., Crippen, R., Duren, R., Hensley, S., Kobrick, M., Paller, M., Rodriguez, E., Roth, L., Seal, D., Shaffer, S., Shimada, J., Umland, J., Werner, M., Oskin, M., Burbank, D., and Alsdorf, D.: Shuttle Radar Topography Mission (SRTM) global digital elevation model, NASA EOSDIS Land Processes DAAC [data set], https://doi.org/10.5066/F7PR7TFT, 2026.
Finney, M. A., Cohen, J. D., Forthofer, J. M., McAllister, S. S., Gollner, M. J., Gorham, D. J., Saito, K., Akafuah, N. K., Adam, B. A., and English, J. D.: Role of buoyant flame dynamics in wildfire spread, P. Natl. Acad. Sci. USA, 112, 9833–9838, https://doi.org/10.1073/pnas.1504498112, 2015.
Hersbach, H., Bell, B., Berrisford, P., Hirahara, S., Horányi, A., Muñoz-Sabater, J., Nicolas, J., Peubey, C., Radu, R., Schepers, D., Simmons, A., Soci, C., Abdalla, S., Abellan, X., Balsamo, G., Bechtold, P., Biavati, G., Bidlot, J., Bonavita, M., De Chiara, G., Dahlgren, P., Dee, D., Diamantakis, M., Dragani, R., Flemming, J., Forbes, R., Fuentes, M., Geer, A., Haimberger, L., Healy, S., Hogan, R. J., Hólm, E., Janisková, M., Keeley, S., Laloyaux, P., Lopez, P., Lupu, C., Radnoti, G., de Rosnay, P., Rozum, I., Vamborg, F., Villaume, S., and Thépaut, J.-N.: The ERA5 global reanalysis, Q. J. Roy. Meteorol. Soc., 146, 1999–2049, https://doi.org/10.1002/qj.3803, 2020.
Iacono, M. J., Delamere, J. S., Mlawer, E. J., Shephard, M. W., Clough, S. A., and Collins, W. D.: Radiative forcing by long-lived greenhouse gases: Calculations with the AER radiative transfer models, J. Geophys. Res.-Atmos., 113, D13103, https://doi.org/10.1029/2008JD009944, 2008.
Janjić, Z. I.: The Step-Mountain Eta Coordinate Model: Further Developments of the Convection, Viscous Sublayer, and Turbulence Closure Schemes, Mon. Weather Rev., 122, 927–945, https://doi.org/10.1175/1520-0493(1994)122<0927:TSMECM>2.0.CO;2, 1994.
Jia, W., Zhang, X., Wang, H., Wang, Y., Wang, D., Zhong, J., Zhang, W., Zhang, L., Guo, L., Lei, Y., Wang, J., Yang, Y., and Lin, Y.: Comprehensive evaluation of typical planetary boundary layer (PBL) parameterization schemes in China – Part 1: Understanding expressiveness of schemes for different regions from the mechanism perspective, Geosci. Model Dev., 16, 6635–6670, https://doi.org/10.5194/gmd-16-6635-2023, 2023.
Jones, M. W., Abatzoglou, J. T., Veraverbeke, S., Andela, N., Lasslop, G., Forkel, M., Smith, A. J. P., Burton, C., Betts, R. A., Van Der Werf, G. R., Sitch, S., Canadell, J. G., Santín, C., Kolden, C., Doerr, S. H., and Le Quéré, C.: Global and Regional Trends and Drivers of Fire Under Climate Change, Rev. Geophys., 60, https://doi.org/10.1029/2020RG000726, 2022.
Li, M., Jia, L., Zhang, F., Hu, M., Shi, Y., and Chen, X.: Characteristics of haze weather in Chongqing, China and its determinants analysis based on automatic monitoring stations, Atmos. Pollut. Res., 7, 638–646, https://doi.org/10.1016/j.apr.2016.02.012, 2016.
Mandel, J., Beezley, J. D., and Kochanski, A. K.: Coupled atmosphere-wildland fire modeling with WRF 3.3 and SFIRE 2011, Geosci. Model Dev., 4, 591–610, https://doi.org/10.5194/gmd-4-591-2011, 2011.
Menezes, I. C., Lopes, D., Fernandes, A. P., Borrego, C., Viegas, D. X., and Miranda, A. I.: Atmospheric dynamics and fire-induced phenomena: Insights from a comprehensive analysis of the Sertã wildfire event, Atmos. Res., 310, 107649, https://doi.org/10.1016/j.atmosres.2024.107649, 2024.
Monin, A. S. and Obukhov, A. M.: Basic laws of turbulent mixing in the surface layer of the atmosphere, Contrib. Geophys. Inst. Acad. Sci. USSR, 24, 163–187, 1954.
Mulverhill, C., Coops, N. C., Boulanger, Y., Hoffman, K. M., Cardinal Christianson, A., Daniels, L. D., Flamand-Hubert, M., Wotherspoon, A. R., and Achim, A.: Wildfires are spreading fast in Canada – we must strengthen forests for the future, Nature, 633, 282–285, https://doi.org/10.1038/d41586-024-02919-z, 2024.
Nakanishi, M. and Niino, H.: An Improved Mellor–Yamada Level-3 Model: Its Numerical Stability and Application to a Regional Prediction of Advection Fog, Bound.-Lay. Meteorol., 119, 397–407, https://doi.org/10.1007/s10546-005-9030-8, 2006.
Nakanishi, M. and Niino, H.: Development of an Improved Turbulence Closure Model for the Atmospheric Boundary Layer, J. Meteorol. Soc. Jpn. Ser. II, 87, 895–912, https://doi.org/10.2151/jmsj.87.895, 2009.
Richardson, D., Black, A. S., Irving, D., Matear, R. J., Monselesan, D. P., Risbey, J. S., Squire, D. T., and Tozer, C. R.: Global increase in wildfire potential from compound fire weather and drought, npj Clim. Atmos. Sci., 5, 23, https://doi.org/10.1038/s41612-022-00248-4, 2022.
Richardson, D., Ribeiro, A. F. S., Batibeniz, F., Quilcaille, Y., Taschetto, A. S., Pitman, A. J., and Zscheischler, J.: Increasing Fire Weather Season Overlap Between North America and Australia Challenges Firefighting Cooperation, Earth's Future, 13, e2024EF005030, https://doi.org/10.1029/2024EF005030, 2025.
Shamsaei, K., Juliano, T. W., Roberts, M., Ebrahimian, H., Kosovic, B., Lareau, N. P., and Taciroglu, E.: Coupled fire-atmosphere simulation of the 2018 Camp Fire using WRF-Fire, Int. J. Wildland Fire, 32, 195–221, https://doi.org/10.1071/WF22013, 2023.
Skamarock, W. C., Klemp, J. B., Dudhia, J., Gill, D. O., Liu, Z., Berner, J., Wang, W., Powers, J. G., Duda, M. G., Barker, D. M., and Huang, X.-Y.: A Description of the Advanced Research WRF Model Version 4, NCAR Tech. Note NCAR/TN-556+STR, NCAR [code], https://doi.org/10.5065/1dfh-6p97, 2021.
Thompson, G., Rasmussen, R. M., and Manning, K.: Explicit Forecasts of Winter Precipitation Using an Improved Bulk Microphysics Scheme. Part I: Description and Sensitivity Analysis, Mon. Weather Rev., 132, 519–542, https://doi.org/10.1175/1520-0493(2004)132<0519:EFOWPU>2.0.CO;2, 2004.
Wang, Q., Zeng, B., Chen, G., and Li, Y.: Simulation performance of planetary boundary layer schemes in WRF v4.3.1 for near-surface wind over the western Sichuan Basin: a single-site assessment, Geosci. Model Dev., 18, 1769–1784, https://doi.org/10.5194/gmd-18-1769-2025, 2025a.
Wang, Y. L., Yang, C., Shi, L. M., Yao, Q. C., and Zhong, L. H.: Model for “Dynamical Linkages Between Planetary Boundary Layer Schemes and Wildfire Spread Processes”, Zenodo [code], https://doi.org/10.5281/zenodo.15851773, 2025b.
Wang, Y. L., Yang, C., Shi, L. M., Yao, Q. C., and Zhong, L. H.: Data for “Dynamical Linkages Between Planetary Boundary Layer Schemes and Wildfire Spread Processes”, Zenodo [data set], https://doi.org/10.5281/zenodo.15772925, 2025c.
Yao, R., Luo, Q., Luo, Z., Jiang, L., and Yang, Y.: An integrated study of urban microclimates in Chongqing, China: Historical weather data, transverse measurement and numerical simulation, Sustain. Cities Soc., 14, 187–199, https://doi.org/10.1016/j.scs.2014.09.007, 2015.
Zhou, J., Zhao, J., Li, Y., Bai, Y., Wu, Y., Xiang, B., and Zhu, H.: The hottest center: characteristics of high temperatures in midsummer of 2022 in Chongqing and its comparison with 2006, Theor. Appl. Climatol., 155, 151–162, https://doi.org/10.1007/s00704-023-04609-8, 2024.