the Creative Commons Attribution 4.0 License.
the Creative Commons Attribution 4.0 License.
 | 07 Jan 2026
Sentinel-1 SAR-based globally distributed co-seismic landslide detection by deep neural networks
Alessandro Mondini
Kushanav Bhuyan
Chengyong Fang
Oriol Monserrat
Alessandro Novellino
Filippo Catani
Rapid response to multiple landslide events demands accurate, all-weather, day-and-night detection capabilities. Optical remote sensing has advanced landslide detection but remains limited under adverse weather and lighting conditions. Synthetic Aperture Radar, resilient to these constraints, remains underexplored for automated landslide detection due to challenges such as complex pre-processing and geometric distortions. This study integrates Deep Neural Networks with Sentinel-1 backscatter data for co-seismic landslide detection, utilizing a data-centric approach. We train and test the models using 11 earthquake-induced widespread landslide events, covering ≈ 73 000 landslides across diverse geologic and climatic settings. Inference on unseen events in Haiti (2021) and Sumatra (2022) demonstrates robust transferability, achieving F1-scores up to 82 %. Using explainable artificial intelligence, we highlight the discriminative capability of change detection bands over backscatter alone. Our findings emphasize the potential of SAR-based DNN models for worldwide, generalized, and rapid landslide detection, addressing critical gaps in current methods that solely use optical data. This research lays a foundation for broader applications in automated SAR-based earth surface change detection, particularly in complex, hilly and mountainous terrains.
- Article
(10794 KB) - Full-text XML
-
Supplement
(851 KB) - BibTeX
- EndNote


Slope instabilities, commonly referred to as landslides, represent a widespread natural occurrence in mountainous and hilly regions, presenting substantial threats to both human lives and infrastructure (Froude and Petley, 2018). Earthquakes, heavy rainfall, and human activities serve as the primary triggers for landslides (Ferrario, 2019; Serey et al., 2019; Song et al., 2019; Wang et al., 2019). Notably, a single event can involve either one or multiple landslide failures (Guzzetti et al., 2012), commonly referred to as multiple landslide events (MLEs). Over the last 15 years, several co-seismic MLEs have occurred, impacting wide regions within remarkably brief timeframes (Tanyaş et al., 2017). In the aftermath of such occurrences, it is important to investigate locations of landslides to assess damages to natural and anthropogenic landscapes. Williams et al. (2018) and Amatya et al. (2023) highlighted the importance of rapid mapping in disaster response using as disasters the 2015 Gorkha and 2021 Haiti MLE co-seismic landslides. Moreover, a comprehensive understanding of these slope instability processes begins with a spatial assessment of the slope failures both for rainfall (Nocentini et al., 2023; Segoni et al., 2014) and earthquake-induced landslides (Meena and Piralilou, 2019). Information concerning the location and timing of failed slopes is usually recorded in landslide inventories (Eeckhaut et al., 2013). Traditionally, the accurate positioning for landslides involved mainly the Global Satellite Navigation System (GNSS), topographic total station, and aerial photogrammetry surveys, known for their accuracy. However, these surveys are expensive, pose risks in challenging terrains (Manconi et al., 2014), and are exceptionally time-consuming. How ever, time is key during damage assessments of MLE affecting large areas (Williams et al., 2018). As a result, satellite products have emerged as a cost-effective alternative for generating landslide inventories (Ghorbanzadeh et al., 2019). The field of remote sensing, particularly Earth observation (EO) imagery analysis, has been extensively investigated for automatically extracting landslide location. However, a significant portion of landslides lacks comprehensive and timely information (Guzzetti et al., 2012). This deficiency stems from the lack of systematic coverage in existing EO data (Williams et al., 2018). The challenge is exacerbated by the reliance on optical imagery. The methods that use this data type are generally precise, however, limited when solar reflection is absent, or in presence of cloud obscuration. Numerous research has recently combined optical data with deep learning (DL) models for landslide detection (Novellino et al., 2024). These approaches range from utilizing crowdsourced data (Catani, 2021) and Unmanned Aerial Vehicles (UAVs) (Beni et al., 2023; Dai et al., 2023b) to analyzing LIDAR (Fang et al., 2022), and optical satellite imagery (Bhuyan et al., 2023; Prakash et al., 2021). Some studies have also investigated the incorporation of morphological factors alongside satellite data for DL-based landslide detection (Meena et al., 2021). Lastly, there is a growing trend towards training DL models capable of delivering reliable predictions in unseen areas for swift assessment of new MLEs. Some of these studies concentrate on individual data sources, such as Copernicus Sentinel-2 (Prakash et al., 2021; Ghorbanzadeh et al., 2022) and PlanetScope (Meena et al., 2023), while others examine the integration of multi-source data (Xu et al., 2024; Fang et al., 2024) to enhance accuracy and improve transferability. However, persistent clouds hinder the timely acquisition of data, impeding effective disaster management operations (Mondini et al., 2021a). This issue is prevalent in numerous tropical countries and is universally present in the context of landslide activations induced by storms (Wilson and Jetz, 2016) or where, following earthquakes that triggered MLEs, the first cloud-free optical image is not rapidly available (Williams et al., 2018). SAR sensors represent a valuable alternative due to their capacity to acquire information on the ground in all-weather and illumination conditions (Hertel et al., 2023). Recently, there has been a growing interest in using the amplitude information to identify and rapid landslide failures (Burrows et al., 2020, 2019; Catani et al., 2005; Chorowicz et al., 1998; Mondini et al., 2019; Santangelo et al., 2022; Singhroy, 1995). Landslides are identified as anomalies in SAR products based on tone, texture, pattern, mottling, or their changes (Santangelo et al., 2022; Singhroy, 1995; Lindsay et al., 2023). Konishi and Suga (2018), Suga and Konishi (2012), and Uemoto et al. (2019) utilized X-band COSMO-SkyMed and airborne Pi-SAR2 imagery, respectively, for landslide mapping in Japan.
Handwerger et al. (2022) designed a GEE-based approach to produce density heatmaps with Sentinel-1 C-band data over several MLEs. However, while most of these methods have demonstrated the ability to successfully detect landslides in individual study areas, the issue of transferability in different settings persists (Mondini et al., 2021b). While artificial intelligence shows promise in training generalized models for automatically assessing target locations using satellite imagery (Guan et al., 2023), the focus on optical-based automated landslide detection outweighs studies utilizing SAR data (Mondini et al., 2021b). Challenges like data pre-processing (Plank et al., 2016) and geometry distortions, particularly in high-slope landslide-prone regions, contribute to this disparity. Instances combining SAR and deep learning for landslide detection are still uncommon. Examples include CNN-based approaches with Sentinel-1 data (Nava et al., 2022a, b; Chen et al., 2024) and with quad-polarimetric ALOS-2 data (Liang et al., 2025). Other studies have applied classical machine learning, such as Random Forests with SAR and terrain data (Ohki et al., 2020; Burrows et al., 2021) or object-based image analysis (Lin et al., 2021), but these lack the scalability of end-to-end deep learning methods. Most existing studies have been tested on only a few events, often two or three, limiting their ability to demonstrate scalability and generalization. To our knowledge, a globally distributed, multi-event evaluation of Sentinel-1 SAR-based landslide detection using deep learning has not yet been conducted.
Here, we close this gap by training and testing on 11 earthquake-triggered events worldwide (≈ 73 000 landslides). Our approach includes SAR-specific data preparation for consistent performance across diverse terrains, integrates eXplainable AI (XAI) to interpret pixel-level contributions, and provides an open-source SAR-LRA tool for rapid, cloud-based landslide detection via GEE and Colaboratory. To our knowledge, this is the first study to demonstrate promising transferability of SAR-based landslide detection using deep neural networks, advancing reproducibility and supporting automated, globally scalable co-seismic landslide response.
2.1 Study Areas
This study investigates 11 earthquake-triggered multiple landslide events across diverse geographic and geologic settings. These events provide a representative dataset for assessing landslide detection performance across different environmental and tectonic contexts.
2.2 Sentinel-1 Data
Each Sentinel-1 satellite follows a near-polar, sun-synchronous orbit with a 12 d repeat cycle, completing 175 orbits per cycle. With a single satellite, global landmass mapping in Interferometric Wide swath mode occurs approximately every 12 d, while the two-satellite constellation enables a more frequent 6 d exact repeat cycle at the equator. Sentinel-1B has been inactive since 2022 and is now being replaced by Sentinel-1C, which was successfully launched and will ensure continuity of C-band SAR acquisitions. Revisit rates vary with latitude, with higher revisit frequencies observed at higher latitudes compared to the equator. We used GRD scenes with 10 m spatial resolution and Interferometric Wide acquisition mode. Depending on availability, each scene consists of either one or two out of four possible polarization bands. The potential combinations include single-band Vertical Vertical (VV) polarization or Vertical Horizontal (VH) polarization, and dual-band VV+VH. Additionally, each scene incorporates an “angle” band indicating the approximate incidence angle from the ellipsoid in degrees at each point.
Roback et al. (2017)Tanyaş et al. (2022a)Ruiz et al. (2020)Hu et al. (2019)Tanyaş et al. (2022b)Ferrario (2019)Wang et al. (2019)García-Delgado et al. (2021)Martinez et al. (2021)Dai et al. (2023a)Meena et al. (2023)Table 1Summary of Earthquake-Triggered Landslide Inventories and Sentinel-1 Polarizations.
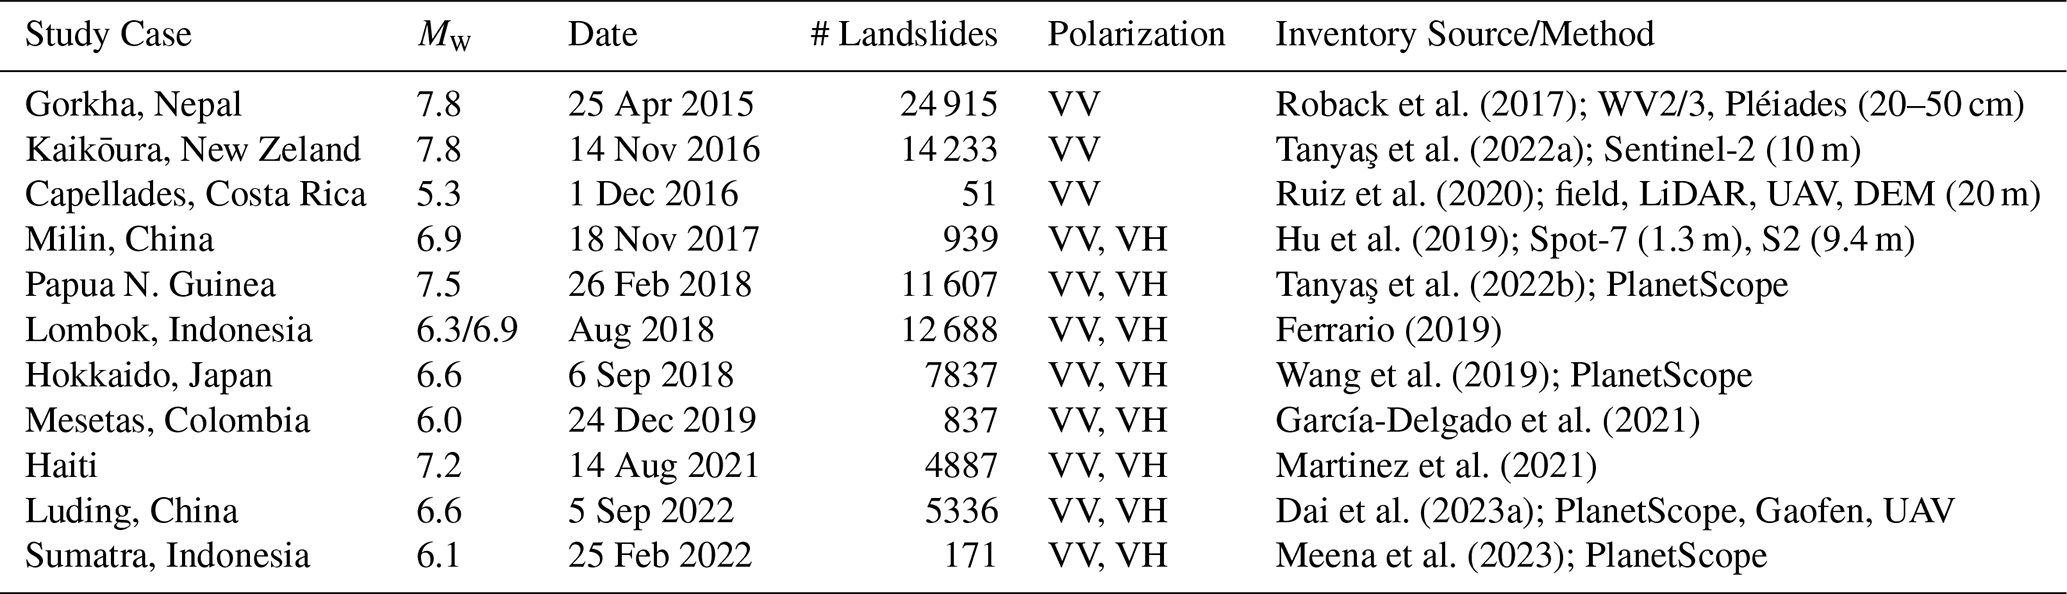
All Sentinel-1 scenes used in this study had been pre-processed by the provider, including thermal noise removal, radiometric calibration, and terrain correction (using SRTM 30, or ASTER DEM at latitudes above 60°). The terrain-corrected values are provided in logarithmic scale (10log 10(x) dB). For details of the processing workflow, see https://developers.google.com/earth-engine/guides/sentinel1 (last access: 15 April 2025). Our research focuses on scenarios where either only VV polarization or both VV and VH polarizations are accessible for both ascending and descending orbits (see Table 1).
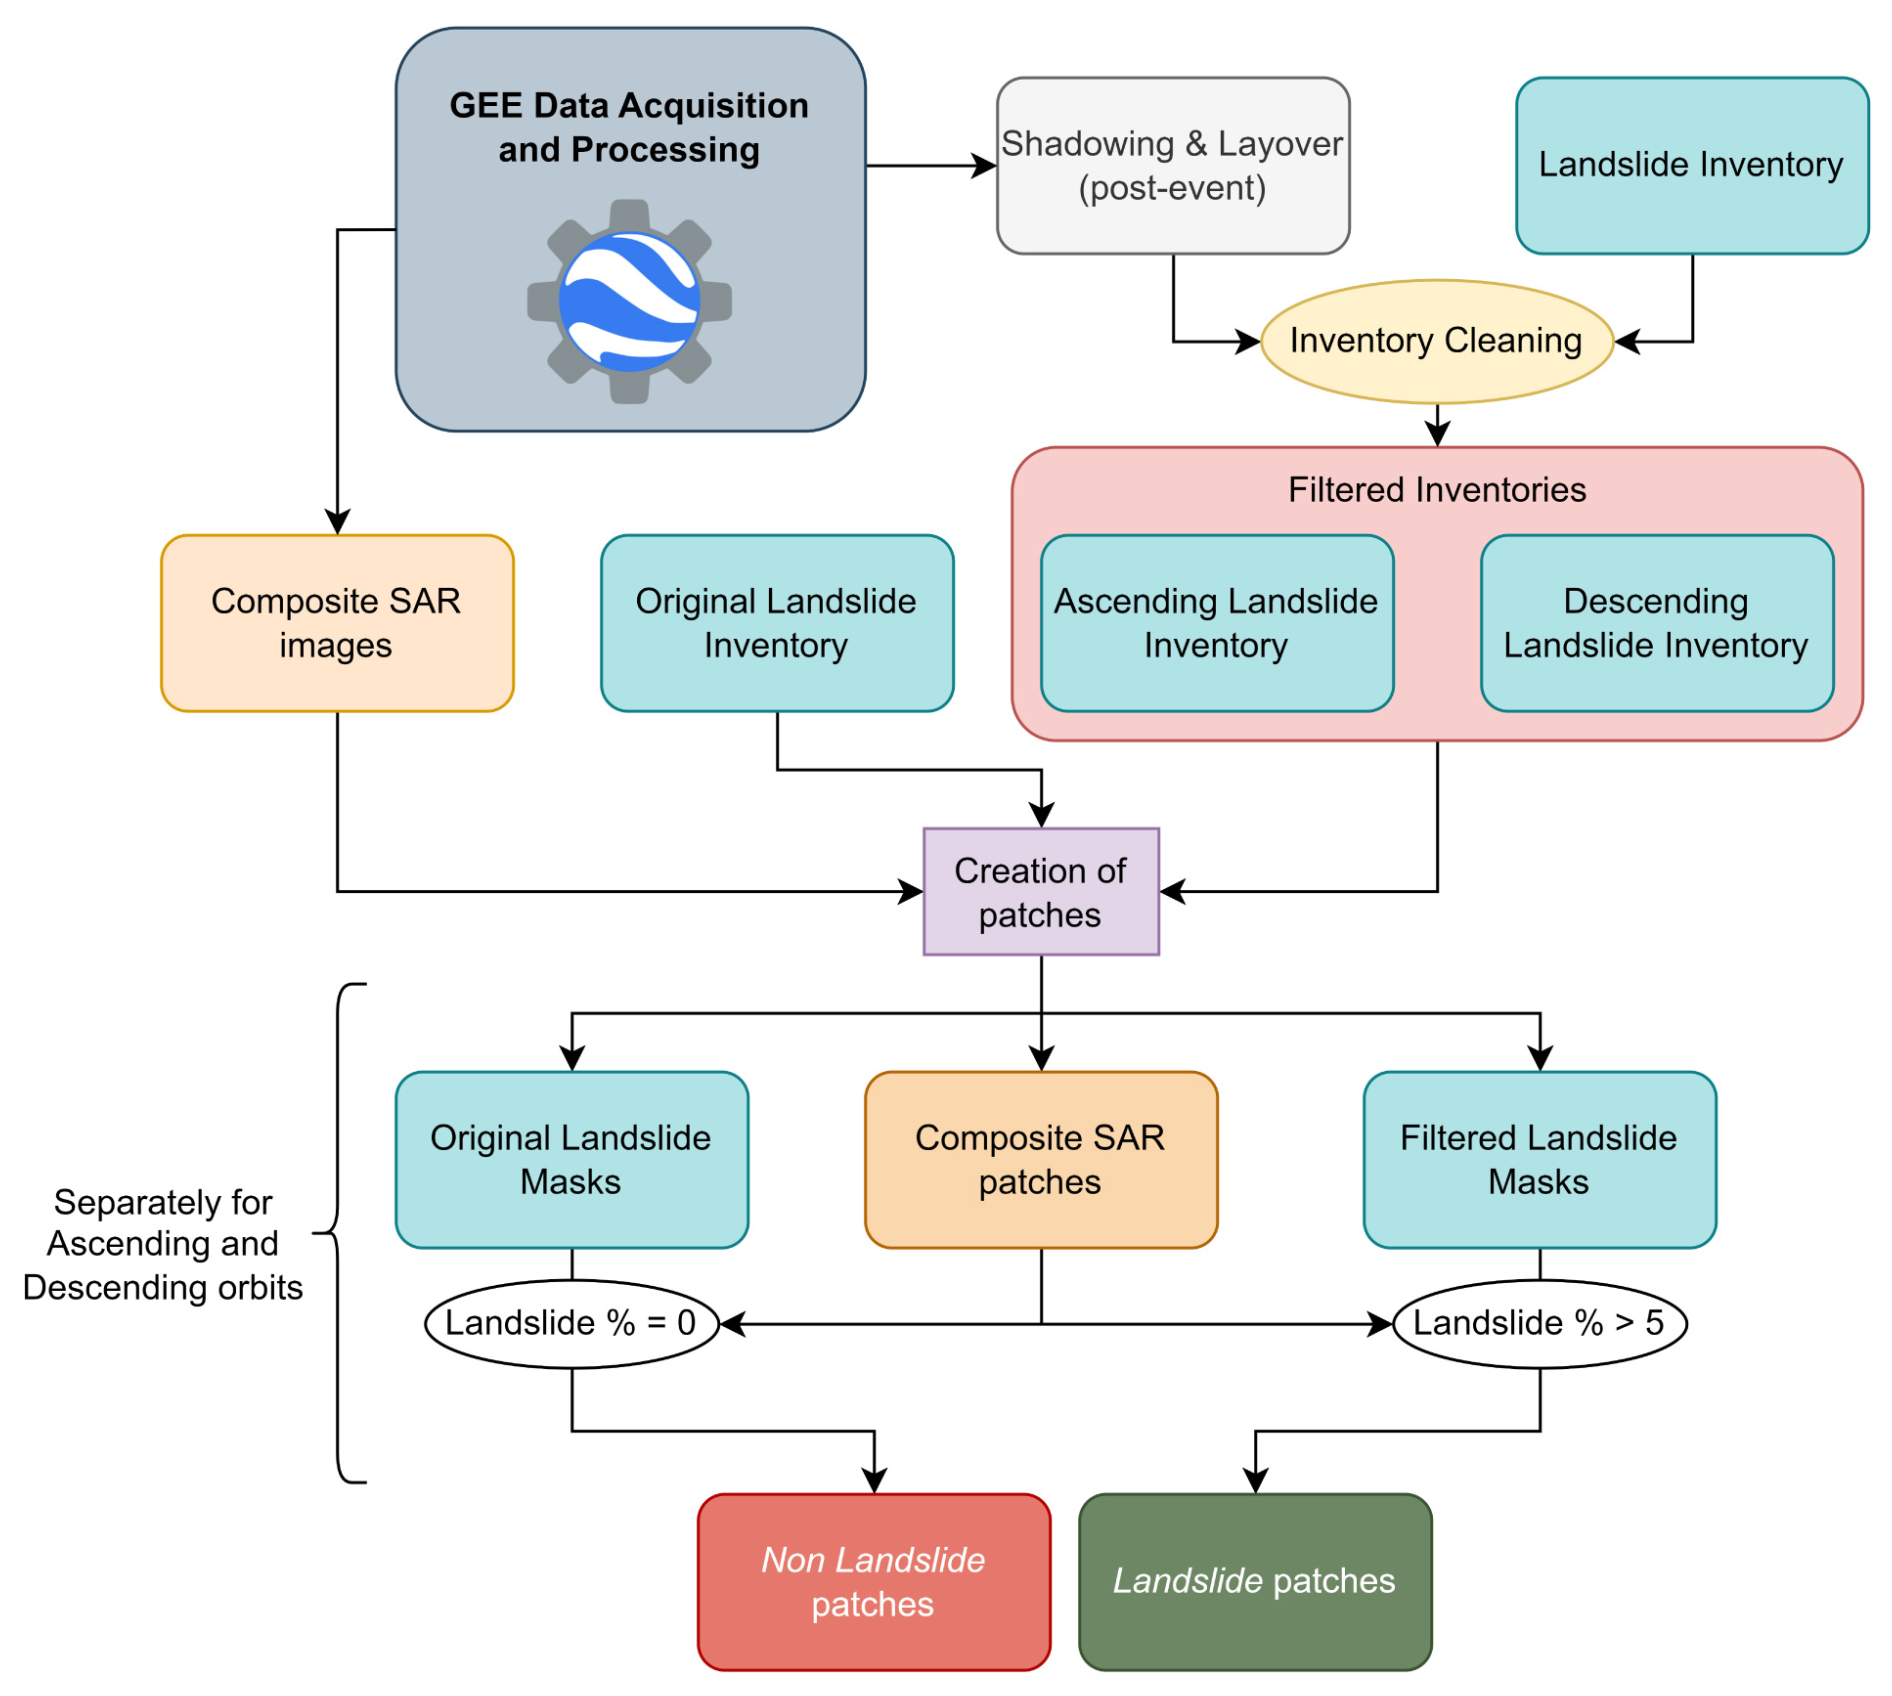
Pre- and post-event SAR imagery undergo several pre-processing steps on the GEE cloud, including acquisition, stack median calculation, differencing, and stacking. Specifically, for each study area, satellite images are acquired and stacked in space and time, median values of the stacks are extracted, and shadowing and layover masks are generated. Subsequently, we generate change detection bands, and the final images are composited. The subsequent data processing involves patch sampling, as outlined in Sect. 3.1, to prepare the data for model training (see Fig. 1). The data is then used to train and test our CNN, as described in Sect. 3.5. Finally, the object detection strategy is outlined in Sect. 3.6.
3.1 Dataset Design
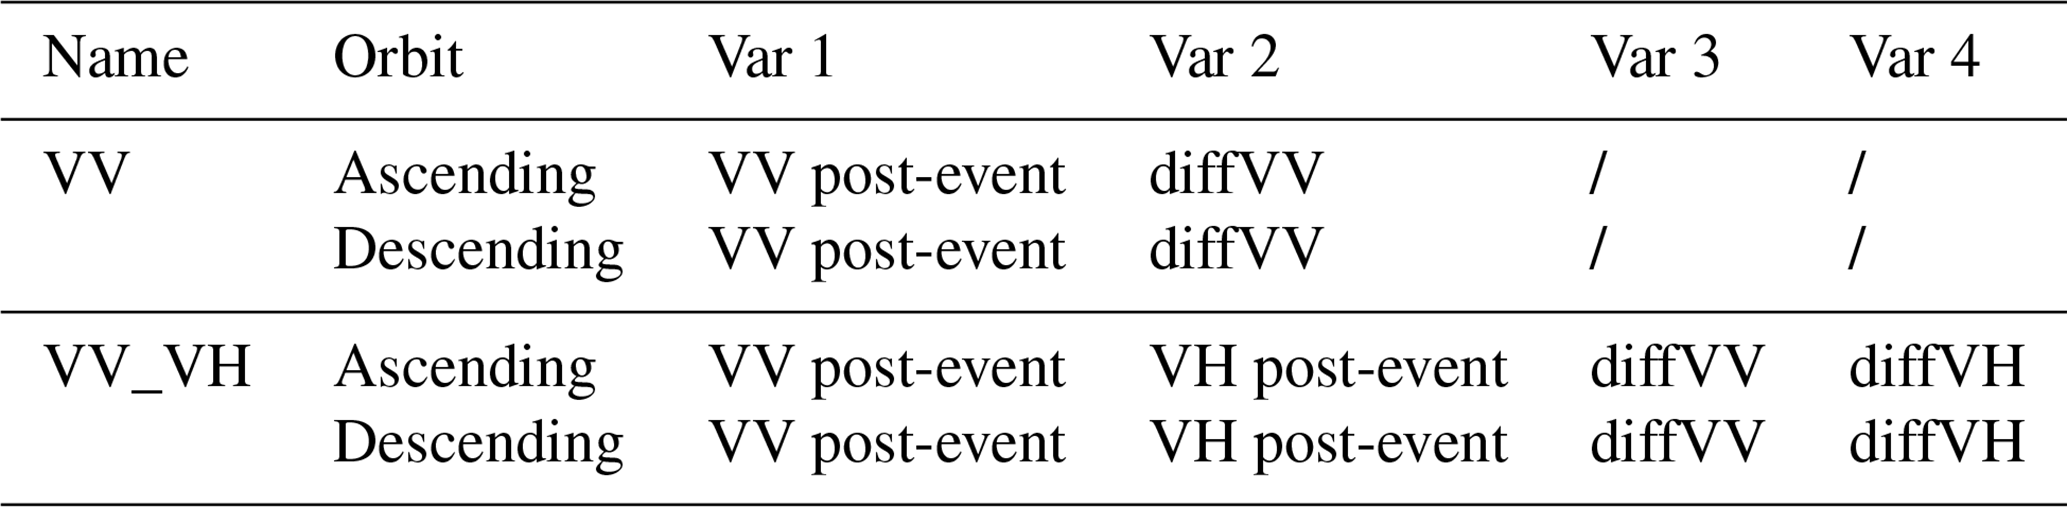
Four distinct combinations of Sentinel-1 SAR polarizations and orbits have been devised to evaluate neural network classification performance. These combinations are described in Table 2. We also calculate the differences for both pre- and post-VV and VH amplitude imagery, represented as diffVV and diffVH, respectively. These values are derived by subtracting the median amplitude of the pre-event stack from the median amplitude of the post-event stack. Each polarization combination is separately employed with different orbits, enabling the independent assessment of the neural network's classification performance.
Table 2Main Dataset Combinations. diffVV and diffVH are obtained by subtracting the median of the pre-event stack from the median of the post-event stack.
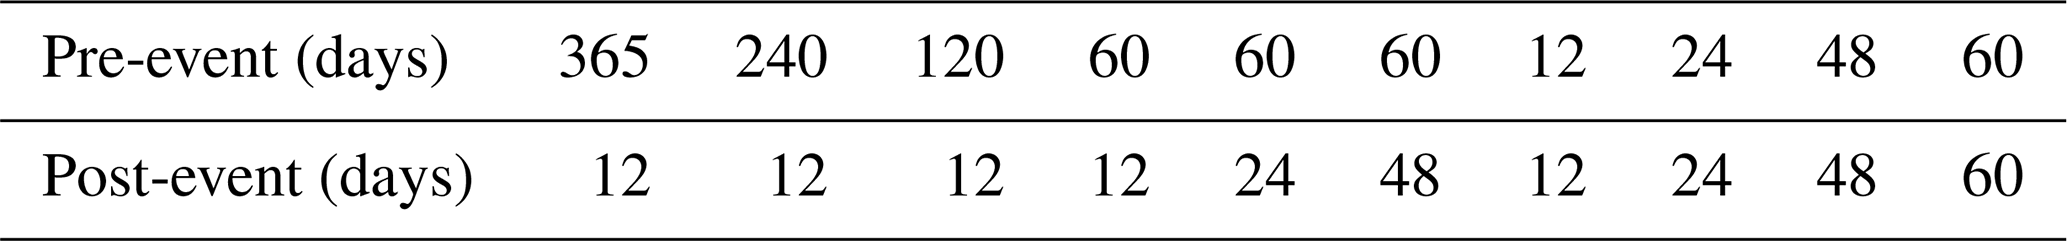
Furthermore, these four major combinations are implemented across various pre- and post-event temporal buffers. The selection of these buffers is based on the current average revisiting time of Sentinel-1. The 12 d buffer represents the most rapid assessment time, encompassing one acquisition per acquisition geometry, which will fall within 12 d of the event (European Space Agency/Copernicus, 2025). We vary the selection of such event buffers to assess their impact on model performance (see Table 3).
Table 3Temporal Buffers Applied to the Dataset Combinations in Table 2.
It is crucial to acknowledge that when working with two multitemporal stacks located in different geographic areas, even if they are generated using the same temporal buffers, they might not have the same number of images. This discrepancy can be attributed to differences in the orbit plans of Sentinel-1.
3.2 Data Sampling
Landslide polygons in the available inventories were digitized from optical imagery. Because of geometric distortions inherent to SAR, particularly layover and shadowing in mountainous terrain (Soldato et al., 2021; Burrows et al., 2020; NASA Earthdata, 2025), we design a tailored sampling strategy. Following Vollrath et al. (2020) and Lindsay et al. (2022), we generated shadow and layover masks for each acquisition geometry and subtracted them from the landslide inventories (“Inventory Cleaning” in Fig. 1). Three inventories were thus prepared for each study case: (i) original, (ii) filtered with ascending masks, and (iii) filtered with descending masks. The original inventory was used for sampling the background class, while filtered inventories were used for landslide samples, retaining only patches with more than 5 % landslide pixels (∼ 2000 m2). Predictions in patches below this threshold are treated as false positives, acknowledging that some of them may correspond to real but sub-threshold or unmapped landslides.
Patch sampling was performed on a non-overlapping 64×64 grid (∼ 0.4 km2). Generally, larger patches provide richer contextual information. However, excessively large patches yield final bounding boxes that are undesirably large. In our study, we settled on a patch size of 64×64 pixels, aiming for a final bounding box of approximately 0.4 km2. This size balances contextual information with bounding-box compactness. Due to the inherent class imbalance, background-to-landslide patch ratios ranged from 8 (Hokkaido) to 120 (Gorkha). In cases where the natural ratio exceeded 10, the test set ratio was capped at 10; otherwise, the original distribution was preserved.
3.3 Data Partitioning
The dataset was split into training, validation, and testing partitions, with 67 % of the data from each study area used for training/validation and the remaining 33 % reserved for testing. During training, 40 % of the training set was allocated to validation. The VV_VH dataset includes data from Papua New Guinea, Lombok, Hokkaido, Mesetas, Milin, and Luding. The VV dataset also incorporates Capellades, Kaikoura, and Gorka, where VH data are not available (see Table 1). To assess performance beyond the training domains, data from Sumatra and Haiti were kept completely unseen during model development and are used to evaluate how well the model generalizes to new events.
3.4 Model Architecture
Convolutional neural networks (CNNs) are widely used for image classification, including SAR applications (Nava et al., 2022b; Tang et al., 2021; Zhang et al., 2017; Zhou et al., 2022). Here, we use a lightweight CNN with three convolutional blocks. Each block consists of a convolution layer, batch normalization, and max pooling. The outputs of the three blocks are resized and concatenated to retain multi-level features. A dropout layer is then applied, followed by flattening and a fully connected layer. Finally, a single sigmoid unit outputs the binary classification. This design is a simplified adaptation of Nava et al. (2022b), optimized for efficiency while retaining strong performance in SAR image classification.
We trained CNN models for each dataset combination: 2 polarization options, 2 orbits (Table 2), and 10 temporal windows (Table 3), yielding 40 models in total. Additional benchmarks compared CNN, CBAM, and ResNet on the VV_VH dataset. ResNet achieved the highest accuracy (96.43 %) and F1-score (82.53 %), while CBAM produced competitive results. The lightweight CNN, however, was selected for large-scale experiments because it balances accuracy (96.04 %) and F1-score (80.94 %) with lower computational cost, making it a practical baseline for extensive testing (see Appendix and Supplement).
3.5 Model Training
We use TensorFlow 2.8 (Abadi et al., 2016) for training the model, utilizing the Adam optimizer (Kingma and Ba, 2017) with a variable batch size and a focal loss function. The model underwent training for a maximum of 500 epochs, during which hyperparameter tuning was employed to optimize its performance. Additionally, early stopping was implemented to halt training when the validation loss ceased to decrease for 30 consecutive epochs. We use the focal loss (Lin et al., 2017), designed address the challenges of class imbalance and the effective handling of challenging examples within the context of binary classification tasks. Finally, iterative training sessions were conducted employing various hyperparameter combinations, specifically focusing on the number of filters (32, 64), class imbalance rate of the training set (ranging from 4 to 6), dropout rates (0.5, 0.7), and learning rates (10−4, 10−5). Model performance evaluation involved standard metrics, including Precision, Recall, and F1-score.
3.6 Landslide Detection
The calibrated models are coupled with a sliding window algorithm (Lee et al., 2005) and non-maximum suppression (Neubeck and Gool, 2006) to identify landslide locations within a given area. The sliding window algorithm systematically extracts regions of interest (ROIs) across the study area, using defined vertical and horizontal strides and dimensions. In this study, the vertical and horizontal strides are set to 32 pixels, ensuring a 50 % overlap between adjacent ROIs. This overlap enhances robustness by capturing diverse spatial features while maintaining computational efficiency. Furthermore, the dimensions of the training patches are fixed at 64×64 pixels to align with the characteristics of the training data. These ROIs, representing sub-images of the satellite imagery, are classified as either landslide or non-landslide using models trained on labeled image data. To refine the predictions, non-maximum suppression is applied, eliminating redundant or overlapping detections to ensure that each classified landslide patch corresponds to a unique and significant area on the map. Although this approach is computationally more intensive compared to classic YOLO (You Only Look Once) architectures (Han et al., 2023; Liu et al., 2023), it is preferred due to the inherent characteristics of SAR data. Unlike optical imagery, SAR data often exhibits discrepancies with landslide inventories because of factors such as shadowing, layover, and foreshortening, which can distort the appearance of landslides. These effects result in misalignments between detected landslides and inventories created using optical imagery or field surveys (Nava et al., 2022b). Additionally, landslide polygons in inventories often represent amalgamated features or multiple landslides, making it impractical to define bounding boxes based on exact polygon boundaries.
We conduct a comparison of model predictions using VV and VV_VH data across six study areas: Papua New Guinea, Lombok, Hokkaido, Mesetas, Milin, and Luding, to ensure consistency when evaluating model performance. Additionally, the model trained on the VV datasets uses the nine cases outlined in Sect. 3 to improve the model’s generalizability, and the corresponding performance scores are reported. Finally, we assess the models' detection capabilities in completely new and unseen regions, simulating the detection of landslides for a recently occurred, unseen major landslide event (MLE).
4.1 Landslide Classification Results
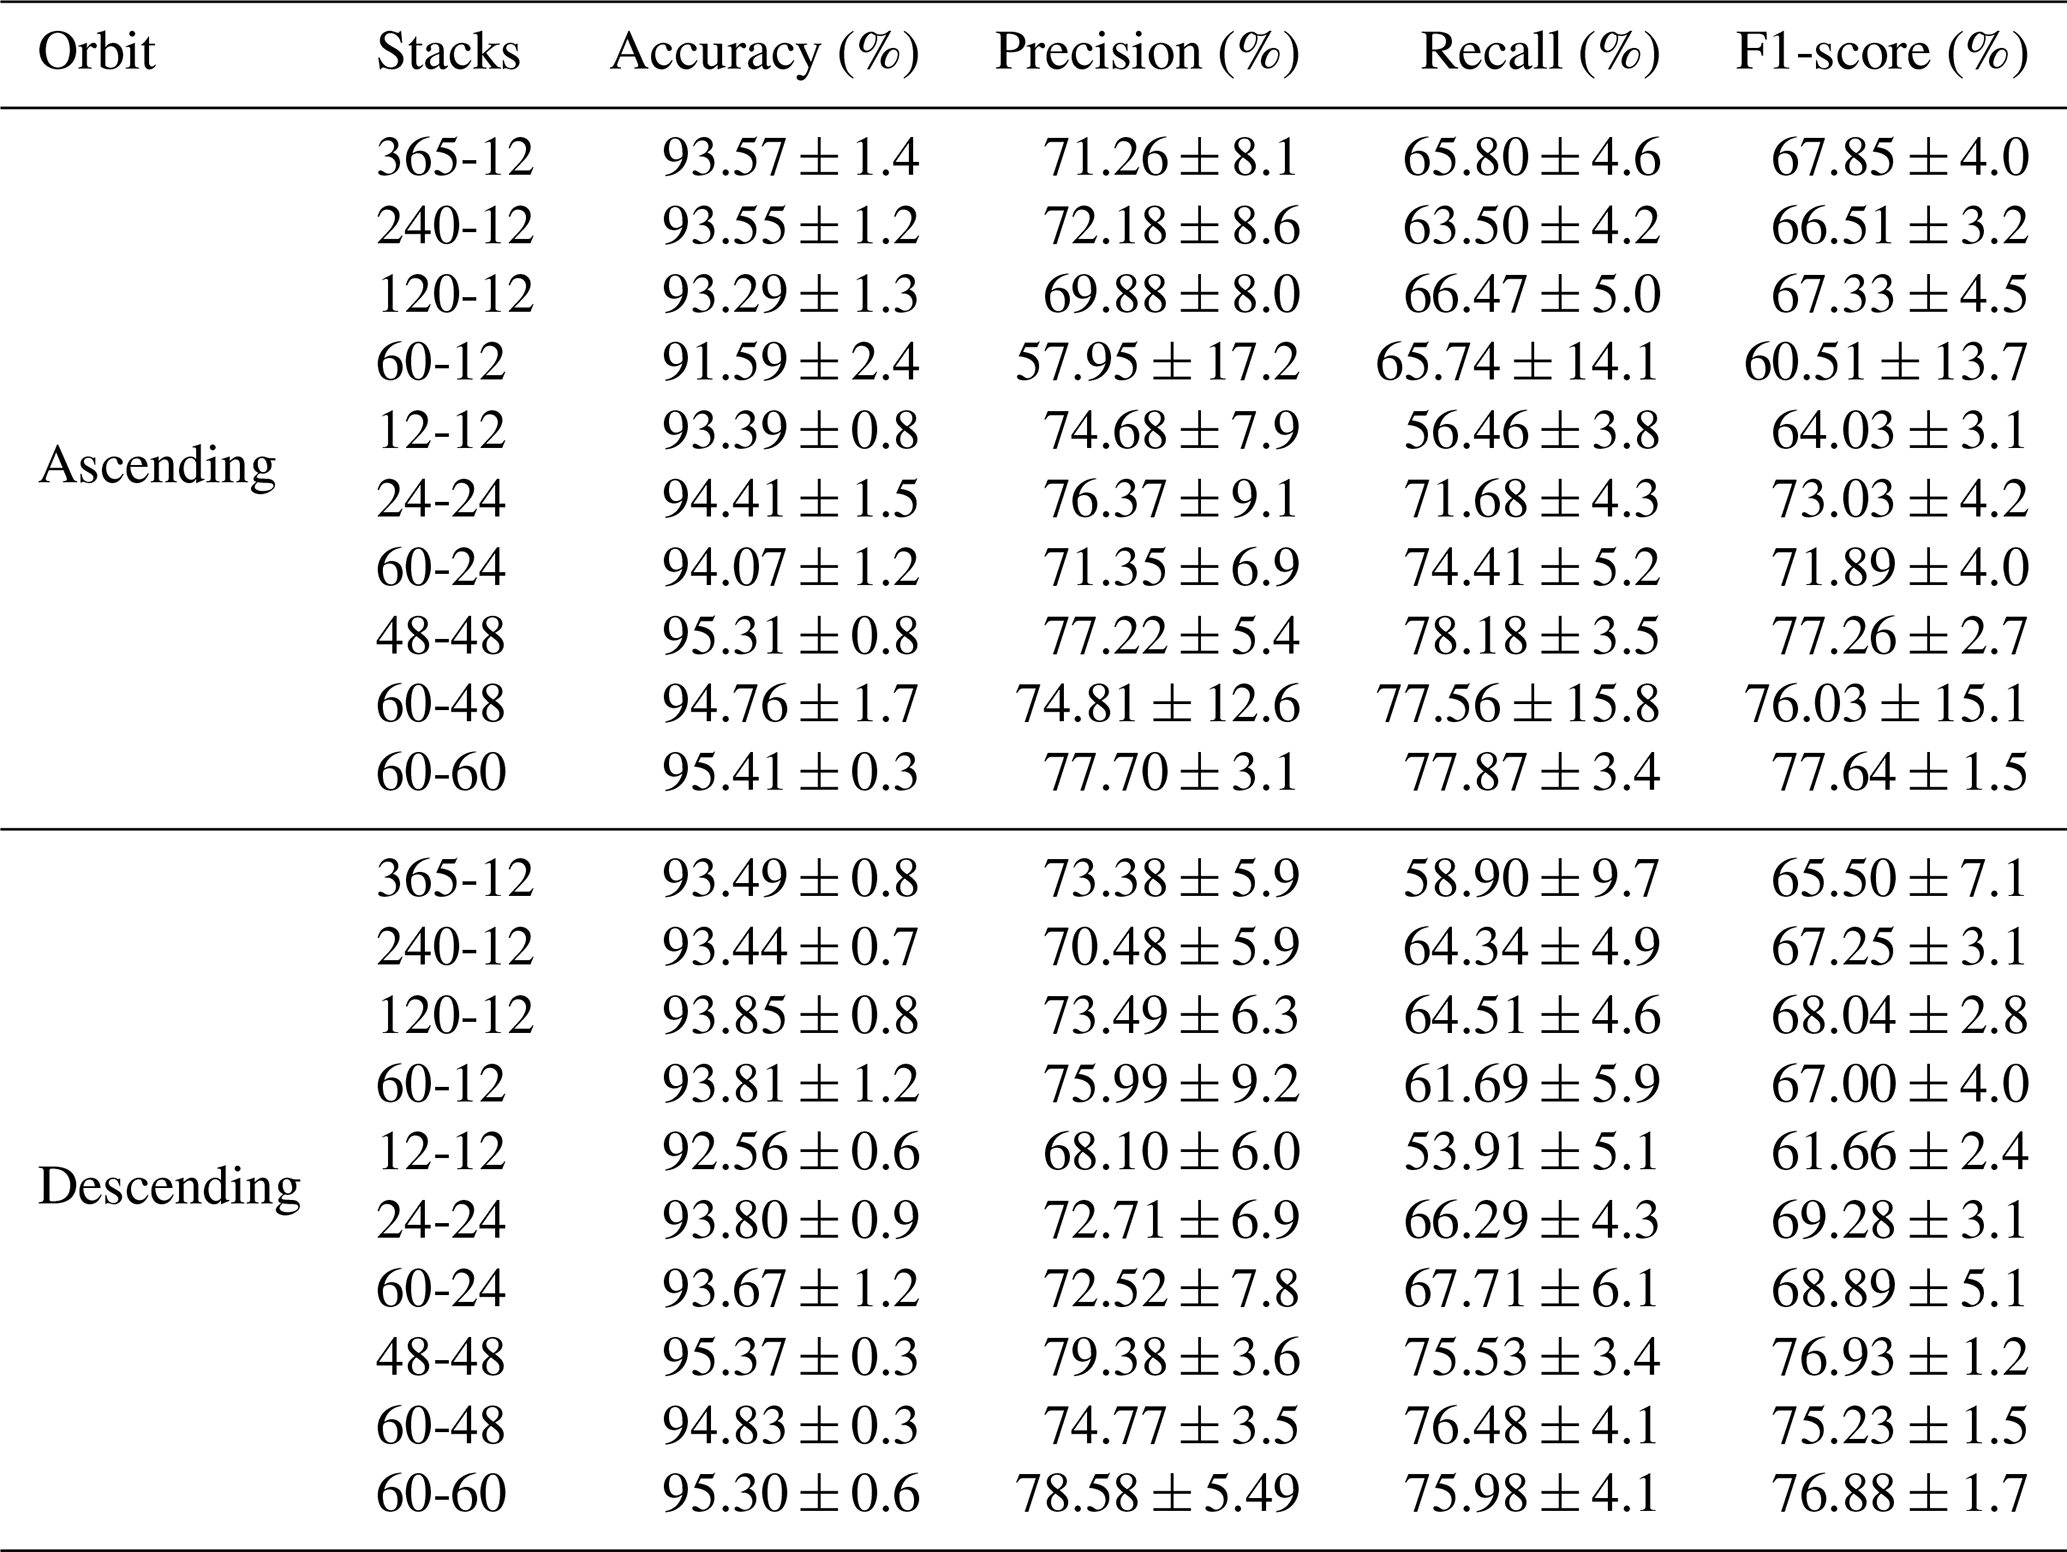
As established in Sect. 3.1, the test sets are prepared to include a representative subset comprising 33 % of patches from each distinct study case. To ensure an unbiased comparison, identical patches are employed for model training and testing phases in all the combinations. The reported scores in Tables A2 and A3 in Appendix A represent the median values derived from an exploration across 24 distinct combinations of hyperparameters and training set class imbalances, as outlined in Sect. 3. An overview of the most meaningful metric, F1-score, across the various data configurations is given in Fig. 2. The precision trend remains relatively consistent across all combinations, while the recall varies significantly, as does the F1 score. In numerous cases, both metrics experience a significant increase when incorporating additional post-event acquisitions.
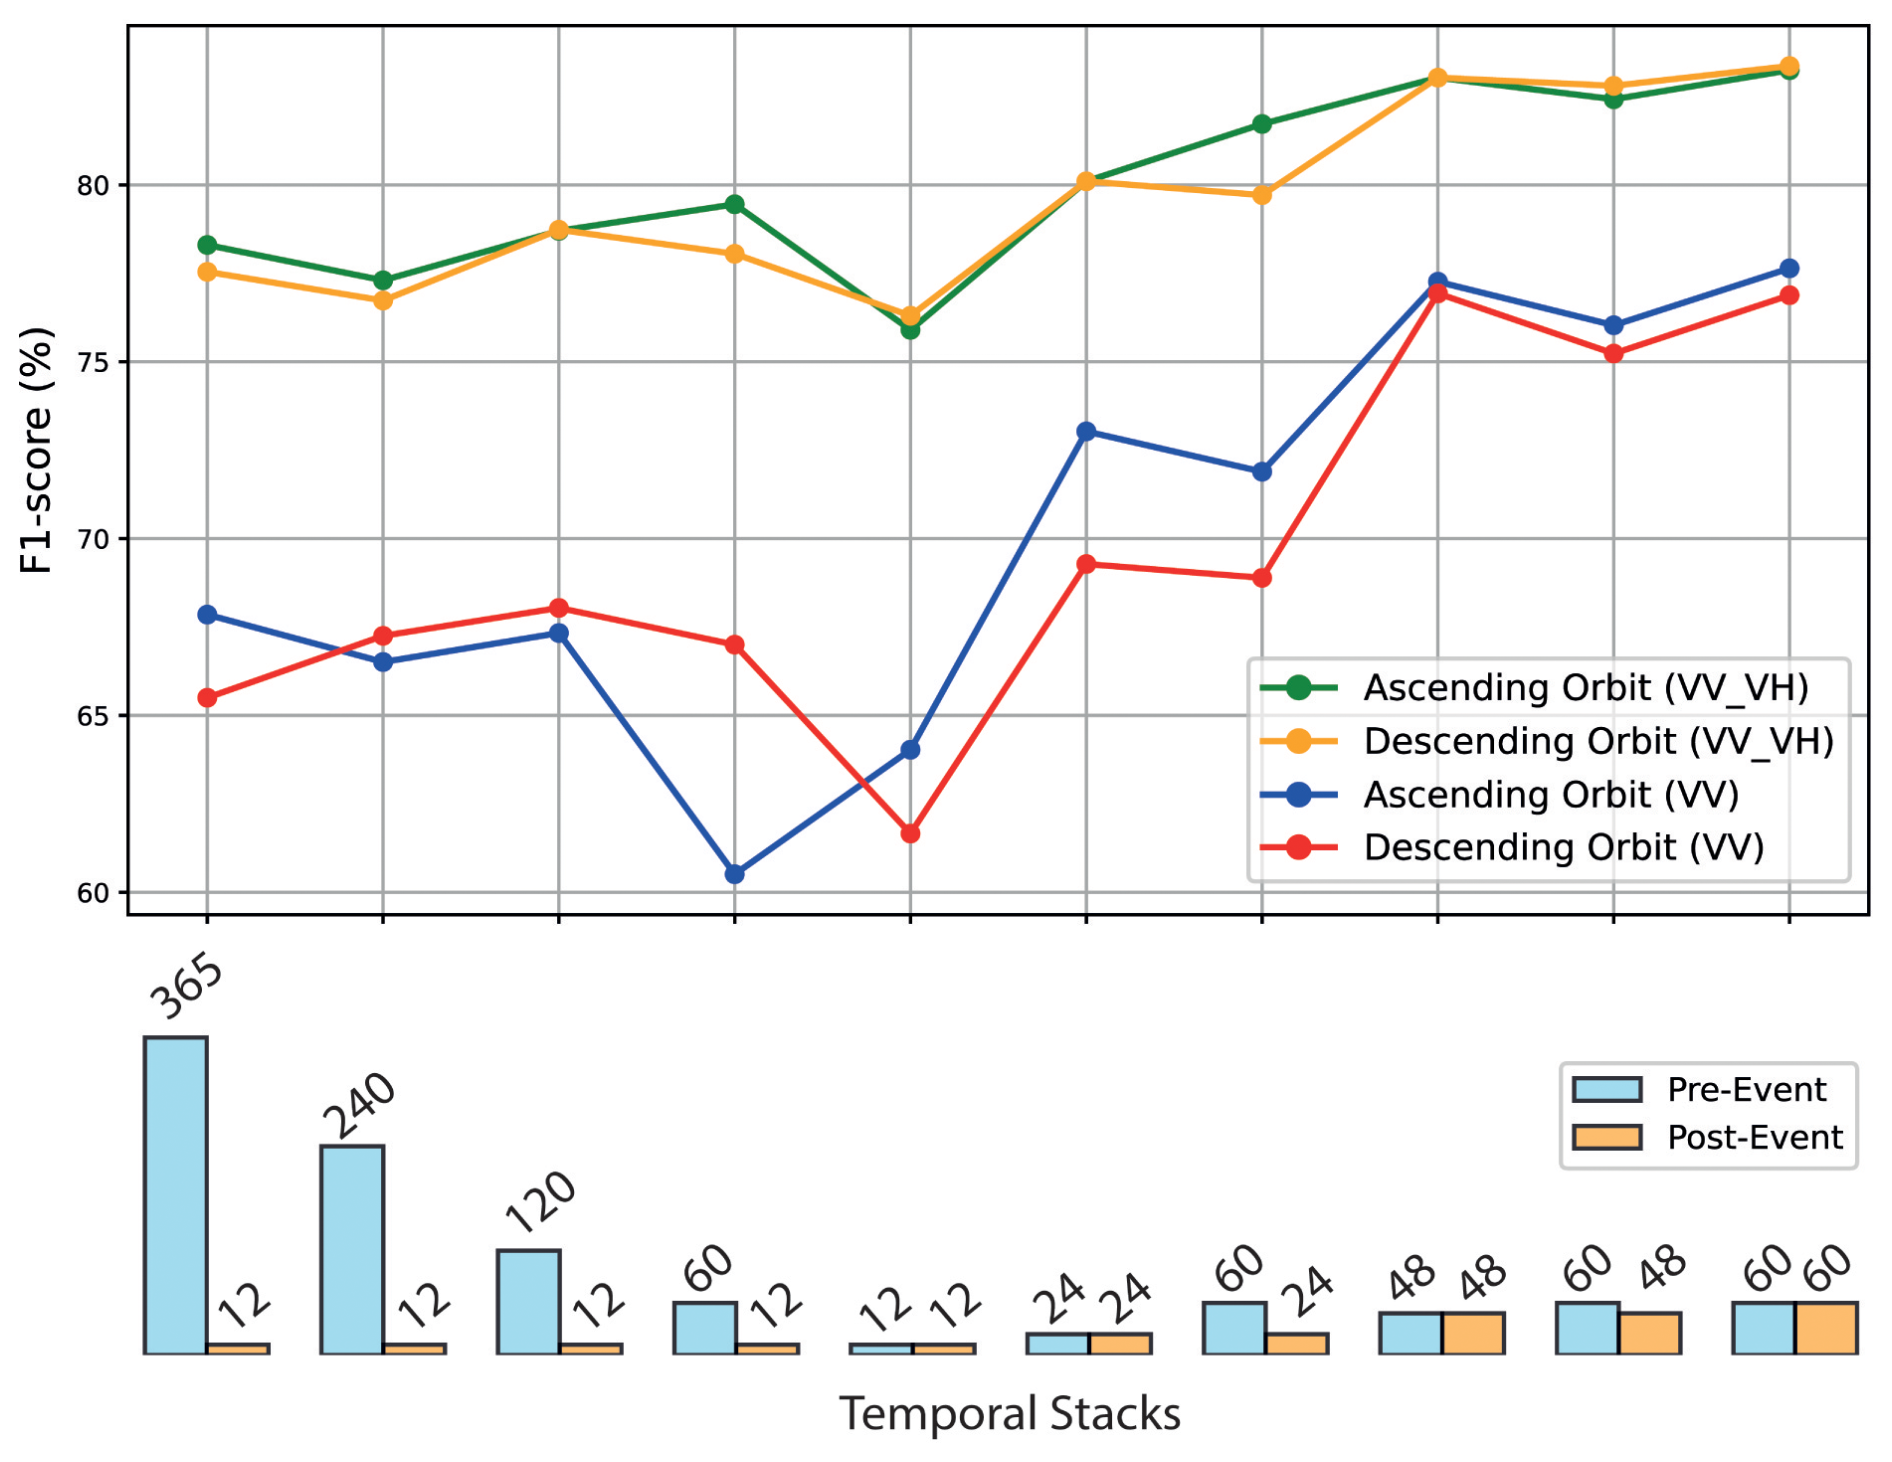
Figure 2Performance of models trained on different pre- and post-event temporal stacks, considering both ascending and descending orbits and utilizing VV and VV_VH data combinations.
4.2 Landslide Rapid Assessment on Unseen MLEs
In this section, we present the detection results of the models that showcased the best rapid assessment performance for both descending and ascending orbits separately. The characteristics of the hyperparameters and performance of the models used in the rapid assessment are provided in Table 4. We deployed them for the 2022 Sumatra event, which was not part of the initial training and test datasets. The results, illustrated in Fig. 3, demonstrate the effectiveness of both the VV_VH combination models. Figure 3 compares predictions from the VV_VH combination model across descending and ascending orbits during rapid assessment. The model maintains robust performance even when applied to the novel, unseen areas and events that we use.
Table 4Hyperparameters and performance of models for rapid assessment using VV and VV_VH combinations for ascending and descending orbits. All models use a 60 d pre-event and 12 d post-event stack with a learning rate of 0.001. Lower VV scores reflect the inclusion of additional study cases (Gorka, Kaikoura, Capellades).
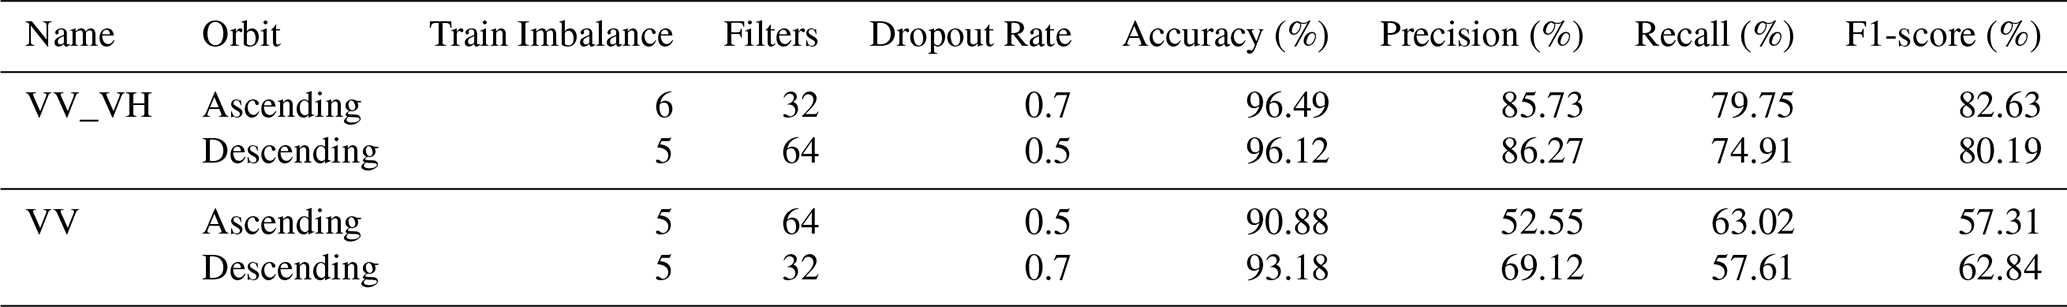
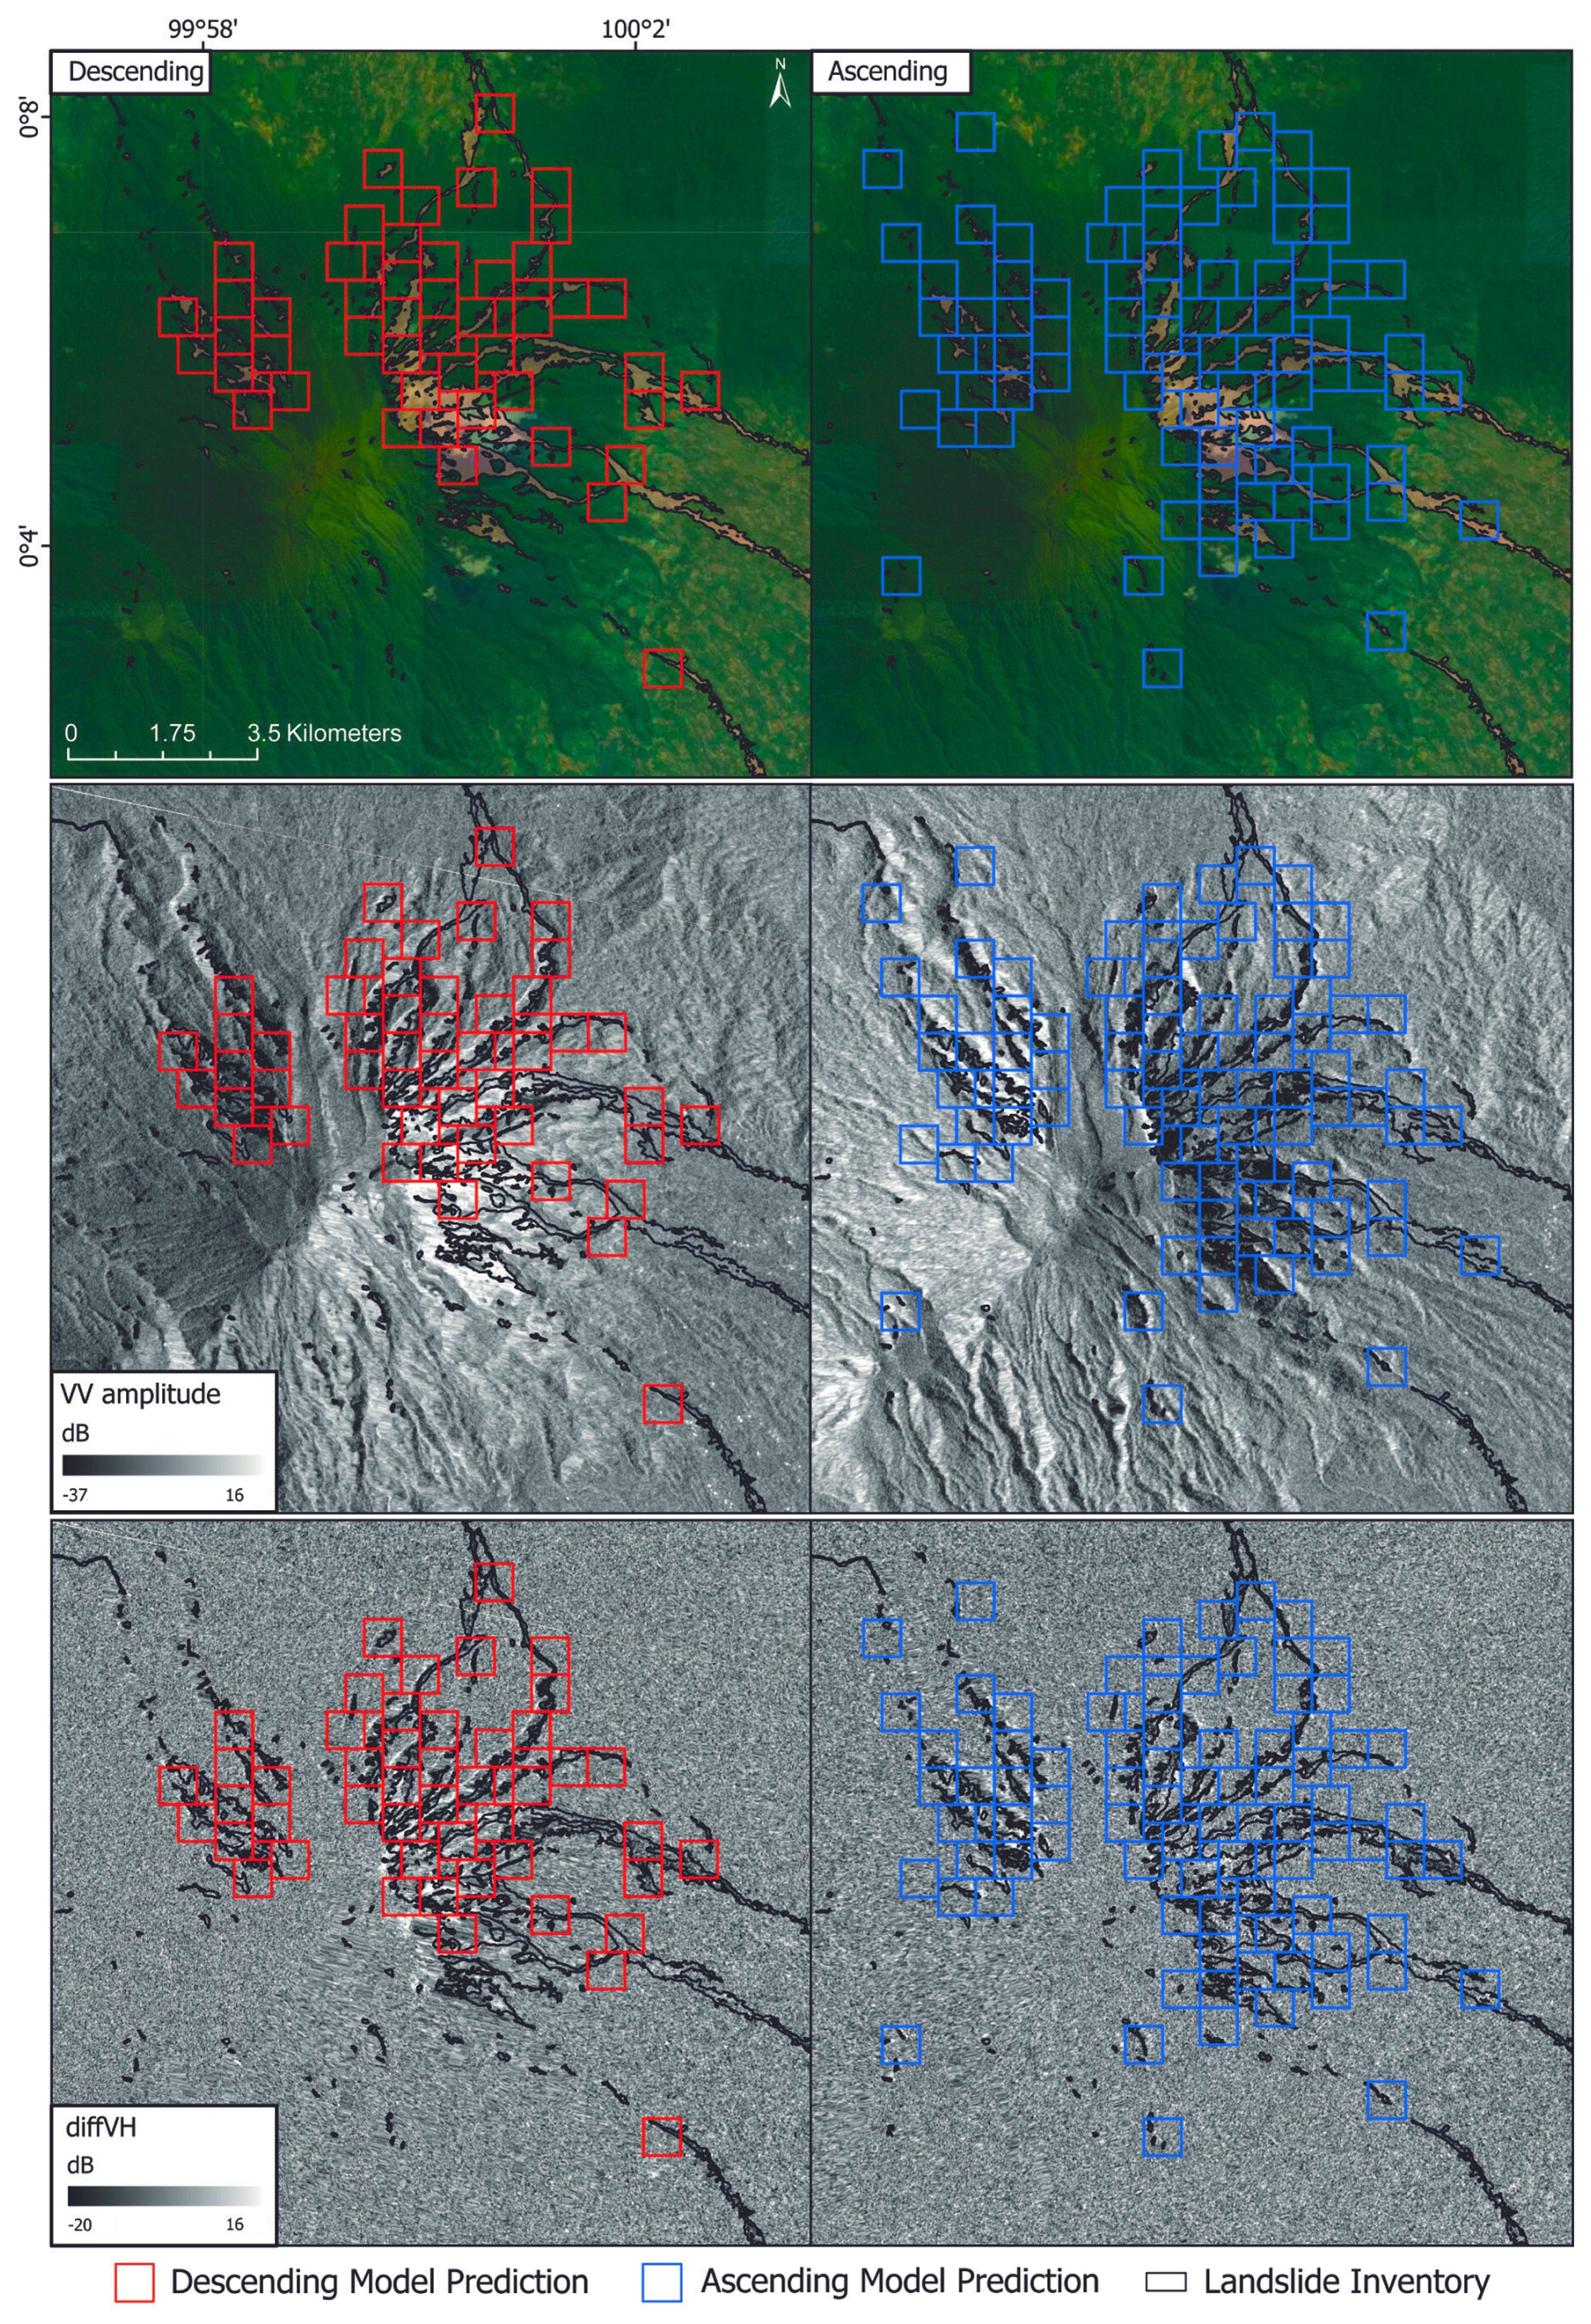
Figure 3Rapid assessment for the 2022 Sumatra event utilizing VV_VH combination and 60-12 stack pre- and post-event. This unseen event validates the comprehensive generalizability in the rapid assessment of the VV_VH-based detection models. The left column shows the predictions obtained using the descending orbit, while the right shows the predictions based on the ascending orbit. The first row shows the predictions over an RGB background, the second row uses a post-event VV background, and the third row displays the diffVH background.
We further evaluate the model's performance using an additional unseen case study: the 2021 Haiti earthquake event, with results shown in Fig. 4. In this case, the affected area is considerably larger than in the previous example. The model correctly identifies zones of high landslide density in both ascending and descending orbits. Two Sentinel-1 tracks cover the region in the ascending configuration, and we now process each track separately to avoid mixing far- and near-range acquisitions, which can introduce geometric inconsistencies.
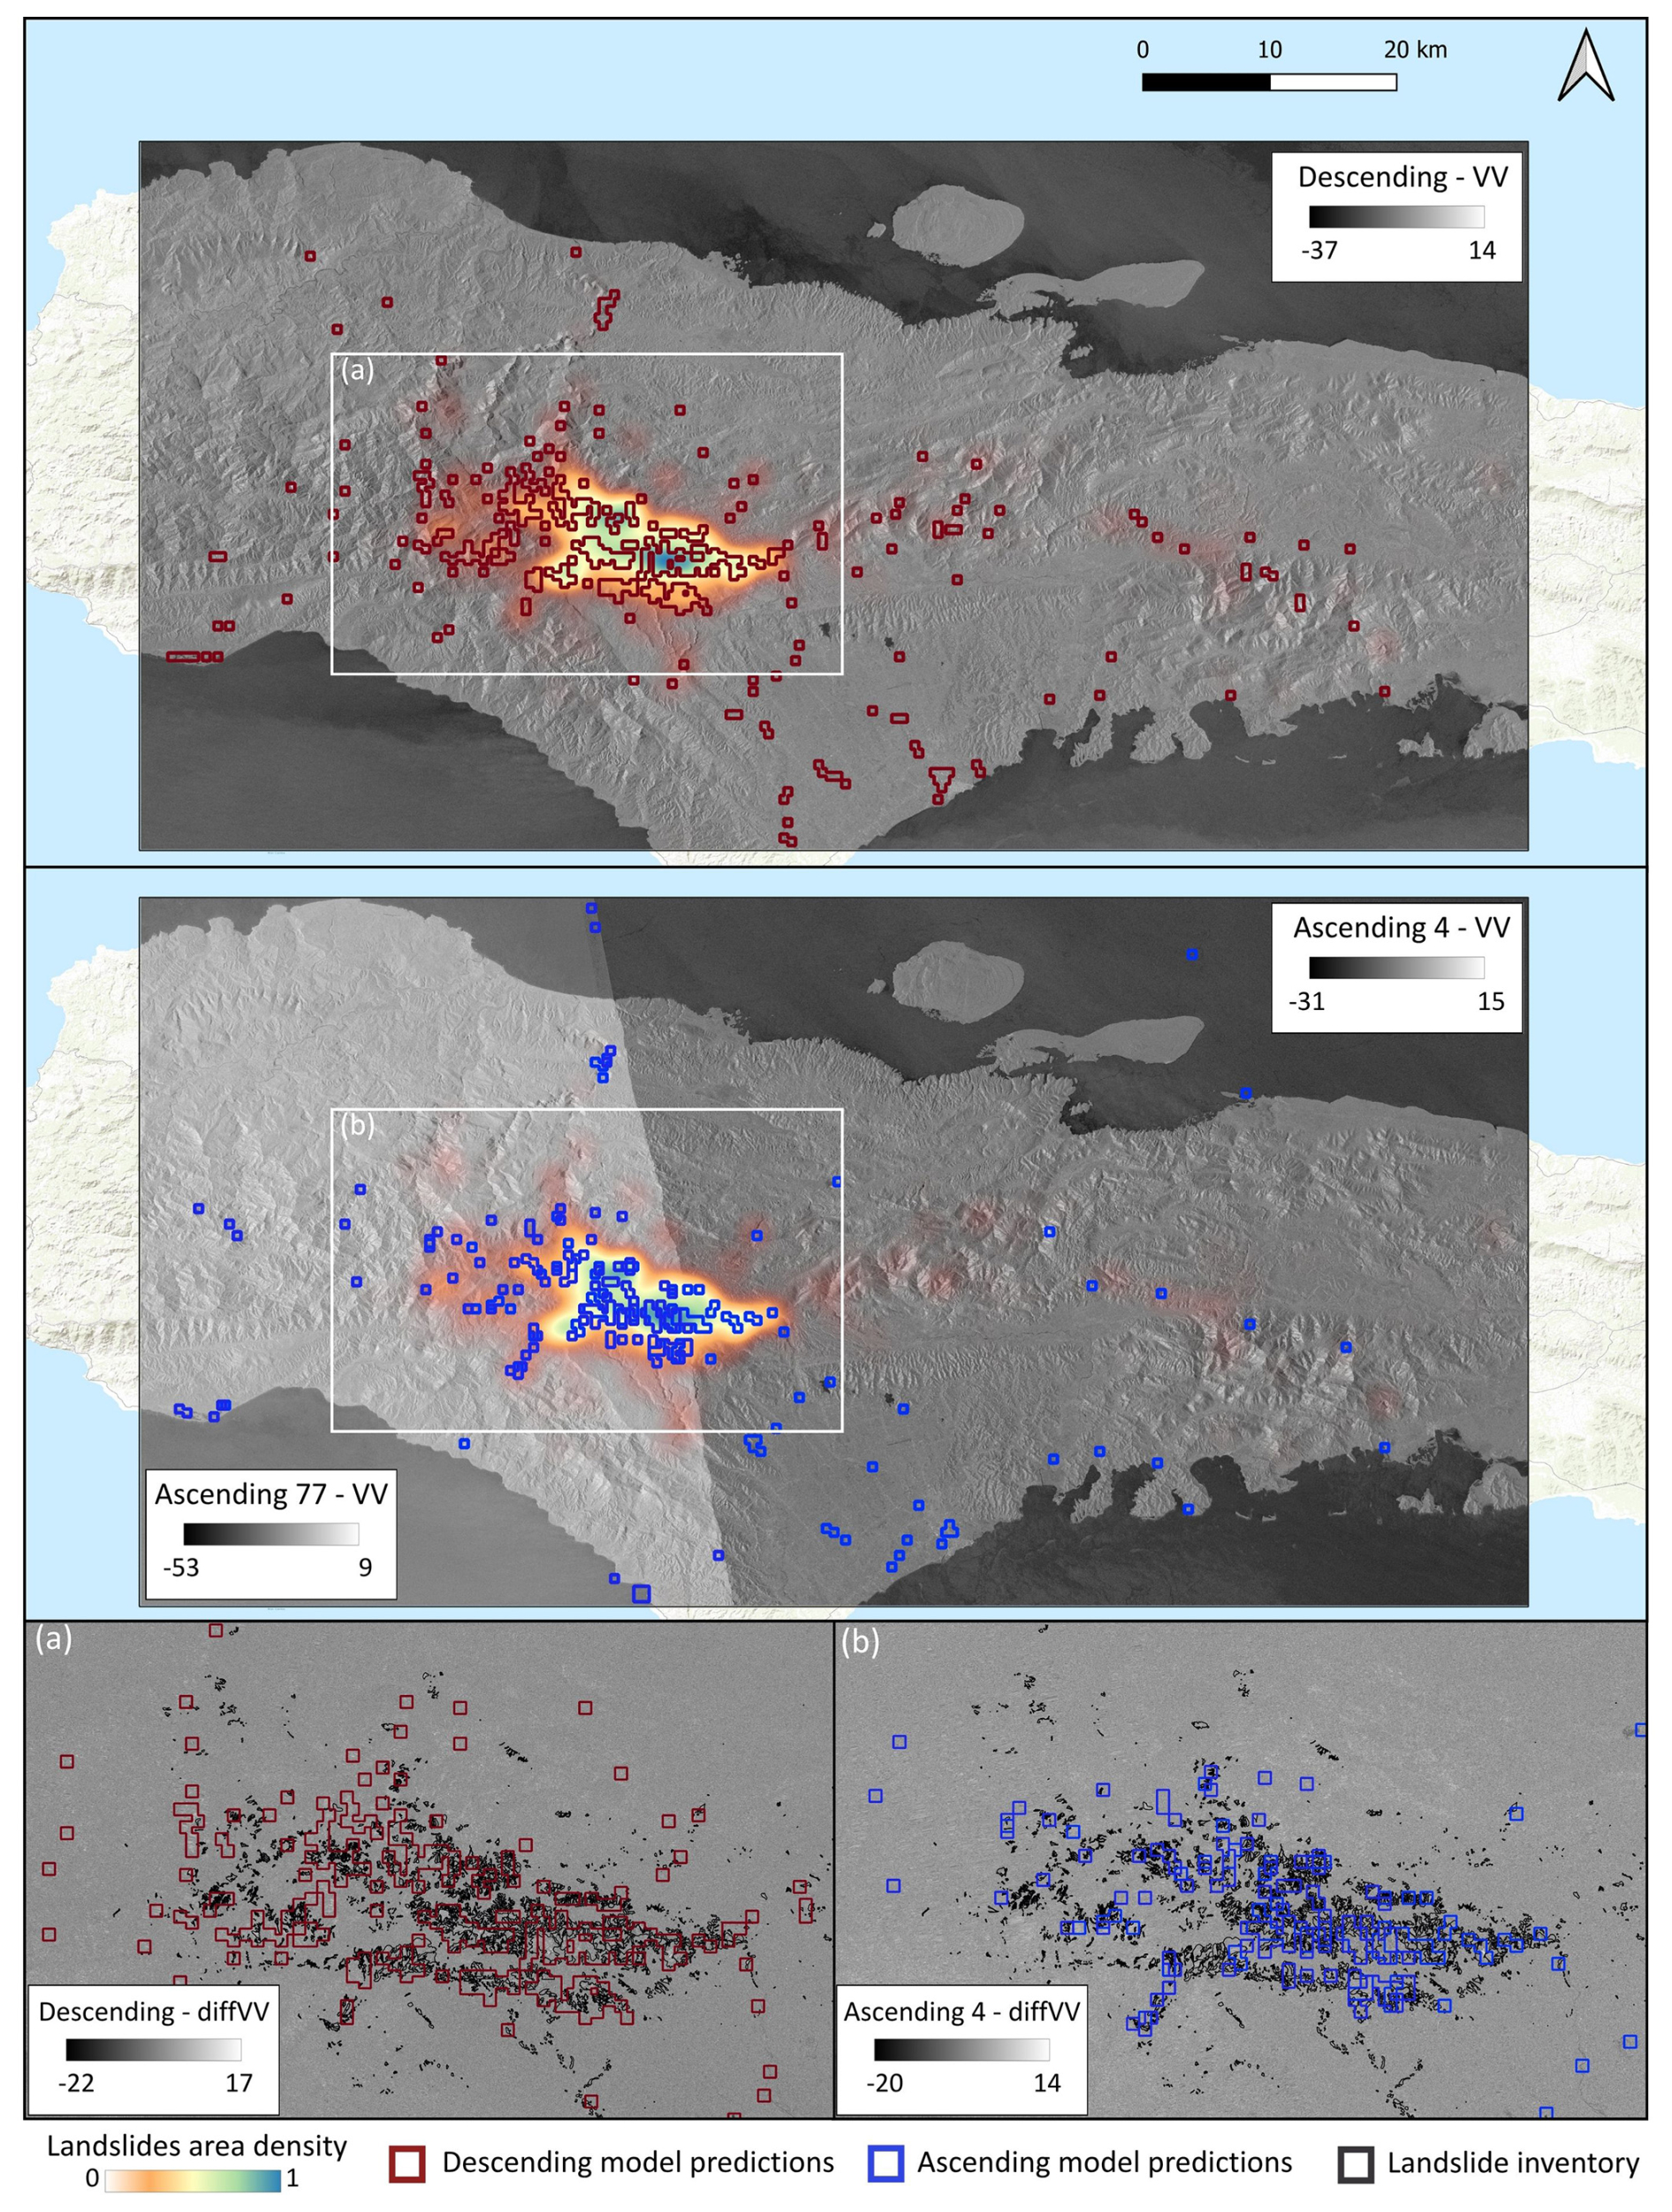
Figure 4This figure shows the rapid assessment for the 2021 Haiti event, obtained using the VV–VH polarization combination and a 60 d pre-event and 12 d post-event image stack for both ascending and descending orbits. The search for post-event images starts on 17 August 2021, accounting for the tropical storm that followed the earthquake and triggered additional landslides. (Source: ESRI.)
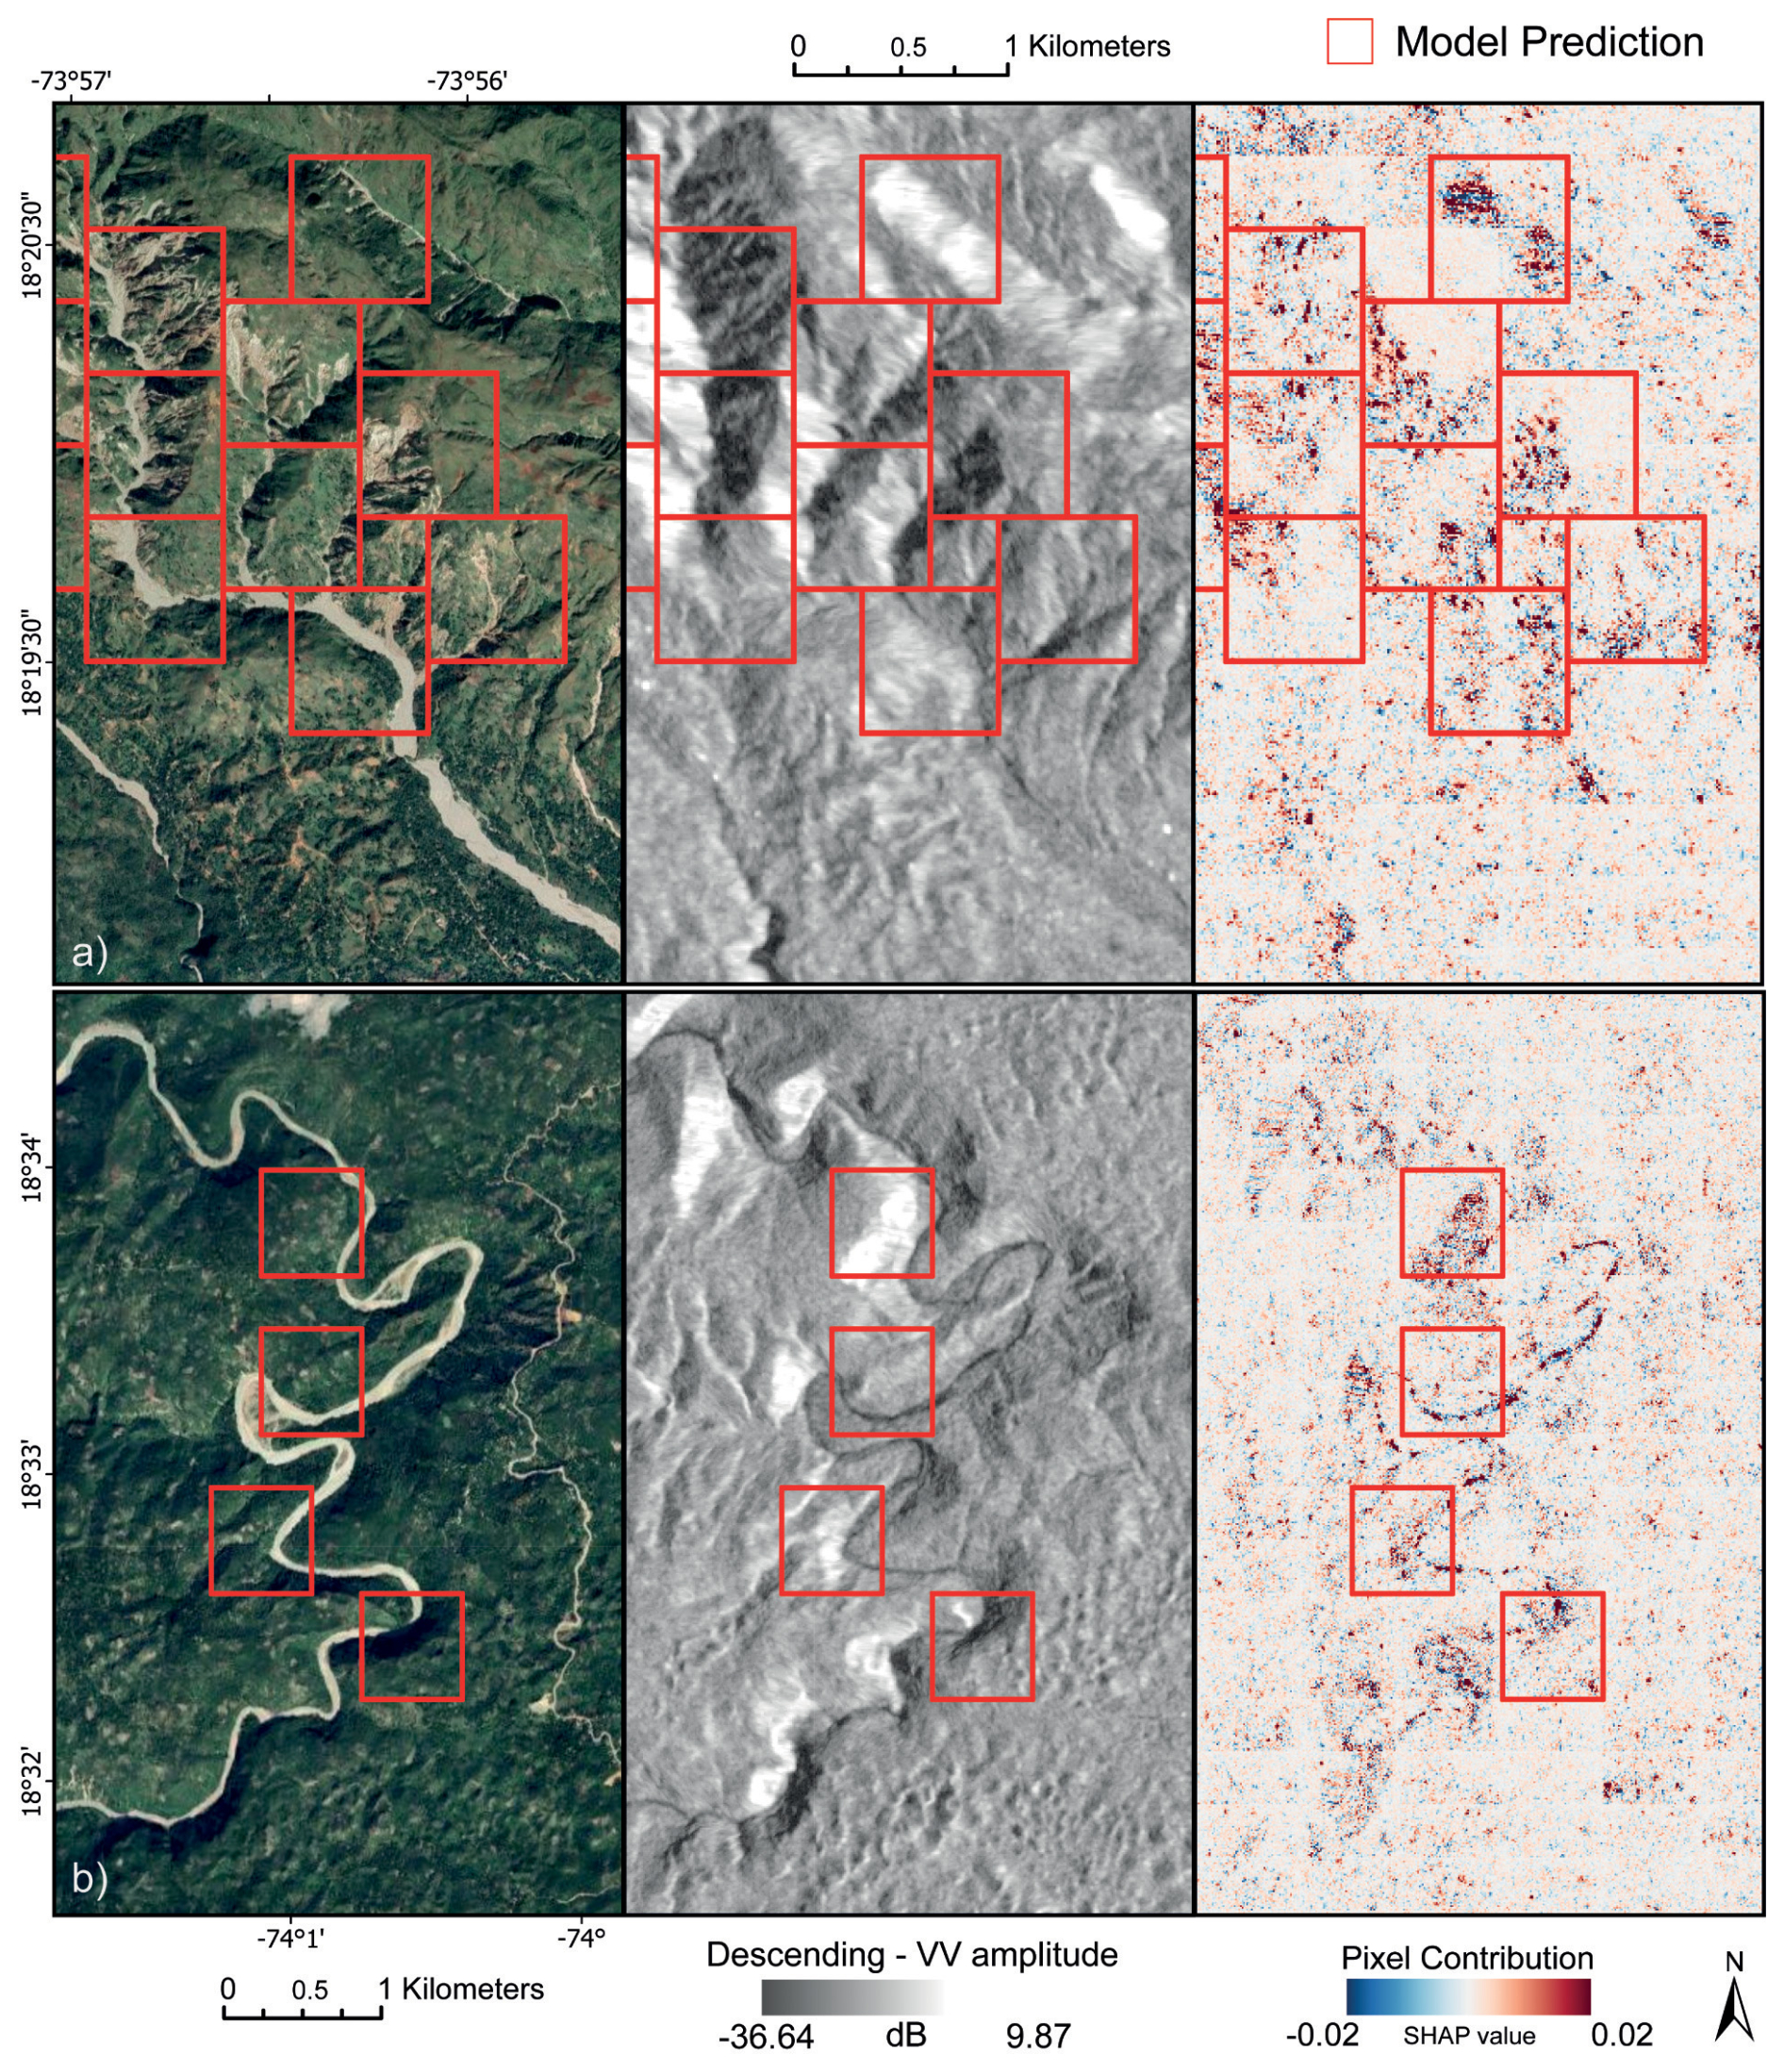
Figure 5Prediction results for the 2021 Haiti event were generated using the VV_VH combination and a 60-60 stack pre- and post-event, descending orbit. (a) True Positives; (b) False Positives. The figure shows orthophoto, post-event VV amplitude, and Pixel Contribution (SHapley Additive exPlanations – SHAP value) to derive the final detection. Notably, SHAP values represent the mean of the pixel contribution across all four bands in the image. It's important to highlight that the pixel contribution is calculated for all regions of interest (ROIs) during prediction. However, not all ROIs are identified as landslides. The visualization depicts red clusters representing areas that increase the probability of a certain ROI being classified as landslides, while blue clusters signify the opposite effect. (Source: Image © 2024 Airbus.)
Finally, we explore the interpretability of the model predictions for the Haiti event (see Fig. 5). Here we present the SHAP values, which reveal how individual pixels in each channel contribute to the final model decision. By averaging pixel contributions across all four image bands, areas that increase or decrease the likelihood of a region being classified as a landslide can be identified. The model exhibited overpredictions in certain regions, particularly where model attention was directed towards riverbeds filled with sediments.
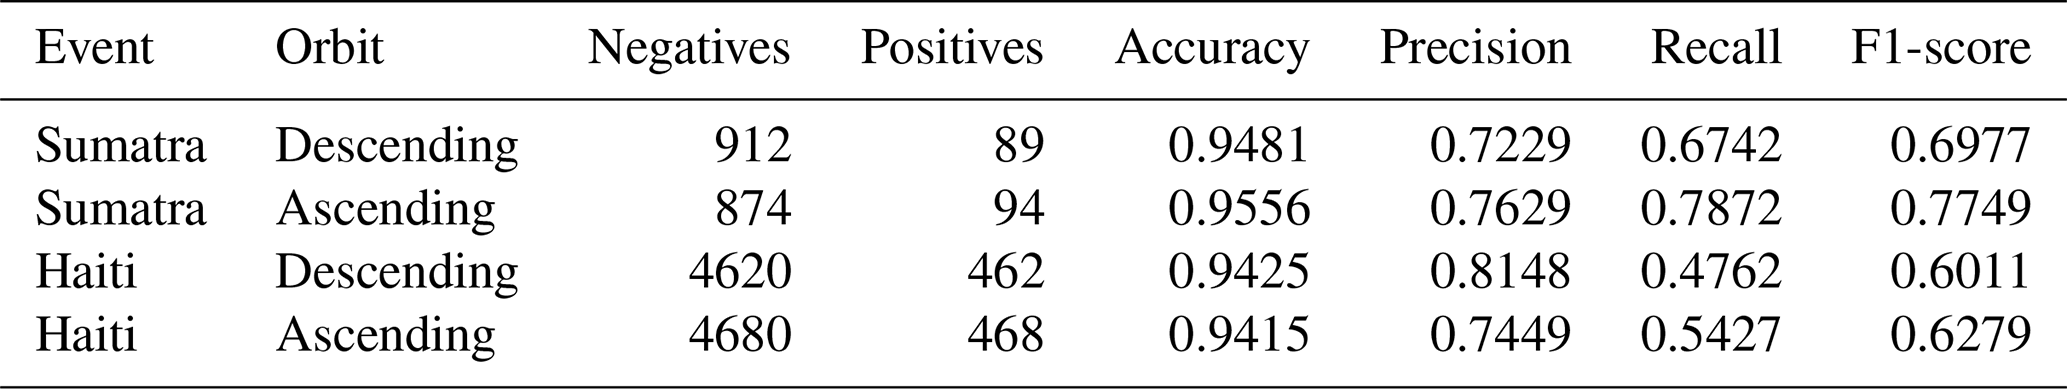
Table 5 summarizes the quantitative performance for the Sumatra and Haiti events across both orbits. Model transferability to the Sumatra event is good, while performance in Haiti decreases, particularly in terms of recall.
Few rapid assessment tools and models are currently available for effective deployment in response to MLEs. Among these, only a limited number of published resources exist, with most comprising datasets intended for training generalized landslide detection models. Examples include datasets designed by Meena et al. (2023), Xu et al. (2024), and Fang et al. (2024). These resources, as well as the tools evaluated by Amatya et al. (2023), cover both optical and SAR-based rapid assessment approaches (Handwerger et al., 2022). The SAR-based rapid assessment tool implemented by Handwerger et al. (2022) stands out for its direct applicability to new events, aligning with our research objectives. Hence, we draw a direct comparison with their methodology. While their method focuses on all surface changes and does not consider SAR geometric distortions, ours specifically targets landslide-related alterations. This distinction is crucial because post-earthquake amplitude alterations can stem from various factors besides landslides (Xu et al., 2022). Additionally, the combination of data from both ascending and descending orbits in Amatya's method inevitably includes geometric distortions arising from the two viewing angles. This integration can compromise the accurate detection of small surface changes in mountainous areas. Moreover, our models' performance does not improve with an increase in the number of pre-event temporal stacks, contrasting with findings reported by Handwerger et al. (2022). Increasing the difference in size between pre- and post-event stacks beyond a certain point decreases model performance. This tradeoff arises because larger stacks, though effective in mitigating noise, can introduce inconsistencies due to varying durations of the sampled processes. For example, the 12-12 case results in lower scores due to insufficient noise mitigation, while the 60-12 case achieves higher scores. However, the 365-12 case shows limited improvement, as the noise reduction saturates and physical process sampling becomes too large compared to the 12 d post-event buffer. This pattern also explains why 24-24 outperforms 60-24 and why 48-48 achieves higher scores than 60-48. In part, this behavior may also depend on the test events: in landscapes affected by strong seasonal changes (e.g., snowmelt), using a longer pre-event time series might help suppress these transient signals and improve performance. Other rapid assessment datasets and tools, such as those by Meena et al. (2023), Xu et al. (2024), Fang et al. (2024), and methods evaluated by Amatya et al. (2023), including HazMapper (Scheip and Wegmann, 2021) and ALADIM (Deprez et al., 2022), rely on optical data and employ diverse techniques such as object-based image analysis (OBIA) (Blaschke, 2010) and deep learning segmentation models. While optical-based tools excel at accurately outlining landslide boundaries, they are hindered by cloud cover and daylight dependency (Nava et al., 2022b), rendering them less effective during disaster response when rapid access to landslide inventories is critical. Conversely, SAR-based tools provide predictions regardless of weather conditions or time of day, albeit with reduced accuracy.
5.1 Insights by Spatial XAI
Figure 6 shows relative pixel contributions. Within these examples, we present four patches where the model assigns a high probability (0.87) of belonging to the landslide class in two instances. While post-event VV imagery maintains this emphasis, post-event VH imagery often shows pixels contributing to increased landslide probability without displaying the landslides themselves. This pattern persists across all VH band cases, suggesting the model uses VH for contextual insights. Despite VV and VH having minor weight in the final model decision, they cleaerly play crucial roles when combined with more impactful features like diffVV and diffVH. The performance gain in VV_VH models mainly reflects the complementary nature of the two polarizations: VV enhances sensitivity to surface roughness and moisture, while VH captures vegetation-related volume scattering, allowing the model to distinguish landslides from background more effectively.
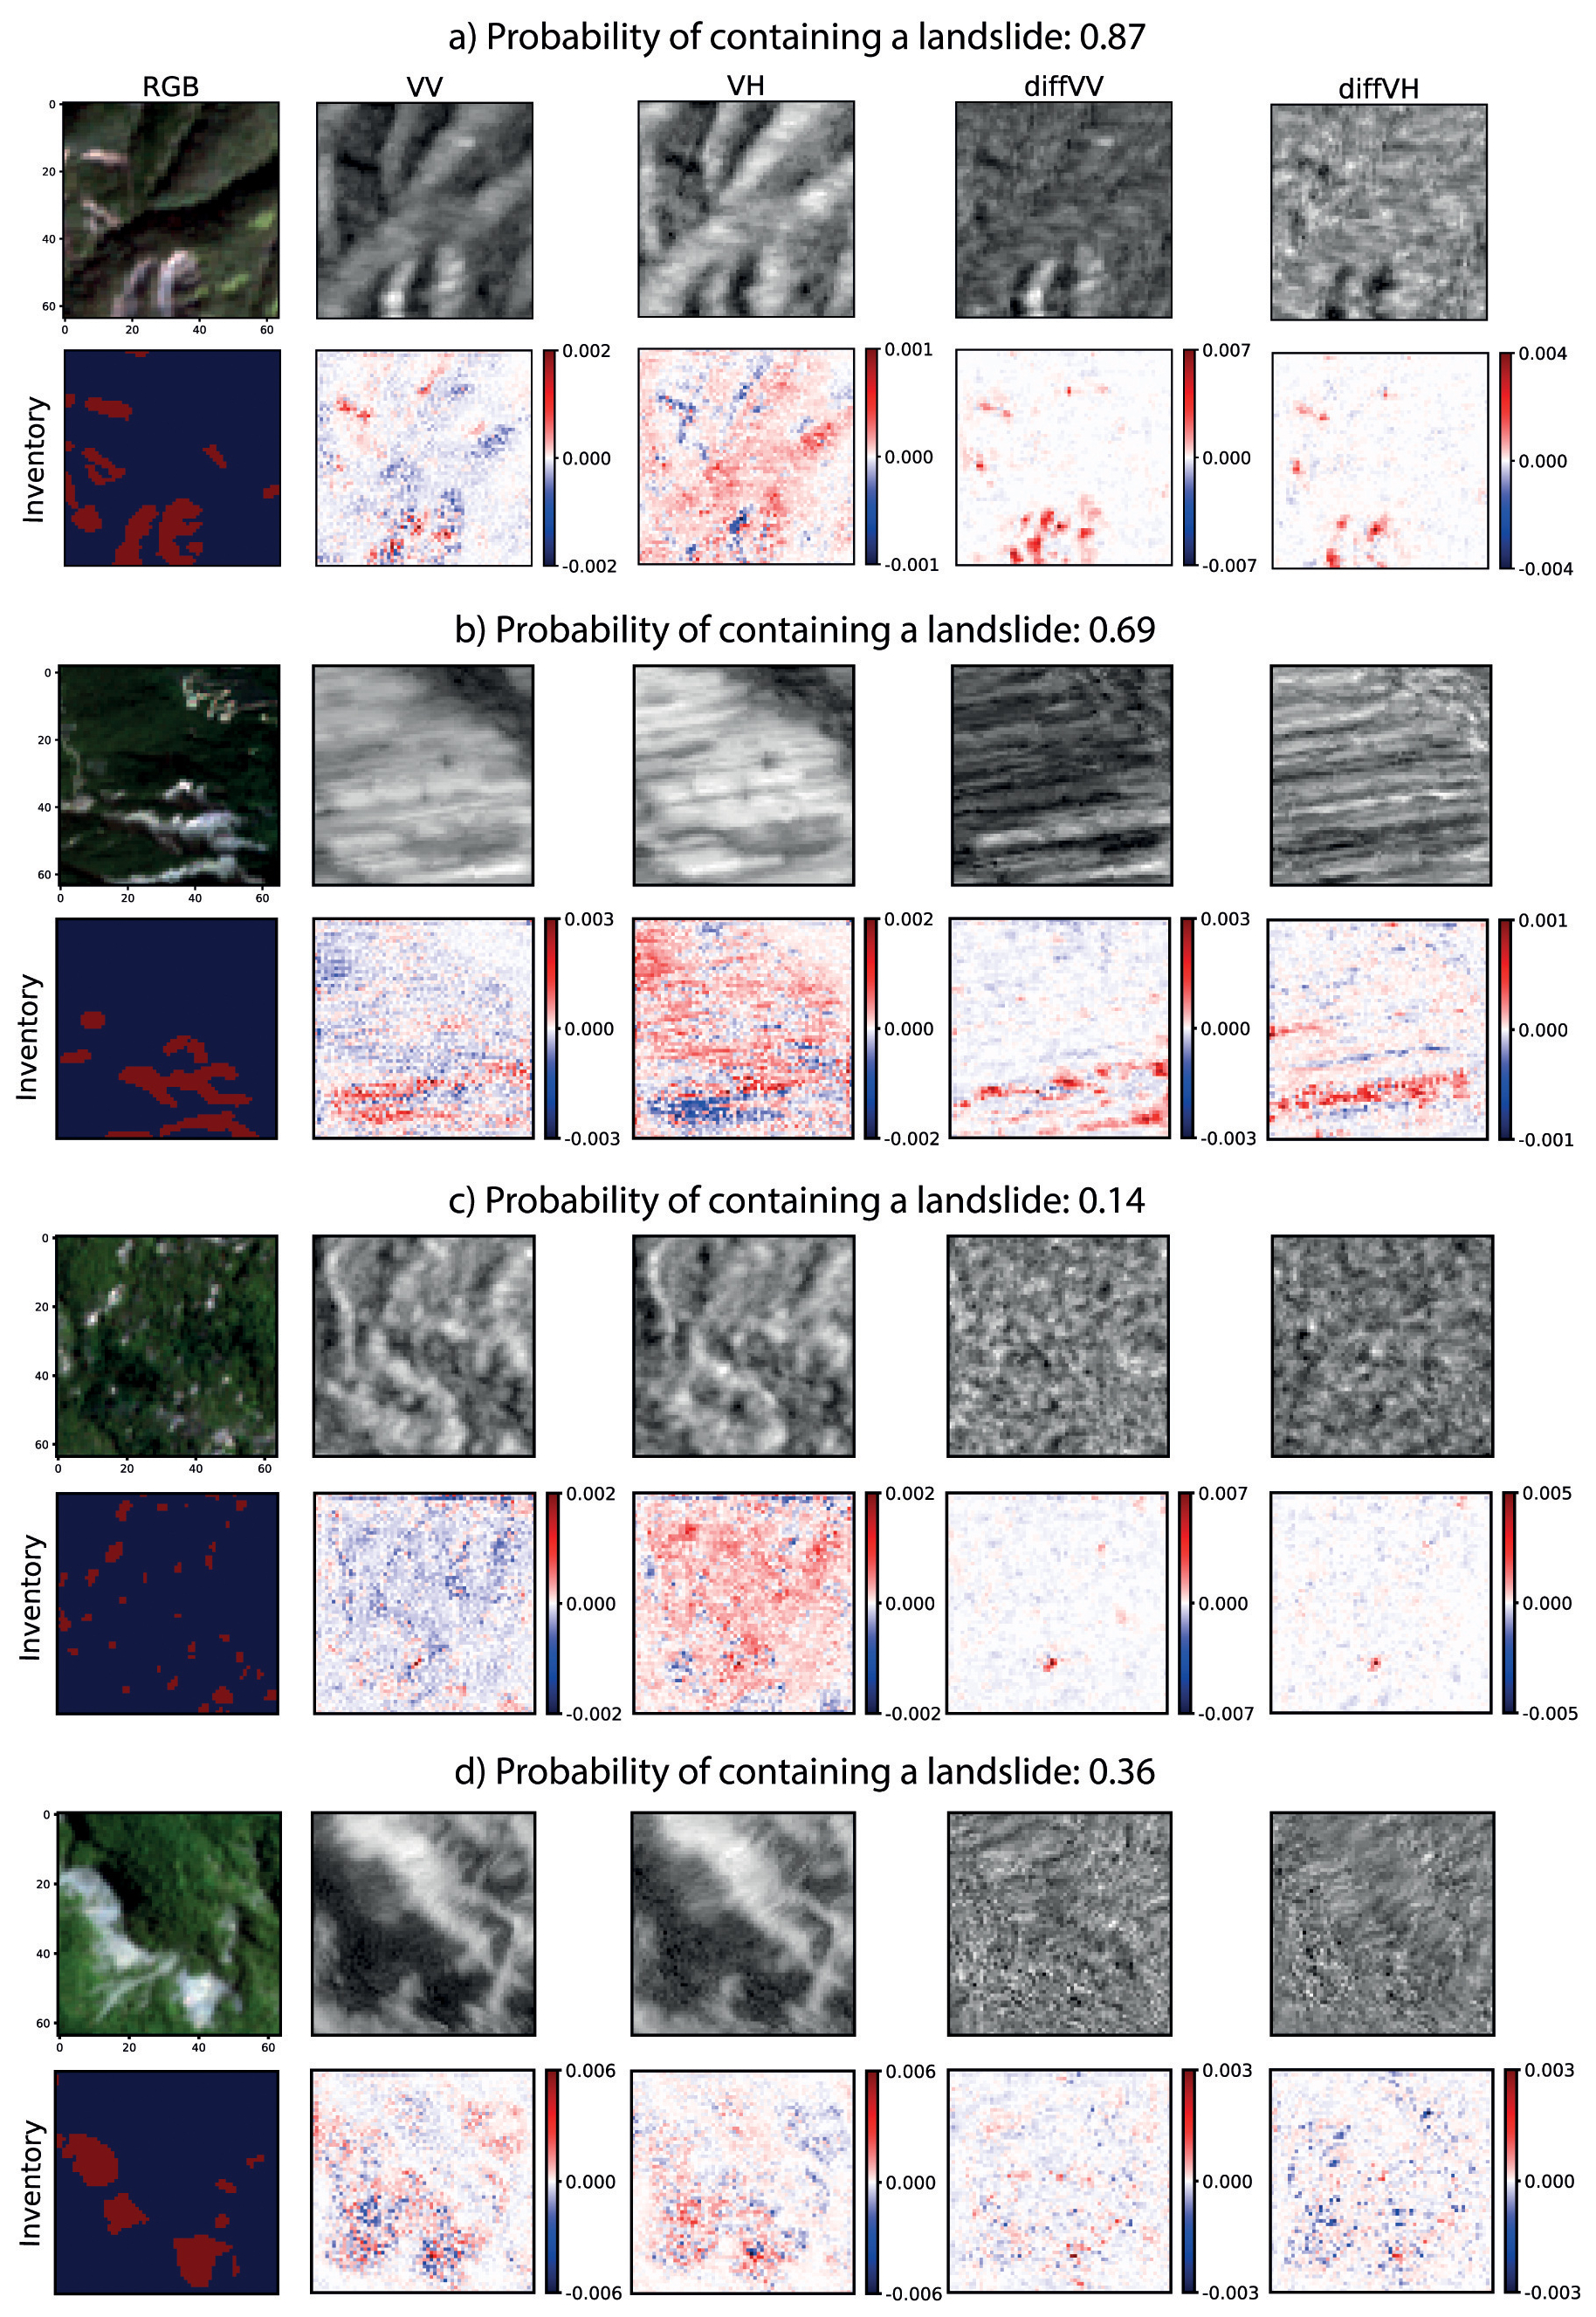
Figure 6XAI pixel contribution maps. We showcase pixel contributions for each of the bands in the patches, alongside a true color image, SAR bands, landslide inventory, and SHAP pixel contributions for four patches within the mixed test set. Panels (a) and (b) depict true positives, where (a) exemplifies a distinguishable landslide correctly detected with a high probability of belonging to the landslide class, while (b) showcases landslides accurately classified despite foreshortening effects. In contrast, (c) and (d) represent false negatives. In (c), landslides are undetected due to their small individual dimensions, illustrating a limitation of the model. Panels (d) illustrates another case of undetected landslides, attributed to missing information in the SAR images.
Figure 6c illustrates a scenario where the size of the landslide is not enough to produce a distinct signature in the SAR image, resulting in an indistinguishable speckle-like “salt and pepper” effect with minimal changes in dimensions, shape, and backscatter. In such cases, the model struggles to correctly classify the patch and assigns a very low probability (0.14) of containing a landslide, despite the presence of multiple landslides within the area. Moreover, while we meticulously filter the inventory to exclude landslides occurring in areas affected by shadow and layover, we can still encounter situations where landslides are not captured by SAR, resulting in bias in the model and misclassifications (e.g., Fig. 6d). This challenge stems from our method of calculating distortion masks, which relies on the geometric interplay between the satellite's side view and the terrain, represented by the SRTM 30 m resolution DEM.
Apparent mismatches between SAR-based pixel contribution and landslide inventories often reflect the intrinsic differences in how SAR captures surface changes rather than errors in the inventories themselves (see Fig. 6b).
Overall, the pixel contributions associated with the diffVV and diffVH bands are promising, as the model demonstrates an ability to identify the areas where most of the landslides occur and focuses attention on the landslide-related pixels. It may be worthwhile to explore applying unsupervised clustering techniques to precisely locate these landslides within the predicted landslide patches. However, it is important to note that the location of landslide-related information in SAR imagery does not always align with the location of landslides in optical imagery due to geometric distortions, which is a current inherent limitation of SAR satellite data.
5.2 Supporting Arguments and Gap Analysis
Our method shows strong generalization, performing well across the tested different landscapes and geographic settings. Performance slightly degrades in unseen events (see Table 5). Data pre-processing is handled in GEE, removing the need for specialized GIS software, while cloud platforms such as Google Colaboratory support deep learning workflows (Yang et al., 2023). The approach achieves reliable results, with few missed detections or false alarms, even on unseen landslide events. We aim to ensure robustness within the available data by training and evaluating the model across areas exhibiting diverse landslide occurrences and environmental variations, while recognizing that some environments remain underrepresented due to the lack of suitable inventories. A key element is the input sampling strategy, which filters out landslides located in SAR layover and shadow zones (Burrows et al., 2020). This prevents the model from learning distortions unrelated to landslide signals, particularly in mountainous terrain where such effects are common. Lastly, while the workflow relies on GEE, all preprocessing steps use standard Sentinel-1 operations that can be easily reproduced outside the platform.
The method may perform less effectively in arid or semi-arid regions, where the data used in this study was scarce. In addition, differential maps can highlight changes unrelated to landslides, such as variations in water levels or suspended material (Hertel et al., 2023). While most inventories used are peer-reviewed and publicly available, their quality is variable (Guzzetti et al., 2012), and potential biases cannot be ruled out. Additionally, the absence or minimal presence of snow in the training and calibration areas may affect our detection capabilities (see Fig. S1 in the Supplement) in regions where snow cover is present before, during, and/or right after the MLE. Another limitation lies in the model's inability to effectively detect small landslides, primarily due to Sentinel-1 data resolution constraints. Utilizing higher-resolution imagery would significantly enhance prediction accuracy. While the 5 % threshold set during training helps minimize overpredictions and excludes patches lacking landslide-related information in SAR images, it may overlook small landslides, particularly if their signals are weak or if only one small landslide is present in the area.
Furthermore, our methodology cannot differentiate between different types of landslides. Continuous testing is essential for mitigating uncertainties associated with unknown and unexplored terrains, poor image quality, and the presence of snow.
The models seems to have higher error rates in herbaceous and open forest areas. These likely reflect a combination of increased backscatter variability, partial canopy effects, and inventory limitations, which together make landslides harder to detect reliably in these environments (see Fig. S2). However, we observed a discrepancy in the distribution of slope and aspect values when comparing the pixels within landslide scars of patches correctly predicted as landslides (True Positives) with those where landslides were missed (False Negatives). In True Positives, the distributions of slope and aspect align with the overall distribution observed in landslide scars across the entire training set (see Fig. S1), indicating that the model performs well when detecting landslides that align with these typical distributions. However, considering False Negatives, the distributions diverge, particularly in areas with high slope degrees (see Fig. 7).
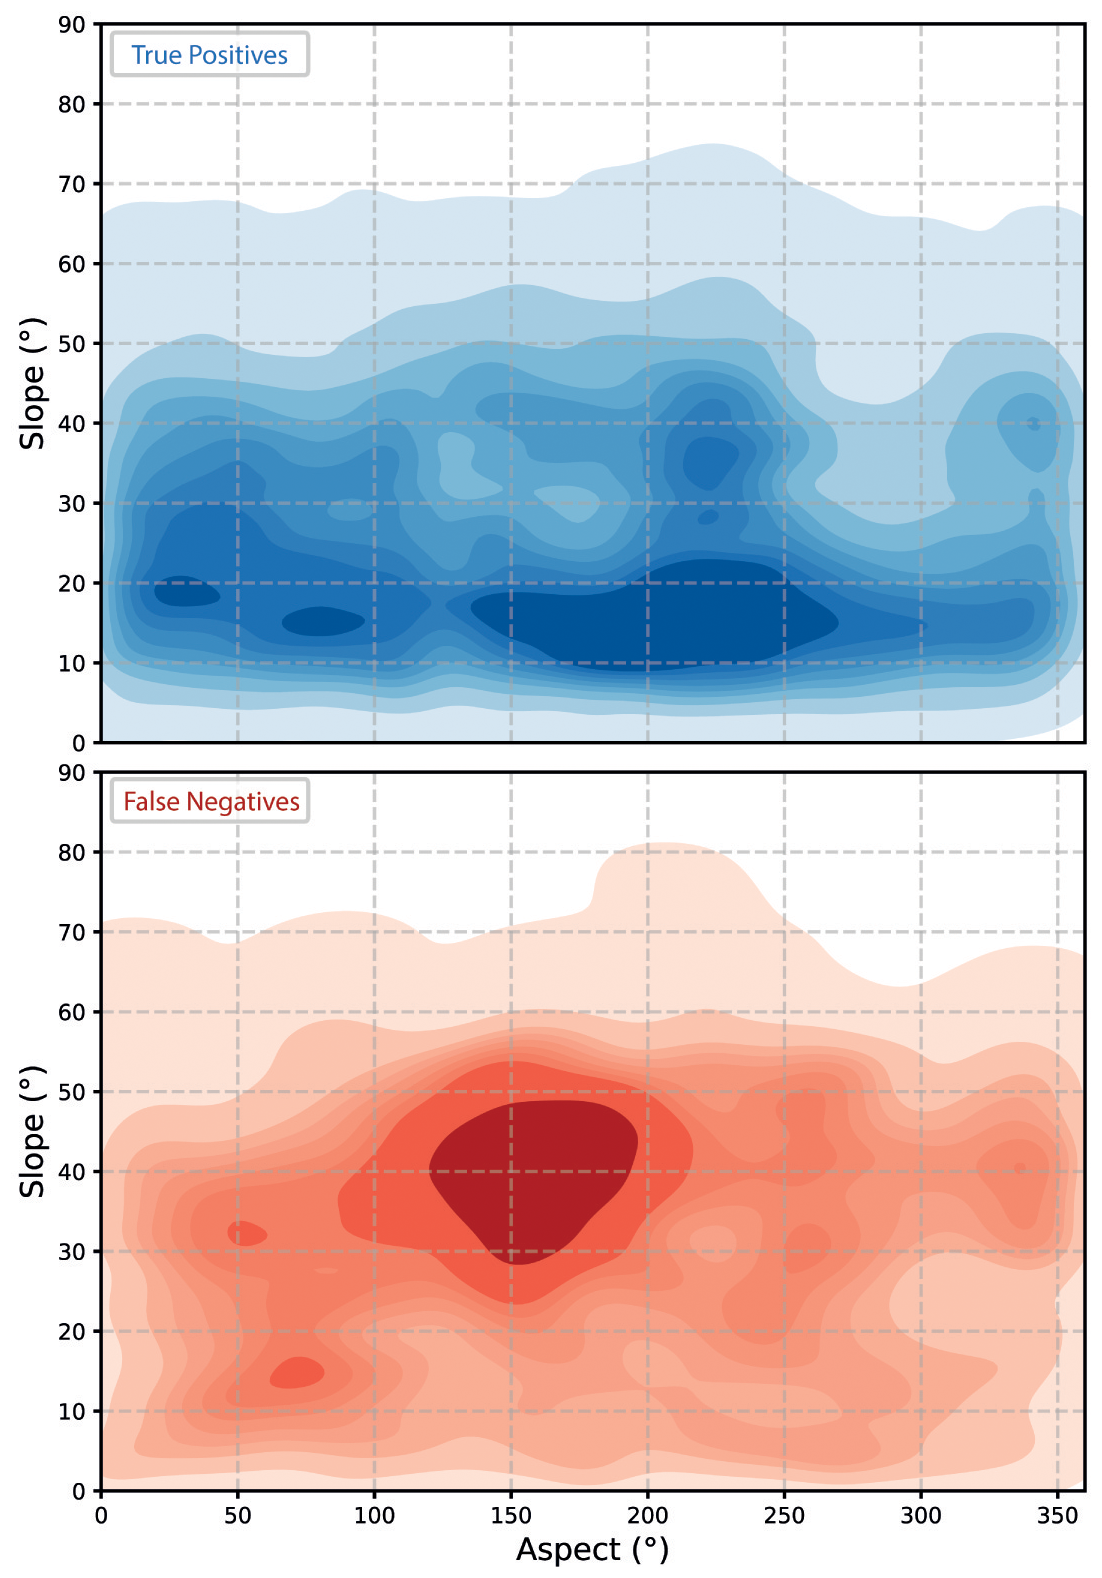
Figure 7Kernel Density Estimation of the slope and aspect values in the landslide scars, in the True Positive and False Negative predictions of the test dataset by the model trained on the descending orbit for the 60-12 temporal stack combination in the six study areas used to perform the SAR settings comparison.
Slopes steeper than 30° can produce significant SAR backscatter distortions, reducing the visibility of landslide features. In terms of aspect, we find that misclassifications peak around 160° (SE) in the descending orbit, whereas the distribution of True Positives follows the overall landslide aspect distribution, peaking near 225° (SW). This suggests that slopes facing SE, which are closer to perpendicular to the Sentinel-1 descending look direction (≈250°), are harder to classify correctly. In this configuration, the radar beam strikes the slope at a grazing angle, reducing backscatter contrast and making landslides less distinguishable.
5.3 Future Research Directions
Our analysis focused on earthquake-induced landslides; future work will also consider rainfall-triggered events. Although we used only Sentinel-1 C-band backscatter intensity, the methodology can be extended to SAR data with different wavelengths and resolutions (e.g., X- and L-band). Upcoming missions such as NISAR, with S- and L-band sensors and higher acquisition frequencies, are expected to improve monitoring, particularly in vegetated areas. Incorporating multiple wavelengths and polarizations may provide complementary information and enhance model performance. Another direction is to test the impact of terrain attributes (e.g., slope, aspect, land cover) on detection and generalization.
An alternative strategy is to work directly with Single Look Complex (SLC) data, enabling custom filtering and co-registration to generate tailored SAR composites. This would allow experiments with features such as differenced coherence, which, despite lower spatial resolution, can be more sensitive to surface changes than backscatter (Burrows et al., 2020).
Future work should also explore how population bias across events influences model behavior, for example by testing event-level balancing strategies such as oversampling smaller events.
Finally, while we employed a CNN, future studies should explore advanced architectures, including Visual Transformers (Liu et al., 2024) and Interactive Differential Attention Networks (Ji et al., 2024), to further improve landslide detection.
In this study, we demonstrate the efficacy of Sentinel-1 SAR backscatter and DNNs for generalized rapid co-seismic landslide detection in vegetated areas, introducing a data-centric approach to achieve this goal. We develop this method by using 11 earthquake-induced MLEs, comprising a total of 73 thousand landslides. We test the approach on unseen MLEs, located in Sumatra and Haiti, to validate the generalizability and applicability of the approach. We use XAI to examine the pixel contributions of the model across various SAR bands, uncovering indicators of landslide-related information, also in foreshortening. As per our current knowledge, this study represents the first evidence supporting the feasibility of applying DNNs to enable generalized landslide rapid assessment via SAR backscatter data, across diverse geographic locations. Therefore, we establish a robust foundation for future research endeavors, wherein SAR and DNNs can be harnessed to locate terrain changes in mountainous regions. The approach leverages the cloud-based capabilities of GEE and Google Colaboratory, eliminating the need for specialized software and democratizing geospatial analysis globally. Lastly, we introduce the SAR-LRA Tool, serving as an asset for swift all-weather landslide assessment, available here: https://doi.org/10.5281/zenodo.14898556 (Nava et al., 2025). As reliable inventories become increasingly available, we are committed to continuously updating and refining our models and datasets to improve their accuracy and generalizability.
A1 ResNet-Based Model
The ResNet model employs residual learning with skip connections to mitigate the vanishing gradient problem, enabling efficient training of deep networks. It uses Residual Blocks with two convolutional layers (3×3 kernels) and ReLU activation, where the input is summed with the output via skip connections. The architecture includes an initial convolutional layer, multiple Residual Blocks interspersed with MaxPooling layers, and a Dropout layer to reduce overfitting. A fully connected layer with sigmoid activation provides binary classification outputs. Optimization is performed using the Adam optimizer with a binary cross-entropy loss function, offering robust generalization for complex tasks.
A2 CBAM-Based Model
The CBAM model incorporates the Convolutional Block Attention Module (CBAM) to enhance feature selection via Channel and Spatial Attention (Tang et al., 2021). Channel Attention refines critical feature channels using global pooling and dense layers, while Spatial Attention emphasizes significant regions using pooled features processed through a 7×7 convolution. The architecture consists of convolutional layers, CBAM modules, MaxPooling layers, and dense layers with Dropout for regularization. The final output uses sigmoid activation. CBAM improves feature representation with minimal computational overhead, making it effective for tasks requiring selective focus.
A3 Performance Comparison
Table A1Performance Metrics of CNN, CBAM, and ResNet Architectures on 60-12 VV_VH Dataset.
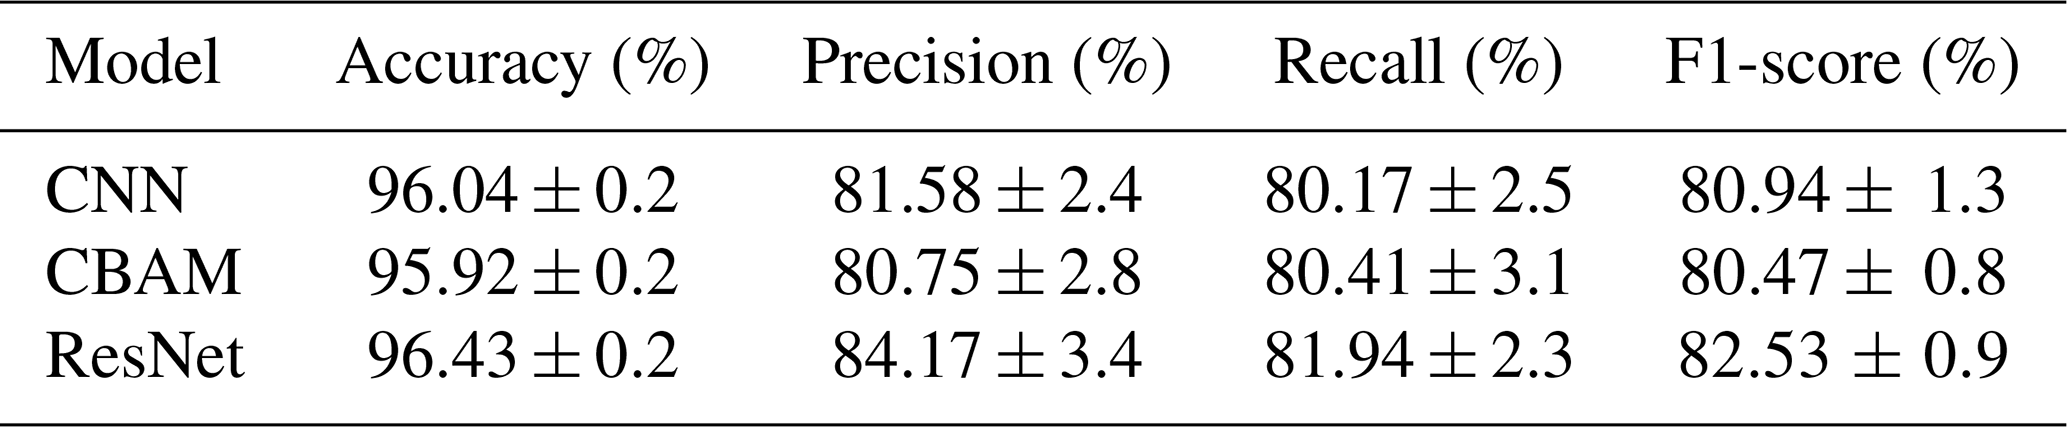
Table A2Median and Standard Deviation of Accuracy, Precision, Recall, and F1-Score for VV_VH Datasets.
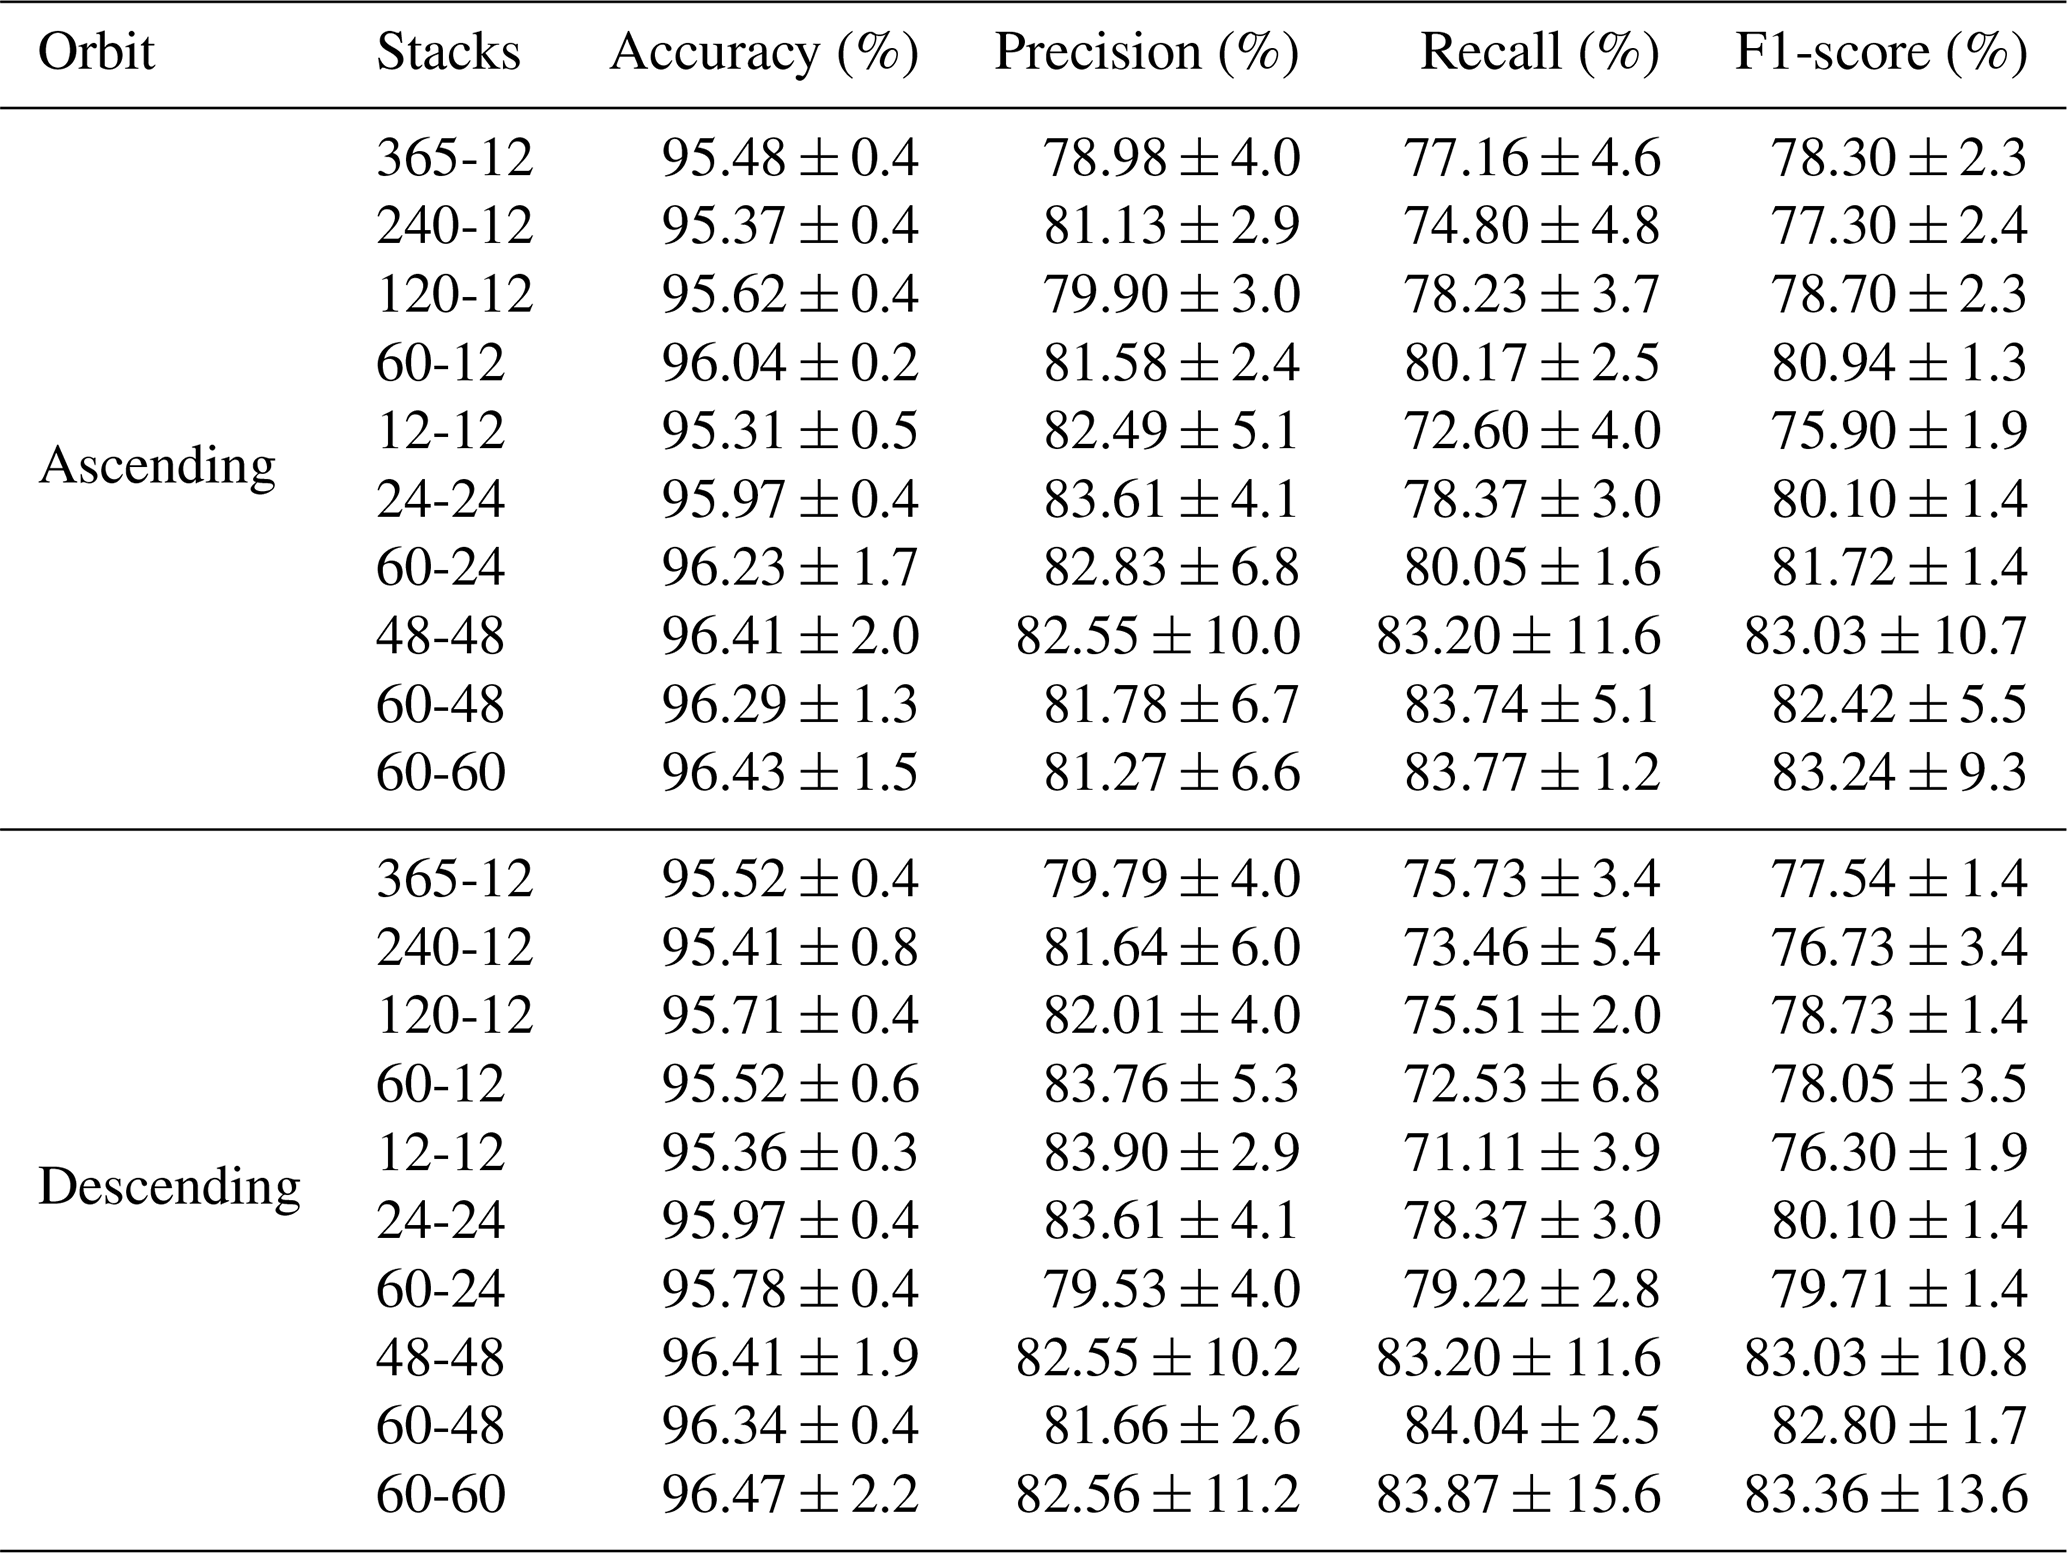
Table A3Median and Standard Deviation of Accuracy, Precision, Recall, and F1-Score for VV Datasets.
The code and model weights of SAR-LRA are available at https://github.com/lorenzonava96/SAR-and-DL-for-Landslide-Rapid-Assessment (last access: 29 November 2025) and https://doi.org/10.5281/zenodo.14898556 (Nava et al., 2025). As new MLE polygon inventories emerge, we will update the tool accordingly and upload the new versions in the same repository, accompanied by detailed descriptions of the modifications made. The datasets used to train SAR-LRA are available at https://doi.org/10.5281/zenodo.14898556 (Nava et al., 2025).
The supplement related to this article is available online at https://doi.org/10.5194/gmd-19-167-2026-supplement.
L.N. contributed to the conceptualization, design of the research, formal analysis, data curation, methodology, investigation, and drafting of the original manuscript, as well as review and editing. A.C.M contributed to the conceptualization, design of the research, investigation, and drafting of the original manuscript, as well as review and editing. K.B. and C.F. contributed to the formal analysis, investigation, and drafting of the original manuscript, as well as review and editing. O.M., A.N., and F.C. contributed to the conceptualization and review and editing of the manuscript.
The contact author has declared that none of the authors has any competing interests.
Publisher's note: Copernicus Publications remains neutral with regard to jurisdictional claims made in the text, published maps, institutional affiliations, or any other geographical representation in this paper. The authors bear the ultimate responsibility for providing appropriate place names. Views expressed in the text are those of the authors and do not necessarily reflect the views of the publisher.
The inventories utilized in our analysis primarily originate from open-access repositories, with a notable emphasis on the “Landslide Inventories” repository provided by USGS (accessible at https://www.sciencebase.gov/catalog/item/586d824ce4b0f5ce109fc9a6, last access: 15 April 2024). We extend our sincere appreciation to the authors for their generous contribution of data, which greatly facilitated our research efforts.
This research was supported by the “The Geosciences for Sustainable Development” project (Budget Ministero dell'Università e della Ricerca–Dipartimenti di Eccellenza 2023–2027C93C23002690001) and by Sichuan Science and Technology Program (grant no. 2024JDHJ0038). Alessandro Novellino was funded through the BGS International NC programme “Geoscience to tackle Global Environmental Challenges” (NERC reference NE/X006255/1). Oriol Monserrat was funded by the Spanish Grant PID2020-116540RB-C21 funded by MCIN/AEI/10-.13039/501100011033.
This paper was edited by Rohitash Chandra and reviewed by two anonymous referees.
Abadi, M., Agarwal, A., Barham, P., Brevdo, E., Chen, Z., Citro, C., Corrado, G. S., Davis, A., Dean, J., and Devin, M.: Tensorflow: Large-scale machine learning on heterogeneous distributed systems, arXiv [preprint], https://doi.org/10.48550/arXiv.1603.04467, 2016. a
Amatya, P., Scheip, C., Déprez, A., Malet, J.-P., Slaughter, S. L., Handwerger, A. L., Emberson, R., Jean-Baptiste, J., Huang, M.-H., Clark, M. K., Zekkos, D., Huang, J.-R., Pacini, F., and Boissier, E.: Learnings from rapid response efforts to remotely detect landslides triggered by the August 2021 Nippes earthquake and Tropical Storm Grace in Haiti, Natural Hazards, 118, 2337–2375, https://doi.org/10.1007/s11069-023-06096-6, 2023. a, b, c
Beni, T., Nava, L., Gigli, G., Frodella, W., Catani, F., Casagli, N., Gallego, J. I., Margottini, C., and Spizzichino, D.: Classification of rock slope cavernous weathering on UAV photogrammetric point clouds: The example of Hegra (UNESCO World Heritage Site, Kingdom of Saudi Arabia), Eng. Geol., 325, https://doi.org/10.1016/j.enggeo.2023.107286, 2023. a
Bhuyan, K., Tanyaş, H., Nava, L., Puliero, S., Meena, S. R., Floris, M., van Westen, C., and Catani, F.: Generating multi-temporal landslide inventories through a general deep transfer learning strategy using HR EO data, Sci. Rep., 13, 162, https://doi.org/10.1038/s41598-022-27352-y, 2023. a
Blaschke, T.: Object based image analysis for remote sensing, ISPRS J. Photogramm. Remote Sens., 65, 2–16, https://doi.org/10.1016/j.isprsjprs.2009.06.004, 2010. a
Burrows, K., Walters, R. J., Milledge, D., Spaans, K., and Densmore, A. L.: A new method for large-scale landslide classification from satellite radar, Remote Sensing, 11, 237, https://doi.org/10.3390/rs11030237, 2019. a
Burrows, K., Walters, R. J., Milledge, D., and Densmore, A. L.: A systematic exploration of satellite radar coherence methods for rapid landslide detection, Nat. Hazards Earth Syst. Sci., 20, 3197–3214, https://doi.org/10.5194/nhess-20-3197-2020, 2020. a, b, c, d
Burrows, K., Milledge, D., Walters, R. J., and Bellugi, D.: Integrating empirical models and satellite radar can improve landslide detection for emergency response, Nat. Hazards Earth Syst. Sci., 21, 2993–3014, https://doi.org/10.5194/nhess-21-2993-2021, 2021. a
Catani, F.: Landslide detection by deep learning of non-nadiral and crowdsourced optical images, Landslides, 18, https://doi.org/10.1007/s10346-020-01513-4, 2021. a
Catani, F., Casagli, N., Ermini, L., Righini, G., and Menduni, G.: Landslide hazard and risk mapping at catchment scale in the Arno River basin, Landslides, 2, 329–342, https://doi.org/10.1007/s10346-005-0021-0, 2005. a
Chen, L., Li, Z., Song, C., Xing, J., Cai, X., Fang, Z., Luo, R., and Li, Z.: Automatic detection of earthquake triggered landslides using Sentinel-1 SAR imagery based on deep learning, International Journal of Digital Earth, 17, 2393261, https://doi.org/10.1080/17538947.2024.2393261, 2024. a
Chorowicz, J., Scanvic, J. Y., Rouzeau, O., and Cuervo, G. V.: Observation of recent and active landslides from SAR ERS-1 and JERS-1 imagery using a stereo-simulation approach: Example of the Chicamocha valley in Colombia, Int. J. Remote Sens., 19, 3187–3196, https://doi.org/10.1080/014311698214253, 1998. a
Dai, L., Fan, X., Wang, X., Fang, C., Zou, C., Tang, X., Wei, Z., Xia, M., Wang, D., and Xu, Q.: Coseismic landslides triggered by the 2022 Luding Ms6.8 earthquake, China, Landslides, 20, 1277–1292, https://doi.org/10.1007/s10346-023-02061-3, 2023a. a
Dai, L., Fan, X., Wang, X., Fang, C., Zou, C., Tang, X., Wei, Z., Xia, M., Wang, D., and Xu, Q.: Coseismic landslides triggered by the 2022 Luding Ms6.8 earthquake, China, Landslides, 20, 1277–1292, https://doi.org/10.1007/s10346-023-02061-3, 2023b. a
Deprez, A., Marc, O., Malet, J.-P., Stumpf, A., and Michéa, D.: ALADIM – A change detection on-line service for landslide detection from EO imagery, EGU General Assembly 2022, Vienna, Austria, 23–27 May 2022, EGU22-3536, https://doi.org/10.5194/egusphere-egu22-3536, 2022. a
Eeckhaut, M. V. D., Hervás, J., and Montanarella, L.: Landslide databases in Europe: Analysis and recommendations for interoperability and harmonisation, in: Landslide Science and Practice, 35–42, Springer Berlin Heidelberg, https://doi.org/10.1007/978-3-642-31325-7_4, 2013. a
European Space Agency/Copernicus: Sentinel-1 – Copernicus open-access SAR mission, https://sentinels.copernicus.eu/web/sentinel/copernicus/sentinel-1 (last access: 3 January 2025), 2025. a
Fang, C., Fan, X., Zhong, H., Lombardo, L., Tanyaş, H., and Wang, X.: A novel historical landslide detection approach based on LiDAR and lightweight attention U-Net, Remote Sens., 14, 4357, https://doi.org/10.3390/rs14174357, 2022. a
Fang, C., Fan, X., Wang, X., Nava, L., Zhong, H., Dong, X., Qi, J., and Catani, F.: A globally distributed dataset of coseismic landslide mapping via multi-source high-resolution remote sensing images, Earth Syst. Sci. Data, 16, 4817–4842, https://doi.org/10.5194/essd-16-4817-2024, 2024. a, b, c
Ferrario, M. F.: Landslides triggered by multiple earthquakes: Insights from the 2018 Lombok (Indonesia) events, Natural Hazards, 98, https://doi.org/10.1007/s11069-019-03718-w, 2019. a, b
Froude, M. J. and Petley, D. N.: Global fatal landslide occurrence from 2004 to 2016, Nat. Hazards Earth Syst. Sci., 18, 2161–2181, https://doi.org/10.5194/nhess-18-2161-2018, 2018. a
García-Delgado, H., Cordón, J. L. C., and Rodríguez, C. A. G.: Landslides triggered by the December 24, 2019 Mesetas (Meta, Colombia) earthquake, in: Proceedings of the 13th International Symposium on Landslides, https://www.issmge.org/publications/publication/landslides-triggered-by-the-december-24-2019-mesetas-meta-colombia-earthquake (last access: 12 December 2023), 2021. a
Ghorbanzadeh, O., Blaschke, T., Gholamnia, K., Meena, S. R., Tiede, D., and Aryal, J.: Evaluation of different machine learning methods and deep-learning convolutional neural networks for landslide detection, Remote Sens., 11, https://doi.org/10.3390/rs11020196, 2019. a
Ghorbanzadeh, O., Xu, Y., Zhao, H., Wang, J., Zhong, Y., Zhao, D., Zang, Q., Wang, S., Zhang, F., Shi, Y., Zhu, X., Bai, L., Li, W., Peng, W., and Ghamisi, P.: The outcome of the 2022 landslide4sense competition: Advanced landslide detection from multisource satellite imagery, IEEE J. Sel. Top. Appl. Earth Observ. Remote Sens., 15, 9927–9942, 2022. a
Guan, H., Huang, J., Li, L., Li, X., Miao, S., Su, W., Ma, Y., Niu, Q., and Huang, H.: Improved Gaussian mixture model to map the flooded crops of VV and VH polarization data, Remote Sens. Environ., 295, 113714, https://doi.org/10.1016/j.rse.2023.113714, 2023. a
Guzzetti, F., Mondini, A. C., Cardinali, M., Fiorucci, F., Santangelo, M., and Chang, K.-T.: Landslide inventory maps: New tools for an old problem, Earth Sci. Rev., 112, 42–66, https://doi.org/10.1016/j.earscirev.2012.02.001, 2012. a, b, c
Han, Z., Fang, Z., Li, Y., and Fu, B.: A novel Dynahead-Yolo neural network for the detection of landslides with variable proportions using remote sensing images, Front. Earth Sci. (Lausanne), 10, https://doi.org/10.3389/feart.2022.1077153, 2023. a
Handwerger, A. L., Huang, M.-H., Jones, S. Y., Amatya, P., Kerner, H. R., and Kirschbaum, D. B.: Generating landslide density heatmaps for rapid detection using open-access satellite radar data in Google Earth Engine, Nat. Hazards Earth Syst. Sci., 22, 753–773, https://doi.org/10.5194/nhess-22-753-2022, 2022. a, b, c, d
Hertel, V., Chow, C., Wani, O., Wieland, M., and Martinis, S.: Probabilistic SAR-based water segmentation with adapted Bayesian convolutional neural network, Remote Sens. Environ., 285, 113388, https://doi.org/10.1016/j.rse.2022.113388, 2023. a, b
Hu, K., Zhang, X., You, Y., Hu, X., Liu, W., and Li, Y.: Landslides and dammed lakes triggered by the 2017 Ms6.9 Milin earthquake in the Tsangpo gorge, Landslides, 16, 993–1001, https://doi.org/10.1007/s10346-019-01168-w, 2019. a
Ji, Y., Sun, W., Wang, Y., Lv, Z., Yang, G., Zhan, Y., and Li, C.: Domain Adaptive and Interactive Differential Attention Network for Remote Sensing Image Change Detection, IEEE Transactions on Geoscience and Remote Sensing, https://doi.org/10.1109/TGRS.2024.3382116, 2024. a
Kingma, D. P. and Ba, J.: Adam: A method for stochastic optimization, arXiv [preprint], https://doi.org/10.48550/arXiv.1412.6980, 2017. a
Konishi, T. and Suga, Y.: Landslide detection using COSMO-SkyMed images: A case study of a landslide event on Kii Peninsula, Japan, Eur. J. Remote Sens., 51, 205–221, https://doi.org/10.1080/22797254.2017.1418185, 2018. a
Lee, C.-H., Lin, C.-R., and Chen, M.-S.: Sliding window filtering: an efficient method for incremental mining on a time-variant database, Inf. Syst., 30, 227–244, https://doi.org/10.1016/j.is.2004.02.001, 2005. a
Liang, R., Dai, K., Lopez-Sanchez, J. M., Han, Y., Shi, X., and Xu, Q.: Landslide mapping from post-event single-temporal polarimetric SAR image by a deep learning method exploiting a morphological model, Remote Sensing of Environment, 328, 114904, https://doi.org/10.1016/j.rse.2025.114904, 2025. a
Lin, S.-Y., Lin, C.-W., and Van Gasselt, S.: Towards Monitoring of Mountain Mass Wasting Using Object-Based Image Analysis Using SAR Intensity Images, in: 2021 IEEE International Geoscience and Remote Sensing Symposium IGARSS, 3813–3816, https://doi.org/10.1109/IGARSS47720.2021.9554248, 2021. a
Lin, T.-Y., Goyal, P., Girshick, R., He, K., and Dollar, P.: Focal Loss for Dense Object Detection, in: Proc. IEEE Int. Conf. Computer Vision (ICCV), p. 299, https://doi.org/10.1109/ICCV.2017.324, 2017. a
Lindsay, E., Frauenfelder, R., Rüther, D., Nava, L., Rubensdotter, L., Strout, J., and Nordal, S.: Multi-temporal satellite image composites in Google Earth Engine for improved landslide visibility: A case study of a glacial landscape, Remote Sens., 14, https://doi.org/10.3390/rs14102301, 2022. a
Lindsay, E., Ganerød, J., Devoli, G., Reiche, J., Nordal, S., Frauenfelder, R., and Tokle, L.: Understanding landslide expression in SAR backscatter data: A global study, Preprints, 2023020390, https://doi.org/10.20944/preprints202302.0390.v1, 2023. a
Liu, Q., Wu, T., Deng, Y., and Liu, Z.: SE-YOLOv7 Landslide Detection Algorithm Based on Attention Mechanism and Improved Loss Function, Land, 12, 1522, https://doi.org/10.3390/land12081522, 2023. a
Liu, Y., Zhang, Y., Wang, Y., Hou, F., Yuan, J., Tian, J., and He, Z.: A survey of visual transformers, IEEE Transactions on Neural Networks and Learning Systems, 35, 7478–7498, https://doi.org/10.1109/TNNLS.2022.3227717, 2024. a
Manconi, A., Casu, F., Ardizzone, F., Bonano, M., Cardinali, M., De Luca, C., Gueguen, E., Marchesini, I., Parise, M., Vennari, C., Lanari, R., and Guzzetti, F.: Brief Communication: Rapid mapping of landslide events: the 3 December 2013 Montescaglioso landslide, Italy, Nat. Hazards Earth Syst. Sci., 14, 1835–1841, https://doi.org/10.5194/nhess-14-1835-2014, 2014. a
Martinez, S. N., Allstadt, K. E., Slaughter, S. L., Schmitt, R., Collins, E., Schaefer, L. N., and Ellison, S.: Landslides triggered by the August 14, 2021, magnitude 7.2 Nippes, Haiti, earthquake, USGS Open-File Report, 2021–1112, 1–17, https://doi.org/10.3133/ofr20211112, 2021. a
Meena, S. R. and Piralilou, M. T.: Comparison of Earthquake-Triggered Landslide Inventories: A Case Study of the 2015 Gorkha Earthquake, Nepal, Geosciences, 9, 437, https://doi.org/10.3390/geosciences9100437, 2019. a
Meena, S. R., Ghorbanzadeh, O., van Westen, C. J., Nachappa, T. G., Blaschke, T., Singh, R. P., and Sarkar, R.: Rapid mapping of landslides in the Western Ghats (India) triggered by 2018 extreme monsoon rainfall using a deep learning approach, Landslides, 18, 1937–1950, https://doi.org/10.1007/s10346-020-01602-4, 2021. a
Meena, S. R., Nava, L., Bhuyan, K., Puliero, S., Soares, L. P., Dias, H. C., Floris, M., and Catani, F.: HR-GLDD: a globally distributed dataset using generalized deep learning (DL) for rapid landslide mapping on high-resolution (HR) satellite imagery, Earth Syst. Sci. Data, 15, 3283–3298, https://doi.org/10.5194/essd-15-3283-2023, 2023. a, b, c, d
Mondini, A., Santangelo, M., Rocchetti, M., Rossetto, E., Manconi, A., and Monserrat, O.: Sentinel-1 SAR amplitude imagery for rapid landslide detection, Remote Sens., 11, 760, https://doi.org/10.3390/rs11070760, 2019. a
Mondini, A. C., Guzzetti, F., Chang, K. T., Monserrat, O., Martha, T. R., and Manconi, A.: Landslide failures detection and mapping using Synthetic Aperture Radar: Past, present and future, Earth Sci. Rev., https://doi.org/10.1016/j.earscirev.2021.103574, 2021a. a
Mondini, A. C., Guzzetti, F., Chang, K. T., Monserrat, O., Martha, T. R., and Manconi, A.: Landslide failures detection and mapping using Synthetic Aperture Radar: Past, present and future, Earth-Science Reviews, 217, 103574, https://doi.org/10.1016/j.earscirev.2021.103574, 2021b. a, b
NASA Earthdata: Synthetic aperture radar (SAR), https://www.earthdata.nasa.gov/learn/earth-observation-data-basics/sar (last access: 10 April 2025), 2025. a
Nava, L.: SAR-LRA: A Synthetic Aperture Radar-Based Landslide Rapid Assessment Tool, GitHub [ICE], https://github.com/lorenzonava96/SAR-and-DL-for-Landslide-Rapid-Assessment/blob/main/SAR-LRA Tool V2/SAR_LRA_Tool_V2.ipynb, last access: (10 November 2025) 2025.
Nava, L., Bhuyan, K., Meena, S. R., Monserrat, O., and Catani, F.: Rapid mapping of landslides on SAR data by Attention U-Net, Remote Sens., 14, https://doi.org/10.3390/rs14061449, 2022a. a
Nava, L., Monserrat, O., and Catani, F.: Improving landslide detection on SAR data through deep learning, IEEE Geoscience and Remote Sensing Letters, 19, https://doi.org/10.1109/LGRS.2021.3127073, 2022b. a, b, c, d, e
Nava, L., Mondini, A. C., Fang, C., Bhuyan, K., Monserrat, O., Novellino, A., and Catani, F.: SAR-LRA: A Synthetic Aperture Radar-Based Landslide Rapid Assessment Tool, Zenodo [code, data set], https://doi.org/10.5281/zenodo.14898556, 2025. a, b, c
Neubeck, A. and Gool, L. V.: Efficient non-maximum suppression, in: Proc. 18th Int. Conf. Pattern Recognition (ICPR'06), 850–855, IEEE, https://doi.org/10.1109/ICPR.2006.479, 2006. a
Nocentini, N., Rosi, A., Segoni, S., and Fanti, R.: Towards landslide space-time forecasting through machine learning: The influence of rainfall parameters and model setting, Front. Earth Sci. (Lausanne), 11, https://doi.org/10.3389/feart.2023.1152130, 2023. a
Novellino, A., Pennington, C., Leeming, K., Taylor, S., Alvarez, I. G., McAllister, E., Arnhardt, C., and Winson, A.: Mapping landslides from space: A review, Landslides, 1–12, https://doi.org/10.1007/s10346-024-02215-x, 2024. a
Ohki, M., Abe, T., Tadono, T., and Shimada, M.: Landslide detection in mountainous forest areas using polarimetry and interferometric coherence, Earth, Planets and Space, 72, https://doi.org/10.1186/s40623-020-01191-5, 2020. a
Plank, S., Twele, A., and Martinis, S.: Landslide mapping in vegetated areas using change detection based on optical and polarimetric SAR data, Remote Sens., 8, https://doi.org/10.3390/rs8040307, 2016. a
Prakash, N., Manconi, A., and Loew, S.: A new strategy to map landslides with a generalized convolutional neural network, Sci. Rep., 11, 9722, https://doi.org/10.1038/s41598-021-89015-8, 2021. a, b
Roback, K., Clark, M. K., West, A. J., Zekkos, D., Li, G., Gallen, S. F., Chamlagain, D., and Godt, J. W.: The size, distribution, and mobility of landslides caused by the 2015 Mw7.8 Gorkha earthquake, Nepal, Geomorphology, 301, 121–138, https://doi.org/10.1016/j.geomorph.2017.01.030, 2017. a
Ruiz, P., Rodriguez, N., Valverde, J., Marden, A., Vecchiarelli, L., Seal, D., Jessee, M. A. N., and Hamburger, M. W.: A comprehensive catalog of coseismic landslides in Costa Rica: Toward the development of an empirical landslide hazard model, in: AGU Fall Meeting Abstracts, NH030–0004, 2020. a
Santangelo, M., Cardinali, M., Bucci, F., Fiorucci, F., and Mondini, A. C.: Exploring event landslide mapping using Sentinel-1 SAR backscatter products, Geomorphology, 397, 108021, https://doi.org/10.1016/j.geomorph.2021.108021, 2022. a, b
Scheip, C. M. and Wegmann, K. W.: HazMapper: a global open-source natural hazard mapping application in Google Earth Engine, Nat. Hazards Earth Syst. Sci., 21, 1495–1511, https://doi.org/10.5194/nhess-21-1495-2021, 2021. a
Segoni, S., Rossi, G., Rosi, A., and Catani, F.: Landslides triggered by rainfall: A semi-automated procedure to define consistent intensity–duration thresholds, Comput. Geosci., 63, 123–131, https://doi.org/10.1016/j.cageo.2013.10.009, 2014. a
Serey, A., Piñero-Feliciangeli, L., Sepúlveda, S. A., Poblete, F., Petley, D. N., and Murphy, W.: Landslides induced by the 2010 Chile megathrust earthquake: A comprehensive inventory and correlations with geological and seismic factors, Landslides, https://doi.org/10.1007/s10346-019-01150-6, 2019. a
Singhroy, V.: SAR integrated techniques for geohazard assessment, Advances in Space Research, 15, 67–78, https://doi.org/10.1016/0273-1177(95)00076-Q, 1995. a, b
Soldato, M. D., Solari, L., Novellino, A., Monserrat, O., and Raspini, F.: A new set of tools for the generation of InSAR visibility maps over wide areas, Geosciences, 11, 229, https://doi.org/10.3390/geosciences11060229, 2021. a
Song, K., Wang, F., Dai, Z., Iio, A., Osaka, O., and Sakata, S.: Geological characteristics of landslides triggered by the 2016 Kumamoto earthquake in Mt. Aso volcano, Japan, Bulletin of Engineering Geology and the Environment, 78, https://doi.org/10.1007/s10064-017-1097-1, 2019. a
Suga, Y. and Konishi, T.: Landslide detection using very high-resolution satellite imageries, in: Proc. SPIE, SPIE, Vol. 8524, 852428, https://doi.org/10.1117/12.976033, 2012. a
Tang, X., Liu, M., Zhong, H., Ju, Y., Li, W., and Xu, Q.: MILL: Channel attention-based deep multiple instance learning for landslide recognition, ACM Trans. Multimedia Comput. Commun. Appl., 17, https://doi.org/10.1145/3454009, 2021. a, b
Tanyaş, H., van Westen, C. J., Allstadt, K. E., Jessee, M. A. N., Görüm, T., Jibson, R. W., Godt, J. W., Sato, H. P., Schmitt, R. G., Marc, O., and Hovius, N.: Presentation and analysis of a worldwide database of earthquake‐induced landslide inventories, J. Geophys. Res. Earth Surf., 122, 1991–2015, https://doi.org/10.1002/2017JF004236, 2017. a
Tanyaş, H., Görüm, T., Fadel, I., Yıldırım, C., and Lombardo, L.: An open dataset for landslides triggered by the 2016 Mw 7.8 Kaikōura earthquake, New Zealand, Landslides, 19, 1405–1420, https://doi.org/10.1007/s10346-022-01869-9, 2022a. a
Tanyaş, H., Hill, K., Mahoney, L., Fadel, I., and Lombardo, L.: The world’s second-largest, recorded landslide event: Lessons learnt from the landslides triggered during and after the 2018 Mw 7.5 Papua New Guinea earthquake, Eng. Geol., 297, 106504, https://doi.org/10.1016/j.enggeo.2021.106504, 2022b. a
Uemoto, J., Moriyama, T., Nadai, A., Kojima, S., and Umehara, T.: Landslide detection based on height and amplitude differences using pre- and post-event airborne X-band SAR data, Natural Hazards, 95, 485–503, https://doi.org/10.1007/s11069-018-3492-8, 2019. a
Vollrath, A., Mullissa, A., and Reiche, J.: Angular-based radiometric slope correction for Sentinel-1 on Google Earth Engine, Remote Sens., 12, 1867, https://doi.org/10.3390/rs12111867, 2020. a
Wang, F., Fan, X., Yunus, A. P., Subramanian, S. S., Alonso-Rodriguez, A., Dai, L., Xu, Q., and Huang, R.: Coseismic landslides triggered by the 2018 Hokkaido, Japan (Mw 6.6), earthquake: Spatial distribution, controlling factors, and possible failure mechanism, Landslides, 16, https://doi.org/10.1007/s10346-019-01187-7, 2019. a, b
Williams, J. G., Rosser, N. J., Kincey, M. E., Benjamin, J., Oven, K. J., Densmore, A. L., Milledge, D. G., Robinson, T. R., Jordan, C. A., and Dijkstra, T. A.: Satellite-based emergency mapping using optical imagery: experience and reflections from the 2015 Nepal earthquakes, Nat. Hazards Earth Syst. Sci., 18, 185–205, https://doi.org/10.5194/nhess-18-185-2018, 2018. a, b, c, d
Wilson, A. M. and Jetz, W.: Remotely sensed high-resolution global cloud dynamics for predicting ecosystem and biodiversity distributions, PLoS Biol., 14, https://doi.org/10.1371/journal.pbio.1002415, 2016. a
Xu, S., Dimasaka, J., Wald, D. J., and et al.: Seismic multi-hazard and impact estimation via causal inference from satellite imagery, Nature Communications, 13, 7793, https://doi.org/10.1038/s41467-022-35418-8, 2022. a
Xu, Y., Ouyang, C., Xu, Q., Wang, D., Zhao, B., and Luo, Y.: CAS Landslide Dataset: A large-scale and multisensor dataset for deep learning-based landslide detection, Sci. Data, 11, 12, https://doi.org/10.1038/s41597-023-02847-z, 2024. a, b, c
Yang, Y., Rogers, B. M., Fiske, G., Watts, J., Potter, S., Windholz, T., Mullen, T., Nitze, I., and Natali, S. M.: Mapping retrogressive thaw slumps using deep neural networks, Remote Sens. Environ., 288, 113495, https://doi.org/10.1016/j.rse.2023.113495, 2023. a
Zhang, Z., Wang, H., Xu, F., and Jin, Y.-Q.: Complex-valued convolutional neural network and its application in polarimetric SAR image classification, IEEE Trans. Geosci. Remote Sens., 55, 7177–7188, https://doi.org/10.1109/TGRS.2017.2743222, 2017. a
Zhou, G., Liu, W., Zhu, Q., Lu, Y., and Liu, Y.: ECA-MobileNetV3(Large)+SegNet model for binary sugarcane classification of remotely sensed images, IEEE Trans. Geosci. Remote Sens., 60, 1–15, https://doi.org/10.1109/TGRS.2022.3215802, 2022. a