the Creative Commons Attribution 4.0 License.
the Creative Commons Attribution 4.0 License.
 | 03 Feb 2026
Simulating the recent drought-induced mortality of European beech (Fagus sylvatica L.) and Norway spruce (Picea abies L.) in German forests
Gina Marano
Ulrike Hiltner
Nikolai Knapp
Harald Bugmann
Drought is increasingly recognized as a critical driver of forest dynamics, altering tree species' growth, dominance and survival. To better understand these dynamics, we used a process-based modeling approach to investigate drought-related mortality of European beech (Fagus sylvatica L.) and Norway spruce (Picea abies L.) in German forests. The predisposing-inciting (PI) framework for drought-induced tree mortality incorporated in ForClim v4.1 was combined with a bark beetle module for Norway spruce to account for a key contributing factor, leading to ForClim v4.2.
Our study addressed three hypotheses: (1) the PI framework, initially developed for Swiss beech forests, is effective across the broad ecological and climatic gradients found in Germany; (2) Soil properties, i.e. soil water holding capacity (AWC) and its spatial heterogeneity, have a strong influence on drought-related mortality by amplifying mortality risk through limited microsite variability, or dampening it by providing moist refugia, thus complementing climatic drivers; (3) incorporating bark beetle damage ameliorates model performance for simulating drought-related mortality of Norway spruce. Our modelling approach deliberately forgoes calibration to better investigate the underlying mechanisms and drivers of drought-induced tree mortality.
We conducted simulations across 149 plots of the ICP Forest Level I network in Germany, covering a wide gradient of climate and soil conditions. ForClim reproduced the general patterns of drought-related mortality, highlighting the ability of the PI framework to capture emergent mortality patterns across a range of environmental conditions. However, mismatches in magnitude and trends highlight areas for improvement. Discrepancies were attributed to sparse mortality data, the drought sensitivity of the bark beetle submodule, and the absence of regional calibration. Our results revealed the critical role of AWC and local soil heterogeneity in modulating drought responses. Sites with low AWC experienced significantly higher mortality rates, while high AWC provided a buffering effect, bringing simulated outcomes closer to observed data. Furthermore, soil heterogeneity played a mitigating role, with sites exhibiting uniform soils showing higher mortality risk, thus emphasizing the importance of the spatial variability of soil properties for dampening drought impacts. Lastly, the new bark beetle submodel, even though highly simplified, considerably improved the simulation of drought-related mortality patterns in Norway spruce-dominated sites.
This study underscores the value of process-based models like ForClim for disentangling the mechanisms underlying forest vulnerability and drought-induced mortality. However, improvements such as finer-resolution mortality and crown condition data, as well as regional model calibration, would be useful to enhance its predictive accuracy. Our findings contribute to the better understanding, forecasting and managing of forest resistance under current and future climatic conditions.
- Article
(2378 KB) - Full-text XML
-
Supplement
(3923 KB) - BibTeX
- EndNote


In recent decades, the frequency and intensity of drought extremes increased markedly, becoming a defining feature of the global climate regime (Caretta et al., 2022). Intensified drought events pose considerable threats to forest ecosystems worldwide, disrupting forest dynamics and altering species dominance (Cavin et al., 2013; Fensham et al., 2015). European beech (Fagus sylvatica L.) and Norway spruce (Picea abies L.) historically were cornerstone species in European forestry due to their economic and ecological value (FOREST EUROPE and FAO, 2020). However, the recent prolonged and intense droughts exposed unprecedent vulnerabilities in these species (Bonannella et al., 2024; Kasper et al., 2022; Schuldt et al., 2020). Scientists, forest managers and nature conservationists in these areas are debating the future viability of both species, emphasizing the need for adaptive management strategies that consider species-specific responses to drought (Bottero et al., 2021; Meyer et al., 2022; Vitali et al., 2017). This is particularly evident in lowland regions such as Germany, where drought has been a major cause of decline in recent years (Langer and Bußkamp, 2023; Spiecker and Kahle, 2023; Thonfeld et al., 2022).
In this context, it is of paramount importance to understand the conditions that led to the observed decline and mortality patterns, so as to ultimately be able to predict the behavior of these tree species under further anthropogenic climate change. To this end, systematic surveys like the International Co-operative Programme on Assessment and Monitoring of Air Pollution Effects on Forests (ICP Forests) provide valuable data over large areas (Gazol and Camarero, 2022; George et al., 2022). They include crown defoliation assessments, which have shown promise in detecting early signs of stress that is predisposing trees to die (Hunziker et al., 2022). Monitoring data such as those from ICP Forests were used to statistically model tree mortality probability (Anders et al., 2025; Camarero, 2021; Knapp et al., 2024). While valuable for assessing and mapping forest health and detecting early signs of stress, such statistical models offer limited insight into the underlying processes driving observed mortality patterns, are difficult to extrapolate to future conditions, and, being closely tied to underlying empirical data, often lack transferability across regions and tree species.
Process-based dynamic vegetation models (DVMs) provide a complementary approach by simulating tree mortality on a more mechanistic basis, incorporating complex interactions between climate, soil, and tree physiology (Bugmann et al., 2019). However, DVMs continue to struggle with accurately reproducing observed patterns of forest response to drought, particularly due to an incomplete understanding of the ecophysiological processes underlying tree mortality (Fischer et al., 2025; Kolus et al., 2019; Trugman, 2022), but also uncertainties associated with soil properties (Camarero, 2021; Kolus et al., 2019; Trugman et al., 2021). Uncertainties in our understanding of soil properties and their role in mediating drought responses make it challenging to accurately assess how soil moisture deficits shape the long-term drought response, either buffering or amplifying atmospheric drought signals (Koster et al., 2009; Trugman et al., 2018; Ukkola et al., 2016).
Recent research has suggested a path forward by integrating predisposing and inciting mortality factors in DVMs (hereafter PI scheme). The PI scheme integrated in the ForClim model v4.1 (Marano et al., 2025) features a “drought memory” term as a predisposing factor, reflecting the species-specific effects of prolonged drought. Additionally, it includes inciting factors such as drought duration and seasonal soil moisture deficits, which may hinder bud break in spring, cell division and expansion in summer, and carbon reserve buildup in fall for the following year. The approach highlights how consecutive dry years and soil moisture deficits can amplify mortality risk, even though processes such as hydraulic failure and carbon starvation are not modelled explicitly (Liu et al., 2021; Marano et al., 2025; Yao et al., 2022). Marano et al. (2025) found that ForClim v4.1 was able to simulate the recent drought-induced tree mortality at six mesic beech sites in Switzerland as well as at a xeric Scots pine site in the continental Alps while providing a realistic depiction of potential natural vegetation from the cold to the dry treeline in Europe. That same model was also found to be able to realistically simulate the recent massive wave of Norway spruce mortality at one site in the Harz mountains in Germany (Fischer et al., 2025).
Yet, the generality of the new formulation for drought-induced mortality remains unknown because the ability of ForClim v4.1 to simulate the recent observed mortality patterns over heterogeneous regions rather than at individual sites remains untested. Furthermore, the model does not currently account for key contributing factors such as bark beetle infestations, which are known to play a pivotal role in driving mortality under drought (Hlásny et al., 2021; Netherer et al., 2019). Several studies highlighted that biotic stressors often interact with abiotic factors, amplifying tree vulnerability and mortality rates, especially in regions prone to prolonged droughts, for instance in the Swiss Alps (Bigler et al., 2006; Dobbertin et al., 2005; Rigling and Cherubini, 1999). Incorporating these contributing factors in the PI scheme, hence, to be named PIC scheme, would not only enhance its predictive accuracy but also improve our understanding of the complex dynamics governing drought-related tree mortality, and our predictive ability under changing climatic conditions.
In this study, we aimed to evaluate the generality of the PI scheme of Marano et al. (2025) beyond the site-specific tests reviewed above and developed it further into a PIC framework. We focused on European beech and Norway spruce due to the prevailing uncertainty regarding their response to future climatic extremes. Taking into account that soil properties may play a major role for modulating drought-induced mortality, we decided to address the following research questions:
-
Can the PI scheme predict drought-induced mortality across diverse environmental conditions?
-
How strongly is soil water holding capacity and its small-scale spatial heterogeneity modulating drought-induced tree mortality of European beech and Norway spruce, in addition to the effects of climate variability?
-
Does the integration of a simple model for bark beetle activity (PIC scheme) enhance the predictive ability of the forest model in the context of Norway spruce mortality?
2.1 Site selection and mortality observations
The ICP Forest Level I plots, in Germany also known as crown condition survey (“Waldzustandserhebung”, hereafter WZE), constitute a large network in which tree vitality and mortality are observed annually for 24 dominant trees per plot, attributing causes to the mortality events as far as possible (Fig. 1b). Overall, the WZE contains about 410 plots on a regular 16 km × 16 km grid across Germany (Wellbrock et al., 2018). On each plot, crown defoliation is being evaluated for the same sample trees year after year. Since 1998, the likely reasons are recorded for trees that have died. Only natural causes that kill trees and leave them standing are considered, i.e., harvested trees and windthrows are excluded. A tree is labelled as dying when it has been alive in the previous year and is either standing dead with fine twigs still present but 100 % defoliation (tree status 0 or 9 according to Wellbrock et al., 2018) or leaving the WZE sample collective as a dead tree with a natural cause of death, including salvage logging (tree status 12, 32, 33, 34, 42 or plot status 12).
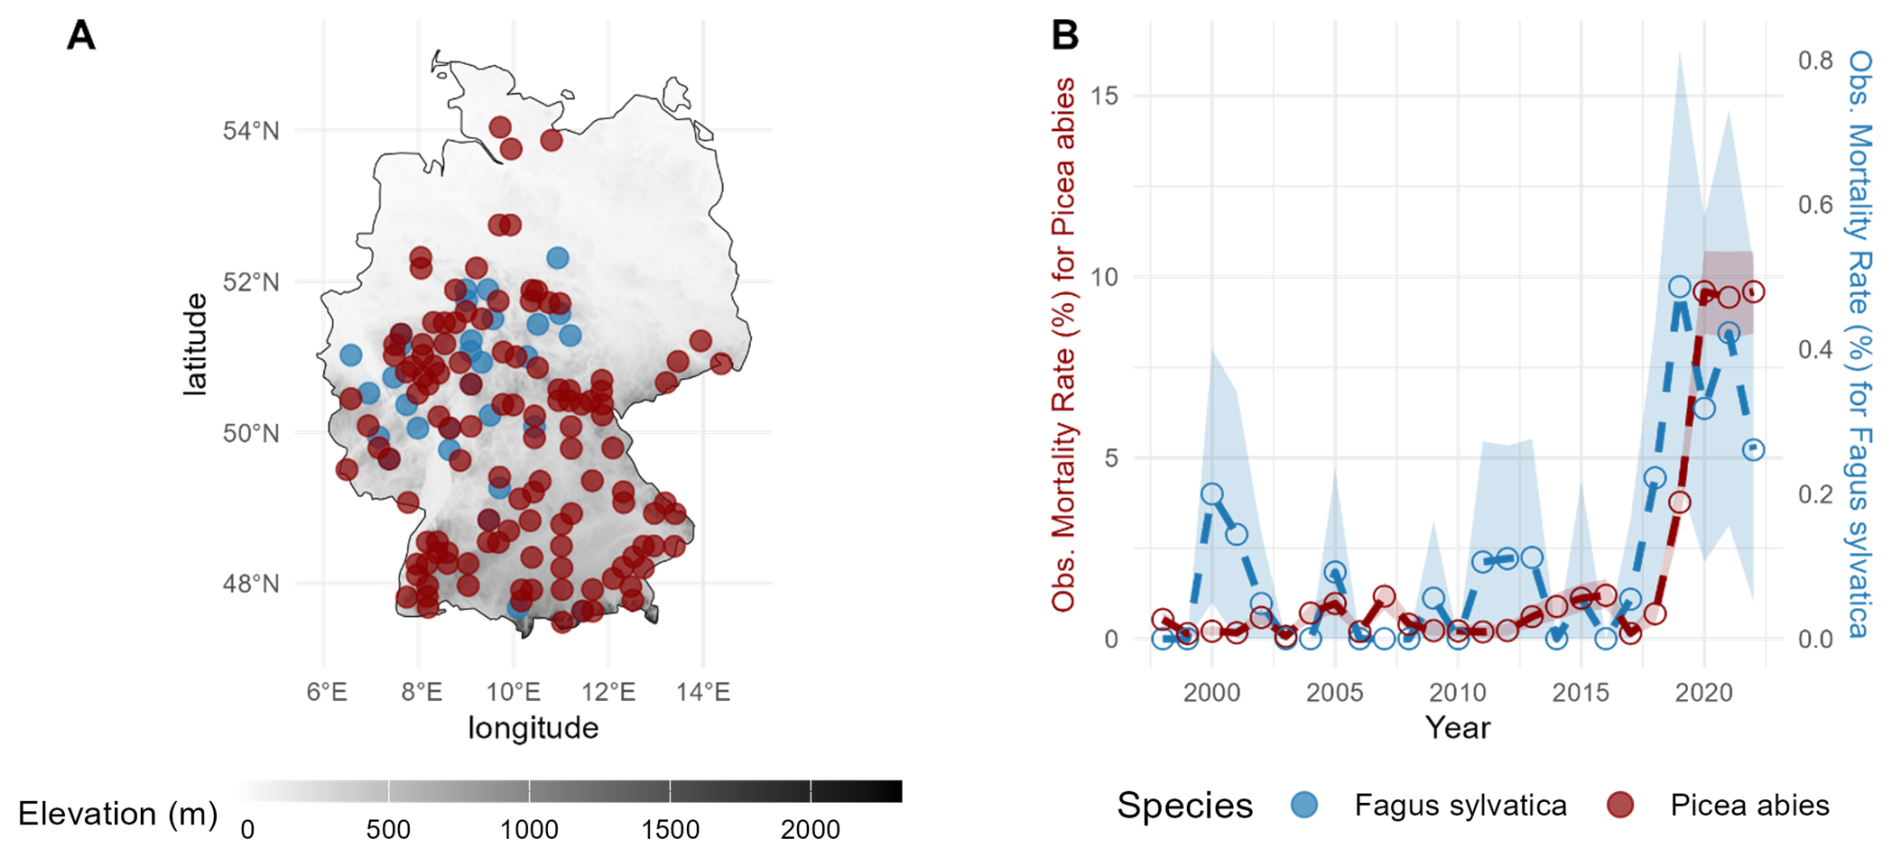
Figure 1Location of the ICP Forest Level I plots for the present study (a) and the respective observed annual mortality rates (b) for European beech (blue) and Norway spruce (dark red) averaged across sites from Knapp et al. (2024). The shaded blue and red areas represent ±1 standard deviation derived via a bootstrap procedure to show the variability in the observed data.
We selected all sites of the ICP Forest Level I plot network in Germany (Fig. 1a) where progressive crown decline (i.e. crown defoliation) associated with drought-related stress of the respective species (European beech and Norway spruce) was observed. This choice is in line with the observed mortality rates estimated by Knapp et al. (2024). It amounted in total to 30 plots dominated by beech and 119 plots dominated by spruce. In each plot, we used only those trees that had been classified as having died due to drought-related factors and processes (both biotic and abiotic). The spatial distribution of the selected plots follows the data availability and filtering criteria defined in Knapp et al. (2024), which focused on sites with confirmed drought-induced mortality. The apparent absence of plots in northeastern Germany reflects the lack of reported mortality for either species in that region during the observation period, rather than an intentional exclusion.
The overall number of drought-related dead trees in the WZE from 1998–2022 was merely 51 for Fagus sylvatica, but for Picea abies it was 1110 (cf. Figs. S6 and S7), whereas 47 621 and 82 551 living trees were monitored repeatedly, respectively (Knapp et al., 2024). This imbalance in the observed mortality data, particularly for beech, may limit the representativeness of the dataset and its ability to capture the full range of drought-induced mortality events. To address this limitation, our study employed a combination of soil water availability scenarios to evaluate the potential influence of soil moisture and its spatial heterogeneity on drought-induced mortality.
2.2 ForClim model
2.2.1 Brief overview
ForClim is a forest gap model that was originally designed to capture the dynamics of temperate mountain forests in Central Europe and account for climate change (Bugmann, 1994; Bugmann 1996). It allows for both short- and long-term estimations of forest dynamics that are simulated on small areas (“patches”), normally with a size of (ca. 800 m2), each representing one out of many stochastic realizations of tree population dynamics that are spatially independent from each other. The simulation results from many patches (typically 200) that are averaged to obtain forest dynamics at the stand scale.
ForClim is based on a minimum number of ecological assumptions to capture the influence of climate on ecological processes, i.e. establishment, growth, competition, and mortality of trees, in the context of forest dynamics. Environmental constraints, particularly temperature and soil water availability, influence tree-level performance, thereby regulating growth and increasing the risk of mortality. Each species is defined by a suite of functional traits including shade tolerance, frost resistance, and drought resistance, among others, which determine how it responds to environmental conditions. Model outputs are calculated annually for each tree, enabling both fine-grained analyses at the individual level and assessments of species composition and stand dynamics.
We employed ForClim v4.1 (Marano et al., 2025) which builds upon ForClim v4.0.1 (Huber et al., 2020). While it keeps a modular approach, it presents distinct features. First, v4.1 uses time series of monthly weather data (precipitation sum, mean temperature) to derive bioclimatic variables in the weather submodel, rather than employing a random weather generator operating at the patch scale, as done in previous model versions. ForClim's water submodel builds on the Thornthwaite and Mather soil water balance (Bugmann and Cramer, 1998), following a mono-layer bucket model approach, i.e. a single soil layer is conceptualized as receiving and storing all incident water until its capacity is reached. Bucket models use the concept of “bucket size” (kBS), representing the maximum plant-available water in the soil, thus corresponding to the available water capacity (AWC).
To account for the fine-grained spatial heterogeneity of soil properties in forests, in ForClim v4.1 distinct soil water properties (AWC) are assigned to each forest patch. A lognormal probability distribution is used to represent the patch-level variability in AWC, reflecting the skewed and stochastic nature of these properties. This distribution is parameterized using the mean and minimum values of the parameter kBS (AWC), which determine the standard deviation (σ, Eq. 1) and mean (μ, Eq. 2) of the lognormal distribution (for details cf. Marano et al., 2025).
This heterogeneity among patches is particularly relevant for assessing the impacts of drought extremes on the soil water balance in forest ecosystems. Specifically, heterogeneous soils may provide microsites with high levels of water retention, acting as potential drought refugia for plants (Gazol et al., 2018; Kirchen et al., 2017; Ripullone et al., 2020). Moreover, because σ quantifies the spread in the lognormal distribution of AWC, it serves as a direct indicator of the degree of spatial heterogeneity of water availability within a forest stand (cf. Sect. 2.2.3).
Following Manion's (1981) Decline-Disease Theory, in the plant submodel of ForClim v4.1 predisposing and inciting factors are distinguished that contribute to tree mortality, as derived and explained in detail by Marano et al. (2025). Overall, the probability of stress-induced mortality in ForClim v4.1 emerges from three key elements: (i) a general carbon memory component, reflecting tree vulnerability arising from persistent sub-optimal growth; (ii) drought-related predisposing factors, represented by a drought memory that is related to the species-specific drought tolerance; and (iii) inciting factors, arising from cumulative drought stress (via the seasonal ratio of supply and demand for soil water, which is closely related to Vapor Pressure Deficit) in combination with soil moisture shortage in spring and fall.
This framework acknowledges that a series of dry years can increase mortality risk under prolonged summer and early- or late-season soil moisture deficits, conditions that are closely related to carbon starvation (long-term effect) and the onset of hydraulic failure (short-term effect), although neither of these physiological processes is modeled explicitly. In ForClim v4.1, the predisposing and inciting factors sensu Manion (1981) give rise to a constant stress-induced mortality probability (cf. Marano et al., 2025). However, contributing factors such as biotic agents (e.g., insect outbreaks, fungal pathogens) are not accounted for in ForClim v4.1.
2.2.2 A simple spruce bark beetle submodel
An empirically based formulation for estimating bark beetle (mainly Ips typographus L.) disturbance probability for Norway spruce was derived to add contributing factors (C) to the PI scheme of ForClim v4.1 (Marano et al., 2025; Manion, 1981). This was necessary since drought-related spruce mortality is often amplified by bark beetle outbreaks. The simple bark beetle submodel consists of a base probability for a beetle outbreak, which is composed of (1) a base annual probability, (2) a flag for a potential year of infestation, and (3) an inciting drought stress term, as explained below.
Base annual probability
The annual base probability for a bark beetle outbreak (Pbark) was derived from the theoretical probability of bark beetle disturbance in spruce-dominated forests (Hlásny et al., 2021, their Fig. 4). We adapted the disturbance map from Hlasny et al. (2021) to obtain a base probability of bark beetle outbreaks for Germany under the climate of 1979–1990 (cf. Hlasny et al., 2021, their Fig. 4 and Appendix 2). We converted the original six qualitative classes for the outbreak probability (i.e., No Spruce, Very Low, Low, Medium, High, and Very High) into quantitative values from 0 %–100 %. Our classification was designed to ensure that the lower outbreak probability classes (i.e., Very Low and Low) had smaller ranges, while the higher outbreak probability classes (i.e., Medium, High, and Very High) reflected increasing values with smooth transitions (Table S3). Our heuristic approach combined fixed percentages for the lower classes and an exponential progression for the higher classes, as explained in Sect. S2.3. To obtain the base probability of bark beetle outbreaks (Pbark) for the area of Germany, we averaged all pixel values in Hlasny et al. (2021), resulting in a value of Pbark=20 %.
Potential year of infestation
To identify a potential year of infestation, we assessed the estimated number of bark beetle generations within that year (gGen) against the drought-induced stress experienced by the tree which is based on the intensity of drought within that year. The number of bark beetle generations (Eq. 3) per year are calculated as a function of the annual degree-day sum (mDDAn) based on the relationships from Jakoby et al. (2019).
Inciting factor for drought stress
To account for the fact that drought stress weakens spruce trees, we considered a drought-related sensitivity threshold (“drought tolerance”, kBeetleDrTol) based on the species-specific drought tolerance parameter (Bugmann and Cramer, 1998) scaled by the factor kDrSc (), in order to allow moderate drought events to have a noticeable effect on spruce vigor (Eq. 4).
The overall probability of tree mortality induced by bark beetles (PDist; Eq. 5) was then determined by the interplay of biotic factors (i.e., the number of bark beetle generations gGen) and environmental stressors (i.e., annual drought stress; mDrAn) that identify a potential year of bark beetle infestation, and finally the predisposing factor of the drought memory (uDrM) (for details, see Marano et al., 2025):
The threshold of gGen=1.5 corresponds to the univoltine–bivoltine transition observed at around 1000 m above sea level in Switzerland, where the mean number of generations of Ips typographus is ∼1.5, i.e. “in about 50 % of all years two, otherwise one generation” (Jakoby et al., 2019, their Fig. 3b). Thus, gGen>1.5 operationally identifies years or sites whose thermal regime consistently favors bivoltinism as this is the biologically important tipping point for mass-attack risk in our PIC framework. This new bark beetle model led to ForClim v.4.2, which incorporates predisposing, inciting as well as contributing mortality factors sensu Manion (1981) (PIC scheme).
2.2.3 Simulation rationale and settings
In this simulation study, no model calibration was performed, as we aimed to assess the model's ability to identify the drivers (PIC and PIC factors) shaping the system response, rather than to fine-tune parameters to best match observational data. Our approach ensures that the results reflect intrinsic model behaviour rather than adjustments made to improve fit, aligning with previous studies that recommend to integrate process-based mechanisms in DVMs rather than empirical calibration (McDowell et al., 2011; Meir et al., 2015).
To initialize the ForClim model, stand-level information for the ICP Forest Level I plots was required (Figs. S6 and S7), but each plot provides just observations for 24 dominant trees with no specified plot size or scaling to the hectare. Therefore, we derived an approximate stand-level inventory for the year 2000 defined as the equilibrium between current climate, soil properties, and forest vegetation. To do so, we ran single-species simulations from bare ground for 2000 years. We applied this procedure for each of the selected ICP Forest Level I plots, using 200 patches with a size of 800 m2 to account for stochasticity. Across all plots, nitrogen availability (kAvN) was set to non-limiting 180 , and we assumed flat terrain (kSlAsp=0). For each plot, we retrieved interpolated climate data from the German Weather Service (DWD) at 1 km resolution (Kaspar et al., 2019). Precipitation ranges from 549–2063 mm for the European beech plots and from 655–2182 mm for the Norway spruce plots (cf. Figs. S1 and S2 in the Supplement). Annual mean temperature of the plots ranges from 5.3–10.5 °C for both species. All climate data refers to the period 1950–2023.
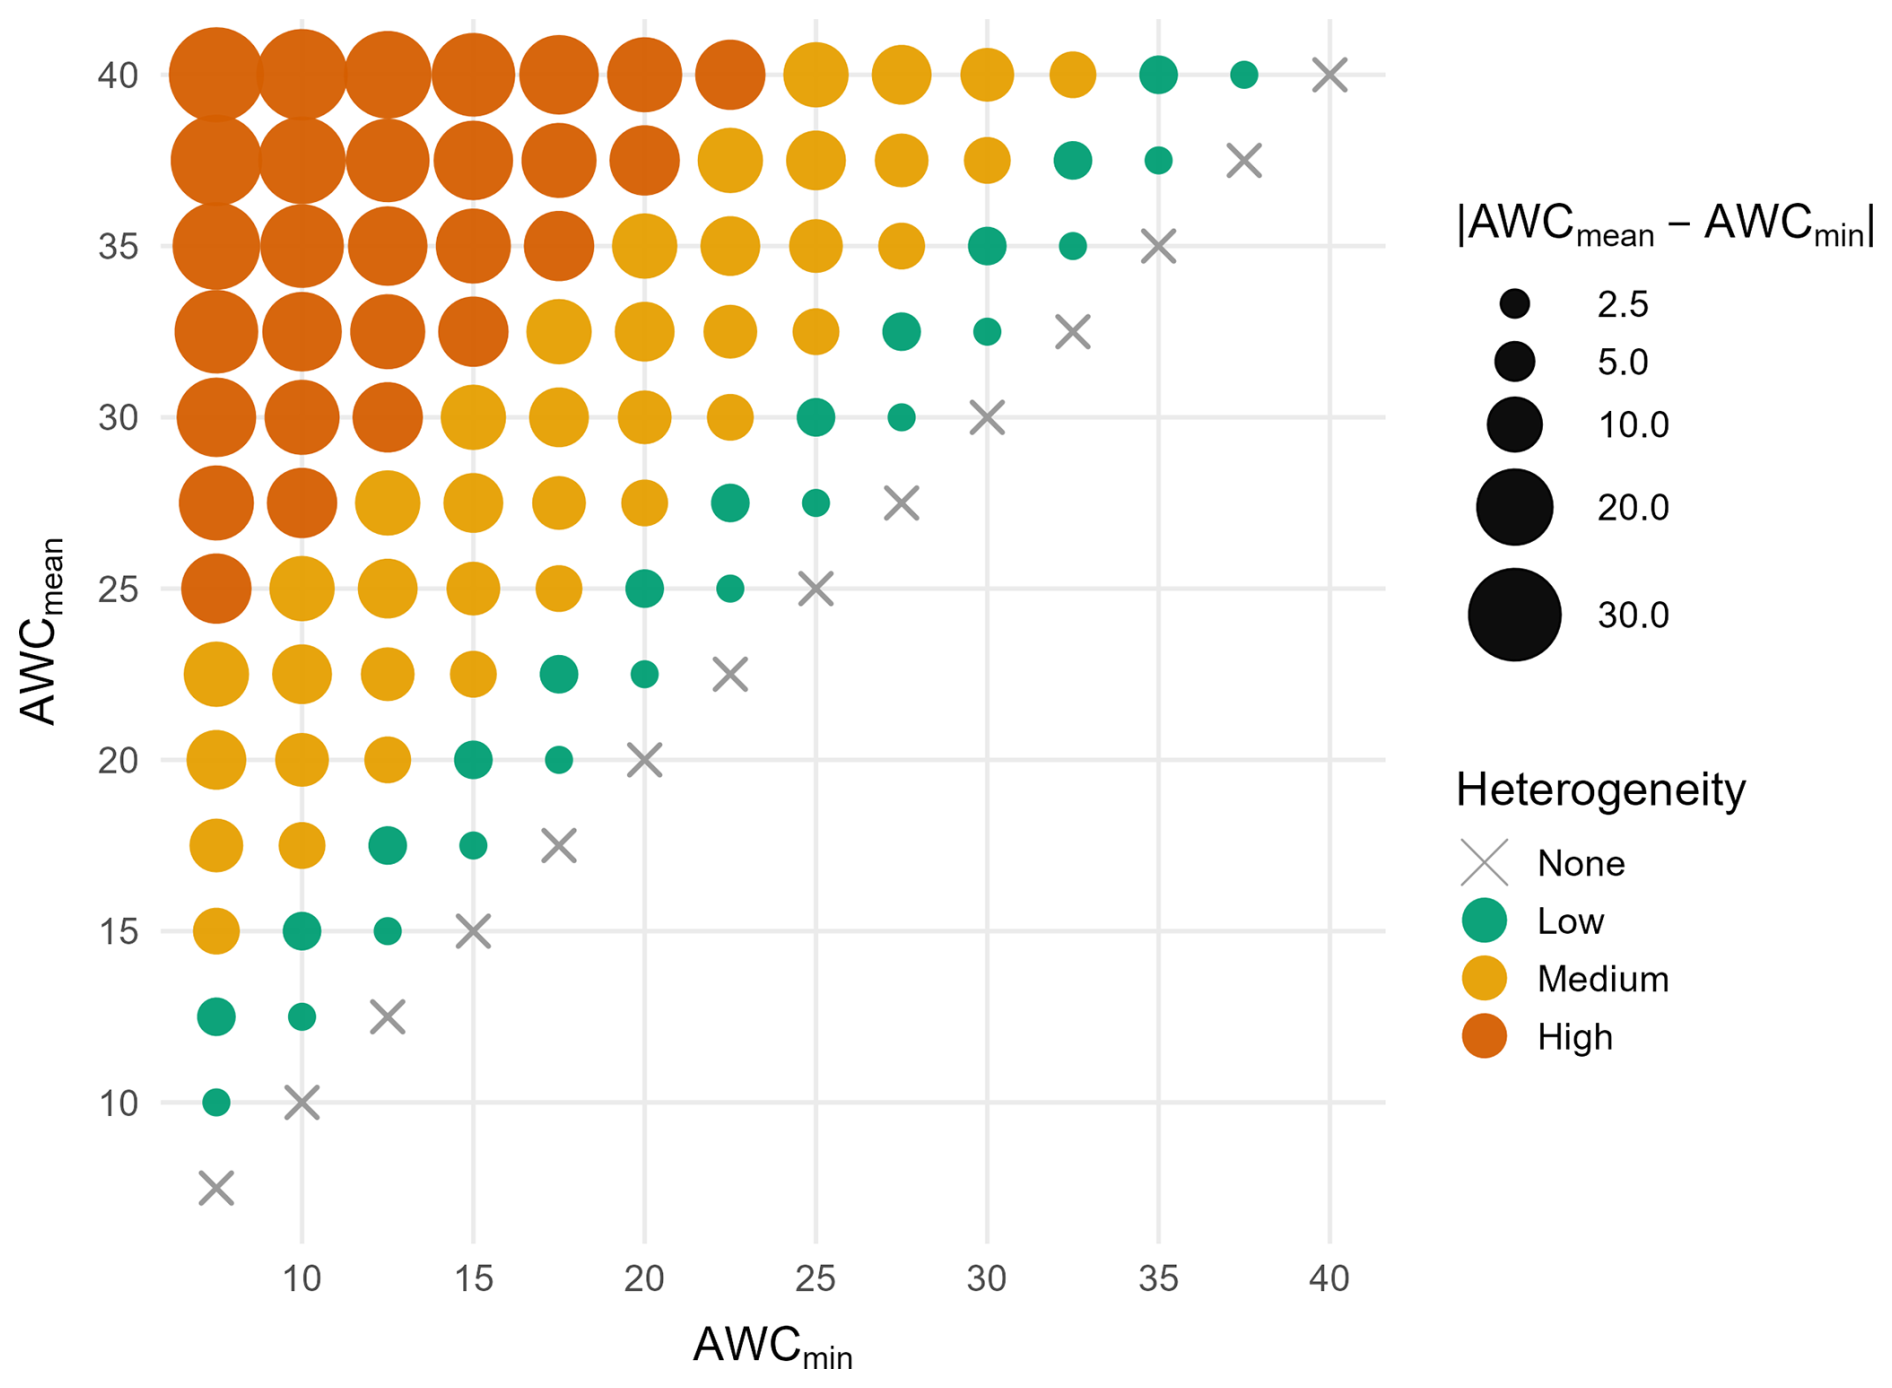
Figure 2Soil scenarios are defined as combinations of minimum and mean AWC. Distinct colors indicate soil heterogeneity classes, ranging from no heterogeneity (AWCmin=AWCmean, None), across low and medium to high heterogeneity classes.
We attempted to estimate the minimum and mean values of soil AWC down to rooting depth from maps of the Bundesanstalt für Geowissenschaften und Rohstoffe (BGR) at 500 m spatial resolution (Meinel, 2015, cf. Fig. S3). Yet, the resulting soil properties were deemed questionable, as they posit that, for example, European beech thrives on soils with an AWC<50 mm (cf. Fig. S4), which is ecologically implausible (Kirchen et al., 2017; Pichler et al., 2009; Walthert et al., 2021). Thus, we decided to evaluate the likely site-specific AWC and its spatial heterogeneity through sensitivity analysis by defining a range of scenarios. This approach enabled a systematic examination of how variations in soil water availability and its spatial heterogeneity influence drought-induced mortality, while recognizing that the simulations represent an exploration of plausible conditions rather than actual heterogeneity. We set the ranges of the minimum and mean values of AWC based on the BGR maps (Fig. S3) but considered additional, ecologically relevant values to cover a wider range of potential soil conditions. The resulting scenarios spanned AWCmean values from 7.5–40 cm, covering the range found in the BGR maps and including more extreme values to assess the sensitivity of the model to soil water availability. The absolute difference between AWCmin and AWCmean represents a gradient of plot-level soil heterogeneity classes which we assigned to four distinct groups (Fig. 2). To quantitatively constrain the soil heterogeneity classes, we also calculated the corresponding sigma (σ) of the lognormal distribution for each soil moisture scenario (cf. Table S1 in the Supplement). A total of 105 AWC scenarios were tested to evaluate two hypotheses: (a) under conditions of low precipitation, a low mean available water capacity (AWCmean) induces high mortality rates for European beech and Norway spruce, indicating that in Germany these species predominantly thrive on more favorable soils, and (b) local spatial heterogeneity in soil water availability, represented by the plot-level difference between AWCmean and AWCmin, influences tree survival by (i) exacerbating drought-induced mortality when AWCmean is low and spatial heterogeneity is also low, or (ii) providing moist refugia in highly heterogeneous soils. This approach allows for a more realistic exploration of ecologically sound AWC values, yet their patterns are still based upon mapped products.
For each ICP Forest Level I plot, the ForClim model was initialized with the simulated equilibrium (the state of the forest structure – i.e., species, DBH and height of all trees – in the simulation year 2000), and simulations were run from 2000 until 2022. Notably, this period captures the strong droughts of 2003 and 2015, which did not induce widespread mortality, whereas the drought of 2018ff. led to a large mortality wave. A total of 31 890 simulation scenarios (states × sites × soil scenarios × species) were run on the Euler High Performance Computing Cluster of ETH Zürich. These simulation results were filtered for trees with DBH≥40 cm so as to better match the simulation results with the observations, which only include “dominant” trees. Yet, the simulation results contain all causes of growth-related mortality and thus are likely to overestimate the observed data. Therefore, we subtracted the simulated “background mortality” rates (which are independent of growth patterns in the model) from the simulated values. They correspond to an annual mortality rate of 0.921 % and 0.495 % for European beech and Norway spruce, respectively (Forest Ecology, ETH Zürich, 2019). Notably, in contrast to the observational data, which focus on drought-related mortality, the simulated mortality rates still contain mortality events that are due to other stressors (e.g., light availability), and thus simulated mortality rates are likely to remain higher than the observed ones.
2.3 Statistical analyses
The observed mortality rate (Mobs) from the ICP Forest Level I data was calculated by dividing the number of dead trees by the number of living trees from the previous year (normally, n=24 for each year at each plot), as done by Knapp et al. (2024). The results were averaged across all plots for each species. Similarly, the simulated mortality rate (Msim) of the large trees (DBH>40 cm) was averaged across all simulated sites (each consisting of 200 patches) for each species.
The performance of the ForClim model for each AWC scenario was evaluated by employing the mean absolute error (MAE), the root mean squared error (RMSE) and the coefficient of determination (adjusted R2, Eqs. 6–8).
To evaluate the relationship between Mobs and Msim, a linear regression was used (Eq. 9).
The (Eq. 8) was calculated to evaluate the explanatory power of the simulations based on the total number of observations in the dataset (n) and the number of predictors included in the linear model (p), including the intercept. In this context, p refers to the Msim derived from the scenario being evaluated. was selected as the primary ranking metric because it balances model fit with complexity, helping to identify the two best simulation scenarios among the 105 scenarios that explain a high proportion of variance. Furthermore, MAE and RMSE (Eqs. 7–8) were used to assess the magnitude of prediction errors. MAE provides a measure of the average magnitude of errors, while RMSE emphasizes larger errors. In MAE and RMSE, and represent the simulated value of tree mortality rates from the scenarios being evaluated and the observed values of the tree mortality rates, respectively. MAE was selected as the secondary ranking metric for the selection of the two top-ranked simulation scenarios. Ultimately, to assess how spatial heterogeneity influences model performance, we fitted a generalized additive model (GAM) relating Adjusted R2 to the degree of local soil heterogeneity (σ); this choice was supported by the quasi-normal distribution of the residuals in standard diagnostics plots.
For Norway spruce, we additionally quantified how sensitive the simulated mortality is to two parameters of the PIC-scheme that lack a good empirical basis but potentially have a large impact on the simulation results: (i) kDrSc and (ii) Pbark. This analysis focused on the two best scenarios. Around the best configuration (“baseline”, Δ=0 %), we applied symmetric perturbations of ±10 % and ±20 % to one parameter at a time while keeping the other fixed. This yielded four sensitivity runs per factor and scenario. For each (scenario, factor) combination, we computed a central-difference slope, representing the change in fit per 1 % parameter change (δ par), using the ± pairs (Eq. 10), and analogously for the adjusted R2. We averaged the 10 % and 20 % slopes to stabilize estimates and reported 95 % bootstrap confidence intervals by resampling years within each scenario.
Lastly, to account for the main causes of mortality within the PIC scheme for European beech and Norway spruce, we computed for each year and AWC scenario, among the dominant dead trees (i.e. DBH>40 cm), the fraction of trees flagged for slow growth, drought memory, and inciting drought. Fractions were calculated per run and averaged across runs to a stand-level mean (bounded 0 %–100 %).
All analyses were performed in R (v4.2, R Core Team, 2023) using the packages data.table, tidyverse, mcg and rforclim (Barrett et al., 2026; Marano and Bugmann, 2025; Wickham et al., 2019).
3.1 European beech
The relationship between soil water properties, simulated mortality, and observed mortality for Fagus sylvatica revealed clear patterns in model performance across the gradients of mean and minimum AWC (Fig. 3a). In the lower-left region of the matrix – characterized by low mean and minimum AWC – there was poor agreement between simulated and observed mortality rates. Under these conditions, poor soil conditions accelerated the onset of drought stress (cf. Fig. S8), leading to abrupt and severe mortality events that do not align with observations. Overall, such scenarios resulted in early and intense mortality signals prior to the year 2010 (cf. Figs. S8 and S9a). The high MAE under low AWCmin (e.g., 7.5–10 cm) underscored the model's overestimation of mortality (cf. Table S4, e.g. scenarios 1–14), despite correctly identifying heightened vulnerability to drought.
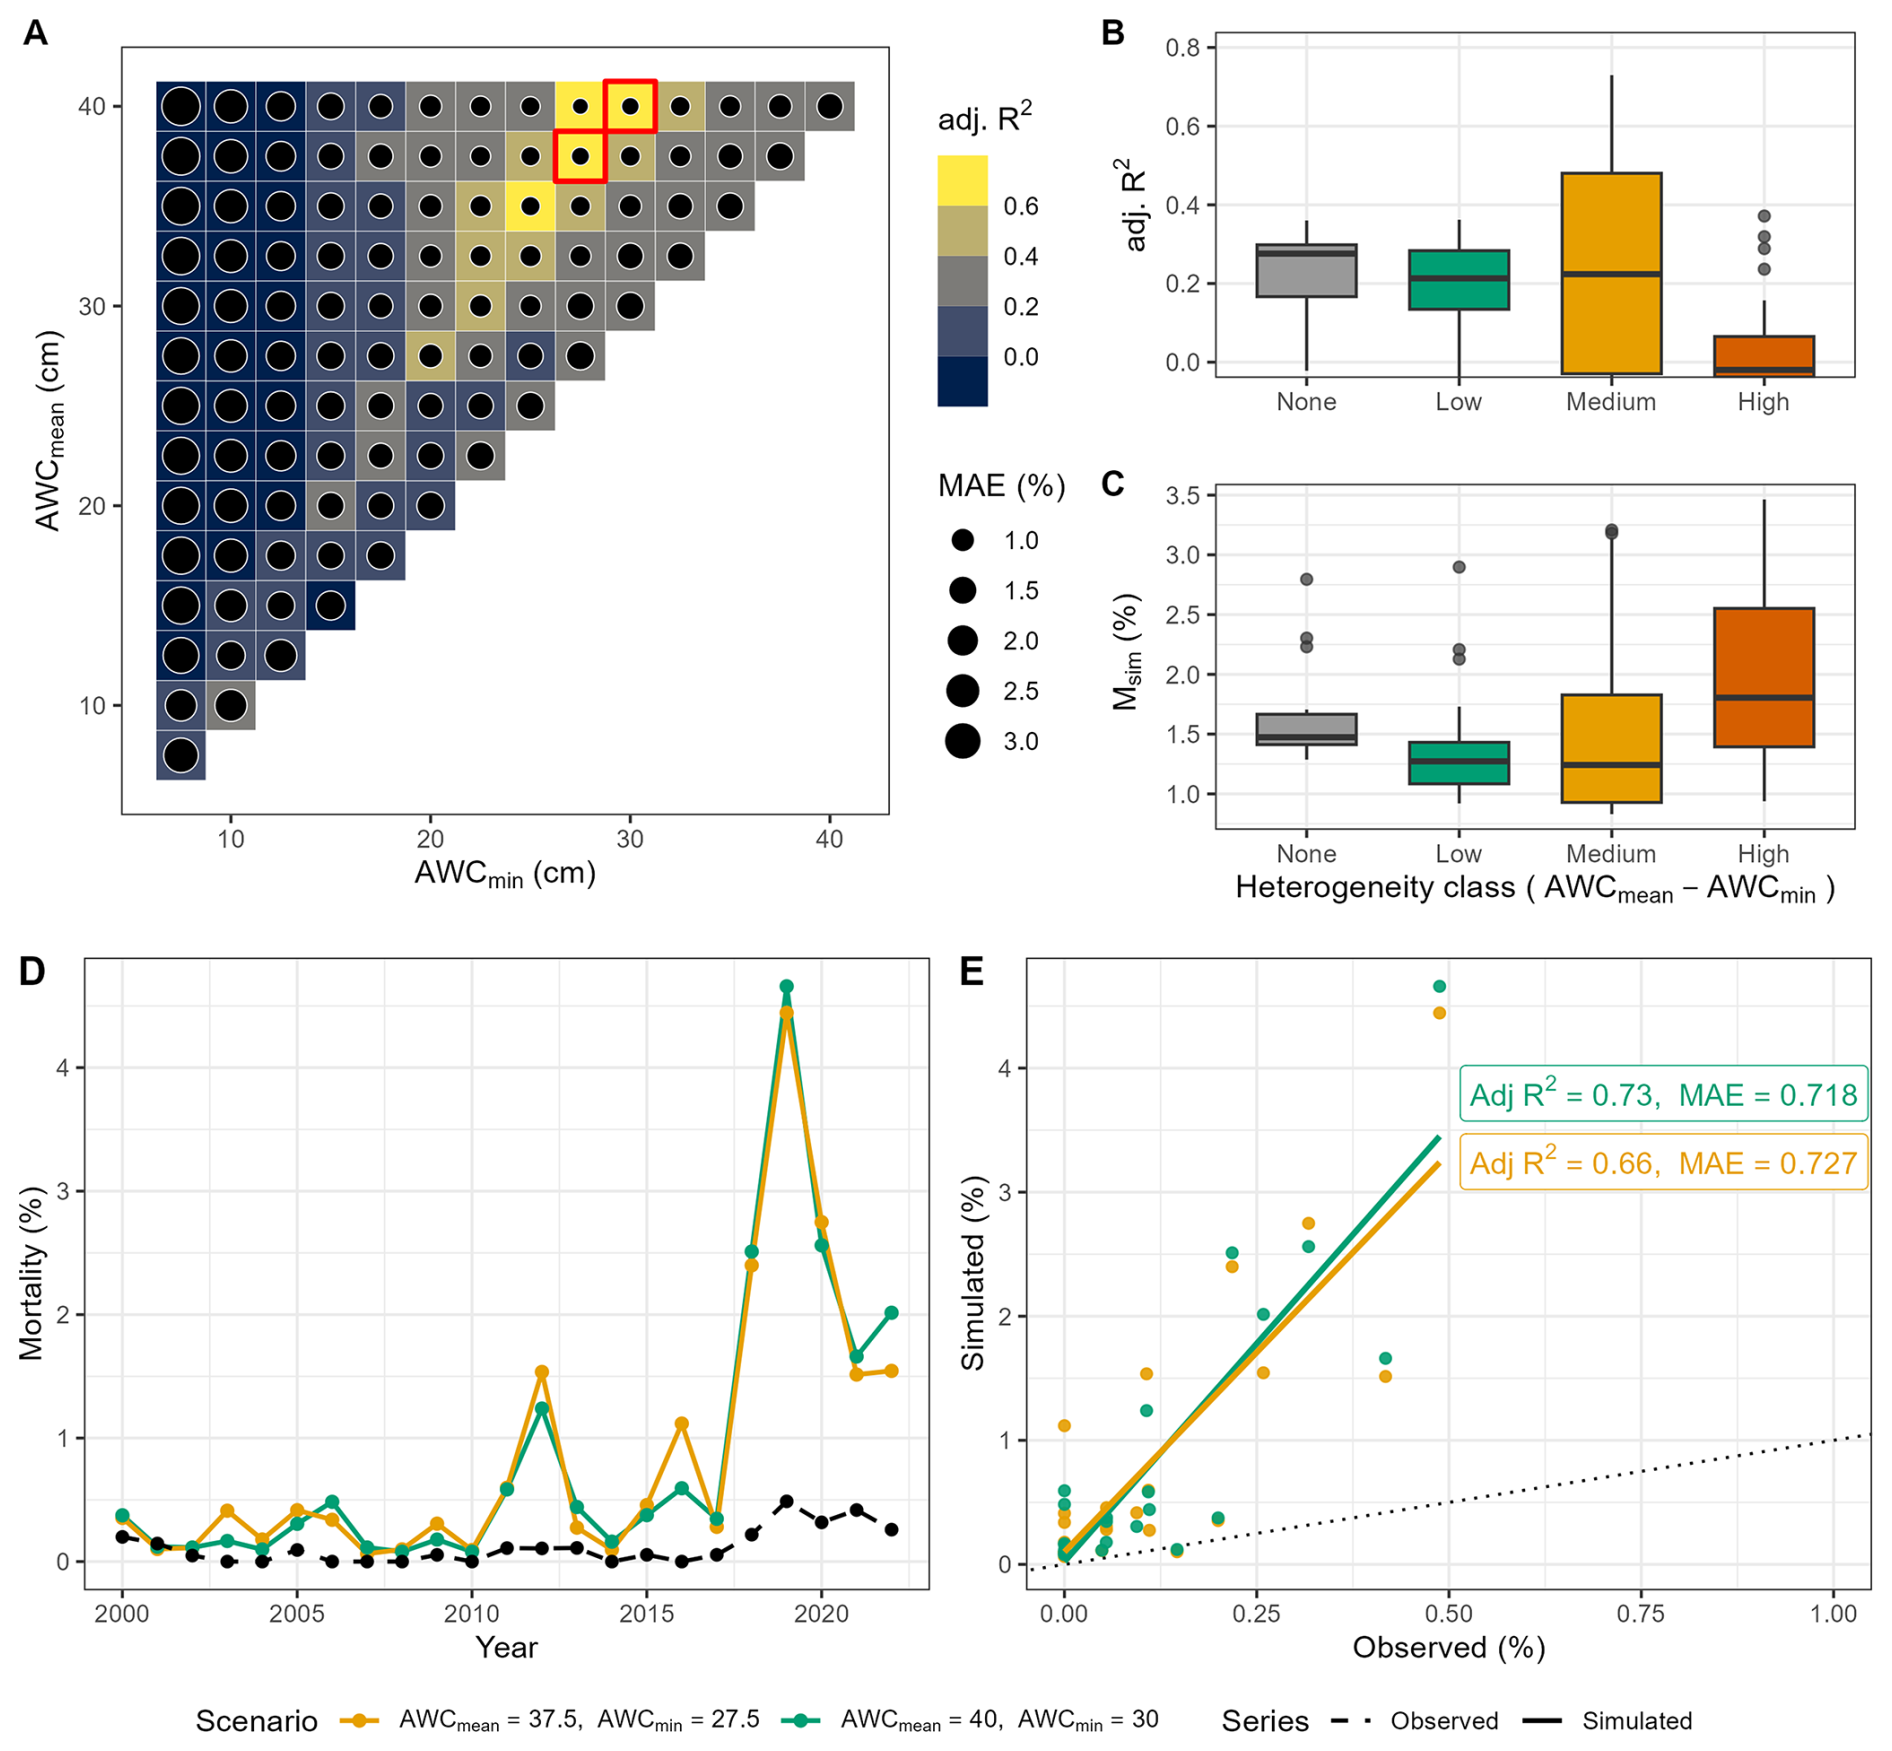
Figure 3Evaluation of the performance of soil moisture scenarios in reproducing simulated tree mortality compared to observed tree mortality for European beech-dominated sites. (A) AWC scenarios showing adjusted R2 and MAE. The two top-ranked AWC scenarios are indicated by red boxes. The top highest box (first row, starting from the top) represents scenario 95, while the second box (second row, starting from the top) indicates scenario 89. (B) Adjusted R2 and simulated mortality rate across heterogeneity classes (cf. Fig. 2). (C) Mean simulated mortality rate across heterogeneity classes. (D) Simulated (the two top-ranked AWC scenarios) and observed annual mortality rates over time across all sites, and (E) model statistics for the two top-ranked AWC scenarios. Scenario 89 is indicated in orange, while scenario 95 is in green.
In contrast, the regions of the parameter space with moderate to high mean and minimum AWC (i.e., towards the upper-right portion of the matrix) showed good agreement between simulated and observed mortality rates. Here, the model was able to capture both the timing and the relative magnitude of mortality signals. The corresponding lower MAE suggested that scenarios with high AWC were less prone to overestimating mortality, i.e. these are conditions where AWC is sufficiently high to delay and dampen drought impacts (cf. Fig. S9a). This pattern highlights the importance of mesic soils for moderating mortality responses, thus enhancing forest resistance to drought.
The transition from poor to strong model-data agreement (Fig. 3a) underscored the interaction between mean and minimum AWC in shaping mortality outcomes: when both were low, insufficient soil moisture buffering exacerbated mortality and produced significant model–observation mismatches. Conversely, high AWCmean (e.g., AWCmean>20 cm) combined with high AWCmin reduced the mortality response, improving model performance in terms of both trend (high adjusted R2) and magnitude (low MAE). Increasing soil heterogeneity (expressed as the difference between AWCmean and AWCmin) was associated with a clear shift in the mortality response (Fig. 3b). Under homogeneous and low soil moisture conditions (i.e., soil heterogeneity class None, Low), model performance was poor (as judged by the median of the distribution), with simulated mortality exhibiting lower variability and very low agreement with observations. As a result, the lack of soil heterogeneity exacerbated extreme drought responses and increased the likelihood of mortality events. At medium soil heterogeneity, (i.e. Medium class in Fig. 3b), the agreement between simulated and observed mortality rates increased as well, with a corresponding higher variability. This suggested that the spatial variability in soil water availability began to exacerbate mortality responses by creating localized zones of drought stress. At the highest levels of soil heterogeneity (i.e., High heterogeneity class), the relationship between simulated and observed mortality weakened, while simulated mortality rates increased and became more variable (Fig. 3c). The strong spatial (i.e. across patches) contrasts led to asynchronous drought responses among patches, as some experienced severe water stress while others remained relatively buffered. This divergence amplified overall mortality variability and reduced the consistency between simulated and observed mortality patterns. These overall patterns were confirmed by the analysis of spatial heterogeneity via σ (cf. Sect. S2.2 and Fig. S5a), suggesting that the relationship between soil heterogeneity and model accuracy was highly nonlinear (cf. Table S2, Fagus sylvatica). Indeed, the adjusted R2 initially increased as heterogeneity increased, reaching a peak at σ≈0.3, after which model performance declined sharply (Fig. S5a). Moreover, 48 % of the variation in adjusted R2 values across the dataset was explained by heterogeneity alone. This indicated a moderate to strong influence of local soil heterogeneity on model performance for European beech, suggesting that moderate levels of soil heterogeneity increased predictability, whereas high levels of heterogeneity reduced it.
The observed drought-induced mortality rates (Fig. 3d) featured a narrow range and low interannual variability for 2000–2017, whereas the simulated rates from the two top-ranked AWC scenarios exhibited more pronounced fluctuations, indicating an overestimation of both magnitude and variability by ForClim (cf. Table S4 for complete statistics). Between 2000 and 2017, the observed annual drought-related mortality rate averaged 0.054 % (±0.060 %), whereas the two top-ranked simulation scenarios (89 and 95) produced substantially higher means of 0.380 % (±0.383 %) and 0.326 % (±0.287 %), respectively – approximately seven and six times the observed rate. The pronounced simulated peak in 2012 reflected the strong drought intensity observed during that year, which however was not accompanied by observed mortality (cf. Figs. S8 and S9a).
For the period 2018–2022, the observed mortality increased up to 0.340 % (±0.105 %) with a peak value of 0.65 %, reflecting the onset of the pronounced drought (Fig. 3d). Over this period, scenarios 89 and 95 projected mean mortality rates of 2.53 % (±0.120 %) and 2.68 % (±1.17 %), exceeding the observations by a factor of 7.5. Overall, during the 2018–2022 drought, both observed and simulated mortality rates increase sharply, reflecting the expected impact of drought on forest mortality.
The statistical comparison between simulated and observed mortality rates (Fig. 3e) indicated that both two top-ranked AWC scenarios featured strong correlations with observed mortality, with and 0.66, respectively. Despite this strong correlation, the MAE highlighted the model's tendency to overestimate the magnitude (∼0.72 % MAE).The spread of the simulated values further emphasized the consistent overestimation of mortality in both scenarios, as the majority of the simulated values were above the 1:1 line. Overall, while the model successfully reproduced the temporal dynamics of drought-induced mortality of European beech, it systematically overestimated its magnitude. These results were confirmed also by analyzing the spatial mortality patterns at site level (cf. Figs. S16a and S18a).
Not surprisingly, the evaluation of model performance before and after 2018 revealed that the extreme drought years had a large influence on the fit of the simulations (cf. Fig. S14a–c). When excluding post-2017 data, the overall explanatory power (i.e. adj R2) of the simulations declined substantially, which reflected the very low absolute mortality rates before 2018 and the corresponding high observational uncertainty. Additional analyses based on a truncated period (2000–2017) showed that the selection of best-fitting AWC scenarios (i.e., scenarios 72 and 95, Fig. S10a, d and e) emphasized model sensitivity to moderate drought years such as 2012. These mortality peaks are recognized as responses to intense drought thresholds (cf. Fig. S9a), reflecting the model's internal drought sensitivity rather than stochastic behaviour. This supports the mechanistic plausibility of mortality signals prior to 2018, although overestimations and artifacts may remain. There are in fact years, such as 2009 but also 2012 (cf. Fig. S10d), in which the model generates mortality spikes that are not supported by observations (Fig. 1b), suggesting an overreaction to simulated drought intensity and its interaction with background mortality.
Including the post-2017 drought years therefore did not artificially boost model skill but rather captured the first emergence of a clear drought-driven mortality signal in the observations, providing a meaningful constraint on process behaviour under extreme conditions.
Regarding the causes of mortality, the fraction of simulated dead trees associated with predisposing and inciting factors remained low before 2015, generally <10 % (cf. Fig. S15a). Minor peaks were visible in 2004 and 2012, corresponding to isolated drought years (cf. Fig. S9a). Following the dry year 2015, the fraction of trees flagged for having a drought memory increased markedly, reaching approximately 50 % in 2019 under the best AWC scenarios, while slow-growth predisposition accounted for <10 % and inciting drought stress for 15 %–25 % in the same period. These results indicated that the strong mortality peak after 2018 was primarily linked to predisposing drought memory and inciting acute drought stress, while slow growth acted as a moderate predisposing factor only. Overall, our results confirm that European beech mortality was mainly driven by the interplay of drought effects acting on longer and shorter time-scales, which reflect a high sensitivity to prolonged and intense drought signals in the post-2018 period.
3.2 Norway spruce
Simulation results for Picea abies revealed a complex interplay between soil water availability, soil water heterogeneity and drought-related mortality (Fig. 4a). At very low AWCmean amd AWCmin values – i.e., in the lowest-left region of the matrix – model performance was relatively high when judged by the adjusted R2. However, MAE in this region of the parameter space reached , indicating a notable mismatch between simulated and observed magnitudes of mortality. This pronounced mismatch indicates that under low AWC scenarios the model responded too strongly to drought intensity (cf. Figs. S11 and S12a). As mean and minimum AWC increased (i.e., towards the top right of the matrix, Fig. 4a), model performance decreased, although the reduction in MAE suggests that discrepancies between simulated and observed mortality rates were reduced, particularly in the central and upper-right regions of the matrix (). Towards the upper left part of the matrix both adjusted R2 and MAE increased, highlighting a zone where the model better captures both the spatial pattern and the magnitudes of the drought response. Overall, rather than indicating a monotonic gradient of simulated drought resistance, the agreement across the matrix revealed a more complex pattern compared to European beech. For low AWCmean, moderate adjusted R2 and high MAE indicated that the model captured the general mortality pattern but exhibited high inaccuracies regarding the simulated magnitude. This suggests that low AWCmean was insufficient to buffer drought events and resulted in amplifying the mortality responses even when AWCmin was relatively high. Yet, high AWCmean values buffered mortality events too strongly, leading to an underrepresentation of the recent drought-related mortality in the simulations. The best AWC configurations were found under low to medium AWCmean,min, and again under high AWCmean with low to medium AWCmin.
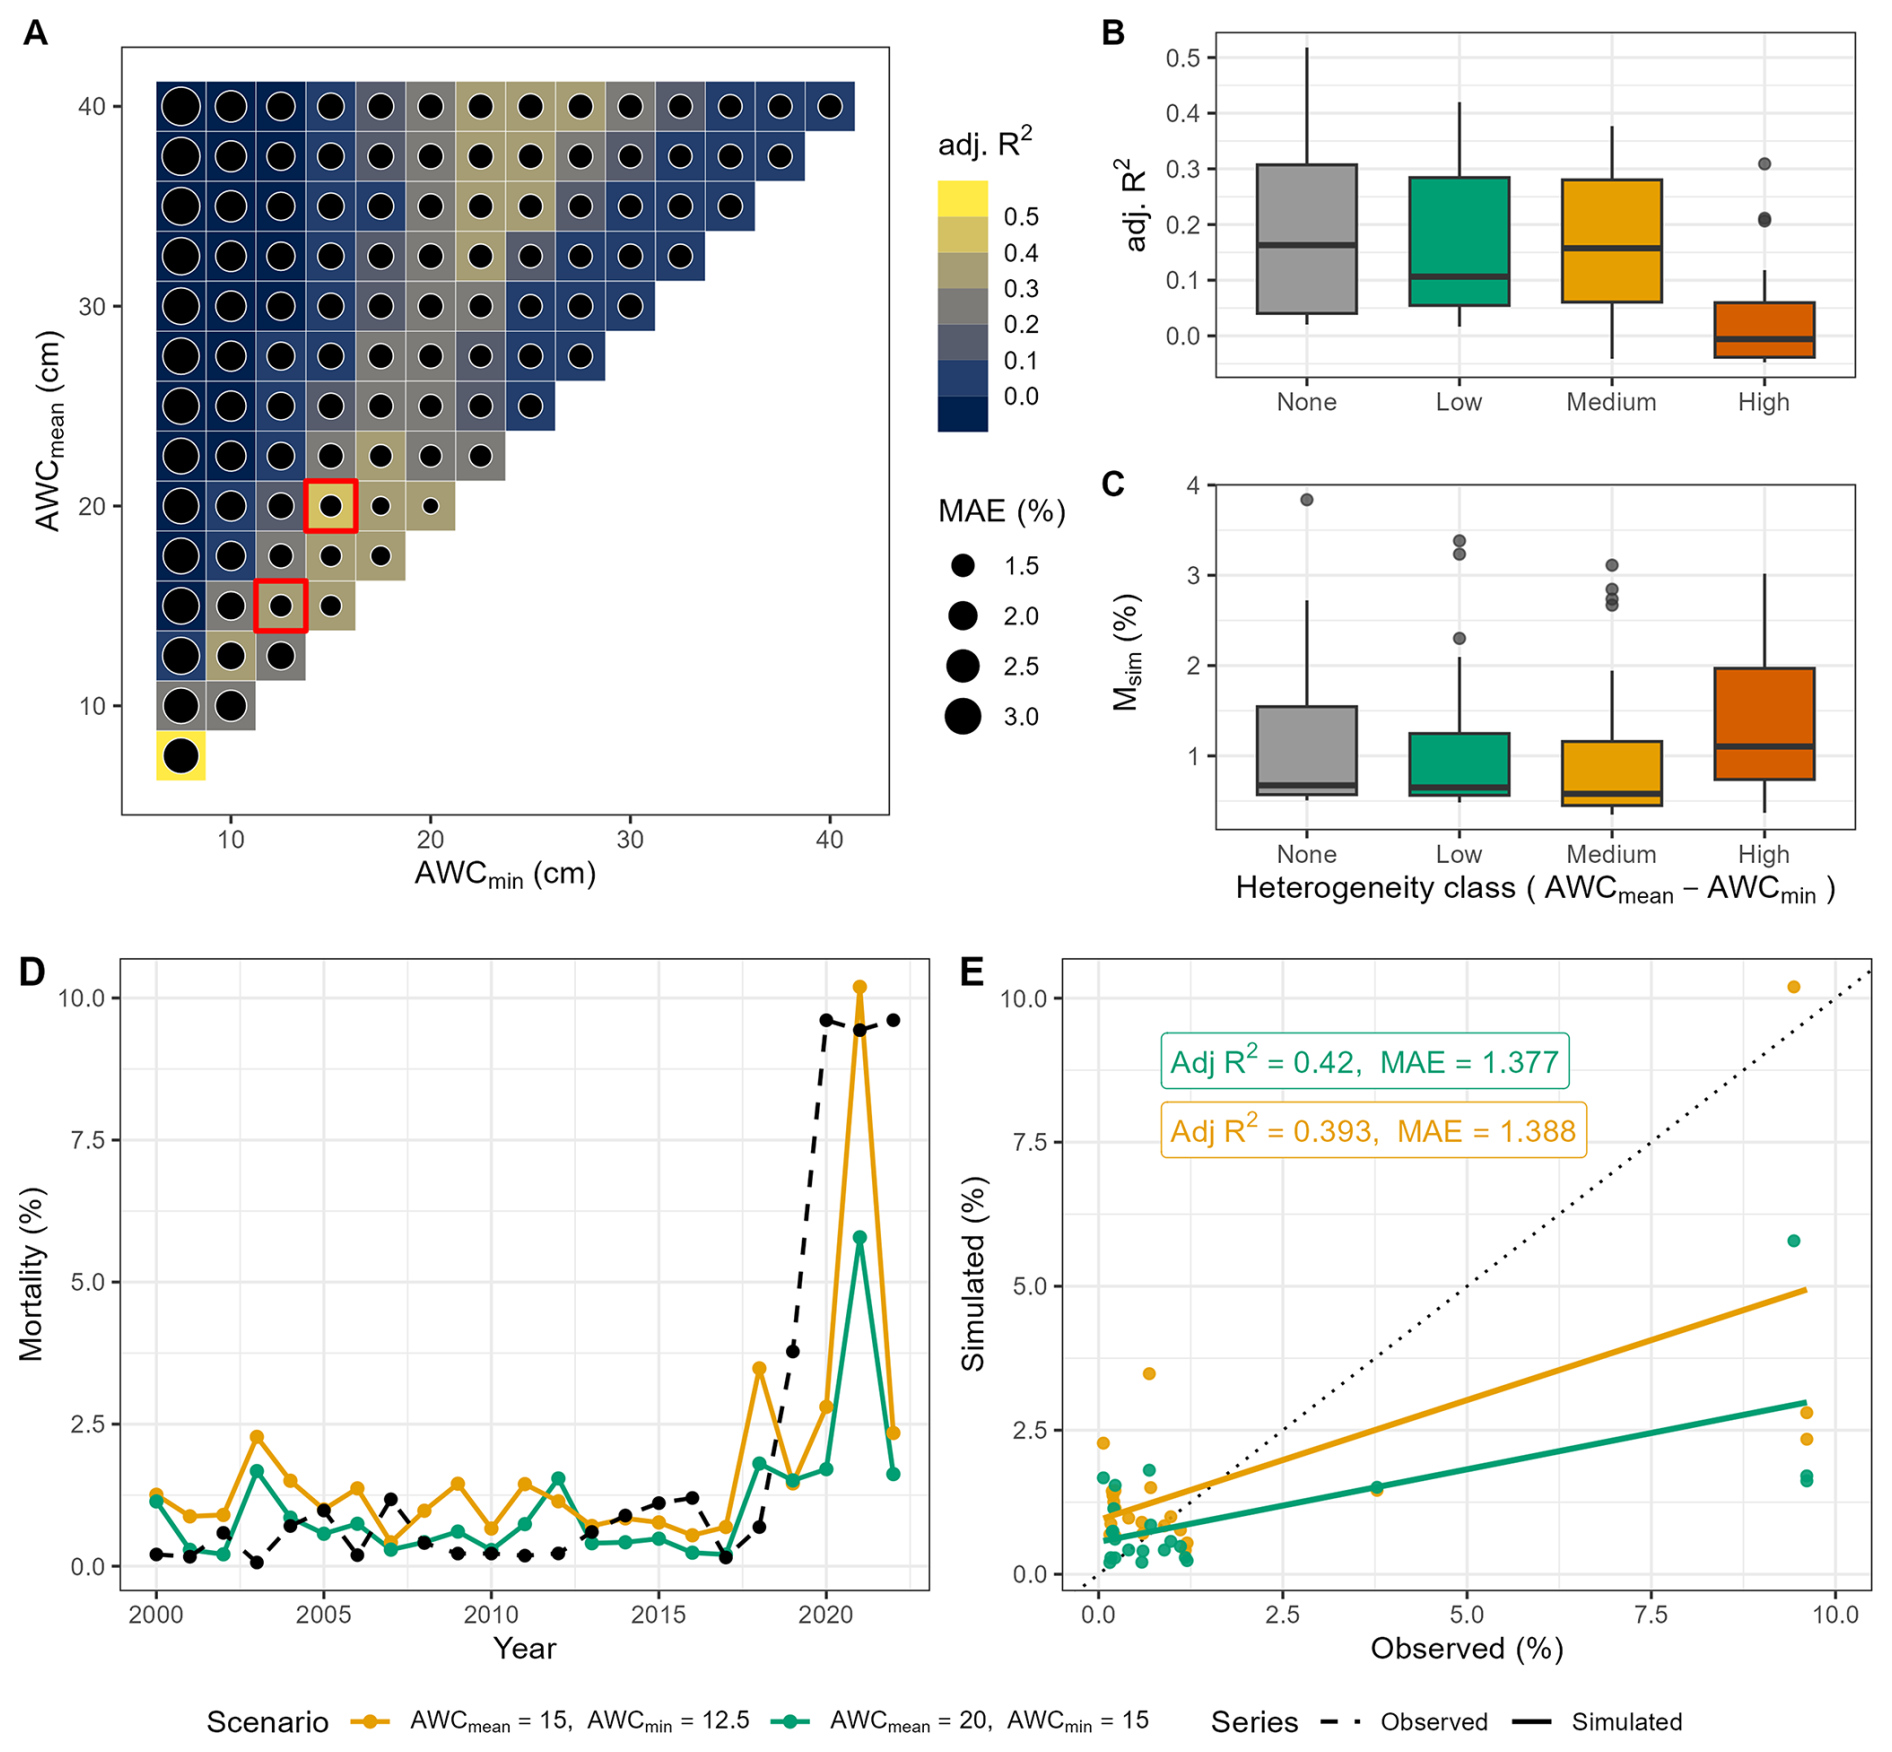
Figure 4Evaluation of the performance of each soil water scenario in reproducing simulated tree mortality compared to observed tree mortality for Norway spruce dominated sites. (A) AWC scenarios showing adjusted R2 and MAE. The two top-ranked AWC scenarios are indicated by red boxes. The top highest box (sixth row, starting from bottom) represents scenario 42, while the second box (fourth row, starting from the bottom) indicates scenario 29. (B) Adjusted R2 and simulated mortality rate across soil heterogeneity classes (cf. Fig. 2). (C) Mean simulated mortality rate across heterogeneity classes. (D) Simulated (the two best AWC scenarios, full lines) and observed mortality rates (dashed line) over time for Norway spruce, and (E) model statistics for the two best AWC scenarios. Scenario 29 is indicated in orange, while scenario 42 is in green.
The relationship between soil heterogeneity and model performance revealed a distinct negative trend for Norway spruce (Fig. 4b). The adjusted R2 values declined progressively from low to high soil heterogeneity, suggesting that the model performed best in spatially uniform conditions and struggled to capture mortality dynamics in highly heterogeneous soils. This pattern contrasts with Fagus sylvatica, where a hump-shaped response was evident (cf. Fig. 3b). Similar to European beech, the average simulated mortality increased with increasing soil heterogeneity (Fig. 4c), indicating that high spatial variability strongly influences the drought response (cf. Fig. S12b).
The GAM model confirmed that soil moisture heterogeneity had a significant non-linear impact on model performance, even higher than in the case of European beech, with peak performance at intermediate levels of heterogeneity (σ≈0.36), followed by a steep decline in adjusted R2 at higher σ (cf. Sect. S2.2 and Fig. S5b). Notably, the decline in model fit at high σ was steeper for Norway spruce, indicating a stronger sensitivity to higher soil moisture, whereas the performance of European beech decreased more gradually. The intercept (0.132, cf. Table S2, Picea abies) suggested as well that when structural heterogeneity was minimal (i.e., σ is close to zero), the model explained only 13.2 % of the variation in adjusted R2 values – a lower baseline compared to European beech, indicating that spruce model performance depended more strongly on soil heterogeneity.
Observed mortality rates of Picea abies between 2000 and 2018 were relatively low (mean=0.53 %, SD=0.39 %; Fig. 4d); simulated mortality under the two top-ranked soil moisture scenarios featured comparable magnitudes (mean=0.68 %) for scenarios 42 and higher (mean=1.2 %) for scenario 29 but a somewhat larger variability (SD=0.51 % and 0.71 %). This indicates that ForClim captured both the level and the interannual variability of mortality in non-drought years.
From 2019–2022, the observed mortality increased sharply (mean=8.1 %, SD=2.9 %), reflecting the impact of the recent severe drought. Although both simulation scenarios captured the general trend of rising mortality during the early years of this drought, with simulated means of 4.2 % and 2.7 % (SD=4.0 % and 2.1 % for scenarios 29 and 42, respectively), the model underestimated the magnitude of mortality in the later years, particularly in 2021 and 2022.
Between 2019 and 2022, the observed cumulative mortality reached 32.4 %, with a pronounced peak of 9.6 % in 2020 and 2022. The simulations underestimated the overall severity: scenario 29 reached a cumulative mortality of 16.8 % and scenario 42 merely 10.6 %. Peaks occurred in 2021 in the simulations (10.2 % under scenario 29 and 5.79 under scenario 42). In 2020, simulated mortality was 2.8 % and 1.7 % for scenario 29 and 42, respectively. Across 2021–2022, the observed mortality averaged 9.5 %, while simulations averaged 6.3 % and 3.7 for scenario 29 and 42. Overall, while the model reproduced the broad pattern of drought-driven mortality, it did not fully reflect the lagged mortality events after 2020. These findings were confirmed by the comparison in Fig. 4e, where simulated estimates aligned reasonably well with observations at low mortality rates but underestimated the severity as mortality rose, indicated by most of the high-mortality points lying below the 1:1 line for the last simulated years. The spatial analysis at site level also aligns with this finding (cf. Figs. S17b and S18b).
Similarly to European beech, the analysis of pre- and post-2018 model skill for Norway spruce (Fig. S14d–f) indicated that the inclusion of extreme drought years enhanced the model's discriminative ability. The increase in adjusted R2 for the full period was mainly due to the 2018–2022 mortality wave. Excluding these years resulted in much lower adjusted R2, as the 2000–2017 interval was also partially dominated by drought-driven mortality in the simulations. Indeed, a falsification experiment using only pre-2018 data indicated that the model exhibited an exaggerated response to moderate drought signals (e.g., 2003–2004, 2010–2012), particularly under low AWC settings, reinforcing the importance of evaluating model performance across a range of drought intensities (see Fig. S13d and e).
As for European beech, the temporal divergence of observed vs. simulated mortality peaks was a direct consequence of AWC-driven drought dynamics (cf. Fig. S12a) rather than noise, underscoring the mechanistic basis of model behaviour.
Even if underestimated compared to the observation, the bark beetle module induced a significant increase in mortality during the period of elevated drought, i.e. after 2018 (Fig. 4c), whereas in the absence of the bark beetle submodel, the overall trend and magnitude showed a substantial mismatch with observations (cf. Sect. S3.3.6 and Fig. S19). Thus, integrating the bark beetle submodel was essential for capturing the drought-induced mortality wave of Norway spruce in German forests in the period 2018–2022.
The sensitivity analysis of the bark beetle parameters kDrSc and Pbark revealed that across both scenarios the model was far more sensitive to kDrSc than to Pbark (Table S7). For scenario 29, the central-difference slope for kDrSc was −0.004421ΔMAE per 1 % (95 % CI ), about 10× larger in magnitude than Pbark (+0.000431 per 1 %). Interpreting the slope, a +10 % change in kDrSc reduced MAE by ∼0.044 (direction consistent with the MAE–vs–Δ plots), whereas a +10 % change in Pbark changed MAE by only For scenario 42, kDrSc remained the dominant driver ( vs. 0.000005 for Pbark), while Pbark was essentially flat within a range of variation of ±20 %. The confidence intervals spanned zero (as expected with only four perturbation levels), but the direction and magnitude were consistent across classes. Overall, the results identify kDrSc as a key parameter governing the model's sensitivity to drought-induced tree susceptibility to bark beetle attack, highlighting the importance of careful calibration and empirical benchmarking.
For Norway spruce, the contribution to mortality of slow-growth predisposition was consistently higher than for beech throughout the simulation (cf. Fig. S15B). Under the scenario 42 (i.e., AWCmean=20 cm, AWCmin=15 cm), slow growth accounted for of dead trees already before 2015. After 2015, the importance of the drought memory increased (5 %–15 %) particularly in the years 2018 and 2021, while inciting drought stress contributed less than 10 % until 2019. After the extreme drought of 2018, drought-related inciting stress rose sharply, reaching ∼15 % and 10 % in 2019 and 2021, respectively. The combined predisposing components (slow growth + drought memory) were much higher for scenario 29 (i.e., AWCmean=15 cm, AWCmin=12.5 cm), amounting to almost 53 % in 2019. Hence, the mortality before 2018 in spruce stands emerged from the superposition of long-term predisposing growth reduction (i.e., ∼15 % higher than scenario 42) and the drought memory under conditions of limited soil water storage. Together, these results emphasize that in Norway spruce, mortality dynamics were dominated by long-term growth-related predisposition and cumulative drought memory effects rather than immediate inciting stress. The stronger response in the drier scenario (29) thus underscores the model's capacity to capture how reduced soil water storage amplifies chronic vulnerability and prolongs post-drought mortality.
4.1 Trend and magnitude of simulated mortality rate
Our study demonstrated that a simple framework that semi-mechanistically considers the factors underlying drought-related tree mortality (i.e., the PIC scheme of ForClim v4.1 including the bark beetle model in ForClim v4.2) was able to capture the recent drought-induced tree mortality trends and particularly the response to the extreme drought of 2018–2022 at large spatial scales for two major European tree species, although model performance varied among species and revealed some limitations. Importantly, a key feature of the PIC scheme was its capacity to accurately predict the timing of extreme drought-related mortality events, although the magnitude of this mortality was captured differently for the two species, as discussed below.
When the evaluation is restricted to 2000–2017, adj R2 values are much lower for both species because observed mortality is very low and dominated by both drought-driven and “background”, i.e. stochastic components. In particular, using only data from 2000–2017 revealed that the AWC scenario selection is sensitive to the period chosen for the analyses, particularly for European beech. While Norway spruce showed a more consistent scenario rankings across periods, scenario selection based solely on the post-2017 mortality may overemphasize extreme drought responses. These findings underscore the need to evaluate model robustness across moderate and extreme drought conditions to avoid projection bias.
The 2018–2022 period provides the first strong, process-driven signal against which the PIC scheme can be mechanistically constrained. Across the 105 AWC scenarios, differences in the year of peak mortality arose from drought sensitivity – not stochasticity – whereby low AWC caused earlier, sharper peaks (e.g., 2003 and 2018) and higher AWC buffered drought and shifted the peak later (e.g., 2021). Thus, higher full-period R2 reflects improved signal-to-noise under extreme stress, while also revealing remaining limitations (e.g., underestimation of multi-year spruce mortality after 2018) that likely would require representing lagged physiological decline and compounding beetle dynamics rather than simply outbreak pulses, as captured in ForClim v4.2.
For European beech, the model captured the pattern of mortality over time quite well, but it overestimated the magnitude of mortality throughout by a factor of 7–8, including the recent drought wave (2018–2022). This indicated that for beech the sensitivity to drought-related stress as parameterized in the PI scheme (Marano et al., 2025) is probably too strong. Yet, it is noteworthy that the timing of the drought-related mortality peak (2018–2022) was captured well; in the model, the magnitude of drought-related mortality depends on a single parameter whose value is going back to an assumption by Botkin et al. (1972), according to which stressed trees have just a 1 % chance of surviving 10 stress years, thus yielding an annual stress-related mortality probability of 36.8 %. Evidently, this probability was too high to be compatible with observed data for beech (George et al., 2022; Knapp et al., 2024). However, we wanted to assess whether the PI scheme was capable of predicting the timing of strong drought-related mortality (irrespective of its exact magnitude), and this was successful. Parameter calibration could certainly improve the fit between simulated and observed mortality rates, but this was not the scope of our analysis.
For European beech, our study is the first to explicitly simulate drought-induced tree mortality using a process-based dynamic vegetation model along a wide geographical gradient. The simulated mortality rates aligned closely in terms of magnitude with results from other studies examining drought-induced mortality during the same period in managed beech dominated forests, ranging between 0.5 %–4.0 % at the patch level, including the rising trend in mortality after 2018 (Meyer et al., 2022). This consistency across studies lends credibility to the model's capacity to replicate the pattern of drought-related mortality of beech, despite challenges in the direct comparison with observations from a sample inventory such as WZE (cf. Sect. 4.4).
For Norway spruce, the model captured the magnitude of mortality over time even better than for European beech, including the severity of the recent drought-induced mortality wave. Although some inconsistencies remained (e.g., minor temporal mismatches and overestimation of low-intensity events and the misaligned peak after 2018), these differences primarily reflect the absence of model calibration and possibly also site-specific effects that the model cannot capture. In particular, the misaligned peak of bark beetle-related mortality might be attributed to uncertainty in both the model and the data. In ForClim v.4.2, the high sensitivity of Norway spruce to drought-induced stress overestimated the mortality response in the model for 2019, whereas the simplified bark beetle module may have underestimated the number of beetle generations, thus leading to the underestimation of mortality in 2021–2022. Empirical evidence also indicates that bark beetle outbreaks often lag behind drought events by several seasons or years, as drought-weakened trees become increasingly susceptible over time (Seidl et al., 2008). Furthermore, in reality such outbreaks are typically tied to other disturbances such as windthrows, which the model does not currently consider (Hlásny et al., 2021; Jakoby et al., 2019; Netherer et al., 2019; Seidl and Rammer, 2017). These simplifications are likely to contribute to the mismatched peaks of simulated spruce mortality, underscoring the need for a more nuanced integration of delayed and compounding disturbance interactions.
Nevertheless, model performance was clearly better for spruce when bark beetle activity as a contributing factor to mortality was included; this underscores the importance biotic stressors in the PIC framework (Fischer et al., 2025; Trugman et al., 2021). Our study demonstrated that the model's simplified PIC scheme successfully captured observed mortality rates, a noteworthy achievement given that previous statistical and process-based models that incorporated mechanistic approaches (e.g., hydraulic failure, carbon starvation) were largely unable to simulate drought-induced mortality (Davi and Cailleret, 2017; Fischer et al., 2025).
Compared with recent modeling efforts (Anders et al., 2025; George et al., 2022; Fischer et al., 2025), ForClim v.4.2 accurately reproduced both the overall trend and magnitude, in case of European beech, and magnitude for Norway spruce of drought-related tree mortality. Thus, despite the inherent complexities of modeling drought-related tree mortality, our study represents an important advancement by successfully addressing this challenge without resorting to calibration. In contrast to recent studies that used statistical modeling and thus large calibration efforts, which aligned closely with observed mortality data from the ICP monitoring network (e.g., Anders et al., 2025; Knapp et al., 2024), our primary objective was not to optimize the model for immediate predictive accuracy. Rather, we sought to explore and understand the processes underlying drought-induced mortality across different species and contexts, which is often impossible based on statistical methods alone (Brunner et al., 2021; McDowell et al., 2013; Trugman et al., 2021). Our process-based approach thus prioritizes mechanistic insights over accuracy, allowing for the identification of key drivers of mortality. Future research should build on this foundation by structurally refining and then calibrating the PIC scheme.
4.2 Role of soil water availability and its local spatial heterogeneity for modulating species response to drought
To date, the quantitative importance of AWC for buffering or amplifying drought stress signals and tree mortality has not received attention in dynamic modeling studies, in spite of its recognized relevance for modulating tree responses to water scarcity (Klesse et al., 2022; Martinez del Castillo et al., 2022; Mellert et al., 2018). Our findings provide detailed insights regarding the responses of Fagus sylvatica and Picea abies to varying degrees of soil water stress.
The overestimated mortality rates in the European beech simulations reported in our study are in stark contrast to the good match in the case of six mesic beech sites in Switzerland (Marano et al., 2025), and such difference can be attributed to several reasons. First, it may be due to an inherent limitation in the model's assumptions for European beech under low precipitation conditions. ForClim simulates European beech dominance within a relatively small optimum climatic space (cf. Bugmann, 1996; Bugmann and Cramer, 1998; Bugmann and Solomon, 2000) and thus may predict excessive mortality at sites with less than ≈700 mm of annual precipitation, as often found in Germany. In reality, populations of Fagus sylvatica may still thrive in such environments, likely due to local adaptations, microclimatic refugia, or access to groundwater – factors that lie outside the current model structure. Consequently, the observed die-off in the simulations indicates that moisture availability, not just soil water-holding capacity, constitutes a critical bottleneck for accurately forecasting beech dynamics in marginally dry climates.
Moreover, the future of Fagus sylvatica is intricately linked not only to climate, but also to soil conditions (cf. Gessler et al., 2022; Meusburger et al., 2022; Walthert et al., 2021; Walthert and Meier, 2017). Our study reinforced this notion, demonstrating that soil properties and particularly their small-scale spatial variability play a critical role in modulating drought-induced mortality. The characteristics of the top-ranked scenarios for both species underscore the importance of moderate local heterogeneity of soil conditions with values of σ=0.31 and 0.29 for scenarios 89 and 95, respectively, for European beech.
We found that Picea abies exhibits an even higher sensitivity to low AWC than Fagus sylvatica, which is in line with previous research (Griesbauer et al., 2021; Henne et al., 2011; Lagergren and Lindroth, 2002). This may be linked to its shallow rooting system, which limits access to deep soil water during prolonged drought. Generally, higher AWC provides a critical buffer, allowing spruce to better withstand drought episodes and delaying the onset of mortality, which was confirmed by our simulations showing reduced model performance at higher AWC values. Specifically, also for Norway spruce the most predictive scenarios correspond to moderate levels of the heterogeneity of soil water availability (σ=0.18 and 0.29 for scenarios 29 and 90, respectively), suggesting that variability at the microsite scale (i.e., at the patch-level within the simulated forest stands) captures ecologically meaningful differences in moisture supply that influence tree vulnerability to drought.
Notably, scenarios characterized by either very low or very high heterogeneity (i.e., σ) performed less well for European beech, while for Norway spruce some low heterogeneity scenarios still performed well, although the discrepancies in simulated mortality were much higher compared to scenarios of medium heterogeneity. This indicates that for Norway spruce no variability in soil moisture heterogeneity can heighten the mortality signal driven by drought (e.g., during the most recent massive drought), whereas excessive heterogeneity may introduce noise that masks the underlying drivers of mortality and dampens the signal. Thus, it is pivotal to account for the small-scale spatial variability of soil water properties when aiming to provide accurate mortality predictions in forest models based on semi-mechanistic (rather than merely statistical) frameworks. Overall, our research emphasizes that the future of beech and to some extent also Norway spruce hinges strongly upon soil conditions, and general statements based on Species Distribution Models, which largely ignore soil properties, are likely to lack accuracy (e.g., Gessler et al., 2024).
Lastly, when attempting to use our PIC scheme for projecting the future fate of European beech and Norway spruce under climate change, we recommend to first perform a species-specific calibration, to avoid artifacts caused by influential outlier years (e.g. for the time after 2017). Furthermore, as climate change is likely to exacerbate drought conditions across Europe, integrating detailed information on soil properties and species-specific drought resilience in forest models will be essential for accurately predicting mortality dynamics and, ultimately, guiding adaptive management practices.
4.3 Mechanistic interpretation of the post-2017 mortality surges
The additional analysis of predisposing and inciting drought stress factors provided mechanistic support for the simulated mortality peaks before and after the intense drought events of 2018ff. In ForClim, the stress factors differentiate short-term physiological stress and legacy effects that accumulate through time (Marano et al., 2025). The patterns indicated that the sharp increase in mortality did not arise solely from the exceptional drought of 2018, but rather from the interaction between cumulative pre-drought stress and acute drought events, as explained below.
For European beech, model behavior is consistent with a primarily event-driven response, where mortality is triggered once critical drought thresholds are exceeded. This suggests that the species' vulnerability is tightly coupled to short-term hydraulic stress rather than to persistent carbon limitation (Ulrich and Grossiord, 2023). The transient emergence of the drought-memory effects implies that legacy stress contributes to the physiological weakening of this tree species and may delay recovery even after water availability improves. This aligns well with empirical evidence showing that beech exhibits partial recovery of growth following drought release and relatively low mortality persistence (Neycken et al., 2022; Ulrich and Grossiord, 2023).
In contrast, Norway spruce featured a chronic predisposition to growth-related decline in the model, reflecting a gradual depletion of carbon reserves and cumulative impairment of hydraulic function (Ulrich and Grossiord, 2023). This long-term predisposition magnifies the impact of subsequent inciting events, producing sustained high mortality even after acute drought conditions subside. The simulated response mirrors field observations in spruce forests where prolonged growth suppression, shallow rooting, and successive warm-dry years collectively increase bark-beetle susceptibility and the persistence of mortality (Netherer et al., 2019).
From a modeling perspective, these findings highlight the ability of our PIC framework to reproduce both acute and lagged mortality dynamics, even in the absence of parameter calibration. They further suggest that correctly representing predisposing processes – such as growth limitation, carbon memory, and drought legacy – is essential to explain delayed and multi-year mortality waves, particularly in species with different hydraulic strategies.
4.4 Methodological considerations and research recommendations
Accurately predicting drought-induced tree mortality remains one of the most pressing challenges in forest modelling (cf. Fischer et al., 2025), hindered by both observational and methodological constraints.
First, long-term observations of drought-induced tree mortality remain limited, posing significant challenges for understanding, predicting, and comparing simulation results with observed mortality rates and trends (George et al., 2022). Such datasets are rare due to the difficulty of establishing and maintaining monitoring systems over extended, multi-decadal periods with at least an annual resolution, which however is essential for capturing drought-related mortality (Bugmann et al., 2019). This scarcity inherently limits the power of validation efforts for simulation models. We used data from ICP Level I plots, which provide a valuable compromise between spatial extent and temporal resolution, as they were surveyed systematically over decades with an annual resolution, providing a long-term standardized dataset where the causes of tree death are recorded. However, this dataset has limitations. The observations relied on just 24 trees per plot, making stand-level generalization impossible. Additionally, the data were not representative of true stand-level mortality dynamics, as they were collected on a per-tree basis rather than being representative of the stand. To address these limitations, it would be ideal if future monitoring efforts could focus on long-term, stand-level observational data to provide a comprehensive basis for validating and refining forest simulation models. Obviously, there are logistic constraints to this; the high-intensity Level II sites were set up to accomplish this, but they are lacking high replication, amounting to “just” 68 plots in total. In any case, the present study in the general context of understanding and predicting drought-induced mortality underlines the high value and necessity of long-term, high-quality monitoring data.
Second, the absence of stand-level observations necessitated the use of a simulation approach based on single species to provide the initialization dataset for the actual simulation study. This was a pragmatic and heuristically useful solution; it ignored the potential role of current forest structure and composition in mediating drought responses. Therefore, incorporating real forest states rather than initializing simulations from a “spin-up” is a critical step for better assessing model fidelity. Remote sensing technologies such as LiDAR combined with high-resolution aerial photography may be a promising approach to address the lack of ground observations and provide a first estimate of mortality rates after drought events (Mosig et al., 2026; Schiefer et al., 2023, 2024).
Third, these observational constraints are further compounded by the inherent complexity and uncertain relative importance of drought-related ecophysiological processes – including hydraulic failure, carbon starvation, and various abiotic and biotic stressors – along with challenges in determining the appropriate spatio-temporal resolution and level of model complexity needed for their accurate representation (McDowell, 2011; Sala et al., 2010; Trugman et al., 2021). Multiple studies have shown that models often fail to capture the interplay between predisposing factors (e.g., drought memory), inciting events (e.g., prolonged water deficits) and contributing factors (e.g., pest outbreaks) (Fischer et al., 2025; Gazol and Camarero, 2022; Hartmann et al., 2018; McDowell et al., 2013). Trade-offs between model complexity, process knowledge and computational feasibility constitute further barriers to integrating physiological, ecological, and climatic processes at the scales needed to simulate large-scale tree mortality (Meir et al., 2015). These limitations underscore the need for an improved understanding of the processes that are triggering drought responses at the tree level and how they propagate at the stand and landscape scale (Choat et al., 2018; Davi and Cailleret, 2017; McDowell et al., 2008). Furthermore, the development of hybrid modeling approaches that blend process-based and data-driven methodologies could be explored (Fischer et al., 2025; Zhang et al., 2021).
Lastly, recent studies (Anders et al., 2025; Fischer et al., 2025; Liu et al., 2021) have shown that model calibration offers a powerful means to align simulations with observations, enhancing model accuracy and robustness. However, to fully profit from calibration, it is crucial that models first demonstrate the capacity to reliably reproduce mortality patterns through process-based understanding. This ensures that the mechanisms driving mortality are captured accurately, rather than relying on statistical adjustments to match observed patterns. Calibrating models without a robust process-based foundation risks “getting the right answer for the wrong reason”, where the output aligns with historical data but fails to reflect the underlying ecological dynamics, particularly since mortality models – including our PIC scheme – contain multiple parameters that are poorly constrained by direct observation, thus essentially constituting degrees of freedom for calibration. Premature calibration however would not only undermine confidence in the model but also jeopardize its ability to project future trajectories. By prioritizing process understanding, as done here, models are better equipped to capture the complexity of mortality drivers, enabling them to provide meaningful insights under novel and uncertain future conditions.
Our analysis evaluated the predisposing and inciting factor scheme (PI in ForClim v4.1) outside its original development context – Swiss beech-dominated forests – by applying it to broader datasets in Germany for two dominant species, European beech and Norway spruce. The scheme was further developed to account for contributing factors (PIC, giving rise to ForClim v4.2) in order to capture drought-related mortality signals across a wide climatic and pedospheric gradient for Norway spruce. From this research, we draw the following conclusions.
First, the model demonstrated its ability to replicate drought-induced mortality patterns with varying, but generally impressive degrees of agreement when compared to observed mortality rates. Discrepancies between simulated and observed mortality rates stem from several factors, including data imbalance (e.g., limited observations of dead trees), the high sensitivity of the bark beetle submodel to drought intensity, and the absence of model calibration to the specific conditions of the analyzed datasets.
Second, soil water availability emerged as a key factor influencing species-specific responses to drought, both in terms of absolute AWC (available water holding capacity) values and the local spatial heterogeneity of soil conditions modeled through varying AWC scenarios. Low AWC conditions accelerated and amplified mortality, whereas moderate to high AWC buffered drought impacts, improving alignment between simulated and observed mortality trends. Low soil heterogeneity correlated with increased mortality events, as the lack of microsite variation provides limited opportunities for trees to access favorable soil conditions under drought stress, whereas higher soil heterogeneity mitigated drought impacts as it provided local refugia of higher water availability. These findings underscore the critical role of soil water dynamics in shaping tree resistance to drought, in addition to mere climatic factors.
Third, by incorporating a bark beetle module, ForClim v4.2 achieved greater accuracy in simulating Norway spruce mortality patterns under drought stress compared to simulations that did not consider bark beetle activity.
Lastly, further research is needed to enhance the robustness and applicability of the PIC scheme, regardless of the degree of ecophysiological detail being employed. Specifically, higher-resolution data, such as annual observations of tree mortality and crown condition at the stand (rather than single-tree) scale, would be important for refining model predictions. Moreover, model calibration could be used once the primary processes driving drought-related mortality are better isolated and understood. Such advancements hold the potential to not only improve the accuracy of process-based models under historical climate, but most importantly to offer deeper insights for disentangling the complex, multifactorial drivers of drought as a compound phenomenon. This, in turn, would pave the way for more reliably simulating the impacts of future climate change, thereby supporting adaptive forest management strategies in an era of intensifying climatic stressors.
The ForClim v4.2 model source code, simulation settings and outputs are archived at the following Zenodo (https://doi.org/10.5281/zenodo.17977101, Marano and Bugmann, 2025). Analysis code in the R language is also archived at Zenodo at: https://doi.org/10.5281/zenodo.17977101 (Marano and Bugmann, 2025).
The underlying research data include ICP Forests Level I monitoring data. These data are not publicly accessible because they are owned and managed by a third party and are subject to access restrictions defined by the data provider. ICP Level I data for Germany can be requested from the Thünen Institute (Germany), which acts as the responsible data custodian and provides access upon reasonable request and in accordance with the applicable data use agreements. The authors did not generate new primary monitoring data for this study and therefore cannot deposit the data in a public repository or assign a DOI. Access to the data is contingent on approval by the data owner.
The supplement related to this article is available online at https://doi.org/10.5194/gmd-19-1121-2026-supplement.
GM, HB and UH conceived the idea, developed the concept and framing of the paper; GM curated the ForClim source code, conducted the analyses, created the graphics, and drafted the main manuscript; NK provided the ICP-Level 1 data. All authors contributed to the writing, reviewed the manuscript and approved its submission.
The contact author has declared that none of the authors has any competing interests.
Publisher's note: Copernicus Publications remains neutral with regard to jurisdictional claims made in the text, published maps, institutional affiliations, or any other geographical representation in this paper. The authors bear the ultimate responsibility for providing appropriate place names. Views expressed in the text are those of the authors and do not necessarily reflect the views of the publisher.
This research has been supported by the Schweizerischer Nationalfonds zur Förderung der Wissenschaftlichen Forschung (grant-no. 188882).
This paper was edited by Yuanchao Fan and reviewed by two anonymous referees.
Anders, T., Hetzer, J., Knapp, N., Forrest, M., Langan, L., Tölle, M. H., Wellbrock, N., and Hickler, T.: Modelling past and future impacts of droughts on tree mortality and carbon storage in Norway spruce stands in Germany, Ecol. Model., 501, 110987, https://doi.org/10.1016/j.ecolmodel.2024.110987, 2025.
Barrett, T., Dowle, M., Srinivasan, A., Gorecki, J., Chirico, M., Hocking, T., Schwendinger, B., and Krylov, I.: data.table: Extension of “data.frame”, R package, CRAN – Comprehensive R Archive Network, https://doi.org/10.32614/CRAN.package.data.table, 2026.
Bigler, C., Bräker, O. U., Bugmann, H., Dobbertin, M., and Rigling, A.: Drought as an Inciting Mortality Factor in Scots Pine Stands of the Valais, Switzerland, Ecosystems, 9, 330–343, https://doi.org/10.1007/s10021-005-0126-2, 2006.
Bonannella, C., Parente, L., De Bruin, S., and Herold, M.: Multi-decadal trend analysis and forest disturbance assessment of European tree species: concerning signs of a subtle shift, Forest Ecol. Manag., 554, 121652, https://doi.org/10.1016/j.foreco.2023.121652, 2024.
Botkin, D. B., Janak, J. F., and Wallis, J. R.: Some Ecological Consequences of a Computer Model of Forest Growth, J. Ecol., 60, 849, https://doi.org/10.2307/2258570, 1972.
Bottero, A., Forrester, D. I., Cailleret, M., Kohnle, U., Gessler, A., Michel, D., Bose, A. K., Bauhus, J., Bugmann, H., Cuntz, M., Gillerot, L., Hanewinkel, M., Lévesque, M., Ryder, J., Sainte-Marie, J., Schwarz, J., Yousefpour, R., Zamora-Pereira, J. C., and Rigling, A.: Growth resistance and resilience of mixed silver fir and Norway spruce forests in central Europe: Contrasting responses to mild and severe droughts, Glob. Change Biol., 27, 4403–4419, https://doi.org/10.1111/gcb.15737, 2021.
Brunner, M. I., Slater, L., Tallaksen, L. M., and Clark, M.: Challenges in modeling and predicting floods and droughts: A review, WIREs Water, 8, e1520, https://doi.org/10.1002/wat2.1520, 2021.
Bugmann, H. and Cramer, W.: Improving the behaviour of forest gap models along drought gradients, Forest Ecol. Manag., 103, 247–263, https://doi.org/10.1016/S0378-1127(97)00217-X, 1998.
Bugmann, H., Seidl, R., Hartig, F., Bohn, F., Brùna, J., Cailleret, M., François, L., Heinke, J., Henrot, A. J., Hickler, T., Hülsmann, L., Huth, A., Jacquemin, I., Kollas, C., Lasch-Born, P., Lexer, M. J., Merganiè, J., Merganièová, K., Mette, T., Miranda, B. R., Nadal-Sala, D., Rammer, W., Rammig, A., Reineking, B., Roedig, E., Sabaté, S., Steinkamp, J., Suckow, F., Vacchiano, G., Wild, J., Xu, C., and Reyer, C. P. O.: Tree mortality submodels drive simulated long-term forest dynamics: assessing 15 models from the stand to global scale, Ecosphere, 10, https://doi.org/10.1002/ecs2.2616, 2019.
Bugmann, H. K.: On the Ecology of Mountainous Forests in a Changing Climate: A Simulation Study, Dissertation, ETH Zurich, 252 pp., https://doi.org/10.3929/ethz-a-000946508, 1994.
Bugmann, H. K. M.: A Simplified Forest Model to Study Species Composition Along Climate Gradients, Ecology, 77, 2055–2074, https://doi.org/10.2307/2265700, 1996.
Bugmann, H. K. M. and Solomon, A. M.: Explaining forest composition and biomass across multiple biogeographical regions, Ecol. Appl., 10, 95–114, https://doi.org/10.1890/1051-0761(2000)010[0095:EFCABA]2.0.CO;2, 2000.
Camarero, J. J.: The drought-dieback-death conundrum in trees and forests, Plant Ecology and Diversity, 14, 1–12, https://doi.org/10.1080/17550874.2021.1961172, 2021.
Caretta, M. A., Mukherji, A., Arfanuzzaman, M., Betts, R. A., Gelfan, A., Hirabayashi, Y., Lissner, T. K., Liu, J., Lopez Gunn, E., Morgan, R., Mwanga, S., and Supratid, S.: Water, in: Climate Change 2022: Impacts, Adaptation and Vulnerability, Contribution of Working Group II to the Sixth Assessment Report of the Intergovernmental Panel on Climate Change, edited by: Pörtner, H.-O., Roberts, D. C., Tignor, M., Poloczanska, E. S., Mintenbeck, K., Alegría, A., Craig, M., Langsdorf, S., Löschke, S., Möller, V., Okem, A., and Rama, B., Cambridge University Press, Cambridge, UK and New York, NY, USA, 551–712, https://doi.org/10.1017/9781009325844.006, 2022.
Cavin, L., Mountford, E. P., Peterken, G. F., and Jump, A. S.: Extreme drought alters competitive dominance within and between tree species in a mixed forest stand, Funct. Ecol., 27, 1424–1435, https://doi.org/10.1111/1365-2435.12126, 2013.
Choat, B., Brodribb, T. J., Brodersen, C. R., Duursma, R. A., López, R., and Medlyn, B. E.: Triggers of tree mortality under drought, Nature, 558, 531–539, https://doi.org/10.1038/s41586-018-0240-x, 2018.
Davi, H. and Cailleret, M.: Assessing drought-driven mortality trees with physiological process-based models, Agr. Forest Meteorol., 232, 279–290, https://doi.org/10.1016/j.agrformet.2016.08.019, 2017.
Dobbertin, M., Mayer, P., Wohlgemuth, T., Feldmeyer-Christe, E., Graf, U., Zimmermann, N. E., and Rigling, A.: The decline of Pinus sylvestris L. forests in the Swiss Rhone valley – a result of drought stress?, Phyton. Annales Rei Botanicae, 45, 153–156, 2005.
Fensham, R. J., Fraser, J., MacDermott, H. J., and Firn, J.: Dominant tree species are at risk from exaggerated drought under climate change, Glob. Change Biol., 21, 3777–3785, https://doi.org/10.1111/gcb.12981, 2015.
Fischer, R., Anders, T., Bugmann, H., Djahangard, M., Dreßler, G., Hetzer, J., Hickler, T., Hiltner, U., Marano, G., and Sperlich, D.: Perspectives for forest modeling to improve the representation of drought-related tree mortality, J. Cult. Plants/J. Kulturpflanz., 77, https://doi.org/10.5073/JfK.2025.02.05, 2025.
Forest Ecology, ETH Zürich: ForClim documentation, version 4.0, Institute of Terrestrial Ecosystems, ETH Zürich, https://ites-fe.ethz.ch/openaccess/products/forclim (last access: 30 January 2026), 2019.
FOREST EUROPE and FAO: State of Europe's forests 2020, FOREST EUROPE Liaison Unit Bratislava and Food and Agriculture Organization of the United Nations, Bratislava, https://foresteurope.org/wp-content/uploads/2016/08/SoEF_2020.pdf (last access: 30 January 2026), 2020.
Gazol, A. and Camarero, J. J.: Compound climate events increase tree drought mortality across European forests, Sci. Total Environ., 816, 151604, https://doi.org/10.1016/j.scitotenv.2021.151604, 2022.
Gazol, A., Camarero, J. J., Jiménez, J. J., Moret-Fernández, D., López, M. V., Sangüesa-Barreda, G., and Igual, J. M.: Beneath the canopy: Linking drought-induced forest die off and changes in soil properties, Forest Ecol. Manag., 422, 294–302, https://doi.org/10.1016/j.foreco.2018.04.028, 2018.
George, J. P., Bürkner, P. C., Sanders, T. G. M., Neumann, M., Cammalleri, C., Vogt, J. V., and Lang, M.: Long-term forest monitoring reveals constant mortality rise in European forests, Plant Biology, 24, 1108–1119, https://doi.org/10.1111/plb.13469, 2022.
Gessler, A., Bächli, L., Rouholahnejad Freund, E., Treydte, K., Schaub, M., Haeni, M., Weiler, M., Seeger, S., Marshall, J., Hug, C., Zweifel, R., Hagedorn, F., Rigling, A., Saurer, M., and Meusburger, K.: Drought reduces water uptake in beech from the drying topsoil, but no compensatory uptake occurs from deeper soil layers, New Phytol., 233, 194–206, https://doi.org/10.1111/nph.17767, 2022.
Gessler, A., Wilhelm, M., Brun, P., Zimmermann, N., and Rigling, A.: Zurück in die Zukunft – Ein neuer Blick auf die Perspektiven für die Buche nach 20 Jahren Forschung und weiter fortschreitendem Klimawandel, Allgemeine Forst- und Jagdzeitung, 193, 224, https://doi.org/10.23765/afjz000101, 2024.
Griesbauer, H., DeLong, S. C., Rogers, B., and Foord, V.: Growth sensitivity to climate varies with soil moisture regime in spruce–fir forests in central British Columbia, Trees – Structure and Function, https://doi.org/10.1007/s00468-020-02066-8, 2021.
Hartmann, H., Moura, C. F., Anderegg, W. R. L., Ruehr, N. K., Salmon, Y., Allen, C. D., Arndt, S. K., Breshears, D. D., Davi, H., Galbraith, D., Ruthrof, K. X., Wunder, J., Adams, H. D., Bloemen, J., Cailleret, M., Cobb, R., Gessler, A., Grams, T. E. E., Jansen, S., Kautz, M., Lloret, F., and O'Brien, M.: Research frontiers for improving our understanding of drought-induced tree and forest mortality, New Phytol., 218, 15–28, https://doi.org/10.1111/nph.15048, 2018.
Henne, P. D., Elkin, C. M., Reineking, B., Bugmann, H., and Tinner, W.: Did soil development limit spruce (Picea abies) expansion in the Central Alps during the Holocene? Testing a palaeobotanical hypothesis with a dynamic landscape model, J. Biogeogr., 38, 933–949, https://doi.org/10.1111/j.1365-2699.2010.02460.x, 2011.
Hlásny, T., König, L., Krokene, P., Lindner, M., Montagné-Huck, C., Müller, J., Qin, H., Raffa, K. F., Schelhaas, M.-J., Svoboda, M., Viiri, H., and Seidl, R.: Bark Beetle Outbreaks in Europe: State of Knowledge and Ways Forward for Management, Current Forestry Reports, 7, 138–165, https://doi.org/10.1007/s40725-021-00142-x, 2021.
Huber, N., Bugmann, H., and Lafond, V.: Capturing ecological processes in dynamic forest models: why there is no silver bullet to cope with complexity, Ecosphere, 11, e03109, https://doi.org/10.1002/ecs2.3109, 2020.
Hunziker, S., Begert, M., Scherrer, S. C., Rigling, A., and Gessler, A.: Below Average Midsummer to Early Autumn Precipitation Evolved Into the Main Driver of Sudden Scots Pine Vitality Decline in the Swiss Rhône Valley, Front. For. Glob. Change, 5, 874100, https://doi.org/10.3389/ffgc.2022.874100, 2022.
Jakoby, O., Lischke, H., and Wermelinger, B.: Climate change alters elevational phenology patterns of the European spruce bark beetle (Ips typographus), Glob. Change Biol., 25, 4048–4063, https://doi.org/10.1111/gcb.14766, 2019.
Kaspar, F., Kratzenstein, F., and Kaiser-Weiss, A. K.: Interactive open access to climate observations from Germany, Adv. Sci. Res., 16, 75–83, https://doi.org/10.5194/asr-16-75-2019, 2019.
Kasper, J., Leuschner, C., Walentowski, H., Petritan, A. M., and Weigel, R.: Winners and losers of climate warming: Declining growth in Fagus and Tilia vs. stable growth in three Quercus species in the natural beech – oak forest ecotone (western Romania), Forest Ecol. Manag., 506, 119892, https://doi.org/10.1016/j.foreco.2021.119892, 2022.
Kirchen, G., Calvaruso, C., Granier, A., Redon, P.-O., Van Der Heijden, G., Bréda, N., and Turpault, M.-P.: Local soil type variability controls the water budget and stand productivity in a beech forest, Forest Ecol. Manag., 390, 89–103, https://doi.org/10.1016/j.foreco.2016.12.024, 2017.
Klesse, S., Wohlgemuth, T., Meusburger, K., Vitasse, Y., von Arx, G., Lévesque, M., Neycken, A., Braun, S., Dubach, V., Gessler, A., Ginzler, C., Gossner, M. M., Hagedorn, F., Queloz, V., Samblás Vives, E., Rigling, A., and Frei, E. R.: Long-term soil water limitation and previous tree vigor drive local variability of drought-induced crown dieback in Fagus sylvatica, Sci. Total Environ., 851, https://doi.org/10.1016/j.scitotenv.2022.157926, 2022.
Knapp, N., Wellbrock, N., Bielefeldt, J., Dühnelt, P., Hentschel, R., and Bolte, A.: From single trees to country-wide maps: Modeling mortality rates in Germany based on the Crown Condition Survey, Forest Ecol. Manag., 568, 122081, https://doi.org/10.1016/j.foreco.2024.122081, 2024.
Kolus, H. R., Huntzinger, D. N., Schwalm, C. R., Fisher, J. B., McKay, N., Fang, Y., Michalak, A. M., Schaefer, K., Wei, Y., Poulter, B., Mao, J., Parazoo, N. C., and Shi, X.: Land carbon models underestimate the severity and duration of drought's impact on plant productivity, Sci. Rep.-UK, 9, 2758, https://doi.org/10.1038/s41598-019-39373-1, 2019.
Koster, R. D., Guo, Z., Yang, R., Dirmeyer, P. A., Mitchell, K., and Puma, M. J.: On the Nature of Soil Moisture in Land Surface Models, J. Climate, 22, 4322–4335, https://doi.org/10.1175/2009JCLI2832.1, 2009.
Lagergren, F. and Lindroth, A.: Transpiration response to soil moisture in pine and spruce trees in Sweden, Agr. Forest Meteorol., 112, 67–85, https://doi.org/10.1016/S0168-1923(02)00060-6, 2002.
Langer, G. J. and Bußkamp, J.: Vitality loss of beech: a serious threat to Fagus sylvatica in Germany in the context of global warming, J. Plant Dis. Prot., 130, 1101–1115, https://doi.org/10.1007/s41348-023-00743-7, 2023.
Liu, Q., Peng, C., Schneider, R., Cyr, D., Liu, Z., Zhou, X., and Kneeshaw, D.: TRIPLEX-Mortality model for simulating drought-induced tree mortality in boreal forests: Model development and evaluation, Ecol. Model., 455, 109652, https://doi.org/10.1016/j.ecolmodel.2021.109652, 2021.
Manion, P. D.: Tree disease concepts, Prentice-Hall, Inc., ISBN 13.978-0139294235, 1981.
Marano, G. and Bugmann, H.: Code and simulation settings underlying: Simulating the recent drought-induced mortality of European beech (Fagus sylvatica L.) and Norway spruce (Picea abies L.) in German forests (Version 3), Zenodo [code], https://doi.org/10.5281/zenodo.17977101, 2025.
Marano, G., Hiltner, U., Meusburger, K., Hands, T., and Bugmann, H.: Predicting drought-induced tree mortality in Swiss beech forests hinges upon predisposing and inciting factors, bioRxiv [preprint], https://doi.org/10.64898/2025.12.15.694299, 2025.
Martinez del Castillo, E., Zang, C. S., Buras, A., Hacket-Pain, A., Esper, J., Serrano-Notivoli, R., Hartl, C., Weigel, R., Klesse, S., Resco de Dios, V., Scharnweber, T., Dorado-Liñán, I., van der Maaten-Theunissen, M., van der Maaten, E., Jump, A., Mikac, S., Banzragch, B. E., Beck, W., Cavin, L., Claessens, H., Èada, V., Èufar, K., Dulamsuren, C., Grièar, J., Gil-Pelegrín, E., Janda, P., Kazimirovic, M., Kreyling, J., Latte, N., Leuschner, C., Longares, L. A., Menzel, A., Merela, M., Motta, R., Muffler, L., Nola, P., Petritan, A. M., Petritan, I. C., Prislan, P., Rubio-Cuadrado, Á., Rydval, M., Stajiæ, B., Svoboda, M., Toromani, E., Trotsiuk, V., Wilmking, M., Zlatanov, T., and de Luis, M.: Climate-change-driven growth decline of European beech forests, Communications Biology, 5, https://doi.org/10.1038/s42003-022-03107-3, 2022.
McDowell, N., Pockman, W., Allen, C. D., Breshears, D., Cobb, N., Kolb, T., Plaut, J. A., Sperry, J., West, A., Williams, D. G., and Yepez, E. A.: Mechanisms of plant survival and mortality during drought: why do some plants survive while others succumb to drought?, New Phytol., 178, 719–739, https://doi.org/10.1111/j.1469-8137.2008.02436.x, 2008.
McDowell, N., Beerling, D., Breshears, D., Fisher, R., Raffa, K., and Stitt, M.: The interdependence of mechanisms underlying climate-driven vegetation mortality, Trends Ecol. Evol., 26, 523–532, https://doi.org/10.1016/j.tree.2011.06.003, 2011.
McDowell, N. G.: Mechanisms linking drought, hydraulics, carbon metabolism, and vegetation mortality, Plant Physiol., 155, 1051–1059, https://doi.org/10.1104/pp.110.170704, 2011.
McDowell, N. G., Fisher, R. A., Xu, C., Domec, J. C., Hölttä, T., Mackay, D. S., Sperry, J. S., Boutz, A., Dickman, L., Gehres, N., Limousin, J. M., Macalady, A., Martínez-Vilalta, J., Mencuccini, M., Plaut, J. A., Ogée, J., Pangle, R. E., Rasse, D. P., Ryan, M. G., Sevanto, S., Waring, R. H., Williams, A. P., Yepez, E. A., and Pockman, W. T.: Evaluating theories of drought-induced vegetation mortality using a multimodel–experiment framework, New Phytol., 200, 304–321, https://doi.org/10.1111/nph.12465, 2013.
Meinel, G. (Ed.): Flächennutzungsmonitoring. 7: Boden – Flächenmanagement – Analysen und Szenarien, edited by: Meinel, G., Schumacher, U., Behnisch, M., and Krüger, T., Leibniz-Institut für ökologische Raumentwicklung (IÖR), Rhombos-Verlag, Berlin, 1 pp., ISBN 978-3-944101-67-5, 2015.
Meir, P., Mencuccini, M., and Dewar, R. C.: Drought-related tree mortality: Addressing the gaps in understanding and prediction, New Phytol., 207, 28–33, https://doi.org/10.1111/nph.13382, 2015.
Mellert, K. H., Lenoir, J., Winter, S., Kölling, C., Èarni, A., Dorado-Liñán, I., Gégout, J. C., Göttlein, A., Hornstein, D., Jantsch, M., Juvan, N., Kolb, E., López-Senespleda, E., Menzel, A., Stojanoviæ, D., Täger, S., Tsiripidis, I., Wohlgemuth, T., and Ewald, J.: Soil water storage appears to compensate for climatic aridity at the xeric margin of European tree species distribution, Eur. J. Forest Res.-Jpn., 137, 79–92, https://doi.org/10.1007/s10342-017-1092-x, 2018.
Meusburger, K., Trotsiuk, V., Schmidt-Walter, P., Baltensweiler, A., Brun, P., Bernhard, F., Gharun, M., Habel, R., Hagedorn, F., Köchli, R., Psomas, A., Puhlmann, H., Thimonier, A., Waldner, P., Zimmermann, S., and Walthert, L.: Soil–plant interactions modulated water availability of Swiss forests during the 2015 and 2018 droughts, Glob. Change Biol., 28, 5928–5944, https://doi.org/10.1111/gcb.16332, 2022.
Meyer, P., Spînu, A. P., Mölder, A., and Bauhus, J.: Management alters drought-induced mortality patterns in European beech (Fagus sylvatica L.) forests, Plant Biol. J., 24, 1157–1170, https://doi.org/10.1111/plb.13396, 2022.
Mosig, C., Vajna-Jehle, J., Mahecha, M. D., Cheng, Y., Hartmann, H., Montero, D., Junttila, S., Horion, S., Schwenke, M. B., Koontz, M. J., Maulud, K. N. A., Adu-Bredu, S., Al-Halbouni, D., Ali, M., Allen, M., Altman, J., Amorós, L., Angiolini, C., Astrup, R., Awada, H., Barrasso, C., Bartholomeus, H., Beck, P. S. A., Bozzini, A., Braun-Wimmer, J., Brede, B., Breunig, F. M., Brugnaro, S., Buras, A., Burchard-Levine, V., Camarero, J. J., Candotti, A., Capuder, L., Carrieri, E., Centritto, M., Chirici, G., Cloutier, M., Conciani, D., Cushman, K. C., Dalling, J. W., Dao, P. D., Dempewolf, J., Denter, M., Dogotari, M., Díaz-Delgado, R., Ecke, S., Eichel, J., Eltner, A., Fabbri, A., Fabi, M., Fassnacht, F., Ferreira, M. P., Fischer, F. J., Frey, J., Frick, A., Fuentes, J., Ganz, S., Garbarino, M., García, M., Gassilloud, M., Gazol, A., Gea-Izquierdo, G., Gerberding, K., Ghasemi, M., Giannetti, F., Gillan, J., Gonzalez, R., Gosper, C., Greene, T., Greinwald, K., Grieve, S., Große-Stoltenberg, A., Gutierrez, J. A., Göritz, A., Hajek, P., Hedding, D., Hempel, J., Heremans, S., Hernández, M., Heurich, M., Honkavaara, E., Höfle, B., Jackisch, R., Jucker, T., Kalwij, J. M., Kepfer-Rojas, S., Khatri-Chhetri, P., Kleinebecker, T., Klemmt, H.-J., Kloček, T., Koivumäki, N., Kolagani, N., Komárek, J., Korznikov, K., Kraszewski, B., Kruse, S., Krüger, R., Kuechly, H., Kwong, I. H. Y., Laliberté, E., Langan, L., Latifi, H., Leal-Medina, C., Lehmann, J. R. K., Li, L., Lines, E., Lisiewicz, M., Lopatin, J., Lucieer, A., Ludwig, A., Ludwig, M., Lyytikäinen-Saarenmaa, P., Ma, Q., Mansuy, N., Peña, J. M., Marino, G., Maroschek, M., Martín, M. P., Martín-Benito, D., Matham, P., Mazzoni, S., Meloni, F., Menzel, A., Meyer, H., Miraki, M., Moreno, G., Moreno-Fernández, D., Muller-Landau, H. C., Mälicke, M., Möhring, J., Müllerova, J., Naidu, S. S., Nardi, D., Neumeier, P., Nita, M. D., Näsi, R., Oppgenoorth, L., Orunbaev, S., Palmer, M., Paul, T., Pfenning, M., Potts, A., Prasanna, G. L., Prober, S., Puliti, S., Pérez-Luque, A. J., Pérez-Priego, O., Reudenbach, C., Revuelto, J., Rivas-Torres, G., Roberge, P., Roggero, P. P., Rossi, C., Ruehr, N. K., Ruiz-Benito, P., Runge, C. M., Satta, G. G. A., Scanu, B., Scherer-Lorenzen, M., Schiefer, F., Schiller, C., Schladebach, J., Schmehl, M.-T., Schmid, J., Schmidt, T. A., Schwarz, S., Seidl, R., Seifert, T., Barba, A. S., Shafeian, E., Shapiro, A., de Simone, L., Sohrabi, H., Soltani, S., Sotomayor, L., Sparrow, B., Steer, B. S. C., Stenson, M., Stöckigt, B., Su, Y., Suomalainen, J., Tamudo, E., Barbieri, M. J. T., Tomelleri, E., Torresani, M., Trepekli, K., Ullah, S., Ullah, S., Umlauft, J., Vargas-Ramírez, N., Vatandaslar, C., Visacki, V., Volpi, M., Vásquez, V., Wallis, C., Weinstein, B., Weiser, H., Wich, S., Ximena, T. C., Zarco-Tejada, P. J., Zdunic, K., Zielewska-Büttner, K., de Oliveira, R. A., van Wagtendonk, L., von Dosky, V., and Kattenborn, T.: deadtrees.earth – An open-access and interactive database for centimeter-scale aerial imagery to uncover global tree mortality dynamics, Remote Sens. Environ., 332, https://doi.org/10.1016/j.rse.2025.115027, 2026.
Netherer, S., Panassiti, B., Pennerstorfer, J., and Matthews, B.: Acute Drought Is an Important Driver of Bark Beetle Infestation in Austrian Norway Spruce Stands, Frontiers in Forests and Global Change, 2, https://doi.org/10.3389/ffgc.2019.00039, 2019.
Neycken, A., Scheggia, M., Bigler, C., and Lévesque, M.: Long-term growth decline precedes sudden crown dieback of European beech, Agr. Forest Meteorol., 324, https://doi.org/10.1016/j.agrformet.2022.109103, 2022.
Pichler, V., Ïurkoviè, J., Capuliak, M., and Pichlerová, M.: Altitudinal variability of the soil water content in natural and managed beech (Fagus sylvatica L.) forests, Polish J. Ecol., 57, 313–319, 2009.
Rigling, A. and Cherubini, P.: Wieso sterben die Waldföhren im “TeIwald” bei Visp? Eine Zusammenfassung bisheriger Studien und eine dendroökologische Untersuchung | What is the Cause of the High Mortality Rates of the Scots Pines in the “Telwald” near Visp (Switzerland)? A Summary of Previous Studies and a Dendroecological Study, Schweizerische Zeitschrift für Forstwesen, 150, 113–131, https://doi.org/10.3188/szf.1999.0113, 1999.
Ripullone, F., Camarero, J. J., Colangelo, M., and Voltas, J.: Variation in the access to deep soil water pools explains tree-to-tree differences in drought-triggered dieback of mediterranean oaks, Tree Physiol., 40, 591–604, https://doi.org/10.1093/treephys/tpaa026, 2020.
Sala, A., Piper, F., and Hoch, G.: Physiological mechanisms of drought-induced tree mortality are far from being resolved, New Phytol., 186, 274–281, https://doi.org/10.1111/j.1469-8137.2009.03167.x, 2010.
Schiefer, F., Schmidtlein, S., Frick, A., Frey, J., Klinke, R., Zielewska-Büttner, K., Junttila, S., Uhl, A., and Kattenborn, T.: UAV-based reference data for the prediction of fractional cover of standing deadwood from Sentinel time series, ISPRS Open Journal of Photogrammetry and Remote Sensing, 8, 100034, https://doi.org/10.1016/j.ophoto.2023.100034, 2023.
Schiefer, F., Schmidtlein, S., Hartmann, H., Schnabel, F., and Kattenborn, T.: Large-scale remote sensing reveals that tree mortality in Germany appears to be greater than previously expected, Forestry: An International Journal of Forest Research, cpae062, https://doi.org/10.1093/forestry/cpae062, 2024.
Schuldt, B., Buras, A., Arend, M., Vitasse, Y., Beierkuhnlein, C., Damm, A., Gharun, M., Grams, T. E. E., Hauck, M., Hajek, P., Hartmann, H., Hiltbrunner, E., Hoch, G., Holloway-Phillips, M., Körner, C., Larysch, E., Lübbe, T., Nelson, D. B., Rammig, A., Rigling, A., Rose, L., Ruehr, N. K., Schumann, K., Weiser, F., Werner, C., Wohlgemuth, T., Zang, C. S., and Kahmen, A.: A first assessment of the impact of the extreme 2018 summer drought on Central European forests, Basic Appl. Ecol., 45, 86–103, https://doi.org/10.1016/j.baae.2020.04.003, 2020.
Seidl, R. and Rammer, W.: Climate change amplifies the interactions between wind and bark beetle disturbances in forest landscapes, Landscape Ecology, 32, 1485–1498, https://doi.org/10.1007/s10980-016-0396-4, 2017.
Seidl, R., Rammer, W., Jäger, D., and Lexer, M. J.: Impact of bark beetle (Ips typographus L.) disturbance on timber production and carbon sequestration in different management strategies under climate change, Forest Ecol. Manag., 256, 209–220, https://doi.org/10.1016/j.foreco.2008.04.002, 2008.
Spiecker, H. and Kahle, H.: Climate-driven tree growth and mortality in the Black Forest, Germany – Long-term observations, Glob. Change Biol., 29, 5908–5923, https://doi.org/10.1111/gcb.16897, 2023.
Thonfeld, F., Gessner, U., Holzwarth, S., Kriese, J., Da Ponte, E., Huth, J., and Kuenzer, C.: A First Assessment of Canopy Cover Loss in Germany's Forests after the 2018–2020 Drought Years, Remote Sensing, 14, 562, https://doi.org/10.3390/rs14030562, 2022.
Trugman, A. T.: Integrating plant physiology and community ecology across scales through trait-based models to predict drought mortality, New Phytol., 234, 21–27, https://doi.org/10.1111/nph.17821, 2022.
Trugman, A. T., Medvigy, D., Mankin, J. S., and Anderegg, W. R. L.: Soil Moisture Stress as a Major Driver of Carbon Cycle Uncertainty, Geophys. Res. Lett., 45, 6495–6503, https://doi.org/10.1029/2018GL078131, 2018.
Trugman, A. T., Anderegg, L. D. L., Anderegg, W. R. L., Das, A. J., and Stephenson, N. L.: Why is Tree Drought Mortality so Hard to Predict?, Trends Ecol. Evol., 36, 520–532, https://doi.org/10.1016/j.tree.2021.02.001, 2021.
Ukkola, A. M., De Kauwe, M. G., Pitman, A. J., Best, M. J., Abramowitz, G., Haverd, V., Decker, M., and Haughton, N.: Land surface models systematically overestimate the intensity, duration and magnitude of seasonal-scale evaporative droughts, Environ. Res. Lett., 11, 104012, https://doi.org/10.1088/1748-9326/11/10/104012, 2016.
Ulrich, D. E. M. and Grossiord, C.: Faster drought recovery in anisohydric beech compared with isohydric spruce, Tree Physiol., 43, 517–521, https://doi.org/10.1093/treephys/tpad009, 2023.
Vitali, V., Büntgen, U., and Bauhus, J.: Silver fir and Douglas fir are more tolerant to extreme droughts than Norway spruce in south-western Germany, Glob. Change Biol., 23, 5108–5119, https://doi.org/10.1111/gcb.13774, 2017.
Walthert, L. and Meier, E. S.: Tree species distribution in temperate forests is more influenced by soil than by climate, Ecology and Evolution, 7, 9473–9484, https://doi.org/10.1002/ece3.3436, 2017.
Walthert, L., Ganthaler, A., Mayr, S., Saurer, M., Waldner, P., Walser, M., Zweifel, R., and von Arx, G.: From the comfort zone to crown dieback: Sequence of physiological stress thresholds in mature European beech trees across progressive drought, Sci. Total Environ., 753, https://doi.org/10.1016/j.scitotenv.2020.141792, 2021.
Wellbrock, N., Eickenscheidt, N., Hilbrig, L., Dühnelt, P., Holzhausen, M., Bauer, A., Dammann, I., Strich, S., Engels, F., and Wauer, A: Leitfaden und Dokumentation zur Waldzustandserhebung in Deutschland, Johann Heinrich von Thünen-Institut, Thünen Working Paper, Braunschweig, https://doi.org/10.3220/WP1513589598000, 2018.
Wickham, H., Averick, M., Bryan, J., Chang, W., McGowan, L., François, R., Grolemund, G., Hayes, A., Henry, L., Hester, J., Kuhn, M., Pedersen, T., Miller, E., Bache, S., Müller, K., Ooms, J., Robinson, D., Seidel, D., Spinu, V., Takahashi, K., Vaughan, D., Wilke, C., Woo, K., and Yutani, H.: Welcome to the tidyverse, J. Open Source Softw., 4, 1686, https://doi.org/10.21105/joss.01686, 2019.
Yao, Y., Joetzjer, E., Ciais, P., Viovy, N., Cresto Aleina, F., Chave, J., Sack, L., Bartlett, M., Meir, P., Fisher, R., and Luyssaert, S.: Forest fluxes and mortality response to drought: model description (ORCHIDEE-CAN-NHA r7236) and evaluation at the Caxiuanã drought experiment, Geosci. Model Dev., 15, 7809–7833, https://doi.org/10.5194/gmd-15-7809-2022, 2022.
Zhang, L., Gao, J., Tang, Z., and Jiao, K.: Quantifying the ecosystem vulnerability to drought based on data integration and processes coupling Information on the coauthors, Agr. Forest Meteorol., 301–302, 108354–108354, https://doi.org/10.1016/j.agrformet.2021.108354, 2021.