
the Creative Commons Attribution 4.0 License.
the Creative Commons Attribution 4.0 License.
 | 26 Oct 2026
Stratospheric aerosol forcing for CMIP7 – Part 2: Volcanic sulfur dioxide emissions
Thomas J. Aubry

Michael Sigl
Matthew Toohey
Man Mei Chim
Magali Verkerk
Anja Schmidt
Simon A. Carn
Explosive volcanic sulfur emissions into the stratosphere form sulfate aerosol particles which are an important driver of climate variability. Volcanic sulfur emissions are required both by climate models using interactive stratospheric aerosol schemes, as well as simpler volcanic aerosol models typically used to provide stratospheric aerosol optical properties for climate models which cannot simulate stratospheric aerosols interactively from precursor emissions. Here we present an upper-tropospheric and stratospheric volcanic sulfur emission inventory covering the period 1750 to 2023, made for phase 7 of the Coupled Model Intercomparison Project (CMIP7). CMIP7 stratospheric aerosol optical properties, presented in a companion paper, are directly derived from this emission inventory for the 1750–1978 pre-satellite period. For the satellite era, the emission inventory is primarily derived from satellite observations. For the pre-satellite period, the inventory is derived from a bipolar ice-core dataset, which captures well eruptions injecting on the order of 10 Tg SO2 or more, complemented by a high-resolution Greenland ice-core and the geological record, which support the inclusion of eruptions injecting on the order of 0.1–1 Tg SO2. We use satellite-era eruptions and older eruptions confidently matched to sulfate deposition records in ice-cores to derive empirical relationships to attribute injection height from SO2 mass and injection latitude from polar deposition asymmetry when these parameters are missing. The final CMIP7 emission inventory includes 463 explosive eruptions injecting a total of 428.2 Tg SO2 into the upper troposphere-stratosphere over 1750–2023, corresponding to a mean flux of 1.56 Tg SO2 yr−1. For the pre-satellite era, around 25 % of CMIP7 volcanic sulfur emissions originate from small-to-moderate magnitude eruptions, defined here as injecting ≤3 Tg SO2, which are not captured in many available ice core arrays. Comparing the CMIP7 inventory with other inventories available for specific time periods, we highlight the large uncertainties characterizing volcanic emissions over the historical period. However, we show that CMIP7 is less biased in terms of the frequency-magnitude distribution of small-to-moderate magnitude eruptions which are largely underestimated in other pre-satellite era inventories. Although the long-term mean emissions associated with these eruptions is consistent with the satellite era in CMIP7, we show that their frequency-magnitude distribution likely remains biased with a lack of small-magnitude eruptions injecting on the order of 0.1 Tg SO2, and potentially too many moderate-magnitude eruptions injecting on the order of 1 Tg SO2. We discuss other key sources of uncertainties and directions for improvements for the dataset, including the addition of non-sulfur and non-volcanic stratospheric aerosol precursors, as well as needs for operationalizing the dataset production. To support consistent implementation of the dataset in stratospheric aerosol models, we also provide recommendations for the temporal, horizontal, and vertical distribution of emissions associated with each eruption. Modelling groups using the dataset should document in detail any deviation from provided parameter values and recommended emission implementation.
- Article
(4665 KB) - Full-text XML
- Companion paper
- BibTeX
- EndNote


Stratospheric aerosols, which are mostly formed from explosive volcanic sulfur emissions into the upper atmosphere (Kremser et al., 2016) are one of the most important natural drivers of climate variability (e.g. Sigl et al., 2015). Most climate models require direct prescription of aerosol optical properties to represent stratospheric aerosol forcing. Consequently, for the Assessment Fast Track (AFT) of Phase 7 of the Coupled Model Intercomparison Project (CMIP7), delivering benchmark climate model simulations for the climate community, a stratospheric aerosol optical properties dataset was provided. This dataset is documented in Aubry et al. (2026a) and compared to independent datasets in Chim et al. (2026), with both papers being companion papers in the same special issue. However, in addition to this dataset, we decided to provide an upper tropospheric-stratospheric volcanic sulfur emission dataset for two primary reasons:
-
We have very limited direct constraints on stratospheric aerosol optical properties before the satellite era. In contrast, ice-cores provide us with relatively direct constraints on the amount of stratospheric volcanic sulfur emitted by past eruptions. Consequently, the aerosol optical property dataset provided in the companion paper is emission-derived before the satellite era. Figure 1 gives an overview of both our emission and aerosol optical property datasets produced, and their interdependence.
-
An increasing number of models interactively simulate stratospheric aerosol from precursor emissions (e.g. Clyne et al., 2021; Quaglia et al., 2023). These models integrate our understanding of aerosol and atmospheric processes allowing us to explore key controls on volcanic radiative forcing (e.g. Marshall et al., 2022), assess potential solar radiation modification through stratospheric aerosol injection (e.g. Visioni et al., 2021), and predict the impacts of increasingly intense wildfire and associated pyrocumulonimbus on stratospheric composition and Earth's radiative balance (e.g. Yu et al., 2023).
Since 1979, volcanic sulfur emissions into the stratosphere have been quantified by satellites using various ultraviolet (UV) and infrared (IR) sensors (e.g. Carn et al., 2016). Before 1979, i.e. pre-satellite era, volcanic stratospheric sulfur emissions are most commonly estimated using ice cores from the polar ice sheets in both hemispheres (e.g. Gao et al., 2008; Crowley and Unterman, 2013; Toohey and Sigl, 2017). IVI2 (Gao et al., 2008) and Sigl et al. (2014, 2015), used in eVolv2k (Toohey and Sigl, 2017), use stacked ice-core records of sulfate from Greenland and Antarctica to constrain volcanic sulfur emissions. While detection, quantification and calibration methods broadly agree between these different datasets (see Gao et al., 2007; Sigl et al., 2014 for details), IVI2 is based on more ice cores in Greenland whereas Sigl et al. (2015) is based on a more comprehensive well synchronized array from Antarctica, including many new ice cores analyzed in high time resolution using state-of-the art analytical methods (Sigl et al., 2013; Fang et al., 2023). Note that Crowley and Unterman (2013) also provided a reconstruction of volcanic forcing largely sharing ice-core records with IVI2, which generally are in good agreement with IVI2 and evolv2k (Sigl et al., 2014; Toohey and Sigl, 2017). Unlike these ice-core inventories which stop in the 20th century, the VolcanEESM inventory (Neely and Schmidt, 2016) combines information from ice-core, satellite and geological records and covers the 850–2016 period. VolcanEESM was applied to run CMIP6-era historical simulations in climate models with an interactive stratospheric aerosol component (Danabasoglu et al., 2020; Davis et al., 2023). However, no detailed documentation of the dataset exists, and it has not been extended to 2021.
The CMIP7 emssion dataset builds on the latest products and scientific advances from the ice core, remote sensing and volcanology communities to deliver a consistent emission inventory covering 1750–2023, including the CMIP7 historical period (1850–2021, Dunne et al., 2025). One of our priorities in building this dataset is to minimize biases in the representation of small-to-moderate magnitude eruptions (defined here as injecting ≤3 Tg SO2), whose forcing was likely strongly underestimated before the satellite era in CMIP6 (Chim et al., 2023; Aubry et al., 2026a). Such bias in turn affects pre-industrial and scenario simulations (Chim et al., 2023, 2025) because for both CMIP6 and CMIP7, the stratospheric aerosol forcing in these simulations is a climatology derived from the average over the historical period. In CMIP6 (Luo, 2018), the underrepresentation of these eruptions was likely caused by the challenge of detecting them in sparse and highly uncertain pyrheliometer records of the optical thickness of the atmosphere (Aubry et al., 2026a). However, the emissions of small-to-moderate magnitude eruptions are also largely undetected in ice-core datasets (e.g. Aubry et al., 2016; Chim et al., 2023). To produce the CMIP7 emission inventory for the pre-satellite era, we thus complemented existing ice-core datasets (Sigl et al., 2015; Toohey and Sigl, 2017) with a new high-resolution ice-core dataset (Fang et al., 2023) and added information from the geological record (Global Volcanism Program, 2025). Section 2 introduces the key source datasets used to produce the CMIP7 emission dataset. Section 3 explains how these datasets were merged, and Sect. 4 describes how missing parameters, e.g. unknown SO2 injection heights, were determined. Section 5 presents the full dataset and makes recommendations for implementation in aerosol forcing and climate models. Dataset uncertainties, opportunities for improvement, and production operationalization are discussed in Sect. 6.
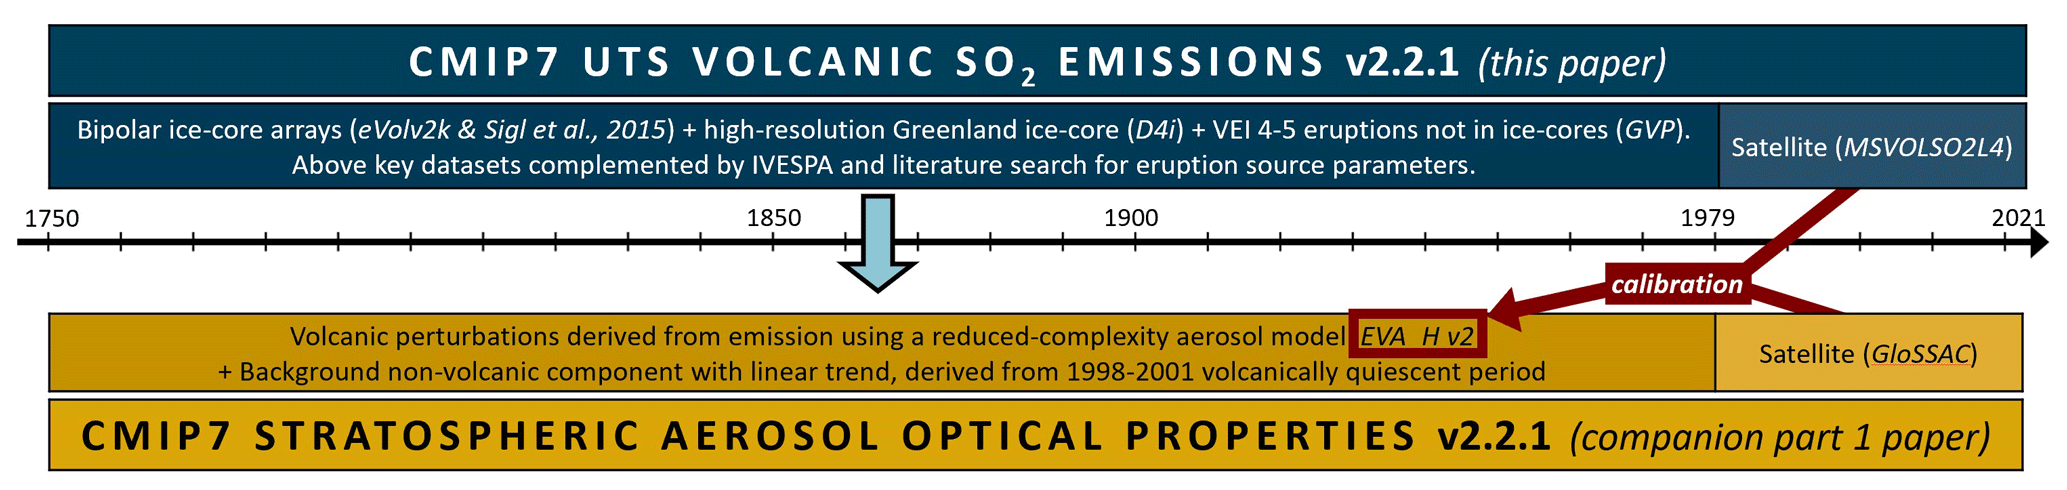
Figure 1Graphical depiction of the CMIP7 stratospheric aerosol forcing datasets, i.e. the upper tropospheric-stratospheric (UTS) volcanic SO2 emission dataset (documented in this paper) and the stratospheric aerosol optical property dataset (documented in Aubry et al., 2026a). Key source datasets for pre-satellite (1750–1978) and satellite (1979–2023) era emissions as well as satellite-era aerosol optical properties are indicated. Version 2 of the EVA_H volcanic aerosol model used to derive pre-satellite era aerosol optical properties is calibrated against satellite-era emission and optical property datasets.
2.1 MSVOLSO2L4 (satellite)
CMIP7 uses the Multi-Satellite Volcanic Sulfur Dioxide L4 Long-Term Global Database (MSVOLSO2L4; Carn, 2021), which is a comprehensive inventory of SO2 emissions by volcanic eruptions in the satellite era. In this context, the satellite era began at the onset of NASA's Nimbus-7 Total Ozone Mapping Spectrometer (TOMS) mission in October 1978, when daily UV satellite measurements of volcanic SO2 emissions first became available. Other satellite-based inventories exist (e.g. Carboni et al., 2016; Neely and Schmidt, 2016; Bingen et al., 2017; Schallock et al., 2023), but they do not cover the full satellite era (1978–present), and most of them are not extended as recent measurements become available. UV satellite observations are the primary source of SO2 data for MSVOLSOL4, beginning with the TOMS missions (1978–2005; e.g. Fisher et al., 2019) and followed by the Ozone Monitoring Instrument (OMI; 2004–present; e.g. Li et al., 2017), the Ozone Mapping and Profiler Suite (OMPS; 2011–present; e.g. Li et al., 2024), and the Tropospheric Monitoring Instrument (TROPOMI; 2017–present; e.g. Theys et al., 2021). IR satellite measurements of SO2 are also used for high-latitude volcanic eruptions during the winter months, when UV data are not available (e.g. Clarisse et al., 2012; Taylor et al., 2018). MSVOLSO2L4 provides an estimate of the SO2 mass loading and injection altitude for all eruptions that emit SO2 detectable by UV or IR satellites. Each entry includes the source volcano and location (latitude and longitude), the eruption date, and the Volcanic Explosivity Index (VEI; Newhall and Self, 1982). Eruptions are categorized as either “effusive” (where lava flow effusion is the dominant eruption style) or “explosive” (where injection of volcanic gas and ash clouds dominates). For each eruption, a single SO2 injection altitude is provided and labeled as either “observed” or “estimated”. Observed injection altitudes are derived from a variety of sources including direct UV or IR satellite retrievals of SO2 altitude, IR satellite measurements of cloud-top temperatures, volcanic ash advisories (VAAs), or aircraft pilot reports. In the absence of altitude observations (which is mainly an issue for older eruptions in the database) an estimated injection altitude is given, which by default is 5 km above the volcanic vent for effusive eruptions, and 10 km above the vent for explosive eruptions. Although SO2 emissions are distributed over a range of altitudes in most volcanic eruptions, the single injection altitude in MSVOLSOL4 attempts to capture the dominant level of SO2 injection (e.g., the umbrella cloud altitude for an explosive eruption).
Table 1Overview of the parameters provided by each of our source datasets, the period they cover, and the period for which they were used. For each column associated with a parameter, we either enter yes if the parameter is systematically provided, no if it is not provided, and commented in any other case.
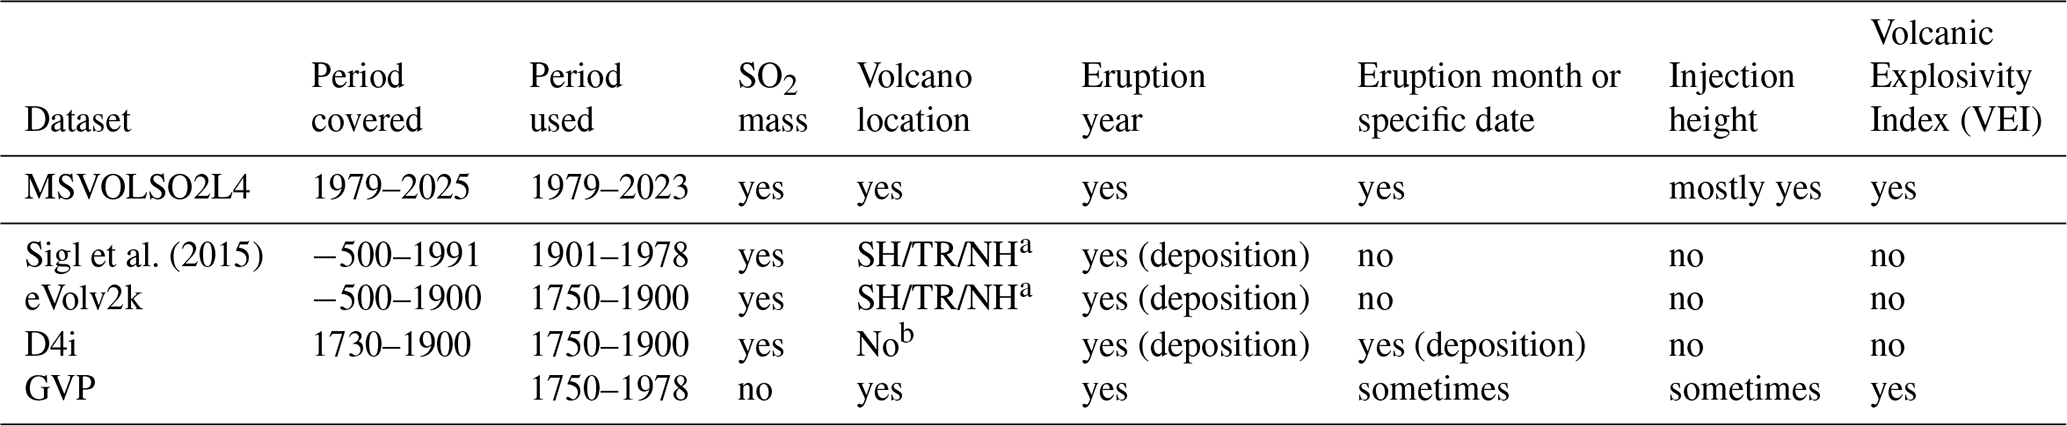
a Deposition asymmetry between Greenland and Antarctica provides constraint on whether the volcano was likely located in the extratropical Northern hemisphere (NH), tropics (TR) or extratropical Southern hemisphere (SH). b This dataset is purely based on a Greenland ice core, making it unplausible to detect extratropical Southern hemisphere eruptions.
Before implementation in CMIP7, the following pre-processing steps were applied:
-
We excluded effusive eruptions and explosive eruptions with a VEI strictly smaller than 3, as these eruptions were deemed to be unlikely to have resulted in upper-tropospheric or stratospheric injections.
-
We excluded any eruption for which the observed height above sea level (a.s.l.) is smaller than 5+5 exp(−()6) km (an arbitrary equation approximating mid-tropopsheric altitudes where λ is the eruption latitude), which ensures that we retain any eruptive plume that reached the mid-troposphere or above. We retain these eruptions because: (i) error on plume height measurement (typically 10 %–40 %, Aubry et al., 2021) means that plumes with estimated mid-upper tropospheric heights could have injected sulfur directly into the stratosphere; and (ii) stratosphere-troposphere exchange, e.g. driven by Monsoon systems (e.g. Bourassa et al., 2012), or self-lofting of volcanic clouds, e.g. driven by absorption of infrared radiation (e.g. Muser et al., 2020), could result in significant stratospheric injections even in cases where the initial sulfur is injected into the upper troposphere.
-
We considered any height labelled “estimated”, i.e. with a default value of 10 km above vent level (a.v.l.) for explosive eruptions, as missing. Section 4 details how we attributed them in such cases.
Although the latest version of MSVOLSO2L4 documents eruptions up to 2025, we used eruptions up to 2023 in version 2.2.1 of the CMIP7 emission inventory. We acknowledge that by considering upper tropospheric volcanic injections, some of the aerosol-chemistry-climate models might double-count some of the tropospheric volcanic sulfur emissions if tropospheric volcanic emissions are specified separately in climate models. However, the tropospheric injections associated with our dataset are in the order of 0.1 Tg SO2 yr−1 , two orders of magnitude smaller than total tropospheric volcanic sulfur emissions (order 20 Tg SO2 yr−1, e.g. Carn et al., 2017) which are dominated by passive volcanic degassing. This double-counting is thus negligible.
2.2 Sigl et al. (2015) (ice-core, bipolar)
Since the pioneering work introduced in the 1980s which used the content of sulfate in polar ice cores to reconstruct past volcanic activity and related changes of stratospheric aerosol burden (Hammer et al., 1980), several datasets have been compiled to quantify volcanic sulfate depositions across the polar ice sheets of Greenland and Antarctica (Crowley and Unterman, 2013; Gao et al., 2007; Robock and Free, 1995; Sigl et al., 2014). These ice-core arrays form the basis for reconstructions of stratospheric sulfur injections from volcanic eruptions back in time (Gao et al., 2008; Sigl et al., 2022; Toohey and Sigl, 2017). They include ice cores from sites of varying elevation and snow-accumulation rates, including different species (sulfate, sulfur), analyzed with different analytical instrumentation of varying precision. Site selection further dictates the susceptibility of the ice-core records towards postdepositional effects such as wind-drift, melting or diffusion and the relative importance of dry versus wet deposition of aerosols, all of which contribute to the overall uncertainty of the reconstruction (Gautier et al., 2016; Sigl et al., 2014) next to methodological choices regarding detection, quantification and calibration (Fuglestvedt et al., 2024; Gao et al., 2007; Toohey and Sigl, 2017).
Sigl et al. (2015) provided a chronological framework for ice-cores from Greenland and Antarctica based on annual-layer counting of multi-parameter high-resolution aerosol records from both polar ice sheets over the past 2500 years. Within the lattice of synchronized ice cores, a total of 283 volcanic eruption signals has been detected, 81 of which were detected simultaneously in both polar ice sheets, which has traditionally been interpreted as an indication of tropical volcanic eruptions. Between 1750 and 2010 CE, 38 volcanic eruptions have been detected in the ice-core records from NGRIP (Plummer et al., 2012), NEEM (Sigl et al., 2013) and within a multi-ice-core composite record across Antarctica (AVS-2k; Sigl et al., 2014) (Fig. 2). Pinatubo 1991 is the youngest detected eruption in the AVS-2k stack. With SO2 emissions from industrial emissions strongly increasing over the 20th century (Hoesly et al., 2018), estimates of volcanic sulfate depositions are highly uncertain for Greenland ice cores from 1920 onwards, including volcanic eruptions such as Agung (1963) and Pinatubo (1991) which coincide with the peak of anthropogenic sulfate pollution over Greenland (Sigl et al., 2018, 2013) (Fig. 2). In CMIP7, we used the lower-bound value (50 % of the best-estimate value) for volcanic sulfate deposition over Greenland for all eruptions (N=9) in the 20th century of the Sigl et al. (2015) dataset. This choice ensured more consistency between CMIP6 and CMIP7 aerosol optical properties for periods where pyrheliometer measurements are used in CMIP6.

Figure 2Equivalent sulfur concentrations from ice cores in Greenland and Antarctica between 1750 and 2010 used for reconstructions of volcanic activity and stratospheric sulfur injection. Triangles mark eruptions reconstructed by Sigl et al. (2015) (S15); Toohey and Sigl (2017) (T17, eVolv2k) and Fang et al., (2023) (F23, D4i). Source volcano and eruptions years are provided for major eruptions. Ice cores have been analysed for sulfur using inductively coupled plasma mass spectrometry or for sulfate using ion-chromatography (using the molar mass ratio of sulfate to sulfur of three for conversion). Annual mean concentrations are shown for all ice cores except for GISP2 analysed at bi-annual resolution (Zielinski, 1995). Details on ice-core sites and analytical setup can be found elsewhere (Plummer et al., 2012; Sigl et al., 2013, 2014).
2.3 eVolv2k (ice-core, bipolar)
The eVolv2k data product (Toohey and Sigl, 2017) includes estimates of the magnitudes and approximate source latitudes of major volcanic stratospheric sulfur injection from 500 BCE to 1900 CE. The products are based on ice cores from three sites in Greenland (NEEM, NGRIP and GISP2) and between 8 and 17 individual ice cores from Antarctica included in the AVS-2k composite over the Common Era (Sigl et al., 2014) (Fig. 2). Except for the addition of the GISP2 ice-core record (Zielinski, 1995) the underlying ice-core records are identical to those from Sigl et al. (2015).
For selected eruptions (14 between 1750–1900), emission locations and dates in eVolv2k were based on matching ice-core volcanic sulfate signals with historic eruptions included in the GVP database. Eruption dates for unidentified eruptions are based on ice-core chronologies for Greenland and Antarctica (Sigl et al., 2015) and represent the first year in which a sulfate anomaly was detected in the glacio-chemical records. Absolute age uncertainties in the ice-core records used in eVolv2k are believed to be on average better than ±2 years during the past 1500 years. Broad injection regions are estimated from the ice cores; signals occurring synchronously (given small possible dating uncertainties) in both Greenland and Antarctic composites are attributed to tropical (25° S–25° N) eruptions, while those with signals in only one hemisphere are assumed to be extratropical (90–25° S and 25–90° N) in origin. Stratospheric sulfate injections are estimated by linearly scaling the Greenland and Antarctic ice-sheet sulfate mass deposition (often referred to as “flux”) derived from the polar composites to hemispheric sulfur loadings, based on a technique pioneered by Gao et al. (2007). Uncertainties in VSSI are provided, based on both spread in the ice-core flux values and model-based estimates of the imperfect correlation between ice-sheet deposition and hemispheric loading (Toohey et al., 2013, see also Marshall et al., 2021; Fuglestvedt et al., 2024). For CMIP7, matches between ice-core sulfate deposition events and historical eruptions were all re-assessed (see Sect. 3). When specific eruptions date and latitude are provided in eVolv2k for events with a proposed match, we thus ignore these dates and latitudes and instead use the year and latitudinal band derived from ice cores in Toohey and Sigl (2017), before attribution to a historical eruption.
2.4 D4i (ice-core, Greenland)
With a snow accumulation rate of >40 cm yr−1 the D4 ice core from central Greenland provides high time-resolution information on past accumulation rates and atmospheric composition, including volcanic emissions and anthropogenic pollution between 1733 and 2002 CE (Banta and McConnell, 2007; McConnell and Edwards, 2008; McConnell et al., 2007). The ice core has been dated using multi-parameter annual-layer counting including hydrogen peroxide (H2O2) with minimum concentrations consistently occurring during midwinter with maximum dating uncertainties of ±1 year. A core segment of the core (D4i) was reanalyzed in 2014 at the Desert Research Institute to derive a timeseries of sulfur (and other impurity) concentrations with a nominal (i.e. assuming constant snow accumulation between the winter markers) monthly resolution between 1733–1906 CE (Fang et al., 2023; Rhodes et al., 2016). After subtracting a mean annual cycle (representative of marine and volcanic background sulfur emissions), Fang et al. (2023) compared excess sulfur concentrations against the timing of major volcanic eruptions (VEI ≥ 3) from the GVP database, revealing a close temporal correspondence of excess sulfur following several known explosive eruptions (VEI = 4), suggesting a volcanic source for the excess sulfur. Fang et al. (2023) have therefore adapted the detection thresholds and reconstructed a total of 35 additional volcanic eruptions between 1733 and 1895 CE using the D4i dataset (Fig. 2). These volcanic eruptions resulted in ice-core sulfate depositions in the range of 5 to 10 kg km−2 which for attributed eruptions (e.g. Awu 1812, Suwanosejima 1813, Fuego 1857) equate to stratospheric sulfur injections between 0.5 and 1.5 Tg SO2. These estimated values are in close agreement with typical sulfur injections obtained by satellites (Carn et al., 2016) for eruptions of comparable magnitudes (VEI = 4) such as Kasatochi 2008, Sarychev 2009 or Nabro 2011 (Fang et al., 2023). As with eVolv2k, multiple deposition events in D4i were matched in the source dataset paper (Fang et al., 2023) to specific historical eruptions. However, as with eVolv2k, we re-assessed all matches between ice core sulfate deposition events and historical eruptions (see Sect. 3). When matching deposition event to eruption, we thus use the ice-core-based eruption date and latitudinal band (one band encompassing the tropics and northern hemisphere for D4i) instead of latitudes and dates associated with a historical eruption matches proposed in Fang et al. (2023).
2.5 Global Volcanism Program Volcanoes of the World database (geological)
The Volcanoes of the World (VOTW) database of the Smithsonian Global Volcanism Program (GVP, 2025) is the reference volcanological database for the Holocene and is well-maintained by the Smithsonian Institution. We only use confirmed eruptions in this database with a VEI greater than 3 as smaller VEI values do not correspond to eruptions explosive enough to result in stratospheric injections. In addition to the confirmed nature of the eruption and the VEI, the eruption start date, end date and latitude from VOTW are used to inform the matching procedure to ice-core sulfate deposition peaks. We also used the volcano longitude and, when eruption-specific vent altitude could not be found in the literature, the reported vent altitude. Note that the VOTW database does not provide emitted SO2 mass.
One of the most important limitations of VOTW, and indeed all geological and ice-core volcanic records, is eruption under-recording, with under-recording rates increasing back in time as well as for smaller VEIs (Fig. 3). Numerous eruptions are simply not known, and many eruptions have not been characterized sufficiently to attribute an accurate VEI (most often underestimated) (e.g. Brown et al., 2014; Rougier et al., 2016; Papale et al., 2022). These issues disproportionally affect regions in which volcanic deposits have been less systematically documented, or where deposits erode faster (e.g. in a wet tropical climate) (Rougier et al, 2016). Characterizing under-recording rates is important to assess the robustness of matches made in the CMIP7 dataset. We assume that global eruption rates are constant and that in the absence of eruption under-recording, the cumulative number of eruptions would thus follow a linear trend in time. For each VEI between 3 and 6, we perform a linear fit of the cumulative eruption number since 10 000 BCE for a period for which we are very confident that the global record is robust. Going forward in time from 10 000 BCE, we then find the first data point within the prediction interval of that fit (at the 95 % confidence level) and consider that there is significant under-recording before. For VEI 3 eruptions, we assume that the record is robust for the satellite era and thus use 1980–2022 for the linear fit. For other VEIs, we assume that there is no under-recording for the period for which we determined no under-recording for the VEI value immediately below. For example, for VEI 3, our procedure suggests no under-recording since 1951 (Fig. 3a), and we thus use 1951–2022 to constrain the linear fit for VEI 4 eruptions (Fig. 3b). Following this procedure, we find that significant under-recording occurs before 1951, 1853, 1450 and 2040 BCE for eruptions of VEI 3, 4, 5 and 6, respectively. Using each fit period, we also find return periods of 0.2, 1.7, 16 and 106 years for these respective VEIs. Both our suggested time threshold for significant under-recording and eruption return period are in good agreement with Papale (2018) for VEI 3–5, with older time threshold and lower eruption rate for VEI6, which are well recorded for the full Common Era anyway. Improved consistency with methods used in e.g. Papale (2018) or Rougier et al. (2016) to define the time threshold for significant under-recording should be considered in future dataset versions.
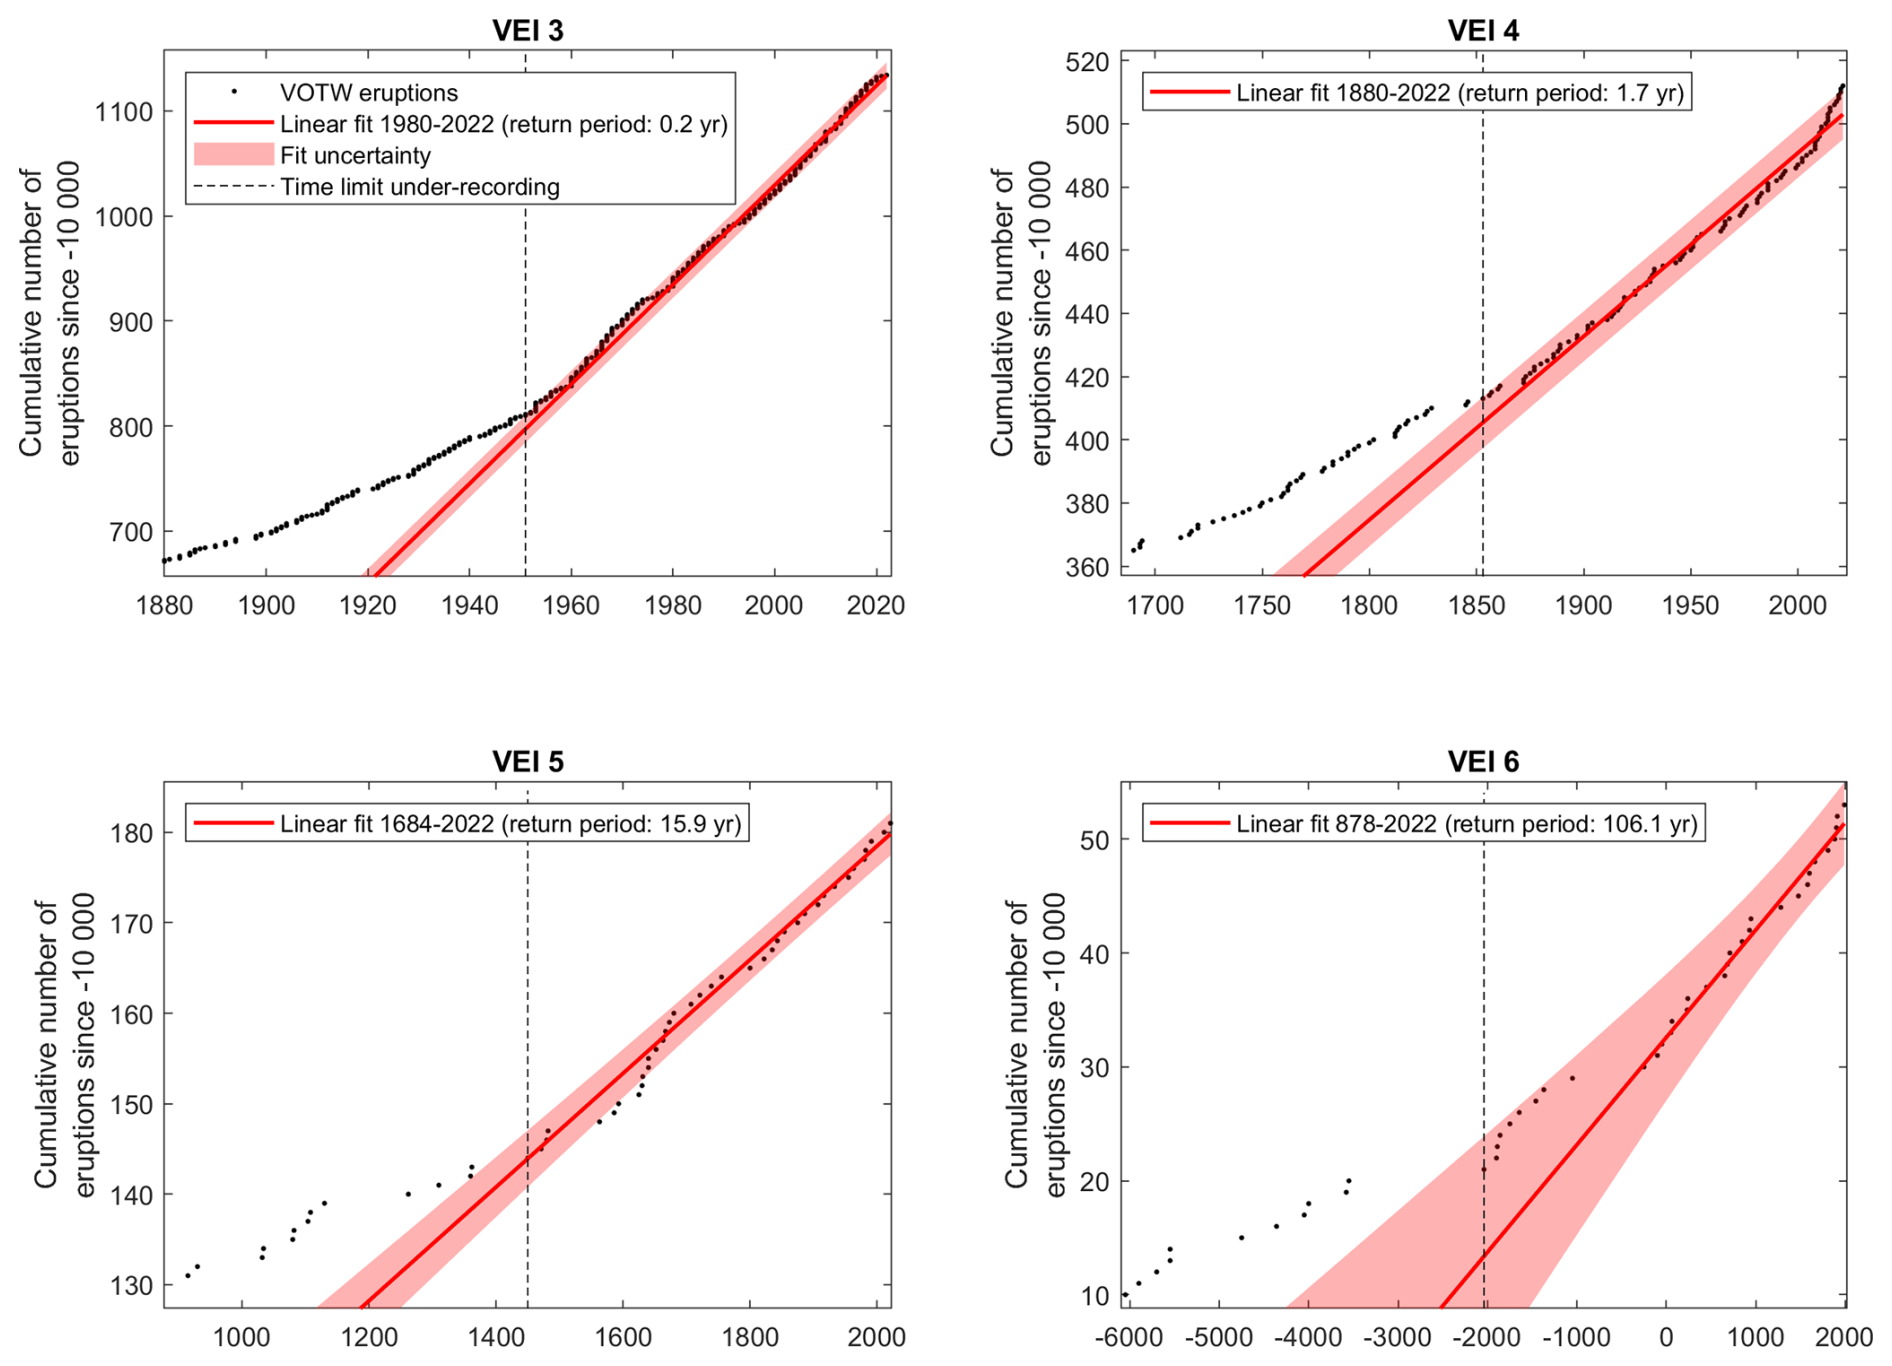
Figure 3Cumulative number of eruptions since 10 000 BCE in the VOTW database, for VEI 3–6 eruptions. For each VEI, a linear fit is performed for a period for which we are confident no under-recording occurs (see text for explanation). The year from which significant under-recording occurs (vertical dashed line) is then the last point in time within the fit 95 % prediction interval.
The satellite era dataset (MSVOLSO2L4) and pre-satellite era dataset (obtained from all other source datasets) are simply concatenated to obtain the full historical emission dataset. For the pre-satellite era, the 1750–1900 portion of the eVolv2k and the 1901–1978 portion of the Sigl et al. (2015) bipolar ice-core datasets are concatenated. As explained in Sect. 2.2, we assumed that all 20th century eruptions for the Sigl et al. (2015) dataset had Greenland deposition corresponding to the lower bound given in the dataset. For 1750–1900, we also add all events from the D4i dataset that have not been identified already in the eVolv2k dataset in Fang et al. (2023). This results in a total of 67 eruptions over 1750–1978. The last step is to add GVP eruptions for 1750–1978, without adding eruptions detected in ice-core datasets. To do so, we have to match sulfur deposition events recorded in ice-core datasets to historical eruptions recorded in GVP. This matching procedure is subject to uncertainties, with matches considered high confidence only when tephra shards found in the core could be geochemically fingerprinted to the tephra deposit from the proposed matched eruption or volcano (Plunkett et al., 2023). However, attributing sulfate deposition to a specific eruption can further be complicated by the presence of co-deposited fallout from other eruptions. High-resolution tephra and sulfur (33S and 34S) isotope analyses are emerging as a powerful technique for distinguishing the contributions of several contemporary eruptions in ice stratigraphy (Lee et al., 2024; Hutchison et al., 2024) though applications in the period 1750–2021 remain sparse (Burke et al., 2019; Hutchison et al., 2025). In the absence of geochemical fingerprinting, the confidence in a given match depends on:
-
The historical eruption VEI, location and date which altogether are key controls on the under-recording of eruptions.
-
The consistency between the timing of deposition and the proposed eruption date. with the deposition expected to primarily occur during the year of eruption or the following year.
-
The consistency between the location of the proposed matched eruption and the location of sulfur deposition. Tropical eruptions are expected to lead to bipolar deposition, whereas extratropical eruptions are generally expected to result in polar deposition only in the hemisphere where the eruption occurred.
-
The existence of multiple plausible eruption matches for a given deposition event.
Even though the above considerations can make the attribution of a match very uncertain, we strived to attribute a match to as many sulfate deposition events as possible in CMIP7. This approach enables us to minimize the risk of double-counting an eruption in the dataset, i.e. to have distinct GVP and ice-core derived eruptions that are the same eruption. To inform dataset users on the confidence of proposed matches, we systematically attribute a match confidence flag taking the following values:
-
Flag 4 (very high confidence match): geochemical fingerprinting links the proposed eruption match to tephra found within the deposited sulfur layer. The Zavaritskii 1831 eruption (Hutchison et al., 2025) is an example of match confidence flag 4 (Table 2).
-
Flag 3 (high confidence match): the proposed eruption match has a VEI ≥ 5, no other VEI ≥ 5 eruption is a potential match, the eruption year is the same year the deposition year or on the year before, and the eruption latitude band is consistent with the presence/absence of sulfur deposition at both poles. Flag 3 was never attributed to proposed eruption matches for D4i deposition events because of the absence of information on Southern Hemisphere polar deposition. We chose VEI 5 as a threshold because at global scale, such eruptions are seemingly well recorded throughout the full period considered (from 1450 for VEI 5 and −2040 for VEI 6, see Fig. 3). They are also sufficiently rare (return period of 15.9 years for VEI 5) to be confident that other potential eruption matches with smaller VEI recorded in close time proximity were unlikely of the same VEI as the selected match, despite large uncertainty in VEI attribution. The Ksudach 1907 eruption is an example of match confidence flag 3 (Table 2).
-
Flag 2 (medium confidence match): Flag 2 criteria are similar to flag 3, but with two exceptions: (i) we allow the VEI to be 4 for eruptions after 1850, from when VEI 4 eruptions are relatively well recorded (Fig. 3); (ii) we allow flag 2 for D4i events if the eruption is tropical or extratropical northern hemisphere. The Katla 1918 eruption is an example of match confidence flag 2 (Table 2).
-
Flag 1 (low confidence match): For any other case, we attribute a match flag value of 1. We did not propose a match if no historical eruption was occurring within −2 to +1 year relative to the deposition year, nor for extratropical eruptions for which deposition was recorded only in the pole of the other hemisphere. We only considered eruptions of VEI 3 or more as match candidates. The Tungurahua 1886 eruption is an example of match confidence flag 1 (Table 2)
Following the matching procedure, we added to the CMIP7 dataset any GVP eruption not suggested as match to an ice-core sulfate deposition event, with an estimated eruption year between 1750 and 1978, and with a VEI ≥ 4. This results in the addition of 4 eruptions with a VEI of 5 and 64 eruptions with a VEI of 4. We did not add VEI 3 eruptions from the GVP database unmatched to ice-core events. Last, because the D4i dataset is based on a single Greenland core, the scaling factor to be used to derive the total SO2 mass from the sulfate deposition is dependent on the assumed eruption location, and the mass is thus adjusted following the matching procedure using the same scaling factor as Fang et al. (2023): (i) for events matched to a tropical eruption, we use a scaling factor of 0.271 Tg S kg SO km2; (ii) for events matched to an extra-tropical eruption, we use a scaling factor of 0.103 Tg S kg SO km2. For events not matched to an eruption, we weight the two scaling factors by the probabilities that an eruption depositing sulfate in Greenland is tropical (0.36) and extratropical (0.64), respectively (Fang et al., 2023).
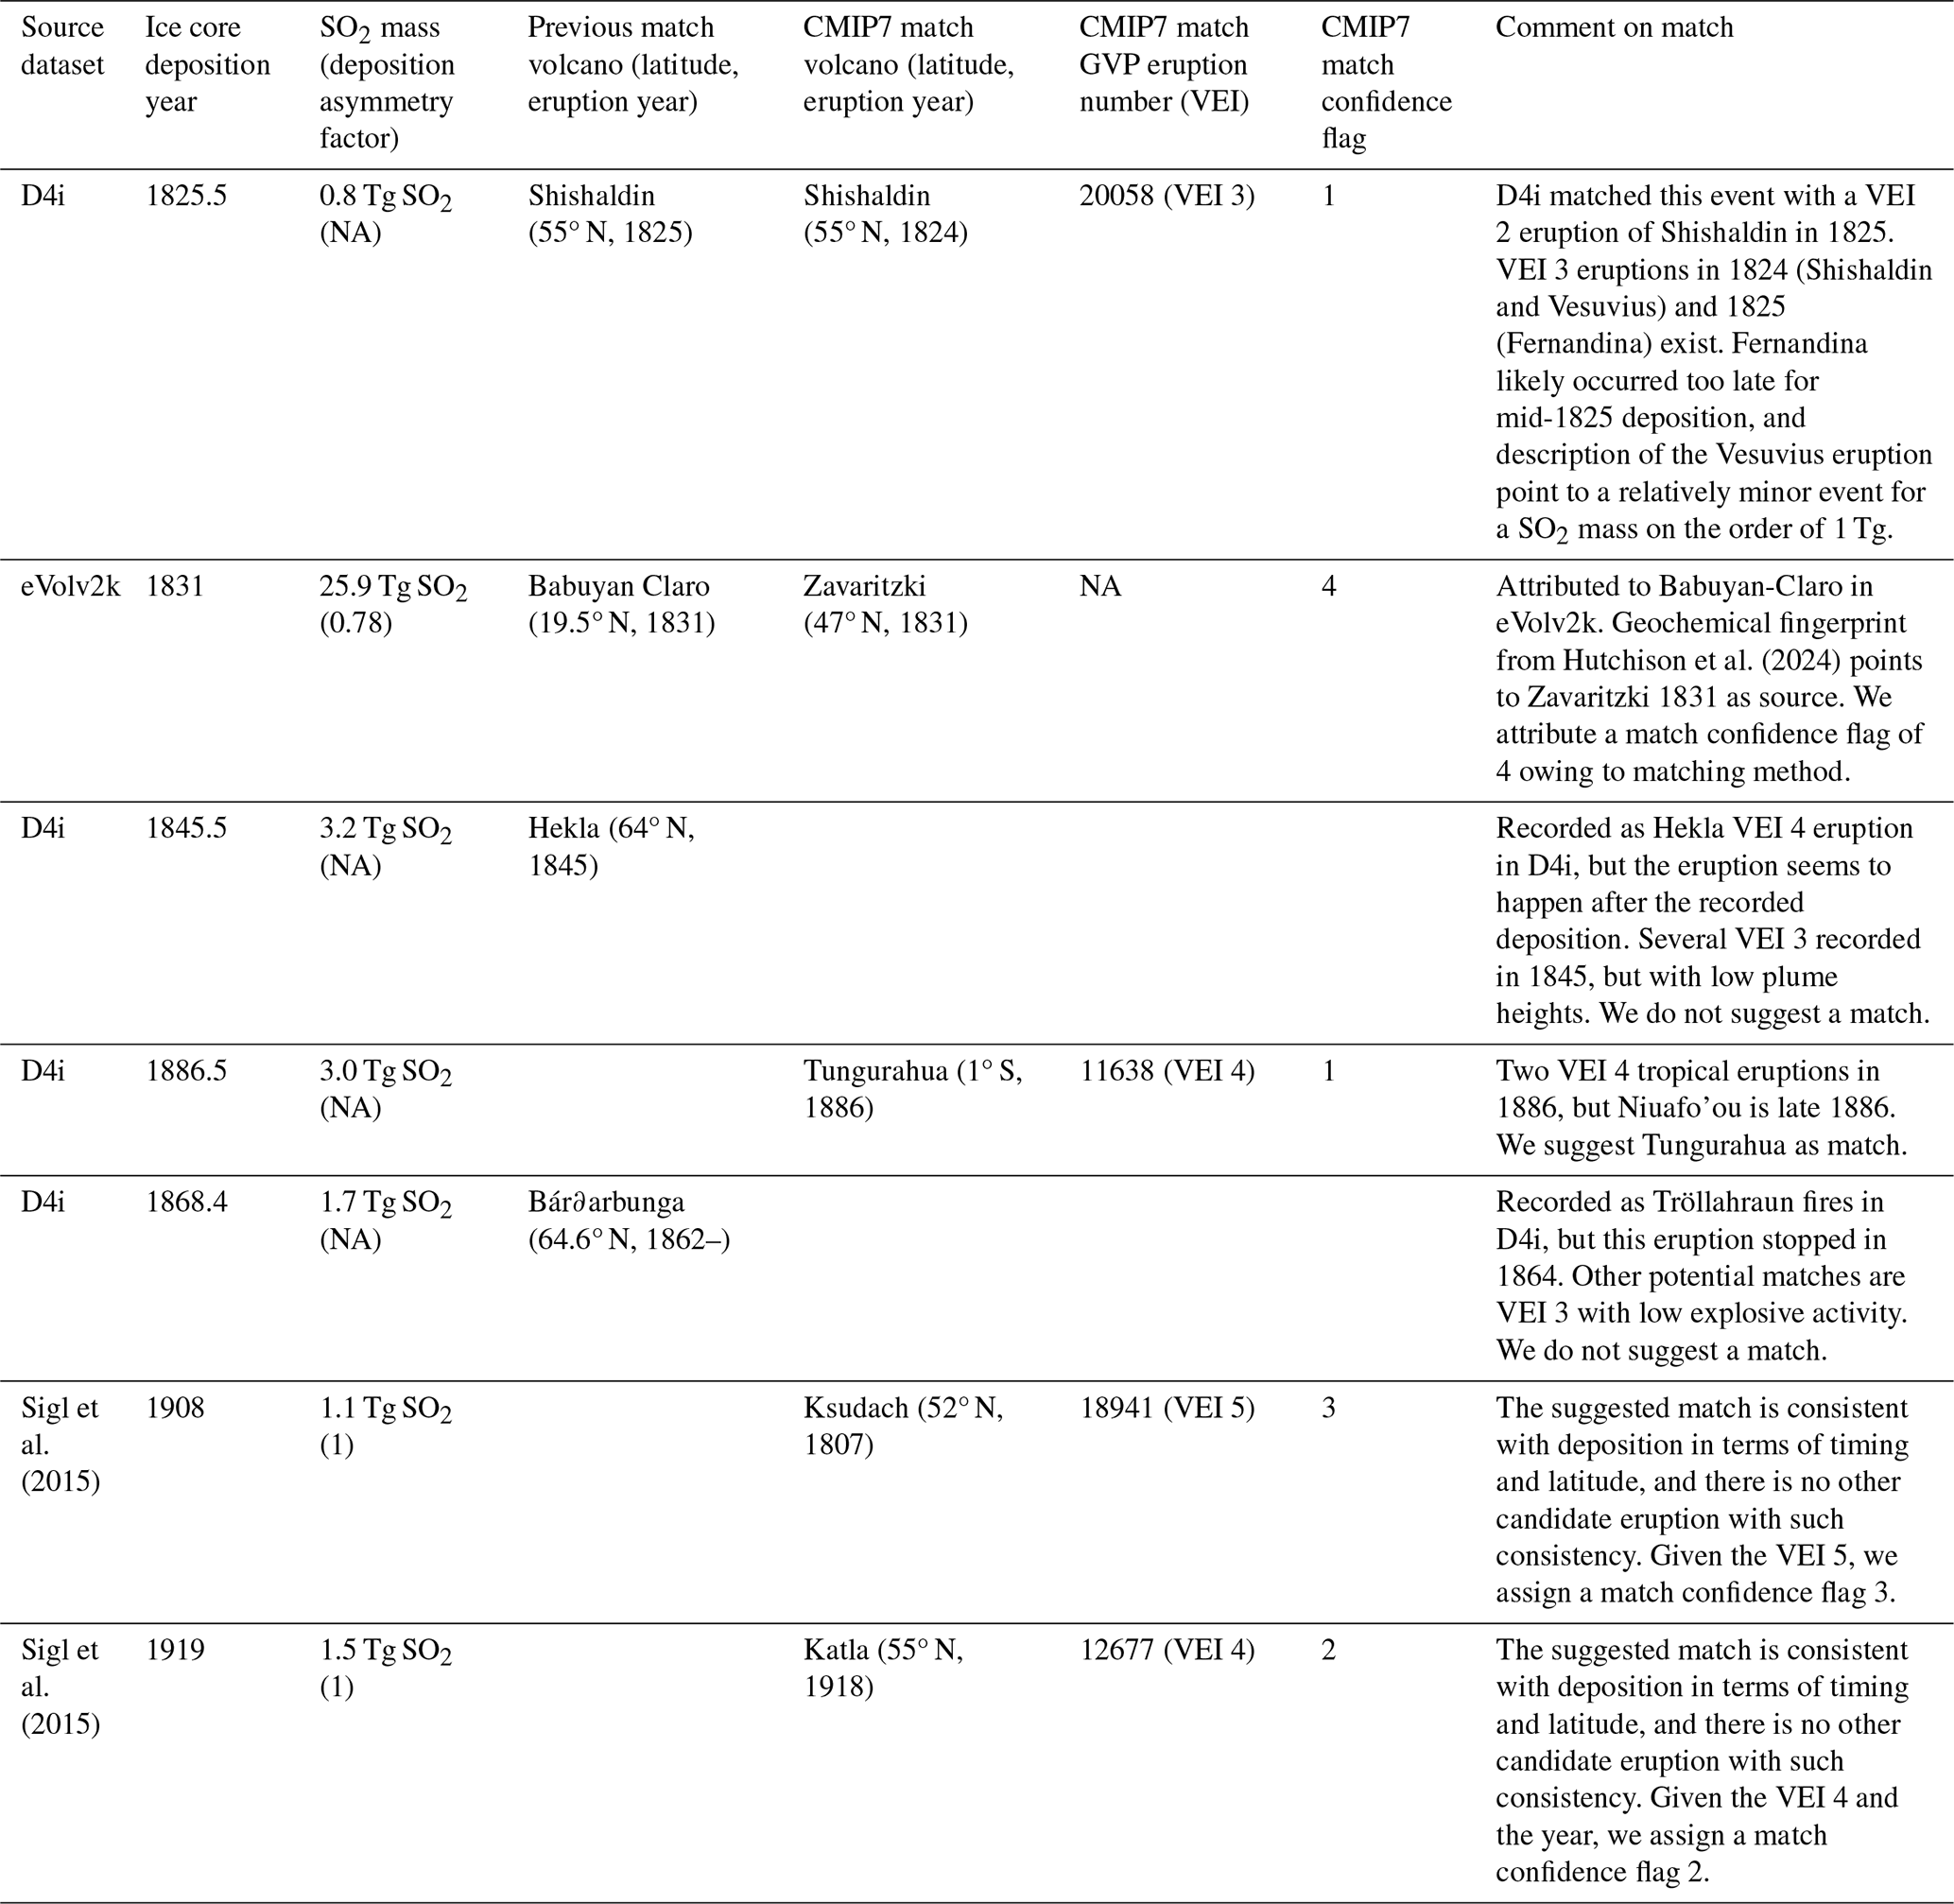
Following the process described above, we obtain 146 pre-satellite eruptions in the CMIP7 dataset over 1750–1978, with 77 eruptions originating from an ice-core source dataset (eVolv2k, Sigl et al., 2015 or D4i), out of which we proposed a specific historical eruption match for 67 events. Among these eruption matches, 34, 9, 13 and 11 have match confidence flag values of 1 (low confidence), 2, 3 and 4 (very high confidence), respectively. The 11 eruptions with flag 4 value (geochemical fingerprinting) correspond to two actual eruptions only, as Laki 1783–1784 was split in 10 phases (Sect. 4.6). Table 2 shows select eruption matches, including any eruption for which match attribution differs from the source ice-core dataset. For example, a D4i-based eruption injecting 0.8 Tg SO2 mid-1825 was attributed to an 1825, VEI 2 eruption of Shishaldin by Fang et al. (2023). Although a VEI 2 eruption would not have potential to inject sulfur into the stratosphere, the VEI could have been misattributed in the GVP database. However, three VEI 3 eruptions are recorded in 1824 (Shishaldin and Vesuvius) and 1825 (Fernandina) in the GVP, and we deem these eruptions to be better candidates. The Fernandina eruption occurred relatively late in 1825, making it implausible for a mid-1825 deposition in Greenland. Historical accounts suggest that the 1824 Vesuvius eruption was relatively moderate in magnitude, making it unlikely that it was the primary contributor to a 0.8 Tg SO2 injection. Consequently, we retained the 1824, VEI 4 eruption of Shishaldin as a match. We could find no specific timing constraint for this eruption, and given the high latitude, we acknowledge that it would be a poor match should it have occurred in early 1824. We attribute a confidence match flag of 1 to this eruption. Although the date and latitude are consistent with deposition parameters, low confidence matches with the same VEI exist, meaning we can only give a match flag of 1 as per our criteria above. Furthermore, the VEI 3 (high frequency eruption with significant under-recording) also means we can only give a match flag of 1 as per the same criteria. As a second example, in eVolv2k, following prior reconstructions (e.g., Zielinksi, 1995; Sigl et al., 2013) an eruption of 25.9 Tg SO2 in 1831, with 6 times more sulfate deposited in Greenland than Antarctica, was attributed to the Babuyan Claro tropical eruption in 1831. However, Garrison et al. (2018) provide evidence that there was no eruption of Babuyan Claro in 1831, and Hutchison et al. (2025) geochemically matched tephra found in several ice cores to the VEI 6 Zavaritskii 1831 eruption in the Kurile islands. We thus use this eruption as a match with a match confidence flag of 4.
Table 2Select examples of ice-core deposition – eruption matching in CMIP7. We show all cases for which the attribution in the CMIP7 dataset is different from the source ice-core dataset, complemented by select examples to cover cases for each value of our match confidence flag. Matches, including comments justifying our choices and match confidence flags, are comprehensively informed in the CMIP7 dataset (see data availability section). The deposition asymmetry factor is defined as (FNH − FSH) (FNH + FSH) (Eq. 2) where FNH and FSH are the sulfur flux recorded in Greenland and Antarctica.
4.1 Parameter search for known and matched eruptions
For any pre-satellite eruption with a proposed historical eruption match, we conducted a literature review to constrain the eruption year, month, day, vent altitude and altitude of SO2 injection. For satellite-era eruptions for which a default SO2 injection altitude was used in MSVOLSO2L4, we also conducted a search for the altitude of SO2 injection (all other parameters are systematically informed in MSVOLSO2L4). Firstly, for eruptions from 1900 onwards, we verified if the eruption was informed in the Independent Volcanic Eruption Source Parameter Archive (IVESPA, Aubry et al., 2021). IVESPA is a compilation of eruption source parameters conducted by a working group of the International Association of Volcanology and Chemistry of the Earth Interior (IAVCEI) using information from published literature. We prioritized using information from IVESPA because: (i) all information provided in the database originates from a comprehensive literature search; (ii) key source parameter values, including heights, were vetted independently by two members of the IVESPA working group; (iii) IVESPA distinguishes three types of height: the top and spreading heights of the tephra cloud, and the SO2 injection height. If the eruption of interest is not informed in IVESPA, we started our parameter search from the GVP database (Global Volcanism Program, 2025). The volcano and eruption pages might contain general information about the eruption, including the eruption year, month, day, and vent altitude. Bulletin reports about the eruptive history of the volcano might refine this information and also provide data on eruptive plume heights. After collecting parameter values from the GVP pages, we searched for parameters using source references mentioned in the GVP database for each eruption, as well as references found through targeted Google Scholar searches using the volcano name and eruption year. We sometimes refined these searches with key words such as “height” or “isopleth” for eruptions with a large number of associated papers. Whenever parameters values found both in the peer-review literature and in the GVP database differed, we used information from the peer reviewed literature. Last, when finding eruptive plume height in the literature, we did our best to interpret whether the height corresponded to the observed SO2 height (), to the observed spreading height of the ash cloud (Hspr), to the observed top height of the plume overshoot (Htop), or to the top height reconstructed from isopleth (Hiso), i.e. from the mapped distribution of clast size in the eruption deposit. Following Engwell et al. (2023), we then applied the following correction to obtain an estimate of the SO2 injection height ():
with all heights expressed a.v.l., not a.s.l.. These corrections were derived from well observed eruptions in the IVESPA database. Note that for most pre-satellite era eruptions, plume heights found in the literature are derived from isopleth maps. In the absence of correction, the SO2 injection height would likely be overestimated by 49 % on average. The CMIP7 dataset (see Data Availability section) provides all parameters found through our literature search, as well as comments containing references used and explanations on the parameter values provided.
4.2 Attribution of missing eruption location parameters
Pre-satellite era volcanic sulfur injections with no eruption match have no exact information on the eruption location. The dataset includes a flag indicating if a fill value was used for the longitude and latitude. For longitude, we assign a default value of 0° E for unidentified eruptions, and note that injection longitude has little influence on the stratospheric aerosol forcing generated by models (Toohey et al., 2011).
For eruptions with no match, the only information we can use to infer a latitude is the deposition asymmetry, which we here define following Toohey et al. (2016) as
where FNH and FSH are the sulfur flux recorded in Greenland and Antarctica, respectively. α has a value of 1 for pure Greenland deposition, −1 for pure Antarctica deposition, and varies linearly with the difference in polar deposition. Figure 4 shows the relationship between α and the eruption latitude (λ) for satellite-era eruptions, flag 3 and 4 eruptions from our emission dataset, and eruptions before 1750 which were geochemically matched to an ice-core sulfate deposition event. This relationship is well-captured (R2=0.75) by the linear fit:
We thus use Eq. (3) to attribute a latitude to all eruptions for which it is unknown. The fit prediction uncertainty (at 95 % confidence level) is nearly constant with a value of 40°, which we use as an uncertainty on the value inferred from Eq. (3). We excluded the tropical northern hemisphere eruptions of El Chichón (1982, three phases) and Santa Maria (1902) before fitting. These eruptions are clear outliers with , but this is unsurprising as anthropogenic sulfate complicates the detection of volcanic sulfate deposition peaks in Greenland in the 20th century. Low-medium confidence (match flag 1–2) matches are all in good agreement with Eq. (3), providing circumstantial evidence to support the proposed matches.
We acknowledge that numerous other parameters such as injection height, season and mass also govern the value of α (Marshall et al., 2021). However, the influence of these other controls is reflected in the important prediction uncertainty of our proposed relationship between α and λ. Although Eq. (3) is simplistic, using a non-linear relationship between α and λ is not justified by the available data nor its uncertainty. Interactive stratospheric aerosol model simulations from Marshall et al. (2021) are also consistent with a linear relationship (Fig. 4) (, R2=0.79). Their use of polar eruption latitudes might explain the larger slope, and the far south intercept could be caused by strong stratospheric transport towards the Northern Hemisphere in the UM-UKCA model they use (e.g. Dhomse et al., 2020). Assessing the deposition asymmetry-eruption latitude relationship simulated by other models could give greater confidence in Eq. (3) whilst being a test of model skill at simulating stratospheric aerosol processes. Last, most ice-core datasets currently prescribe a tropical latitude (e.g. 0°) for eruptions for which , and a mid-latitude (e.g. ±45°) otherwise (Toohey and Sigl., 2017; Sigl et al., 2022) based on seminal previous work (Lamb, 1970; Cole-Dai, 2010). Although such relationships are outside the prediction uncertainty of our fit only for , they poorly capture the correlation between α and λ seen in observational datasets and simulations compared to Eq. (3), and they also result in relatively low latitude attribution for eruptions with very high deposition asymmetry. Following a similar rational, more recent studies have already reattributed approximated latitudes based on the bipolar depositions (Toohey et al., 2016; Pearson et al., 2022; Abbott et al., 2021; Lin et al., 2022; Verkerk et al., 2025).
Last, for D4i, Eq. (3) can not be used for event with no historical eruption match because the deposition asymmetry factor cannot be quantified. For these eruptions, we thus use an eruption latitude of 30° N which results in approximately 65 % of the sulfur injected in the northern hemisphere and 35 % in the tropics, with this partitioning matching the probabilites that an eruption depositing sulfate in Greenland is northern hemisphere extratropical vs. tropical (Fang et al., 2023).
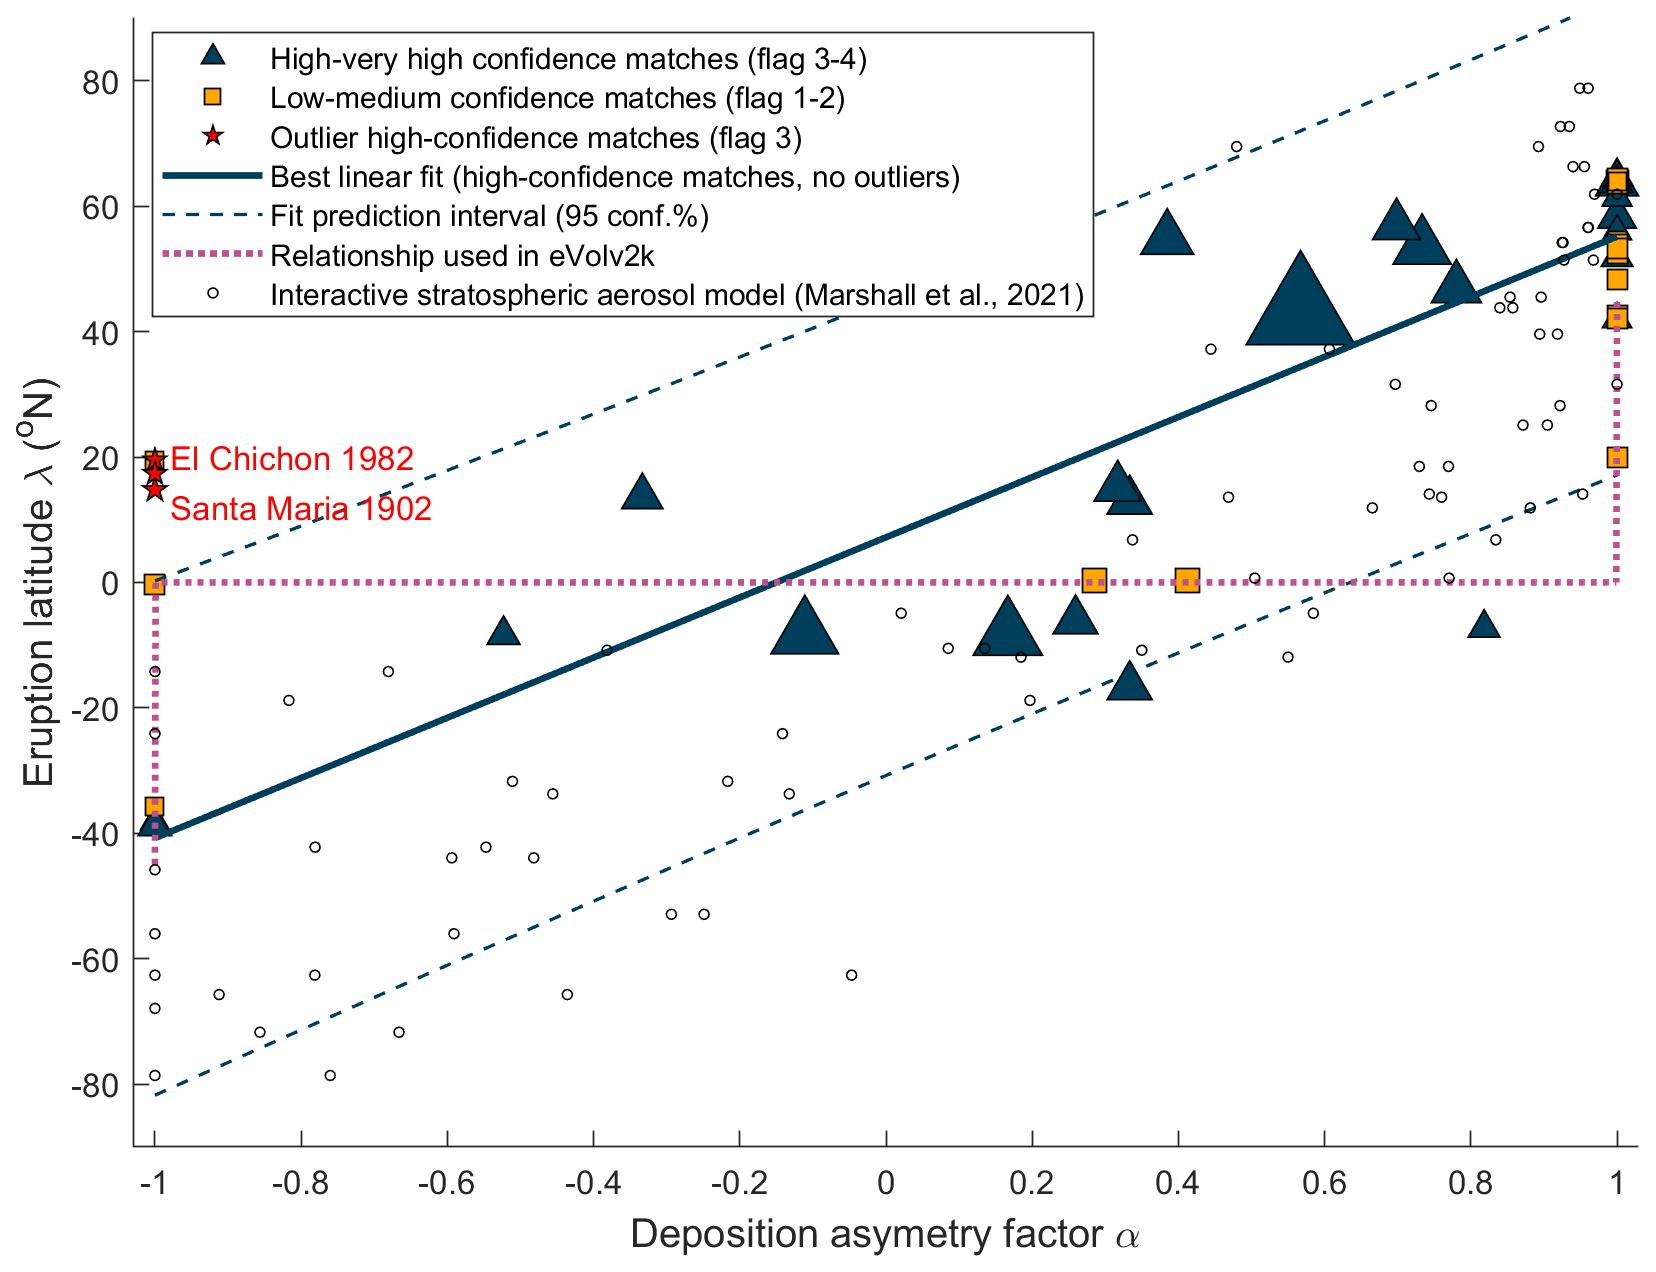
Figure 4Eruption latitude vs. deposition asymmetry (Eq. 2) for ice-core sulfate deposition events with a proposed match (coloured symbols), and interactive stratospheric aerosol model simulations (black circles, Marshall et al., 2021). Symbol size is proportional to the logarithm of the SO2 mass for ice-core data. Dark blue lines show the best linear fit (Eq. 3) and its prediction uncertainty (95 % confidence level) and the purple dotted line shows the relationship used in eVolv2k. In addition to 1750–1978 eruptions with a flag 3–4 from our dataset, “high confidence matches” include the El Chichon 1982 and Pinatubo 1991 eruptions (α from Sigl et al., 2015), as well as any pre-1750 eruption from Sigl et al. (2022) for which tephra found in ice cores enabled a geochemical match between the sulfate peak and a known eruption.
4.3 Attribution of missing eruption dates
Pre-satellite era volcanic sulfur injections with no eruption match or with poorly documented eruption match might not have exact information on the eruption date. If no eruption year is known, we assume that the eruption occurred in the year when volcanic sulfate deposition started in the ice cores. We follow the convention adopted in Toohey and Sigl (2017) and Sigl et al. (2022) and assume a default value of January when the eruption month is unknown, and first day of the month when the eruption day is unknown. For D4i events with no attributed eruption or unknown eruption date, the month was aimed to be set to the month when deposition was recorded as the measurements have resolution on the order of month. However, a code typo resulted in these unknown eruption dates to be set to 1 December. This error, which was not corrected for CMIP7 Fast Track because it was detected too late, affects 13 eruptions injecting 1.6–6.5 Tg SO2 between 1750 and 1849, as well as eruptions in 1868 (2.9 Tg SO2, deposition starts in May 1868), 1885 (4.2 Tg SO2, deposition starts in July 1885) and 1894 (1.9 Tg SO2, deposition starts in April 1894). Overall, for the 1850–2021 period, default eruption dates do not affect generated aerosol optical properties, except for three 1.9–4.2 Tg SO2 D4i-derived eruptions in December 1868, December 1885 and December 1894 which are likely ∼1 year too late. However, for the 1750–1849 period, the default eruption date affects 16 eruptions, with the 1 December date for the 13 D4i-derived events occurring 11 months later than intended (1 December instead of 1 January) and thus likely having dates ∼1 year too late compared to actual eruptions. Note that the ice-core age uncertainties since 1750 CE can be up to ±1 year (see Sects. 2.2–4 for details). Our dataset includes a flag indicating if a fill value was used for the month and day. No uncertainty is included on the eruption date as part of the dataset.
4.4 Attribution of missing SO2 injection heights
The SO2 injection height is unknown for numerous eruptions in our dataset including: (i) ice-core sulfate peaks with no eruption match; (ii) ice-core sulfate peaks with an eruption match for which the plume height has not been characterized; (iii) satellite-era eruptions for which no height observations are available. For the latter, Carn (2021) uses 10 km and 5 km a.v.l. for explosive and effusive eruptions in MSVOLSO2L4. Instead of using this convention, we treat in a consistent way all eruptions with unknown heights. Figure 5 shows how the SO2 injection height (, in km a.v.l.) relates to the mass of SO2 (, in Tg of SO2) the only parameter reliably known for all eruptions in our dataset. The relationship between two parameters is reasonably characterized (R2=0.43) by a power-law model:
A power-law relationship between SO2 height and mass is expected. The mass of SO2 is equal to the mass eruption rate of tephra, multiplied by eruption duration and sulfur content (kg S kg−1 tephra). The mass eruption rate is in turn a power-law function of plume height (e.g. Wilson et al., 1978; Mastin et al., 2009; Engwell, et al., 2023), with this relationship modulated by e.g. atmospheric and vent conditions (e.g. Woodhouse et al., 2013). The large spread in Fig. 5 is thus likely simply explained by variability of eruption duration, sulfur content, syneruptive atmospheric conditions and other factors affecting the height-mass eruption rate relationship. The fact that the exponent of 0.12 is much smaller than values expected from analytical modelling of idealized buoyant plumes rising in absent or strong wind field (0.25–0.33, Morton et al., 1956; Hewett et al., 1971) might be caused by interdependence between the SO2 mass and the sulfur content, and/or eruption duration, and/or the tephra to SO2 height ratio. For well observed eruptions in the IVESPA database, Engwell et al. (2023) find that the SO2 height relates to the mass eruption rate of tephra raised by an exponent 0.169, a value already lower than the expected theoretical range giving confidence in the empirical value used in Eq. (4).
Given the above considerations, we use Eq. (4) to attribute a SO2 injection height in km a.v.l. when it is unknown. To obtain a height in km a.s.l., the vent altitude is added when known. When unknown (i.e., pre-satellite era eruption with no historical eruption match), we assume a vent altitude of 2.15 km, the mean across all the volcanoes in the CMIP7 dataset. The prediction uncertainty associated with Eq. (4) is asymmetric and a complex function of the SO2 mass, but we find that a relative uncertainty of 66 % on height captures 95 % of the data for eruptions injecting more than 0.1 Tg SO2. We thus prescribe a 66 % uncertainty for all heights a.v.l. inferred from Eq. (4). If the vent altitude is known, we neglect the associated uncertainty whereas if it is unknown, we assume a 100 % uncertainty when the vent altitude is unknown and prescribed to 2.15 km. This uncertainty captures 95 % of the known vent altitudes in our dataset. For known eruption heights (i.e. those not inferred from Eq. 4), we arbitrarily set relative uncertainties of 50 % and 38 % on the height a.v.l. of pre-satellite and satellite-era eruptions, respectively. The latter two uncertainty levels represent our expert guess and require further investigation. Last, for eruptions for which the source dataset is the GVP database, no SO2 mass is constrained and Eq. (4) can thus not be applied prior to assigning a SO2 mass. Consequently, we arbitrarily assigned heights near the tropopause for VEI 4 eruptions with no constrained SO2 mass, namely 16 km a.s.l. for tropical eruptions and 11 km a.s.l. for extratropical eruptions. We assigned a height of 18 km a.s.l. to VEI 5 eruptions with no constrained SO2 mass.
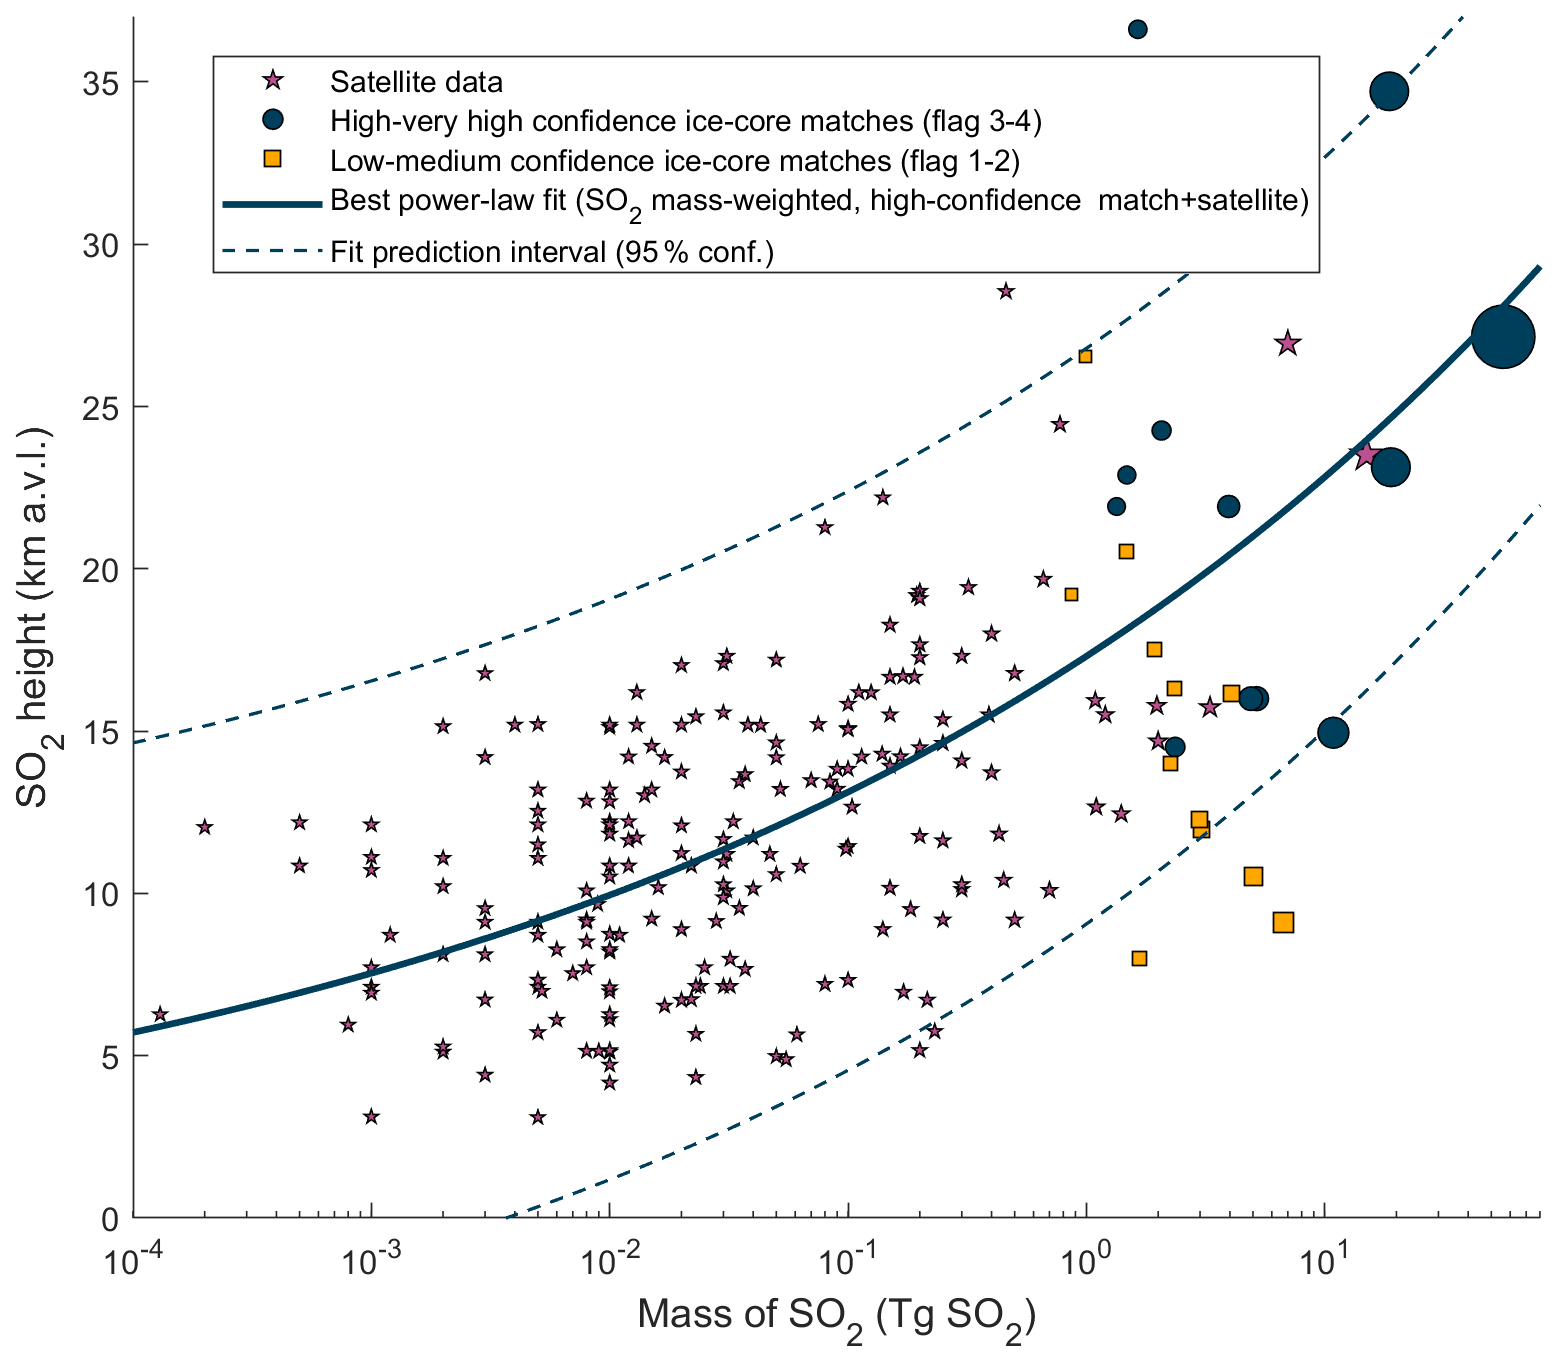
Figure 5SO2 injection height vs mass of SO2 for satellite data (MSVOLSO2L4) and ice-core data (sulfate deposition peak matched to eruptions with known height). Eruption matches are either from the CMIP7 dataset or pre-1750 matches identified through geochemical fingerprinting of tephra found in ice. Marker size is proportional to the log of the SO2 mass. The best power-law fit (weighted by SO2 mass owing to the large number of small-magnitude eruptions) and the associated prediction interval are shown.
4.5 Attribution of missing eruption SO2 mass (GVP eruptions)
For the VEI 4–5 eruptions for which the source dataset is the GVP database, we need to attribute a SO2 mass. For the four VEI 5 eruptions not matched to an ice-core signal, we assume an SO2 mass of 2.78 Tg SO2 which is equal to the mean mass of four VEI 5 eruptions with a known mass in the dataset (range 0.2–7 Tg SO2). For the 64 VEI 4 eruptions not matched to an ice-core signal, we considered using the mean mass of VEI 4 eruptions for the satellite era (0.26 Tg SO2). However, the SO2 mass of VEI 4 eruptions is highly variable, between 0.003 and 2 Tg SO2. Furthermore, for such small eruptions, there is little confidence that SO2 was actually injected into the stratosphere, in particular if the VEI was overestimated. Consequently, we choose a default SO2 mass enabling to match: (i) the time-averaged volcanic SAOD associated with small-to-moderate magnitude eruptions in the pre-satellite era; and (ii) the satellite-observed time-averaged volcanic SAOD over 1998–2023, during which only eruptions of VEI ≤ 5 occurred and with a SO2 mass ≤ 2 Tg SO2. The 1998–2023 mean global mean 525 nm SAOD anomaly, calculated as deviation from the minimum, is 0.003 (Fig. 6a) and is assumed to be a good estimate of the long term time-averaged SAOD anomaly associated with small-to-moderate magnitude eruptions injecting ≤3 Tg SO2. To match this value over the historical pre-satellite era (1850–1978), we run the EVA_H v2 model (Aubry et al., 2026a) used to produce the pre-satellite stratospheric aerosol optical properties using only small-magnitude eruptions. We ran the model 10 times using default SO2 masses for GVP-derived VEI 4 eruptions ranging from 0.02 to 0.5 Tg SO2 (Fig. 6b). We find that a mass of 0.08 Tg SO2 enables to match the 0.003 1998–2023 global mean SAOD anomaly, and thus choose this mass as the default SO2 mass for GVP-derived VEI 4 eruptions. By equating the pre-satellite SAOD anomaly from relatively small eruptions to the observed 1998–2023 anomaly characterized by the occurrence of small eruptions only, we aim to minimize bias in mean forcing from small-to-moderate magnitude eruptions between the pre- and satellite era datasets. We acknowledge this approach is subject to high uncertainties. For example, 1998–2023 might not be a sufficiently long period to quantify the true value of small-to-moderate magnitude eruptions, and SAOD is also influenced by pyrocumulonimbus events (e.g. Kloss et al., 2019; Peterson et al., 2025). We also expect the emissions and forcing associated with GVP-derived VEI 4 and 5 eruptions to be highly variable.
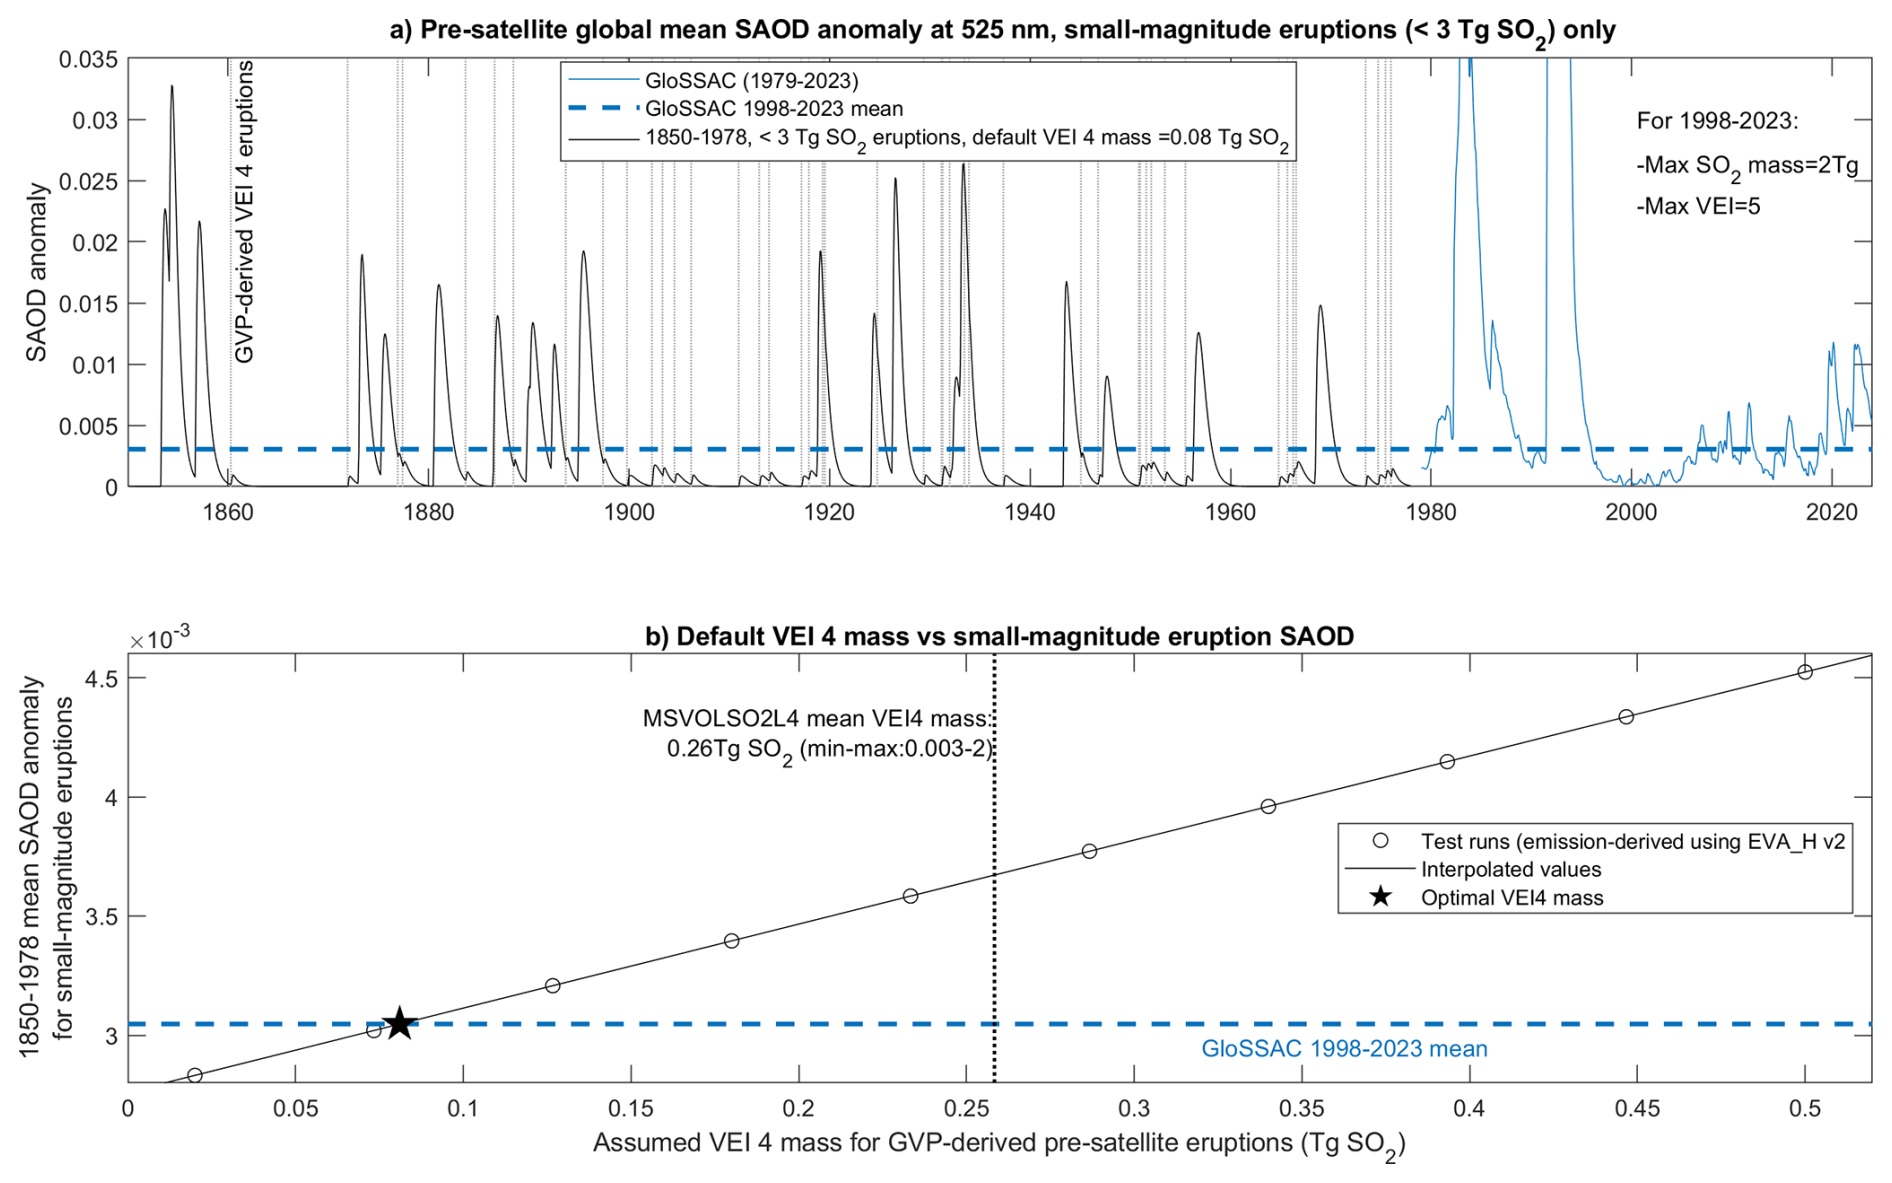
Figure 6(a) SAOD anomaly for the satellite (blue, 1979–2023) era, and for pre-satellite era for small-magnitude (<3 Tg SO2) eruptions only (black, 1750–1978), with the chosen mass of 0.08 Tg SO2 for pre-satellite GVP VEI 4 eruptions with unconstrained SO2 mass. These eruptions are highlighted by vertical grey lines. The horizontal blue dashed line shows the GloSSAC anomaly of global mean SAOD at 525 nm for 1998–2023, a period characterized by the absence of large-magnitude eruptions (>3 Tg SO2). (b) 1850–1978 mean anomaly of global mean SAOD at 525 nm as a function of the assumed mass of SO2 for pre-satellite GVP VEI 4 eruptions with unconstrained SO2 mass. The star highlights the value used in CMIP7 and panel a, obtained by interpolating to match the GloSSAC 1998–2023 mean SAOD. The vertical line highlights the mean VEI 4 SO2 mass for satellite-era eruptions from MSVOLSO2L4. For pre-satellite-era, SAOD anomalies are calculated by running EVA_H v2 with volcanic emissions only (no background stratospheric aerosol). For the satellite era, we simply remove the minimum SAOD value from the GloSSAC dataset.
4.6 Distinction of specific eruption phases: Laki (1783–1784) and Agung (1963)
4.6.1 Laki 1783–1784
Consistent with the timeline of explosive phases of the Laki 1783–1784 eruption, we split injections into ten phases (Thordarson and Self, 2003). The SO2 mass partitioning among phases is assumed to follow the explosive SO2 mass distribution from Thordarson and Self (2003), with the total mass equal to that recorded in ice cores (i.e. 41.6 Tg SO2, Toohey and Sigl, 2017) for consistency with the rest of the dataset. For the SO2 mass uncertainty, we arbitrarily assume that the relative uncertainty on the fraction of SO2 for each phase is 30 %, resulting in a total uncertainty on SO2 mass of 64 % for each phase.
We use the date of peak SO2 emission provided in Thordarson and Self (2003) for each phase; when the date is provided as a range, we arbitrarily use the first day. According to Thordarson and Self (1993), the column height was observed at ≥ 12 km during early August, i.e. for the 6th phase. From the formulation, we assume this height is a.v.l. i.e. 12.5 km a.s.l. given the 500 m vent altitude (Thordarson and Self, 1993). Given this represents a single observation for an ≈ 8 d long explosive phase, we arbitrarily assume that a representative average height of emission is 1 km lower, i.e. 11 km a.v.l.. Last, Thordarson and Self (1993) suggest that the height of explosive column in basaltic fissure eruptions scales with the volumetric eruption rate raised to the power . We assume that this rate scales with the mass eruption rate of SO2 from vents, Q, which we calculate for each phase using the SO2 mass released at vent and durations provided in Thordarson and Self (2003). Knowing the observed height of the 6th phase H6=11 km a.v.l. and noting Q6 (1.1 Tg SO2 d−1) its mass rate, we deduce the height H in km a.v.l. of any phase i as Hi=H6x (). The resulting plume heights range from 8.1 to 18.1 km a.s.l. across the 10 phases, and are generally lower for later phases. Note that both in terms of mass and height, our choice of eruption parameters differs significantly from parameters used by Zambri et al. (2019) to simulate the aerosol forcing and climatic impacts of this eruption. First, the 41.6 Tg SO2 mass we use, derived from ice cores, is much lower than Zambri et al. (2019) who inject 94 Tg of SO2 into the upper troposphere/lower stratosphere based on petrological estimates (122 Tg SO2, Thordarson et al., 1996). The discrepancy between these estimates are unsurprising given their uncertainties (34 % for ice-core derived estimate, > 15 % for the petrological estimate, both quoted at 1-σ) and the fact that petrological estimates reflect the total sulfur released, not the sulfur injected high-enough to be deposited in Greenland. Second, they used the same injection altitude for all eruptive phases, spreading SO2 emissions between 9 and 13 km a.s.l. Our injection altitudes are specific to each phase, with one phase with height lower than 9 km a.s.l., six phases with heights within 9–13 km a.s.l., and three phases with heights between 13 and 18 km a.s.l.
4.6.2 Agung 1963
The Agung 1963 eruption had two major phases separated by two months (Self and Rampino, 2012) and we thus split it into two phases in the CMIP7 emission dataset. This eruption is catalogued in IVESPA (Aubry et al., 2021) with a tephra mass of 3.7×10¹¹ kg for the 17 March paroxysm and 3.5×10¹¹ kg for the 16 May paroxysm. We aimed to partition the sulfur mass recorded in ice-cores proportionally to these recorded tephra masses, resulting in sulfur masses of 4.9 and 5.2 Tg SO2, respectively. However, both phases were accidentally swapped, which will have minimal impacts given how close they are. For the SO2 mass uncertainty, as with Laki, we arbitrarily assume that the relative uncertainty on the fraction of SO2 associated with each phase is 30 %, resulting in a 63 % uncertainty for the SO2 mass of individual phases.
We also use IVESPA estimates for eruption dates (16 March and 16 May, UTC) and heights (19 km a.s.l. for both phases). Note that this eruption has heights recorded for the top of the ash plume, its spreading height, and the SO2 height in IVESPA, and we thus use the latter estimates. Our choices of eruption parameters for both phases differ from the modelling study of Niemeier et al. (2019). First, they used masses of 4.7 and 2.3 Tg SO2 for both phases, meaning a much smaller total mass (7 Tg SO2 instead of 10.1 in CMIP7), with a much more pronounced difference between both phases and a larger mass for the first phase instead of the second one (caused by our accidental swap of the mass for both phases). The total masses differ because Niemeier et al. (2019) use a SO2 mass derived from an aerosol optical depth reconstruction, whereas we use an ice-core derived mass. The partitioning between phases differ because they based theirs on estimates of volumetric eruption rates, which would indeed be larger for the second phase owing to the shorter duration, as opposed to the total mass of material erupted in our case. They also used heights of 50 hPa (≈ 20.5 km a.s.l.) and 70 hPa (≈ 18.5 km a.s.l.) for the two phases, which are slightly different from the 19 km a.s.l. we used for both phases.
5.1 Dataset overview
Table 3 summarizes all parameters provided in the CMIP7 upper tropospheric-stratospheric volcanic sulfur emission dataset. Two datasets were provided to the modelling community: a netcdf file stored on the Earth System Grid Federation containing key variables required for aerosol models, marked with an asterisk in Table 3, and a spreadsheet containing all Table 3 parameters (see data availibility section). Altogether, these parameters document the data sources and dataset creation process in detail to maximize transparency and facilitate future updates and improvements. All scripts used to produce our emission (and stratospheric aerosol optical property) dataset are publicly available (see code availability statement).
Table 3Variables provided in the CMIP7 emission dataset. Key variables marked with an asterisk (*) are provided in the netcdf file stored on the ESGF, other variables are provided in a separate spreadsheet (see data availability statement).
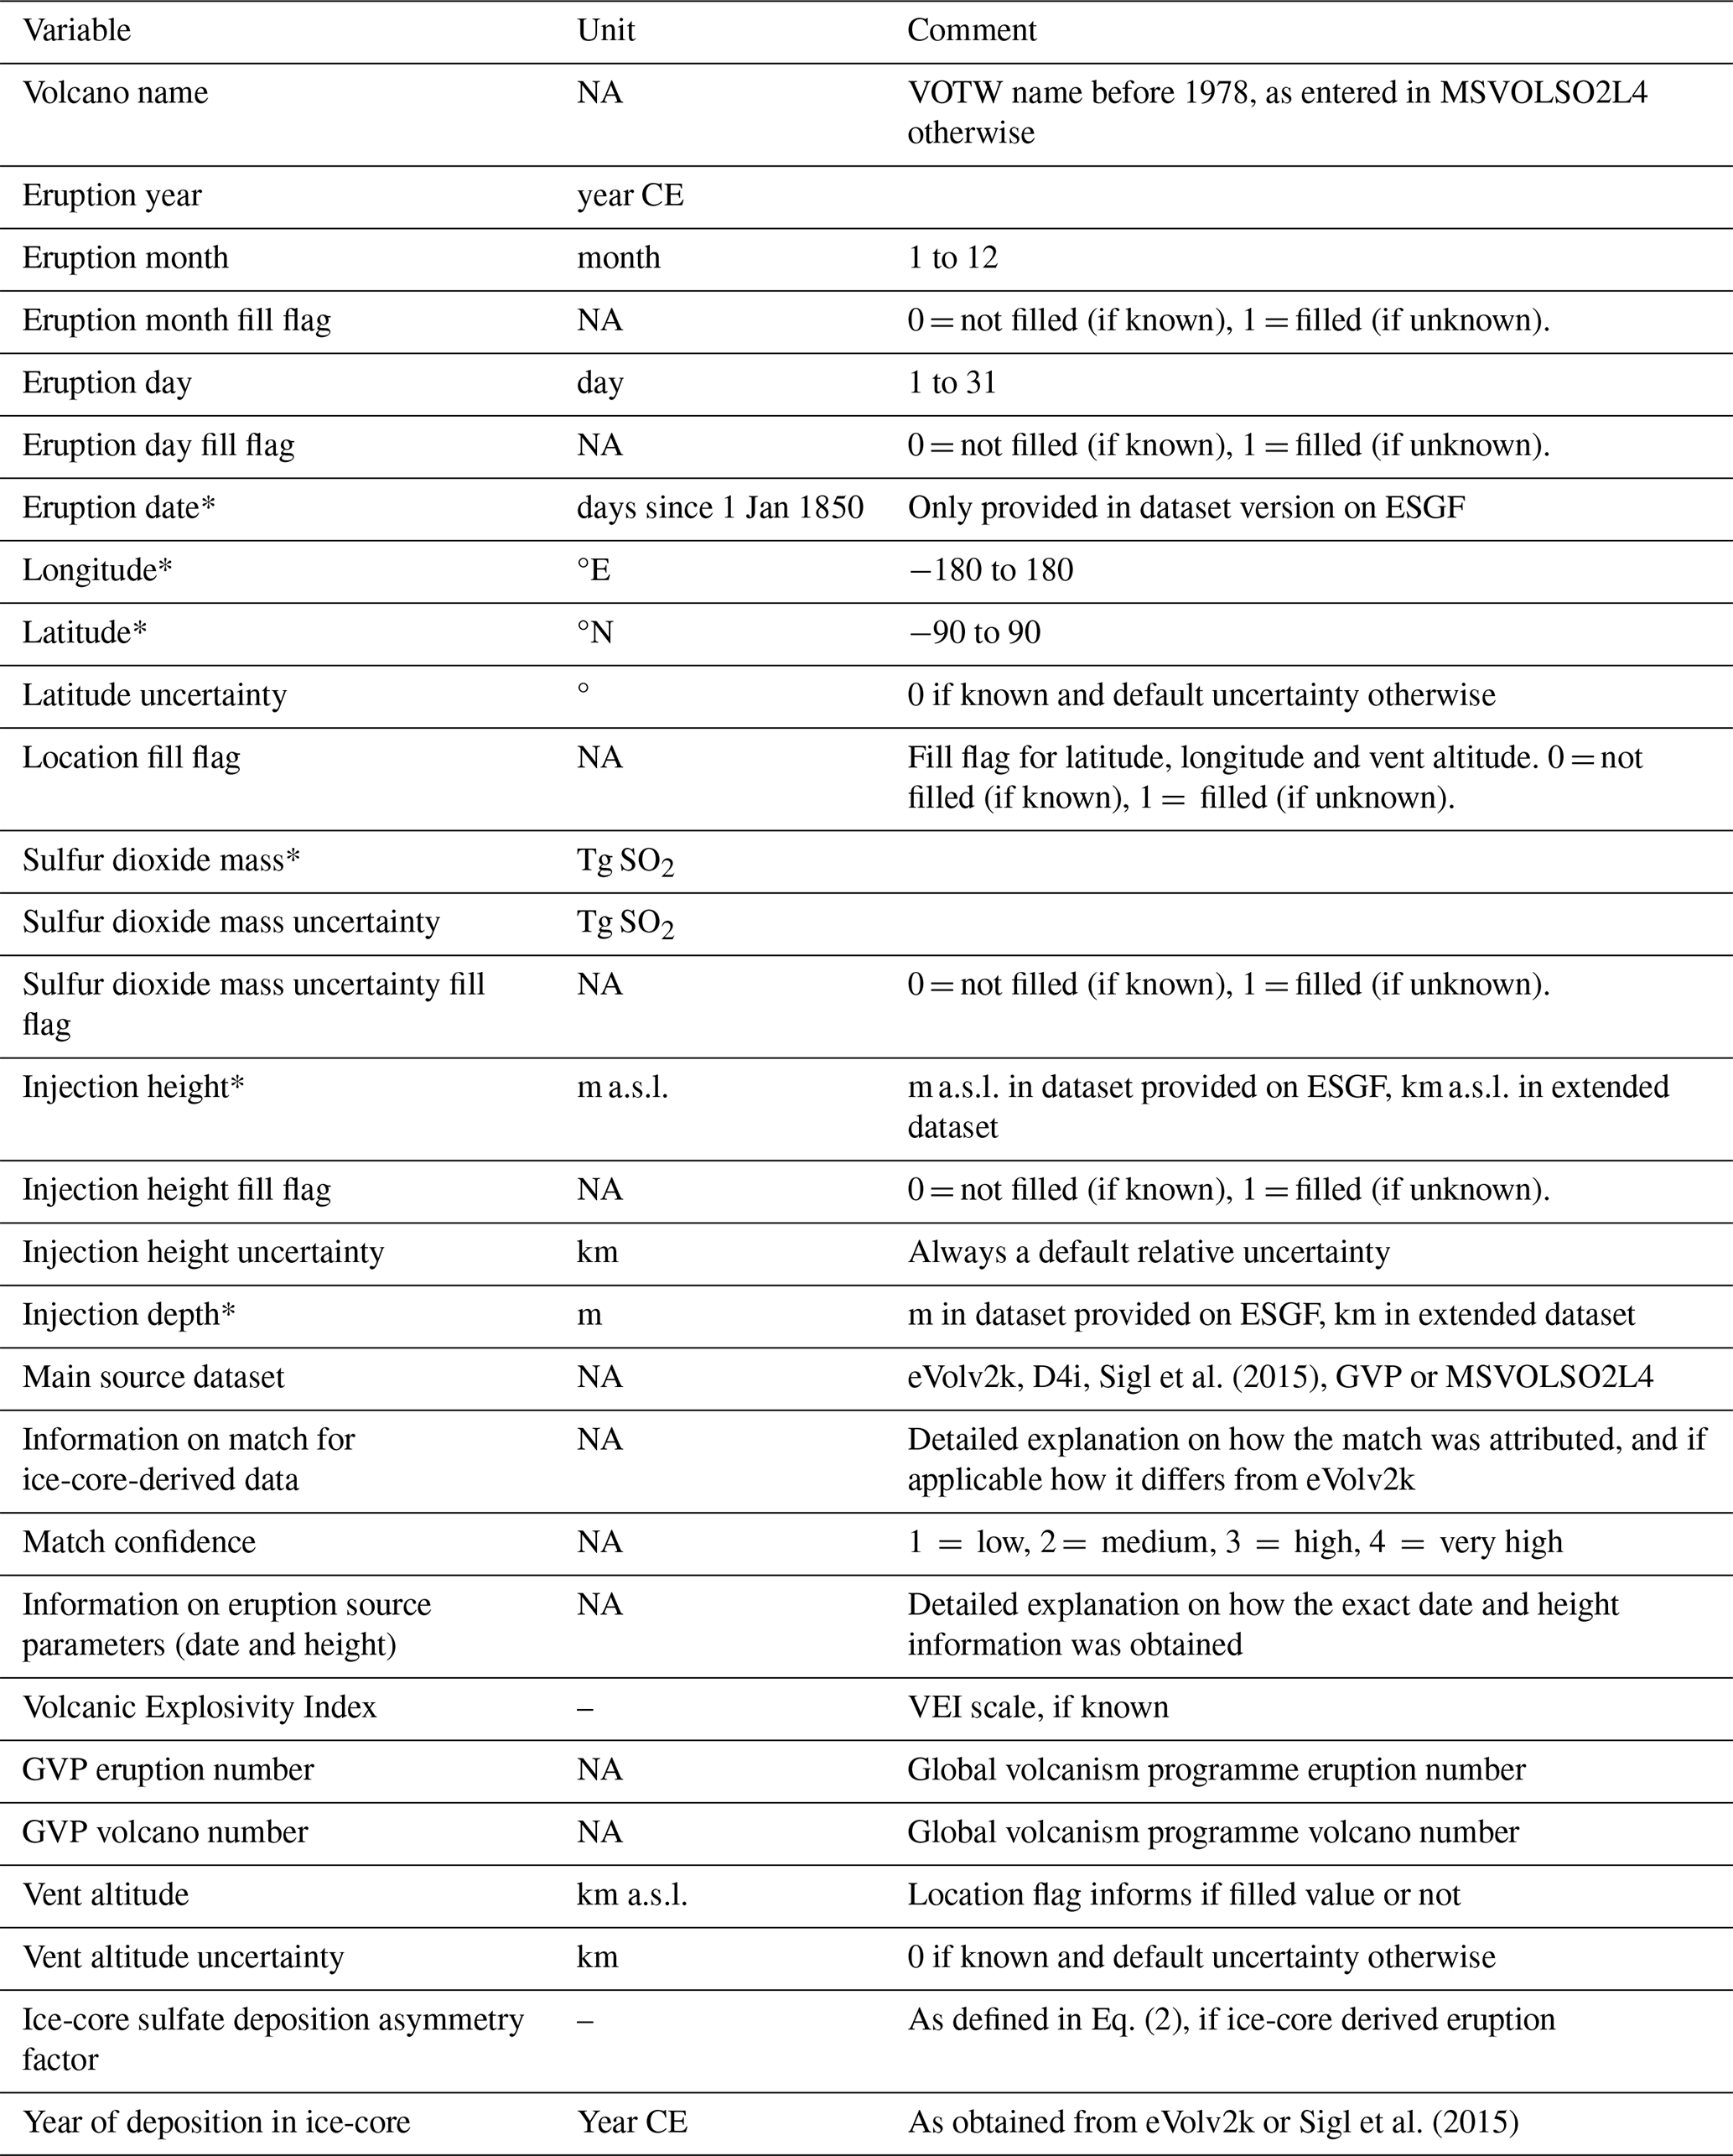
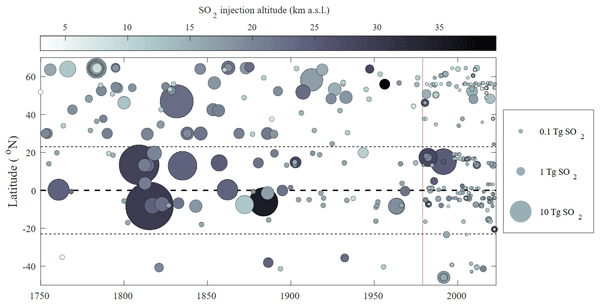
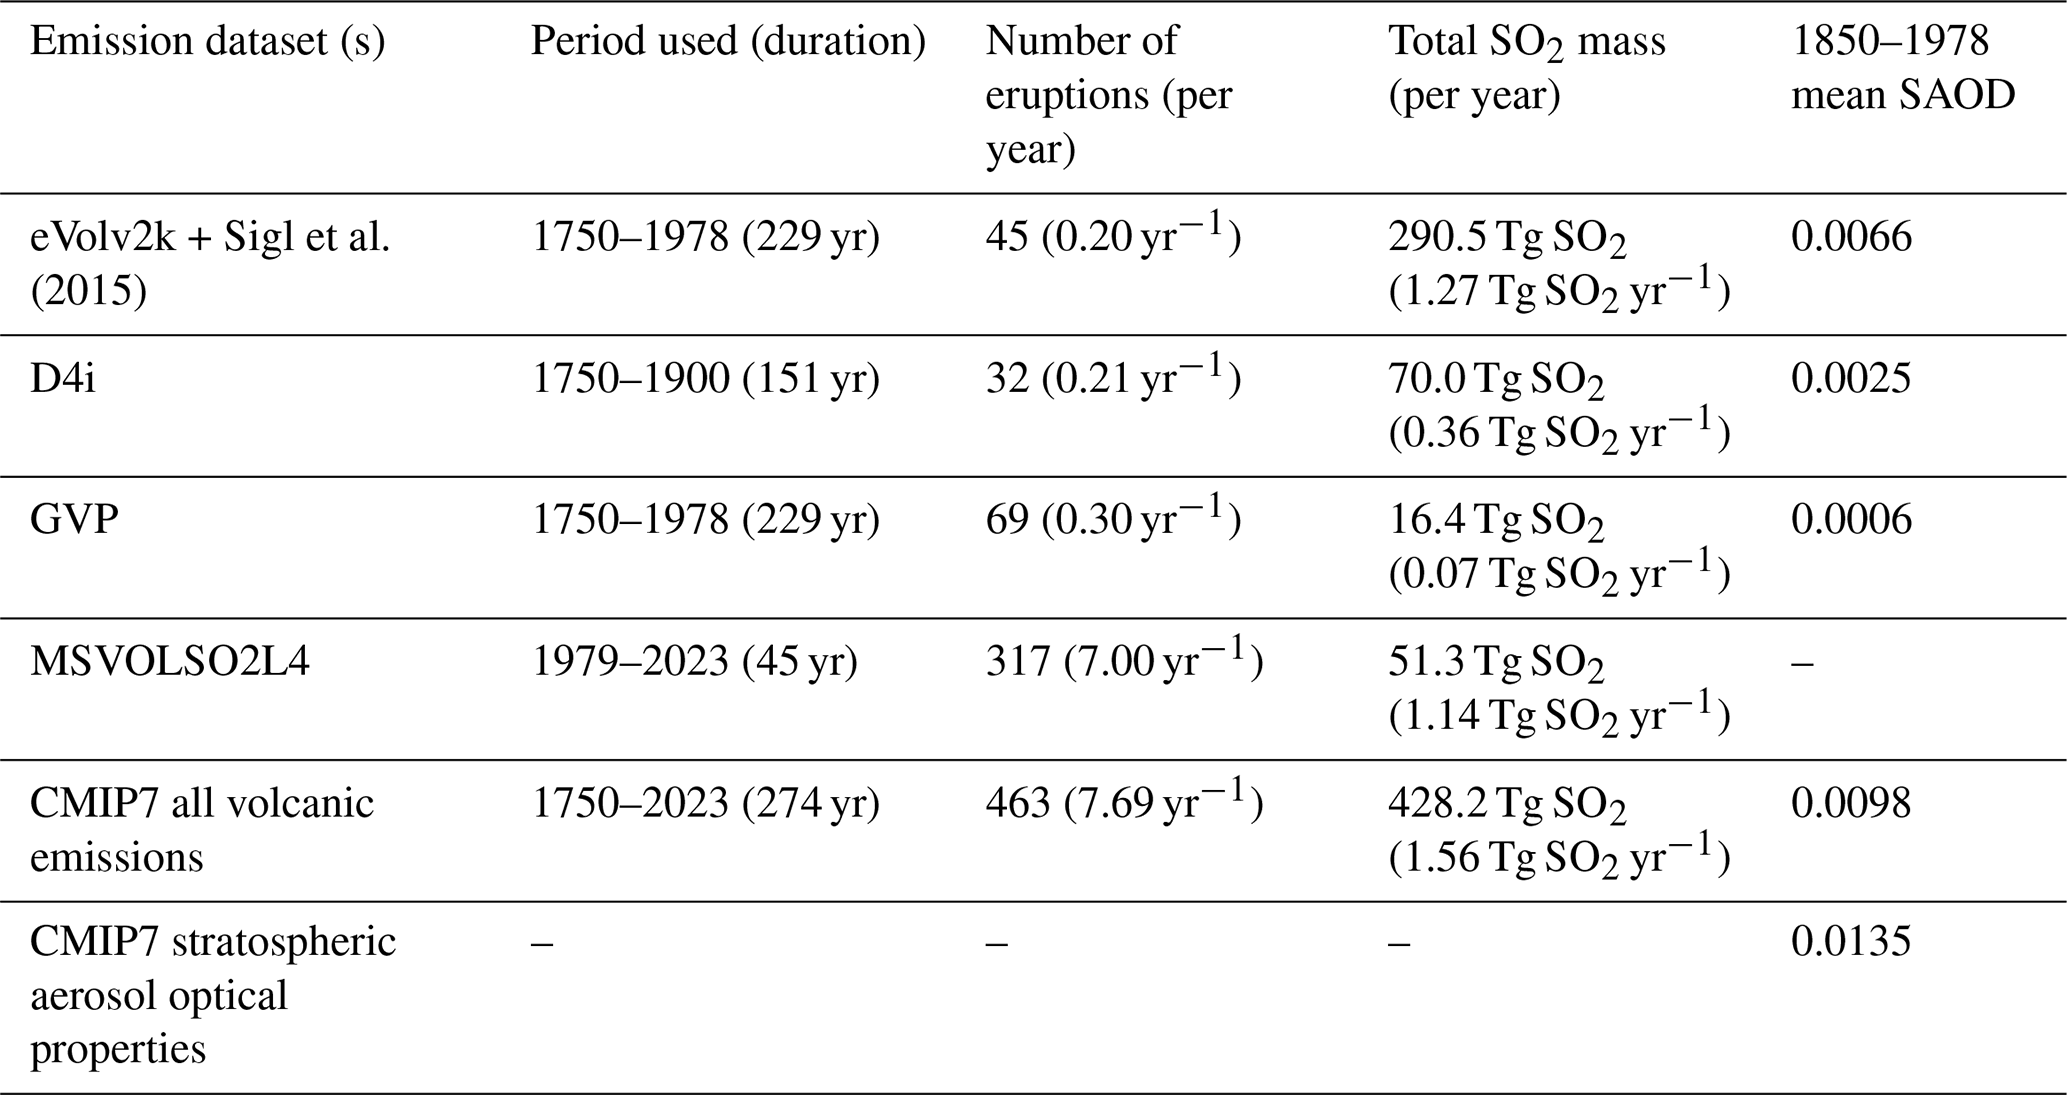
Figure 7 shows the CMIP7 emission dataset, with Table 4 summarizing key metrics. The most prominent eruptions of the dataset, e.g. the 10 Laki eruptive phases in 1783–1784, an unidentified eruption in 1809, and Tambora in 1815, all happen before 1850 and thus will not affect historical climate simulations run by most models (Dunne et al., 2025) nor the pre-industrial control climatology of stratospheric aerosol optical properties (Aubry et al., 2026a). Over 1850–2021, the most prominent eruptions are an unidentified eruption in the early 1860s attributed to the 1861 eruption of Kie Besi in CMIP7, the 1883 eruption of Krakatau, the 1912 eruption of Katmai, the 1963 eruption of Agung, the 1982 eruption of El Chichón and the 1991 eruption of Mt. Pinatubo. Over 1750–2023, the dataset contains 463 eruptions (7.69 yr−1) injecting 428.2 Tg SO2 (1.56 Tg SO2 yr−1). Although most of these injections are stratospheric, some are upper-tropospheric and will not affect the CMIP7 stratospheric aerosol optical properties dataset (Aubry et al., 2026a) because the reduced complexity aerosol model (EVA_H v2) used for CMIP7 does not account for potential transport from the troposphere to the stratosphere, or volcanic cloud self-lofting. Figure 7 qualitatively shows that small-to-moderate magnitude eruptions are under-recorded before the satellite era in our dataset, despite our best efforts to include them using the D4i and GVP datasets. Over their respective periods, the D4i dataset contributes an average of 0.36 Tg SO2 yr−1, the GVP dataset 0.07 Tg SO2 yr−1, and the eVolv2k and Sigl et al. (2015) datasets (which mostly capture large-magnitude eruptions) 1.27 Tg SO2 yr−1. Averaged between 1850 (the start year of CMIP7 historical experiments) and 1978 (the last year before use of satellite data), a period for which CMIP7 stratospheric aerosol optical properties are derived from the CMIP7 emission dataset, the CMIP7 global mean SAOD at 550 nm is 0.0135 (Aubry et al., 2026a). Volcanic SO2 emissions contribute 0.0098 (73 %) of this SAOD (Table 4), and the non-volcanic background contributes 0.0037 (27 %) of it. For the volcanically-driven mean SAOD, 0.0006 (6 %) is contributed by GVP-derived eruptions, 0.0025 (26 %) by D4i-derived eruptions, and 0.0066 (68 %) by eruptions derived from eVolv2k and Sigl et al. (2015) (Table 1).
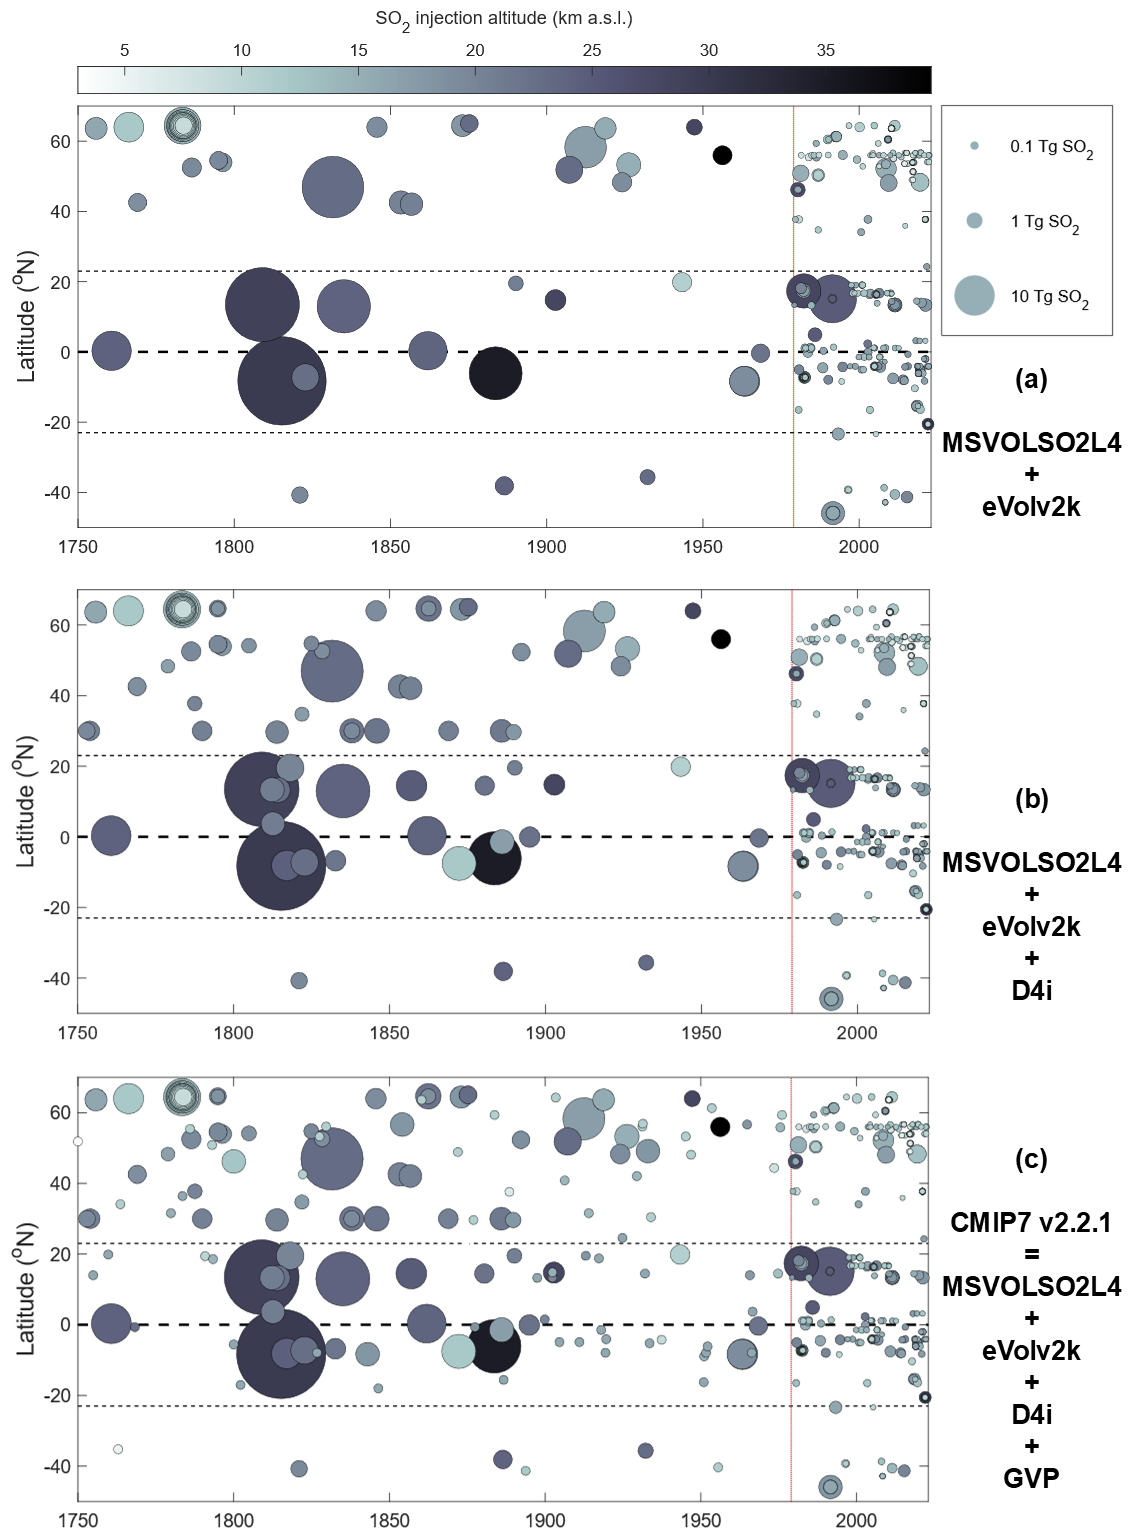
Figure 7Volcanic SO2 emission dataset, with each dot showing an eruption as a function of time and latitude. Dot size scales with SO2 mass, whereas shading is associated with injection height. The vertical red dotted line highlights the year 1979 from which we rely primarily on satellite-derived emission parameters (MSVOLSO2L4 dataset). Panel a shows emissions obtained from MSVOLSO4, eVolv2k and Sigl et al. (2015) only, and panel b from MSVOLSO2L4, eVolv2k, Sigl et al. (2015) and D4i only. Panel c shows the CMIP7 v2.2.1 dataset obtained by combining the five main source datasets (MSVOLSO2L4, eVolv2k, D4i, Sigl et al., 2015, and GVP).
Table 4Key metrics characterizing source emission datasets, as processed for use in the CMIP7 emission dataset. Number of eruptions and SO2 masses are for the period used. The last column is the 1850–1978 (pre-satellite historical period) global mean stratospheric aerosol optical depth (SAOD) at 550 nm, calculated using the EVA_H v2 aerosol model used to produce CMIP7 stratospheric aerosol optical properties (Aubry et al., 2026a). The second last row corresponds to metrics for the full CMIP7 emission dataset. The last row is not an emission dataset, but indicates the SAOD in the CMIP7 dataset, i.e. the combination of volcanic emission-derived (second last row) and background non-volcanic stratospheric aerosol optical properties.
5.2 Recommendations for the time, horizontal and vertical distribution of volcanic emissions in model studies
We do not provide eruption duration nor the exact horizontal or vertical distribution of the SO2 cloud because it is unconstrained for most eruptions. We thus make recommendations for these parameters hereafter and strongly encourage modelling groups to explicitly document how they specify them when implementing our dataset, regardless of whether or not they follow our recommendations.
We recommend an injection duration of 24 h for all eruptions. Durations on the order of hours-days are typical for explosive eruptions, e.g. the median and average duration of eruptions documented in the IVESPA database are 4 and 45 h, respectively. Furthermore, in MSVOLSO2L4, emissions for eruptions with durations longer than one day (e.g. Eyjafjallajökull 2010) are provided daily, consistent with a 24-h duration. Last, a 24-h duration is standard practice in the interactive stratospheric aerosol community (e.g. VolMIP Tambora experiment, Clyne et al., 2021) and this recommendation thus promotes consistency with existing model experiments.
For the horizontal injection structure, we recommend injection in the model grid cell containing the volcano latitude and longitude. This strategy is again standard practice in the community (e.g. Clyne et al., 2021 for VolMIP Tambora experiment; Quaglia et al., 2023 for ISA-MIP HErSEA experiments), promoting consistency between model experiments. Schallock et al. (2023) have prescribed a 3-dimensional (including horizontal) structure of SO2 injection consistent with satellite observations in simulations with the EMAC model, which could improve constraints on initial injection but is challenging to apply to pre-satellite era eruptions. Future work could use umbrella spreading models (e.g. Millward et al., 2023; Prata et al., 2025) to prescribe a horizontal injection extent consistent with spreading processes not accounted for in interactive stratospheric aerosol models.
Last, beyond the bulk injection height, the vertical structure of the SO2 injection is unconstrained for the vast majority of eruptions in our dataset, including for the satellite era. There is also no standard community practice to prescribe these emissions. Simulations with a 3-dimensional volcanic plume model for a wide range of eruption and atmospheric conditions suggest that the vertical profile of horizontal mass flux of gas and fine ash into the umbrella cloud (F) is well approximated by the following Gaussian profile (Aubry et al., 2019):
where z is the altitude a.s.l., Fmax the maximum flux value, z0 the vent altitude, and is the plume height (here taken as SO2 height) a.v.l. We thus used to define our injection depth (Sect 4.3), and recommend that modelling groups use this Gaussian profile to specify the vertical SO2 injection profile (Fig. 8). Should other profiles be specified, we recommend that the profile is always centered on the SO2 injection altitude (a.s.l.) provided in our dataset, and that most of the SO2 is injected over a vertical extent of 4 times the depth provided. For example, for a “top hat” profile with a constant flux between two altitudes, we would recommend the lower altitude is H depth, and the upper altitude HSO2+2x depth, with here expressed a.v.l. Corresponding top-hat profiles are shown in Fig. 8. We acknowledge that real-word SO2 clouds would thin as they spread, and that Eq. (5) best describes the injection profile within proximity of the volcano. However, given large uncertainties on reported injection height and the unsteady nature of most eruptions with variable plume height, we think it is preferable to overestimate rather than underestimate the injection depth used in aerosol models. Note that we expect that for some eruptions, part or most of the SO2 mass might be injected into the model troposphere when using the profile from Fig. 8 with provided emission height.
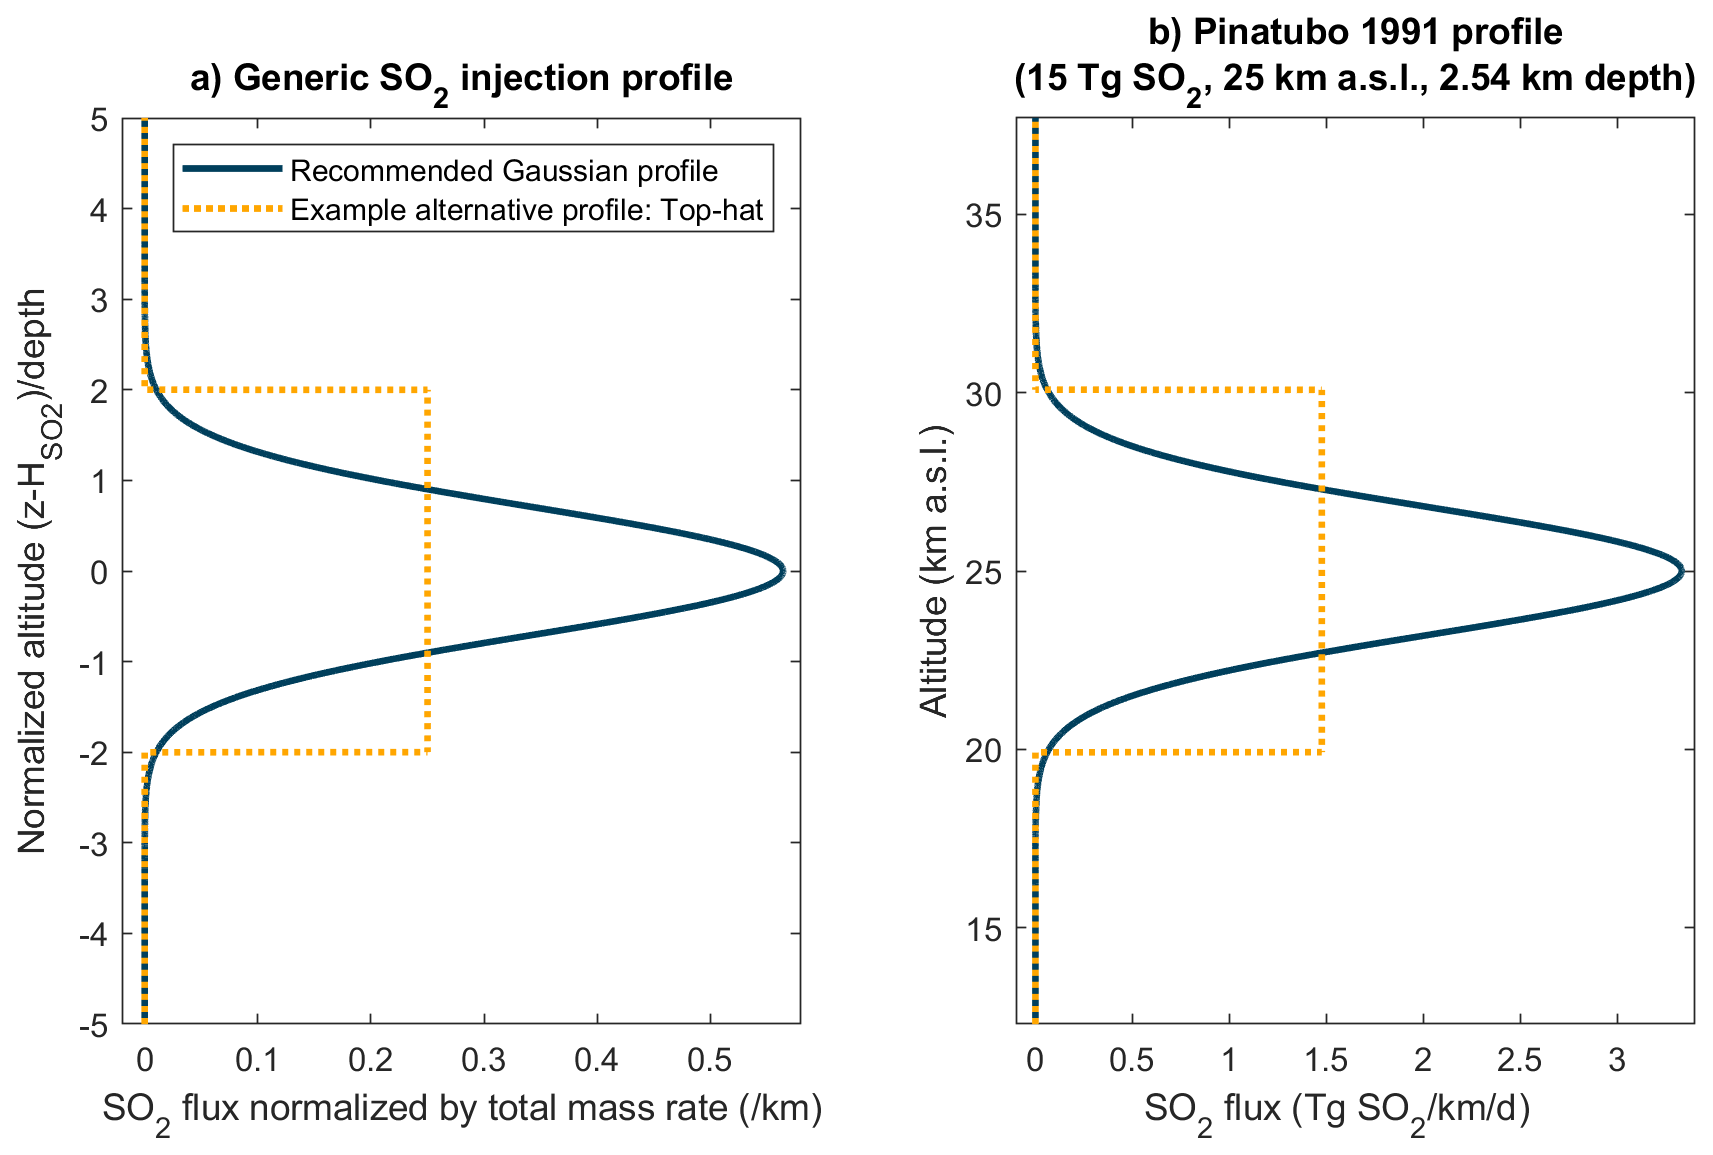
Figure 8SO2 vertical injection profiles recommended (Gaussian, blue; Eq. 5) and select example alternative profile (yellow dashed, top-hat). Panel (a) shows non-dimensional profile, whereas panel (b) shows the actual profile corresponding to a for the Pinatubo 1991 eruption.
6.1 Comparison with alternative source datasets
In choosing source datasets used for CMIP7, we aimed to use products that were most up to date, widely accepted by the volcano-climate community, and documented in peer-reviewed publications. However, alternative source datasets exist. To assess uncertainties in the CMIP7 dataset, we compare it (Fig. 9) to IVI2 (Gao et al., 2008), which is one of the most widely used ice-core inventory along with eVolv2k, and VolcanEESM (Neely and Schmidt, 2016), which is one of the only inventories covering both the pre-satellite and satellite eras. A detailed comparison of IVI2 and eVolv2k, extending beyond the CMIP7 period, is also provided in Toohey and Sigl (2017).
For the pre-satellite era, there are around twice as many more years with volcanic injections in the CMIP7 dataset compared to any of the other two inventories. This reflects our efforts to reduce the pre-satellite bias in small-to-moderate magnitude eruptions by using the D4i and GVP datasets in combination with more widely used ice-core records. Even for the satellite era, 7 years have volcanic injections in the CMIP7 dataset (i.e. MSVOLSO2L4), but not in the VolcanEESM dataset. These differences might be partially due to different filtering of low-mid tropospheric eruptions, but the MSVOLSO2L4 dataset also contains more eruptions. Both for the satellite and pre-satellite era, yearly volcanic SO2 injections are characterized by some discrepancies between datasets, although most of them are within uncertainties. Notable exceptions are year 1831, marked by the Zavaritskii eruption (Hutchison et al., 2025), with total SO2 injections of 25.9 Tg SO2 in CMIP7, vs. 17.9 Tg SO2 in VolcanEESM and 8.3 Tg SO2 in IVI2 (in which the distinct 1831 sulfate deposition, see Fig. 1, was not resolved in Antarctica). The 1861 injection, the largest historical (1850–) injection for which no eruption is robustly identified, ranges from 2.1 Tg SO2 in IVI2 to 9.8 Tg SO2 in VolcanEESM, with 9.1 Tg SO2 for CMIP7. IVI2 has a lower value because no sulfate was detected in Greenland in contrast to the ice cores used in CMIP7 (see Fig. 1). 1861 is one of the few eruptions for which the prescribed aerosol optical properties for CMIP6 were, as for CMIP7, derived from emissions using a stratospheric aerosol model (Luo, 2018). CMIP6 used the IVI2 inventory for emissions (Arfeuille et al., 2014), explaining the much stronger forcing for that eruption in CMIP7 (Aubry et al., 2026a). For year 1883 associated with the Krakatau eruption, IVI2, VolcanEESM and CMIP7 respectively estimate 10.7, 16.9 and 18.8 Tg SO2. Overall, the IVI2 inventory thus has much smaller masses in years with important discrepancies (partly explained by more conservative detection thresholds as described for the above examples). Notable exceptions exist, e.g. 1902 (Santa Maria eruption) for which both CMIP7 and IVI2 have emissions around 2 Tg SO2, whereas VolcanEESM reports 5 Tg SO2. Although satellite-era uncertainties on erupted SO2 mass are important, they are much smaller than the pre-satellite uncertainties. Both VolcanEESM and CMIP7 report total masses around 19.5 Tg SO2 for 1991 associated with the eruptions of Pinatubo and Cerro Hudson, with IVI2 only reporting 14.7 Tg SO2. IVI2 derived this estimate from ice-core only, making it more uncertain although the more recent ice-core based estimate of 21.3 Tg SO2 using Sigl et al. (2015) is consistent with satellite-derived estimates. Recent years marked by small-to-moderate eruptions have typical differences of 20 %–30 % between VolcanEESM and CMIP7, e.g. VolcanEESM reports 2 Tg SO2 injection for 2011, marked by the Nabro eruption, vs. 2.5 Tg SO2 in CMIP7.
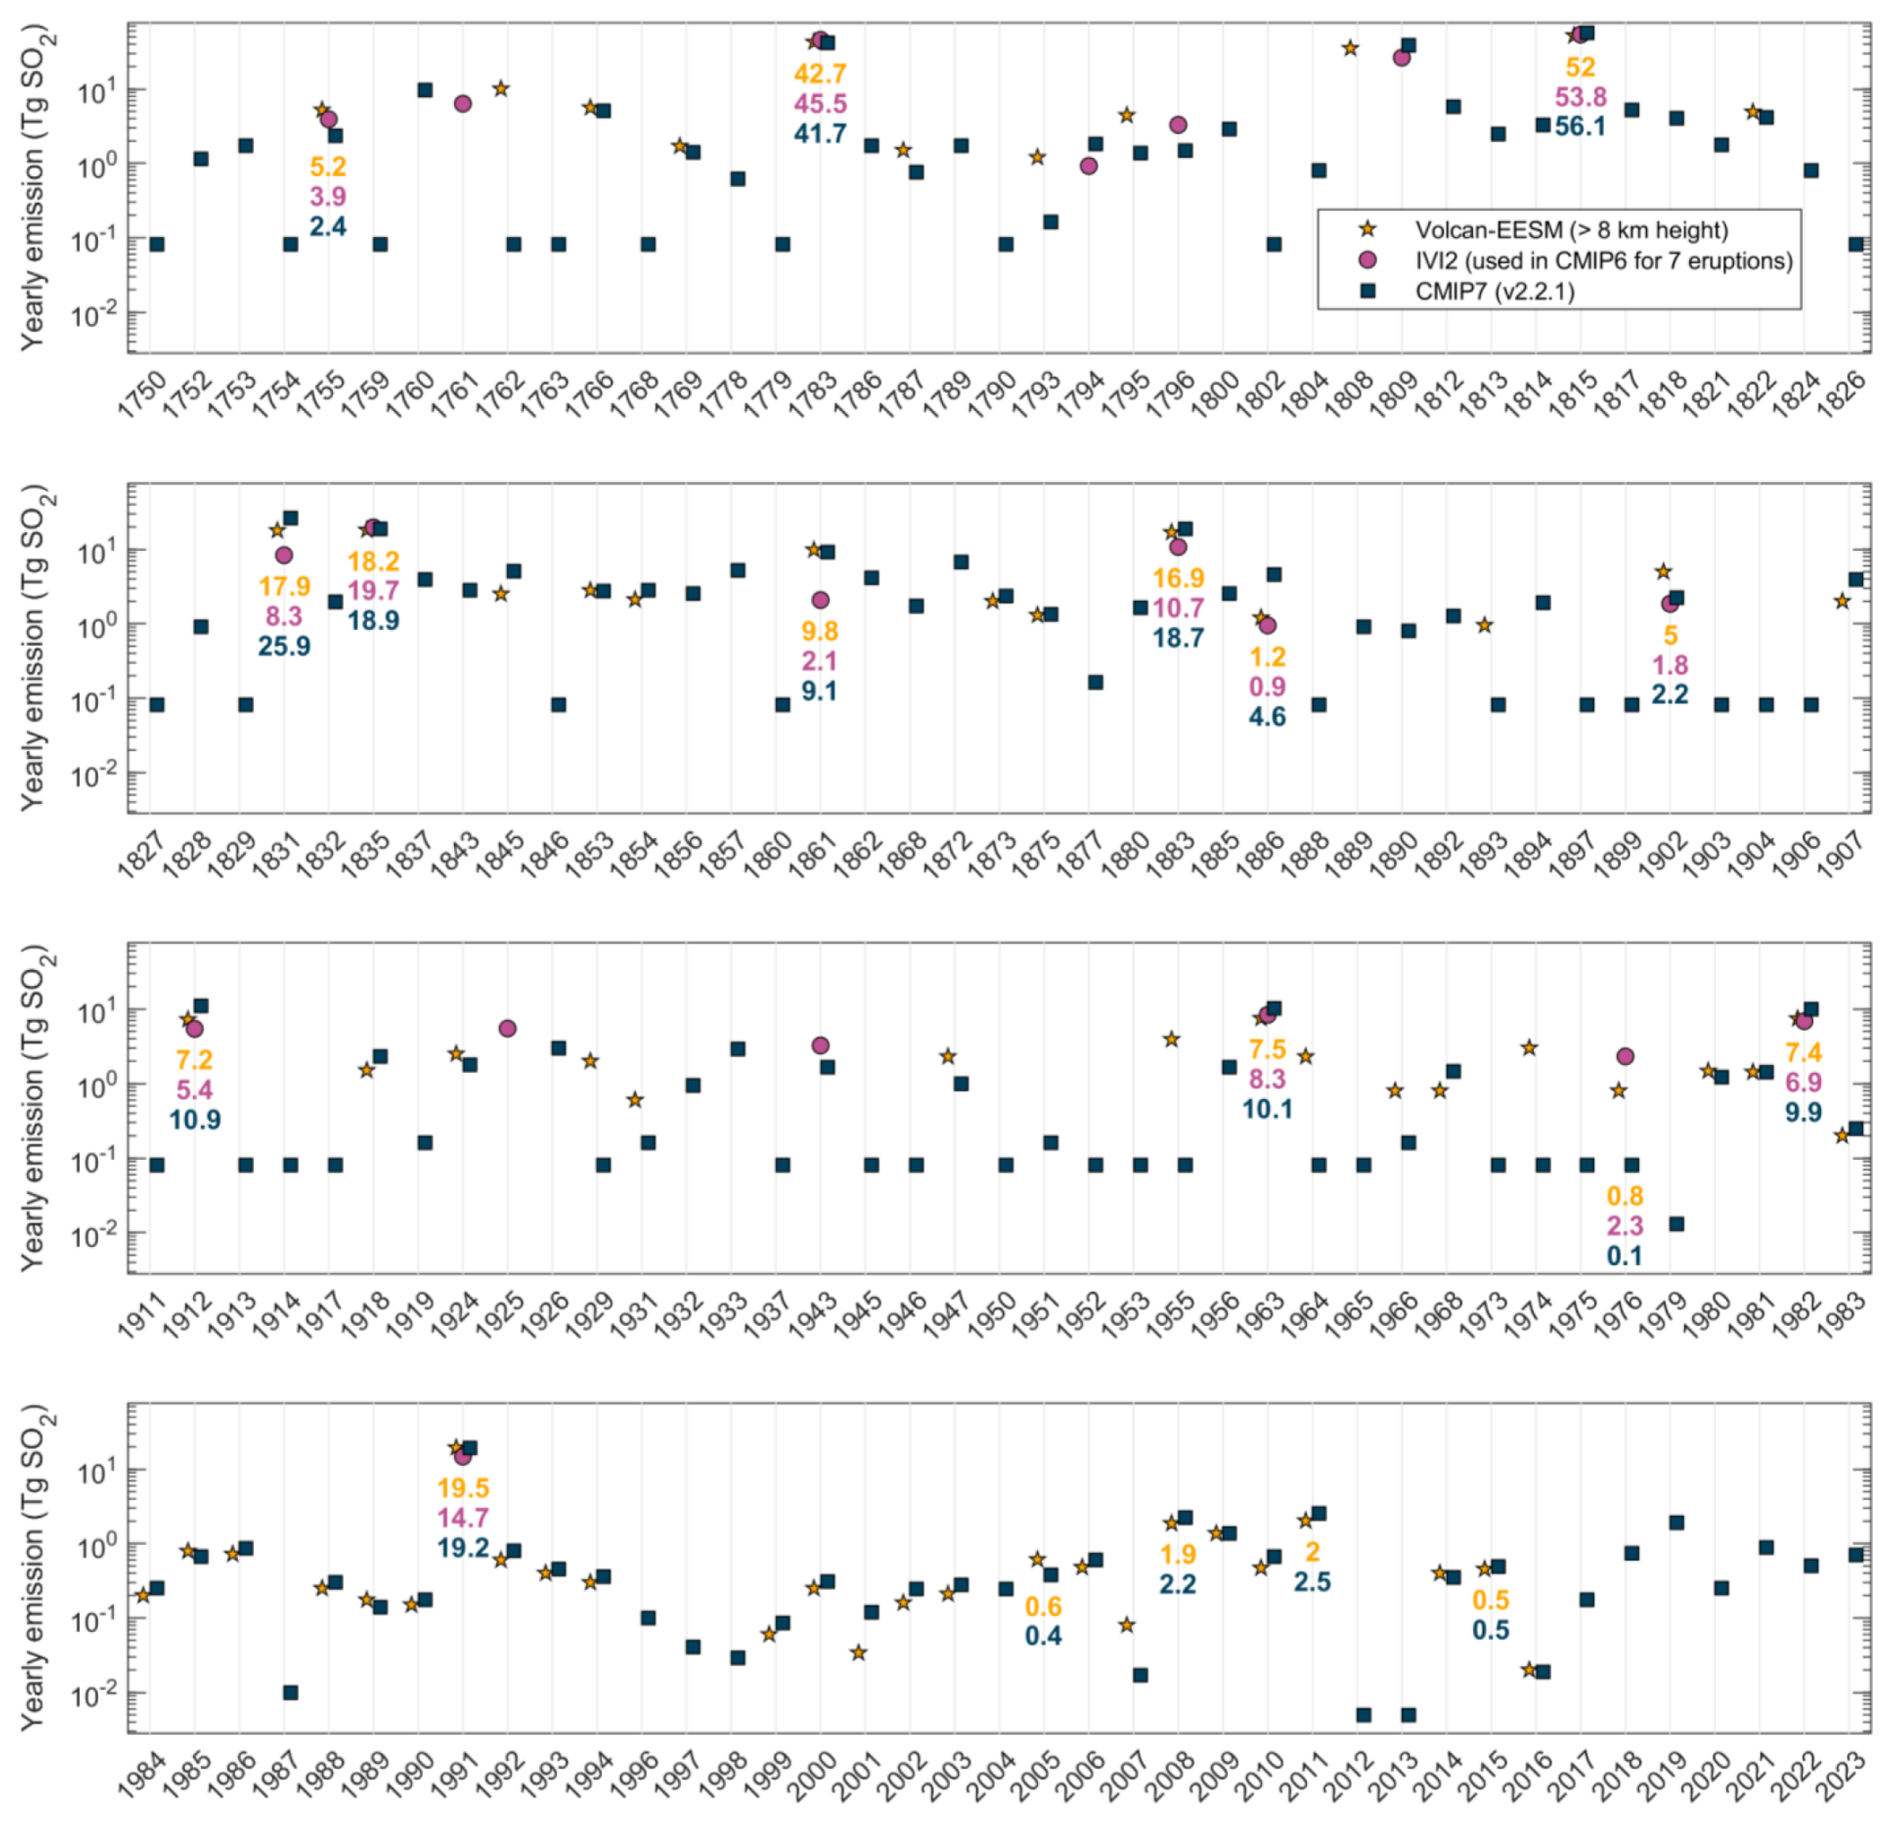
Figure 9Yearly volcanic SO2 emissions for the IVI2 (purple; Gao et al., 2008), VolcanEESM (yellow; Neely and Schmidt, 2016) and CMIP7 (dark blue; this paper) inventories. Annotated numbers show values for selected years. Only years with at least one inventory recording SO2 injections are shown.
6.2 Key uncertainties and opportunities for future improvements
Estimation of stratospheric sulfate injection from ice-core sulfate mass deposition is subject to large uncertainty (Gao et al., 2007; Toohey and Sigl, 2017; Fuglestvedt et al., 2024). First, transfer functions are used to convert ice-sheet mean (i.e. averaged over an ice-core array) deposition estimates to total stratospheric sulfate loadings. Such transfer functions have been developed using climate-aerosol model simulations (e.g. Gao et al., 2007) or the distribution of fission products in Greenland from thermonuclear testing used as an analogue for stratospheric injection in the Northern Hemisphere extra-tropics (Clausen and Hammer, 1988). Currently, two separate functions are used, one for tropical eruptions and one for extratropical eruptions. Sensitivity studies with the Community Earth System Model (CESM) Whole Atmosphere Community Climate Model version 6 (WACCM6) suggested that current transfer function may be biased by up to 20 % and be strongly sensitive to atmospheric variability and eruption parameters (Fuglestvedt et al., 2024). Second, ice-core datasets used in CMIP7 assume that the sulfate deposited in ice-core is entirely sourced from the stratosphere, even though tropospheric transport to ice-core locations is possible for extra-tropical eruptions. Recent high-resolution measurement of sulfur isotopic composition (i.e. 33S, 34S) in Greenland ice cores for key explosive volcanic eruptions demonstrated that the fraction of stratospheric sulfur to the total deposited sulfur varied between ca. 60 % for eruptions in Alaska and 100 % for eruptions located in the tropics (Burke et al., 2019, 2023; Pearson et al., 2022). Correcting for the non-stratospheric component within the ice-core records reduced the estimates of sulfur injection for the respective eruptions (Burke et al., 2023). However, high-resolution sulfur isotope analyses of ice cores have only been applied to a small number of historical eruptions (Baroni et al., 2007; Burke et al., 2019; Hutchison et al., 2025). For the 20th century, a third major source of uncertainty is discriminating between volcanic and anthropogenic sources of sulfate, especially for Greenland ice-cores. Novel approaches are urgently needed to better quantify anthropogenic sulfate depositions over Greenland, including distinct source tracers of anthropogenic pollution in the ice cores, isotopic constraints (e.g. 34S, 15NO3), to discriminate natural and anthropogenic emissions, or by developing historical sulfate emissions based on inverse modeling of ice-core records (Eckhardt et al., 2023; Geng et al., 2014; Jongebloed et al., 2023; Moseid et al., 2022). The golden era of ice core drilling was in the 1990s, which means that sample density and spatial representation are rapidly declining in the past 30 years (see e.g. Gao et al., 2008; Sigl et al., 2014). Updating records at former drill sites (e.g. GISP2, NEEM, NGRIP) and analyzing sulfate to capture the last 30 years is key to close this data gap and improve calibration of ice-core records with instrumental data. Diagnostic tracers for the presence of tephra are now available (Plunkett et al., 2023), and methods have improved to geochemically characterize small ash shards typical for most eruptions (Innes et al., 2025; Iverson et al., 2017; Narcisi et al., 2019). These techniques should be employed (in tandem with sulfur isotopes) to target volcanic eruptions in the historic period that are currently highly uncertain e.g. unidentified eruptions in 1761, 1809, 1861.
In addition to the above key source of uncertainties which affect the estimation of SO2 mass for eruptions detected in ice-cores, another crucial source of uncertainty is the detection of these eruptions itself. Figure 10b shows the mean SO2 flux associated with eruptions of different SO2 mass. For small-to-moderate magnitude eruptions (<3 Tg SO2) with short return period, we would expect the distributions for the satellite era (after 1979) and pre-satellite era to be the same if there was no major change to eruption frequency-magnitude distribution through time, and if the CMIP7 dataset was unbiased. Yet, the emissions associated with eruptions <1 Tg SO2 are one order of magnitude smaller pre-satellite era, which we interpret to be a consequence of difficulties in detecting small eruptions in ice-cores. The emissions associated with eruptions 1–3 Tg SO2 are twice as large in the pre-satellite era than for the satellite era. Although with only 5 such eruptions (6 if combining individual Nabro 2011 phases), the satellite record might be too short (45 years) to accurately estimate the long-term mean emissions of 1–3 Tg SO2 eruptions, this discrepancy could be explained by an overestimation of the stratospheric SO2 mass associated with eruptions in the D4i inventory. 37 % of the 1–3 Tg SO2 1750–1978 eruptions originate from D4i in CMIP7, but the Greenland-only, single-core nature of this source dataset might make it more likely to record deposition of sulfate of tropospheric origin. These biases have important consequences for stratospheric aerosol optical properties (Fig. 10c). The CMIP7 dataset was designed so that the mean 1850–1978 SAOD anomaly associated with small-to-moderate magnitude eruptions is equal to the 1998–2023 SAOD anomaly, assuming that this period is long enough to capture the long-term SAOD distribution associated with small-to-moderate magnitude eruptions. However, Fig. 10c shows that the pre-satellite era is likely characterized by too many months having SAOD anomalies, a consequence of the lack of small-to-moderate magnitude eruptions (Fig. 10b), and too many months with SAOD anomalies, which might be a consequence of the overestimation of the stratospheric SO2 injections for eruptions injecting 1–3 Tg SO2 (Fig. 10b). The under-recording of small-to-moderate magnitude eruptions in ice-core is particularly prominent for tropical eruptions (average emissions ≈3 times smaller pre-satellite era relative to satellite era) and extra-tropical southern hemisphere eruptions (average emissions one order of magnitude smaller pre-satellite era relative to satellite era) (Fig. 10a). In addition to biases associated with frequency-magnitude distribution, the CMIP7 emission and aerosol optical property dataset are also subject to spatial biases pre-satellite era, for small-to-moderate magnitude eruptions. Well synchronized, high-elevation, and high snow accumulation ice-core records would be helpful to improve the detection of small-to-moderate magnitude eruptions in Antarctica and future updates should focus on the inclusion of ice-core records from such sites (e.g. Thomas et al., 2023; Pasteris et al., 2014; Dixon et al., 2004) ideally paired with cryptotephra and sulfur isotope analyses (Gautier et al., 2019; Piva et al., 2023). Last, future studies should quantify the radiative forcing and climate impacts associated with differing small-moderate magnitude eruption representation between CMIP6 and CMIP7 (v2.2.1), and between CMIP7 (v2.2.1) and future dataset versions with further reduction of biases discussed in this section.
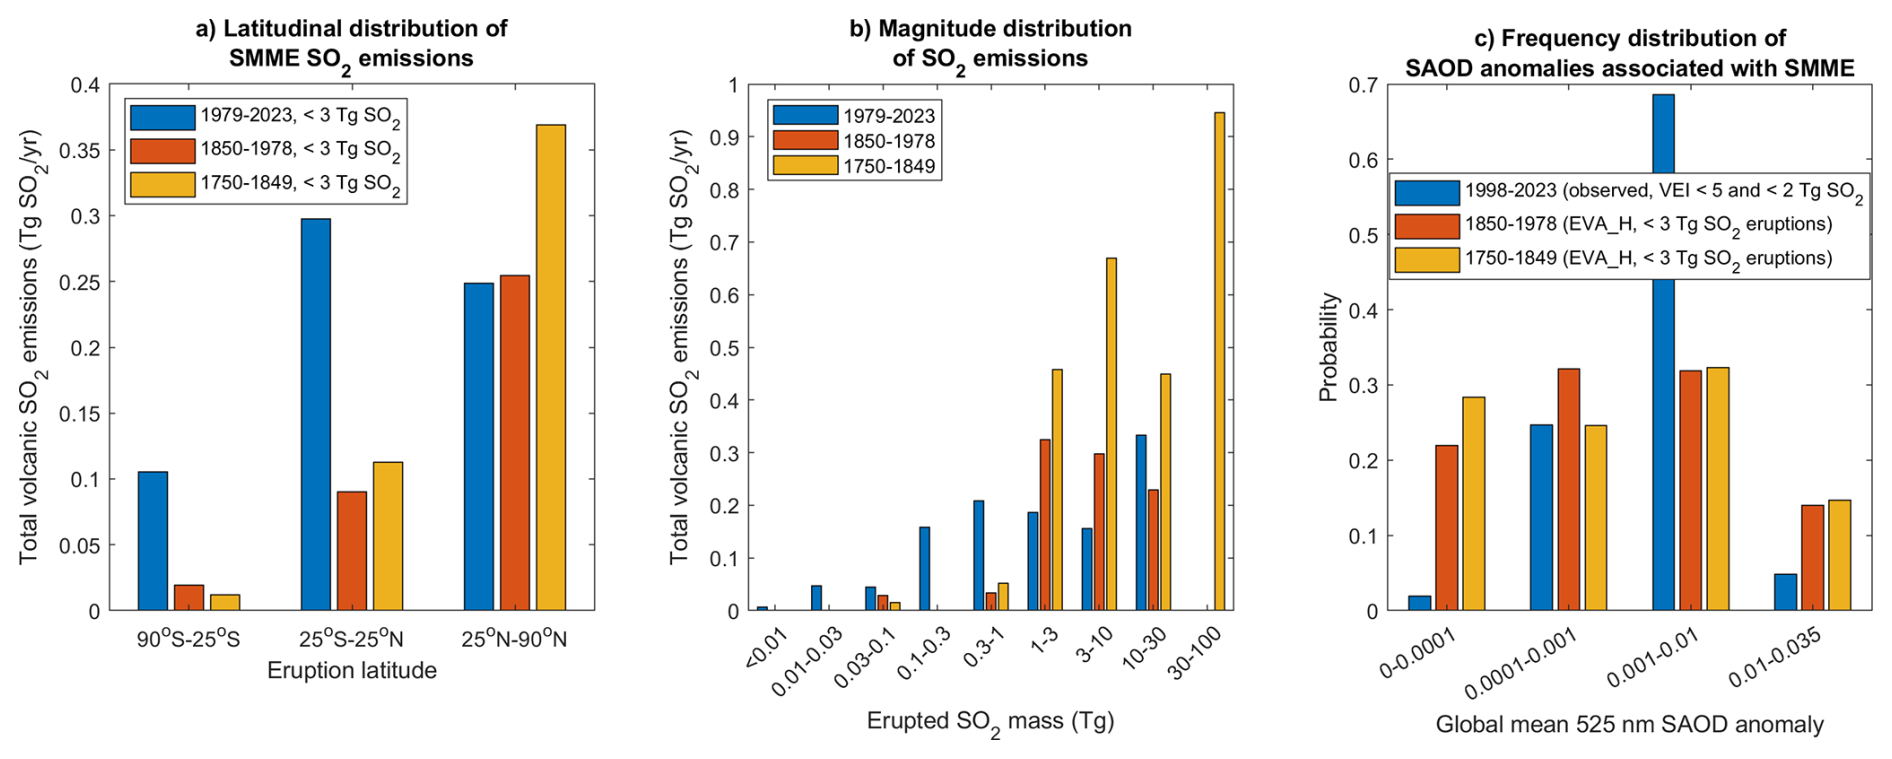
Figure 10Latitudinal (a) and magnitude (b) distribution of SO2 emissions in the CMIP7 dataset for the 1979–2023 (satellite era), 1850–1978 (pre-satellite era, contributing to the CMIP7 pre-industrial control climatology) and 1750–1849 (not contributing to the CMIP7 pre-industrial control climatology, and not included in CMIP7 standard historical simulations). Panel (a) only shows emissions associated with small-to-moderate magnitude eruptions (SMME, <3 Tg SO2) as over such short periods, the latitudinal distribution of emissions from larger eruptions might not reflect the expected long-term latitudinal distribution. Panel (c) shows global mean monthly SAOD anomaly distributions associated with SMMEs. For the satellite era, only years from 1998, characterized by SMMEs only, are considered, and the anomaly is calculated as the deviation from the minimum value. For pre-satellite era, we simply ran the EVA_H v2 model using volcanic emissions from SMMEs only, and did not include background non-volcanic stratospheric aerosols.
Although uncertainties and future improvements in ice-core derived volcanic SO2 injection mass and their attribution to specific historical eruptions are the most important for our dataset, numerous other sources of uncertainty exist. For the pre-satellite era, for identified eruptions, detailed volcanological studies are key to reconstruct eruption source parameters including the eruption sequence and potential occurrence of multiple events (i.e., eruptive phases) injecting sulfur in the stratosphere or upper troposphere, the(ir) precise timing and the(ir) associated injection height. When the top or spreading height of the ash plume is reconstructed from deposit, large uncertainties affect both the height estimate itself (e.g. Rossi et al., 2019) and their conversion to the SO2 injection height (Engwell et al., 2023; Eq. 1). For unidentified eruptions and for the numerous eruptions of VEI 3–5 with limited published information on eruption source parameters, we made ad-hoc assumptions for these key emission parameters including eruption timing, injection height, and sometimes latitude. Although we proposed new empirical relationships to assign missing injections heights (Fig. 5) and latitudes (Fig. 4), these are subject to high uncertainties. Future work should refine these relationships and complement them with additional constraints, e.g. from sulfur isotope for injection height. Last, although satellite-era eruptions are by far the best constrained in terms of height and mass, with no uncertainty on location and timing, they are also subject to some uncertainties (Fig. 9 and, e.g., Timmreck et al., 2018; Vernier et al., 2024). The creation of an uncertainty product for the CMIP7 volcanic emission inventory will be key to documenting these uncertainties in detail and quantifying how they propagate to aerosol optical properties, including uncertainties on volcanic injection mass (Sects. 3 and 4.5), latitude (Sect. 4.2) and height (Sect. 4.4).
6.3 Stratospheric emissions: beyond volcanic sulfur
Volcanic eruptions emit other forcing agents than sulfur, including halogens (e.g., Cl, Br, I), water vapor and ash. These are not constrained in our dataset, but these co-emissions have a direct radiative forcing effect (e.g. Vernier et al., 2016) and can influence the life cycle and transport of volcanic sulfur species (e.g. Zhu et al., 2020; Staunton-Sykes et al., 2021; Wells et al., 2023) and thus volcanic sulfate aerosol forcing. Stratospheric halogen emissions play a crucial role in stratospheric ozone depletion impacting atmospheric chemistry (e.g. Solomon et al., 2016; Brenna et al., 2019). Volcanic eruptions can emit large amounts of halogens but most are scavenged in the plume by water and ice so that the quantities directly injected into the stratosphere are often poorly constrained (Tabazadeh and Turco, 1993; Textor et al., 2003). The ice-core community is widely measuring most of these species in cores (Cl, F, Br, tephra) and use them for source attribution (e.g. McConnell et al., 2017; Gabriel et al., 2024) but quantifying the stratospheric emissions of these compounds remains challenging given their high reactivity in the atmosphere and snowpack (Zhai et al., 2023). Last, the Hunga Tonga 2022 eruption unravelled how different the composition, life cycle and forcing of volcanic clouds associated with shallow submarine eruptions can be (APARC, 2025; Colombier et al., 2025). This eruption injected only 0.5–1 Tg SO2 (Carn et al., 2022), but 146 Tg of water vapor (Millán et al., 2022) into the stratosphere. The injected water accelerated and enhanced sulfate aerosol growth, resulting in a disproportionate aerosol forcing compared to any eruption previously observed by satellite (Sellitto et al., 2022). The stratospheric water vapor also resulted in a positive top-of-the-atmosphere radiative forcing which partially offset the negative aerosol forcing (APARC, 2025). In addition to volcanic forcing agents co-emitted with sulfur, the CMIP7 emission dataset also does not compile source of non-volcanic aerosols. New stratospheric aerosol sources are emerging as a consequence of human activities including pyrocumulonimbus produced by increasingly intense wildfires (e.g. Peterson et al., 2025; Murphy et al., 2025), and aerosol associated with the space industry including rocket launches and spacecraft debris (Brown et al., 2024; Murphy et al., 2023). Developing emission datasets for both non-sulfur volcanic aerosols (precursors) and non-volcanic aerosols (precursors) and incorporating them into the CMIP7 emission dataset is a key future direction.
6.4 Requirements for dataset operationalization
Naik et al. (2025) highlight the importance of the operationalization of the production of CMIP forcing datasets, i.e. the extension (and, if needed, updating) of these datasets on an annual basis instead of on the CMIP-cycle (≈7 years). For the extension of the volcanic emission dataset, i.e. an extension in time with no major change in methodology and no change to the period covered by the previous version, we are currently reliant on continued extensions of the MSVOLSO2L4 dataset. These extensions are reliant on the continued availability of operational SO2 products from nadir-viewing, hyperspectral UV and IR sensors on polar-orbiting US (NASA/NOAA), European (ESA/Copernicus) or other satellites. Currently, we expect the UV OMPS and TROPOMI instruments (and the follow-on Copernicus Sentinel-5 mission) to continue operations through the next decade and beyond. New Chinese satellite missions are also beginning to provide volcanic SO2 measurements (e.g. Zeng et al., 2025). Emission datasets produced by other groups (e.g. Carboni et al., 2016) could be utilised should the NASA-supported MSVOLSO2L4 be discontinued, but would be subject to the same requirements highlighted above in terms of availibility of satellite products, as well as continued funding for the team(s) curating these datasets.
Although dataset extension is the key concern for the operationalization of CMIP forcing production, the volcanic SO2 emission dataset is particularly uncertain pre-satellite era, as evident from differences between CMIP6 and CMIP7 stratospheric aerosol optical properties (Aubry et al., 2026a). Regular updating of the dataset as new knowledge becomes available is thus important. This requires support to improvements to ice-core datasets discussed in Sect. 4.2, as well as to the widespread volcanology and tephra research on which our dataset is reliant, such as the Smithsonian GVP database (Global Volcanism Program, 2025), studies linking specific historical eruptions to ice-core sulfate deposition (e.g. Hutchison et al., 2025), and studies quantifying eruption source parameters of historical eruptions (e.g. Self and Rampino, 2012) and associated databases (e.g. IVESPA, Aubry et al., 2021). To facilitate the use of published data in the CMIP7 emission dataset and beyond, relevant published data should ideally: (i) have an associated peer-reviewed publication; (ii) include units of parameters, with plume heights a.v.l. vs. a.s.l. or sulfur masses in Tg SO2 vs. Tg H2SO4 vs Tg SO4 typically requiring clarification; (iii) where possible, document uncertainties including clear confidence level and what source of uncertainties where accounted for; (iv) where updating an existing dataset, keep format as consistent as possible with predecessor version to minimize work associated with using a new version; and (v) make source data open-access. For the latter point, original ice-core datasets from Greenland retrieved in the 1990s and 2000s (extensively used e.g. by Gao et al, 2008; Crowley and Unterman, 2013) are not publicly available. These data from Greenland should be published with all available metadata and supporting datasets that allows to update chronologies (i.e. depth, age, density), in a similar way as it was done for the ice-core records in Antarctica (Thomas et al., 2023).
We document version 2.2.1 of the 1750–2023 upper-tropospheric stratospheric volcanic sulfur emission inventory produced for phase 7 of the Coupled Model Intercomparison Project (CMIP7). For the pre-satellite era (1750–1978), the dataset directly underpins the CMIP7 stratospheric aerosol optical property (Part 1 publication, Aubry et al., 2026a) dataset which is expected to be used by most CMIP7 models. The few CMIP7 models which might include interactive stratospheric aerosol schemes will implement this emission dataset to run historical simulations.
For the satellite (1979–2023) era, the CMIP7 emission dataset mostly relies on the satellite-based MSVOLSO2L4 emission inventory. For the pre-satellite era, we use a combination of: (i) inventories derived from bipolar ice-core arrays (Sigl et al., 2015; Toohey and Sigl, 2017); (ii) an inventory derived from a high-resolution Greenland ice-core (Fang et al., 2023); and (iii) the Global Volcanism Program (GVP) geological database. The use of the latter two source datasets enables us to better reconstruct small-to-moderate magnitude eruptions injecting less than 3 Tg SO2 into the atmosphere pre-satellite era. To provide best estimates of volcanic sulfur injection timing, location and altitude, we conducted a detailed literature search for these parameters. This search was aided by the Independent Volcanic Eruption Source Parameter Archive (IVESPA, Aubry et al., 2021) for eruptions after 1900, with IVESPA-derived relationships (Engwell et al., 2023) also informing correction of deposit-derived plume heights into SO2 injection altitude for all eruptions. We also derive new empirical relationships between eruption latitude and ice-core deposition asymmetry (Fig. 4) and sulfur mass and injection height (Fig. 5) to attribute injection latitude and altitude in the absence of direct constraints. The final CMIP7 upper-tropospheric stratospheric emission inventory has 463 eruptions injecting 428.2 Tg SO2 over 1750–2023, corresponding to a mean flux of 1.56 Tg SO2 yr−1 (Fig. 7). Before 1979, 25 % of these emissions originate from relatively small-magnitude eruptions not captured in mainstream bipolar ice-core arrays. Along with the dataset, we provide recommendations for implementing it in stratospheric aerosol models, including the temporal, horizontal and vertical distribution of emissions associated with each eruption. Modelling groups using the dataset should document in detail any deviation from provided parameter values and recommended emission implementation.
We discuss the large uncertainties characterizing volcanic emissions over the historical period (Fig. 9), but show that CMIP7 is less biased in terms of representing small-to-moderate magnitude eruptions injecting ≤3 Tg SO2 into the upper troposphere and stratosphere. Although the CMIP7 inventory should not be biased in terms of the long-term mean forcing of these eruptions, we show that before 1979, the dataset likely overestimates the frequency of eruptions injecting on the order of 1 Tg SO2 but underestimate the frequency of eruptions injecting on the order of 0.1 Tg SO2. The dataset is also likely biased in terms of the latitudinal distribution of small-to-moderate magnitude eruptions pre-satellite, with insufficient tropical and southern hemisphere injections. We suggest that bipolar high-resolution ice-core datasets combined with sulfur isotope analysis are critical to detect more small-to-moderate magnitude eruptions whilst discriminating what fraction of their injections were stratospheric. Last, an error means that three 1.9–4.2 Tg SO2 eruptions in 1868, 1885 and 1894 with unknown dates were attributed default dates of 1 December, and thus occur around 1 year later than the actual eruption. The same issue affects 13 eruptions over 1750–1849 (see Sect. 4.3). The SO2 masses of the two phases of Agung 1963 were also accidentally swapped with minimal impacts given how close they are (4.9 and 5.2 Tg SO2). We conclude the study by discussing other key limitations and directions for the dataset, including the addition of non-sulfur and non-volcanic stratospheric aerosol precursors, revision of ice-core transfer functions, quantification of emission uncertainties, as well as maintained funding for communities providing the source satellite, ice-core and geological datasets on which the CMIP7 emission dataset relies. We also discuss ideal requirements for these source datasets in terms of provided data and documentation.
All codes used to produce the CMIP7 dataset and source datasets required to run them are available through Zenodo (Aubry, 2025, https://doi.org/10.5281/zenodo.17295697) and GitHub (https://github.com/thomasaubry/CMIP7_stratforcing_v2.2.1, last access: 24 October 2026).
All netcdf datasets produced for this paper, including the netcdf file containing key emission variables, are available on the Earth System Grid Federation at https://aims2.llnl.gov/search?project=input4MIPs&versionType=, as well as on Zenodo (Aubry, 2025, https://doi.org/10.5281/zenodo.17295697). All source datasets used to produce the CMIP7 emission dataset are available through Zenodo (Aubry, 2025, https://doi.org/10.5281/zenodo.17295697). Additional datasets such as details of eruption source parameter search and the extended CMIP7 volcanic sulfur emission dataset (version 2.2.1) are available in Aubry et al. (2026b, https://doi.org/10.5281/zenodo.18412288). The underlying data for all three ice-core-based source datasets and the reconstruns are also accessible in Jong et al. (2022), Sigl et al. (2015, 2023), Thomas et al. (2023), Sigl and McConnell (2022, 2023), Toohey and Sigl (2019), and Sigl and Toohey (2024).
TJA designed the dataset with support from MS, AS and MT. MS, MT and SAC curated source datasets. TJA created the dataset with support from MMC, MV, MS and MT. TJA produced analysis of the dataset and wrote the manuscript with support from all co-authors. TJA and AS secured funding to support this work.
The contact author has declared that none of the authors has any competing interests.
Publisher's note: Copernicus Publications remains neutral with regard to jurisdictional claims made in the text, published maps, institutional affiliations, or any other geographical representation in this paper. The authors bear the ultimate responsibility for providing appropriate place names. Views expressed in the text are those of the authors and do not necessarily reflect the views of the publisher.
We warmly thank the numerous people who gave feedback on the dataset during its design and production, including the VolImpact 2025 workshop attendees, the “Perspectives on Stratospheric Aerosol Observations” team of the International Space Science Institute, Vaishali Naik, Paul Durack, Ilaria Quaglia, Simone Tilmes. Claudia Timmreck, Claire Macintosh, Gilles Seropian and many others who contributed through CMIP meetings and workshops or informal discussions with us. We also thank Zebedee Nicholls who provided invaluable support to make scripts to produce emission files compliant with CMIP standards for our dataset.
TJA acknowledges generous support from the CMIP International Project Office (project 4000136906), the European Space Agency “Volcanic forcing for CMIP” project of the Climate Change Initiative (CCI) (ESA Contract No. 4000145911/24/I-LR), the University of Exeter (through the Camborne School of Mines and the Department of Earth and Environmental Sciences research funds), and a travel award from the Canada-UK foundation. MT acknowledges support from the Canadian Space Agency (grant no. 21SUASOCSA). MMC is supported by the Croucher Foundation through the Croucher Postdoctoral Fellowship. MS received funding from the European Research Council under the European Union's Horizon 2020 research and innovation programme (grant no. 820047) and from the Swiss State Secretariat for Education, Research and Innovation (SERI) under the contract no. MB22.00030. SAC acknowledges support from the NASA Making Earth System Data Records for Use in Research Environments (MEaSUREs) program (grant no. 80NSSC24K0922). MS also received funding from University of Oslo: Energy and Environment (TRG project NORCLI and Convergence Environment project Clim-SHOCK).
This paper was edited by Tatiana Egorova and reviewed by two anonymous referees.
Abbott, P. M., Niemeier, U., Timmreck, C., Riede, F., McConnell, J. R., Severi, M., Fischer, H., Svensson, A., Toohey, M., Reinig, F., and Sigl, M.: Volcanic climate forcing preceding the inception of the Younger Dryas: Implications for tracing the Laacher See eruption, Quaternary Sci. Rev., 274, https://doi.org/10.1016/j.quascirev.2021.107260, 2021.
APARC: The Hunga Volcanic Eruption Atmospheric Impacts Report, edited by: Zhu, Y., Mann, G., Newman, P. A., and Randel, W., APARC Report No. 11, WCRP-10/2025, https://doi.org/10.34734/FZJ-2025-05237, https://aparc-climate.org/publications/ (last access: 10 October 2026), 2025.
Arfeuille, F., Weisenstein, D., Mack, H., Rozanov, E., Peter, T., and Brönnimann, S.: Volcanic forcing for climate modeling: a new microphysics-based data set covering years 1600–present, Clim. Past, 10, 359–375, https://doi.org/10.5194/cp-10-359-2014, 2014.
Aubry, T.: Scripts and source datasets for CMIP7 stratospheric aerosol forcing datasets (v2.2.1) (version 2.2.1), Zenodo [code and data set], https://doi.org/10.5281/zenodo.17295697, 2025.
Aubry, T. J., Jellinek, A. M., Degruyter, W., Bonadonna, C., Radic, V., Clyne, M., and Quainoo, A.: Impact of global warming on the rise of volcanic plumes and implications for future volcanic aerosol forcing, J. Geophys. Res.-Atmos., 121, 13326–13351, https://doi.org/10.1002/2016JD025405, 2016.
Aubry, T. J., Cerminara, M., and Jellinek, A. M.: Impacts of climate change on volcanic stratospheric injections: Comparison of 1D and 3D plume model projections, Geophys. Res. Lett., 46, https://doi.org/10.1029/2019GL083975, 2019.
Aubry, T. J., Engwell, S., Bonadonna, C., Carazzo, G., Scollo, S., Van Eaton, A. R., Taylor, I. A., Jessop, D., Eychenne, J., Gouhier, M., Mastin, L. G., Wallace, K. L., Biass, S., Bursik, M., Grainger, R. G., Jellinek, A. M., and Schmidt, A. The Independent Volcanic Eruption Source Parameter Archive (IVESPA, version 1.0): A new observational database to support explosive eruptive column model validation and development, J. Volcanol. Geotherm. Res., https://doi.org/10.1016/j.jvolgeores.2021.107295, 2021.
Aubry, T. J., Toohey, M., Khanal, S., Chim, M. M., Verkerk, M., Johnson, B., Schmidt, A., Kovilakam, M., Sigl, M., Nicholls, Z., Thomason, L., Naik, V., Rieger, L., Stiller, D., Ziegler, E., Durack, P., and Smith, I. H.: Stratospheric aerosol forcing for CMIP7 – Part 1: optical properties for pre-industrial, historical, and scenario simulations, Geosci. Model Dev., 19, 3725–3756, https://doi.org/10.5194/gmd-19-3725-2026, 2026a.
Aubry, T., Sigl, M., Toohey, M., Chim, M. M., Verkerk, M., Schmidt, A., and Carn, S.: Supplementary tables for “Stratospheric aerosol forcing for CMIP7 (part 2): Volcanic sulfur dioxide emissions” (Version version 2.2.1), Zenodo [data set], https://doi.org/10.5281/zenodo.18412288, 2026b.
Banta, J. R. and McConnell, J. R.: Annual accumulation over recent centuries at four sites in central Greenland, J. Geophys. Res.-Atmos., 112, https://doi.org/10.1029/2006JD007887, 2007.
Baroni, M., Thiemens, M. H., Delmas, R. J., and Savarino, J.: Mass-independent sulfur isotopic compositions in stratospheric volcanic eruptions, Science, 315, 84–87, https://doi.org/10.1126/science.1131754, 2007.
Bingen, C., Robert, C. E., Stebel, K., Brühl, C., Schallock, J., Vanhellemont, F., Mateshvili, N., Höpfner, M., Trickl, T., Barnes, J. E., Jumelet, J., Vernier, J.-P., Popp, T., de Leeuw, G., and Pinnock, S.: Stratospheric aerosol data records for the climate change initiative: Development, validation and application to chemistry-climate modelling, Remote Sens. Environ., 203, 296–321, https://doi.org/10.1016/j.rse.2017.06.002, 2017.
Bourassa, A. E., Robock, A., Randel, W. J., Deshler, T., Rieger, L. A., Lloyd, N. D., Llewellyn, E. J., and Degenstein, D. A.: Large volcanic aerosol load in the stratosphere linked to Asian monsoon transport, Science, 337, 78–81, https://doi.org/10.1126/science.1219371, 2012.
Brenna, H., Kutterolf, S., and Krüger, K.: Global ozone depletion and increase of UV radiation caused by pre-industrial tropical volcanic eruptions, Sci. Rep., 9, 9435, https://doi.org/10.1038/s41598-019-45630-0, 2019.
Brown, S. K., Crosweller, H. S., Sparks, R. S. J., Cottrell, E., Deligne, N. I., Ortiz Guerrero, N., Hobbs, L., Kiyosugi, K., Loughlin, S. C., Siebert, L., and Takarada, S.: Characterisation of the Quaternary eruption record: analysis of the Large Magnitude Explosive Volcanic Eruptions (LaMEVE) database, J. Appl. Volcanol., 3, 5, https://doi.org/10.1186/2191-5040-3-5, 2014.
Brown, T. F. M., Bannister, M. T., Revell, L. E., Sukhodolov, T., and Rozanov, E.: Worldwide Rocket Launch Emissions 2019: An Inventory for Use in Global Models, Earth Space Sci., 11, e2024EA003668, https://doi.org/10.1029/2024EA003668, 2024.
Burke, A., Moore, K. A., Sigl, M., Nita, D. C., McConnell, J. R., and Adkins, J. F.: Stratospheric eruptions from tropical and extratropical volcanoes constrained using high-resolution sulfur isotopes in ice cores, Earth Planet Sc. Lett., 521, 113–119, https://doi.org/10.1016/j.epsl.2019.06.006, 2019.
Burke, A., Innes, H. M., Crick, L., Anchukaitis, K. J., Byrne, M. P., Hutchison, W., McConnell, J. R., Moore, K. A., Rae, J. W. B., Sigl, M., and Wilson, R.: High sensitivity of summer temperatures to stratospheric sulfur loading from volcanoes in the Northern Hemisphere, P. Natl. Acad. Sci. USA, 120, e2221810120, https://doi.org/10.1073/pnas.2221810120, 2023.
Carboni, E., Grainger, R. G., Mather, T. A., Pyle, D. M., Thomas, G. E., Siddans, R., Smith, A. J. A., Dudhia, A., Koukouli, M. E., and Balis, D.: The vertical distribution of volcanic SO2 plumes measured by IASI, Atmos. Chem. Phys., 16, 4343–4367, https://doi.org/10.5194/acp-16-4343-2016, 2016.
Carn, S.: Multi-Satellite Volcanic Sulfur Dioxide L4 Long-Term Global Database V4, NASA Goddard Earth Sciences Data and Information Services Center [data set], https://doi.org/10.5067/MEASURES/SO2/DATA405, 2021.
Carn, S. A., Clarisse, L., and Prata, A. J.: Multi-decadal satellite measurements of global volcanic degassing, J. Volcanol. Geoth. Res., 311, 99–134, https://doi.org/10.1016/j.jvolgeores.2016.01.002, 2016.
Carn, S. A., Fioletov, V. E., McLinden, C. A., Li, C., and Krotkov, N. A.: A decade of global volcanic SO2 emissions measured from space, Sci. Rep., 7, 44095, https://doi.org/10.1038/srep44095, 2017.
Carn, S. A., Krotkov, N. A., Fisher, B. L., and Li, C.: Out of the blue: Volcanic SO2 emissions during the 2021–2022 eruptions of Hunga Tonga – Hunga Ha'apai (Tonga), Front. Earth Sci., 10, 976962, https://doi.org/10.3389/feart.2022.976962, 2022.
Chim, M. M., Aubry, T. J., Abraham, N. L., Marshall, L., Mulcahy, J., Walton, J., and Schmidt, A. Climate projections very likely underestimate future volcanic forcing and its climatic effects, Geophys. Res. Lett., 50, e2023GL103743, https://doi.org/10.1029/2023GL103743, 2023.
Chim, M. M., Aubry, T. J., Smith, C., and Schmidt, A.: Neglecting future sporadic volcanic eruptions underestimates climate uncertainty, Commun. Earth Environ., 6, 236, https://doi.org/10.1038/s43247-025-02208-1, 2025.
Chim, M. M., Stiller, D., Ziegler, E., Aubry, T. J., Boissel, L., Guillet, S., Rodgers, B., Toohey, M., Pohl, C., and Rozanov, A.: Stratospheric aerosol forcing for CMIP7 – Part 3: comparison with CMIP6 and evaluation using complementary datasets, EGUsphere [preprint], https://doi.org/10.5194/egusphere-2026-4193, 2026.
Clarisse, L., Hurtmans, D., Clerbaux, C., Hadji-Lazaro, J., Ngadi, Y., and Coheur, P.-F.: Retrieval of sulphur dioxide from the infrared atmospheric sounding interferometer (IASI), Atmos. Meas. Tech., 5, 581–594, https://doi.org/10.5194/amt-5-581-2012, 2012.
Clausen, H. B. and Hammer, C. U.: The Laki and Tambora Eruptions as Revealed in Greenland Ice Cores from 11 Locations, Ann. Glaciol., 10, 16–22, 1988.
Clyne, M., Lamarque, J.-F., Mills, M. J., Khodri, M., Ball, W., Bekki, S., Dhomse, S. S., Lebas, N., Mann, G., Marshall, L., Niemeier, U., Poulain, V., Robock, A., Rozanov, E., Schmidt, A., Stenke, A., Sukhodolov, T., Timmreck, C., Toohey, M., Tummon, F., Zanchettin, D., Zhu, Y., and Toon, O. B.: Model physics and chemistry causing intermodel disagreement within the VolMIP-Tambora Interactive Stratospheric Aerosol ensemble, Atmos. Chem. Phys., 21, 3317–3343, https://doi.org/10.5194/acp-21-3317-2021, 2021.
Cole-Dai, J.: Volcanoes and climate, Wires Clim. Change, 1, 824–839, 2010.
Colombier, M., Bonifacie, M., Brenna, M., Burke, A., Cimarelli, C., Cronin, S.J., Delmelle, P., Dingwell, D. B., Hess, K. U., Huebsch, M., and Kula, T.: The role of submarine volcanism in atmospheric chemistry, Earth Planet. Sci. Lett., 671, p. 119690, https://doi.org/10.1016/j.epsl.2025.119690, 2025.
Crowley, T. J. and Unterman, M. B.: Technical details concerning development of a 1200 yr proxy index for global volcanism, Earth Syst. Sci. Data, 5, 187–197, https://doi.org/10.5194/essd-5-187-2013, 2013.
Danabasoglu, G., Lamarque, J.-F., Bacmeister, J., Bailey, D. A., DuVivier, A. K., Edwards, J., Emmons, L. K., Fasullo, J., Garcia, R., Gettelman, A., Hannay, C., Holland, M. M., Large, W. G., Lauritzen, P. H., Lawrence, D. M., Lenaerts, J. T. M., Lindsay, K., Lipscomb, W. H., Mills, M. J., Neale, R., Oleson, K. W., Otto-Bliesner, B., Phillips, A., Sacks, W., Tilmes, S., van Kampenhout, L., Vertenstein, M., Bertini, A., Dennis, J., Deser, C., Fischer, C., Fox-Kemper, B., Kay, J. E., Kinnison, D. E., Kushner, P. J., Larson, V. E., Long, M. C., Mickelson, S., Moore, J. K., Nienhouse, E., Polvani, L., Rasch, P. J., and Strand, W. G.: The Community Earth System Model Version 2 (CESM2), J. Adv. Model. Earth Syst., 12, e2019MS001916, https://doi.org/10.1029/2019MS001916, 2020.
Davis, N. A., Visioni, D., Garcia, R. R., Kinnison, D. E., Marsh, D. R., Mills, M., Richter, J. H., Tilmes, S., Bardeen, C. G., Gettelman, A., Glanville, A. A., MacMartin, D. G., Smith, A. K., and Vitt, F.: Climate, variability, and climate sensitivity of 'Middle Atmosphere' chemistry configurations of the Community Earth System Model Version 2, Whole Atmosphere Community Climate Model Version 6 (CESM2(WACCM6)), J. Adv. Model. Earth Syst., 15, e2022MS003579, https://doi.org/10.1029/2022MS003579, 2023.
Dhomse, S. S., Mann, G. W., Antuña Marrero, J. C., Shallcross, S. E., Chipperfield, M. P., Carslaw, K. S., Marshall, L., Abraham, N. L., and Johnson, C. E.: Evaluating the simulated radiative forcings, aerosol properties, and stratospheric warmings from the 1963 Mt Agung, 1982 El Chichón, and 1991 Mt Pinatubo volcanic aerosol clouds, Atmos. Chem. Phys., 20, 13627–13654, https://doi.org/10.5194/acp-20-13627-2020, 2020.
Dixon, D., Mayewski, P. A., Kaspari, S., Sneed, S., and Handley, M.: A 200 year sub-annual record of sulfate in West Antarctica, from 16 ice cores, Ann. Glaciol., 39, 545–556, https://doi.org/10.3189/172756404781814113, 2004.
Dunne, J. P., Hewitt, H. T., Arblaster, J. M., Bonou, F., Boucher, O., Cavazos, T., Dingley, B., Durack, P. J., Hassler, B., Juckes, M., Miyakawa, T., Mizielinski, M., Naik, V., Nicholls, Z., O'Rourke, E., Pincus, R., Sanderson, B. M., Simpson, I. R., and Taylor, K. E.: An evolving Coupled Model Intercomparison Project phase 7 (CMIP7) and Fast Track in support of future climate assessment, Geosci. Model Dev., 18, 6671–6700, https://doi.org/10.5194/gmd-18-6671-2025, 2025.
Eckhardt, S., Pisso, I., Evangeliou, N., Zwaaftink, C. G., Plach, A., McConnell, J. R., Sigl, M., Ruppel, M., Zdanowicz, C., Lim, S., Chellman, N., Opel, T., Meyer, H., Steffensen, J. P., Schwikowski, M., and Stohl, A.: Revised historical Northern Hemisphere black carbon emissions based on inverse modeling of ice core records, Nat. Commun., 14, 271, https://doi.org/10.1038/s41467-022-35660-0, 2023.
Engwell, S. L., Aubry, T. J., Bonadonna, C., Mastin, L. G., Carazzo, G., Van Eaton, A. R., Jessop, D. E., Grainger, R. G., Scollo, S., Taylor, I. A., Jellinek, A. M., Schmidt, A., Biass, S., and Gouhier, M.: New insights into the relationship between mass eruption rate and volcanic column height based on the IVESPA data set, Geophys. Res. Lett., 50, e2022GL102633, https://doi.org/10.1029/2022GL102633, 2023.
Fang, S.-W., Sigl, M., Toohey, M., Jungclaus, J., Zanchettin, D., and Timmreck, C.: The role of small to moderate volcanic eruptions in the early 19th century climate, Geophys. Res. Lett., https://doi.org/10.1029/2023GL105307, 2023.
Fisher, B. L., Krotkov, N. A., Bhartia, P. K., Li, C., Carn, S. A., Hughes, E., and Leonard, P. J. T.: A new discrete wavelength backscattered ultraviolet algorithm for consistent volcanic SO2 retrievals from multiple satellite missions, Atmos. Meas. Tech., 12, 5137–5153, https://doi.org/10.5194/amt-12-5137-2019, 2019.
Fuglestvedt, H. F., Zhuo, Z., Toohey, M., and Krüger, K.: Volcanic forcing of high-latitude Northern Hemisphere eruptions, Npj Clim. Atmos. Sci., 7, 10, https://doi.org/10.1038/s41612-023-00539-4, 2024.
Gabriel, I., Plunkett, G., Abbott, P. M., Behrens, M., Burke, A., Chellman, N., Cook, E., Fleitmann, D., Hörhold, M., Hutchison, W., McConnell, J. R., Óladóttir, B. A., Preiser-Kapeller, J., Sliwinski, J. T., Sugden, P., Twarloh, B., and Sigl, M.: Decadal-to-centennial increases of volcanic aerosols from Iceland challenge the concept of a Medieval Quiet Period, Commun. Earth Environ., 5, 194, https://doi.org/10.1038/s43247-024-01350-6, 2024.
Gao, C. C., Oman, L., Robock, A., and Stenchikov, G. L.: Atmospheric volcanic loading derived from bipolar ice cores: Accounting for the spatial distribution of volcanic deposition, J. Geophys. Res.-Atmos., 112, https://doi.org/10.1029/2006JD007461, 2007.
Gao, C. C., Robock, A., and Ammann, C.: Volcanic forcing of climate over the past 1500 years: An improved ice core-based index for climate models, J. Geophys. Res.-Atmos., 113, https://doi.org/10.1029/2008JD010239, 2008.
Garrison, C. S., Kilburn, C. R. J., and Edwards, S. J.: The 1831 eruption of Babuyan Claro that never happened: has the source of one of the largest volcanic climate forcing events of the nineteenth century been misattributed?, J. Appl. Volcanol., 7, 8, https://doi.org/10.1186/s13617-018-0078-9, 2018.
Gautier, E., Savarino, J., Erbland, J., Lanciki, A., and Possenti, P.: Variability of sulfate signal in ice core records based on five replicate cores, Clim. Past, 12, 103–113, https://doi.org/10.5194/cp-12-103-2016, 2016.
Gautier, E., Savarino, J., Hoek, J., Erbland, J., Caillon, N., Hattori, S., Yoshida, N., Albalat, E., Albarede, F., and Farquhar, J.: 2600-years of stratospheric volcanism through sulfate isotopes, Nat. Commun., 10, https://doi.org/10.1038/s41467-019-08357-0, 2019.
Geng, L., Alexander, B., Cole-Dai, J., Steig, E. J., Savarino, J., Sofen, E. D., and Schauer, A. J.: Nitrogen isotopes in ice core nitrate linked to anthropogenic atmospheric acidity change, P. Natl. Acad. Sci., 111, 5808–5812, https://doi.org/10.1073/pnas.1319441111, 2014.
Global Volcanism Program: Volcanoes of the World (v. 5.3.4; 30 Dec 2025), compiled by: Venzke, E., Global Volcanism Programme of the Smithsonian Institution [data set], https://doi.org/10.5479/si.GVP.VOTW5-2025.5.3, 2025.
Hammer, C. U., Clausen, H. B., and Dansgaard, W.: Greenland Ice-Sheet Evidence of Post-Glacial Volcanism and Its Climatic Impact, Nature, 288, 230–235, https://doi.org/10.1038/288230a0, 1980.
Hewett, T. A., Fay, J. A., and Hoult, D. P.: Laboratory experiments of smokestack plumes in a stable atmosphere, Atmos. Environ., 1967, 767–789, https://doi.org/10.1016/0004-6981(71)90028-X, 1971.
Hoesly, R. M., Smith, S. J., Feng, L., Klimont, Z., Janssens-Maenhout, G., Pitkanen, T., Seibert, J. J., Vu, L., Andres, R. J., Bolt, R. M., Bond, T. C., Dawidowski, L., Kholod, N., Kurokawa, J.-I., Li, M., Liu, L., Lu, Z., Moura, M. C. P., O'Rourke, P. R., and Zhang, Q.: Historical (1750–2014) anthropogenic emissions of reactive gases and aerosols from the Community Emissions Data System (CEDS), Geosci. Model Dev., 11, 369–408, https://doi.org/10.5194/gmd-11-369-2018, 2018.
Hutchison, W., Gabriel, I., Plunkett, G., Burke, A., Sugden, P., Innes, H., Davies, S., Moreland, W. M., Krüger, K., Wilson, R., Vinther, B. M., Dahl-Jensen, D., Freitag, J., Oppenheimer, C., Chellman, N. J., Sigl, M., and McConnell, J. R.: High-Resolution Ice-Core Analyses Identify the Eldgjá Eruption and a Cluster of Icelandic and Trans-Continental Tephras Between 936 and 943 CE, J. Geophys. Res.-Atmos., 129, e2023JD040142, https://doi.org/10.1029/2023JD040142, 2024.
Hutchison, W., Sugden, P., Burke, A., Abbott, P., Ponomareva, V. V., Dirksen, O., Portnyagin, M. V., MacInnes, B., Bourgeois, J., Fitzhugh, B., Verkerk, M., Aubry, T. J., Engwell, S. L., Svensson, A., Chellman, N. J., McConnell, J. R., Davies, S., Sigl, M., and Plunkett, G.: The 1831 CE mystery eruption identified as Zavaritskii caldera, Simushir Island (Kurils), P. Natl. Acad. Sci. USA, 122, e2416699122, https://doi.org/10.1073/pnas.2416699122, 2025.
Innes, H. M., Hutchison, W., Sigl, M., Crick, L., Abbott, P. M., Bigler, M., Chellman, N. J., Davies, S. M., Kutterolf, S., McConnell, J. R., Severi, M., Sparks, R. S. J., Svensson, A., Wolff, E. W., Rae, J. W. B., and Burke, A.: Ice core evidence for the Los Chocoyos supereruption disputes millennial-scale climate impact, Commun. Earth Environ., 6, 137, https://doi.org/10.1038/s43247-025-02095-6, 2025.
Iverson, N.A., Kalteyer, D., Dunbar, N.W., Kurbatov, A., and Yates, M.: Advancements and best practices for analysis and correlation of tephra and cryptotephra in ice, Quaternary Geochronol., 40, 45–55, https://doi.org/10.1016/j.quageo.2016.09.008, 2017.
Jong, L. M., Plummer, C. T., Roberts, J. L., Moy, A. D., Curran, M. A. J., Vance, T. R., Pedro, J. B., Long, C. A., Nation, M., Mayewski, P. A., and van Ommen, T. D.: 2000 years of annual ice core data from Law Dome, East Antarctica, Earth Syst. Sci. Data, 14, 3313–3328, https://doi.org/10.5194/essd-14-3313-2022, 2022.
Jongebloed, U. A., Schauer, A. J., Hattori, S., Cole-Dai, J., Larrick, C. G., Salimi, S., Edouard, S. R., Geng, L., and Alexander, B.: Sulfur isotopes quantify the impact of anthropogenic activities on industrial-era Arctic sulfate in a Greenland ice core, Environ. Res. Lett., 18, https://doi.org/10.1088/1748-9326/acdc3d, 2023.
Kloss, C., Berthet, G., Sellitto, P., Ploeger, F., Bucci, S., Khaykin, S., Jégou, F., Taha, G., Thomason, L. W., Barret, B., Le Flochmoen, E., von Hobe, M., Bossolasco, A., Bègue, N., and Legras, B.: Transport of the 2017 Canadian wildfire plume to the tropics via the Asian monsoon circulation, Atmos. Chem. Phys., 19, 13547–13567, https://doi.org/10.5194/acp-19-13547-2019, 2019.
Kremser, S., Thomason, L. W., von Hobe, M., Hermann, M., Deshler, T., Timmreck, C., Toohey, M., Stenke, A., Schwarz, J. P., Weigel, R., Fueglistaler, S., Prata, F. J., Vernier, J.-P., Schlager, H., Barnes, J. E., Antuña-Marrero, J.-C., Fairlie, D., Palm, M., Mahieu, E., Notholt, J., Rex, M., Bingen, C., Vanhellemont, F., Bourassa, A., Plane, J. M. C., Klocke, D., Carn, S. A., Clarisse, L., Trickl, T., Neely, R., James, A. D., Rieger, L., Wilson, J. C., and Meland, B.: Stratospheric aerosol – Observations, processes, and impact on climate, Rev. Geophys., 54, 278–335, https://doi.org/10.1002/2015RG000511, 2016.
Lamb, H. H.: Volcanic Dust in the Atmosphere; with a Chronology and Assessment of Its Meteorological Significance, Philos. T. Roy. Soc. London A, 266, 425–533, 1970.
Lee, G., Burke, A., Hutchison, W., Sugden, P., Smith, C., McConnell, J. R., Sigl, M., Oppenheimer, C., Rasmussen, S. O., Steffensen, J. P., Lee, S. R., and Ahn, J.: Phasing and climate forcing potential of the Millennium Eruption of Mt. Baekdu, Commun. Earth Environ., 5, 549, https://doi.org/10.1038/s43247-024-01713-z, 2024.
Li, C., Krotkov, N. A., Carn, S., Zhang, Y., Spurr, R. J. D., and Joiner, J.: New-generation NASA Aura Ozone Monitoring Instrument (OMI) volcanic SO2 dataset: algorithm description, initial results, and continuation with the Suomi-NPP Ozone Mapping and Profiler Suite (OMPS), Atmos. Meas. Tech., 10, 445–458, https://doi.org/10.5194/amt-10-445-2017, 2017.
Li, C., Krotkov, N. A., Joiner, J., Fioletov, V., McLinden, C., Griffin, D., Leonard, P. J. T., Carn, S., Seftor, C., and Vasilkov, A.: Version 1 NOAA-20/OMPS Nadir Mapper total column SO2 product: continuation of NASA long-term global data record, Earth Syst. Sci. Data, 16, 4291–4309, https://doi.org/10.5194/essd-16-4291-2024, 2024.
Lin, J., Svensson, A., Hvidberg, C. S., Lohmann, J., Kristiansen, S., Dahl-Jensen, D., Steffensen, J. P., Rasmussen, S. O., Cook, E., Kjær, H. A., Vinther, B. M., Fischer, H., Stocker, T., Sigl, M., Bigler, M., Severi, M., Traversi, R., and Mulvaney, R.: Magnitude, frequency and climate forcing of global volcanism during the last glacial period as seen in Greenland and Antarctic ice cores (60–9 ka), Clim. Past, 18, 485–506, https://doi.org/10.5194/cp-18-485-2022, 2022.
Luo, B.: Stratospheric aerosol data for use in CMIP6 models – data description, Swiss Federal Institute of Technology Zurich, ftp://iacftp.ethz.ch/pub_read/luo/CMIP6/Readme_Data_Description.pdf (last access: 17 February 2023), 2018.
Marshall, L. R., Schmidt, A., Johnson, J. S., Mann, G. W., Lee, L. A., Rigby, R., and Carslaw, K. S.: Unknown Eruption Source Parameters Cause Large Uncertainty in Historical Volcanic Radiative Forcing Reconstructions, J. Geophys. Res.-Atmos., 126, e2020JD033578, https://doi.org/10.1029/2020JD033578, 2021.
Marshall, L. R., Maters, E. C., Schmidt, A., Timmreck, C., Robock, A., and Toohey, M.: Volcanic effects on climate: recent advances and future avenues, Bull. Volcanol., 84, 54, https://doi.org/10.1007/s00445-022-01559-3, 2022.
Mastin, L. G., Guffanti, M., Servranckx, R., Webley, P., Barsotti, S., Dean, K., Durant, A., Ewert, J. W., Neri, A., Rose, W. I., and Schneider, D.: A multidisciplinary effort to assign realistic source parameters to models of volcanic ash-cloud transport and dispersion during eruptions, J. volcanol. Geotherm. Res., 186, 10–21, https://doi.org/10.1016/j.jvolgeores.2009.01.008, 2009.
McConnell, J. R. and Edwards, R.: Coal burning leaves toxic heavy metal legacy in the Arctic, P. Natl. Acad. Sci. USA, 105, 12140–12144, https://doi.org/10.1073/pnas.0803564105, 2008.
McConnell, J. R., Edwards, R., Kok, G. L., Flanner, M. G., Zender, C. S., Saltzman, E. S., Banta, J. R., Pasteris, D. R., Carter, M. M., and Kahl, J. D. W.: 20th-century industrial black carbon emissions altered arctic climate forcing, Science, 317, 1381–1384, 2007.
McConnell, J. R., Burke, A., Dunbar, N. W., Kohler, P., Thomas, J. L., Arienzo, M. M., Chellman, N. J., Maselli, O. J., Sigl, M., Adkins, J. F., Baggenstos, D., Burkhart, J. F., Brook, E. J., Buizert, C., Cole-Dai, J., Fudge, T. J., Knorr, G., Graf, H. F., Grieman, M. M., Iverson, N., McGwire, K. C., Mulvaney, R., Paris, G., Rhodes, R. H., Saltzman, E. S., Severinghaus, J. P., Steffensen, J. P., Taylor, K. C., and Winckler, G.: Synchronous volcanic eruptions and abrupt climate change similar to 17.7 ka plausibly linked by stratospheric ozone depletion, P. Natl. Acad. Sci. USA, 114, 10035–10040, 2017.
Millán, L., Santee, M. L., Lambert, A., Livesey, N. J., Werner, F., Schwartz, M. J., Pumphrey, H. C., Manney, G. L., Wang, Y., Su, H., Wu, L., Read, W. G., and Froidevaux, L.: The Hunga Tonga-Hunga Ha'apai hydration of the stratosphere, Geophys. Res. Lett., 49, e2022GL099381, https://doi.org/10.1029/2022GL099381, 2022.
Millward, F. J., Webster, H. N., and Johnson, C. G.: Modeling wind-blown umbrella clouds in Lagrangian Dispersion Models, J. Geophys. Res.-Atmos., 128, e2023JD039115. https://doi.org/10.1029/2023JD039115, 2023.
Morton, B. R., Taylor, G. I. and Turner, J. S.: Turbulent gravitational convection from maintained and instantaneous sources, P. Roy. Soc. London A, 234, 1–23, https://doi.org/10.1098/rspa.1956.0011, 1956.
Moseid, K. O., Schulz, M., Eichler, A., Schwikowski, M., McConnell, J. R., Olivié, D., Criscitiello, A. S., Kreutz, K. J., and Legrand, M.: Using Ice Cores to Evaluate CMIP6 Aerosol Concentrations Over the Historical Era, J. Geophys. Res.-Atmos., 127, https://doi.org/10.1029/2021JD036105, 2022.
Murphy, D. M., Abou-Ghanem, M., Cziczo, D. J., Froyd, K. D., Jacquot, J., Lawler, M. J., Maloney, C., Plane, J. M. C., Ross, M. N., Schill, G. P., and Shen, X.: Metals from spacecraft reentry in stratospheric aerosol particles, P. Natl. Acad. Sci. USA, 120, e2313374120, https://doi.org/10.1073/pnas.2313374120, 2023.
Murphy, D. M., Abou-Ghanem, M., Ahern, A. T., Brock, C. A., Cziczo, D. J., Hintsa, E. J., Jacquot, J. L., Lawler, M. J., Lyu, M., Moore, F. L., Robinson, M. A., Roberts, J. M., Schill, G. P., Shen, X., Thornberry, T. D., and Veres, P. R.: Perchlorate in stratospheric aerosol particles, P. Natl. Acad. Sci. USA, 122, e2512783122, https://doi.org/10.1073/pnas.2512783122, 2025.
Muser, L. O., Hoshyaripour, G. A., Bruckert, J., Horváth, Á., Malinina, E., Wallis, S., Prata, F. J., Rozanov, A., von Savigny, C., Vogel, H., and Vogel, B.: Particle aging and aerosol–radiation interaction affect volcanic plume dispersion: evidence from the Raikoke 2019 eruption, Atmos. Chem. Phys., 20, 15015–15036, https://doi.org/10.5194/acp-20-15015-2020, 2020.
Naik, V., Durack, P. J., Nicholls, Z., Buontempo, C., Dunne, J. P., Hewitt, H. T., Macintosh, C., and O'Rourke, E.: Climate models need more frequent releases of input data – here's how to do it, Nature, 644, 874–875, https://doi.org/10.1038/d41586-025-02642-3, 2025.
Narcisi, B., Petit, J. R., Delmonte, B., Batanova, V., and Savarino, J.: Multiple sources for tephra from AD 1259 volcanic signal in Antarctic ice cores, Quaternary Sci. Rev., 210, 164–174, https://doi.org/10.1016/j.quascirev.2019.03.005, 2019.
Neely III, R. R. and Schmidt, A.: VolcanEESM (Volcanic Emissions for Earth System Models): Volcanic sulphur dioxide (SO2) emissions database from 1850 to present. Centre for Environmental Data Analysis, date of citation. http://catalogue.ceda.ac.uk/uuid/bfbd5ec825fa422f9a858b14ae7b2a0d (last access: 10 October 2026), 2016.
Newhall, C. G. and Self, S.: The volcanic explosivity index (VEI) an estimate of explosive magnitude for historical volcanism, J. Geophys. Res., 87, 1231–1238, https://doi.org/10.1029/JC087iC02p01231, 1982.
Niemeier, U., Timmreck, C., and Krüger, K.: Revisiting the Agung 1963 volcanic forcing – impact of one or two eruptions, Atmos. Chem. Phys., 19, 10379–10390, https://doi.org/10.5194/acp-19-10379-2019, 2019.
Papale, P.: Global time-size distribution of volcanic eruptions on Earth, Sci. Rep.-Uk, 8, 6838, https://doi.org/10.1038/s41598-018-25286-y, 2018.
Papale, P., Garg, D., and Marzocchi, W.: Global Rates of Subaerial Volcanism on Earth, Front. Earth Sci., 10, https://doi.org/10.3389/feart.2022.922160, 2022.
Pasteris, D. R., McConnell, J. R., Das, S. B., Criscitiello, A. S., Evans, M. J., Maselli, O. J., Sigl, M., and Layman, L.: Seasonally resolved ice core records from West Antarctica indicate a sea ice source of sea-salt aerosol and a biomass burning source of ammonium, J. Geophys. Res.-Atmos., 119, 9168–9182, https://doi.org/10.1002/2013JD020720, 2014.
Pearson, C., Sigl, M., Burke, A., Davies, S., Kurbatov, A., Severi, M., Cole-Dai, J., Innes, H., Albert, P. G., and Helmick, M.: Geochemical ice-core constraints on the timing and climatic impact of Aniakchak II (1628 BCE) and Thera (Minoan) volcanic eruptions, PNAS Nexus, https://doi.org/10.1093/pnasnexus/pgac048, 2022.
Peterson, D. A., Berman, M. T., Fromm, M. D., Servranckx, R., Julstrom, W. J., Hyer, E. J., Campbell, J. R., McHardy, T. M., and Lambert, A.: Worldwide inventory reveals the frequency and variability of pyrocumulonimbus and stratospheric smoke plumes during 2013–2023, npj Clim. Atmos. Sci., 8, 325, https://doi.org/10.1038/s41612-025-01188-5, 2025.
Piva, S. B., Barker, S. J., Iverson, N. A., Winton, V. H. L., Bertler, N. A. N., Sigl, M., Wilson, C. J. N., Dunbar, N. W., Kurbatov, A. V., Carter, L., Charlier, B. L. A., and Newnham, R. M.: Volcanic glass from the 1.8 ka Taupo eruption (New Zealand) detected in Antarctic ice at ∼ 230 CE, Sci. Rep.-Uk, 13, https://doi.org/10.1038/s41598-023-42602-3, 2023.
Plummer, C. T., Curran, M. A. J., van Ommen, T. D., Rasmussen, S. O., Moy, A. D., Vance, T. R., Clausen, H. B., Vinther, B. M., and Mayewski, P. A.: An independently dated 2000-yr volcanic record from Law Dome, East Antarctica, including a new perspective on the dating of the 1450s CE eruption of Kuwae, Vanuatu, Clim. Past, 8, 1929–1940, https://doi.org/10.5194/cp-8-1929-2012, 2012.
Plunkett, G., Sigl, M., McConnell, J. R., Pilcher, J. R., and Chellman, N. J.: The significance of volcanic ash in Greenland ice cores during the Common Era, Quaternary Sci. Rev., 301, 107936, https://doi.org/10.1016/j.quascirev.2022.107936, 2023.
Prata, F., Prata, A. T., Tanner, R., Grainger, R. G., Borgas, M., and Aubry, T. J.: The radial spreading of volcanic umbrella clouds deduced from satellite measurements, Volcanica, 8, 1–29. https://doi.org/10.30909/vol.08.01.0129, 2025.
Quaglia, I., Timmreck, C., Niemeier, U., Visioni, D., Pitari, G., Brodowsky, C., Brühl, C., Dhomse, S. S., Franke, H., Laakso, A., Mann, G. W., Rozanov, E., and Sukhodolov, T.: Interactive stratospheric aerosol models' response to different amounts and altitudes of SO2 injection during the 1991 Pinatubo eruption, Atmos. Chem. Phys., 23, 921–948, https://doi.org/10.5194/acp-23-921-2023, 2023.
Rhodes, R. H., Faïn, X., Brook, E. J., McConnell, J. R., Maselli, O. J., Sigl, M., Edwards, J., Buizert, C., Blunier, T., Chappellaz, J., and Freitag, J.: Local artifacts in ice core methane records caused by layered bubble trapping and in situ production: a multi-site investigation, Clim. Past, 12, 1061–1077, https://doi.org/10.5194/cp-12-1061-2016, 2016.
Robock, A. and Free, M. P.: Ice Cores as an Index of Global Volcanism from 1850 to the Present, J. Geophys. Res.-Atmos., 100, 11549–11567, https://doi.org/10.1029/95JD00825, 1995.
Rossi, E., Bonadonna, C., and Degruyter, W.: A new strategy for the estimation of plume height from clast dispersal in various atmospheric and eruptive conditions, Earth Planet. Sci. Lett., 505, 1–12, https://doi.org/10.1016/j.epsl.2018.10.007, 2019.
Rougier, J., Sparks, S. R., and Cashman, K. V.: Global recording rates for large eruptions, J. Appl. Volcanol., 5, 11, https://doi.org/10.1186/s13617-016-0051-4, 2016.
Schallock, J., Brühl, C., Bingen, C., Höpfner, M., Rieger, L., and Lelieveld, J.: Reconstructing volcanic radiative forcing since 1990, using a comprehensive emission inventory and spatially resolved sulfur injections from satellite data in a chemistry-climate model, Atmos. Chem. Phys., 23, 1169–1207, https://doi.org/10.5194/acp-23-1169-2023, 2023.
Self, S. and Rampino, M. R.: The 1963–1964 eruption of Agung volcano (Bali, Indonesia), Bull. Volcanol., 74, 1521–1536, https://doi.org/10.1007/s00445-012-0615-z, 2012.
Sellitto, P., Podglajen, A., Belhadji, R., Boichu, M., Carboni, E., Cuesta, J., Duchamp, C., Kloss, C., Siddans, R., Bègue, N., Blarel, L., Jegou, F., Khaykin, S., Renard, J.-B., and Legras, B.: The unexpected radiative impact of the Hunga Tonga eruption of 15th January 2022, Commun. Earth Environ., 3, 288, https://doi.org/10.1038/s43247-022-00618-z, 2022.
Sigl, M. and McConnell, J. R.: NEEM-2011-S1 ice-core aerosol record (conductivity, NH4, NO3, BC, Na, Mg, S, Ca, Mn, Sr, Ce, acidity) in NW-Greenland at 2 cm resolution from 86–1997 CE on the annual-layer counted NS1 2011 chronology, PANGAEA [data set], https://doi.org/10.1594/PANGAEA.94055372, 2022.
Sigl, M. and McConnell, J. R.: D4i Greenland ice-core non-sea-salt sulfur concentrations and calculated volcanic sulfate deposition (1733–1900 CE), PANGAEA [data set], https://doi.org/10.1594/PANGAEA.960977, 2023.
Sigl, M. and Toohey, M.: Volcanic stratospheric sulfur injections from 500 BCE to 1900 CE, eVolv2k_version4, PANGAEA [data set], https://doi.org/10.1594/PANGAEA.97196891, 2024.
Sigl, M., McConnell, J. R., Layman, L., Maselli, O., McGwire, K., Pasteris, D., Dahl-Jensen, D., Steffensen, J. P., Vinther, B., Edwards, R., Mulvaney, R., and Kipfstuhl, S.: A new bipolar ice core record of volcanism from WAIS Divide and NEEM and implications for climate forcing of the last 2000 years, J. Geophys. Res.-Atmos., 118, 1151–1169, https://doi.org/10.1029/2012JD018603, 2013.
Sigl, M., McConnell, J. R., Toohey, M., Curran, M., Das, S. B., Edwards, R., Isaksson, E., Kawamura, K., Kipfstuhl, S., Krüger, K., Layman, L., Maselli, O. J., Motizuki, Y., Motoyama, H., Pasteris, D. R., and Severi, M.: Insights from Antarctica on volcanic forcing during the Common Era, Nat. Clim. Change, 4, 693–697, https://doi.org/10.1038/nclimate2293, 2014.
Sigl, M., Winstrup, M., McConnell, J. R., Welten, K. C., Plunkett, G., Ludlow, F., Büntgen, U., Caffee, M., Chellman, N., Dahl-Jensen, D., Fischer, H., Kipfstuhl, S., Kostick, C., Maselli, O. J., Mekhaldi, F., Mulvaney, R., Muscheler, R., Pasteris, D. R., Pilcher, J. R., Salzer, M., Schüpbach, S., Steffensen, J. P., Vinther, B. M., and Woodruff, T. E.: Timing and climate forcing of volcanic eruptions for the past 2,500 years, Nature, 523, 543–549, https://doi.org/10.1038/nature14565, 2015.
Sigl, M., Abram, N. J., Gabrieli, J., Jenk, T. M., Osmont, D., and Schwikowski, M.: 19th century glacier retreat in the Alps preceded the emergence of industrial black carbon deposition on high-alpine glaciers, The Cryosphere, 12, 3311–3331, https://doi.org/10.5194/tc-12-3311-2018, 2018.
Sigl, M., Toohey, M., McConnell, J. R., Cole-Dai, J., and Severi, M.: Volcanic stratospheric sulfur injections and aerosol optical depth during the Holocene (past 11 500 years) from a bipolar ice-core array, Earth Syst. Sci. Data, 14, 3167–3196, https://doi.org/10.5194/essd-14-3167-2022, 2022.
Sigl, M., McConnell, J. R., and Toohey, M.: Volcanic stratospheric sulfur injection between 1733 and 1895 CE based on the eVolv2k-plus-D4i ice-core eruption catalogue, PANGAEA [data set], https://doi.org/10.1594/PANGAEA.960975, 2023.
Solomon, S., Ivy, D. J., Kinnison, D., Mills, M. J., Neely, R. R., and Schmidt, A.: Emergence of healing in the Antarctic ozone layer, Science, 353, 269–274, https://doi.org/10.1126/science.aae0061, 2016.
Staunton-Sykes, J., Aubry, T. J., Shin, Y. M., Weber, J., Marshall, L. R., Luke Abraham, N., Archibald, A., and Schmidt, A.: Co-emission of volcanic sulfur and halogens amplifies volcanic effective radiative forcing, Atmos. Chem. Phys., 21, 9009–9029, https://doi.org/10.5194/acp-21-9009-2021, 2021.
Tabazadeh, A. and Turco, R. P.: Stratospheric Chlorine Injection by Volcanic Eruptions: HCl Scavenging and Implications for Ozone, Science, 260, 1082–1086, 1993.
Taylor, I. A., Preston, J., Carboni, E., Mather, T. A., Grainger, R. G., Theys, N., Hidalgo, S., and McCormick Kilbride, B.: Exploring the utility of IASI for monitoring volcanic SO2 emissions, J. Geophys. Res.-Atmos., 123, 5588–5606, https://doi.org/10.1002/2017JD027109, 2018.
Textor, C., Graf, H.-F., Herzog, M., and Oberhuber, J. M.: Injection of gases into the stratosphere by explosive volcanic eruptions, J. Geophys. Res.-Atmos., 108, https://doi.org/10.1029/2002JD002987, 2003.
Theys, N., Fioletov, V., Li, C., De Smedt, I., Lerot, C., McLinden, C., Krotkov, N., Griffin, D., Clarisse, L., Hedelt, P., Loyola, D., Wagner, T., Kumar, V., Innes, A., Ribas, R., Hendrick, F., Vlietinck, J., Brenot, H., and Van Roozendael, M.: A sulfur dioxide Covariance-Based Retrieval Algorithm (COBRA): application to TROPOMI reveals new emission sources, Atmos. Chem. Phys., 21, 16727–16744, https://doi.org/10.5194/acp-21-16727-2021, 2021.
Thomas, E. R., Vladimirova, D. O., Tetzner, D. R., Emanuelsson, B. D., Chellman, N., Dixon, D. A., Goosse, H., Grieman, M. M., King, A. C. F., Sigl, M., Udy, D. G., Vance, T. R., Winski, D. A., Winton, V. H. L., Bertler, N. A. N., Hori, A., Laluraj, C. M., McConnell, J. R., Motizuki, Y., Takahashi, K., Motoyama, H., Nakai, Y., Schwanck, F., Simões, J. C., Lindau, F. G. L., Severi, M., Traversi, R., Wauthy, S., Xiao, C., Yang, J., Mosely-Thompson, E., Khodzher, T. V., Golobokova, L. P., and Ekaykin, A. A.: Ice core chemistry database: an Antarctic compilation of sodium and sulfate records spanning the past 2000 years, Earth Syst. Sci. Data, 15, 2517–2532, https://doi.org/10.5194/essd-15-2517-2023, 2023.
Thordarson, T. and Self, S.: The Laki (Skaftár Fires) and Grímsvötn eruptions in 1783–1785, Bull. Volcanol., 55, 233–263, https://doi.org/10.1007/BF00624353, 1993.
Thordarson, T., Self, S., Oskarsson, N., and Hulsebosch, T.: Sulfur, chlorine, and fluorine degassing and atmospheric loading by the 1783–1784 AD Laki (Skaftár Fires) eruption in Iceland, Bull. Volcanol., 58, 205–225, https://doi.org/10.1007/s004450050136, 1996.
Thordarson, Th. and Self, S.: Atmospheric and environmental effects of the 1783–1784 Laki eruption: A review and reassessment, J. Geophys. Res., 108, 4011, https://doi.org/10.1029/2001JD002042, 2003.
Timmreck, C., Mann, G. W., Aquila, V., Hommel, R., Lee, L. A., Schmidt, A., Brühl, C., Carn, S., Chin, M., Dhomse, S. S., Diehl, T., English, J. M., Mills, M. J., Neely, R., Sheng, J., Toohey, M., and Weisenstein, D.: The Interactive Stratospheric Aerosol Model Intercomparison Project (ISA-MIP): motivation and experimental design, Geosci. Model Dev., 11, 2581–2608, https://doi.org/10.5194/gmd-11-2581-2018, 2018.
Toohey, M. and Sigl, M.: Volcanic stratospheric sulfur injections and aerosol optical depth from 500 BCE to 1900 CE, Earth Syst. Sci. Data, 9, 809–831, https://doi.org/10.5194/essd-9-809-2017, 2017.
Toohey, M. and Sigl, M.: Reconstructed volcanic stratospheric sulfur injections and aerosol optical depth, 500 BCE to 1900 CE, version 3, World Data Center for Climate (WDCC) at DKRZ [data set], https://doi.org/10.26050/WDCC/eVolv2k_v3, 2019.
Toohey, M., Krüger, K., Niemeier, U., and Timmreck, C.: The influence of eruption season on the global aerosol evolution and radiative impact of tropical volcanic eruptions, Atmos. Chem. Phys., 11, 12351–12367, https://doi.org/10.5194/acp-11-12351-2011, 2011.
Toohey, M., Krüger, K., and Timmreck, C.: Volcanic sulfate deposition to Greenland and Antarctica: A modeling sensitivity study, J. Geophys. Res.-Atmos., 118, 4788–4800, 2013.
Toohey, M., Krüger, K., Sigl, M., Stordal, F., and Svensen, H.: Climatic and societal impacts of a volcanic double event at the dawn of the Middle Ages, Clim. Change, 136, 401–412, https://doi.org/10.1007/s10584-016-1648-7, 2016.
Verkerk, M., Aubry, T. J., Smith, C., Hopcroft, P. O., Sigl, M., Tierney, J. E., Anchukaitis, K., Osman, M., Schmidt, A., and Toohey, M.: Using reduced-complexity volcanic aerosol and climate models to produce large ensemble simulations of Holocene temperature, Clim. Past, 21, 1755–1778, https://doi.org/10.5194/cp-21-1755-2025, 2025.
Vernier, J.-P., Fairlie, T. D., Deshler, T., Natarajan, M., Knepp, T., Foster, K., Wienhold, F. G., Bedka, K. M., Thomason, L., and Trepte, C.: In situ and space-based observations of the Kelud volcanic plume: The persistence of ash in the lower stratosphere, J. Geophys. Res.-Atmos., 121, 11104–11118, https://doi.org/10.1002/2016JD025344, 2016.
Vernier, J.-P., Aubry, T. J., Timmreck, C., Schmidt, A., Clarisse, L., Prata, F., Theys, N., Prata, A. T., Mann, G., Choi, H., Carn, S., Rigby, R., Loughlin, S. C., and Stevenson, J. A.: The 2019 Raikoke eruption as a testbed used by the Volcano Response group for rapid assessment of volcanic atmospheric impacts, Atmos. Chem. Phys., 24, 5765–5782, https://doi.org/10.5194/acp-24-5765-2024, 2024.
Visioni, D., MacMartin, D. G., Kravitz, B., Boucher, O., Jones, A., Lurton, T., Martine, M., Mills, M. J., Nabat, P., Niemeier, U., Séférian, R., and Tilmes, S.: Identifying the sources of uncertainty in climate model simulations of solar radiation modification with the G6sulfur and G6solar Geoengineering Model Intercomparison Project (GeoMIP) simulations, Atmos. Chem. Phys., 21, 10039–10063, https://doi.org/10.5194/acp-21-10039-2021, 2021.
Wells, A. F., Jones, A., Osborne, M., Damany-Pearce, L., Partridge, D. G., and Haywood, J. M.: Including ash in UKESM1 model simulations of the Raikoke volcanic eruption reveals improved agreement with observations, Atmos. Chem. Phys., 23, 3985–4007, https://doi.org/10.5194/acp-23-3985-2023, 2023.
Wilson, L., Sparks, R. S. J., Huang, T. C., and Watkins, N. D.: The control of volcanic column heights by eruption energetics and dynamics, J. Geophys. Res., 83, 1829–1836, https://doi.org/10.1029/JB083iB04p01829, 1978.
Woodhouse, M. J., Hogg, A. J., Phillips, J. C., and Sparks, R. S. J.: Interaction between volcanic plumes and wind during the 2010 Eyjafjallajökull eruption, Iceland, J. Geophys. Res.-Solid Earth, 118, 92–109, https://doi.org/10.1029/2012JB009592, 2013.
Yu, P., Portmann, R. W., Peng, Y., Liu, C.-C., Zhu, Y., Asher, E., Bai, Z., Lu, Y., Bian, J., Mills, M., Schmidt, A., Rosenlof, K. H., and Toon, O. B.: Radiative forcing from the 2014–2022 volcanic and wildfire injections, Geophys. Res. Lett., 50, e2023GL103791, https://doi.org/10.1029/2023GL103791, 2023.
Zambri, B., Robock, A., Mills, M. J., and Schmidt, A.: Modeling the 1783–1784 Laki eruption in Iceland: 1. Aerosol evolution and global stratospheric circulation impacts, J. Geophys. Res.-Atmos., 124, 6750–6769, https://doi.org/10.1029/2018JD029553, 2019.
Zeng, Z. C., Clarisse, L., Franco, B., Clerbaux, C., Theys, N., Qi, C., Lee, L., Zhu, L., Hu, X., Gu, M., and Zhang, P.: Volcanic Sulfur Dioxide Monitored from a Constellation of FengYun Hyperspectral Infrared Sounders in Dawn-dusk, Mid-morning, and Afternoon Sun-synchronous Orbits, Remote Sens. Environ., 331, 115057, https://doi.org/10.1016/j.rse.2025.115057, 2025.
Zhai, S. T., Swanson, W., McConnell, J. R., Chellman, N., Opel, T., Sigl, M., Meyer, H., Wang, X., Jaeglé, L., Stutz, J., Dibb, J. E., Fujita, K., and Alexander, B.: Implications of Snowpack Reactive Bromine Production for Arctic Ice Core Bromine Preservation, J. Geophys. Res.-Atmos., 128, https://doi.org/10.1029/2023JD039257, 2023.
Zhu, Y., Toon, O. B., Jensen, E. J., Bardeen, C. G., Mills, M. J., Tolbert, M. A., Yu, P., and Woods, S.: Persisting volcanic ash particles impact stratospheric SO2 lifetime and aerosol optical properties, Nat. Commun., 11, 4526, https://doi.org/10.1038/s41467-020-18352-5, 2020.
Zielinski, G. A.: Stratospheric Loading and Optical Depth Estimates of Explosive Volcanism over the Last 2100 Years Derived from the Greenland-Ice-Sheet-Project-2 Ice Core, J. Geophys. Res.-Atmos., 100, 20937–20955, 1995.
- Abstract
- Introduction
- Source datasets
- Merging source datasets and deposition-eruption matching
- Attribution of eruption source parameters
- Key characteristics of the dataset and recommendation for implementation
- Discussion
- Summary
- Code availability
- Data availability
- Author contributions
- Competing interests
- Disclaimer
- Acknowledgements
- Financial support
- Review statement
- References