the Creative Commons Attribution 4.0 License.
the Creative Commons Attribution 4.0 License.
 | 23 Sep 2025
The sensitivity of EC-Earth3 decadal predictions to the choice of volcanic forcing dataset: insights for the next major eruption
Thomas J. Aubry
Matthew Toohey
Pablo Ortega
Vladimir Lapin
Etienne Tourigny
Large volcanic eruptions can have significant impacts on climate. Due to their unpredictable nature, when a major volcanic eruption occurs, decadal forecasts issued prior to the eruption will be inaccurate. Consequently, new decadal forecasts including updated estimates of the stratospheric sulfate aerosol evolution must be produced. To rapidly generate such volcanic forcing once the initial eruption characteristics are known, the Easy Volcanic Aerosol (EVA) forcing generator, and its updated version EVA_H, can be used. Comparing the volcanic forcings generated with these tools and the one from Coupled Model Intercomparison Project phase 6 for the recent eruptions of Mount Agung (1963), El Chichón (1982) and Mount Pinatubo (1991), we identify some differences in the magnitude and latitudinal structure, particularly for the eruptions of Mount Agung and El Chichón. Using these forcings, we conduct a set of retrospective prediction experiments for these eruptions with the Barcelona Supercomputing Center decadal forecast system, following a specifically designed protocol. The predictions driven by the three forcing datasets show similar post-eruption radiative responses, with particularly good agreement for the eruption of Mount Pinatubo. The global mean top-of-atmosphere flux and global mean surface temperature responses in the hindcast experiments are indistinguishable across the three forcing sets and three eruptions. However, we find differences in the zonal mean and regional responses due to the latitudinally-varying structure of the volcanic forcings, particularly for the eruptions of Mount Agung and El Chichón. Significant differences among the datasets are found in the global mean lower stratospheric warming, where the responses are strongest. Comparing the predicted anomalies in these hindcasts with observations we show that overall there is better agreement when volcanic forcing is included, highlighting its importance to accurate predictions. Our study suggests that either EVA and EVA_H forcings can be used for predicting the post-volcanic radiative response, although the generated forcing datasets and simulations should be interpreted with care given the limitations of these reduced-complexity empirical models.
- Article
(9124 KB) - Full-text XML
-
Supplement
(2744 KB) - BibTeX
- EndNote


Decadal climate prediction systems have become a useful tool for forecasting the climate of the next few years out to several decades (e.g. Hermanson et al., 2022). Part of the predictability in decadal forecasts arises from initialising the model from the observed state. Initialization is key to take advantage of the slowly evolving components of the climate system (i.e., the ocean), which can be predictable, and phases the model’s internal climate variability with the observed one (e.g. Doblas-Reyes et al., 2013). The other main source of predictability is the use of accurate estimates of external radiative forcings, which can be of natural (e.g., solar irradiance and volcanic aerosols) or anthropogenic (e.g., greenhouse gas concentrations, land use changes and anthropogenic aerosols) origin. Among the natural forcings, volcanic stratospheric sulphate aerosols are one of the main drivers of seasonal to centennial climate variability (e.g. Sigl et al., 2015) and are thus critical for predictability.
Explosive volcanic eruptions inject large quantities of sulphur dioxide into the stratosphere, where sulphate aerosols are formed and transported globally by the atmospheric circulation. The primary effect of the aerosols is to scatter part of the incoming solar radiation back into space, causing a negative radiative forcing that cools the Earth's surface, an effect that may last for several years until the aerosols are transported to the troposphere where they are washed out within weeks (e.g. Robock, 2000). These aerosols also absorb infrared radiation which leads to a local warming of the stratosphere. These temperature adjustments may lead to other climate impacts such as changes in the atmospheric and oceanic dynamics, which modulate climate variability and the global cooling response to volcanic eruptions (see Marshall et al., 2022 and references therein). Studies have shown that volcanic impacts on climate have a high predictive potential on seasonal-to-decadal timescales (e.g. Timmreck et al., 2016; Ménégoz et al., 2018; Hermanson et al., 2020; Bilbao et al., 2024). Therefore, including the volcanic forcing in operational climate forecasts is necessary to produce accurate predictions whenever an explosive volcanic eruption occurs.
Acknowledging the potential for a major volcanic eruption at any time, the steering group of the Decadal Climate Prediction Project (DCPP) – which leads decadal prediction activities under the World Climate Research Programme (WCRP) – developed guidelines to ensure that decadal prediction centers can produce updated forecasts in a timely and coordinated manner. Sospedra-Alfonso et al. (2024) described these guidelines (see their Fig. 1) and conduct a community exercise simulating a response to a hypothetical large eruption occurring in April 2022. In current operational decadal prediction systems, stratospheric sulfate aerosols are typically prescribed as boundary conditions. This volcanic forcing could be generated with the Easy Volcanic Aerosol (EVA) model (Toohey et al., 2016), as in Sospedra-Alfonso et al. (2024), or its more recent version, EVA_H (Aubry et al., 2020). These reduced-complexity models are designed to reconstruct the spatiotemporal evolution of stratospheric aerosol optical properties based on input parameters describing the eruption characteristics. In a real-time case, these parameters would be provided by the WCRP’s Volcanic Response (VolRes) initiative – a group within the Stratospheric Sulfur and its Role in Climate (SSiRC), part of the Atmospheric Processes And their Role in Climate (APARC) project – using data from multiple satellite observation platforms. This procedure is illustrated in Vernier et al. (2024) through the case of the 2019 Raikoke eruption, for which an initial estimate of the volcanic forcing was produced just one week after the event using EVA_H. Volcanic aerosol optical properties from EVA or EVA_H can then be formatted and incorporated into climate models, enabling the generation of updated forecasts that account for the eruption's impact.
While EVA and EVA_H, particularly EVA, have been used widely for a variety of studies to investigate the impact of volcanic eruptions on climate, the realism and the underlying uncertainty in climate predictions associated with the volcanic forcings remains unexplored. The objective of this paper is to evaluate the radiative response to the volcanic forcings produced with EVA and EVA_H using decadal hindcasts for the recent eruptions of Mount Agung (1963), El Chichón (1982) and Mount Pinatubo (1991), which may inform the expected uncertainty if used in real-time forecasts. The paper is structured as follows. Section 2 describes how the EVA and EVA_H forcings are produced and the decadal hindcast run with the Barcelona Supercomputing Center (BSC) decadal forecast system (Bilbao et al., 2021). Section 3 compares the EVA and EVA_H forcings with the CMIP6 historical volcanic forcing and evaluates the simulated climate response to these forcings. Section 4 summarises and discusses the results in the context of operational forecasts.
2.1 EVA and EVA_H stratospheric aerosol forcings.
Toohey et al. (2016) developed EVA based on a parameterized three-box model of stratospheric transport and simple scaling relationships used to produce aerosol optical properties for climate model simulations based on the sulfur emissions of eruptions. EVA was calibrated against the Chemistry-Climate Model Initiative (CCMI, Eyring and Lamarque, 2012) satellite dataset for the 1991 Pinatubo eruption. To address some of the limitations in EVA, Aubry et al. (2020) developed an extension named EVA_H (the H stands for height) with the following improvements: (i) making the forcing magnitude and its time evolution dependent on the injection altitude as well as latitude; (ii) making the vertical structure of the aerosol optical properties and its time evolution dependent on the injection altitude; (iii) calibrating the model against the more recent Global Space-based Stratospheric Aerosol Climatology (GloSSAC) observation-based dataset (Thomason et al., 2018) for the full 1979–2015 period. Despite the improvements implemented in EVA_H, one lingering limitation affecting both models is a too slow decay of the aerosol forcing for eruptions that inject 1 Tg SO2 or less into the stratosphere (Vernier et al., 2024). EVA and EVA_H are both publicly available on github (https://github.com/matthew2e/easy-volcanic-aerosol, last access: 12 September 2025, and https://github.com/thomasaubry/EVA_H, last access: 12 September 2025).
Both EVA and EVA_H output stratospheric aerosol optical properties as a function of time, latitude, height, and wavelength based on several parameters which describe the eruption characteristics, termed eruption source parameters. EVA uses the mass of sulphur injected, timing of the eruption and an optional hemispheric asymmetry parameter (indicating the degree of asymmetry in the transport of aerosol to the Northern Hemisphere and Southern Hemisphere). EVA_H additionally requires the tropopause altitude at the volcano location and the altitude of the SO2 injection, and does not include an asymmetry parameter. Further parameters to generate the forcings are required, such as the time span of forcing files and the model wavelengths. In the case of EC-Earth3, we calculate 14 shortwave and 16 long wave bands, as used in the IFS radiation scheme. While model parameters such as aerosol loss timescales can be adjusted for both EVA and EVA_H, we use the default recommended parameter values.
EVA and EVA_H produce monthly values of the aerosol extinction (EXT), single scattering albedo (SSA) and scattering asymmetry factor (AF) as a function of time, altitude (up to 40 km), latitude and wavelength, as well as providing the altitude and latitude values. These variables are produced on a standard set of levels and therefore were interpolated to the Integrated Forecast System (IFS; atmospheric model of EC-Earth3) vertical levels (91 vertical levels). The monthly variation of the altitude values is taken into account considering a climatology of the IFS layers height. Values above 40 km height were masked as they can be unrealistically distorted due to the vertical extrapolation. The latitudinal interpolation is directly performed online by EC-Earth3. With these variables, the aerosol optical depth (AOD), aerosol absorption optical depth (AAOD) and the scattering part of the aerosol optical depth (REFAOD) as a function of the waves bands, time, latitude and altitude, are derived and the EC-Earth3 input forcing files generated.
In this work, we produce historical volcanic forcings with both EVA and EVA_H for the period 1962–2005 including only the 1963 eruption of Mount Agung, the 1982 eruption of El Chichón and the 1991 eruption of Mount Pinatubo. The eruption source parameters used for EVA are those in Toohey et al. (2016) (Table S1 in the Supplement). We include the hemispheric asymmetry for these eruptions as derived from observations, therefore this forcing is considered a best estimate. In a real-time context, the asymmetric transport for a tropical eruptions could only be assessed after sufficiently long observations of the dispersing cloud, or using interactive stratospheric aerosol model simulations although these models are also subject to strong transport biases (Dhomse et al., 2020; Quaglia et al., 2023).
For EVA_H, the source parameters for Mount Agung were taken from Niemeier et al. (2019), splitting the eruption into two phases as recommended, and for the eruptions of El Chichón and Mount Pinatubo they were taken from Carn et al. (2016) (Table S2). Additionally, we produce another volcanic forcing with EVA_H for the period 1979–2005 including all the eruptions in Carn et al. (2016), we refer to this forcing as EVA_H_Carn16.
2.2 Decadal Prediction Experiments, Observations and Evaluation Methods
The experiments analysed in this study were performed with the BSC Decadal Forecast System (Bilbao et al., 2021), which is based on the Coupled Model Intercomparison Project Phase 6 (CMIP6) version of the EC-Earth3 atmosphere-ocean general circulation model (AOGCM) in its standard resolution (∼1° both in the ocean and atmosphere; Döscher et al., 2022). Our decadal prediction system follows the CMIP6 Decadal Climate Prediction Project (DCPP) component-A protocol (DCPP, Boer et al., 2016) and, therefore, consists of 10-member ensembles of 10-year-long predictions initialised every year in November from 1960 to present, with prescribed CMIP6 historical forcings, including the stratospheric volcanic aerosols (Luo, 2018).
To evaluate the climate response to volcanic forcings we follow a protocol similar to the Decadal Climate Prediction Project (DCPP, Boer et al., 2016), which was designed jointly with VolMIP (Zanchettin et al., 2016), to investigate the impact of volcanic eruptions on decadal predictions. DCPP component-C repeats the 10-member hindcasts initialised in 1962, 1981 and 1990 (corresponding with the start-dates right before the onset of the three major volcanic eruptions), but without the volcanic forcings, which are then compared with the baseline hindcast (DCPP-A) to diagnose the effects of the forcings. To evaluate the realism of the EVA and EVA_H estimates, we repeat the forecasts for the same three start dates but using instead the corresponding volcanic forcings. The experiments are summarised in Table 1. The impact of the volcanic forcing is computed by subtracting the DCPP-C from the DCPP-A hindcasts, i.e., the hindcasts with volcanic forcing minus the hindcasts without volcanic forcing. The significance of the differences for both time series and fields is tested by creating a distribution of 10-member mean differences by bootstrap with replacement of ensemble members from 1000 repetitions. If the 2.5 %–97.5 % range of the distribution of differences (equivalent to p≤0.05) does not include zero we reject the null hypothesis (no difference between the hindcast sets with and without volcanic forcing) and the differences are considered statistically significant. To estimate whether the responses simulated in the DCPP-EVA, DCPP-EVA_H and DCPP-EVA_H_Hud hindcasts are significantly different from the DCPP-A hindcast, we apply a Mann-Whitney U test to compare the ensemble distributions. For the time series plots, the intra-ensemble spread is shown by the 10th and the 90th percentiles of the 10-member hindcast experiments ensemble.
The prediction anomalies were computed using the lead-time-dependent climatology from the DCPP-A decadal hindcasts and we assume that the forecast drift is equal in all the hindcast experiments, which is a reasonable assumption given that large volcanic eruptions are uncommon. To evaluate the hindcasts we use the ERA5 reanalysis (Hersbach et al., 2020) for TOA fluxes, near-surface temperature and lower stratospheric temperature (at 100 hPa). Additionally we use the satellite derived datasets: Deep-C version 5 reconstruction (Liu et al., 2020) for TOA fluxes and the TLS (Temperature Lower Stratosphere) single-channel data set of zonally averaged temperature anomalies, produced by Remote Sensing Systems (RSS, Mears and Wentz, 2009). This last dataset is sensitive to temperatures between altitudes of 12 to 27 km and is derived using vertical weighting functions (see Mears and Wentz, 2009 for further details). For the model experiments not enough vertical model levels were saved for atmospheric temperature to apply a vertical weighting function as in TSL, so we take the temperature at 100 hPa which approximately corresponds with the maxima.
To quantify the errors in the hindcasts for the ensemble mean surface temperature we use the area-weighted root mean square error, as in Bilbao et al. (2024). To determine the impact of the volcanic forcings on the quality of the predictions we also compute for each grid cell whether the observations are outside the 90 % range of the ensemble members by computing the 5th and 95th percentiles.
Carn et al. (2016)
3.1 Volcanic Forcings
We start by comparing the global mean AOD at 530 nm for the volcanic forcings produced with EVA and EVA_H including the 1963 eruption of Mount Agung, the 1982 eruption of El Chichón and the 1991 eruption of Mount Pinatubo, with the CMIP6 stratospheric aerosol forcing (Luo, 2018) (Fig. 1). The CMIP6 forcing may be considered a best estimate, although the AOD after the eruptions of Mount Agung and El Chichón are very uncertain due to the limited amount of observations. Overall the three forcings show a comparable global mean AOD (at 530 nm) evolution following the three volcanic eruptions, however, there are some evident differences among them. These are more pronounced for the eruptions of Agung and El Chichón. For these eruptions, the peak AOD simulated by both EVA and EVA_H is smaller than in CMIP6 by ∼20 % and ∼40 %, respectively. As for the temporal evolution, the EVA and EVA_H forcings compare reasonably well with CMIP6 for the eruption of Agung, but decay faster for El Chichón. In the case of the eruption of Pinatubo, both EVA and EVA_H forcings compare better with the CMIP6 values, however some differences remain. For the EVA forcing, the peak AOD is very similar in magnitude to CMIP6, but the forcing rises faster and decays sooner. In contrast, the decay in the EVA_H forcing compares better to CMIP6, but its peak AOD is smaller by approximately 14 %. Our EVA and EVA_H forcing time series only includes the three main eruptions, which dominated the changes in AOD, but other smaller eruptions have occurred. Consequently, we produce another forcing time series with EVA_H using the complete Carn et al. (2016) emission inventory, referred to as EVA_H_Carn16. This suggests that the apparent underestimation of the Pinatubo forcing (∼18 Tg SO2 in Carn et al., 2016) is mostly resolved when including all eruptions, most importantly the 1991 eruption of Cerro Hudson (∼4 Tg SO2 in Carn et al., 2016).
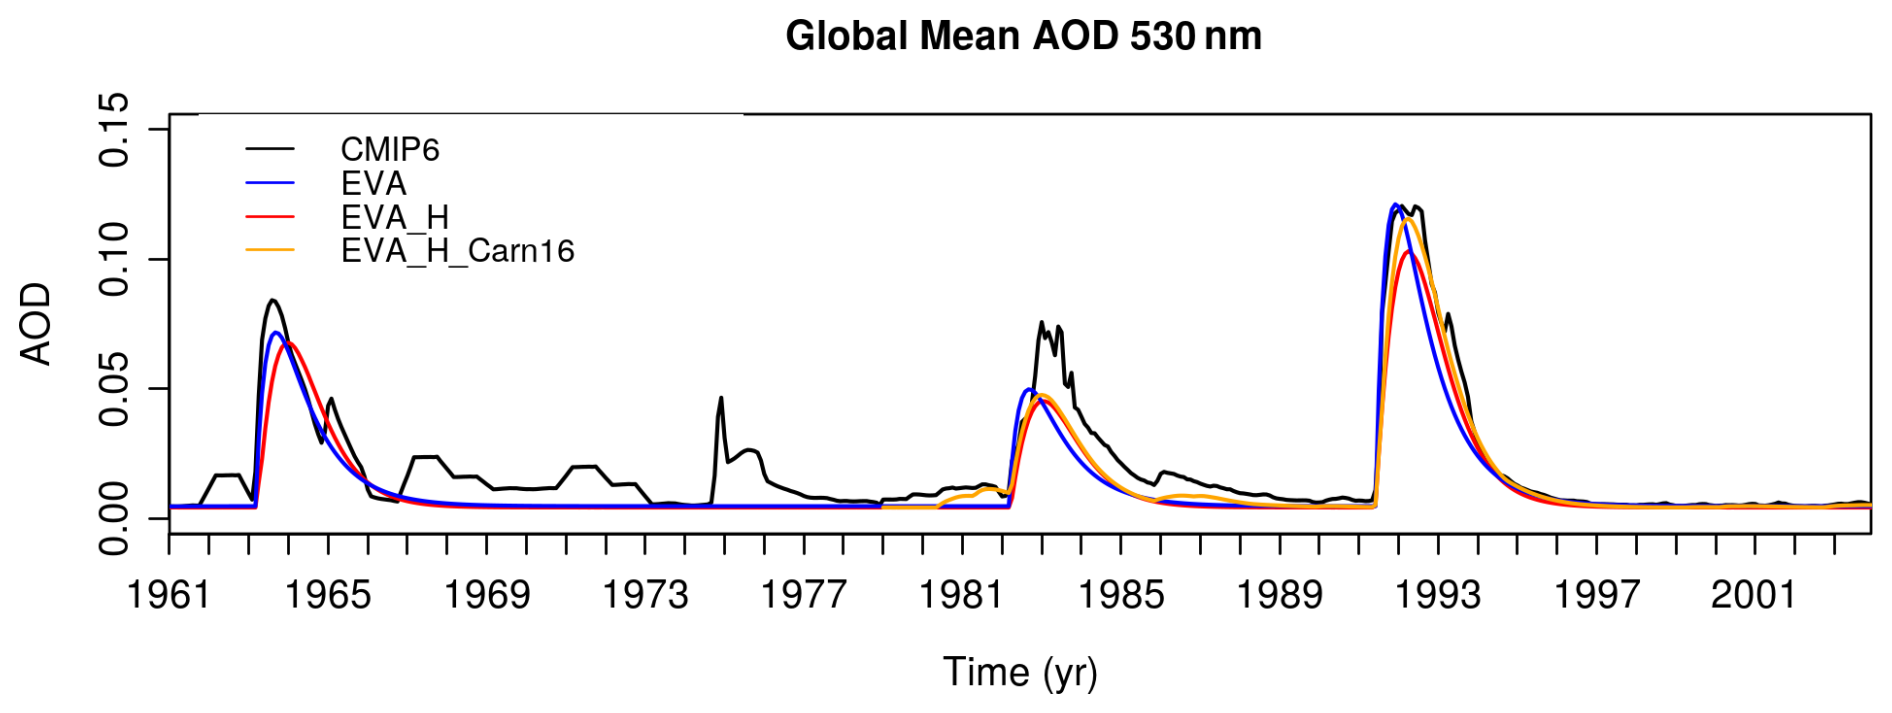
Figure 1Global mean stratospheric aerosol optical depth at 530 nm. The EVA and EVA_H forcings only have data for the eruptions of Mount Agung in 1963, El Chichón in 1982 and Mount Pinatubo in 1991. The EVA_H_Carn16 forcing was generated with the data from Carn et al. (2016) which includes all volcanic eruptions from 1978–2004.
Figure 2 shows that both EVA and EVA_H forcings also have some discrepancies with CMIP6 in terms of the latitudinal structure of the forcing. The CMIP6 forcing indicates that the eruption of Agung had a stronger aerosol forcing in the Southern Hemisphere, the eruption of El Chichón produced a stronger forcing in the Northern Hemisphere and the eruption of Pinatubo produced a mostly hemispherically symmetric forcing (Fig. 2a–c). For the eruption of Pinatubo, EVA simulates a forcing with stronger maxima in the equator and a weaker forcing in the high latitudes with respect to CMIP6 (Fig. 2f). On the other hand, EVA_H simulates comparatively well the three maxima in the CMIP6 forcing (in the equator and Northern and Southern Hemispheres), however the magnitude of the forcing is overall underestimated, especially in the tropics (Fig. 2i). Overall, EVA simulates the magnitude of the maxima in the equator closer to CMIP6, but the overall latitudinal structure is better captured by EVA_H. For the other two eruptions, which are more uncertain, EVA_H simulates a forcing structure similar to the one for Pinatubo, not accounting for the latitudinal asymmetry of the forcing (Fig. 2g and h). In contrast, the hemispheric asymmetry factor in EVA allows for the latitudinal asymmetry of the forcing of Mount Agung and El Chichón to be partly captured (Fig. 2d and e). However the AOD values are weaker by ∼40 % in the Southern Hemisphere for the eruption of Agung and by ∼70 % in the Northern Hemisphere for the eruption of El Chichón, with respect to CMIP6.
Comparing the EVA_H and EVA_H_Carn16 forcings (Fig. S1 in the Supplement) we find that including the eruption of Cerro Hudson produces a stronger forcing in the Southern Hemisphere, which increases the similarity with the CMIP6 forcing. This suggests a potential role of the eruption of Cerro Hudson in the latitudinal distribution in 1991, making Pinatubo seem more hemispherically symmetric than it was. There is also a minor increase in AOD in the EVA_H-Carn16 forcing in the Northern hemisphere, which is due to other small Northern Hemisphere eruptions included in the Carn et al. (2016).
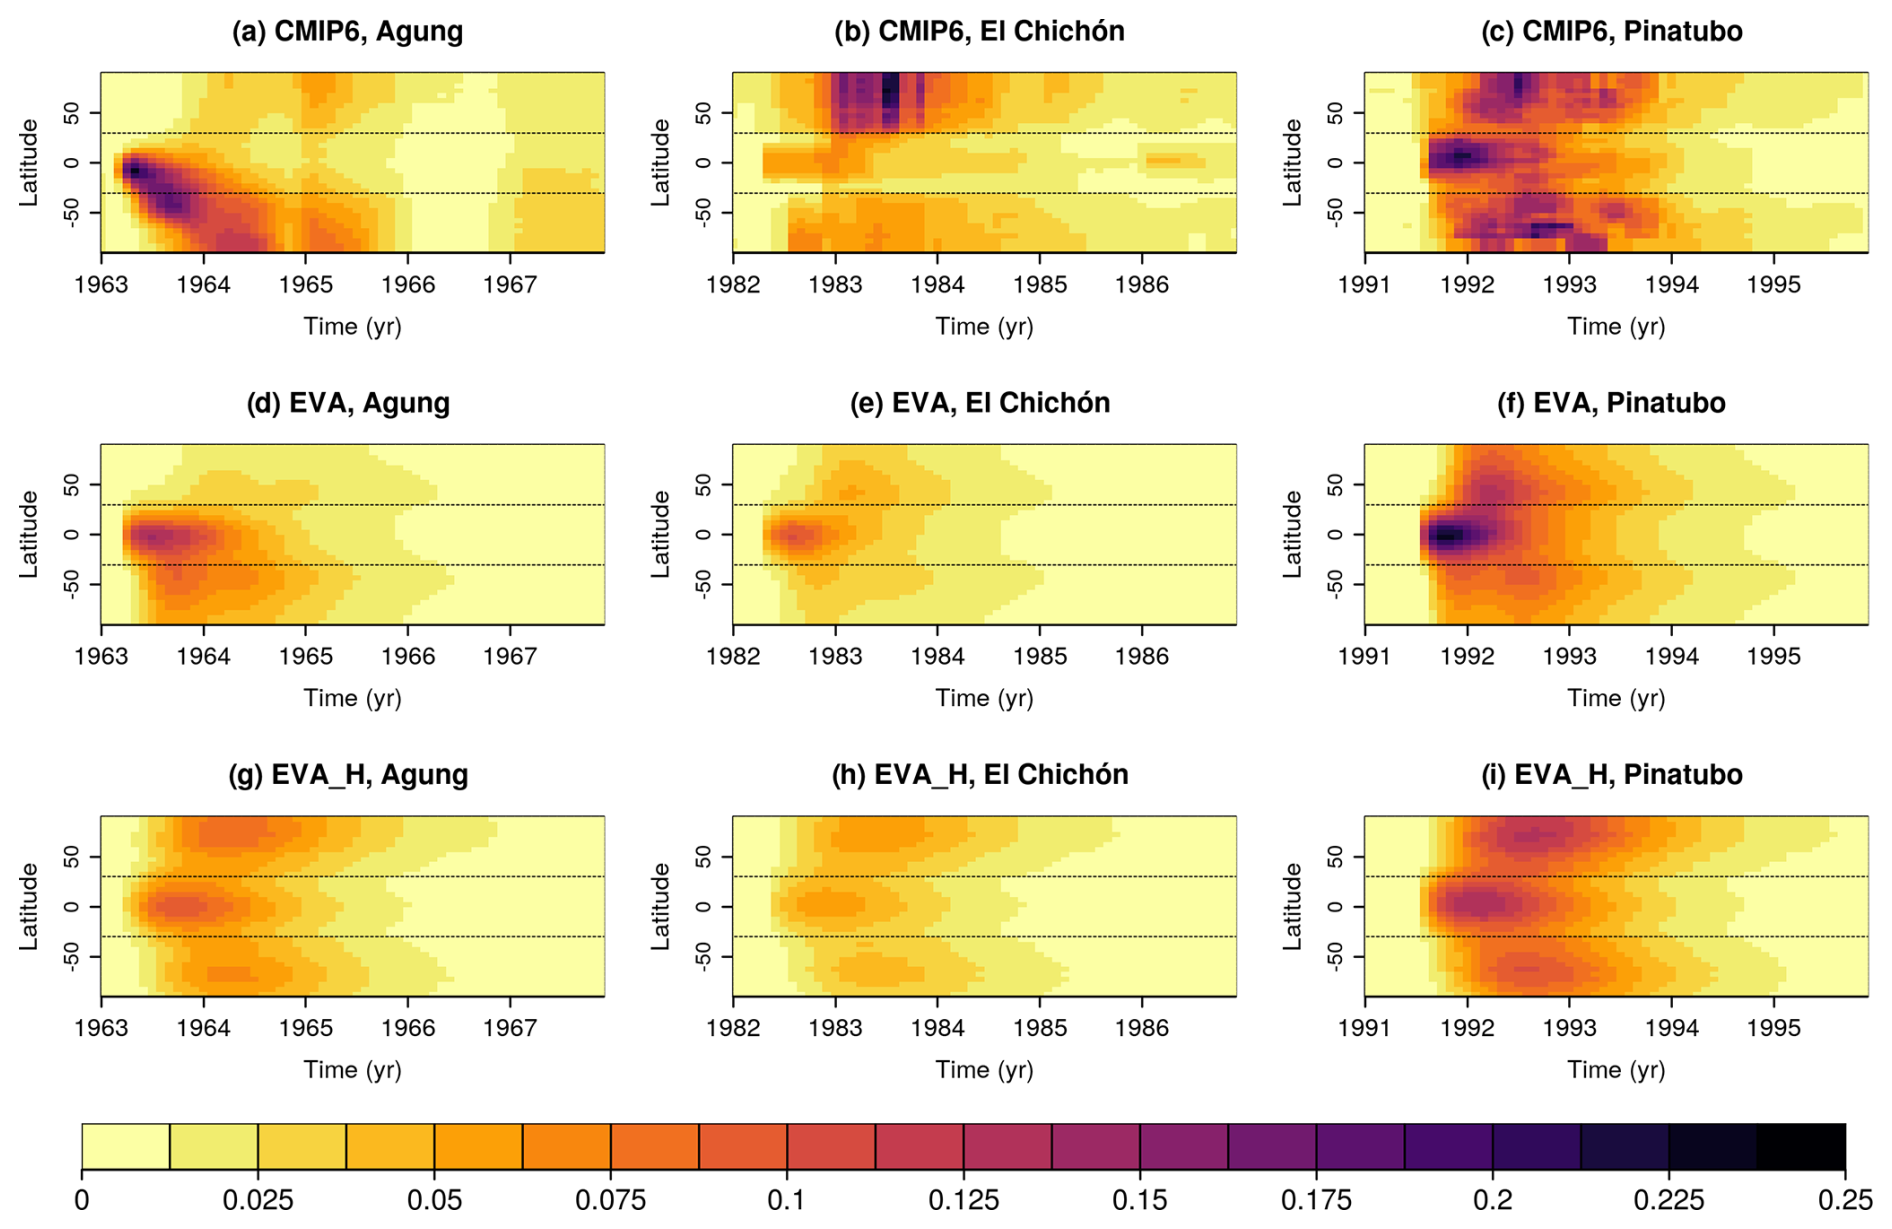
Figure 2Stratospheric aerosol optical depth at 530 nm as a function of time and latitude for the eruptions of Mount Agung in 1963 (a, d, g), El Chichón in 1982 (b, e, h) and Mount Pinatubo in 1991 (c, f, i) for CMIP6, EVA and EVA_H.
Figure 3 shows the tropical mean extinction as a function of time and altitude. For CMIP6, the altitude of peak tropical extinction clearly decreases with time for all three eruptions considered, from ∼24 km (1963) to ∼20 km (1966) for Agung, ∼22 km (1983) to ∼18 km (1986) for El Chichón and ∼22 km (1991) to ∼19 km (1994) for Pinatubo. The forcing vertical structure is independent of time for the eruptions considered in EVA, with a peak tropical extinction at 25 km. In contrast, the developments in EVA_H allow temporal and eruption-dependent peak extinction altitude, which is more realistic. While for the Agung forcing produced with EVA_H the peak extinction does not vary much, there is nonetheless a noticeable downward shift in the altitude of extinction values. The relatively stable altitude of peak extinction afterwards likely results from the lower SO2 injection heights during the two phases (18 and 20 km), which are close to the tropopause. In contrast, for the El Chichón and Pinatubo eruptions, a clear decline in peak tropical extinction altitude is simulated, consistent with satellite observations upon which the CMIP6 forcing is based for these eruptions, dropping from approximately 23 km in 1983 to 20 km in 1986 for El Chichón, and from around 23.5 km in 1991 to 19.5 km in 1994 for Pinatubo. These eruptions had higher injection heights of 25 and 28 km, respectively.
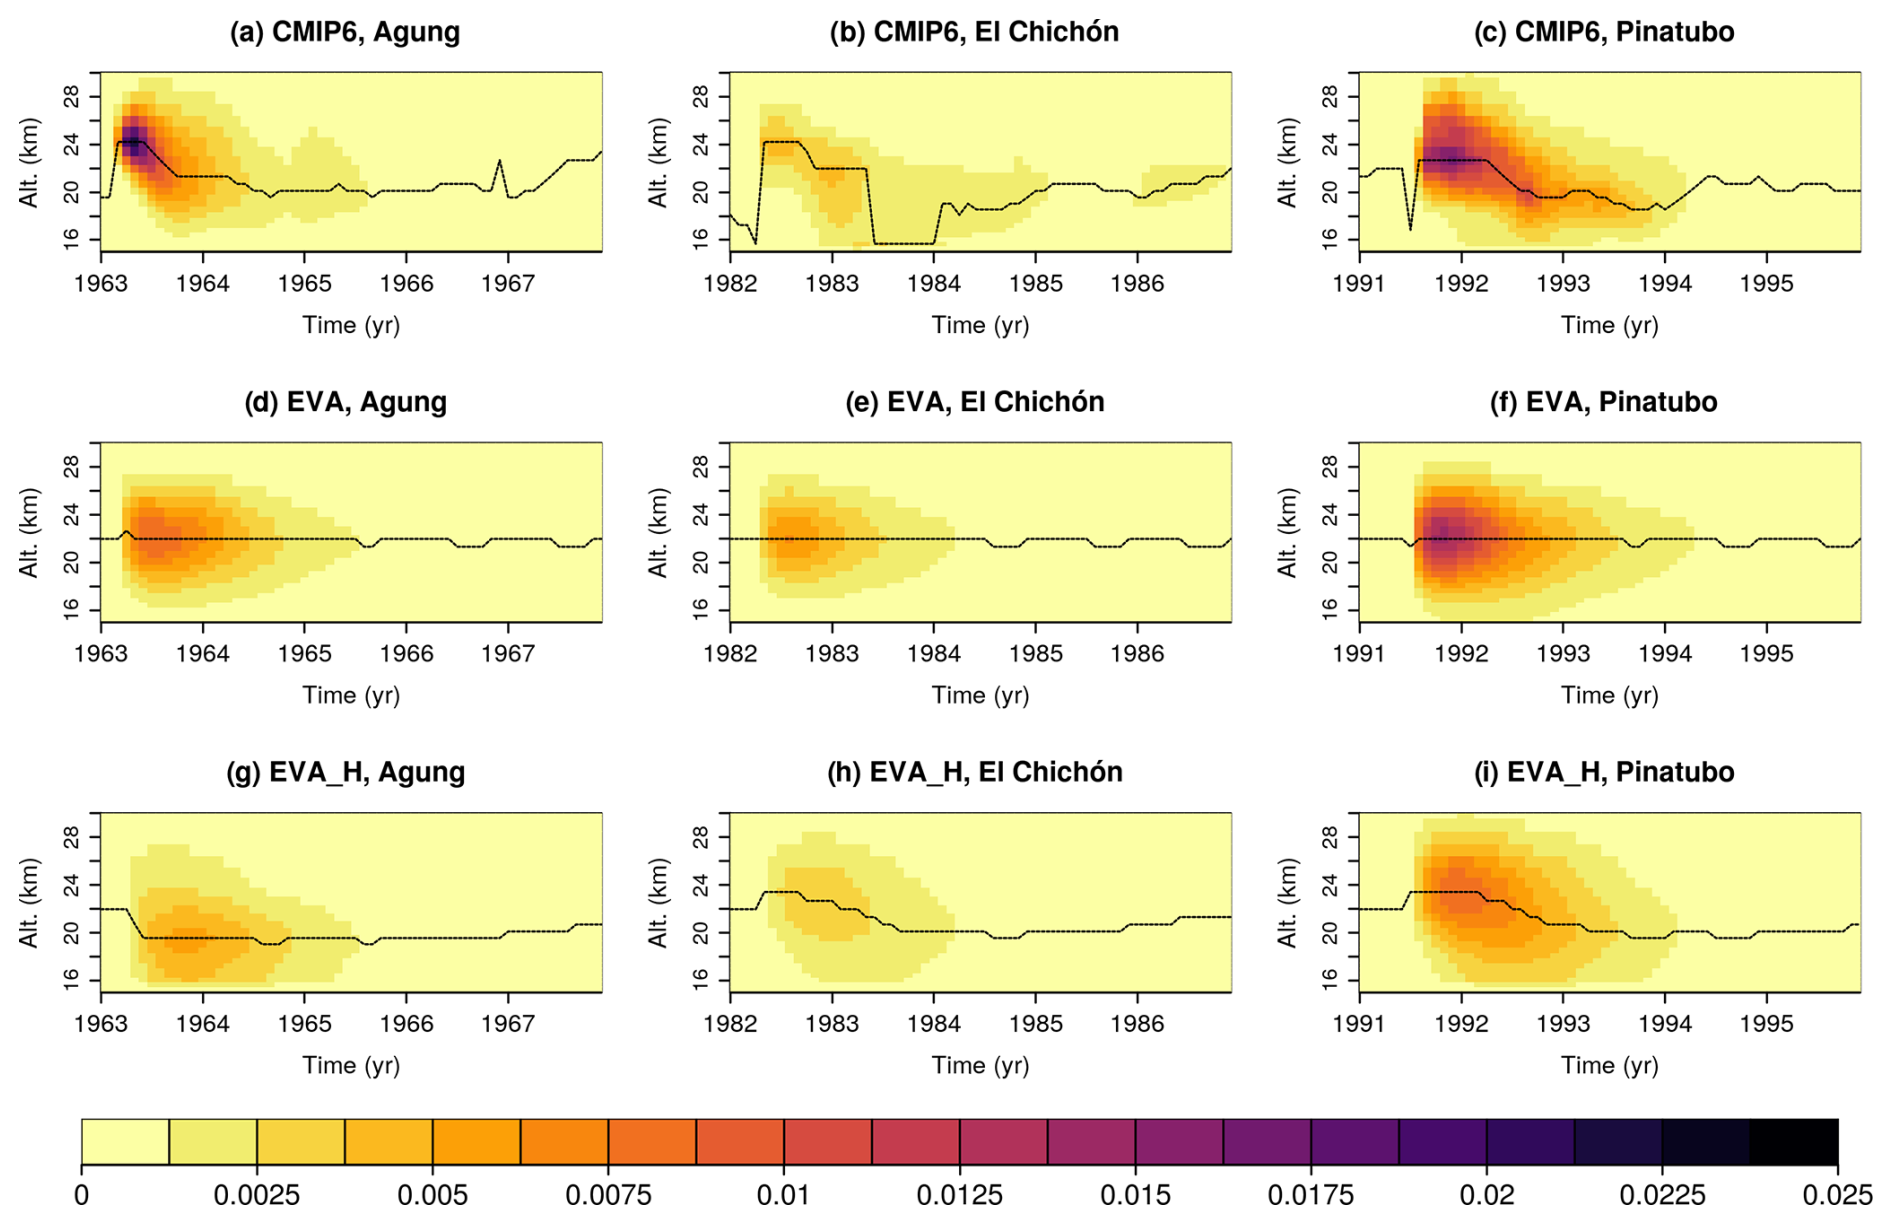
Figure 3Tropical-mean (30° N–30° S) extinction (km−1) at 530 nm as a function of time and altitude for the eruptions of Mount Agung in 1963 (a, d, g), El Chichón in 1982 (b, e, h) and Mount Pinatubo in 1991 (c, f, i) for CMIP6, EVA and EVA_H. Logarithmic colorbar scale. The dashed line indicates the height of the maximum AOD.
3.2 Climate response to the volcanic forcings
3.2.1 Global mean climate response
We first analyse the global mean net top-of-atmosphere (TOA) radiation flux response (i.e., hindcasts with volcanic forcing minus hindcasts with no volcanic forcing), calculated as anomalies of incoming shortwave minus outgoing shortwave and out-going longwave radiation. Figure 4a–c shows a post-volcanic decrease in global mean TOA radiation flux response which is qualitatively similar in the three hindcast experiments (DCPP-A, DCPP-EVA and DCPP-EVA_H). The ensemble mean negative TOA flux anomalies are statistically significant following the eruptions of Mount Agung and Pinatubo, which last for a year and two years respectively, while for the eruption of El Chichón shows a weaker and barely significant response (filled squares at the bottom of Fig. 4a–c). Comparing the ensemble mean TOA flux responses in the hindcast sets for each eruption, we find some differences in the magnitude and the temporal evolution, consistent with the differences in the volcanic forcings used. However, these differences across the hindcasts are not statistically significant, with few exceptions (asterisks at the bottom of Fig. 4a–c). DCPP-EVA, and in particular DCPP-EVA_H show an overall weaker response compared to DCPP-A following the eruptions of Mount Agung and El Chichón. For the latter eruption, despite its weak intensity which hinders the detection of robust signals, DCPP-EVA shows an initial strong response. Also, after el Chichón the forced signals last longer in DCPP-A than for both DCPP-EVA and DCPP-EVA_H, since the CMIP6 forcing is overall stronger (Fig. 1). For the eruption of Mount Pinatubo, the magnitude of the response in DCPP-EVA compares well with DCPP-A and may even be slightly stronger, while in DCPP-EVA_H the response is weaker and significantly different with respect to DCPP-A at peak values. There are also some differences in the temporal evolution in DCPP-EVA, as the EVA forcing decays earlier than in EVA_H and CMIP6.
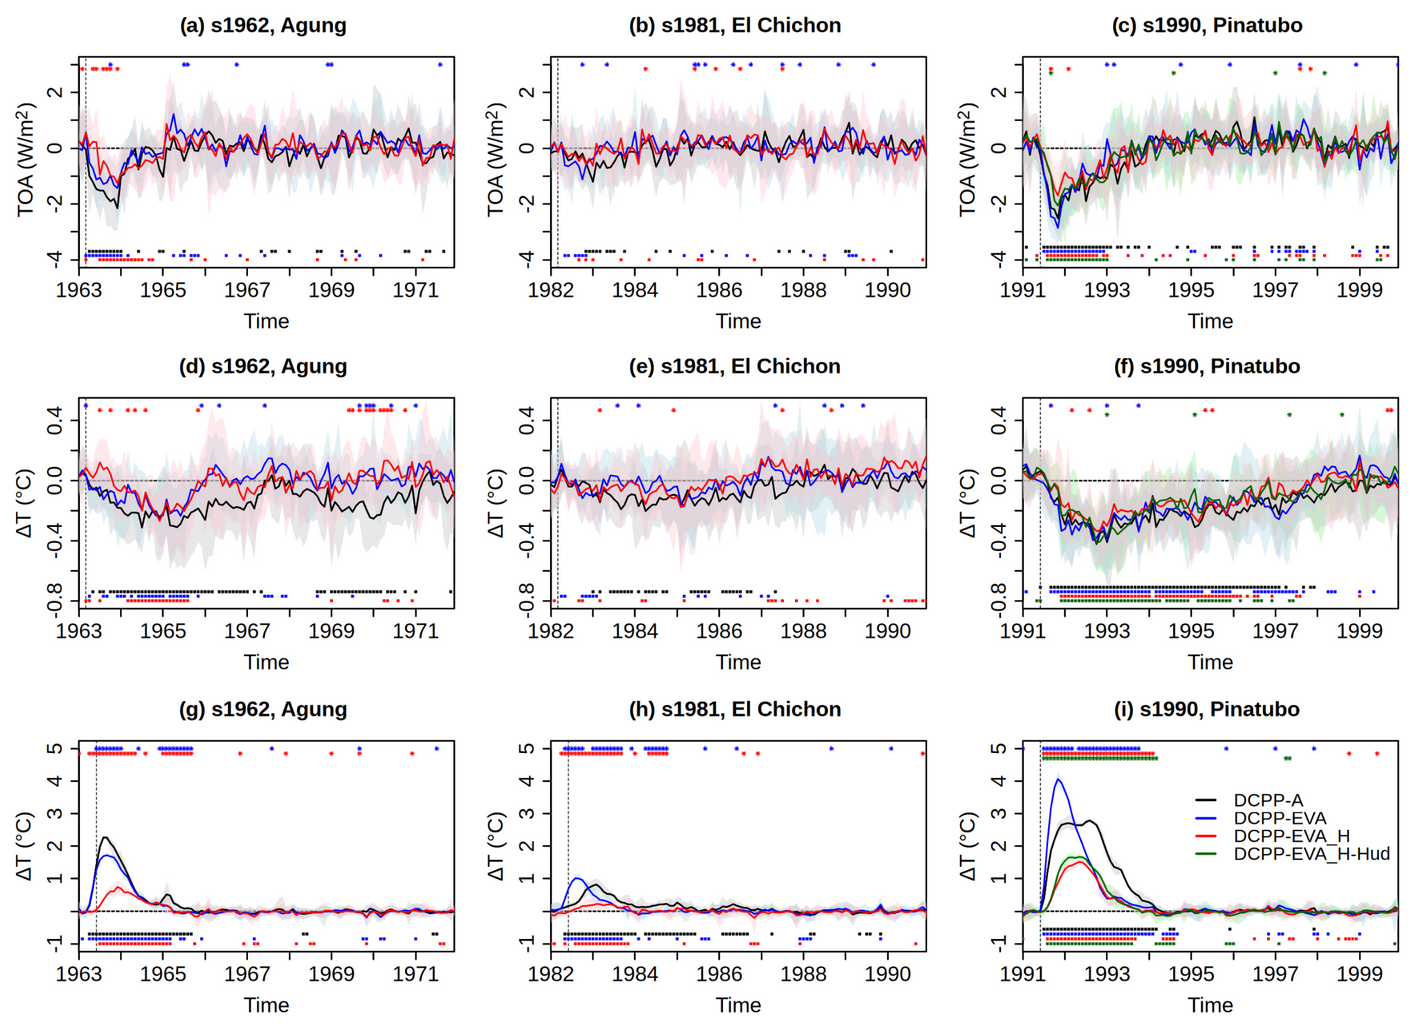
Figure 4Global mean (a–c) top-of-atmosphere net radiative flux (W m−2), (d–f) surface air temperature (°C) and (g–i) lower stratospheric (50 hPa) temperature (°C) responses to the volcanic eruptions (hindcasts with volcanic forcing minus hindcasts without volcanic forcing), for DCPP-A (CMIP6) in black, DCPP-EVA in blue, DCPP-EVA_H in red and DCPP-EVA_H_Hud in green. The shading is the multi-model member spread calculated as the 10th and 90th percentiles of the ensemble. Filled squares at the bottom of the figures indicate statistically significant differences from zero (p<0.05), based on a bootstrap with resampling with 1000 iterations. Asterisks at the top part of the figures indicate whether the responses simulated in DCPP-EVA, DCPP-EVA_H and DCPP-EVA_H_Hud are significantly different (p<0.05) from DCPP-A based on a Mann-Whitney U test.
The global mean surface temperature responses are consistent with the global mean TOA fluxes (Fig. 4d–f). Despite the noisier global mean surface temperature responses following the eruptions of Agung and El Chichón, the ensemble mean post-volcanic cooling in DCPP-EVA and DCPP-EVA_H is slightly weaker with respect to DCPP-A (Fig. 4d and e), consistent with the reduced statistical significance of the response. These differences are statistically indistinguishable across the experiments. For the eruption of Pinatubo, the negative global surface temperature response is consistent across the hindcast sets and remain statistically significant for up to six years (Fig. 4f). Small differences are found in DCPP-EVA and DCPP-EVA_H with respect to DCPP-A that are consistent with the TOA flux responses, especially in the first year following the eruption, but these are again not statistically significant across the hindcasts.
The global mean temperature in the lower stratosphere (50 hPa) shows strong post eruption warming anomalies with smaller ensemble spread in comparison to other variables (Fig. 4g–i), reinforcing the fundamental differences induced by the forcings. As a result, both the DCPP-EVA and DCPP-EVA_H hindcasts exhibit statistically significant differences compared to DCPP-A. In the particular case of DCPP-EVA hindcasts the lower stratospheric anomalies show eruption-dependent differences with respect to DCPP-A. For the eruption of Agung the temporal evolution of the warming is consistent with DCPP-A but slightly weaker in magnitude, for El Chichón the warming happens earlier and is slightly stronger and for Pinatubo the magnitude is stronger but decays earlier. In contrast, in DCPP-EVA_H the lower stratospheric anomalies are consistently weaker than in DCPP-A and DCPP-EVA_H for the three eruptions, although there are some similarities in the temporal evolution.
For the eruption of Mount Pinatubo, the weaker TOA flux response in DCPP-EVA_H is, at least partly, due to omitting the eruption of Cerro Hudson. As indicated by the EVA_H_Hud experiment, when this eruption is also included, the ensemble mean TOA radiation flux response is still weaker compared to DCPP-A (by ∼18 %) (Fig. 4c), reducing the difference with CMIP6 by half. This is supported by the fact that the difference in TOA flux response between the DCPP-EVA_H and DCPP-A hindcasts is no longer statistically significant at the peak values. Consequently, the magnitude of the global mean surface temperature response and its temporal evolution are in better agreement with DCPP-A than the other two hindcasts (DCPP-EVA and DCPP-EVA_H). In contrast, for the global mean temperature response in the lower stratosphere (50 hPa), including the eruption of Cerro Hudson in the EVA_H forcing marginally increases the global mean temperature response in the lower stratosphere.
3.2.2 Spatiotemporal Characteristics of the Radiative Response
Next, we examine how latitudinal differences in the forcings influence the geographical patterns of the response. Figure 5 shows the zonal mean TOA flux response in the first year following the eruptions, when the TOA response is at its peak. Consistent with the volcanic forcings (Fig. 2), the largest TOA flux decrease – statistically significant in all hindcast experiments – occurs in the tropics. However, there are noticeable latitudinal differences in the forcings for the three eruptions, which reflect variations in volcanic forcing. Neither DCPP-EVA nor DCPP-EVA-H reproduce the TOA flux response in the Southern and Northern Hemispheres after the eruptions of Mount Agung and El Chichón respectively, and these differences with respect to DCPP-A are significantly different (Fig. 5a and b). Nonetheless, for Mount Agung, DCPP-EVA shows a statistically significant TOA flux decrease in the Southern Hemisphere, as the EVA volcanic forcing captures, at least partly, the latitudinal structure of the forcing through the hemispheric asymmetry parameter, though the effect is much weaker than in the CMIP6 forcing. For the Pinatubo eruption, which is almost hemispherically symmetric, the negative TOA flux response in DCPP-EVA is comparable to DCPP-A but slightly stronger at the equator, with the peak extending further south (Fig. 5c). In contrast, DCPP-EVA-H shows a considerably weaker negative TOA flux response along the equator (around −2 W m−2), which is significantly different from DCPP-A. Including the eruption of Cerro Hudson increases the TOA response, but has a small impact.
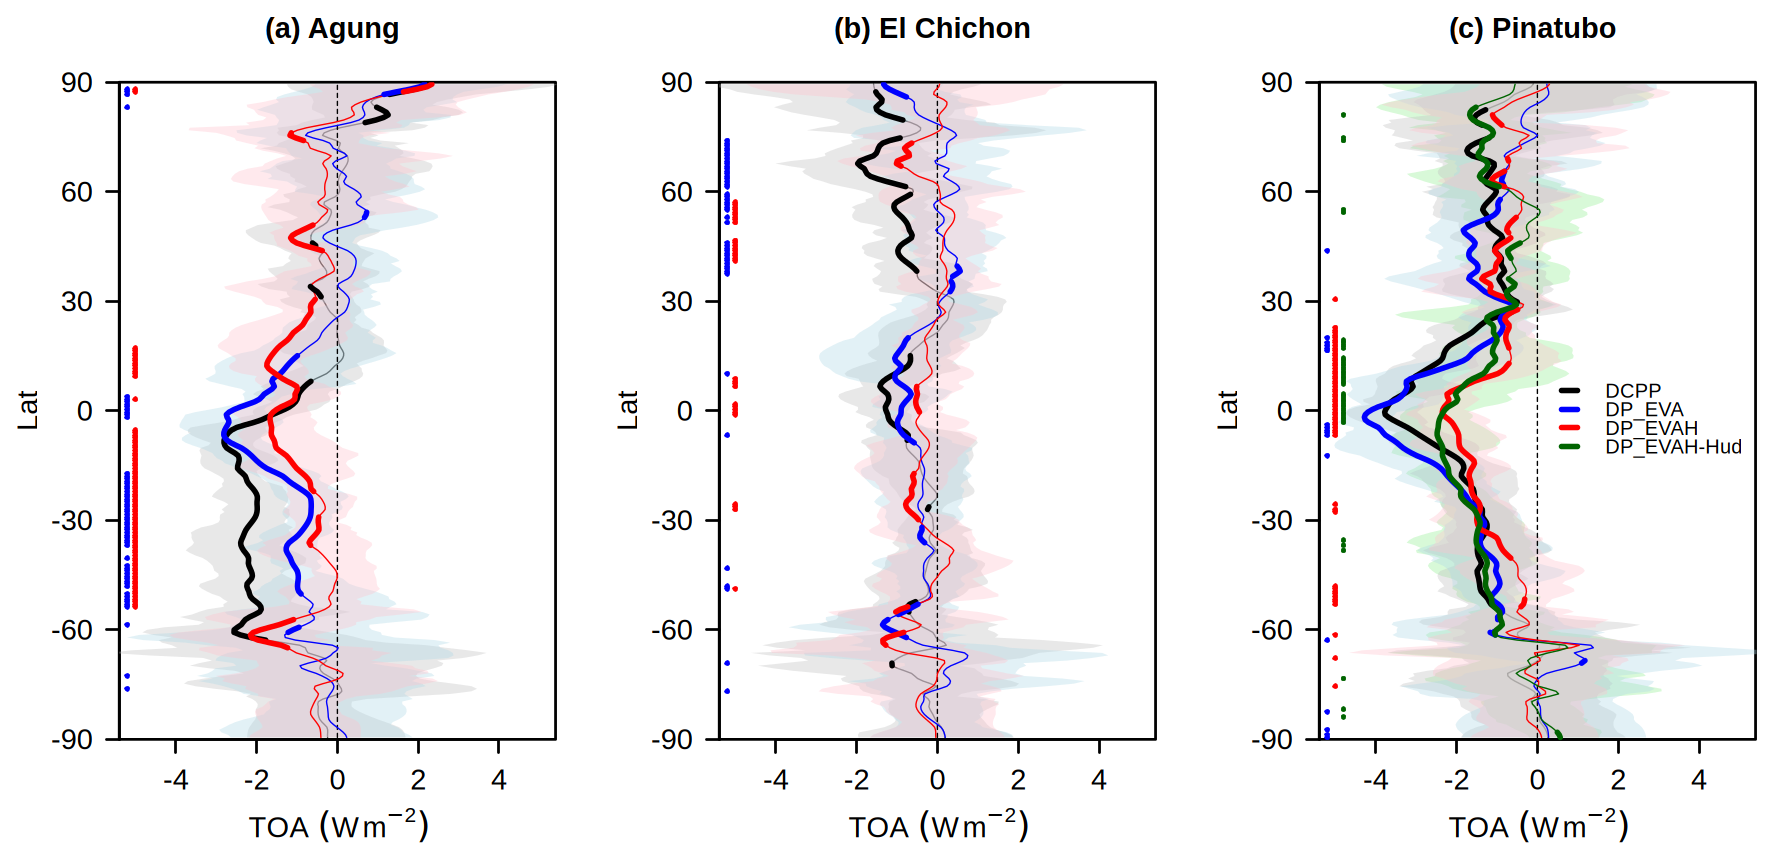
Figure 5Zonal mean TOA radiation flux (W m−2) response (hindcasts with volcanic forcing minus hindcasts without volcanic forcing) the first year following the eruptions (June–May) in DCPP (CMIP6), DCPP-EVA and DCPP-EVA_H. The ensemble mean for each hindcast experiment is shown. The shading is the member spread calculated as the 10th and 90th percentiles of the ensemble. Thicker lines indicate statistically significant differences from zero (p<0.05), based on a bootstrap with resampling with 1000 iterations. Asterisks at the left part of the figure indicate whether the responses simulated in DCPP-EVA, DCPP-EVA_H and DCPP-EVA_H_Hud are significantly different (p<0.05) from DCPP-A based on a Mann-Whitney U test.
Latitudinal differences in the TOA flux response influence the surface temperature response, which can last several years, depending on the eruption's magnitude. In the first year following the eruptions, which roughly coincides with the period of post volcanic global mean surface cooling, the surface temperature response patterns are characterised by cooling over the tropics and subtropics (Fig. 6). This cooling is generally consistent across the hindcast experiments and volcanic eruptions, despite some noise due to the small ensemble size. However, differences align with variations in the TOA radiation flux response. For example, both DCPP-EVA and DCPP-EVA_H simulate weaker tropical cooling following the eruption of Mount Agung, with the effect being more pronounced in DCPP-EVA_H. Similarly, the cooling response is also weaker in DCPP-EVA_H after the eruption of Mount Pinatubo. For the DCPP-EVA_H-Hud predictions the cooling response is similar, with slightly stronger cooling due to adding the contribution of Cerro Hudson to the volcanic forcing (Fig. S2a).
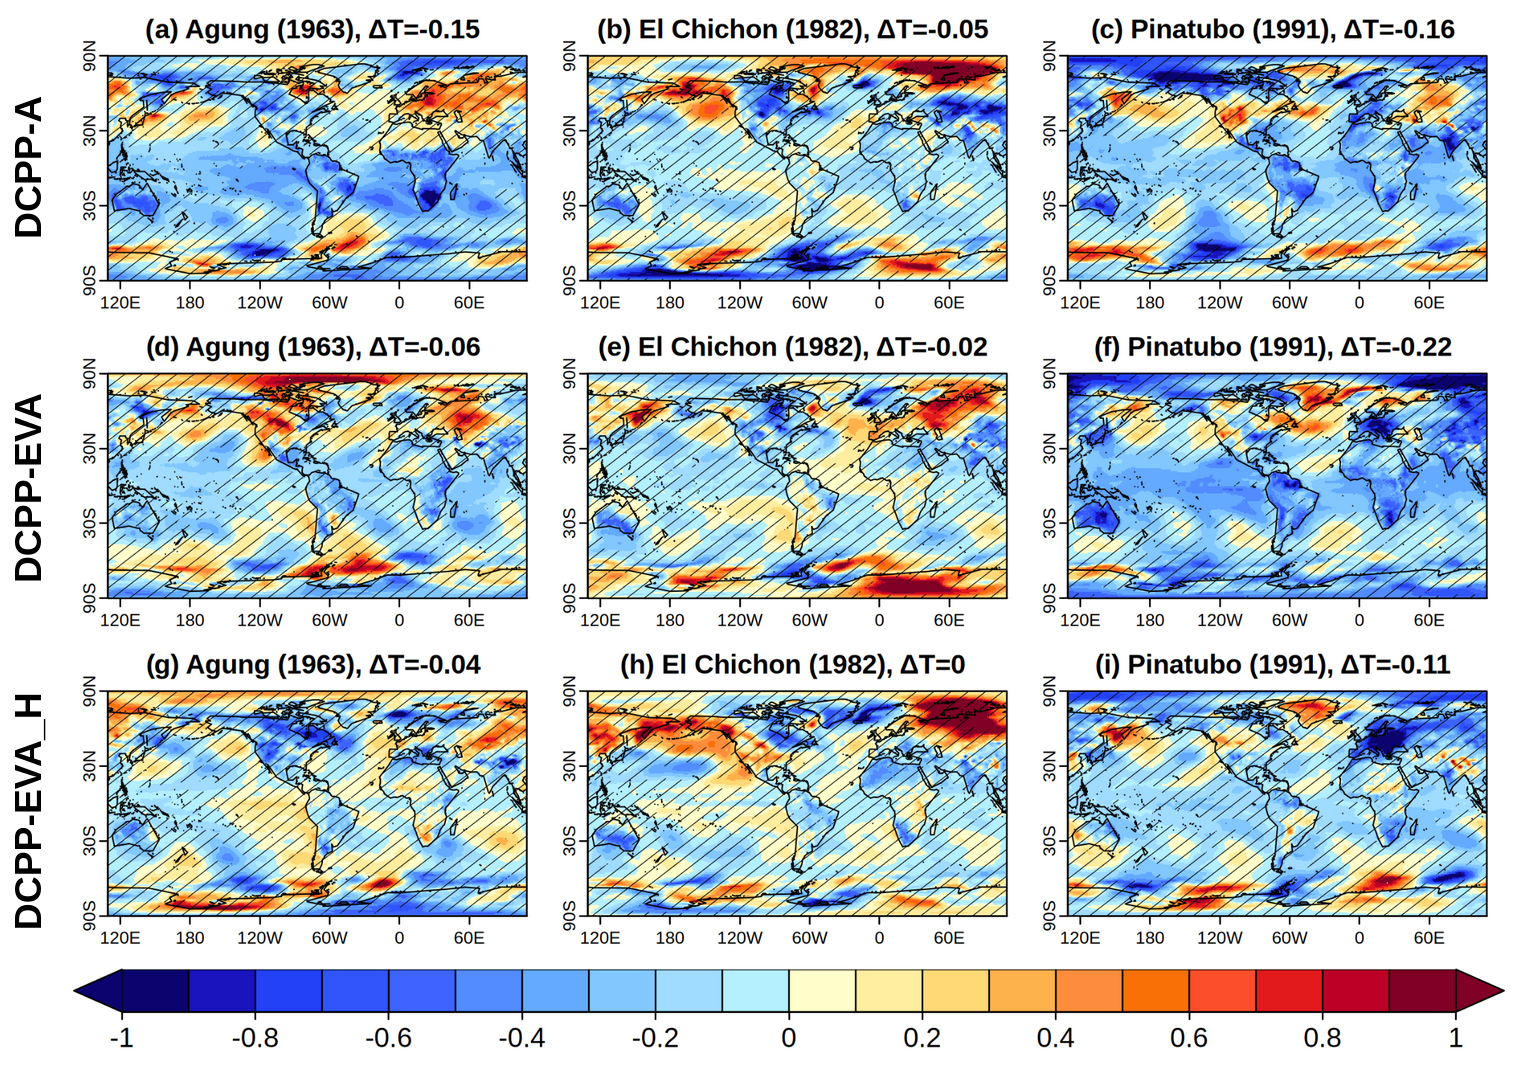
Figure 6Ensemble mean surface air temperature (°C) response (hindcasts with volcanic forcing minus hindcasts without volcanic forcing) for the first year following the eruptions (June–May) in DCPP (CMIP6), DCPP-EVA and DCPP-EVA_H. Hatching indicates statistically non-significant anomalies according to a bootstrap with resampling with 1000 iterations. The titles include the global mean surface temperature response.
For years 2 to 5 after the eruptions, as the global mean surface temperature recovers, cooling spreads worldwide, with the strongest effects seen in the tropics, subtropics, and Arctic, depending on the eruption's magnitude (Fig. 7). For this period, the volcanic impact on surface temperature becomes clearer due to longer temporal averaging, revealing significant differences across the hindcasts. The DCPP-EVA and DCPP-EVA_H hindcasts show much weaker volcanic cooling compared to DCPP-A for the Mount Agung and El Chichón eruptions (Fig. 7d, e, g and h). In contrast, for the Pinatubo eruption, these hindcasts simulate widespread cooling, with the strongest cooling over the Arctic (Fig. 7f, i). However, there are some differences from DCPP-A, attributable to the volcanic forcing differences described previously: DCPP-EVA shows slightly stronger tropical cooling than DCPP-A, while DCPP-EVA_H simulates generally weaker anomalies overall. For the DCPP-EVA_H-Hud hindcasts the response patterns are similar, again with a slightly stronger cooling response (Fig. S2b).
In forecast years 6–9 (Fig. S3), surface temperature anomalies generally recover and weaken globally, except in the DCPP-A experiment for the Mount Agung eruption. However, this cooling is most likely not caused by the Agung eruption itself but by other smaller volcanic eruptions included in the CMIP6 volcanic forcing. On these forecast times, the Arctic is a region where cool anomalies persist in most hindcast experiments, particularly in response to the Mount Pinatubo eruption.
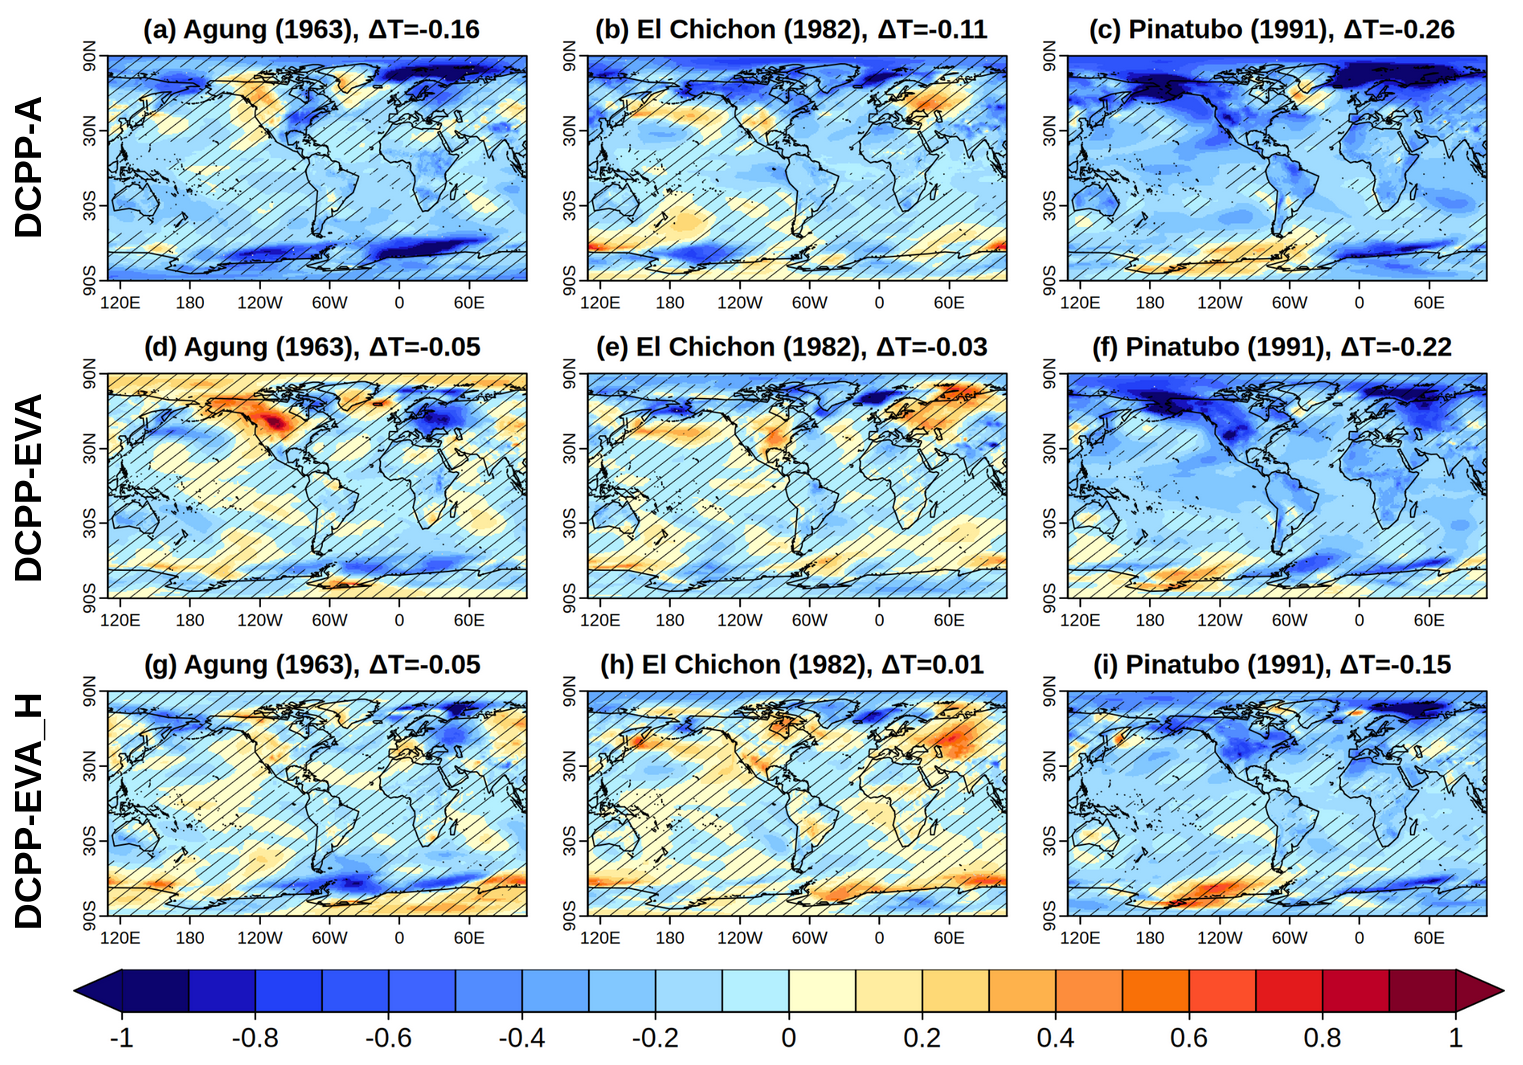
Figure 7Ensemble mean surface air temperature (°C) response (hindcasts with volcanic forcing minus hindcasts without volcanic forcing) for years 2–5 following the eruptions (June–May) in DCPP (CMIP6), DCPP-EVA and DCPP-EVA_H. Hatching indicates statistically non-significant anomalies (p<0.05) according to a bootstrap with resampling with 1000 iterations. The titles include the global mean surface temperature response.
3.2.3 Comparison of the predicted response with observations
To assess the potential impact of using forcings generated by EVA and EVA_H in operational forecasts, we compare the predicted anomalies from the hindcast experiments with the ERA5 reanalysis and observational datasets available.
Figure 8a–c show the global mean TOA flux anomalies. For the eruptions of Mount Agung and El Chichón, the hindcast experiments consistently simulate weaker global mean TOA fluxes compared to the ERA5 data. Additionally, both the DCPP-EVA and DCPP-EVA-H models produce weaker anomalies than the DCPP model. However, these results should be interpreted cautiously due to low confidence in pre-satellite TOA flux observations. For the Mount Pinatubo eruption, the global mean TOA flux anomalies can also be compared against the Deep-C version 5 reconstruction (Liu et al., 2020), which is based on CERES satellite observations. For this eruption, all hindcast experiments, except DCPP-C, show a strong alignment with both ERA5 and Deep-C, underscoring the significance of including volcanic forcing to accurately simulate the post-eruption TOA flux decrease. This agreement suggests that the predicted response in global mean flux is realistic. While the predicted TOA flux anomalies generally align well with observational data, the strongest agreement is observed in the DCPP and DCPP-EVA simulations. In contrast, the DCPP-EVA-H and DCPP-EVA_H_Hud simulations show slightly weaker anomalies, consistent with previous findings.
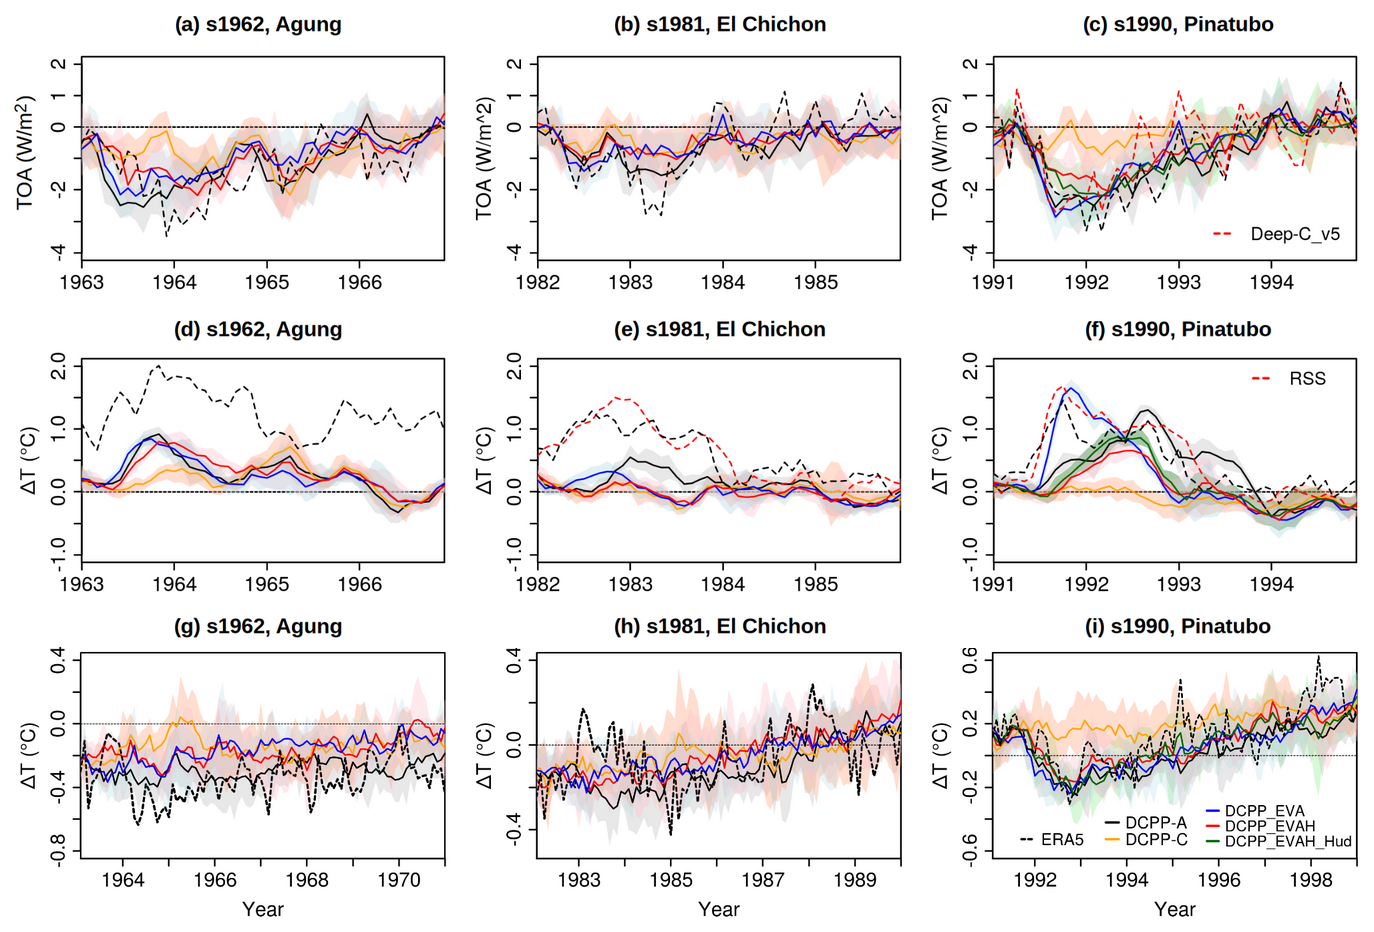
Figure 8Global mean (a–c) top-of-atmosphere net radiative flux (W m−2), (d–f) lower stratospheric (100 hPa) temperature (°C) and (g–i) surface air temperature (°C) anomalies for the decadal hindcasts and observational products. The anomalies for the TOA flux and lower stratospheric temperature have been computed with respect to the period 1985–2015, while for surface temperature the reference period is 1970–2005 (see methods for further information). For the lower stratospheric temperature anomalies the global mean was computed from 83° S and 83° N as the RSS observational dataset is limited to this range. The ensemble mean for each hindcast is shown. The shading is the multi-model member spread calculated as the 10th and 90th percentiles of the ensemble.
Comparing the latitudinal average of the predicted TOA flux anomalies for the Mount Pinatubo eruption with the Deep-C version 5 dataset shows that the DCPP and DCPP-EVA models match the observed values well, especially the negative anomalies in the tropics (Fig. 9). The observations tend to be within the ensemble spread of the predictions, although in DCPP-EVA the anomalies may be slightly overestimated in the tropics. In contrast, the DCPP-EVA_H and DCPP-EVA_H_Hud hindcasts substantially underestimate the negative anomalies in the tropics during the first six months following the eruption, although they show similar values to DCPP-A and DCPP-EVA in later months. It is also worth noting that all the predictions struggle to reproduce the changes in the high latitudes, but this might be unrelated to the volcanic forcing.
Figure 8d–f show the global mean temperature anomalies at 100 hPa for the prediction experiments, ERA5, and observational data from RSS. For the Mount Agung eruption, where direct observations are unavailable, all hindcast experiments except DCPP-C are similar, though consistently lower than ERA5 throughout the period, suggesting that comparisons should be approached with caution. For the El Chichón and Mount Pinatubo eruptions, observations from RSS are available and as mentioned in Methods, the comparison with RSS must be approached with caution. However it is reassuring that ERA5 aligns closely with this dataset. In the case of El Chichón, the predicted global mean lower stratospheric temperature anomalies are weaker than observed. For Mount Pinatubo, DCPP-EVA initially shows the closest agreement with RSS and ERA5; however, the temperature anomalies decrease more rapidly than observed, consistent with prior findings. The DCPP and DCPP-EVA_H hindcasts both underestimate the initial warming, but DCPP shows better alignment in later years while DCPP-EVA_H decays too soon. Finally, DCPP-C fails to simulate lower stratospheric warming, underscoring the importance of volcanic forcing in capturing the post-eruption response accurately.
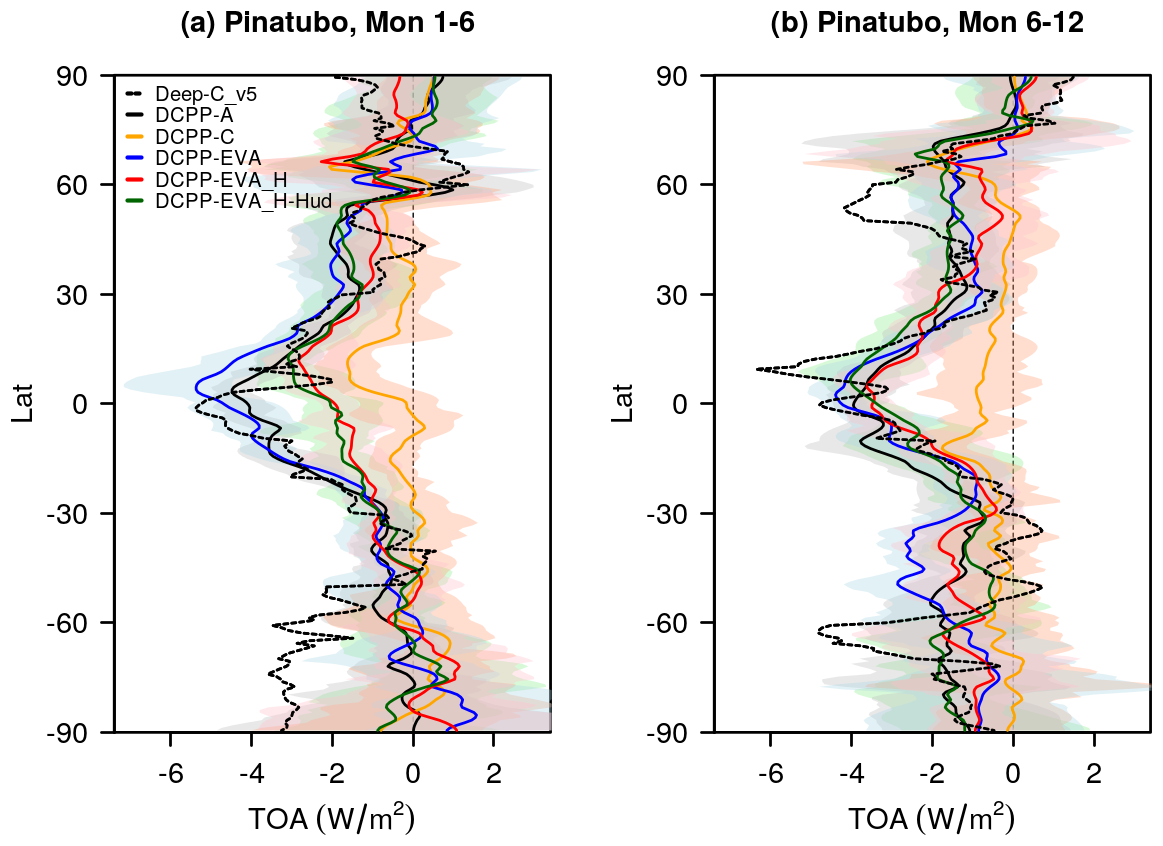
Figure 9Zonal mean TOA radiation flux anomaly (W m−2) timeseries for (a) months 1–6 and (b) 7–12 following the eruption of Mount Pinatubo. The anomalies are computed with respect to the period 1985–2015. The shading is the multi-model member spread calculated as the 10th and 90th percentiles of the ensemble.
Figure 8g–i shows the predicted global mean surface temperature anomalies alongside ERA5. Since surface temperature observations are more reliable, these comparisons should provide robust insights. Overall, the EC-Earth3 hindcasts that include volcanic forcing (DCPP-A, DCPP-EVA, and DCPP-EVA_H) align more closely with ERA5 global mean surface temperature anomalies than the hindcasts without volcanic forcing (DCPP-C). Consistent with the multi-model analysis of Bilbao et al. (2024), while the volcanic impact is less evident for the Mount Agung and El Chichón eruptions – likely due to greater observational uncertainty and their moderate magnitudes – volcanic forcing is particularly crucial for accurately reproducing the observed global temperature cooling following the Pinatubo eruption in the early 1990s. For Pinatubo, despite differences between the CMIP6, EVA, and EVA_H forcings in the hindcasts, the observed anomalies generally fall within the uncertainty range of the hindcast ensembles (between the 10th and 90th percentiles). It is worth noting that, consistent with previous findings, the global mean surface temperature response in DCPP-EVA initially shows stronger cooling than observed, while DCPP-EVA_H simulates slightly weaker peak cooling.
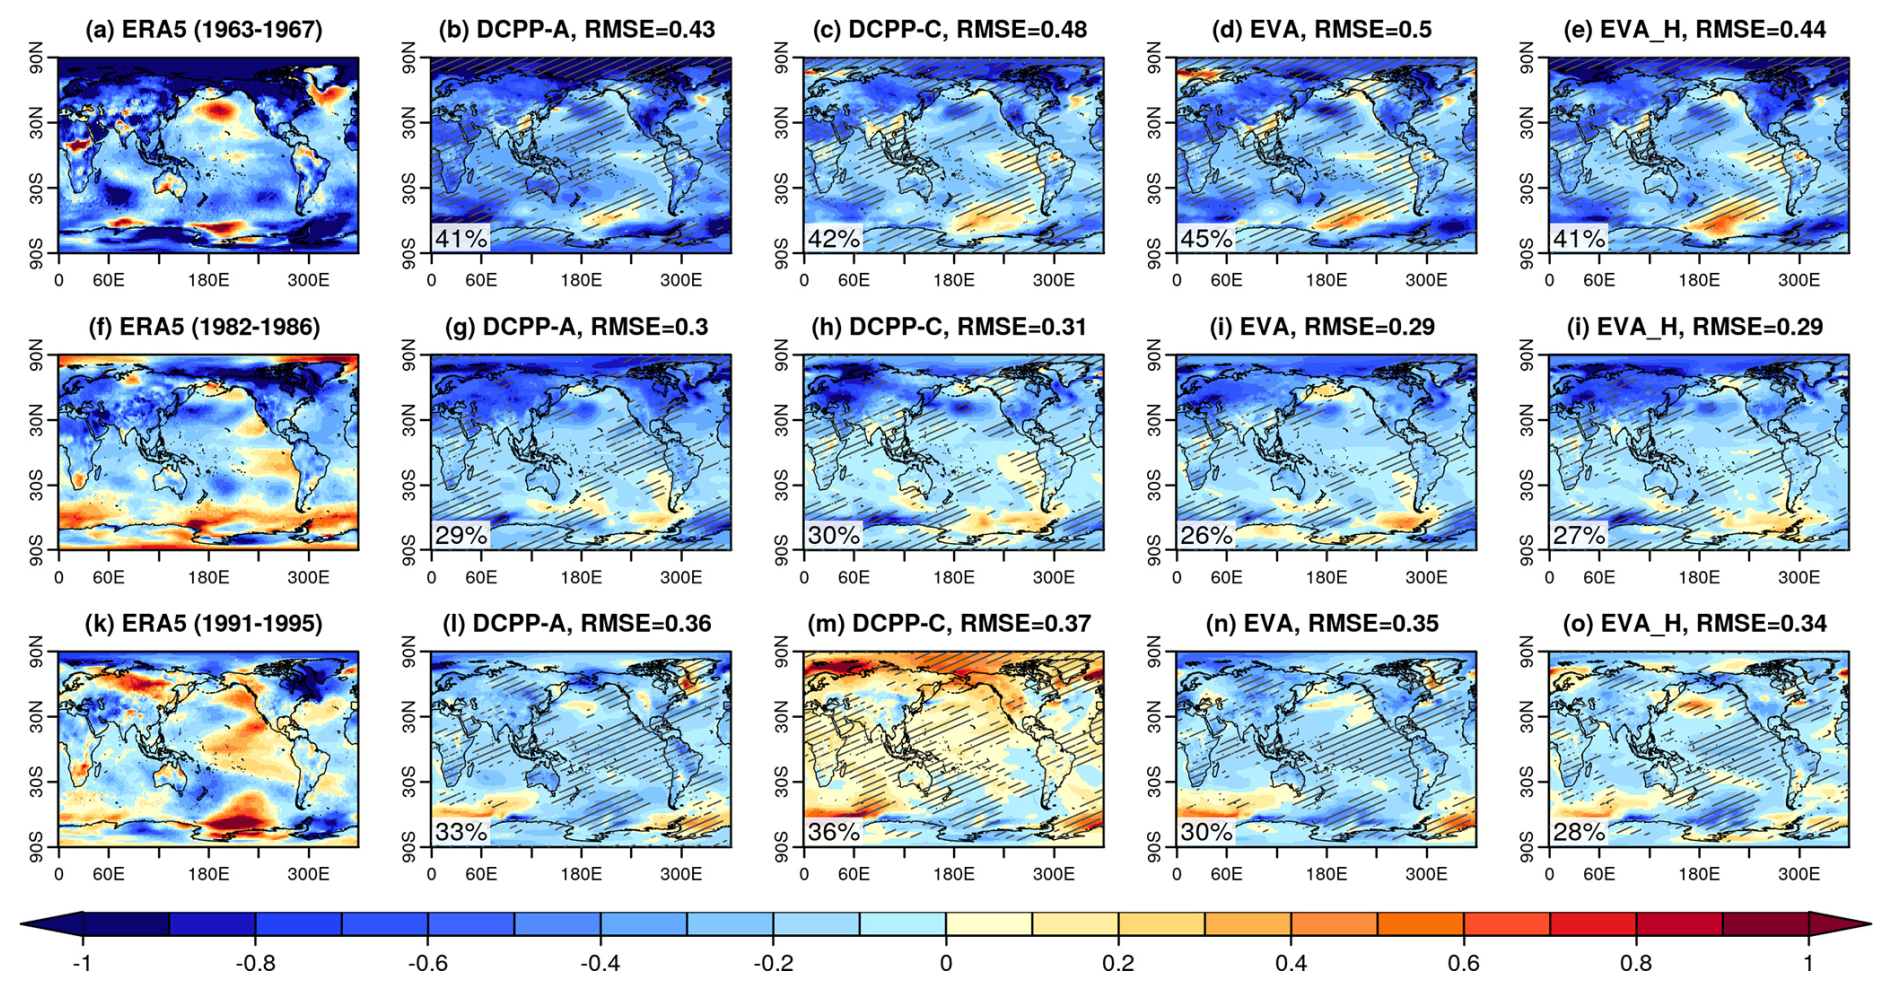
Figure 10Surface air temperature anomalies (°C) for forecast years 2–5 following the eruptions (years are defined from January–Dececember) in ERA5 and for the predictions ensemble mean initialised in 1962, 1981 and 1990 for the DCPP-A, DCPP-C, DCPP-EVA and DCPP-EVA_H hindcasts. The anomalies have been computed with respect to the period 1971–2015 (see methods). Stippling indicates where the observations fall outside of the 90 % range of the ensemble and the percentage at the bottom left corner of each map indicates the percentage of grid-points outside this range.
Since the volcanic forcing significantly improves the global mean surface temperature predictions – particularly for the Pinatubo eruption – we also analyse regional anomalies to assess the potential improvements in the response patterns. Figure 10 shows the surface temperature anomalies in ERA5 and the ensemble mean predictions for forecast years 1–5, the period when the volcanic signal is strongest. The ensemble mean surface temperature anomaly patterns are generally smoother with respect to ERA5, indicating the limitations of decadal forecast systems in predicting regional variations on these timescales. Across the experiments, the predicted anomaly patterns are largely similar, except for the DCPP-C hindcasts. These hindcasts simulate warmer anomalies (as they omit volcanic forcing) leading to larger forecast errors (except for Mount Agung in DCPP-EVA), as indicated by the area-weighted RMSE, though the differences are small. Additionally, this experiment shows a higher proportion of grid points where ERA5 falls outside the 95 % ensemble range. These discrepancies are most prominent in regions where volcanic impacts are strongest, particularly in the tropics, as shown in Fig. 7. Interestingly, in some regions, the DCPP-C hindcasts may appear to improve consistency with observations, such as in the tropical Pacific. However, this improvement probably arises for the wrong reasons. For instance, in the case of the Pinatubo eruption, the warmer conditions in the tropical Pacific in DCPP-C are not due to a better prediction of the El Niño conditions but rather the absence of the volcanic radiative response. Overall, the volcanic forcing enhances prediction accuracy, despite the small ensemble size.
Comparing the hindcast experiments with volcanic forcings (DCPP-A with the DCPP-EVA, and DCPP-EVA_H), we find that the area-weighted RMSE is similar among the volcanic eruptions. Additionally, including the eruption of Cerro Hudson make little difference in this respect as shown in Fig. S4 for the DCPP-EVA_H-Hud experiment. The fact that none of the experiments outperform the others could be because the forecast errors unrelated to volcanic forcing (i.e. internal variations) are larger than those attributable to differences in volcanic forcing. In terms of the percentage of global area where ERA5 observations fall outside the 95 % range of the ensemble members, we find that all experiments coincide in the regions for each of the eruptions, with small differences. This indicates that using the forcings from EVA or EVA_H provide reasonable results and could be used in operational predictions, particularly for Pinatubo-like eruptions.
Due to the unpredictable nature of volcanic eruptions, if one occurs, operational decadal forecasts will no longer be accurate. Given that large volcanic eruptions have climate impacts, for a rapid response, decadal hindcasts could be rerun with volcanic forcings generated with EVA and EVA_H once the eruption characteristics are known (Sospedra-Alfonso et al., 2024). While these tools have been widely used to carry out sensitivity studies to volcanic forcings, their use in real time forecasts is largely unexplored. In this paper we have compared the volcanic forcings generated with EVA and EVA_H for the last three major volcanic eruptions with the CMIP6 volcanic forcing, and evaluated their climate response in decadal predictions with the BSC decadal forecast system (based on EC-Earth3) following a similar protocol to DCPP component C (Boer et al., 2016).
We have compared the volcanic forcings for the eruptions of Agung, El Chichón and Pinatubo, generated with EVA and EVA_H with the CMIP6 forcing, and quantified their magnitude and latitudinal structure differences. Although EVA_H produces a temporal and vertical evolution more similar to CMIP6 than EVA, it does not capture the hemispherical asymmetry for tropical eruptions like Agung and El Chichón owing to the absence of EVA-like parameterization enabling preferential transport to one hemisphere. In a real-time prediction context, the asymmetric transport for a tropical eruptions could only be assessed after sufficiently long observations of the dispersing cloud, remaining a source of uncertainty when the initial estimates of SO2 mass are available.
The EC-Earth3 decadal prediction hindcasts, forced with three different volcanic forcing datasets (DCPP-A, DCPP-EVA, and DCPP-EVA_H), exhibit qualitatively similar post-eruption radiative responses across the three volcanic events. However, differences in the magnitude, timing, and latitudinal distribution of the volcanic forcings lead to variations in both the global and regional climate responses, as reflected in TOA fluxes, surface temperature, and lower stratospheric temperature. Following the eruptions of Mount Agung and El Chichón, the EVA and EVA_H hindcasts show weaker temperature responses compared to DCPP-A. In contrast, for the eruption of Pinatubo, the EVA hindcasts exhibit a stronger response than DCPP-A, while the EVA_H response is weaker. Globally averaged, these differences are relatively small for TOA flux and surface temperature, with responses largely indistinguishable across the experiments. However, the global mean lower stratospheric temperature response is stronger and reveals clearer differences between experiments. Regionally, the latitudinal structure of the temperature response shows noticeable discrepancies. For Agung and El Chichón, EVA and EVA_H produce weaker temperature anomalies in the Southern and Northern Hemispheres, respectively, compared to DCPP-A. For Pinatubo, the main differences appear in the tropics, where EVA_H shows a much weaker surface temperature response than both EVA and DCPP-A. The inclusion of the Cerro Hudson eruption in the EVA_H forcing has a modest effect, slightly strengthening the anomalies and reducing discrepancies with the other forcings.
We have also compared the predicted anomalies for the three hindcasts with the available observations for TOA fluxes, lower stratospheric temperature and surface temperature. These results highlight the importance of including the volcanic forcing to make skillful climate predictions following major volcanic eruptions, particularly in capturing the radiative effects, which are largely consistent in decadal prediction systems (e.g. Bilbao et al., 2024). Despite this relevant result, the hindcasts show limitations in predicting the observations. For the eruptions of Mount Agung and El Chichón, EVA and EVA_H may exhibit some limitations in reproducing the magnitude and, in particular, the latitudinal structure of the volcanic forcing. However, these eruptions are subject to large observational uncertainties, in terms of direct AOD and emissions as well as the TOA flux and atmospheric temperature observations over that period. This is evident from the evaluation of the DCPP-A hindcasts, which, despite having been run with the CMIP6 forcing (one of the best estimates currently available), show large forecast errors. In contrast, for the eruption of Mount Pinatubo, the hindcasts predict the observed post-volcanic effect more accurately. However, the hindcasts with EVA forcings weakly overestimate the radiative response and the hindcasts with EVA_H forcings underestimate it. Overall our results suggest that despite the deficiencies in the EVA and EVA_H forcings, both can be reasonable choices for including the post-volcanic radiative effects in decadal forecasts, given the inherent forecast uncertainty. Furthermore, we expect that for eruptions with strong hemispheric asymmetry the forecast errors are likely to be larger.
While in this study we used the reduced-complexity models EVA and EVA_H to compute the volcanic forcings, other options are also available for such purpose. For example, the forcings may also be produced with interactive stratospheric aerosol models. These models explicitly simulate aerosol microphysical processes and represent the complete life cycle of stratospheric aerosols including the initial injection of sulfur-containing gases and their conversion into aerosol particles, their vertical and horizontal transport into the stratosphere, and to their eventual removal from the stratosphere (e.g., Timmreck et al., 2018). While these models have much greater complexity with respect to reduced-complexity models, they also have very large uncertainties (e.g. Dhomse et al., 2020; Clyne et al., 2021; Quaglia et al., 2023) and a much higher computational cost. This makes them less effective for the intended use purpose of this paper. However, with future advancements, interactive stratospheric aerosol models may achieve greater accuracy and become the better option.
Previous studies have shown that volcanic eruptions can also lead to atmospheric and oceanic dynamical changes (see Marshall et al., 2022 for a review). These dynamical changes, however, have larger uncertainties with respect to the radiative impacts, as large ensembles are required to detect responses, can be model dependent (e.g. Bilbao et al., 2024), can be affected by the background climate conditions (e.g. Zanchettin et al., 2022) and there is evidence that models might be deficient in simulating some of the impacts (e.g. Wu et al., 2023). Therefore, in this study, with the limited ensemble size of the experiments for only one model it has not been possible to detect and evaluate the dynamical impacts. Previous studies have shown that post-eruption tropical stratospheric warming impacts the atmospheric circulation by strengthening the polar vortex, leading to positive NAO-like conditions, which may result in warming of the North Eurasian continent the first winter after the eruption (e.g. Hermanson et al., 2020). Here we find a significant response in the stratospheric temperatures (Fig. 4g–i), but we do not detect a statistically significant acceleration of the Northern Hemisphere stratospheric polar vortex, possibly due to the strong variability and the small ensemble size. Other dynamical impacts include changes in the North Atlantic Ocean, which may lead to an acceleration of the Atlantic Meridional Overturning Circulation, and El Niño Southern Oscillation (ENSO) (e.g. Hermanson et al., 2020; Bilbao et al., 2024). In these simulations it has not been possible to detect such responses, again probably due to the small ensemble size and also because EC-Earth3 is one of the models with weak response in this respect as shown in Bilbao et al. (2024).
The results of this study provide further insight into the effects of volcanic eruptions on climate and their predictability, in particular on the expected uncertainty of using the EVA and EVA_H forcings in operational decadal predictions, as well as informing the future development of these tools. However, we are limited to a small ensemble and one prediction system. To make further progress, we suggest that other modelling centres carry out similar predictions with EVA and EVA_H forcings for past volcanic eruptions. While we expect the radiative effects to be consistent, based on the results of recent papers (e.g. Zanchettin et al., 2022; Bilbao et al., 2024), a larger multi-model ensemble will allow a better quantification of the uncertainty and to determine the impact on the modes of climate variability.
For data retrieval, loading, processing and calculating metrics and visualisation the following R packages have been used: startR (Automatically Retrieve Multidimensional Distributed Data Sets) version 2.3.0. https://doi.org/10.32614/CRAN.package.startR (Manubens et al., 2023) and s2dv (A Set of Common Tools for Seasonal to Decadal Verification) version 2.0.0. https://doi.org/10.32614/CRAN.package.s2dv (Ho et al., 2023). The scripts used to do the analysis and plots in this manuscript are available at https://doi.org/10.5281/zenodo.14990179 (Bilbao, 2025a).
The EC-Earth3 decadal predictions are available online: dcppA-hindcast (EC-Earth Consortium (EC-Earth), 2019, https://doi.org/10.22033/ESGF/CMIP6.4553), dcppC-hindcast-noAgung (EC-Earth Consortium (EC-Earth), 2022a, https://doi.org/10.22033/ESGF/CMIP6.4586), dcppC-hindcast-noElChichón (EC-Earth Consortium (EC-Earth), 2022b, https://doi.org/10.22033/ESGF/CMIP6.4588), dcppC-hindcast-noPinatubo (EC-Earth Consortium (EC-Earth), 2022c, https://doi.org/10.22033/ESGF/CMIP6.4590), dcpp-EVA (Bilbao, 2025b, https://doi.org/10.23728/b2share.9245771b0ade46848dec103940edf415), dcpp-EVA_H (Bilbao, 2025c, https://doi.org/10.23728/b2share.0d90ceba71d14c7abed3541d0e8cd13d) and dcpp-EVA_H_Carn16 (Bilbao, 2025d, https://doi.org/10.23728/b2share.e3cbaffa4c9e471b8efc04387ea3953a). ERA5 data is available at https://doi.org/10.24381/cds.adbb2d47 (Hersbach et al., 2023). The Deep-C version 5 reconstructions of the radiation fluxes at the top of the atmosphere are available at https://doi.org/10.17864/1947.271 (Liu and Allan, 2020). The TLS (Temperature Lower Stratosphere) single-channel data set of zonally averaged temperature anomalies, produced by Remote Sensing Systems,are available at https://images.remss.com/msu/msu_time_series.html (last access: February 2025) (Mears and Wentz, 2009).
The supplement related to this article is available online at https://doi.org/10.5194/gmd-18-6239-2025-supplement.
RB conceived and planned the experiments; RB produced the decadal predictions; RB led the analysis with contributions from TA, MT and PO; RB, VL and ET created the initial conditions and developed the BSC Decadal Forecast System. RB wrote the manuscript draft; TA, MT and PO provided critical feedback and helped shape the research, analysis and manuscript.
The contact author has declared that none of the authors has any competing interests.
Publisher's note: Copernicus Publications remains neutral with regard to jurisdictional claims made in the text, published maps, institutional affiliations, or any other geographical representation in this paper. While Copernicus Publications makes every effort to include appropriate place names, the final responsibility lies with the authors. Also, please note that this paper has not received English language copy-editing.
We thank the two anonymous reviewers for their insightful comments.
Roberto Bilbao and Pablo Ortega acknowledge the support from the HORIZON EU project IMPETUS4CHANGE (no. 101081555) and the Horizon 2020 research project CONFESS (no. 101004156). Thomas J. Aubry acknowledges funding from the Coupled Model Intercomparison Project International Project Office (PO 4000136906) and the European Space Agency (contract number 4000145911/24/I-LR).
This paper was edited by Tatiana Egorova and reviewed by two anonymous referees.
Aubry, T. J., Toohey, M., Marshall, L., Schmidt, A., and Jellinek, A. M.: A New Volcanic Stratospheric Sulfate Aerosol Forcing Emulator (EVA_H): Comparison With Interactive Stratospheric Aerosol Models, Journal of Geophysical Research: Atmospheres, 125, e2019JD031303, https://doi.org/10.1029/2019JD031303, 2020. a, b
Bilbao, R.: EC-Earth3 DecadalPred-Volc: Manuscript, Zenodo [code], https://doi.org/10.5281/zenodo.14990179, 2025a. a
Bilbao, R.: EC-Earth3 DCPP-EVA decadal predictions produced in Bilbao et al. (2025), B2Share [data set], https://doi.org/10.23728/b2share.9245771b0ade46848dec103940edf415, 2025b. a
Bilbao, R.: EC-Earth3 DCPP-EVA_H decadal predictions produced in Bilbao et al. (2025), B2Share [data set], https://doi.org/10.23728/b2share.0d90ceba71d14c7abed3541d0e8cd13d, 2025c. a
Bilbao, R.: EC-Earth3 DCPP-EVA_H_Carn16 decadal predictions produced in Bilbao et al. (2025), B2Share [data set], https://doi.org/10.23728/b2share.e3cbaffa4c9e471b8efc04387ea3953a, 2025d. a
Bilbao, R., Wild, S., Ortega, P., Acosta-Navarro, J., Arsouze, T., Bretonnière, P.-A., Caron, L.-P., Castrillo, M., Cruz-García, R., Cvijanovic, I., Doblas-Reyes, F. J., Donat, M., Dutra, E., Echevarría, P., Ho, A.-C., Loosveldt-Tomas, S., Moreno-Chamarro, E., Pérez-Zanon, N., Ramos, A., Ruprich-Robert, Y., Sicardi, V., Tourigny, E., and Vegas-Regidor, J.: Assessment of a full-field initialized decadal climate prediction system with the CMIP6 version of EC-Earth, Earth Syst. Dynam., 12, 173–196, https://doi.org/10.5194/esd-12-173-2021, 2021. a, b
Bilbao, R., Ortega, P., Swingedouw, D., Hermanson, L., Athanasiadis, P., Eade, R., Devilliers, M., Doblas-Reyes, F., Dunstone, N., Ho, A.-C., Merryfield, W., Mignot, J., Nicolì, D., Samsó, M., Sospedra-Alfonso, R., Wu, X., and Yeager, S.: Impact of volcanic eruptions on CMIP6 decadal predictions: a multi-model analysis, Earth Syst. Dynam., 15, 501–525, https://doi.org/10.5194/esd-15-501-2024, 2024. a, b, c, d, e, f, g, h
Boer, G. J., Smith, D. M., Cassou, C., Doblas-Reyes, F., Danabasoglu, G., Kirtman, B., Kushnir, Y., Kimoto, M., Meehl, G. A., Msadek, R., Mueller, W. A., Taylor, K. E., Zwiers, F., Rixen, M., Ruprich-Robert, Y., and Eade, R.: The Decadal Climate Prediction Project (DCPP) contribution to CMIP6, Geosci. Model Dev., 9, 3751–3777, https://doi.org/10.5194/gmd-9-3751-2016, 2016. a, b, c
Carn, S., Clarisse, L., and Prata, A.: Multi-decadal satellite measurements of global volcanic degassing, Journal of Volcanology and Geothermal Research, 311, 99–134, https://doi.org/10.1016/j.jvolgeores.2016.01.002, 2016. a, b, c, d, e, f, g, h
Clyne, M., Lamarque, J.-F., Mills, M. J., Khodri, M., Ball, W., Bekki, S., Dhomse, S. S., Lebas, N., Mann, G., Marshall, L., Niemeier, U., Poulain, V., Robock, A., Rozanov, E., Schmidt, A., Stenke, A., Sukhodolov, T., Timmreck, C., Toohey, M., Tummon, F., Zanchettin, D., Zhu, Y., and Toon, O. B.: Model physics and chemistry causing intermodel disagreement within the VolMIP-Tambora Interactive Stratospheric Aerosol ensemble, Atmos. Chem. Phys., 21, 3317–3343, https://doi.org/10.5194/acp-21-3317-2021, 2021. a
Dhomse, S. S., Mann, G. W., Antuña Marrero, J. C., Shallcross, S. E., Chipperfield, M. P., Carslaw, K. S., Marshall, L., Abraham, N. L., and Johnson, C. E.: Evaluating the simulated radiative forcings, aerosol properties, and stratospheric warmings from the 1963 Mt Agung, 1982 El Chichón, and 1991 Mt Pinatubo volcanic aerosol clouds, Atmos. Chem. Phys., 20, 13627–13654, https://doi.org/10.5194/acp-20-13627-2020, 2020. a, b
Doblas-Reyes, F. J., Andreu-Burillo, I., Chikamoto, Y., García-Serrano, J., Guemas, V., Kimoto, M., Mochizuki, T., Rodrigues, L. R. L., and van Oldenborgh, G. J.: Initialized near-term regional climate change prediction, Nature Communications, 4, 1715, https://doi.org/10.1038/ncomms2704, 2013. a
Döscher, R., Acosta, M., Alessandri, A., Anthoni, P., Arsouze, T., Bergman, T., Bernardello, R., Boussetta, S., Caron, L.-P., Carver, G., Castrillo, M., Catalano, F., Cvijanovic, I., Davini, P., Dekker, E., Doblas-Reyes, F. J., Docquier, D., Echevarria, P., Fladrich, U., Fuentes-Franco, R., Gröger, M., v. Hardenberg, J., Hieronymus, J., Karami, M. P., Keskinen, J.-P., Koenigk, T., Makkonen, R., Massonnet, F., Ménégoz, M., Miller, P. A., Moreno-Chamarro, E., Nieradzik, L., van Noije, T., Nolan, P., O'Donnell, D., Ollinaho, P., van den Oord, G., Ortega, P., Prims, O. T., Ramos, A., Reerink, T., Rousset, C., Ruprich-Robert, Y., Le Sager, P., Schmith, T., Schrödner, R., Serva, F., Sicardi, V., Sloth Madsen, M., Smith, B., Tian, T., Tourigny, E., Uotila, P., Vancoppenolle, M., Wang, S., Wårlind, D., Willén, U., Wyser, K., Yang, S., Yepes-Arbós, X., and Zhang, Q.: The EC-Earth3 Earth system model for the Coupled Model Intercomparison Project 6, Geosci. Model Dev., 15, 2973–3020, https://doi.org/10.5194/gmd-15-2973-2022, 2022. a
EC-Earth Consortium (EC-Earth): EC-Earth-Consortium EC-Earth3 model output prepared for CMIP6 DCPP dcppA-hindcast, Earth System Grid Federation [data set], https://doi.org/10.22033/ESGF/CMIP6.4553, 2019. a
EC-Earth Consortium (EC-Earth): EC-Earth-Consortium EC-Earth3 model output prepared for CMIP6 DCPP dcppC-hindcast-noAgung, Earth System Grid Federation [data set], https://doi.org/10.22033/ESGF/CMIP6.4586, 2022a. a
EC-Earth Consortium (EC-Earth): EC-Earth-Consortium EC-Earth3 model output prepared for CMIP6 DCPP dcppC-hindcast-noElChichon, Earth System Grid Federation [data set], https://doi.org/10.22033/ESGF/CMIP6.4588, 2022b. a
EC-Earth Consortium (EC-Earth): EC-Earth-Consortium EC-Earth3 model output prepared for CMIP6 DCPP dcppC-hindcast-noPinatubo, Earth System Grid Federation [data set], https://doi.org/10.22033/ESGF/CMIP6.4590, 2022c. a
Eyring, V. and Lamarque, J.-F.: Global chemistry-climate modeling and evaluation, Eos, Transactions American Geophysical Union, 93, 539–539, https://doi.org/10.1029/2012EO510012, 2012. a
Hermanson, L., Bilbao, R., Dunstone, N., Ménégoz, M., Ortega, P., Pohlmann, H., Robson, J. I., Smith, D. M., Strand, G., Timmreck, C., Yeager, S., and Danabasoglu, G.: Robust Multiyear Climate Impacts of Volcanic Eruptions in Decadal Prediction Systems, Journal of Geophysical Research: Atmospheres, 125, e2019JD031739, https://doi.org/10.1029/2019JD031739, 2020. a, b, c
Hermanson, L., Smith, D., Seabrook, M., Bilbao, R., Doblas-Reyes, F., Tourigny, E., Lapin, V., Kharin, V. V., Merryfield, W. J., Sospedra-Alfonso, R., Athanasiadis, P., Nicoli, D., Gualdi, S., Dunstone, N., Eade, R., Scaife, A., Collier, M., O’Kane, T., Kitsios, V., Sandery, P., Pankatz, K., Früh, B., Pohlmann, H., Müller, W., Kataoka, T., Tatebe, H., Ishii, M., Imada, Y., Kruschke, T., Koenigk, T., Karami, M. P., Yang, S., Tian, T., Zhang, L., Delworth, T., Yang, X., Zeng, F., Wang, Y., Counillon, F., Keenlyside, N., Bethke, I., Lean, J., Luterbacher, J., Kolli, R. K., and Kumar, A.: WMO Global Annual to Decadal Climate Update: A Prediction for 2021–25, Bulletin of the American Meteorological Society, 103, E1117–E1129, https://doi.org/10.1175/BAMS-D-20-0311.1, 2022. a
Hersbach, H., Bell, B., Berrisford, P., Hirahara, S., Horányi, A., Muñoz-Sabater, J., Nicolas, J., Peubey, C., Radu, R., Schepers, D., Simmons, A., Soci, C., Abdalla, S., Abellan, X., Balsamo, G., Bechtold, P., Biavati, G., Bidlot, J., Bonavita, M., De Chiara, G., Dahlgren, P., Dee, D., Diamantakis, M., Dragani, R., Flemming, J., Forbes, R., Fuentes, M., Geer, A., Haimberger, L., Healy, S., Hogan, R. J., Hólm, E., Janisková, M., Keeley, S., Laloyaux, P., Lopez, P., Lupu, C., Radnoti, G., de Rosnay, P., Rozum, I., Vamborg, F., Villaume, S., and Thépaut, J.-N.: The ERA5 global reanalysis, Quarterly Journal of the Royal Meteorological Society, 146, 1999–2049, https://doi.org/10.1002/qj.3803, 2020. a
Hersbach, H., Bell, B., Berrisford, P., Biavati, G., Horányi, A., Muñoz Sabater, J., Nicolas, J., Peubey, C., Radu, R., Rozum, I., Schepers, D., Simmons, A., Soci, C., Dee, D., and Thépaut, J.-N.: ERA5 hourly data on single levels from 1940 to present, Copernicus Climate Change Service (C3S) Climate Data Store (CDS) [data set], https://doi.org/10.24381/cds.adbb2d47, 2023. a
Ho, A.-C., Perez-Zanon, N., Bilbao, R., Cos, J., Delgado, C., Lledó, L., Manrique, A., Verfaillie, D., Rifa, E., and BSC-CNS: s2dv: A Set of Common Tools for Seasonal to Decadal Verification v2.0.0, The Comprehensive R Archive Network (CRAN) [code], https://doi.org/10.32614/CRAN.package.s2dv, 2023. a
Liu, C. and Allan, R.: Reconstructions of the radiation fluxes at the top of the atmosphere and net surface energy flux over 1985–2017 – DEEP-C Version 4.0, University of Reading [data set], https://doi.org/10.17864/1947.271, 2020. a
Liu, C., Allan, R. P., Mayer, M., Hyder, P., Desbruyères, D., Cheng, L., Xu, J., Xu, F., and Zhang, Y.: Variability in the global energy budget and transports 1985–2017, Climate Dynamics, 55, 3381–3396, https://doi.org/10.1007/s00382-020-05451-8, 2020. a, b
Luo, B.: Stratospheric aerosol data for use in CMIP6 models, ftp://iacftp.ethz.ch/pub_read/luo/CMIP6/Readme_Data_Description.pdf (last access: 18 April 2023), 2018. a, b
Manubens, N., Ho, A.-C., Perez-Zanon, N., Rifa, E., Agudetse, V., de Paula Kinoshita, B., Vegas, J., Bretonniere, P. A., Serrano, R., and BSC-CNS: startR: Automatically Retrieve Multidimensional Distributed Data Sets v2.3.1, The Comprehensive R Archive Network (CRAN) [code], https://doi.org/10.32614/CRAN.package.startR, 2023. a
Marshall, L. R., Maters, E. C., Schmidt, A., Timmreck, C., Robock, A., and Toohey, M.: Volcanic effects on climate: recent advances and future avenues, Bulletin of Volcanology, 84, 1–31, https://doi.org/10.1007/s00445-022-01559-3, 2022. a, b
Mears, C. A. and Wentz, F. J.: Construction of the RSS V3.2 Lower-Tropospheric Temperature Dataset from the MSU and AMSU Microwave Sounders, Journal of Atmospheric and Oceanic Technology, 26, 1493–1509, https://doi.org/10.1175/2009JTECHA1237.1, 2009. a, b, c
Ménégoz, M., Bilbao, R., Bellprat, O., Guemas, V., and Doblas-Reyes, F. J.: Forecasting the climate response to volcanic eruptions: prediction skill related to stratospheric aerosol forcing, Environmental Research Letters, 13, 064022, https://doi.org/10.1088/1748-9326/aac4db, 2018. a
Niemeier, U., Timmreck, C., and Krüger, K.: Revisiting the Agung 1963 volcanic forcing – impact of one or two eruptions, Atmos. Chem. Phys., 19, 10379–10390, https://doi.org/10.5194/acp-19-10379-2019, 2019. a
Quaglia, I., Timmreck, C., Niemeier, U., Visioni, D., Pitari, G., Brodowsky, C., Brühl, C., Dhomse, S. S., Franke, H., Laakso, A., Mann, G. W., Rozanov, E., and Sukhodolov, T.: Interactive stratospheric aerosol models' response to different amounts and altitudes of SO2 injection during the 1991 Pinatubo eruption, Atmos. Chem. Phys., 23, 921–948, https://doi.org/10.5194/acp-23-921-2023, 2023. a, b
Robock, A.: Volcanic eruptions and climate, Reviews of Geophysics, 38, 191–219, https://doi.org/10.1029/1998RG000054, 2000. a
Sigl, M., Winstrup, M., McConnell, J. R., Welten, K. C., Plunkett, G., Ludlow, F., Büntgen, U., Caffee, M., Chellman, N., Dahl-Jensen, D., Fischer, H., Kipfstuhl, S., Kostick, C., Maselli, O. J., Mekhaldi, F., Mulvaney, R., Muscheler, R., Pasteris, D. R., Pilcher, J. R., Salzer, M., Schüpbach, S., Steffensen, J. P., Vinther, B. M., and Woodruff, T. E.: Timing and climate forcing of volcanic eruptions for the past 2,500 years, Nature, 523, 543–549, https://doi.org/10.1038/nature14565, 2015. a
Sospedra-Alfonso, R., Merryfield, W. J., Toohey, M., Timmreck, C., Vernier, J.-P., Bethke, I., Wang, Y., Bilbao, R., Donat, M. G., Ortega, P., Cole, J., Lee, W.-S., Delworth, T. L., Paynter, D., Zeng, F., Zhang, L., Khodri, M., Mignot, J., Swingedouw, D., Torres, O., Hu, S., Man, W., Zuo, M., Hermanson, L., Smith, D., Kataoka, T., and Tatebe, H.: Decadal prediction centers prepare for a major volcanic eruption, Bulletin of the American Meteorological Society, https://doi.org/10.1175/BAMS-D-23-0111.1, 2024. a, b, c
Thomason, L. W., Ernest, N., Millán, L., Rieger, L., Bourassa, A., Vernier, J.-P., Manney, G., Luo, B., Arfeuille, F., and Peter, T.: A global space-based stratospheric aerosol climatology: 1979–2016, Earth Syst. Sci. Data, 10, 469–492, https://doi.org/10.5194/essd-10-469-2018, 2018. a
Timmreck, C., Pohlmann, H., Illing, S., and Kadow, C.: The impact of stratospheric volcanic aerosol on decadal-scale climate predictions, Geophysical Research Letters, 43, 834–842, https://doi.org/10.1002/2015GL067431, 2016. a
Timmreck, C., Mann, G. W., Aquila, V., Hommel, R., Lee, L. A., Schmidt, A., Brühl, C., Carn, S., Chin, M., Dhomse, S. S., Diehl, T., English, J. M., Mills, M. J., Neely, R., Sheng, J., Toohey, M., and Weisenstein, D.: The Interactive Stratospheric Aerosol Model Intercomparison Project (ISA-MIP): motivation and experimental design, Geosci. Model Dev., 11, 2581–2608, https://doi.org/10.5194/gmd-11-2581-2018, 2018. a
Toohey, M., Stevens, B., Schmidt, H., and Timmreck, C.: Easy Volcanic Aerosol (EVA v1.0): an idealized forcing generator for climate simulations, Geosci. Model Dev., 9, 4049–4070, https://doi.org/10.5194/gmd-9-4049-2016, 2016. a, b, c
Vernier, J.-P., Aubry, T. J., Timmreck, C., Schmidt, A., Clarisse, L., Prata, F., Theys, N., Prata, A. T., Mann, G., Choi, H., Carn, S., Rigby, R., Loughlin, S. C., and Stevenson, J. A.: The 2019 Raikoke eruption as a testbed used by the Volcano Response group for rapid assessment of volcanic atmospheric impacts, Atmos. Chem. Phys., 24, 5765–5782, https://doi.org/10.5194/acp-24-5765-2024, 2024. a, b
Wu, X., Yeager, S. G., Deser, C., Rosenbloom, N., and Meehl, G. A.: Volcanic forcing degrades multiyear-to-decadal prediction skill in the tropical Pacific, Science Advances, 9, eadd9364, https://doi.org/10.1126/sciadv.add9364, 2023. a
Zanchettin, D., Khodri, M., Timmreck, C., Toohey, M., Schmidt, A., Gerber, E. P., Hegerl, G., Robock, A., Pausata, F. S. R., Ball, W. T., Bauer, S. E., Bekki, S., Dhomse, S. S., LeGrande, A. N., Mann, G. W., Marshall, L., Mills, M., Marchand, M., Niemeier, U., Poulain, V., Rozanov, E., Rubino, A., Stenke, A., Tsigaridis, K., and Tummon, F.: The Model Intercomparison Project on the climatic response to Volcanic forcing (VolMIP): experimental design and forcing input data for CMIP6, Geosci. Model Dev., 9, 2701–2719, https://doi.org/10.5194/gmd-9-2701-2016, 2016. a
Zanchettin, D., Timmreck, C., Khodri, M., Schmidt, A., Toohey, M., Abe, M., Bekki, S., Cole, J., Fang, S.-W., Feng, W., Hegerl, G., Johnson, B., Lebas, N., LeGrande, A. N., Mann, G. W., Marshall, L., Rieger, L., Robock, A., Rubinetti, S., Tsigaridis, K., and Weierbach, H.: Effects of forcing differences and initial conditions on inter-model agreement in the VolMIP volc-pinatubo-full experiment, Geosci. Model Dev., 15, 2265–2292, https://doi.org/10.5194/gmd-15-2265-2022, 2022. a, b