the Creative Commons Attribution 4.0 License.
the Creative Commons Attribution 4.0 License.
 | 31 Jan 2024
A model of the within-population variability of budburst in forest trees
Jianhong Lin
Daniel Berveiller
Christophe François
Heikki Hänninen
Alexandre Morfin
Gaëlle Vincent
Rui Zhang
Cyrille Rathgeber
Nicolas Delpierre
Spring phenology is a key indicator of temperate and boreal ecosystems' response to climate change. To date, most phenological studies have analyzed the mean date of budburst in tree populations while overlooking the large variability of budburst among individual trees. The consequences of neglecting the within-population variability (WPV) of budburst when projecting the dynamics of tree communities are unknown. Here, we develop the first model designed to simulate the WPV of budburst in tree populations. We calibrated and evaluated the model on 48 442 budburst observations collected between 2000 and 2022 in three major temperate deciduous trees, namely, hornbeam (Carpinus betulus), oak (Quercus petraea) and chestnut (Castanea sativa). The WPV model received support for all three species, with a root mean square error of 5.7 ± 0.5 d for the prediction of unknown data. Retrospective simulations over 1961–2022 indicated earlier budburst as a consequence of ongoing climate warming. However, simulations revealed no significant change for the duration of budburst (DurBB, i.e., the time interval from BP20 to BP80 (with BP representing budburst percent), which respectively represent the date when 20 % and 80 % of trees in a population have reached budburst), due to a lack of significant temperature increase during DurBB in the past. This work can serve as a basis for the development of models targeting intra-population variability of other functional traits, which is of increasing interest in the context of climate change.
- Article
(3738 KB) - Full-text XML
-
Supplement
(2196 KB) - BibTeX
- EndNote


Phenology, as the study of recurrent biological events such as budburst in spring, has attracted increasing attention due to climate warming (Piao et al., 2019). The timing of leaf phenology in spring is a major indicator of climate warming (Parmesan and Yohe, 2003) and is mainly modulated by temperature (Menzel et al., 2006; Zhang et al., 2022, 2021; Chen et al., 2018; Vitasse et al., 2009a), photoperiod (Delpierre et al., 2016; Fu et al., 2019; Vitasse and Basler, 2013; Meng et al., 2021) and soil moisture (Liu et al., 2022; Luo et al., 2021). In the Northern Hemisphere, it is well established that spring phenological events have been advanced by climate warming (Walther et al., 2002; Menzel et al., 2006), although this advancement is currently slowing down (Fu et al., 2015; Chen et al., 2019). To date, massive efforts have been made to study the spatiotemporal variability of leaf phenology among tree populations and across years (Delpierre et al., 2016; Fu et al., 2015; Meng et al., 2021; Chen et al., 2018). However, the variability of leaf phenology within populations has received little attention to date (Scotti et al., 2016; Delpierre et al., 2017), which is in line with the general focus of ecological studies on average traits (Violle et al., 2012). This is intriguing, since the within-population (i.e., tree-to-tree) variability of phenological events is vast and can even be equivalent to that observed among populations (Delpierre et al., 2017; Vitasse et al., 2009a; Rathgeber et al., 2011). It typically takes 1 to 4 weeks from the first to the last tree to burst buds in a population (Denechere et al., 2021), with an average of 19 d (Delpierre et al., 2017). Furthermore, the duration from the first to last tree to burst buds in a given population varies annually (Denechere et al., 2021).
The large within-population variability (WPV) of budburst observed in natural tree populations is considered to result from their exposure to a wide range of fluctuating environmental (e.g., frost) and biotic (e.g., herbivores and pathogens) selection pressures, which alternatively favor trees that burst buds early or late (Alberto et al., 2011). From an evolutionary point of view, this phenotypic diversity has an adaptive value at the population scale, because the environment is likely to change across the lifetime of trees (Petit and Hampe, 2006; Morente-Lopez et al., 2022; Blanquart et al., 2013). For instance, if a local climate becomes suitable in early spring under climate warming, trees that burst buds early will benefit from an extended growing season, thus maximizing their carbon assimilation and possibly their biomass production (Zohner et al., 2020; Delpierre et al., 2009; Richardson et al., 2010), which will allow them to gradually occupy a dominant position in the population. Moreover, early budburst enables trees to escape pathogens (e.g., for oak, see Dantec et al., 2015). On the contrary, if freezing events occur frequently in early spring with the advance of budburst, late trees can grow better by avoiding freezing injury (Delpierre et al., 2017; Zohner et al., 2020; Puchalka et al., 2016). Moreover, the WPV also affects interactions with competing plants and herbivores (Hart et al., 2016; Renner and Zohner, 2018).
The internal mechanism of the WPV of budburst is probably underpinned by genetic diversity, as evidenced by the variability of phenological traits among individual trees that experience similar environmental conditions (Bontemps et al., 2016; Delpierre et al., 2017). This genetic determinism is further reflected in the year-to-year repeatability of the phenological ranking of individuals within tree populations (Delpierre et al., 2017). In addition to this genetic determinism, the WPV is also likely influenced by micro-environmental variations such as the unbalanced distribution of soil-water content within populations, edaphic conditions or microtopography (Delpierre et al., 2017; Denechere et al., 2021; Scotti et al., 2016). To the best of our knowledge, the question of whether and to what extent would the WPV of budburst be modified in the current context of climate change has not been addressed so far.
Phenological research has made extensive use of modeling to study the response of the spatiotemporal variability of budburst to climate warming (Zhang et al., 2022; Meng et al., 2021; Delpierre et al., 2009; Chuine and Regniere, 2017). The models postulate that temperature and photoperiod are the main environmental cues that trigger budburst in boreal and temperate (Delpierre et al., 2009; Kramer, 1994; Hänninen and Kramer, 2007), subtropical (Zhang et al., 2022; Du et al., 2019) and tropical trees (Chen et al., 2017). In process-based models for spring phenology, the effects of environmental factors (mainly air temperature) on budburst are quantified (Zhang et al., 2022; Hänninen, 2016; Jewaria et al., 2021). Firstly, dormancy state of buds reached in the previous autumn is released due to exposure to low temperature, that is, removing the growth-arresting physiological factors in the bud (the chilling requirement of dormancy release). Secondly, when dormancy is relieved to a certain extent, high temperatures drive the process of ontogenetic development, that is, visible bud elongation and swelling that results in budburst (forcing requirement of ontogenetic growth). Meanwhile, there is an interaction between these two stages in the models, namely, ontogenetic growth is influenced by dormancy release (Hänninen, 2016; Hänninen and Kramer, 2007; Vegis, 1964). Lundell et al. (2020) further proved that this interaction can be affected by prevailing temperatures. One important point is that these models do not pay attention to the WPV of phenological traits. They have been parameterized and applied to predict the mean or median date of budburst in a given tree population (Lundell et al., 2020; Kramer, 1994; Zhang et al., 2022). In other words, these models simulate the timing of budburst as a discrete event in the population without considering the WPV of leaf phenology. To the best of our knowledge, only two studies to date, notably (Rousi and Heinonen, 2007) in birch (Betula pendula) and (Langvall et al., 2001) in Norway spruce (Picea abies (L.) Karst.), have attempted to establish a link between WPV and environmental conditions through the temperature sum required for the opening of buds at the scale of individual trees. At the scale of tree populations, a distribution of temperature sums to budburst was also used in the so-called physio-demo-genetic (PDG) models (Kramer et al., 2008; Oddou-Muratorio and Davi, 2014) to simulate the adaptive potential of tree populations. However, a systematic model for the WPV of budburst is still lacking.
Here we developed a model that simulates the WPV of budburst in temperate deciduous trees. We calibrated and validated the model over an extensive budburst dataset acquired from five tree populations at the individual tree scale over 23 years (representing 48 442 observations). Specially, we aim to (1) develop the WPV model and validate its ability for predicting the progress of budburst in tree populations and (2) use the model to in a retrospective simulation exercise testing whether the duration of budburst period in the population changed with climate warming in the recent decades.
2.1 Study sites
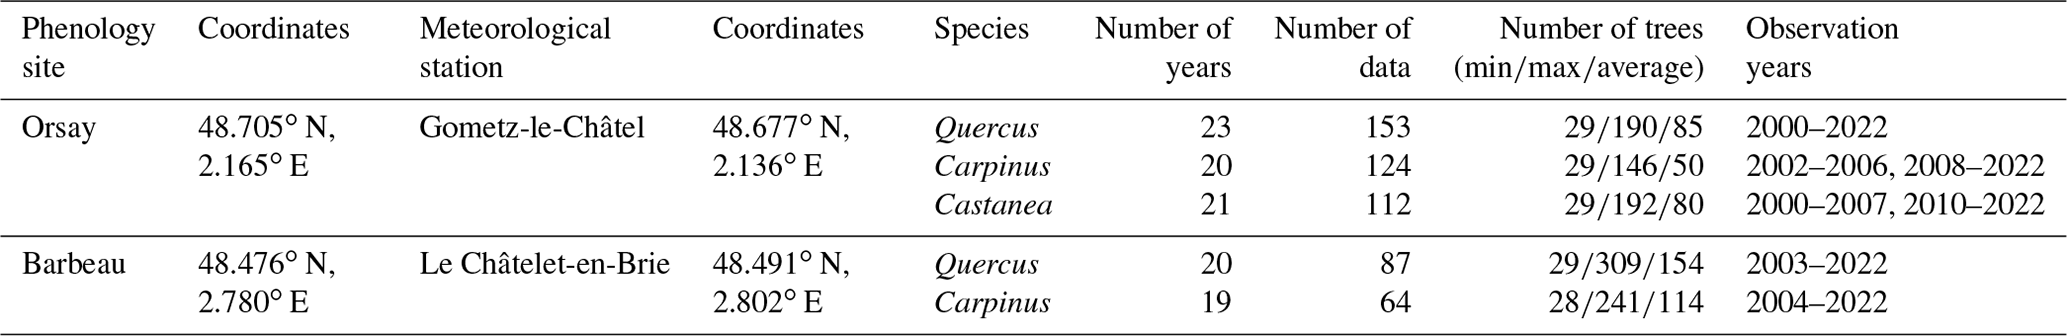
We used budburst data collected from two forests located near Paris (France): Barbeau (48.476∘ N, 2.780∘ E; 95 m a.s.l.) and Orsay (48.705∘ N, 2.167∘ E; 105 m a.s.l.). At these sites, the progress of budburst was observed at the individual scale in populations of three major temperate deciduous tree species, namely, hornbeam (Carpinus betulus L.), oak (Quercus petraea (Matt.) Liebl) and chestnut (Castanea sativa Mill.). Hornbeam is an early leafing tree species, chestnut is a late species, and oak is intermediate. Hornbeam and oak are present in both forests, while chestnut is present in Orsay only (Table 1). For each species, we focused on healthy and dominant trees, except for hornbeam (an understory species). We collected budburst observations from 2000 to 2022, which yielded a dataset comprising five populations and 103 population years. In each population, we observed between 28 and 309 individuals (mean 90) (Table 1).
Table 1Description of the phenological and meteorological datasets.
2.2 Phenology dataset
A team of eight local observers (including most of the authors of this paper) conducted the observations of developing buds in the tree crowns throughout spring. The observers used binoculars and occasionally received training in order to reduce observer bias (Liu et al., 2021). The interval between phenological observations was 4 d on average (from 2 to 7 d). A tree was considered to have burst its buds when at least 50 % of the buds in the upper third of the crown presented leaves that extended beyond the tip of the scales, which corresponded to stage BBCH 9 (Meier, 1997). At each observation date, we calculated the percentage of trees that had reached budburst in the tree population, dividing the number of trees at BBCH 9 by the total number of trees observed on that date and multiplying the result by 100.
2.3 Temperature data
We obtained the mean daily temperature data from the meteorological station nearest to the study sites (Table 1). However, there were missing values in the temperature data collected from the stations, especially before 1970. To fill these gaps and predict the missing data in order to simulate budburst in previous years, we used the Safran reanalysis data (grid-resolution of 8×8 km2) (Vidal et al., 2010), which we de-biased by establishing a linear regression between the local and corresponding Safran temperature data from September of the previous year to June.
2.4 Model description
We introduce a novel model, named the within-population variability (WPV) model, which was constructed to predict the progress of budburst in tree populations (i.e., percentage of trees having burst buds at a given date in a tree population). We hypothesized that the difference between individuals in the population was reflected in the difference in the forcing accumulation requirement (F*).
We built the WPV model by modifying a state-of-the-art process-based model that simulated a discrete budburst event (i.e., budburst of an individual plant or mean budburst date in a tree population) (Lundell et al., 2020). In short, the model represents the release of endodormancy through the accumulation of “chilling” temperatures and simulates the ontogenetic growth of buds through the accumulation of “forcing” temperatures. One particularity of the model is that ontogenetic growth is regulated by the state of rest break and the prevailing temperature (Lundell et al., 2020; Hänninen, 1990; Hänninen and Kramer, 2007; Vegis, 1964). The ontogenetic competence, Co (a dimensionless [0, 1] multiplier), is applied to represent this regulation (Lundell et al., 2020; Hänninen and Kramer, 2007; Hänninen, 2016). In the model, budburst is considered to occur at date t when a given sum of the forcing temperature is reached such that . In the WPV model, we assumed that F* followed a normal distribution at the level of the tree population (see Fig. S1 in the Supplement for a flow chart of the model). At each date t, the model simulates the proportion of the population (BP, for budburst percent) that has fulfilled the forcing accumulation requirement:
where F(t) is the forcing degree-day accumulation reached on day t, μ is the mean of normal distribution, σ is the standard deviation of normal distribution and erf is the Gaussian error function.
The forcing accumulation F(t) is calculated as the integral of a “forcing rate” as follows:
where d is the start date of forcing accumulation (d= DoY 270 in the previous year, where DoY represents day of the year). In this model, the stage of dormancy release and the stage of ontogenetic growth can occur simultaneously (i.e., the model belongs to the “parallel” model category) (Hänninen, 2016; Chuine and Regniere, 2017). However, the forcing rate Rfact, which is the actual rate of ontogenetic growth, is affected by both temperatures and ontogenetic competence (Co). It is calculated as follows:
where Rf(t) is the potential rate of ontogenetic growth on day t, and Co is the ontogenetic competence on day t; these two variables are calculated as follows:
where T(t) is the daily mean air temperature on day t, and Tb is the temperature threshold (∘C) above which forcing accumulation occurs.
The ontogenetic competence, Co, varies over time and is simulated as
where Co(t) is the ontogenetic competence on day t, in the range [0, 1], which modulates the effect of the state of rest break on the rate of ontogenetic growth (see Fig. S2). When Co = 0, ontogenetic growth is stopped. The ability of ontogenetic growth is restored between Co = 0 and Co = 1 with rest breaking. Finally, g and h are parameters (Lundell et al., 2020), and Sr(t) is the state of rest break on day t, which is calculated as follows:
where Ccri is the chilling requirement for rest completion, and Ctot is the actual accumulation of chilling temperature, quantified as the number of chilling units (in chill units C.U.) and calculated from DoY = 270 of the previous year up to day t as follows:
where the daily rate of chilling accumulation (Rc) is calculated as follows:
where Tc is the temperature threshold (∘C) below which chilling accumulation occurs.
2.5 Parameter estimation
We calibrated the model using budburst data obtained during the period 2000–2016 in Orsay (all three species: hornbeam, oak and chestnut) and then validated it using data from 2017–2022 in Orsay (three species) and from 2000–2022 in Barbeau (two species: hornbeam and oak). The model was therefore calibrated over 17 years for the three species (Orsay populations, representing 52, 71, and 50 observation dates for hornbeam, oak, and chestnut, respectively) and validated over 29 site years for hornbeam and oak (representing 89 and 114 observation dates, respectively) and 6 years (29 observation dates) for chestnut. A previous study (Vitasse et al., 2009b) provided evidence of similar apparent phenological responses to temperature among populations of the same species located as far as 650 km apart, which also suggests the low differentiation of phenological traits across populations. Orsay and Barbeau populations are separated by a distance of 50 km and experience a similar climate. This is why we used the Barbeau data as a validation counterpart to the Orsay data used for calibration. The model predicts the percentage of budburst in the population (from 0 % to 100 % budburst) along with the corresponding date. Thus, we calculated the root mean square error (RMSE) over two dimensions (Fig. S3). First, we calculated RMSE over the percentage of budburst in the tree population (i.e., comparing the difference between the observed and predicted budburst percent occurring on the same day of the year, DoY).
where RMSEBP is the root mean square error for budburst percent (expressed in percent), num is the number of trees observed on a given day of the year, BPobs,i is the observed percentage of budburst of datum i, BPpred,i is the predicted percentage of budburst of the same datum and n is the total number of data (e.g., n=50 in a hypothetic case where the percentage of budburst has been observed five times per year on average over 10 years in a given population). We used as a weight in the calculation of squared errors to compensate for the fact that a very large number of trees (i.e., > 300 trees) were observed on some dates: these observations are more representative of the actual percentage of budburst in the population (as compared to observations established for a smaller number of trees), although they also tend to over-represent them in the calculation of errors.
We then calculated the RMSE of dates (i.e., comparing the difference, in number of days, between the observations and predictions for the same percentage of budburst; Fig. S3).
where RMSEDoY is the root mean square error for the budburst date (in days), num is the number of trees observed, DoYobs,i is the observed date of budburst of datum i (e.g., the date when we observed 24 % budburst for the population of interest in a given year), DoYpred,i is the predicted date of budburst of the same datum (e.g., the date when the model predicted 24 % budburst in the same tree population and year) and n is the total number of data.
Finally, we calculated the total RMSE as follows:
where INTBP and INTDoY are the average intervals between consecutive observations of budburst percent and days, respectively, which are calculated based on observation data (Table S1 in the Supplement).
We used RMSEtot (unitless) as an aggregate, multi-objective cost function (similar to, for example, Keenan et al., 2011) during the calibration procedure. In the definition of RMSEtot (Eq. 12), we divided the individual objectives of the cost function (i.e., RMSEBP and RMSEDoY) by the average intervals between consecutive observations (INTBP and INTDoY) in order to scale them and make them contribute similarly to the optimization problem. The values of INTBP and INTDoY measure the actual resolution of the observation data and are thus the best achievable values in the optimization procedure. We used the function optim to calibrate the model parameters with R statistical software v.4.0.3 (R Development Core Team, 2020). In order to ensure that the optim algorithm reached the global minimum of the cost function, we ran it 768 times for each calibration, starting from different, random combinations of initial parameters, which appear in Table S2, and retained the parameter set yielding the overall lowest RMSEtot. One possible issue with aggregate multi-objective cost functions such as Eq. (12) is that the same minimum RMSEtot can be achieved with multiple combinations of RMSEBP INTBP and RMSEDOY INTDOY. In order to evaluate this, we produced a figure to show the relation between RMSEtot and RMSEBP INTBP or RMSEDOY INTDOY (Fig. S4). One can see that RMSEtot was mostly influenced by RMSEDOY INTDOY, with RMSEBP INTBP playing a secondary role. In addition to RMSE, we used mean bias error and the correlation coefficient (r) and p value to evaluate the model forecast accuracy (in terms of budburst percentage or days), which are calculated as follows:
where obsi and predi are the ith observation and prediction, respectively, and N is the number of observations.
where obsmean and predmean are the mean of observation and prediction, respectively.
2.6 Evaluating the modeled F* distributions
To validate the modeled F* distribution, we simulated the distribution of the forcing accumulation at the date of each BP observation. Because there are different observed BP in each year. We binned the observed BP data into 11 groups (i.e., BP0, BP10, BP20, …, BP100; for example, we regard the data between BP5 (date at which 5 % of trees burst buds) and BP15 (date at which 15 % of trees burst buds) as group “BP10”; note that BP0 refers to dates at which 5 % or less trees have burst buds, and BP100 refers to dates at which 95 % or more trees have burst buds). Then we used a sigmoid function to simulate the relation between BP and averaged corresponding forcing accumulation across all the years. We also calculated their first derivatives (i.e., the increasing of BP per unit of forcing accumulation). Moreover, we calculated the distribution of observed BP across all the years.
2.7 Evaluating the response of the within-population variability of budburst to climate warming
We used our model to predict budburst in the past (1961–2022) using historical daily mean temperature data and gap-filled data using debiased Safran reanalysis of temperatures (see above).
As explained earlier, our model simulates the percentage of budburst in a tree population at a given date. To evaluate the response of the WPV of budburst to climate warming, we focused on the particular dates at which 20 % and 80 % of trees in a given population had reached budburst (termed BP20 and BP80, respectively) and the duration between these two dates (duration of budburst DurBB = BP80–BP20), which we consider to represent the variability of budburst within the population for a given year. BP20 represents the “beginning” of budburst in the tree population, whereas BP80 represents its “end”. We chose these quantiles instead of more extreme quantiles of distribution (e.g., 5 % and 95 %), because they are well represented in our dataset (Fig. 1), thus implying higher model accuracy. For sake of model evaluation, we calculated the DurBB in observed phenology data. Specifically, we selected years which had records before BP20 and after BP80. Then the date of BP20 or BP80 was calculated by using the two nearest data (one is below BP20 or BP80 and the other is above BP20 or BP80) through interpolation (e.g., 15 % budburst percent is on DoY 80 and 25 % budburst percent is on DoY 84. We can obtain the date of BP20 by interpolation, that is, DoY 82).
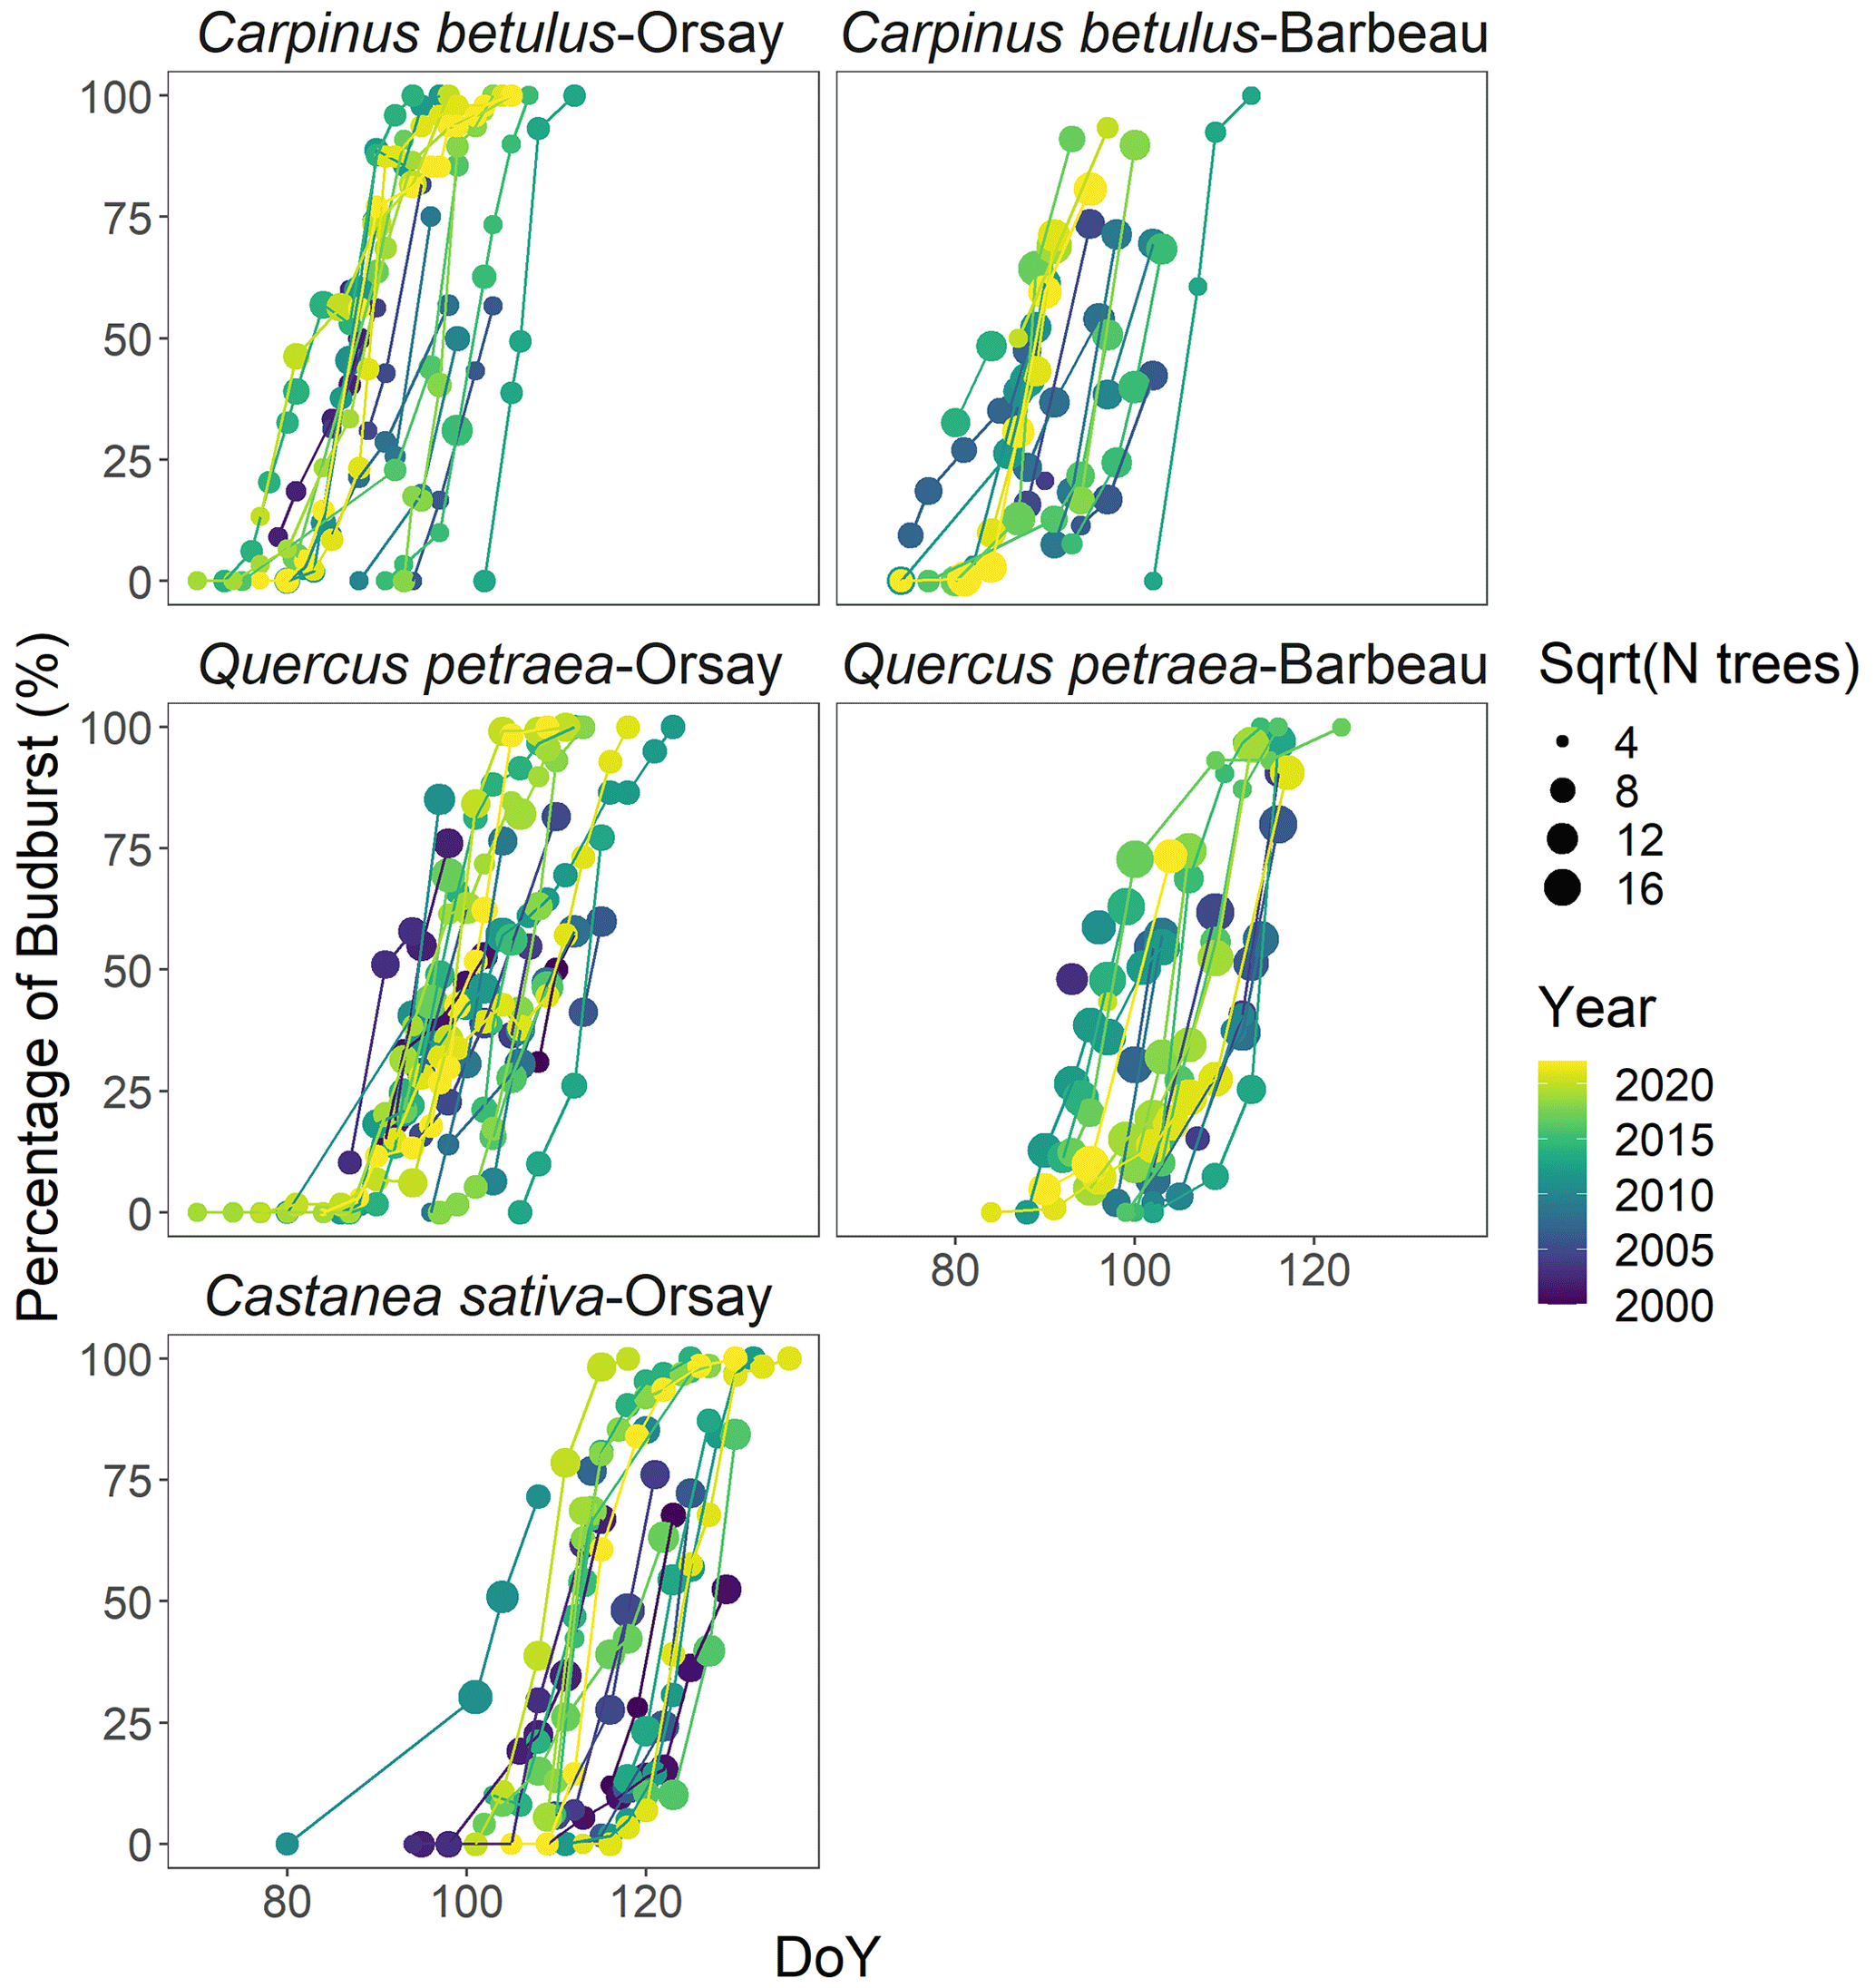
Figure 1Observed percentage of budburst in five tree populations during the period 2000–2022. The size of the points is scaled with the square root of the number of trees observed. The lines connect the dates of the same year.
2.8 Statistical analyses
For each population, we quantified by linear regression the sensitivity of budburst date (BP20 and BP80) and the DurBB to time (d yr−1) and to January–May temperature (d ∘C−1). Analysis of variance (ANOVA) was used to analyze the significance of the regression slopes (α=0.05). All simulations and statistical analyses were carried out with R statistical software v.4.0.3 (R Development Core Team, 2020).
3.1 Phenological observations
Figure 1 shows the observed percentages of budburst in the five tree populations monitored from 2000 to 2022. These percentage data were established based on 48 442 observations of budburst collected from individual trees. Among the species, hornbeam was the earliest to reach budburst, typically over DoY 70–100, followed by oak over DoY 90–110, and finally, chestnut over DoY 100–130. The budburst dates of the oak and hornbeam populations at Barbeau and Orsay were very close, with average differences of 2 and 1 d (Table S3). The duration of budburst in the population (DurBB) (i.e., time interval, in days, during which the proportion of trees having reached budburst increases from 20 % to 80 %) differs for each species depending on the site and year, with a mean of 8 d over the whole dataset and ranging from 3 d for hornbeam at Orsay in 2018 and 2021 to 21 d for oak at Orsay in 2012 (Fig. 1).
3.2 Model performance
For all the populations considered here, the WPV model predicted with good accuracy the progress of budburst in tree populations during spring as well as the interannual variability of budburst (Figs. 2, 3; see Fig. S5 for a comparison of observed and simulated time series). The model predicted the percentage of budburst in tree populations with an error (RMSEBP) of 16.4 % ± 1.1 % for the calibration dataset (correlation coefficient of predictions vs. observations: 0.80 ± 0.01, P<0.001) and 20.7 % ± 1.1 % for the validation dataset (correlation: 0.73 ± 0.06, P<0.001). This corresponded to prediction errors for the date of budburst (RMSEDOY) of 3.7 ± 0.5 d for the calibration dataset (correlation: 0.90 ± 0.04, P<0.001) and 5.7 ± 0.5 d for the validation dataset (correlation: 0.80 ± 0.09, P<0.001). This compared well to the time resolution of the phenological observations (2–7 d). The mean bias was less than 1 d (Fig. 3).
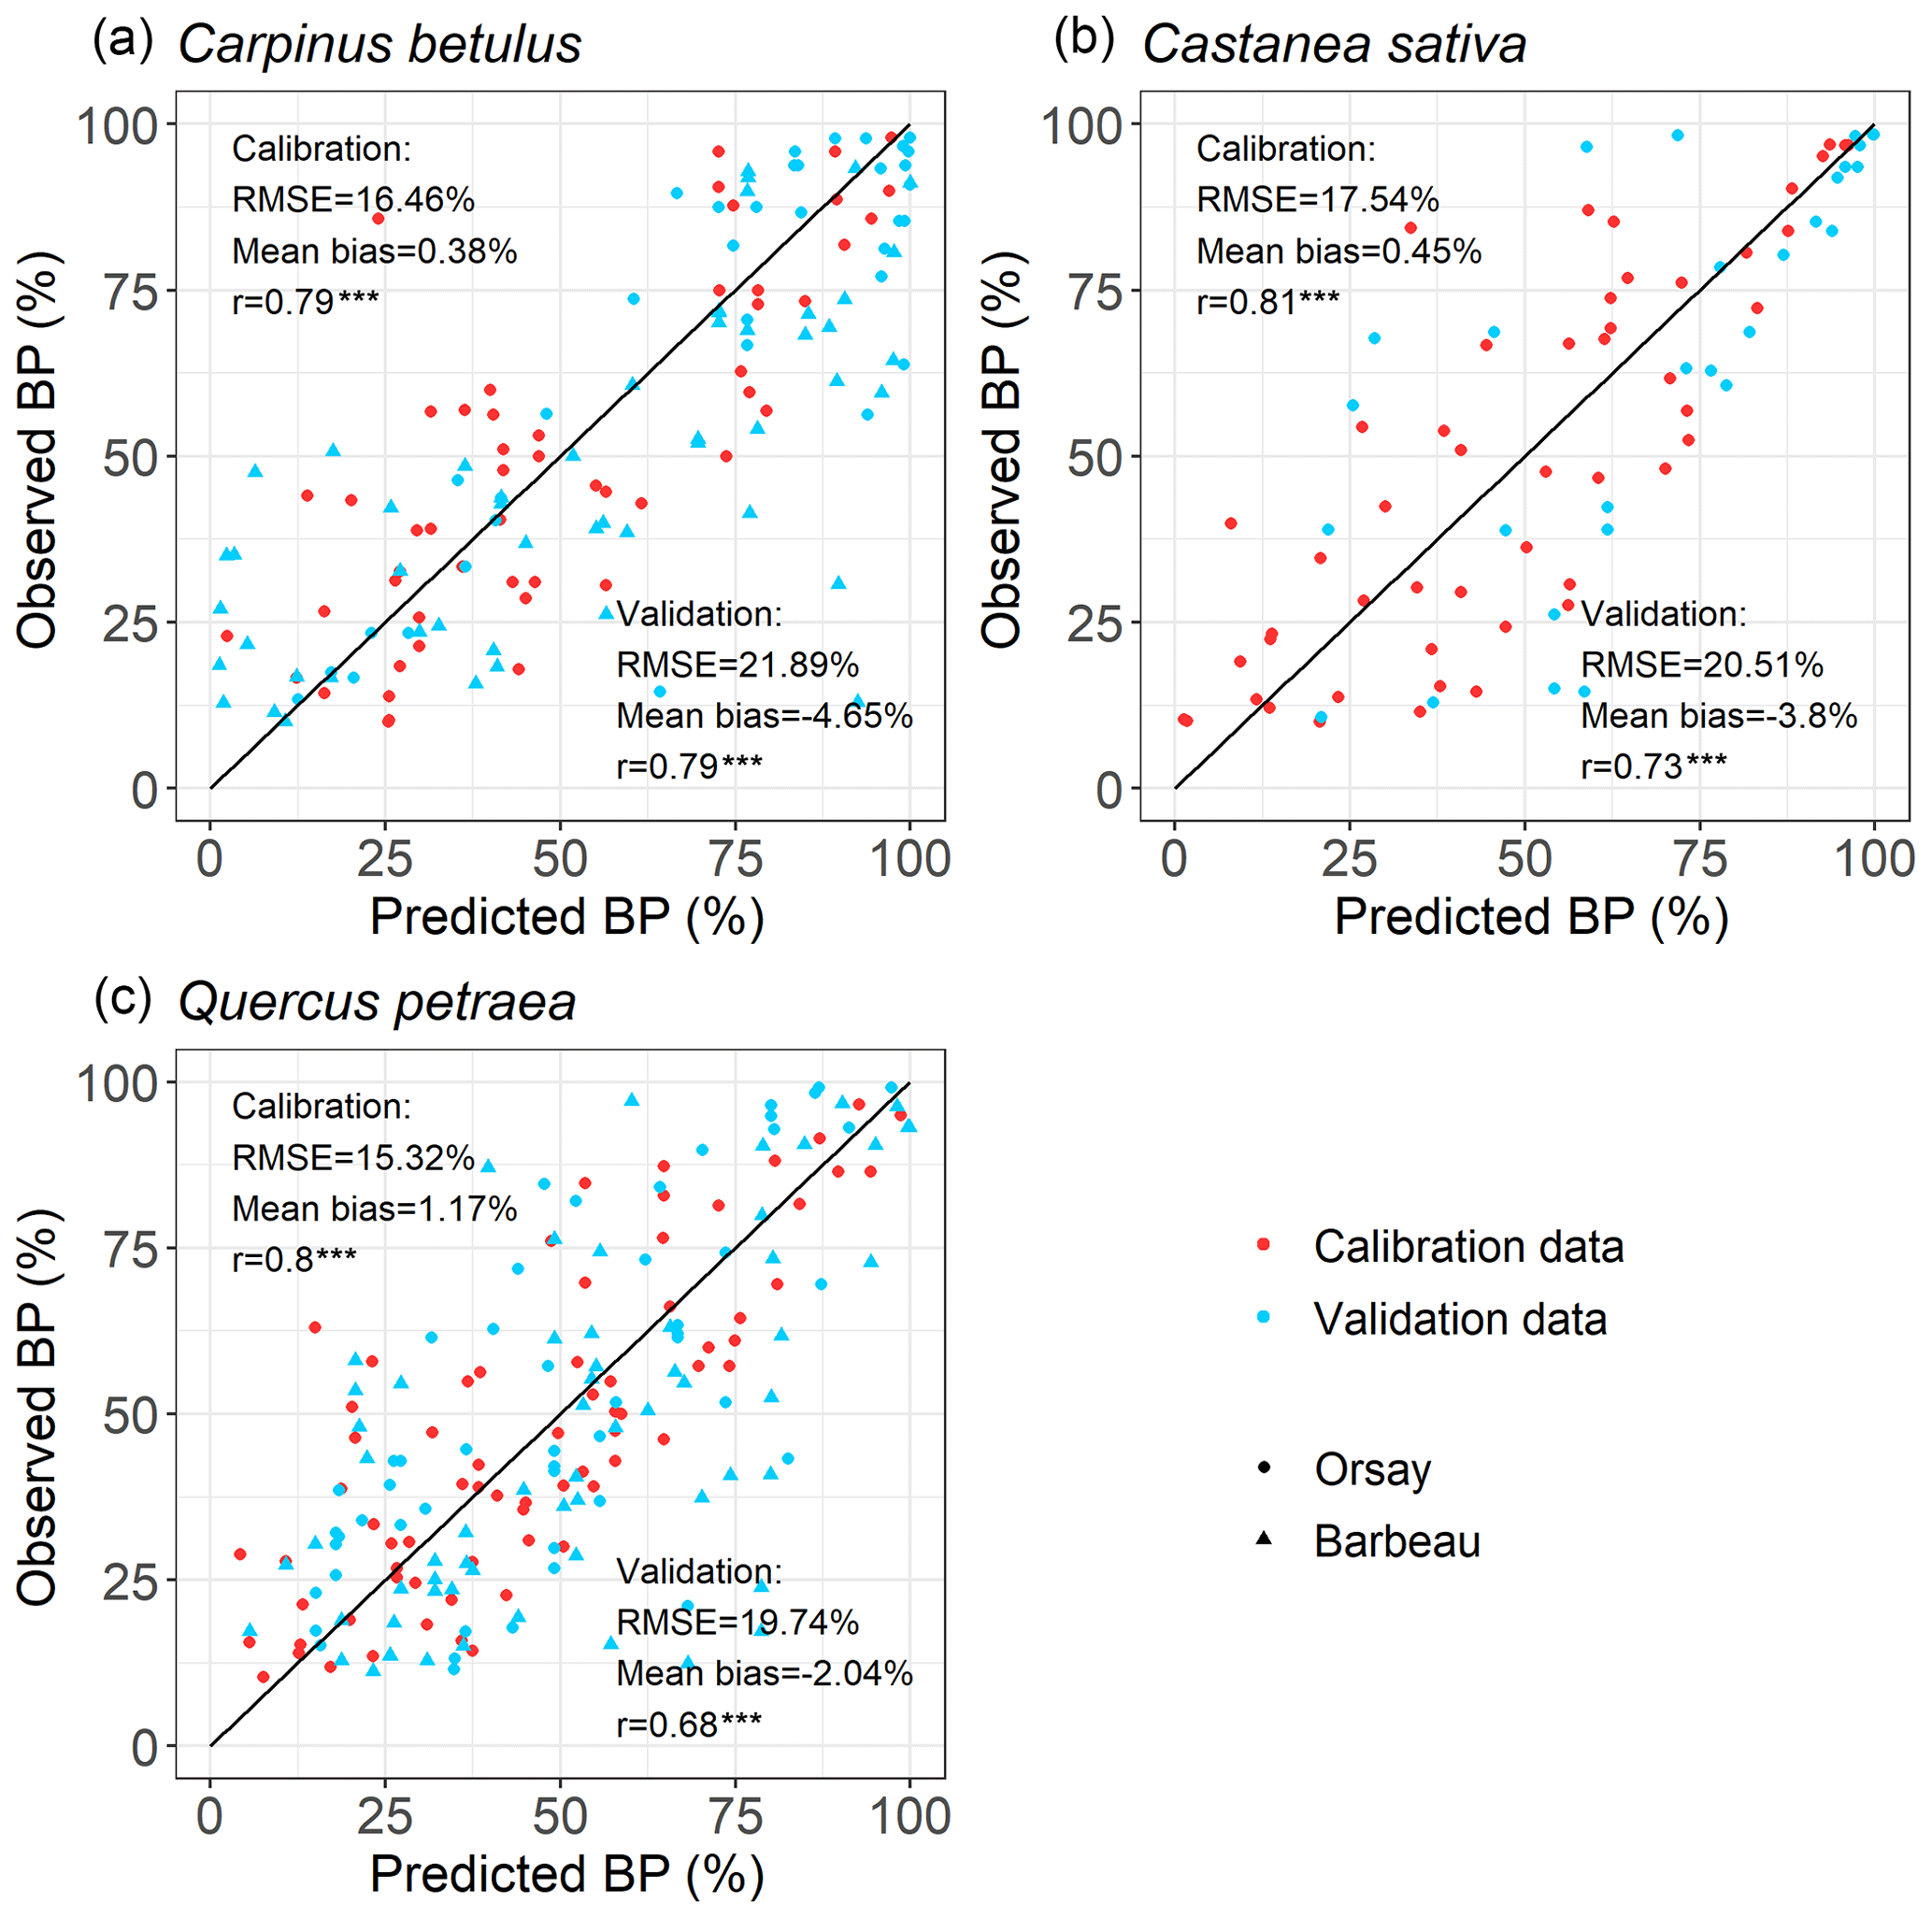
Figure 2Evaluation of the within-population variability (WPV) model predicting the budburst percentage over calibration (red points) and validation (blue points) data. The circle symbols represent data observed in Orsay, and the triangle symbols represent those observed in Barbeau. The points establish the correspondence between the observed and predicted percentage of budburst on an observation day in the population of interest. The one-to-one relation is shown as the black line. RMSE (which is the root mean square error for the budburst percentage), mean bias and correlation coefficient (r) are shown. There are 52, 71 and 50 points (i.e., observation dates) for calibration and 89, 114 and 29 points for validation for hornbeam, oak and chestnut, respectively. P values of the correlation coefficients appear as follows (*: P<0.05, : P<0.01, : P<0.001).
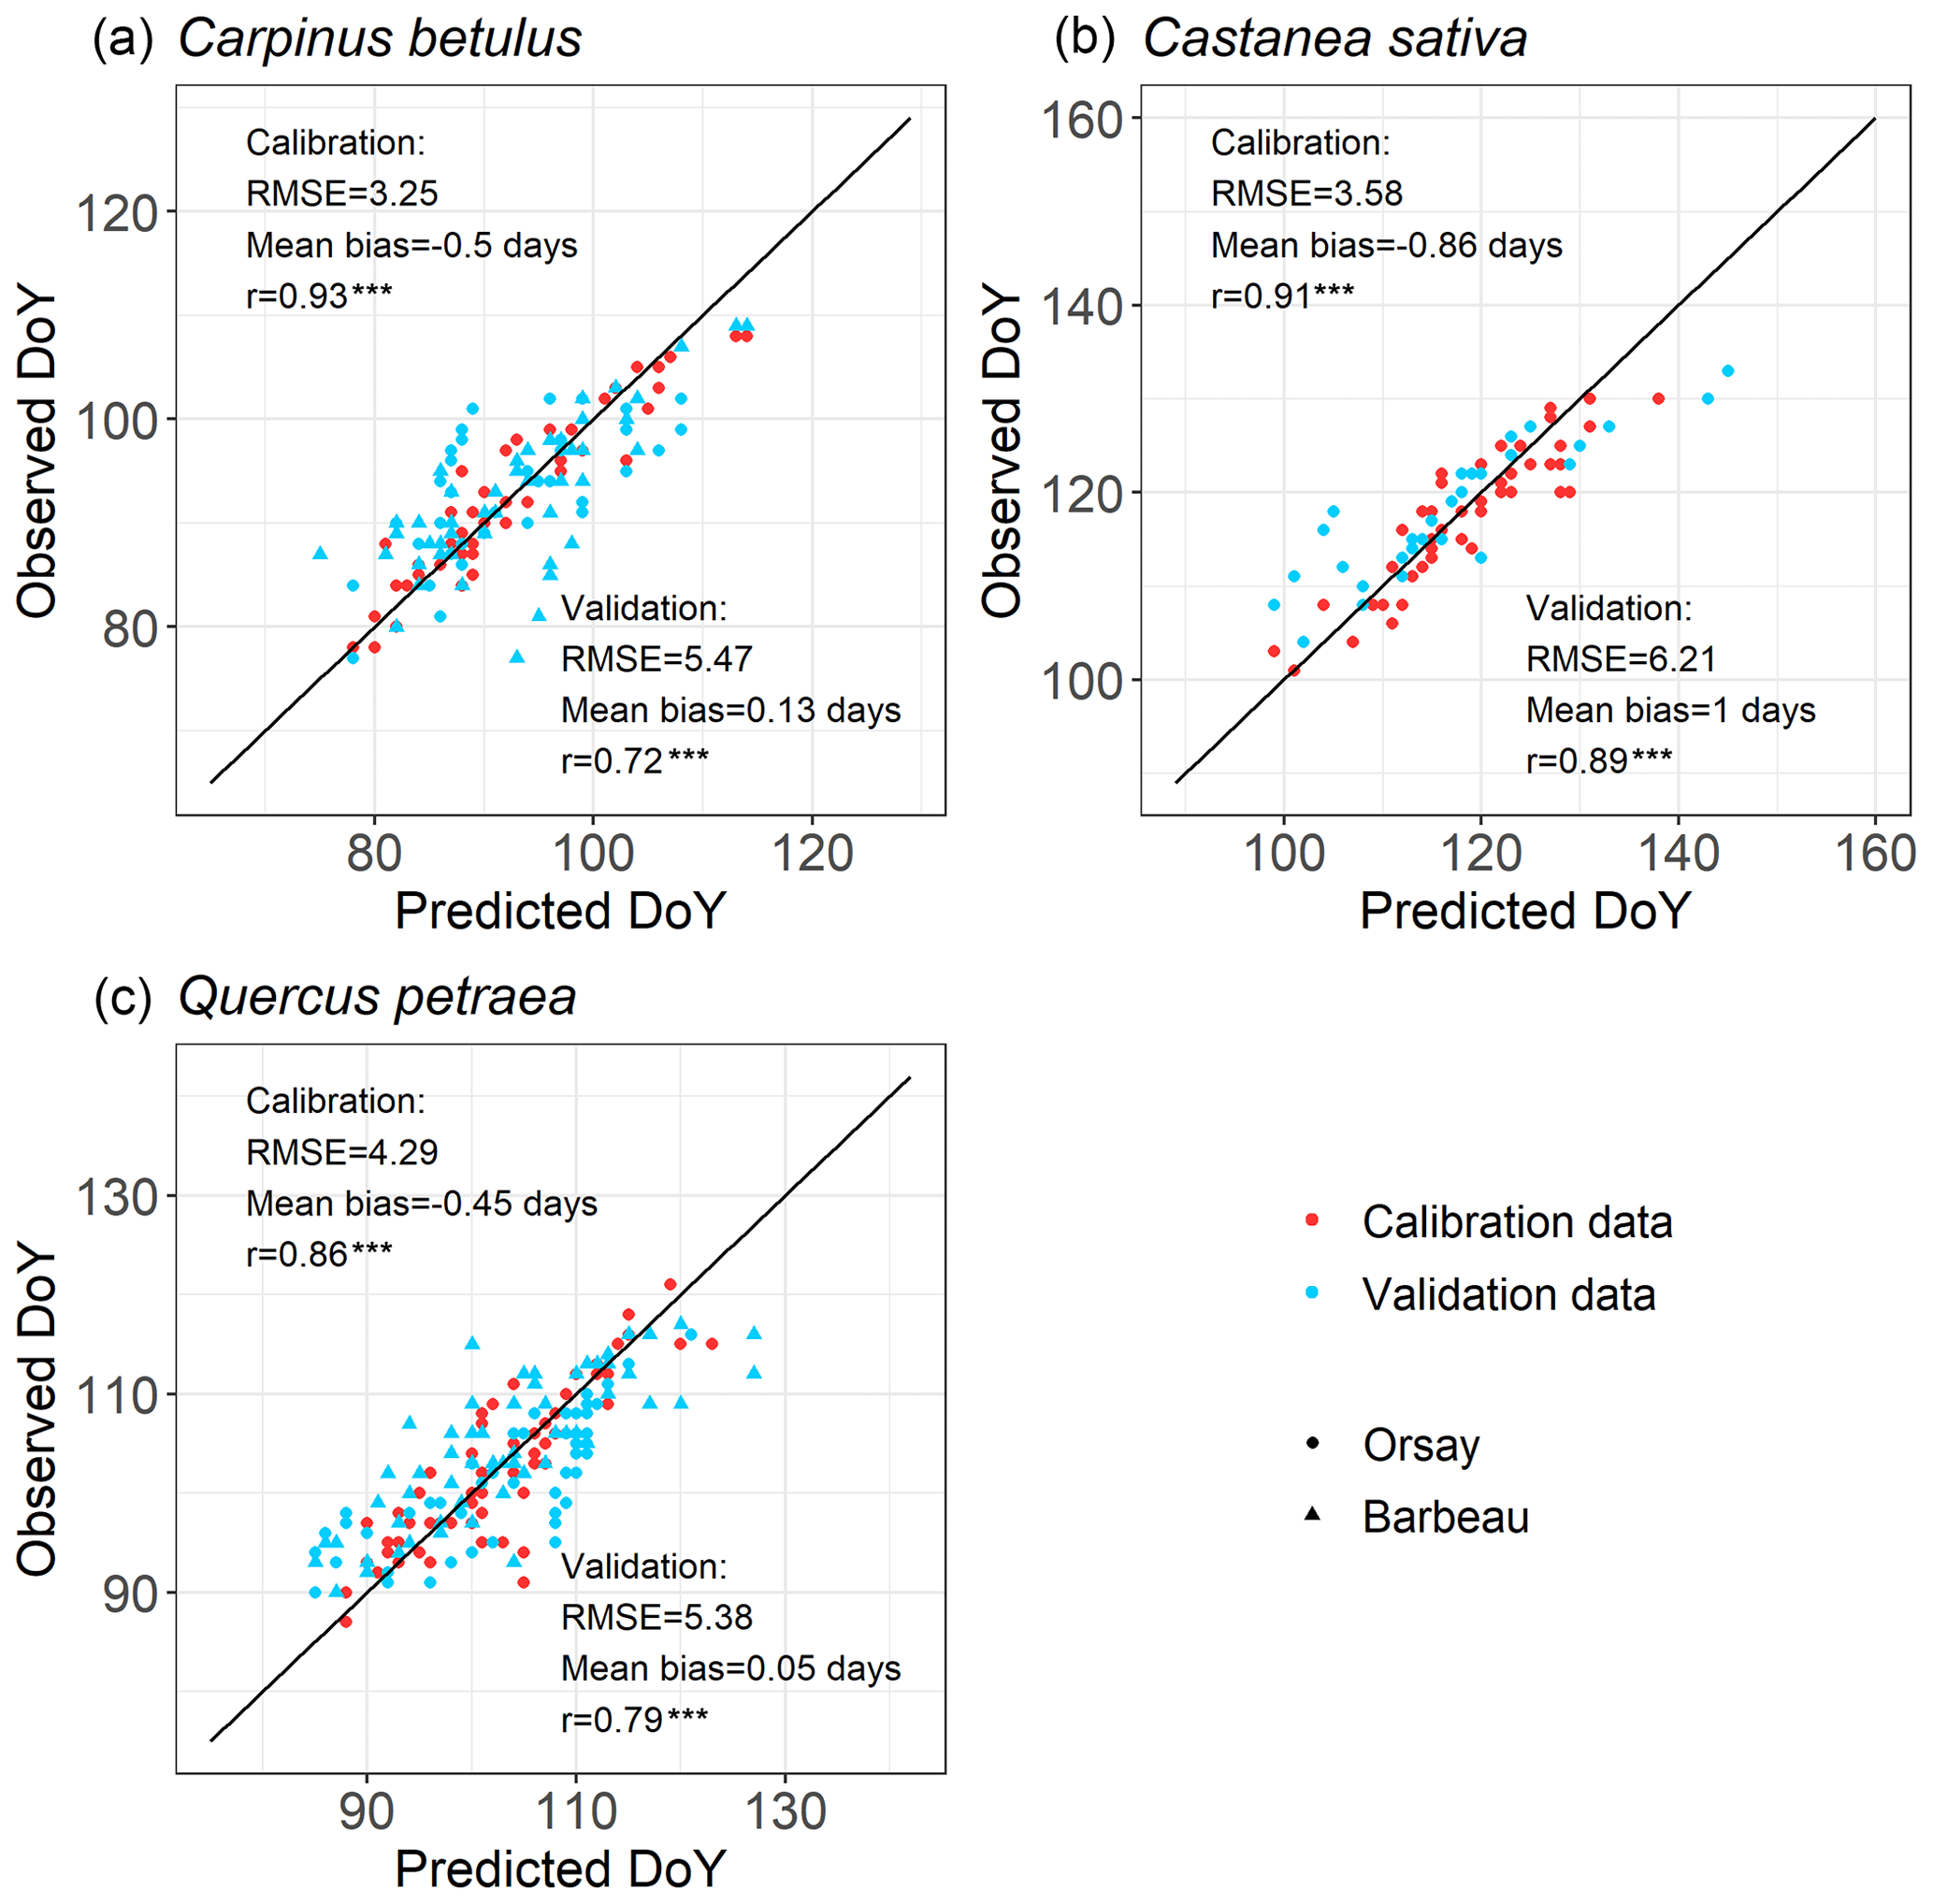
Figure 3Evaluation of the within-population variability (WPV) model predicting budburst dates over calibration (red points) and validation (blue points) data. The circle symbols represent data observed in Orsay, and the triangle symbols represent data observed in Barbeau. The points establish the correspondence between the observed and predicted budburst date on one observation day in the population of interest. The one-to-one relation is shown as the black line. RMSE (which is root mean square error for the budburst date), mean bias and correlation coefficient (r) are shown. There are 52, 71 and 50 points (i.e., observation dates) for calibration and 89, 114 and 29 points for validation for hornbeam, oak and chestnut, respectively. P values of the correlation coefficients appear as follows (*: P<0.05, : P<0.01, : P<0.001).
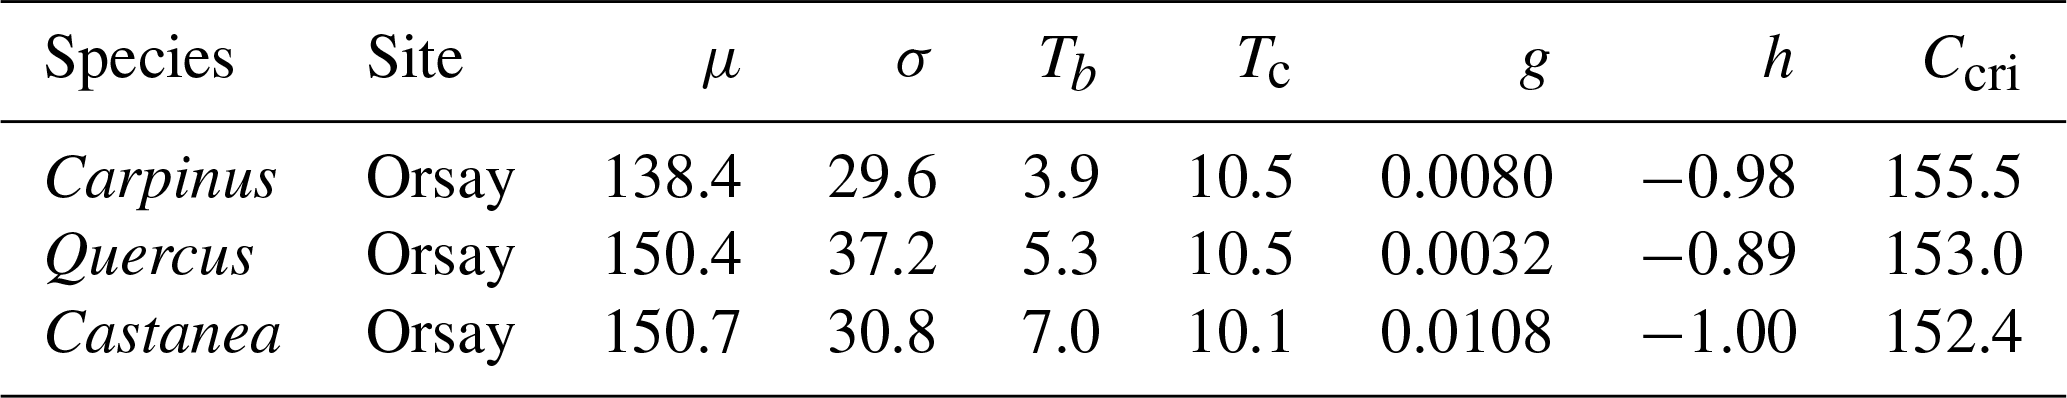
3.3 Parameter variations across species
As mentioned earlier, we assumed that the forcing requirement (F*) followed a normal distribution. The calibration procedure yielded a set of distribution curves that differed across species (Fig. 4). We observed that the distribution of F* looked similar for the three species, with a mean of 146.5 ± 7.0 degree-days (mean ± SD across the three species) and a standard deviation of 32.5 ± 4.1 degree-days, yielding a coefficient of variation of 0.22 ± 0.02 (Fig. 4, Table 2). The distributions of F* compared well to the actual distribution of forcing accumulation established from observations (Fig. 5b, e, h), validating the choice of the normal distribution. However, the modeled distribution did not overlap exactly the distribution established from observed data, because the distribution of observations along the BP scale was uneven (Fig. 5c, f, i). The temperature threshold for chilling accumulation (Tc) ranged from 10.1 ∘C for chestnut to 10.5 ∘C for hornbeam and oak (Table 2). The temperature threshold for forcing accumulation (Tf) ranged from 3.9 ∘C for hornbeam to 7.0 ∘C for chestnut (Table 2, Fig. S2). In all species, buds could not begin ontogenetic growth until the accumulation of chilling to a certain extent (i.e., parameter h was negative for all populations, Table 2). Prevailing temperatures could compensate for the lack of chilling accumulation (positive parameter g; Table 2) for three species.
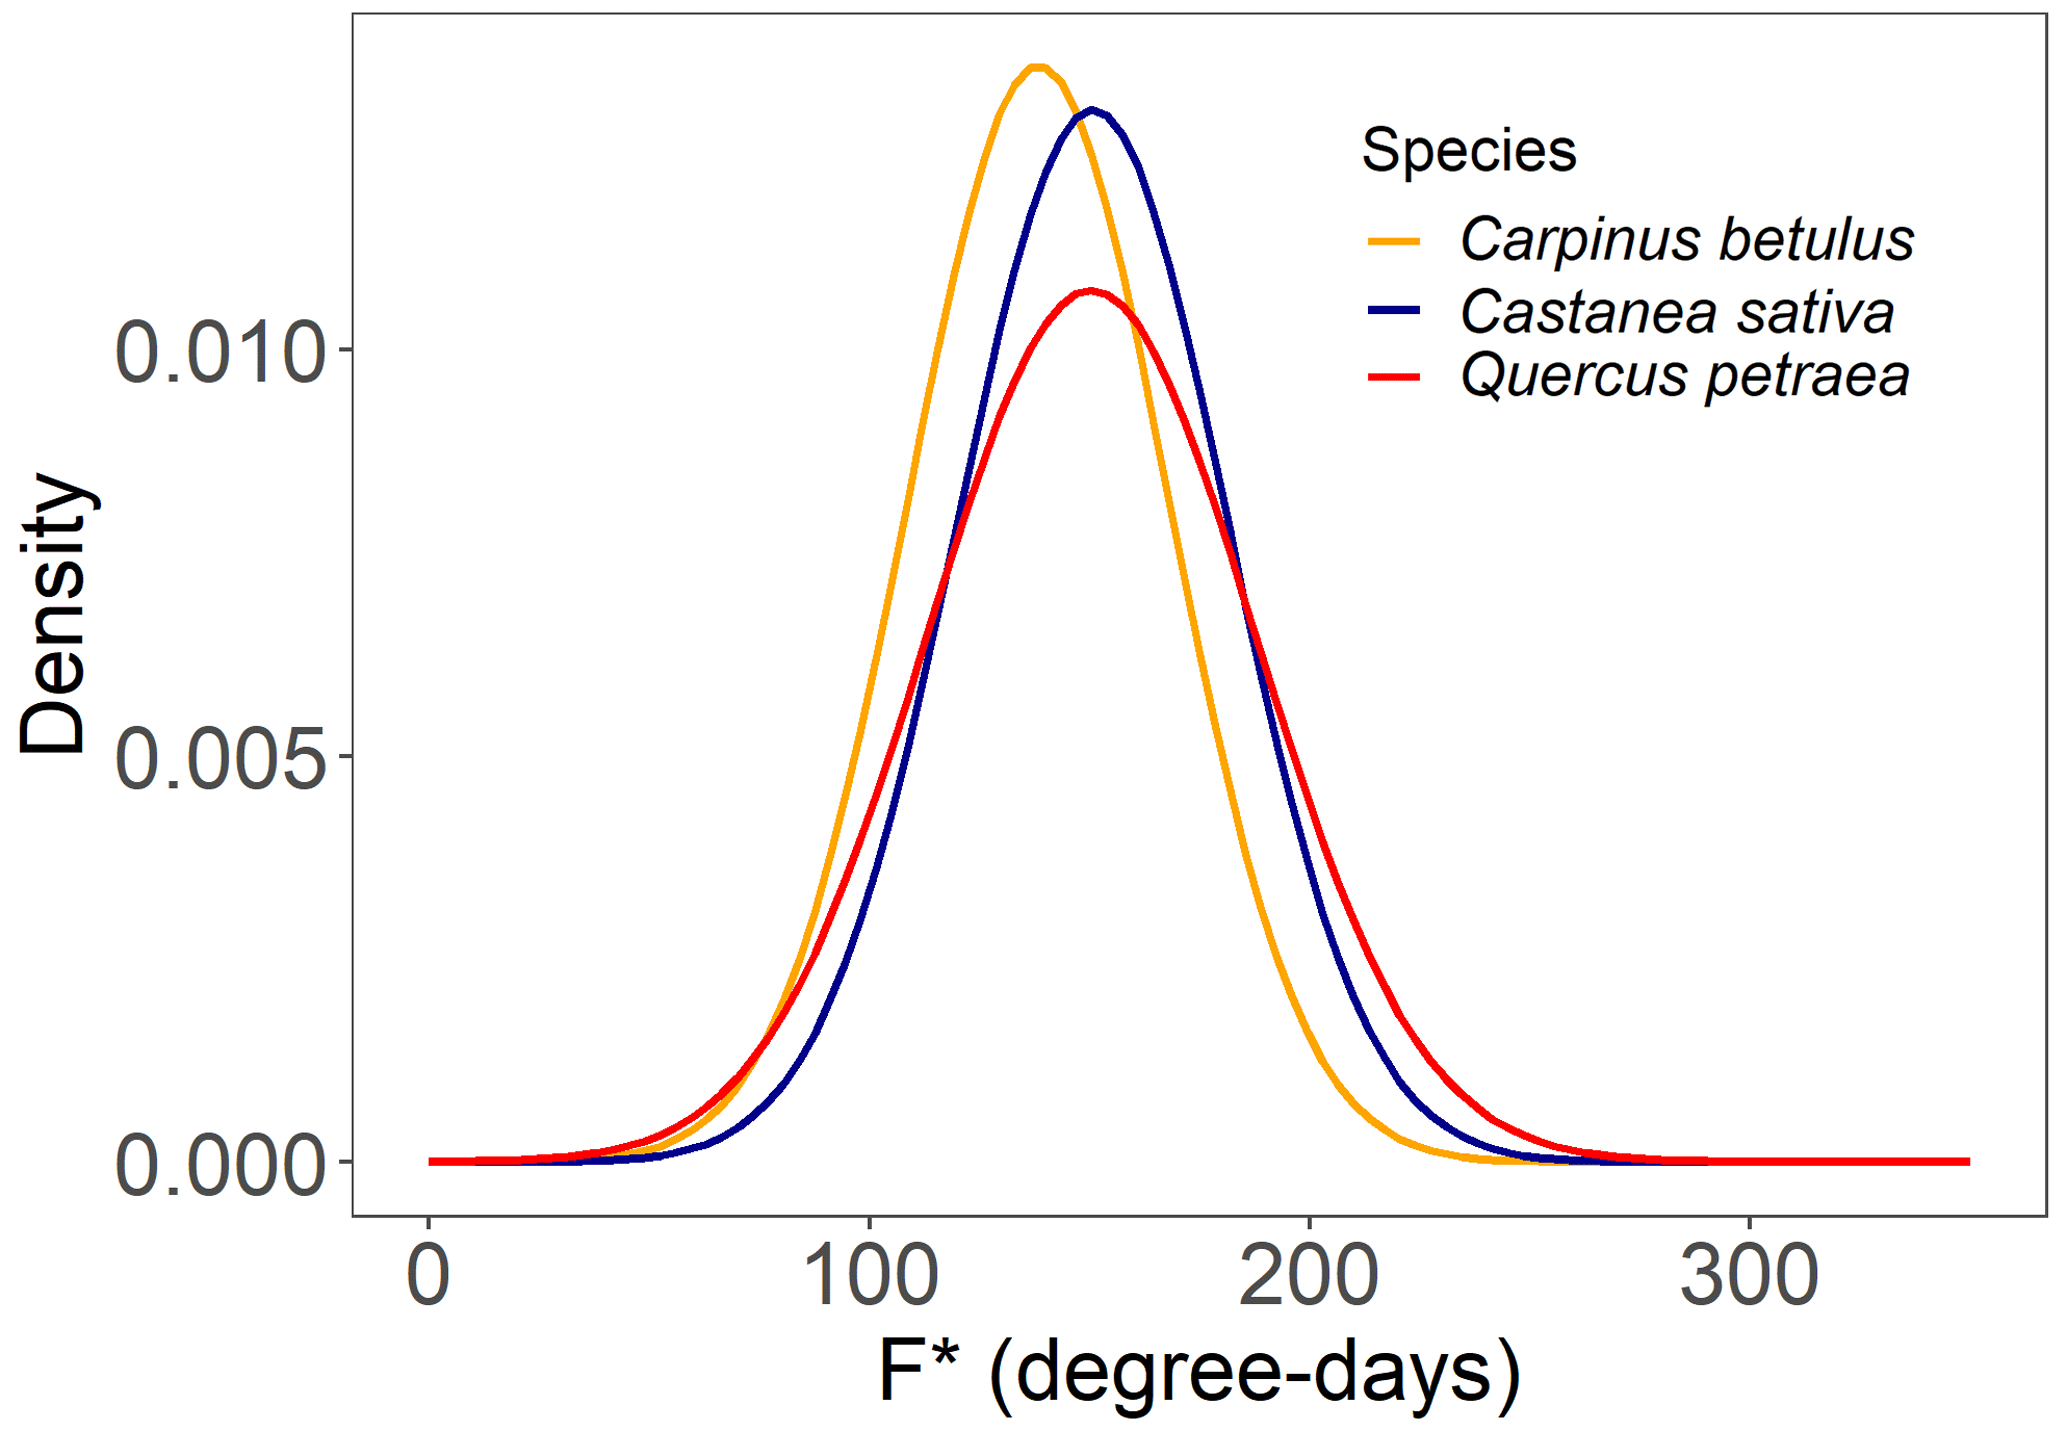
Table 2Parameter values of the WPV model for three populations. μ (degree-days) and σ (degree-days) are the mean and standard deviation of the distribution of F*, respectively (Eq. 1). Tb and Tc (∘C) are the threshold temperatures for the accumulation of forcing and chilling temperatures, respectively (Eqs. 5 and 9). g (∘C−1) and h (dimensionless) are the parameters determining the interactive effect of the state of rest break and the prevailing air temperature on the ontogenetic competence (Eq. 6). Ccri (number of days) is the chilling requirement of rest completion.
3.4 Retrospective analysis for within-population variability of budburst
Over the past 6 decades (1961–2022), spring average temperature increased by +1.9 ∘C in Orsay and +1.4 ∘C in Barbeau (Fig. S6). Over this time period, our retrospective simulations suggest that the beginning (20 %, BP20) and end (80 %, BP80) of budburst in tree populations has advanced significantly for all the species (Fig. 6), with respectively 1.6 ± 0.5 d decade−1 (mean ± SD across species) and 1.7 ± 0.3 d decade−1 and apparent temperature sensitivities of 5.7 ± 0.6 d ∘C−1 and 5.5 ± 0.2 d ∘C−1. These similar trends regarding the beginning and end of budburst result in an unchanged duration of the budburst period (DurBB) in the considered populations over the past 62 years (no trend in DurBB is significantly different from zero in Fig. 7, P>0.05). Meanwhile, the results about temperature sensitivity were similar which were negative for BP20 and BP80 for all three species based on pre-season temperature preceding budburst (Table S4). Notably, the interannual variability of DurBB was large (Fig. 6) and fairly simulated by our model (RMSE of 2.6 ± 1.4 d).
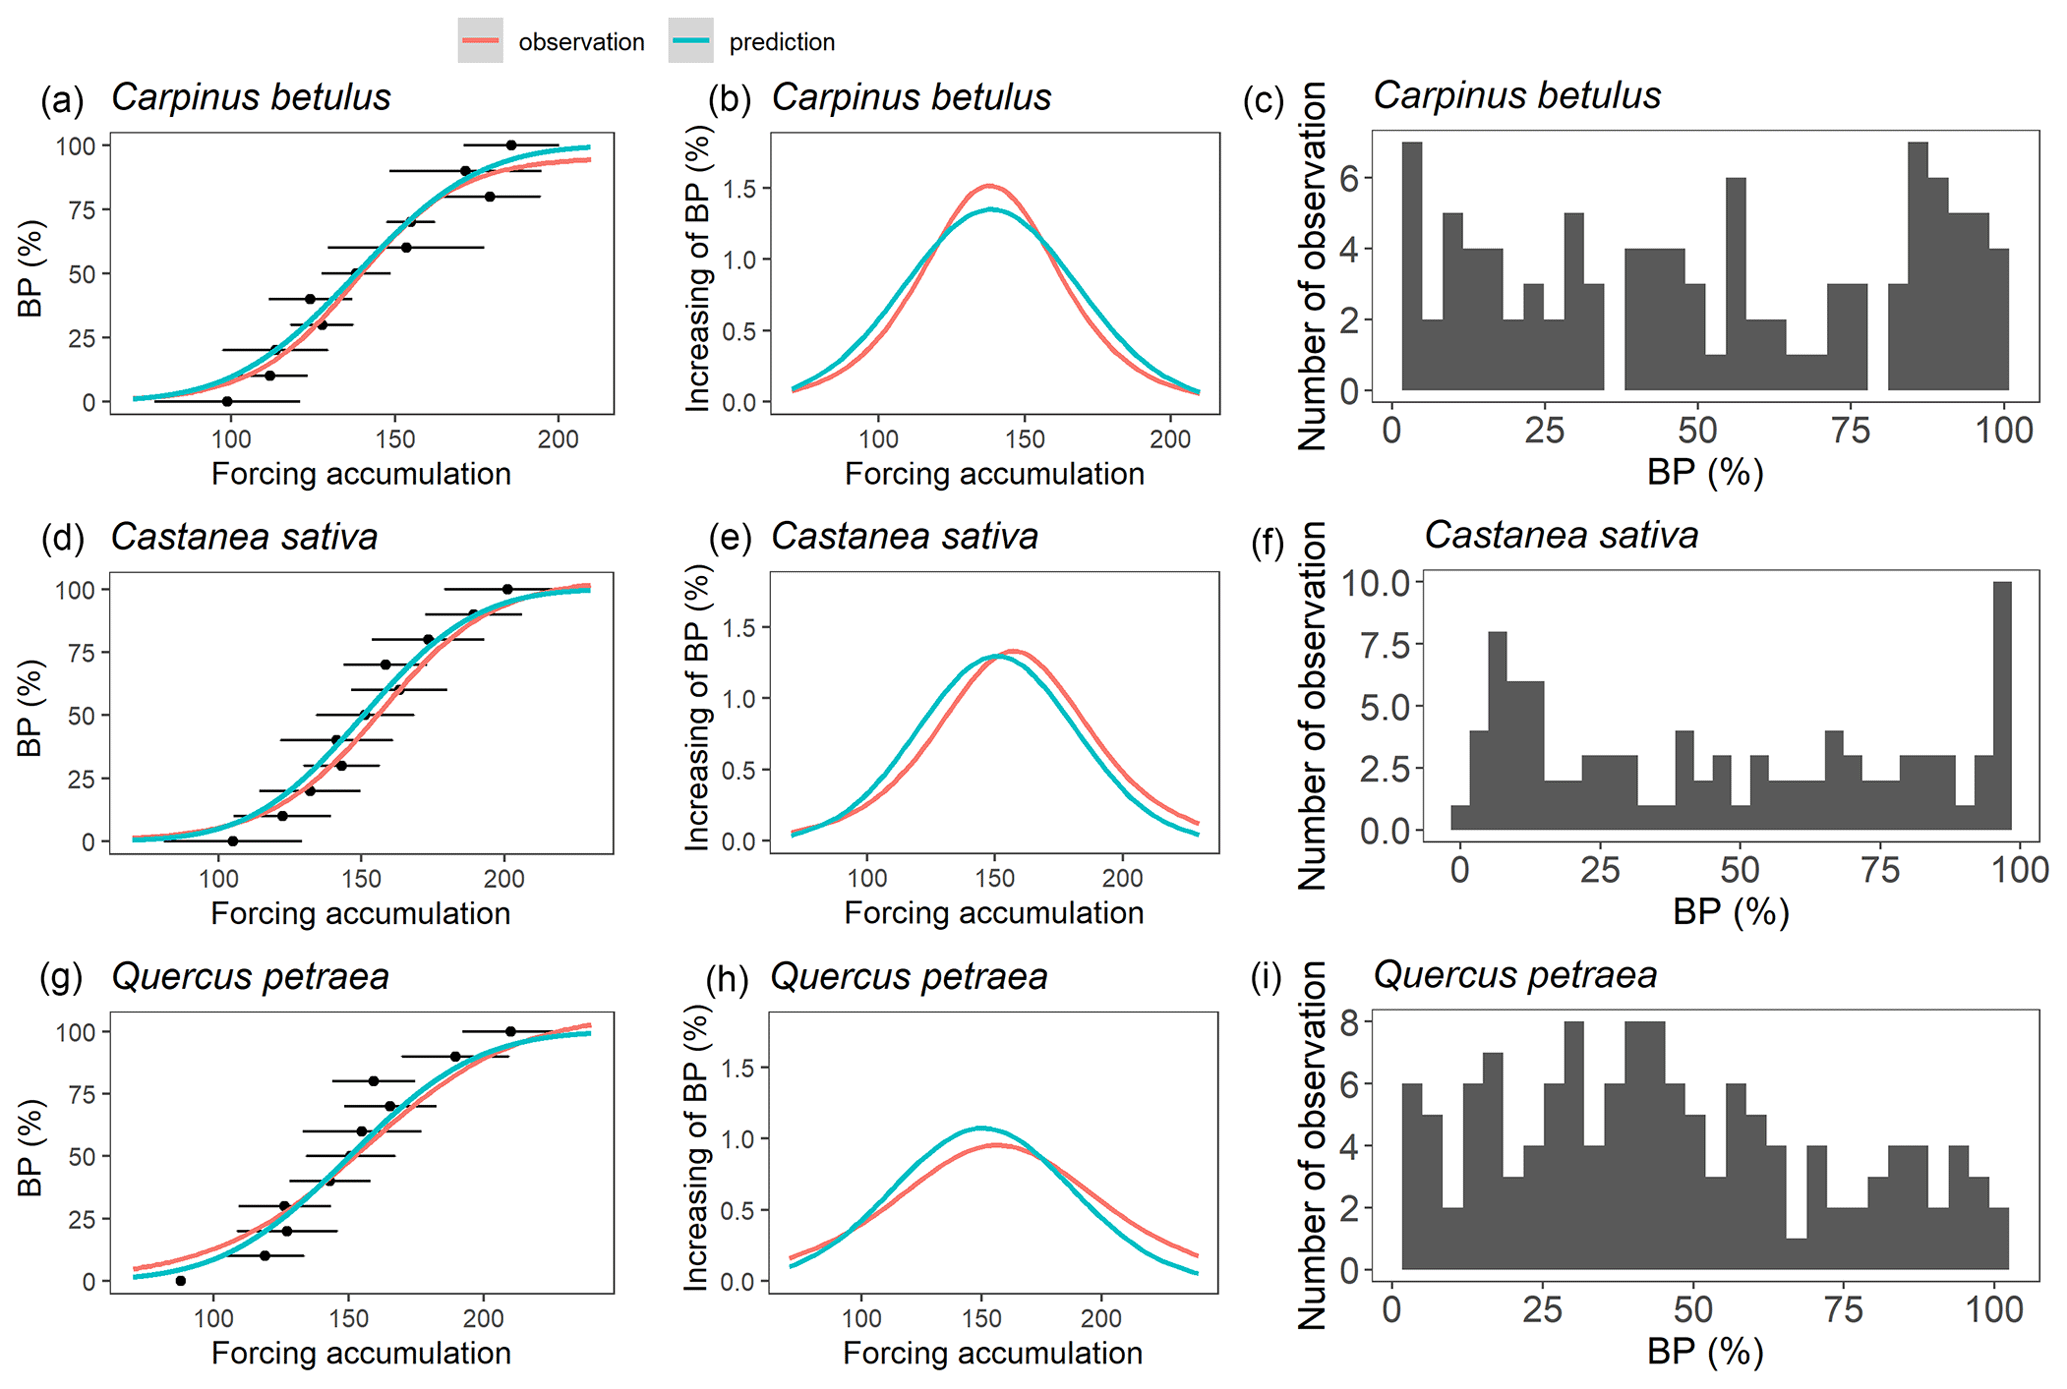
Figure 5Evaluating the modeled F* distributions. Panels (a), (d) and (g) represent the relation between budburst percentage (BP) and forcing accumulation. The black points and error bars represent the forcing accumulation required to reach a given budburst percentage in observed data (average across years ± one standard deviation). The red curves represent a sigmoid function fitted to the black dots (a, d, g), and its first derivative (b, e, h). The blue curve represents predictions based on the parameters in Table 2. Panels (b), (e) and (h) represent the increasing of BP per unit of forcing accumulation. Panels (c), (f) and (i) show the distribution of observed data points in the budburst dataset.
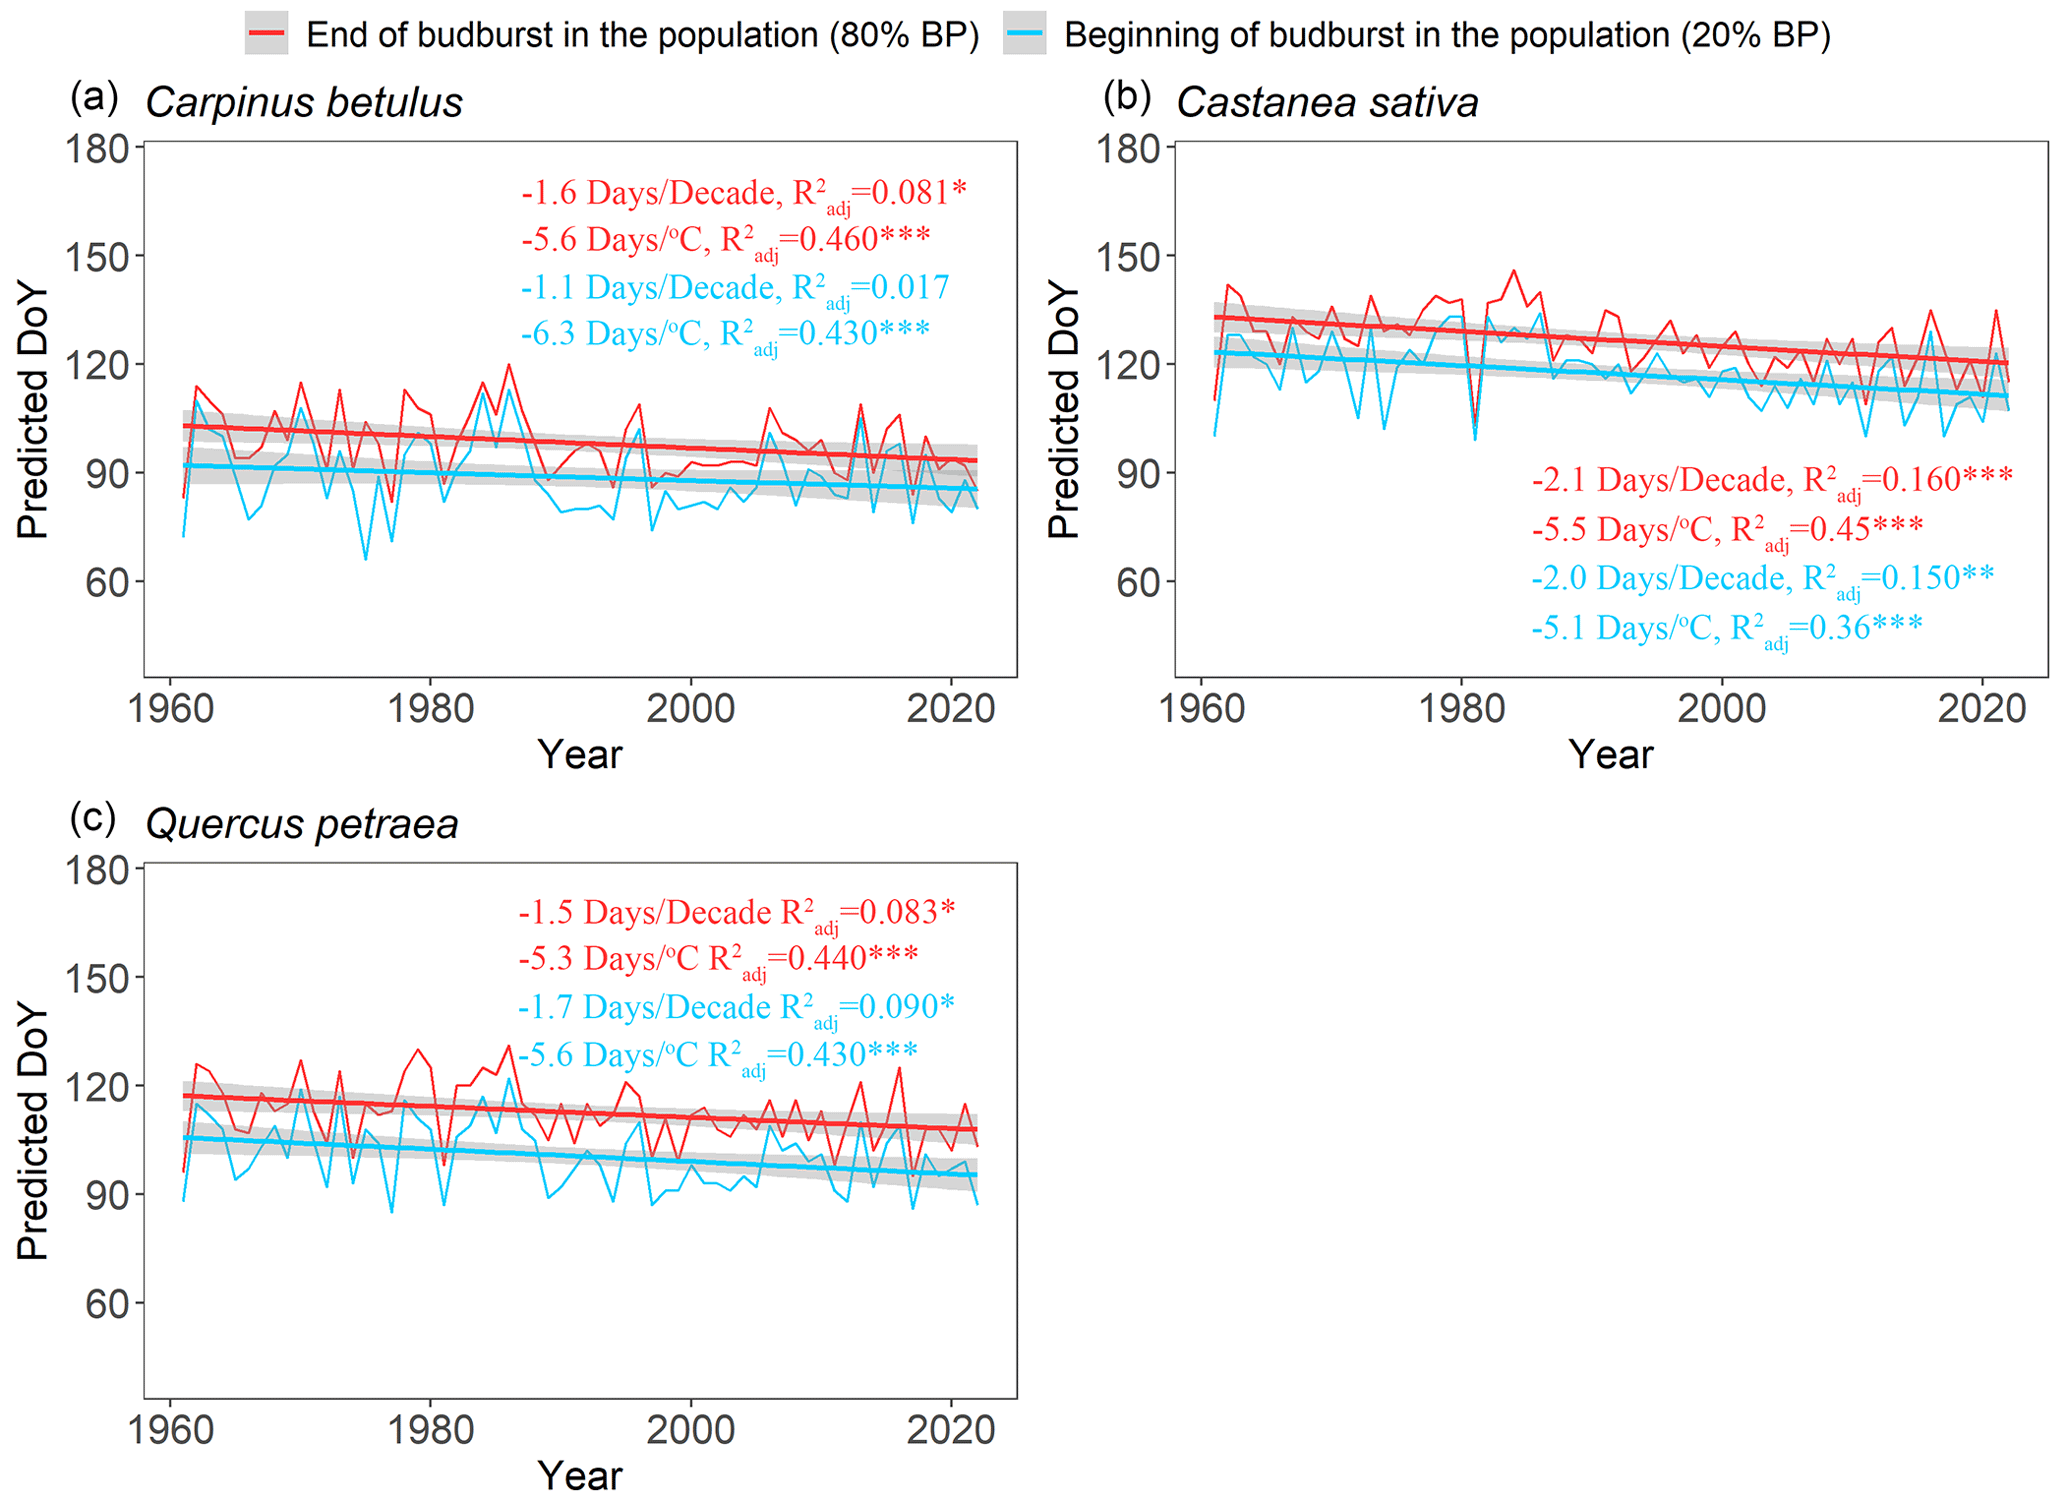
Figure 6Simulated occurrence of the beginning (20 %, BP20 in blue) and end (80 %, BP80 in red) of budburst using the WPV model for three tree species during the period 1961–2022. The fitted lines highlight the trends over the past 62 years. Text in blue (red) shows the sensitivity of BP20 (BP80) to time and mean spring temperature (from January to May), respectively. The trends (in d decade−1 and d ∘C−1) are displayed in the figure. The sensitivity values are tested by linear regression analyses (*: P<0.05, : P<0.01, : P<0.001), and the adjusted coefficient of determination () is shown.
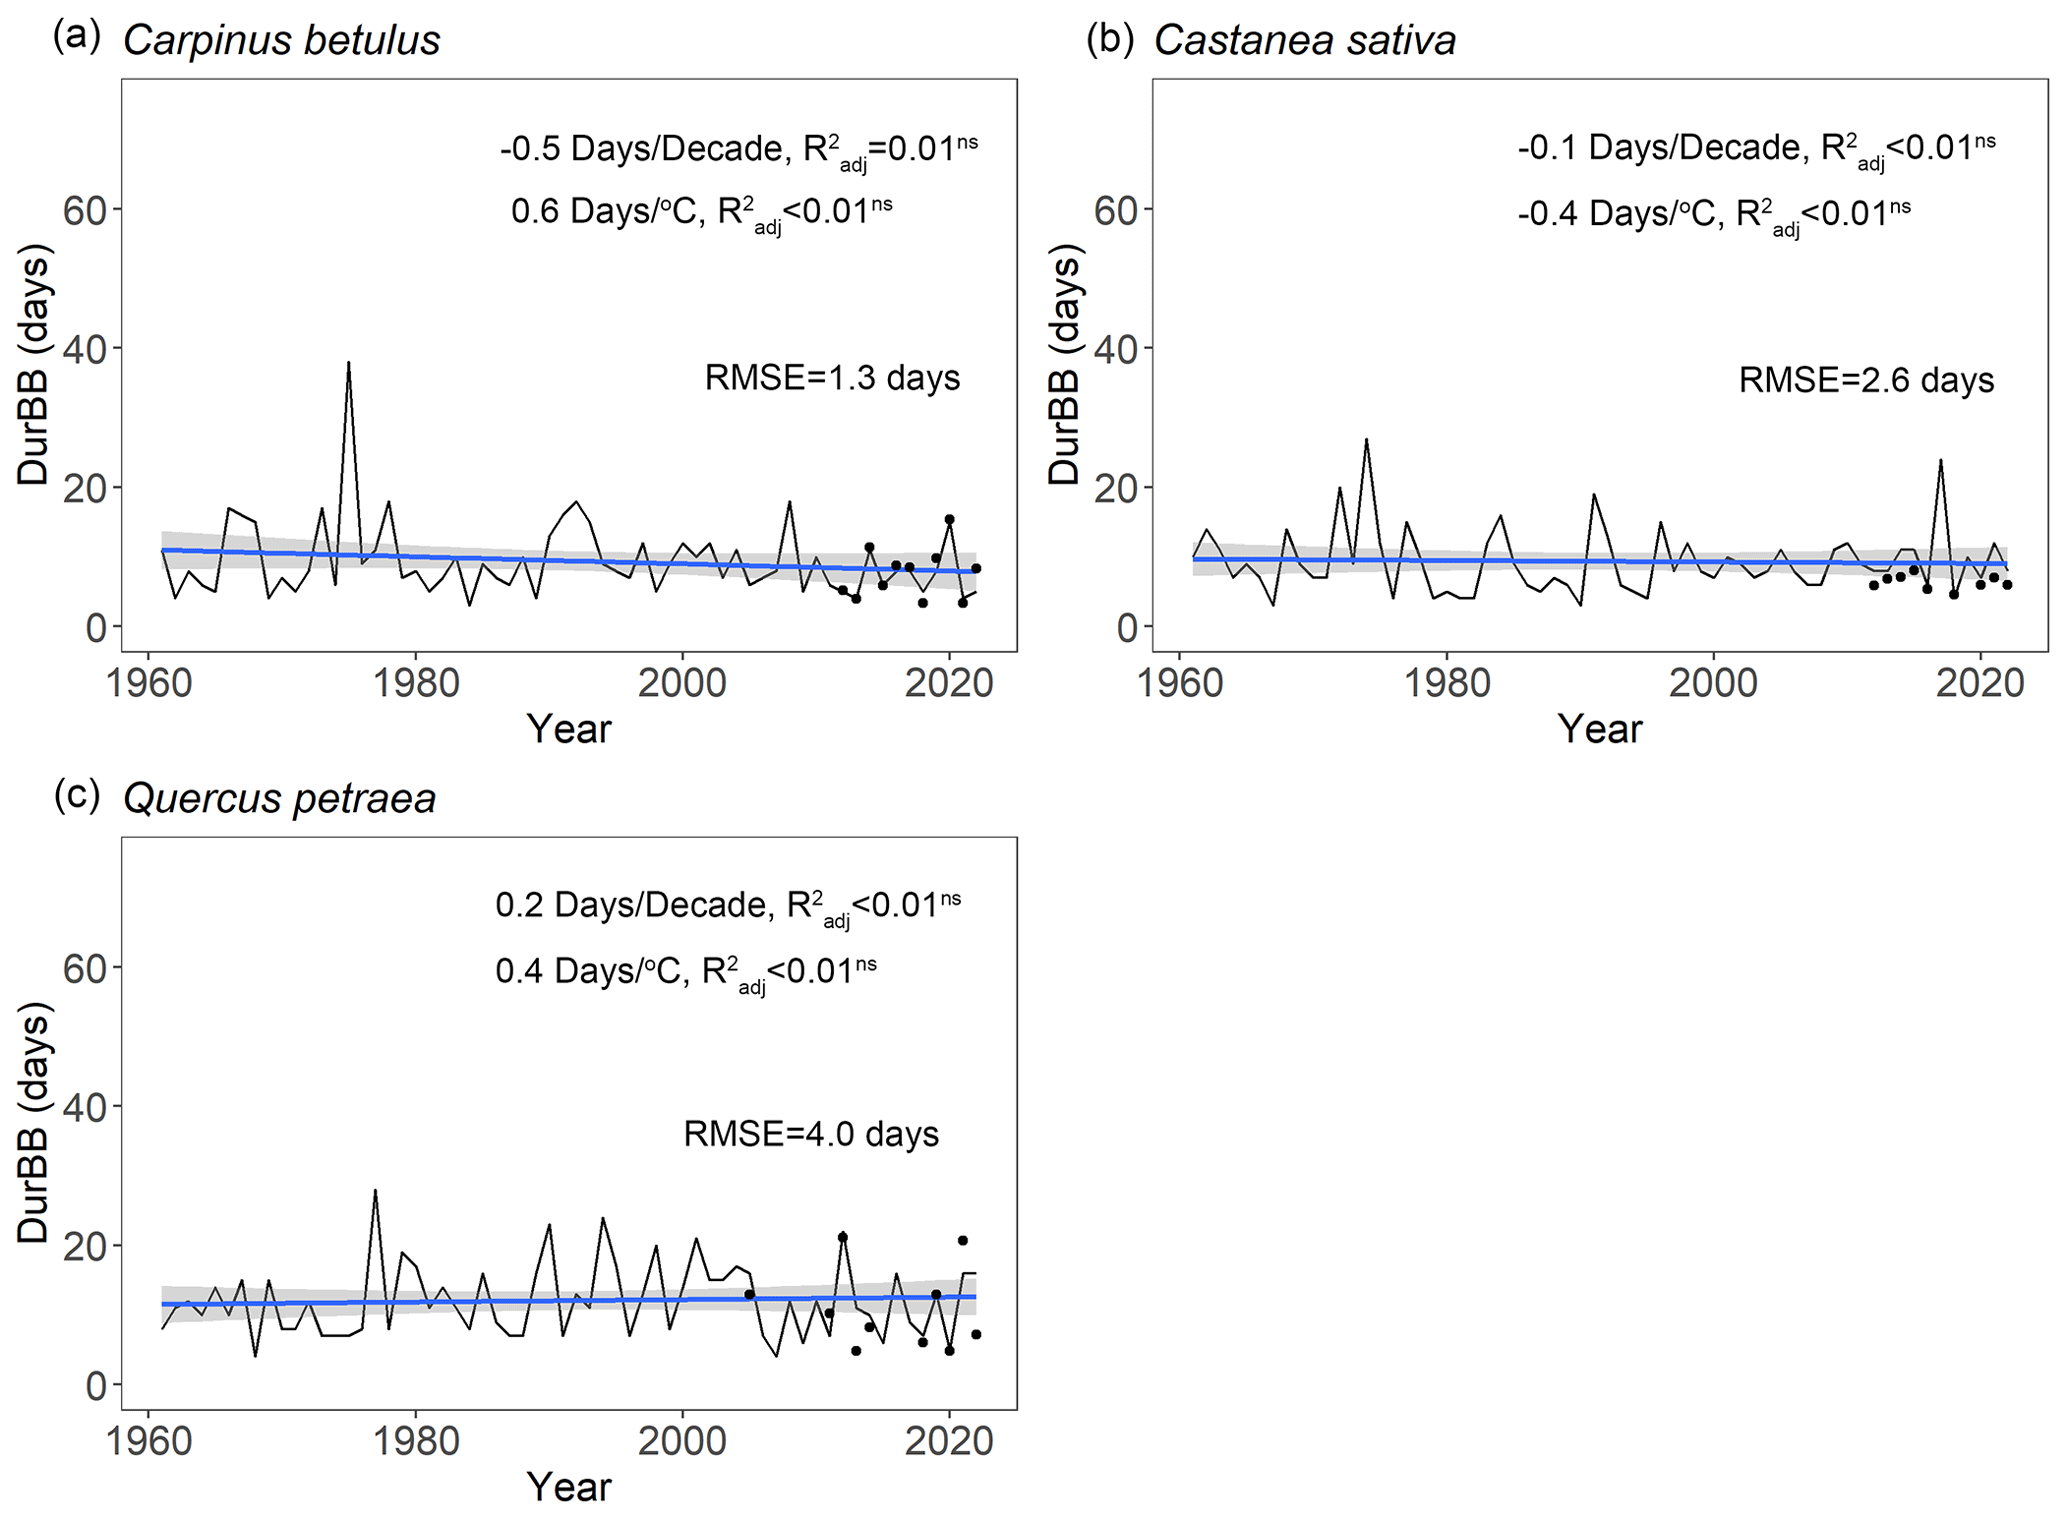
Figure 7Simulated duration of budburst in the population (DurBB) using the WPV model for three tree species during the period 1961–2022. The fitted line depicts the change in DurBB over the past 62 years. The sensitivity of DurBB to time and mean spring temperature (from January to May) are tested by linear regression analyses (not significant: P>0.05), and the adjusted coefficient of determination () is shown. The trends (in d decade−1 and d ∘C−1) are displayed in the figure. The black points are the actual durations of budburst observed in the data (i.e., restricted to years when both BP20 and BP80 are available in a population).
To the best of our knowledge, this paper presents the first model simulating the within-population variability of budburst in tree populations. An added value of this model is that it can simulate the duration of budburst in tree populations. The central hypothesis of the model is that F*, the amount of accumulated forcing temperature required for trees to budburst, follows a normal distribution in tree populations. The ability of the model to simulate the dynamics of budburst over the calibration and validation data, as well as the good agreement between the observed and the simulated F* distributions (Fig. 5), lend support to this hypothesis for all the species and populations considered. Our model yielded RMSE for the validation data (5.4 to 6.2 d), which are close to the temporal resolution of the spring phenology observation (from 2–7 d) and similar to the typical prediction accuracy of models simulating discrete (i.e., population average) budburst dates (e.g., Basler, 2016).
The variability in the timing of budburst among individuals in tree populations is considered to be mainly determined by genetic diversity (Bontemps et al., 2016; Delpierre et al., 2017; Jarvinen et al., 2003; Rousi and Heinonen, 2007; Rusanen et al., 2003) followed by the influence of the microenvironment (Delpierre et al., 2017; Rousi and Heinonen, 2007). The phenological ranking of individuals is largely conserved in tree populations (Delpierre et al., 2017), leading to the identification of “early”, “intermediate” and “late” trees (Malyshev et al., 2022). Further, the distribution of budburst categories is not uniform in natural tree populations, with numerous intermediate individuals and comparatively fewer early and late trees (Malyshev et al., 2022; Chesnoiu et al., 2009; Zohner et al., 2018; Caradonna et al., 2014), which lends further support to a unimodal distribution such as the normal law. Our data further show the same trees are always early/late within the population with corresponding low/high forcing accumulation requirements (Fig. S7). Our model reproduces this phenomenon, with categories of early, intermediate and late trees corresponding to increasing values of F*. This core assumption of the model is supported by previous empirical studies, which observe that the variability of F* could represent the variability of budburst among trees (Langvall et al., 2001; Rousi and Heinonen, 2007). Nevertheless, we could have chosen to assign the variance among individuals to one or several other parameters of the model, related to the fact that genetic variations may affect any of the plant traits determining the modeled parameters. For instance, Gauzere et al. (2019) found that the temperature yielding mid-forcing during ecodormancy (T50) was more sensitive than F* in the UniChill model, which suggests that this parameter is another good candidate for identifying the phenological behavior of individual trees in a population. Thus, we constructed a model assuming that the threshold for forcing temperature (Tb, i.e., parameter of our model analogous to T50) followed a normal distribution, whereas F* was fitted as a constant parameter for the population. This model fitted the data less effectively in both the calibration and validation steps (see Figs. S8 and S9 compared with Figs. 2 and 3), which further supports our decision to assign the among-individual variance to F*. We further tested to assign the among-individual variance to the parameters for phase of dormancy release (e.g., chilling requirement of rest completion (Ccri) and the threshold temperatures for the accumulation of chilling temperatures (Tc)) also using a normal distribution. However, the model fitted the data even worse than in our attempt of fitting a normal distribution of Tb. Questions remain regarding the actual shape of the F* distribution. Indeed, natural selection can lead to traits that are not normally distributed (Caradonna et al., 2014), and uneven distribution of observations may contribute to the non-perfect overlapping of observed and simulated F* distributions (Fig. 5). However, earlier results (Vallet, 2020) showed that the form of the distribution had little influence on the prediction accuracy.
We built the WPV model based on a two-phase parallel model framework, which describes the cumulative effect of chilling and forcing temperatures on the endodormancy and ecodormancy phases, respectively (Hänninen, 2016; Hänninen and Kramer, 2007; Lundell et al., 2020; Chuine and Regniere, 2017). This model structure is in line with our current understanding of the physiological and molecular basis of dormancy in which the dynamics of the dormancy mechanism are emphasized as opposed to a strict classification between the dormancy stages (Lundell et al., 2020; Cooke et al., 2012). In this study, the threshold of chilling accumulation is up to 10.5 ∘C for oak and hornbeam. It is consistent with the experimental results in Baumgarten et al. (2021), which challenge the common assumption that optimal chilling temperatures range ca. 4–6 ∘C, showing 10 ∘C is also effective for chilling accumulation in six dominant temperate European tree species including oak. Furthermore, the model uses the concept of ontogenetic competence (Co) to simulate the process of regulation for the rate of ontogenetic growth by the state of rest break, a phenomenon that has found support in phenological experiments (Lundell et al., 2020; Zhang et al., 2022). Our results demonstrate that, in the investigated species, Co is equal to 0 until dormancy is released to a certain extent (Fig. S2); that is, ontogenetic growth cannot start before a certain amount of chilling accumulation has been reached, which is consistent with previous findings (Lundell et al., 2020; Zhang et al., 2022). According to the calibrated parameter values, ontogenetic competence is also influenced by the prevailing temperature, although the effect is minimal. Indeed, parameter g, which is related to the effect of the prevailing temperature, ranges from 0.0032 to 0.0108 (Table 2), which is comparable to values found in a previous study (Lundell et al., 2020). To some extent in this model, one consequence is that the effect of the prevailing temperature can compensate for the deficiency of chilling accumulation.
Beyond introducing a model to describe the WPV of budburst in tree populations, our study aimed to quantify the response of the duration of budburst (DurBB) to climate warming. We used temperature data to simulate the occurrence of 20 % (BP20) and 80 % (BP80) budburst, as well as DurBB, over the past decades. Our results suggest that the start and end of budburst in tree populations have advanced over the past 62 years with climate warming (Fig. 6), which is consistent with previous results showing advances in the population average dates of budburst (Wenden et al., 2020; Menzel et al., 2006; Fu et al., 2015). In addition, our model simulates sensitivities of budburst to time and temperature that are comparable to values reported earlier (Vitasse et al., 2009b; see Table S5). Our results point to significant sensitivities to both time and temperature for oak as well as significant sensitivity to temperature for hornbeam, which is consistent with the results by Vitasse et al. (2009b). The advancement of budburst would increase the possibility of spring frost damage (Liu et al., 2018; Vitasse et al., 2018), influencing tree physiology and growth with possible impacts on the productivity of forests (Vitasse et al., 2019) or even the distribution of tree species (Chuine, 2010).
Our retrospective simulations suggest that there was no trend in the duration of budburst in tree populations, DurBB, over the past 62 years (Fig. 7), in spite of climate warming (Fig. S6). Since both BP20 and BP80 advanced at a similar rate, DurBB did not evolve over time over the 1961–2022 period. Interestingly, the analysis of temperature data revealed no significant warming in the period of time from BP20 to BP80 over the past decades (P>0.05, Fig. S10). This could explain why DurBB (time interval between BP20 and BP80) did not change over time, in spite of the strong trends in both BP20 and BP80, caused by climate warming. However, interannual variability of DurBB was large, which was reproduced by the WPV model (Fig. 7). Moreover, our study sites are located in the temperate zone, at the heart (for oak and hornbeam) and at the north (chestnut) of our study species distribution areas (Caudullo et al., 2017). At those sites, trees can accumulate enough chilling, or at least, chilling accumulation is not a limitation for ontogenetic growth in nature so far, meaning that budburst is still advancing (Wenden et al., 2020; Piao et al., 2019). Thus, the phenomenon by which DurBB increased with insufficient chilling accumulation in a given population (see Zhang et al., 2021, their Figs. 2, 3 and 4 for evidence in subtropical trees) did not appear in our retrospective simulations. However, we can infer that if chilling accumulation can not be fulfilled under future, continuous climate warming, it will take more time to fulfill the forcing requirement for late trees with a high forcing requirement, leading to the prolonging of DurBB. A longer duration of budburst would increase the possibility of damage (i.e., freezing, insect damage).
We acknowledge that the projections of the WPV of budburst produced by the model are uncertain, first and foremost because the parameter values were inferred from observation data collected in natural conditions as opposed to controlled experiments (Hänninen et al., 2019). Another cause of uncertainty is the ability of the phenological response of plants to acclimatize to the changing climate (Bennie et al., 2010). Under the hypothesis of plant acclimatization, the parameters of the WPV model could have changed over the past decades and would further change with ongoing climate warming. Consequently, related experiments are urgently needed to improve our understanding of the WPV of budburst to infer more reliable parameters and analyze the behavior of phenology models in different climates (Hänninen et al., 2019). However, because our model explicitly addresses, for the first time, the within-population variation of the physiological traits affecting phenology, it can contribute as a framework for future experimental studies. In our study, we only considered the effect of temperature on budburst. However, other environmental factors may also affect budburst (e.g., photoperiod, soil moisture and the interaction between factors). Previous studies showed that photoperiod is expected to modulate the timing of budburst in late-successional species such as oak and chestnut but not in early-successional species such as hornbeam (Basler and Korner, 2012), but see a counterexample on oak in Malyshev et al. (2018). Moreover, photoperiod may have a more complex interaction mechanism with temperature in terms of regulating the time of budburst (Meng et al., 2021). And negative correlations between spring soil moisture and the start of the growing season were found in the Mongolian Plateau (Luo et al., 2021). We envision that improved versions of the WPV of budburst could be proposed based on a more comprehensive understanding of the potential mechanism between phenology and environmental factors in the future.
In conclusion, our work presents a novel model, simulating the continuity of budburst in tree populations in spring. This phenological model can be adapted to the study of other stages of the tree phenological cycle, which are all of continuous nature in tree populations (leaf senescence, wood formation, etc.). We found that budburst was advanced in the past 62 years due to climate warming. However, the duration of budburst period of population was not affected by increasing temperature. This is the first model simulating the within-population variability of budburst in the population. It provides a basis for implementation of a module in models directly interested in the within-population variability of phenological and other functional traits (e.g., physio-demo-genetic models). It can also be used as a standalone model to study the dynamics of phenological traits from the scale of individuals to the population and community in the context of climate change.
The related phenology data and R code for the phenological model are openly accessible under https://doi.org/10.5281/zenodo.7962840 (Dufrene et al., 2023) and https://doi.org/10.5281/zenodo.10020474 (Lin, 2023), respectively.
The supplement related to this article is available online at: https://doi.org/10.5194/gmd-17-865-2024-supplement.
ND and JL designed the research. ND, JL, AM, GV and DB collected phenological data. JL and ND performed the research. JL wrote the manuscript with substantial inputs from all co-authors.
The contact author has declared that none of the authors has any competing interests.
Publisher's note: Copernicus Publications remains neutral with regard to jurisdictional claims made in the text, published maps, institutional affiliations, or any other geographical representation in this paper. While Copernicus Publications makes every effort to include appropriate place names, the final responsibility lies with the authors.
We acknowledge Eric Dufrêne for setting up the phenological surveys. We are also grateful to Eric Dufrêne and Jean-Yves Pontailler for their invaluable contributions regarding the collection of phenological data. We are also grateful for the constructive comments provided by Yongshuo H. Fu and an anonymous reviewer. This work was supported by the China Scholarship Council (202008330320) and the ANR (FOREPRO project, grant number ANR-19-CE32-0008).
This research has been supported by the China Scholarship Council (grant no. 202008330320) and the ANR (FOREPRO project, grant number ANR-19-CE32-0008).
This paper was edited by Hans Verbeeck and reviewed by Yongshuo H. Fu and one anonymous referee.
Alberto, F., Bouffier, L., Louvet, J. M., Lamy, J. B., Delzon, S., and Kremer, A.: Adaptive responses for seed and leaf phenology in natural populations of sessile oak along an altitudinal gradient, J. Evol. Biol., 24, 1442–1454, https://doi.org/10.1111/j.1420-9101.2011.02277.x, 2011.
Basler, D.: Evaluating phenological models for the prediction of leaf-out dates in six temperate tree species across central Europe, Agr. Forest Meteorol., 217, 10–21, https://doi.org/10.1016/j.agrformet.2015.11.007, 2016.
Basler, D. and Korner, C.: Photoperiod sensitivity of bud burst in 14 temperate forest tree species, Agr. Forest Meteorol., 165, 73–81, https://doi.org/10.1016/j.agrformet.2012.06.001, 2012.
Baumgarten, F., Zohner, C. M., Gessler, A., and Vitasse, Y.: Chilled to be forced: the best dose to wake up buds from winter dormancy, New Phytol., 230, 1366–1377, https://doi.org/10.1111/nph.17270, 2021.
Bennie, J., Kubin, E., Wiltshire, A., Huntley, B., and Baxter, R.: Predicting spatial and temporal patterns of bud-burst and spring frost risk in north-west Europe: the implications of local adaptation to climate, Glob. Change Biol., 16, 1503–1514, https://doi.org/10.1111/j.1365-2486.2009.02095.x, 2010.
Blanquart, F., Kaltz, O., Nuismer, S. L., and Gandon, S.: A practical guide to measuring local adaptation, Ecol. Lett., 16, 1195–1205, https://doi.org/10.1111/ele.12150, 2013.
Bontemps, A., Lefevre, F., Davi, H., and Oddou-Muratorio, S.: In situ marker-based assessment of leaf trait evolutionary potential in a marginal European beech population, J. Evol. Biol., 29, 514–527, https://doi.org/10.1111/jeb.12801, 2016.
Caradonna, P. J., Iler, A. M., and Inouye, D. W.: Shifts in flowering phenology reshape a subalpine plant community, P. Natl. Acad. Sci. USA, 111, 4916–4921, https://doi.org/10.1073/pnas.1323073111, 2014.
Caudullo, G., Welk, E., and San-Miguel-Ayanz, J.: Chorological maps for the main European woody species, Data Brief, 12, 662–666, https://doi.org/10.1016/j.dib.2017.05.007, 2017.
Chen, L., Huang, J. G., Ma, Q., Hanninen, H., Rossi, S., Piao, S., and Bergeron, Y.: Spring phenology at different altitudes is becoming more uniform under global warming in Europe, Glob. Change Biol., 24, 3969–3975, https://doi.org/10.1111/gcb.14288, 2018.
Chen, L., Huang, J. G., Ma, Q., Hanninen, H., Tremblay, F., and Bergeron, Y.: Long-term changes in the impacts of global warming on leaf phenology of four temperate tree species, Glob. Change Biol., 25, 997–1004, https://doi.org/10.1111/gcb.14496, 2019.
Chen, X. Q., Wang, L. X., and Inouye, D.: Delayed response of spring phenology to global warming in subtropics and tropics, Agr. Forest Meteorol., 234, 222–235, https://doi.org/10.1016/j.agrformet.2017.01.002, 2017.
Chesnoiu, E. N., Şofletea, N., Curtu, A. L., Toader, A., Radu, R., and Enescu, M.: Bud burst and flowering phenology in a mixed oak forest from Eastern Romania, Ann. Forest Res., 52, 199–206, https://doi.org/10.15287/afr.2009.136, 2009.
Chuine, I.: Why does phenology drive species distribution?, Philos. T. Roy. Soc. B, 365, 3149–3160, https://doi.org/10.1098/rstb.2010.0142, 2010.
Chuine, I. and Regniere, J.: Process-Based Models of Phenology for Plants and Animals, Annu. Rev. Ecol. Evol. S., 48, 159–182, https://doi.org/10.1146/annurev-ecolsys-110316-022706, 2017.
Cooke, J. E., Eriksson, M. E., and Junttila, O.: The dynamic nature of bud dormancy in trees: environmental control and molecular mechanisms, Plant Cell Environ., 35, 1707–1728, https://doi.org/10.1111/j.1365-3040.2012.02552.x, 2012.
Dantec, C. F., Ducasse, H., Capdevielle, X., Fabreguettes, O., Delzon, S., and Desprez-Loustau, M. L.: Escape of spring frost and disease through phenological variations in oak populations along elevation gradients, J. Ecol., 103, 1044–1056, https://doi.org/10.1111/1365-2745.12403, 2015.
Delpierre, N., Dufrene, E., Soudani, K., Ulrich, E., Cecchini, S., Boe, J., and Francois, C.: Modelling interannual and spatial variability of leaf senescence for three deciduous tree species in France, Agr. Forest Meteorol., 149, 938–948, https://doi.org/10.1016/j.agrformet.2008.11.014, 2009.
Delpierre, N., Vitasse, Y., Chuine, I., Guillemot, J., Bazot, S., Rutishauser, T., and Rathgeber, C. B. K.: Temperate and boreal forest tree phenology: from organ-scale processes to terrestrial ecosystem models, Ann. Forest Sci., 73, 5–25, https://doi.org/10.1007/s13595-015-0477-6, 2016.
Delpierre, N., Guillemot, J., Dufrene, E., Cecchini, S., and Nicolas, M.: Tree phenological ranks repeat from year to year and correlate with growth in temperate deciduous forests, Agr. Forest Meteorol., 234, 1–10, https://doi.org/10.1016/j.agrformet.2016.12.008, 2017.
Denechere, R., Delpierre, N., Apostol, E. N., Berveiller, D., Bonne, F., Cole, E., Delzon, S., Dufrene, E., Gressler, E., Jean, F., Lebourgeois, F., Liu, G., Louvet, J. M., Parmentier, J., Soudani, K., and Vincent, G.: The within-population variability of leaf spring and autumn phenology is influenced by temperature in temperate deciduous trees, Int. J. Biometeorol., 65, 369–379, https://doi.org/10.1007/s00484-019-01762-6, 2021.
Du, Y. J., Pan, Y. Q., and Ma, K. P.: Moderate chilling requirement controls budburst for subtropical species in China, Agr. Forest Meteorol., 278, 107693, https://doi.org/10.1016/j.agrformet.2019.107693, 2019.
Dufrene, E., Delpierre, N., Vincent, G., Morfin, A., Berveiller, D., and Lin, J.: The data for WPV model for budburst, Zenodo [data set], https://doi.org/10.5281/zenodo.7962840, 2023.
Fu, Y. H., Zhao, H., Piao, S., Peaucelle, M., Peng, S., Zhou, G., Ciais, P., Huang, M., Menzel, A., Penuelas, J., Song, Y., Vitasse, Y., Zeng, Z., and Janssens, I. A.: Declining global warming effects on the phenology of spring leaf unfolding, Nature, 526, 104–107, https://doi.org/10.1038/nature15402, 2015.
Fu, Y. H., Zhang, X., Piao, S., Hao, F., Geng, X., Vitasse, Y., Zohner, C., Penuelas, J., and Janssens, I. A.: Daylength helps temperate deciduous trees to leaf-out at the optimal time, Glob. Change Biol., 25, 2410–2418, https://doi.org/10.1111/gcb.14633, 2019.
Gauzere, J., Lucas, C., Ronce, O., Davi, H., and Chuine, I.: Sensitivity analysis of tree phenology models reveals increasing sensitivity of their predictions to winter chilling temperature and photoperiod with warming climate, Ecol. Modell., 411, 108805, https://doi.org/10.1016/j.ecolmodel.2019.108805, 2019.
Hänninen, H.: Modelling bud dormancy release in trees from cool and temperate regions, Acta Forestalia Fennica, 213, 7660, https://doi.org/10.14214/aff.7660, 1990.
Hänninen, H.: Boreal and temperate trees in a changing climate: Modelling the ecophysiology of seasonality, Dordrecht, Springer Science +Business Media, https://doi.org/10.1007/978-94-017-7549-6_1, 2016.
Hänninen, H. and Kramer, K.: A framework for modelling the annual cycle of trees in boreal and temperate regions, Silva Fenn., 41, 167–205, 2007.
Hänninen, H., Kramer, K., Tanino, K., Zhang, R., Wu, J., and Fu, Y. H.: Experiments Are Necessary in Process-Based Tree Phenology Modelling, Trends Plant Sci., 24, 199–209, https://doi.org/10.1016/j.tplants.2018.11.006, 2019.
Hart, S. P., Schreiber, S. J., and Levine, J. M.: How variation between individuals affects species coexistence, Ecol. Lett., 19, 825–838, https://doi.org/10.1111/ele.12618, 2016.
Jarvinen, P., Lemmetyinen, J., Savolainen, O., and Sopanen, T.: DNA sequence variation in BpMADS2 gene in two populations of Betula pendula, Mol. Ecol., 12, 369–384, https://doi.org/10.1046/j.1365-294x.2003.01740.x, 2003.
Jewaria, P. K., Hanninen, H., Li, X., Bhalerao, R. P., and Zhang, R.: A hundred years after: endodormancy and the chilling requirement in subtropical trees, New Phytol., 231, 565–570, https://doi.org/10.1111/nph.17382, 2021.
Keenan, T. F., Carbone, M. S., Reichstein, M., and Richardson, A. D.: The model–data fusion pitfall: assuming certainty in an uncertain world, Oecologia, 167, 587–597, https://doi.org/10.1007/s00442-011-2106-x, 2011.
Kramer, K.: A Modeling Analysis of the Effects of Climatic Warming on the Probability of Spring Frost Damage To Tree Species in the Netherlands and Germany, Plant Cell Environ., 17, 367–377, https://doi.org/10.1111/j.1365-3040.1994.tb00305.x, 1994.
Kramer, K., Buiteveld, J., Forstreuter, M., Geburek, T., Leonardi, S., Menozzi, P., Povillon, F., Schelhaas, M., du Cros, E. T., Vendramin, G. G., and van der Werf, D. C.: Bridging the gap between ecophysiological and genetic knowledge to assess the adaptive potential of European beech, Ecol. Model., 216, 333–353, https://doi.org/10.1016/j.ecolmodel.2008.05.004, 2008.
Langvall, O., Nilsson, U., and Orlander, G.: Frost damage to planted Norway spruce seedlings – influence of site preparation and seedling type, Forest Ecol. Manage., 141, 223–235, https://doi.org/10.1016/S0378-1127(00)00331-5, 2001.
Lin, J.: code for wpv model (model simulating the within-population of budburst in tree populations), Zenodo [code], https://doi.org/10.5281/zenodo.10020474, 2023
Liu, G. H., Chuine, I., Denechere, R., Jean, F., Dufrene, E., Vincent, G., Berveiller, D., and Delpierre, N.: Higher sample sizes and observer inter-calibration are needed for reliable scoring of leaf phenology in trees, J. Ecol., 109, 2461–2474, https://doi.org/10.1111/1365-2745.13656, 2021.
Liu, Q., Piao, S. L., Janssens, I. A., Fu, Y. S., Peng, S. S., Lian, X., Ciais, P., Myneni, R. B., Penuelas, J., and Wang, T.: Extension of the growing season increases vegetation exposure to frost, Nat. Commun., 9, 426, https://doi.org/10.1038/s41467-017-02690-y, 2018.
Liu, Z., Fu, Y. H., Shi, X., Lock, T. R., Kallenbach, R. L., and Yuan, Z.: Soil moisture determines the effects of climate warming on spring phenology in grasslands, Agr. Forest Meteorol., 323, 109039, https://doi.org/10.1016/j.agrformet.2022.109039, 2022.
Lundell, R., Hanninen, H., Saarinen, T., Astrom, H., and Zhang, R.: Beyond rest and quiescence (endodormancy and ecodormancy): A novel model for quantifying plant-environment interaction in bud dormancy release, Plant Cell Environ., 43, 40–54, https://doi.org/10.1111/pce.13650, 2020.
Luo, M., Meng, F., Sa, C., Duan, Y., Bao, Y., Liu, T., and De Maeyer, P.: Response of vegetation phenology to soil moisture dynamics in the Mongolian Plateau, CATENA, 206, 105505, https://doi.org/10.1016/j.catena.2021.105505, 2021.
Malyshev, A. V., Henry, H. A. L., Bolte, A., Khan, M. A. S. A., and Kreyling, J.: Temporal photoperiod sensitivity and forcing requirements for budburst in temperate tree seedlings, Agr. Forest Meteorol., 248, 82–90, https://doi.org/10.1016/j.agrformet.2017.09.011, 2018.
Malyshev, A. V., van der Maaten, E., Garthen, A., Mass, D., Schwabe, M., and Kreyling, J.: Inter-Individual Budburst Variation in Fagus sylvatica Is Driven by Warming Rate, Front Plant Sci., 13, 853521, https://doi.org/10.3389/fpls.2022.853521, 2022.
Meier, U.: Growth stages of mono-and dicotyledonous plants, BBCH Monograph, Blackwell Wissenschafts-Verlag Berlin Wien, https://doi.org/10.5073/20180906-074619, 1997.
Meng, L., Zhou, Y., Gu, L., Richardson, A. D., Penuelas, J., Fu, Y., Wang, Y., Asrar, G. R., De Boeck, H. J., Mao, J., Zhang, Y., and Wang, Z.: Photoperiod decelerates the advance of spring phenology of six deciduous tree species under climate warming, Glob. Change Biol., 27, 2914–2927, https://doi.org/10.1111/gcb.15575, 2021.
Menzel, A., Sparks, T. H., Estrella, N., Koch, E., Aasa, A., Ahas, R., Alm-Kubler, K., Bissolli, P., Braslavska, O., Briede, A., Chmielewski, F. M., Crepinsek, Z., Curnel, Y., Dahl, A., Defila, C., Donnelly, A., Filella, Y., Jatcza, K., Mage, F., Mestre, A., Nordli, O., Penuelas, J., Pirinen, P., Remisova, V., Scheifinger, H., Striz, M., Susnik, A., Van Vliet, A. J. H., Wielgolaski, F. E., Zach, S., and Zust, A.: European phenological response to climate change matches the warming pattern, Glob. Change Biol., 12, 1969–1976, https://doi.org/10.1111/j.1365-2486.2006.01193.x, 2006.
Morente-Lopez, J., Kass, J. M., Lara-Romero, C., Serra-Diaz, J. M., Soto-Correa, J. C., Anderson, R. P., and Iriondo, J. M.: Linking ecological niche models and common garden experiments to predict phenotypic differentiation in stressful environments: Assessing the adaptive value of marginal populations in an alpine plant, Glob. Change Biol., 28, 4143–4162, https://doi.org/10.1111/gcb.16181, 2022.
Oddou-Muratorio, S. and Davi, H.: Simulating local adaptation to climate of forest trees with a Physio-Demo-Genetics model, Evol. Appl., 7, 453–467, https://doi.org/10.1111/eva.12143, 2014.
Parmesan, C. and Yohe, G.: A globally coherent fingerprint of climate change impacts across natural systems, Nature, 421, 37–42, https://doi.org/10.1038/nature01286, 2003.
Petit, R. J. and Hampe, A.: Some evolutionary consequences of being a tree, Annu. Rev. Ecol. Evol. S., 37, 187–214, https://doi.org/10.1146/annurev.ecolsys.37.091305.110215, 2006.
Piao, S., Liu, Q., Chen, A., Janssens, I. A., Fu, Y., Dai, J., Liu, L., Lian, X., Shen, M., and Zhu, X.: Plant phenology and global climate change: Current progresses and challenges, Glob. Change Biol., 25, 1922–1940, https://doi.org/10.1111/gcb.14619, 2019.
Puchalka, R., Koprowski, M., Przybylak, J., Przybylak, R., and Dabrowski, H. P.: Did the late spring frost in 2007 and 2011 affect tree-ring width and earlywood vessel size in Pedunculate oak (Quercus robur) in northern Poland?, Int. J. Biometeorol., 60, 1143–1150, https://doi.org/10.1007/s00484-015-1107-6, 2016.
Rathgeber, C. B., Rossi, S., and Bontemps, J. D.: Cambial activity related to tree size in a mature silver-fir plantation, Ann. Bot., 108, 429–438, https://doi.org/10.1093/aob/mcr168, 2011.
R Core Team: R: A language and environment for statistical computing, R Foundation for Statistical Computing, Vienna, Austria, https://www.R-project.org/ (last access: 20 December 2023), 2020.
Renner, S. S. and Zohner, C. M.: Climate Change and Phenological Mismatch in Trophic Interactions Among Plants, Insects, and Vertebrates, Annu. Rev. Ecol. Evol. S., 49, 165–182, https://doi.org/10.1146/annurev-ecolsys-110617-062535, 2018.
Richardson, A. D., Black, T. A., Ciais, P., Delbart, N., Friedl, M. A., Gobron, N., Hollinger, D. Y., Kutsch, W. L., Longdoz, B., Luyssaert, S., Migliavacca, M., Montagnani, L., Munger, J. W., Moors, E., Piao, S., Rebmann, C., Reichstein, M., Saigusa, N., Tomelleri, E., Vargas, R., and Varlagin, A.: Influence of spring and autumn phenological transitions on forest ecosystem productivity, Philos. T. R. Soc. Lond. B, 365, 3227–3246, https://doi.org/10.1098/rstb.2010.0102, 2010.
Rousi, M. and Heinonen, J.: Temperature sum accumulation effects on within-population variation and long-term trends in date of bud burst of European white birch (Betula pendula), Tree Physiol., 27, 1019–1025, https://doi.org/10.1093/treephys/27.7.1019, 2007.
Rusanen, M., Vakkari, P., and Blom, A.: Genetic structure of Acer platanoides and Betula pendula in northern Europe, Can. J. Forest Res., 33, 1110–1115, https://doi.org/10.1139/X03-025, 2003.
Scotti, I., González-Martínez, S. C., Budde, K. B., and Lalagüe, H.: Fifty years of genetic studies: what to make of the large amounts of variation found within populations?, Ann. Forest Sci., 73, 69–75, https://doi.org/10.1007/s13595-015-0471-z, 2016.
Vallet, L.: Modélisation de la dynamique intra-populationnelle du débourrement en Ile-de-France, MSc report, Université Paris-Saclay, Orsay, France, 2020.
Vegis, A.: Dormancy in Higher Plants, Annu. Rev. Plant Phys., 15, 185–224, https://doi.org/10.1146/annurev.pp.15.060164.001153, 1964.
Vidal, J. P., Martin, E., Franchisteguy, L., Baillon, M., and Soubeyroux, J. M.: A 50-year high-resolution atmospheric reanalysis over France with the Safran system, Int. J. Climatol., 30, 1627–1644, https://doi.org/10.1002/joc.2003, 2010.
Violle, C., Enquist, B. J., McGill, B. J., Jiang, L., Albert, C. H., Hulshof, C., Jung, V., and Messier, J.: The return of the variance: intraspecific variability in community ecology, Trends Ecol. Evol., 27, 244–252, https://doi.org/10.1016/j.tree.2011.11.014, 2012.
Vitasse, Y. and Basler, D.: What role for photoperiod in the bud burst phenology of European beech, Eur. J. Forest Res., 132, 1–8, https://doi.org/10.1007/s10342-012-0661-2, 2013.
Vitasse, Y., Porte, A. J., Kremer, A., Michalet, R., and Delzon, S.: Responses of canopy duration to temperature changes in four temperate tree species: relative contributions of spring and autumn leaf phenology, Oecologia, 161, 187–198, https://doi.org/10.1007/s00442-009-1363-4, 2009a.
Vitasse, Y., Delzon, S., Dufrêne, E., Pontailler, J.-Y., Louvet, J.-M., Kremer, A., and Michalet, R.: Leaf phenology sensitivity to temperature in European trees: Do within-species populations exhibit similar responses?, Agr. Forest Meteorol., 149, 735–744, https://doi.org/10.1016/j.agrformet.2008.10.019, 2009b.
Vitasse, Y., Schneider, L., Rixen, C., Christen, D., and Rebetez, M.: Increase in the risk of exposure of forest and fruit trees to spring frosts at higher elevations in Switzerland over the last four decades, Agricultural and Forest Meteorology, 248, 60-69, https://doi.org/10.1016/j.agrformet.2017.09.005, 2018.
Walther, G. R., Post, E., Convey, P., Menzel, A., Parmesan, C., Beebee, T. J., Fromentin, J. M., Hoegh-Guldberg, O., and Bairlein, F.: Ecological responses to recent climate change, Nature, 416, 389–395, https://doi.org/10.1038/416389a, 2002.
Wenden, B., Mariadassou, M., Chmielewski, F. M., and Vitasse, Y.: Shifts in the temperature-sensitive periods for spring phenology in European beech and pedunculate oak clones across latitudes and over recent decades, Glob. Change Biol., 26, 1808–1819, https://doi.org/10.1111/gcb.14918, 2020.
Zhang, R., Lin, J. H., Wang, F. C., Shen, S. T., Wang, X. B., Rao, Y., Wu, J. S., and Hanninen, H.: The chilling requirement of subtropical trees is fulfilled by high temperatures: A generalized hypothesis for tree endodormancy release and a method for testing it, Agr. Forest Meteorol., 298, 108296, https://doi.org/10.1016/j.agrformet.2020.108296, 2021.
Zhang, R., Lin, J. H., Wang, F. C., Delpierre, N., Kramer, K., Hanninen, H., and Wu, J. S.: Spring phenology in subtropical trees: Developing process-based models on an experimental basis, Agr. Forest Meteorol., 314, 108802, https://doi.org/10.1016/j.agrformet.2021.108802, 2022.
Zohner, C. M., Mo, L., and Renner, S. S.: Global warming reduces leaf-out and flowering synchrony among individuals, elife, 7, e40214, https://doi.org/10.7554/eLife.40214, 2018.
Zohner, C. M., Mo, L., Sebald, V., Renner, S. S., and Dornelas, M.: Leaf-out in northern ecotypes of wide-ranging trees requires less spring warming, enhancing the risk of spring frost damage at cold range limits, Global Ecol. Biogeogr., 29, 1065–1072, https://doi.org/10.1111/geb.13088, 2020.