the Creative Commons Attribution 4.0 License.
the Creative Commons Attribution 4.0 License.
 | 09 Aug 2024
Radiocarbon analysis reveals underestimation of soil organic carbon persistence in new-generation soil models
Frank Hagedorn
Margaux Moreno Duborgel
Luisa I. Minich
Heather D. Graven
Reflecting recent advances in our understanding of soil organic carbon (SOC) turnover and persistence, a new generation of models increasingly makes the distinction between the more labile soil particulate organic matter (POM) and the more persistent mineral-associated organic matter (MAOM). Unlike the typically poorly defined conceptual pools of traditional SOC models, the POM and MAOM soil fractions can be directly measured for their carbon content and isotopic composition, allowing for fraction-specific data assimilation. However, the new-generation model predictions of POM and MAOM dynamics have not yet been validated with fraction-specific carbon and 14C observations. In this study, we evaluate five influential and actively developed new-generation models (CORPSE, MEND, Millennial, MIMICS, SOMic) with fraction-specific and bulk soil 14C measurements of 77 mineral topsoil profiles in the International Soil Radiocarbon Database (ISRaD). We find that all five models consistently overestimate the 14C content (Δ14C) of POM by 69 ‰ on average, and two out of the five models also strongly overestimate the Δ14C of MAOM by more than 80 ‰ on average, indicating that the models generally overestimate the turnover rates of SOC and do not adequately represent the long-term stabilization of carbon in soils. These results call for more widespread usage of fraction-specific carbon and 14C measurements for parameter calibration and may even suggest that some new-generation models might need to restructure or further subdivide their simulated carbon pools in order to accurately reproduce SOC dynamics.
- Article
(3010 KB) - Full-text XML
-
Supplement
(9780 KB) - BibTeX
- EndNote


The terrestrial carbon reservoir sequesters an estimated 29 % of anthropogenic CO2 emissions each year (Friedlingstein et al., 2022), significantly reducing the accumulation rate of CO2 in the atmosphere and thus slowing down climate change. However, the future role of the terrestrial carbon reservoir as a net CO2 sink is uncertain, as Earth System Models (ESMs) produce a wide range of projections for the net land–atmosphere carbon flux over the course of the 21st century, partly due to high uncertainties in the carbon–climate feedback (Friedlingstein et al., 2014; Arora et al., 2020). Moreover, a study by He et al. (2016) using the radiocarbon (14C) isotope suggests that some of the most widely used CMIP5 (Coupled Model Intercomparison Project Phase 5) ESMs may be systematically overestimating the future land carbon sink, further casting doubt on the reliability of future land sink predictions. All five ESMs tested in their study strongly underestimated the 14C age of soil organic carbon, which indicates an overestimation of the simulated carbon cycling rates, particularly in the most stable soil carbon pools. After He et al. (2016) adjusted the soil carbon cycling rates to fit the observed 14C data, the ESMs ended up predicting 40±27 % lower carbon sequestration by the terrestrial sink in the 21st century than with their default parameters. This result puts into question the ability of current ESMs to accurately model soil carbon dynamics and highlights the importance of validating model predictions with 14C data.
Almost all ESMs rely on soil organic carbon (SOC) modules that are ultimately based either on the Century model (Parton et al., 1987) (e.g., CESM2, Danabasoglu et al., 2020) or the RothC model (Coleman and Jenkinson, 1996) (e.g., JULES, Clark et al., 2011). Even though Century and RothC have been used for many decades to predict SOC dynamics in various landscapes with moderate success (Leifeld, 2008; Leifeld et al., 2008, 2009; Abramoff et al., 2022; Zhang et al., 2020), both modeling frameworks were developed in the 1980s and thus reflect the comparatively limited understanding of soil carbon cycling of that time. Indeed, the model design of RothC is inspired by the now obsolete humification theory (Lehmann and Kleber, 2015; Schmidt et al., 2011), and neither RothC nor Century explicitly simulate specific processes of SOC cycling, such as physico-chemical protection of SOC or adsorption and desorption of dissolved organic carbon, because their mechanisms were previously not understood well enough.
According to our current understanding, the most important control on SOC stability is not so much the molecular composition or “quality” of organic matter but rather its protection from microbial and abiotic decomposition through occlusion in aggregates and mineral association (Kleber et al., 2011; Dungait et al., 2012; Lehmann and Kleber, 2015; Lavallee et al., 2020). When SOC gets enclosed into aggregates or stabilized by interactions with reactive soil mineral surfaces of pedogenic oxides or phyllosilicates through cation bridging, electrostatic interactions, or the formation of inner- and outer-sphere complexes (Rasmussen et al., 2018a; Rowley et al., 2018; Vogel et al., 2014; Kleber et al., 2015), it becomes less accessible to decomposers and thus significantly increases its persistence in soils (Basile-Doelsch et al., 2020; Schrumpf et al., 2013; Doetterl et al., 2015). A new generation of SOC models is now being developed to incorporate the theory of SOC protection through occlusion and interactions with soil minerals into our carbon cycle predictions. A common feature of new-generation soil models is their distinction between particulate organic matter (POM) and mineral-associated organic matter (MAOM). The POM fraction largely consists of partially decomposed litter fragments smaller than 2 mm (Lavallee et al., 2020; Basile-Doelsch et al., 2020), which may be covered with a thin mineral coating (Wagai et al., 2009). On the other hand, the MAOM fraction contains organic matter chemically adsorbed onto reactive mineral surfaces or stabilized by occlusion or adsorption inside micro-aggregates formed around sand, silt, or clay particles (Basile-Doelsch et al., 2020; Lavallee et al., 2020). Unlike the carbon pools of RothC and Century, the POM and MAOM fractions simulated by new-generation models are designed to be “measurable”: they can be operationally defined with experimental protocols by which they can be separated from soil samples and then analyzed individually for their elemental and isotopic composition (von Lützow et al., 2007). This allows for a closer look into the processes governing soil carbon stabilization and for potentially much larger datasets for model calibration and validation. However, the use of fraction-specific measurements to validate models is still limited, even for new-generation models (Zhang et al., 2021, Table S1 in the Supplement).
The theory that protection and accessibility are the most important controls on SOC stability is strongly supported by 14C studies (Gaudinski et al., 2000; Schrumpf et al., 2013, 2021), which could indicate that new-generation SOC models might perform better with 14C than the traditional SOC models integrated into ESMs. 14C is an effective carbon cycle tracer because it is chemically indistinguishable from the other carbon isotopes and therefore participates in the same carbon exchange mechanisms as the more abundant 12C and 13C isotopes. Over the past century, the atmospheric 14C levels have undergone dramatic changes, most notably as a result of thermonuclear weapons tests in the 1950s and 1960s, which have almost doubled the amount of atmospheric 14CO2 in the Northern Hemisphere (see Fig. 2). As this bomb-derived 14CO2 spreads into the terrestrial carbon reservoirs through photosynthesis and into oceans through air–sea gas exchanges (Graven et al., 2020), the level of enrichment in bomb-derived 14C across different terrestrial and oceanic carbon reservoirs helps to evaluate the speed and magnitude of carbon exchanges with the atmosphere on annual and decadal scales. However, for slower-cycling reservoirs such as deep soils or permafrost, the level of 14C depletion due to radioactive decay (half-life of 5700±30 years; Roberts and Southon, 2007) helps to estimate the time scales of carbon stabilization in those reservoirs on the order of centuries and millennia. 14C is therefore a powerful tool for studying the exchanges and storage of carbon from decadal to millennial time scales. However, new-generation models do not generally implement 14C simulations, and only a handful have systematically assimilated observed 14C data (e.g., Tipping and Rowe, 2019; Braakhekke et al., 2014; Ahrens et al., 2020).
In this study, we use 14C measurements of the organic carbon in the mineral topsoil to evaluate the performance of five new-generation SOC models: CORPSE (Sulman et al., 2014), MEND-new (Wang et al., 2022), Millennial v2 (Abramoff et al., 2022), MIMICS-CN v1.0 (Kyker-Snowman et al., 2020), and SOMic 1.0 (Woolf and Lehmann, 2019). These models were chosen because they are open source, actively developed, and influential in the soil modeling community. Leveraging the measurability of their pools, we compare the predictions of these models with 14C measurements of POM and MAOM in addition to the total soil 14C. This provides a detailed picture of the modeled SOC dynamics and enables us to carry out an in-depth analysis of the performances of the models.
Throughout this paper, we report the 14C content of a given carbon sample as Δ14C, which is the deviation of the sample's 14C 12C ratio from the “modern” standard, corresponding to the pre-industrial atmospheric 14COCO2 ratio (Trumbore et al., 2016).
2.1 Fraction-specific carbon and radiocarbon measurements
We compare model predictions with three types of measured data for the topsoil: (1) the total SOC stocks in the topsoil; (2) the relative mass contributions of POM and MAOM to the total SOC stocks; and (3) the Δ14C of POM, MAOM, and bulk SOC.
For this study, we use the International Soil Radiocarbon Database (ISRaD) (Lawrence et al., 2020) for carbon and 14C measurements of POM and MAOM obtained from soil samples using a combination of density fractionation and ultra-sonication. Density fractionation with ultra-sonication is currently one of the most effective and commonly employed methods for isolating POM and MAOM (Golchin et al., 1994; Griepentrog et al., 2015, 2014; Cerli et al., 2012; von Lützow et al., 2007; Poeplau et al., 2018). This method separates the soil into three “density fractions” – the free light fraction, occluded light fraction, and heavy fraction – in a three-step process:
-
Obtain the free light fraction from the soil sample by density fractionation.
-
In the remaining sample, destroy loosely bound aggregates with ultra-sonication, thus releasing the occluded fraction.
-
Isolate the occluded light fraction from the relatively denser heavy fraction by density fractionation.
The resulting free and occluded light fractions, jointly referred to as the “light fraction”, correspond approximately to the POM, while the heavy fraction is a good proxy for MAOM (Mikutta et al., 2019; Lavallee et al., 2020).
ISRaD provides carbon and 14C data for the bulk soil and the free light, occluded light, and heavy fractions. We directly associate MAOM with the heavy fraction in ISRaD and POM with the light fraction (i.e., the sum of the free and occluded light fractions in ISRaD; see Appendix A1). When the Δ14C of the bulk soil is not measured or reported in ISRaD, we calculate it with a weighted average of the Δ14C of the light and heavy fractions (see Appendix A2). In this study, we evaluate models only for the topsoil, which we strictly define as at least the top 5 cm and at most the top 10 cm of the mineral soil (see Appendix A3 for more details). This way, we can ignore the effect of vertical mixing of soil carbon, which plays a more important role in deeper soil 14C dynamics (Koven et al., 2013; Chen et al., 2019; Braakhekke et al., 2011, 2014), and instead focus more on the effectiveness of the model designs in terms of their simulated carbon pools and biochemical processes. Furthermore, by choosing such a narrow depth interval, we can treat the topsoil as a single homogeneous soil layer, which allows us to also evaluate models which are not vertically resolved and are only intended for topsoil simulations. The current version of ISRaD (v 2.5.5.2023-09-20; International Soil Radiocarbon Database, 2023) contains complete 14C datasets of the light- and heavy-density fractions in the topsoil of 77 soil profiles spread across 39 sampling sites, covering forests, shrubland, cultivated landscapes, and rangeland and grassland. See Appendix A3 for more information on the choice of profiles and Appendix A4 for the derivation of the topsoil carbon and 14C data from layer data. Almost all of the sampling sites are in North America and Europe, and the remaining sites are located in Hawaii and Puerto Rico (see map in Fig. 1). The dataset does not contain any permafrost, thermokarst, peatland, or wetland soils, and 75 of the 77 samples are from the period 1997–2015, with only one sample from 1949 and one sample from 1978. As shown in Fig. 2, most data points bear a positive Δ14C value, demonstrating an enrichment in bomb-derived 14C in the topsoil. See Table S4 in the Supplement for more details on the data and the data sources for the 77 selected soil profiles.
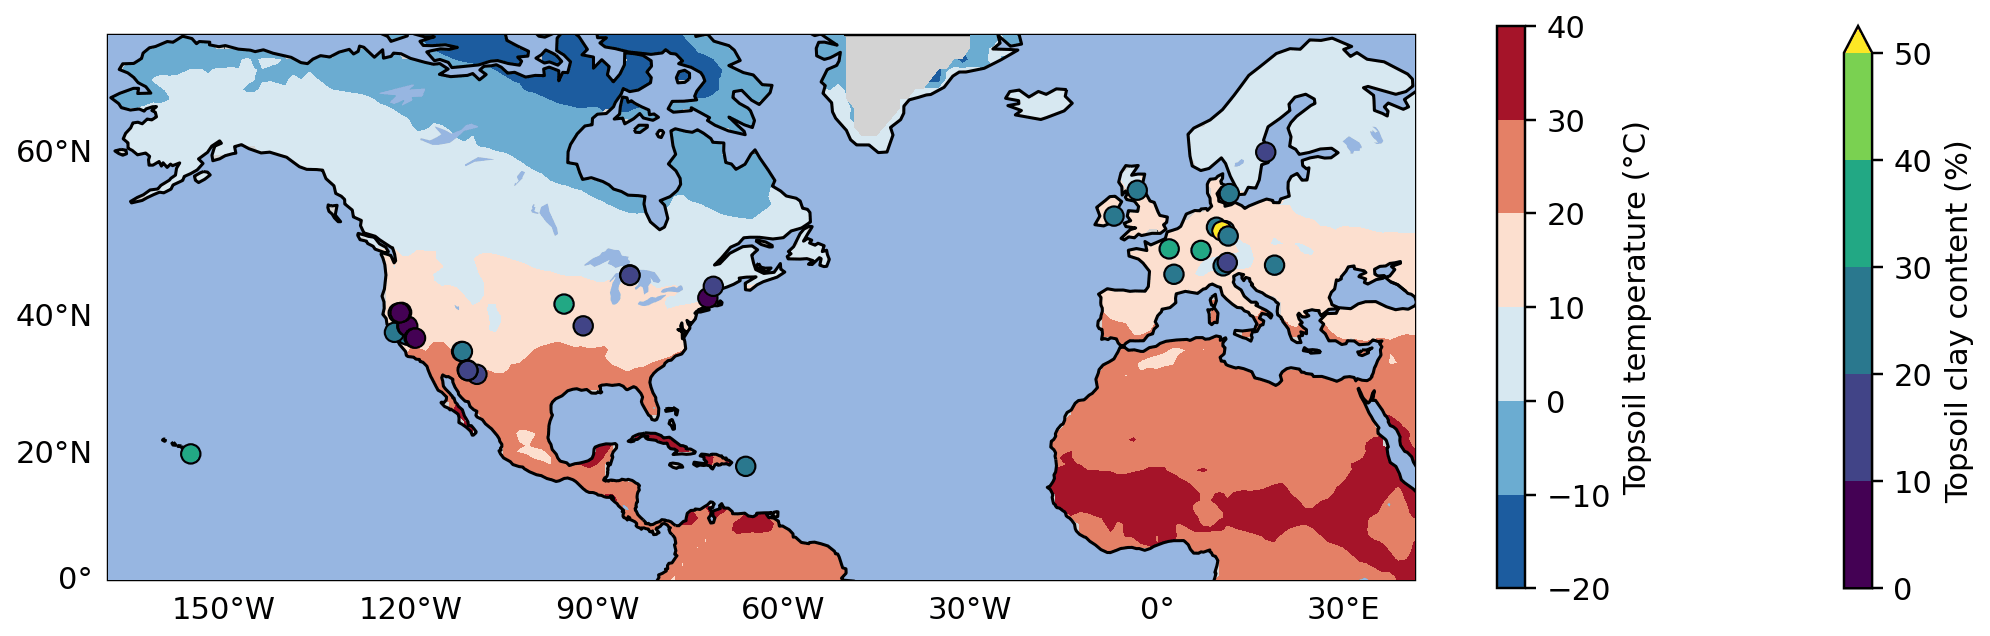
Figure 1Map of selected topsoil sampling sites from ISRaD (Lawrence et al., 2020). Of the 39 sites, 37 are located in North America and Europe, and the 2 remaining sites are in Hawaii and Puerto Rico. All sites have a complete 14C dataset for the bulk soil and density fractions in the top 5 or 10 cm of the mineral soil. The map also shows two of the most important environmental controls on soil carbon persistence: soil temperature (at 4 cm depth, averaged over the 1970–2010 period, at 1° horizontal resolution) from the CESM2 Large Ensemble product (Rodgers et al., 2021) on the map background and clay content in the topsoil from ISRaD or SoilGrids (Poggio et al., 2021) for each sampling site.
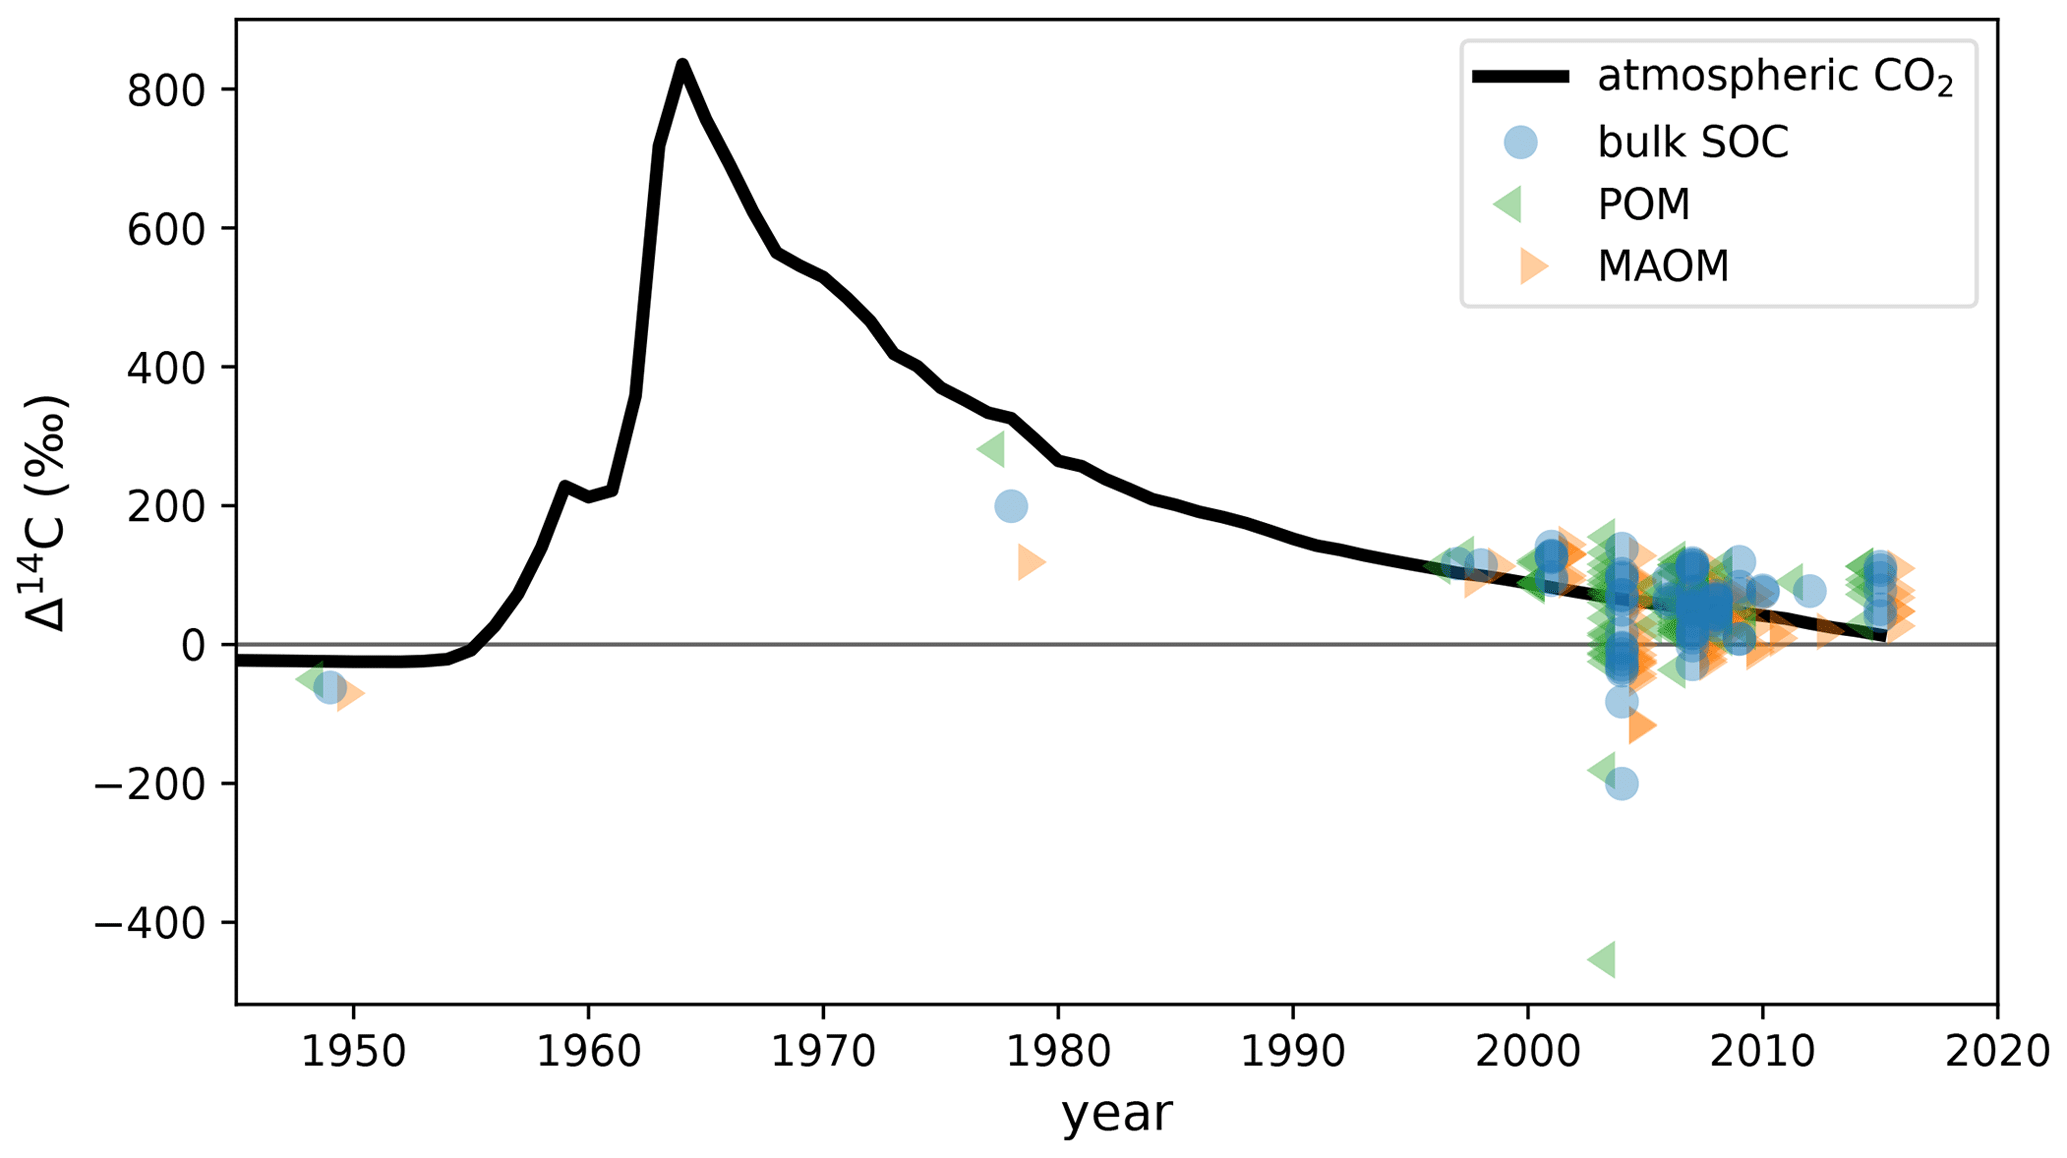
Figure 2Measured Δ14C data of the POM and MAOM density fractions and total soil organic carbon (bulk SOC) at the selected topsoil profiles from ISRaD (Lawrence et al., 2020) overlaid on the atmospheric Δ14CO2 curve of the Northern Hemisphere (Graven et al., 2017). All POM and MAOM fractions shown here were produced using the method of density fractionation with ultra-sonication. These ISRaD data were originally published in Baisden et al. (2002), Berhe et al. (2012), Harden et al. (2002), Heckman (2010), Heckman et al. (2018), Lybrand et al. (2017), Marín-Spiotta et al. (2008), McFarlane et al. (2013), Meyer et al. (2012), Rasmussen et al. (2018b), and Schrumpf et al. (2013).
2.2 Selection of new-generation models
We reviewed the literature to find new-generation models whose pools are fully compatible with the POM–MAOM distinction and that are capable of running global simulations (i.e., their parameter values depend on the environmental conditions and are not just optimized for a few specific sites). Table 1 gives an overview of the features and capabilities of such new-generation models, almost all of which have been developed starting in the 2010s. Many new-generation SOC models also explicitly represent the microbial biomass as a separate carbon pool, since microbes are the main drivers of SOC turnover (Crowther et al., 2019; Basile-Doelsch et al., 2020; Schimel, 2023). The newest version of the MEND model simulates a variety of microbial exo-enzyme pools in addition to its microbial biomass pools (Wang et al., 2022). About half of the models listed in Table 1 already implement 14C simulations. However, none of them have systematically assimilated fraction-specific 14C data, instead relying on 14C data of bulk SOC or 14CO2 data from soil respiration.
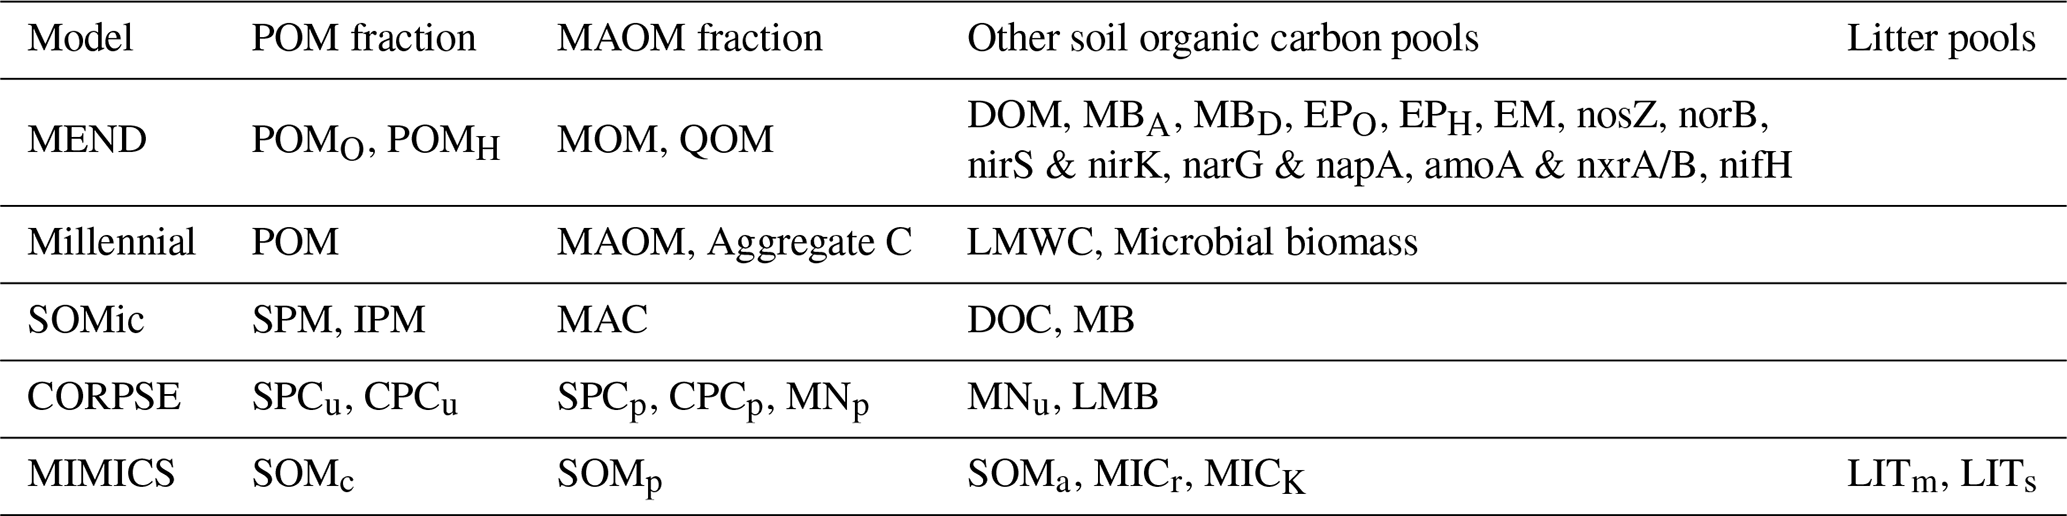
Table 1Summary of features and capabilities of new-generation models. All of the listed models are compatible with the distinction between POM and MAOM and are capable of running global simulations. The models selected for evaluation with 14C in this study are indicated with an asterisk (∗). The first two columns are the year of the first publication and, if applicable, the year of the latest published revision of each model at the time of writing. The “Open source”, “Implements 14C”, and “Explicitly models” columns are checkmarked if at least one version of the model has open-source code, implements 14C simulations, or explicitly models a specified pool or feature, respectively. In the “Vertical mixing” column, models with a downward arrow (↓) simulate any kind of downward transport or leaching for at least one of their pools, often in dissolved form, and sometimes using an advection equation. Models featuring an up–down arrow (↕) additionally implement vertical mixing with a diffusion equation for at least one of their pools. DOM signifies dissolved organic matter.
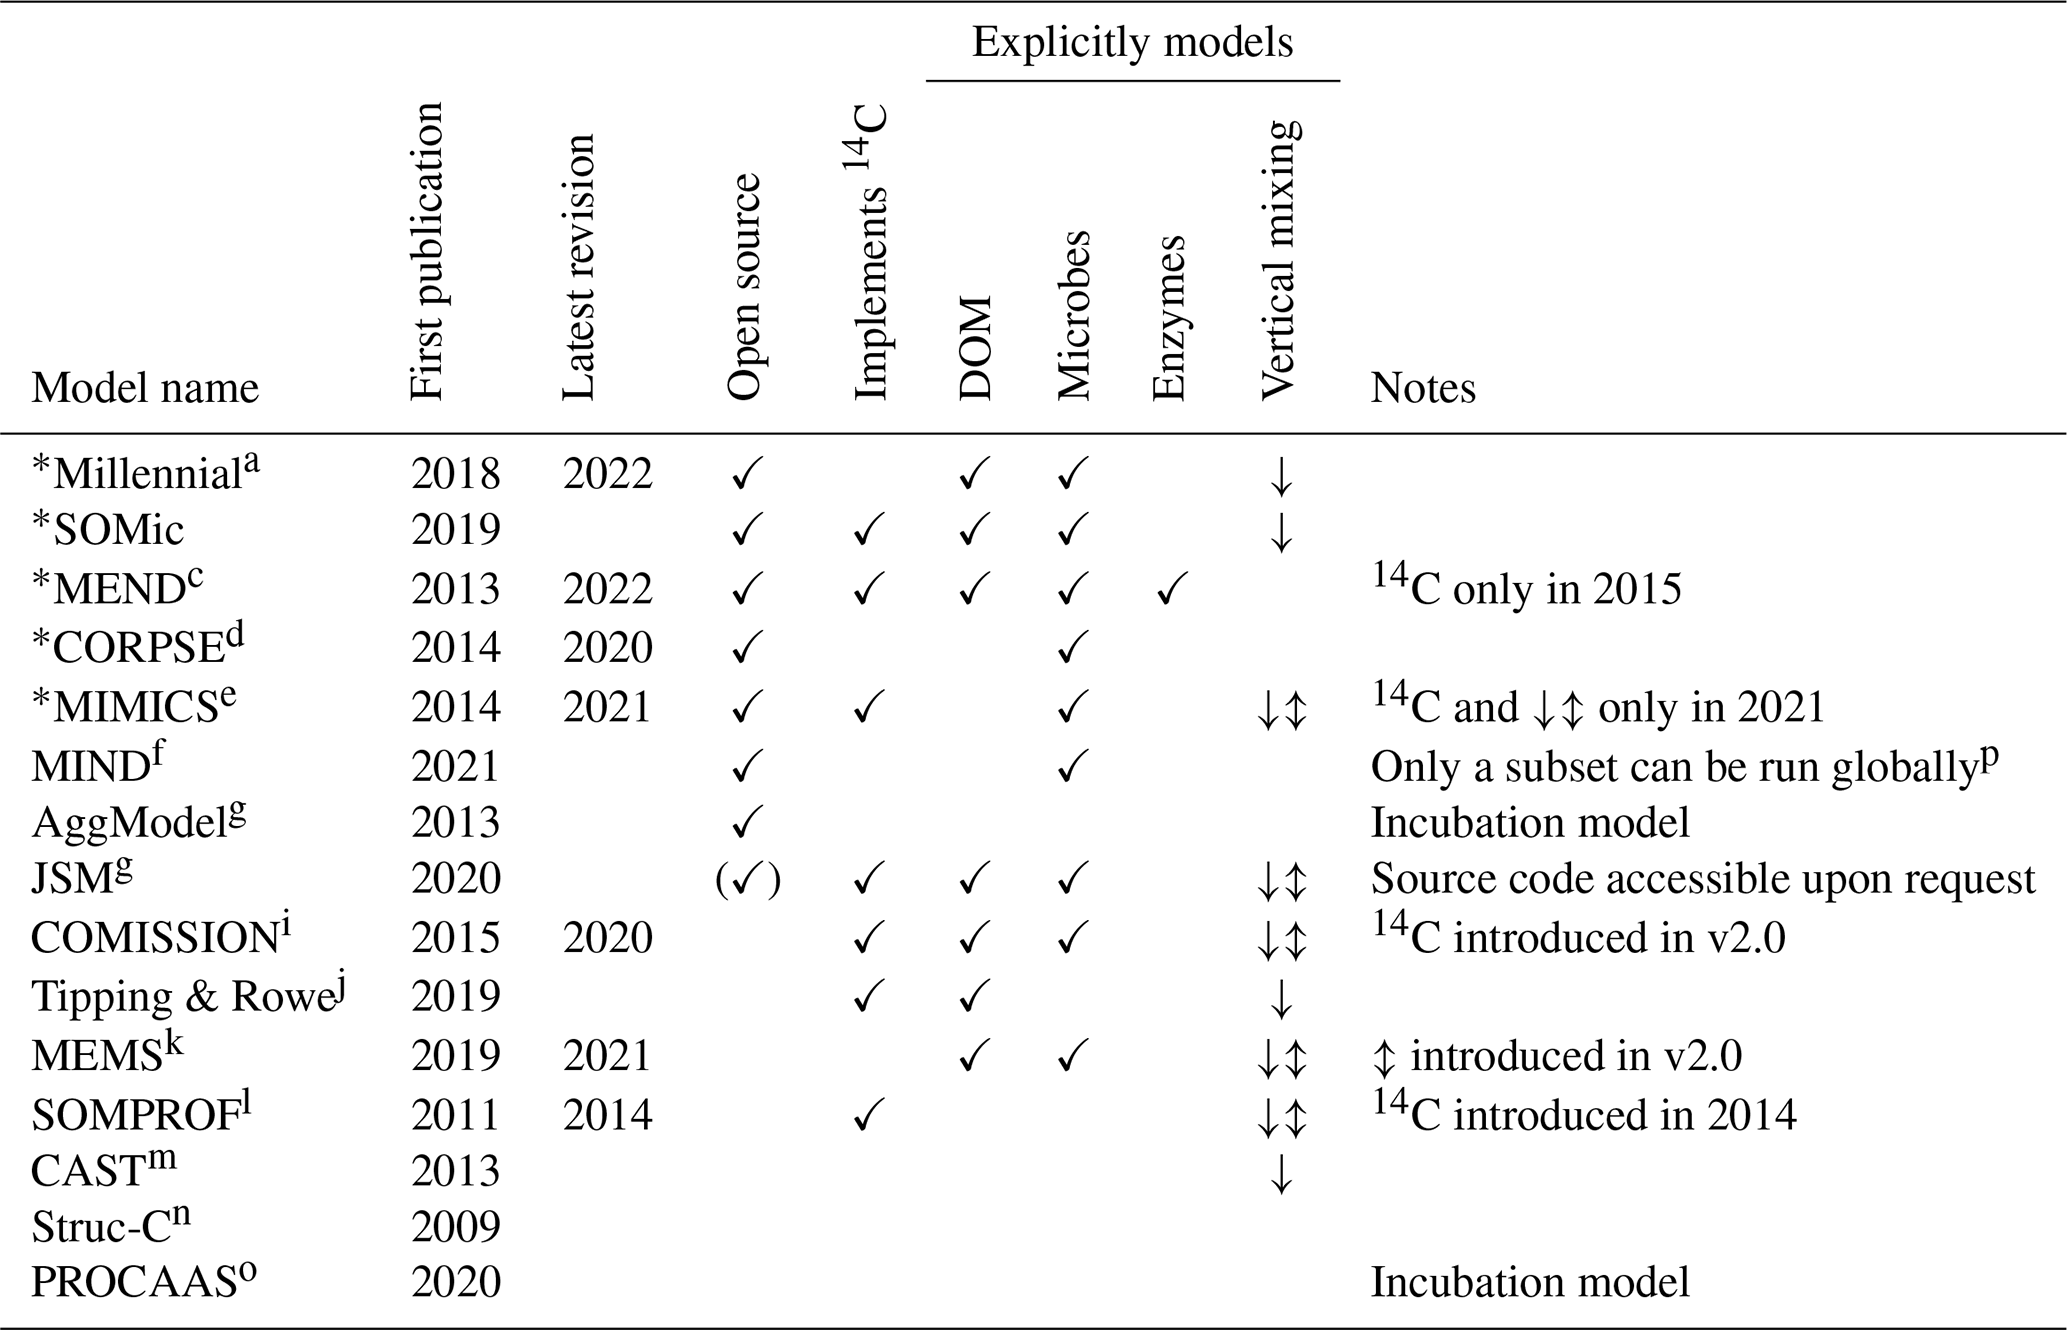
a Abramoff et al. (2018, 2022). b Woolf and Lehmann (2019). c Wang et al. (2013, 2015, 2022). d Sulman et al. (2014, 2017); Salazar et al. (2018); Hicks Pries et al. (2018); Moore et al. (2020). e Wieder et al. (2014, 2015); Zhang et al. (2020); Kyker-Snowman et al. (2020); Wang et al. (2021). f Fan et al. (2021). g Segoli et al. (2013). h Yu et al. (2020). i Ahrens et al. (2015, 2020). j Tipping and Rowe (2019). k Robertson et al. (2019); Zhang et al. (2021). l Braakhekke et al. (2011, 2013, 2014). m Stamati et al. (2013). n Malamoud et al. (2009). o Liu et al. (2020). p Only the microbial necromass pools of MIND were run globally; some of the parameters (e.g., and KM,P) necessary to run the live microbial biomass and plant-derived carbon pools do not have fitted values outside of four experimental test cases.
For this 14C study, we chose to evaluate the following models, as they are open source and still actively developed:
-
Millennial v2 (with Michaelis–Menten kinetics), (Abramoff et al., 2022),
-
SOMic 1.0 (Woolf and Lehmann, 2019),
-
MEND-new (with default equations) (Wang et al., 2022),
-
CORPSE-fire-response (as implemented in Sulman, 2024a), (Sulman et al., 2014),
-
MIMICS-CN v1.0 (Kyker-Snowman et al., 2020).
Figure 3 shows the general structure of the above models. All the selected models have pools which can be associated with the POM and MAOM fractions (see Appendix C for details on how we associate the pools with each fraction), and they all have at least one microbial biomass pool. We generally chose to evaluate the most recent version of each model. However, we found an error in the 14C implementation of the most recent version of MIMICS (Wang et al., 2021) (see Appendix E2), and thus we chose to use the coupled carbon–nitrogen version MIMICS-CN published 1 year earlier in Kyker-Snowman et al. (2020). See Appendix B and Figs. C1–C5 for more details on the exact versions and implementations of each model. Appendix D explains how we re-implemented the models to produce 14C predictions.
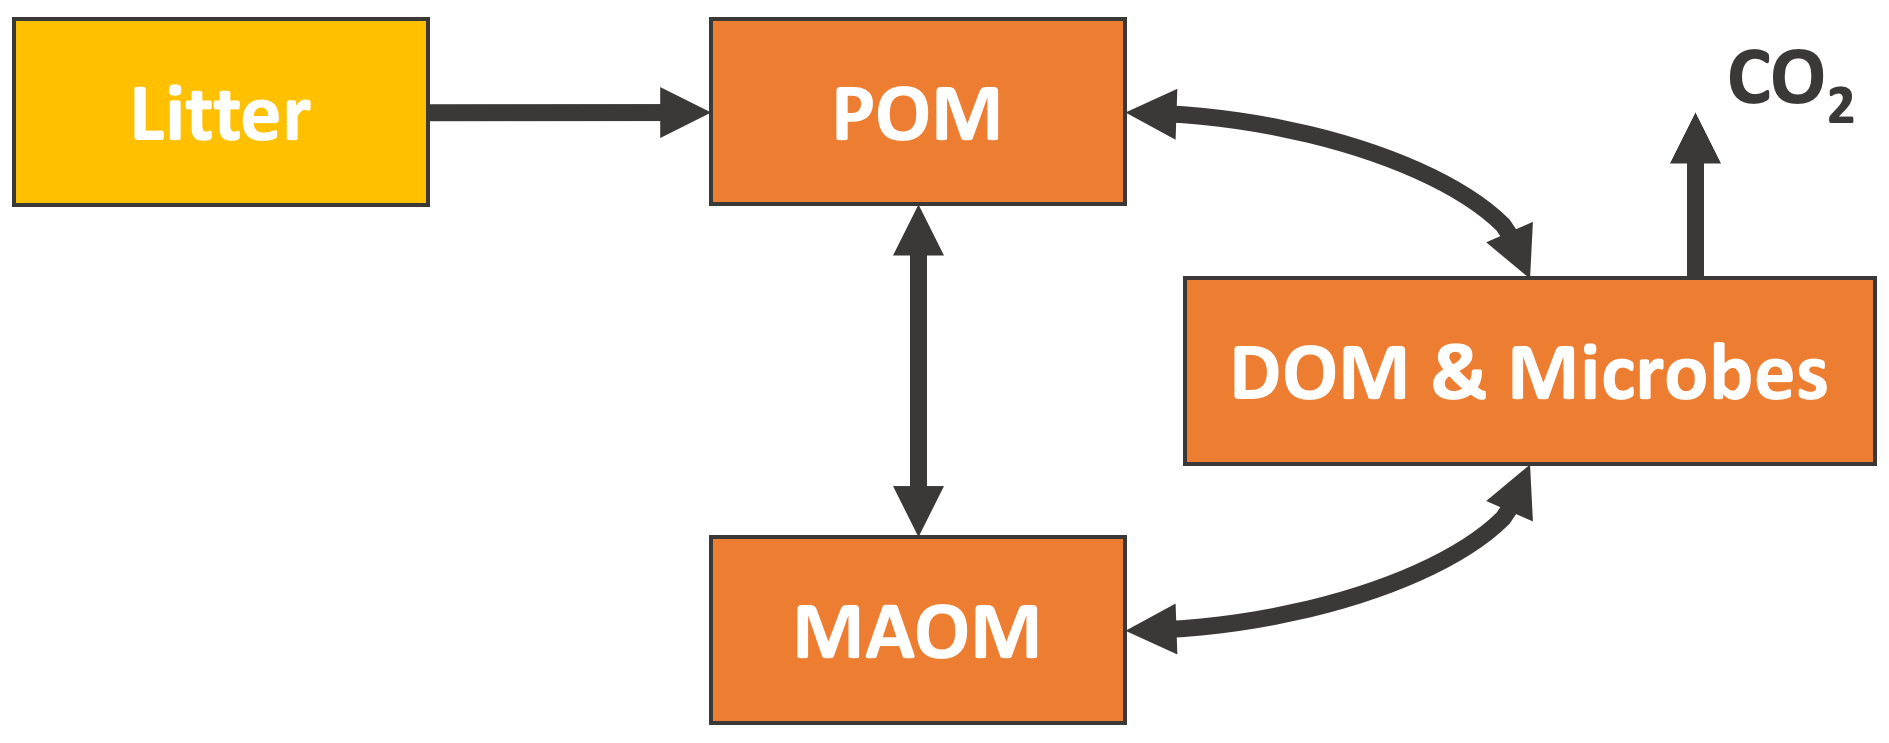
Figure 3General structure of the new-generation models chosen for this study. The MIMICS and CORPSE models additionally feature a CO2 flux leaving MAOM and POM, which depends on the carbon use efficiency of the microbes. The SOMic and CORPSE models do not allow any flux from the DOM, microbes, or MAOM back into the POM. More detailed diagrams for the MEND, Millennial, SOMic, CORPSE, and MIMICS models are shown in Figs. C1–C5. Abbreviations: POM, particulate organic matter; MAOM, mineral-associated organic matter; DOM, dissolved organic matter.
2.3 Model input data
For each measurement site, the models are run for the topsoil with local environmental forcing data from 1850 to 2014. The initial conditions in 1850 are found by spinning up the models and looping over a “pre-industrial” year, where the forcing data are averaged over the 1850–1879 period, until the system reaches equilibrium, i.e., does not experience any significant inter-annual variability. In practice, the carbon–nitrogen component of the MEND model is spun up from its default initial condition for 400 years and its 14C component for 1000 years, the SOMic model is spun up for 50 000 years, and the remaining three models are spun up for 200 years from their pre-industrial steady-state solution. More details on the spinup methods for each model are given in Appendix B.
The selected models require a number of constant and time-dependent forcing data to be run at each study site. We assume that soil properties such as sand, clay, and silt content; soil density; and land use are time-invariant since pre-industrial times. Where these site-specific soil properties are not reported in ISRaD, they are taken from the SoilGrids database (Poggio et al., 2021), accessed with the soilgrids Python package v0.1.4 (Gan, 2023). The MIMICS model also requires the lignin content of litter inputs, which we set to be a constant value depending only on the land use type. We assume that the lignin content is 25 % for forest litter and 7 % for shrubland litter (Rahman et al., 2013; Table 1). For grassland and cultivated landscapes, we assume a lignin content of 9 % based on measurements of grasses at the seeding stage (Armstrong et al., 1950; Table 1). Weather-dependent and other dynamic environmental properties, such as soil temperature and 14C influx, are taken from global model predictions with monthly time resolution. We use the monthly averaged CESM2 Large Ensemble (CESM2-LE) product (IBS Center for Climate Physics et al., 2021; Rodgers et al., 2021) for vertically resolved soil temperature and moisture, above- and below-ground net primary production (NPP), total gross primary productivity (GPP), litterfall and litter heterotrophic respiration, and the carbon-to-nitrogen ratio and Δ14C of total litter carbon from 1850 to 2014 with 1° spatial resolution. Since the below-ground NPP from the CESM2-LE output is not vertically resolved, we derive the topsoil portion of the below-ground NPP using the exponential function model from Xiao et al. (2023). For nitrogen deposition rates, we use monthly data simulated by the NCAR Chemistry–Climate Model Initiative (CCMI) on a 0.5° grid from 1860 to 2016 (Tian et al., 2018) downloaded from the ISIMIP Repository (ISIMIP, 2024; Rosenzweig et al., 2017). We extend these data back to 1850 by setting the monthly nitrogen deposition rates for the 1850–1860 period to be equal to the average monthly rates over the 1860–1870 period.
Since none of the selected soil models represent lateral carbon transport or upward vertical mixing of soil carbon, the simulated topsoil systems receive all of their carbon exclusively from vegetation inputs. We can therefore estimate the Δ14C of the carbon influx into the soil with the Δ14C of litter from the CESM2-LE product. These litter Δ14C data account for the pre-aging of carbon in vegetation (Herrera-Ramírez et al., 2020; Solly et al., 2018) because the litter carbon first passes through the vegetation pools in the land module of CESM2 (CLM5; Lawrence et al., 2019). For Millennial, CORPSE, and MIMICS, we estimate the carbon influx into the soil with the topsoil NPP, setting the slightly negative NPP values in the CESM2-LE output to 0. In the case of the MEND model, we use total GPP instead of NPP as a model input, as prescribed by the developers of MEND (Wang, 2024). SOMic is the only model to require the use of litter inputs instead of NPP or GPP as a model input. Following the example of the global simulations performed in the original publication of SOMic (Woolf and Lehmann, 2019), we estimate litter inputs as the annual average of litterfall minus litter heterotrophic respiration, setting litter inputs to 0 in the rare instances where annual litterfall is less than annual litter heterotrophic respiration. We derive the topsoil portion of litter inputs assuming they have the same vertical distribution as NPP.
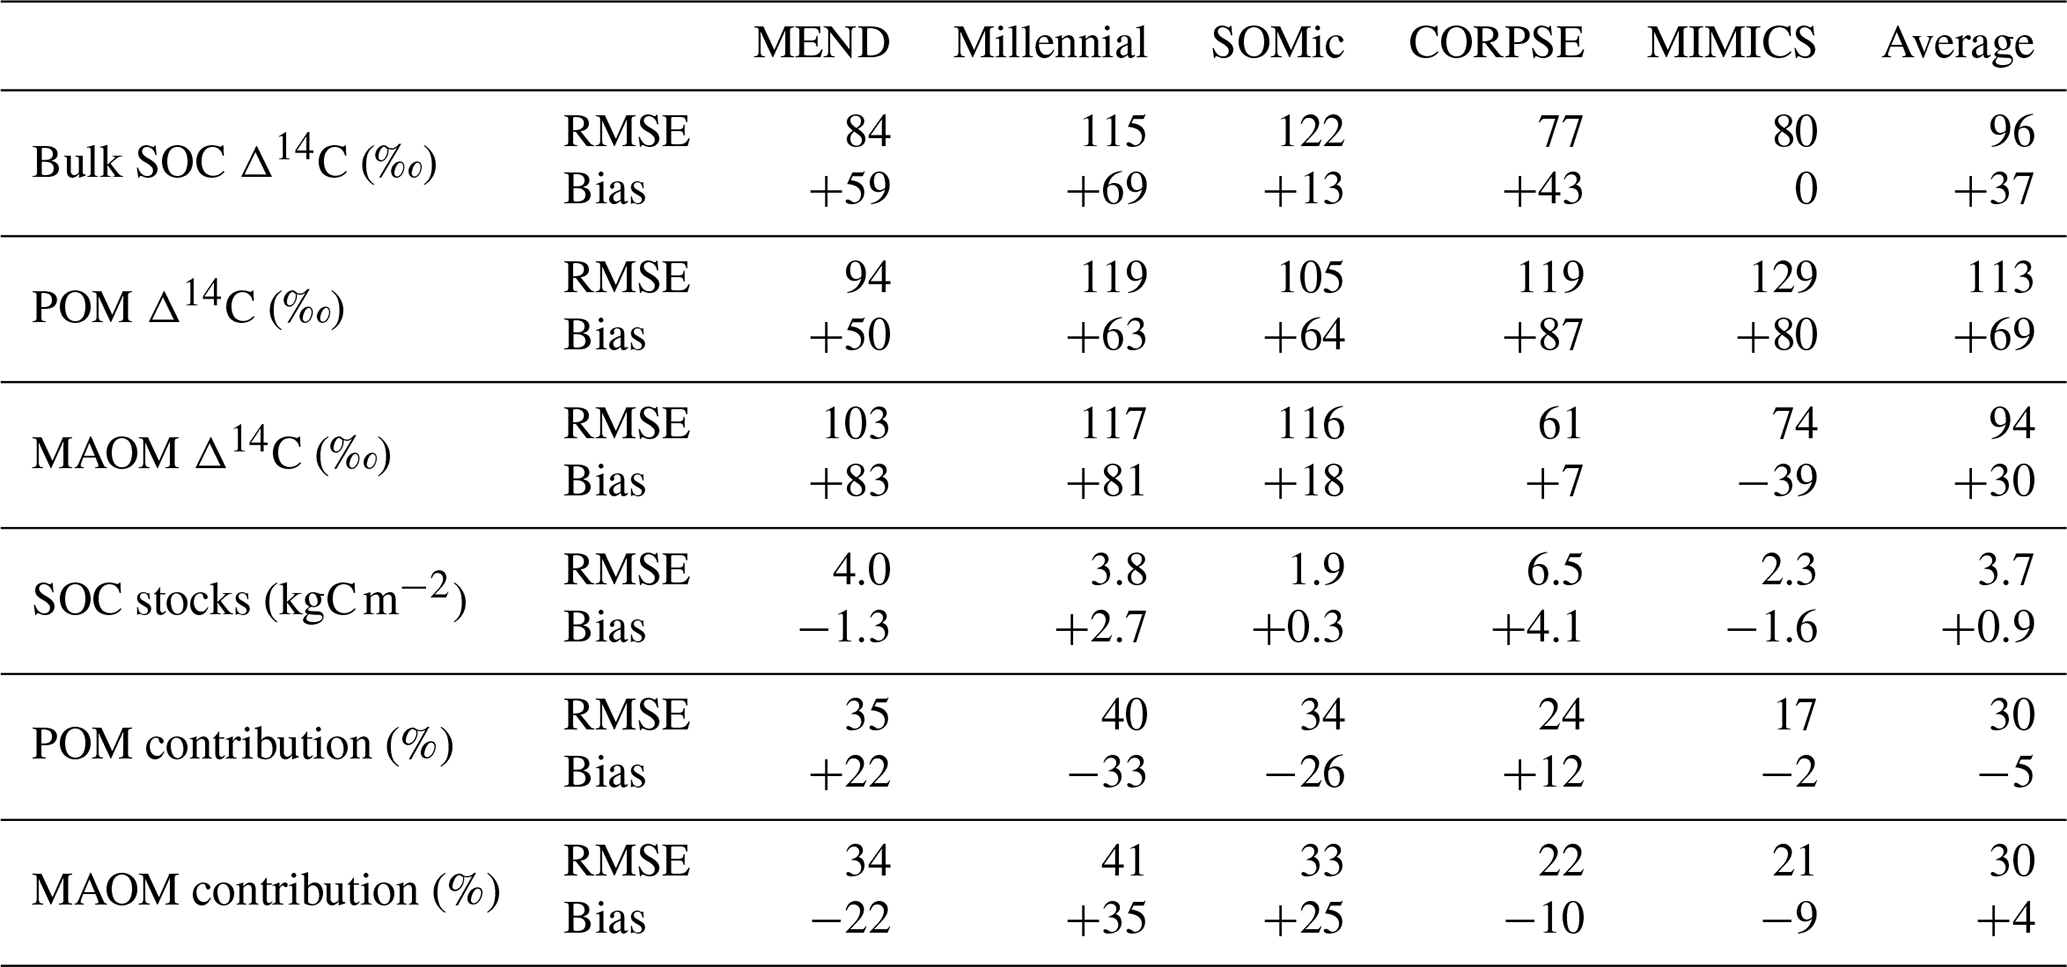
We produced carbon and 14C predictions with the MEND, Millennial, SOMic, CORPSE, and MIMICS models for the 77 selected soil profiles and compared them with the observed carbon and 14C data from ISRaD. Our main performance metrics are the root mean square error (RMSE) and mean bias of the predictions with respect to the observational datasets described in Sect. 2.1. Table 2 gives a summary of the model performances. Detailed tables of the results and plots of predictions against observations for each variable and each model can be found in the Supplement (Tables S3 and S5 and Fig. S3). Note that the MEND model failed to run on 9 of the 77 selected soil profiles due to some numerical instability and was unable to produce 14C data for 6 other profiles. Note also that the SOC stocks are not available for 17 of the 77 selected profiles.
Table 2Root mean square error (RMSE) and mean bias for each model with respect to each dataset. In the case of the MEND model, the RMSE and bias were calculated based on results of n=62 profiles for the Δ14C rows, n=55 for the SOC stocks, and n=68 for the rows of POM and MAOM contributions. For all other models, n=77 for all rows, except SOC stocks, where n=60.
3.1 Carbon stocks and partitioning between pools
While the Millennial and CORPSE models tend to overestimate the topsoil SOC stocks of the selected soil profiles, MEND and MIMICS generally underestimate the SOC stocks (Fig. 4a). The SOMic model, which is the only model to estimate carbon inputs into soils with litter inputs instead of primary productivity, produces the best predictions for the topsoil SOC stocks, with a positive mean bias of only 0.3 kgC m−2 (+13 % relative to the observational mean) and an RMSE of 1.9 kgC m−2.
With the exception of the MIMICS model, the new-generation models generally fail to simulate the full range of variability in the observations of SOC partitioning between POM and MAOM (Fig. 4b–c). The Millennial model's partitioning is nearly fixed around 8 % POM and 92 % MAOM for all sites, never deviating more than 1.5 percentage points from those values. The CORPSE and MIMICS models produce the best predictions of POM and MAOM contributions to the total SOC stocks. They follow the one-to-one line of model predictions versus observations much better than the other models (see Figs. S3.2 and S3.4 in the Supplement), and they both have an RMSE of around 20 percentage points and a bias of around 10 points or less in magnitude (Table 2). By comparison, the MEND, Millennial, and SOMic models have an average RMSE of 36 points and an average absolute bias of 27 points in their predictions of POM and MAOM contributions (Table 2).
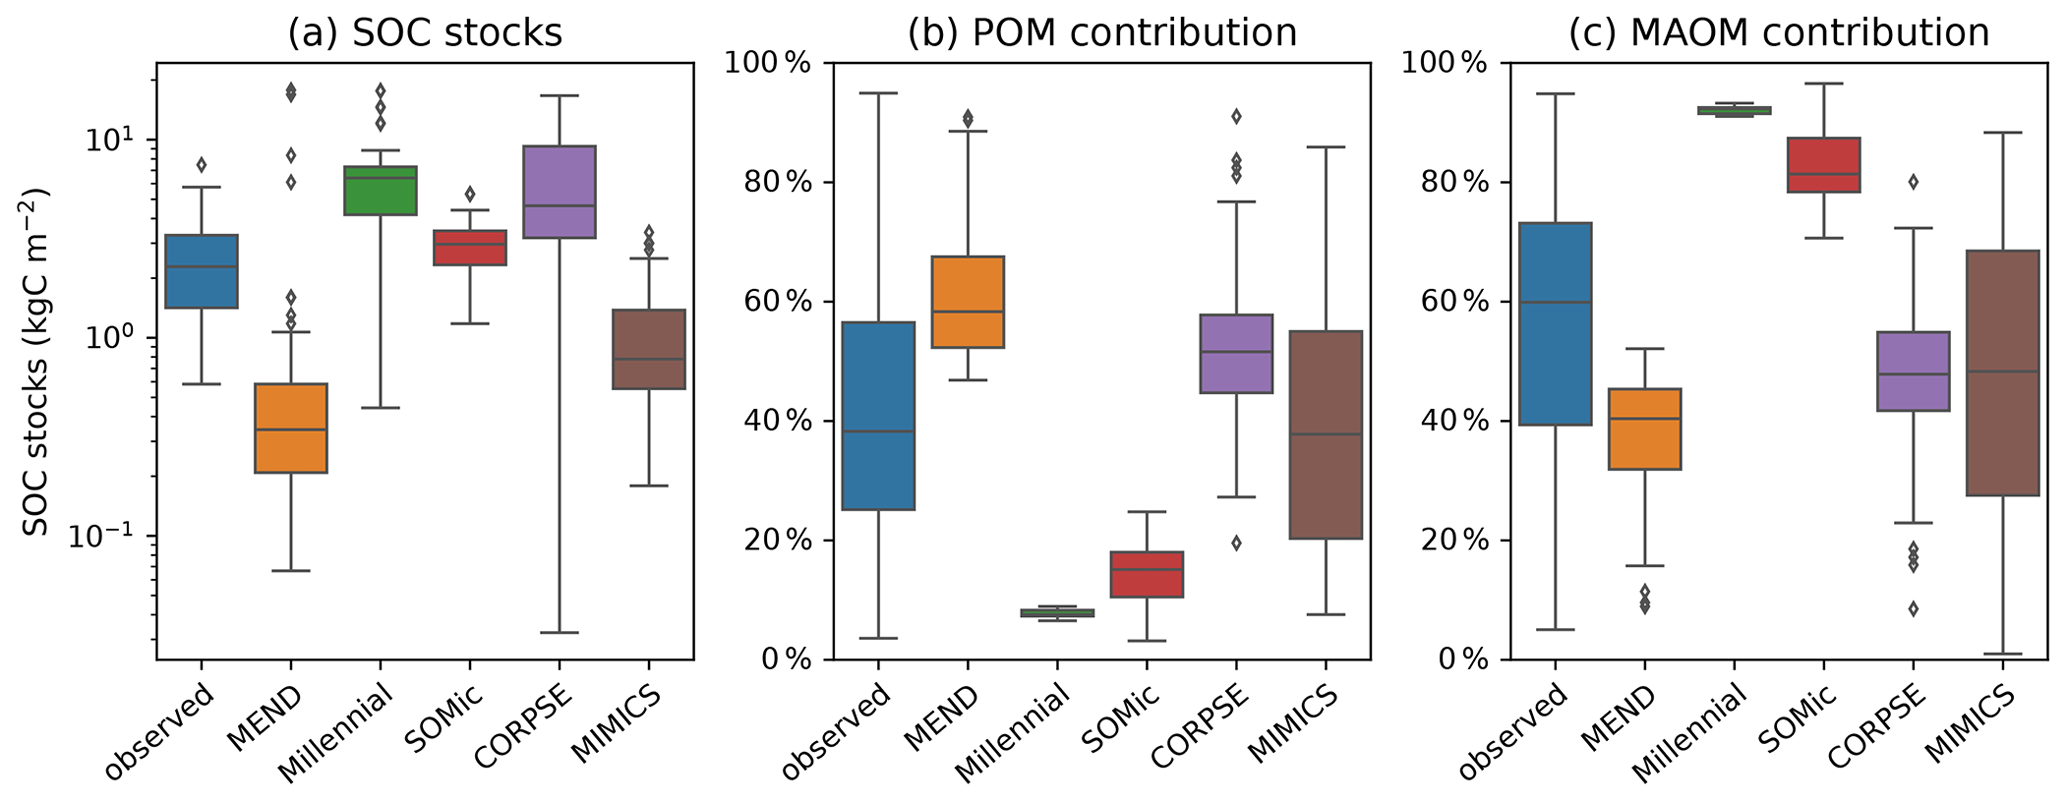
Figure 4Observed and modeled SOC stocks in the topsoil (top 5 or 10 cm of mineral soil) plotted on a log-transformed axis in panel (a) and contributions of the POM and MAOM fractions to the topsoil SOC stocks in panels (b) and (c), respectively. Black diamonds are outliers. In panel (a), n=60 for the boxplot of observed data, n=68 for MEND, and n=77 for all other models. In panels (b) and (c), n=77 for all boxplots, except for MEND, where n=68.
3.2 Performance with 14C
With the notable exception of MIMICS, the new-generation models consistently overestimate the Δ14C of bulk SOC, and their 14C predictions do not capture the full variability of the observations (Fig. 5a). This is reminiscent of the ESMs' 14C predictions from He et al. (2016), which also overestimate the Δ14C of SOC and underestimate its variability but to a different extent and over a larger depth interval (top 1 m instead of the top 5 or 10 cm of the mineral soil). Our results could therefore suggest that the new generation of soil models may be facing similar problems to those experienced by the traditional SOC models incorporated into ESMs.
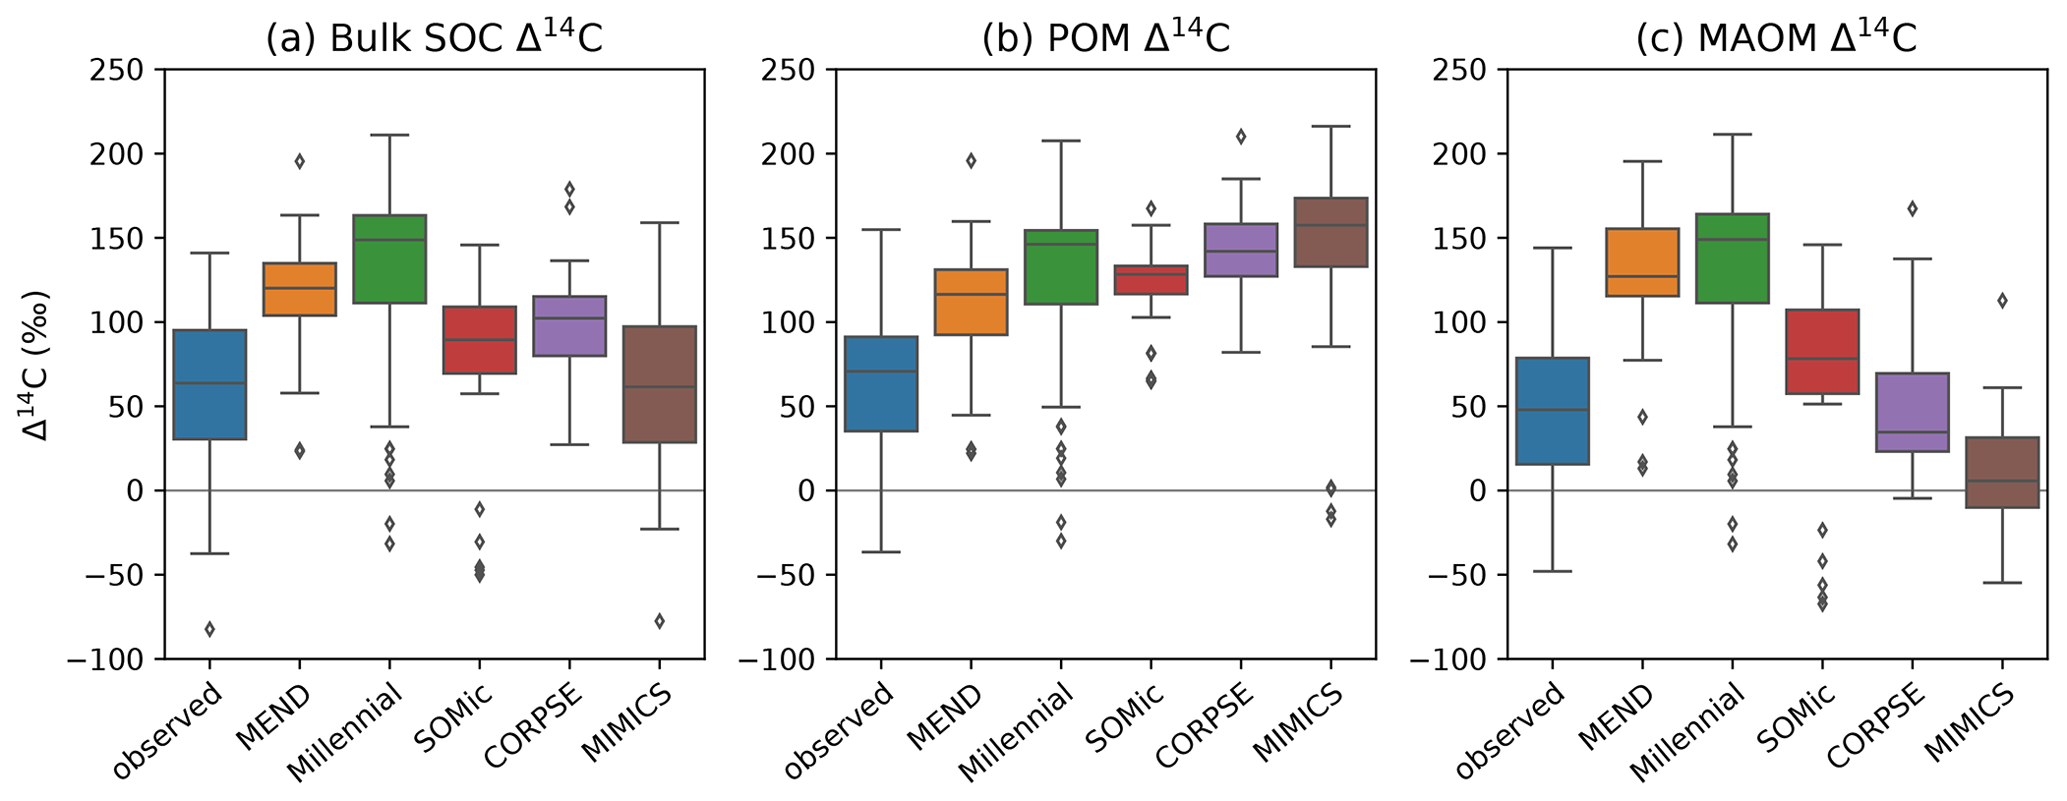
Figure 5Observed and modeled Δ14C of bulk SOC (a), POM (b), and MAOM (c) in the topsoil (top 5 or 10 cm of mineral soil). Black diamonds are outliers. Note that some extreme outliers are outside of the plotting range. To have a uniform and consistent 14C dataset, we excluded the 1949 and 1978 samples so that we end up with more compact data spanning only 18 years at the tail end of the bomb spike. Therefore, n=75 for all boxplots, except for MEND, where n=60.
The pool-specific 14C results, shown in Fig. 5b–c, shed a more critical light on the performance of MIMICS with the Δ14C of bulk SOC. MIMICS overestimates the Δ14C of POM by 80 ‰ and underestimates the Δ14C of MAOM by around 40 ‰ on average, and these biases happen to cancel out in such a way that MIMICS produces very good predictions for the Δ14C of bulk SOC with an RMSE of just 80 ‰ and no bias – the best performance among the evaluated models (Table 2). All five models overestimate the Δ14C of POM, with an average positive bias of 69 ‰, and MEND and Millennial also strongly overestimate the Δ14C of MAOM by more than 80 ‰. CORPSE is good at predicting the Δ14C of MAOM with effectively no bias, but its POM Δ14C predictions have the largest bias (+87 ‰) among all the models. On average, the evaluated models have a positive bias between 37 ‰ and 69 ‰ and an RMSE of around 100 ‰ in their Δ14C predictions for POM, MAOM, and bulk SOC (see Table 2 for more details).
The models produce contrasting predictions for the evolution of soil 14C over the second half of the 20th century. In Fig. 6, we can see in a representative example of the model biases that the CORPSE, SOMic, and MIMICS models produce very distinct 14C dynamics for POM and MAOM, with POM having a predicted Δ14C at least 200 ‰ higher than MAOM in the 1980s. On the other hand, the Δ14C curves of MAOM and POM predicted by the MEND and Millennial models remain very close to each other throughout the post-bomb period. This is because Millennial and MEND have faster turnover rates than the other models, and their pools rapidly exchange carbon between themselves, thus homogenizing the 14C signal across their simulated soil fractions (see Appendix F for more details on the turnover rates in Millennial, which are particularly fast).
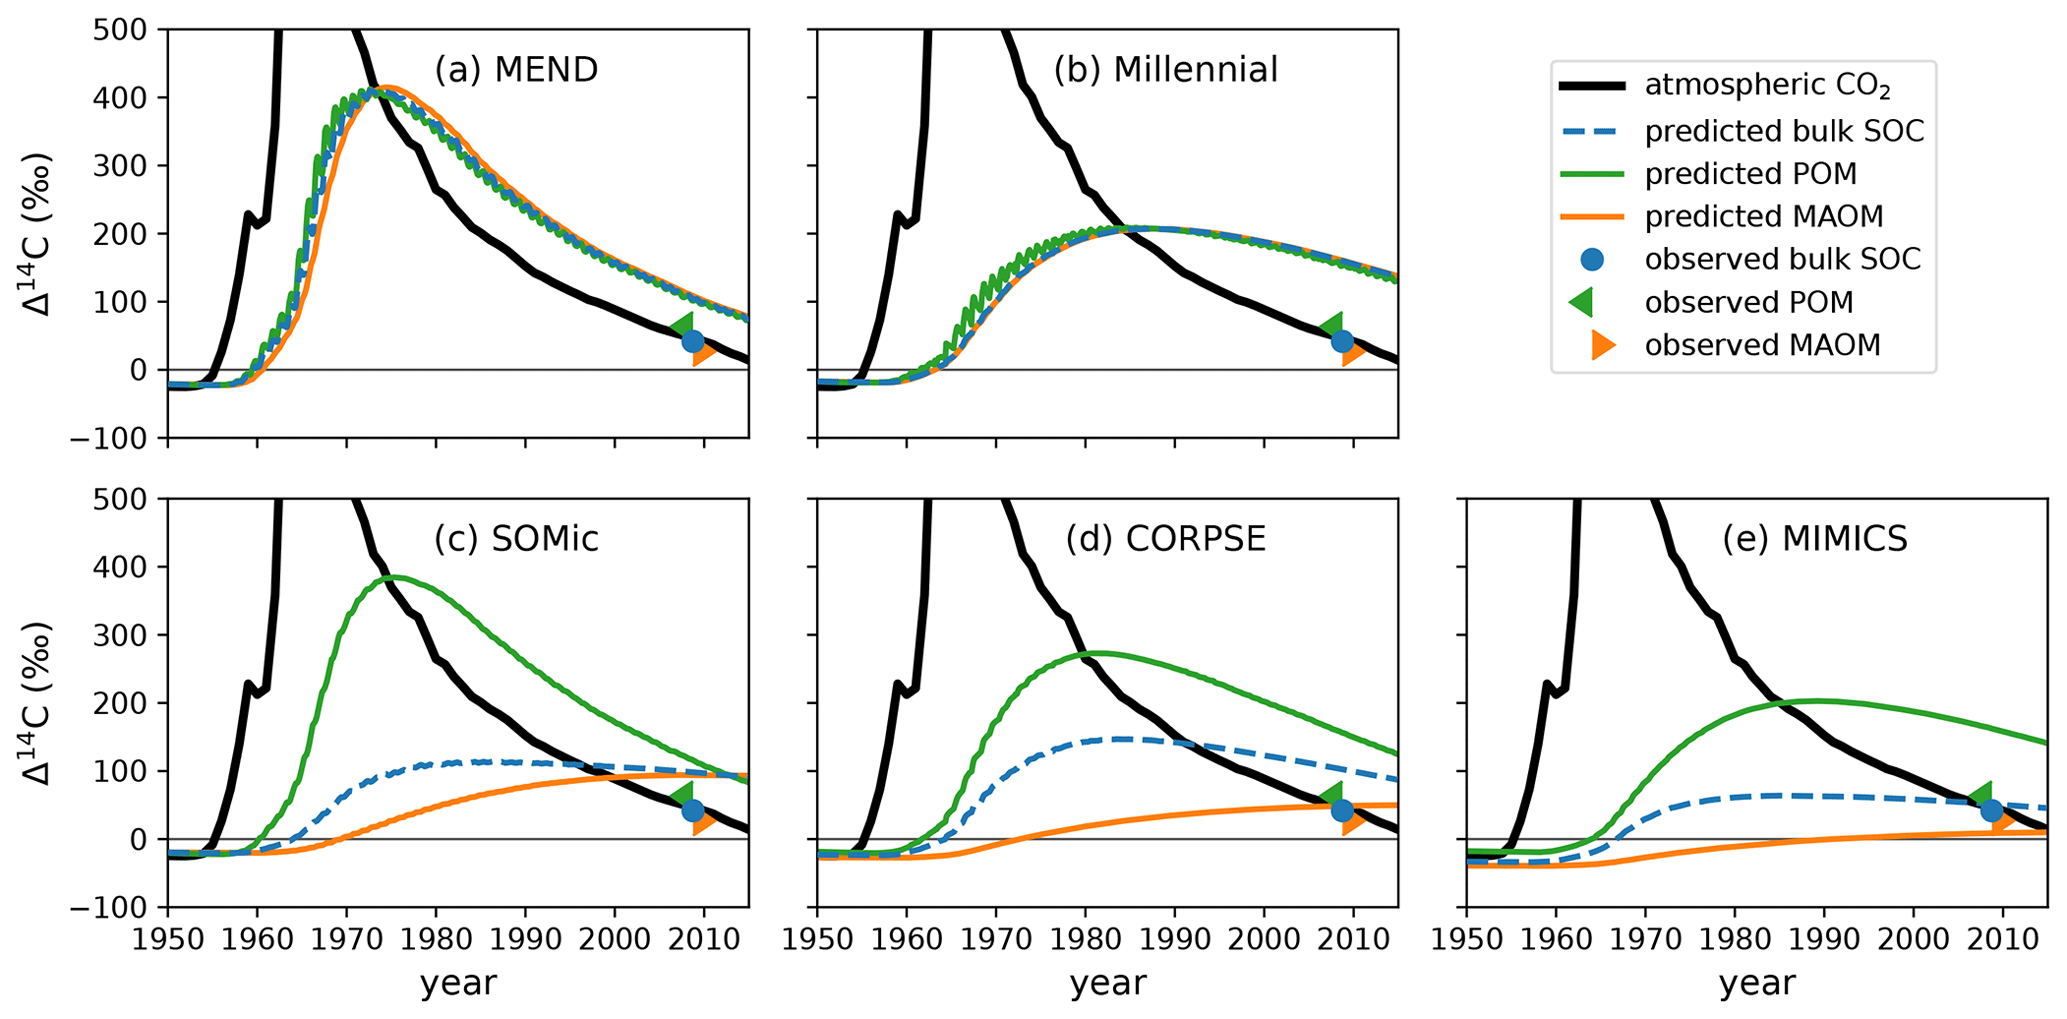
Figure 6Observed and predicted Δ14C of POM, MAOM, and bulk SOC in the top 10 cm of the mineral soil of an abandoned alpine grassland in the Stubai Valley, Austria. The observed 14C data from 2008 are published in Meyer et al. (2012), where the “observed POM” and “observed MAOM” data come from light- and heavy-density fraction measurements, respectively. The atmospheric Δ14CO2 of the Northern Hemisphere (Graven et al., 2017) is shown for reference. With SOMic, CORPSE, and MIMICS, the predicted Δ14C of POM is distinct from the predicted Δ14C of MAOM. On the other hand, the POM and MAOM fractions in MEND and Millennial have very similar Δ14C throughout the bomb-spike period. Plots of the predicted and observed Δ14C of all the other profiles are provided in the Supplement (Fig. S2).
3.3 Role of environmental parameters
We further investigate how simulations depend on soil temperature and clay content, as these are considered some of the most important factors controlling SOC turnover and persistence (Basile-Doelsch et al., 2020; Leifeld et al., 2009).
Higher soil temperatures enhance microbial activity and generally increase the turnover rate of carbon in soils (German et al., 2012; Leifeld et al., 2009; Sierra et al., 2015). While the observed SOC stocks and POM and MAOM contributions are not correlated with temperature (Fig. 7a–c), the observed Δ14C data of POM, MAOM, and bulk SOC significantly increase with higher temperature (Fig. 7d–f). By contrast, the Δ14C predictions for POM, MAOM, and bulk SOC are either uncorrelated or negatively correlated with soil temperature. All of the selected models modify carbon decomposition rates with a temperature-dependent scaling factor (Abramoff et al., 2022; Woolf and Lehmann, 2019; Kyker-Snowman et al., 2020; Wang et al., 2022; Sulman et al., 2014), but these results could indicate that they may need to increase or change the effect of temperature on carbon turnover rates.
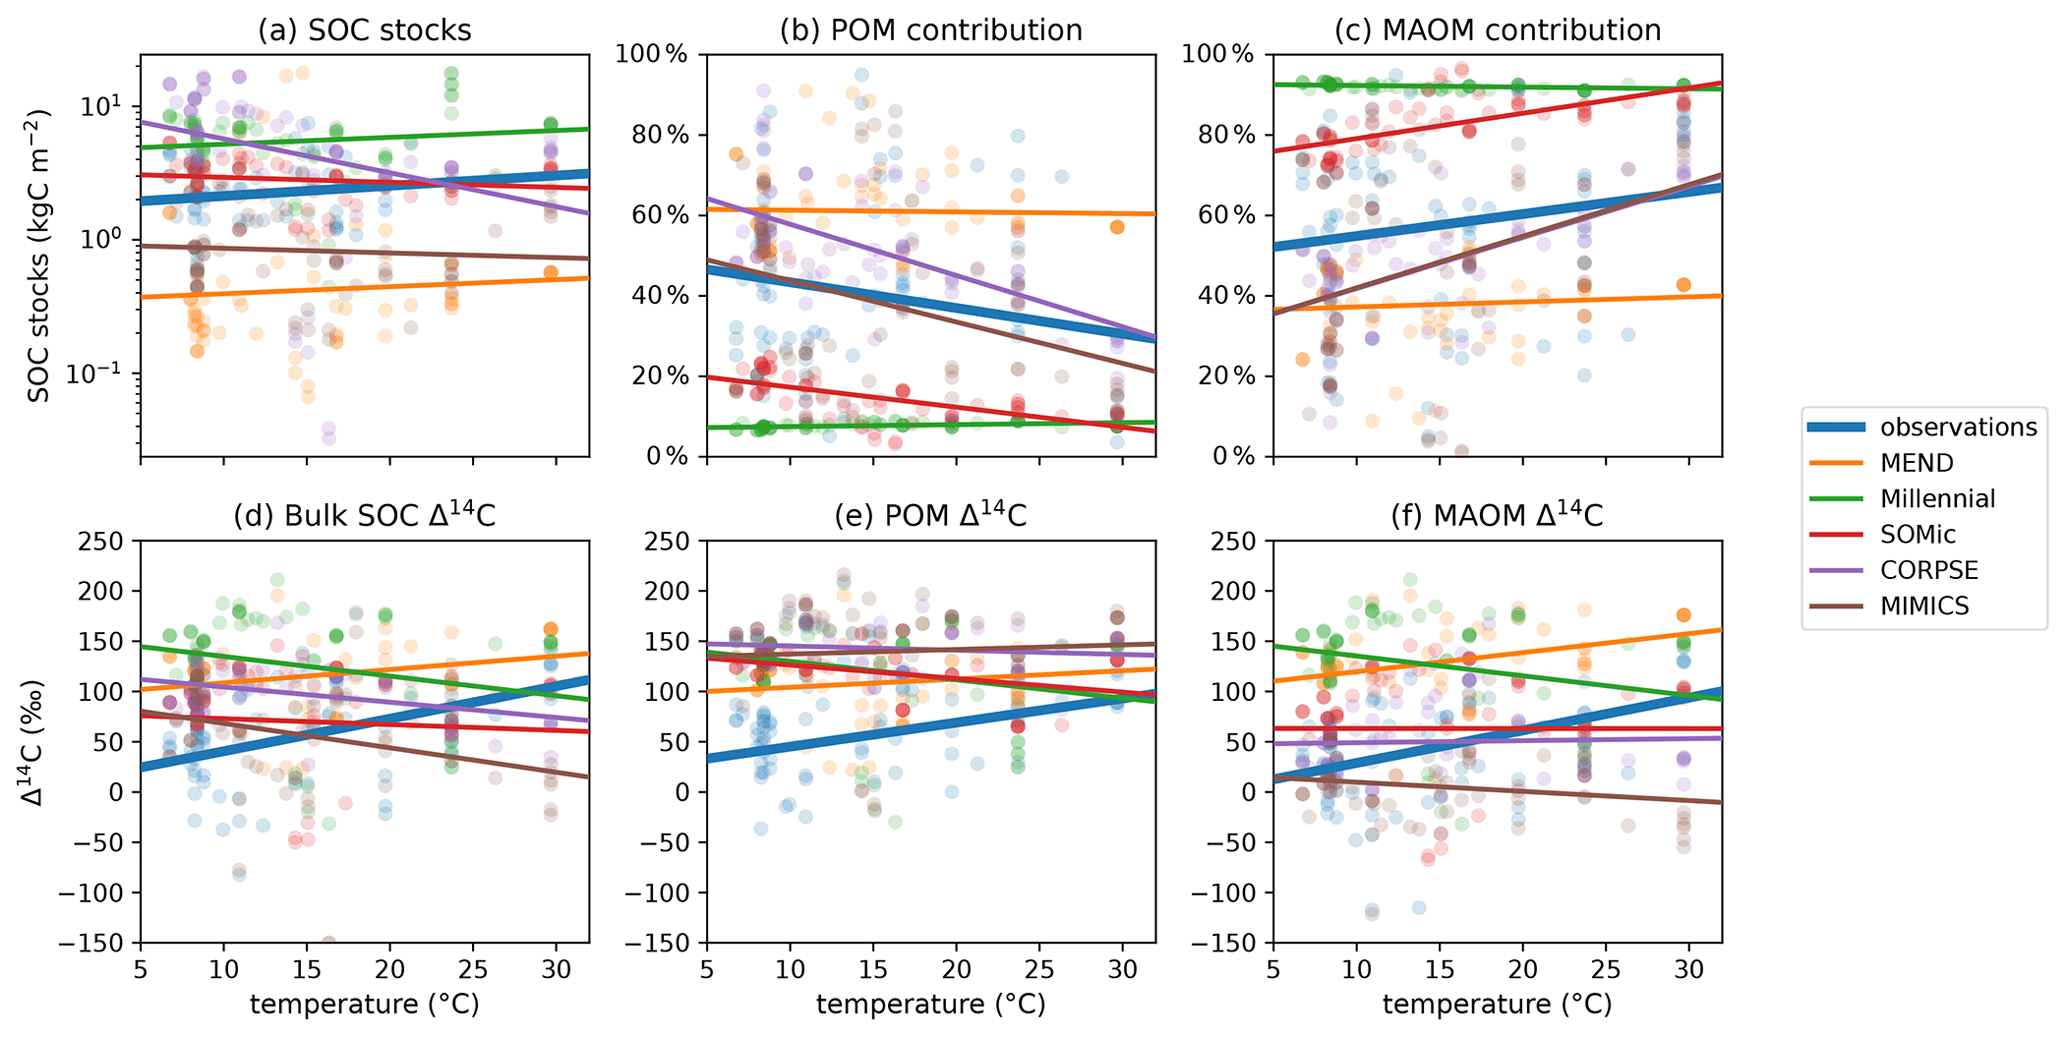
Figure 7Relationships of observed and predicted carbon and Δ14C data with respect to mean annual temperature of the topsoil (averaged over the 1970–2010 period). Circles are data points and lines are best linear fits through the points. The observed Δ14C data of bulk SOC, POM, and MAOM have a strong positive relationship with temperature, while the predicted Δ14C data are more weakly and sometimes negatively correlated with temperature. The linear fit line of CORPSE in panel (c) is completely covered by the linear fit line of MIMICS. Note that some extreme outliers are outside of the plotting range and that we again excluded the 1949 and 1978 samples for these plots. Separate plots for each individual model are provided in the Supplement (Figs. S1.2.32–36).
In Fig. 8c, the clay content of the sampled topsoils seems to be a decisive factor controlling the observed contribution of MAOM carbon to the SOC stocks, with higher clay content correlating with higher MAOM contribution. This is also true for the modeled MAOM contributions predicted by the MIMICS and CORPSE models, which produce the most accurate predictions of MAOM contribution (Table 2). However, MIMICS appears to struggle with correctly simulating the effects of increased clay content on overall SOC dynamics, as evidenced by the inaccurate relationships of SOC stocks and Δ14C with clay (see Fig. 8a and d–f). It appears that MIMICS correctly reproduces the evolution of MAOM contribution with clay content by increasing the turnover time of carbon in MAOM, which in turn lowers the Δ14C of MAOM and increases SOC stocks, contrary to the observations.
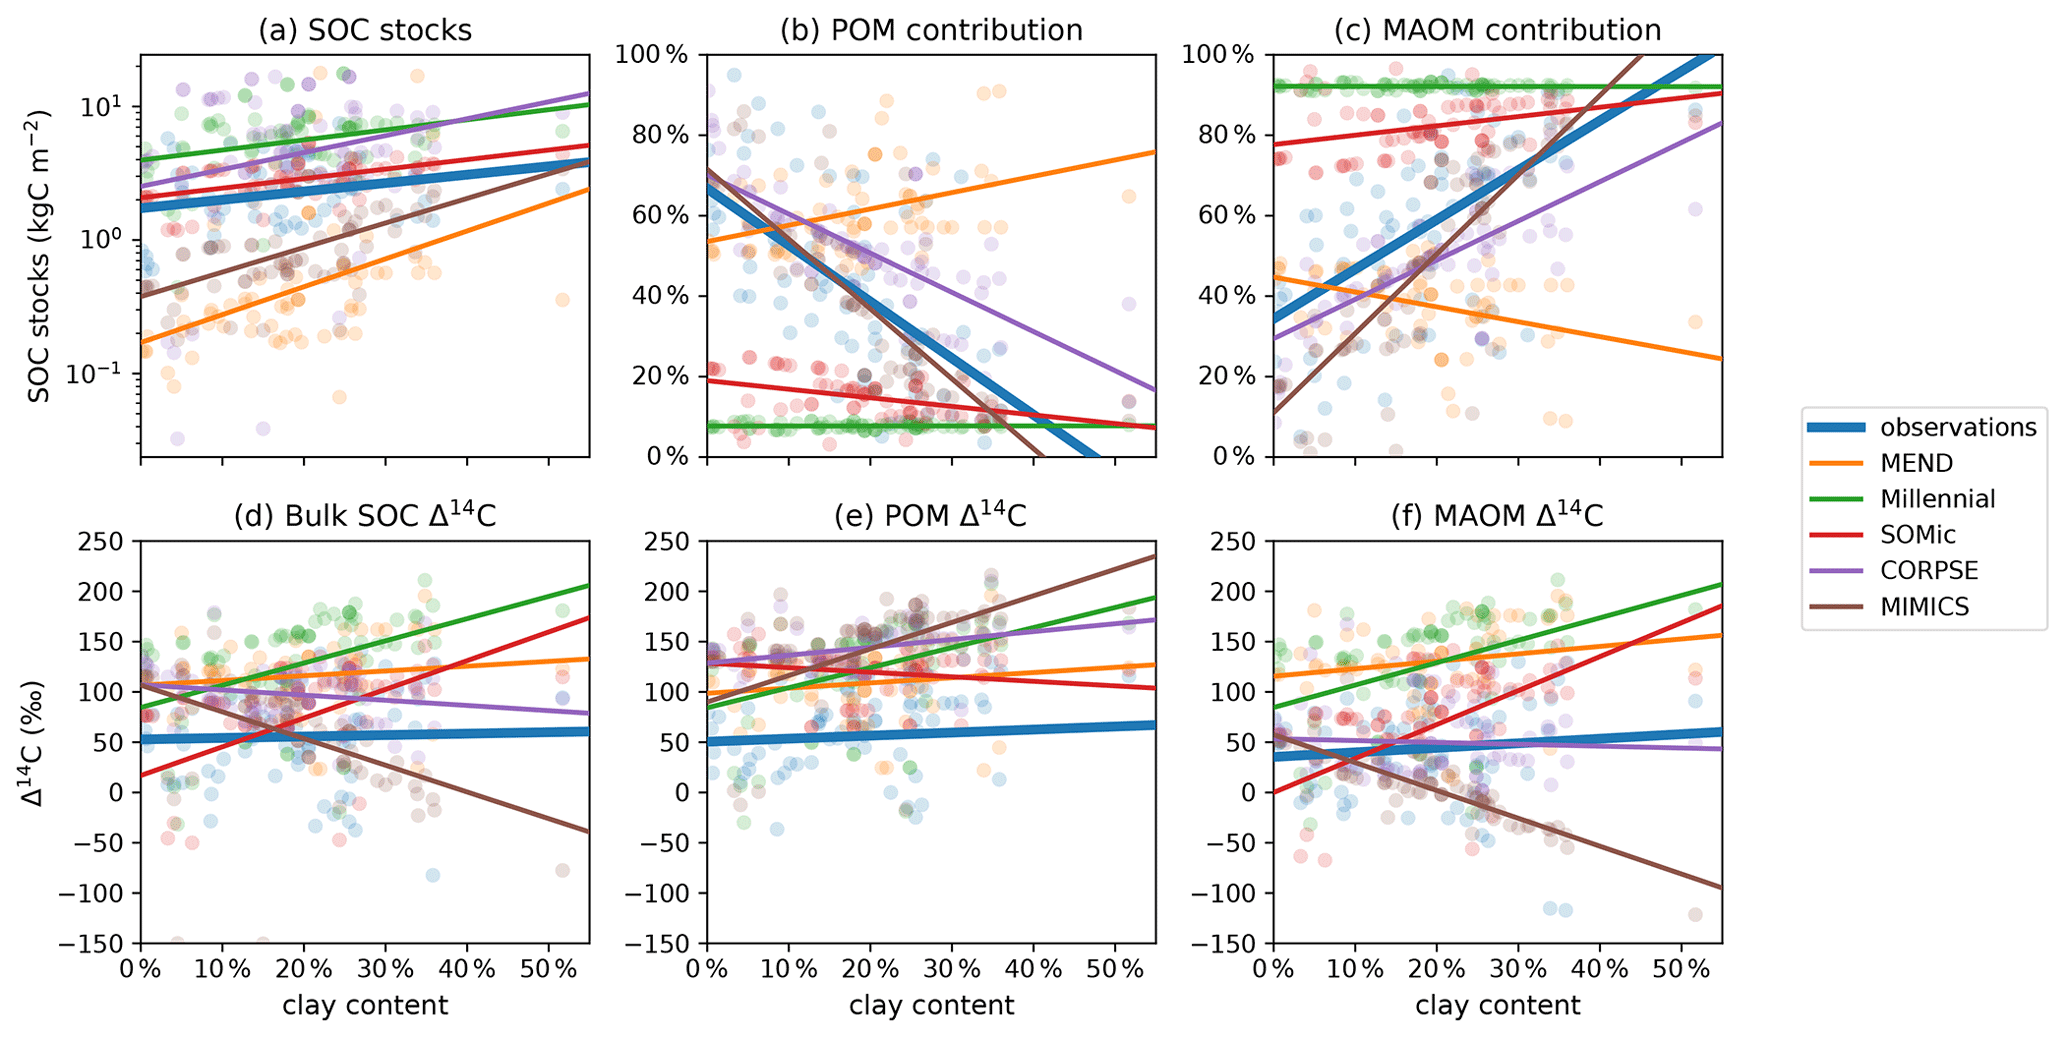
Figure 8Relationship of observed and predicted carbon and Δ14C data with respect to clay content in the topsoil. Circles are data points and lines are best linear fits through the points. CORPSE and MIMICS successfully reproduce the positive relationship between the topsoil clay content and the observed MAOM contribution to the SOC stocks in panel (c). However, in panel (f), MIMICS has a strong negative correlation of MAOM Δ14C with clay content, unlike the observations, which do not show a correlation. The linear fit line of CORPSE in panel (f) overlaps with that of the observations. Note that some extreme outliers are outside of the plotting range and that we again excluded the 1949 and 1978 samples for these plots. Separate plots for each individual model are provided in the Supplement (Figs. S1.2.26–30).
It is important to note that the regression lines in the Δ14C plots in Figs. 7d–f and 8d–f could potentially be biased due to the different sampling years of soil profiles with different environmental parameters. However, those biases most likely do not affect our analysis of the results (see Appendix G, and plots with “normalized” Δ14C data in Fig. S.1.1). The Supplement also contains figures of the model biases and absolute errors plotted against temperature and clay content (Figs. S.1.2.1–24).
The comparison of topsoil 14C measurements with predictions by new-generation models reveals inaccuracies in the modeled time scales of carbon turnover and persistence in soils. Like the Earth System Models (ESMs) evaluated in He et al. (2016), most new-generation models do not correctly reproduce the Δ14C of bulk soil organic carbon (SOC) and they, too, may therefore be unsuitable for studying the effectiveness of soils as a net atmospheric CO2 sink in the 21st century. The model biases in the partitioning of SOC between particulate organic matter (POM) and mineral-associated organic matter (MAOM) may also affect the accuracy of future projections. POM and MAOM have been shown to have different sensitivities to environmental variables such as temperature and are thus expected to react differently to a changing climate (Georgiou et al., 2024; Heckman et al., 2022; Hicks Pries et al., 2017; Kleber et al., 2011). Therefore, if models do not correctly partition SOC into POM and MAOM and misrepresent their 14C, they will probably produce inaccurate predictions of SOC dynamics under climate change.
We identify three likely reasons why the new-generation models generally underperform with 14C and discuss how these problems could potentially be solved:
-
insufficient datasets for the calibration of carbon turnover parameters
-
lack of a pool with very slow turnover to account for highly persistent SOC components
-
pools which do not capture the full range of SOC turnover rates.
The last point invites further research on the stability of the different constituents of SOC and a discussion on the most effective way to partition SOC into pools which are more representative of the diversity of cycling rates and persistence of carbon in soils.
4.1 Insufficient calibration datasets
Our 14C results suggest that the new-generation models selected for this study overestimate some carbon turnover rates. The most extreme case is Millennial v2, which gives its micro-aggregate pool and mineral-adsorbed carbon pool turnover times of just a few months (see Appendix F). On the other hand, 14C-based studies find that the MAOM fraction, which includes micro-aggregates and mineral-adsorbed carbon, typically turns over on time scales of many decades or centuries (Gaudinski et al., 2000; Schrumpf and Kaiser, 2015; Van der Voort et al., 2017; Baisden et al., 2002). The overestimation of turnover rates may be due to inadequate or insufficient data for the calibration of the turnover parameters of the models. Even though new-generation models can model measurable soil fractions such as POM and MAOM, they do not usually assimilate fraction-specific carbon and 14C data, probably because such data are currently very sparse. The only models in our evaluation to calibrate their parameters with fraction-specific carbon data are CORPSE (with data from only two soil profiles, according to Zhang et al., 2021; Table S1) and Millennial (as described in Abramoff et al., 2022), and none of them assimilated fraction-specific 14C data. Instead, new-generation models primarily rely on less informative bulk soil data, as well as some soil incubation results, for parameter optimization. However, as the dataset of fraction-specific carbon and 14C measurements is growing larger, new-generation models should start to take full advantage of the measurability of their pools and assimilate those highly informative data.
4.2 Lack of passive pool
Another explanation for the consistent overestimation of soil Δ14C by new-generation models is the inability of the models to account for the presence of highly persistent compounds in the soil, which negatively offset the bulk Δ14C. For example, some soils with a history of wildfires may contain a considerable fraction of pyrogenic carbon (Reisser et al., 2016; González-Domínguez et al., 2019), which is composed of highly durable aromatic compounds and can remain in soils over thousands of years (Eckmeier et al., 2009; Hajdas et al., 2007; Leifeld, 2008). Due to its longevity, pyrogenic carbon is depleted in 14C as a result of radioactive decay, bringing down the overall Δ14C of both POM (Van der Voort et al., 2017; Baisden et al., 2002) and MAOM (Soucémarianadin et al., 2019). In deeper soils, the Δ14C of SOC can be even further depleted due to a larger proportion of petrogenic carbon, which is devoid of 14C (Grant et al., 2023; Van der Voort et al., 2019). Whereas the two major traditional SOC models explicitly account for such extremely old components with a “passive” pool (1000 year turnover time) in the Century model (Parton et al., 1987) and an “inert organic matter” pool (no turnover at all) in the RothC model (Coleman and Jenkinson, 1996), the new-generation models effectively force virtually inert components to fit into their actively cycling carbon pools. By adding slow-turnover pools to account for highly persistent compounds such as pyrogenic carbon, the new-generation models would be able to lower the overall Δ14C of POM and MAOM and more accurately reproduce the measured 14C data.
4.3 Search for more representative pools
Finally, the underperformance of the models with respect to 14C may also be due to a choice of pools which are not truly representative of the full spectrum of carbon turnover rates in soils. Whereas traditional models simply define the number and turnover rates of their SOC pools such that they can reproduce observed SOC dynamics while minimizing their degrees of freedom, new-generation models additionally need to make sure their pools are at once easily measurable and representative of the various time scales of SOC persistence. If a measurable fraction contains two or more components with very different turnover rates, as is the case for the POM and MAOM fractions (von Lützow et al., 2007; Poeplau et al., 2018; Baisden et al., 2002), a model will not be able to correctly reproduce the fraction's Δ14C with one single carbon pool because it assumes a homogeneous turnover rate for the entire pool. Most new-generation models already address this problem by splitting the POM and MAOM fractions into multiple smaller subpools with contrasting turnover rates. For example, the SOMic model distinguishes between soluble and insoluble POM and the MEND model between oxidizable and hydrolyzable POM. Some new-generation models subdivide the MAOM fraction into micro-aggregates and mineral-adsorbed carbon (e.g., Millennial model) or into an active layer of adsorbed DOC (dissolved organic carbon) and a more stable MAOM component (e.g., MEND model). However, these subpools might still not be homogeneous enough in their turnover rates for effective 14C simulations. Recent 14C studies determining the stability of MAOM under the action of peroxide oxidation show that it may be necessary to further split clay-sized MAOM into two measurable subpools which are decomposable or resistant to microbial exo-enzymes (Schrumpf et al., 2021; Jagadamma et al., 2010; Poeplau et al., 2018). Within the POM fraction, the occluded light fraction could serve as an easily measurable proxy for the more persistent POM (Schrumpf et al., 2013; Wagai et al., 2009), and measurements of the pyrogenic carbon content (e.g., with hydrogen pyrolysis, as in González-Domínguez et al., 2019) could give clues on the size of the most persistent pool in the POM fraction. Finally, “continuous” SOC fractionation methods such as ramped pyrolysis oxidation (Stoner et al., 2023) could provide a much higher resolution of the SOC turnover rate spectrum. However, the resulting measurable pools are more difficult to interpret in terms of their role in the soil carbon cycle, and their incorporation into mechanistic SOC models is therefore less straightforward. In order to correctly reproduce the time scales of SOC persistence and turnover, new-generation models may need a more detailed subdivision of the POM and MAOM fractions into more representative subpools, thus potentially increasing the number of simulated pools and degrees of freedom. However, as discussed in Sect. 4.1, such an increase in model complexity must also be accompanied with an expansion of the observational datasets, in particular fraction-specific isotopic measurements, for effective model calibration and validation.
4.4 Limitations of this study
The accuracy of our model evaluation is affected by several factors. Although we took care to accurately match the modeled pools to the measured fractions (see Appendix C), the correspondences are imperfect and further complicated by non-standardized definitions and density cut-offs for the light and heavy fractions published on ISRaD. Nevertheless, this does not change the overall overestimation of soil Δ14C by most models. The use of forcing data from possibly inaccurate CESM2-LE and CCMI outputs with low spatial resolution may also affect the accuracy of our model evaluation. Furthermore, the Δ14C of the carbon inputs from the CESM2-LE product could be inaccurate, especially in soils with a thick organic layer, which pre-ages the carbon before it enters the mineral soil. However, the consistency and magnitude of the models' overestimation of the topsoil Δ14C with respect to observed data indicate that this overestimation is evidently a real pattern among the studied models. Finally, it is also important to note that our study only produces an incomplete picture of model performances on a global scale, since most of the measured data points represent North American and European forest ecosystems.
Despite their incorporation of the latest advances in soil sciences, new-generation soil organic carbon (SOC) models still seem to experience some of the same problems with predicting 14C as the traditional SOC models. The new-generation models' consistent overestimation of the Δ14C in both particulate organic matter (POM) and mineral-associated organic matter (MAOM) and their inaccurate partitioning of SOC between the POM and MAOM fractions suggest that these models underestimate the time scales of carbon storage in soils and might produce unreliable future predictions under climate change. To improve their predictions, new-generation models should take advantage of the measurability of their pools and calibrate their parameters with the rapidly growing dataset of fraction-specific carbon and 14C measurements in addition to incubation and bulk soil data. They may also have to reconsider their model design and simulate carbon pools which better capture the full spectrum of carbon turnover rates present in the soils. In particular, the consideration of highly persistent SOC such as pyrogenic carbon could significantly improve 14C predictions. As more effective measurable pools are being discovered and the dataset of fraction-specific 14C data is expanding, new-generation soil models have the potential to eventually supersede the traditional SOC models employed by ESMs if they take full advantage of the measurability of their pools and assimilate the available data.
A1 Derivation of LF data from fLF and oLF data
We calculate the Δ14C and carbon contribution of the light fraction (LF) by combining the soil density fraction data of the free light fraction (fLF) and the occluded light fraction (oLF) from the International Soil Radiocarbon Database (ISRaD) (Lawrence et al., 2020). The fractional contribution of LF to the total soil organic carbon (cLF) is calculated as the sum of the fLF and oLF contributions (cfLF and coLF, respectively), and the Δ14C of LF is derived with a weighted average of the Δ14C of fLF and oLF:
where .
A2 Derivation of bulk data from LF and HF data
If the Δ14C data for the bulk soil (Δ14Cbulk) are not available, we derive them with a weighted average of Δ14CLF and Δ14CHF, the Δ14C of the light fraction (LF) and heavy fraction (HF), respectively:
where cLF and cHF are the relative contributions of LF and HF to the soil organic carbon stocks, respectively. Note that the sum cLF+cHF is generally very close to 1, but not necessarily equal to 1, depending on the methods employed by the data producers.
A3 Definition of topsoil and selection of profiles
We define the topsoil as at least the top 5 cm and at most the top 10 cm of the mineral soil, i.e., the interval from 0 cm to x cm depth such that . All profiles in this study must have depth layers which fully span the topsoil without a gap. We only use layers whose top boundary is less than 5 cm deep and whose bottom boundary is less than 10 cm deep. For example, if a profile has layers 0–5 cm and 5–10 cm, we only use the 0–5 cm layer to represent the topsoil and discard the data from the 5–10 cm layer.
Examples of profiles we would choose for this study:
-
profile with layer 0–10 cm
-
profile with layers 0–3 cm and 3–8 cm
-
profile with layers 0–4 cm and 3–8 cm (overlapping is allowed).
Examples of profiles that we would have to reject:
-
profile with layer 0–15 cm (extends beyond 10 cm depth)
-
profile with topmost layer 1–8 cm (missing top 1 cm)
-
profile whose top two layers are 0–3 cm and 4–8 cm (gap between layers).
A4 Derivation of topsoil data from layer data
The carbon and 14C data for the topsoil are derived by integrating over the layers comprising the topsoil. The total soil organic carbon stocks in the topsoil (SOC) are found by summing the SOCℓ stocks in each layer ℓ. If the SOCℓ data are not reported, they are derived from the layer thickness hℓ, soil bulk density ρℓ, and carbon concentration Cℓ in each layer ℓ:
In order to find the Δ14C of bulk soil, light fraction (LF), and heavy fraction (HF) in the topsoil (Δ14Cbulk, Δ14CLF, and Δ14CHF, respectively), as well as the LF and HF fractional contributions to the total carbon stocks in the topsoil (cLF and cHF, respectively), we take a weighted average over the layers ℓ:
If there are overlapping layers in the topsoil (e.g., a profile with layers 0–2, 0–4, and 3–10 cm), we integrate over depth while averaging overlapping layers in the intervals where those layers overlap.
The original source codes of all the selected model versions are openly available. By having direct access to the code with which the model developers produced their results, we can be more confident that we test an implementation of the models as intended by their respective authors.
Our final implementations of Millennial, CORPSE, MIMICS, and the 14C component of MEND are available as Python modules in our GitHub repository https://github.com/asb219/evaluate-SOC-models (last access: 30 July 2024), published on Zenodo at https://doi.org/10.5281/zenodo.11583791 (Brunmayr, 2024). For the carbon and nitrogen components of MEND, we compile the Fortran source code from https://doi.org/10.5281/zenodo.11065513 (Wang and Brunmayr, 2024). Finally, we use the install_url function of the devtools package in R (Wickham et al., 2022) to install SOMic as an R package directly from https://doi.org/10.5281/zenodo.11068749 (Woolf and Brunmayr, 2023).
B1 MEND
We use the MEND-new version of the MEND model as described in Wang et al. (2022). Our 14C re-implementation is based on the code from commit 92323c7 of the GitHub repository at https://github.com/wanggangsheng/MEND (last access: 30 July 2024) (Zenodo publication: Wang, 2024). We forked the repository from that commit to https://github.com/asb219/MEND (last access: 30 July 2024) so that we could adapt the model input and output to our purposes. On our fork, the original version of MEND-new is released under tag name “MEND-new”, and the version we used to produce our results is released under tag name “MEND-new-asb219” (Zenodo publication: Wang and Brunmayr, 2024). We use all the default model settings and the optimized parameter values provided in the Fortran namelist file MEND_namelist.nml in the repository. The pre-industrial soil carbon and nitrogen stocks are found by initializing the model with the default initial state from the file userio/inp/SOIL_ini.dat and spinning up the non-isotopic carbon–nitrogen component of the model for 400 years with pre-industrial forcing data. The pre-industrial soil 14C levels are then found by running the 14C component of the model for another 1000 years, looping over the final year of the carbon–nitrogen spinup. The final states of the carbon–nitrogen and 14C spinups are then used for the initial condition of the final run of MEND over the 1850–2014 period. The model runs with hourly time steps and uses the forward Euler integration method.
B2 Millennial
We use Millennial v2 with Michaelis–Menten kinetics as described in Abramoff et al. (2022). We re-implemented the model with 14C in Python based on the original R code in the repository https://github.com/rabramoff/Millennial (last access: 30 July 2024) released under the tag “v2”, commit e95bca9 (Zenodo publication: Abramoff and Xu, 2022). We used the model equations from the file R/models/derivs_V2_MM.R in the repository and ran the model with the fitted parameter values from the file Fortran/MillennialV2/simulationv2/soilpara_in_fit.txt in the repository. The initial condition for both carbon and 14C stocks is found by first solving for a pre-industrial steady state (similarly to the model tutorial R/simulation/model_tutorial.Rmd in the repository) and then running the model from steady state for 200 years using time-varying pre-industrial forcing data featuring a seasonal cycle. The final state of that spinup is then used as the initial condition for the final run of the model over the 1850–2014 period. The model runs with daily time steps, and although the model tutorial uses the 4th order Runge–Kutta integration method, we integrate the equations simply with the forward Euler method, which is stable and precise enough with daily time steps.
B3 SOMic
We use version 1.0 of the SOMic model as described in (Woolf and Lehmann, 2019). The original code is released under version “SOMic v 1.00” (commit be34e56) in the GitHub repository https://github.com/domwoolf/somic1 (last access: 30 July 2024) (Zenodo publication: Woolf, 2024). However, we had to fork the repository from commit be34e56 to https://github.com/asb219/somic1 (last access: 30 July 2024) in order to fix a minor issue in the 14C implementation (see Appendix E1 for the reason) and to allow for distinct 14C values in the initial condition of each pool (previously, all pools were always initialized with the same 14C value). To produce our results, we used the version released under the tag “v1.1-asb219” in our fork (Zenodo publication: Woolf and Brunmayr, 2023). The model is spun up for 50 000 years to get the initial carbon and 14C stocks. The model runs with monthly time steps and uses the forward Euler integration method.
B4 CORPSE
The CORPSE model was originally described in Sulman et al. (2014). There are currently six publicly available versions of CORPSE owned by GitHub user https://github.com/bsulman (last access: 30 July 2024). Since we are mostly interested in carbon dynamics, the lead developer Benjamin Sulman recommended we use the most up-to-date carbon-only implementation in https://github.com/bsulman/CORPSE-fire-response (last access: 30 July 2024) (commit 19ee2c7 released as version v1.0; Zenodo publication: Sulman, 2024a). We re-implemented CORPSE with 14C based on the equations in the file CORPSE_array.py and using the parameter values from the file Whitman_sims.py in that repository. However, the equation for the clay-related rate-modifying factor is taken from the file code/CORPSE_integrate.py in repository https://github.com/bsulman/CORPSE-N (last access: 30 July 2024) (commit 4a689ef released as version v1.0; Zenodo publication: Sulman, 2024b), since the model seems to be working more reliably with that version of the equation. As in Millennial, the initial condition is found by solving for a pre-industrial steady state and spinning up for 200 years from that steady state. If the solver is unable to find a steady state, the model is spun up for 10 000 years. The steady-state solution was found for all the profiles in this study. The model runs with daily time steps and uses the forward Euler integration method.
B5 MIMICS
We use MIMICS-CN v1.0 as published in Kyker-Snowman et al. (2020) because the latest version of MIMICS (Wang et al., 2021; Wang, 2020) did not correctly implement 14C (see Appendix E2). The original R code of MIMICS-CN v1.0 is available at https://doi.org/10.5281/zenodo.3534562 (Kyker-Snowman, 2019). It already implements stable isotope tracers but no radioactive isotopes such as 14C, so we re-implemented the model with 14C in Python. As for Millennial and CORPSE, we spin up for 200 years from the pre-industrial steady-state solution. If no steady state can be found, we spin up for 10 000 years. The steady-state solution was found for all the profiles in this study. The model runs with hourly time steps and uses the forward Euler integration method.
This section explains how we associate the simulated pools of each model with either the POM fraction (particulate organic matter, corresponding to the light fraction resulting from density fractionation) or the MAOM fraction (mineral-associated organic matter, corresponding to the heavy fraction resulting from density fractionation). We assume that the POM fraction is composed of fragmented and partially processed plant litter which is not stabilized in the soil matrix through mineral association. We assume that the MAOM fraction is composed of soil organic carbon which is enclosed in stable aggregates or strongly adsorbed to minerals. Since the live microbial biomass and dissolved organic carbon generally represent a small fraction of soil organic carbon, we can neglect them and assume they belong to neither POM nor MAOM.
See Table C1 for a summary of the correspondences between the modeled pools and the POM and MAOM fractions.
Table C1Correspondences between simulated carbon pools and the POM fraction, MAOM fraction, or other carbon fractions. See Appendix Sects. C1–C5 for more information.
C1 MEND
List of organic carbon pools in the MEND-new model by Wang et al. (2022) (model diagram in Fig. C1):
-
POMO and POMH (particulate organic matter decomposed by oxidative and hydrolytic enzymes, respectively);
-
MOM (mineral-associated organic matter);
-
QOM: “active layer of MOM” which can exchange carbon with DOM through adsorption and desorption (Wang et al., 2022);
-
DOM (dissolved organic matter);
-
MBA and MBD (active and dormant microbial biomass, respectively);
-
EPO, EPH, EM, nosZ, norB, nirS, nirK, narG, napA, amoA, nxrA/B, nifH: various microbial exo-enzymes.
Note that the “Above-ground biomass”, “Root biomass”, and “Litter” boxes in the MEND model diagram in Fig. C1 are not explicitly modeled as pools and therefore do not feature in the above list of organic carbon pools.
We assume that the POM fraction is composed of the POMO and POMH pools and that the MAOM fraction is composed of the MOM and QOM pools. The DOM, MBA, MBD, and exo-enzyme pools belong to neither fraction.
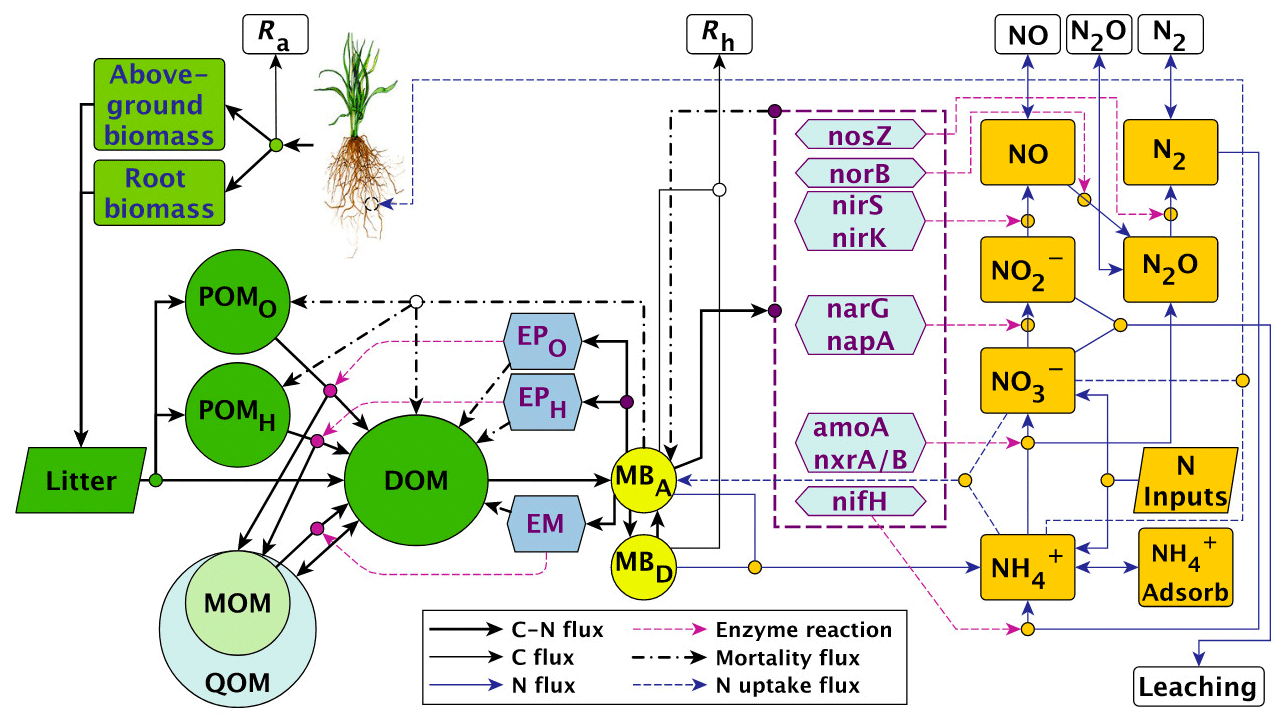
Figure C1MEND-new model diagram. Source: Wang et al. (2022). Reuse permission received with Copyright Clearance Center license number 5691380194276.
C2 Millennial
List of organic carbon pools in Millennial v2 by Abramoff et al. (2022) (model diagram in Fig. C2):
-
POM (particulate organic matter);
-
Aggregate C: “stable microaggregates which remain after dispersion in the larger particle size fraction (> 50–60 µm)” (Abramoff et al., 2022) – thus this corresponds to the coarse heavy fraction;
-
MAOM (mineral-associated organic matter): consists of organic matter associated with minerals through sorption (Abramoff et al., 2022);
-
Microbial biomass: live microbial biomass;
-
LMWC (low-molecular-weight carbon): “LMWC could be analogous to dissolved organic C (DOC) if there is enough moisture in the soil matrix, and if we do not consider DOC molecules that are too large to be taken up by microbes” (Abramoff et al., 2022).
We assume that the MAOM fraction is the sum of the Aggregate C and MAOM pools and that the POM fraction is entirely composed of the POM pool. The microbial biomass and LMWC pools belong to neither fraction.
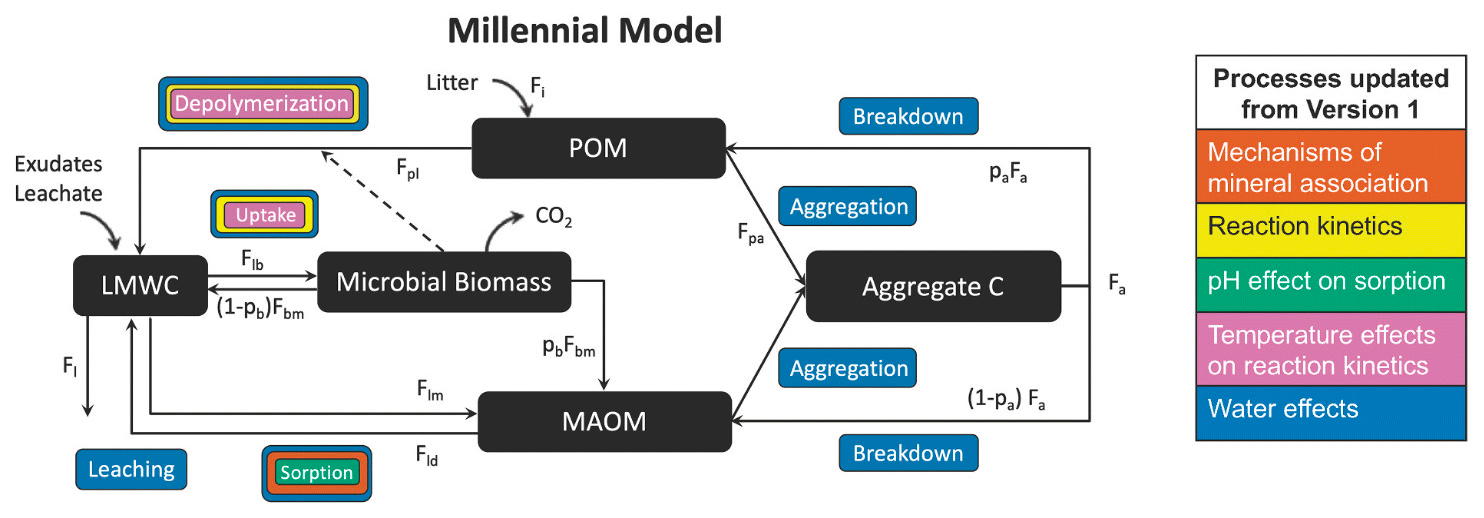
Figure C2Millennial v2 diagram. Source: Abramoff et al. (2022). License: CC BY.
C3 SOMic
List of organic carbon pools in SOMic 1.0 by Woolf and Lehmann (2019) (model diagram in Fig. C3):
-
SPM and IPM (soluble and insoluble plant matter, respectively);
-
MAC (mineral-associated carbon): “mineral-sorbed or -occluded SOC” (Woolf and Lehmann, 2019);
-
DOC (dissolved organic carbon);
-
MB (microbial biomass).
We assume that the MAOM fraction is composed of the MAC pool and the POM fraction is composed of the SPM and IPM pools. The DOC and MB pools belong to neither fraction.
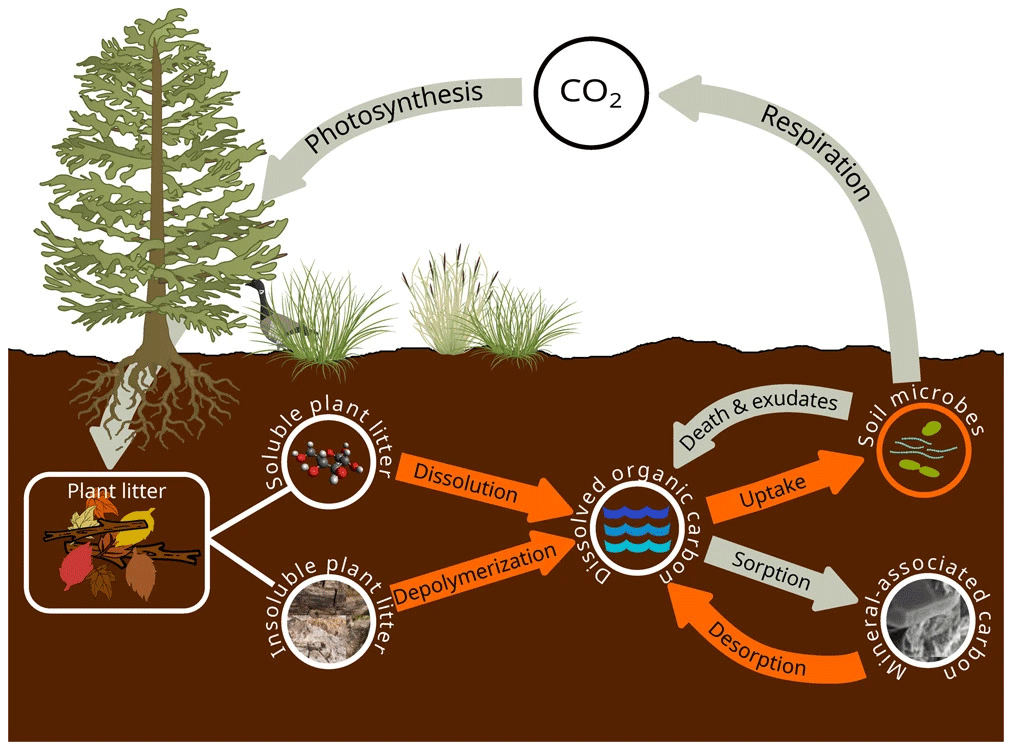
Figure C3SOMic 1.0 diagram. Source: Woolf and Lehmann (2019). License: CC BY.
C4 CORPSE
List of organic carbon pools in the CORPSE-fire-response version (Sulman, 2024a) of the CORPSE model, first published in Sulman et al. (2014) and last updated in Moore et al. (2020) (model diagram in Fig. C4):
-
SPCu, CPCu, and MNu (unprotected simple plant carbon, unprotected complex plant carbon, and unprotected microbe necromass, respectively);
-
SPCp, CPCp, and MNp (protected simple plant carbon, protected complex plant carbon, and protected microbe necromass): “protected organic matter is inaccessible to microbial decomposition through chemical sorption to mineral surfaces or occlusion within microaggregates” (Moore et al., 2020);
-
LMB (live microbial biomass).
We associate the MAOM fraction with the SPCp, CPCp, and MNp pools, since they represent mineral-adsorbed and micro-aggregated carbon (Moore et al., 2020). We associate the POM fraction with the SPCu and CPCu pools, but not the microbial MNu pool, because POM is mostly composed of unprotected plant-derived carbon. The MNu and LMB pools belong to neither fraction.
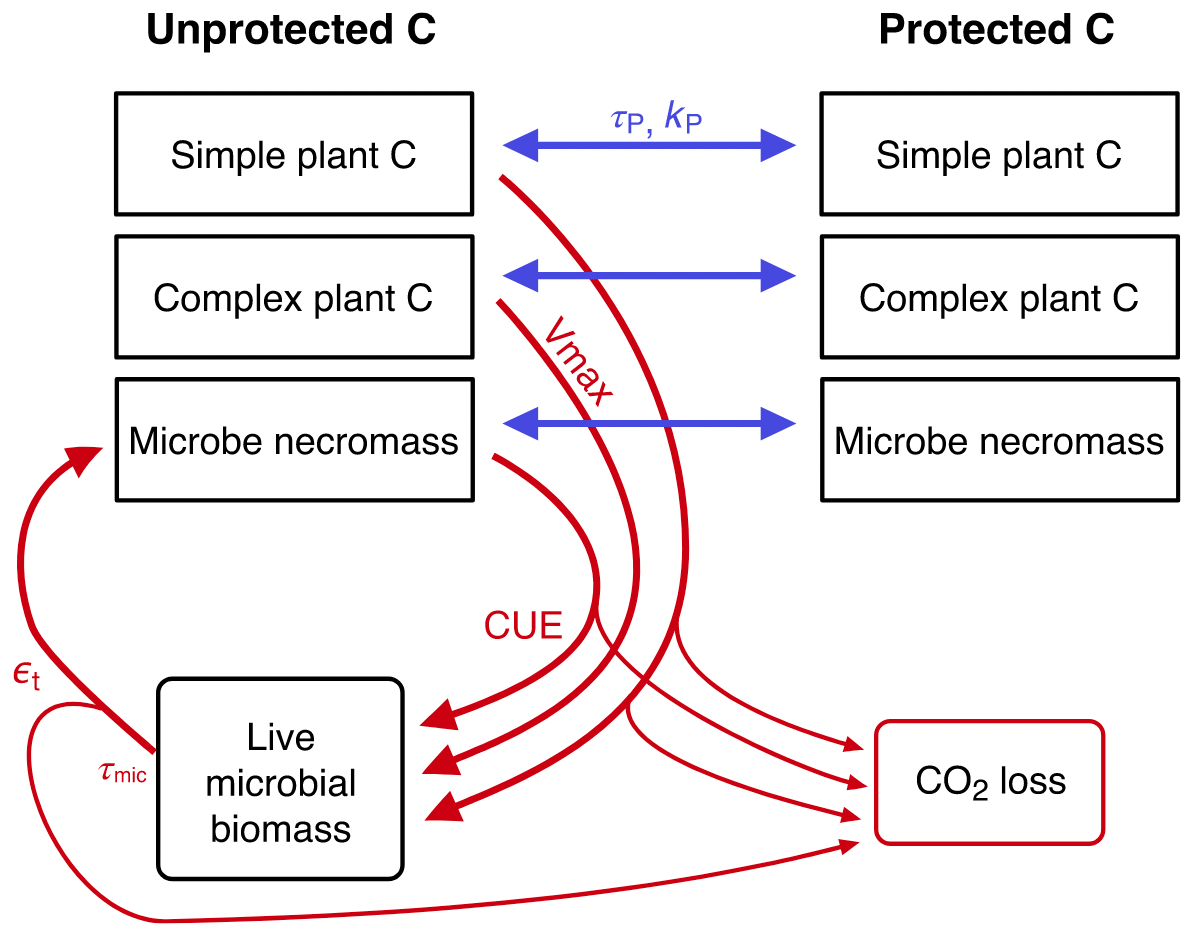
Figure C4CORPSE diagram. Source: Moore et al. (2020). Reuse permission received with Copyright Clearance Center license number 5691370621010.
C5 MIMICS
List of organic carbon pools in MIMICS-CN v1.0 by Kyker-Snowman et al. (2020) (model diagram in Fig. C5):
-
LITm and LITs (metabolic and structural litter, respectively): litter pools which are not considered part of soil organic matter;
-
SOMp (physicochemically protected soil organic matter): “is primarily composed of microbial products that are adsorbed onto mineral surfaces” and is “analogous to heavy fraction or MAOM pools” (Kyker-Snowman et al., 2020);
-
SOMc (chemically recalcitrant soil organic matter): “consists of decomposed or partially decomposed litter” and is “analogous to light fraction or POM pools” (Kyker-Snowman et al., 2020);
-
SOMa (available soil organic matter): “the only SOM pool that is available for microbial decomposition; it contains a mixture of fresh microbial residues, products that are desorbed from the SOMp pool (e.g., Jilling et al., 2018), as well as depolymerized organic matter from the SOMc pool” (Kyker-Snowman et al., 2020). This pool is usually small and we associate it with neither POM nor MAOM;
-
MICr and MICK (“low-efficiency, r-strategist” microbes and “higher-efficiency, K-strategist” microbes, respectively) (Kyker-Snowman et al., 2020): live microbial biomass pools.
According to Kyker-Snowman et al. (2020), the SOMc pool corresponds to the POM fraction and the SOMp pool corresponds to the MAOM fraction. The SOMa, MICr, and MICK pools belong to neither fraction.
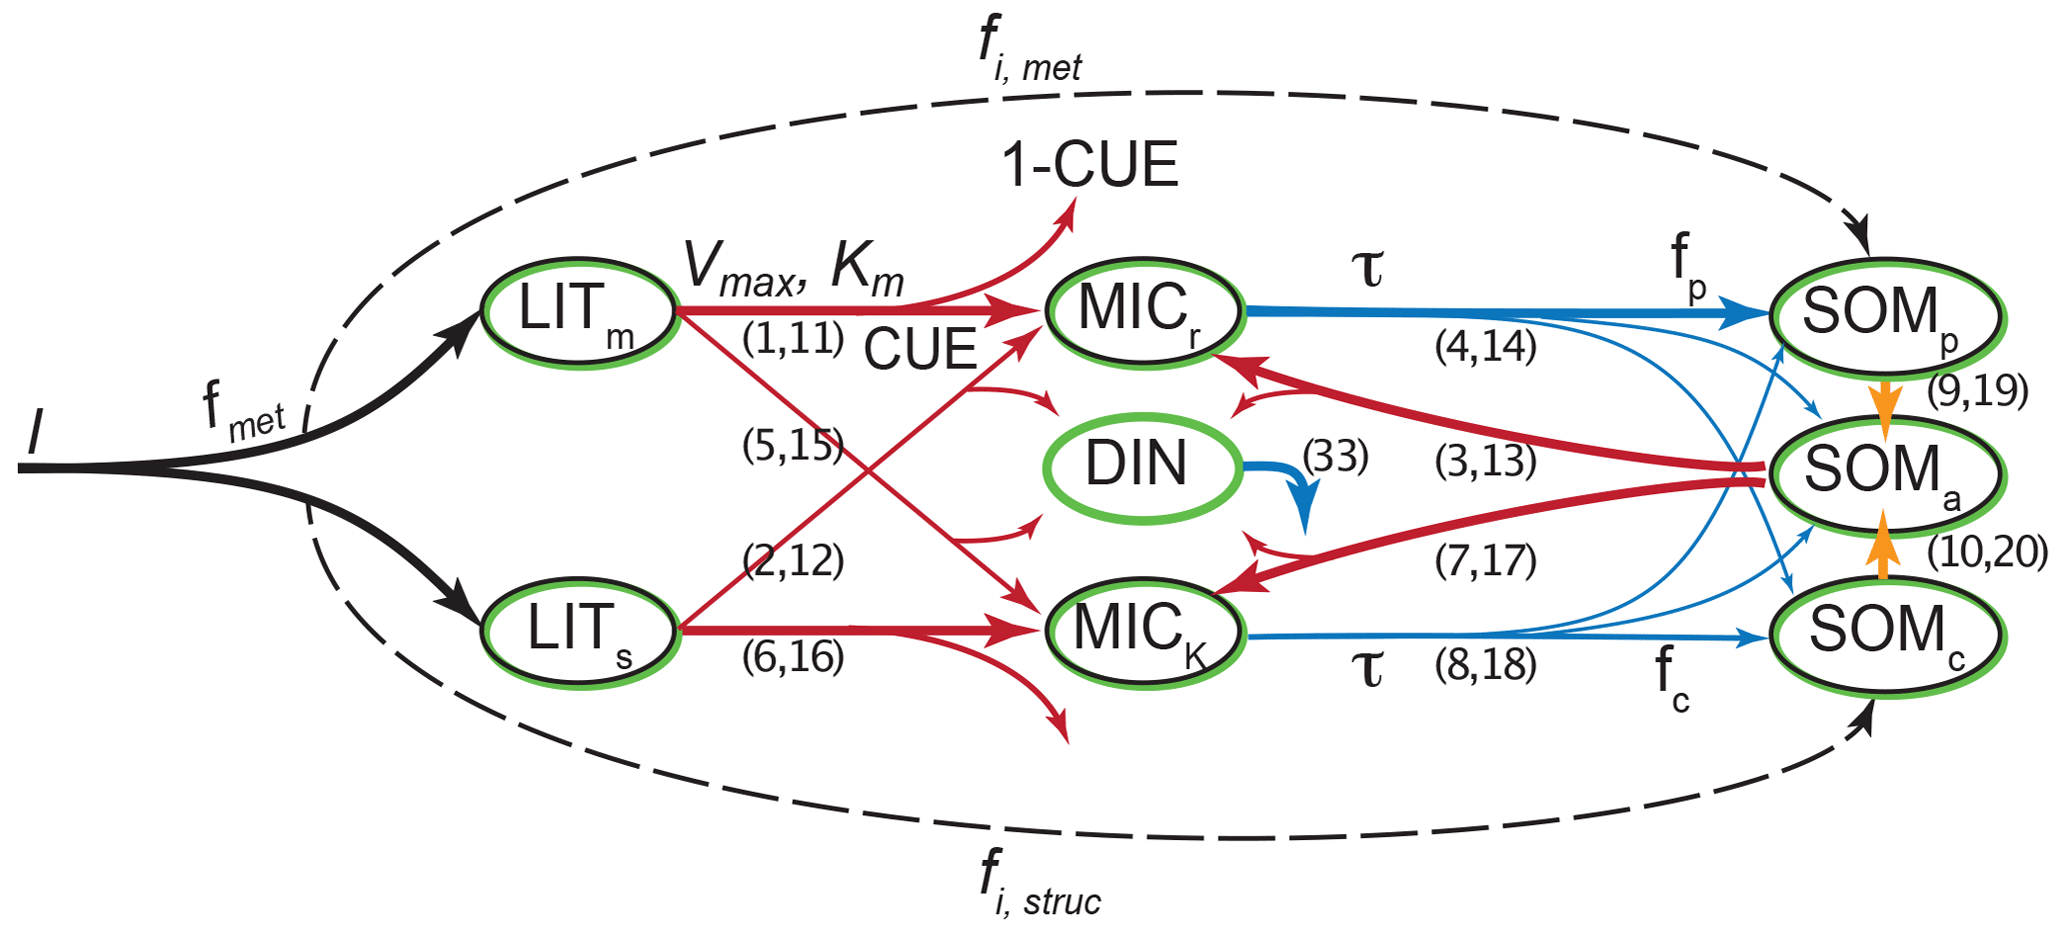
Figure C5MIMICS-CN v1.0 diagram. Source: Kyker-Snowman et al. (2020). License: CC BY.
Among the new-generation models selected for this study, SOMic, MIMICS, and MEND have already implemented 14C. However, the most recent and only open-source version of MEND does not include 14C, and SOMic and MIMICS incorrectly implemented their 14C simulations (see Appendix E). Nevertheless, we can still produce 14C predictions with non-isotopic models by individually tracking the carbon fluxes at every time step and attaching a 14C signal to each flux. Since none of the models define an internal structure for their pools, we will assume by default that the pools are well-mixed, which means that the Δ14C of a pool's outflux is equal to the pool's Δ14C. This assumption is common practice for 14C modeling in soils (Sierra et al., 2017).
We run all of the selected models using the forward Euler method to advance from one time step to the next. The models either implicitly or explicitly produce the internal flux matrix Φi at each time step i, where is the flux of carbon from pool k into pool j (with j≠k) and is the total outflux of carbon out of pool j at time step i. They also define the external influx vector Ii such that is the influx of carbon entering the modeled system through pool j at time step i. Matrix Φ contains all the fluxes between the pools and out of the system, and vector I contains all the influxes of carbon from outside the system into the modeled pools. We can therefore find the carbon stocks of pool j at time step i+1 based on the Φi, Ii, and Ci of the previous time step i:
where the summation of internal fluxes is performed over all donor pools k to get the total internal carbon flux into pool j (when k≠j), subtracted by the flux out of pool j (when k=j).
Assuming the pools are well-mixed, we can now produce 14C predictions by tagging each flux Φjk with the 14C signal of pool k. We measure the 14C signal in terms of the unitless “absolute Fraction Modern” (FMabs) as defined in Trumbore et al. (2016), such that . The FMabs is proportional to the 14C 12C ratio normalized to a δ13C of −25 ‰ (Trumbore et al., 2016) and is thus proportional to the normalized ratio of 14C to total carbon (14C/C), considering the negligible abundance of 14C compared to 12C and 13C. Therefore, if we know , the FMabs of pool j at time step i, we can find at time step i+1 with the following equation (provided all the pools and the influx have comparable δ13C signatures):
where is given by Eq. (D1), λ is the radioactive decay rate of 14C in units of inverse time step size, and is the FMabs of the external carbon influx at time step i given by the forcing data. We can then recover the Δ14C at each time step i and for each pool j with ‰.
E1 SOMic
The original implementation (available on Zenodo: Woolf, 2024) of the SOMic model (Woolf and Lehmann, 2019) does not produce accurate 14C predictions. Instead of working with the more typical Δ14C or absolute Fraction Modern (FMabs) units, this implementation tracks the 14C age, which we summarily define as , where λ is the radioactive decay rate of 14C. This causes complications when updating the 14C ages of the pools at each time step and when computing the total 14C age of the soil from the 14C ages of the individual pools. Indeed, to find the combined age AgeA+B of pools A and B, the implementation of SOMic takes a weighted average over the ages, which is not entirely accurate:
where Agei and Ci are the 14C age and the carbon stocks, respectively, of pool i. This weighted average formula is used to integrate the 14C ages of carbon fluxes into the pools at each time step in lines 154–160 and to compute the 14C age of the total soil in line 210 of file src/SOMIC.cpp (available on Zenodo: Woolf, 2024).
In order to prove that Eq. (E1) is inaccurate, let us derive how to correctly add the 14C ages of pools A and B. Let denote the 14C stocks and Ci the total carbon stocks of pool i. Then, by conservation of mass, we have
Since the FMabs is proportional to the 14C/C ratio (assuming pools A and B have similar δ13C signatures), the above is equivalent to
where Fi and Ci are the FMabs and carbon stocks, respectively, of pool i. It follows that the combined 14C age of pools A and B is given by
Note that Eq. (E1) is the first non-zero term of the above result's Taylor expansion around AgeA=0, AgeB=0. This means that Eq. (E1) works well for ages that are close to 0, i.e., when the Δ14C is close to 0. However, it fails to accurately predict the propagation of the bomb spike into the soil ecosystem in the latter half of the 20th century, as shown in Fig. E1. While the error induced by the incorrect implementation exceeds 20 ‰ for the bulk soil Δ14C in the 1970s, the average error in the 2000s and 2010s is only around 10 ‰, which is relatively minor.
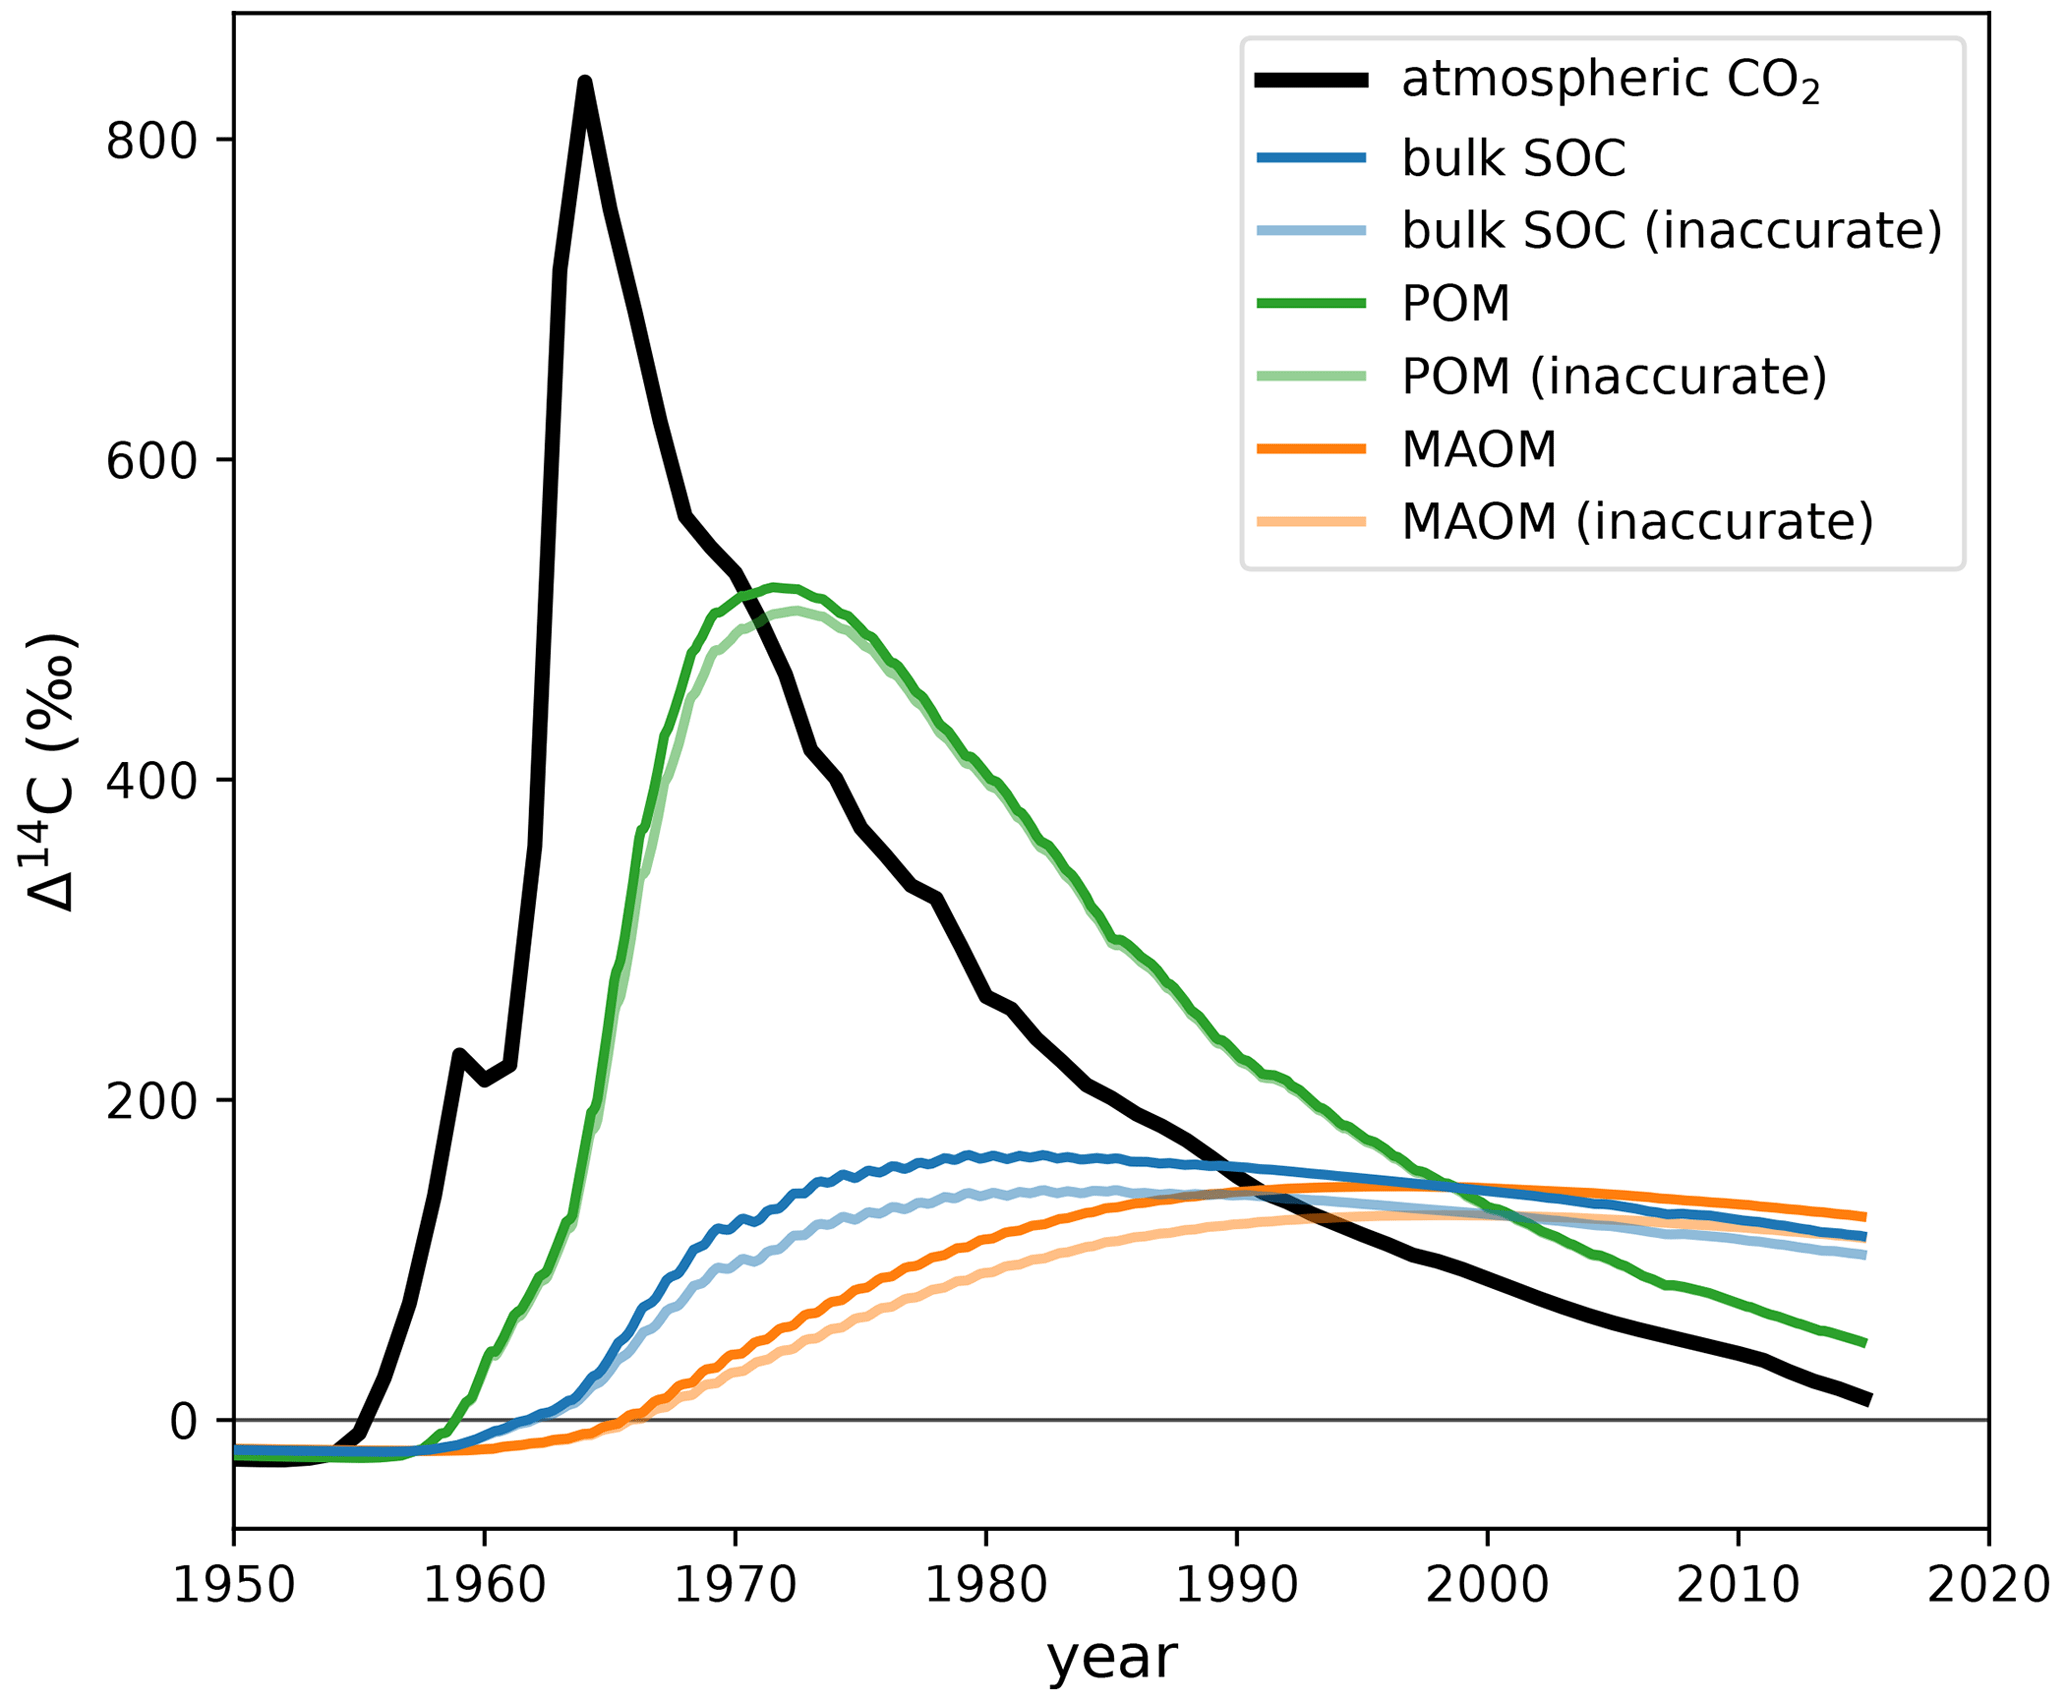
Figure E1Comparison of Δ14C predicted by SOMic with the more and less accurate 14C implementations. For this example simulation, SOMic was run with forcing data corresponding to the top 5 cm of the mineral soil of the Bugac grassland site in Hungary sampled in 2004 (Schrumpf et al., 2013). The atmospheric Δ14CO2 of the Northern Hemisphere (Graven et al., 2017) is plotted for reference. The plotted model output data are available in the Supplement (Table S2).
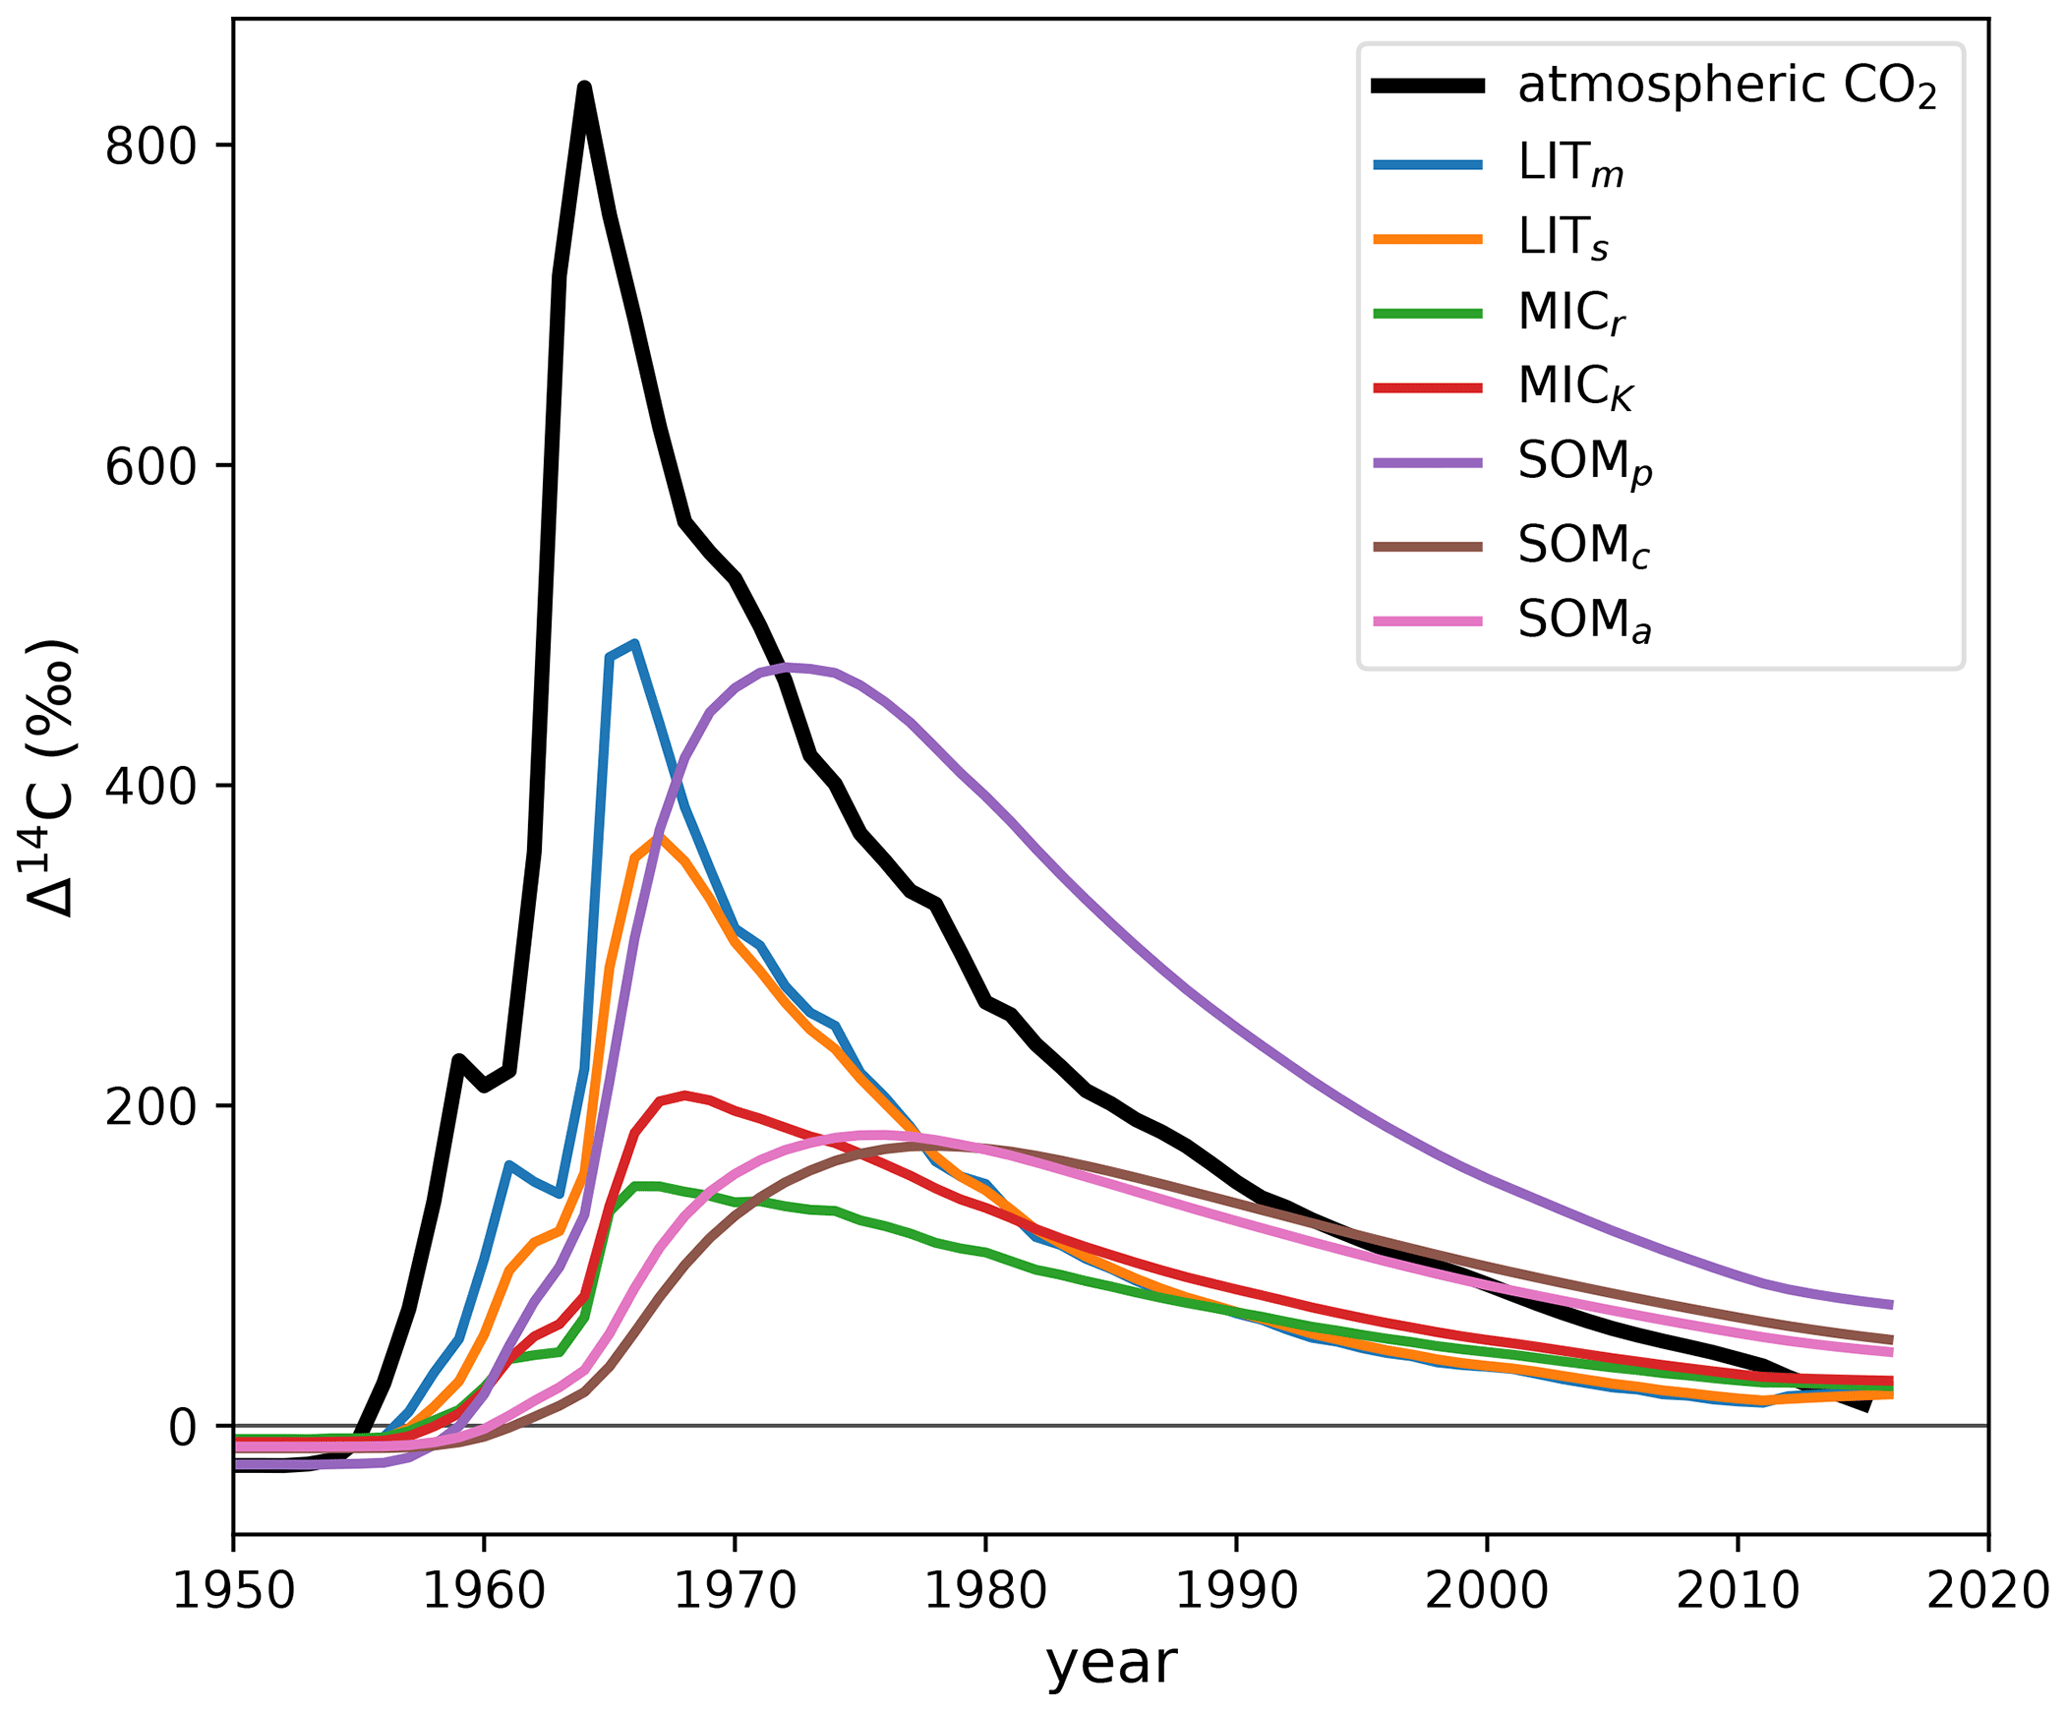
Figure E2Δ14C output of MIMICS (Wang et al., 2021) with incorrect isotopic implementation. The model was run with the default parameters and forcing data published with the original source code (Wang, 2020). Our only modification to the source code was to output the pools' 14C and 12C stocks for each year. The atmospheric Δ14CO2 of the Northern Hemisphere (Graven et al., 2017) is plotted for reference. MIMICS pool names: LITm, metabolic litter; LITs, structural litter; MICr, r-strategist microbes; MICK, K-strategist microbes; SOMp, physically protected soil organic matter; SOMc, chemically protected soil organic matter; SOMa, active soil organic matter. The plotted model output data are available in the Supplement (Table S1).
E2 MIMICS
The only MIMICS version already implemented with 14C is published in Wang et al. (2021), and the source code is available at https://data.csiro.au/collection/csiro:47942v1 (last access: 30 July 2024) (Wang, 2020). However, this 14C implementation is incorrect (see Fig. E2).
The time evolution of the carbon stocks in MIMICS is given by function f(C,t), which depends on the carbon stocks vector C and time t. Function f is implemented as subroutine modelx in the source file vsoilmic05f_ms25.f90. We can write function f in terms of internal carbon transfer matrix A and carbon influx vector I:
where matrix A(C,t) is a function of carbon stocks C and time t and vector I(t) is time-dependent.
Then, following the same procedure which yielded Eq. (D2), we can derive the equation governing the evolution of the 14C stocks (14C):
where λ is the radioactive decay rate of 14C and 14I is the external influx of 14C.
However, in the 14C implementation of MIMICS, the evolution of the 14C stocks is predicted with
The above equation is incorrect because, for this model, when the pools have Δ14C≠0 ‰. This is especially problematic during the bomb-spike period, where 14C undergoes big changes while C remains stable, causing A(14C,t) to deviate significantly from A(C,t). The incorrect implementation causes a strong attenuation of the Δ14C curves of the metabolic and structural litter pools (Fig. E2), which should more closely follow the atmospheric curve, considering the fast turnover rates of the litter pools. Another noticeable effect of the incorrect implementation, as seen in Fig. E2, is that the SOMp pool (corresponding to the MAOM fraction) incorporated much more bomb-derived 14C than the SOMc pool (corresponding to the POM fraction) in the 1970s, which is highly improbable.
In Millennial v2 (Abramoff et al., 2022), the POM, MAOM, and Aggregate C pools exchange carbon with each other on the scale of a few months. The aggregate formation rate of the POM pool is between 0.012 and 0.026 d−1 (kpa in Table A1 of Abramoff et al., 2022), which translates to an average aggregation time of 1–3 months. However, the optimized rate of aggregate formation for the MAOM pool is between 0.0038 and 0.0052 d−1 (kma in Table A1 of Abramoff et al., 2022), giving MAOM an average aggregation time of 6–8 months. The Aggregate C pool has a breakdown rate of around 0.02 d−1 (kb in Table A1 of Abramoff et al., 2022), and thus aggregates have a turnover time of just 50 d. POM and MAOM exchange their carbon rapidly with the Aggregate C pool, which then redistributes the carbon back to the POM and MAOM pools in less than 2 months on average. This means that, under the assumption of well-mixed pools, the 14C signals of the POM, MAOM, and Aggregate C pools get homogenized within a couple years.
The results and analysis in Sect. 3.3 on the dependency of observed and predicted Δ14C on environmental parameters could potentially be biased due to the different sampling years of soil profiles with different environmental parameters. While there is no strong relationship between soil temperature and the sampling year (Fig. S1.4), it turns out that most of the profiles with higher clay content (> 20 %) were sampled before 2005 and those with lower clay content (< 20 %) were sampled after 2005 (Fig. S1.3). Even though the data shown in Fig. 8 only span a period of 18 years (1997–2015), the rapid changes in atmospheric Δ14CO2 in the post-bomb period could mean that the regression lines of Δ14C against clay in panels (d)–(f) are biased. We can attempt to remove this bias by “normalizing” the Δ14C data to the year 2000. The predicted Δ14C data are normalized simply by selecting the model output for 1 July 2000. The normalized Δ14C predictions for all models, profiles, and soil fractions are reported in Table S5. Normalizing the observed Δ14C data, however, is highly problematic, especially in the context of this paper, because it requires the use of a simplistic soil carbon model. Following the normalization method used in Shi et al. (2020) and Heckman et al. (2022), we fit a steady-state linear one-pool model to the observed Δ14C data and then predict the Δ14C in the year 2000 with the fitted model. Table S5 in the Supplement lists the normalized Δ14C from the observed data, as well as the turnover rate of the one-pool model fitted with scipy.optimize.minimize in Python and whether optimization terminated successfully, for each soil fraction and each profile. We then remade Figs. 7 and 8 with all the Δ14C data normalized to the year 2000 (see Figs. S.1.1.31 and S.1.1.25, respectively). Although normalization slightly shifted some of the Δ14C data, the slopes of the regression lines through the Δ14C data essentially remained the same. Therefore, our analysis and interpretation of the results presented in Sect. 3.3 are likely not affected by the different sampling years.
The source code to download the input data, run the models, and reproduce all the results presented in this paper and the supplementary material is available from our GitHub repository https://github.com/asb219/evaluate-SOC-models (last access: 30 July 2024), published on Zenodo at https://doi.org/10.5281/zenodo.10575139 (Brunmayr, 2024).
The supplement related to this article is available online at: https://doi.org/10.5194/gmd-17-5961-2024-supplement.
Conceptualization: ASB and HDG. Data curation, formal analysis, methodology, software, validation, visualization, and original draft preparation: ASB. Investigation, and review and editing: ASB, HDG, FH, LIM, MMD. Supervision: HDG. Funding acquisition: HDG and FH.
The contact author has declared that none of the authors has any competing interests.
Publisher’s note: Copernicus Publications remains neutral with regard to jurisdictional claims made in the text, published maps, institutional affiliations, or any other geographical representation in this paper. While Copernicus Publications makes every effort to include appropriate place names, the final responsibility lies with the authors.
This research has been supported by the Swiss National Science Foundation through the Sinergia scheme (grant no. 193770).
This paper was edited by Marko Scholze and reviewed by Jeffrey Beem Miller and one anonymous referee.
Abramoff, R. and Xu, X.: rabramoff/Millennial: First release of Millennial V2, Zenodo [code], https://doi.org/10.5281/ZENODO.6353519, 2022. a
Abramoff, R. Z., Xu, X., Hartman, M., O'Brien, S., Feng, W., Davidson, E., Finzi, A., Moorhead, D., Schimel, J., Torn, M., and Mayes, M. A.: The Millennial model: in search of measurable pools and transformations for modeling soil carbon in the new century, Biogeochemistry, 137, 51–71, https://doi.org/10.1007/s10533-017-0409-7, 2018. a
Abramoff, R. Z., Guenet, B., Zhang, H., Georgiou, K., Xu, X., Viscarra Rossel, R. A., Yuan, W., and Ciais, P.: Improved global-scale predictions of soil carbon stocks with Millennial Version 2, Soil Biol. Biochem., 164, 108466, https://doi.org/10.1016/j.soilbio.2021.108466, 2022. a, b, c, d, e, f, g, h, i, j, k, l, m, n, o, p
Ahrens, B., Braakhekke, M. C., Guggenberger, G., Schrumpf, M., and Reichstein, M.: Contribution of sorption, DOC transport and microbial interactions to the 14C age of a soil organic carbon profile: Insights from a calibrated process model, Soil Biol. Biochem., 88, 390–402, https://doi.org/10.1016/j.soilbio.2015.06.008, 2015. a
Ahrens, B., Guggenberger, G., Rethemeyer, J., John, S., Marschner, B., Heinze, S., Angst, G., Mueller, C. W., Kögel-Knabner, I., Leuschner, C., Hertel, D., Bachmann, J., Reichstein, M., and Schrumpf, M.: Combination of energy limitation and sorption capacity explains 14C depth gradients, Soil Biol Biochem., 148, 107912, https://doi.org/10.1016/j.soilbio.2020.107912, 2020. a, b
Armstrong, D. G., Cook, H., and Thomas, B.: The lignin and cellulose contents of certain grassland species at different stages of growth, J. Agr. Sci., 40, 93–99, https://doi.org/10.1017/S002185960004555X, 1950. a
Arora, V. K., Katavouta, A., Williams, R. G., Jones, C. D., Brovkin, V., Friedlingstein, P., Schwinger, J., Bopp, L., Boucher, O., Cadule, P., Chamberlain, M. A., Christian, J. R., Delire, C., Fisher, R. A., Hajima, T., Ilyina, T., Joetzjer, E., Kawamiya, M., Koven, C. D., Krasting, J. P., Law, R. M., Lawrence, D. M., Lenton, A., Lindsay, K., Pongratz, J., Raddatz, T., Séférian, R., Tachiiri, K., Tjiputra, J. F., Wiltshire, A., Wu, T., and Ziehn, T.: Carbon–concentration and carbon–climate feedbacks in CMIP6 models and their comparison to CMIP5 models, Biogeosciences, 17, 4173–4222, https://doi.org/10.5194/bg-17-4173-2020, 2020. a
Baisden, W. T., Amundson, R., Cook, A. C., and Brenner, D. L.: Turnover and storage of C and N in five density fractions from California annual grassland surface soils, Global Biogeochem. Cy., 16, 64-1–64-16, https://doi.org/10.1029/2001GB001822, 2002. a, b, c, d
Basile-Doelsch, I., Balesdent, J., and Pellerin, S.: Reviews and syntheses: The mechanisms underlying carbon storage in soil, Biogeosciences, 17, 5223–5242, https://doi.org/10.5194/bg-17-5223-2020, 2020. a, b, c, d, e
Berhe, A. A., Harden, J. W., Torn, M. S., Kleber, M., Burton, S. D., and Harte, J.: Persistence of soil organic matter in eroding versus depositional landform positions, J. Geophys. Res.-Biogeo., 117, G02019, https://doi.org/10.1029/2011JG001790, 2012. a
Braakhekke, M. C., Beer, C., Hoosbeek, M. R., Reichstein, M., Kruijt, B., Schrumpf, M., and Kabat, P.: SOMPROF: A vertically explicit soil organic matter model, Ecol. Modell., 222, 1712–1730, https://doi.org/10.1016/j.ecolmodel.2011.02.015, 2011. a, b
Braakhekke, M. C., Wutzler, T., Beer, C., Kattge, J., Schrumpf, M., Ahrens, B., Schöning, I., Hoosbeek, M. R., Kruijt, B., Kabat, P., and Reichstein, M.: Modeling the vertical soil organic matter profile using Bayesian parameter estimation, Biogeosciences, 10, 399–420, https://doi.org/10.5194/bg-10-399-2013, 2013. a
Braakhekke, M. C., Beer, C., Schrumpf, M., Ekici, A., Ahrens, B., Hoosbeek, M. R., Kruijt, B., Kabat, P., and Reichstein, M.: The use of radiocarbon to constrain current and future soil organic matter turnover and transport in a temperate forest, J. Geophys. Res.-Biogeo., 119, 372–391, https://doi.org/10.1002/2013JG002420, 2014. a, b, c
Brunmayr, A. S.: asb219/evaluate-SOC-models, Zenodo [code], https://doi.org/10.5281/zenodo.10575139, 2024. a, b
Cerli, C., Celi, L., Kalbitz, K., Guggenberger, G., and Kaiser, K.: Separation of light and heavy organic matter fractions in soil – Testing for proper density cut-off and dispersion level, Geoderma, 170, 403–416, https://doi.org/10.1016/j.geoderma.2011.10.009, 2012. a
Chen, J., Zhu, Q., Riley, W. J., He, Y., Randerson, J. T., and Trumbore, S.: Comparison With Global Soil Radiocarbon Observations Indicates Needed Carbon Cycle Improvements in the E3SM Land Model, J. Geophys. Res.-Biogeo., 124, 1098–1114, https://doi.org/10.1029/2018JG004795, 2019. a
Clark, D. B., Mercado, L. M., Sitch, S., Jones, C. D., Gedney, N., Best, M. J., Pryor, M., Rooney, G. G., Essery, R. L. H., Blyth, E., Boucher, O., Harding, R. J., Huntingford, C., and Cox, P. M.: The Joint UK Land Environment Simulator (JULES), model description – Part 2: Carbon fluxes and vegetation dynamics, Geosci. Model Dev., 4, 701–722, https://doi.org/10.5194/gmd-4-701-2011, 2011. a
Coleman, K. and Jenkinson, D. S.: RothC-26.3 - A Model for the turnover of carbon in soil, in: Evaluation of Soil Organic Matter Models, edited by: Powlson, D. S., Smith, P., and Smith, J. U., Springer Berlin Heidelberg, Berlin, Heidelberg, 237–246, ISBN 978-3-642-64692-8 978-3-642-61094-3, https://doi.org/10.1007/978-3-642-61094-3_17, 1996. a, b
Crowther, T. W., Van Den Hoogen, J., Wan, J., Mayes, M. A., Keiser, A. D., Mo, L., Averill, C., and Maynard, D. S.: The global soil community and its influence on biogeochemistry, Science, 365, eaav0550, https://doi.org/10.1126/science.aav0550, 2019. a
Danabasoglu, G., Lamarque, J.-F., Bacmeister, J., Bailey, D. A., DuVivier, A. K., Edwards, J., Emmons, L. K., Fasullo, J., Garcia, R., Gettelman, A., Hannay, C., Holland, M. M., Large, W. G., Lauritzen, P. H., Lawrence, D. M., Lenaerts, J. T. M., Lindsay, K., Lipscomb, W. H., Mills, M. J., Neale, R., Oleson, K. W., Otto-Bliesner, B., Phillips, A. S., Sacks, W., Tilmes, S., Kampenhout, L., Vertenstein, M., Bertini, A., Dennis, J., Deser, C., Fischer, C., Fox-Kemper, B., Kay, J. E., Kinnison, D., Kushner, P. J., Larson, V. E., Long, M. C., Mickelson, S., Moore, J. K., Nienhouse, E., Polvani, L., Rasch, P. J., and Strand, W. G.: The Community Earth System Model Version 2 (CESM2), J. Adv. Model. Earth Sy., 12, e2019MS001916, https://doi.org/10.1029/2019MS001916, 2020. a
Doetterl, S., Stevens, A., Six, J., Merckx, R., Van Oost, K., Casanova Pinto, M., Casanova-Katny, A., Muñoz, C., Boudin, M., Zagal Venegas, E., and Boeckx, P.: Soil carbon storage controlled by interactions between geochemistry and climate, Nat. Geosci., 8, 780–783, https://doi.org/10.1038/ngeo2516, 2015. a
Dungait, J. A. J., Hopkins, D. W., Gregory, A. S., and Whitmore, A. P.: Soil organic matter turnover is governed by accessibility not recalcitrance, Glob. Change Biol., 18, 1781–1796, https://doi.org/10.1111/j.1365-2486.2012.02665.x, 2012. a
Eckmeier, E., Van der Borg, K., Tegtmeier, U., Schmidt, M. W. I., and Gerlach, R.: Dating Charred Soil Organic Matter: Comparison of Radiocarbon Ages from Macrocharcoals and Chemically Separated Charcoal Carbon, Radiocarbon, 51, 437–443, https://doi.org/10.1017/S0033822200055831, 2009. a
Fan, X., Gao, D., Zhao, C., Wang, C., Qu, Y., Zhang, J., and Bai, E.: Improved model simulation of soil carbon cycling by representing the microbially derived organic carbon pool, ISME J., 15, 2248–2263, https://doi.org/10.1038/s41396-021-00914-0, 2021. a
Friedlingstein, P., Meinshausen, M., Arora, V. K., Jones, C. D., Anav, A., Liddicoat, S. K., and Knutti, R.: Uncertainties in CMIP5 Climate Projections due to Carbon Cycle Feedbacks, J. Climate, 27, 511–526, https://doi.org/10.1175/JCLI-D-12-00579.1, 2014. a
Friedlingstein, P., O'Sullivan, M., Jones, M. W., Andrew, R. M., Gregor, L., Hauck, J., Le Quéré, C., Luijkx, I. T., Olsen, A., Peters, G. P., Peters, W., Pongratz, J., Schwingshackl, C., Sitch, S., Canadell, J. G., Ciais, P., Jackson, R. B., Alin, S. R., Alkama, R., Arneth, A., Arora, V. K., Bates, N. R., Becker, M., Bellouin, N., Bittig, H. C., Bopp, L., Chevallier, F., Chini, L. P., Cronin, M., Evans, W., Falk, S., Feely, R. A., Gasser, T., Gehlen, M., Gkritzalis, T., Gloege, L., Grassi, G., Gruber, N., Gürses, Ö., Harris, I., Hefner, M., Houghton, R. A., Hurtt, G. C., Iida, Y., Ilyina, T., Jain, A. K., Jersild, A., Kadono, K., Kato, E., Kennedy, D., Klein Goldewijk, K., Knauer, J., Korsbakken, J. I., Landschützer, P., Lefèvre, N., Lindsay, K., Liu, J., Liu, Z., Marland, G., Mayot, N., McGrath, M. J., Metzl, N., Monacci, N. M., Munro, D. R., Nakaoka, S.-I., Niwa, Y., O'Brien, K., Ono, T., Palmer, P. I., Pan, N., Pierrot, D., Pocock, K., Poulter, B., Resplandy, L., Robertson, E., Rödenbeck, C., Rodriguez, C., Rosan, T. M., Schwinger, J., Séférian, R., Shutler, J. D., Skjelvan, I., Steinhoff, T., Sun, Q., Sutton, A. J., Sweeney, C., Takao, S., Tanhua, T., Tans, P. P., Tian, X., Tian, H., Tilbrook, B., Tsujino, H., Tubiello, F., van der Werf, G. R., Walker, A. P., Wanninkhof, R., Whitehead, C., Willstrand Wranne, A., Wright, R., Yuan, W., Yue, C., Yue, X., Zaehle, S., Zeng, J., and Zheng, B.: Global Carbon Budget 2022, Earth Syst. Sci. Data, 14, 4811–4900, https://doi.org/10.5194/essd-14-4811-2022, 2022. a
Gan, T.: CSDMS SoilGrids Data Component, Zenodo [code], https://doi.org/10.5281/ZENODO.10368883, 2023. a
Gaudinski, J. B., Trumbore, S. E., Davidson, E. A., and Zheng, S.: Soil carbon cycling in a temperate forest: radiocarbon-based estimates of residence times, sequestration rates and partitioning of fluxes, Biogeochemistry, 51, 33–69, https://doi.org/10.1023/A:1006301010014, 2000. a, b
Georgiou, K., Koven, C. D., Wieder, W. R., Hartman, M. D., Riley, W. J., Pett-Ridge, J., Bouskill, N. J., Abramoff, R. Z., Slessarev, E. W., Ahlström, A., Parton, W. J., Pellegrini, A. F. A., Pierson, D., Sulman, B. N., Zhu, Q., and Jackson, R. B.: Emergent temperature sensitivity of soil organic carbon driven by mineral associations, Nat. Geosci., 17, 205–212, https://doi.org/10.1038/s41561-024-01384-7, 2024. a
German, D. P., Marcelo, K. R. B., Stone, M. M., and Allison, S. D.: The Michaelis-Menten kinetics of soil extracellular enzymes in response to temperature: a cross-latitudinal study, Glob.Change Biol., 18, 1468–1479, https://doi.org/10.1111/j.1365-2486.2011.02615.x, 2012. a
Golchin, A., Oades, J., Skjemstad, J., and Clarke, P.: Study of free and occluded particulate organic matter in soils by solid state 13C CP/MAS NMR spectroscopy and scanning electron microscopy, Soil Res., 32, 285, https://doi.org/10.1071/SR9940285, 1994. a
González-Domínguez, B., Niklaus, P. A., Studer, M. S., Hagedorn, F., Wacker, L., Haghipour, N., Zimmermann, S., Walthert, L., McIntyre, C., and Abiven, S.: Temperature and moisture are minor drivers of regional-scale soil organic carbon dynamics, Sci. Rep., 9, 6422, https://doi.org/10.1038/s41598-019-42629-5, 2019. a, b
Grant, K., Hilton, R., and Galy, V.: Global patterns of radiocarbon depletion in subsoil linked to rock-derived organic carbon, Geochem. Perspect. Lett., 25, 36–40, https://doi.org/10.7185/geochemlet.2312, 2023. a
Graven, H., Allison, C. E., Etheridge, D. M., Hammer, S., Keeling, R. F., Levin, I., Meijer, H. A. J., Rubino, M., Tans, P. P., Trudinger, C. M., Vaughn, B. H., and White, J. W. C.: Compiled records of carbon isotopes in atmospheric CO2 for historical simulations in CMIP6, Geosci. Model Dev., 10, 4405–4417, https://doi.org/10.5194/gmd-10-4405-2017, 2017. a, b, c, d
Graven, H., Keeling, R. F., and Rogelj, J.: Changes to Carbon Isotopes in Atmospheric CO2 Over the Industrial Era and Into the Future, Global Biogeochem. Cy., 34, e2019GB006170, https://doi.org/10.1029/2019GB006170, 2020. a
Griepentrog, M., Bodé, S., Boeckx, P., Hagedorn, F., Heim, A., and Schmidt, M. W. I.: Nitrogen deposition promotes the production of new fungal residues but retards the decomposition of old residues in forest soil fractions, Glob. Change Biol., 20, 327–340, https://doi.org/10.1111/gcb.12374, 2014. a
Griepentrog, M., Eglinton, T. I., Hagedorn, F., Schmidt, M. W. I., and Wiesenberg, G. L. B.: Interactive effects of elevated CO2 and nitrogen deposition on fatty acid molecular and isotope composition of above- and belowground tree biomass and forest soil fractions, Glob. Change Biol., 21, 473–486, https://doi.org/10.1111/gcb.12666, 2015. a
Hajdas, I., Schlumpf, N., Minikus-Stary, N., Hagedorn, F., Eckmeier, E., Schoch, W., Burga, C., Bonani, G., Schmidt, M. W., and Cherubini, P.: Radiocarbon ages of soil charcoals from the southern Alps, Ticino, Switzerland, Nucl. Instrum. Meth. B, 259, 398–402, https://doi.org/10.1016/j.nimb.2007.02.075, 2007. a
Harden, J. W., Fries, T. L., and Pavich, M. J.: Cycling of Beryllium and Carbon through hillslope soils in Iowa, Biogeochemistry, 60, 317–336, https://doi.org/10.1023/A:1020308729553, 2002. a
He, Y., Trumbore, S. E., Torn, M. S., Harden, J. W., Vaughn, L. J. S., Allison, S. D., and Randerson, J. T.: Radiocarbon constraints imply reduced carbon uptake by soils during the 21st century, Science, 353, 1419–1424, https://doi.org/10.1126/science.aad4273, 2016. a, b, c, d
Heckman, K.: Pedogenesis & Carbon Dynamics Across A Lithosequence Under Ponderosa Pine, Ph.D. thesis, Zenodo, https://doi.org/10.5281/zenodo.1486081, 2010. a
Heckman, K., Lawrence, C. R., and Harden, J. W.: A sequential selective dissolution method to quantify storage and stability of organic carbon associated with Al and Fe hydroxide phases, Geoderma, 312, 24–35, https://doi.org/10.1016/j.geoderma.2017.09.043, 2018. a
Heckman, K., Hicks Pries, C. E., Lawrence, C. R., Rasmussen, C., Crow, S. E., Hoyt, A. M., Von Fromm, S. F., Shi, Z., Stoner, S., McGrath, C., Beem-Miller, J., Berhe, A. A., Blankinship, J. C., Keiluweit, M., Marín-Spiotta, E., Monroe, J. G., Plante, A. F., Schimel, J., Sierra, C. A., Thompson, A., and Wagai, R.: Beyond bulk: Density fractions explain heterogeneity in global soil carbon abundance and persistence, Glob. Change Biol., 28, 1178–1196, https://doi.org/10.1111/gcb.16023, 2022. a, b
Herrera-Ramírez, D., Muhr, J., Hartmann, H., Römermann, C., Trumbore, S., and Sierra, C. A.: Probability distributions of nonstructural carbon ages and transit times provide insights into carbon allocation dynamics of mature trees, New Phytol., 226, 1299–1311, https://doi.org/10.1111/nph.16461, 2020. a
Hicks Pries, C. E., Castanha, C., Porras, R. C., and Torn, M. S.: The whole-soil carbon flux in response to warming, Science, 355, 1420–1423, https://doi.org/10.1126/science.aal1319, 2017. a
Hicks Pries, C. E., Sulman, B. N., West, C., O'Neill, C., Poppleton, E., Porras, R. C., Castanha, C., Zhu, B., Wiedemeier, D. B., and Torn, M. S.: Root litter decomposition slows with soil depth, Soil Biol. Biochem., 125, 103–114, https://doi.org/10.1016/j.soilbio.2018.07.002, 2018. a
IBS Center for Climate Physics, National Center for Atmospheric Research, Danabasoglu, G., Deser, C., Rodgers, K., and Timmermann, A.: CESM2 Large Ensemble Community Project, https://doi.org/10.26024/KGMP-C556, 2021. a
International Soil Radiocarbon Database: ISRaD database files (v 2.5.5.2023-09-20), GitHub [code], https://github.com/International-Soil-Radiocarbon-Database/ISRaD/blob/629b14634d0ddaadf523c662f2cc45b4dad29ae5/ISRaD_data_files/database/ISRaD_database_files.zip (last access: 30 July 2024), 2023. a
ISIMIP: ISIMIP Repository, https://data.isimip.org, last access: 30 July 2024. a
Jagadamma, S., Lal, R., Ussiri, D. A. N., Trumbore, S. E., and Mestelan, S.: Evaluation of structural chemistry and isotopic signatures of refractory soil organic carbon fraction isolated by wet oxidation methods, Biogeochemistry, 98, 29–44, https://doi.org/10.1007/s10533-009-9374-0, 2010. a
Kleber, M., Nico, P. S., Plante, A., Filley, T., Kramer, M., Swanston, C., and Sollins, P.: Old and stable soil organic matter is not necessarily chemically recalcitrant: implications for modeling concepts and temperature sensitivity, Glob. Change Biol., 17, 1097–1107, https://doi.org/10.1111/j.1365-2486.2010.02278.x, 2011. a, b
Kleber, M., Eusterhues, K., Keiluweit, M., Mikutta, C., Mikutta, R., and Nico, P. S.: Mineral–Organic Associations: Formation, Properties, and Relevance in Soil Environments, in: Advances in Agronomy, Elsevier, vol. 130, 1–140, ISBN 978-0-12-802137-8, https://doi.org/10.1016/bs.agron.2014.10.005, 2015. a
Koven, C. D., Riley, W. J., Subin, Z. M., Tang, J. Y., Torn, M. S., Collins, W. D., Bonan, G. B., Lawrence, D. M., and Swenson, S. C.: The effect of vertically resolved soil biogeochemistry and alternate soil C and N models on C dynamics of CLM4, Biogeosciences, 10, 7109–7131, https://doi.org/10.5194/bg-10-7109-2013, 2013. a
Kyker-Snowman, E.: EmilyKykerSnowman/MIMICS-CN-for-publication v1.0, Zenodo [code], https://doi.org/10.5281/ZENODO.3534561, 2019. a
Kyker-Snowman, E., Wieder, W. R., Frey, S. D., and Grandy, A. S.: Stoichiometrically coupled carbon and nitrogen cycling in the MIcrobial-MIneral Carbon Stabilization model version 1.0 (MIMICS-CN v1.0), Geosci. Model Dev., 13, 4413–4434, https://doi.org/10.5194/gmd-13-4413-2020, 2020. a, b, c, d, e, f, g, h, i, j, k, l, m
Lavallee, J. M., Soong, J. L., and Cotrufo, M. F.: Conceptualizing soil organic matter into particulate and mineral-associated forms to address global change in the 21st century, Glob. Change Biol., 26, 261–273, https://doi.org/10.1111/gcb.14859, 2020. a, b, c, d
Lawrence, C. R., Beem-Miller, J., Hoyt, A. M., Monroe, G., Sierra, C. A., Stoner, S., Heckman, K., Blankinship, J. C., Crow, S. E., McNicol, G., Trumbore, S., Levine, P. A., Vindušková, O., Todd-Brown, K., Rasmussen, C., Hicks Pries, C. E., Schädel, C., McFarlane, K., Doetterl, S., Hatté, C., He, Y., Treat, C., Harden, J. W., Torn, M. S., Estop-Aragonés, C., Asefaw Berhe, A., Keiluweit, M., Della Rosa Kuhnen, Á., Marin-Spiotta, E., Plante, A. F., Thompson, A., Shi, Z., Schimel, J. P., Vaughn, L. J. S., von Fromm, S. F., and Wagai, R.: An open-source database for the synthesis of soil radiocarbon data: International Soil Radiocarbon Database (ISRaD) version 1.0, Earth Syst. Sci. Data, 12, 61–76, https://doi.org/10.5194/essd-12-61-2020, 2020. a, b, c, d
Lawrence, D. M., Fisher, R. A., Koven, C. D., Oleson, K. W., Swenson, S. C., Bonan, G., Collier, N., Ghimire, B., Kampenhout, L., Kennedy, D., Kluzek, E., Lawrence, P. J., Li, F., Li, H., Lombardozzi, D., Riley, W. J., Sacks, W. J., Shi, M., Vertenstein, M., Wieder, W. R., Xu, C., Ali, A. A., Badger, A. M., Bisht, G., Broeke, M., Brunke, M. A., Burns, S. P., Buzan, J., Clark, M., Craig, A., Dahlin, K., Drewniak, B., Fisher, J. B., Flanner, M., Fox, A. M., Gentine, P., Hoffman, F., Keppel-Aleks, G., Knox, R., Kumar, S., Lenaerts, J., Leung, L. R., Lipscomb, W. H., Lu, Y., Pandey, A., Pelletier, J. D., Perket, J., Randerson, J. T., Ricciuto, D. M., Sanderson, B. M., Slater, A., Subin, Z. M., Tang, J., Thomas, R. Q., Val Martin, M., and Zeng, X.: The Community Land Model Version 5: Description of New Features, Benchmarking, and Impact of Forcing Uncertainty, J. Adv. Model. Earth Sy., 11, 4245–4287, https://doi.org/10.1029/2018MS001583, 2019. a
Lehmann, J. and Kleber, M.: The contentious nature of soil organic matter, Nature, 528, 60–68, https://doi.org/10.1038/nature16069, 2015. a, b
Leifeld, J.: Biased 14C-derived organic carbon turnover estimates following black carbon input to soil: an exploration with RothC, Biogeochemistry, 88, 205–211, https://doi.org/10.1007/s10533-008-9209-4, 2008. a, b
Leifeld, J., Zimmermann, M., and Fuhrer, J.: Simulating decomposition of labile soil organic carbon: Effects of pH, Soil Biol. Biochem., 40, 2948–2951, https://doi.org/10.1016/j.soilbio.2008.08.019, 2008. a
Leifeld, J., Zimmermann, M., Fuhrer, J., and Conen, F.: Storage and turnover of carbon in grassland soils along an elevation gradient in the Swiss Alps, Glob. Change Biol., 15, 668–679, https://doi.org/10.1111/j.1365-2486.2008.01782.x, 2009. a, b, c
Liu, K., Xu, Y., Feng, W., Zhang, X., Yao, S., and Zhang, B.: Modeling the dynamics of protected and primed organic carbon in soil and aggregates under constant soil moisture following litter incorporation, Soil Biol. Biochem., 151, 108039, https://doi.org/10.1016/j.soilbio.2020.108039, 2020. a
Lybrand, R. A., Heckman, K., and Rasmussen, C.: Soil organic carbon partitioning and 14C variation in desert and conifer ecosystems of southern Arizona, Biogeochemistry, 134, 261–277, https://doi.org/10.1007/s10533-017-0360-7, 2017. a
Malamoud, K., McBratney, A. B., Minasny, B., and Field, D. J.: Modelling how carbon affects soil structure, Geoderma, 149, 19–26, https://doi.org/10.1016/j.geoderma.2008.10.018, 2009. a
Marín-Spiotta, E., Swanston, C. W., Torn, M. S., Silver, W. L., and Burton, S. D.: Chemical and mineral control of soil carbon turnover in abandoned tropical pastures, Geoderma, 143, 49–62, https://doi.org/10.1016/j.geoderma.2007.10.001, 2008. a
McFarlane, K. J., Torn, M. S., Hanson, P. J., Porras, R. C., Swanston, C. W., Callaham, M. A., and Guilderson, T. P.: Comparison of soil organic matter dynamics at five temperate deciduous forests with physical fractionation and radiocarbon measurements, Biogeochemistry, 112, 457–476, https://doi.org/10.1007/s10533-012-9740-1, 2013. a
Meyer, S., Leifeld, J., Bahn, M., and Fuhrer, J.: Free and protected soil organic carbon dynamics respond differently to abandonment of mountain grassland, Biogeosciences, 9, 853–865, https://doi.org/10.5194/bg-9-853-2012, 2012. a, b
Mikutta, R., Turner, S., Schippers, A., Gentsch, N., Meyer-Stüve, S., Condron, L. M., Peltzer, D. A., Richardson, S. J., Eger, A., Hempel, G., Kaiser, K., Klotzbücher, T., and Guggenberger, G.: Microbial and abiotic controls on mineral-associated organic matter in soil profiles along an ecosystem gradient, Sci. Rep., 9, 10294, https://doi.org/10.1038/s41598-019-46501-4, 2019. a
Moore, J. A. M., Sulman, B. N., Mayes, M. A., Patterson, C. M., and Classen, A. T.: Plant roots stimulate the decomposition of complex, but not simple, soil carbon, Funct. Ecol., 34, 899–910, https://doi.org/10.1111/1365-2435.13510, 2020. a, b, c, d, e
Parton, W. J., Schimel, D. S., Cole, C. V., and Ojima, D. S.: Analysis of Factors Controlling Soil Organic Matter Levels in Great Plains Grasslands, Soil Sci. Soc. Am. J., 51, 1173–1179, https://doi.org/10.2136/sssaj1987.03615995005100050015x, 1987. a, b
Poeplau, C., Don, A., Six, J., Kaiser, M., Benbi, D., Chenu, C., Cotrufo, M. F., Derrien, D., Gioacchini, P., Grand, S., Gregorich, E., Griepentrog, M., Gunina, A., Haddix, M., Kuzyakov, Y., Kühnel, A., Macdonald, L. M., Soong, J., Trigalet, S., Vermeire, M.-L., Rovira, P., van Wesemael, B., Wiesmeier, M., Yeasmin, S., Yevdokimov, I., and Nieder, R.: Isolating organic carbon fractions with varying turnover rates in temperate agricultural soils – A comprehensive method comparison, Soil Biol. Biochem., 125, 10–26, https://doi.org/10.1016/j.soilbio.2018.06.025, 2018. a, b, c
Poggio, L., de Sousa, L. M., Batjes, N. H., Heuvelink, G. B. M., Kempen, B., Ribeiro, E., and Rossiter, D.: SoilGrids 2.0: producing soil information for the globe with quantified spatial uncertainty, SOIL, 7, 217–240, https://doi.org/10.5194/soil-7-217-2021, 2021. a, b
Rahman, M. M., Tsukamoto, J., Rahman, M. M., Yoneyama, A., and Mostafa, K. M.: Lignin and its effects on litter decomposition in forest ecosystems, Chem. Ecol., 29, 540–553, https://doi.org/10.1080/02757540.2013.790380, 2013. a
Rasmussen, C., Heckman, K., Wieder, W. R., Keiluweit, M., Lawrence, C. R., Berhe, A. A., Blankinship, J. C., Crow, S. E., Druhan, J. L., Hicks Pries, C. E., Marin-Spiotta, E., Plante, A. F., Schädel, C., Schimel, J. P., Sierra, C. A., Thompson, A., and Wagai, R.: Beyond clay: towards an improved set of variables for predicting soil organic matter content, Biogeochemistry, 137, 297–306, https://doi.org/10.1007/s10533-018-0424-3, 2018a. a
Rasmussen, C., Throckmorton, H., Liles, G., Heckman, K., Meding, S., and Horwath, W.: Controls on Soil Organic Carbon Partitioning and Stabilization in the California Sierra Nevada, Soil Syst., 2, 41, https://doi.org/10.3390/soilsystems2030041, 2018b. a
Reisser, M., Purves, R. S., Schmidt, M. W. I., and Abiven, S.: Pyrogenic Carbon in Soils: A Literature-Based Inventory and a Global Estimation of Its Content in Soil Organic Carbon and Stocks, Front. Earth Sci., 4, 80, https://doi.org/10.3389/feart.2016.00080, 2016. a
Roberts, M. L. and Southon, J. R.: A Preliminary Determination of the Absolute 14C/12C Ratio of OX-I, Radiocarbon, 49, 441–445, https://doi.org/10.1017/S0033822200042363, 2007. a
Robertson, A. D., Paustian, K., Ogle, S., Wallenstein, M. D., Lugato, E., and Cotrufo, M. F.: Unifying soil organic matter formation and persistence frameworks: the MEMS model, Biogeosciences, 16, 1225–1248, https://doi.org/10.5194/bg-16-1225-2019, 2019. a
Rodgers, K. B., Lee, S.-S., Rosenbloom, N., Timmermann, A., Danabasoglu, G., Deser, C., Edwards, J., Kim, J.-E., Simpson, I. R., Stein, K., Stuecker, M. F., Yamaguchi, R., Bódai, T., Chung, E.-S., Huang, L., Kim, W. M., Lamarque, J.-F., Lombardozzi, D. L., Wieder, W. R., and Yeager, S. G.: Ubiquity of human-induced changes in climate variability, Earth Syst. Dynam., 12, 1393–1411, https://doi.org/10.5194/esd-12-1393-2021, 2021. a, b
Rosenzweig, C., Arnell, N. W., Ebi, K. L., Lotze-Campen, H., Raes, F., Rapley, C., Smith, M. S., Cramer, W., Frieler, K., Reyer, C. P. O., Schewe, J., Van Vuuren, D., and Warszawski, L.: Assessing inter-sectoral climate change risks: the role of ISIMIP, Environ. Res. Lett., 12, 010301, https://doi.org/10.1088/1748-9326/12/1/010301, 2017. a
Rowley, M. C., Grand, S., and Verrecchia, E. P.: Calcium-mediated stabilisation of soil organic carbon, Biogeochemistry, 137, 27–49, https://doi.org/10.1007/s10533-017-0410-1, 2018. a
Salazar, A., Sulman, B. N., and Dukes, J. S.: Microbial dormancy promotes microbial biomass and respiration across pulses of drying-wetting stress, Soil Biol. Biochem., 116, 237–244, https://doi.org/10.1016/j.soilbio.2017.10.017, 2018. a
Schimel, J.: Modeling ecosystem-scale carbon dynamics in soil: The microbial dimension, Soil Biol. Biochem., 178, 108948, https://doi.org/10.1016/j.soilbio.2023.108948, 2023. a
Schmidt, M. W. I., Torn, M. S., Abiven, S., Dittmar, T., Guggenberger, G., Janssens, I. A., Kleber, M., Kögel-Knabner, I., Lehmann, J., Manning, D. A. C., Nannipieri, P., Rasse, D. P., Weiner, S., and Trumbore, S. E.: Persistence of soil organic matter as an ecosystem property, Nature, 478, 49–56, https://doi.org/10.1038/nature10386, 2011. a
Schrumpf, M. and Kaiser, K.: Large differences in estimates of soil organic carbon turnover in density fractions by using single and repeated radiocarbon inventories, Geoderma, 239-240, 168–178, https://doi.org/10.1016/j.geoderma.2014.09.025, 2015. a
Schrumpf, M., Kaiser, K., Guggenberger, G., Persson, T., Kögel-Knabner, I., and Schulze, E.-D.: Storage and stability of organic carbon in soils as related to depth, occlusion within aggregates, and attachment to minerals, Biogeosciences, 10, 1675–1691, https://doi.org/10.5194/bg-10-1675-2013, 2013. a, b, c, d, e
Schrumpf, M., Kaiser, K., Mayer, A., Hempel, G., and Trumbore, S.: Age distribution, extractability, and stability of mineral-bound organic carbon in central European soils, Biogeosciences, 18, 1241–1257, https://doi.org/10.5194/bg-18-1241-2021, 2021. a, b
Segoli, M., De Gryze, S., Dou, F., Lee, J., Post, W., Denef, K., and Six, J.: AggModel: A soil organic matter model with measurable pools for use in incubation studies, Ecol. Modell., 263, 1–9, https://doi.org/10.1016/j.ecolmodel.2013.04.010, 2013. a
Shi, Z., Allison, S. D., He, Y., Levine, P. A., Hoyt, A. M., Beem-Miller, J., Zhu, Q., Wieder, W. R., Trumbore, S., and Randerson, J. T.: The age distribution of global soil carbon inferred from radiocarbon measurements, Nat. Geosci., 13, 555–559, https://doi.org/10.1038/s41561-020-0596-z, 2020. a
Sierra, C. A., Trumbore, S. E., Davidson, E. A., Vicca, S., and Janssens, I.: Sensitivity of decomposition rates of soil organic matter with respect to simultaneous changes in temperature and moisture, J. Adv. Model. Earth Sy., 7, 335–356, https://doi.org/10.1002/2014MS000358, 2015. a
Sierra, C. A., Müller, M., Metzler, H., Manzoni, S., and Trumbore, S. E.: The muddle of ages, turnover, transit, and residence times in the carbon cycle, Glob. Change Biol., 23, 1763–1773, https://doi.org/10.1111/gcb.13556, 2017. a
Solly, E. F., Brunner, I., Helmisaari, H.-S., Herzog, C., Leppälammi-Kujansuu, J., Schöning, I., Schrumpf, M., Schweingruber, F. H., Trumbore, S. E., and Hagedorn, F.: Unravelling the age of fine roots of temperate and boreal forests, Nat. Commun., 9, 3006, https://doi.org/10.1038/s41467-018-05460-6, 2018. a
Soucémarianadin, L., Reisser, M., Cécillon, L., Barré, P., Nicolas, M., and Abiven, S.: Pyrogenic carbon content and dynamics in top and subsoil of French forests, Soil Biol. Biochem., 133, 12–15, https://doi.org/10.1016/j.soilbio.2019.02.013, 2019. a
Stamati, F. E., Nikolaidis, N. P., Banwart, S., and Blum, W. E.: A coupled carbon, aggregation, and structure turnover (CAST) model for topsoils, Geoderma, 211-212, 51–64, https://doi.org/10.1016/j.geoderma.2013.06.014, 2013. a
Stoner, S. W., Schrumpf, M., Hoyt, A., Sierra, C. A., Doetterl, S., Galy, V., and Trumbore, S.: How well does ramped thermal oxidation quantify the age distribution of soil carbon? Assessing thermal stability of physically and chemically fractionated soil organic matter, Biogeosciences, 20, 3151–3163, https://doi.org/10.5194/bg-20-3151-2023, 2023. a
Sulman, B.: bsulman/CORPSE-fire-response: v1.0, Zenodo [code], https://doi.org/10.5281/ZENODO.10624992, 2024a. a, b, c
Sulman, B.: bsulman/CORPSE-N: v1.0, Zenodo [code], https://doi.org/10.5281/ZENODO.10624990, 2024b. a
Sulman, B. N., Phillips, R. P., Oishi, A. C., Shevliakova, E., and Pacala, S. W.: Microbe-driven turnover offsets mineral-mediated storage of soil carbon under elevated CO2, Nat. Clim. Change, 4, 1099–1102, https://doi.org/10.1038/nclimate2436, 2014. a, b, c, d, e, f
Sulman, B. N., Brzostek, E. R., Medici, C., Shevliakova, E., Menge, D. N. L., and Phillips, R. P.: Feedbacks between plant N demand and rhizosphere priming depend on type of mycorrhizal association, Ecol. Lett., 20, 1043–1053, https://doi.org/10.1111/ele.12802, 2017. a
Tian, H., Yang, J., Lu, C., Xu, R., Canadell, J. G., Jackson, R. B., Arneth, A., Chang, J., Chen, G., Ciais, P., Gerber, S., Ito, A., Huang, Y., Joos, F., Lienert, S., Messina, P., Olin, S., Pan, S., Peng, C., Saikawa, E., Thompson, R. L., Vuichard, N., Winiwarter, W., Zaehle, S., Zhang, B., Zhang, K., and Zhu, Q.: The Global N2O Model Intercomparison Project, B. Am. Meteorol. Soc., 99, 1231–1251, https://doi.org/10.1175/BAMS-D-17-0212.1, 2018. a
Tipping, E. and Rowe, E. C.: Modelling the physical states, element stoichiometries and residence times of topsoil organic matter, European J. Soil Sci., 70, 321–337, https://doi.org/10.1111/ejss.12785, 2019. a, b
Trumbore, S. E., Sierra, C. A., and Hicks Pries, C. E.: Radiocarbon Nomenclature, Theory, Models, and Interpretation: Measuring Age, Determining Cycling Rates, and Tracing Source Pools, in: Radiocarbon and Climate Change, edited by: Schuur, E. A., Druffel, E., and Trumbore, S. E., Springer International Publishing, Cham, 45–82, ISBN 978-3-319-25641-2, https://doi.org/10.1007/978-3-319-25643-6_3, 2016. a, b, c
Van der Voort, T. S., Zell, C. I., Hagedorn, F., Feng, X., McIntyre, C. P., Haghipour, N., Graf Pannatier, E., and Eglinton, T. I.: Diverse Soil Carbon Dynamics Expressed at the Molecular Level: Molecular Level Soil Carbon Dynamics, Geophys. Res. Lett., 44, 11840–11850, https://doi.org/10.1002/2017GL076188, 2017. a, b
van der Voort, T. S., Mannu, U., Hagedorn, F., McIntyre, C., Walthert, L., Schleppi, P., Haghipour, N., and Eglinton, T. I.: Dynamics of deep soil carbon – insights from 14C time series across a climatic gradient, Biogeosciences, 16, 3233–3246, https://doi.org/10.5194/bg-16-3233-2019, 2019. a
Vogel, C., Mueller, C. W., Höschen, C., Buegger, F., Heister, K., Schulz, S., Schloter, M., and Kögel-Knabner, I.: Submicron structures provide preferential spots for carbon and nitrogen sequestration in soils, Nat. Commun., 5, 2947, https://doi.org/10.1038/ncomms3947, 2014. a
von Lützow, M., Kögel-Knabner, I., Ekschmitt, K., Flessa, H., Guggenberger, G., Matzner, E., and Marschner, B.: SOM fractionation methods: Relevance to functional pools and to stabilization mechanisms, Soil Biol. Biochem., 39, 2183–2207, https://doi.org/10.1016/j.soilbio.2007.03.007, 2007. a, b, c
Wagai, R., Mayer, L. M., and Kitayama, K.: Nature of the “occluded” low-density fraction in soil organic matter studies: A critical review, Soil Sci. Plant Nutr., 55, 13–25, https://doi.org/10.1111/j.1747-0765.2008.00356.x, 2009. a, b
Wang, G.: Microbial-ENzyme Decomposition (MEND) model (commit 92323c7 in https://github.com/wanggangsheng/MEND), Zenodo [code], https://doi.org/10.5281/zenodo.10576664, 2024. a, b
Wang, G. and Brunmayr, A. S.: Microbial-ENzyme Decomposition (MEND) model – GitHub fork asb219/MEND, Zenodo [code], https://doi.org/10.5281/zenodo.11065513, 2024. a, b
Wang, G., Post, W. M., and Mayes, M. A.: Development of microbial-enzyme-mediated decomposition model parameters through steady-state and dynamic analyses, Ecol. Appl., 23, 255–272, https://doi.org/10.1890/12-0681.1, 2013. a
Wang, G., Jagadamma, S., Mayes, M. A., Schadt, C. W., Megan Steinweg, J., Gu, L., and Post, W. M.: Microbial dormancy improves development and experimental validation of ecosystem model, ISME J., 9, 226–237, https://doi.org/10.1038/ismej.2014.120, 2015. a
Wang, G., Gao, Q., Yang, Y., Hobbie, S. E., Reich, P. B., and Zhou, J.: Soil enzymes as indicators of soil function: A step toward greater realism in microbial ecological modeling, Glob. Change Biol., 28, 1935–1950, https://doi.org/10.1111/gcb.16036, 2022. a, b, c, d, e, f, g, h, i
Wang, Y.-P.: Vertically resolved soil carbon model (model codes and site data), CSIRO [data set], https://doi.org/10.25919/843A-W584, 2020. a, b, c
Wang, Y.-P., Zhang, H., Ciais, P., Goll, D., Huang, Y., Wood, J. D., Ollinger, S. V., Tang, X., and Prescher, A.-K.: Microbial Activity and Root Carbon Inputs Are More Important than Soil Carbon Diffusion in Simulating Soil Carbon Profiles, J. Geophys. Res.-Biogeo., 126, e2020JG006205, https://doi.org/10.1029/2020JG006205, 2021. a, b, c, d, e
Wickham, H., Hester, J., Chang, W., and Bryan, J.: devtools: Tools to Make Developing R Packages Easier, r package version 2.4.5, https://CRAN.R-project.org/package=devtools (last access: 30 July 2024), 2022. a
Wieder, W. R., Grandy, A. S., Kallenbach, C. M., and Bonan, G. B.: Integrating microbial physiology and physio-chemical principles in soils with the MIcrobial-MIneral Carbon Stabilization (MIMICS) model, Biogeosciences, 11, 3899–3917, https://doi.org/10.5194/bg-11-3899-2014, 2014. a
Wieder, W. R., Grandy, A. S., Kallenbach, C. M., Taylor, P. G., and Bonan, G. B.: Representing life in the Earth system with soil microbial functional traits in the MIMICS model, Geosci. Model Dev., 8, 1789–1808, https://doi.org/10.5194/gmd-8-1789-2015, 2015. a
Woolf, D.: domwoolf/somic1: SOMic v 1.00, Zenodo [code], https://doi.org/10.5281/ZENODO.10578048, 2024. a, b, c
Woolf, D. and Brunmayr, A. S.: SOMic – GitHub fork asb219/somic1, Zenodo [code], https://doi.org/10.5281/ZENODO.11068749, 2023. a, b
Woolf, D. and Lehmann, J.: Microbial models with minimal mineral protection can explain long-term soil organic carbon persistence, Sci. Rep., 9, 6522, https://doi.org/10.1038/s41598-019-43026-8, 2019. a, b, c, d, e, f, g, h, i, j
Xiao, L., Wang, G., Chang, J., Chen, Y., Guo, X., Mao, X., Wang, M., Zhang, S., Shi, Z., Luo, Y., Cheng, L., Yu, K., Mo, F., and Luo, Z.: Global depth distribution of belowground net primary productivity and its drivers, Global Ecol. Biogeogr., 32, 1435–1451, https://doi.org/10.1111/geb.13705, 2023. a
Yu, L., Ahrens, B., Wutzler, T., Schrumpf, M., and Zaehle, S.: Jena Soil Model (JSM v1.0; revision 1934): a microbial soil organic carbon model integrated with nitrogen and phosphorus processes, Geosci. Model Dev., 13, 783–803, https://doi.org/10.5194/gmd-13-783-2020, 2020. a
Zhang, H., Goll, D. S., Wang, Y.-P., Ciais, P., Wieder, W. R., Abramoff, R., Huang, Y., Guenet, B., Prescher, A.-K., Viscarra Rossel, R. A., Barré, P., Chenu, C., Zhou, G., and Tang, X.: Microbial dynamics and soil physicochemical properties explain large-scale variations in soil organic carbon, Glob. Change Biol., 26, 2668–2685, https://doi.org/10.1111/gcb.14994, 2020. a, b
Zhang, Y., Lavallee, J. M., Robertson, A. D., Even, R., Ogle, S. M., Paustian, K., and Cotrufo, M. F.: Simulating measurable ecosystem carbon and nitrogen dynamics with the mechanistically defined MEMS 2.0 model, Biogeosciences, 18, 3147–3171, https://doi.org/10.5194/bg-18-3147-2021, 2021. a, b, c
- Abstract
- Introduction
- Methods
- Results
- Discussion
- Summary
- Appendix A: ISRaD data selection and processing
- Appendix B: Further information on model versions and implementations
- Appendix C: Correspondences between pools and soil fractions
- Appendix D: Radiocarbon predictions with non-isotopic models
- Appendix E: Incorrect or inaccurate 14C implementations
- Appendix F: Turnover times in the Millennial model
- Appendix G: Effect of sampling year on relationships between 14C and environmental parameters
- Code and data availability
- Author contributions
- Competing interests
- Disclaimer
- Financial support
- Review statement
- References
- Supplement