the Creative Commons Attribution 4.0 License.
the Creative Commons Attribution 4.0 License.
 | 11 Jul 2024
Modelling boreal forest's mineral soil and peat C dynamics with the Yasso07 model coupled with the Ricker moisture modifier
Aleksi Lehtonen
Alla Yurova
Rose Abramoff
Bertrand Guenet
Elisa Bruni
Samuli Launiainen
Mikko Peltoniemi
Shoji Hashimoto
Xianglin Tian
Juha Heikkinen
Kari Minkkinen
Raisa Mäkipää
As soil microbial respiration is the major component of land CO2 emissions, differences in the functional dependence of respiration on soil moisture among Earth system models (ESMs) contributes significantly to the uncertainties in their projections.
Using soil organic C (SOC) stocks and CO2 data from a boreal forest–mire ecotone in Finland and Bayesian data assimilation, we revised the original precipitation-based monotonic saturation dependency of the Yasso07 soil carbon model using the non-monotonic Ricker function based on soil volumetric water content. We fit the revised functional dependency of moisture to the observed microbial respiration and SOC stocks and compared its performance against the original Yasso07 model and the version used in the JSBACH land surface model with a reduction constant for decomposition rates in wetlands.
The Yasso07 soil C model coupled with the calibrated unimodal Ricker moisture function with an optimum in well-drained soils accurately reconstructed observed SOC stocks and soil CO2 emissions and clearly outperformed previous model versions on paludified organo-mineral soils in forested peatlands and water-saturated organic soils in mires. The best estimate of the posterior moisture response of decomposition used both measurements of SOC stocks and CO2 data from the full range of moisture conditions (from dry and xeric to wet and water-saturated soils). We observed unbiased residuals of SOC and CO2 data modelled with the moisture optimum in well-drained soils, suggesting that this modified function accounts more precisely for the long-term SOC change dependency according to ecosystem properties as well as the contribution of short-term CO2 responses including extreme events.
The optimum moisture for decomposition in boreal forests was found in well-drained soils instead of the mid-range between dry and water-saturated conditions as is commonly assumed among soil C and ESMs. Although the unimodal moisture modifier with an optimum in well-drained soils implicitly incorporates robust biogeochemical mechanisms of SOC accumulation and CO2 emissions, it needs further evaluation with large-scale data to determine if its use in land surface models will decrease the uncertainty in projections.
- Article
(3730 KB) - Full-text XML
-
Supplement
(902 KB) - BibTeX
- EndNote


Soil moisture and soil C stocks in boreal forests are higher in forested peatlands on frequently paludified organo-mineral soils and in peatlands on water-saturated organic soils than in well-drained forests on mineral soils (Weishampel et al., 2009; Ťupek et al., 2008; Bhatti et al., 2006; Hartshorn et al., 2003). Almost a quarter of the total terrestrial C (440 Pg C) stored in boreal moist and dry soils has accumulated since the last glaciation (Scharlemann et al., 2014) and is expected to create large C losses under warming climates (Hararuk et al., 2015). Moist organic soils are crucial for modelling dynamics of the global C cycle as they store 5 times more carbon than dry mineral soils (Leifeld and Menichetti, 2018; Turetsky et al., 2015; Scharlemann et al., 2014). However, soil organic carbon (SOC) stocks modelled by Earth system models (ESMs) show large uncertainty due to structural model differences (Hashimoto et al., 2017; Hararuk et al., 2014, 2015; Todd-Brown et al., 2013) and differences in environmental drivers and their functional dependencies used by soil C models (Thum et al., 2020; Ťupek et al., 2019; Falloon et al., 2011).
Despite soil moisture being a dominant driver of variation in C dynamics (Humphrey et al., 2021), ESMs lack consensus on the response of decomposition to soil moisture and temperature (Yan et al., 2018; Sierra et al., 2015; Falloon et al., 2011). The functional forms of the temperature and moisture modifiers of default decomposition rates among models disagree in their representation of extreme cold–dry and hot–wet conditions (Sierra et al., 2015). For example, the moisture decomposition dependency in the Yasso07 soil C model (Tuomi et al., 2011, 2009) is based on annual precipitation, has a form of monotonic saturation, and is uninformed about soil characteristics. By a monotonic saturation function, we mean a function which is entirely non-decreasing, initially increasing rapidly and later slowly approaching a maximum. The use of the saturation function is limited to well-drained soils because under wet or poorly drained forest soils such a model results in underestimation of the C stocks (Dalsgaard et al., 2016, Ťupek et al., 2016). The soil module of the CENTURY model (Adair et al., 2008; Parton, 1996; Metherell et al., 1993) uses precipitation and basic soil data (bulk density, clay, and silt contents) to calculate soil moisture, which similarly to Yasso07 assumes saturation of decomposition rates. Other functional dependencies of moisture such as DayCent, DEMETER, STANDCARB, CANDY, Gompertz, Myers, Moyano, and Skopp assume various functional forms, for example, non-monotonic Gaussian increase with an optimum and reduction in decomposition (DayCent, STANDCARB, Moyano), linear increase until reaching an optimum and linear reduction (Skoop), monotonic linear and non-linear increase (DEMETER and Myers, respectively), or monotonic saturation functions (CENTURY, CANDY) (Sierra et al., 2015, and references therein). The wide variation in commonly used moisture functions may result from the variety of data from different soil types and climates used to constrain these moisture indices.
If environmental response functions were calibrated for mineral soils only, then these functions may not adequately represent responses in the moisture range characteristic of organic soils. For example, default response functions of soil C models cannot represent anoxic inhibition of decomposition rates in paludified peatland forest soils. However, the inhibition of decomposition can be accounted for even in monotonic functions, e.g. by a reduction parameter such as “anerb” in CENTURY (Methereall et al., 1993). Due to variable water levels and their determination of soil oxic/anoxic conditions and SOC accumulation in peatlands, peat SOC stocks are typically modelled with models specifically developed for peatlands (Bona et al., 2020; Kleinen et al., 2012; St-Hilaire et al., 2010; Frolking et al., 2010, 2001; Clymo, 1978, 1992). However, for global applications on peatlands, the general soil models in ESMs can be modified for peat soil by adjusting parameters such as the hydraulic conductivity, as seen in models like JULES (Chadburn et al., 2022) and ORCHIDEE (Qiu et al., 2018), or by reducing decomposition rates for wetlands, as in LPJ (Wania et al., 2010) and JSBACH (Goll et al., 2015). The land surface model JSBACH coupled with the Yasso soil C model adopts a heuristic 65 % reduction in decomposition for wetlands (Kleinen et al., 2021; Goll et al., 2015). Using the CENTURY model at the site level, Raich et al. (2000) opted for improvement in modelled SOC of wetlands by modifying the environmental function with the anoxic inhibition for sites with insufficient drainage. This approach improved CENTURY compared to the default Yasso07 in poorly drained forested peatlands in Sweden, though the SOC stocks of both models were still underestimated (on average by 10 and 13 kg C m−2, respectively) (Ťupek et al., 2016). A similar magnitude of SOC underestimation of Yasso07 model with default dependency on precipitation was also observed for poorly drained forest soils (e.g. Gleysols and organic soils) in Norway (Dalsgaard et al., 2016).

Figure 1Infrared areal image showing the location of nine studied forest–mire types forming a transect of approximately 450 m on a northern hillslope in Finland (61°47′ N, 24°19′ E). A series of hemispherical images of forest stands on the top of the aerial image show the increasing gradient in the canopy openness from upland forests (left) to mires (right). The series of soil profiles shows the increasing gradient of the organic layer depth. The images in the series arranged from left to right mimic the site type location on the slope from the hill to depression. Sites range from upland (1) xeric, (2) sub-xeric, (3) mesic, and (4) herb-rich forest types (CT – Calluna, VT – vitis-idaea, MT – myrtillus, OMT – Oxalis–myrtillus) through paludified forest–mire transitions (5–7) (OMT+ – Oxalis–myrtillus paludified, KgK – myrtillus spruce forest paludified, KR – spruce pine swamp) to sparsely forested mires and peatlands in depressions (8–9) (VSR1 and VSR2 – tall-sedge pine fen).
We hypothesized that the SOC stocks and CO2 emissions of mineral and organic (peat) soils can be modelled accurately by revising the original precipitation-based environmental modifier of a parsimonious model like Yasso07 with a function accounting for the reduction in decomposition based on the long-term near-surface moisture. Near-surface moisture is strongly correlated with the groundwater level depth in peatlands (Dimitrov et al., 2022), and the moisture values between mineral soil forests and peatlands are comparable on the same scale, which makes soil volumetric water content (SWC) a suitable variable for representing landscape moisture variation. Boreal forest SWC can be either measured in situ or derived in high resolution using hydrological models (e.g. Leppä et al., 2020; Launiainen et al., 2019) and at larger scale by remote sensing and machine learning (Han et al., 2023). We aimed to develop the original Yasso07 model with parameters as in Tuomi et al. (2011) by adding a revised unimodal moisture-based environmental function. We then optimized this function using Bayesian data assimilation of measurements from a boreal forest–mire hillslope catena of mineral, organo-mineral, and organic soils, and we tested whether we could correctly reconstruct observed SOC stocks and CO2 emissions.
2.1 Study sites
Nine forest and mire site types in this study were situated along the hillslope from the Vatiharju esker to the Lakkasuo mire in southern Finland (61°47′ N, 24°19′ E) (Fig. 1) and formed a forest–mire ecotone, a gradient in soil moisture and nutrient status, vegetation composition, biomass production, and SOC stocks (Dimitrov et al., 2014). The sites were situated along a 450 m transect on a 3.3 % slope facing NE with a relative relief of 15 m. The site typology described below was based on the vegetation composition reflecting site wetness, fertility, and location on the slope according to Finnish forest and mire classification systems (Cajander, 1949; Laine et al., 2004).
On the crest of the esker was a well-drained xeric Scots pine forest (CT – Calluna type), which changed down the slope to sub-xeric mixed Scots pine–Norway spruce forest (VT – vitis-idaea type) and mid-slope to mesic and herb-rich Norway-spruce-dominated forest (MT – myrtillus type, OMT – Oxalis–myrtillus type), together referred to as mineral soil upland forests. On the toe of the slope were forest–mire transitions on gleyic organo-mineral soils or mixed spruce pine birch forests (OMT+ – Oxalis–myrtillus paludified type, KgK – myrtillus spruce forest paludified type, KR – spruce pine swamp type). On the level were water-saturated sparsely forested mires on Histosols (VSR1 and VSR2 – tall-sedge pine fen types).
The understorey or forest floor vegetation along the ecotone changed from being dominated by Calluna and Vaccinium vitis-idaea dwarf shrubs and typical forest mosses on the uppermost sites (CT, VT) to Vaccinium myrtillus dwarf shrubs with herbs on the mid-slope (MT, OMT); Vaccinium myrtillus dwarf shrubs with herbs and Sphagnum in the transitions (OMT+, KgK, KR); and Vaccinium oxycoccos and Betula nana dwarf shrubs with Menyanthes trifoliata, Carex, and Sphagnum species on the level (VSR1, VSR2) (Fig. 1). More detailed tree stand, soil, and climate characteristics for these sites were reported by Ťupek et al. (2015).
2.2 Auxiliary measurements
Soil temperature, water content, and CO2 emissions () were measured simultaneously during the years 2004, 2005, and 2006. The measurement campaigns were conducted weekly, and we measured each plot once and all plots in 1 or 2 d between 07:00 and 18:00 eastern European time (EET) during the vegetative season of 2004 (July–November), 2005 (May–November), and 2006 (May–September) and monthly during the non-vegetative seasons (December–April). The summer seasons of the years 2004–2006 showed exceptionally different monthly weather patterns. Data from Finnish meteorological station, located in Juupajoki 3 km north-east of the ecotone, showed that the summer season in 2004 was rainy and colder in comparison to long-term typically mild weather, in 2005 the weather was typical, and in summer 2006 the weather was sunny and warm. The exceptional drought in 2006 caused by the lack of rain and increased temperatures in June and late July–early August (Gao et al., 2017) caused visible drying of the moss layer along all the sites of the ecotone. The 2006 summer drought ended with showers in mid-August and with more frequent rain in autumn when the soil moisture recovered to a normal level.
2.2.1 Soil temperature and moisture conditions
The soil temperature was measured at depths of 5 cm (T5, °C) with a portable thermometer, and the soil volumetric water content was measured at a depth of 10 cm (SWC10, %, m3 m−3) in all sites with a portable ThetaProbe (Delta-T Devices Ltd.) calibrated for each site type. The SWC calibration accounted for the bulk density–porosity of forest-type-specific soils (Ťupek et al., 2008, 2015). Because the forest–mire variation in the soil organic layer bulk density was relatively small at 0.34 ± 0.07 g cm−3 (porosity 74 ± 5 %) (Ťupek et al., 2015), the SWC values of the top 10 cm were on the same order of magnitude between the forest–mire site types. For missing field campaigns during months with snow cover (November 2004, February–April 2005, December 2005–April 2006), we interpolated the measured monthly mean T5 and SWC10 time series with a spline function. The SWC10 values among the forest and mire site types ranged between 0 and 1 (or 0 % and 100 %) (Fig. 3), whereas in comparison to water level depth, the values range from 8 cm in tall-sedge mire to 881 cm in pine forest on the top of the esker (Ťupek et al., 2008).
2.2.2 Soil CO2 emissions
Measurements of forest soil heterotrophic respiration (Rh, , positive sign) were taken using opaque cylindrical chambers (30 cm diameter, 21.2 L) placed on metallic collars (30 cm in diameter), which were installed permanently at 30 cm soil depth. The collar locations (3 for each site type, 12 for mineral soil forests, 9 for transitions, and 6 for mires, totalling 27) were selected to represent the spatial variation of each site type and the spatial variation along the forest–mire ecotone (e.g. dominant forest floor vegetation, microtopography, soil drainage, and nutrient status).
The aboveground forest floor vegetation inside each collar was clipped at the time of collar installation, and any plant regrowth of, for example, mosses was clipped approximately half an hour before the flux measurements. At the time of the collar installation, the roots of the understorey vegetation and trees were cut with a saw along the collars' perimeter. The metallic collars installed to 30 cm soil depth prevented the regrowth of the roots. Due to the vast majority of tree and understorey roots in boreal forest occurring in the humus layer, the 30 cm depth was considered sufficient to cut the roots and thus remove the signal of the root autotrophic respiration from the net CO2 emissions. In transitions and mires, the depth of peat could be more than 30 cm (in a range from 0.15 m in OMT+ to 1.2 m in VSR2; Ťupek et al., 2008), but the prevailing high groundwater levels (in a range from 33 cm in OMT+ to 7 cm in VSR1, Ťupek et al., 2008) limit the root growth into the upper/sub-surface layer.
The soil CO2 emissions were measured every 4.8 s during 80 s intervals with a portable infrared CO2 analyser (EGM4, SRC-1, PP Systems Inc.). We calculated CO2 flux rates from the development of CO2 concentration over time inside the chamber.
2.2.3 Soil organic carbon stocks
The soil data from the 2006 sampling up to 30 cm depth (Ťupek et al., 2015) were combined with additional soil sampling cores of up to 100 cm depth in October 2015 (three per site) (Fig. S1 in the Supplement). The bulk density and C and N concentrations for new samples were determined as in Ťupek et al. (2015).
The SOC content (g cm−3) of separate soil layers was interpolated for the whole profile with the fitted spline functions and summed for each depth and each forest and mire site (Fig. S1). The SOC content was similar in the uppermost humus layers of all forest and mire types (below 0.3 g cm−3 in a layer 0–10 cm), but in the sub-surface level (10–30 cm), it clearly doubled from uplands to transitions and mires (from below 0.2 to above 0.4 g cm−3) (Fig. S1). In the soil layers below 30 cm, the SOC content showed differences in degrees of magnitude (around 0, 0.01, and 0.1 g cm−3 for forests, transitions, and mires, respectively) (Fig. S1). The SOC stock (kg C m−2) was a result of SOC content multiplied by a bulk density.
2.2.4 Biomass of tree stand and understorey vegetation
The breast height diameter and height of all Scots pine (Pinus sylvestris), Norway spruce (Picea abies), and silver birch (Betula pendula) trees for each forest site type were measured in 2006. The biomass components for each species (leaves, branches, stems, coarse roots) were estimated with biomass conversion functions (Repola, 2008, 2009) and for fine roots with functions by Lehtonen et al. (2016b). Forest floor plants from three 0.07 m2 sample plots located near soil respiration measuring collars were harvested for each forest and mire site type in June–July 2004 (Ťupek et al., 2008). Plants were separated into herbs, mosses, and shrubs and dried and weighed for each category and each sample plot. The stand density and the tree biomass increased from xeric (CT) and mesic upland forest sites (VT and MT) towards the herb-rich forest site (OMT) and transitions (OMT+, KgK, and KR) and decreased to very sparse canopy in peatlands and mires (VSR sites) (Fig. 1b). The understorey aboveground biomass correlated negatively with the density of the canopy cover and thus positively with the light intercepted on the forest floor (Ťupek et al., 2008).
2.3 Data analysis
2.3.1 Yasso07 SOC and CO2 modelling
Equilibrium SOC stocks of up to 1 m depth, SOC changes, and soil CO2 emissions (Rh) for the forest and mire types were modelled using the Yasso07 soil carbon model (Tuomi et al., 2009, 2011) with specific litter input and weather data in accordance with the method of the Finnish greenhouse gas inventory (Statistics Finland, 2023). The temperature and precipitation data for the weather input were from the nearest Finnish Meteorological Institute (FMI) weather station, located 3 km away from our study sites. We first ran the Yasso07 model using the original formulation of the environmental function with precipitation and air temperature data, and then we ran the Yasso07 model fitted with the environmental modifier function based on the SWC10 and T5 of the forest and mire site types using the Bayesian data assimilation technique.
Yasso07 is a semi-empirical process-based soil carbon model where soil C is divided based on the organic matter solubility into five pools (CA, CW, CE, CN, and CH) from which three are fast (acid, A; water, W; and ethanol, E, all soluble), one is slow (non-soluble, N), and one is almost stable (humus, H) (Tuomi et al., 2011). The rates of C decomposition in each pool and C transfers between the pools are affected by climate. The model can be expressed mathematically as a set of differential equations where decomposition of the entire structural matrix of C pools defined by default mass flow parameters and decomposition coefficients (AYS) is scaled by the time-step-dependent scalar of the environmental rate modifier ξ(t) (Eq. 1).
where t is time, i defines a vector of initial carbon pools , and subscripts to α indicate mass transfer pools (e.g. αA,W defines mass transfer from pool W to pool A). The total soil respiration or CO2 efflux (Rh) is a product of a column vector by a row vector C(t), where the elements of the column vector are the fractions that were not transferred among the pools (Sierra et al., 2012).
The model was originally calibrated for running on annual time steps (Tuomi et al., 2009), but it can run on monthly steps with monthly decomposition rates ( of annual kA, …, kH) and monthly litter and climate data (Ťupek et al., 2019). Then ξ(tm) is defined by a combined function of monthly air temperature (Tm) and of annual precipitation () (Eq. 2).
where β1, β2, and γ are parameters of the environmental function and tm is the monthly time step. To test our hypothesis of running the model for a catena of soils with gradually increasing moisture content (from xeric to mesic, paludified, and saturated), we re-defined the ξ(tm) function for use with soil temperature based on a Q10 exponential function applied to T5 (used by Davidson et al., 2012, as an alternative to Arrhenius kinetics) and with moisture data using an adjusted hump-shaped Ricker function (Bolker, 2008) for response to SWC10, which limits the decomposition rate outside the optimum soil water content (ξAR, Eq. 3).
where the Q10 parameter represents the increase in the temperature function over a 10 °C difference in T5 and a controls both ascending and descending slopes of the moisture function when the peak is set to 1. In the Ricker function with a and b parameters and an independent variable vector x (axe−bx), the height of the peak can be inferred as and the x value of the peak location as (Bolker, 2008). Thus, in our formulation, by setting the peak in the Ricker function to 1, we could substitute the b parameter with ae−1 and the SWC10 optimum (the SWC10 when decomposition is optimum) was inferred as .
Table 1The posterior distribution of parameters of the Yasso07 soil carbon model (parameters the same as in Table S1) coupled with the environmental function ξAR (Eq. 3, parameters Q10 and a) optimized with observations of SOC stocks (p(θ|SOC)), SOC stocks and CO2 emissions (p(θ|SOC−CO2)), and CO2 emissions (p(θ|CO2)) from forest–mire ecotone sites using Bayesian data assimilation (Hartig et al., 2012). PSRF stands for the Gelman–Rubin potential scale reduction factor and MAP for a maximum a posteriori probability. The SWC10 optimum (the SWC10 when the SOC decomposition in the boreal forest–mire ecotone was optimum) was inferred as and ranged between 14 % and 27 % (for aMAPSOC, , and ).

The Yasso07 model versions in this study run accordingly as follows:
-
The Yasso07.ξTW version is Yasso07 coupled with the original ξT (Eq. 2) and with the original global parameter set (Tuomi et al., 2011) but with two k-rate parameter sets, (i) the original rates for application on mineral soils applied to mineral and organo-mineral soil forests (CT, VT, MT, OMT, OMT+, KgK, KR) and (ii) with an inhibitor reducing k rates by 35 % (0.65 ) for application on wetlands (Goll et al., 2015; Kleinen et al., 2021) applied to mire sites (VSR1 and VSR2).
-
The Yasso07.ξW wetland version is the same as Yasso07.ξTW but with a fine-tuned k-rate inhibitor to fit the SOC of mire sites (VSR1 and VSR2).
-
The Yasso07.ξAR version for the soil moisture gradient from mineral to peat soils (e.g. as in the boreal forest–mire ecotone) is the Yasso07 model coupled with ξAR (Eq. 3), with the original global parameter set of the structural matrix and optimized parameters of ξAR.
The initial equilibrium SOC stock (Co) for each forest and mire type for the pre-trenching period was simulated analytically (Xia et al., 2012) (Eq. 4).
where ξ is the environmental modifier, AYS is a structural matrix formulation of the Yasso07 model's differential equations, and is the litter input (mean annual litter sum of foliage, branches, stem, stump, roots, and understorey).
The Yasso07 model source code used here was built in R software (R Core Team, 2023) on the platform of the SoilR package (Sierra et al., 2012) according to the mathematical description and parameters of Tuomi et al. (2011). The model outputs are monthly SOC stocks and soil CO2 emissions. The model was run with data inputs of above- and belowground litterfall (accounting for its chemical composition) and climate data (described in more detail below). Monthly model outputs of heterotrophic soil respiration were compared to mean monthly Rh measurements.
2.3.2 Climate and litter C input data for the Yasso07 model
Yasso07.ξTW was run with monthly air temperature and precipitation from the nearby Juupajoki weather station of the Finnish Meteorological Institute. Yasso07.ξAR was run using site-type-specific continuous monthly T5 and SWC10 time series.
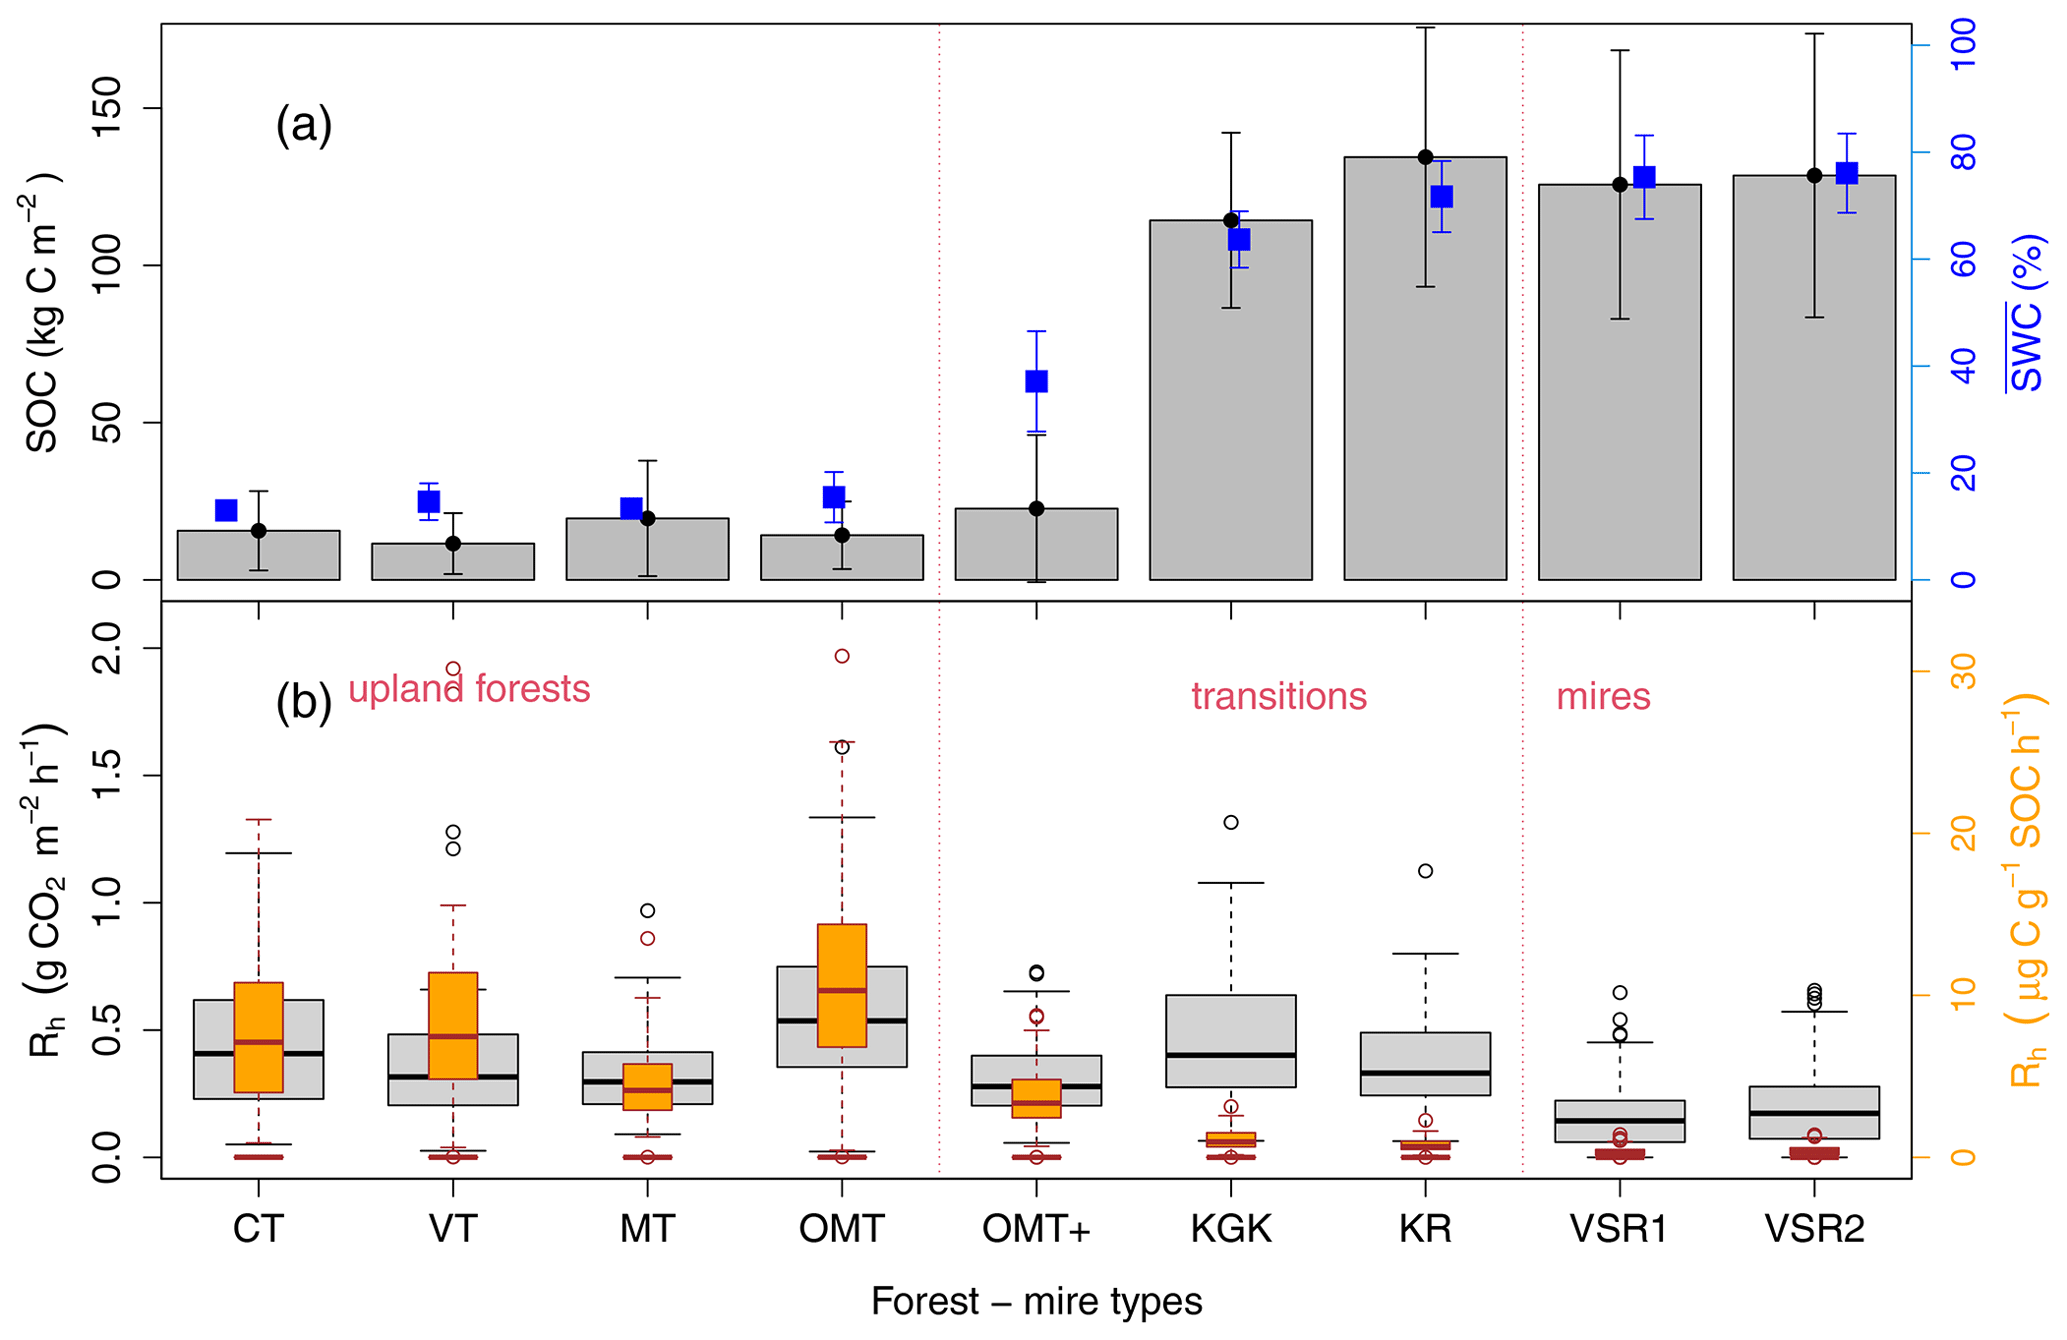
Figure 2Observations specific to the forest or mire site type of soil organic carbon (SOC) stocks (kg C m−2, summed to 1 m) and the mean volumetric soil water content (SWC) at 10 cm depth (%) (with error bars showing 1 standard deviation of all measured values) (a) in comparison to their distributions of heterotrophic soil CO2 emissions/respiration measurements (Rh, ) and Rh expressed as the emitted C fraction per site-specific SOC stock () (b). The CT, VT, MT, and OMT types represent upland forests; OMT+, KgK, and KR forest–mire transitions; and VSR1 and VSR2 mires. The boxplot horizontal lines show the 25th and 75th interval with the median in between, and the 5th and 95th confidence interval is shown by whiskers.
The litter C input of the forest and mire types (Figs. S2 and S3) used by Yasso07 was estimated as in Lehtonen et al. (2016a) based on turnover rates of tree stand biomass components (including fine and coarse roots, stump, branches, and foliage) and understorey vegetation. The litter C input was separated into Yasso07 A, W, E, and N pools according to the component and species-specific (or species-group-specific) A, W, E, and N ratios taken from the literature (Berg et al., 1991a, 1b, 1993; Gholz et al., 2000; Trofymow, 1998; Vávřová et al., 2009; Straková et al., 2010) (Table S2 in the Supplement). The annual litter was distributed either according to a monthly resolution by accounting for seasonal trends in foliage, fine roots, and the understorey (Ťupek et al., 2019; Zhiyanski, 2014) or evenly. The litter input before trenching was assumed to represent the long-term average of the equilibrium state forest (Figs. S2a and S3). During trenching, the severed fine and coarse roots made up the major component of the total litter (Fig. S2b) and resulted in a clear peak in the monthly litterfall time series (Fig. S3). After trenching, the monthly litter levels decreased as the sum of components excluded the roots (Figs. S2c and S3).
2.3.3 Bayesian SOC and CO2 data assimilation
The Bayesian Markov chain Monte Carlo (MCMC) data assimilation has proved useful in improving soil organic carbon estimates (e.g. Xu et al., 2006; Hararuk et al., 2014). The Bayesian posterior uncertainty provides updated information on parameter values based on pre-existing information on the parameters and the data through the likelihood function (Speich et al., 2021). The Q10 and parameters of ξAR (Eq. 3) coupled with the Yasso07 model were optimized on the level of the forest–mire ecotone using the Bayesian data assimilation technique (Luo et al., 2011; Hartig et al., 2012; Speich et al., 2021) with observed SOC stocks and monthly Rh data of forest and mire types with prior information on the best parameter values and the defined parameter range in Table S1. During the optimization, the Yasso07.ξAR model was run first only with observed SOC stocks, second with both SOC stocks and CO2 data combined, and third only with CO2 data obtaining a probability distribution of model parameters of ξAR (the posterior uncertainty p(θ|y) conditional on the observations (y) and prior knowledge on the parameter values p(θ)). The sum of the probability density for the target parameter set (θ) between the model predictions and observations was maximized for the best agreement using the likelihood defined by a modified Laplace probability density function p(y|θ) (the probability of observing the data y with the model parameters set θ), where we allowed the width of the distribution to be affected by the observed SOC and CO2 values (Eq. 5).
where μj,i is the observed jth variable (e.g. SOC, CO2, or SOC and CO2) of ith observations, xi is the modelled prediction, N is the total number of observations, and ϵa and ϵb are parameters affecting the width of the distribution. In the combined SOC–CO2 likelihood, the likelihood function p(y|θ) was then the multiplication of the distributions of SOC and CO2 at all observation times. We evaluated the variation in the estimated parameters by separating data for fitting the models and testing them with a 9-fold cross-validation technique.
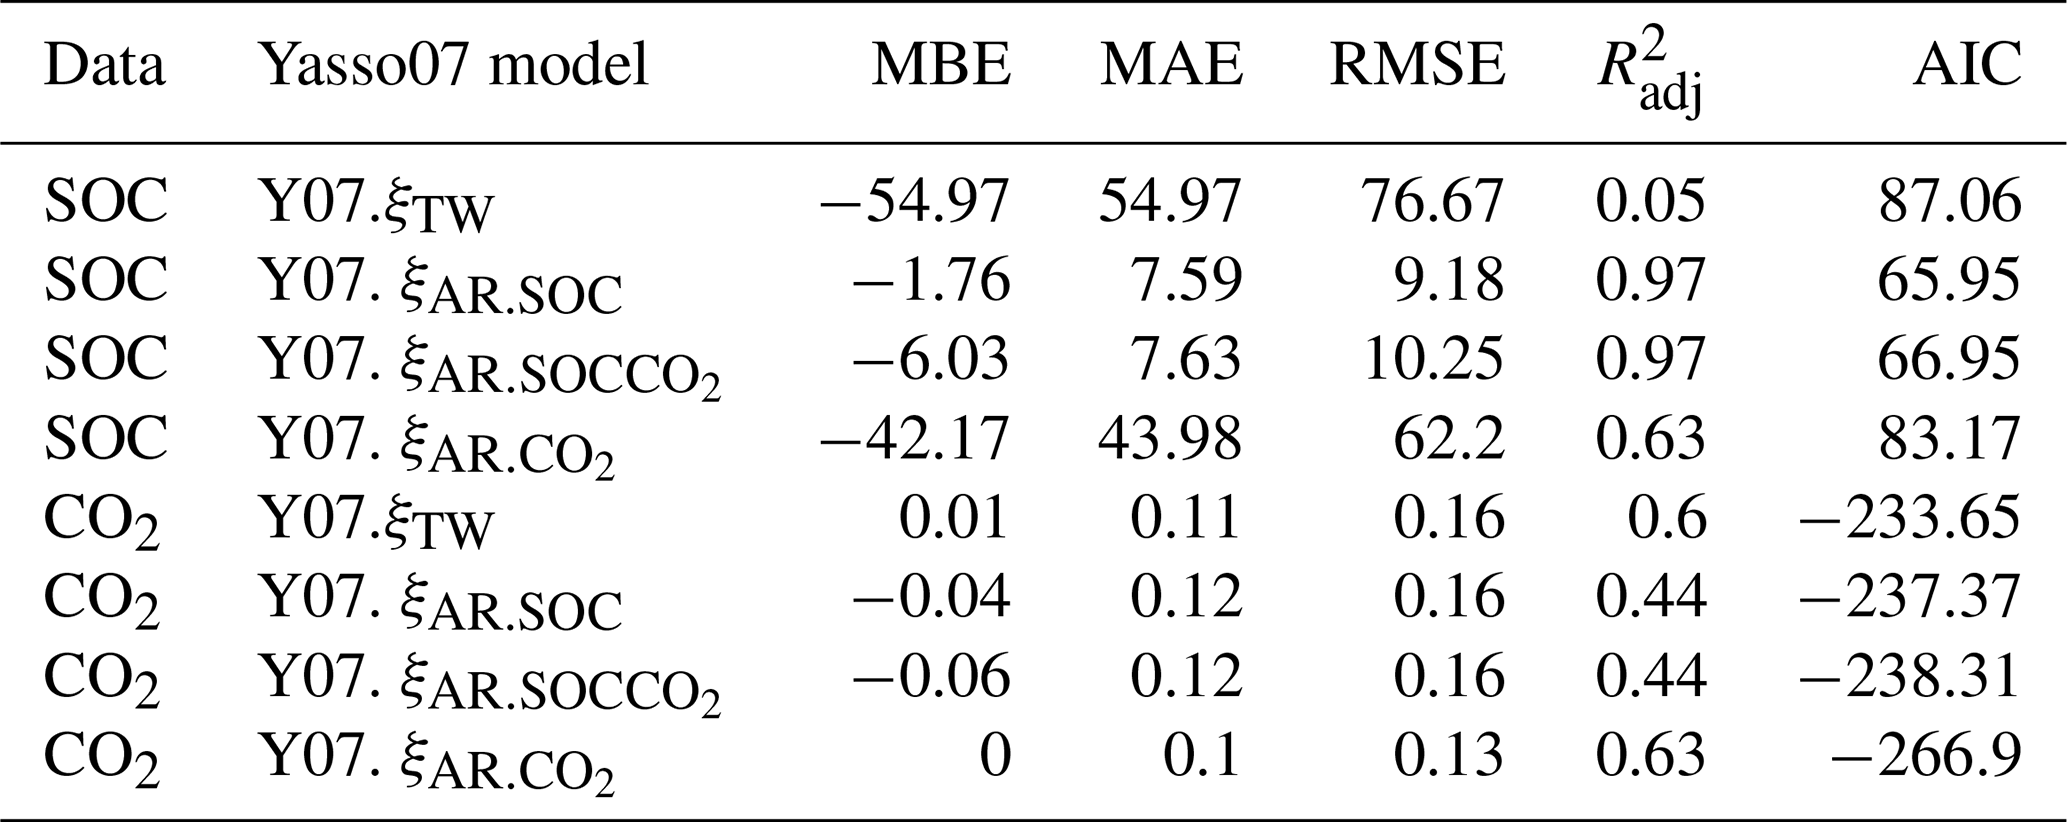
Table 2The SOC and CO2 performance statistics of Yasso07 (Y07) model versions against the measured data in the boreal forest–mire ecotone, where MAE is the mean absolute error, MBE is the mean bias error, RMSE is the root-mean-square error, is the adjusted coefficient of determination, and AIC is the Akaike information criterion. The units of MAE, MBE, and RMSE are in kg C m−2 and kg CO2 per square metre per month for SOC and CO2, respectively.
The model parameters of ξAR and p(y|θ) were sampled from an assumed uniform distribution within their prior ranges (Table S1). Posterior probability distributions of parameters (Table 2) were derived using the differential evolution “DEzs” MCMC sampler used by the runMCMC function from the BayesianTools package in R (Hartig et al., 2019) and by computing three chains in parallel. The convergence of MCMC runs was evaluated using the Gelman–Rubin multivariate potential scale reduction factor (PSRF) (Brooks and Gelman, 1998). The MCMC simulation was considered converged if PSRF was below 1.03 for all parameters (1.01, 1.01, and 1.016 for p(θ|SOC), p(θ|CO2), and p(θ|SOCCO2), respectively). Trace plots of MCMC runs for target parameters showed effective sampling and unimodal parameter density with clearly defined peaks. The differences in parameter uncertainties (difference between 97.5 % and 2.5 % quantiles of the 95 % confidence interval) were not significant (p = 0.99) when evaluated with a Welch two-sample t test between two posterior distributions p(θ|SOC) and p(θ|SOCCO2) (Table 1).
2.3.4 Performance evaluation of Yasso07.ξTW and Yasso07.ξAR
The performance of Yasso07 model versions (i) Yasso07.ξTW and (ii) Yasso07.ξAR with ξAR parameter set θ from three posterior distributions, p(θ|SOC), p(θ|CO2) and p(θ|SOCCO2), was evaluated with the modelled SOC and CO2 outputs against the observed data in the forest mire ecotone with the coefficient of determination (R2), the mean absolute error (MAE), mean bias error (MBE), the root-mean-square error (RMSE), and the Akaike information criterion (AIC), considering the number of model parameters in the error calculation as in Abramoff et al. (2022) and with the fitted linear trends of normalized SOC and CO2 model residuals with observations against T5 and SWC10 data.
3.1 Distributions of SOC stocks and Rh in relation to SWC
The SOC stock measurements (to a depth of 1 m) in a forest–mire ecotone were distributed in range between 20 kg C m−2 in well-drained soils of upland forests and 125 kg C m−2 in poorly drained soils in peatlands and mires (Fig. 2). The SOC stock values strongly correlated with the long-term moisture levels. The median Rh values ranged between 0.4 and 0.6 for upland forests, 0.4 and 0.5 for forest–mire transitions, and 0.3 and 0.4 for mires (Fig. 2). The forest and mire site type differences in median Rh values expressed per square metre were small and poorly correlated with the mean soil moisture levels.
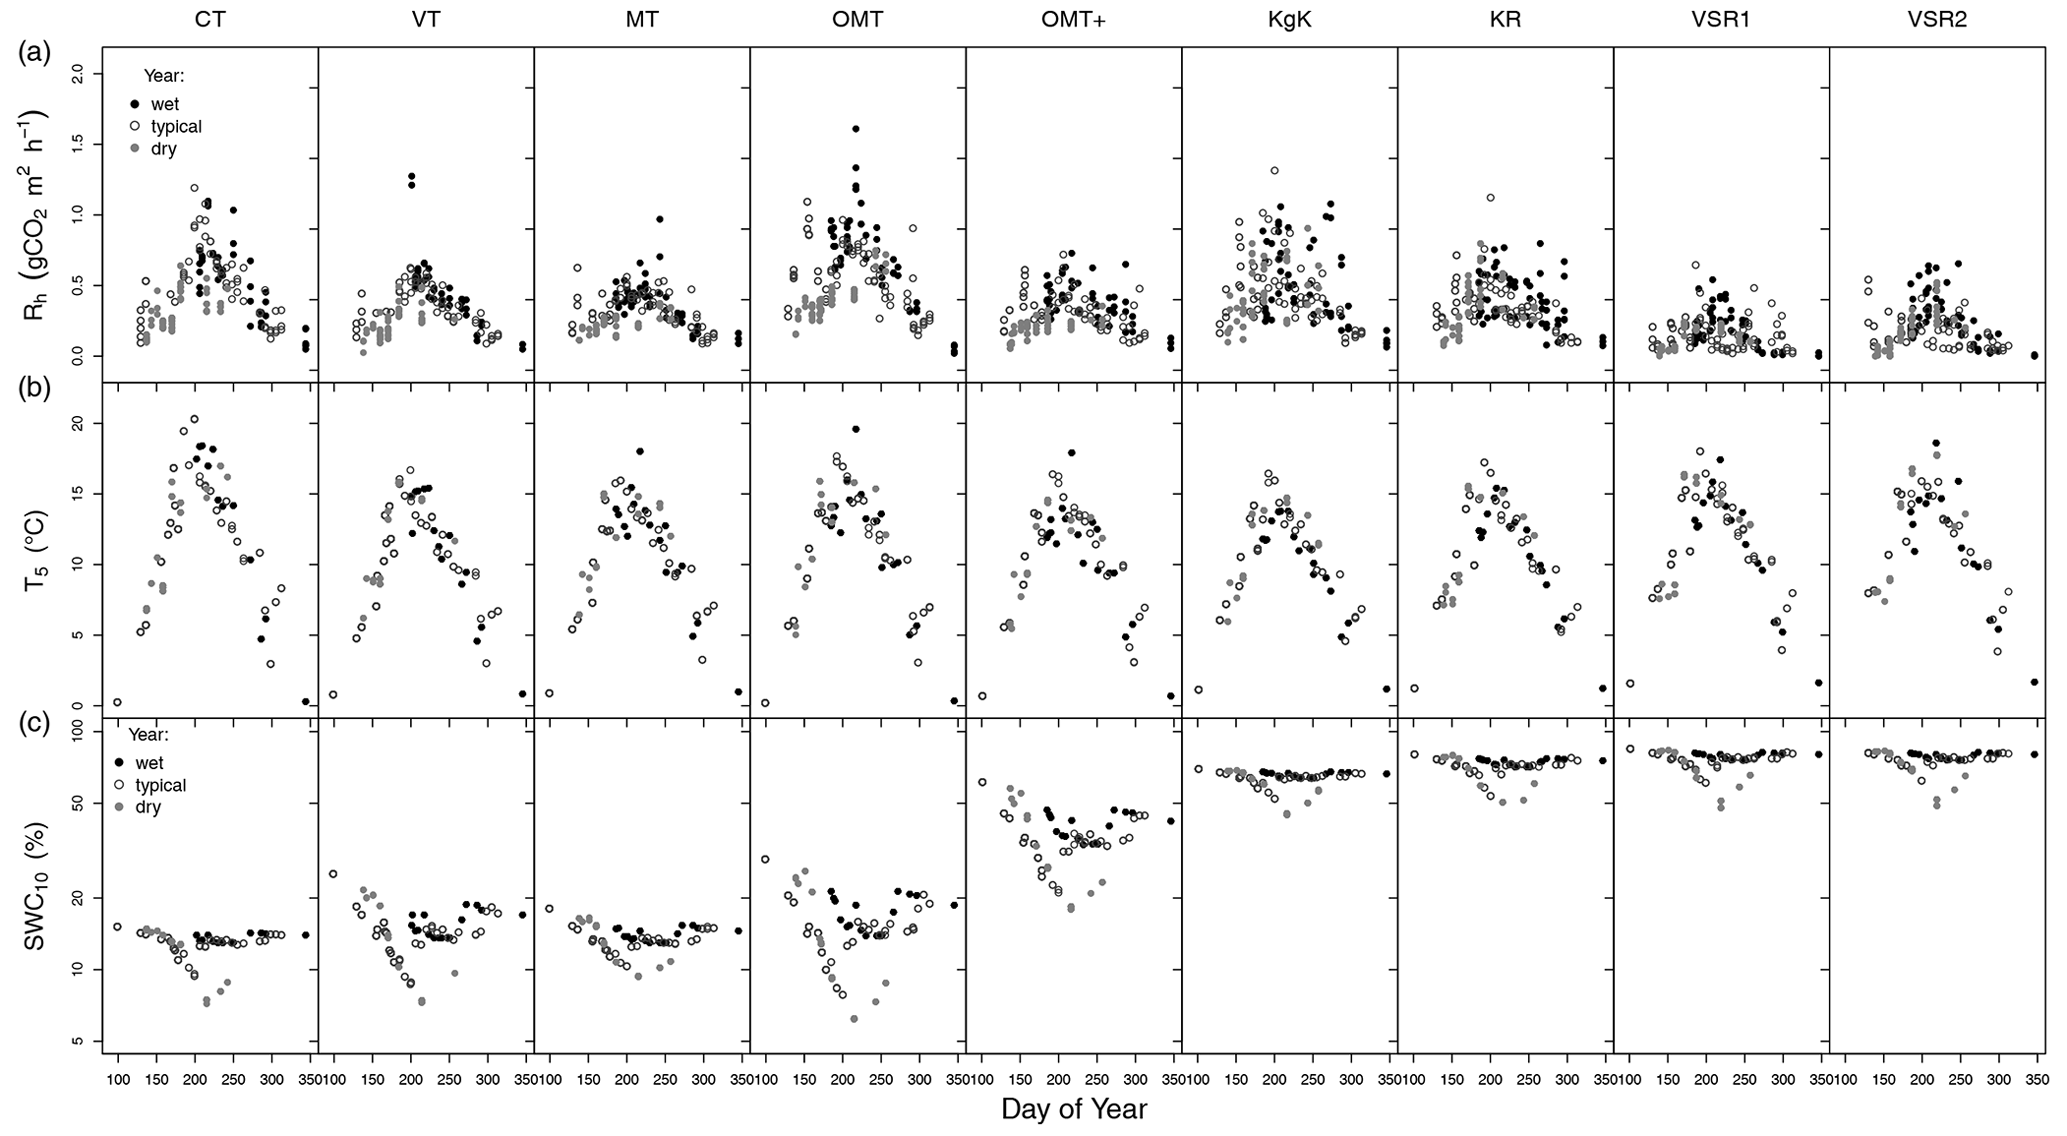
Figure 3The 3-year time series (2004 – wet; 2005 – typical; 2006 – dry) of instantaneous measurements of (a) soil heterotrophic respiration (Rh, , positive sign), (b) soil temperature at 5 cm depth (°C), and (c) soil moisture at 10 cm depth (%) of nine forest and mire sites (four upland forests (CT, MT, and OMT), three forest–mire transitions (OMT+, KgK, and KR), and two mires (VSR1 and VSR2)). The sites are arranged from left to right according to their position on the slope (see Fig. 1).
3.2 Distribution of Rh in climate space of soil T and SWC
The site-specific time series of hourly Rh measured in the forest–mire ecotone during the years 2004, 2005, and 2006 followed a typical seasonal pattern of temperature and was distributed in range between 0.08 and 1.6 depending on the corresponding soil temperature and moisture conditions (Fig. 3). The Rh values were generally larger during wet years than during a typical year and were lowest during dry years (Fig. 3).
The T5 and SWC10 values showed a typical seasonal variation (in a range between around 0 and 20 °C, driest in the summer and wettest in late autumn–spring) (Figs. 2b and 3c). T5 showed a similar magnitude among the forest and mire sites, whereas the SWC10 increased from the driest (upland forest) to intermediate (forest–mire transition) sites and from upland to lowland for the wettest (mire) sites located on the slope (Fig. 3). The volumetric SWC10 values (%) were comparable and on the same order of magnitude between the forest and mire site types because the forest–mire variation in the soil organic layer bulk density was relatively small at 0.34 ± 0.07 g cm−3 (porosity 74 ± 5 %). The forest–mire ecotone soil moisture at 10 cm depth ranged from 5 % to 91 %. The minimum, maximum, and mean SWC at 10 cm depth between forests, transitions, and mires clearly differed, showing a gradient of increasing moisture from forests to mires (Figs. 2a and 3). Due to highly variable weather (wet, typical, and dry years), all ecosystems experienced periods of extremely low and high SWC10 values. The SWC10 ranged between 5 % and 25 % in upland forest, between 17 % and 70 % in transitions, and between 49 % and 91 % in mires (Fig. 3). The variation in soil temperature at 5 cm depth along the ecotone was similar among the forest and mire types and ranged between −3 and 22 °C (Fig. 3). The Rh values during the dry year of 2006 were, in comparison to previous years, clearly reduced, mostly in upland forest and forest–mire transitions (Fig. 3). The spatial soil moisture gradient of forest and mire types was not clearly reflected in the distribution of Rh values when expressed in (Fig. 2) (unless expressed as a C fraction of SOC). The short-term SWC variation impacted the typical seasonal levels of Rh values, mainly during the extreme events (the rainy summer period in wet years or drought summer period in dry years) (Fig. 3).

Figure 4The optimized environmental modifier of default decomposition rates ξAR (Eq. 3) (coupled with the Yasso07 model) drawn with mean posterior values of parameters and their confidence intervals (dashed lines) (Table 1) for separate responses to (a) soil temperature at 5 cm, ξAR = f(T5) when f(SWC10) = 1 and (b) soil water content at 10 cm, ξAR = f(SWC10) when f(T5) = 1. The functions were fit based on only CO2, SOC and CO2, or only SOC data.
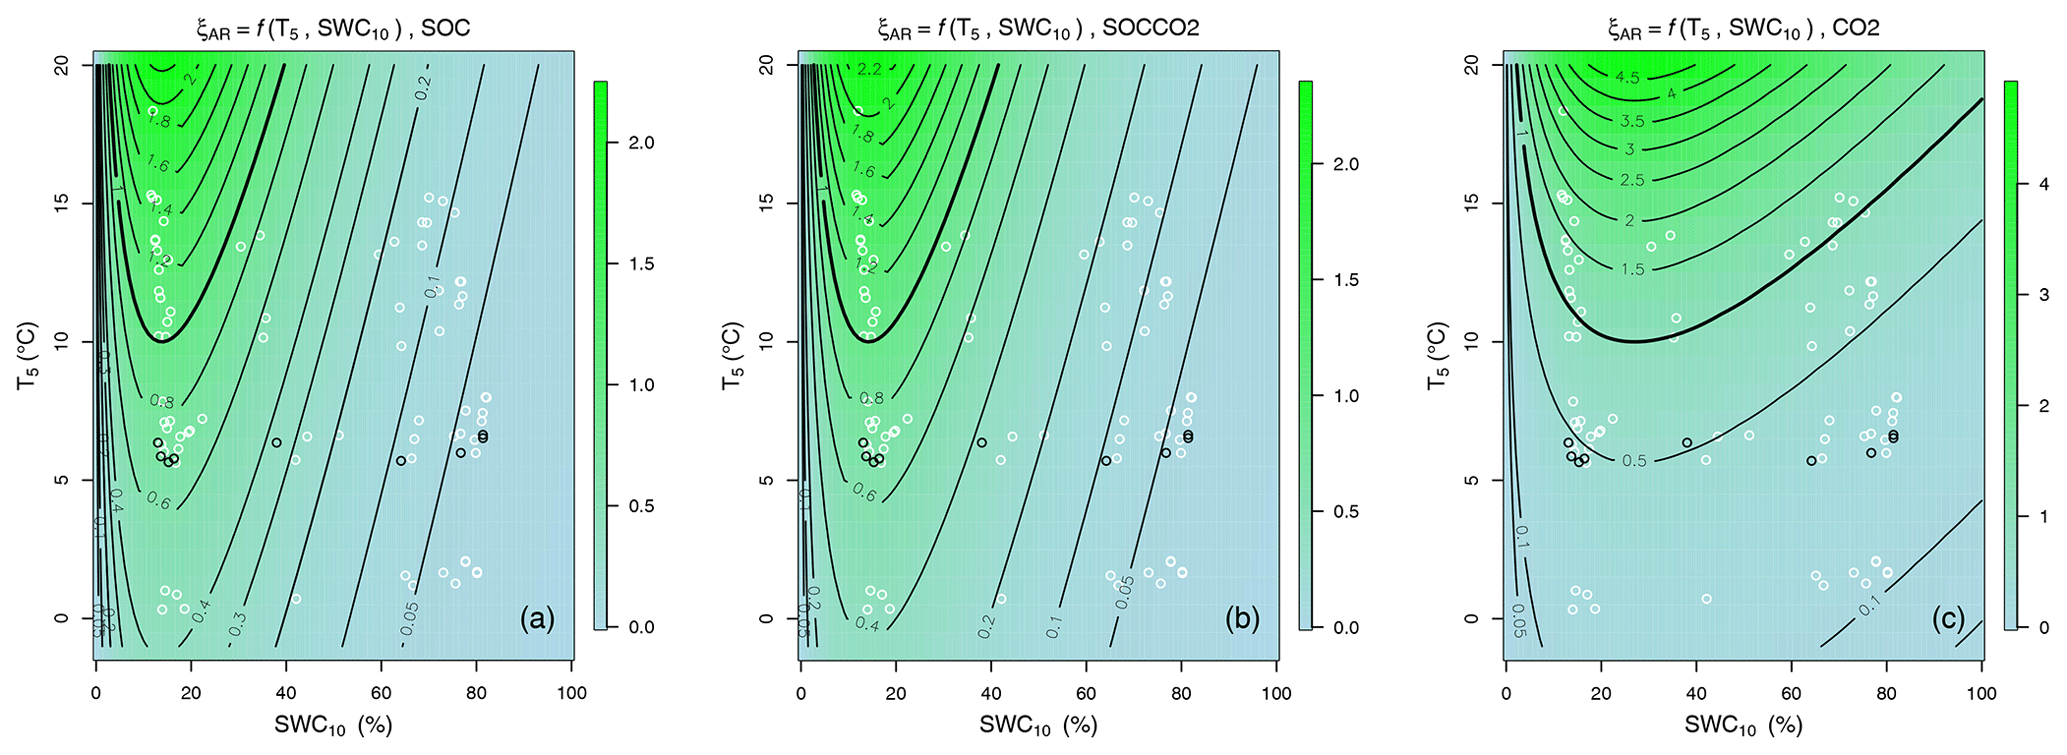
Figure 5The colours and contour lines showing the optimized environmental modifier of default decomposition rates ξAR (Eq. 3) (coupled with Yasso07 model) drawn with mean posterior values of parameters (Table 1) for combined responses to soil temperature at 5 cm, ξAR = f(T5), and to soil water content at 10 cm, ξAR = f(SWC10), based on only SOC (a), SOC and CO2 (b), or only CO2 (c) data. In the panels of combined ξAR white circles show pairs of corresponding monthly means of T5 and SWC10, and the black circles show the annual T5 and SWC10 means for 9 forest and mire site types.
3.3 ξAR optimized with Yasso07.ξAR
The optimization of ξAR (Eq. 3) coupled with Yasso07 showed that in the catena of mineral and organic soils of the boreal forest–mire, the optimum moisture content for decomposition and CO2 emissions was in well-drained mineral soil forests (SWCopt medians between 14 % and 27 %, Table 1, Fig. 4). The MCMC fit with CO2 data produced larger SWCopt and a larger tail in the Ricker function (compared to the SOC or SOCCO2 fit). The decomposition rate outside the moisture optimum reduced decomposition similarly for the two data sources (SOC and SOCCO2) used for calibration. However, the temperature and moisture functions were different when only CO2 was used for calibration.
The two SOC- and SOCCO2-based Q10 functions showed a similar increase with T5 until 10 °C (Fig. 4a). The combined non-linear temperature and moisture response in the whole climate data range showed larger change in ξ for mineral soil forests compared to forest mire transitions and peatlands (Fig. 5). The ξAR values in Fig. 5a and b for SOC- and SOCCO2-based ξAR are similar, showing that both SOC parameterization and SOCCO2 parameterization are almost the same, whereas the ξAR in Fig. 5c is different. The CO2-based temperature sensitivity of the median ξAR Q10 value of 4.5 resulted in a more pronounced increase in decomposition rates, especially in climate space with high water saturation (Figs. 4 and 5c). The SOC- and SOCCO2-based ξAR Q10 values for the forest–mire ecotone (medians 2.3 and 2.5, Table 1) were lower.
3.4 Performance of Yasso07.ξTW, Yasso07.ξW, and Yasso07.ξAR
The model performance evaluation showed that the soil water and temperature modifier ξAR coupled with the Yasso07 model (Yasso07.ξAR) outperformed the original Yasso07 environmental function even after a 65 % reduction in decomposition rates for wetlands was applied (Yasso07.ξTW) (Table 2, Fig. 5). Although the Yasso07.ξTW model version accurately predicted SOC stocks of mineral soil forests (CT, …, OMT), it heavily underestimated the SOC stocks of organo-mineral forested peatlands and mires (OMT+, …, VSR2); thus it showed the most biased model performance metrics (highest RMSE, MBE, MAE, and AIC and lowest ) among the model versions compared (Table 2). A reduction in decomposition rates of 65 % for mires in Yasso07.ξTW was not sufficient to simulate their SOC stocks as the simulated SOC of mires was only about 10 % of measured values (Fig. 5a–c). The SOC simulations for VSR mires with Yasso07.ξW would have required as much as a 96 % reduction in the decomposition rates. The optimized Yasso07.ξAR model version accurately simulated SOC stocks throughout the forest–mire ecotone.
The Yasso07.ξAR,p(θ|SOC) version outperformed Yasso07. when evaluated against SOC data, and both models were similar when evaluated against CO2 data (Table 2, Fig. 5). Yasso07. outperformed the functions based on SOC or SOCCO2 against measured CO2 data but failed when evaluated against measured SOC values. The Ricker function improved the representation of decomposition for drier soils and the representation of optimal SWC for decomposition.

Figure 6Scatterplots between observed SOC (kg C m−2) and Rh () from the forest–mire ecotone against modelled values with the two versions of Yasso07 model: (i) Y07.ξTW – Yasso07 coupled with the default environmental modifier (ξT, Eq. 3) based on air T and precipitation with a global parameter set (Tuomi et al., 2011) (applied for CT, …, KR mineral and organo-mineral soil forest sites) and with a reduction in decomposition rates by 65 % for wetlands (Goll et al., 2015; Kleinen et al., 2021) (applied to VSR1 and VSR2 mires sites) – and (ii) Y07.ξAR – Yasso07 coupled with an environmental modifier (ξAR, Eq. 3) based on SOC, SOC–CO2, or CO2 data (a, d) compared with the 1:1 line (dashed red line). The normalized model residuals (residuals divided by observations) are plotted against T5 and SWC10 with the trend lines of the linear fits and with their confidence intervals (dashed lines) (b, c, e, and f).
The SWC optimum was derived from the fitted ascending slope parameter, and its values were between 14 % and 27 % (depending on the data used for fitting; 14 % for SOC and CO2 and 27 % for CO2). The MCMC fit with CO2 data produced larger SWCopt and a larger tail in the Ricker function (compared to the SOC or SOCCO2 fit). However, the CO2-only fit also underestimated SOC stocks of forested peatlands (Fig. 5a). The normalized SOC residuals of the two Yasso07.ξAR models based on SOC or SOC and CO2 did not show any large T5 or SWC10 trends (Fig. 5a–c), although measured Rh fluxes during the cold season may be slightly overestimated.
The soil CO2 emissions simulated with the original Yasso07.ξTW agreed unexpectedly well with observed Rh values (Table 2, Fig. 6d–f), outperforming the Yasso07.ξAR,p(θ|SOC) version (Table 2, Fig. 6e). On the other hand, the Rh simulated with Yasso07.ξAR,p(θ|SOC) performed similarly to Yasso07.ξTW in terms of RMSE (the same RMSE of 0.16 for both models). The performance statistics for Yasso07.ξAR based on SOC and SOCCO2 were better compared with those of Yasso07.ξTW for SOC and about the same for Rh (Table 2). The performance statistics for Yasso07.ξAR based on CO2 were best among the models for CO2 but failed for SOC in a similar fashion to Yasso07.ξTW. The normalized modelled residuals showed that both Yasso07 model versions (Yasso07.ξTW and Yasso07.ξAR,p(θ|SOC)) showed small Rh biases in extreme, very cold and very warm, temperatures (Fig. 6e). The normalized CO2 residuals of the Yasso07. showed no bias among the functions (0 MBE, Table 2). The normalized CO2 residuals evaluated against SWC10 did not show any bias for any of the models (Fig. 6f).
The Yasso07 model (Tuomi et al., 2011), coupled with a revised and optimized empirical Q10 soil temperature and Ricker moisture function ξAR (Eq. 3, Fig. 4), successfully reconstructed observed variation in SOC stocks and soil heterotrophic CO2 emissions with increasing soil wetness in mineral, organo-mineral, and peat soils in boreal forest (Fig. 6). The original Yasso07 monotonic precipitation function is effective due to easily available data on upper boundary conditions, but it is also flawed in the case of a shallow water table when the lower boundary is equally important in defining the water content on the soil. Therefore, the usage of soil water content as a variable is structurally superior, and this can be proved by inductive reasoning, e.g. from the test model runs. Separating the effect of structure from calibration would require more test runs with data from a larger number of study sites.
Our application of Yasso07 models on the hillslope accounted for the continuity in moisture conditions, which was reflected in the modelled gradient of mineral and peat soil carbon stocks. The Yasso07 model initially developed for mineral soils was improved for application in peatlands by accounting for the soil temperature and volumetric moisture, as these are better predictors of heterotrophic respiration than air temperature and precipitation (Jian et al., 2022). Although the empirical Ricker function ξAR used here was heuristic, its form implicitly accounted for prevailing intrinsic micro-scale processes on the hillslope controlling Rh and SOC accumulation, e.g. plant and microbial communities and the long-term and short-term limitation of oxygen and substrate with moisture (Davidson et al., 2012; Moyano et al., 2012; Ghezzehei et al., 2019).
ξAR being able to simulate gradually increasing SOC stocks from mineral to organic soils makes it a preferable rate modifier for the Yasso07 model, instead of simply adjusting decomposition with a reduction constant for wetlands (e.g. Goll et al., 2015; Kleinen et al., 2021), which underestimated the SOC stocks of peatlands (Yasso07.ξTW in Fig. 5). In this study, a constant 96 % reduction (0.04 × k rates) was proposed for the existing Yasso07.ξTW model for more accurate SOC modelling in mires, a value comparable to rates of anaerobic decomposition (Schuur et al., 2015). The 96 % reduction is comparable to JULES, which accounts for oxygen inhibition with a gradual reduction in decomposition from the maximum rate of 1 at the moisture optimum (30 %–75 % SWC) to a reduced rate of 0.2 in water-saturated peat soils (Chadburn et al., 2022).
4.1 The moisture response
The use of gradually changing near-surface soil moisture avoids biases in land surface modelling related to ignoring high SOC stocks of organo-mineral soils of forested peatlands (Dalsgaard et al., 2016, Ťupek et al., 2016), e.g. forest–mire transitions (Figs. 1 and 2). The accurate modelling of decomposition rates with diffusion-based moisture functions accounting for microbial processes requires the correct representation of the drivers of heterotrophic respiration (Yan et al., 2018; Moyano et al., 2012, 2013; Manzoni et al., 2012; Ghezzehei et al., 2019). However, there is uncertainty in functional moisture – soil respiration dependencies are high (Sierra et al., 2015; Falloon et al., 2011) and dependencies vary with the soil properties; e.g. the SWC optimum increases for soils with higher organic C content (from 30 % to 75 % SWC; Moyano et al., 2012, 2013). The ξAR function's SWCopt found in dry and well-drained conditions and the reduction in default decomposition rates (k) with increasing soil wetness contrasted responses from short-term laboratory incubation soil respiration studies (weeks, months) that showed an increase in decomposition from dry conditions until reduction in very wet conditions (Sierra et al., 2017; Moyano et al., 2012, 2013; Kelly et al., 2000; Skopp et al., 1990; Yan et al., 2018). The ξAR optimized with SOC and CO2 data showed that the optimum/maximum decomposition rate in the forest–mire ecotone in dry, well-drained conditions was around 14 % of mean long-term near-surface SWC (around 20 % water-filled pore space (WFPS), corresponding to sub-xeric and mesic forest site types) (SWCopt parameters inferred from a parameter in Table 1, Fig. 4b), whereas the moisture optimum of studies based only on respiration from laboratory soil incubations was around 40 %–60 % (Fairbairn et al., 2023; Moyano et al., 2013; Kelly et al., 2000; Skopp et al., 1990; Yan et al., 2018).
The moisture optimum derived from the field site soil respiration datasets from a larger moisture range was found for 50 % WFPS and corresponded to around 31 % SWC assuming a mean porosity of 62 % (Hashimoto et al., 2011). Our SWCopt between 14 % and 27 % SWC (Table 1) was comparable to the optimum derived from the field site data, which was lower compared to laboratory incubations. The SWCopt discrepancy of the ξAR function highlights the difference between (1) the responses from the field-based or long-term soil respiration measurements reflecting moisture responses of older, stabilized, and slowly decomposing SOC and (2) the short-term incubation-based soil respiration studies which predominantly capture the decomposition of the newly available, labile, and rapidly decomposing SOC pool (González-Domínguez et al., 2019; Huang and Hall, 2017). Over longer periods of incubation, high Q10 can be observed (Zhou et al., 2014). The enhanced C mineralization can occur during periods of elevated moisture under Fe reduction when microbes can access previously protected labile C (Huang and Hall, 2017). The incubations are short term (from a few days to a few months) and are useful to identify short-term processes. Moreover, they are performed on disturbed soils (sometimes even sieved), and therefore the soil structure is not representative of the field.
The ecosystem-scale application of moisture reduction functions obtained in the laboratory can be hindered by several factors. There are a number of feedback mechanisms which modify the response obtained on a limited size soil sample. Among them is a change in microbial community composition, the texture- and structure-dependent effect of pore-scale connectedness of soil solutions, and competition between plants and microorganism for resources under different environmental stress conditions. Under a changing climate, these feedback mechanisms may lead to the system behaving unpredictably in relation to extrapolation. Therefore, the validation of the models at the site level with a series of various in situ stress levels is necessary for reliable future predictions.
In their impact on decomposition, the ξAR functions (calibrated with SOC, SOCCO2, and CO2 data) incorporated into the Yasso07 soil C model were comparable (e.g. all found the moisture optimum in well-drained soils of the forest–mire ecotone). Although the soil temperature and moisture functions showed relatively small differences in Q10 between the model fits, the a parameter of the moisture functions of the CO2-based fit was larger than those from the SOC and SOCCO2 fits (Table 1). In terms of the Yasso07 model constants, if temperature and moisture conditions are favourable for organic matter stabilization, then ξAR is reduced (Figs. 4 and 5), which in turn reduces decomposition rates of fast and slow C pools, reduces their CO2 emissions, and increases C storage. The forest–mire sites' heterotrophic respiration per unit of area did not show a clear difference between well-drained and water-saturated soils, whereas the C mineralization per unit of SOC was clearly reduced in soils with mean long-term field soil moisture (Fig. 2). A reduction in decomposition rates in the environmental gradient from low to higher field moisture indicates a possible difference in the soil C stabilization mechanisms under low and high water content (Das et al., 2019). Ghezzehei et al. (2019) suggested that empirical moisture sensitivity curves should be calibrated individually for each soil type. However, our study shows that the common modifier function, based on the SWC of the topsoil humus layer, which has comparable properties across the soil types, could provide insights into a more generalizable moisture sensitivity function. The mechanistic diffusion-based moisture functions (e.g. by Ghezzehei et al., 2019; Yan et al., 2018) could, in follow-up studies, be compared against deterministic moisture functions to evaluate their applicability and interpretation.
The ξAR function with its reduction with increasing wetness from dry soils was based on a large range of forest and mire soil C stocks (between 11 and 134 kg C m−2), reflecting a spatial long-term moisture gradient between forests and mires (Fig. 2) and short-term moisture and CO2 dynamics over years with contrasting climate (Fig. 3). The soil respiration data from 3 years covered exceptionally contrasting wet and dry summers and likely captured a full range dependency on the soil moisture induced by short-term weather variation in a spatial long-term forest–mire gradient for soil moisture, soil C pools, vegetation litter input dynamics (Figs. S2 and S3), and microbial composition. The short-term deviations in respiration indicative of wetting–drying cycles (Barnard et al., 2020; Patel et al., 2021) could be seen by the respiration increases in wet summers or during and after a period of drought (Fig. 3). Thus, the curve calibrated with highly variable SOC and CO2 data from a forest–mire ecotone represented a mean robust moisture decomposition dependency smoothing short-term weather-dependent fluctuations with the spatial variation in organic matter decomposition across ecological gradients. This function could meet the land surface modelling criteria for not only spatial accuracy on small scales but also cost efficiency for running or forecasting the C dynamics at large scales (Luo and Schuur, 2020).
Including SOC data or a combination of SOC and CO2 data in model fitting resulted in lower SWCopt, and the model fitting based only on CO2 showed larger SWCopt and a larger tail (descending slope) of the Ricker moisture function. Thus, in comparison to other studies, whose dependencies were limited to relatively short-term responses of only soil heterotrophic CO2 respiration from mainly mineral soils in laboratory conditions, the differences in SWCopt observed in our studies could be expected from differences in the data source used in model calibration. Unlike the data from controlled laboratory conditions, we used data from field measurements (mineral soil and peat SOC stocks, litter input, soil CO2 respiration, T5, and SWC10 measured under extreme weather variability for 3 years). In optimizing model performance with a multi-variable dataset, Keenan et al. (2013) found that a combination of data with fast and slow turnover (e.g. soil respiration and soil carbon stocks) leads to the largest improvement in model performance. Yasso07.ξAR based only on slow turnover (SOC) was as good as that constraining with SOC and CO2, as both approaches accurately observed soil CO2 emissions and SOC stocks across the site types of the forest–mire ecotone with no clear bias in residuals (Fig. 6). Thus, in a catena of mineral and peat soils of the forest–mire ecotone and in the combined measured SOC and CO2 data assimilation in ξAR (9 and 2369, respectively), the relatively small number of SOC stocks (nine forest and mire types) largely determined the SWC response form, reflecting both a spatial moisture gradient and its temporal variation. Whether the deterministic modifier rate was estimated correctly or not for the drained peatlands as well should be tested in follow-up studies, as our data did not include drained peatlands. The Ricker functional dependency has performed well for the drier region, but the performance in soils with high water status could still be improved. This could be deduced from the better statistical performance of the CO2-only fit with CO2 data (compared to the SOC or SOCCO2 fit), which produced a larger tail of the Ricker function. The CO2-only fit also underestimated SOC stocks of forested peatlands.
Although the moisture representation of the ξAR environmental function was accurate at the forest–mire ecotone level, at the forest site level, the contrasting respiration responses to moisture (i.e. either respiration reduction during soil drying or increased CO2 emissions with rewetting for dry soils or the opposite for wet soils; Barnard et al., 2020; Patel et al., 2021) were likely not captured sufficiently. Soil C modelling might be further improved using a moisture response that accounts separately for microbial respiration with increased water availability and for oxygen limitation in soil reaching water saturation (Sierra et al., 2015). However, as the aim of the environmental modifier used in this study was to apply the above concepts in a cost-efficient way using an empirical function with easily interpretable parameters (Q10 and a which informs us about the SWC optimum) (Davidson et al., 2012), the mathematical representation of the moisture function with increased complexity still needs to be evaluated in further studies testing different functional forms with larger regional data availability. Ghezzehei et al. (2019) suggested that empirical moisture sensitivity curves should be calibrated individually for each soil type. The mechanistic diffusion-based moisture functions (e.g. by Moyano et al., 2013; Yan et al., 2018; Ghezzehei et al., 2019) could, in follow-up studies, be tested against deterministic moisture functions (e.g. as in Davidson et al., 2012) to evaluate their applicability and interpretation. However, our study shows that the common modifier function, based on the SWC of the topsoil humus layer, which has comparable properties across the soil types, could provide insights into a more generalizable moisture sensitivity function.
In this study, we constrained the soil carbon model using both SOC (stock) and CO2 (flow) data. Few studies have constrained the soil carbon model to both SOC and CO2 data. Our study demonstrates the importance of extensive constraints on the soil carbon model to obtain a reliable model output. The SOC constraint improved the model performance; at the same time, the intensive SOC and CO2 constraint did not result in the improvement of model performance, which implies the need for further model development and testing. One potential improvement in modelling could be to account for the different responses to the environment (e.g. soil moisture) among different pools, like the temperature dependency separated between the soil layers and soil C fractions in more recent versions of the Yasso model, e.g. Yasso15 and Yasso20 (Viskari et al., 2020, 2022). The Yasso07 model adapts one common response function among different pools for simplicity; however, the fresh plant litter moisture limitation of decomposition may be expected to differ from the moisture limitation on older stabilized C in the humus horizon and mineral-associated C. Another factor could be the vertical process. The SOC is vertically distributed in the soil, and soil C fractions differ among soil depths. Accounting for the depth of the soil layer with the largest proportion of net CO2 emissions (Davidson et al., 2006, 2012), which is expected to vary with fluctuating water levels in forested peatlands, may further improve the soil respiration estimates for organic soils. On a process level, the key to understanding the difference in the moisture reduction function at different soil depths may lie in the nature of the physical and biochemical availability of substrate to enzymes released by microbial decomposers (Sainte-Marie et al., 2021).
4.2 The temperature response
The original air-temperature-based modifier in Yasso07 was replaced by the Q10-type temperature function driven by soil temperature (Davidson et al., 2012). This function was found to best represent the enzyme kinetics under unconstrained substrate and oxygen (Sierra et al., 2017). The optimized temperature function with SOC and combined SOC–CO2 data produced slightly more biased Rh estimates than the modifier based on CO2 data with Q10 around 4.5 (Table 1, Fig. 6). The Q10 values around 4.0 were comparable with the well-drained, moderately drained, and poorly drained forest soils for similar climates (Chen et al., 2020; Davidson et al., 1998; Karhu et al., 2010; Pumpanen et al., 2008). However, the optimization of the Q10-type temperature response only with SOC data and with SOC and CO2 (Table 1) showed lower values than for the Gaussian type of temperature dependency in Yasso07.ξTW (Fig. 5). Thus, due to the comparable predictive power when using soil and air temperature (Jian et al., 2022), the original Gaussian air temperature dependency could be more accurate than the Q10 response for the optimization with soil temperature (Tuomi et al., 2008).
Discrepancies in modelled respiration during winter (Fig. 6) could also be caused by a scarcity of winter field CO2 measurements, potentially resulting in larger random errors (e.g. due to difficulties of measuring relatively small respiration fluxes during soil freezing–thawing cycles, measurements on soil covered by a snow layer, and reduced precision of gas analysers during measurements in a lower temperature range). The density of CO2, temperature, and SWC measurements can be seen in Fig. 3. The less frequent measurements during periods of near-zero soil temperature might have affected the fit of the temperature function. However, our main emphasis was on the moisture, which in near-zero temperature conditions plays only a minor role in controlling respiration.
The Yasso07 soil carbon model was developed and parameterized at a global scale for mineral soils; however, it has also been applied to land surface modelling coupled with the JSBACH model with a 65 % reduction in default decomposition for wetlands. In this study we emphasized the improving representation of the response of soil organic C stock change and respiration to soil moisture in the Yasso07 model for forest–mire ecosystems. At the forest site level, we evaluated the performance of the Yasso07 model with an original climate modifier based on air temperature and precipitation against the model coupled with a revised environmental modifier based on soil temperature and moisture. We found that the Yasso07 model coupled with revised climate dependencies performed similarly for mineral soils but outperformed the original configuration with the JSBACH modification for undrained peatland soils.
The optimization of moisture dependency conducted in this study accounted for both a spatial moisture gradient and its temporal variation. The moisture optimum for dry soils has not changed depending on whether the function was optimized using both slow (SOC) and fast (CO2) turnover data (combined SOC and CO2 data) or only slow (SOC) data.
The SOC stocks in peatland forests were an order of magnitude larger in comparison to forests on mineral soil. On a landscape level, these peatland SOC stocks had the largest influence on calibrating the moisture optimum, when they were included along with fluxes in optimization. This could be inferred from the same calibrated moisture optimum when using calibration with only SOC or SOCCO2 as the data source, whereas for only CO2-based calibration, the optimum differs. The function implicitly accounted for a relative contribution of C fluxes from short-term biogeochemical processes in long-term SOC accumulation. For accurate estimates of the boreal forest soil carbon pools with the Yasso07 model, the SOC accumulation related to inhibition of decomposition with increasing wetness was more pronounced than the one related to dryness.
This study illustrated the limitation of the default moisture functions used for peatland forest soil C modelling. Also, the non-monotonic Ricker function with a moisture optimum in well-drained mineral soils needs further evaluation with regional boreal forest data. The exact representation of the functional form of the soil moisture dependency is characteristic of conditions of our study, e.g. the distribution of organic and mineral soil forests in the data. Broader extrapolation of the conclusions, e.g. regarding climate change or forest management on drained peatlands, would require more model testing with spatially larger data and lower water levels in forests on organic soils. However, if the soil moisture optimum of litter decomposition in forests on well-drained mineral soils of boreal landscapes proves to be robust, then in the future warmer and drier climates, the boreal forest could be expected to enhance soil C emissions to the atmosphere due to water level drawdown of presently water-saturated peat soils with large C stocks. In contrast, rewetting of previously drained peatlands could be expected to reduce soil C emissions, turning SOC loss to long-term C sequestration.
The input data (soil CO2 fluxes, soil temperature and moisture, air temperature and precipitation, tree stand and understorey inventory, and soil C stocks) as well as the analysis (R codes) needed to run the Yasso07 model versions and reproduce the results of this study are available on Zenodo, https://doi.org/10.5281/zenodo.8111475 (Tupek et al., 2023).
The supplement related to this article is available online at: https://doi.org/10.5194/gmd-17-5349-2024-supplement.
BŤ designed the hypothesis, collected data, and carried out the analysis. KM contributed to the design of the ecological gradient of study sites and the design of measurements of soil respiration and micrometeorology. AY contributed to soil sampling and soil C data preparation. AL contributed to codes on biomass and litter estimation. XT contributed to the formulation of likelihood for model calibration. BŤ prepared and revised the manuscript with contributions from all co-authors.
The contact author has declared that none of the authors has any competing interests.
Publisher's note: Copernicus Publications remains neutral with regard to jurisdictional claims made in the text, published maps, institutional affiliations, or any other geographical representation in this paper. While Copernicus Publications makes every effort to include appropriate place names, the final responsibility lies with the authors.
The study was partially supported by the SOMPA project (Novel soil management practices – key for sustainable bioeconomy and climate change mitigation) funded by the Strategic Research Council at the Research Council of Finland (grant no. 336570) and the HoliSoils project (Holistic management practices, modelling and monitoring for European forest soils) funded by European commission (EU Horizon 2020 grant agreement no. 101000289). We appreciate the constructive comments of Stefano Manzoni and the three referees (two anonymous and Lorenzo Menichetti).
This research has been supported by the European Commission, EU Horizon 2020 Framework Programme (grant no. 101000289), and the Strategic Research Council of Finland (grant no. 336570).
This paper was edited by Hans Verbeeck and reviewed by Lorenzo Menichetti and two anonymous referees.
Abramoff, R. Z., Guenet, B., Zhang, H., Georgiou, K., Xu, X., Viscarra Rossel, R. A., Yuan, W., and Ciais, P.: Improved global-scale predictions of soil carbon stocks with Millennial Version 2, Soil Biol. Biochem., 164, 108466, https://doi.org/10.1016/j.soilbio.2021.108466, 2022.
Adair, E. C., Parton, W. J., Del Grosso, S. J., Silver, W. L., Harmon, M. E., Hall, S. A., Burke, I. C., and Hart, S. C.: Simple three-pool model accurately describes patterns of long-term litter decomposition in diverse climates, Glob. Change Biol., 14, 2636–2660, https://doi.org/10.1111/j.1365-2486.2008.01674.x, 2008.
Barnard, R. L., Blazewicz, S. J., and Firestone, M. K.: Rewetting of soil: Revisiting the origin of soil CO2 emissions, Soil Biol. Biochem., 147, 107819, https://doi.org/10.1016/j.soilbio.2020.107819, 2020.
Berg, B., Booltink, H., Breymeyer, A., Ewertsson, A., Gallardo, A., Holm, B., Johansson, M.-B., Koivuoja, S., Meentemeyer, V., Nyman, P., Olofsson, J., Pettersson, A.-S., Reurslag, A., Staaf, H., Staaf, I., and Uba, L.: Data on needle litter decomposition and soil climate as well as site characteristics for some coniferous forest sites, Part I, Site characteristics, Report 41, Swedish University of Agricultural Sciences, Department of Ecology and Environmental Research, Uppsala, 1991a.
Berg, B., Booltink, H., Breymeyer, A., Ewertsson, A., Gallardo, A., Holm, B., Johansson, M.-B., Koivuoja, S., Meentemeyer, V., Nyman, P., Olofsson, J., Pettersson, A.-S., Reurslag, A., Staaf, H., Staaf, I., and Uba, L.: Data on needle litter decomposition and soil climate as well as site characteristics for some coniferous forest sites, Part II, Decomposition data, Report 42, Swedish University of Agricultural Sciences, Department of Ecology and Environmental Research, Uppsala, 1991b.
Berg, B., Berg, M. P., Bottner, P., Box, E., Breymeyer, A., De Anta, R. C., Couteaux, M., Mälkönen, E., McClaugherty, C., Meentemeyer, V., Munoz, F., Piussi, P., Remacle, J., and De Santo, A. V.: Litter mass loss in pine forests of Europe and Eastern United States: some relationships with climate and litter quality, Biogeochemistry, 20, 127–159, https://doi.org/10.1007/BF00000785, 1993.
Bhatti, J., Errington, R., Bauer, I., and Hurdle, P.: Carbon stock trends along forested peatland margins in central Saskatchewan, Can. J. Soil Sci., 86, 321–333, https://doi.org/10.4141/S05-085, 2006.
Bolker, B. M.: Deterministic Functions for Ecological Modeling, in: 3. Deterministic Functions for Ecological Modeling, Princeton University Press, 72–102, https://doi.org/10.1515/9781400840908-004, 2008.
Bona, K. A., Shaw, C., Thompson, D. K., Hararuk, O., Webster, K., Zhang, G., Voicu, M., and Kurz, W. A.: The Canadian model for peatlands (CaMP): A peatland carbon model for national greenhouse gas reporting, Ecol. Model., 431, 109164, https://doi.org/10.1016/j.ecolmodel.2020.109164, 2020.
Brooks, S. P. and Gelman, A.: General Methods for Monitoring Convergence of Iterative Simulations, J. Comput. Graphical Stat., 7, 434–455, https://doi.org/10.1080/10618600.1998.10474787, 1998.
Cajander A. K.: Forest types and their significance, Acta Forestalia Fennica, 56, 5, https://doi.org/10.14214/aff.7396, 1949.
Chadburn, S. E., Burke, E. J., Gallego-Sala, A. V., Smith, N. D., Bret-Harte, M. S., Charman, D. J., Drewer, J., Edgar, C. W., Euskirchen, E. S., Fortuniak, K., Gao, Y., Nakhavali, M., Pawlak, W., Schuur, E. A. G., and Westermann, S.: A new approach to simulate peat accumulation, degradation and stability in a global land surface scheme (JULES vn5.8_accumulate_soil) for northern and temperate peatlands, Geosci. Model Dev., 15, 1633–1657, https://doi.org/10.5194/gmd-15-1633-2022, 2022.
Chen, S., Wang, J., Zhang, T., and Hu, Z.: Climatic, soil, and vegetation controls of the temperature sensitivity (Q10) of soil respiration across terrestrial biomes, Global Ecology and Conservation, 22, e00955, https://doi.org/10.1016/j.gecco.2020.e00955, 2020.
Clymo, R. S.: A Model of Peat Bog Growth, in: Production Ecology of British Moors and Montane Grasslands, Ecological Studies, vol 27, edited by: Heal, O. W. and Perkins, D. F., Springer, Berlin, Heidelberg, https://doi.org/10.1007/978-3-642-66760-2_9, 1978.
Clymo, R. S.: Models of peat growth, Suo, 43, 127–136, 1992.
Dalsgaard, L., Lange, H., Strand, L. T., Callesen, I., Borgen, S. K., Liski, J., and Astrup, R.: Underestimation of boreal forest soil carbon stocks related to soil classification and drainage, Can. J. Forest Res., 46, 1413–1425, https://doi.org/10.1139/cjfr-2015-0466, 2016.
Das, S., Richards, B. K., Hanley, K. L., Krounbi, L., Walter, M. F., Walter, M. T., Steenhuis, T. S., and Lehmann, J.: Lower mineralizability of soil carbon with higher legacy soil moisture, Soil Biol. Biochem., 130, 94–104, https://doi.org/10.1016/j.soilbio.2018.12.006, 2019.
Davidson, E. A., Belk, E., and Boone, R. D.: Soil water content and temperature as independent or confounded factors controlling soil respiration in a temperate mixed hardwood forest, Glob. Change Biol., 4, 217–227, https://doi.org/10.1046/j.1365-2486.1998.00128.x, 1998.
Davidson, E. A., Savage, K. E., Trumbore, S. E., and Borken, W.: Vertical partitioning of CO2 production within a temperate forest soil, Glob. Change Biol., 12, 944–956, https://doi.org/10.1111/j.1365-2486.2005.01142.x, 2006.
Davidson, E. A., Samanta, S., Caramori, S. S., and Savage, K.: The Dual Arrhenius and Michaelis–Menten kinetics model for decomposition of soil organic matter at hourly to seasonal time scales, Glob. Change Biol., 18, 371–384, https://doi.org/10.1111/j.1365-2486.2011.02546.x, 2012.
Dimitrov, D. D., Bhatti, J. S., and Grant, R. F.: The transition zones (ecotone) between boreal forests and peatlands: Ecological controls on ecosystem productivity along a transition zone between upland black spruce forest and a poor forested fen in central Saskatchewan, Ecol. Model., 291, 96–108, https://doi.org/10.1016/j.ecolmodel.2014.07.020, 2014.
Dimitrov, D. D., Lafleur, P., Sonnentag, O., Talbot, J., and Quinton, W. L.: Hydrology of peat estimated from near-surface water contents, Hydrolog. Sci. J., 67, 1702–1721, https://doi.org/10.1080/02626667.2022.2099281, 2022.
Fairbairn, L., Rezanezhad, F., Gharasoo, M., Parsons, C. T., Macrae, M. L., Slowinski, S., and Van Cappellen, P.: Relationship between soil CO2 fluxes and soil moisture: Anaerobic sources explain fluxes at high water content, Geoderma, 434, 116493, https://doi.org/10.1016/j.geoderma.2023.116493, 2023.
Falloon, P., Jones, C. D., Ades, M., and Paul, K.: Direct soil moisture controls of future global soil carbon changes: An important source of uncertainty, Global Biogeochem. Cy., 25, GB3010, https://doi.org/10.1029/2010GB003938, 2011.
Frolking, S., Roulet, N. T., Moore, T. R., Richard, P. J. H., Lavoie, M., and Muller, S. D.: Modeling Northern Peatland Decomposition and Peat Accumulation, Ecosystems, 4, 479–498, https://doi.org/10.1007/s10021-001-0105-1, 2001.
Frolking, S., Roulet, N. T., Tuittila, E., Bubier, J. L., Quillet, A., Talbot, J., and Richard, P. J. H.: A new model of Holocene peatland net primary production, decomposition, water balance, and peat accumulation, Earth Syst. Dynam., 1, 1–21, https://doi.org/10.5194/esd-1-1-2010, 2010.
Gao, Y., Markkanen, T., Aurela, M., Mammarella, I., Thum, T., Tsuruta, A., Yang, H., and Aalto, T.: Response of water use efficiency to summer drought in a boreal Scots pine forest in Finland, Biogeosciences, 14, 4409–4422, https://doi.org/10.5194/bg-14-4409-2017, 2017.
Ghezzehei, T. A., Sulman, B., Arnold, C. L., Bogie, N. A., and Berhe, A. A.: On the role of soil water retention characteristic on aerobic microbial respiration, Biogeosciences, 16, 1187–1209, https://doi.org/10.5194/bg-16-1187-2019, 2019.
Gholz, H. L., Wedin, D. A., Smitherman, S. M., Harmon, M. E., and Parton, W. J.: Long-term dynamics of pine and hardwood litter in contrasting environments: toward a global model of decomposition, Glob. Change Biol., 6, 751–765, https://doi.org/10.1046/j.1365-2486.2000.00349.x, 2000.
Goll, D. S., Brovkin, V., Liski, J., Raddatz, T., Thum, T., and Todd-Brown, K. E. O.: Strong dependence of CO2 emissions from anthropogenic land cover change on initial land cover and soil carbon parametrization, Global Biogeochem. Cy., 29, 1511–1523, https://doi.org/10.1002/2014GB004988, 2015.
González-Domínguez, B., Niklaus, P. A., Studer, M. S., Hagedorn, F., Wacker, L., Haghipour, N., Zimmermann, S., Walthert, L., McIntyre, C., and Abiven, S.: Temperature and moisture are minor drivers of regional-scale soil organic carbon dynamics, Sci. Rep.-UK, 9, 6422, https://doi.org/10.1038/s41598-019-42629-5, 2019.
Han, Q., Zeng, Y., Zhang, L., Wang, C., Prikaziuk, E., Niu, Z., and Su, B.: Global long term daily 1 km surface soil moisture dataset with physics informed machine learning, Sci. Data, 10, 101, https://doi.org/10.1038/s41597-023-02011-7, 2023.
Hararuk, O., Xia, J., and Luo, Y.: Evaluation and improvement of a global land model against soil carbon data using a Bayesian Markov chain Monte Carlo method, J. Geophys. Res.-Biogeo., 119, 403–417, https://doi.org/10.1002/2013JG002535, 2014.
Hararuk, O., Smith, M. J., and Luo, Y.: Microbial models with data-driven parameters predict stronger soil carbon responses to climate change, Glob. Change Biol., 21, 2439–2453, https://doi.org/10.1111/gcb.12827, 2015.
Hartig, F., Dyke, J., Hickler, T., Higgins, S. I., O'Hara, R. B., Scheiter, S., and Huth, A.: Connecting dynamic vegetation models to data – an inverse perspective, J. Biogeogr., 39, 2240–2252, https://doi.org/10.1111/j.1365-2699.2012.02745.x, 2012.
Hartig, F., Minunno, F., Paul, S., Cameron, D., Ott, T., and Pichler, M.: BayesianTools: General-Purpose MCMC and SMC Samplers and Tools for Bayesian Statistics, https://CRAN.R-project.org/package=BayesianTools (last access: 5 July 2024), 2019.
Hartshorn, A. S., Southard, R. J., and Bledsoe, C. S.: Structure and Function of Peatland-Forest Ecotones in Southeastern Alaska, Soil Sci. Soc. Am. J., 67, 1572–1581, https://doi.org/10.2136/sssaj2003.1572, 2003.
Hashimoto, S., Morishita, T., Sakata, T., Ishizuka, S., Kaneko, S., and Takahashi, M.: Simple models for soil CO2, CH4, and N2O fluxes calibrated using a Bayesian approach and multi-site data, Ecol. Model., 222, 1283–1292, https://doi.org/10.1016/j.ecolmodel.2011.01.013, 2011.
Hashimoto, S., Nanko, K., Ťupek, B., and Lehtonen, A.: Data-mining analysis of the global distribution of soil carbon in observational databases and Earth system models, Geosci. Model Dev., 10, 1321–1337, https://doi.org/10.5194/gmd-10-1321-2017, 2017.
Huang, W. and Hall, S. J.: Elevated moisture stimulates carbon loss from mineral soils by releasing protected organic matter, Nat. Commun., 8, 1774, https://doi.org/10.1038/s41467-017-01998-z, 2017.
Humphrey, V., Berg, A., Ciais, P., Gentine, P., Jung, M., Reichstein, M., Seneviratne, S. I., and Frankenberg, C.: Soil moisture–atmosphere feedback dominates land carbon uptake variability, Nature, 592, 65–69, https://doi.org/10.1038/s41586-021-03325-5, 2021.
Jian, J., Steele, M. K., Zhang, L., Bailey, V. L., Zheng, J., Patel, K. F., and Bond-Lamberty, B. P.: On the use of air temperature and precipitation as surrogate predictors in soil respiration modelling, Eur. J. Soil Sci., 73, e13149, https://doi.org/10.1111/ejss.13149, 2022.
Karhu, K., Fritze, H., Hämaläinen, K., Vanhala, P., Jungner, H., Oinonen, M., Sonninen, E., Tuomi, M., Spetz, P., Kitunen, V., and Liski, J.: Temperature sensitivity of soil carbon fractions in boreal forest soil, Ecology 91, 370–376, https://www.jstor.org/stable/25661063 (last access: 5 July 2024), 2010.
Keenan, T. F., Davidson, E. A., Munger, J. W., and Richardson, A. D.: Rate my data: quantifying the value of ecological data for the development of models of the terrestrial carbon cycle, Ecol. Appl., 23, 273–286, https://doi.org/10.1890/12-0747.1, 2013.
Kelly, R. H., Parton, W. J., Hartman, M. D., Stretch, L. K., Ojima, D. S., and Schimel, D. S.: Intra-annual and interannual variability of ecosystem processes in shortgrass steppe, J. Geophys. Res.-Atmos., 105, 20093–20100, https://doi.org/10.1029/2000JD900259, 2000.
Kleinen, T., Brovkin, V., and Schuldt, R. J.: A dynamic model of wetland extent and peat accumulation: results for the Holocene, Biogeosciences, 9, 235–248, https://doi.org/10.5194/bg-9-235-2012, 2012.
Kleinen, T., Gromov, S., Steil, B., and Brovkin, V.: Atmospheric methane underestimated in future climate projections, Environ. Res. Lett., 16, 094006, https://doi.org/10.1088/1748-9326/ac1814, 2021.
Laine, J., Komulainen, V. M., Laiho, R., Minkkinen, K., Rasinmaki, A., Sallantaus, T., Sarkkola, S., Silvan, N., Tolonen, K., Tuittila, E. S., Vasander, H., and Paivanen, J.: Lakkasuo: a guide to mire ecosystem, Helsingin yliopiston metsäekologian laitoksen julkaisuja, Helsingin yliopisto, metsäekologian laitos, Helsinki, 2004.
Launiainen, S., Guan, M., Salmivaara, A., and Kieloaho, A.-J.: Modeling boreal forest evapotranspiration and water balance at stand and catchment scales: a spatial approach, Hydrol. Earth Syst. Sci., 23, 3457–3480, https://doi.org/10.5194/hess-23-3457-2019, 2019.
Lehtonen, A., Linkosalo, T., Peltoniemi, M., Sievänen, R., Mäkipää, R., Tamminen, P., Salemaa, M., Nieminen, T., Ťupek, B., Heikkinen, J., and Komarov, A.: Forest soil carbon stock estimates in a nationwide inventory: evaluating performance of the ROMULv and Yasso07 models in Finland, Geosci. Model Dev., 9, 4169–4183, https://doi.org/10.5194/gmd-9-4169-2016, 2016a.
Lehtonen, A., Palviainen, M., Ojanen, P., Kalliokoski, T., Nöjd, P., Kukkola, M., Penttilä, T., Mäkipää, R., Leppälammi-Kujansuu, J., and Helmisaari, H.-S.: Modelling fine root biomass of boreal tree stands using site and stand variables. For. Ecol. Manag., 359, 361–369, https://doi.org/10.1016/j.foreco.2015.06.023, 2016b.
Leifeld, J. and Menichetti, L.: The underappreciated potential of peatlands in global climate change mitigation strategies, Nat. Commun., 9, 1071, https://doi.org/10.1038/s41467-018-03406-6, 2018.
Leppä, K., Hökkä, H., Laiho, R., Launiainen, S., Lehtonen, A., Mäkipää, R., Peltoniemi, M., Saarinen, M., Sarkkola, S., and Nieminen, M.: Selection Cuttings as a Tool to Control Water Table Level in Boreal Drained Peatland Forests, Front. Earth Sci., 8, https://doi.org/10.3389/feart.2020.576510, 2020.
Luo, Y. and Schuur, E. A. G.: Model parameterization to represent processes at unresolved scales and changing properties of evolving systems, Glob. Change Biol., 26, 1109–1117, https://doi.org/10.1111/gcb.14939, 2020.
Luo, Y., Ogle, K., Tucker, C., Fei, S., Gao, C., LaDeau, S., Clark, J. S., and Schimel, D. S.: Ecological forecasting and data assimilation in a data-rich era, Ecol. Appl., 21, 1429–1442, https://doi.org/10.1890/09-1275.1, 2011.
Manzoni, S., Schimel, J. P., and Porporato, A.: Responses of soil microbial communities to water stress: results from a meta-analysis, Ecology, 93, 930–938, https://doi.org/10.1890/11-0026.1, 2012.
Metherell, A. K., Harding, L. A., Cole, C. V., and Parton, W. J.: CENTURY Soil Organic Matter Model Environment Technical Documentation, Agroecosystem Version 4.0, Technical Report No. 4, Great Plains System Research Unit, USDA-ARS, Ft. Collins, 1993.
Moyano, F. E., Vasilyeva, N., Bouckaert, L., Cook, F., Craine, J., Curiel Yuste, J., Don, A., Epron, D., Formanek, P., Franzluebbers, A., Ilstedt, U., Kätterer, T., Orchard, V., Reichstein, M., Rey, A., Ruamps, L., Subke, J.-A., Thomsen, I. K., and Chenu, C.: The moisture response of soil heterotrophic respiration: interaction with soil properties, Biogeosciences, 9, 1173–1182, https://doi.org/10.5194/bg-9-1173-2012, 2012.
Moyano, F. E., Manzoni, S., and Chenu, C.: Responses of soil heterotrophic respiration to moisture availability: An exploration of processes and models, Soil Biol. Biochem., 59, 72–85, https://doi.org/10.1016/j.soilbio.2013.01.002, 2013.
Parton, W. J.: The CENTURY model, in: Evaluation of Soil Organic Matter Models, NATO ASI Series, edited by: Powlson, D. S., Smith, P., and Smith, J. U., Springer, Berlin, Heidelberg, 283–291, https://doi.org/10.1007/978-3-642-61094-3_23, 1996.
Patel, K. F., Myers-Pigg, A., Bond-Lamberty, B., Fansler, S. J., Norris, C. G., McKever, S. A., Zheng, J., Rod, K. A., and Bailey, V. L.: Soil carbon dynamics during drying vs. rewetting: Importance of antecedent moisture conditions, Soil Biol. Biochem., 156, 108165, https://doi.org/10.1016/j.soilbio.2021.108165, 2021.
Pumpanen, J., Ilvesniemi, H., Kulmala, L., Siivola, E., Laakso, H., Kolari, P., Helenelund, C., Laakso, M., Uusimaa, M., and Hari, P.: Respiration in Boreal Forest Soil as Determined from Carbon Dioxide Concentration Profile, Soil Sci. Soc. Am. J., 72, 1187–1196, https://doi.org/10.2136/sssaj2007.0199, 2008.
Qiu, C., Zhu, D., Ciais, P., Guenet, B., Krinner, G., Peng, S., Aurela, M., Bernhofer, C., Brümmer, C., Bret-Harte, S., Chu, H., Chen, J., Desai, A. R., Dušek, J., Euskirchen, E. S., Fortuniak, K., Flanagan, L. B., Friborg, T., Grygoruk, M., Gogo, S., Grünwald, T., Hansen, B. U., Holl, D., Humphreys, E., Hurkuck, M., Kiely, G., Klatt, J., Kutzbach, L., Largeron, C., Laggoun-Défarge, F., Lund, M., Lafleur, P. M., Li, X., Mammarella, I., Merbold, L., Nilsson, M. B., Olejnik, J., Ottosson-Löfvenius, M., Oechel, W., Parmentier, F.-J. W., Peichl, M., Pirk, N., Peltola, O., Pawlak, W., Rasse, D., Rinne, J., Shaver, G., Schmid, H. P., Sottocornola, M., Steinbrecher, R., Sachs, T., Urbaniak, M., Zona, D., and Ziemblinska, K.: ORCHIDEE-PEAT (revision 4596), a model for northern peatland CO2, water, and energy fluxes on daily to annual scales, Geosci. Model Dev., 11, 497–519, https://doi.org/10.5194/gmd-11-497-2018, 2018.
Raich, J. W., Parton, W. J., Russell, A. E., Sanford, R. L., and Vitousek, P. M.: Analysis of factors regulating ecosystemdevelopment on Mauna Loa using the Century model, Biogeochemistry, 51, 161–191, https://doi.org/10.1023/A:1006495408992, 2000.
R Core Team: R: A language and environment for statistical computing, R Foundation for Statistical Computing, Vienna, Austria, https://www.R-project.org/ (last access: 5 July 2024), 2023.
Repola, J.: Biomass equations for birch in Finland, Silva Fenn., 42, 605–624, https://doi.org/10.14214/sf.236, 2008.
Repola, J.: Biomass equations for Scots pine and Norway spruce in Finland, Silva Fenn., 43, 625–647, https://doi.org/10.14214/sf.184, 2009.
Sainte-Marie, J., Barrandon, M., Saint-André, L., Gelhaye, E., Martin, F., and Derrien, D.: C-STABILITY an innovative modeling framework to leverage the continuous representation of organic matter, Nat. Commun., 12, 810, https://doi.org/10.1038/s41467-021-21079-6, 2021,.
Scharlemann, J. P., Tanner, E. V., Hiederer, R., and Kapos, V.: Global soil carbon: understanding and managing the largest terrestrial carbon pool, Carbon Manag., 5, 81–91, https://doi.org/10.4155/cmt.13.77, 2014.
Schuur, E. a. G., McGuire, A. D., Schädel, C., Grosse, G., Harden, J. W., Hayes, D. J., Hugelius, G., Koven, C. D., Kuhry, P., Lawrence, D. M., Natali, S. M., Olefeldt, D., Romanovsky, V. E., Schaefer, K., Turetsky, M. R., Treat, C. C., and Vonk, J. E.: Climate change and the permafrost carbon feedback, Nature, 520, 171–179, https://doi.org/10.1038/nature14338, 2015.
Sierra, C. A., Müller, M., and Trumbore, S. E.: Models of soil organic matter decomposition: the SoilR package, version 1.0, Geosci. Model Dev., 5, 1045–1060, https://doi.org/10.5194/gmd-5-1045-2012, 2012.
Sierra, C. A., Trumbore, S. E., Davidson, E. A., Vicca, S., and Janssens, I.: Sensitivity of decomposition rates of soil organic matter with respect to simultaneous changes in temperature and moisture, J. Adv. Model. Earth Sy., 7, 335–356, https://doi.org/10.1002/2014MS000358, 2015.
Sierra, C. A., Malghani, S., and Loescher, H. W.: Interactions among temperature, moisture, and oxygen concentrations in controlling decomposition rates in a boreal forest soil, Biogeosciences, 14, 703–710, https://doi.org/10.5194/bg-14-703-2017, 2017.
Skopp, J., Jawson, M. D., and Doran, J. W.: Steady-State Aerobic Microbial Activity as a Function of Soil Water Content, Soil Sci. Soc. Am. J., 54, 1619–1625, https://doi.org/10.2136/sssaj1990.03615995005400060018x, 1990.
Speich, M., Dormann, C. F., and Hartig, F.: Sequential Monte-Carlo algorithms for Bayesian model calibration – A review and method comparison, Ecol. Model., 455, 109608, https://doi.org/10.1016/j.ecolmodel.2021.109608, 2021.
Statistics Finland: Greenhouse gas emissions in Finland 1990 to 2021. National Inventory Report under the UNFCCC and the Kyoto Protocol, Statistics Finland, https://www.stat.fi/static/media/uploads/tup/khkinv/fi_nir_eu_2021_2023-03-15.pdf (last access: 15 May 2023), 2023.
St-Hilaire, F., Wu, J., Roulet, N. T., Frolking, S., Lafleur, P. M., Humphreys, E. R., and Arora, V.: McGill wetland model: evaluation of a peatland carbon simulator developed for global assessments, Biogeosciences, 7, 3517–3530, https://doi.org/10.5194/bg-7-3517-2010, 2010.
Straková, P., Anttila, J., Spetz, P., Kitunen, V., Tapanila, T., and Laiho, R.: Litter quality and its response to water level drawdown in boreal peatlands at plant species and community level, Plant Soil, 335, 501–520, https://doi.org/10.1007/s11104-010-0447-6, 2010.
Thum, T., Nabel, J. E. M. S., Tsuruta, A., Aalto, T., Dlugokencky, E. J., Liski, J., Luijkx, I. T., Markkanen, T., Pongratz, J., Yoshida, Y., and Zaehle, S.: Evaluating two soil carbon models within the global land surface model JSBACH using surface and spaceborne observations of atmospheric CO2, Biogeosciences, 17, 5721–5743, https://doi.org/10.5194/bg-17-5721-2020, 2020.
Todd-Brown, K. E. O., Randerson, J. T., Post, W. M., Hoffman, F. M., Tarnocai, C., Schuur, E. A. G., and Allison, S. D.: Causes of variation in soil carbon simulations from CMIP5 Earth system models and comparison with observations, Biogeosciences, 10, 1717–1736, https://doi.org/10.5194/bg-10-1717-2013, 2013.
Trofymow, J. A.: The Canadian Intersite Decomposition ExperimenT (CIDET), Project and site establishment report, Information report BCX-378, Pacific Forestry Centre, Victoria, Canada, 1998.
Tuomi, M., Vanhala, P., Karhu, K., Fritze, H., and Liski, J.: Heterotrophic soil respiration—Comparison of different models describing its temperature dependence, Ecol. Model., 211, 182–190, https://doi.org/10.1016/j.ecolmodel.2007.09.003, 2008.
Tuomi, M., Thum, T., Järvinen, H., Fronzek, S., Berg, B., Harmon, M., Trofymow, J. A., Sevanto, S., and Liski, J.: Leaf litter decomposition – Estimates of global variability based on Yasso07 model, Ecol. Model., 220, 3362–3371, https://doi.org/10.1016/j.ecolmodel.2009.05.016, 2009.
Tuomi, M., Laiho, R., Repo, A., and Liski, J.: Wood decomposition model for boreal forests, Ecol. Model., 222, 709–718, https://doi.org/10.1016/j.ecolmodel.2010.10.025, 2011.
Ťupek, B., Minkkinen, K., Kolari, P., Starr, M., Chan, T., Alm, J., Vesala, T., Laine, J., and Nikinmaa, E.: Forest floor versus ecosystem CO2 exchange along boreal ecotone between upland forest and lowland mire, Tellus B, 60, 153–166, https://doi.org/10.1111/j.1600-0889.2007.00328.x, 2008.
Ťupek, B., Minkkinen, K., Pumpanen, J., Vesala, T., and Nikinmaa, E.: CH4 and N2O dynamics in the boreal forest–mire ecotone, Biogeosciences, 12, 281–297, https://doi.org/10.5194/bg-12-281-2015, 2015.
Ťupek, B., Ortiz, C. A., Hashimoto, S., Stendahl, J., Dahlgren, J., Karltun, E., and Lehtonen, A.: Underestimation of boreal soil carbon stocks by mathematical soil carbon models linked to soil nutrient status, Biogeosciences, 13, 4439–4459, https://doi.org/10.5194/bg-13-4439-2016, 2016.
Ťupek, B., Launiainen, S., Peltoniemi, M., Sievänen, R., Perttunen, J., Kulmala, L., Penttilä, T., Lindroos, A.-J., Hashimoto, S., and Lehtonen, A.: Evaluating CENTURY and Yasso soil carbon models for CO2 emissions and organic carbon stocks of boreal forest soil with Bayesian multi-model inference, Eur. J. Soil Sci., 70, 847–858, https://doi.org/10.1111/ejss.12805, 2019.
Tupek, B., Yurova, A., and Lehtonen, A.: Data assimilation of boreal forest – mire ecotone soil C dynamics into Yasso07 model coupled with updated moisture modifier, Zenodo [code and data set], https://doi.org/10.5281/zenodo.8111475, 2023.
Turetsky, M. R., Benscoter, B., Page, S., Rein, G., van der Werf, G. R., and Watts, A.: Global vulnerability of peatlands to fire and carbon loss, Nat. Geosci., 8, 11–14, https://doi.org/10.1038/ngeo2325, 2015.
Vávřová, P., Penttilä, T., and Laiho, R.: Decomposition of Scots pine fine woody debris in boreal conditions: Implications for estimating carbon pools and fluxes, Forest Ecol. Manag., 257, 401–412, https://doi.org/10.1016/j.foreco.2008.09.017, 2009.
Viskari, T., Laine, M., Kulmala, L., Mäkelä, J., Fer, I., and Liski, J.: Improving Yasso15 soil carbon model estimates with ensemble adjustment Kalman filter state data assimilation, Geosci. Model Dev., 13, 5959–5971, https://doi.org/10.5194/gmd-13-5959-2020, 2020.
Viskari, T., Pusa, J., Fer, I., Repo, A., Vira, J., and Liski, J.: Calibrating the soil organic carbon model Yasso20 with multiple datasets, Geosci. Model Dev., 15, 1735–1752, https://doi.org/10.5194/gmd-15-1735-2022, 2022.
Wania, R., Ross, I., and Prentice, I. C.: Implementation and evaluation of a new methane model within a dynamic global vegetation model: LPJ-WHyMe v1.3.1, Geosci. Model Dev., 3, 565–584, https://doi.org/10.5194/gmd-3-565-2010, 2010.
Weishampel, P., Kolka, R., and King, J. Y.: Carbon pools and productivity in a 1-km2 heterogeneous forest and peatland mosaic in Minnesota, USA, Forest Ecol. Manag. 257, 747–754, https://doi.org/10.1016/j.foreco.2008.10.008, 2009.
Xia, J. Y., Luo, Y. Q., Wang, Y.-P., Weng, E. S., and Hararuk, O.: A semi-analytical solution to accelerate spin-up of a coupled carbon and nitrogen land model to steady state, Geosci. Model Dev., 5, 1259–1271, https://doi.org/10.5194/gmd-5-1259-2012, 2012.
Xu, T., White, L., Hui, D., and Luo, Y.: Probabilistic inversion of a terrestrial ecosystem model: Analysis of uncertainty in parameter estimation and model prediction, Global Biogeochem. Cy., 20, GB2007, https://doi.org/10.1029/2005GB002468, 2006.
Yan, Z., Bond-Lamberty, B., Todd-Brown, K. E., Bailey, V. L., Siliang, L., Congqiang, L., and Chongxuan, L.: A moisture function of soil heterotrophic respiration that incorporates microscale processes, Nat. Commun., 9, 2562, https://doi.org/10.1038/s41467-018-04971-6, 2018.
Zhiyanski, M.: Seasonal dynamics of fine root biomass in selected forest stands, Silva Balcanica, 15, 5–15, 2014.
Zhou, W., Hui, D., and Shen, W.: Effects of Soil Moisture on the Temperature Sensitivity of Soil Heterotrophic Respiration: A Laboratory Incubation Study, PLOS ONE, 9, e92531, https://doi.org/10.1371/journal.pone.0092531, 2014.