the Creative Commons Attribution 4.0 License.
the Creative Commons Attribution 4.0 License.
 | 22 May 2024
Importance of microphysical settings for climate forcing by stratospheric SO2 injections as modeled by SOCOL-AERv2
Sandro Vattioni
Beiping Luo
Gabriel Chiodo
Timofei Sukhodolov
Elia Wunderlin
Thomas Peter
Solar radiation modification by a sustained deliberate source of SO2 into the stratosphere (strat-SRM) has been proposed as an option for climate intervention. Global interactive aerosol–chemistry–climate models are often used to investigate the potential cooling efficiencies and associated side effects of hypothesized strat-SRM scenarios. A recent model intercomparison study for composition–climate models with interactive stratospheric aerosol suggests that the modeled climate response to a particular assumed injection strategy depends on the type of aerosol microphysical scheme used (e.g., modal or sectional representation) alongside host model resolution and transport. Compared to short-duration volcanic SO2 emissions, the continuous SO2 injections in strat-SRM scenarios may pose a greater challenge to the numerical implementation of microphysical processes such as nucleation, condensation, and coagulation. This study explores how changing the time steps and sequencing of microphysical processes in the sectional aerosol–chemistry–climate model SOCOL-AERv2 (40 mass bins) affects model-predicted climate and ozone layer impacts considering strat-SRM by SO2 injections of 5 and 25 Tg(S) yr−1 at 20 km altitude between 30° S and 30° N. The model experiments consider the year 2040 to be the boundary conditions for ozone-depleting substances and greenhouse gases (GHGs). We focus on the length of the microphysical time step and the call sequence of nucleation and condensation, the two competing sink processes for gaseous H2SO4. Under stratospheric background conditions, we find no effect of the microphysical setup on the simulated aerosol properties. However, at the high sulfur loadings reached in the scenarios injecting 25 Tg(S) yr−1 of SO2 with a default microphysical time step of 6 min, changing the call sequence from the default “condensation first” to “nucleation first” leads to a massive increase in the number densities of particles in the nucleation mode (R<0.01 µm) and a small decrease in coarse-mode particles (R>1 µm). As expected, the influence of the call sequence becomes negligible when the microphysical time step is reduced to a few seconds, with the model solutions converging to a size distribution with a pronounced nucleation mode. While the main features and spatial patterns of climate forcing by SO2 injections are not strongly affected by the microphysical configuration, the absolute numbers vary considerably. For the extreme injection with 25 Tg(S) yr−1, the simulated net global radiative forcing ranges from −2.3 to −5.3 W m−2, depending on the microphysical configuration. Nucleation first shifts the size distribution towards radii better suited for solar scattering (0.3 µm 0.4 µm), enhancing the intervention efficiency. The size distribution shift, however, generates more ultrafine aerosol particles, increasing the surface area density and resulting in 10 DU (Dobson units) less ozone (about 3 % of the total column) in the northern mid-latitudes and 20 DU less ozone (6 %) over the polar caps compared to the condensation first approach. Our results suggest that a reasonably short microphysical time step of 2 min or less must be applied to accurately capture the magnitude of the H2SO4 supersaturation resulting from SO2 injection scenarios or volcanic eruptions. Taken together, these results underscore how structural aspects of model representation of aerosol microphysical processes become important under conditions of elevated stratospheric sulfur in determining atmospheric chemistry and climate impacts.
- Article
(2694 KB) - Full-text XML
-
Supplement
(982 KB) - BibTeX
- EndNote


The idea of increasing the Earth’s albedo by injecting sulfur-containing gases into the stratosphere to reduce some of the adverse effects of global warming induced by greenhouse gases (GHGs) dates back to the 1970s (Budyko, 1974) and was 30 years later further elaborated by Crutzen (2006). The arguments presented by Crutzen called for active scientific research of the kind of activity, which became known under the somewhat misleading term geoengineering. Therefore, in this study we use the term stratospheric solar radiation modification (strat-SRM). Crutzen's idea is based on the fact that sulfur-containing gases, such as SO2, H2S, or OCS, injected into the lower stratosphere form aqueous sulfuric acid aerosol particles via a chain of chemical and microphysical processes (Thomason and Peter, 2006; Kremser et al., 2016). The resulting binary H2SO4–H2O solution droplets scatter solar radiation back to space, causing a cooling on the Earth's surface. At the same time, however, they heat the stratosphere due to the absorption of upwelling longwave radiation. Moreover, sulfate aerosols play an important role in stratospheric ozone chemistry by providing surfaces for heterogeneous reactions (Solomon, 1999). While the infrared absorptivity is determined to a good approximation by the total aerosol volume, the efficiency of scattering solar radiation depends strongly on the detailed aerosol size distribution: many small particles are more efficient than a few large particles, but they also provide a larger surface area density (SAD), accelerating heterogeneous chemistry (Heckendorn et al., 2009).
In the stratosphere, the total aerosol number density and size distribution are governed by the microphysical processes of nucleation, coagulation, condensation, evaporation, and gravitational settling (Kremser et al., 2016, and references therein). The formation of new sulfate aerosol particles occurs via binary homogeneous nucleation of H2SO4 and H2O molecules or via heterogeneous nucleation in the presence of appropriate condensation nuclei like meteoritic dust or ions, which requires lower saturation ratios than homogeneous nucleation. The freshly formed particles can grow further through coagulation and condensation of H2SO4 (together with H2O). As stratospheric temperatures increase with altitude, the sulfate aerosol particles eventually evaporate above 32 to 35 km, releasing H2SO4 back to the gas phase.
The effectiveness of strat-SRM by SO2 injection has been intensively investigated using models of different complexities and assuming different injection scenarios (e.g., Heckendorn et al., 2009; Pierce et al., 2010; Niemeier et al., 2011; English et al., 2011; Niemeier and Timmreck, 2015; Tilmes et al., 2018; Vattioni et al., 2019; Weisenstein et al., 2022; Laakso et al., 2022; Tilmes et al., 2022). Such modeling studies have advanced our understanding of stratospheric aerosols, but they also highlighted uncertainties regarding the transport, chemistry, and microphysics of the aerosol size distribution. In a recent study, Weisenstein et al. (2022) presented a model intercomparison exploring the impacts of stratospheric injections of SO2 gas and accumulation-mode sulfuric acid aerosol (AM-H2SO4) on atmospheric chemistry and climate. Three general circulation models (GCMs) with interactive aerosol microphysics conducted strictly coordinated model experiments within the framework of the Geoengineering Model Intercomparison Project (GeoMIP; Kravitz et al., 2011), namely the second version of the Community Earth System Model (CESM2) with the Whole Atmosphere Community Climate Model (WACCM) atmospheric configuration (Danabasoglu et al., 2020), the middle-atmosphere version of the ECMWF Hamburg Model (ECHAM5) with the HAM microphysical module (MA-ECHAM5-HAM; Stier et al., 2005), and the SOlar Climate Ozone Links model with AER microphysics version 2 (SOCOL-AERv2; Feinberg et al., 2019). The model experiments included injections of 5 and 25 Tg(S) yr−1 in the form of SO2 gas or AM-H2SO4, emitted either as two “point injections” at 30° N and 30° S or as “regional injections” between 30° N and 30° S. Two of the participating models, CESM2 and MA-ECHAM5-HAM, assume that the aerosol size distribution can be described by superimposed lognormal size distributions (modal scheme), while SOCOL-AERv2 uses a size-resolving (sectional) scheme.
The analysis of the simulated particle size distributions for the SO2 injection scenarios revealed substantial differences between each pair of the three models. CESM2 generates new particles and adds them directly to the Aitken mode (R≳10 nm) so that there are no nanometer-sized particles. In contrast, SOCOL-AERv2 treats these tiny particles down to 0.4 nm in size. Compared to MA-ECHAM5-HAM, SOCOL shows substantially fewer nucleation-mode particles, suggesting different roles of nucleation and condensation in both models: the microphysical scheme in SOCOL-AERv2 appears to prefer condensational growth of existing particles by the uptake of H2SO4 over the formation of new particles, while the opposite seems to be the case for MA-ECHAM5-HAM. The description of the results of the microphysical processes by means of lognormal functions in modal models, such as CESM2 and MA-ECHAM5-HAM, further complicates the interpretation.
Nucleation and condensation are competing sink processes for gas-phase H2SO4, which occur simultaneously in the atmosphere but typically with different speeds. The characteristic timescale, τ, for the removal of H2SO4 molecules by condensation is given by the following equation:
with A being the aerosol surface area density and v the mean thermal velocity of H2SO4 molecules. For background conditions with typical SAD values of 5 to 10 µm2 cm−3 in nucleation regions, the equilibrium timescale for condensation is around 0.5–1 h. This value decreases inversely with increasing SAD. Under volcanic or strat-SRM conditions with a SAD of ∼ 80 µm2 cm−3, typical of the 25 Tg(S) yr−1 injection scenario, the equilibrium timescale is shorter than 5 min. As the nucleation rate strongly depends on the gas-phase H2SO4 supersaturation, the model time step used for condensation and nucleation must be significantly smaller than the time required to approach gas-phase equilibrium in order to avoid one process erroneously dominating the gas-to-particle transfer of H2SO4. Furthermore, coagulation is also affected by the competition between nucleation and condensation, as it is most efficient at (initially) high number densities and between particles of different sizes. Small particles move fast but have only small cross sections for collision, while large particles exhibit slower Brownian motion but provide good collision targets for smaller particles (Seinfeld and Pandis, 1997). The correct numerical representation of these simultaneously occurring processes is challenging, especially under sulfur-rich conditions, when characteristic timescales become extremely short. This motivated us to critically question the microphysical scheme of the sectional SOCOL-AERv2 model and to systematically test the impact of the call sequence of the subroutines for condensation and nucleation and of the microphysical time step on the simulated aerosol properties and the modeled climate response to stratospheric SO2 injection.
The paper is organized as follows: Sect. 2 presents a brief description of the SOCOL-AERv2 model and details of the experimental setup. Section 3 discusses the impact of the microphysical settings on the aerosol size distribution under stratospheric background conditions and under stratospheric injections of SO2 gas (Sect. 3.1); on the global mean particle size, aerosol burden, and radiative forcing (Sect. 3.2); and on the meridional distributions of aerosol burden, radiative forcing, and ozone (Sect. 3.3) resulting from the SO2 injections. The influence of the microphysical settings on profiles of various quantities is briefly mentioned (Sect. 3.4) and detailed in the Supplement. To evaluate the changes in SOCOL aerosol microphysics against observations, we also test different settings for the 1991 eruption of Mt. Pinatubo (Sect. 3.5). Section 4 includes a summary and a discussion.
2.1 SOCOL-AERv2
A first version of the aerosol–chemistry–climate model SOCOL-AER was introduced by Sheng et al. (2015), who integrated the size-resolving (sectional) sulfate aerosol module AER (Weisenstein et al., 1997) into the three-dimensional grid of the chemistry–climate model (CCM) SOCOLv3 (Stenke et al., 2013), which consists of the middle-atmosphere version of the spectral general circulation model MA-ECHAM5 (Roeckner et al., 2003, 2006) and the chemistry–transport model MEZON (Rozanov et al., 1999; Egorova et al., 2003). Since then, the model's tropospheric and stratospheric sulfur cycles have undergone several improvements, resulting in the publication of SOCOL-AERv2 (Feinberg et al., 2019).
SOCOL-AERv2 resolves the sulfate aerosol particles in 40 mass bins, ranging from 0.39 nm to 3.2 µm in radius. Since the mass bins refer to the dry aerosol radius, they can also be interpreted as aerosol H2SO4 mass bins, ranging from about 2.8 to 1.6 × 10¹² molecules of H2SO4 per aerosol particle. Neighboring mass bins differ in molecule number doubling.
Detailed descriptions of the original AER microphysics and their adaptations for the coupled model are provided in Weisenstein et al. (1997, 2007) and Sheng et al. (2015), respectively. Aerosol composition – i.e., the sulfuric acid weight percent in the particles – is calculated as a function of ambient temperature and H2O partial pressure using the parameterization of Tabazadeh et al. (1997), which is also used for the calculation of the wet aerosol radius of each mass bin. For the formation of new particles by binary homogeneous nucleation, the scheme of Vehkamäki et al. (2002) is used. This scheme calculates the nucleation rate and the radius and composition of new particles, meaning that the nucleated mass is added to a single mass bin. The particles can grow through H2SO4 condensation and shrink through evaporation, with both processes depending on the equilibrium concentration of H2SO4 above the particle surface (Ayers et al., 1980; Kulmala and Laaksonen, 1990). Condensational growth leads to an increase in mass in the aerosol phase and a shift of particles to larger mass bins, while evaporation does the opposite. Changes in the net number density occur only upon evaporation from the smallest mass bin or condensational growth of the largest mass bin. Finally, coagulation reduces number densities and shifts aerosol mass to larger bins. Coagulation is solved by a semi-implicit method (Jacobson and Seinfeld, 2004), whereas at most 90 % of the available mass in one mass bin is allowed to be lost by coagulation within one microphysical time step. Otherwise, the coagulation time step is reduced. The coagulation kernel, which defines the collision probability of two particles, depends on the particle radius and the diffusion coefficient (Fuchs, 1964). Finally, sedimentation, which affects the vertical distribution of aerosol particles and reduces their residence time in the stratosphere, is parameterized following the numerical scheme of Walcek (2000). The gravitational settling velocities of aerosol particles are calculated following Kasten (1968).
The CCM SOCOLv3 and the aerosol module AER are interactively coupled via the chemistry and radiation routines. Sulfur chemical reactions (Sheng et al., 2015) are fully integrated into the model's chemical solver, which is based on the implicit iterative Newton–Raphson scheme (Stott and Harwood, 1993). In addition to gas-phase chemistry, the model includes the aqueous-phase oxidation of S(IV) to S(VI) by ozone (O3) and hydrogen peroxide (H2O2) in cloud water (Jacob, 1986). The modeled sulfate aerosol is fed directly into the heterogeneous chemistry and radiation schemes. The aerosol radiative properties (extinction coefficients, single scattering albedos, and asymmetry factors as functions of wavelength) required to drive the model dynamics are calculated online from the aerosol size distribution using Mie theory with a temperature- and humidity-dependent lookup table, which accounts for the aerosol H2SO4 weight percentage.
The model uses operator splitting. The dynamics module is called every 15 min, whereas the chemistry, aerosol microphysics, and radiation schemes are called every 2 h. For the microphysical processes – especially for nucleation, with its highly nonlinear dependence on gaseous H2SO4 concentration – sub-time steps are used within the 2 h chemistry loop to avoid the process called first mistakenly dominating the H2SO4-to-particle exchange rate. The default procedure is to use Nmicro=20 sub-loops within the chemical time step, which results in a microphysical time step of 6 min (2 h/Nmicro=2 h/20=6 min). The parameter Nmicro can be easily adjusted between runs. By default, the call sequence for the microphysical processes is condensation first, followed by nucleation (see CN sequence in Fig. 1) and, finally, coagulation. At each chemical time step, the model first calculates the new H2SO4 gas-phase concentration resulting from chemical production and transport. In the microphysical loop, the H2SO4 concentration is then consecutively updated with condensation and nucleation. As we see later, it is also important to distribute the gaseous H2SO4 molecules produced during the 2 h chemical time step homogeneously over the Nmicro sub-time steps (see ΔH2SO4 in Fig. 1) rather than passing them as a total amount at the beginning of the microphysical loop. Otherwise, under conditions of SO2 injections, the 2-hourly call frequency of the chemistry scheme would lead to initially unrealistically high H2SO4 supersaturations in the microphysical loop, which then causes artifacts in the aerosol microphysics. The aerosol composition and the coagulation kernel are calculated only once every 2 h and are kept constant for the microphysical calculations. Finally, sedimentation is calculated after the microphysical sub-loop, again, once every 2 h. To test the implications of the aerosol microphysics on the simulated aerosol size distribution under various stratospheric sulfur loadings, we performed several sensitivity simulations, for which we changed the call sequence for condensation and nucleation or increased the number of microphysical sub-time steps, Nmicro>20.
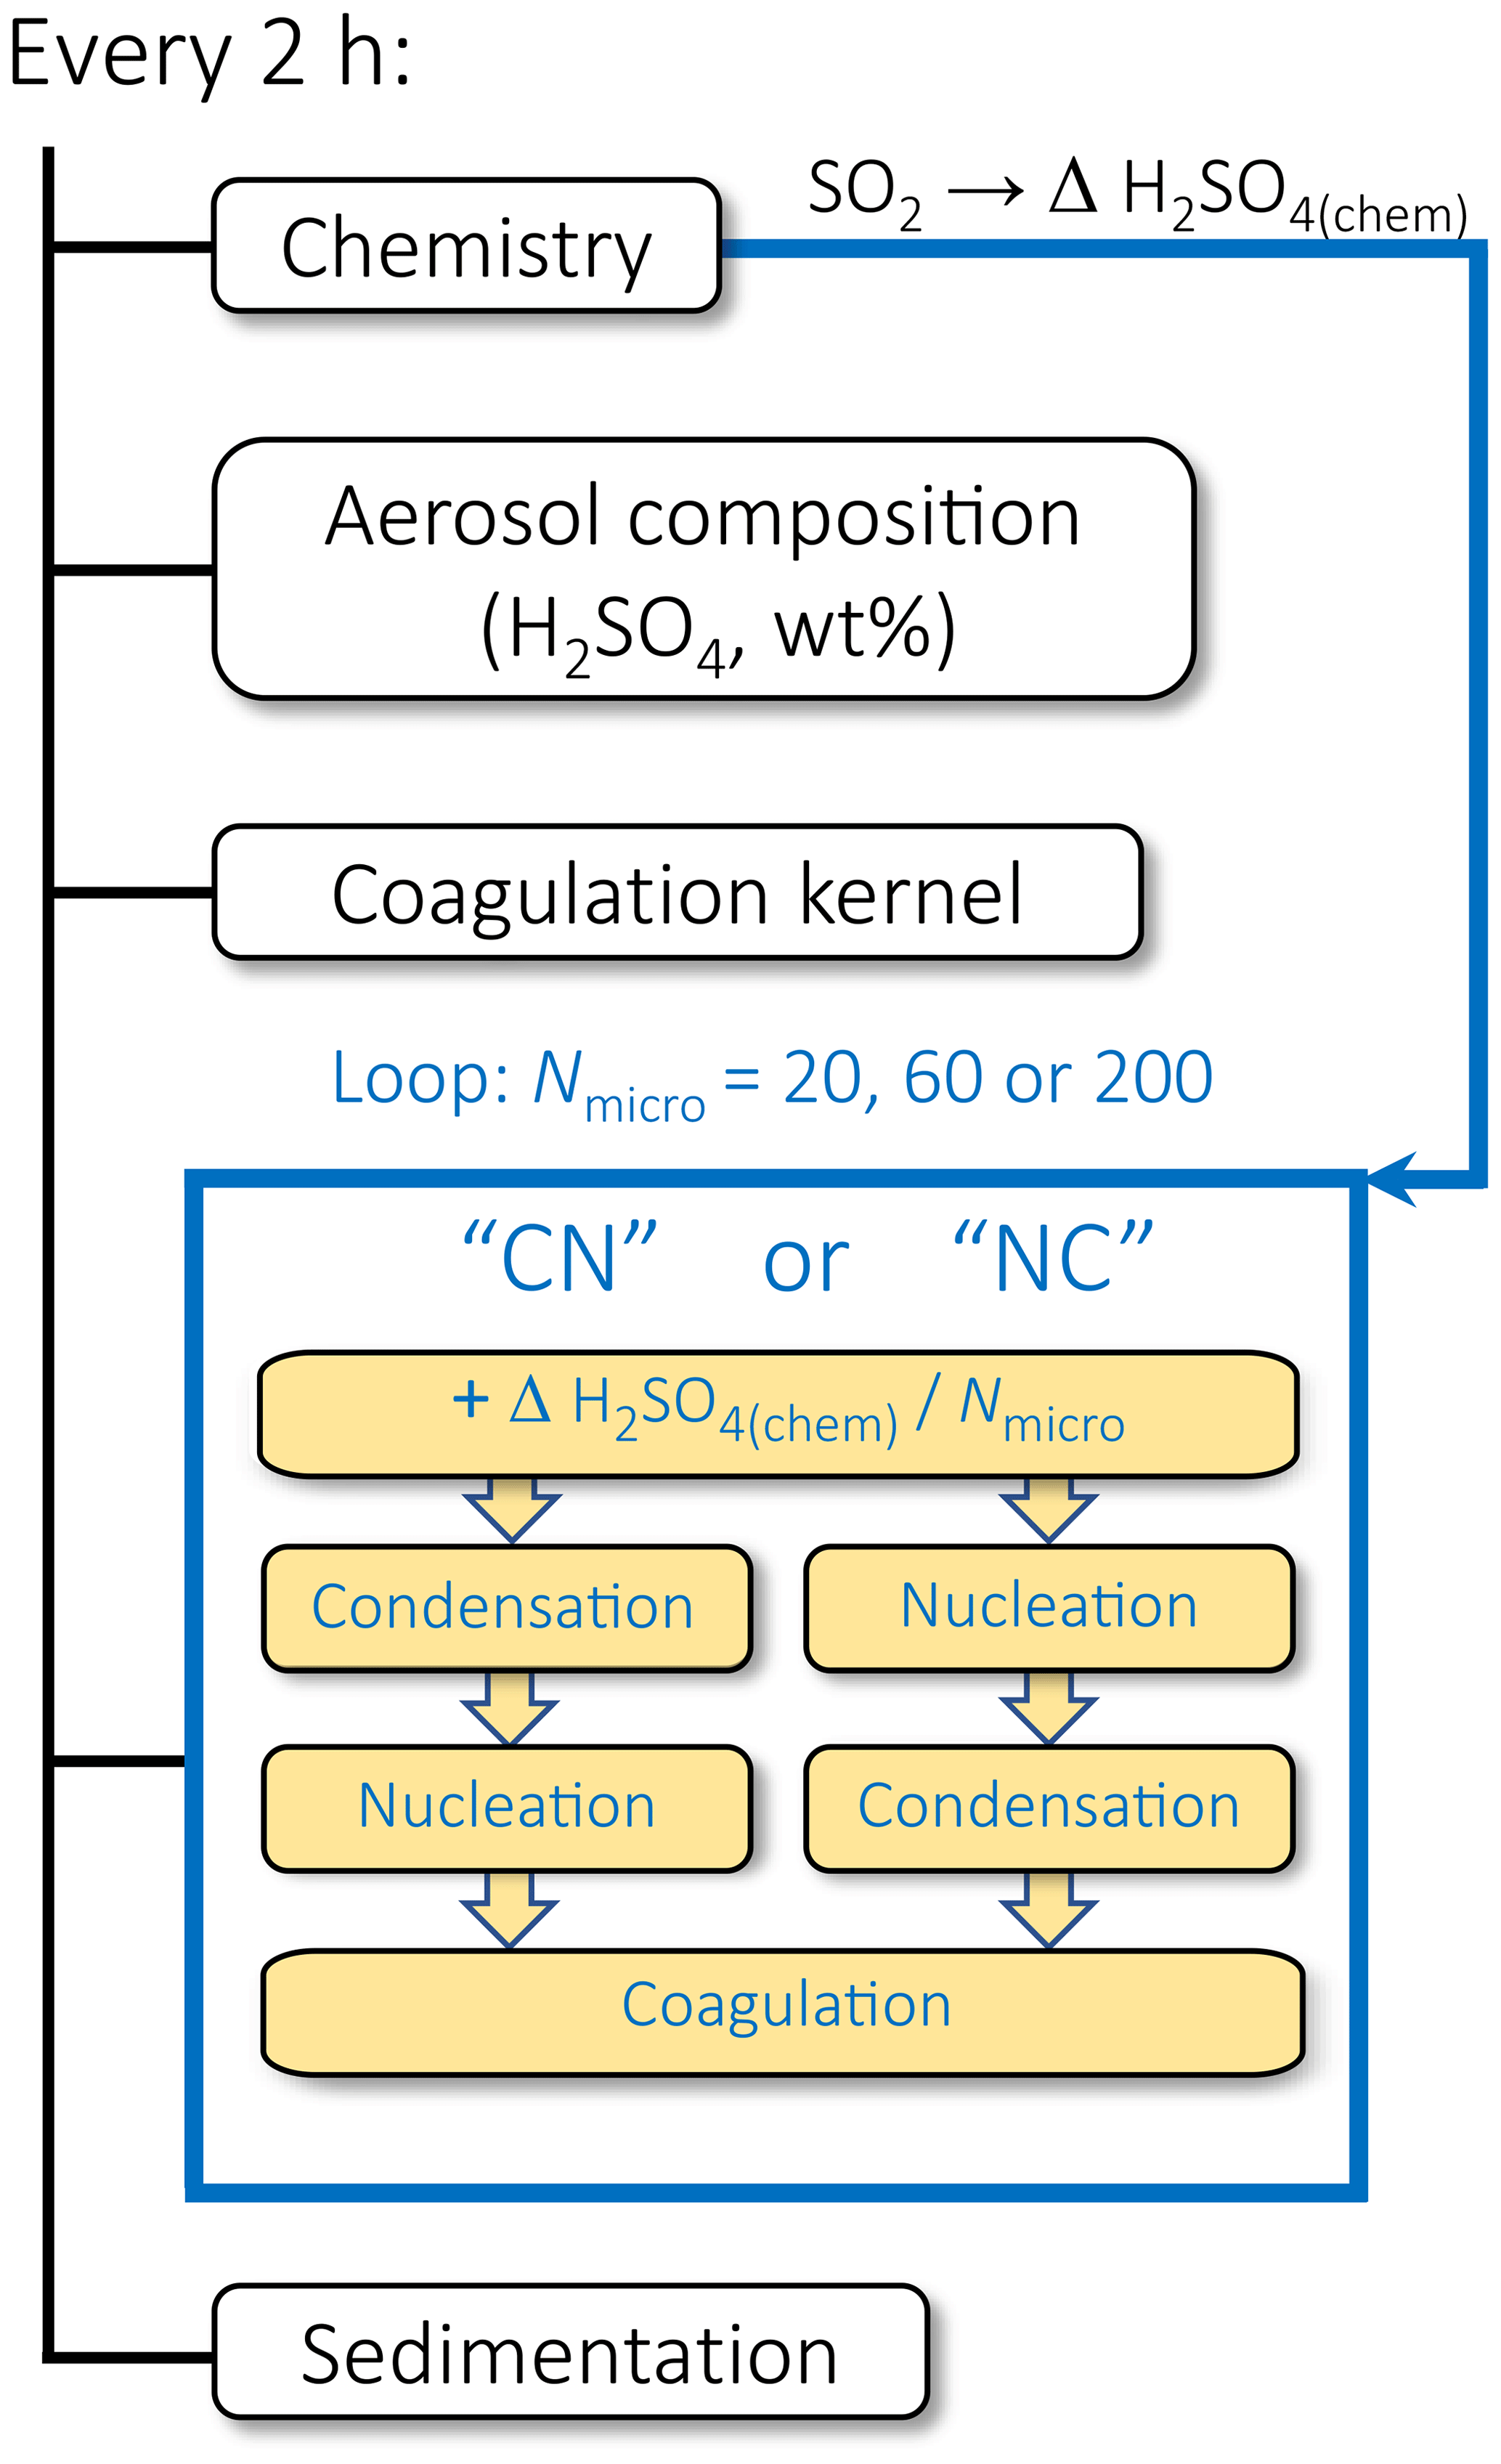
Figure 1Schematic representation of the call sequence for the microphysical processes in SOCOL-AERv2. The scheme shows the setup with the microphysical sub-loop with Nmicro=20 steps by default or an increased number of steps (60 or 200) in the test runs. By default, the condensation routine is called first and nucleation second (CN), which was reversed (NC) for the tests. Furthermore, the sum of the H2SO2 gas molecules produced by the chemistry scheme is uniformly distributed over the Nmicro time steps instead of providing the total sum at the first microphysical time step, as done in the original setup.
2.2 SOCOLv4
Additionally, we performed simulations with the fully coupled Earth system model (ESM) SOCOLv4 (Sukhodolov et al., 2021), which is a further development of SOCOL-AERv2. SOCOLv4 is based on ECHAM6 but incorporates the same aerosol module, AER, as SOCOL-AERv2 (Sect. 2.1). The major difference between the model versions is that SOCOLv4 is based on the MPI-ESM1.2 (Mauritsen et al., 2019), which incorporates the fully coupled interactive ocean module, the Max Planck Institute for Meteorology Ocean Model (MPIOM; Jungclaus et al., 2013). SOCOLv4 has a finer horizontal and vertical atmospheric resolution with T63 truncation (1.9° × 1.9°) and 47 vertical pressure levels also reaching up to 0.01 hPa. Compared to SOCOL-AERv2, the default dynamical time step is halved to 7.5 min, while the default chemical and microphysical time steps are the same as for SOCOL-AERv2 (2 h and 6 min, respectively). The interactive ocean and the finer spatial resolution make SOCOLv4 computationally much more expensive than SOCOL-AERv2. Therefore, we performed most sensitivity simulations with SOCOL-AERv2 using fixed sea surface temperatures (SST) and sea ice coverage (SIC; see Sect. 2.3), while SOCOLv4 was primarily used to look at the impact on surface temperature anomalies.
2.3 Experimental setup
For the present study, we employed SOCOL-AERv2 with a resolution of 39 hybrid sigma-pressure levels in the vertical and a horizontal truncation of T42 (∼ 2.8° × 2.8° in latitude and longitude). The simulations for this study include a reference scenario for stratospheric background conditions and two perturbation scenarios, including stratospheric sulfur injections. The boundary conditions are identical to the GeoMIP test-bed experiment accumH2SO41 with GHGs and ozone-depleting substances taken from the projections for 2040 from the SSP5-8.5 scenario (see also Weisenstein et al., 2022). SST and SIC are prescribed using an average of the years 1988–2007 of the CMIP5 PCMDI-AMIP 1.1.0 SST and sea ice data set (Taylor et al., 2000). As SOCOL-AERv2 with 39 vertical levels does not generate a quasi-biennial oscillation (QBO) internally, the simulated wind in the equatorial stratosphere is nudged towards observed wind profiles (Stenke et al., 2013). We ran 20 model years for each scenario. The first 5 years are considered the spin-up period (sufficient for the present application), and we use the subsequent 15 years for our analysis.
Consistent with Weisenstein et al. (2022), the intervention scenarios examined here apply gaseous SO2 injections of 5 and 25 Tg(S) yr−1 emitted uniformly in a 2 km thick layer centered around 20 km altitude in the region between 30° S and 30° N over all longitudes. These so-called regional injections are complemented by an example of a point injection performed with SOCOLv4 (see Sect. 2.2), injecting 5 Tg(S) yr−1 in the form of SO2 at the same vertical extent but constrained to a region from 10° N to 10° S at the Equator, only emitting at the 0° meridian. These point injection scenarios with constant injection rates were motivated by the G4 GeoMIP experiment described in Kravitz et al. (2011). However, instead of RCP4.5 GHG and injections of 5 Tg(SO2) yr−1, as specified in Kravitz et al. (2011), we used SSP5-8.5 GHG and injected 5 Tg(S) yr−1 in the form of SO2, which is consistent with Wunderlin et al. (2024). The transient SSP5-8.5 boundary conditions allow us to explore the sensitivity of surface temperature to the call sequence in a fully coupled ESM.
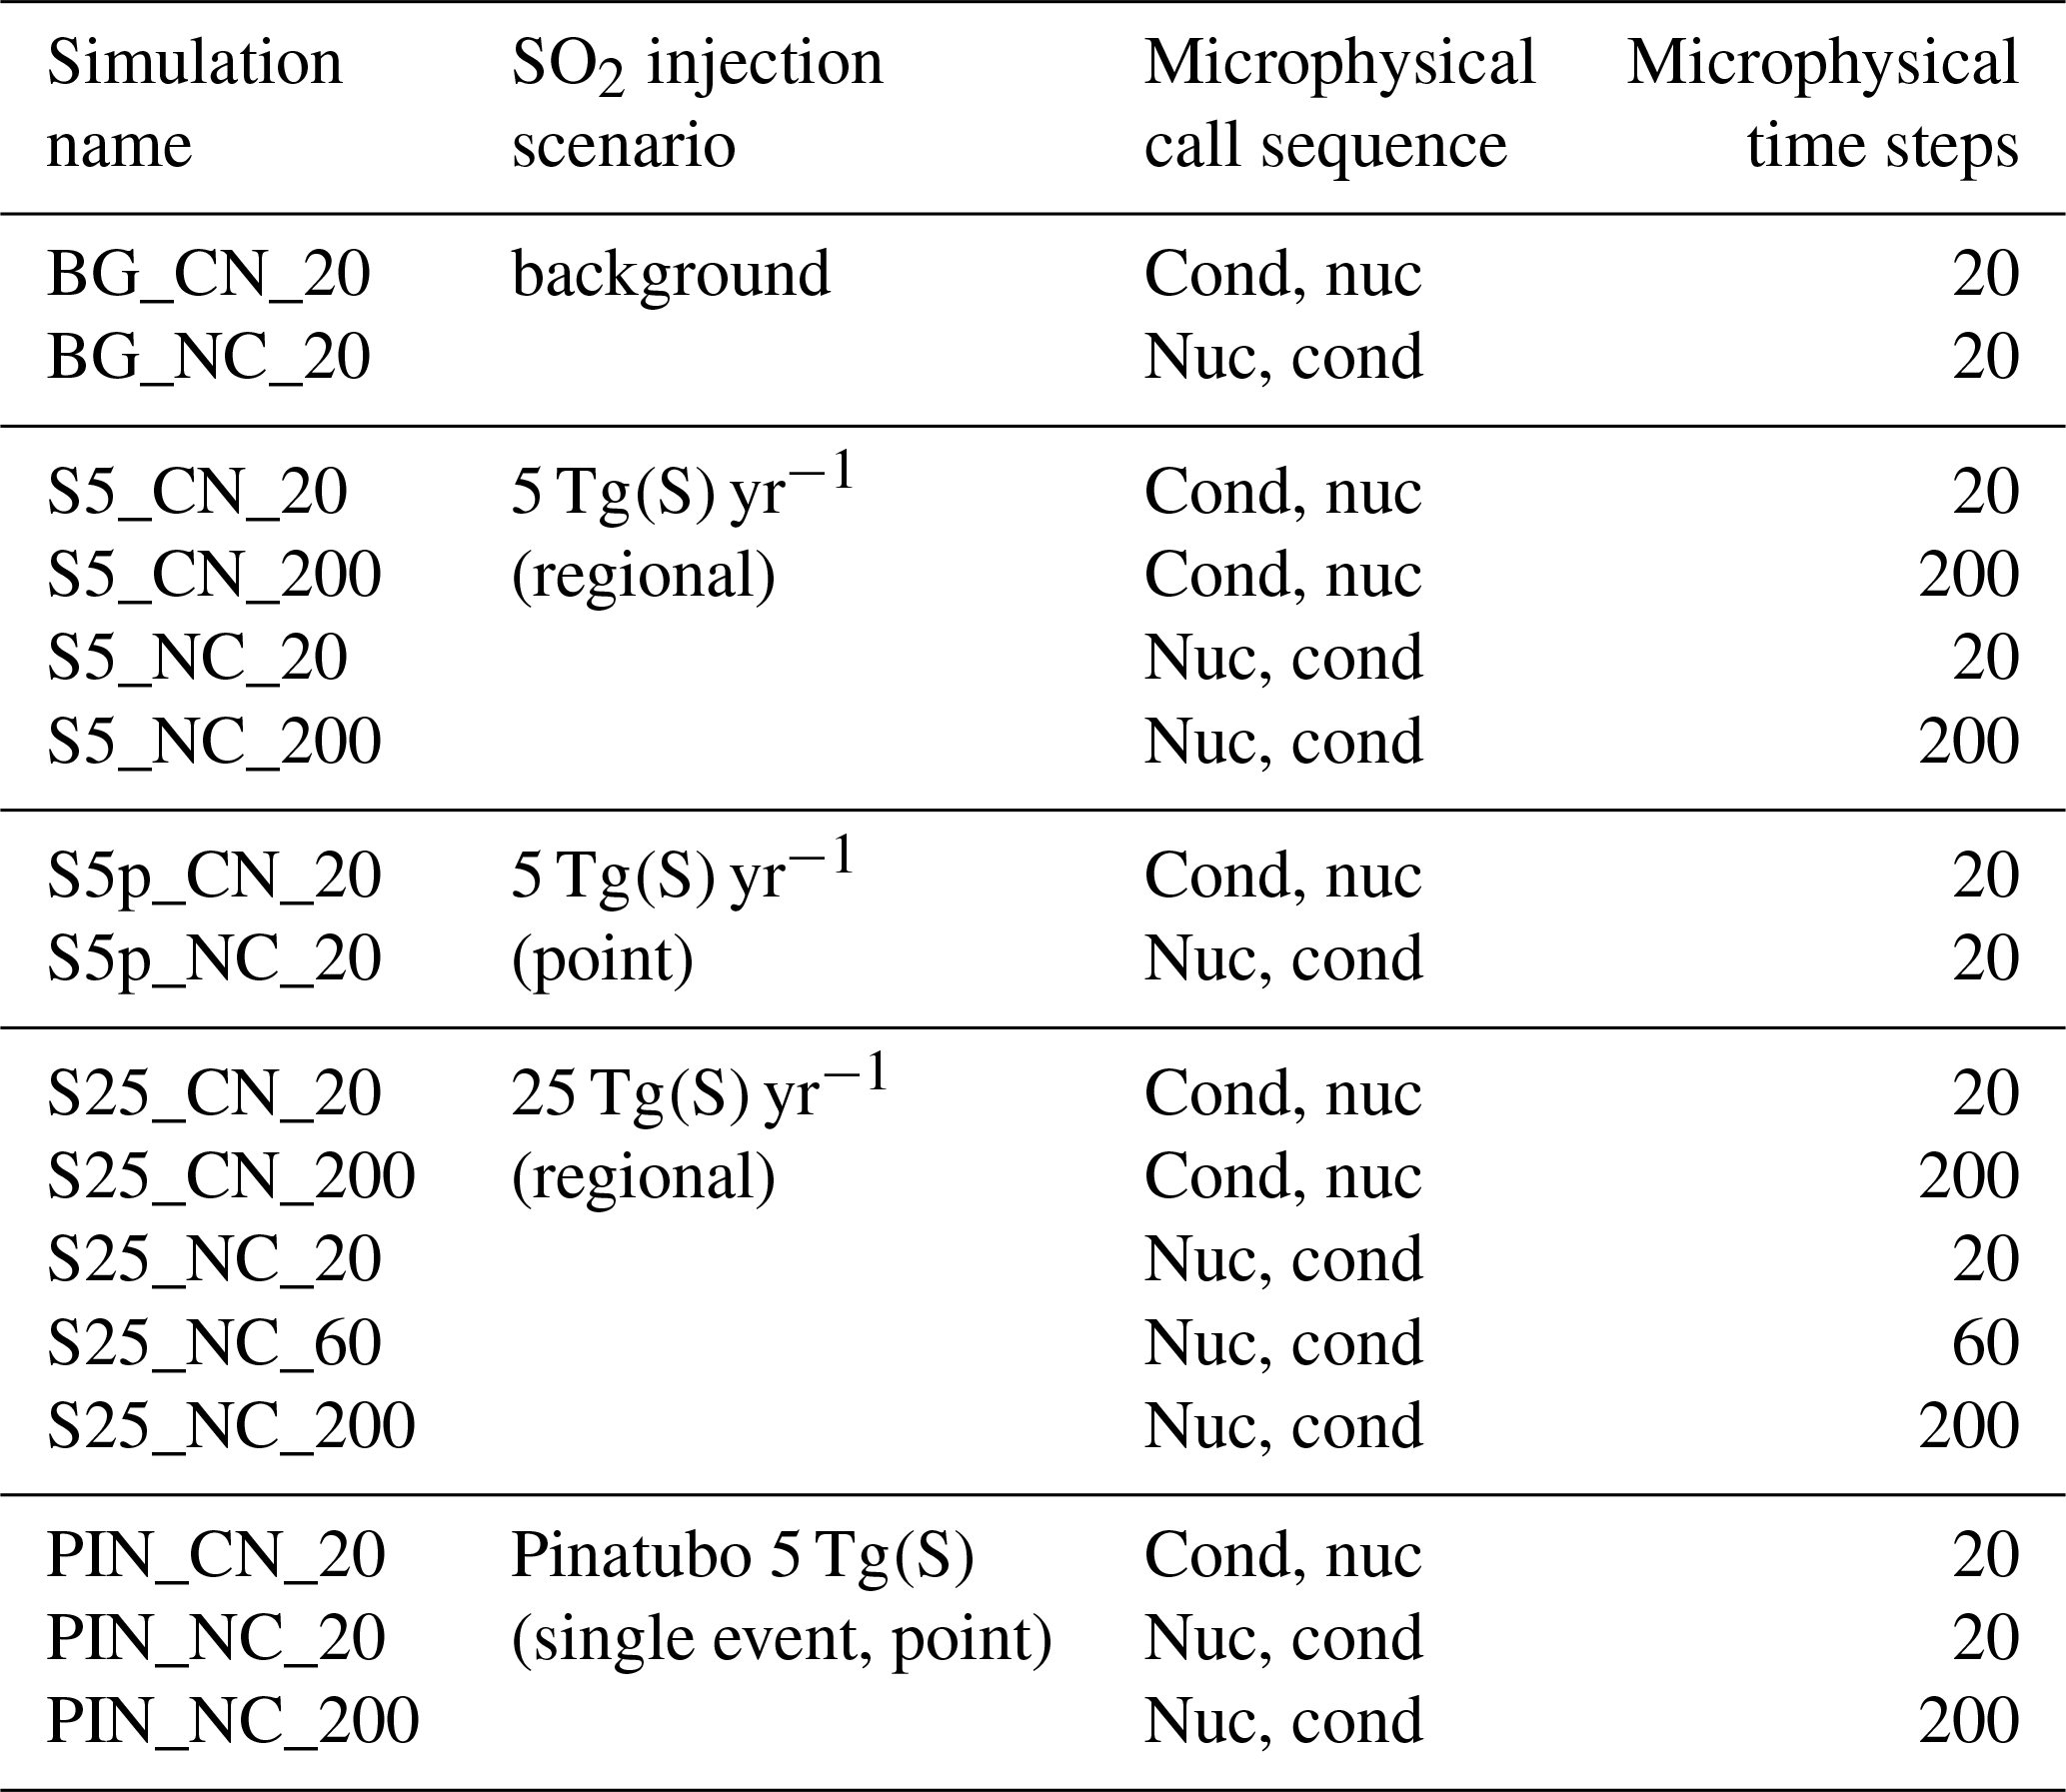
To determine the effects of the setup of the microphysical scheme (see Fig. 1) on the computed size distribution and aerosol burden, we performed several model simulations for background conditions and the conditions of strat-SRM. The different simulations vary by reversing the call sequence of the condensation and nucleation routines, or by increasing the number of microphysical time steps, Nmicro. The model simulations are summarized in Table 1. The experiment BG_CN_20 represents the default setup of the microphysical scheme in SOCOL-AERv2 and is used as the reference simulation.
In the absence of observational data of the stratospheric aerosol layer under strat-SRM conditions, we also tested the effect of different microphysical settings in the modeling of the 1991 Mt. Pinatubo eruption. The 1991 Mt. Pinatubo eruption was specified to be 5 Tg(S) emitted in the form of SO2 at 21–23 km in altitude (2 model levels) above the Mt. Pinatubo geographical location (i.e., two model grid boxes) during one day. This setup corresponds to the HErSEA_Pin_El_Ism scenario proposed by the Interactive Stratospheric Aerosol Model Intercomparison Project (ISA-MIP; Timmreck et al., 2018), which has been shown to have better agreement with observations for some variables compared to scenarios with larger emission amounts and different emission altitudes (Quaglia et al., 2023).
Table 1Overview of model simulations performed with SOCOL-AERv2 (except for the S5p simulations, which were performed with SOCOLv4). Simulation names refer to the following naming convention: SO2 injection scenario_Call sequence_Nmicro. BG: background; S5: 5 Tg(S) yr−1, regional injection; S5p: 5 Tg(S) yr−1, point injection simulated with SOCOLv4; S25: 25 Tg(S) yr−1, regional injection; PIN: Pinatubo eruption (shallow injection scenario, HErSEA_Pin_El_Ism, of ISA-MIP; Timmreck et al., 2018); CN: condensation first; NC: nucleation first; Nmicro: number of microphysical time steps; cond: condensation; nuc: nucleation.
In this section, we first analyze how the microphysical settings in SOCOL-AERv2 affect the calculated aerosol size distributions under stratospheric background conditions and under scenarios with SO2 injection. Next, we examine how the changes in size distributions affect global aerosol properties, such as aerosol loading and net radiative forcing. Finally, we show that microphysical settings directly affect stratospheric chemistry and thus the ozone layer via aerosol surface area density under conditions with strat-SRM.
3.1 Influence of microphysical settings on aerosol size distribution
The upper row of panels in Fig. 2 show particle size distributions at 55 hPa at the low latitudes (30° S–30° N) for unperturbed conditions and for conditions with strat-SRM. As obvious from panel (a), changing the call sequence of the nucleation and condensation subroutines does not influence the simulated aerosol size distribution under background conditions. Since maximum nucleation rates occur about 2–3 km below the tropical tropopause (Thomason and Peter, 2006), we also examined the size distributions at 115 hPa (not shown) and again found that the call sequence had no impact on the model results. This indicates that the default microphysical time step of 6 min is sufficiently shorter than the characteristic times of nucleation and condensation under background conditions so that none of the two processes inappropriately dominates the H2SO4-to-particle conversion.
In contrast to background conditions, the SO2 injection scenarios are highly sensitive to the microphysical settings. Initially, we kept the microphysical time step constant (Nmicro=20) but reversed the call sequence from the default condensation first (CN) to nucleation first (NC). This modification leads to a massive increase in nucleation-mode particles (R<0.01 µm; see dotted yellow and blue lines in Fig. 2c and f).
To highlight the differences in the coarse mode (R>1 µm), we calculated the fifth moment of the corresponding size distributions (the lower row in Fig. 2). This provides an estimate of the downward mass flux due to aerosol sedimentation, which is determined by the product of particle volume (proportional to the third moment) and sedimentation speed (roughly proportional to the second moment). Swapping from CN to NC leads to a significant decrease in coarse-mode particles (by 1 order of magnitude) for the S25 scenario (inset in Fig. 2f).
These significant differences in the size distributions demonstrate the dominating role of the first-called process as a H2SO4 sink (either condensation or nucleation), indicating that the default time step (2 h h min) is too long to properly handle elevated stratospheric sulfur loadings. Therefore, we increased the number of microphysical sub-steps until the resulting particle size distributions of the CN and NC simulations converged. For a sufficiently short microphysical time step (0.6 min with Nmicro=200), the simulations develop a pronounced peak of nucleation-mode particles (solid orange and blue lines in Fig. 2c, e) similarly to those of the CN_20 simulations but with somewhat lower particle number densities.
As expected, the computational costs of the model increase with a shorter microphysical time step. Increasing the number of microphysical sub-steps from 20 to 200 almost doubles the required wall-clock time per model year from 4.6 to 9 h using parallel computing on 64 CPUs. To assess the possibilities of reducing the computational costs, we tested the efficiency of Nmicro=60. Since coagulation has the largest timescale and is computationally the most expensive process within the microphysical sub-loop, we also tested a scenario with 80 sub-steps for nucleation and condensation but only 40 for coagulation. Both sensitivity simulations resulted in similar results (not shown). The red lines in Fig. 2e, f show the results for S25_CN_60, demonstrating excellent agreement with Nmicro=200, which gives us confidence in the accuracy of the model solution. Furthermore, the computational demand increased only moderately by about 33 % (60 min) per model year (relative to Nmicro=20). In conclusion, in SOCOL-AERv2, nucleation first with Nmicro=60 provides a very good description of strat-SRM scenarios even when the loading is extremely high.
We also explored the effects of the distribution of gaseous H2SO4 molecules produced during the 2-hourly call of the chemistry routine either homogeneously across the Nmicro sub-time steps or as a total sum at the beginning of the microphysical loop. As Fig. S1 in the Supplement shows, proper partitioning of the H2SO4 molecules among the Nmicro sub-time steps is critical to avoiding an excessive formation of nucleation-mode particles due to artificially high H2SO4 supersaturations at the beginning of the microphysical sub-stepping. More details can be found in the Supplement (see Sect. S2).
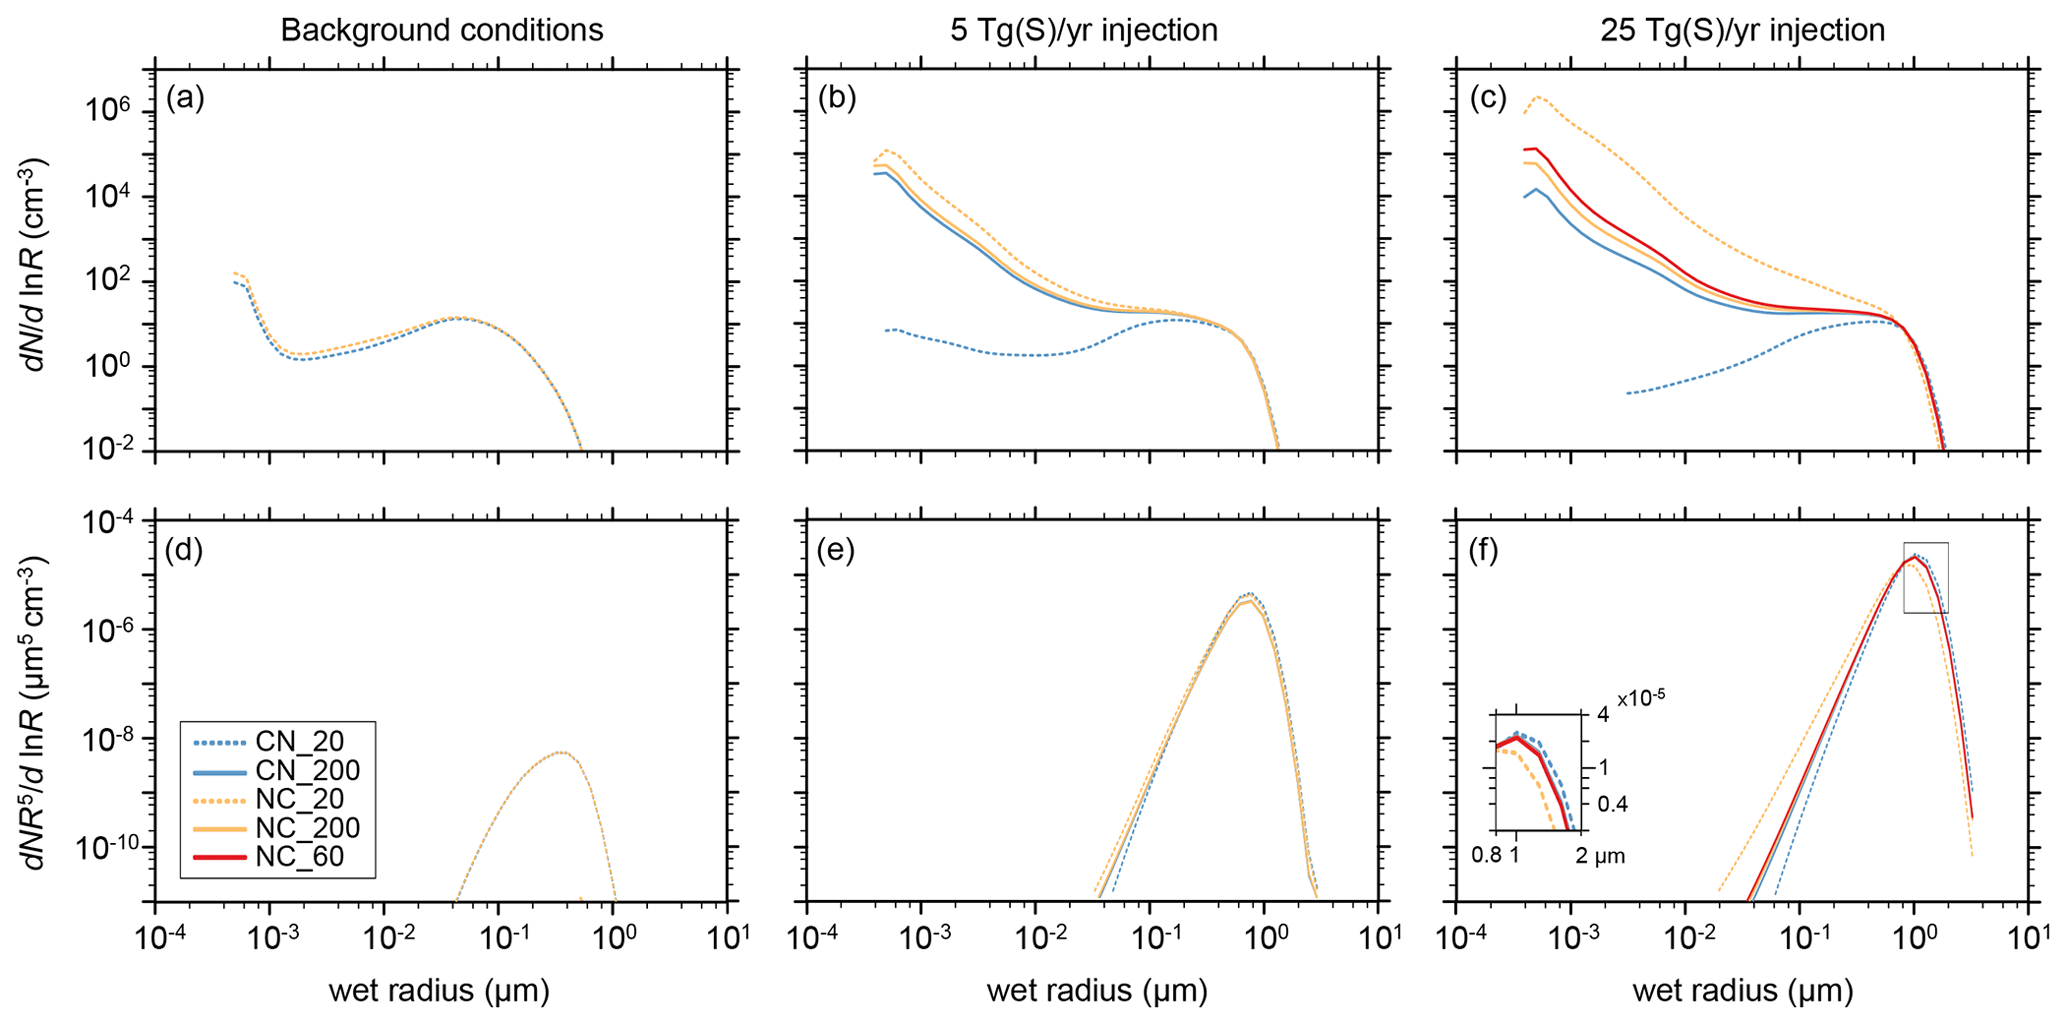
Figure 2(a, b, c) Size distributions (; particles cm−3) averaged between 30° S and 30° N at 55 hPa for the model simulations with (a) stratospheric background conditions, (b) regional SO2 injections of 5 Tg(S) yr−1, and (c) regional SO2 injections of 25 Tg(S) yr−1. (d, e, f) The fifth moment (; µm5 cm−3) of the aerosol size distributions as an estimate for aerosol sedimentation mass flux (particle volume, ∝R3, times sedimentation velocity, ∝R2). Blue lines represent simulations with condensation first and orange and red lines represent nucleation first. Dashed lines represent Nmicro=20 microphysical time steps, solid orange and blue lines represent Nmicro=200, and solid red lines in (c) and (f) represent Nmicro=60. The insert in (f) highlights the differences for coarse particles.
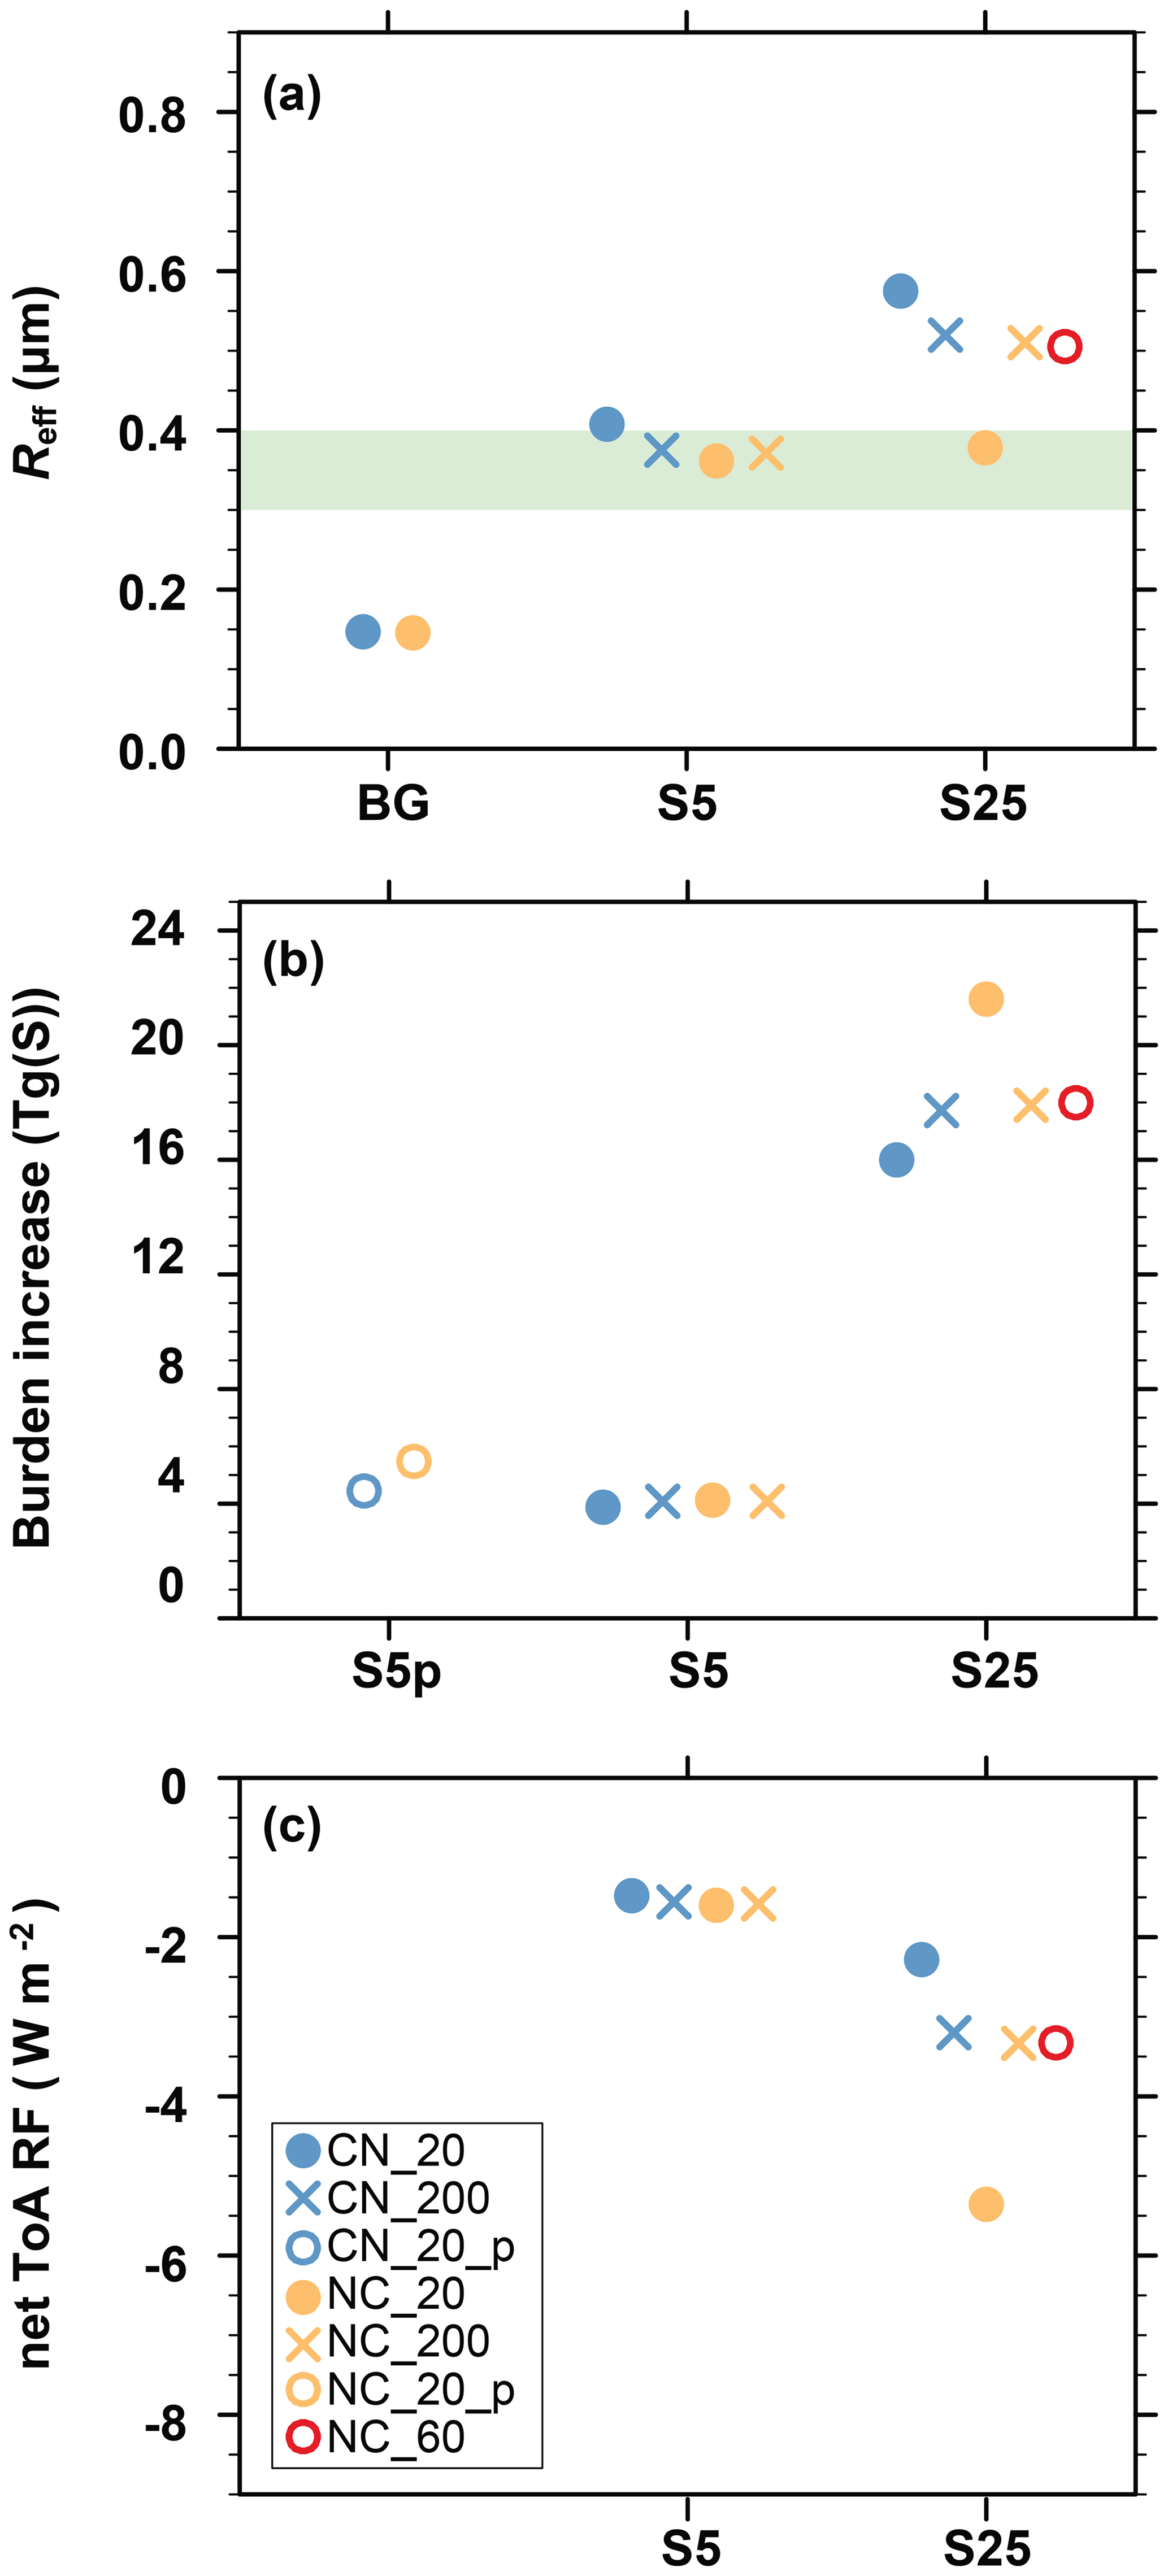
Figure 3The effect of microphysical settings on the global averages of various calculated aerosol and radiative quantities. (a) Global mean effective radius (µm) at 55 hPa. (b) Global mean sulfuric acid aerosol burden increase (Tg(S)). (c) Global mean change in net top-of-atmosphere (joined shortwave and longwave) radiative forcing (W m−2). Injection scenarios are BG (background conditions, no injection), S5 (5 Tg(S) yr−1 regional SO2 injection), S5p (5 Tg(S) yr−1 point SO2 injection), and S25 (25 Tg(S) yr−1 regional SO2 injection). Blue symbols represent condensation first. Orange and red symbols represent nucleation first. Open or filled circles represent Nmicro=20 (or 60). Crosses represent Nmicro=200. Light-blue shading in (a) represents the optimal effective radii for the scattering of solar radiation from Dykema et al. (2016) and Fig. 4 in Weisenstein et al. (2022).
3.2 Influence of microphysical settings on global means of particle size, aerosol burden and radiative forcing
The large differences in the simulated size distribution have wide implications for other key metrics of stratospheric aerosols, namely the average size of the aerosol particles, burden, and radiative forcing: these are collectively shown in Fig. 3 in the three sets of experiments. Figure 3a shows the globally averaged effective radius (Reff) at 55 hPa. For background conditions, both microphysical settings, CN and NC, result in an average Reff of 0.15 µm. For the SO2 injection scenarios, most of the additional sulfur condenses onto existing particles or is consumed in the nucleation of new particles, which coagulate preferentially with the larger background particles. This increases the simulated Reff compared to the background case, moving towards and into the range of the optimal effective radius for scattering of solar radiation between 0.3 and 0.4 µm (Weisenstein et al., 2022; see their Fig. 4). The standard microphysical setup (CN; Nmicro=20; solid blue circles in Fig. 3a) results in the largest simulated Reff, as condensation partly suppresses the subsequent formation of smaller particles via nucleation. Conversely, nucleation first with long microphysical time steps (NC; Nmicro=20; solid orange circles in Fig. 3a) exaggerates the formation of small particles, resulting in an underestimation of Reff. Given a sufficiently short time step (Nmicro=200), CN and NC converge to an Reff of 0.38 µm for the S5 scenario and of 0.48 µm for the S25 scenario (blue and orange crosses). Compared to the modal models MA-ECHAM5-HAM and CESM2, the sectional SOCOL-AERv2, in general, produces a smaller Reff for the regional injections. Hence, improving the SOCOL-AERv2 aerosol microphysics by swapping the sequence to nucleation first and increasing Nmicro leads to a slight reduction in the spread in Reff among these models.
Figure 3b shows the impact of microphysical settings on the total (troposphere and stratosphere) aerosol burden increase in the intervention scenarios compared to background conditions. For background conditions, CN and NC with Nmicro=20 show an almost identical aerosol burden (see also Table S1 in the Supplement). For the SO2 injection scenarios, the original setup CN_20 reveals the smallest aerosol burden. The largest aerosol burden is simulated by the simulation with the CN_20 setting since this setup shifts the size distribution towards small particles, which have a longer stratospheric residence time. For the S5 scenario, the dependence on the call sequence is small, but for S25, the simulated aerosol burdens differ by more than 30 % (Table S1). Despite this large spread in the simulated burden increase, SOCOL-AERv2 still falls between the CESM2 and the MA-ECHAM5-HAM models, which showed, for most of the simulated injection scenarios, the largest and smallest burden increase, respectively (Weisenstein et al., 2022; see their Fig. 1).
Figure 3c displays the globally averaged changes in the net top-of-atmosphere (ToA) shortwave and longwave radiative forcing (RF) due to SO2 injections. Since SOCOL-AERv2 uses prescribed SST and SIC, the strat-SRM runs remain in non-equilibrium, and the perturbation in radiative fluxes at the ToA directly quantify the effective RF (Forster et al., 2016). All S5 simulations show a rather consistent RF change of around −1.5 W m−2. For the S25 simulations, however, we find a large spread in RF, ranging from −2.3 W m−2 for the original microphysical setup (CN_20) to −5.4 W m−2 for the simulation with a reversed call sequence (NC_20). As already mentioned in Weisenstein et al. (2022), the differences in RF between the various SOCOL-AERv2 simulations and between different models are mainly related to the respective burden increases (Fig. 3b). The simulations with the largest burden increase also show the smallest Reff, which efficiently scatters the incoming solar radiation and enhances the negative RF.
As discussed in previous studies (Heckendorn et al., 2009; Kleinschmitt et al., 2018), the efficacy of the SO2 injection – i.e., the RF per Tg of sulfur injected annually – decreases with the increasing injection rate since the aerosol particles grow larger, which increases sedimentation and decreases scattering efficiency. However, the model intercomparison by Weisenstein et al. (2022) revealed that not only the radiative efficacy itself but also its decrease with increasing injection rates is strongly model-dependent. For SOCOL in Fig. 3c, the radiative efficacy of the various S5 simulations ranges moderately between −0.29 and −0.32 . For the S25 simulations, the simulations with the highest and the lowest efficacy differ by more than a factor of 2. The applied microphysical improvements lead to a significantly stronger radiative efficacy (−0.13 for S25_CN_60) compared to the default setup (−0.09 for S25_CN_20).
As SOCOL-AERv2 does not include an interactive ocean model but prescribed SSTs, it is unfeasible to test the impact of the call sequence on surface temperature anomalies. To overcome this limitation, we performed a 5 Tg(S) yr−1 point injection scenario with the CN setup (S5p_CN_20; see Sect. 2.3) using the ESM SOCOLv4, a coupled model which shares the same exact aerosol module as SOCOL-AERv2 (see Sect. 2). The simulation shows an increase of 25 % in stratospheric aerosol burden compared to the conventional S5p_CN_20 scenario (see Fig. 3b, left). The corresponding global averaged surface cooling values are 0.65 and 1.02 K for S5p_CN_20 and S5p_NC_20, respectively, which is an increase of 57 %, whereas no significant differences in global stratospheric aerosol burden and RF were found among regional S5 scenarios performed with SOCOL-AERv2 (see Fig. 3b, middle). This underlines the sensitivity of our results to the chosen injection scenario (point vs. regional) and to the model resolution (Sect. 2.2). Both the model resolution and the regional confinement of the injection scenario can lead to locally very different H2SO4 supersaturation, which influences the sensitivity to the microphysical settings due to the strong nonlinearity of nucleation with the H2SO4 supersaturation.
3.3 Influence of settings on meridional distributions of aerosol burden, radiative forcing, and ozone
Figure 4a, b show the influence of microphysical settings on the modeled latitudinal variation in the sulfate aerosol column burden (stratosphere plus troposphere) for the strat-SRM scenarios simulated with SOCOL-AERv2 (S5 and S25). In contrast, background simulations (not shown) have almost no dependence on the call sequence (see Table S1 in the Supplement). The SO2 injection scenarios show similar latitudinal patterns, with aerosol column burdens peaking over the inner tropics, confined by the tropical leaky pipe. After overcoming the subtropical jet, the burden again maximizes around 45° N/S in the stratospheric surf zone, whereas the polar regions are isolated by the polar jets. As discussed before (Fig. 3b), the original setting, CN_20, results in the smallest aerosol burden, whereas NC_20 with nucleation first shifts the size distribution towards smaller particles with less gravitational settling (see also Table S1).
The latitudinal variations in the burden in Fig. 4a, b are reflected in the changes in radiative forcing (RF) in Fig. 4c, d, with reduced irradiance at high aerosol loading, and illustrate the direct radiative effects of the aerosol. However, in contrast to the smooth distributions of aerosol loading, RF exhibits a much higher degree of small fluctuations due to tropospheric cloud variability. The latitudinal variations in RF are very similar for all S5 simulations, and the S25 simulations also show a consistent geographic pattern. The negative RF covers more than 80 % of the globe, with the exception of the polar caps, where absorption of outwelling infrared radiation by the aerosol predominates and the RF becomes positive. The differences between the individual simulations become the largest in the tropics, reflecting the sensitivity of the aerosol loading to the microphysical setup.
Figure 4e, f show the impact of the simulated SO2 injections on zonally averaged total column ozone as a difference from the reference simulation BG_CN_20. As already discussed by Weisenstein et al. (2022), the SO2 injections lead to a massive reduction in the ozone column. This is caused by accelerated ClOx-induced and HOx-induced ozone destruction cycles, which in turn are due to heterogeneous N2O5 hydrolysis on the aerosol particles (leaving less NO2 required for ClOx and HOx deactivation). The N2O5 hydrolysis rate is proportional to the SAD (see the following section, Sect. 3.4, and Figs. S2 and S3 in the Supplement). Both injection scenarios, S5 and S25, show similar patterns with the most pronounced changes in mid- to high latitudes. In the polar regions, the ozone loss is mainly caused by enhanced heterogeneous ClONO2 activation due to the additional aerosol SAD. Furthermore, in agreement with the CESM2 model, SOCOL-AERv2 simulates a decrease in the ozone column in the tropics, where the accelerated Brewer–Dobson circulation results in the faster transport of ozone towards higher latitudes. In the tropics, the presented microphysical modifications do not show a significant impact on the simulated ozone decrease (Fig. 4e and f) despite clear differences in the simulated SAD for the same sulfur injection (Figs. S2 and S3). This result indicates that above a certain threshold, a further SAD increase does not affect the NOx cycle and its coupling to the ClOx and HOx cycles anymore. The fact that the S25 simulations result in a more pronounced total column ozone change than the S5 simulations is related to a more pronounced strengthening of the Brewer–Dobson circulation, which reduces the time for chemical ozone formation, and to the increased stratospheric H2O entry, which enhances ozone loss by the HOx cycle (Tilmes et al., 2018).
In mid- to high latitudes, both injection scenarios, S5 and S25, reveal substantial differences in the total ozone loss simulated depending on the microphysical settings used in the simulations. For the S5 simulations (Fig. 4e), the total ozone losses over Antarctica range between 23 and 26 DU. For the Northern Hemisphere, the spread in simulated polar ozone losses is, with 13 to 21 DU, even larger. For the S25 simulations (Fig. 4f), the simulated polar ozone loss ranges between 60 and 80 DU over the Southern Hemisphere and between 35 and 60 DU over the Northern Hemisphere. It should be noted that the microphysical setup with the smallest ozone change in one hemisphere does not necessarily also show the smallest ozone change in the other hemisphere, which might be related to the dynamical variability.
It should be emphasized that the discussed changes in total column ozone caused by stratospheric SO2 injections refer to stratospheric concentrations of ozone-depleting substances and GHGs projected for the year 2040. With further decreasing stratospheric chlorine loadings in the future, the impact of the enhanced aerosol SAD under SO2 injections on total column ozone might change as the coupling between the ClOx and NOx cycle becomes less important.
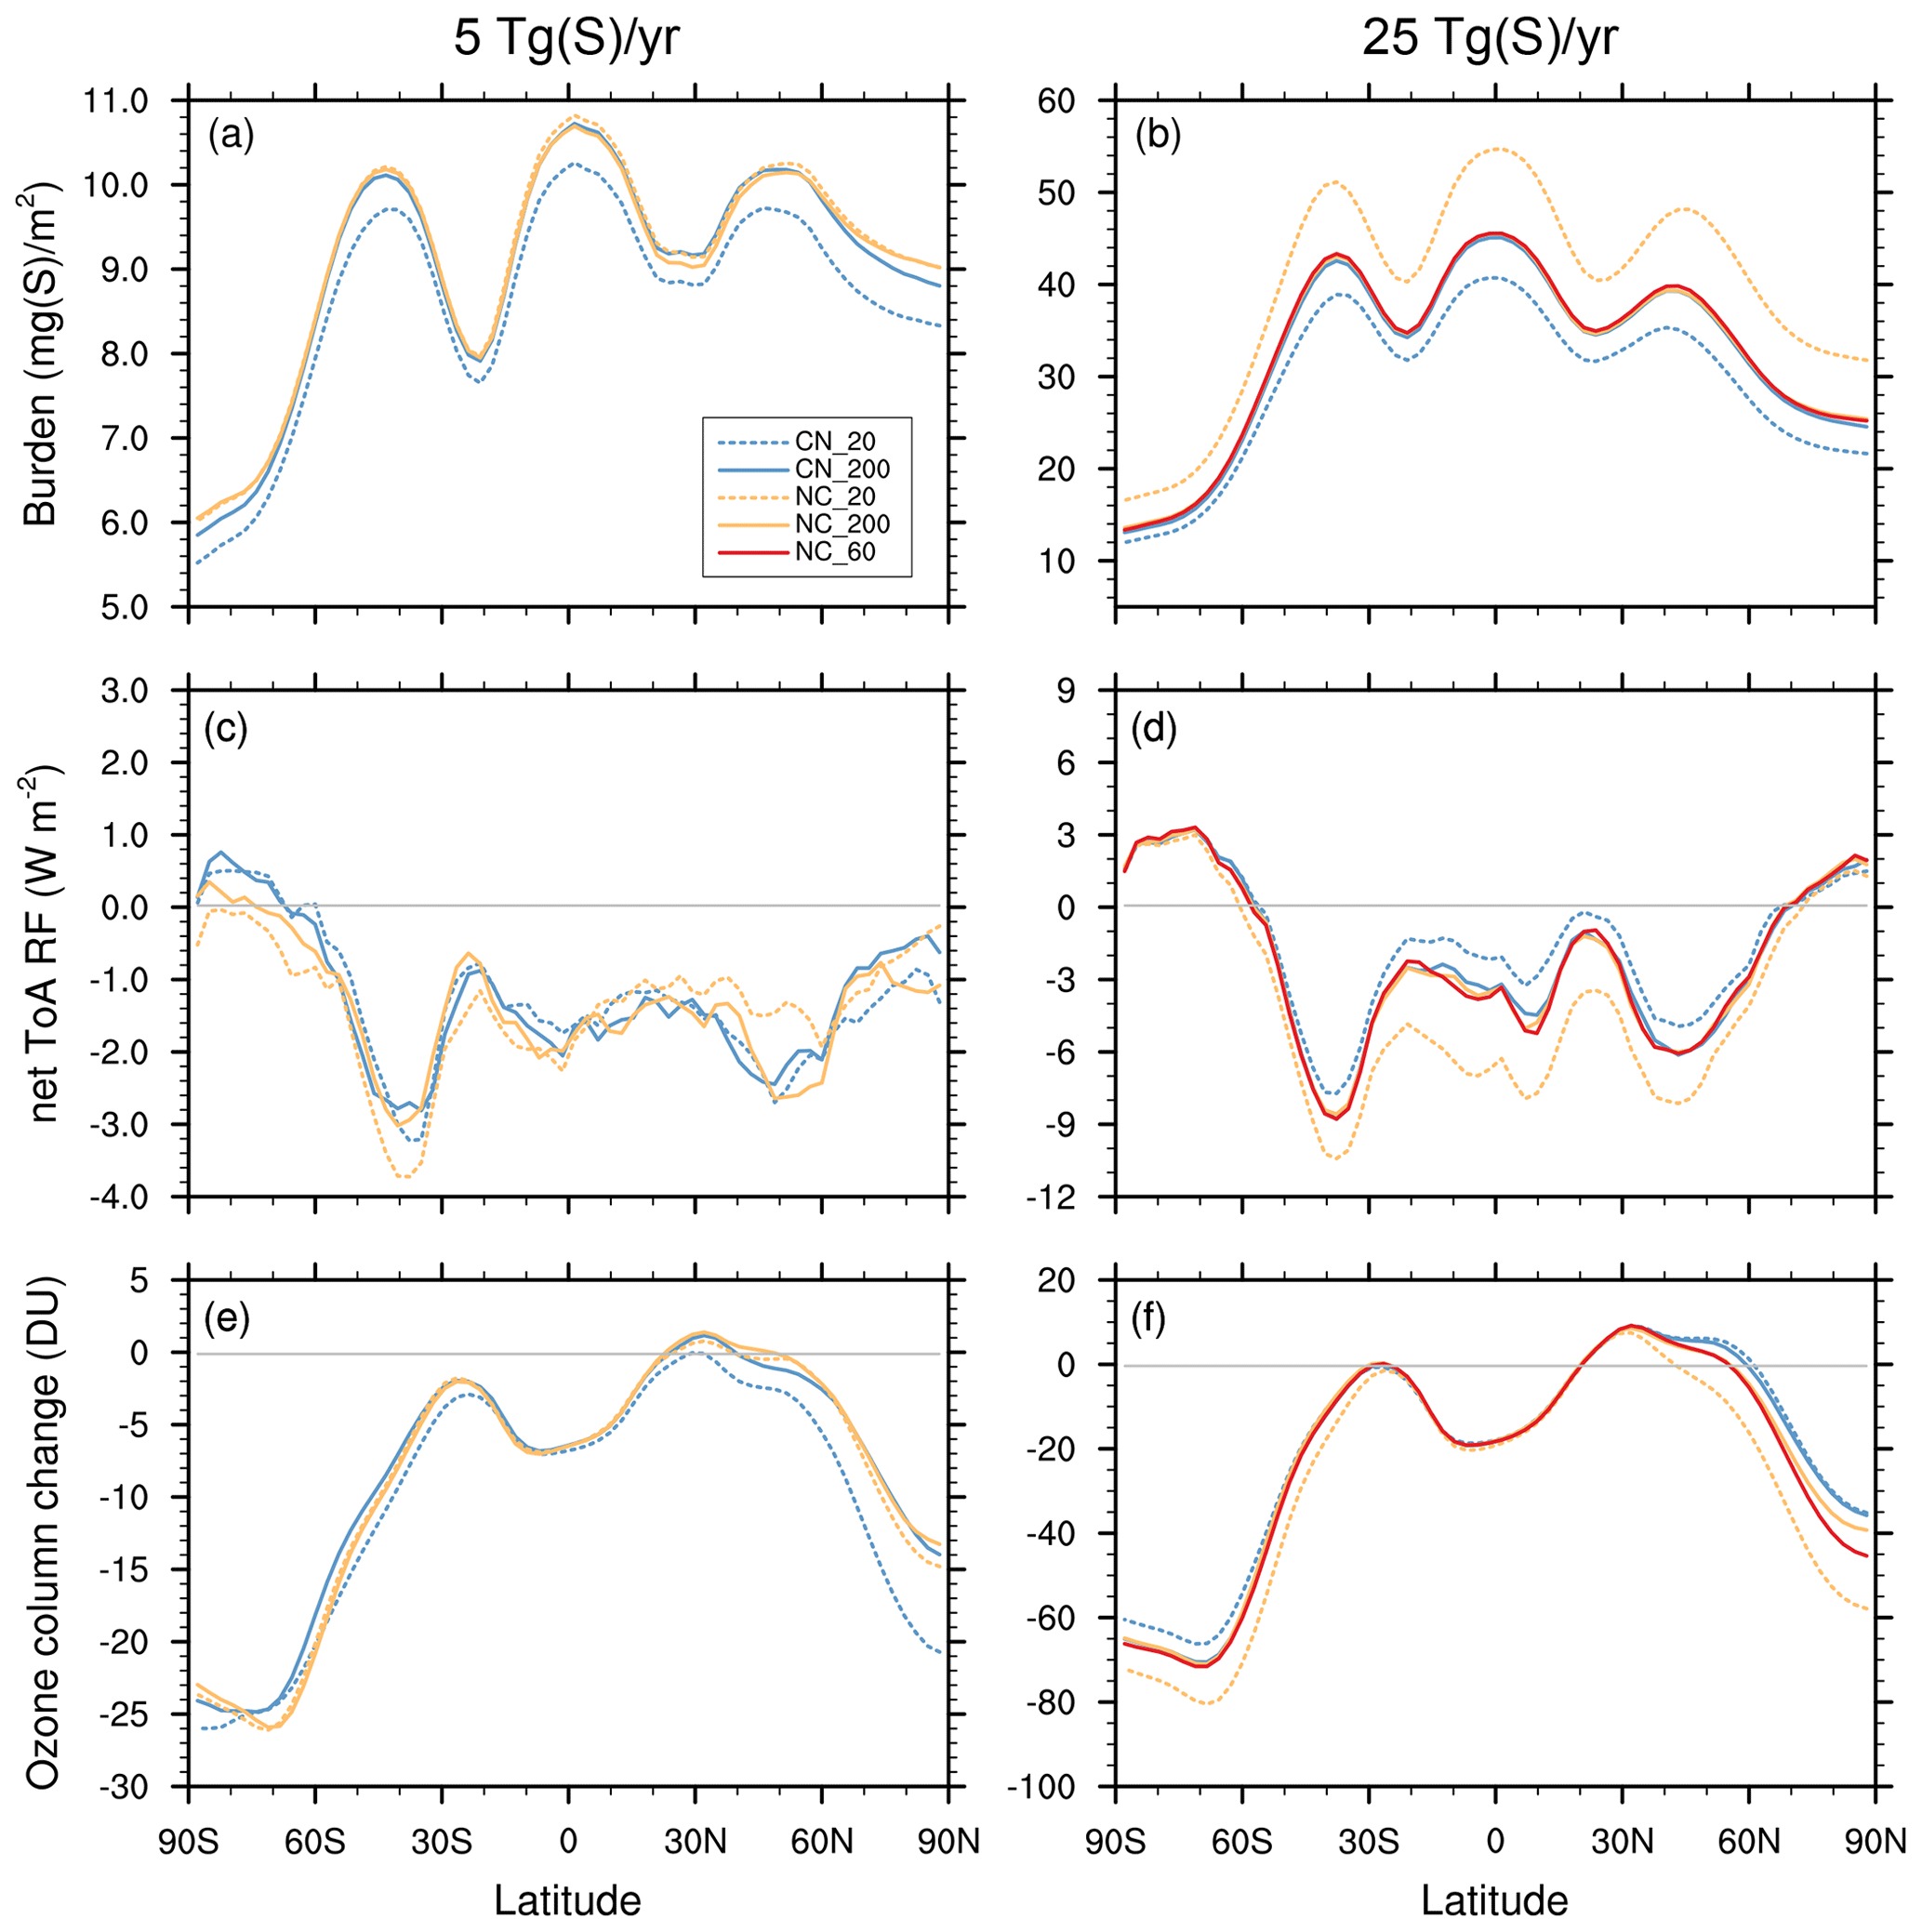
Figure 4The effect of microphysical settings on the zonal averages of various calculated aerosol, radiative, and chemical quantities. (a, c, e) Regional SO2 injections of 5 Tg(S) yr−1. (b, d, f) Regional SO2 injections of 25 Tg(S) yr−1. (a, b) Sulfuric acid aerosol burden per square meter (mg(S) m−2). (c, d) Zonal mean net top-of-atmosphere (joined shortwave and longwave) radiative forcing (W m−2). (e, f) Change in zonal average column ozone (DU, Dobson units). Blue lines represent simulations with condensation first and orange and red lines represent nucleation first. Dashed lines represent Nmicro=20 microphysical time steps and solid orange and blue lines represent Nmicro=200. Solid red lines represent Nmicro=60. All panels use the simulation BG_CN_20 as the reference.
3.4 Influence of settings on SAD and stratospheric temperature
Strat-SRM by stratospheric SO2 injection yields an increase in aerosol surface area density (SAD), which enables heterogeneous chemical reactions such as N2O5 hydrolysis but which is also an approximate measure of the extinction and, hence, the backscatter of shortwave radiation. Moreover, the aqueous H2SO4 aerosol absorbs outwelling longwave radiation, which increases the air temperature, with repercussions for stratospheric dynamics.
Both quantities, SAD and temperature, are also affected by the microphysical settings, CN versus NC, and Nmicro. In brief, the NC setting with Nmicro=200 yields a larger SAD than CN with Nmicro=20 by roughly 20 %. This is due to the smaller particles with a larger SAD and a larger burden (see Figs. S2 and S3 in the Supplement). The larger burden, in turn, leads to more longwave radiative heating, which increases stratospheric temperatures. This is a marginal effect in the S5 scenario but corresponds to about 1 K higher temperatures under S25 conditions (see Fig. S4 in the Supplement). A strongly temperature-dependent reaction such as O3 + O → 2O2 changes by about 4 % for ΔT=1 K, so the impact of microphysical settings on ozone via SAD changes is by far more important than the impact via T changes. The differences from dynamical feedback between the different settings are also likely small since the absolute temperature increase from the S25 scenarios is up to 15 K and thus much larger.
3.5 Influence of settings on modeling the eruption of Mt. Pinatubo
So far, our study has highlighted the impacts of the microphysical settings for continuous injections in strat-SRM scenarios. Here, we expand this analysis by evaluating the effects under conditions of volcanic eruptions on the 1991 eruption of Mt. Pinatubo using the PIN_CN_20, PIN_NC_20, and PIN_CN_200 settings (Table 1). We compared the evolution of the computed global stratospheric aerosol burden with SAGE and HIRS satellite data and the evolution of the computed mean effective particle radius with balloon measurements over Laramie (Wyoming; see Fig. 5). Details of the observational data sets, their uncertainties, and model and inter-model uncertainties can be found in Sukhodolov et al. (2018) and Quaglia et al. (2023). All model settings show a very similar peak in the stratospheric aerosol burden but distinctly different declines during the years 1992/93. Nucleation first shifts the size distribution towards smaller particles, which have a longer stratospheric residence time. The slower decline is in better agreement with observations, although it should be mentioned that the agreement with observations strongly depends on the assumed SO2 emissions profile (Quaglia et al., 2023). Regarding the mean Reff, PIN_NC_20 simulates smaller values than PIN_CN_20 for the first couple of months after the eruption and larger values later on, as PIN_CN_20 returns faster towards background conditions due to faster sedimentation of larger particles. Overall, the microphysical modifications do not overly influence the discrepancy between modeled and observed Reff (Fig. 5b).
However, other than under strat-SRM conditions, the evolution of the aerosol burden and Reff in the PIN_CN_200 scenario is much closer to PIN_CN_20 than to PIN_NC_20. The volcanic eruption is a point event in time and space, whereas the strat-SRM scenarios have continuous injections across all longitudes and between 30° N and 30° S in latitude, which establishes a steady-state situation. This leads to H2SO4 production rates, which are locally about 104–105 times larger in the Mt. Pinatubo case compared to S5 and S25. Since nucleation is exponentially dependent on the H2SO4 supersaturation, this leads to erroneously large nucleation rates in the PIN_NC_20 scenario. Coagulation is not efficient enough to remove the large number of nucleation-mode particles in that scenario. When increasing Nmicro to 200 (PIN_NC_200), the burden and the Reff of the plume evolve, following the PIN_CN_20 scenario, since local supersaturation are smaller now and coagulation can keep up with efficiently removing the nucleation-mode particles.
Therefore, for volcanic eruptions, where H2SO4 supersaturations are locally much larger compared to climate engineering scenarios, the correct solution is much closer to CN_20 since, otherwise, nucleation would erroneously dominate over condensation. This is a good example of how the very different distributions of H2SO4 supersaturation in space and time when simulating volcanic eruptions and strat-SRM scenarios lead to different challenges within aerosol microphysics schemes (Heckendorn et al., 2009; Vattioni et al., 2019).
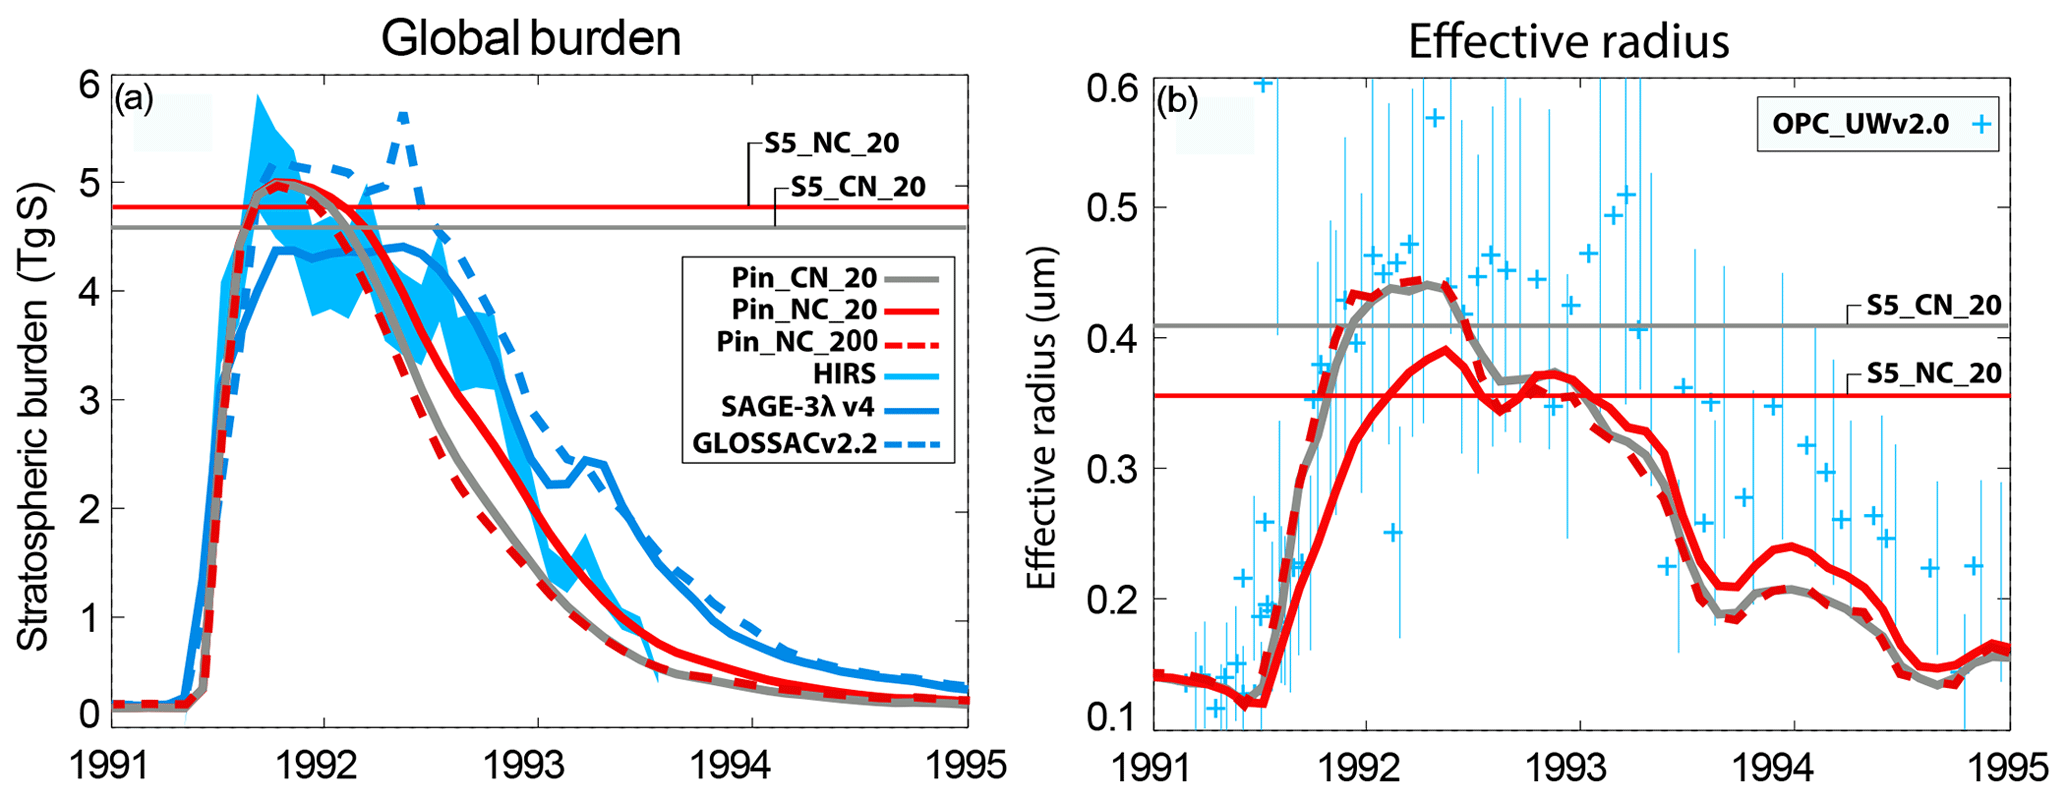
Figure 5(a) The evolution of the simulated global stratospheric aerosol burden (Tg(S)) for PIN_CN_20 and PIN_NC_20 compared with HIRS- and SAGE-II-derived data (SAGE-3,4λ and GLOSSACv2.2; Arfeuille et al., 2013; Thomason et al., 2018; Kovilakam et al., 2020). HIRS-derived total (troposphere and stratosphere) aerosol sulfur burden assumes 75 % sulfuric acid by weight (Baran and Foot, 1994). Light-blue shaded area denotes uncertainties in HIRS. (b) Effective particle radius (µm) averaged over the altitude range from 14 to 30 km compared to in situ measurements taken at Laramie, Wyoming (OPC UWv2.0; Deshler et al., 2019). Thin blue whiskers reflect the measurement uncertainty (adapted from Quaglia et al., 2023). For comparison, the steady-state values for S5_CN_20 and S5_NC_20 from this work are shown as thin horizontal red and gray lines in both panels.
In this study, we show the importance of properly setting the length of the microphysical time step and the call sequence of nucleation and condensation for modeling the global stratospheric sulfuric acid aerosol under conditions of SO2 injections for climate engineering. In the aerosol–chemistry–climate model SOCOL-AERv2, the evolution of the H2SO4 concentration in the gas phase is determined by sequential operator splitting using a sub-stepping approach for aerosol microphysics with a default time step of 6 min; i.e., the H2SO4 gas-phase concentration is consecutively updated by H2SO4 production from chemistry, condensation, and nucleation. We find the following:
-
Under stratospheric background conditions, the call sequence does not affect the model results, indicating that the default number of microphysical sub-time steps is sufficient to prevent the first-called process from spuriously dominating the size distribution.
-
Under elevated H2SO4 supersaturations in the stratosphere, the characteristic times for nucleation and condensation may become shorter than the default microphysical time step. In such cases, the competition between the two H2SO4 sinks affects the simulated aerosol size distribution, and the microphysical time step must be reduced.
-
The default setting, condensation first, can massively underestimate the fraction of nucleation-mode particles, whereas nucleation first tends to underestimate the number of coarse-mode particles. Tests of numerical convergence with very short time steps indicate that nucleation first yields smaller numerical errors for continuous regional SO2 injections, whereas condensation first yields smaller numerical errors for the simulation of volcanic eruptions, with locally and temporally more confined emissions, resulting in extremely high H2SO4 supersaturations.
-
Despite significant shifts in simulated aerosol size distributions, the main response patterns of atmospheric chemistry and climate to stratospheric SO2 injections, as simulated with SOCOL-AERv2, are robust to microphysical time integration adjustments, but the strength of the response can differ substantially in the case of high injection rates (such as 25 Tg(S) yr−1) or locally confined injections (such as 5 Tg(S) yr−1 point injections, S5p), which both lead to large H2SO4 supersaturations.
-
Depending on the microphysical setting, the globally averaged surface temperature response from point injections in SOCOLv4 ranges from −0.65 to −1.02 K cooling when injecting 5 Tg(S) yr−1. In SOCOL-AERv2, the radiative forcing found for the 25 Tg(S) yr−1 regional injection scenario varies by more than a factor of 2 between the different microphysical settings. Nevertheless, this model-internal uncertainty in SOCOL-AERv2 is still smaller than the scatter between the three GCMs with interactive aerosol microphysics – CESM2-WACCM6, MA-ECHAM5-HAM, and SOCOL-AERv2 – compared by Weisenstein et al. (2022) in strictly coordinated strat-SRM modeling.
The first part of our conclusions confirms the study by Wan et al. (2013), who investigated different time integration methods to solve the H2SO4 continuity equation using different versions of the ECHAM-HAM model: HAM1 with a forward Euler scheme with sequential operator splitting similar to SOCOL-AERv2 but without microphysical sub-steps and HAM2 with a two-step time integration scheme implemented by Kokkola et al. (2009) and a version which implicitly solves production, condensation, and nucleation simultaneously via linearization of nucleation. They identified sequential operator splitting with too-long time steps as a major source of numerical errors in HAM1, and found that the implicit two-time-stepping scheme with simultaneous processing of H2SO4 production, condensation and nucleation most accurately represents the competition between these processes. The microphysical sub-stepping technique, as applied in SOCOL-AERv2, improves the results of the operator splitting approach but requires a sufficiently large number of sub-steps. Instead of using a fixed number of sub-steps, a dynamical time step adjustment could be beneficial, but we have not tested this here. However, the best way forward would be to directly implement an implicit solver of H2SO4 production, condensation, and nucleation into the next version of SOCOL, as it is presented in Wan et al. (2013). This will likely generate more accurate results while avoiding the need for sub-loops, which are computationally more expensive. However, these implicit solvers have not yet been tested for numerical stability under conditions of continuously larger SO2 injections as would occur in strat-SRM scenarios.
The importance of aerosol microphysics and the competition between nucleation and condensation for the simulated aerosol size distribution and the radiative efficiency of stratospheric sulfur injections was also shown by Laakso et al. (2022), who investigated different injection strategies using the ECHAM-HAMMOZ model with two different aerosol schemes, the sectional SALSA (Sectional Aerosol module for Large Scale Applications) scheme and the modal M7 scheme. SALSA describes the aerosol size distribution in 10 mass bins, while M7 uses 7 lognormal modes. The authors found that the nucleation of new particles dominates over condensational particle growth in the sectional SALSA scheme, while the opposite is the case in the modal M7 module. In addition, the use of M7 with lognormal modes can result in a minimum in the particle size distribution in the optimal size range for solar scattering due to the accumulation mode reaching its largest size, which adds mass to the coarse mode in the injection scenario applied in Laakso et al. (2022). The resulting gap between the two modes tends to underestimate gravitational settling. These differences resulted in smaller particles in SALSA and, therefore, stronger radiative forcing. For an injection scenario of 20 Tg(S) yr−1, SALSA revealed a global net ToA radiative forcing of around −8 W m−2 and M7 resulted in −3 W m−2. This spread is even larger than what we found for the S25 simulations, S25_CN_20 and S25_NC_20. Laakso et al. (2022) further investigated the impact of the competition between nucleation and condensation by performing simulations, with the nucleation switched off in both aerosol modules, by emitting 25 % of the sulfur directly as 3 nm particles. The results of these sensitivity studies indicate that the different treatment of nucleation and condensation explains the differences in radiative forcing between SALSA and M7 only partly: the difference in radiative forcing weakened from −5 W m−2 to about −3 W m−2.
Apart from time integration or representation of the aerosol size distribution, numerical parameterizations of individual processes are another source of uncertainty. The binary homogeneous nucleation scheme by Vehkamäki et al. (2002), for example, is widely used in models, including SOCOL-AERv2, or the abovementioned aerosol schemes SALSA and M7. The latter two include an extension of the scheme for high sulfate concentrations implemented by Kokkola et al. (2009), using the collision rate as the maximum possible nucleation rate. In a very recent study, Yu et al. (2023) evaluated simulated nucleation rates in the lowermost stratosphere by CLOUD laboratory measurements under stratospheric temperatures. They found that the Vehkamäki scheme overestimates observed nucleation rates by 3 to 4 orders of magnitude. As the particle size distribution is determined not only by nucleation but also by particle growth through condensation and coagulation, Yu et al. (2023) compared the simulated size distributions to in situ measurements of the particle number densities down to a diameter of 3 nm obtained during the NASA Atmospheric Tomography Mission (ATom) between 2016 and 2018. In the size range between 3 and 10 nm, the number densities simulated with the GEOS-Chem model using the Vehkamäki et al. (2002) scheme were 1–2 orders of magnitude larger than observed. The same holds true for SOCOL-AERv2: under background conditions in the Southern Hemisphere lowermost stratosphere (70° S; 12 km altitude), modeled number densities for particles smaller than 10 nm range between 103 and 104 cm−3, while the ATom observations indicate values between slightly below 101 to 102 cm−3. When using the kinetic scheme for ion-mediated and binary homogeneous nucleation (Yu et al., 2020), calculated nucleation rates and size distributions simulated by GEOS-Chem were closer to ATom. Furthermore, the results by Yu et al. (2023) suggest that under low stratospheric background H2SO4 concentrations, nucleation on ions, which is usually not represented in global models, dominates over binary homogeneous H2SO4–H2O nucleation. However, the importance of binary homogeneous nucleation is expected to increase under high H2SO4 concentrations. Unfortunately, CLOUD measurements of nucleation rates only refer to stratospheric background conditions and do not cover strongly elevated H2SO4 concentrations under SO2 injection scenarios or after volcanic eruptions; but based on the findings of Yu et al. (2023), it may be that all models using the Vehkamäki scheme overestimate the role of nucleation. This might explain the low bias in the simulated mean effective radius compared to in situ measurements following the eruption of Mt. Pinatubo. Furthermore, this might have substantial repercussions on the simulated aerosol size distribution, aerosol burdens, and radiative forcing under strat-SRM conditions, most likely resulting in a decreased efficiency of SO2 injections. The reported weaknesses of the Vehkamäki scheme were addressed by Määttänen et al. (2018), who presented a new parameterization for sulfuric acid aerosol formation, including homogeneous and ion-induced nucleation pathways validated by CLOUD laboratory measurements. In future work, the Määttanen et al. (2018) nucleation scheme, which is reported to be valid for the whole range of atmospheric conditions including high stratospheric sulfuric acid concentrations during SO2 injection scenarios, will be used in SOCOL-AER instead of the Vehkamäki scheme (Määttänen et al., 2018).
This work adds to a series of recent publications that highlight the crucial role of aerosol microphysics in simulated aerosol properties and modeled estimates of strat-SRM effects on atmospheric chemistry and climate. Our results clearly demonstrate that there is considerable uncertainty when numerical schemes like the aerosol microphysics in SOCOL-AERv2 are applied under unprecedented conditions, such as strat-SRM with continuously large SO2 injections, even if these models have been thoroughly evaluated and are well capable of reproducing observations under background or moderately perturbed conditions like volcanic eruptions. It should be emphasized that our conclusions are mainly based on simulations of regional SO2 injections, which are supported by point injection scenarios and simulations of the 1991 Mt. Pinatubo eruption. As the nucleation rate strongly depends on the gas-phase H2SO4 concentration, ambient temperatures, and relative humidities, the optimal number of microphysical (sub-)time steps will depend not only on the assumed SO2 injection rates but also on the injection scenario and spatial confinement of the injections. Point injections of SO2, for example, result in very high but locally confined H2SO4 supersaturations, which makes the results more sensitive to the details of the microphysical approach. This effect is shown with the point injection scenarios (S5p), which are much more sensitive to the microphysical settings compared to the regional injection scenarios (S5; see Fig. 3b). The intention of this paper is to raise awareness within the (aerosol) modeling community for potential numerical problems within conventional aerosol microphysics modules when applying them to unprecedented extreme conditions such as high H2SO4 supersaturations from SO2 injection for strat-SRM. To increase confidence in the different aerosol microphysics modules included in the various aerosol–chemistry–climate models, we recommend conducting a model intercomparison study including to explore differences among the process-split sub-stepping methods of aerosol microphysics schemes under conditions of continuous large H2SO4 supersaturation, such as would occur under stratospheric solar strat-SRM scenarios.
While this study focuses on the importance of a proper temporal resolution of aerosol microphysics, it does not address the effects of spatial model resolution, which also affect model results (e.g., Niemeier et al., 2020). Properly resolving the various temporal and spatial scales, ranging from nanometers and seconds for microphysical processes to kilometers and decades for global climate, remains a significant challenge for aerosol–chemistry–climate models (Vattioni et al., 2019; Weisenstein et al., 2022). Continuous model development, such as embedded SO2 injection plume modeling (Sun et al., 2022), is indispensable to closing the spatial and temporal gap between aircraft injection plumes and large-scale model grids and to effectively reducing existing model uncertainties with respect to the effectiveness of strat-SRM by stratospheric sulfur injections. Furthermore, additional laboratory and co-ordinated model intercomparison studies of aerosol formation, growth, and dispersion under various stratospheric conditions could also be beneficial. This study shows that technical developments of the models can improve the fidelity of strat-SRM assessments and motivates dedicated effort towards further developing existing aerosol schemes for more sophisticated numerical methods, including potentially incorporating aerosol tracer tendencies into existing gas-phase chemical solvers.
The original SOCOl-AERv2 code is available at https://doi.org/10.5281/zenodo.5733121 (Brodowsky, 2018). The simulation data using that model code, which do not account for the interpolation of H2SO4 production within the microphysical sub-loop, are available at https://doi.org/10.3929/ethz-b-000610854 (Stenke et al., 2023). The modified source code of SOCOL-AERv2, handling the microphysical sub-loop by taking into account the interpolation of H2SO4 production within the microphysical sub-loop can be found at https://doi.org/10.5281/zenodo.10791230 (Vattioni et al., 2024), and the data from these simulations are available at http://hdl.handle.net/20.500.11850/622193 (Vattioni et al., 2023).
The supplement related to this article is available online at: https://doi.org/10.5194/gmd-17-4181-2024-supplement.
SV proposed the study and implemented the modifications in the microphysical scheme. SV and AS performed the strat-SRM simulations with SOCOL-AERv2 and analyzed the model results. EW performed and analyzed the simulations with SOCOLv4. TS conducted and analyzed the Mt. Pinatubo simulations. Significant scientific guidance during the overall project was provided by TP and BL. AS drafted the first version of the paper. All co-authors contributed to the discussion and the text.
At least one of the (co-)authors is a member of the editorial board of Geoscientific Model Development. The peer-review process was guided by an independent editor, and the authors also have no other competing interests to declare.
Publisher’s note: Copernicus Publications remains neutral with regard to jurisdictional claims made in the text, published maps, institutional affiliations, or any other geographical representation in this paper. While Copernicus Publications makes every effort to include appropriate place names, the final responsibility lies with the authors.
Our special thanks go to Debra Weisenstein for discussions about the original AER code. We also thank Ilaria Quaglia for providing the processed OPC data. Furthermore, we appreciate the feedback from Jim Haywood on the paper draft as well as the reviews from Daniele Visioni, Ulrike Niemeier, and Anton Laakso, which all significantly improved the paper.
Support to Gabriel Chiodo and Andrea Stenke was provided by the Swiss Science Foundation within the Ambizione grant (grant no. PZ00P2_180043). Support for Sandro Vattioni was provided by the ETH Research grant (grant no. ETH-1719-2) and by the Harvard Geoengineering Research Program. Gabriel Chiodo and Sandro Vattioni also received funding from the Simons Foundation (grant no. SFI-MPS-SRM-00005217). Timofei Sukhodolov acknowledges the support from the Swiss National Science Foundation (grant no. 200020-182239), the Karbacher Fonds, Graubünden, Switzerland, and the Simons Foundation (grant no. SFI-MPS-SRM-00005217).
This paper was edited by Graham Mann and reviewed by Ulrike Niemeier, Anton Laakso, and Daniele Visioni.
Arfeuille, F., Luo, B. P., Heckendorn, P., Weisenstein, D., Sheng, J. X., Rozanov, E., Schraner, M., Brönnimann, S., Thomason, L. W., and Peter, T.: Modeling the stratospheric warming following the Mt. Pinatubo eruption: uncertainties in aerosol extinctions, Atmos. Chem. Phys., 13, 11221–11234, https://doi.org/10.5194/acp-13-11221-2013, 2013. a
Ayers, G., Gillett, R., and Gras, J.: On the vapor pressure of sulfuric acid, Geophys. Res. Lett., 7, 433–436, https://doi.org/10.1029/GL007i006p00433, 1980. a
Baran, A. J. and Foot, J. S.: New application of the operational sounder HIRS in determining a climatology of sulphuric acid aerosol from the Pinatubo eruption, J. Geophys. Res., 99, 25673–25679, https://doi.org/10.1029/94JD02044, 1994. a
Brodowsky, C.: SOCOL-AERv2 model code, Zenodo [code], https://doi.org/10.5281/zenodo.5733121, 2018. a
Budyko, M. I.: Climate and Life, Academic Press, New York, USA, ISBN 0121394506, 1974. a
Crutzen, P.: Albedo Enhancement by Stratospheric Sulfur Injections: A Contribution to Resolve a Policy Dilemma?, Climatic Change, 77, 211–220, https://doi.org/10.1007/s10584-006-9101-y, 2006. a
Danabasoglu, G., Lamarque, J.-F., Bacmeister, J., Bailey, D. A., DuVivier, A. K., Edwards, J., Emmons, L. K., Fasullo, J., Garcia, R., Gettelman, A., Hannay, C., Holland, M. M., Large, W. G., Lauritzen, P. H., Lawrence, D. M., Lenaerts, J. T. M., Lindsay, K., Lipscomb, W. H., Mills, M. J., Neale, R., Oleson, K. W., Otto-Bliesner, B., Phillips, A. S., Sacks, W., Tilmes, S., van Kampenhout, L., Vertenstein, M., Bertini, A., Dennis, J., Deser, C., Fischer, C., Fox-Kemper, B., Kay, J. E., Kinnison, D., Kushner, P. J., Larson, V. E., Long, M. C., Mickelson, S., Moore, J. K., Nienhouse, E., Polvani, L., Rasch, P. J., and Strand, W. G.: The Community Earth System Model Version 2 (CESM2), J. Adv. Model. Earth Sy., 12, e2019MS001916, https://doi.org/10.1029/2019MS001916, 2020. a
Deshler, T., Luo, B., Kovilakam, M., Peter, T., and Kalnajs, L. E.: Retrieval of Aerosol Size Distributions From In Situ Particle Counter Measurements: Instrument Counting Efficiency and Comparisons With Satellite Measurements, J. Geophys. Res.-Atmos., 124, 5058–5087, https://doi.org/10.1029/2018JD029558, 2019. a
Dykema, J. A., Keith, D. W., and Keutsch, F. N.: Improved aerosol radiative properties as a foundation for solar geoengineering risk assessment, Geophys. Res. Lett., 43, 7758–7766, https://doi.org/10.1002/2016GL069258, 2016. a
Egorova, T., Rozanov, E., Zubov, V., and Karol, I. L.: Model for Investigating Ozone Trends (MEZON), Izvestiya, Atmos. Ocean. Phys., 39, 277–292, 2003. a
English, J. M., Toon, O. B., Mills, M. J., and Yu, F.: Microphysical simulations of new particle formation in the upper troposphere and lower stratosphere, Atmos. Chem. Phys., 11, 9303–9322, https://doi.org/10.5194/acp-11-9303-2011, 2011. a
Feinberg, A., Sukhodolov, T., Luo, B.-P., Rozanov, E., Winkel, L. H. E., Peter, T., and Stenke, A.: Improved tropospheric and stratospheric sulfur cycle in the aerosol–chemistry–climate model SOCOL-AERv2, Geosci. Model Dev., 12, 3863–3887, https://doi.org/10.5194/gmd-12-3863-2019, 2019. a, b
Forster, P. M., Richardson, T., Maycock, A. C., Smith, C. J., Samset, B. H., Myhre, G., Andrews, T., Pincus, R., and Schulz, M.: Recommendations for diagnosing effective radiative forcing from climate models for CMIP6, J. Geophys. Res.-Atmos., 121, 12460–12475, https://doi.org/10.1002/2016JD025320, 2016. a
Fuchs, N.: The Mechanics of Aerosols, Pergamon Press, Oxford, https://doi.org/10.1002/qj.49709138822, 1964. a
Heckendorn, P., Weisenstein, D., Fueglistaler, S., Luo, B. P., Rozanov, E., Schraner, M., Thomason, L. W., and Peter, T.: The impact of geoengineering aerosols on stratospheric temperature and ozone, Environ. Res. Lett., 4, 045108, https://doi.org/10.1088/1748-9326/4/4/045108, 2009. a, b, c, d
Jacob, D. J.: Chemistry of OH in remote clouds and its role in the production of formic acid and peroxymonosulfate, J. Geophys. Res., 91, 9807–9826, https://doi.org/10.1029/JD091iD09p09807, 1986. a
Jacobson, M. Z. and Seinfeld, J. H.: Evolution of nanoparticle size and mixing state near the point of emission, Atmos. Environ., 38, 1839–1850, https://doi.org/10.1016/j.atmosenv.2004.01.014, 2004. a
Jungclaus, J. H., Fischer, N., Haak, H., Lohmann, K., Marotzke, J., Matei, D., Mikolajewicz, U., Notz, D., and von Storch, J. S.: Characteristics of the ocean simulations in the Max Planck Institute Ocean Model (MPIOM) the ocean component of the MPI-Earth system model, J. Adv. Model. Earth Sy., 5, 422–446, https://doi.org/10.1002/jame.20023, 2013. a
Kasten, F.: Falling speed of aerosol particles, J. Appl. Meteorol., 7, 944–947, https://doi.org/10.1175/1520- 0450(1968)007<0944:FSOAP>2.0.CO;2, 1968. a
Kleinschmitt, C., Boucher, O., and Platt, U.: Sensitivity of the radiative forcing by stratospheric sulfur geoengineering to the amount and strategy of the SO2injection studied with the LMDZ-S3A model, Atmos. Chem. Phys., 18, 2769–2786, https://doi.org/10.5194/acp-18-2769-2018, 2018. a
Kokkola, H., Hommel, R., Kazil, J., Niemeier, U., Partanen, A.-I., Feichter, J., and Timmreck, C.: Aerosol microphysics modules in the framework of the ECHAM5 climate model – intercomparison under stratospheric conditions, Geosci. Model Dev., 2, 97–112, https://doi.org/10.5194/gmd-2-97-2009, 2009. a, b
Kovilakam, M., Thomason, L. W., Ernest, N., Rieger, L., Bourassa, A., and Millán, L.: The Global Space-based Stratospheric Aerosol Climatology (version 2.0): 1979–2018, Earth Syst. Sci. Data, 12, 2607–2634, https://doi.org/10.5194/essd-12-2607-2020, 2020. a
Kravitz, B., Robock, A., Boucher, O., Schmidt, H., Taylor, K. E., Stenchikov, G., and Schulz, M.: The Geoengineering Model Intercomparison Project (GeoMIP), Atmos. Sci. Lett., 12, 162–167, https://doi.org/10.1002/asl.316, 2011. a, b, c
Kremser, S., Thomason, L. W., von Hobe, M., Hermann, M., Deshler, T., Timmreck, C., Toohey, M., Stenke, A., Schwarz, J. P., Weigel, R., Fueglistaler, S., Prata, F. J., Vernier, J.-P., Schlager, H., Barnes, J. E., Antuña-Marrero, J.-C., Fairlie, D., Palm, M., Mahieu, E., Notholt, J., Rex, M., Bingen, C., Vanhellemont, F., Bourassa, A., Plane, J. M. C., Klocke, D., Carn, S. A., Clarisse, L., Trickl, T., Neely, R., James, A. D., Rieger, L., Wilson, J. C., and Meland, B.: Stratospheric aerosol – Observations, processes, and impact on climate, Rev. Geophys., 54, 278–335, https://doi.org/10.1002/2015RG000511, 2016. a, b
Kulmala, M. and Laaksonen, A.: Binary nucleation of water–sulfuric acid system: Comparison of classical theories with different H2SO4 saturation vapor pressures, J. Chem. Phys., 93, 696–701, https://doi.org/10.1063/1.459519, 1990. a
Laakso, A., Niemeier, U., Visioni, D., Tilmes, S., and Kokkola, H.: Dependency of the impacts of geoengineering on the stratospheric sulfur injection strategy – Part 1: Intercomparison of modal and sectional aerosol modules, Atmos. Chem. Phys., 22, 93–118, https://doi.org/10.5194/acp-22-93-2022, 2022. a, b, c, d
Määttänen, A., Merikanto, J., Henschel, H., Duplissy, J., Makkonen, R., Ortega, I. K., and Vehkamäki, H.: New Parameterizations for Neutral and Ion-Induced Sulfuric Acid-Water Particle Formation in Nucleation and Kinetic Regimes, J. Geophys. Res.-Atmos., 123, 1269–1296, https://doi.org/10.1002/2017JD027429, 2018. a, b
Mauritsen, T., Bader, J., Becker, T., Behrens, J., Bittner, M., Brokopf, R., Brovkin, V., Claussen, M., Crueger, T., Esch, M., Fast, I., Fiedler, S., Fläschner, D., Gayler, V., Giorgetta, M., Goll, D. S., Haak, H., Hagemann, S., Hedemann, C., Hohenegger, C., Ilyina, T., Jahns, T., Jimenéz-de-la Cuesta, D., Jungclaus, J., Kleinen, T., Kloster, S., Kracher, D., Kinne, S., Kleberg, D., Lasslop, G., Kornblueh, L., Marotzke, J., Matei, D., Meraner, K., Mikolajewicz, U., Modali, K., Möbis, B., Müller, W. A., Nabel, J. E. M. S., Nam, C. C. W., Notz, D., Nyawira, S.-S., Paulsen, H., Peters, K., Pincus, R., Pohlmann, H., Pongratz, J., Popp, M., Raddatz, T. J., Rast, S., Redler, R., Reick, C. H., Rohrschneider, T., Schemann, V., Schmidt, H., Schnur, R., Schulzweida, U., Six, K. D., Stein, L., Stemmler, I., Stevens, B., von Storch, J.-S., Tian, F., Voigt, A., Vrese, P., Wieners, K.-H., Wilkenskjeld, S., Winkler, A., and Roeckner, E.: Developments in the MPI-M Earth System Model version 1.2 (MPI-ESM1.2) and Its Response to Increasing CO2, J. Adv. Model. Earth Sy., 11, 998–1038, https://doi.org/10.1029/2018MS001400, 2019. a
Niemeier, U. and Timmreck, C.: What is the limit of climate engineering by stratospheric injection of SO2?, Atmos. Chem. Phys., 15, 9129–9141, https://doi.org/10.5194/acp-15-9129-2015, 2015. a
Niemeier, U., Schmidt, H., and Timmreck, C.: The dependency of geoengineered sulfate aerosol on the emission strategy, Atmos. Sci. Lett., 12, 189–194, https://doi.org/10.1002/asl.304, 2011. a
Niemeier, U., Richter, J. H., and Tilmes, S.: Differing responses of the quasi-biennial oscillation to artificial SO2 injections in two global models, Atmos. Chem. Phys., 20, 8975–8987, https://doi.org/10.5194/acp-20-8975-2020, 2020. a
Pierce, J. R., Weisenstein, D. K., Heckendorn, P., Peter, T., and Keith, D. W.: Efficient formation of stratospheric aerosol for climate engineering by emission of condensible vapor from aircraft, Geophys. Res. Lett., 37, L18805, https://doi.org/10.1029/2010GL043975, 2010. a
Quaglia, I., Timmreck, C., Niemeier, U., Visioni, D., Pitari, G., Brodowsky, C., Brühl, C., Dhomse, S. S., Franke, H., Laakso, A., Mann, G. W., Rozanov, E., and Sukhodolov, T.: Interactive stratospheric aerosol models' response to different amounts and altitudes of SO2 injection during the 1991 Pinatubo eruption, Atmos. Chem. Phys., 23, 921–948, https://doi.org/10.5194/acp-23-921-2023, 2023. a, b, c, d
Roeckner, E., Bäuml, G., Bonaventura, L., Brokopf, R., Esch, M., Giorgetta, M., Hagemann, S., Kirchner, I., Kornblueh, L., Manzini, E., Rhodin, A., Schlese, U., Schulzweida, U., and Tompkins, A.: The atmospheric general circulation model ECHAM 5. PART I: Model description, MPI-Report No. 349, Max-Planck-Institut für Meteorologie, Hamburg, https://pure.mpg.de/rest/items/item_995269_4/component/file_995268/content (last access: 15 May 2024), 2003. a
Roeckner, E., Brokopf, R., Esch, M., Giorgetta, M., Hagemann, S., Kornblueh, L., Manzini, E., Schlese, U., and Schulzweida, U.: Sensitivity of simulated climate to horizontal and vertical resolution in the ECHAM5 atmosphere model, J. Climate, 19, 3771–3791, https://doi.org/10.1175/JCLI3824.1, 2006. a
Rozanov, E. V., Zubov, V. A., Schlesinger, M. E., Yang, F., and Andronova, N. G.: The UIUC three-dimensional stratospheric chemical transport model: Description and evaluation of the simulated source gases and ozone, J. Geophys. Res., 104, 11755–11781, https://doi.org/10.1029/1999JD900138, 1999. a
Seinfeld, J. H. and Pandis, S. N.: Atmospheric Chemistry and Physics: From Air Pollut ion to Climate Change, John Wiley & Sons Inc., ISBN 978-1-118-94740-1, 1997. a
Sheng, J., Weisenstein, D. K., Luo, B., Rozanov, E., Stenke, A., Anet, J., Bingemer, H., and Peter, T.: Global atmospheric sulfur budget under volcanically quiescent conditions: Aerosol-chemistry-climate model predictions and validation, J. Geophys. Res.-Atmos., 120, 256–276, https://doi.org/10.1002/2014JD021985, 2015. a, b, c
Solomon, S.: Stratospheric ozone depletion: A review of concepts and history, Rev. Geophys., 37, 275–316, https://doi.org/10.1029/1999RG900008, 1999. a
Stenke, A., Schraner, M., Rozanov, E., Egorova, T., Luo, B., and Peter, T.: The SOCOL version 3.0 chemistry–climate model: description, evaluation, and implications from an advanced transport algorithm, Geosci. Model Dev., 6, 1407–1427, https://doi.org/10.5194/gmd-6-1407-2013, 2013. a, b
Stenke, A., Vattioni, S., Chiodo, G., Luo, B., Sukhodolov, T., and Peter, T.: Simulation data for testing the aerosol microphysical scheme of SOCOL-AERv2, ETH Zurich [data set], https://doi.org/10.3929/ethz-b-000610854, 2023. a
Stier, P., Feichter, J., Kinne, S., Kloster, S., Vignati, E., Wilson, J., Ganzeveld, L., Tegen, I., Werner, M., Balkanski, Y., Schulz, M., Boucher, O., Minikin, A., and Petzold, A.: The aerosol-climate model ECHAM5-HAM, Atmos. Chem. Phys., 5, 1125–1156, https://doi.org/10.5194/acp-5-1125-2005, 2005. a
Stott, P. A. and Harwood, R. S.: An implicit time-stepping scheme for chemical species in a global atmospheric circulation model, Ann. Geophys., 11, 377–388, 1993. a
Sukhodolov, T., Sheng, J.-X., Feinberg, A., Luo, B.-P., Peter, T., Revell, L., Stenke, A., Weisenstein, D. K., and Rozanov, E.: Stratospheric aerosol evolution after Pinatubo simulated with a coupled size-resolved aerosol–chemistry–climate model, SOCOL-AERv1.0, Geosci. Model Dev., 11, 2633–2647, https://doi.org/10.5194/gmd-11-2633-2018, 2018. a
Sukhodolov, T., Egorova, T., Stenke, A., Ball, W. T., Brodowsky, C., Chiodo, G., Feinberg, A., Friedel, M., Karagodin-Doyennel, A., Peter, T., Sedlacek, J., Vattioni, S., and Rozanov, E.: Atmosphere–ocean–aerosol–chemistry–climate model SOCOLv4.0: description and evaluation, Geosci. Model Dev., 14, 5525–5560, https://doi.org/10.5194/gmd-14-5525-2021, 2021. a
Sun, H., Eastham, S., and Keith, D.: Developing a Plume-in-Grid Model for Plume Evolution in the Stratosphere, J. Adv. Model. Earth Sy., 14, e2021MS002816, https://doi.org/10.1029/2021MS002816, 2022. a
Tabazadeh, A., Toon, O. B., Clegg, S. L., and Hamill, P.: A new parameterization of H2SO4/H2O aerosol composition: Atmospheric implications, Geophys. Res. Lett., 24, 1931–1934, https://doi.org/10.1029/97GL01879, 1997. a
Taylor, K. E., Williamson, D., and Zwiers, F.: The sea surface temperature and sea ice concentration boundary conditions for AMIP II simulations, Program for Climate Model Diagnosis and Intercomparison, PCMDI report 60, Lawrence Livermore National Laboratory, https://pcmdi.llnl.gov/report/pdf/60.pdf?id=32 (last access: 3 January 2023), 2000. a
Thomason, L. and Peter, T.: SPARC Assessment of Stratospheric Aerosol Properties (ASAP), SPARC Report No. 4, WCRP-124,WMO/TD-No. 1295, Stratospheric Processes And their Role in Climate (SPARC), http://www.sparc-climate.org/publications/sparc-reports/, (last access: 18 January 2023), 2006. a, b
Thomason, L. W., Ernest, N., Millán, L., Rieger, L., Bourassa, A., Vernier, J.-P., Manney, G., Luo, B., Arfeuille, F., and Peter, T.: A global space-based stratospheric aerosol climatology: 1979–2016, Earth Syst. Sci. Data, 10, 469–492, https://doi.org/10.5194/essd-10-469-2018, 2018. a
Tilmes, S., Richter, J. H., Mills, M. J., Kravitz, B., MacMartin, D. G., Garcia, R. R., Kinnison, D. E., Lamarque, J.-F., Tribbia, J., and Vitt, F.: Effects of Different Stratospheric SO2 Injection Altitudes on Stratospheric Chemistry and Dynamics, J. Geophys. Res., 123, 4654–4673, https://doi.org/10.1002/2017JD028146, 2018. a, b
Tilmes, S., Visioni, D., Jones, A., Haywood, J., Séférian, R., Nabat, P., Boucher, O., Bednarz, E. M., and Niemeier, U.: Stratospheric ozone response to sulfate aerosol and solar dimming climate interventions based on the G6 Geoengineering Model Intercomparison Project (GeoMIP) simulations, Atmos. Chem. Phys., 22, 4557–4579, https://doi.org/10.5194/acp-22-4557-2022, 2022. a
Timmreck, C., Mann, G. W., Aquila, V., Hommel, R., Lee, L. A., Schmidt, A., Brühl, C., Carn, S., Chin, M., Dhomse, S. S., Diehl, T., English, J. M., Mills, M. J., Neely, R., Sheng, J., Toohey, M., and Weisenstein, D.: The Interactive Stratospheric Aerosol Model Intercomparison Project (ISA-MIP): motivation and experimental design, Geosci. Model Dev., 11, 2581–2608, https://doi.org/10.5194/gmd-11-2581-2018, 2018. a, b
Vattioni, S., Weisenstein, D., Keith, D., Feinberg, A., Peter, T., and Stenke, A.: Exploring accumulation-mode H2SO4 versus SO2 stratospheric sulfate geoengineering in a sectional aerosol–chemistry–climate model, Atmos. Chem. Phys., 19, 4877–4897, https://doi.org/10.5194/acp-19-4877-2019, 2019. a, b, c
Vattioni, S., Stenke, A., Chiodo, G., Luo, B., Sukhodolov, T., and Peter, T.: Simulation data for testing the aerosol microphysical scheme of SOCOL-AERv2, ETH Zurich [data set], https://doi.org/10.3929/ethz-b-000622193, 2023. a
Vattioni, S., Stenke, A., and Chiodo, G.: SOCOL-AERv2, Zenodo [code], https://doi.org/10.5281/zenodo.10791230, 2024. a
Vehkamäki, H., Kulmala, M., Napari, I., Lehtinen, K. E. J., Timmreck, C., Noppel, M., and Laaksonen, A.: An improved parameterization for sulfuric acid–water nucleation rates for tropospheric and stratospheric conditions, J. Geophys. Res., 107, AAC 3–1–AAC 3–10, https://doi.org/10.1029/2002JD002184, 2002. a, b, c
Walcek, C. J.: Minor flux adjustment near mixing ratio extremes for simplified yet highly accurate monotonic calculation of tracer advection, J. Geophys. Res., 105, 9335–9348, https://doi.org/10.1029/1999JD901142, 2000. a
Wan, H., Rasch, P. J., Zhang, K., Kazil, J., and Leung, L. R.: Numerical issues associated with compensating and competing processes in climate models: an example from ECHAM-HAM, Geosci. Model Dev., 6, 861–874, https://doi.org/10.5194/gmd-6-861-2013, 2013. a, b
Weisenstein, D. K., Yue, G. K., Ko, M. K., Sze, N., Rodriguez, J. M., and Scott, C. J.: A two-dimensional model of sulfur species and aerosols, J. Geophys. Res., 102, 13019–13035, https://doi.org/10.1029/97JD00901, 1997. a, b
Weisenstein, D. K., Penner, J. E., Herzog, M., and Liu, X.: Global 2-D intercomparison of sectional and modal aerosol modules, Atmos. Chem. Phys., 7, 2339–2355, https://doi.org/10.5194/acp-7-2339-2007, 2007. a
Weisenstein, D. K., Visioni, D., Franke, H., Niemeier, U., Vattioni, S., Chiodo, G., Peter, T., and Keith, D. W.: An interactive stratospheric aerosol model intercomparison of solar geoengineering by stratospheric injection of SO2 or accumulation-mode sulfuric acid aerosols, Atmos. Chem. Phys., 22, 2955–2973, https://doi.org/10.5194/acp-22-2955-2022, 2022. a, b, c, d, e, f, g, h, i, j, k, l
Wunderlin, E., Chiodo, G., Sukhodolov, T., Vattioni, S., Visioni, D., and Tilmes, S.: Side Effects of Sulfur-Based Geoengineering Due To Absorptivity of Sulfate Aerosols, Geophys. Res. Lett., 51, e2023GL107285, https://doi.org/10.1029/2023GL107285, 2024. a
Yu, F., Nadykto, A. B., Luo, G., and Herb, J.: H2SO4–H2O binary and H2SO4–H2O–NH3 ternary homogeneous and ion-mediated nucleation: lookup tables version 1.0 for 3-D modeling application, Geosci. Model Dev., 13, 2663–2670, https://doi.org/10.5194/gmd-13-2663-2020, 2020. a
Yu, F., Luo, G., Nair, A. A., Eastham, S., Williamson, C. J., Kupc, A., and Brock, C. A.: Particle number concentrations and size distributions in the stratosphere: implications of nucleation mechanisms and particle microphysics, Atmos. Chem. Phys., 23, 1863–1877, https://doi.org/10.5194/acp-23-1863-2023, 2023. a, b, c, d
The details of the experiment protocol can be found at http://climate.envsci.rutgers.edu/geomip/testbed.html (last access: 15 May 2024).