the Creative Commons Attribution 4.0 License.
the Creative Commons Attribution 4.0 License.
 | 02 Apr 2024
Intercomparison of multiple two-way coupled meteorology and air quality models (WRF v4.1.1–CMAQ v5.3.1, WRF–Chem v4.1.1, and WRF v3.7.1–CHIMERE v2020r1) in eastern China
Chao Gao
Xuelei Zhang
Aijun Xiu
Qingqing Tong
Hongmei Zhao
Shichun Zhang
Guangyi Yang
Mengduo Zhang
Shengjin Xie
Two-way coupled meteorology and air quality models, which account for aerosol–radiation–cloud interactions, have been employed to simulate meteorology and air quality more realistically. Although numerous related studies have been conducted, none have compared the performances of multiple two-way coupled models in simulating meteorology and air quality over eastern China. Thus, we systematically evaluated annual and seasonal meteorological and air quality variables simulated by three open-source, widely utilized two-way coupled models (Weather Research and Forecasting (WRF)–Community Multiscale Air Quality (WRF–CMAQ), WRF coupled with chemistry (WRF–Chem), and WRF coupled with a regional chemistry-transport model named CHIMERE (WRF–CHIMERE)) by validating their results with surface and satellite observations for eastern China in 2017. Although we have made every effort to evaluate these three coupled models by using configurations that are as consistent as possible, there are still unavoidable differences between them in their treatments of physical and chemical processes. Our thorough evaluations revealed that all three two-way coupled models captured the annual and seasonal spatiotemporal characteristics of meteorology and air quality reasonably well. Notably, the role of the aerosol–cloud interaction (ACI) in improving the models' performances was limited compared to that of the aerosol–radiation interaction (ARI). The sources of uncertainties and bias in the different ACI schemes in the two-way coupled models were identified. With sufficient computational resources, these models can provide more accurate air quality forecasting to support atmospheric environment management and deliver timely warnings of heavy air pollution events. Finally, we propose potential improvements to two-way coupled models for future research.
- Article
(11715 KB) - Full-text XML
-
Supplement
(7945 KB) - BibTeX
- EndNote


Aerosols in the atmosphere due to anthropogenic and natural emissions cause air pollution but also have climate and meteorological impacts through the aerosol–radiation interaction (ARI) and aerosol–cloud interaction (ACI) (Carslaw et al., 2010; Rosenfeld et al., 2014; Fan et al., 2016; IPCC, 2021). The feedbacks of aerosols to meteorology have been widely investigated using two-way coupled meteorology and air quality models in the past 2 decades (Jacobson, 1994, 1997, 1998, 2001, 2002; Grell et al., 2005; Wong et al., 2012; Wang et al., 2014; Zhou et al., 2016; Briant et al., 2017; Feng et al., 2021). In these models, two-way interactions between meteorology and aerosols are enabled by including all the processes involving ARI or/and ACI (Grell and Baklanov, 2011; Wang et al., 2014; Briant et al., 2017; Wang et al., 2021). The fundamental theories, modeling techniques, developments, and applications of two-way coupled meteorology and air quality models in North America, Europe, and Asia have been systemically reviewed (Zhang, 2008; Baklanov et al., 2014; Gao et al., 2022a).
As pointed out by these review papers, the treatments of and parameterization schemes for all the physiochemical processes involving ARI and ACI can be very different in two-way coupled models, so the simulation results from these models can vary in many aspects. At the same time, the configurations of coupled models, such as the meteorological and chemical initial and boundary conditions (ICs and BCs), horizontal and vertical resolutions, and emission inventories and processing tools, play important roles in model simulations. Model intercomparison projects targeting various two-way coupled meteorology and air quality models have been carried out. For example, the Air Quality Model Evaluation International Initiative Phase II focused on the performances of multiple two-way coupled models and the effects of aerosol feedbacks in Europe and the United States (Brunner et al., 2015; Im et al., 2015a, b; Makar et al., 2015a, b). In Asia, the Model Inter-Comparison Study for Asia Phase III was conducted to evaluate ozone (O3) and other gaseous pollutants, fine particulate matter (PM2.5), and acid and reactive nitrogen deposition using various models with/without ARI and/or ACI enabled (Li et al., 2019; Chen et al., 2019; Itahashi et al., 2020; Ge et al., 2020; Kong et al., 2020). With respect to this project, Gao et al. (2018, 2020) reviewed in detail the performances of seven two-way coupled models from different research groups in simulating a heavy air pollution episode during January 2010 in the North China Plain and how aerosol feedbacks affected simulations of meteorological variables and PM2.5 concentrations. Targeting India, a heavily polluted region, Govardhan et al. (2016) compared the results for aerosol optical depth (AOD) and various aerosol species (black carbon, mineral dust, and sea salt) obtained using WRF–Chem (the Weather Research and Forecasting model coupled with chemistry, which includes ARI) with those obtained using the Spectral Radiation-Transport Model for Aerosol Species (which includes both ARI and ACI), although the models had different configurations.
So far, there have been no comprehensive comparisons of multiple coupled models using the same model configuration with respect to the high-aerosol-loading region over eastern China, which has experienced rapid growth in its economy, urbanization, and population as well as severe air quality problems in recent decades (He et al., 2002; Wang and Hao, 2012; Gao et al., 2017; Geng et al., 2021). In the eastern China region (ECR), several open-source and proprietary two-way coupled models have been applied to investigate the effects of ARI and/or ACI, but most such studies have focused on certain short-term episodes of heavy air pollution; no year-long simulations have been performed (Xing et al., 2017; Ding et al., 2019; Ma et al., 2021). The commonly used open-source models in ECR are WRF–Chem and WRF–CMAQ (Grell et al., 2005; Wong et al., 2012), and there has been no application of the two-way coupled WRF–CHIMERE model that has been applied to examine aerosol–radiation–cloud interactions in Europe and Africa (Briant et al., 2017; Tuccella et al., 2019). At the same time, model simulations should be compared against not only surface measurement data but also satellite data (Zhao et al., 2017; Hong et al., 2017; Campbell et al., 2017; Wang et al., 2018). Even though the running time of an individual modeling system (e.g., WRF–CMAQ or WRF–CHIMERE) has been evaluated by considering online and offline versions of it and by applying various computing configurations (Wong et al., 2012; Briant et al., 2017), the computational efficiencies of multiple two-way coupled models need to be compared under the same computing conditions as well.
In this paper, a comparative evaluation of three open-source two-way coupled meteorology and air quality models (WRF–CMAQ, WRF–Chem, and WRF–CHIMERE) applied to the ECR is conducted. The remainder of the paper is organized as follows. Section 2 describes the study methods, including model configurations and evaluation protocols. Sections 3 and 4 present the analyses and intercomparisons of simulations using these three two-way coupled models with regard to meteorology and air quality, respectively. The major findings of this work are summarized in Sect. 5.
2.1 Model configurations and data sources
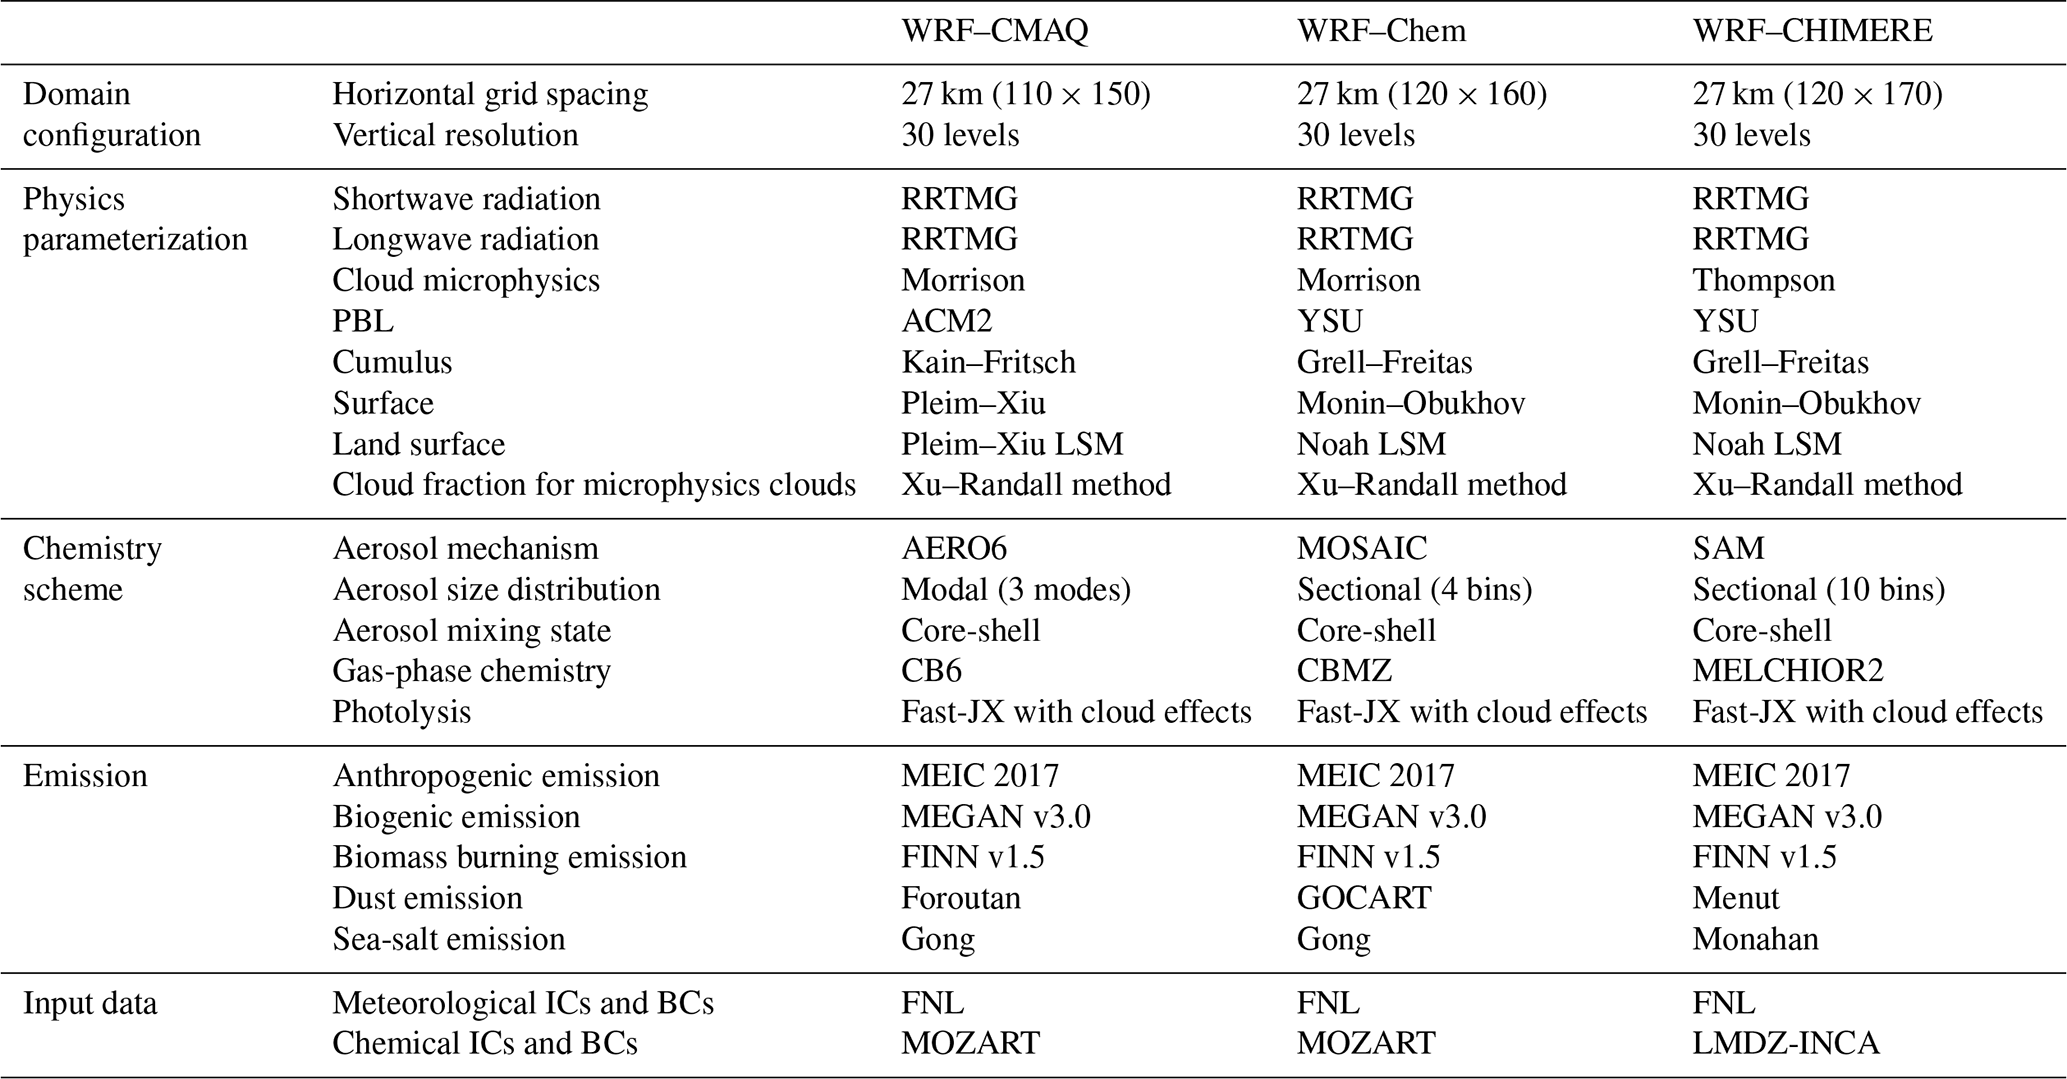
One-year simulations of meteorology and air quality in eastern China were examined using the two-way coupled WRF–CMAQ, WRF–Chem, and WRF–CHIMERE models with or without ARI and/or ACI. The horizontal grid resolution was 27 km (the east–west direction comprised 110, 120, and 120 grid cells and the north–south direction comprised 150, 160, and 170 grid cells for the WRF–CMAQ, WRF–Chem, and WRF–CHIMERE models, respectively). All three coupled models used in this study have 30 levels (i.e., 29 layers) from the surface to 100 hPa, with 11 layers in the bottom 1 km and a bottom-layer thickness of 23.2 m. The anthropogenic emissions in the Multiresolution Emission Inventory for China (MEIC) (Li et al., 2017) and biomass burning emissions (Wiedinmyer et al., 2011) in the Fire INventory from the University Corporation for Atmospheric Research, version 1.5 (FINN v1.5), were considered in our simulations, and their spatial, temporal, and species allocations were performed using Python (Wang et al., 2023). Biogenic emissions were calculated using the Model of Emissions of Gases and Aerosols from Nature, version 3.0 (MEGAN v3.0; Gao et al., 2019). Dust and sea salt emissions were used in the calculations of the inline modules (Table 1). The meteorological ICs and lateral BCs were derived from the National Center for Environmental Prediction Final Analysis (NCEP-FNL) datasets (http://rda.ucar.edu/datasets/ds083.2, last access: 20 October 2020) with a horizontal resolution of 1° × 1° at 6 h intervals for each of the three coupled models, and the flux in the model's top boundary was set to zero. To improve the long-term accuracy of the meteorological variables when utilizing the WRF model, we turned on the options for observational and grid four-dimensional data assimilation (FDDA), and pressure, station height, relative humidity, wind speed (WS), and wind direction were observed 4 times per day at 00:00, 06:00, 12:00, and 18:00 UTC at 2168 stations (https://doi.org/10.5281/zenodo.6975602; Gao et al., 2022b). Notably, turning on FDDA in two-way coupled models could dampen the simulated aerosol feedback (Wong et al., 2012; Forkel et al., 2012; Hogrefe et al., 2015; Zhang et al., 2016). To mitigate the effects of turning on FDDA on aerosol feedback in long-term simulations, we set the nudging coefficients of the u and v wind, temperature, and water vapor mixing ratio above the planetary boundary layer to 0.0001, 0.0001, and 0.00001 s−1, respectively. The chemical ICs/lateral BCs were downscaled from the Whole Atmosphere Community Climate Model (WACCM) for WRF–CMAQ and WRF–Chem using the mozart2camx and mozbc tools, respectively. WRF–CHIMERE employed the climatology from a general circulation model developed at the Laboratoire de Météorologie Dynamique (LMDz), which was coupled to a global chemistry and aerosol model: INteractions between Chemistry and Aerosols (INCA; Mailler et al., 2017). For the model-top chemical BCs, the WRF–CMAQ and WRF–Chem models consider the impacts of stratosphere–troposphere O3 exchange using O3–potential vorticity parameterization (Safieddine et al., 2014; Xing et al., 2016). Equivalent options were used in the two models in this study. WRF–CHIMERE employs the climatology from the LMDz–INCA data (Mailler et al., 2017).
Table 1 lists the options in the parameterization schemes for aerosol–radiation–cloud interactions. To maintain the consistency of the physical schemes, the same Rapid Radiative Transfer Model for General Circulation Models (RRTMG) shortwave (SW) and longwave (LW) radiation schemes and the Morrison microphysics scheme were adopted in the WRF–Chem and WRF–CMAQ models. WRF–CHIMERE applies the same radiation schemes as well as the Thompson microphysics scheme. Other schemes (cumulus, surface, and land surface) used in the WRF–CMAQ and WRF–Chem models were also selected following Gao et al.'s (2022a) widely utilized options outlined in Table S1 in the Supplement. The other schemes employed in WRF–CHIMERE are the same as those used in WRF–Chem. To consider the effects of clouds on radiative transfer calculations, the fractional cloud cover and cloud optical properties were included in the RRTMG SW/LW radiation schemes employed in the three coupled models (Xu and Randall, 1996; Iacono et al., 2008). The coupled WRF–CMAQ model with the Kain–Fritsch cumulus scheme included the impacts of the cumulus cloud fraction (CF) on RRTMG radiation (Alapaty et al., 2012), whereas the WRF–Chem and WRF–CHIMERE models with the Grell–Freitas cumulus scheme did not. In the Fast-JX photolysis scheme employed by the three coupled models, the impacts of clouds were included by considering the cloud cover and cloud optical properties. However, the calculations of the cloud cover and cloud optical properties differed in these models, and Table S1 presents the relevant information. Regarding the aerosol-size distribution, we used the modal approach with Aitken, accumulation, and coarse modes in WRF–CMAQ and the four- and 10-bin sectional approaches in the WRF–Chem and WRF–CHIMERE models, respectively (Binkowski and Roselle, 2003; Zaveri et al., 2008; Archer-Nicholls et al., 2014; Menut et al., 2013, 2016).
To demonstrate the capabilities of the three two-way coupled models with/without aerosol feedbacks in simulating meteorology and air quality, we comprehensively evaluated the strengths and weaknesses of each coupled model and validated them against extensive ground-based and satellite measurements. The ground-based data included 572 hourly ground-based meteorological observations (air temperature (T2) and relative humidity (RH2) at 2 m above the surface, WS at 10 m above the surface (WS10), and precipitation (PREC); http://data.cma.cn, last access: 20 October 2020); 327 hourly national environmental observations (fine particulate matter (PM2.5), ozone (O3), nitrogen dioxide (NO2), sulfur dioxide (SO2), and carbon monoxide (CO); https://quotsoft.net/air, last access: 20 October 2020); 109 hourly surface SW radiation (SSR) measurements (Tang et al., 2019); and 74 radiosonde data retrieved two times per day, which were used to calculate the planetary boundary layer height at 08:00 and 20:00 local time (PBLH08 and PBLH12) (Guo et al., 2019). Figure 1 shows the locations of these data. Because there were no observed water vapor mixing ratio (Q2) data, this parameter was calculated by , where RH2 is the relative humidity and ws is the saturation mixing ratio (Wallace and Hobbs, 2006).
The satellite data included the following: the monthly average downwelling SW/LW flux at the surface and SW/LW flux at the top of the atmosphere (TOA) obtained from the clouds and the Earth's radiant energy system (CERES) (https://ceres.larc.nasa.gov, last access: 20 October 2020); PREC from the Tropical Rainfall Measuring Mission (TRMM); CF, liquid-water path (LWP), and AOD from the Moderate Resolution Imaging Spectroradiometer (MODIS); the tropospheric NO2 and SO2 columns in the planetary boundary layer (PBL) from the Ozone Monitoring Instrument; the total CO column from the Measurements of Pollution in the Troposphere instrument (https://giovanni.gsfc.nasa.gov/giovanni, last access: 20 October 2020); total column ozone (TCO) from the Infrared Atmospheric Sounding Interferometer on Meteorological Operational Satellite A (IASI-METOP-A) (https://cds.climate.copernicus.eu/cdsapp/#!/dataset/satellite-ozone?tab=form, last access: 20 October 2020); and the total ammonia (NH3) column from IASI-METOP-B (https://iasi.aeris-data.fr/nh3_iasi_a_arch, last access: 20 October 2020). These data were downloaded and interpolated to the same horizontal resolution as the model results using the Rasterio library (Gillies et al., 2013). Thereafter, the model and observed values at each grid point were extracted.
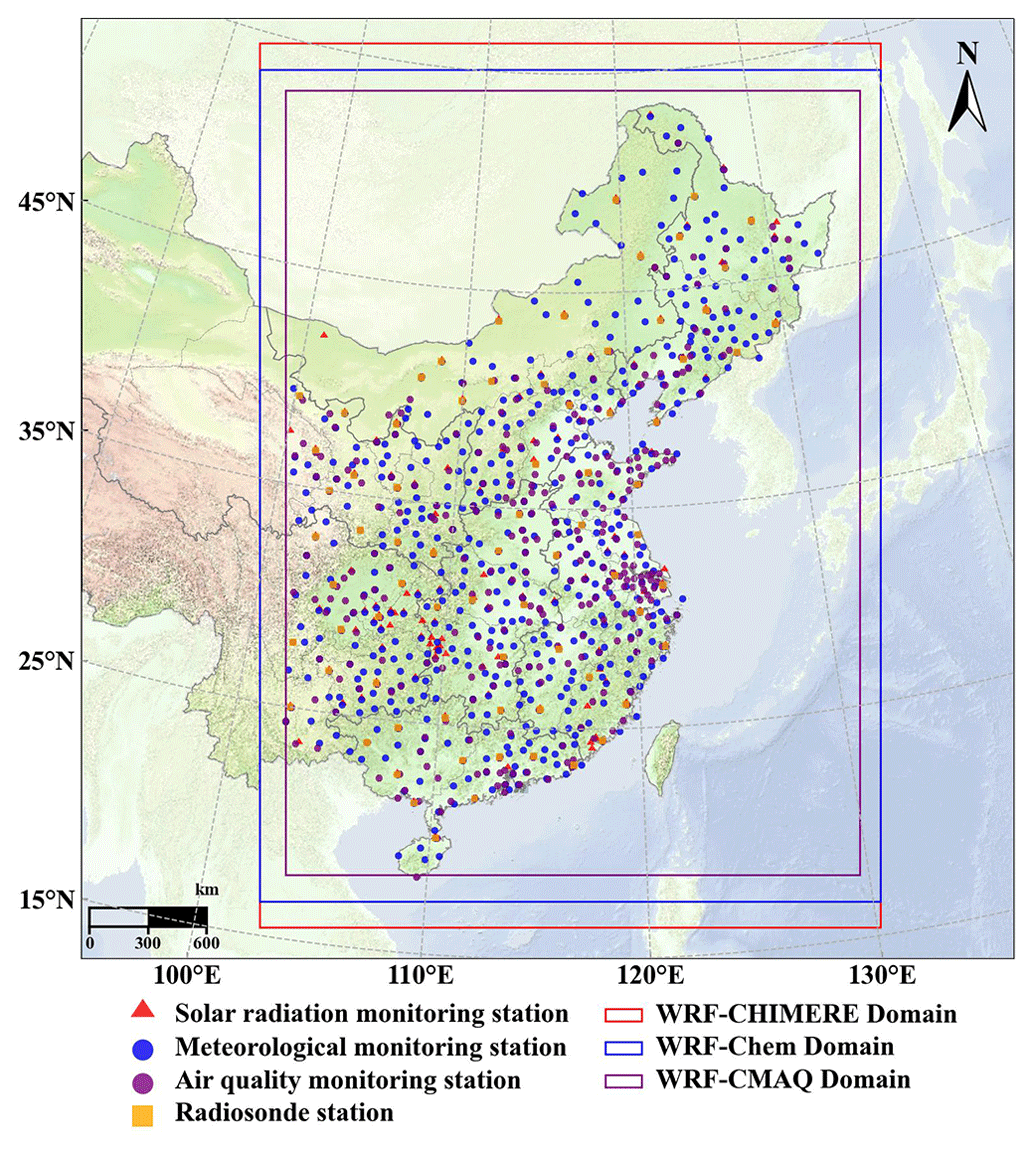
Figure 1Modeling domains (WRF–CMAQ, WRF–Chem, and WRF–CHIMERE) and solar radiation, meteorology, air quality, and radiosonde stations.
Table 1Model setups and inputs for the two-way coupled models (WRF–CMAQ, WRF–Chem, and WRF–CHIMERE).
2.2 Scenario setup
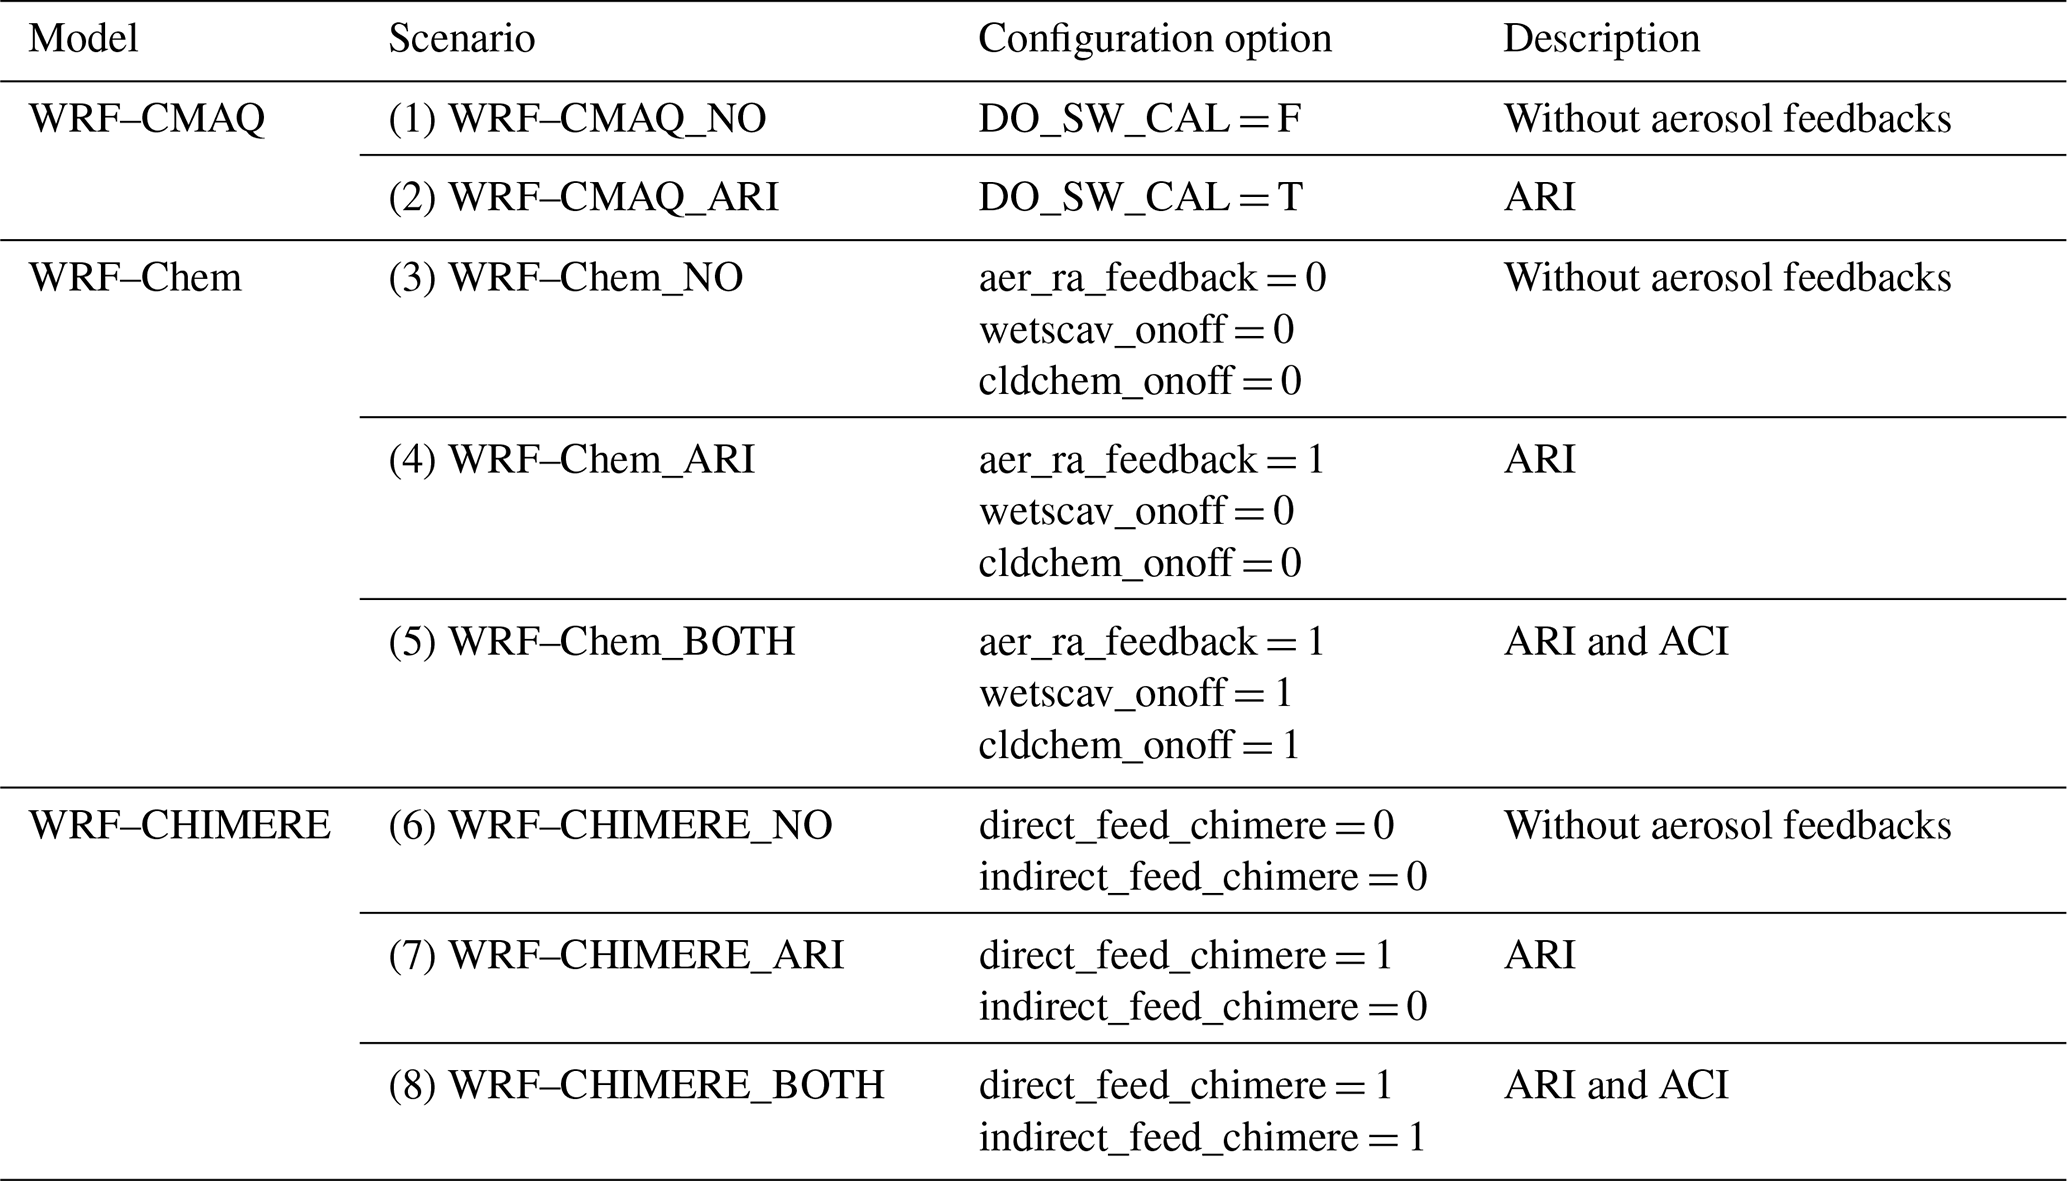
To comprehensively assess the performances of WRF v4.1.1–CMAQ v5.3.1, WRF–Chem v4.1.1, and WRF v3.7.1–CHIMERE v2020r1 as well as the models' performance impacted by aerosol feedbacks over eastern China in 2017, we set up eight scenarios as listed in Table 2. Different from WRF v4.1.1–CMAQ v5.3.1 and WRF–Chem v4.1.1, the officially available version of coupled WRF v3.7.1–CHIMERE v2020r1 is based on an earlier version of WRF, namely version 3.7.1. Notably, WRF–Chem and WRF–CHIMERE are able to simulate the effects of both ARI and ACI, whereas WRF v4.1.1–CMAQ v5.3.1 can only simulate the ARI effects.
In all of the simulations performed in this study, a spin-up time of 1 month was set up to reduce the influence of the initial conditions. Multiple statistical metrics, including the correlation coefficient (R), mean bias (MB), normalized mean bias (NMB), normalized gross error (NGE), and root mean square error (RMSE), were used to compare each scenario simulation and ground-based/satellite-borne observations. The mathematical definitions of these metrics are provided in Sect. S3 in the Supplement. To compare the simulations obtained with the three coupled models, the respective model configurations of the physics and chemistry routines were set to be as consistent as possible. We systematically analyzed the annual and seasonal statistical metrics of the meteorological and air quality variables, which were simulated by the three two-way coupled models with/without aerosol feedbacks. Thereafter, we quantified the respective contributions of ARI and ACI effects to model performance.
Table 2Summary of scenario settings in the three coupled models.
This section presents the annual and seasonal (spring: March–May; summer: June–August; autumn: September–November; winter: December–February) statistical metrics of the simulated meteorological variables and air quality as well as a comparison of them with the ground-based and satellite observations. The running times of the eight simulation scenarios are also discussed.
3.1 Ground-based observations
Figures 2 and S1–S7 show the spatial distributions of R, MB, and RMSE for the hourly SSR, T2, Q2 (water vapor mixing ratio), RH2, WS10, PREC, PBLH08, and PBLH120 from WRF–CMAQ, WRF–Chem, and WRF–CHIMERE with/without turning on aerosol feedback against ground-based observations from each site throughout 2017. The calculated annual model evaluation metrics for all sites in eastern China are summarized in Table S1, and the related seasonal R and MB values are presented in Fig. 3. Here, we mainly focus on comparisons of SSR, T2, RH2, and WS10. Further, Sect. S1.1 presents analyses of Q2, PREC, PBLH08, and PBLH20.
The accuracy of radiation prediction is of great significance in ARI evaluation. The annual and seasonal average simulated SSR data were compared with the ground-based observations (Figs. 3–4 and Table S3), and the SSR over eastern China was found to be simulated very reasonably by the models, with R values of 0.61–0.78. The simulated results were overestimated at annual and seasonal scales (MBs in spring and summer were larger than those in autumn and winter). The overestimated annual SSR values were 19.98, 14.48, and 9.24 W m−2 for WRF–CMAQ, WRF–Chem, and WRF–CHIMERE, respectively. Brunner et al.'s (2015) comparative study also reported that most two-way coupled models overestimated the SSR for Europe and North America. Such overestimations could be caused by multiple factors, namely, the uncertainties in cloud development owing to PBL and convection parameterizations (Alapaty et al., 2012) and the diversity in the treatment of land-surface processes (Brunner et al., 2015), which tend to play more important roles than the enabling of two-way aerosol feedbacks to SSR through the effects of ARI and ACI. When the three models incorporated ARI effects, the simulation accuracies for SSR over the whole year and the four seasons improved, whereas the enabling of ACI effects resulted in relatively limited improvement. Additionally, the MB variations of WRF–CMAQ and WRF–Chem simulations were higher in spring and winter than in summer and autumn, whereas the maximum and minimum MBs of WRF–CHIMERE simulations were obtained in summer (−10.33 W m−2) and autumn (−7.64 W m−2), respectively. The annual and seasonal decrease in SSR simulated by WRF–Chem and WRF–CHIMERE with ACI effects enabled were significantly smaller than those with ARI effects enabled.
Generally, the simulated magnitudes and temporal variations in the air temperature at 2 m above the ground exhibited high consistency with the observations (R=0.88–0.97). The models tended to display a negative bias in the annual and seasonal T2, and the T2 underestimations in spring and winter were greater than those in summer and autumn (Figs. 3 and 4). Following Makar et al. (2015a), WRF–Chem and GEM–MACH produced negative MBs in summer and positive MBs in winter with ACI and ARI effects enabled; additionally, WRF–CMAQ with only ARI effects enabled produced negative MBs in summer over North America in 2010. Notably, Makar et al.'s (2015a) study lacked winter meteorology evaluations using WRF–CMAQ. The results of a comparison of MBs revealed the following order: WRF–CHIMERE > WRF–CMAQ > WRF–Chem. The annual and seasonal MBs of WRF–CMAQ and WRF–Chem were approximately −1°, whereas those of WRF–CHIMERE ranged from −2 to −1 °C. The RMSE values of WRF–CMAQ (2.71–3.05 °C) and WRF–Chem (2.82–3.27 °C) were almost equal. Those of WRF–CHIMERE (3.39–4.53 °C) were larger at annual and seasonal scales. Notably, reduced underestimations of the annual and seasonal T2 in eastern China by the three coupled models were observed when ARI effects were enabled. With ACI effects enabled, the MBs for T2 simulated by WRF–Chem_BOTH did not change significantly compared with those of WRF–Chem_NO; additionally, compared with WRF–CHIMERE_NO, WRF–CHIMERE_BOTH showed greater underestimations of T2 for the full year (−1.30 °C), spring (−0.12 °C), and winter (−0.40 °C).
Regarding RH2, the annual and seasonal simulations using WRF–CMAQ exhibited the highest correlation with the observed values, followed by WRF–Chem and WRF–CHIMERE, and the smallest correlation coefficients of the three models were observed in autumn (∼ 0.5). The spatial MBs between the simulations performed using the three models and observations displayed a general converse trend compared with T2 (i.e., RH2 was overestimated where T2 was underestimated and vice versa). This can be explained by the calculation of RH2 based on T2 in the models (Wang et al., 2021). The annual and seasonal MBs were 0.65 %–71.03 % and −21.30 % to 60.00 %, respectively (Fig. 4 and Table S3); only WRF–Chem produced negative MBs in the summer. The magnitude of RMSE exhibited an inverse pattern compared with R for the three models, with the maximum (28.48 %–29.52 %) and minimum (12.57 %–16.07 %) values observed in autumn and summer, respectively. Figures 3–4 and Table S3 show that WRF–CMAQ_ARI further reduced the overestimations of the annual and seasonal RH2 in the ECR, whereas WRF–Chem_ARI (except for summer) and WRF–CHIMERE_ARI displayed the opposite trend. Moreover, the variations in the annual and seasonal RH2 MBs simulated by WRF–Chem_BOTH and WRF–CHIMERE_BOTH were further reduced compared with those simulated by WRF–Chem_ARI (except for summer) and WRF–CHIMERE_ARI, respectively.
Furthermore, similar analyses were performed for WS10, and the results revealed that WRF–CMAQ performed better in capturing the WS10 patterns than WRF–Chem and WRF–CHIMERE. The R values for all three models ranged from 0.47 to 0.60; WRF–CMAQ and WRF–Chem overestimated WS by ∼ 0.5 m s−1, whereas WRF–CHIMERE overestimated it by ∼ 1.0 m s−1 (Table S3 and Figs. 3–4). The overestimation of WS10 under real-world low-wind conditions is a common phenomenon in existing weather models, and it is mainly caused by outdated geographic data, a coarse model resolution, and a lack of a good physical representation of the urban canopy (Gao et al., 2015, 2018). The three models exhibited lower correlations (0.31–0.54) and MBs (0.20–0.86 m s−1) in summer compared with the other seasons, and the RMSEs were ∼ 2.0 m s−1. Enabling ARI effects mitigated the overestimations of the three models, particularly WRF–CMAQ_ARI.
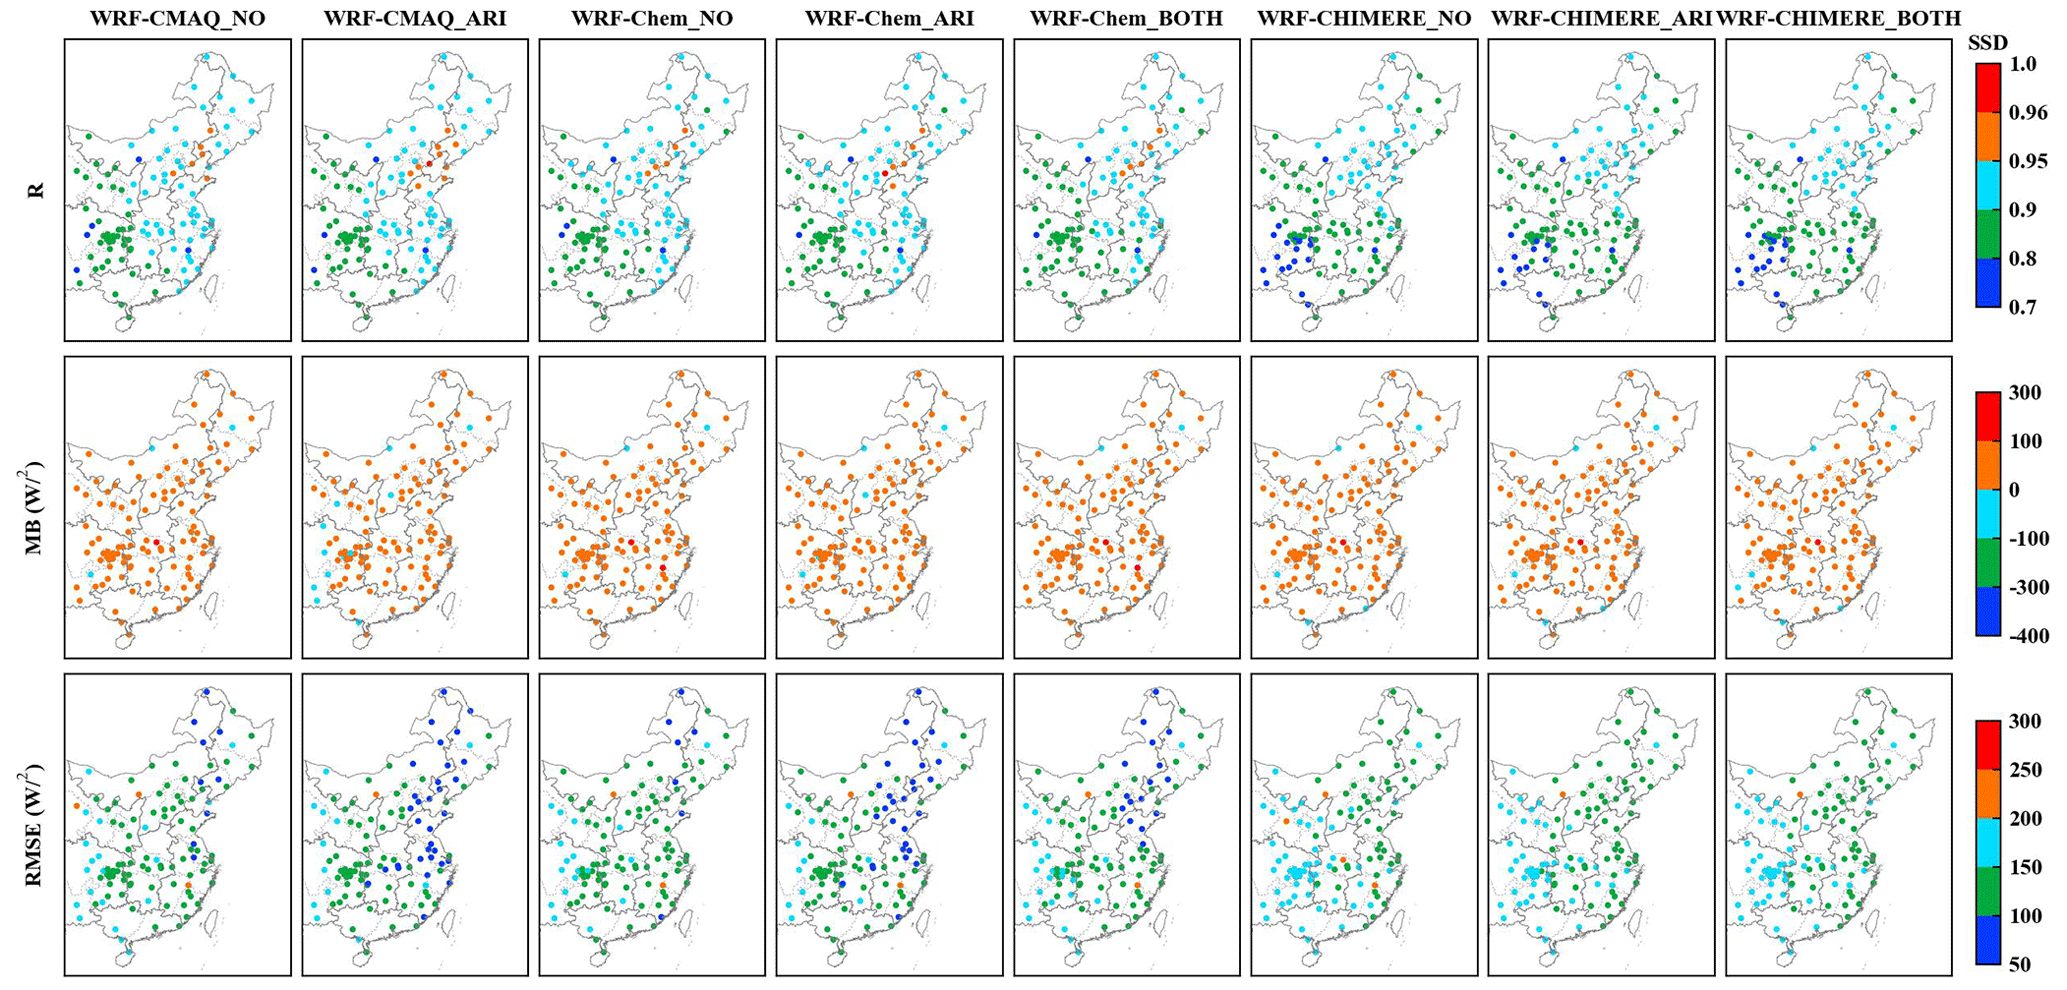
Figure 2Statistical metrics (R, MB, and RMSE) for annual simulations and observations of SSR in eastern China.
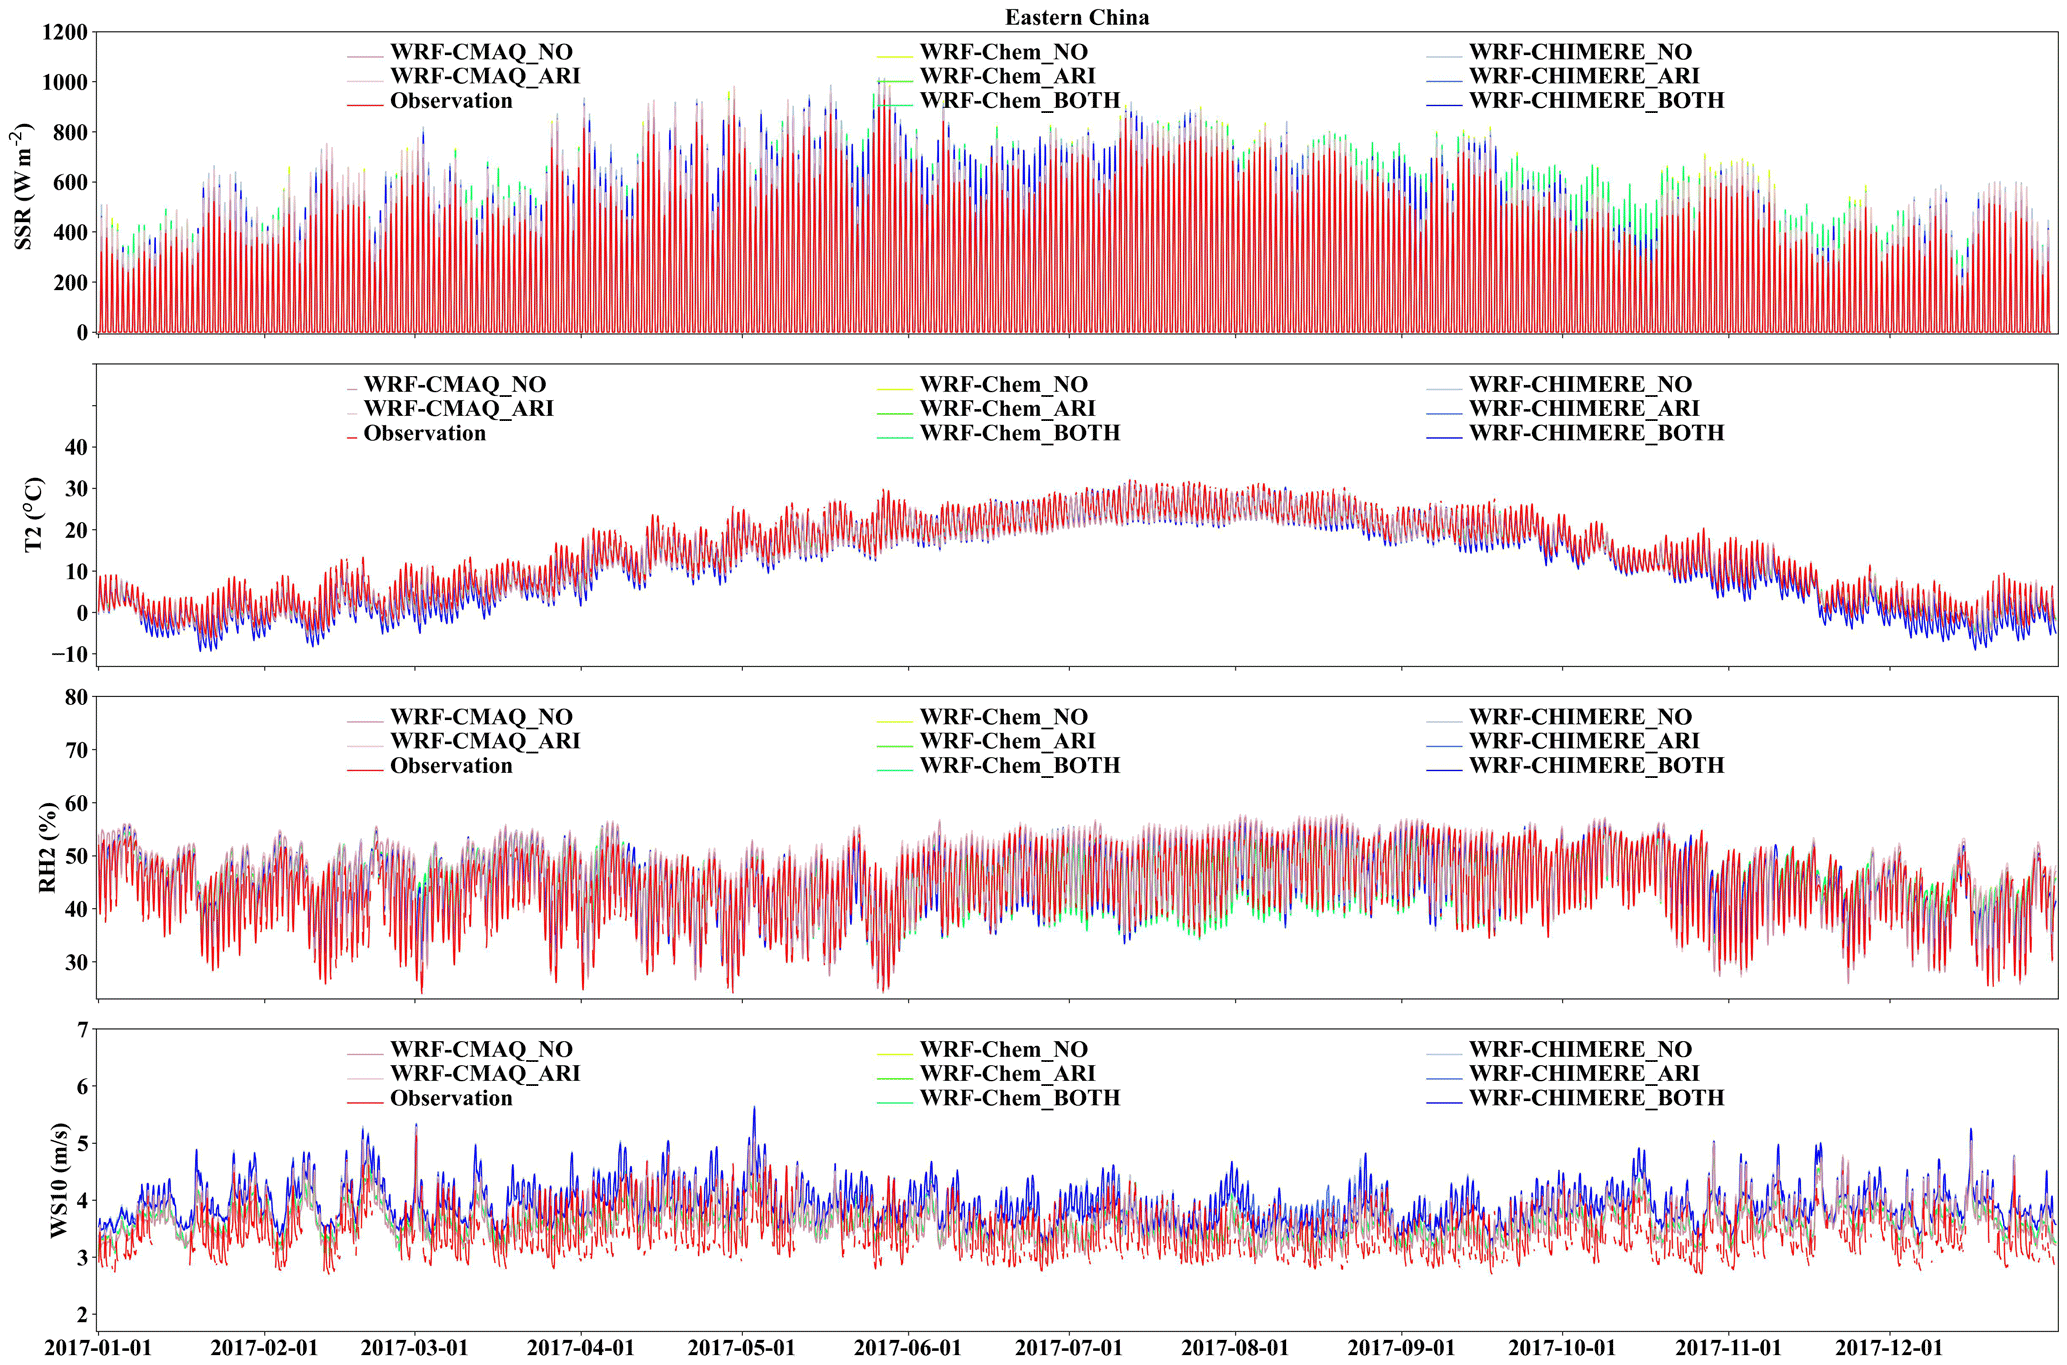
Figure 3Time series of the hourly SSR, T2, RH2, and WS10 over the ECR in 2017 simulated by the coupled models WRF–CMAQ, WRF–Chem, and WRF–CHIMERE with/without aerosol feedbacks and the corresponding observed time series.
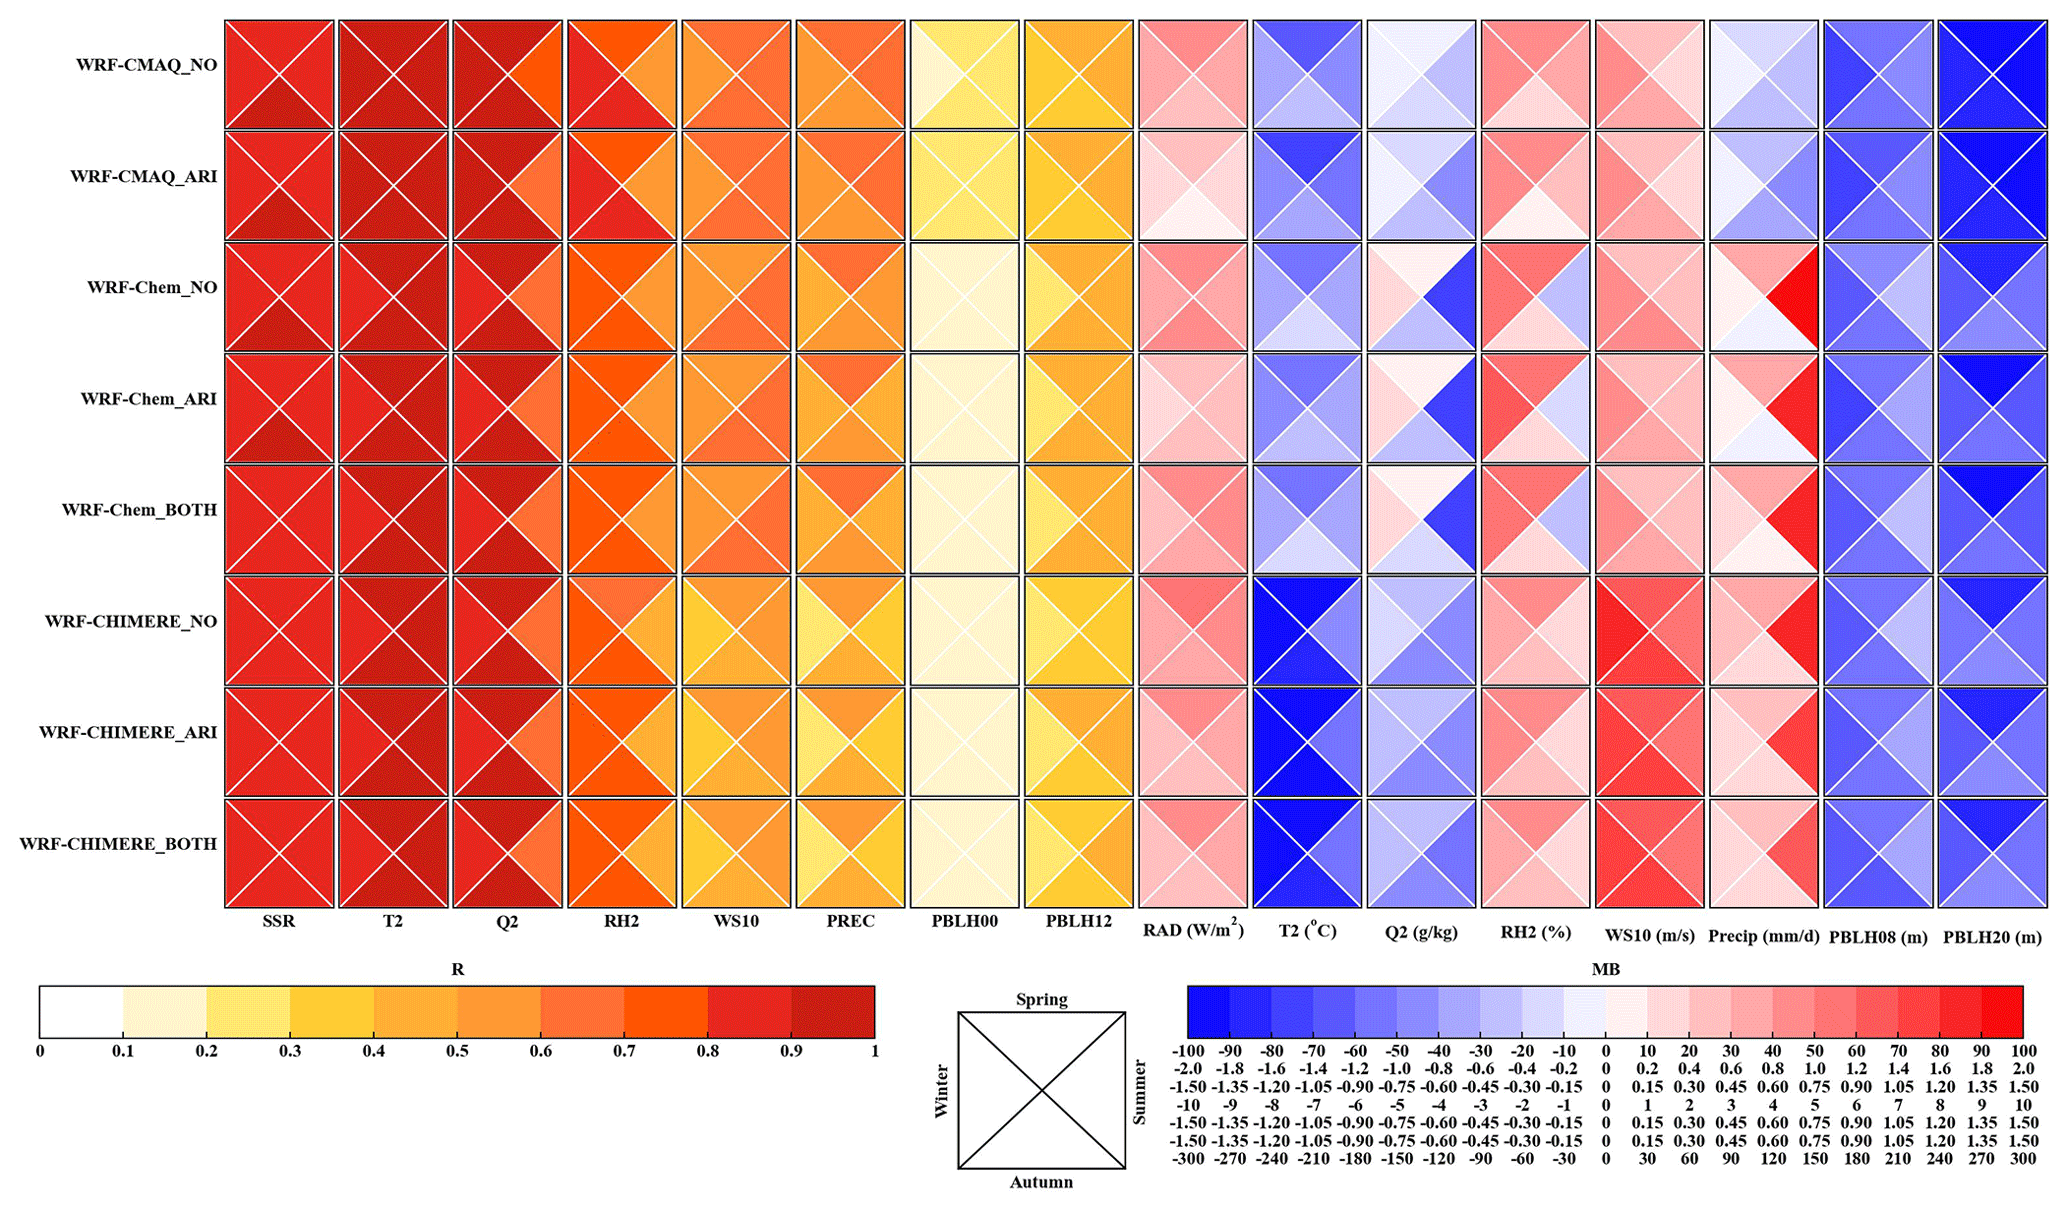
Figure 4Portrait plots of the statistical indices (R and MB) between the seasonal simulations and observations of the meteorological variables (SSR, T2, Q2, RH2, WS10, PREC, and PBLH at 08:00 and 20:00 LT) in the ECR.
To determine and quantify how well our results compared with those of the extant studies using two-way coupled models, we compared our study with previous ones in terms of the evaluation results for meteorology and air quality. We discuss meteorology and air quality in this section and Sect. 4.1, respectively. We employed box-and-whisker plots, and the 5th, 25th, 75th, and 95th percentiles were used as statistical indicators. In the plots, the dashed lines in the boxes represent the mean values and the circles represent outliers. Previous studies mainly used WRF–Chem and WRF–CMAQ to evaluate meteorology and air quality, whereas WRF coupled with the nested air quality prediction modeling system (WRF–NAQPMS) and the global–regional assimilation and prediction system coupled with the Chinese Unified Atmospheric Chemistry Environment forecasting system (GRAPES–CUACE) barely had application potential. As mentioned in Sect. 1, previous investigations of meteorology and air quality using WRF–CHIMERE with/without aerosol feedbacks have not been conducted for the ECR. Therefore, only the evaluation results involving WRF–Chem and WRF–CMAQ were analyzed to study aerosol feedbacks.
Figure S8 shows a comparison between the statistical metrics for T2, RH2, Q2, and WS10 in this study and the evaluation results of previous studies. Based on the number of samples in the statistical metrics of each meteorological variable, most previous studies mainly involved the simulation and evaluation of T2, WS10, and RH2, with relatively few studies focusing on Q2. Compared with the evaluation results of the extant studies, the ranges of our statistical metrics were roughly similar, although there were some notable differences. The R values of the WRF–CMAQ and WRF–Chem models in our study were higher than those of the previous studies; the MBs of T2 simulated by WRF–CMAQ were smaller, whereas those of T2 simulated by WRF–Chem were larger; and the RMSEs of the WRF–CMAQ simulation were larger, whereas those of the WRF–Chem simulation were smaller. For RH2, the R values of WRF–CMAQ and WRF–Chem were larger than the average level of the previous studies, whereas the MBs and RMSEs for WRF–CMAQ were larger. Those for WRF–Chem were smaller than the average reported in previous studies. For Q2, the model performance of WRF–CMAQ in this study was generally better than the average level reported in previous studies, although the R value between the WRF–Chem simulation results and observed values was higher (and the MB and RMSE were lower) than the average level reported in previous studies. We also conclude that the simulation results of WRF–CMAQ and WRF–Chem reproduced the variations in WS10 better than the simulations reported by previous studies did.
3.2 Satellite-borne observations
To further evaluate the performances of WRF–CMAQ, WRF–Chem, and WRF–CHIMERE against the satellite observations, we analyzed the annual and seasonal statistical metrics for SW and LW radiation at the surface, PREC, cloud cover, and LWP simulated by the three coupled models with and without aerosol feedbacks by comparing the simulations with the satellite-borne observations (Table 3 and Figs. 5, S9, and S12–S14). Additionally, evaluations of SW and LW radiation at TOA are presented in Sect. 1.2.
As shown in Table 3 and Fig. 5, the three coupled models exhibited relatively poor performances for SSR, with annual MBs of 8.21–30.74 W m−2 and correlations of 0.61–0.78. A similar poor performance for SW radiation in the United States when using the coupled WRF–CMAQ and offline WRF models was also reported (Wang et al., 2021). The overall seasonal characteristics of SSR were reproduced by the three coupled models (Fig. S10 in the Supplement). Concurrently, regardless of whether aerosol feedbacks were enabled or not, the three models overestimated the seasonal SSR (except WRF–Chem_ARI in winter), obtaining higher MBs in spring and summer than in autumn and winter. The seasonal SSR overestimations might be directly due to the underestimation of the calculated AOD when examining the ARI effects (Wang et al., 2021). Compared with SSR, the three coupled models predicted the surface LW radiation variables (SLR) well (R values were up to 0.99), with annual domain-average MBs of −9.97 to −6.05 W m−2. Furthermore, significant seasonal differences were observed in the LW radiation simulated by the three coupled models: the WRF–CMAQ and WRF–CHIMERE scenarios yielded underestimations, with maximum and minimum SLR values occurring in winter and summer, respectively, whereas the maximum underestimations of WRF–Chem were recorded in autumn, particularly for WRF–Chem_BOTH (Fig. S9).
As the three coupled models adopted the same grid resolution (27 × 27 km) as well as SW and LW radiation schemes (RRTMG), the above analysis demonstrated that the configuration differences among the aerosol components, size distributions, and mechanisms contributed to the diverse seasonal MBs (Tables 1 and S2). Moreover, the three two-way coupled models with ARI feedbacks effectively improved the performances of annual and seasonal SSR; however, for SLR, the performance improvements were much more variable across the three coupled models and different scenarios with and without ARI and/or ACI feedbacks enabled (Table S4). When ARI effects were enabled, the diverse refractive indices of the aerosol species groups caused discrepancies in the aerosol optical properties in different SW and LW bands in the RRTMG SW/LW radiation schemes of WRF–CMAQ, WRF–Chem, and WRF–CHIMERE calculated online (Tables S5–S6). The cloud optical properties induced by aerosol absorption in the RRTMG radiation schemes and calculated online differed regarding their treatments of the aerosol species groups in the three coupled models. With ACI effects enabled, the activation of cloud droplets from aerosols based on the Köhler theory was considered in WRF–Chem and WRF–CHIMERE, and these simulations were compared with those without aerosol feedbacks (Table S7). The treatments of prognostic ice-nucleating particles (INPs) formed via the heterogeneous nucleation of dust particles (diameters >0.5 µm) and the homogeneous freezing of hygroscopic aerosols (diameters >0.1 µm) were only investigated in WRF–CHIMERE, whereas prognostic INPs were not included in WRF–CMAQ and WRF–Chem. These discrepancies eventually contributed to the differences in the simulated radiation changes caused by aerosols.
According to the Intergovernmental Panel on Climate Change reports (IPCC, 2007, 2021), the effects of aerosol feedbacks (particularly with ACI effects enabled) on PREC and cloud processes remained unclear. In this study, we further assessed the annual and seasonal simulated PREC, cloud cover, and LWP in the regions of the ECR with high aerosol loadings against the satellite observations (Table 3 and Figs. S12–S14) to provide new insights into enabling online feedbacks in two-way coupled modeling simulations from a yearly perspective.
The results indicated that PREC simulated by WRF–CMAQ (0.51–0.89) exhibited higher correlations than PREC simulated by WRF–Chem (0.61–0.73) and WRF–CHIMERE (0.54–0.70). WRF–CMAQ demonstrated the best correlation in winter, whereas WRF–Chem and WRF–CHIMERE had the best correlations in spring; the three models presented their worst correlations in summer, as the numerical models struggled to effectively capture enhanced convective activities in summer. Huang and Gao (2018) also revealed that accurate representations of lateral boundaries were crucial to improving PREC simulations in China during summer. WRF–CMAQ underestimated annual PREC, with MBs of −76.49 to −51.93 mm, whereas WRF–Chem and WRF–CHIMERE produced large PREC overestimations ranging from +108.04 to +207.05 mm (Table 3), particularly in southern China regions (Fig. S11). WRF–CMAQ also produced negative biases (−27.89 to +42.08 mm) for seasonal PREC, except for WRF–CMAQ_ARI in winter. WRF–Chem and WRF–CHIMERE only underestimated seasonal PREC in autumn (−31.39 to −26.89 mm) and winter (−7.12 to −4.43 mm), respectively (Fig. S12). The variations in the annual and seasonal MBs of PREC were consistent with the changes in CF and LWP (Zhang et al., 2016), and these changes will be discussed in detail below.
By considering aerosol feedbacks, the ARI-induced decreases in the annual MB of PREC for WRF–CMAQ, WRF–Chem, and WRF–CHIMERE were 24.56, 12.11, and 4.70 mm, respectively. WRF–Chem_BOTH (24.9 mm) and WRF–CHIMERE_BOTH (3.41 mm) showed greater overestimation of annual PREC compared with WRF–Chem_ARI and WRF–CHIMERE_ARI, respectively. Significant increases (+53.15 mm) and decreases (−6.3 to −3.41 mm) in MBs were facilitated by WRF–CMAQ and the other two models with ARI effects enabled compared with those without feedbacks, respectively. WRF–Chem and WRF–CHIMERE with ARI and ACI effects enabled produced larger MB enhancements (+3.54 to +7.46 mm) at the seasonal scale (Fig. S12). Notably, the discrepancies in simulated PREC were mainly attributable to the selection of different microphysics and cumulus schemes in WRF–CMAQ (Morrison and Kain–Fritsch), WRF–Chem (Morrison and Grell–Freitas), and WRF–CHIMERE (Thompson and Grell–Freitas).
CF and LWP can significantly influence the spatiotemporal distributions of PREC; our simulated results for annual and seasonal CFs in the ECR are presented in Table 3 and Fig. S13. Overall, WRF–CMAQ performed the best at simulating CF. The R values of WRF–Chem during summer (0.69) and winter (0.70) were larger than those of WRF–CMAQ (0.59 and 0.64) and WRF–CHIMERE (0.56 and 0.66), whereas WRF–CMAQ and WRF–CHIMERE obtained better simulation results in winter and autumn, with correlations of up to 0.89 and 0.67, respectively. The three coupled models underestimated annual and seasonal CFs, with MBs of −16.83 % to −6.18 % and −21.13 % to −4.13 %, respectively; these results were consistent with those of previous two-way coupled modeling studies using WRF–CMAQ (−19.7 %) and WRF–Chem (−32 % to −9 %) in China (Hong et al., 2017; Zhao et al., 2017). The models simulated the annual LWP in the ECR reasonably well, with R values of >0.55 and negative biases varying from −57.36 to −31.29 g m−2. These underestimations were closely related to the lack of cloud homogeneity (Wang et al., 2015; Dionne et al., 2020) and the excessive conversion of liquid water to ice in the selected cloud microphysics schemes (Klein et al., 2009). As shown in Fig. S14, the models performed best when simulating LWP in spring (R=0.51–0.79), and their highest underestimations were observed in winter (MBs to −40.89 g m−2), except for WRF–Chem, which obtained its maximum bias in autumn.
In relation to quantitatively determining the impacts of aerosol feedbacks on CF and LWP, the simulated scenarios revealed that WRF–CMAQ_ARI overwhelmingly decreased the annual and seasonal underestimations of CF (0.48 %–1.05 %) and LWP (3.03–4.29 g m−2), whereas WRF–Chem_ARI and WRF–CHIMERE_ARI slightly increased the underestimations (CF: 0.02 %–0.39 %; LWP: 0.03–0.58 g m−2). Compared with WRF–CHIMERE_ARI, WRF–CHIMERE_BOTH produced larger variations in the annual and seasonal MBs of CF (0.23 %–0.93 %) and LWP (−2.96 to 7.38 g m−2). WRF–Chem_BOTH and WRF–Chem_ARI exhibited equivalent variations (CF: 0.03 %–0.71 %; LWP: 0.02–2.89 g m−2). This could be explained by the different parameterization treatments of the cloud droplet number concentration (CDNC) simulated by the three coupled models with/without ACI effects enabled. The cloud condensation nuclei (CCN) activated by the aerosol particles can increase CDNC and impact LWP and CF. Without enabling any aerosol feedbacks or when only enabling ARI, CDNC is, by default, prescribed as a constant value of 250 cm−3 in the Morrison schemes of WRF–CMAQ and WRF–Chem and 300 cm−3 in the Thompson schemes of WRF–CHIMERE. When only ACI or both ARI and ACI effects are enabled, the prognostic CDNC is calculated online in the two-way coupled WRF–Chem and WRF–CHIMERE models when cloud maximum supersaturation is greater than aerosol critical supersaturation (Abdul-Razzak and Ghan, 2002; Chapman et al., 2009; Tuccella et al., 2019). Although we have obtained preliminary quantitative results for ACI effects on regional PREC, CF, and LWP, we acknowledge that several limitations still exist regarding the representation of ACI effects in state-of-the-art two-way coupled models. These limitations include a lack of consideration of the responses of convective clouds to ACI (Tuccella et al., 2019), numerical descriptions of giant CCN (Wang et al., 2021), and heterogeneous ice nuclei (Keita et al., 2020).
Table 3Statistical metrics (R, MB, NMB, NGE, and RMSE) between the annual simulations and satellite retrievals of SSR and SLR, TOA SW and LW radiation, PREC, CF, and LWP in the ECR. The best results are shown in bold and the mean simulations and observations are in italics.
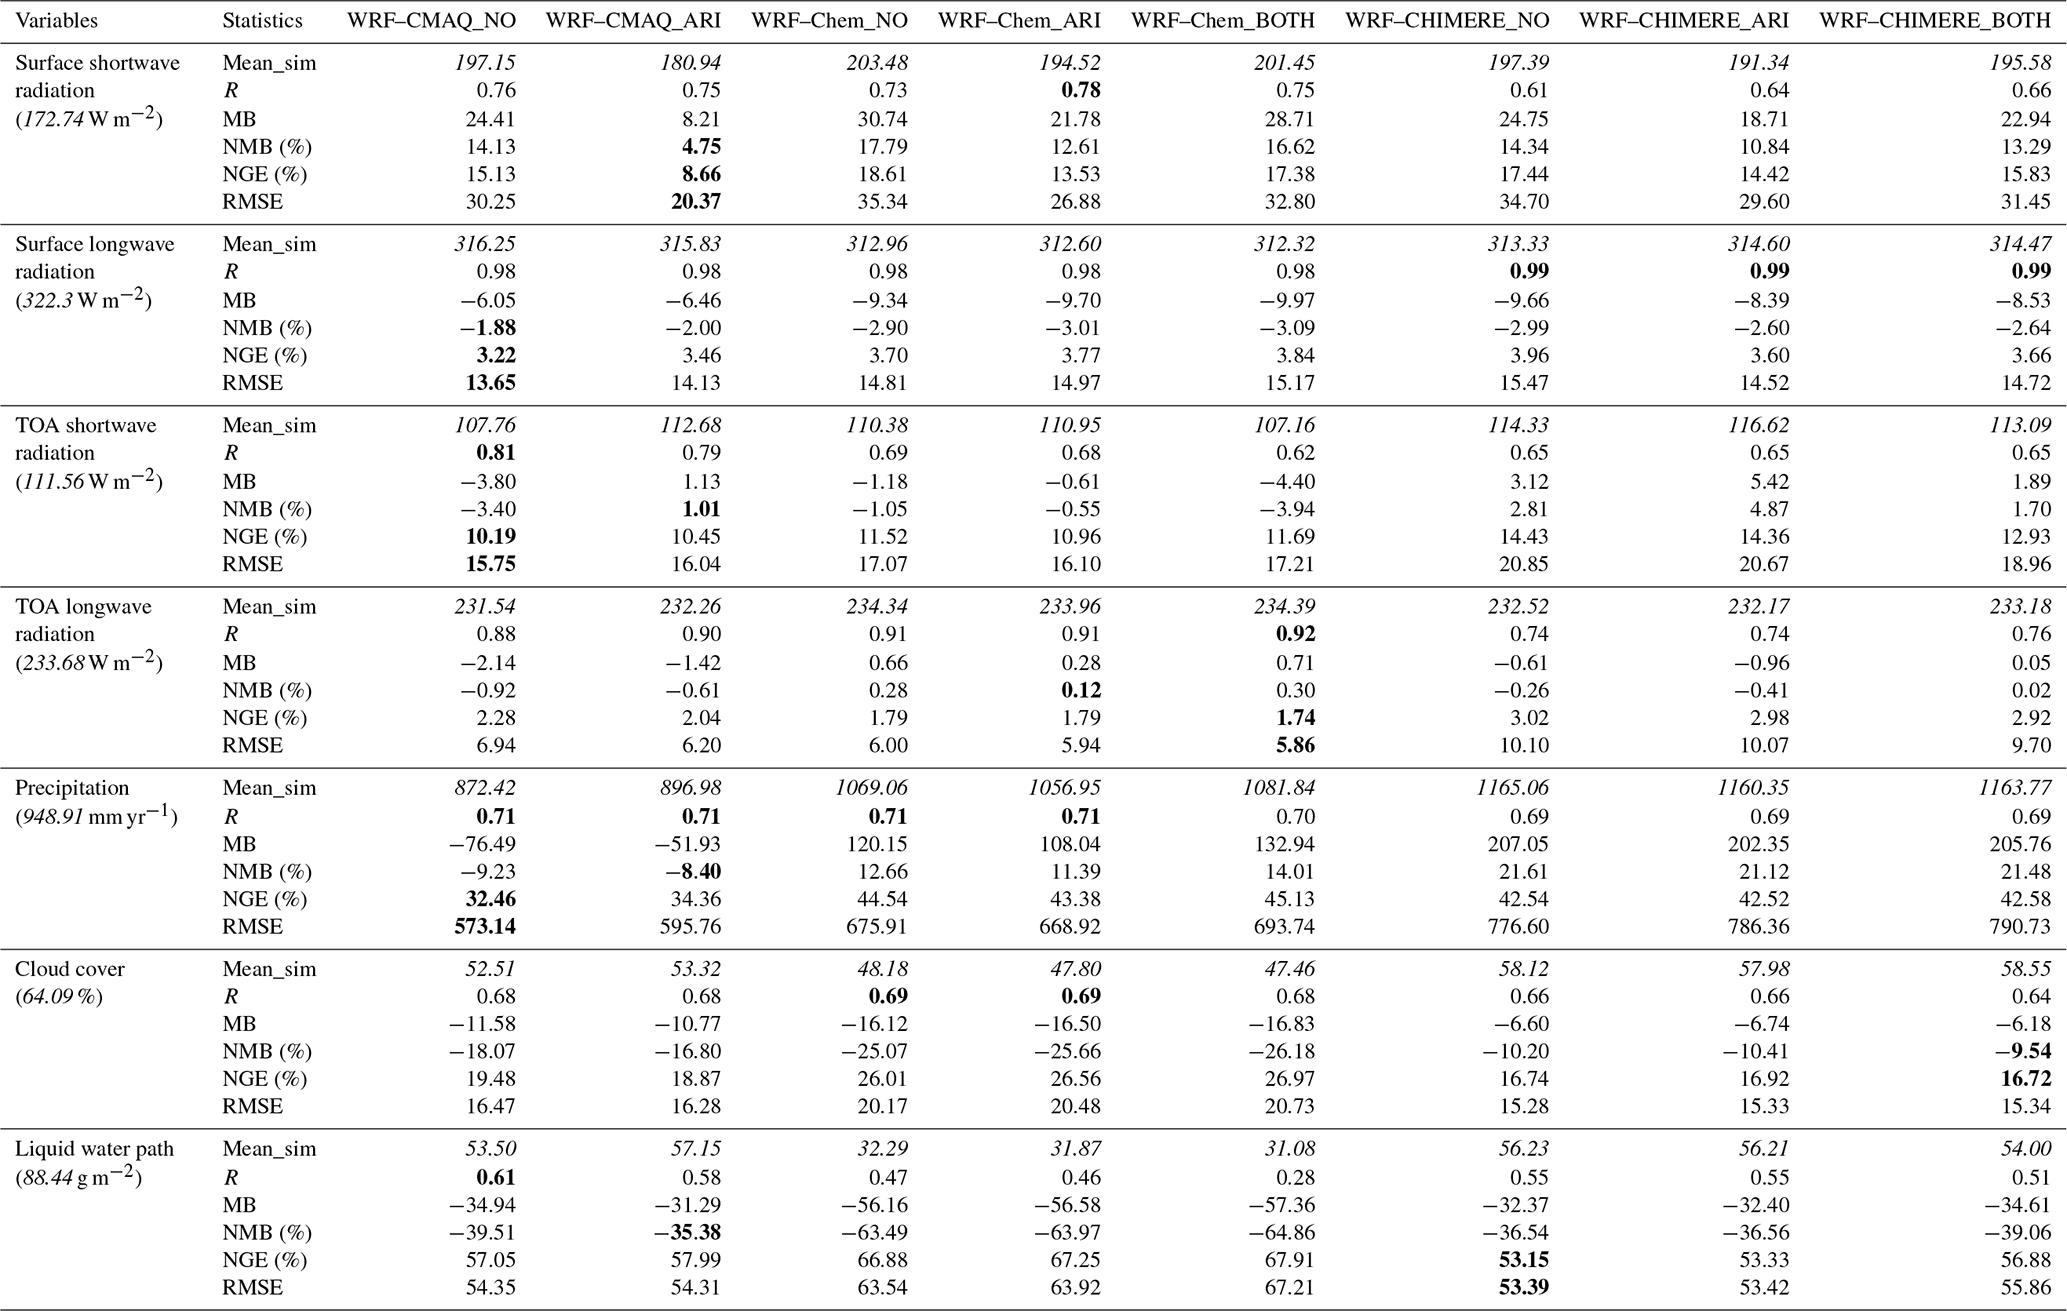
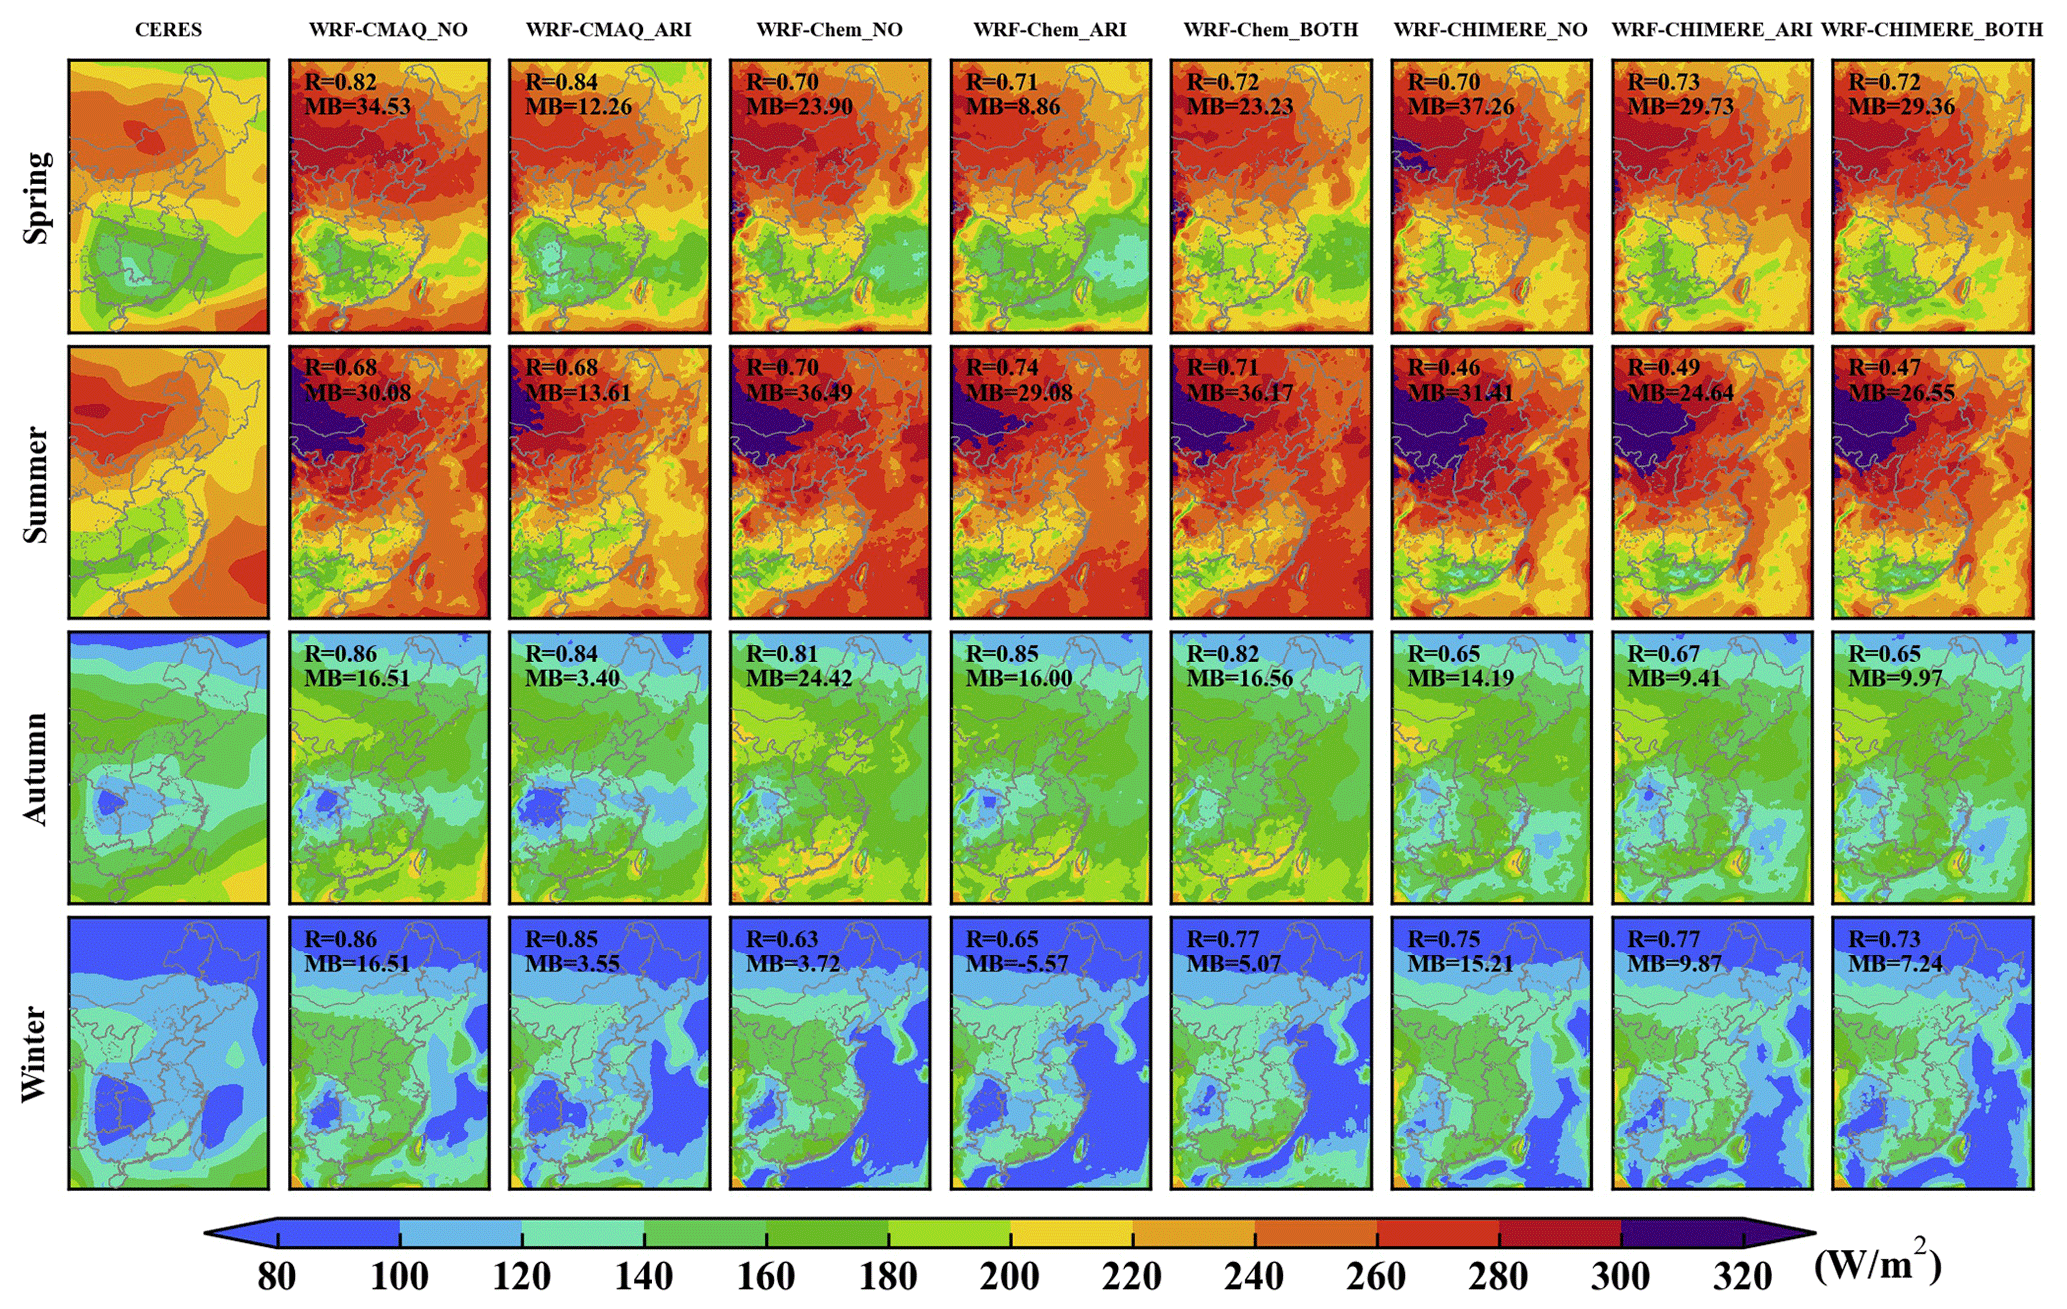
Figure 5Seasonal SSR in the ECR from CERES observations and simulations using WRF–CMAQ, WRF–Chem, and WRF–CHIMERE with and without aerosol feedbacks.
Similar to meteorology, to further determine the quantitative effects of enabling aerosol feedbacks on the simulation accuracy of the air-quality variables in the ECR, ground-based and satellite-borne observations were adopted for comparisons in the following evaluation analysis. The usage of computing resources for each simulation process was also assessed (Sect. 4.3).
4.1 Ground-based observations
Table 4 and Fig. 7 present the statistical metrics of the annual and seasonal air pollutant concentrations (PM2.5, O3, NO2, SO2, and CO) simulated by the three coupled models. The comparisons between the surface measurements and simulations of PM2.5 and O3 are presented below, and performance assessments of the other gaseous pollutants are presented in Sect. 2 of the Supplement.
The R values of the annual PM2.5 concentrations simulated by WRF–CMAQ (0.68) were the highest, followed by those obtained by WRF–Chem (0.65–0.68) and WRF–CHIMERE (0.52–0.53). The three models exhibited higher correlations in winter than in the other seasons (Fig. 7). Table 4 and Figs. 6–7 reveal that WRF–CMAQ underestimated the annual and seasonal (except for autumn) PM2.5 concentrations, with NMBs of −9.78 % to −6.39 % and −17.68 % to +5.17 %, respectively. WRF–Chem overestimated and underestimated PM2.5 at annual and seasonal scales, with the related NMBs varying from −39.11 % to +24.72 %. Concurrently, WRF–CHIMERE excessively overestimated the annual and seasonal PM2.5 concentrations (NMB: +19.51 % to +75.47 %). These biases could be related to the different aerosol and gas-phase mechanisms, dust and sea salt emission schemes, chemical ICs and BCs, and aerosol-size-distribution treatments applied to the three two-way coupled models. Based on the NMB differences between the simulations with ARI and those without aerosol feedbacks, the ARI-induced annual and seasonal NMB variations in WRF–CMAQ_ARI and WRF–Chem_ARI ranged from +3.01 % to +4.21 % and from +3.07 % to +5.02 %, respectively, indicating that enabling ARI feedbacks slightly reduced the annual and seasonal (except for autumn) underestimations of PM2.5 concentration. Notably, WRF–CHIMERE_ARI further overestimated the annual and seasonal PM2.5 concentrations, with an NMB increase of up to 10.04 %. The increases in the PM2.5 concentrations due to ARI effects were attributable to the synergetic decreases in SSR, T2, WS10, and PBLH as well as increases in RH2. With ACI feedbacks also enabled, WRF–Chem_BOTH greatly underestimated the annual and seasonal PM2.5, with NMBs varying from −24.15 % to −14.44 %, compared with WRF–Chem_ARI. WRF–CHIMERE_BOTH tended to decrease (−2.1 % to −0.51 %) the annual and autumn–winter NMBs and increase (+0.35 % to +3.04 %) the spring–summer ones. A further comparison of the ARI- and ACI-induced NMB variations demonstrated that the ARI-induced variations in the PM2.5 concentrations were smaller than the ACI-induced ones in WRF–Chem and that the reverse pattern was seen with WRF–CHIMERE. This might be explained by the incorporation of dust aerosols in WRF–CHIMERE serving as ice nuclei (IN), which was not included in WRF–Chem in this study.
For O3, WRF–CHIMERE (R=0.62) exhibited the highest correlation, followed by WRF–CMAQ (R=0.55) and WRF–Chem (R=0.45) (Table 4 and Fig. S16). WRF–CMAQ slightly underestimated the annual O3 concentration, with NMBs and NGEs of −12.57 % to −11.52 %; conversely, WRF–Chem and WRF–CHIMERE significantly overestimated it, with NMBs of 47.82 %–48.10 % and 29.46 %–29.75 %, respectively. The seasonal results for the statistical metrics displayed patterns consistent with the annual simulations, and the O3 pollution levels in summer were better simulated than those in the other seasons (Fig. 6). The models with ARI feedbacks enabled slightly decreased the annual and seasonal O3 NMBs and NGEs, which ranged from −3.02 % to +0.85 % (the only positive value of +0.85 % was produced by WRF–CMAQ in summer) and from −1.42 % to −0.75 %, respectively. Concurrently, regarding ACI effects, WRF–Chem and WRF–CHIMERE exhibited increased annual O3 NMBs and NGEs of 0.12 %–0.65 % and 0.40 %–0.55 %, respectively. The ACI-induced seasonal NMB variations for WRF–Chem differed from those for WRF–CHIMERE; WRF–Chem increased and decreased in spring–summer and autumn–winter, respectively, whereas WRF–CHIMERE increased in all seasons except winter (Fig. 7). Such diverse NMB and NGE variations can be explained by two model differences.For the model-top BCs, the WRF–CMAQ and WRF–Chem models employed the parameterization scheme of O3–potential vorticity, whereas WRF–CHIMERE employed the climatological data from LMDz–INCA. Regarding the gas-phase chemistry mechanisms, the three coupled models incorporated various photolytic reactions; this is discussed more comprehensively in Sect. 4.2. Knote et al. (2015) comprehensively assessed the effects of seven gas-phase chemical mechanisms (the second generation Regional Acid Deposition Model, RADM2; the Regional Acid Deposition Model Version Karlsruhe, RADMKA; the Regional Atmospheric Chemistry Mechanism - Earth System Research Laboratory, RACM-ESRL; the Carbon Bond Mechanism 2005 (CB05) with chlorine extensions for the troposphere, CB05Clx; and CB05 with updated toluene and activated chlorine chemistry, CB05-TUCL; Carbon-Bond Mechanism version Z, CBMZ; and the Model for Ozone and Related chemical Tracers version 4, MOZART-4) on O3 simulations using the three two-way coupled models WRF–Chem, WRF–CMAQ, and COSMO–ART (the Consortium for Small Scale Modeling with an extension for Aerosols and Reactive Trace gases). They concluded that the O3 concentrations simulated by WRF–Chem using the CBMZ mechanism were closest to the mean values of multiple models for North America and Europe in spring and summer. However, in contrast to the results for North America and Europe, the two-way coupled model WRF–Chem with CBMZ exhibited the lowest performance in spring for the ECR. Additionally, ARI and/or ACI effects contributed to atmospheric dynamics and stability (as mentioned in the PBLH evaluation part of Sect. S1.1 in the Supplement) as well as photochemistry and heterogeneous reactions; thus, they eventually influenced O3 formation (Xing et al., 2017; Qu et al., 2021; Zhu et al., 2021).
Table 4Statistical metrics (R, MB, NMB, NGE, and RMSE) of the annual simulations of surface PM2.5, O3, NO2, SO2, and CO in the ECR with respect to the corresponding observations. The best results are in bold, while the mean simulations and observations are in italics.
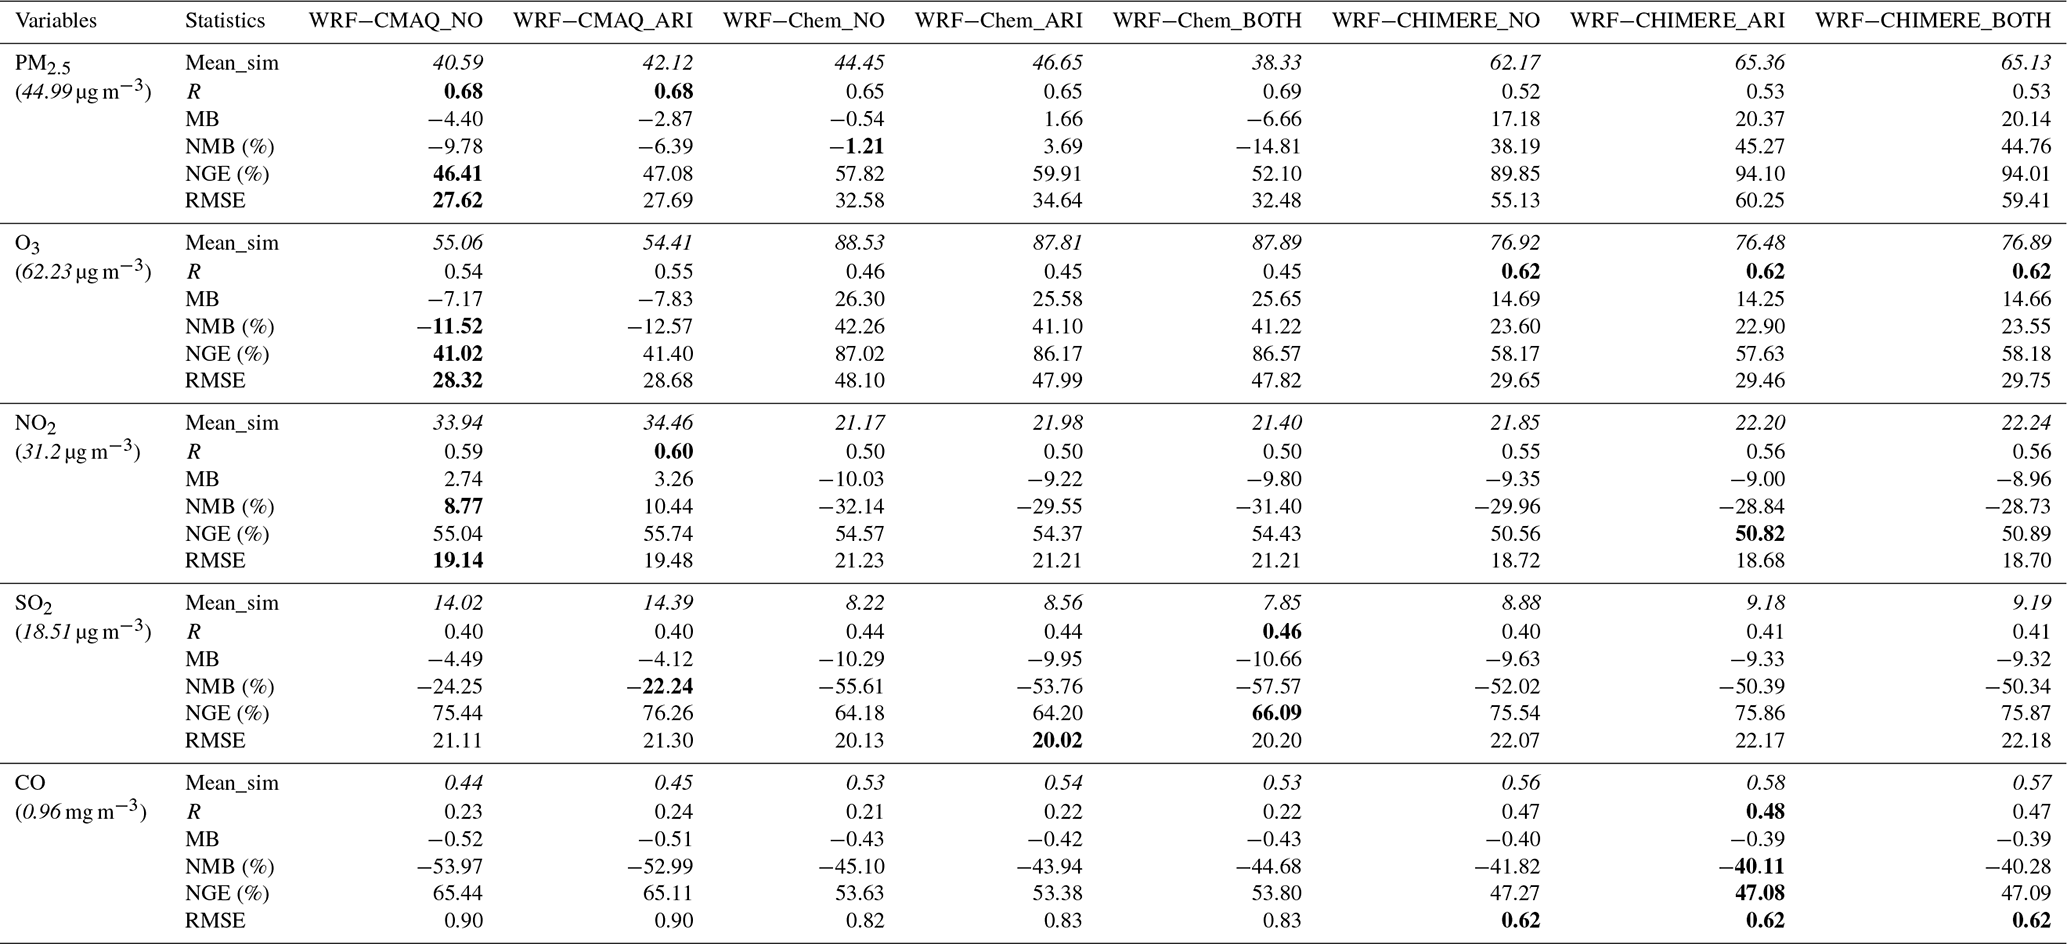
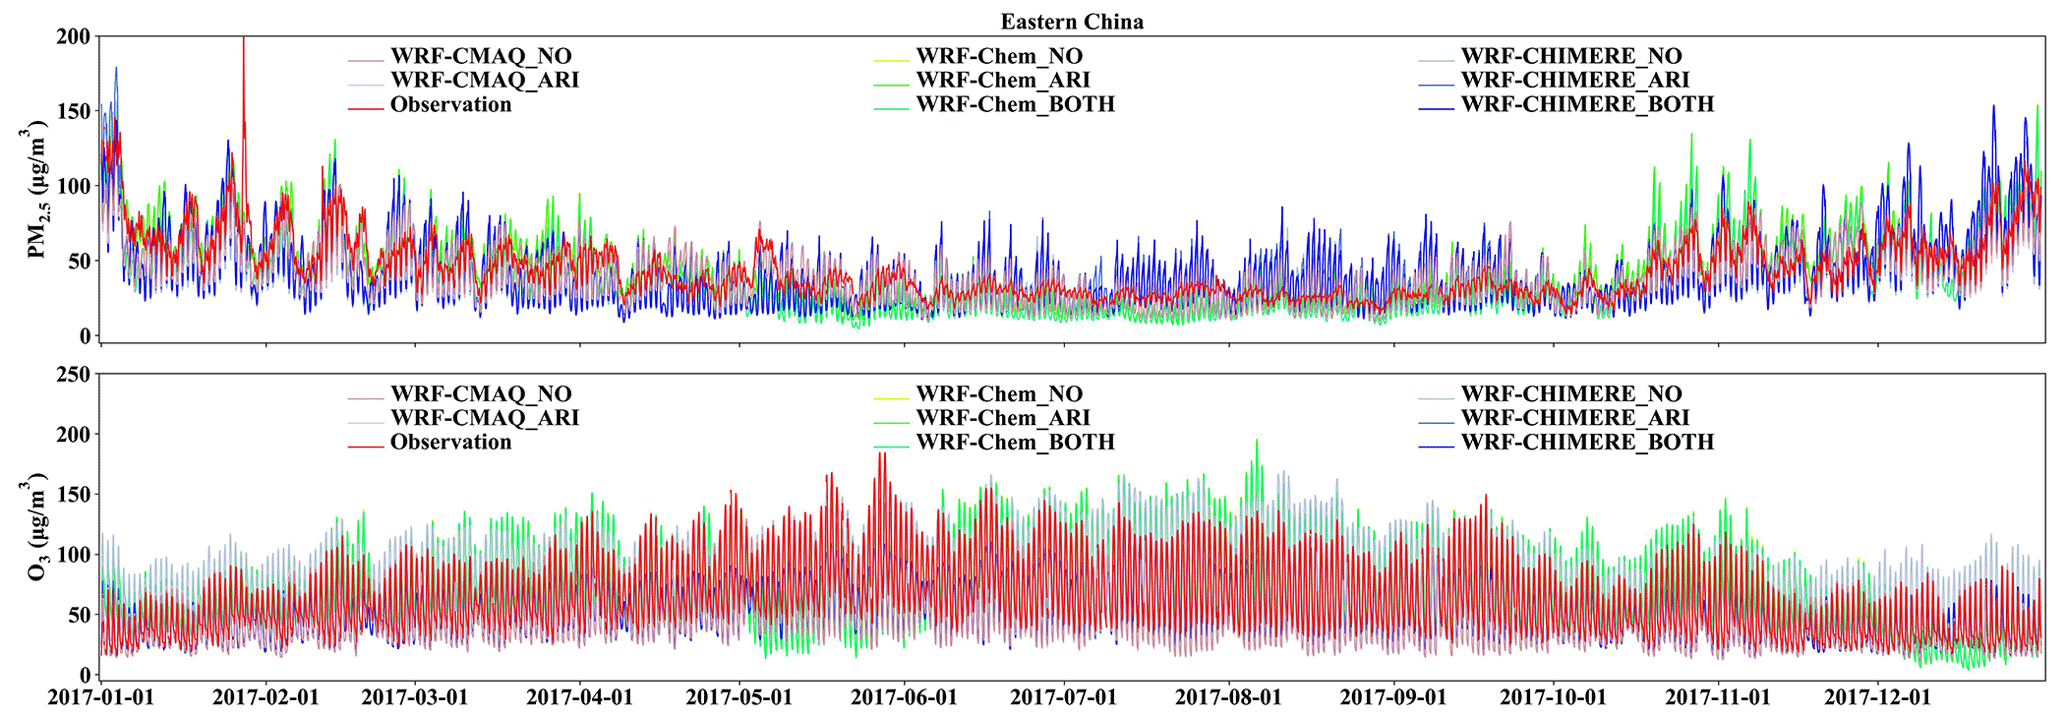
Figure 6Time series of the hourly PM2.5 and O3 concentrations over the ECR in 2017 simulated by WRF–CMAQ, WRF–Chem, and WRF–CHIMERE with/without aerosol feedbacks and the corresponding observed time series.
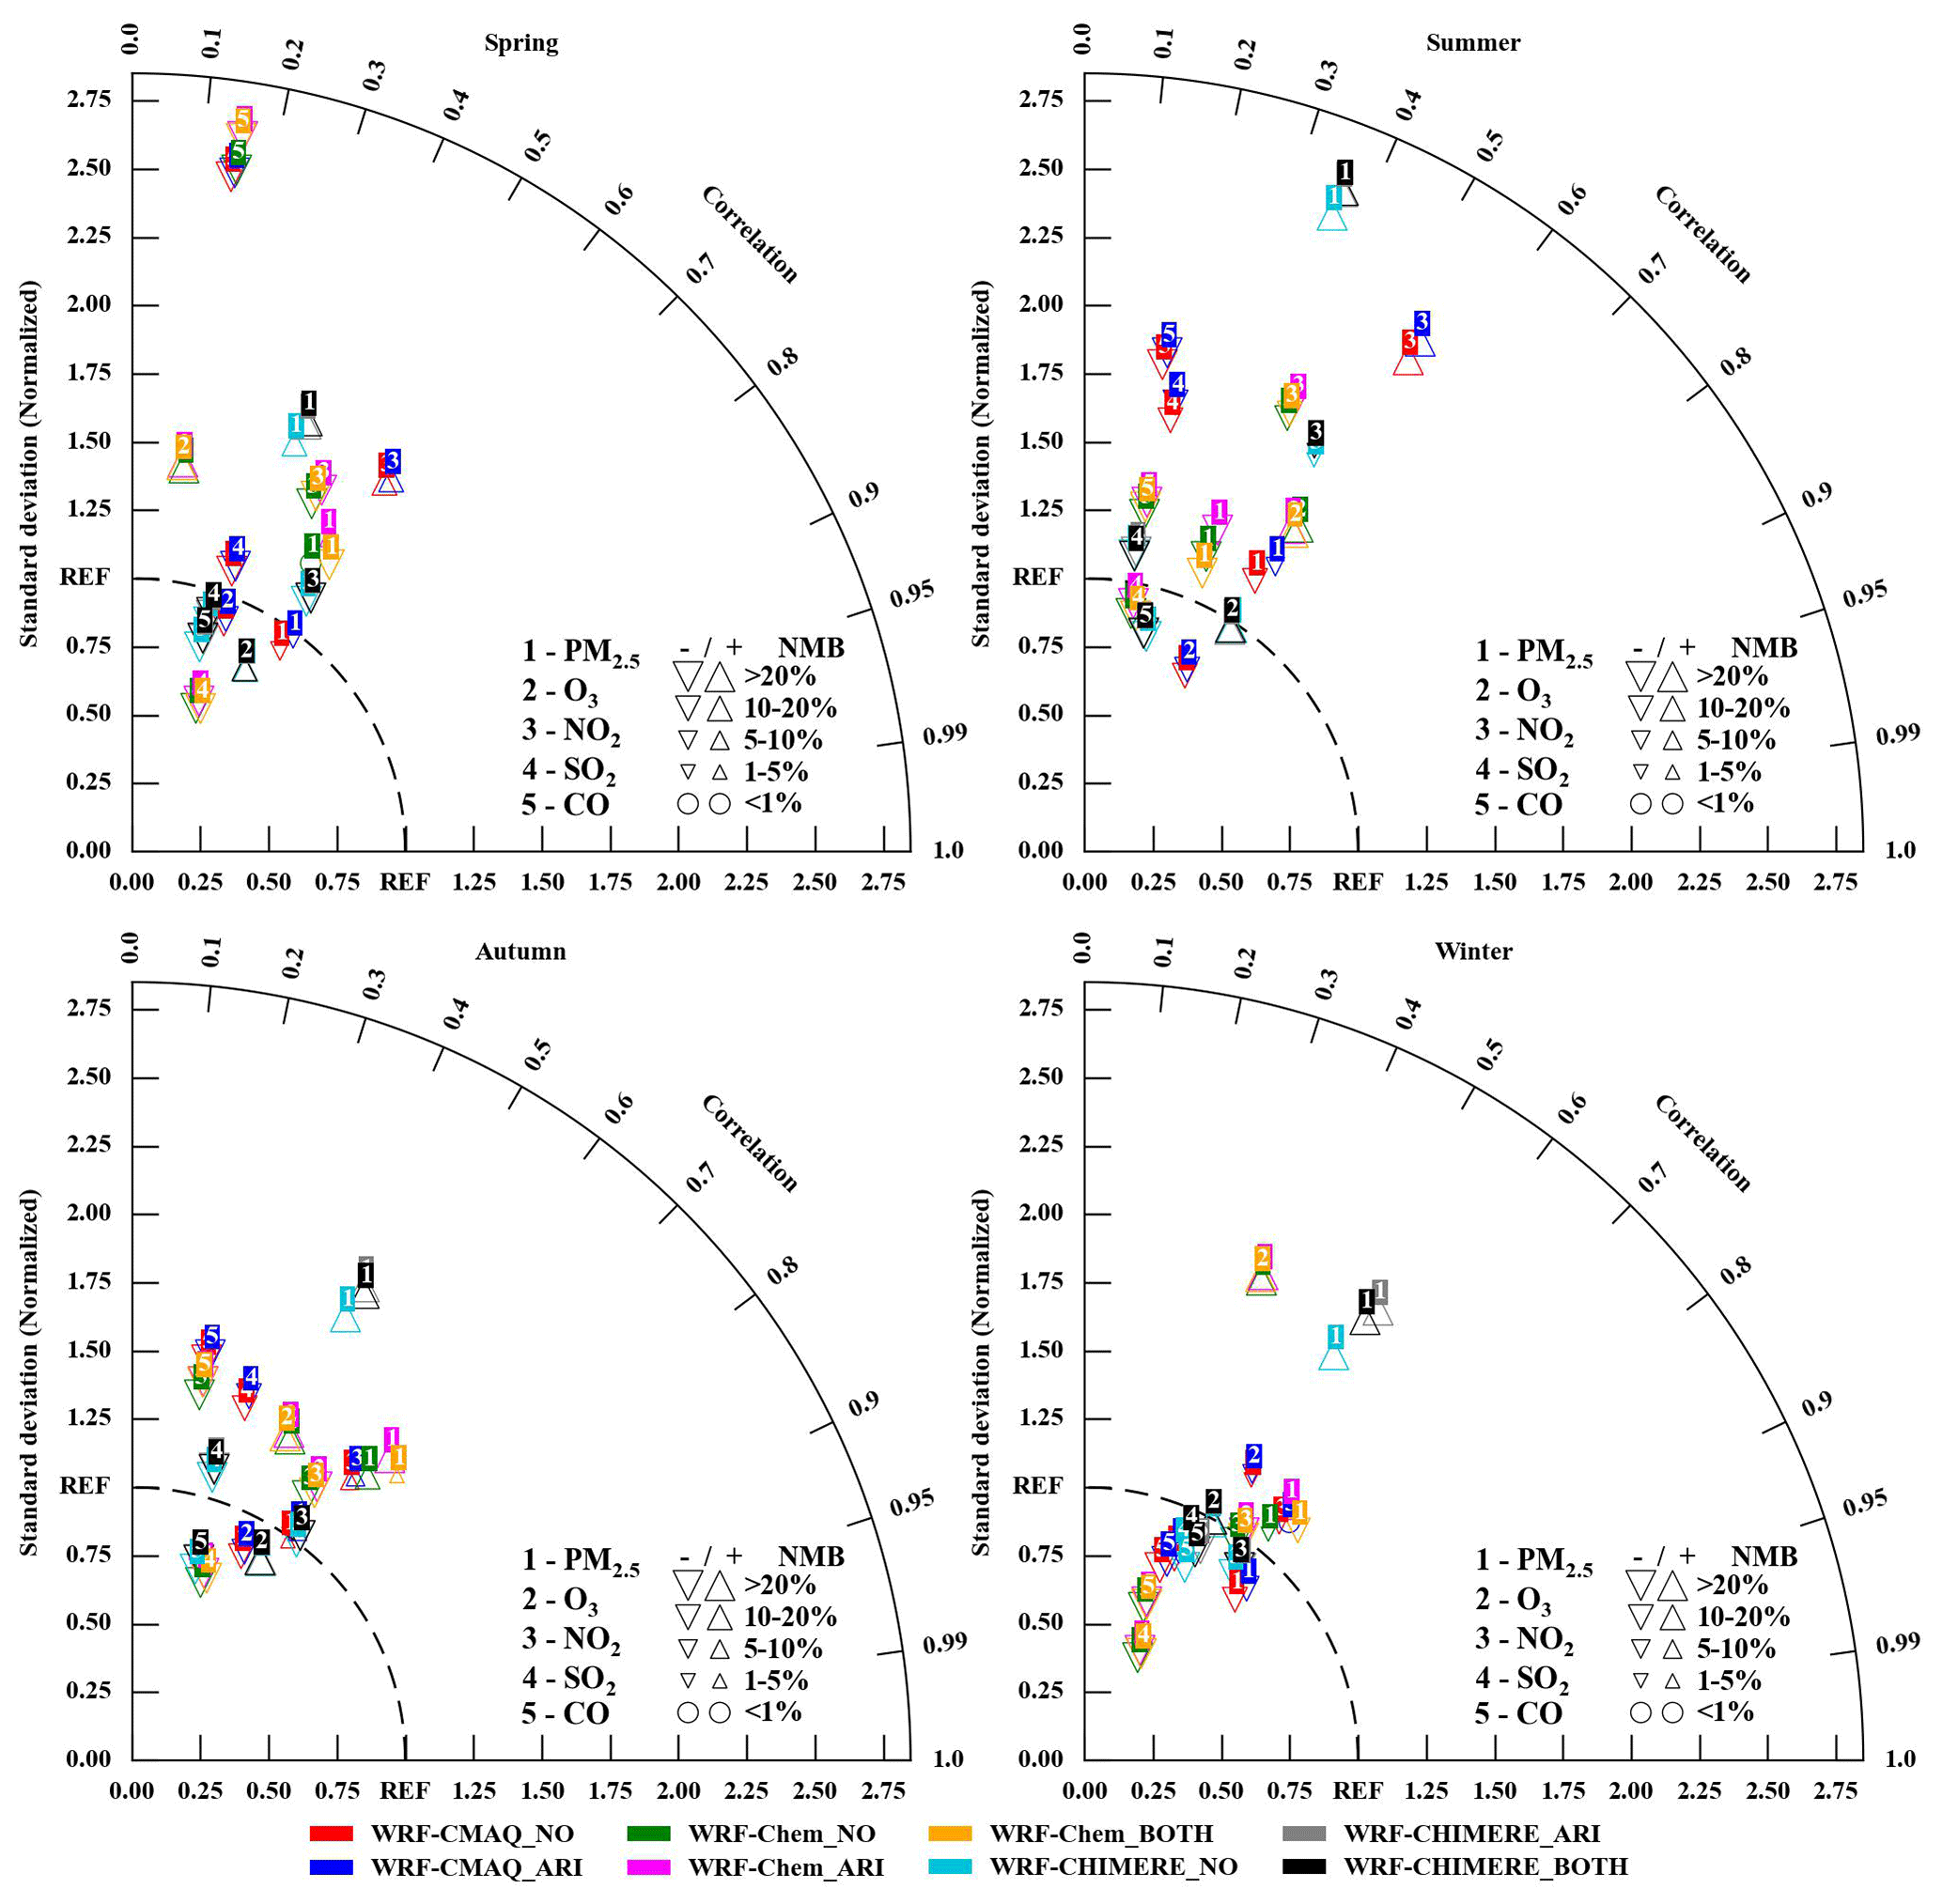
Figure 7Taylor diagrams (R, normalized standard deviation, and NMB) of the seasonal PM2.5, O3, NO2, SO2, and CO in the ECR simulated using the three two-way coupled models (WRF–CMAQ, WRF–Chem, and WRF–CHIMERE) with/without aerosol feedbacks compared with the surface observations.
Similar to the meteorological variables presented above, we conducted quality assurance for the statistical metrics via further comparisons with the PM2.5 and O3 results from previous model evaluations (Fig. S20). In this study, the performances of WRF–CMAQ and WRF–Chem in simulating PM2.5 were better than the average levels reported by the previous studies of the ECR. Regarding the simulation of the O3 level, WRF–Chem performed worse compared with the average level reported by the previous studies. Although the R values of O3 simulated by WRF–CMAQ in this study were lower than the average level reported in the previous studies, our RMSEs were smaller.
4.2 Satellite-borne observations
In this section, we further investigated the discrepancies among the different models regarding the calculated AOD and column concentrations of the gases (O3, NO2, SO2, CO, and NH3) and compared them with various satellite observations. As WRF–CHIMERE was not set to output simulated NH3 concentrations, the discussion here only includes the results from the WRF–CMAQ and WRF–Chem models.
Table 5Statistical metrics (R, MB, NMB, NGE, and RMSE) for the simulated AOD, TCO, tropospheric column NO2, PBL column SO2, total column CO, and total column density of NH3 in the ECR with respect to the corresponding satellite-retrieved data. The best results are shown in bold, and the annual mean simulations and observations are in italics.
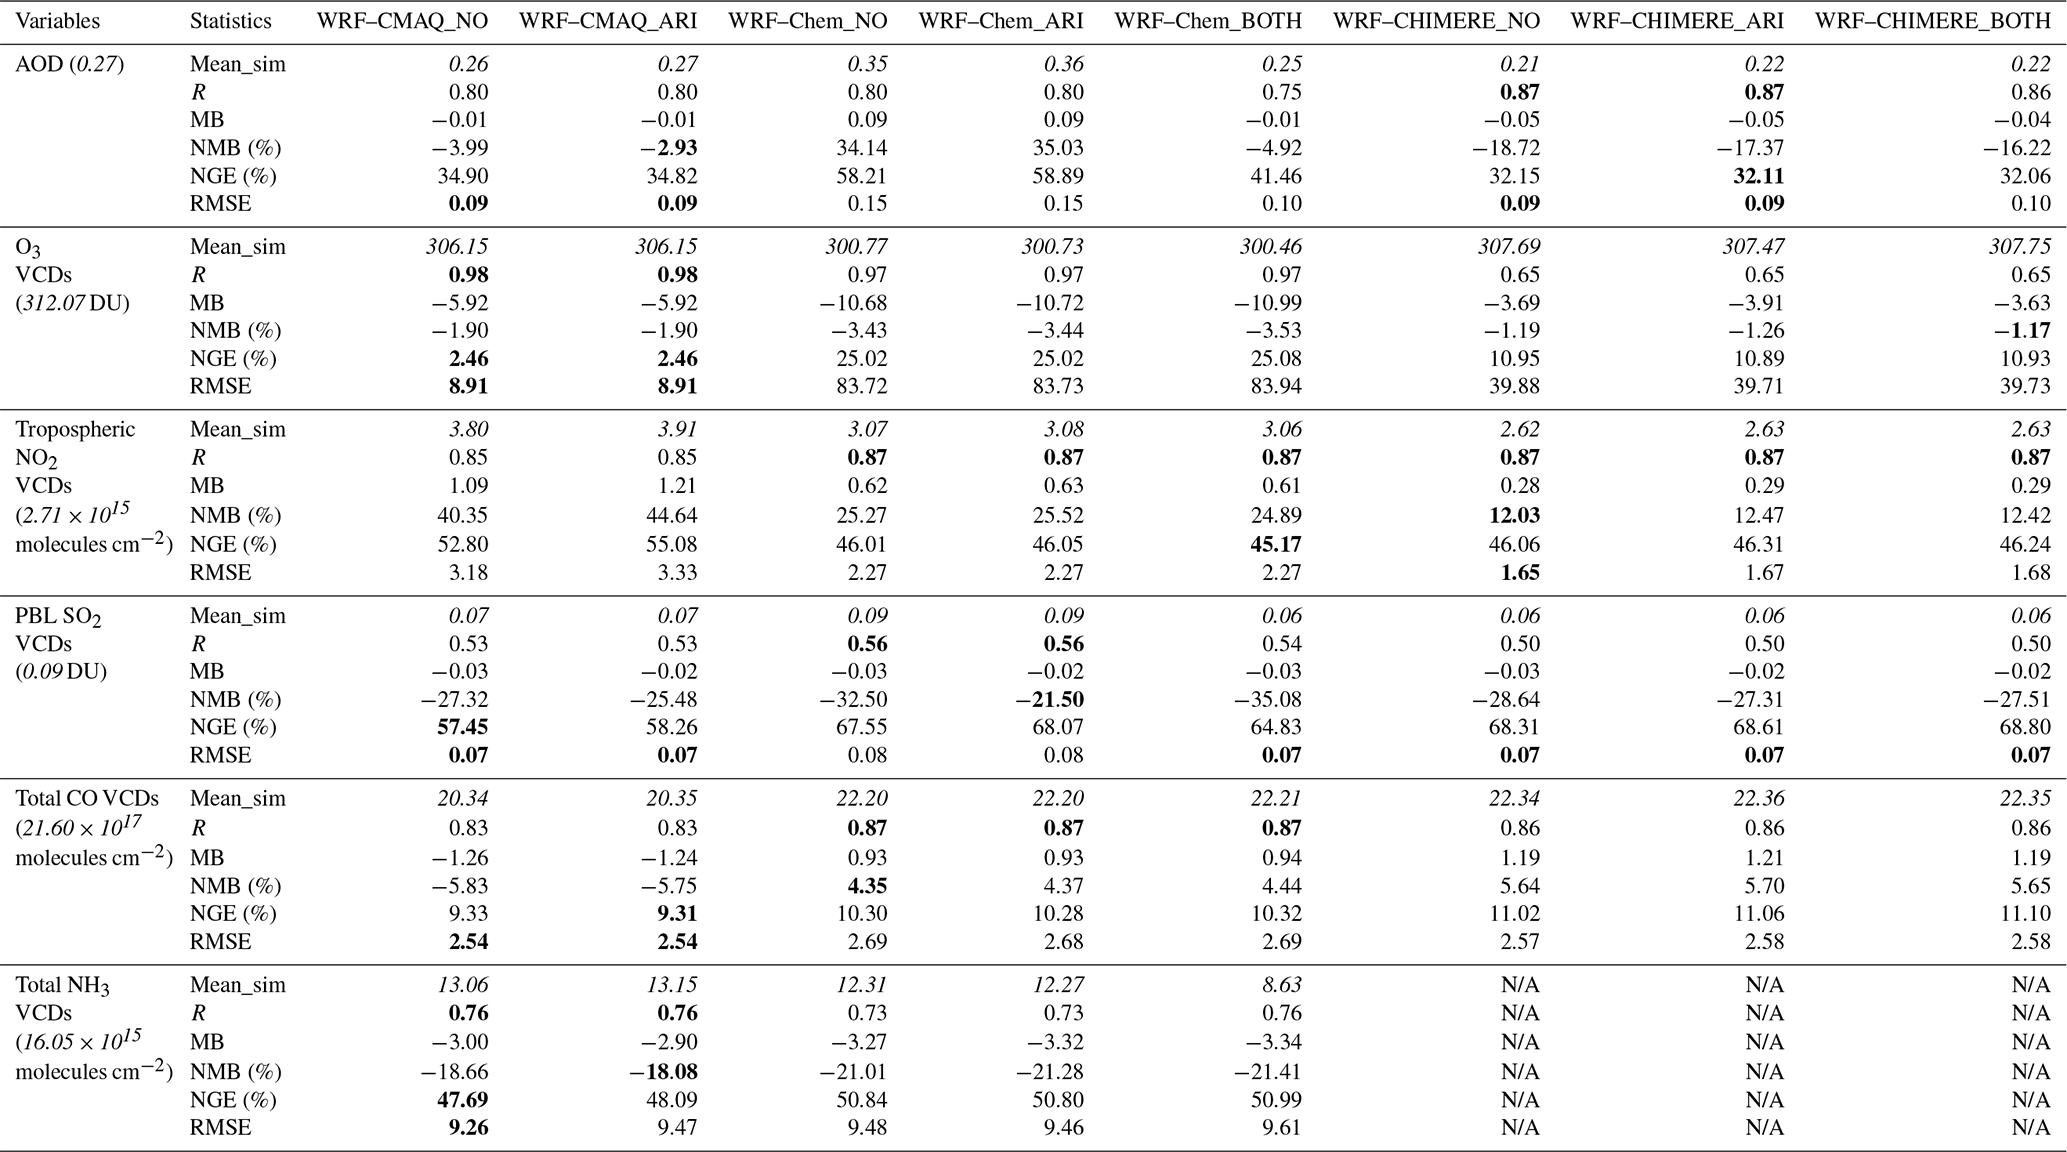
N/A indicates that the NH3 column concentrations were not extracted as output from the WRF–CHIMERE simulations with/without aerosol feedbacks.
Table 5 reveals that the annual AOD at 550 nm, TCO, NO2, and CO simulated by the three models agreed the most with the satellite observations, with R values of 0.80–0.98; these were followed by NH3 (0.75–0.76), and SO2 (0.50–0.53). WRF–CMAQ exhibited negative biases for the annual AOD (−0.01), TCO (−5.92 Dobson units (DU)), SO2 (−0.03 to −0.02 DU), CO (−1.25 × 10¹⁷ molecules cm−2), and NH3 (−2.95 × 10¹⁵ molecules cm−2). Conversely, it exhibited a positive bias for NO2 (1.09–1.21 petamolecules cm−2). Regarding AOD, WRF–Chem and WRF–CHIMERE produced positive (+0.09) and negative (−0.06) MBs. WRF–Chem and WRF–CHIMERE overestimated NO2 (0.28–0.63 petamolecules cm−2) and CO (0.93–1.21 × 10¹⁷ molecules cm−2) and underestimated O3 (−10.99 to −3.63 DU) and SO2 (−0.03 to −0.02 DU). Similar to WRF–CMAQ, WRF–Chem underestimated NH3 by approximately −3.14 × 10¹⁵ molecules cm−2.
Regarding the seasonal variations, we observed relatively high correlations (0.71–0.88) for AOD in autumn, with lower values (0.53–0.84) in the other seasons (Fig. 8). WRF–CMAQ and WRF–Chem tended to underestimate (MBs of −0.1 to −0.4) and overestimate (MBs of 0.01–0.05) AOD in summer and the other seasons, respectively. WRF–CHIMERE exhibited positive (0.03–0.04) and negative (−0.10 to −0.01) biases in winter and the other seasons, respectively. Regarding TCO (Fig. S24), the performances of the WRF–CMAQ and WRF–Chem models in spring and winter were slightly better than their performances in summer and autumn; however, the R values for all the seasons were above 0.89. WRF–CMAQ (−9.53 to −0.72 DU) and WRF–Chem (−24.62 to +10.57 DU) exhibited negative biases in all the seasons (except WRF–Chem in autumn). WRF–CHIMERE better captured TCO in spring and summer (overestimations of +9.19 to +29.20 DU) than in autumn and winter (underestimations of −33.75 to −19.40 DU). The R values of the NO2 columns for the three models were slightly higher in autumn and winter (0.82–0.91) than in spring and summer (0.76–0.84). WRF–CMAQ (−0.68 to −0.16 DU), WRF–Chem (−1.40 to −0.44 DU), and WRF–CHIMERE (−1.31 to −0.19 DU) generally underestimated the seasonal NO2 columns (Fig. S22). All the models overestimated the SO2 column concentrations in winter (by 0.01–0.03 DU) but underestimated them in the other seasons (−0.05 to −0.001 DU) (Fig. S23). Regarding NH3, the only primary alkaline gas in the atmosphere, the WRF–CMAQ and WRF–Chem models performed better in summer (R: 0.81–0.87; MB: −3.42 to 2.07 × 10¹⁵ molecules cm−2) (Fig. S25). The NH3 emissions from fertilizers and livestock have been substantially underestimated in China (Zhang et al., 2017), and the peak values were obtained in spring and summer (Huang et al., 2012). Additionally, bidirectional exchanges of fertilizer-induced NH3 were not considered in our simulations. Compared with the above column variables, WRF–CMAQ, WRF–Chem, and WRF–CHIMERE exhibited relatively poor performances (R: 0.68–0.79) in simulating the CO columns during spring, summer, and autumn, respectively, compared to their performances when simulating the CO columns in the other seasons (Fig. S24). WRF–CMAQ and WRF–CHIMERE underestimated and overestimated the CO columns in the other seasons, respectively, except for summer and spring, with MBs of −3.29 to 0.31 × 10¹⁷ and −0.62 to 2.09 × 10¹⁷ molecules cm−2, respectively. WRF–Chem obtained positive MBs in summer and autumn (4.03–5.12 × 10¹⁷ molecules cm−2) and negative ones in spring and winter (−3.15 to −2.10 × 10¹⁷ molecules cm−2).
Moreover, after comparing the performances of the models for each pollutant described in Sect. 4.1 and 4.2, the only disparity found between evaluations with ground-based observations and those with satellite-borne observations was for CO. The formation of CO via the oxidation of methane, an important source of CO emissions (Stein et al., 2014), was not considered in the three coupled models, and methane emissions were not included in the MEIC inventory. Furthermore, the contribution of CO to the atmospheric oxidation capacity (OH radicals) was nonnegligible; e.g., the values were approximately 20.54 %–38.97 % in Beijing (Liu et al., 2021) and 26 %–31 % in Shanghai (Zhu et al., 2020). In addition, these discrepancies in model performance when simulating AOD and column concentrations of gases can be explained by differences in the representations of the aerosol species groups, the Fast-JX photolysis scheme, and the gas-phase mechanisms in the three coupled models. More detailed interpretations were grouped into four aspects: (1) AODs are calculated via the Mie theory using the refractive indices of different numbers of aerosol species groups (5, 6, and 10) in different coupled models (WRF–CMAQ, WRF–Chem, and WRF–CHIMERE) (Tables S5–S6); (2) seven (294.6, 303.2, 310.0, 316.4, 333.1, 382.0, and 607.7 nm), four (300, 400, 600, and 999 nm), and five (200, 300, 400, 600, and 999 nm) effective wavelengths were used to calculate the actinic fluxes and photolysis rates in the Fast-JX photolysis modules of WRF–CMAQ, WRF–Chem, and WRF–CHIMERE, respectively; (3) there are different methods in the Fast-JX schemes of the three coupled models for calculating the aerosol and cloud optical properties (Tables S1 and S5–S6); and (4) 77, 52, and 40 gas-phase species comprised 218, 132, and 120 gas-phase reactions under the CB6, CBMZ, and MELCHIOR2 mechanisms, respectively.
When only ARI effects were enabled in the three models , relatively limited improvements were observed in the annual AOD and NO2 columns simulated by these models. The AOD simulations improved in spring and summer but worsened in autumn and winter (Table 4 and Fig. 9). Larger ARI-induced variations in the seasonal MBs of the NO2 columns were observed in WRF–CMAQ (−0.18 to 0.13 petamolecules cm−2) compared with WRF–Chem and WRF–CHIMERE (0–0.01 petamolecules cm−2). When both ARI and ACI effects were enabled in WRF–Chem, the model performance for seasonal AOD simulations worsened considerably. The annual and seasonal NO2 simulations by WRF–Chem became slightly worse, whereas those by WRF–CHIMERE became slightly better. Unlike the AOD and the NO2 column concentrations, the improvements in the annual and seasonal column simulations of total ozone, PBL SO2, and NH3 by all the two-way coupled models were limited when one or both of ARI and ACI were enabled.
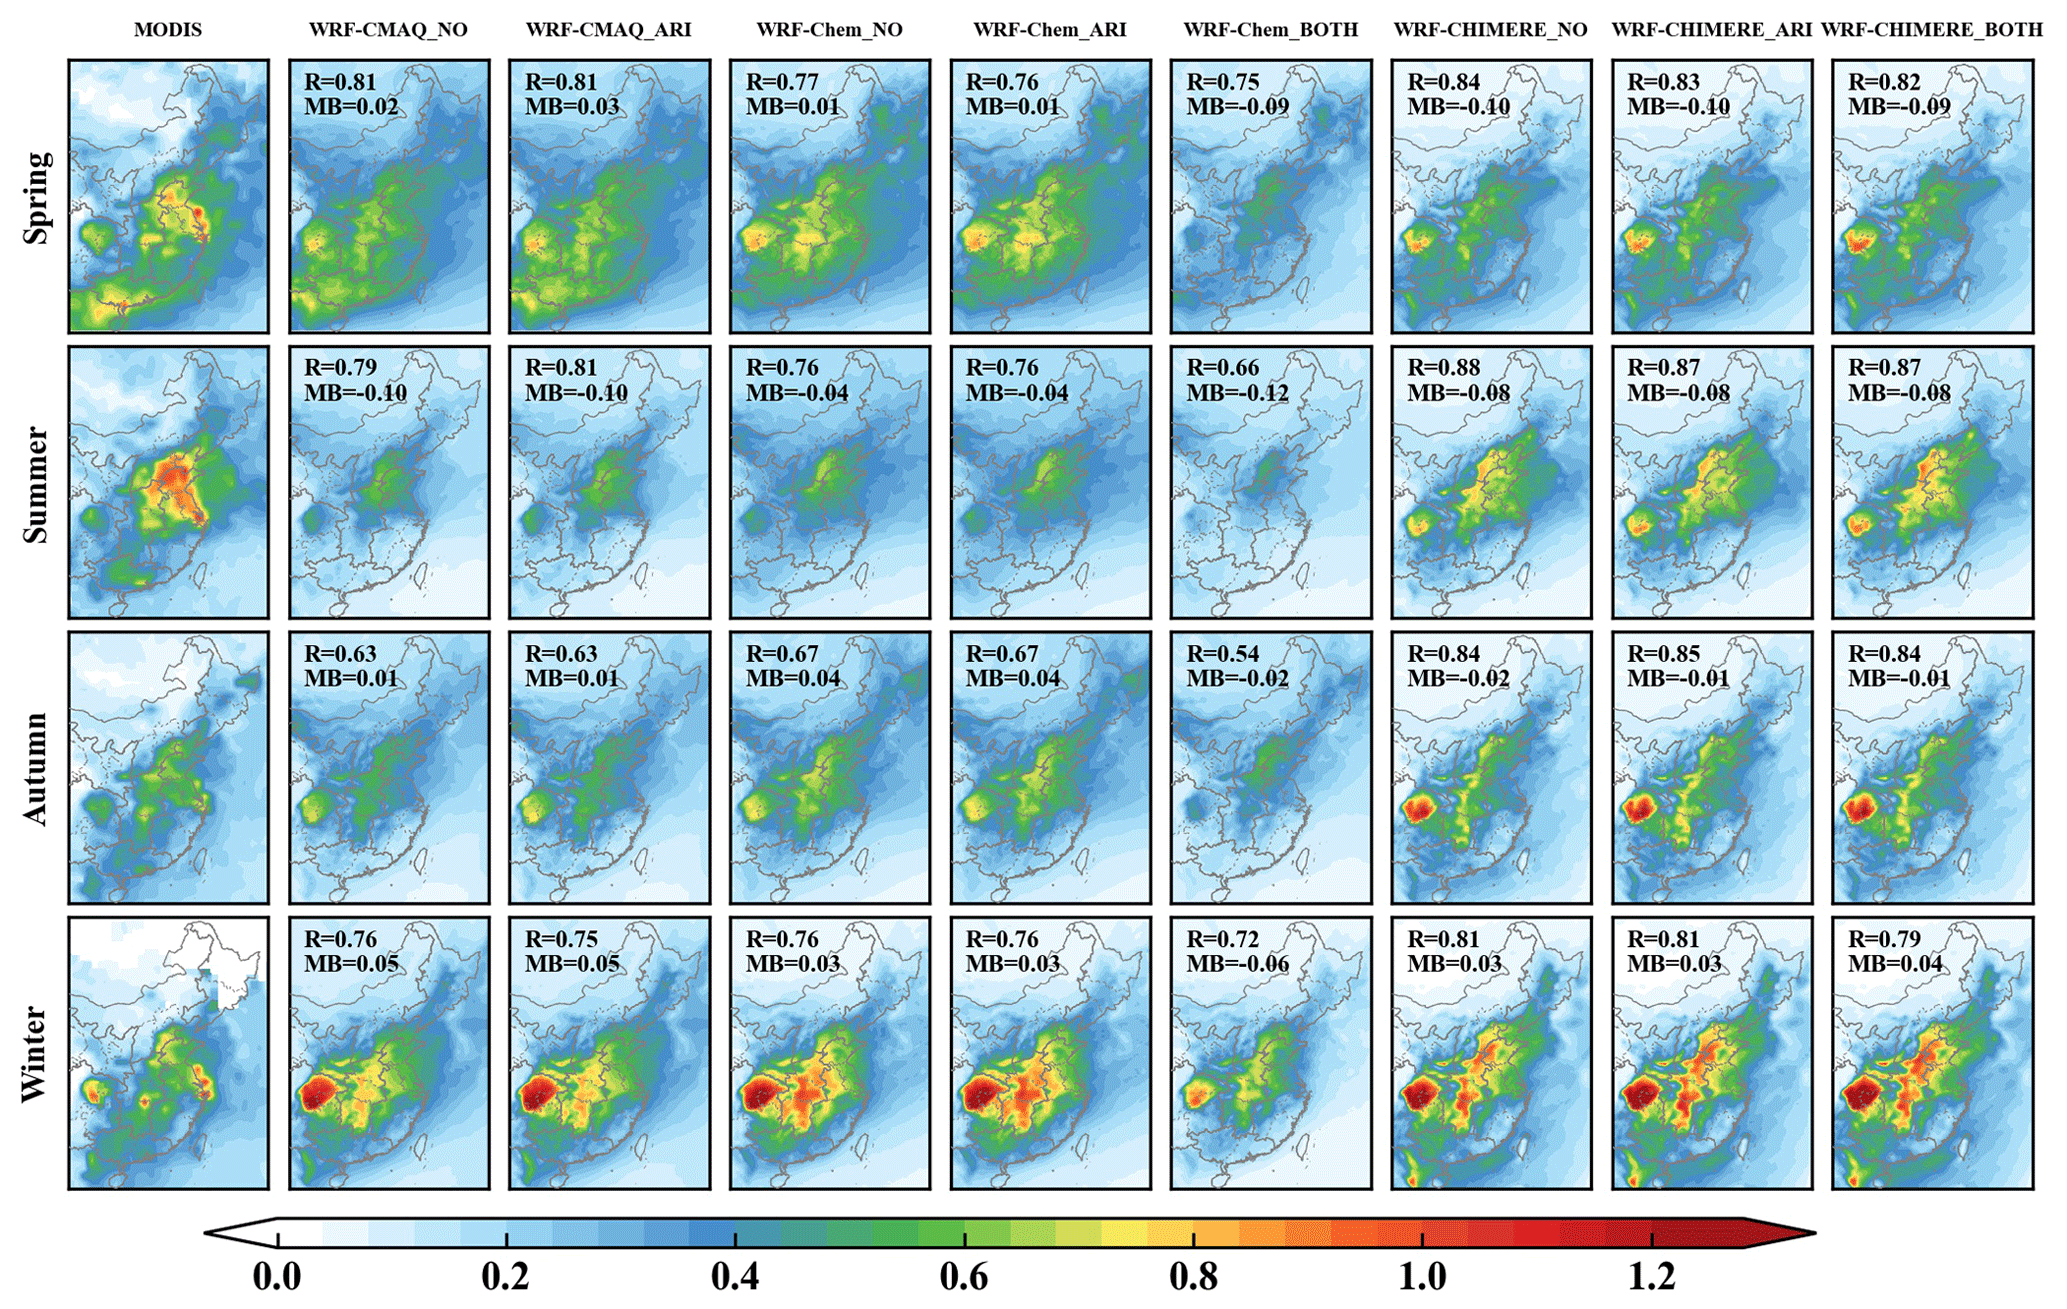
Figure 8Spatial distributions of seasonal AOD in the ECR from MODIS observations and simulations using the WRF–CMAQ, WRF–Chem, and WRF–CHIMERE models with and without aerosol feedbacks.
4.3 Computational performance
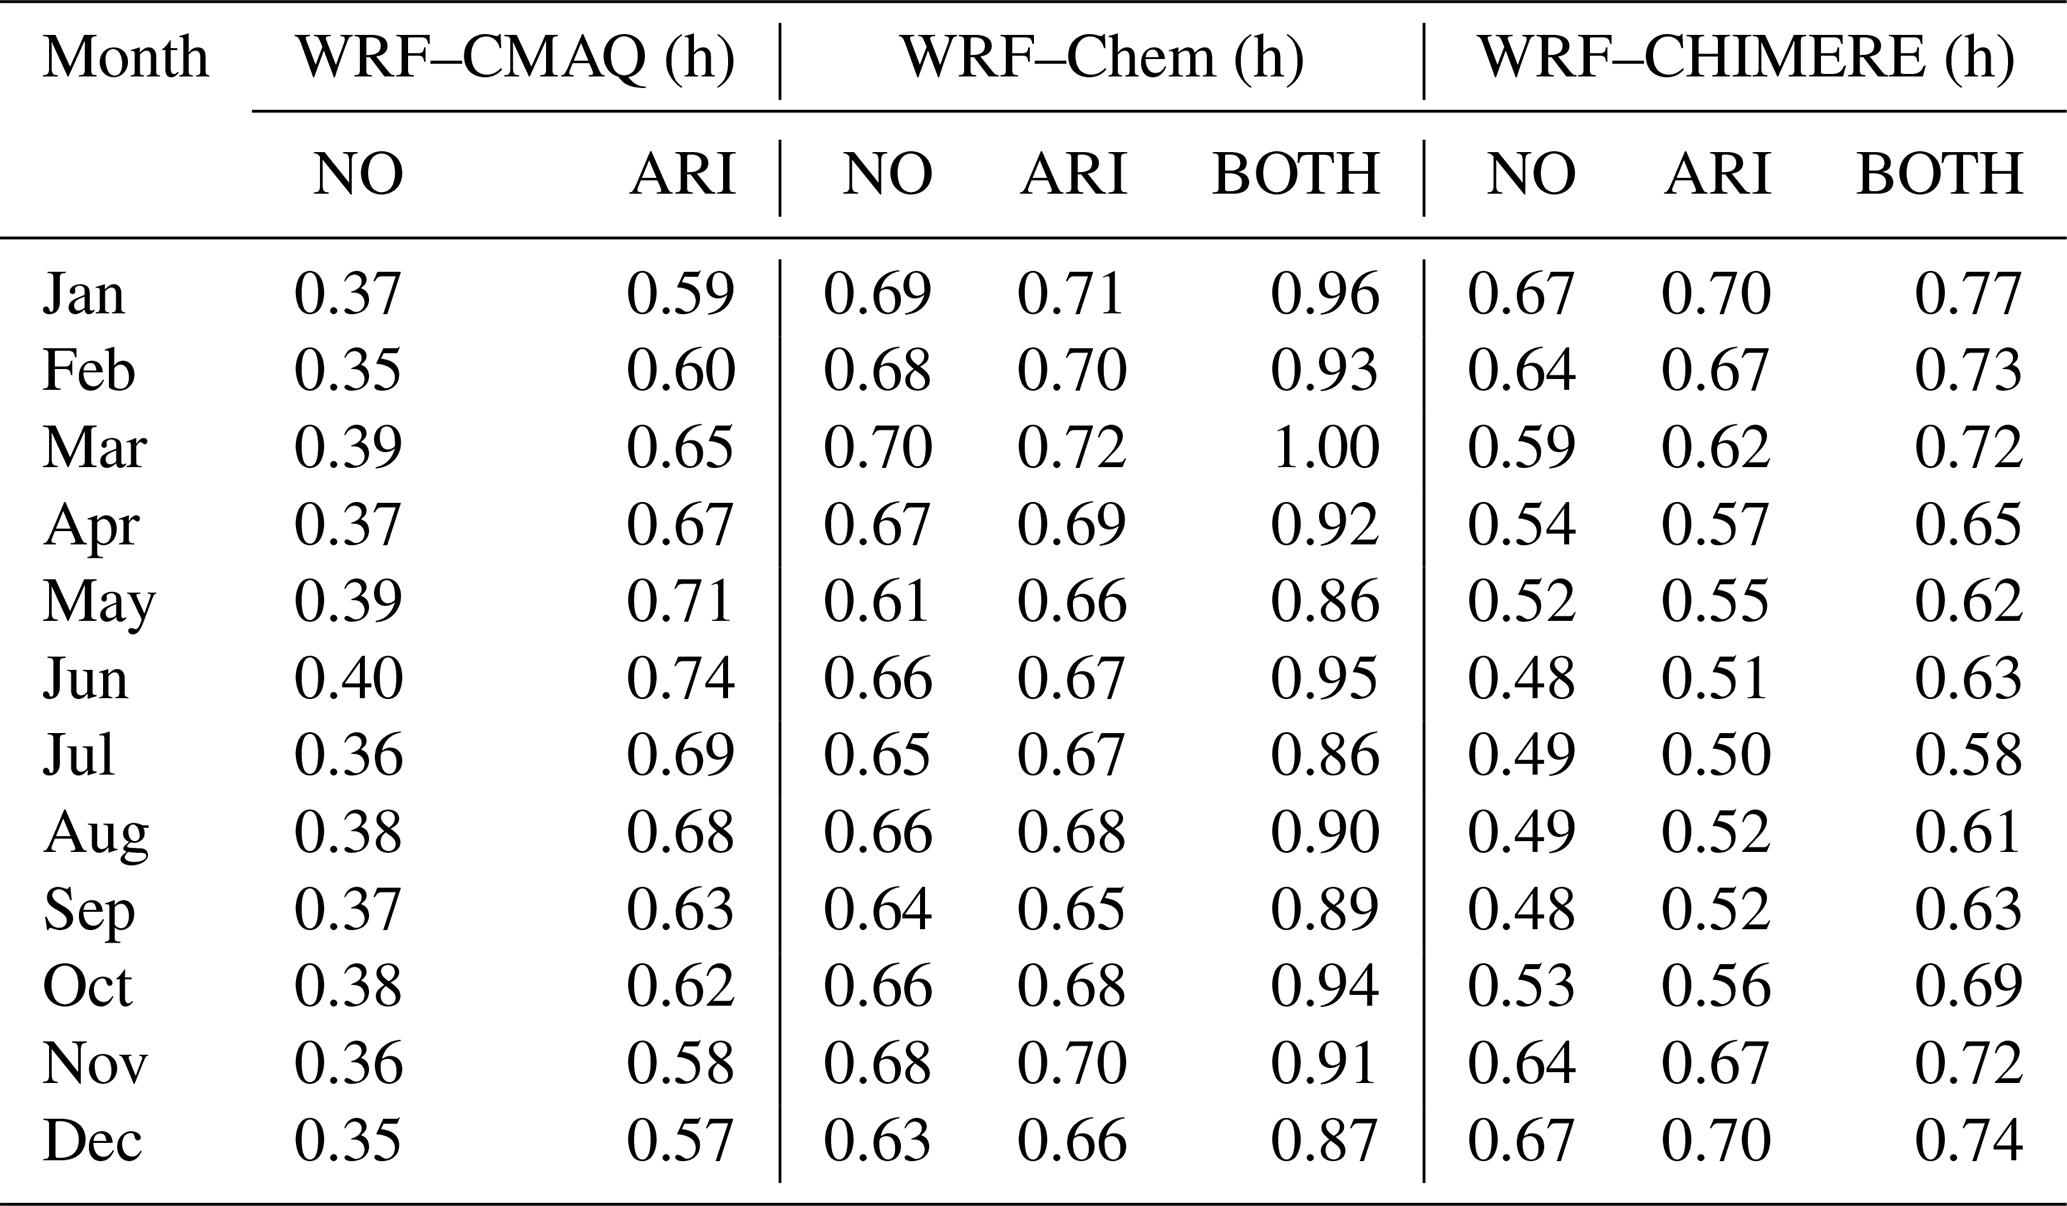
Table 6 presents a summary of the comparative results for the time consumption by the central processing unit (CPU) per simulation day when using WRF–CMAQ, WRF–Chem, and WRF–CHIMERE with and without aerosol feedbacks in 2017. The results indicated that WRF–CMAQ consumed the shortest CPU time when simulating the 1-day meteorology and air quality with or without aerosol feedbacks enabled, followed by WRF–CHIMERE and WRF–Chem. Compared with the simulations without aerosol feedbacks, the processing time of WRF–CMAQ with ARI enabled increased by 0.22–0.34 h d−1. The increases in the running times of WRF–Chem and WRF–CHIMERE were insignificant (0.02–0.03 h d−1). The CPU times for WRF–Chem and WRF–CHIMERE increased slightly when ARI and ACI effects were enabled, and the increase in the CPU time for WRF–Chem (0.25 h d−1) was higher than that for WRF–CHIMERE (0.11 h d−1). Compared with WRF–CMAQ and WRF–Chem, the CPU time consumed by WRF–CHIMERE exhibited clear seasonal differences, with the CPU times in winter and spring being significantly longer than those in summer and autumn. These differences can be partially explained by the choice of main configurations, including the model resolution, model version, and parameterization schemes (cloud microphysics, PBL, cumulus, surface layer, land surface, gas-phase chemistry, and aerosol mechanisms).
Table 6Summary of the running times for the different coupled models.
Two-way coupled meteorology and air-quality models have been deployed for the ECR in recent years. However, no study has comprehensively assessed multiple coupled models of this region. To the best of our knowledge, this is the first study to perform comprehensive intercomparisons of the open-source two-way coupled meteorology and air-quality models WRF–CMAQ, WRF–Chem, and WRF–CHIMERE. We have systemically evaluated the hindcast simulations for 2017 and explored the impacts of ARI and/or ACI on the model performance and computational efficiency for the ECR.
After performing detailed comparisons with ground-based and satellite-borne observations, the evaluation results revealed that the three coupled models performed well for meteorology and air quality, particularly for surface temperature (with an R value of up to 0.97) and PM2.5 concentrations (with an R value of up to 0.68). The effects of aerosol feedbacks on the model performance varied with the two-way coupled model, variable, and timescale. The computational time increased by 20 %–70 % when these two-way coupled models enabled aerosol feedbacks compared with when the simulations proceeded without aerosol–radiation–cloud interactions. Notably, the three coupled models effectively reproduced the spatiotemporal distributions of the satellite-retrieved CO column concentrations but not those for ground-observed CO concentrations.
The intercomparisons revealed some uncertainty sources in the evaluation of the aerosol feedback effects. As numerous schemes can be combined with the configurations of different coupled models, we only evaluated the simulations with specific settings. Future comparisons considering more combinations of multiple schemes within the same or different coupled models are desired. Among the three coupled models, the numerical representations of specific variables in the same scheme (e.g., the treatments of cloud cover and cloud optical properties in the Fast-JX photolysis scheme) are diverse. More accurate representations of photolysis processes must be considered to reduce evaluation uncertainties. Additionally, the FDDA nudging technique can attenuate ARI effects during severe air pollution episodes, and the optimal nudging coefficients for different regions must be determined. Finally, the actual mechanisms underlying ACI effects are still unclear, and new advances in the measurement and parameterization of CCN/IN activations and PREC must be duly incorporated in coupled models.
The source codes of the two-way coupled WRF v4.1.1–CMAQ v5.3.1, WRF–Chem v4.1.1, and WRF v3.7.1–CHIMERE v2020r1 models are obtained from https://github.com/USEPA/CMAQ, https://github.com/wrf-model/WRF, and https://www.lmd.polytechnique.fr/chimere, respectively (last access: 20 November 2020). The related source codes, configuration information, namelist files and automated run scripts of these three two-way coupled models are archived at Zenodo with the following associated DOI: https://doi.org/10.5281/zenodo.7901682 (Gao et al., 2023a; link: https://zenodo.org/record/7901682, last access: 5 May 2023).
The meteorological ICs and BCs used for the three coupled models can be obtained at https://doi.org/10.5281/zenodo.7925012 (Gao et al., 2023b). The Chemical ICs and BCs used for WRF–CMAQ, WRF–Chem, and WRF–CHIMERE are available at https://doi.org/10.5281/zenodo.7932390 (Gao et al., 2023c), https://doi.org/10.5281/zenodo.7932936 (Gao et al., 2023d), and https://doi.org/10.5281/zenodo.7933641 (Gao et al., 2023e), respectively. The emission data used for WRF–CMAQ, WRF–Chem, and WRF–CHIMERE can be downloaded from https://doi.org/10.5281/zenodo.7932430 (Gao et al., 2023f), https://doi.org/10.5281/zenodo.7932734 (Gao et al., 2023g), and https://doi.org/10.5281/zenodo.7931614 (Gao et al., 2023h), respectively. The DOIs and links regarding the output data of each simulation scenario are presented in Table S9. All data used to create figures and tables in this study are provided in an open repository on Zenodo (https://doi.org/10.5281/zenodo.7750907, Gao et al., 2023i).
The supplement related to this article is available online at: https://doi.org/10.5194/gmd-17-2471-2024-supplement.
CG, XZ, and AX performed the majority of the source code configuration of WRF–CMAQ, WRF–Chem, and WRF–CHIMERE. CG designed the numerical simulations to carry them out, performed the related analysis, plotted the figures, and wrote the paper. QT, HZ, SZ, GY, MZ and SX were involved with the original research plan and made suggestions about the writing of the paper.
The contact author has declared that none of the authors has any competing interests.
Publisher’s note: Copernicus Publications remains neutral with regard to jurisdictional claims made in the text, published maps, institutional affiliations, or any other geographical representation in this paper. While Copernicus Publications makes every effort to include appropriate place names, the final responsibility lies with the authors.
The authors are very grateful to David Wong, Chun Zhao, and Laurent Menut, who provided detailed information on the two-way coupled WRF–CMAQ, WRF–Chem, and WRF–CHIMERE models, respectively.
This study was financially sponsored by the National Natural Science Foundation of China (grant nos. 42305171, 42371154 and 42171142), the Youth Innovation Promotion Association of the Chinese Academy of Sciences, China (grant no. 2022230), the National Key Research and Development Program of China (grant nos. 2017YFC0212304 and 2019YFE0194500), the Talent Program of Chinese Academy of Sciences (grant no. Y8H1021001), and the Natural Science Foundation of Jilin Province (grant no. YDZJ202201ZYTS476).
This paper was edited by Xiaohong Liu and reviewed by two anonymous referees.
Abdul-Razzak, H. and Ghan, S. J.: A parameterization of aerosol activation 3. Sectional representation, J. Geophys. Res.-Atmos., 107, AAC 1-1–AAC 1-6, https://doi.org/10.1029/2001JD000483, 2002.
Alapaty, K., Herwehe, J. A., Otte, T. L., Nolte, C. G., Bullock, O. R., Mallard, M. S., Kain, J. S., and Dudhia, J.: Introducing subgrid-scale cloud feedbacks to radiation for regional meteorological and climate modeling, Geophys. Res. Lett., 39, L24809, https://doi.org/10.1029/2012GL054031, 2012.
Archer-Nicholls, S., Lowe, D., Utembe, S., Allan, J., Zaveri, R. A., Fast, J. D., Hodnebrog, Ø., Denier van der Gon, H., and McFiggans, G.: Gaseous chemistry and aerosol mechanism developments for version 3.5.1 of the online regional model, WRF-Chem, Geosci. Model Dev., 7, 2557–2579, https://doi.org/10.5194/gmd-7-2557-2014, 2014.
Baklanov, A., Schlünzen, K., Suppan, P., Baldasano, J., Brunner, D., Aksoyoglu, S., Carmichael, G., Douros, J., Flemming, J., Forkel, R., Galmarini, S., Gauss, M., Grell, G., Hirtl, M., Joffre, S., Jorba, O., Kaas, E., Kaasik, M., Kallos, G., Kong, X., Korsholm, U., Kurganskiy, A., Kushta, J., Lohmann, U., Mahura, A., Manders-Groot, A., Maurizi, A., Moussiopoulos, N., Rao, S. T., Savage, N., Seigneur, C., Sokhi, R. S., Solazzo, E., Solomos, S., Sørensen, B., Tsegas, G., Vignati, E., Vogel, B., and Zhang, Y.: Online coupled regional meteorology chemistry models in Europe: current status and prospects, Atmos. Chem. Phys., 14, 317–398, https://doi.org/10.5194/acp-14-317-2014, 2014.
Binkowski, F. S. and Roselle, S. J.: Models‐3 Community Multiscale Air Quality (CMAQ) model aerosol component 1. Model description, J. Geophys. Res.-Atmos., 108, https://doi.org/10.1029/2001JD001409, 2003.
Briant, R., Tuccella, P., Deroubaix, A., Khvorostyanov, D., Menut, L., Mailler, S., and Turquety, S.: Aerosol–radiation interaction modelling using online coupling between the WRF 3.7.1 meteorological model and the CHIMERE 2016 chemistry-transport model, through the OASIS3-MCT coupler, Geosci. Model Dev., 10, 927–944, https://doi.org/10.5194/gmd-10-927-2017, 2017.
Brunner, D., Savage, N., Jorba, O., Eder, B., Giordano, L., Badia, A., Balzarini, A., Baro, R., Bianconi, R., and Chemel, C.: Comparative analysis of meteorological performance of coupled chemistry-meteorology models in the context of AQMEII phase 2, Atmos. Environ., 115, 470–498, https://doi.org/10.1016/j.atmosenv.2014.12.032, 2015.
Campbell, P., Zhang, Y., Wang, K., Leung, R., Fan, J., Zheng, B., Zhang, Q., and He, K.: Evaluation of a multi-scale WRF-CAM5 simulation during the 2010 East Asian Summer Monsoon, Atmos. Environ., 169, 204–217, https://doi.org/10.1016/j.atmosenv.2017.09.008, 2017.
Carslaw, K. S., Boucher, O., Spracklen, D. V., Mann, G. W., Rae, J. G. L., Woodward, S., and Kulmala, M.: A review of natural aerosol interactions and feedbacks within the Earth system, Atmos. Chem. Phys., 10, 1701–1737, https://doi.org/10.5194/acp-10-1701-2010, 2010.
Chapman, E. G., Gustafson Jr., W. I., Easter, R. C., Barnard, J. C., Ghan, S. J., Pekour, M. S., and Fast, J. D.: Coupling aerosol-cloud-radiative processes in the WRF-Chem model: Investigating the radiative impact of elevated point sources, Atmos. Chem. Phys., 9, 945–964, https://doi.org/10.5194/acp-9-945-2009, 2009.
Chen, L., Gao, Y., Zhang, M., Fu, J. S., Zhu, J., Liao, H., Li, J., Huang, K., Ge, B., Wang, X., Lam, Y. F., Lin, C.-Y., Itahashi, S., Nagashima, T., Kajino, M., Yamaji, K., Wang, Z., and Kurokawa, J.: MICS-Asia III: multi-model comparison and evaluation of aerosol over East Asia, Atmos. Chem. Phys., 19, 11911–11937, https://doi.org/10.5194/acp-19-11911-2019, 2019.
Ding, Q., Sun, J., Huang, X., Ding, A., Zou, J., Yang, X., and Fu, C.: Impacts of black carbon on the formation of advection–radiation fog during a haze pollution episode in eastern China, Atmos. Chem. Phys., 19, 7759–7774, https://doi.org/10.5194/acp-19-7759-2019, 2019.
Dionne, J., von Salzen, K., Cole, J., Mahmood, R., Leaitch, W. R., Lesins, G., Folkins, I., and Chang, R. Y.-W.: Modelling the relationship between liquid water content and cloud droplet number concentration observed in low clouds in the summer Arctic and its radiative effects, Atmos. Chem. Phys., 20, 29–43, https://doi.org/10.5194/acp-20-29-2020, 2020.
Fan, J., Wang, Y., Rosenfeld, D., and Liu, X.: Review of aerosol-cloud interactions: Mechanisms, significance, and challenges, J. Atmos. Sci., 73, 4221–4252, https://doi.org/10.1175/JAS-D-16-0037.1, 2016.
Feng, X., Lin, H., Fu, T.-M., Sulprizio, M. P., Zhuang, J., Jacob, D. J., Tian, H., Ma, Y., Zhang, L., Wang, X., Chen, Q., and Han, Z.: WRF-GC (v2.0): online two-way coupling of WRF (v3.9.1.1) and GEOS-Chem (v12.7.2) for modeling regional atmospheric chemistry–meteorology interactions, Geosci. Model Dev., 14, 3741–3768, https://doi.org/10.5194/gmd-14-3741-2021, 2021.
Forkel, R., Werhahn, J., Hansen, A. B., McKeen, S., Peckham, S., Grell, G., and Suppan, P.: Effect of aerosol-radiation feedback on regional air quality – A case study with WRF/Chem, Atmos. Environ., 53, 202–211, https://doi.org/10.1016/j.atmosenv.2011.10.009,
Gao, C., Zhang, X., Xiu, A., Huang, L., Zhao, H., Wang, K., and Tong, Q.: Spatiotemporal distribution of biogenic volatile organic compounds emissions in China, Acta Sci. Circumstantiae, 39, 4140–4151, https://doi.org/10.13671/j.hjkxxb.2019.0243, 2019.
Gao, C., Xiu, A., Zhang, X., Tong, Q., Zhao, H., Zhang, S., Yang, G., and Zhang, M.: Two-way coupled meteorology and air quality models in Asia: a systematic review and meta-analysis of impacts of aerosol feedbacks on meteorology and air quality, Atmos. Chem. Phys., 22, 5265–5329, https://doi.org/10.5194/acp-22-5265-2022, 2022a.
Gao, C., Xiu, A., and Zhang, X.: Oservational data for sfdda nudging analysis in WRF model over China during 2017, Zenodo [data set], https://doi.org/10.5281/zenodo.6975602, 2022b.
Gao, C., Xiu, A., Zhang, X., Tong, Q., Zhao, H., Zhang, S., Yang, G., Zhang, M., and Xie, S.: Source codes of WRF v4.1.1-CMAQ v5.3.1, WRF-Chem v4.1.1 and WRF v3.7.1-CHIMERE v2020r1, Zenodo [software], https://doi.org/10.5281/zenodo.7901682, 2023a.
Gao, C., Xiu, A., Zhang, X., Tong, Q., Zhao, H., Zhang, S., Yang, G., Zhang, M., and Xie, S.: FNL data used for producing meteorological ICs/BCs of WRF v4.1.1-CMAQ v5.3.1, WRF-Chem v4.1.1 and WRF v3.7.1-CHIMERE v2020r1, Zenodo [data set], https://doi.org/10.5281/zenodo.7925012, 2023b.
Gao, C., Xiu, A., Zhang, X., Tong, Q., Zhao, H., Zhang, S., Yang, G., Zhang, M., and Xie, S.: Chemical initial and boundary conditions for WRF-CMAQ, Zenodo [data set], https://doi.org/10.5281/zenodo.7932390, 2023c.
Gao, C., Xiu, A., Zhang, X., Tong, Q., Zhao, H., Zhang, S., Yang, G., Zhang, M., and Xie, S.: Chemical initial and boundary conditions for WRF-Chem, Zenodo [data set], https://doi.org/10.5281/zenodo.7932936, 2023d.
Gao, C., Xiu, A., Zhang, X., Tong, Q., Zhao, H., Zhang, S., Yang, G., Zhang, M., and Xie, S.: Chemical initial and boundary conditions for WRF-CHIMERE, Zenodo [data set], https://doi.org/10.5281/zenodo.7933641, 2023e.
Gao, C., Zhang, X., Xiu, A., Tong, Q., Zhao, H., Zhang, S., Yang, G., Zhang, M., and Xie, S.: Emission input data for WRF-CMAQ, Zenodo [data set], https://doi.org/10.5281/zenodo.7932430, 2023f.
Gao, C., Xiu, A., Zhang, X., Tong, Q., Zhao, H., Zhang, S., Yang, G., Zhang, M., and Xie, S.: Emission input data for WRF-Chem, Zenodo [data set], https://doi.org/10.5281/zenodo.7932734, 2023g.
Gao, C., Xiu, A., Zhang, X., Tong, Q., Zhao, H., Zhang, S., Yang, G., Zhang, M., and Xie, S.: Emission input data for WRF-CHMIERE, Zenodo [data set], https://doi.org/10.5281/zenodo.7931614, 2023h.
Gao, C., Xiu, A., Zhang, X., Tong, Q., Zhao, H., Zhang, S., Yang, G., Zhang, M., and Xie, S.: Data used to create figures and tables in the GMD manuscript “Inter-comparison of multiple two-way coupled meteorology and air quality models (WRF v4.1.1-CMAQ v5.3.1, WRF-Chem v4.1.1 and WRF v3.7.1-CHIMERE v2020r1) in eastern China”, Zenodo [data set], https://doi.org/10.5281/zenodo.7750907, 2023i.
Gao, J., Woodward, A., Vardoulakis, S., Kovats, S., Wilkinson, P., Li, L., Xu, L., Li, J., Yang, J., and Cao, L.: Haze, public health and mitigation measures in China: A review of the current evidence for further policy response, Sci. Total Environ., 578, 148–157, https://doi.org/10.1016/j.scitotenv.2016.10.231, 2017.
Gao, M., Han, Z., Liu, Z., Li, M., Xin, J., Tao, Z., Li, J., Kang, J.-E., Huang, K., Dong, X., Zhuang, B., Li, S., Ge, B., Wu, Q., Cheng, Y., Wang, Y., Lee, H.-J., Kim, C.-H., Fu, J. S., Wang, T., Chin, M., Woo, J.-H., Zhang, Q., Wang, Z., and Carmichael, G. R.: Air quality and climate change, Topic 3 of the Model Inter-Comparison Study for Asia Phase III (MICS-Asia III) – Part 1: Overview and model evaluation, Atmos. Chem. Phys., 18, 4859–4884, https://doi.org/10.5194/acp-18-4859-2018, 2018.
Gao, M., Han, Z., Tao, Z., Li, J., Kang, J.-E., Huang, K., Dong, X., Zhuang, B., Li, S., Ge, B., Wu, Q., Lee, H.-J., Kim, C.-H., Fu, J. S., Wang, T., Chin, M., Li, M., Woo, J.-H., Zhang, Q., Cheng, Y., Wang, Z., and Carmichael, G. R.: Air quality and climate change, Topic 3 of the Model Inter-Comparison Study for Asia Phase III (MICS-Asia III) – Part 2: aerosol radiative effects and aerosol feedbacks, Atmos. Chem. Phys., 20, 1147–1161, https://doi.org/10.5194/acp-20-1147-2020, 2020.
Gao, Y., Zhang, M., Liu, Z., Wang, L., Wang, P., Xia, X., Tao, M., and Zhu, L.: Modeling the feedback between aerosol and meteorological variables in the atmospheric boundary layer during a severe fog–haze event over the North China Plain, Atmos. Chem. Phys., 15, 4279–4295, https://doi.org/10.5194/acp-15-4279-2015, 2015.
Ge, B., Itahashi, S., Sato, K., Xu, D., Wang, J., Fan, F., Tan, Q., Fu, J. S., Wang, X., Yamaji, K., Nagashima, T., Li, J., Kajino, M., Liao, H., Zhang, M., Wang, Z., Li, M., Woo, J.-H., Kurokawa, J., Pan, Y., Wu, Q., Liu, X., and Wang, Z.: Model Inter-Comparison Study for Asia (MICS-Asia) phase III: multimodel comparison of reactive nitrogen deposition over China, Atmos. Chem. Phys., 20, 10587–10610, https://doi.org/10.5194/acp-20-10587-2020, 2020.
Geng, G., Zheng, Y., Zhang, Q., Xue, T., Zhao, H., Tong, D., Zheng, B., Li, M., Liu, F., and Hong, C.: Drivers of PM2.5 air pollution deaths in China 2002–2017, Nat. Geosci., 14, 645–650, https://doi.org/10.1038/s41561-021-00792-3, 2021.
Gillies, S., Ward, B., and Petersen, A. S.: Rasterio: Geospatial raster I/O for Python programmers, GitHub [code], https://github.com/mapbox/rasterio (last access: 20 November 2020), 2013.
Govardhan, G. R., Nanjundiah, R. S., Satheesh, S. K., Moorthy, K. K., and Takemura, T.: Inter-comparison and performance evaluation of chemistry transport models over Indian region, Atmos. Environ., 125, 486–504, https://doi.org/10.1016/j.atmosenv.2015.10.065, 2016.
Grell, G. and Baklanov, A.: Integrated modeling for forecasting weather and air quality: A call for fully coupled approaches, Atmos. Environ., 45, 6845–6851, https://doi.org/10.1016/j.atmosenv.2011.01.017, 2011.
Grell, G. A., Peckham, S. E., Schmitz, R., McKeen, S. A., Frost, G., Skamarock, W. C., and Eder, B.: Fully coupled “online” chemistry within the WRF model, Atmos. Environ., 39, 6957–6975, https://doi.org/10.1016/j.atmosenv.2005.04.027, 2005.
Guo, J., Li, Y., Cohen, J. B., Li, J., Chen, D., Xu, H., Liu, L., Yin, J., Hu, K., and Zhai, P.: Shift in the temporal trend of boundary layer height in China using long-term (1979–2016) radiosonde data, Geophys. Res. Lett., 46, 6080–6089, https://doi.org/10.1029/2019GL082666, 2019.
He, K., Huo, H., and Zhang, Q.: Urban air pollution in China: current status, characteristics, and progress, Annu. Rev. Environ. Resour., 27, 397–431, https://doi.org/10.1146/annurev.energy.27.122001.083421, 2002.
Hogrefe, C., Pouliot, G., Wong, D., Torian, A., Roselle, S., Pleim, J., and Mathur, R.: Annual application and evaluation of the online coupled WRF–CMAQ system over North America under AQMEII phase 2, Atmos. Environ., 115, 683–694, https://doi.org/10.1016/j.atmosenv.2014.12.034, 2015.
Hong, C., Zhang, Q., Zhang, Y., Tang, Y., Tong, D., and He, K.: Multi-year downscaling application of two-way coupled WRF v3.4 and CMAQ v5.0.2 over east Asia for regional climate and air quality modeling: model evaluation and aerosol direct effects, Geosci. Model Dev., 10, 2447–2470, https://doi.org/10.5194/gmd-10-2447-2017, 2017.
Huang, D. and Gao, S.: Impact of different reanalysis data on WRF dynamical downscaling over China, Atmos. Res., 200, 25–35, https://doi.org/10.1016/j.atmosres.2017.09.017, 2018.
Huang, X., Song, Y., Li, M., Li, J., Huo, Q., Cai, X., Zhu, T., Hu, M., and Zhang, H.: A high-resolution ammonia emission inventory in China, Global Biogeochem. Cy., 26, GB1030, https://doi.org/10.1029/2011GB004161, 2012.
Iacono, M. J., Delamere, J. S., Mlawer, E. J., Shephard, M. W., Clough, S. A., and Collins, W. D.: Radiative forcing by long-lived greenhouse gases: Calculations with the AER radiative transfer models, J. Geophys. Res.-Atmos., 113, D13103, https://doi.org/10.1029/2008JD009944, 2008.
Im, U., Bianconi, R., Solazzo, E., Kioutsioukis, I., Badia, A., Balzarini, A., Baró, R., Bellasio, R., Brunner, D., and Chemel, C.: Evaluation of operational on-line-coupled regional air quality models over Europe and North America in the context of AQMEII phase 2. Part I: Ozone, Atmos. Environ., 115, 404–420, https://doi.org/10.1016/j.atmosenv.2014.09.042, 2015a.
Im, U., Bianconi, R., Solazzo, E., Kioutsioukis, I., Badia, A., Balzarini, A., Baró, R., Bellasio, R., Brunner, D., and Chemel, C.: Evaluation of operational online-coupled regional air quality models over Europe and North America in the context of AQMEII phase 2. Part II: Particulate matter, Atmos. Environ., 115, 421–441, https://doi.org/10.1016/j.atmosenv.2014.08.072, 2015b.
IPCC: Climate change 2007: Synthesis Report. Contribution of Working Groups I, II and III to the Fourth Assessment Report of the Intergovernmental Panel on Climate Change, https://www.ipcc.ch/site/assets/uploads/2018/02/ar4_syr_full_report.pdf (last access: 20 March 2023), 2007.
IPCC: Climate change 2021: Synthesis Report. Contribution of Working Groups I, II and III to the Sixth Assessment Report of the Intergovernmental Panel on Climate Change, https://www.ipcc.ch/report/ar6/wg1/downloads/report/IPCC_AR6_WGI_FullReport_small.pdf (last access: 20 March 2023), 2021.
Itahashi, S., Ge, B., Sato, K., Fu, J. S., Wang, X., Yamaji, K., Nagashima, T., Li, J., Kajino, M., Liao, H., Zhang, M., Wang, Z., Li, M., Kurokawa, J., Carmichael, G. R., and Wang, Z.: MICS-Asia III: overview of model intercomparison and evaluation of acid deposition over Asia, Atmos. Chem. Phys., 20, 2667–2693, https://doi.org/10.5194/acp-20-2667-2020, 2020.
Jacobson, M. Z.: Developing, coupling, and applying a gas, aerosol, transport, and radiation model to study urban and regional air pollution [M], University of California, Los Angeles, 1994.
Jacobson, M. Z.: Development and application of a new air pollution modeling system—Part III. Aerosol-phase simulations, Atmos. Environ., 31, 587–608, https://doi.org/10.1016/S1352-2310(96)00201-4, 1997.
Jacobson, M. Z.: Studying the effects of aerosols on vertical photolysis rate coefficient and temperature profiles over an urban airshed, J. Geophys. Res.-Atmos., 103, 10593–10604, https://doi.org/10.1029/98jd00287, 1998.
Jacobson, M. Z.: GATOR-GCMM: A global-through urban-scale air pollution and weather forecast model: 1. Model design and treatment of subgrid soil, vegetation, roads, rooftops, water, sea ice, and snow, J. Geophys. Res.-Atmos., 106, 5385–5401, https://doi.org/10.1029/2000JD900560, 2001.
Jacobson, M. Z.: Analysis of aerosol interactions with numerical techniques for solving coagulation, nucleation, condensation, dissolution, and reversible chemistry among multiple size distributions, J. Geophys. Res.-Atmos., 107, AAC 2-1–AAC 2-23, https://doi.org/10.1029/2001JD002044, 2002.
Keita, S. A., Girard, E., Raut, J.-C., Leriche, M., Blanchet, J.-P., Pelon, J., Onishi, T., and Cirisan, A.: A new parameterization of ice heterogeneous nucleation coupled to aerosol chemistry in WRF-Chem model version 3.5.1: evaluation through ISDAC measurements, Geosci. Model Dev., 13, 5737–5755, https://doi.org/10.5194/gmd-13-5737-2020, 2020.
Klein, S. A., McCoy, R. B., Morrison, H., Ackerman, A. S., Avramov, A., Boer, G. de, Chen, M., Cole, J. N. S., Del Genio, A. D., and Falk, M.: Intercomparison of model simulations of mixed-phase clouds observed during the ARM Mixed-Phase Arctic Cloud Experiment. I: Single-layer cloud, Q. J. Roy. Meteor. Soc., 135, 979–1002, https://doi.org/10.1002/qj.416, 2009.
Knote, C., Tuccella, P., Curci, G., Emmons, L., Orlando, J. J., Madronich, S., Baró, R., Jiménez-Guerrero, P., Luecken, D., and Hogrefe, C.: Influence of the choice of gas-phase mechanism on predictions of key gaseous pollutants during the AQMEII phase-2 intercomparison, Atmos. Environ., 115, 553–568, https://doi.org/10.1016/j.atmosenv.2014.11.066, 2015.
Kong, L., Tang, X., Zhu, J., Wang, Z., Fu, J. S., Wang, X., Itahashi, S., Yamaji, K., Nagashima, T., Lee, H.-J., Kim, C.-H., Lin, C.-Y., Chen, L., Zhang, M., Tao, Z., Li, J., Kajino, M., Liao, H., Wang, Z., Sudo, K., Wang, Y., Pan, Y., Tang, G., Li, M., Wu, Q., Ge, B., and Carmichael, G. R.: Evaluation and uncertainty investigation of the NO2, CO and NH3 modeling over China under the framework of MICS-Asia III, Atmos. Chem. Phys., 20, 181–202, https://doi.org/10.5194/acp-20-181-2020, 2020.
Li, J., Nagashima, T., Kong, L., Ge, B., Yamaji, K., Fu, J. S., Wang, X., Fan, Q., Itahashi, S., Lee, H.-J., Kim, C.-H., Lin, C.-Y., Zhang, M., Tao, Z., Kajino, M., Liao, H., Li, M., Woo, J.-H., Kurokawa, J., Wang, Z., Wu, Q., Akimoto, H., Carmichael, G. R., and Wang, Z.: Model evaluation and intercomparison of surface-level ozone and relevant species in East Asia in the context of MICS-Asia Phase III – Part 1: Overview, Atmos. Chem. Phys., 19, 12993–13015, https://doi.org/10.5194/acp-19-12993-2019, 2019.
Li, M., Liu, H., Geng, G., Hong, C., Liu, F., Song, Y., Tong, D., Zheng, B., Cui, H., and Man, H.: Anthropogenic emission inventories in China: a review, Natl. Sci. Rev., 4, 834–866, https://doi.org/10.1093/nsr/nwx150, 2017.
Liu, Z., Wang, Y., Hu, B., Lu, K., Tang, G., Ji, D., Yang, X., Gao, W., Xie, Y., and Liu, J.: Elucidating the quantitative characterization of atmospheric oxidation capacity in Beijing, China, Sci. Total Environ., 771, 145306, https://doi.org/10.1016/j.scitotenv.2021.145306, 2021.
Ma, Y., Jin, Y., Zhang, M., Gong, W., Hong, J., Jin, S., Shi, Y., Zhang, Y., and Liu, B.: Aerosol optical properties of haze episodes in eastern China based on remote-sensing observations and WRF-Chem simulations, Sci. Total Environ., 757, 143784, https://doi.org/10.1016/j.scitotenv.2020.143784, 2021.
Mailler, S., Menut, L., Khvorostyanov, D., Valari, M., Couvidat, F., Siour, G., Turquety, S., Briant, R., Tuccella, P., Bessagnet, B., Colette, A., Létinois, L., Markakis, K., and Meleux, F.: CHIMERE-2017: from urban to hemispheric chemistry-transport modeling, Geosci. Model Dev., 10, 2397–2423, https://doi.org/10.5194/gmd-10-2397-2017, 2017.
Makar, P. A., Gong, W., Milbrandt, J., Hogrefe, C., Zhang, Y., Curci, G., Žabkar, R., Im, U., Balzarini, A., Baró, R., Bianconi, R., Cheung, P., Forkel, R., Gravel, S., Hirtl, M., Honzak, L., Hou, A., Jiménez-Guerrero, P., Langer, M., Moran, M. D., Pabla, B., Pérez, J. L., Pirovano, G., San José, R., Tuccella, P., Werhahn, J., Zhang, J., and Galmarini, S.: Feedbacks between air pollution and weather, Part 1: Effects on weather, Atmos. Environ., 115, 442–469, https://doi.org/10.1016/j.atmosenv.2014.12.003, 2015a.
Makar, P. A., Gong, W., Hogrefe, C., Zhang, Y., Curci, G., Žabkar, R., Milbrandt, J., Im, U., Balzarini, A., Baró, R., Bianconi, R., Cheung, P., Forkel, R., Gravel, S., Hirtl, M., Honzak, L., Hou, A., Jiménez-Guerrero, P., Langer, M., Moran, M. D., Pabla, B., Pérez, J. L., Pirovano, G., San José, R., Tuccella, P., Werhahn, J., Zhang, J., and Galmarini, S.: Feedbacks between air pollution and weather, part 2: Effects on chemistry, Atmos. Environ., 115, 499–526, https://doi.org/10.1016/j.atmosenv.2014.10.021, 2015b.
Menut, L., Bessagnet, B., Khvorostyanov, D., Beekmann, M., Blond, N., Colette, A., Coll, I., Curci, G., Foret, G., Hodzic, A., Mailler, S., Meleux, F., Monge, J.-L., Pison, I., Siour, G., Turquety, S., Valari, M., Vautard, R., and Vivanco, M. G.: CHIMERE 2013: a model for regional atmospheric composition modelling, Geosci. Model Dev., 6, 981–1028, https://doi.org/10.5194/gmd-6-981-2013, 2013.
Menut, L., Siour, G., Mailler, S., Couvidat, F., and Bessagnet, B.: Observations and regional modeling of aerosol optical properties, speciation and size distribution over Northern Africa and western Europe, Atmos. Chem. Phys., 16, 12961–12982, https://doi.org/10.5194/acp-16-12961-2016, 2016.
Qu, Y., Voulgarakis, A., Wang, T., Kasoar, M., Wells, C., Yuan, C., Varma, S., and Mansfield, L.: A study of the effect of aerosols on surface ozone through meteorology feedbacks over China, Atmos. Chem. Phys., 21, 5705–5718, https://doi.org/10.5194/acp-21-5705-2021, 2021.
Rosenfeld, D., Andreae, M. O., Asmi, A., Chin, M., de Leeuw, G., Donovan, D. P., Kahn, R., Kinne, S., Kivekäs, N., and Kulmala, M.: Global observations of aerosol-cloud-precipitation-climate interactions, Rev. Geophys., 52, 750–808, https://doi.org/10.1002/2013RG000441, 2014.
Safieddine, S., Boynard, A., Coheur, P.-F., Hurtmans, D., Pfister, G., Quennehen, B., Thomas, J. L., Raut, J.-C., Law, K. S., Klimont, Z., Hadji-Lazaro, J., George, M., and Clerbaux, C.: Summertime tropospheric ozone assessment over the Mediterranean region using the thermal infrared IASI/MetOp sounder and the WRF-Chem model, Atmos. Chem. Phys., 14, 10119–10131, https://doi.org/10.5194/acp-14-10119-2014, 2014.
Stein, O., Schultz, M. G., Bouarar, I., Clark, H., Huijnen, V., Gaudel, A., George, M., and Clerbaux, C.: On the wintertime low bias of Northern Hemisphere carbon monoxide found in global model simulations, Atmos. Chem. Phys., 14, 9295–9316, https://doi.org/10.5194/acp-14-9295-2014, 2014.
Tang, W., Yang, K., Qin, J., Li, X., and Niu, X.: A 16-year dataset (2000–2015) of high-resolution (3 h, 10 km) global surface solar radiation, Earth Syst. Sci. Data, 11, 1905–1915, https://doi.org/10.5194/essd-11-1905-2019, 2019.
Tuccella, P., Menut, L., Briant, R., Deroubaix, A., Khvorostyanov, D., Mailler, S., Siour, G., and Turquety, S.: Implementation of aerosol-cloud interaction within WRF-CHIMERE online coupled model: Evaluation and investigation of the indirect radiative effect from anthropogenic emission reduction on the Benelux Union, Atmosphere (Basel), 10, 20, https://doi.org/10.3390/atmos10010020, 2019.
Wallace, J. M. and Hobbs, P. V: Atmospheric science: an introductory survey, Elsevier, ISBN 9780127329512, 2006.
Wang, K., Zhang, Y., Yahya, K., Wu, S.-Y., and Grell, G.: Implementation and initial application of new chemistry-aerosol options in WRF/Chem for simulating secondary organic aerosols and aerosol indirect effects for regional air quality, Atmos. Environ., 115, 716–732, https://doi.org/10.1016/j.atmosenv.2014.12.007, 2015.
Wang, K., Zhang, Y., Zhang, X., Fan, J., Leung, L. R., Zheng, B., Zhang, Q., and He, K.: Fine-scale application of WRF-CAM5 during a dust storm episode over East Asia: Sensitivity to grid resolutions and aerosol activation parameterizations, Atmos. Environ., 176, 1–20, https://doi.org/10.1016/j.atmosenv.2017.12.014, 2018.
Wang, K., Zhang, Y., Yu, S., Wong, D. C., Pleim, J., Mathur, R., Kelly, J. T., and Bell, M.: A comparative study of two-way and offline coupled WRF v3.4 and CMAQ v5.0.2 over the contiguous US: performance evaluation and impacts of chemistry–meteorology feedbacks on air quality, Geosci. Model Dev., 14, 7189–7221, https://doi.org/10.5194/gmd-14-7189-2021, 2021.
Wang, K., Gao, C., Wu, K., Liu, K., Wang, H., Dan, M., Ji, X., and Tong, Q.: ISAT v2.0: an integrated tool for nested-domain configurations and model-ready emission inventories for WRF-AQM, Geosci. Model Dev., 16, 1961–1973, https://doi.org/10.5194/gmd-16-1961-2023, 2023.
Wang, S. and Hao, J.: Air quality management in China: Issues, challenges, and options, J. Environ. Sci., 24, 2–13, https://doi.org/10.1016/S1001-0742(11)60724-9, 2012.
Wang, Z., Wang, Z., Li, J., Zheng, H., Yan, P., and Li, J.: Development of a meteorology-chemistry two-way coupled numerical model (WRF-NAQPMS) and its application in a severe autumn haze simulation over the Beijing-Tianjin-Hebei area, China. Clim, Environ. Res, 19, 153–163, https://doi.org/10.3878/j.issn.1006-9585.2014.13231, 2014.
Wiedinmyer, C., Akagi, S. K., Yokelson, R. J., Emmons, L. K., Al-Saadi, J. A., Orlando, J. J., and Soja, A. J.: The Fire INventory from NCAR (FINN): a high resolution global model to estimate the emissions from open burning, Geosci. Model Dev., 4, 625–641, https://doi.org/10.5194/gmd-4-625-2011, 2011.
Wong, D. C., Pleim, J., Mathur, R., Binkowski, F., Otte, T., Gilliam, R., Pouliot, G., Xiu, A., Young, J. O., and Kang, D.: WRF-CMAQ two-way coupled system with aerosol feedback: software development and preliminary results, Geosci. Model Dev., 5, 299–312, https://doi.org/10.5194/gmd-5-299-2012, 2012.
Xing, J., Mathur, R., Pleim, J., Hogrefe, C., Wang, J., Gan, C.-M., Sarwar, G., Wong, D. C., and McKeen, S.: Representing the effects of stratosphere–troposphere exchange on 3-D O3 distributions in chemistry transport models using a potential vorticity-based parameterization, Atmos. Chem. Phys., 16, 10865–10877, https://doi.org/10.5194/acp-16-10865-2016, 2016.
Xing, J., Wang, J., Mathur, R., Wang, S., Sarwar, G., Pleim, J., Hogrefe, C., Zhang, Y., Jiang, J., Wong, D. C., and Hao, J.: Impacts of aerosol direct effects on tropospheric ozone through changes in atmospheric dynamics and photolysis rates, Atmos. Chem. Phys., 17, 9869–9883, https://doi.org/10.5194/acp-17-9869-2017, 2017.
Xu, K.-M. and Randall, D. A.: A semiempirical cloudiness parameterization for use in climate models, J. Atmos. Sci., 53, 3084–3102, https://doi.org/10.1175/1520-0469(1996)053<3084:ASCPFU>2.0.CO;2, 1996.
Zaveri, R. A., Easter, R. C., Fast, J. D., and Peters, L. K.: Model for simulating aerosol interactions and chemistry (MOSAIC), J. Geophys. Res.-Atmos., 113, D13204, https://doi.org/10.1029/2007JD008782, 2008.
Zhang, X., Wu, Y., Liu, X., Reis, S., Jin, J., Dragosits, U., Van Damme, M., Clarisse, L., Whitburn, S., and Coheur, P.-F.: Ammonia emissions may be substantially underestimated in China, Environ. Sci. Technol., 51, 12089–12096, https://doi.org/10.1021/acs.est.7b02171, 2017.
Zhang, Y.: Online-coupled meteorology and chemistry models: history, current status, and outlook, Atmos. Chem. Phys., 8, 2895–2932, https://doi.org/10.5194/acp-8-2895-2008, 2008.
Zhang, Y., Zhang, X., Wang, K., Zhang, Q., Duan, F., and He, K.: Application of WRF/Chem over East Asia: Part II. Model improvement and sensitivity simulations, Atmos. Environ., 124, 301–320, https://doi.org/10.1016/j.atmosenv.2015.07.023, 2016.
Zhao, B., Liou, K., Gu, Y., Li, Q., Jiang, J. H., Su, H., He, C., Tseng, H.-L. R., Wang, S., and Liu, R.: Enhanced PM2.5 pollution in China due to aerosol-cloud interactions, Sci. Rep., 7, 4453, https://doi.org/10.1038/s41598-017-04096-8, 2017.
Zhou, C., Zhang, X., Gong, S., Wang, Y., and Xue, M.: Improving aerosol interaction with clouds and precipitation in a regional chemical weather modeling system, Atmos. Chem. Phys., 16, 145–160, https://doi.org/10.5194/acp-16-145-2016, 2016.
Zhu, J., Wang, S., Wang, H., Jing, S., Lou, S., Saiz-Lopez, A., and Zhou, B.: Observationally constrained modeling of atmospheric oxidation capacity and photochemical reactivity in Shanghai, China, Atmos. Chem. Phys., 20, 1217–1232, https://doi.org/10.5194/acp-20-1217-2020, 2020.
Zhu, J., Chen, L., Liao, H., Yang, H., Yang, Y., and Yue, X.: Enhanced PM2.5 decreases and O3 increases in China during COVID-19 lockdown by aerosol-radiation feedback, Geophys. Res. Lett., 48, e2020GL090260, https://doi.org/10.1029/2020GL090260, 2021.