the Creative Commons Attribution 4.0 License.
the Creative Commons Attribution 4.0 License.
 | 01 Mar 2024
Sensitivity of the WRF-Chem v4.4 simulations of ozone and formaldehyde and their precursors to multiple bottom-up emission inventories over East Asia during the KORUS-AQ 2016 field campaign
Kyoung-Min Kim
Seunghwan Seo
Donald R. Blake
Seogju Cho
James H. Crawford
Louisa K. Emmons
Alan Fried
Jay R. Herman
Jinkyu Hong
Jinsang Jung
Gabriele G. Pfister
Andrew J. Weinheimer
Jung-Hun Woo
Qiang Zhang
In this study, the WRF-Chem v4.4 model was utilized to evaluate the sensitivity of O3 simulations with three bottom-up emission inventories (EDGAR-HTAP v2 and v3 and KORUS v5) using surface and aircraft data in East Asia during the Korea-United States Air Quality (KORUS-AQ) campaign period in 2016. All emission inventories were found to reproduce the diurnal variations of O3 and its main precursor NO2 as compared to the surface monitor data. However, the spatial distributions of the daily maximum 8 h average (MDA8) O3 in the model do not completely align with the observations. The model MDA8 O3 had a negative (positive) bias north (south) of 30° N over China. All simulations underestimated the observed CO by 50 %–60 % over China and South Korea. In the Seoul Metropolitan Area (SMA), EDGAR-HTAP v2 and v3 and KORUS v5 simulated the vertical shapes and diurnal patterns of O3 and other precursors effectively, but the model underestimated the observed O3, CO, and HCHO concentrations. Notably, the model aromatic volatile organic compounds (VOCs) were significantly underestimated with the three bottom-up emission inventories, although the KORUS v5 shows improvements. The model isoprene estimations had a positive bias relative to the observations, suggesting that the Model of Emissions of Gases and Aerosols from Nature (MEGAN) version 2.04 overestimated isoprene emissions. Additional model simulations were conducted by doubling CO and VOC emissions over China and South Korea to investigate the causes of the model O3 biases and the effects of the long-range transport on the O3 over South Korea. The doubled CO and VOC emission simulations improved the model O3 simulations for the local-emission-dominant case but led to the model O3 overestimations for the transport-dominant case, which emphasizes the need for accurate representations of the local VOC emissions over South Korea.
- Article
(9981 KB) - Full-text XML
-
Supplement
(4380 KB) - BibTeX
- EndNote


Air pollutants not only harm human health but also affect radiative balance, resulting in climate change (Anenberg et al., 2018; Franklin et al., 2015; Lee et al., 2014; Manning and von Tiedemann, 1995; Rosenzweig et al., 2008; Wild et al., 2001). Anthropogenic activities are the primary source of air pollutant emissions, which have significant temporal and spatial variability. Chemical transport models (CTMs) use bottom-up emission data to simulate ambient concentrations of air pollutants. CTMs then process these emissions, tracking their impact through chemistry, transport, and loss through deposition (Zhong et al., 2016). Therefore, sensitivity evaluations of CTMs to anthropogenic emission data are an essential part of atmospheric modeling research.
Several bottom-up emission inventories are available for the chemical modeling of Asia, including the Multi-resolution Emission Inventory for China (MEIC), Regional Emission inventory in Asia (REAS), and Emissions Database for Global Atmospheric Research-Hemispheric Transport of Air Pollution (EDGAR-HTAP). Since 2010, Tsinghua University has developed the high-resolution MEIC and updated the data to v1.3, providing anthropogenic emissions by sector and species from 2008 to 2017 (Zheng et al., 2018). REAS provides emission data in Asia from 1950 to 2015 (Kurokawa and Ohara, 2020). In Europe, EDGAR-HTAP has been developed and widely used for CTM simulations from the global to the regional scale (Kim et al., 2021; Sharma et al., 2017; Sicard et al., 2021). Recently, EDGAR-HTAP v3 has been published, covering 19 years from 2000 to 2018 compared to only 2 years (2008 and 2010) in the version 2 data (Crippa et al., 2023). Zhong et al. (2016) compared REAS with EDGAR in July 2007 over China, while Saikawa et al. (2017) compared five emission inventories including REAS, EDGAR, and MEIC, without validation. As bottom-up emission inventories are continuously updated for recent years, there is an ongoing need to evaluate new emissions data.
The Ministry of Environment (MOE) in South Korea and National Aeronautics and Space Administration (NASA) in the United States conducted the Korea-United States Air Quality (KORUS-AQ) campaign in May–June 2016. The campaign provided a variety of data sets, including ground-based and airborne observations, useful for the validation of model simulations. The KORUS emissions, developed by Konkuk University, were used by many modeling teams to simulate the air pollutant concentrations during the campaign period. Numerous modeling studies were conducted for this period including validations of CTM results with diverse observation data sets. Miyazaki et al. (2019) adjusted emission inventories using various satellite data sets and the Model for Interdisciplinary Research on Climate with chemistry (MIROC-Chem), resulting in improved simulations of tropospheric O3. Goldberg et al. (2019) reported underestimations of NOx emissions in South Korea, particularly in Seoul. Souri et al. (2020) also revealed the same issue in South Korea and conducted analysis of the sensitivity of O3 formation to adjustments in NOx and volatile organic compound (VOC) emission derived from inverse modeling. Tang et al. (2019) revealed negative biases of simulated CO concentrations in East Asia by utilizing satellite data and the Community Atmosphere Model with Chemistry (CAM-Chem). Choi et al. (2022) modified anthropogenic VOC emissions through inverse modeling using satellite HCHO observations with the Goddard Earth Observing System with Chemistry (GEOS-Chem), which reduced O3 and HCHO biases.
Recently, the updated versions of bottom-up emission inventories and CTMs have become available for air pollution modeling studies in East Asia. In this study, we selected EDGAR-HTAP versions 2 and 3 and KORUS version 5 emission data and used the Weather Research and Forecasting model coupled with Chemistry (WRF-Chem) version 4.4 for intercomparison of the three emissions data sets, aiming to understand the status of precursor emissions from bottom-up emission inventories and their uncertainties, which may impact the O3 formations in the model. O3 and its major precursors were selected for model evaluation, and the model results were evaluated with surface observation data in China and South Korea and aircraft data acquired over the South Korea and surrounding waters.
The paper is organized as follows. The “Data and methods” section introduces emission inventories, the numerical model, and meteorological and chemical observations. The Results section evaluates the model's meteorology and chemistry using routine surface observations over China and South Korea. Subsequently, the model results employing three bottom-up emission inventories are compared with sophisticated chemical observations obtained during the KORUS-AQ field campaign, primarily over South Korea. This comparison summarized the model's performance with each emission inventory. In the Discussion section, strategies to enhance surface O3 simulations, along with accurate precursor simulations, are proposed based on various emission scenarios for urban and regional areas over China and South Korea. The “Summary and conclusions” section follows, providing an overview of the key findings and conclusions drawn from the study.
2.1 WRF-Chem model configurations
In this study, we utilized WRF-Chem v4.4, which was developed by the National Oceanic and Atmospheric Administration (NOAA) and National Center for Atmospheric Research (NCAR) to simulate meteorological variables and chemical species in the atmosphere (Grell et al., 2005). WRF-Chem v4.4 includes N2O5 heterogeneous chemistry that consists of several chemical reactions related to ClNO2 and N2O5 reactions, resulting in nitrate aerosol. The reactions are incorporated into the Secondary Organic Aerosol Volatility Basis Set (SOA-VBS) with the Regional Atmospheric Chemistry Mechanism (RACM) chemistry option (chem =108) in WRF-Chem (Li et al., 2016).
We set 59 vertically customized eta (η) levels as vertical layers. The model's first layer height is approximately 40 m above ground level for the entire domain. The model's vertical layers are designed to include about 17 layers under 1.5 km to simulate planetary boundary layer chemistry and near-surface vertical distribution in detail. The horizontal resolution is 28×28 km2. The simulations in this study start at 12:00 UTC on 24 April and end at 12:00 UTC on 11 June. The model meteorology restarts every 12:00 UTC (21:00 local time in South Korea) to minimize numerical errors. After the first 7 d of model initiation (spin-up), we analyzed the model results from 1 May to 10 June. We used China standard time (+08:00 UTC) and Korea standard time (+09:00 UTC) for evaluations with observations. The model physics, chemistry, and aerosol schemes are summarized in Table S1 with corresponding references. The Global Forecast System (GFS) Final (FNL) analysis data are used for meteorological input and boundary conditions. The Community Atmosphere Model with Chemistry (CAM-Chem) output is used for chemical boundary conditions (https://rda.ucar.edu/datasets/ds313.7/, last access: 16 April 2019) (Buchholz et al., 2019; Emmons et al., 2020). We used the Model of Emissions of Gases and Aerosols from Nature (MEGAN) v2.04 to calculate biogenic emissions (Guenther et al., 2006). We did not account for fire emissions because of the small impact on air quality simulations during the KORUS-AQ campaign period (Park et al., 2021). In our sensitivity simulation with the Fire INventory from NCAR (FINN) v2.5 fire emissions (Wiedinmyer et al., 2022), a marginal increase in the simulated averaged daily maximum 8 h average (MDA8) O3 of approximately 1 ppbv (1.6 %) was noted in China (Supplement Fig. S1).
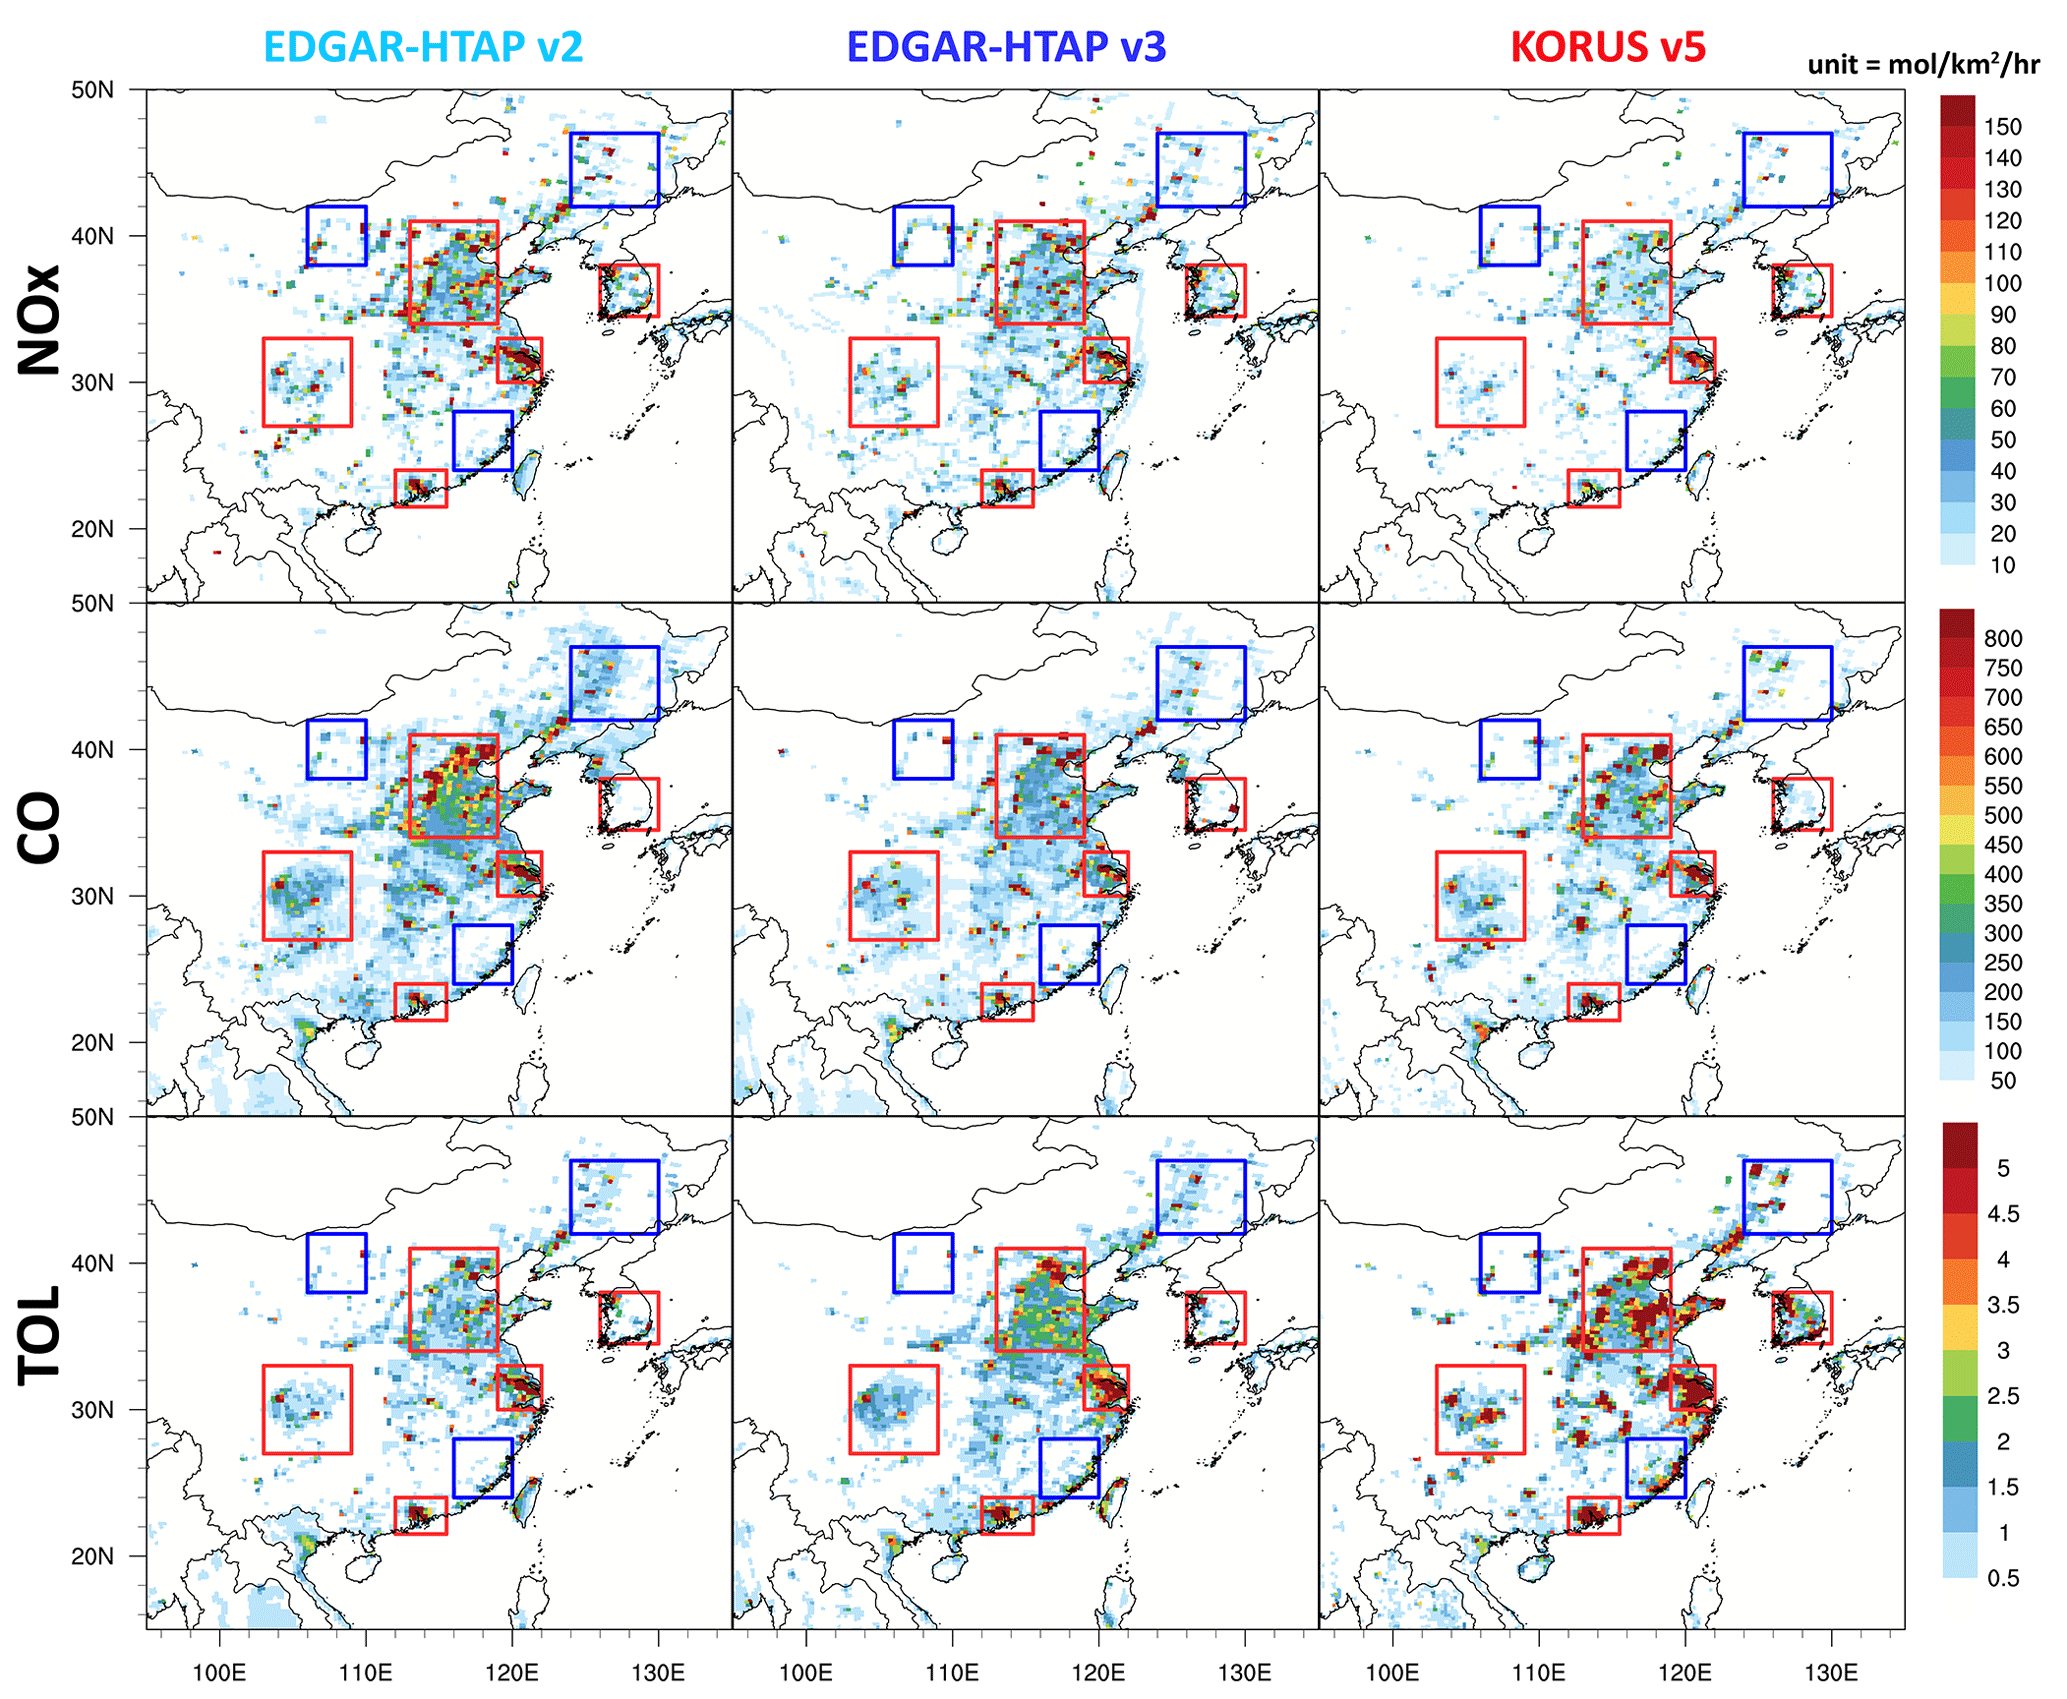
Figure 1The averaged spatial distribution map of the NO, CO, and TOL (toluene + less reactive aromatics) emissions from EDGAR-HTAP v2 and v3 and KORUS v5 in May. The boxes represent Northern China (NOC; 38–42° N,106–110° E), Sichuan–Chongqing–Guizhou (SCG; 27–33° N,103–109° E), Pearl River Delta (PRD; 21.5–24° N, 112–115.5° E), Southeastern China (SEC; 24–28° N, 116–120° E), Yangtze River Delta (YRD; 30–33° N, 119–122° E), South Korea (KOR; 34.5–38° N, 126–130° E), North China Plain (NCP; 34–41° N, 113–119° E), and Northeastern China (NEC; 43–47° N, 124–130° E). NOC, NEC, and SEC are denoted by blue boxes (non-urban). NCP, SCG, PRD, YRD, and KOR are denoted by red boxes (urban).
2.2 The model simulations using different anthropogenic emissions
2.2.1 Bottom-up emission data
EDGAR-HTAP v2 and v3 and KORUS v5 anthropogenic bottom-up emission inventories are compared with respect to their spatial distribution and total amount in Fig. 1 and Table S2. We applied the same diurnal factor for all three emissions data by species, following the diurnal patterns for the Los Angeles Basin as in Kim et al. (2016) (also see Fig. S2).
EDGAR-HTAP v2 provides 2-dimensional emissions of CH4, CO, SO2, NOx (NO + NO2), total non-methane volatile organic compounds (NMVOCs), NH3, PM10, PM2.5, black carbon (BC), and organic carbon (OC) in 2008 and 2010 with a horizontal resolution of 0.1°×0.1°. We used 2010 data since they are the most recent data available. The data are partitioned by each sector and by each source, such as air, ships, energy, industry, transport, residential, and agriculture (https://edgar.jrc.ec.europa.eu/dataset_htap_v2, last access: 1 May 2015). For East Asia, it included data from the Model Inter-Comparison Study for Asia (MICS-Asia) and REAS v2.1. In South Korea, it adopted data from the Clean Air Policy Support System (CAPSS) (Janssens-Maenhout et al., 2015), and the underlying emission data had an original horizontal resolution of 0.25°×0.25° over East Asia, which is resampled to 0.1°×0.1° resolution by raster resampling and aggregation. The speciated EDGAR-HTAP v2 VOC data were obtained through the WRF-Chem site (https://www.acom.ucar.edu/wrf-chem/download.shtml, last access: 6 July 2023) in the anthro_emiss program with the Model for Ozone and Related chemical Tracers (MOZART) species (Table S3). The anthro_emiss program converts the EDGAR-HTAP v2 data into a 28×28 km2 grid by the RACM chemical species (Supplement Table S4). It mapped the MOZART volatile organic compound (VOC) species into the RACM VOC species (see the detailed equations in Table S5) (Li et al., 2014; Emmons et al., 2010).
EDGAR-HTAP v3 is extended to a much longer timescale than the previous version, EDGAR-HTAP v2. EDGAR-HTAP v3 covers 2000 to 2018, with a more detailed horizontal resolution (https://edgar.jrc.ec.europa.eu/dataset_htap_v3, last access: 21 March 2022) (Crippa et al., 2023). While EDGAR-HTAP v2 uses MICS-Asia, only the REAS data are used in China and India in EDGAR-HTAP v3. It adopts the CAPSS Konkuk University (CAPSS-KU) data for South Korea and emission data provided by the Japanese government for Japan. We chose the data for 2016, according to the KORUS-AQ campaign period. Because the original EDGAR-HTAP v3 data provide VOCs as total NMVOCs with the unit of tonnes per month, we distributed the total NMVOCs to MOZART VOC species with the ratio of each VOC species to total NMVOCs from EDGAR-HTAP v2 in anthro_emiss program. Then, the assigned EDGAR-HTAP v3 data were again converted to the RACM.
KORUS v5 emission data represent 2016 in China and 2015 in other regions. The Comprehensive Regional Emissions Inventory for Atmospheric Transport Experiment (CREATE) v2.3 data from 2015 were used, and the ship emissions from CAPSS were added near the coastal region in South Korea (Jang et al., 2020; Woo et al., 2012). The CREATE is originally developed by combining REAS, MEIC, the Japan Auto-Oil Program emission inventory (JATOP), and the Korean Clear Air Policy Support System (CAPSS). The NMVOC species from KORUS v5 were mapped following the Statewide Air Pollution Research Center (SAPRC-99) mechanism, and we also assigned the SAPRC-99 species to RACM (Carter, 2000) (Tables S5–S6).
Figure 1 shows the spatial distribution of NO, CO, and TOL (toluene + less reactive aromatics defined in RACM; see Table S4) emissions in May for each inventory. The NOx emissions were assumed to be emitted as NO. The major cities in China and South Korea had relatively high NO, CO, and TOL emissions, which are precursors affecting O3 formation. We define three boxes representing Eastern China, South Korea, and the Seoul Metropolitan Area (SMA) and calculated the emissions (see Table S2). In South Korea including SMA, EDGAR-HTAP v3 had the largest NOx emission among the emission inventories. KORUS v5 has lower NOx emissions in Eastern China by 46 % and 39 % compared to EDGAR-HTAP v2 and v3, respectively. The CO emission was the lowest in EDGAR-HTAP v2 in South Korea, being 56 % (69 %) lower than that in KORUS v5 (EDGAR-HTAP v3). KORUS v5 showed the highest CO emissions in SMA, though EDGAR-HTAP v3 showed more CO emissions in South Korea. However, KORUS v5 had the smallest CO emissions in China, being 7 % (9 %) lower than that in EDGAR-HTAP v2 (v3). The TOL emissions in KORUS v5 were higher than those in EDGAR-HTAP v2 (EDGAR-HTAP v3) by 176 % (98 %) in China. The relative difference of TOL between KORUS v5 and EDGAR-HTAP v2 (EDGAR-HTAP v3) was larger in South Korea by 263 %. On the other hand, EDGAR-HTAP v3 had larger total NMVOC emissions over China than EDGAR-HTAP v2 and KORUS v5 by 38 % and 27 %, respectively. These discrepancies in VOC emissions may lead to a change in the NOx-/VOC-sensitive regime and O3 production efficiency in South Korea and China. The sensitivity of O3 formation to NOx emission has discrepancies by its regime; a reduction in NOx leads to a decrease in O3 in the NOx-limited regime, while in the VOC-limited regime (or NOx-saturated regime), it results in an increase in O3. This will be further discussed in Sect. 3.2.
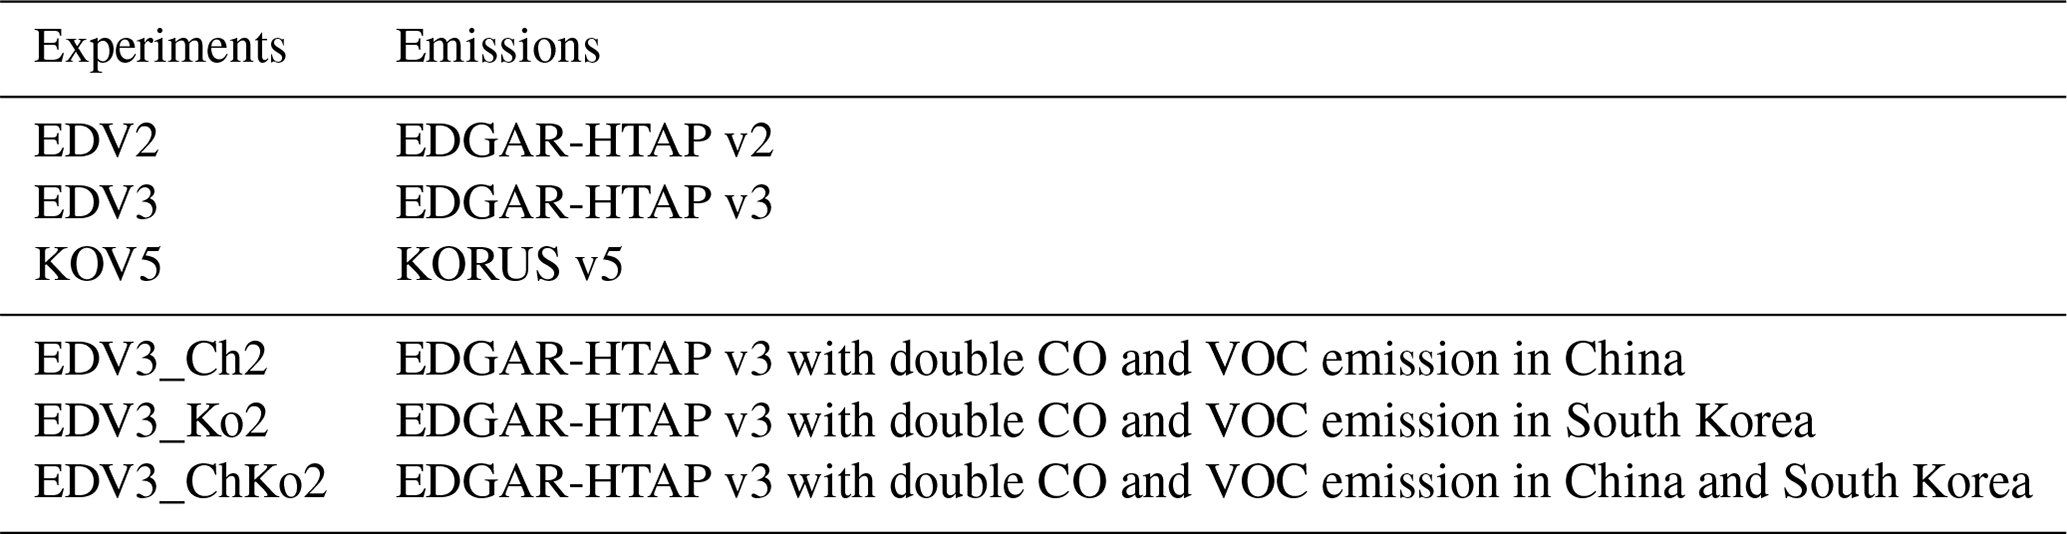
2.2.2 The model experiments
The model experiments are summarized in Table 1. The simulations using EDGAR-HTAP v2 and v3 and KORUS v5 emissions are named as EDV2, EDV3, and KOV5, respectively. In this study, we found consistent underestimation of CO, HCHO, TOL, and XYL for all emissions by −40 % (±2 %), −25 % (±1 %), −67 % (±21 %), and −53 % (±18 %), respectively, compared to observations from the DC-8 in South Korea. Here TOL and XYL are lumped species including toluene and xylene, respectively. This is in line with the results reported by Park et al. (2021), who found that almost every model underestimated CO. Underestimation of CO in East Asia is a well-known feature revealed by many studies. For example, Gaubert et al. (2020) mentioned that CAM-Chem underestimates CO during the KORUS-AQ campaign period and presented a CO compensation method utilizing data assimilation with CO observations. Wada et al. (2012) pointed out that EDGAR v4.1 underestimates anthropogenic CO emissions in China by 45 % compared to observation-based estimations of CO emissions. Moreover, underestimation of VOC is also found for all anthropogenic emission inventories. Kwon et al. (2021) estimated top-down emissions of anthropogenic VOCs utilizing the Geostationary Trace gas and Aerosol Sensor Optimization spectrometer (GeoTASO). They found that top-down VOC emissions were up to 6.9 times higher than bottom-up emissions (KORUS v5).
For all emission inventories in simulations with WRF-Chem, O3 is underestimated at most ground-based observation sites in South Korea. To figure out the potential causes of negative biases of O3 in South Korea, we conducted three additional model simulations using EDGAR-HTAP v3 that shows the lowest bias of O3 concentrations compared to DC-8 than EDGAR-HTAP v2 and KORUS v5 over the SMA; the mean biases are −16.9, −14.2, and −18.1 ppb with EDV2, EDV3, and KOV5, respectively. Two simulations have twice the anthropogenic CO and VOC emissions in China (EDV3_Ch2) and South Korea (EDV3_Ko2), respectively, and the third simulation uses double CO and VOC emissions in both China and South Korea (EDV3_ChKo2) to investigate possible improvements in the simulated O3 and CO from these emission changes. To simulate possible strategies to improve surface O3 simulations over China and South Korea, we incorporated four additional emission scenarios involving the reduction of NOx and/or VOC emissions over China. Specifically, we considered the cases with a 50 % reduction in NOx emissions only, a 50 % reduction in VOC emissions only, a simultaneous 50 % reduction in both NOx and VOC emissions, and a 75 % reduction in NOx emissions only. For more details, refer to Sect. 4 (Discussion).
2.3 Observations
2.3.1 Meteorological data
The meteorological field that WRF-Chem reproduced is evaluated with the surface synoptic observation (SYNOP) data operated by the World Meteorological Organization (WMO) (http://www.meteomanz.com, last access: 15 June 2022). Surface temperature, relative humidity, and surface wind speed are adopted for model validation. As the SYNOP data are provided every 3 or 6 h, we selected model data when the observation data are available. There were 271 sites in China, Taiwan, and Hong Kong SAR and 48 sites in South Korea.
2.3.2 Ground-based observations
The surface observation network used in this study was obtained from AirKorea in South Korea and the China Ministry of Ecology and Environment (MEE) in China. The AirKorea observation network provides 1 h measurements of NO2, SO2, CO, O3, PM10, and PM2.5 at suburban, background, roadside, city, and port sites (http://www.airkorea.or.kr, last access: 28 June 2017). The concentrations of NO2, CO, and O3 are measured using the chemiluminescent, non-dispersive infrared, and ultraviolet photometric methods, respectively. In South Korea, there are indications of positive biases in NO2 surface observations, potentially resulting in overestimations of ∼30 %, particularly at suburban sites in spring (Jung et al., 2017). The model data with 28×28 km2 horizontal resolution were linearly interpolated to the 365 sites in South Korea, and we selected NO2, O3, and CO for model validation.
The Chinese observations were provided by MEE through the website (https://beijingair.sinaapp.com, last access: 24 March 2021). Surface NO2 over China was measured using a molybdenum converter, which has the potential for positive biases due to other NO2-related oxidation products (Dunlea et al., 2007). CO was measured using infrared absorption (Zhang and Cao, 2015), and there were 1454 stations in China during the campaign period.
For validation of NO2 and HCHO vertical column density, data from the Pandora spectrometer were used, which the model reproduced with emission inventories at the Olympic Park site (37.5232° N, 127.126° E). The HCHO data from Pandora are corrected because of internal off-gassing to avoid positive biases (Spinei et al., 2021). At the same observation site, surface NO2 was also measured by a KENTEK NOx analyzer with photolytic method, and surface O3 was measured using the same instrument. Ground-based HCHO was measured using Aerodyne QCL. We compared the observed diurnal cycle of vertical column and surface concentrations of NO2 and HCHO with the model simulations utilizing EDV2, EDV3, and KOV5. We also used ground-based VOC data from gas chromatography flame ionization detector (GC-FID) operated by the Seoul Research Institute of Public Health and Environment (SIHE).
2.3.3 Aircraft data
The DC-8 research aircraft, operated by NASA, performed multiple flight measurements with a variety of measuring instruments. We utilized 1 min interval merged data of O3, NO2, CO, HCHO, and VOC along the 20 flight paths (Fig. 2). The nearest WRF-Chem grid is selected and then temporally and vertically interpolated to the aircraft data using linear interpolation to fully utilize the observations. Atmospheric NO2 and O3 concentrations were measured using a four-channel chemiluminescence instrument, with an uncertainty of 100 pptv +30 % and 5 ppbv + 10 %, respectively. CO concentrations were observed using a diode laser spectrometer, with an uncertainty of 2 % or 2 ppbv. The Compact Atmospheric Multi-species Spectrometer (CAMS) was used to measure HCHO concentration, with a possible 3 % systematic error (Richter et al., 2015). We also utilized data from the Whole Air Sampler (WAS) to analyze VOC species from different emission inventories (Colman et al., 2001). In this study, we focused on DC-8 observations below a height of 2 km to concentrate on planetary boundary layer (PBL) chemistry. The observation height was determined by GPS altitude above ground level.
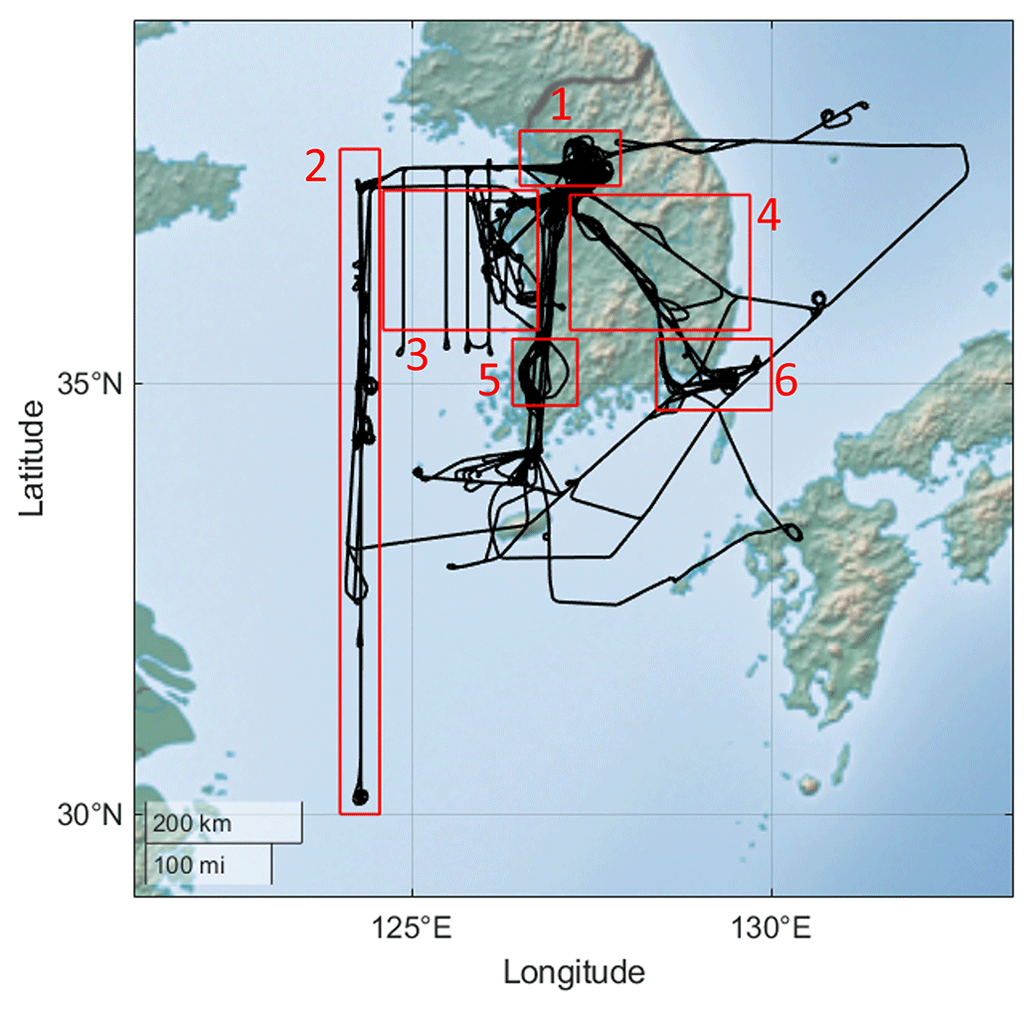
Figure 2The DC-8 flight paths during the KORUS-AQ campaign period in black and six regional boxes in red (1 – Seoul Metropolitan Area (SMA), 2 – Yellow Sea. 3 – Chungnam, 4 – Kyungbuk, 5 – Gwangju, 6 – Busan).
3.1 The model meteorology simulations
The model temperature and relative humidity were compared with surface observations in China and South Korea. The model-simulated temperature had a slight negative mean bias of −0.91 °C (correlation coefficient R=0.90) in China, with the largest negative bias in southwestern China. In South Korea, the mean bias was −1.71 °C (R=0.88). The simulated relative humidity showed a negative bias of −20 % to −10 % in the North China Plain (NCP) area and a positive bias of 10 % to 20 % in southwestern China. There was a negative bias of relative humidity over the west coastal area and a positive bias of 10 % to 20 % at most observation stations in South Korea. The correlation coefficients between the model relative humidity and observations were 0.85 and 0.76 for China and South Korea, respectively. Overall, the comparisons showed decent model simulations of meteorology. A negative temperature bias could result in a reduction of isoprene emissions, as illustrated in Fig. S3, compared to the estimates based on accurately simulated temperature.
During the KORUS-AQ campaign period, WRF-Chem accurately simulated the daytime PBL height from a laser ceilometer (CL-31, Vaisala Inc., Finland) observed at Yonsei University in Seoul, South Korea (Lee et al., 2019). But, Travis et al. (2022) have indicated the possibility of PBL height underestimations by CTMs. Furthermore, due to limitations of the instrument, the ceilometer has potential to inadequately estimate nighttime PBL height. This is primarily attributed to the method based on aerosol gradients (Jordan et al., 2020). Therefore, the interpretation of simulated nighttime concentrations of air pollutants should be approached with caution. More analysis of meteorological fields, including PBL height, can be found in the Supplement (Table S7 and Figs. S4–S5).
Table 2Comparison of the ground-based hourly O3, NO2, and CO observations with the simulations utilizing EDGAR-HTAP v2 (EDV2) and v3 (EDV3) and KORUS v5 (KOV5) in each regional box (unit: ppb). N is the number of samples. R is the correlation coefficient.
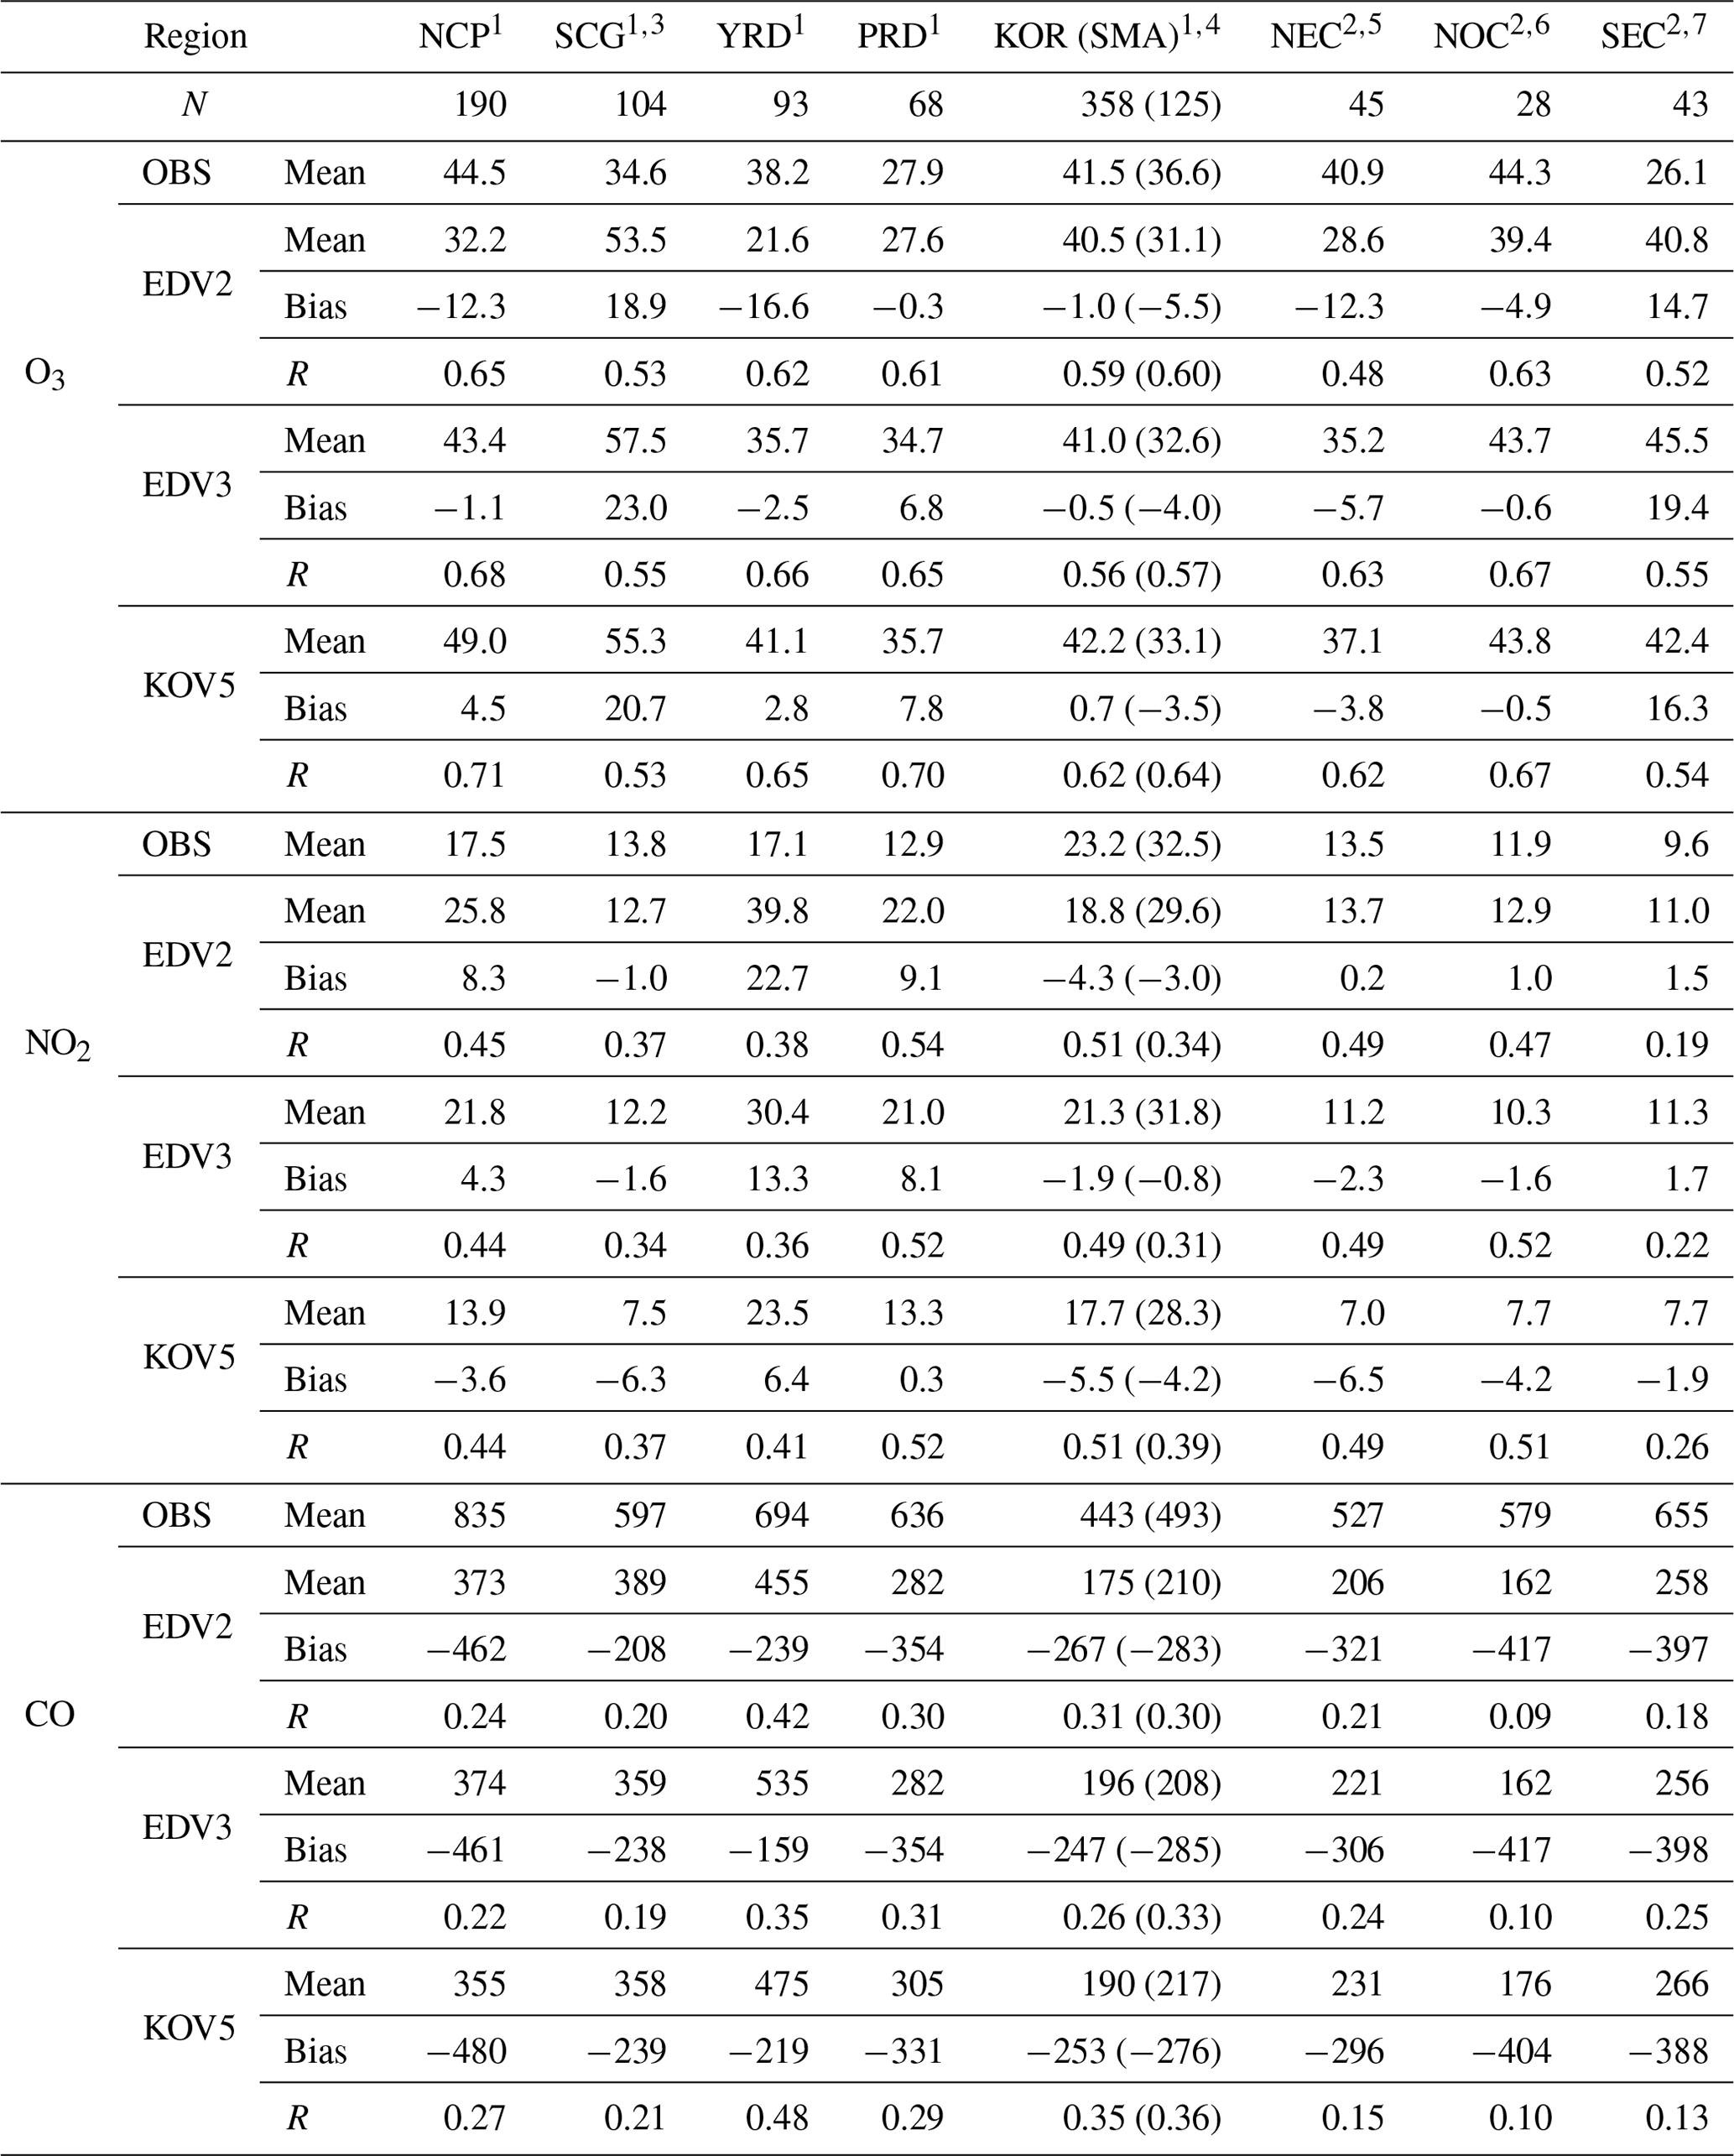
1 Urban area. 2 Non-urban area. 3 Sichuan–Chongqing–Guizhou. 4 South Korea. 5 Northeastern China. 6 Northern China. 7 Southeastern China.
3.2 Evaluations with routine surface chemical observational data
The study compared simulated concentrations of O3, NO2, and CO with data from routine surface observational networks (Table 2 and Figs. 3–7). First, the diurnal variations of the model O3 using different emissions inventories were compared with observations for each subregion (Table 2 and Fig. 3). Overall, all emission inventories successfully reproduced diurnal variations and absolute values of O3 for most regions, but there were notable discrepancies in several regions.
Table 3Comparison of total NOx, TOL, XYL, and biogenic isoprene emissions and the formaldehyde-to-NO2 ratio (FNR) for different emission data sets in each regional box. The MEGAN biogenic isoprene emissions are equally applied to all simulations using different emission data. (unit: mol s−1 for emissions).
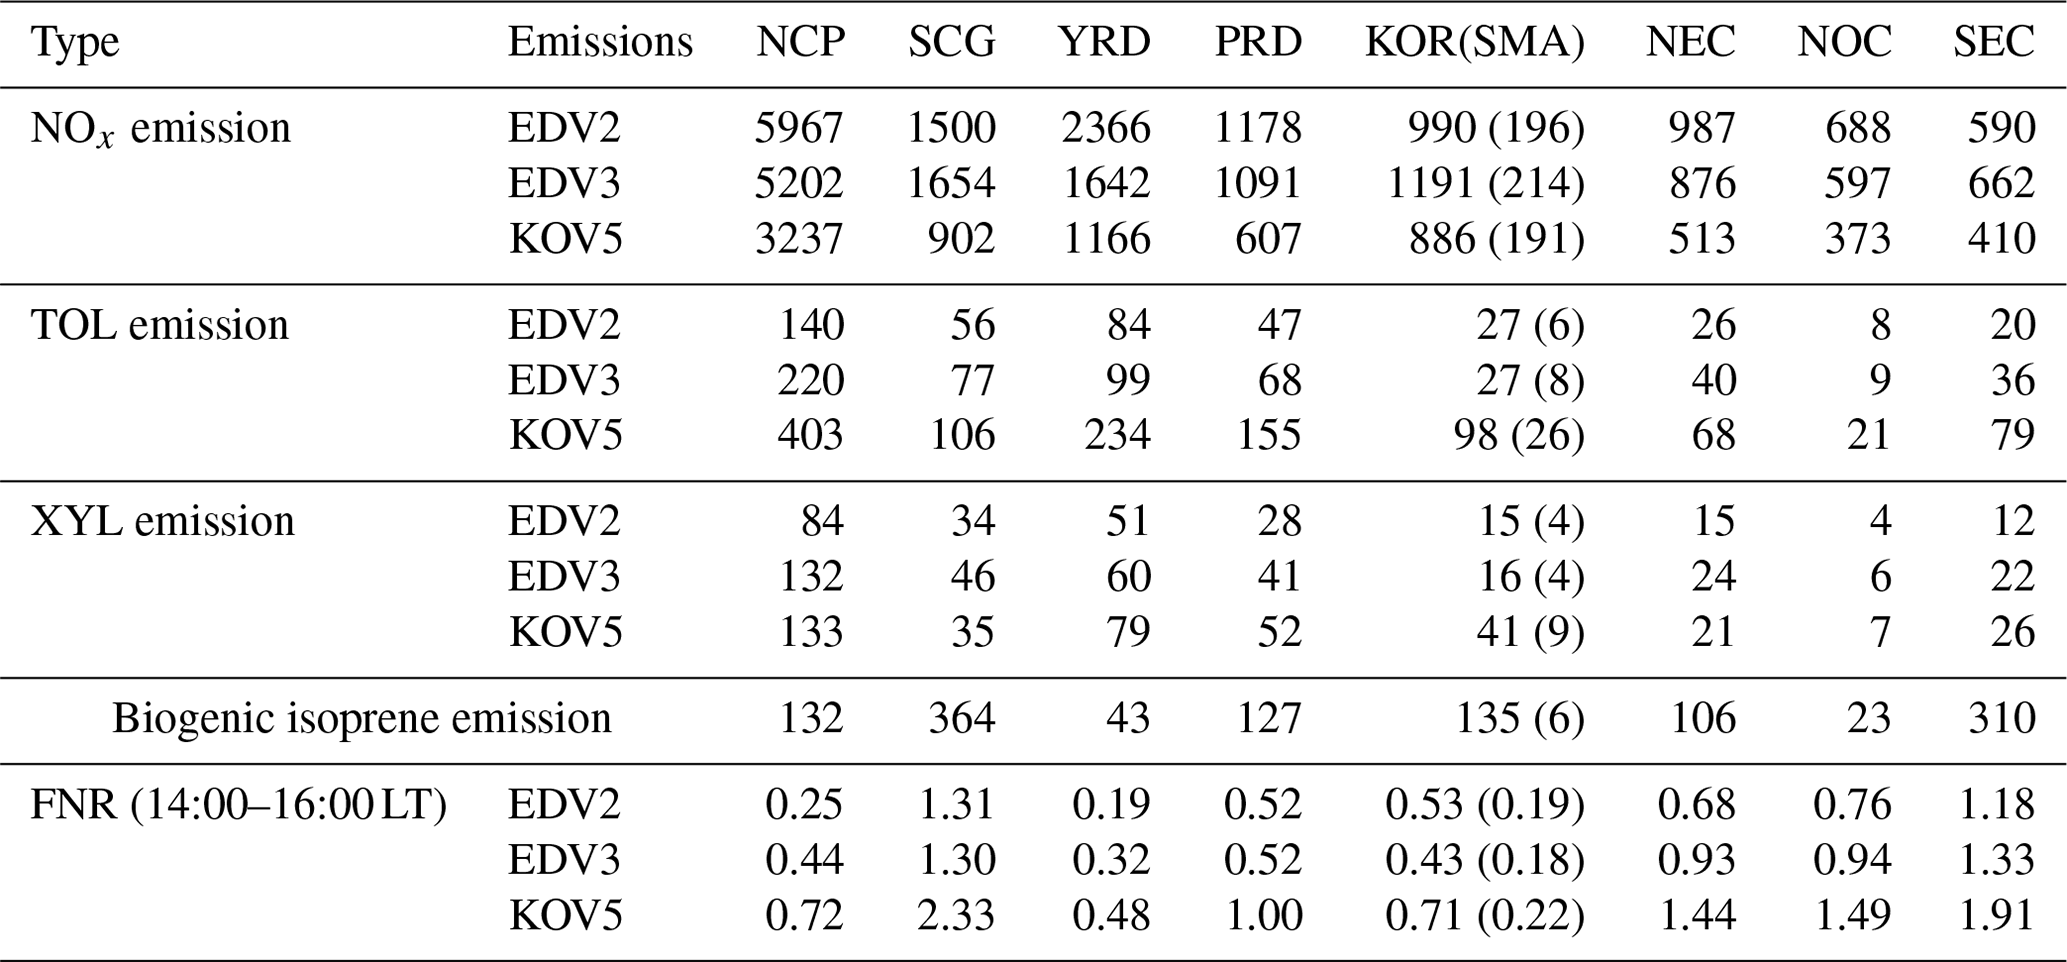
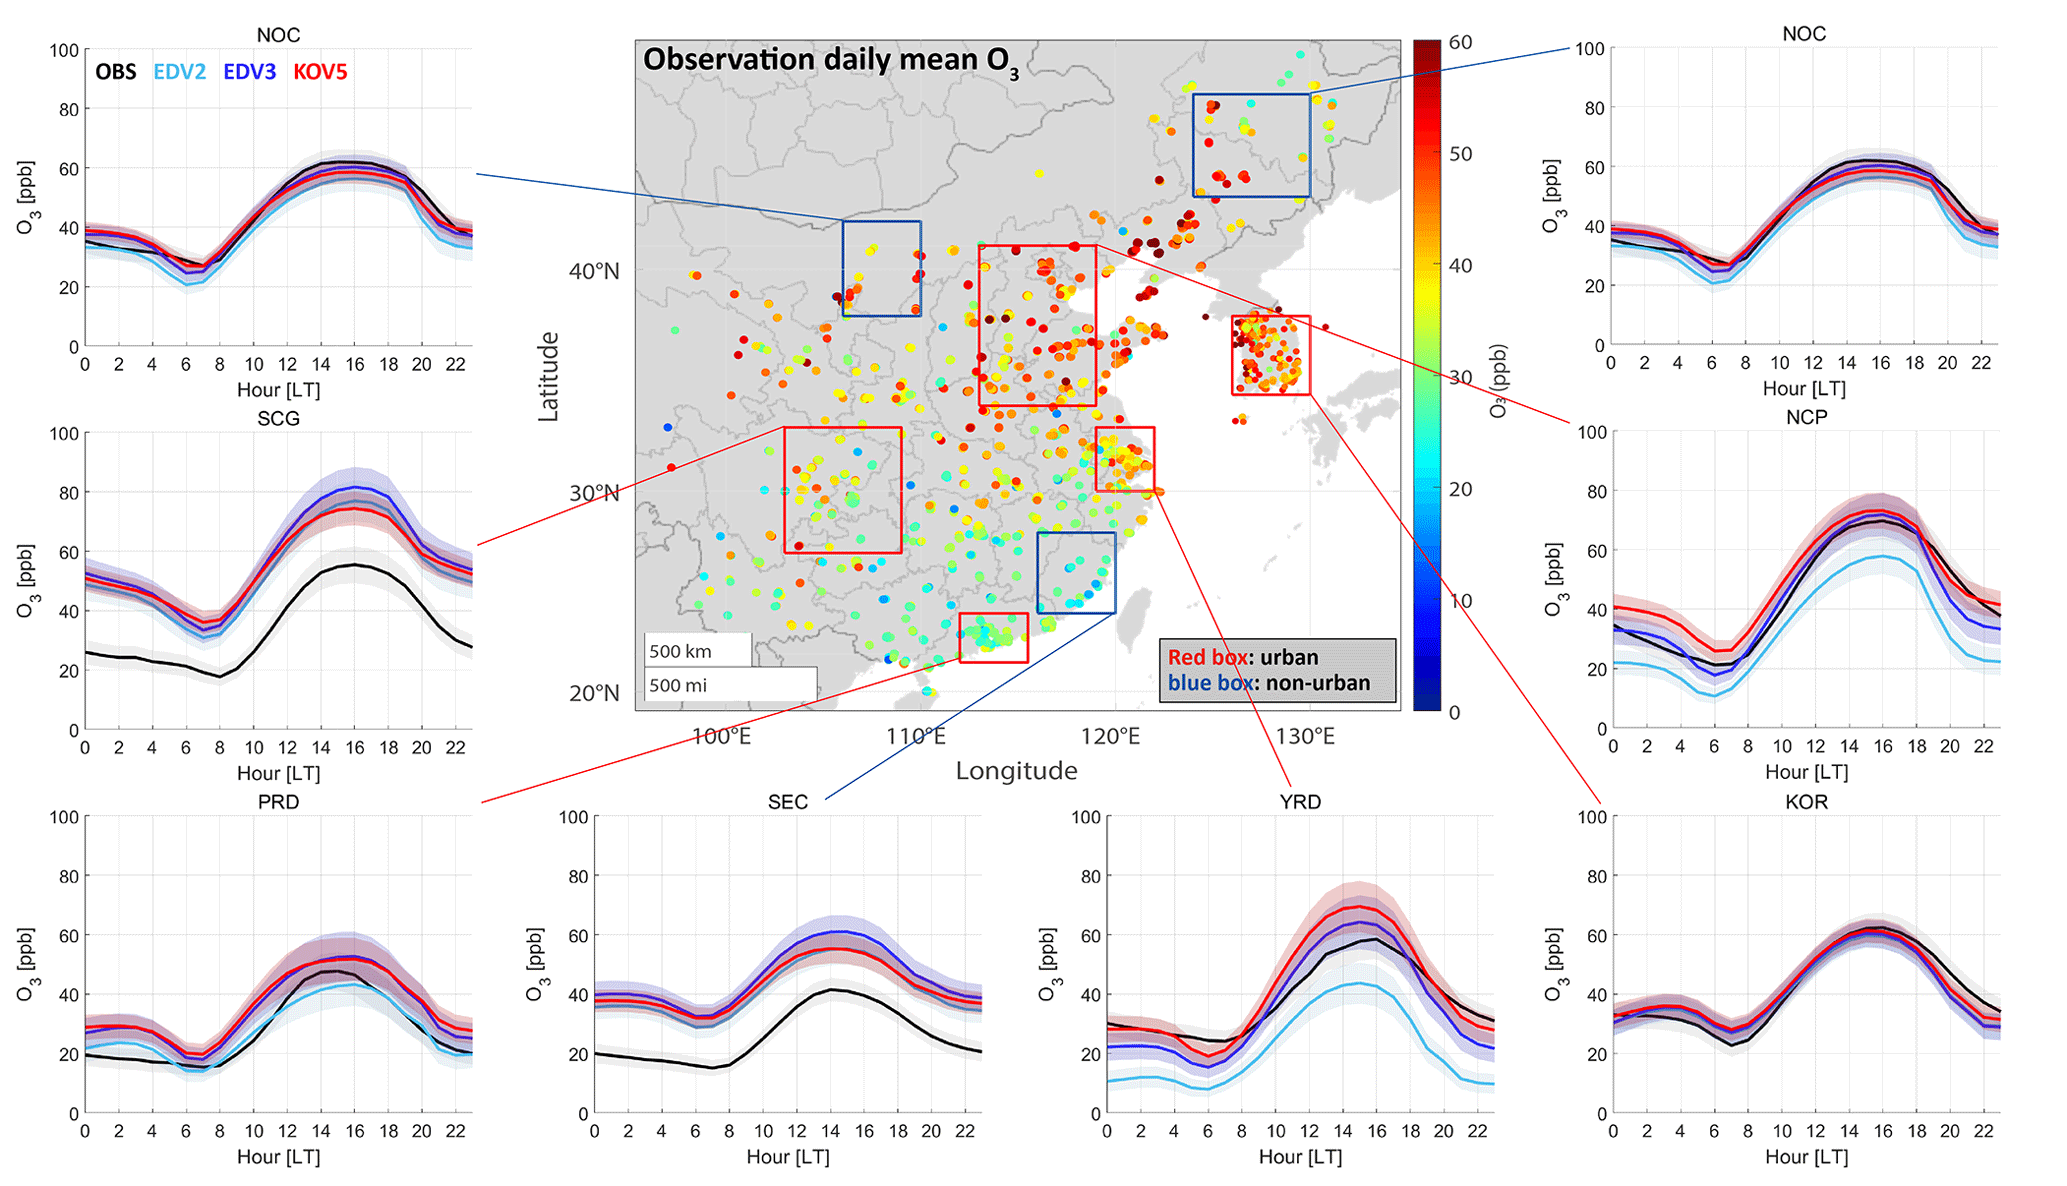
Figure 3Averaged O3 concentrations from ground-based observations and model simulations over the areas that distinguish the urban (red box) and non-urban (blue box) region (central plot). Box-averaged diurnal cycle (solid lines) of O3 and standard deviations (filled area) from observations (black), EDV2 (sky blue), EDV3 (blue), and KOV5 (red) are shown in local time. The results are shown for NOC, SCG, PRD, SEC, YRD, KOR, NCP, and NEC.
In the North China Plain (NCP) region, EDV2 led to a negative model O3 bias (−12 ppb), with R=0.65, while EDV3 and KOV5 simulated O3 better, with reduced biases and increased correlations (R=0.68–0.71). The high NOx emissions relative to the VOC emissions in NCP led to a low formaldehyde-to-NO2 ratio (FNR) (<1), suggesting that the NCP area is in a VOC-limited regime with all emission inventories (Table 3). Due to the elevated reactive VOC emissions in EDV3 and KOV5 compared to EDV2, both EDV3 and KOV5 show improved O3 simulations. Similarly, EDV2 had a negative O3 bias (−17 ppb), with R=0.62 in the Yangtze River Delta (YRD) area, but EDV3 and KOV5 much improved the simulations, which was also observed in the Northeastern China (NEC) area. However, the model O3 concentrations based on the three emission inventories were overestimated in the Sichuan–Chongqing–Guizhou (SCG) and Southeastern China (SEC) area. In SCG and SEC, WRF-Chem simulated higher biogenic isoprene emissions compared to anthropogenic TOL and XYL emissions by up to a factor of 10, leading to a high FNR (>1). In the Pearl River Delta (PRD), EDV2 showed the lowest bias (−0.3 ppb) compared to EDV3 and KOV5 because EDV3 and KOV5 have elevated anthropogenic VOC emissions as well as enhanced biogenic isoprene emissions under a VOC-limited regime (Table 3). In the suburban area of Northern China (NOC), all emission inventories simulated hourly O3 concentrations reasonably well.
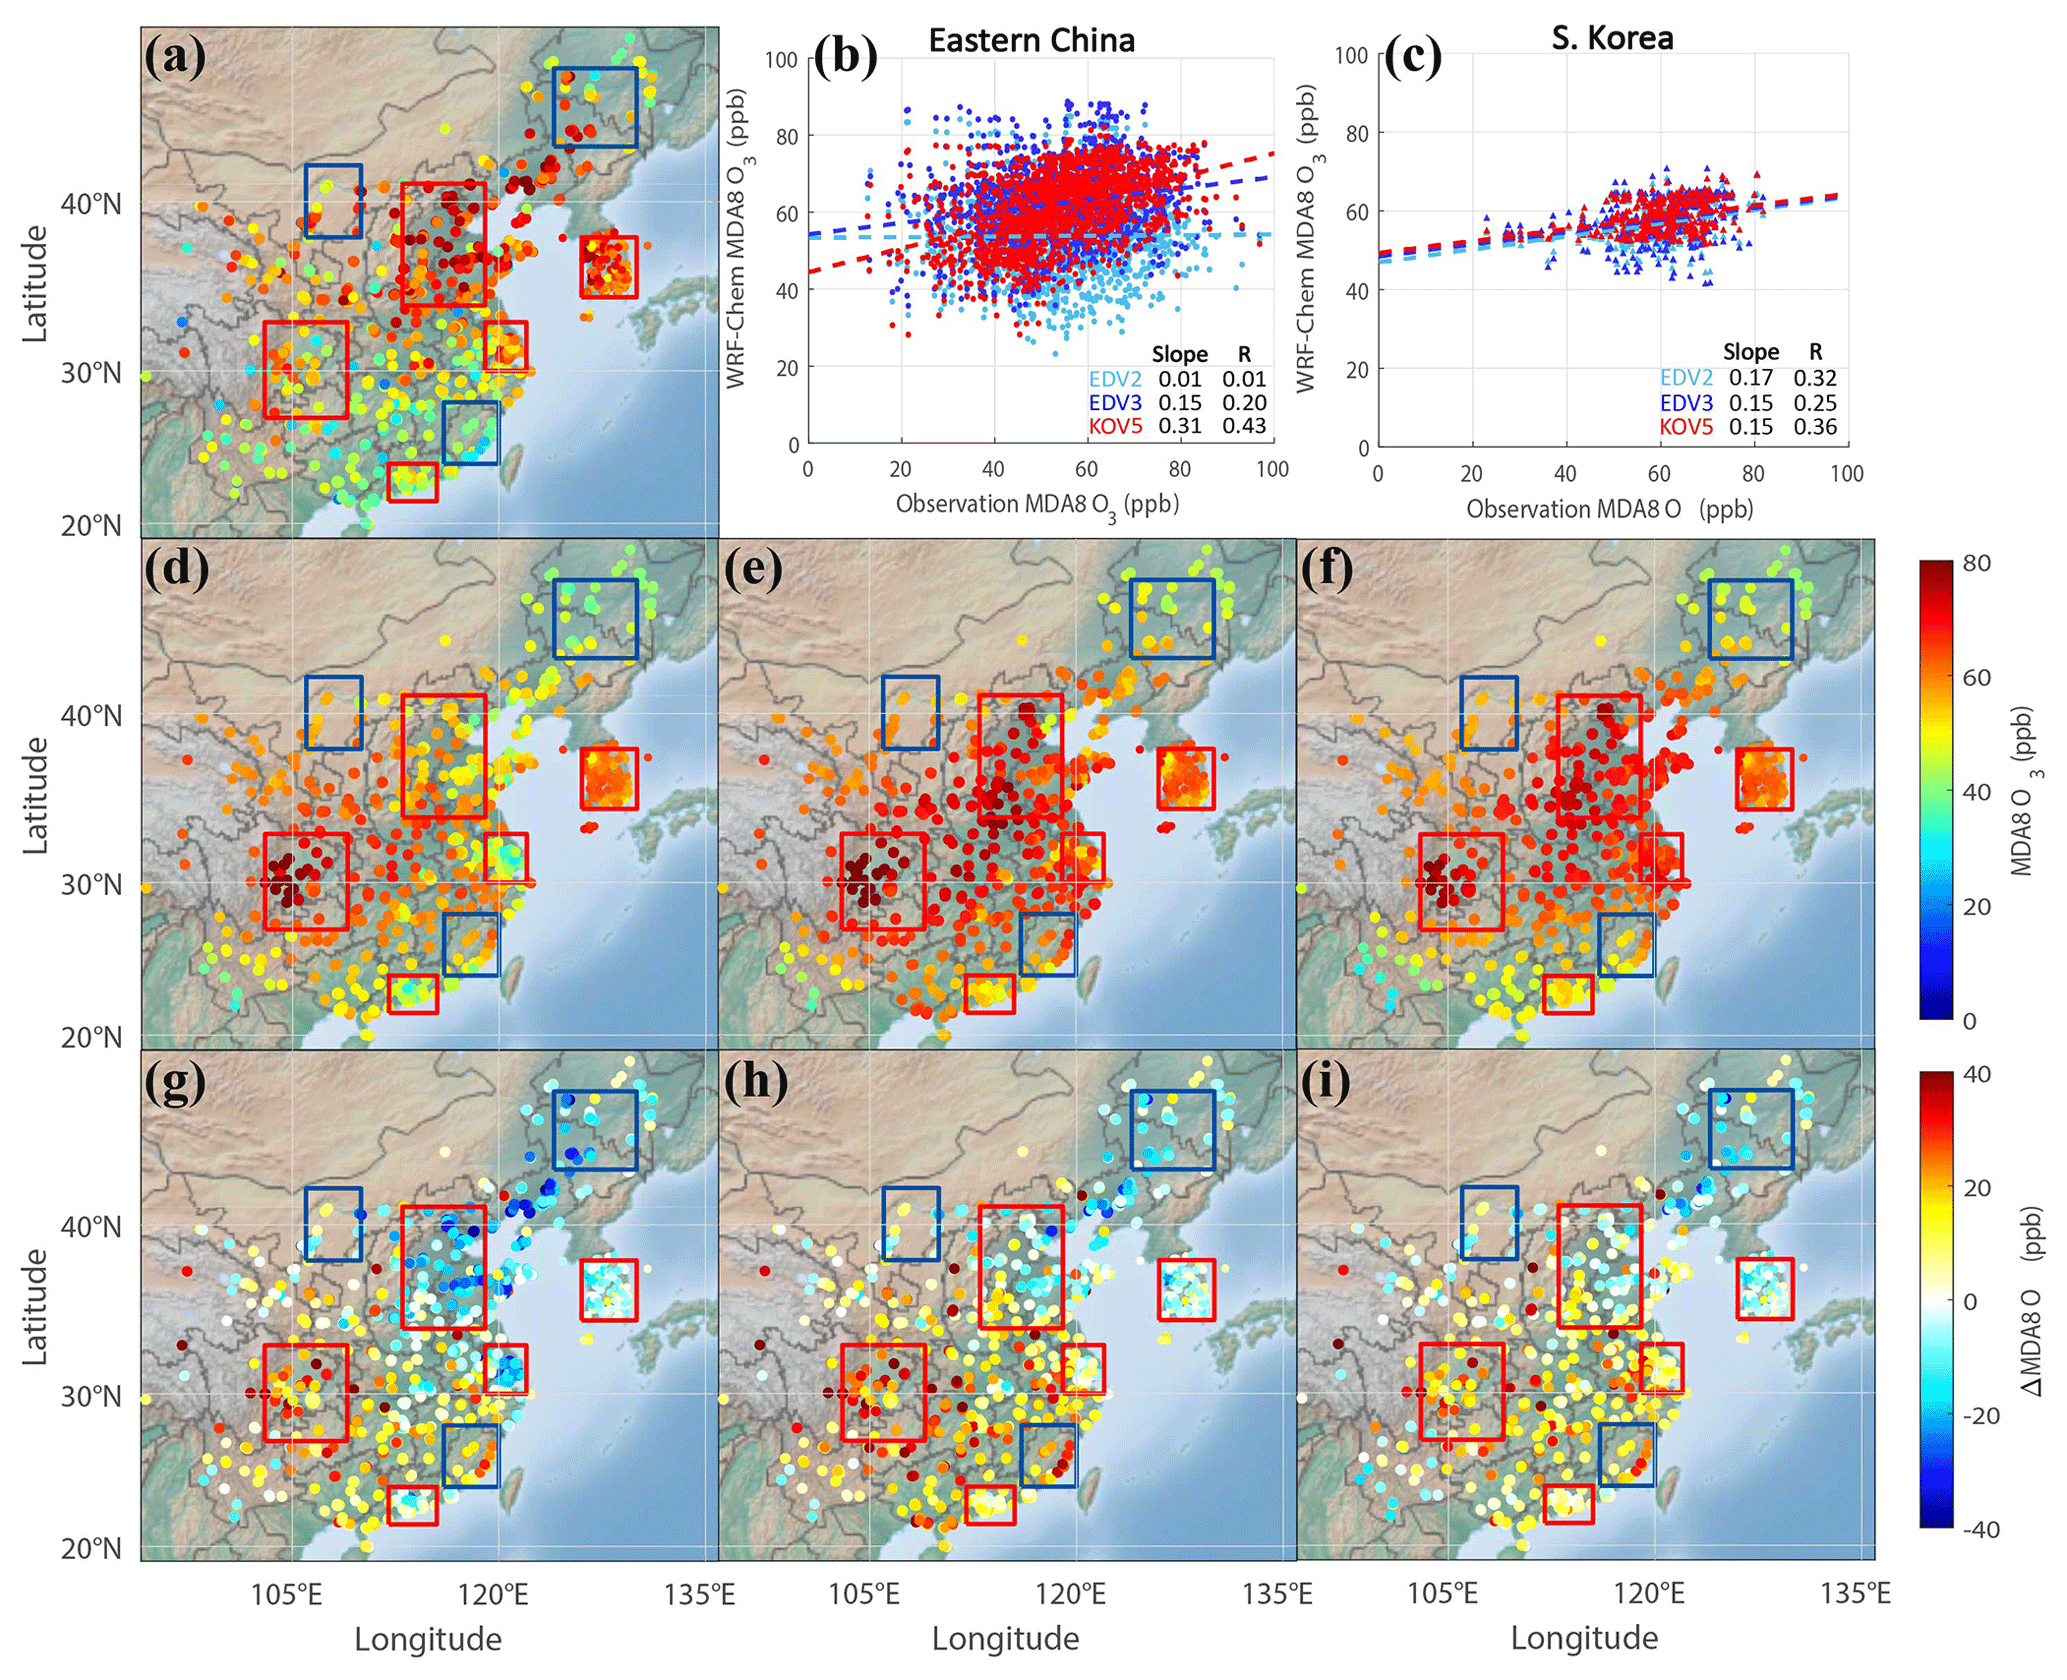
Figure 4Comparison of (a) the campaign-averaged ground-based maximum daily average of 8 h O3 (MDA8 O3) (unit: ppb) observations and WRF-Chem simulations with (d) EDGAR-HTAP v2 (EDV2), (e) v3 (EDV3), and (f) KORUS v5 (KOV5) and (g, h, i) the differences between the observations and model results. The subregions are presented with red (urban) and blue (non-urban) boxes. The scatter plots comparing averaged observations and the three emission-based WRF-Chem simulations (sky blue; EDV2, blue; EDV3, red; KOV5) are shown in (b) and (c) for Eastern China and South Korea, respectively. (a, d–e) Color-filled circles in (a), (d), (e), and (f) represent the averaged MDA8 O3 for the whole campaign period (1 May to 10 June).
Averaged O3 was simulated well in South Korea (KOR), with low biases (−1 to 0.7 ppb), but a negative bias appears over the Seoul Metropolitan Area (SMA) with all emissions (−5.5 to −3.5 ppb) (Table 2). WRF-Chem simulations indicate SMA to be a highly NOx-saturated region (FNR <0.2), resulting in it being VOC-sensitive for O3 production. The underestimated model O3 levels in this region suggest the possibility of insufficient anthropogenic VOC emissions in SMA across all emission inventories (Table 3). A detailed discussion will be provided in Sect. 3.3.
The study also analyzed the mean values of MDA8 O3 concentration at each site and their spatial distributions for the entire campaign period (Fig. 4). The spatial distributions of the model MDA8 O3 were not correlated well with those of the observations. But, notable disparities were observed in simulating MDA8 O3 when the different emissions were used. For the north and eastern part of China including Beijing and Shanghai, large negative biases disappear when using EDV3 and KOV5. KOV5 only shows a significant correlation with the surface MDA8 O3 observations (including 929 sites) than EDV2 and EDV3 in China (0.43 versus 0.01, 0.20). The correlations between the time series of the model MDA8 O3 and observations varied at each site, with about 40 %–60 % of sites (depending on the emission inventories) showing a correlation coefficient greater than 0.6 (see Fig. S6), and the locations of these sites were scattered. The correlation slightly improved with hourly O3 concentrations instead of MDA8 O3, with about 50 %–60 % of sites having a correlation coefficient greater than 0.6 (Fig. S6). For this metric, high correlations occurred in pollution hotspots north of 30° N and the south coast of China, in which the ratio of HCHO to NO2 (FNR) was much less than 1, suggesting a VOC-limited/NOx-saturated chemical regime (Fig. S7). The model MDA8 O3 was underestimated for the pollution hotspots, with a low HCHO-to-NO2 ratio located north of 30° N, suggesting a possibility of model underestimations of anthropogenic VOC emissions causing model MDA8 O3 biases at these sites. In contrast, the simulated MDA8 O3 was generally overestimated for sites south of 30° N in which HCHO concentrations were high (Fig. S7). Zhang et al. (2020) reported that simulated biogenic isoprene (ISO) from MEGAN was overestimated compared to observation sites south of 35° N in China.
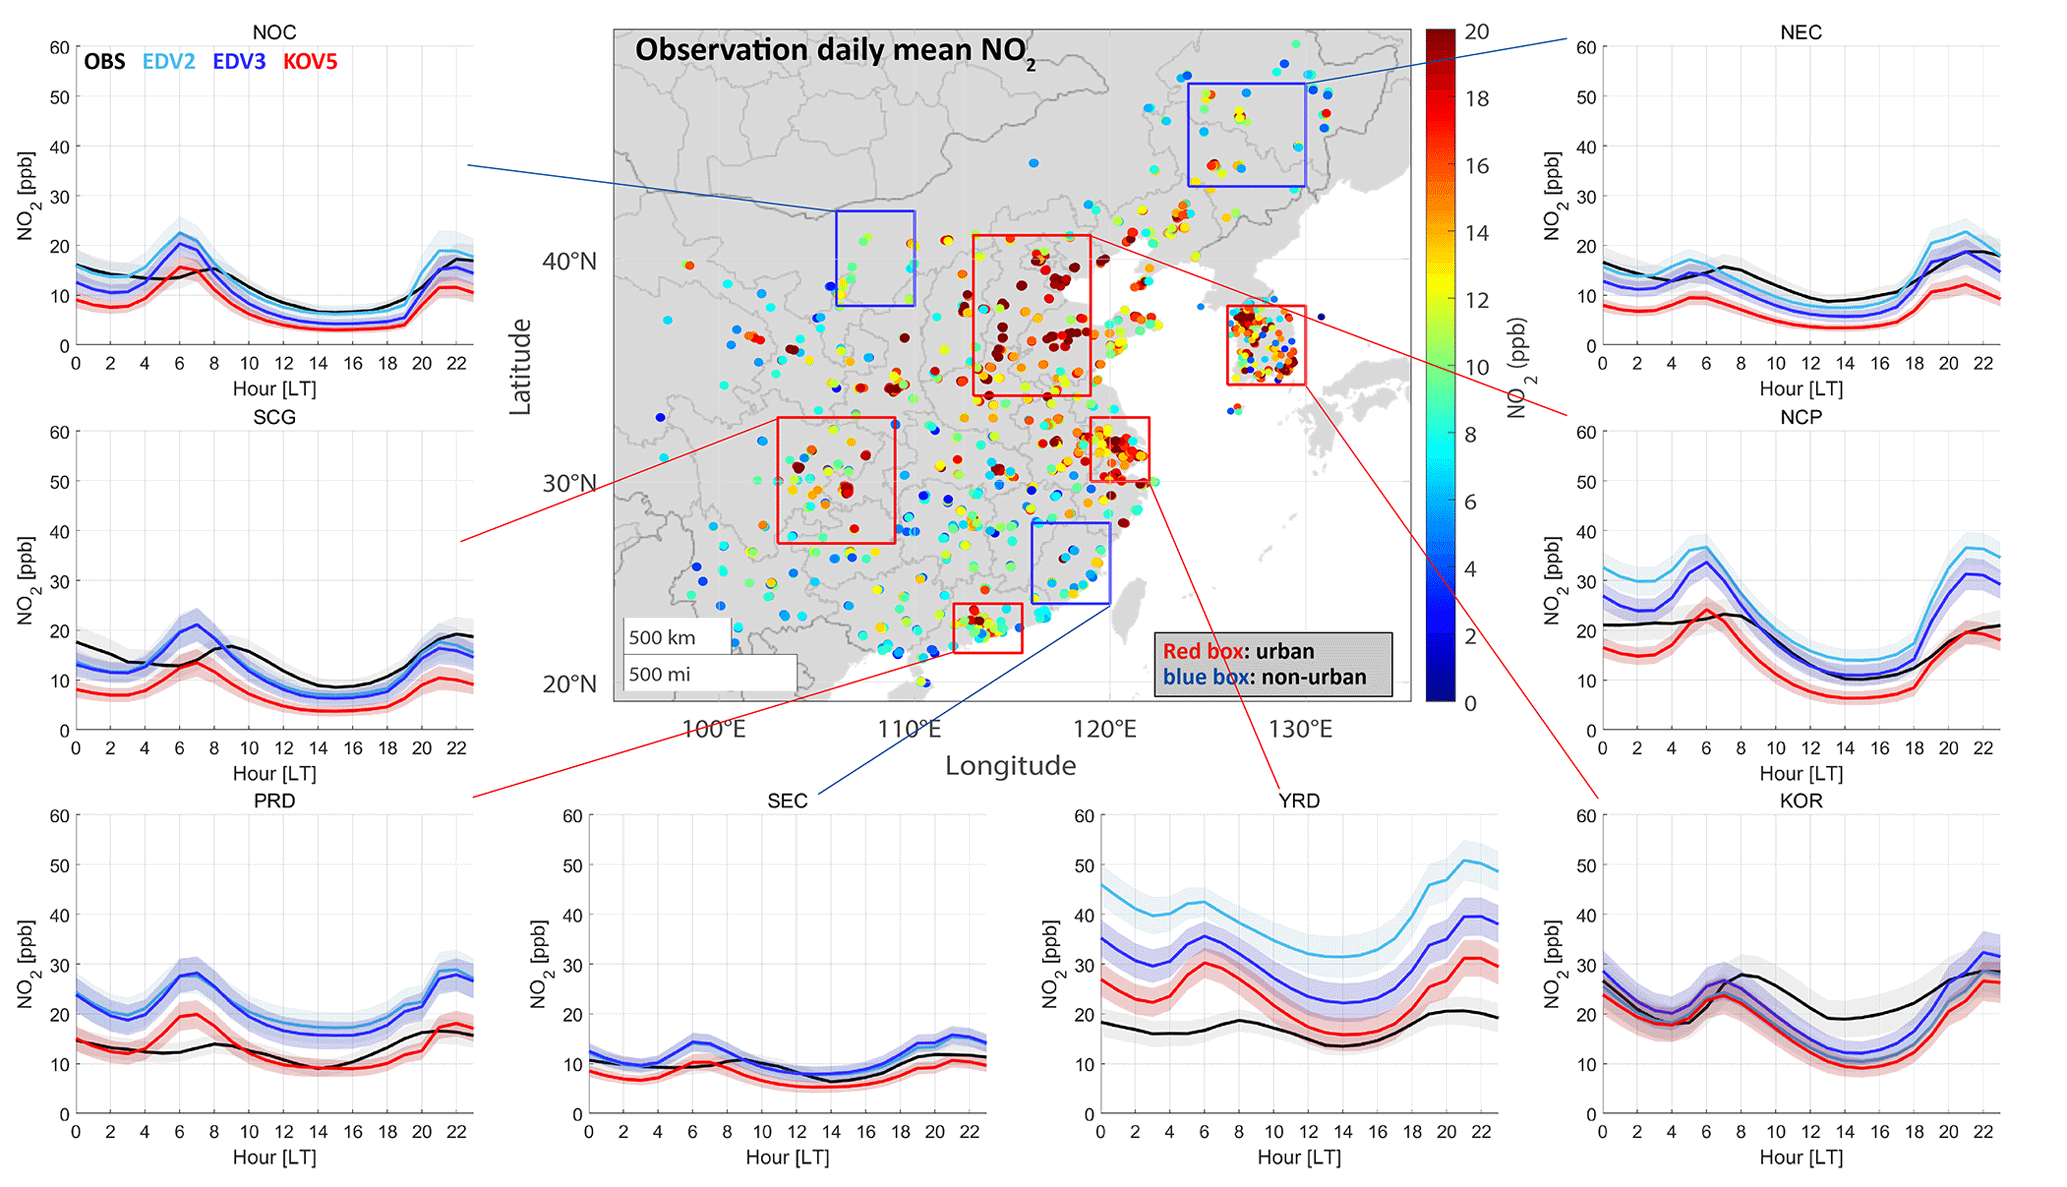
Figure 5The same as Fig. 3 except NO2.
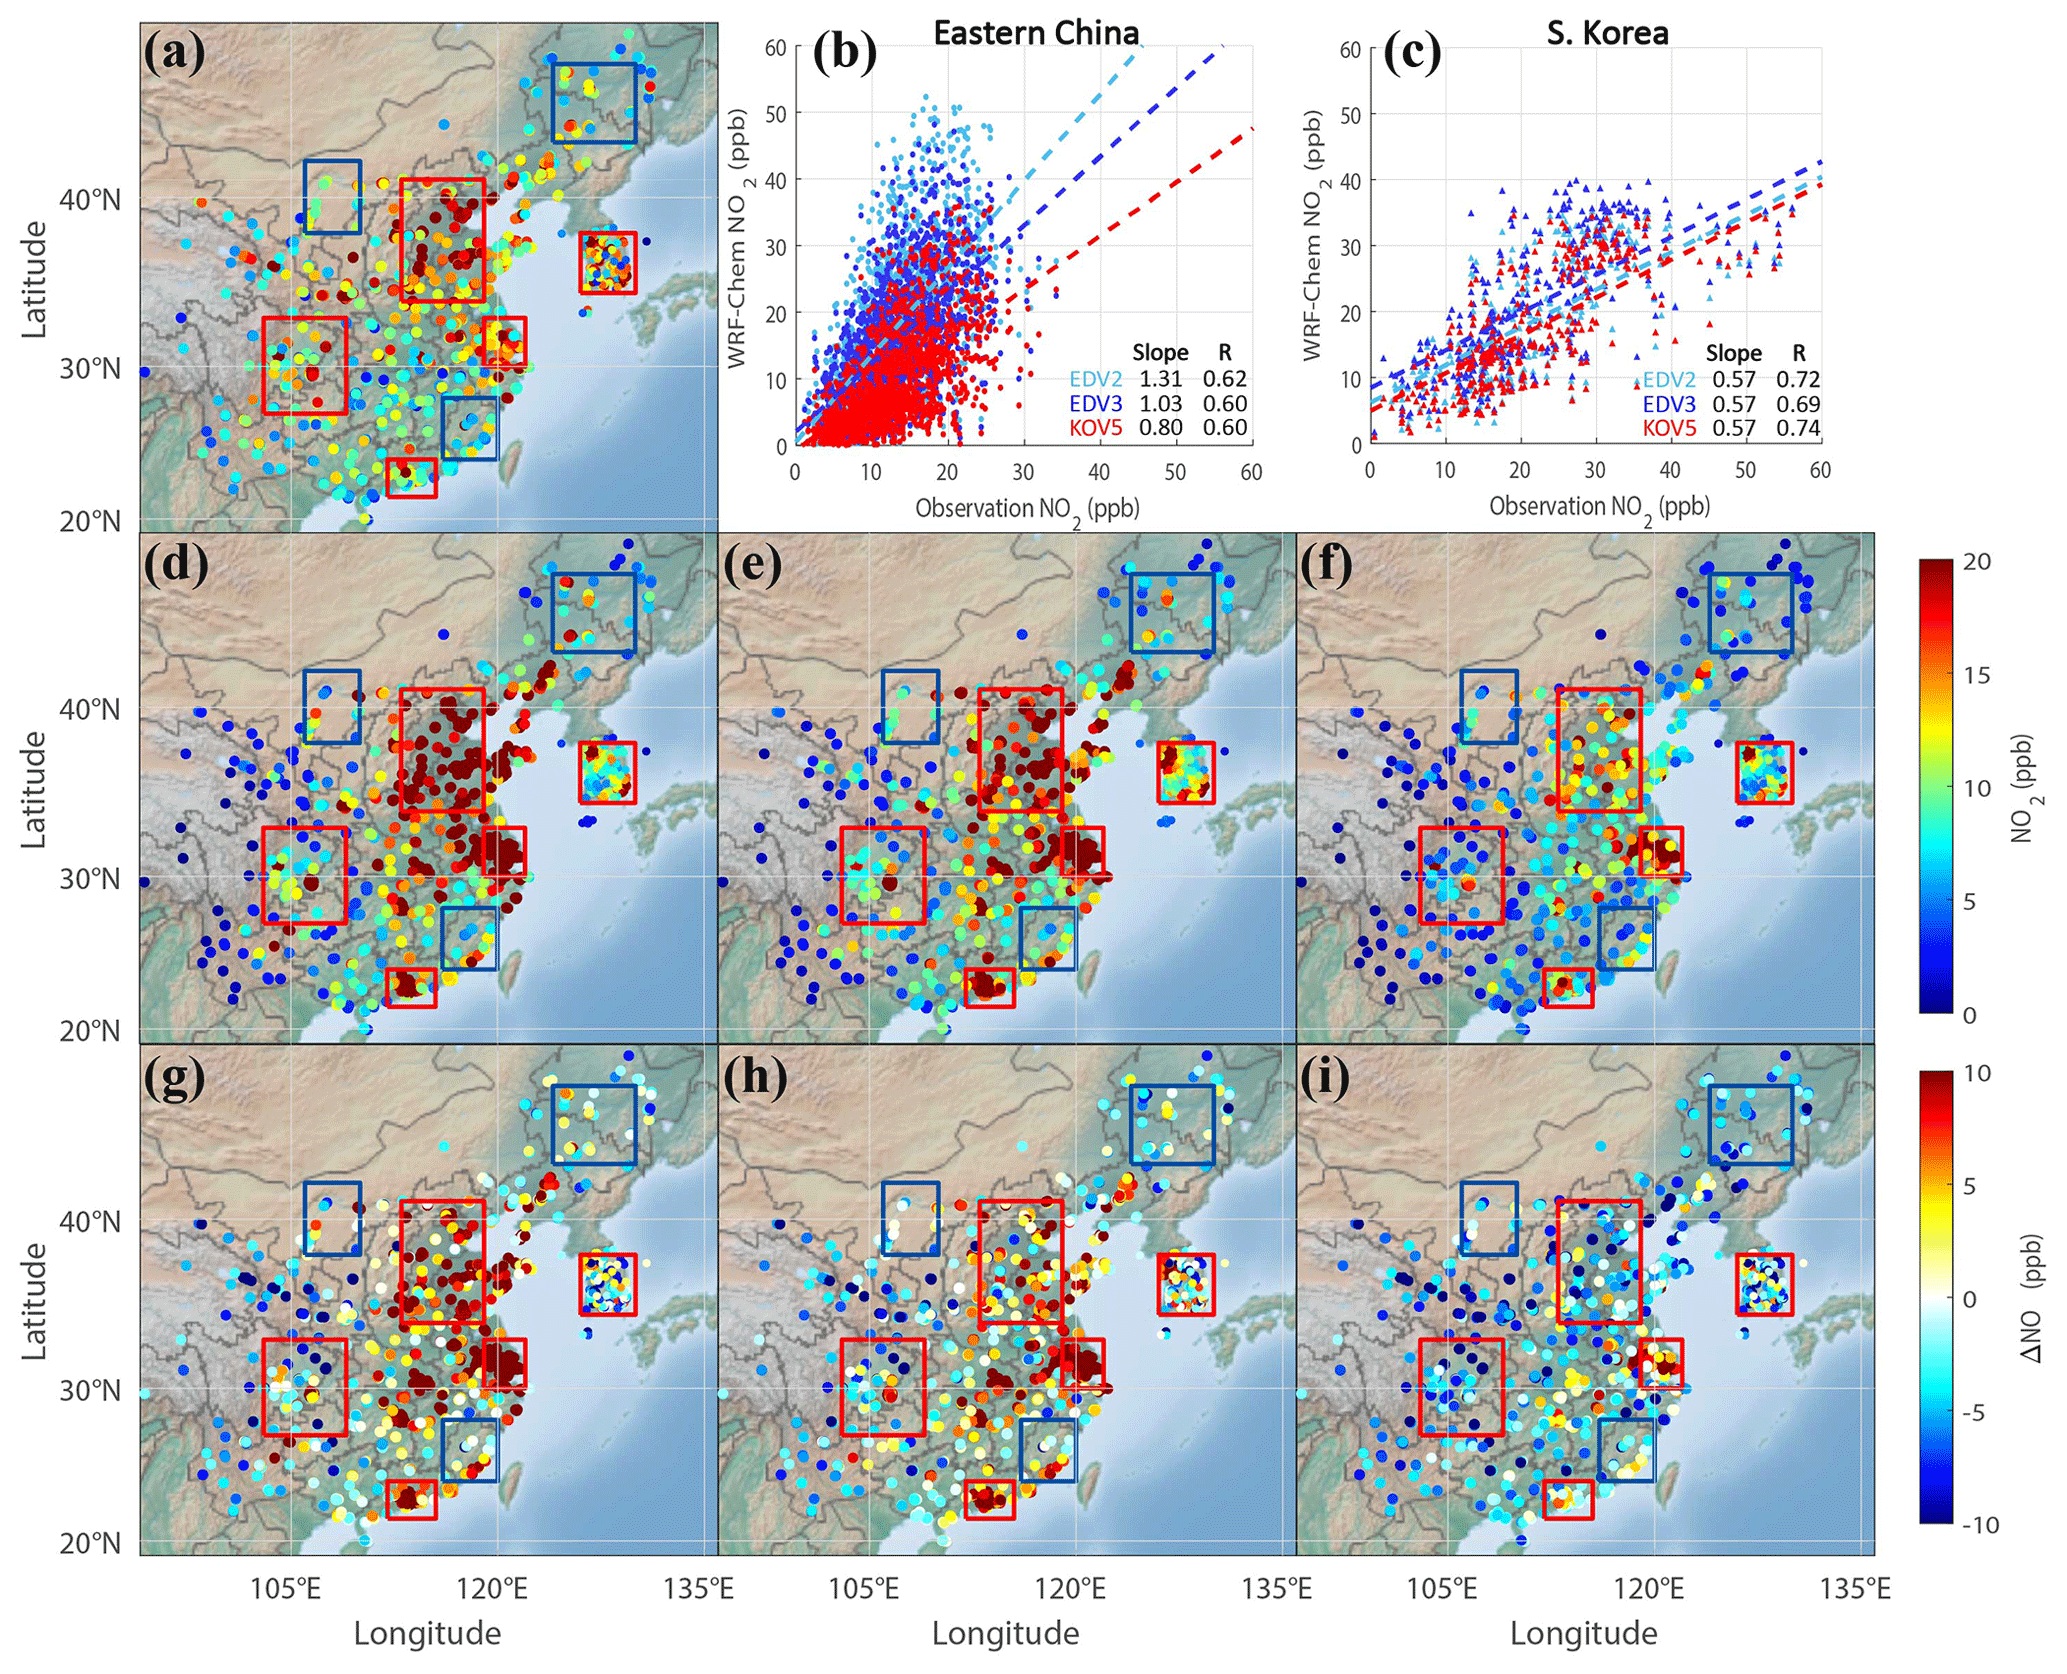
Figure 6The same as Fig. 4 except daily NO2 (unit: ppb).
The EDV2 and EDV3 showed a positive NO2 bias over the YRD, NCP, and PRD regions, which include large cities in China (Table 2 and Figs. 5–6). On the other hand, EDV2 and EDV3 had small negative NO2 biases in the NEC and NOC regions. All models demonstrated reasonable NO2 model performance in the SCG region, where MDA8 O3 was overestimated (Figs. 3 and 5). In the YRD region, there were large positive NO2 biases with EDV2, EDV3, and KOV5 (ranging from 6.4 to 22.7 ppb). Liu et al. (2021) reported that YRD is in a VOC-limited regime when using EDV2. The findings indicated that a reduction in NOx emissions led to an increase in O3 concentrations, while a reduction in VOC emissions resulted in lower O3 concentrations. The O3 in YRD can be attributed to the combined influence of higher anthropogenic NOx emissions and VOC originated from both anthropogenic and biogenic sources (Fig. S7). In contrast, KOV5 underestimated NO2 in the NCP region, while EDV2 and EDV3 did not. All emissions showed significant discrepancies compared to NO2 observations in the SEC area, with a low correlation coefficient (0.19 to 0.26). EDV3 showed the smallest bias of −1.9 ppb (−0.8 ppb) compared to EDV2 and KOV5 in South Korea (SMA). The daily averaged NO2 exhibited spatial distributions similar to MDA8 O3 and CO (Fig. 6). The slopes of regression between the three model simulations and observations were 1.31, 1.03, and 0.8 for EDV2, EDV3, and KOV5, respectively, in China. The correlation coefficients between the simulated NO2 utilizing EDV2, EDV3, and KOV5 and surface data were around 0.6 in China. EDV2, EDV3, and KOV5 demonstrated good correlations with observations in South Korea (R=0.69–0.74). The correlation coefficient (R) was the highest with KOV5 in South Korea (R=0.74).
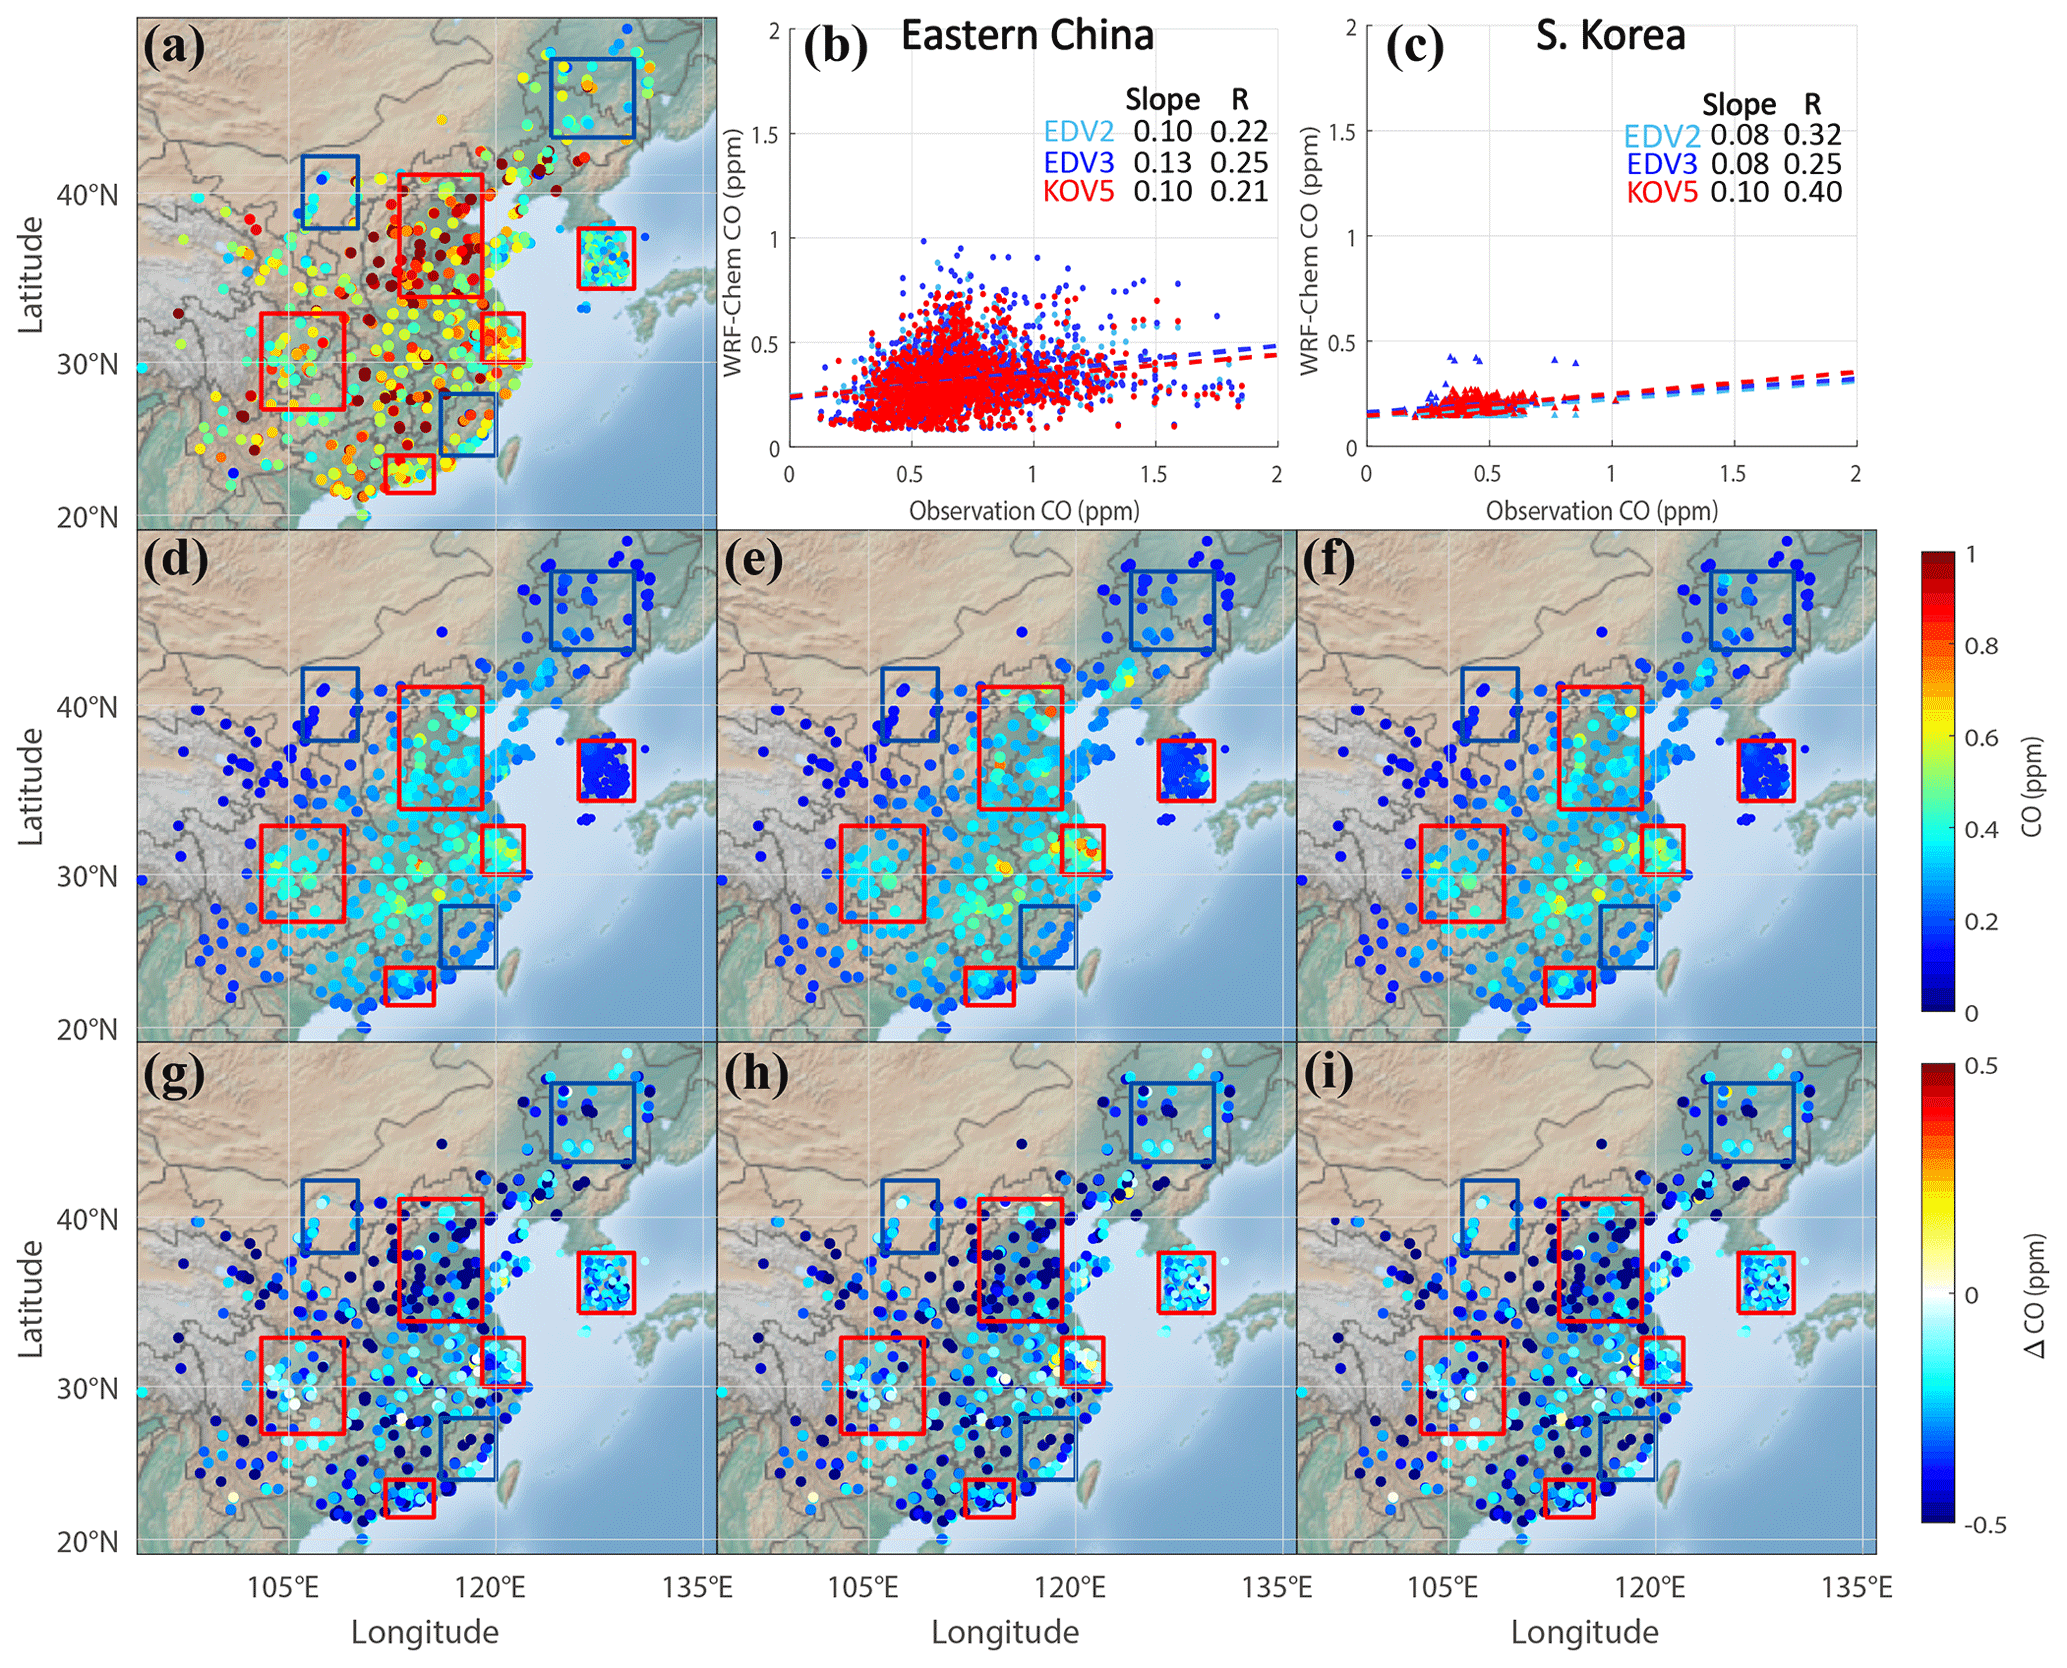
Figure 7The same as Fig. 4 except daily CO (unit: ppm).
Likewise, the diurnal patterns of Ox (i.e., NO2+ O3) are simulated well with all emission inventories (Fig. S8). The spatial distribution and diurnal patterns of Ox are similar to O3 except YRD (Fig. S9). In YRD, the overestimations of Ox with all emission inventories reveal the same issue of NO2 overestimations in Fig. 5. Even though O3 is well simulated in this region, the negative impact of NOx titration to O3 formation is compensated for by the overestimated anthropogenic and biogenic VOC emissions as mentioned above.
The simulated CO was averaged at each site and compared with observations during the KORUS-AQ campaign period (Fig. 7). The three model results showed similar spatial distributions to observations, indicating higher CO concentrations in the NCP, YRD, and PRD regions than their surrounding areas. However, all simulations failed to reproduce the abundance of CO, indicating large negative biases throughout the country. The bias was larger in South Korea than in China.
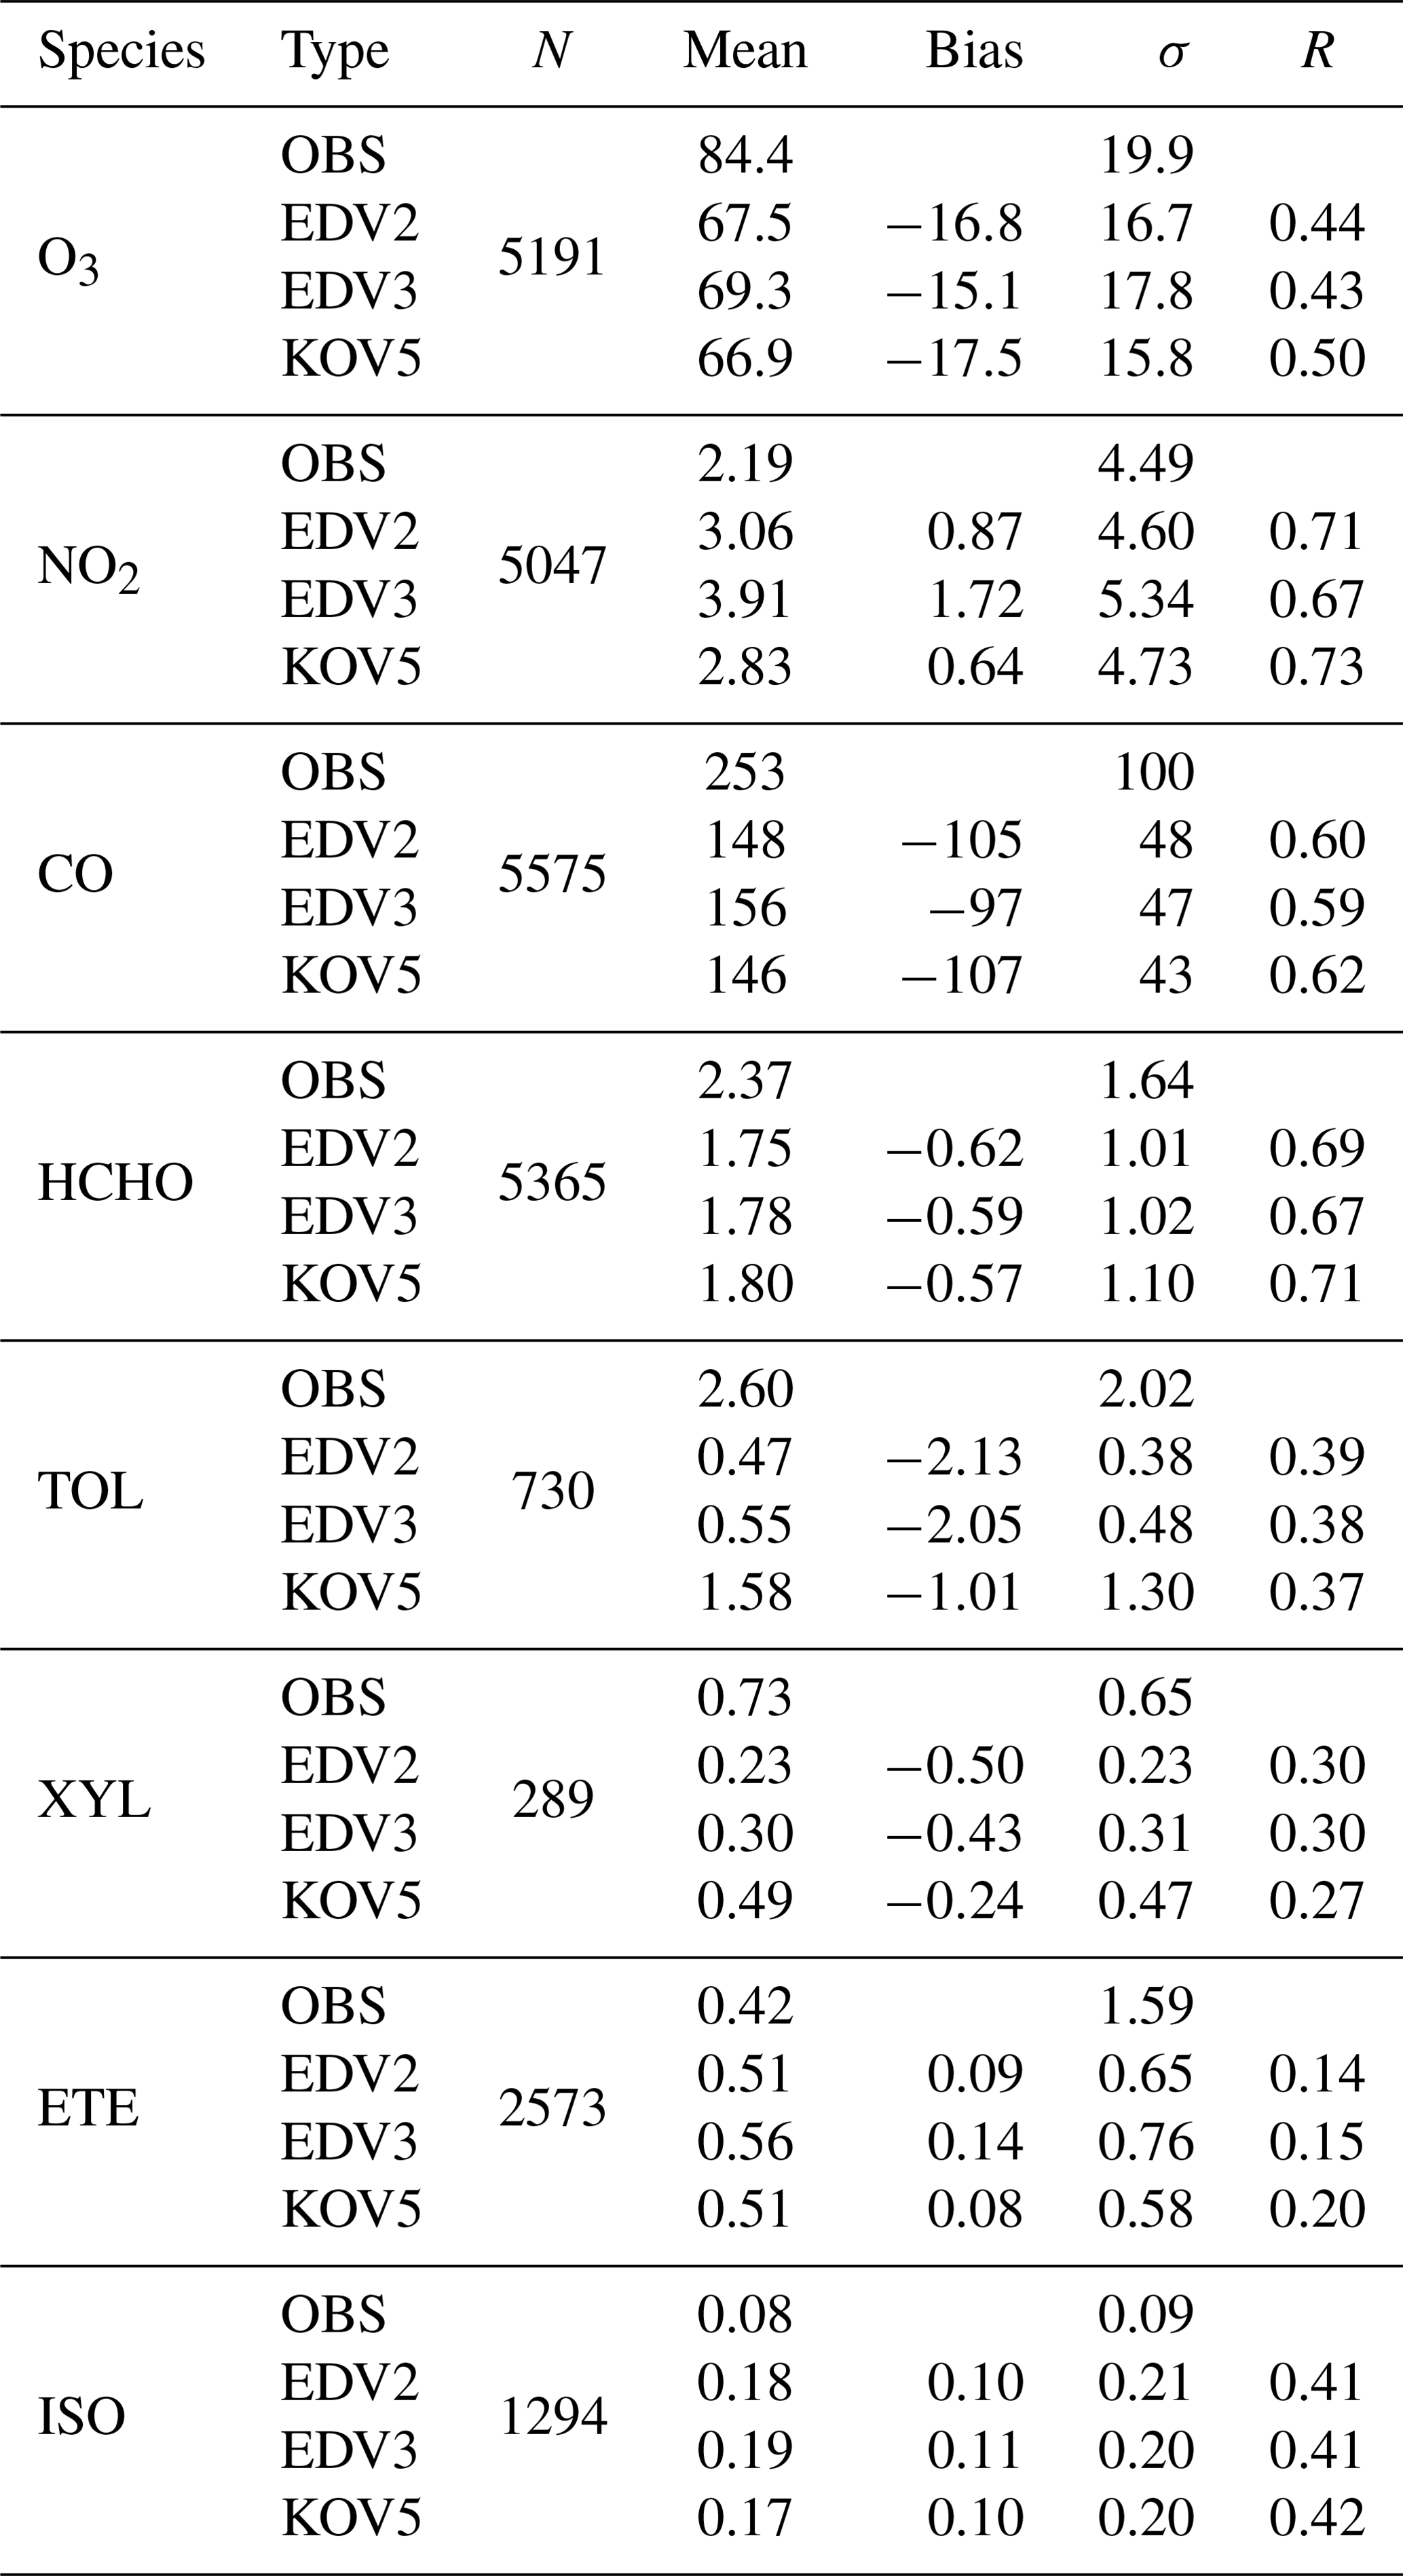
Table 4Comparison of aircraft-based 1 min interval O3, NO2, CO, HCHO, TOL, XYL, ETE, and ISO observations with EDV2, EDV3, and KOV5 for all flight cases under 2 km height (unit: ppb). N is the number of samples. R is the correlation coefficient.
3.3 Evaluations with the airborne and special surface chemical observations during KORUS-AQ
3.3.1 The aircraft observations
Figure 2 shows the flight paths flown by the DC-8 during the KORUS-AQ campaign period. In Table 4, we compare the model results for O3, NO2, CO, HCHO, TOL, XYL, ETE (ethene or OL2), and ISO with the corresponding observed values for all flight tracks under 2 km height in South Korea. On average, the model underestimated O3 by 15–18 ppb, with EDV3 exhibiting the lowest O3 bias (−15.1 ppb) compared to EDV2 and KOV5 (−16.8 and −17.5 ppb, respectively). All emissions showed positive biases for NO2 (0.64 to 1.72 ppb), ETE (0.08 to 0.14 ppb), and ISO (0.1 to 0.11 ppb). However, the model significantly underestimated CO, HCHO, TOL, and XYL for all three emissions. Given the large spatial variability of air pollutants in South Korea, we also sampled aircraft data from six regions (see Fig. 2) and compared the three model results with the aircraft observations under 2 km height (Fig. 8).
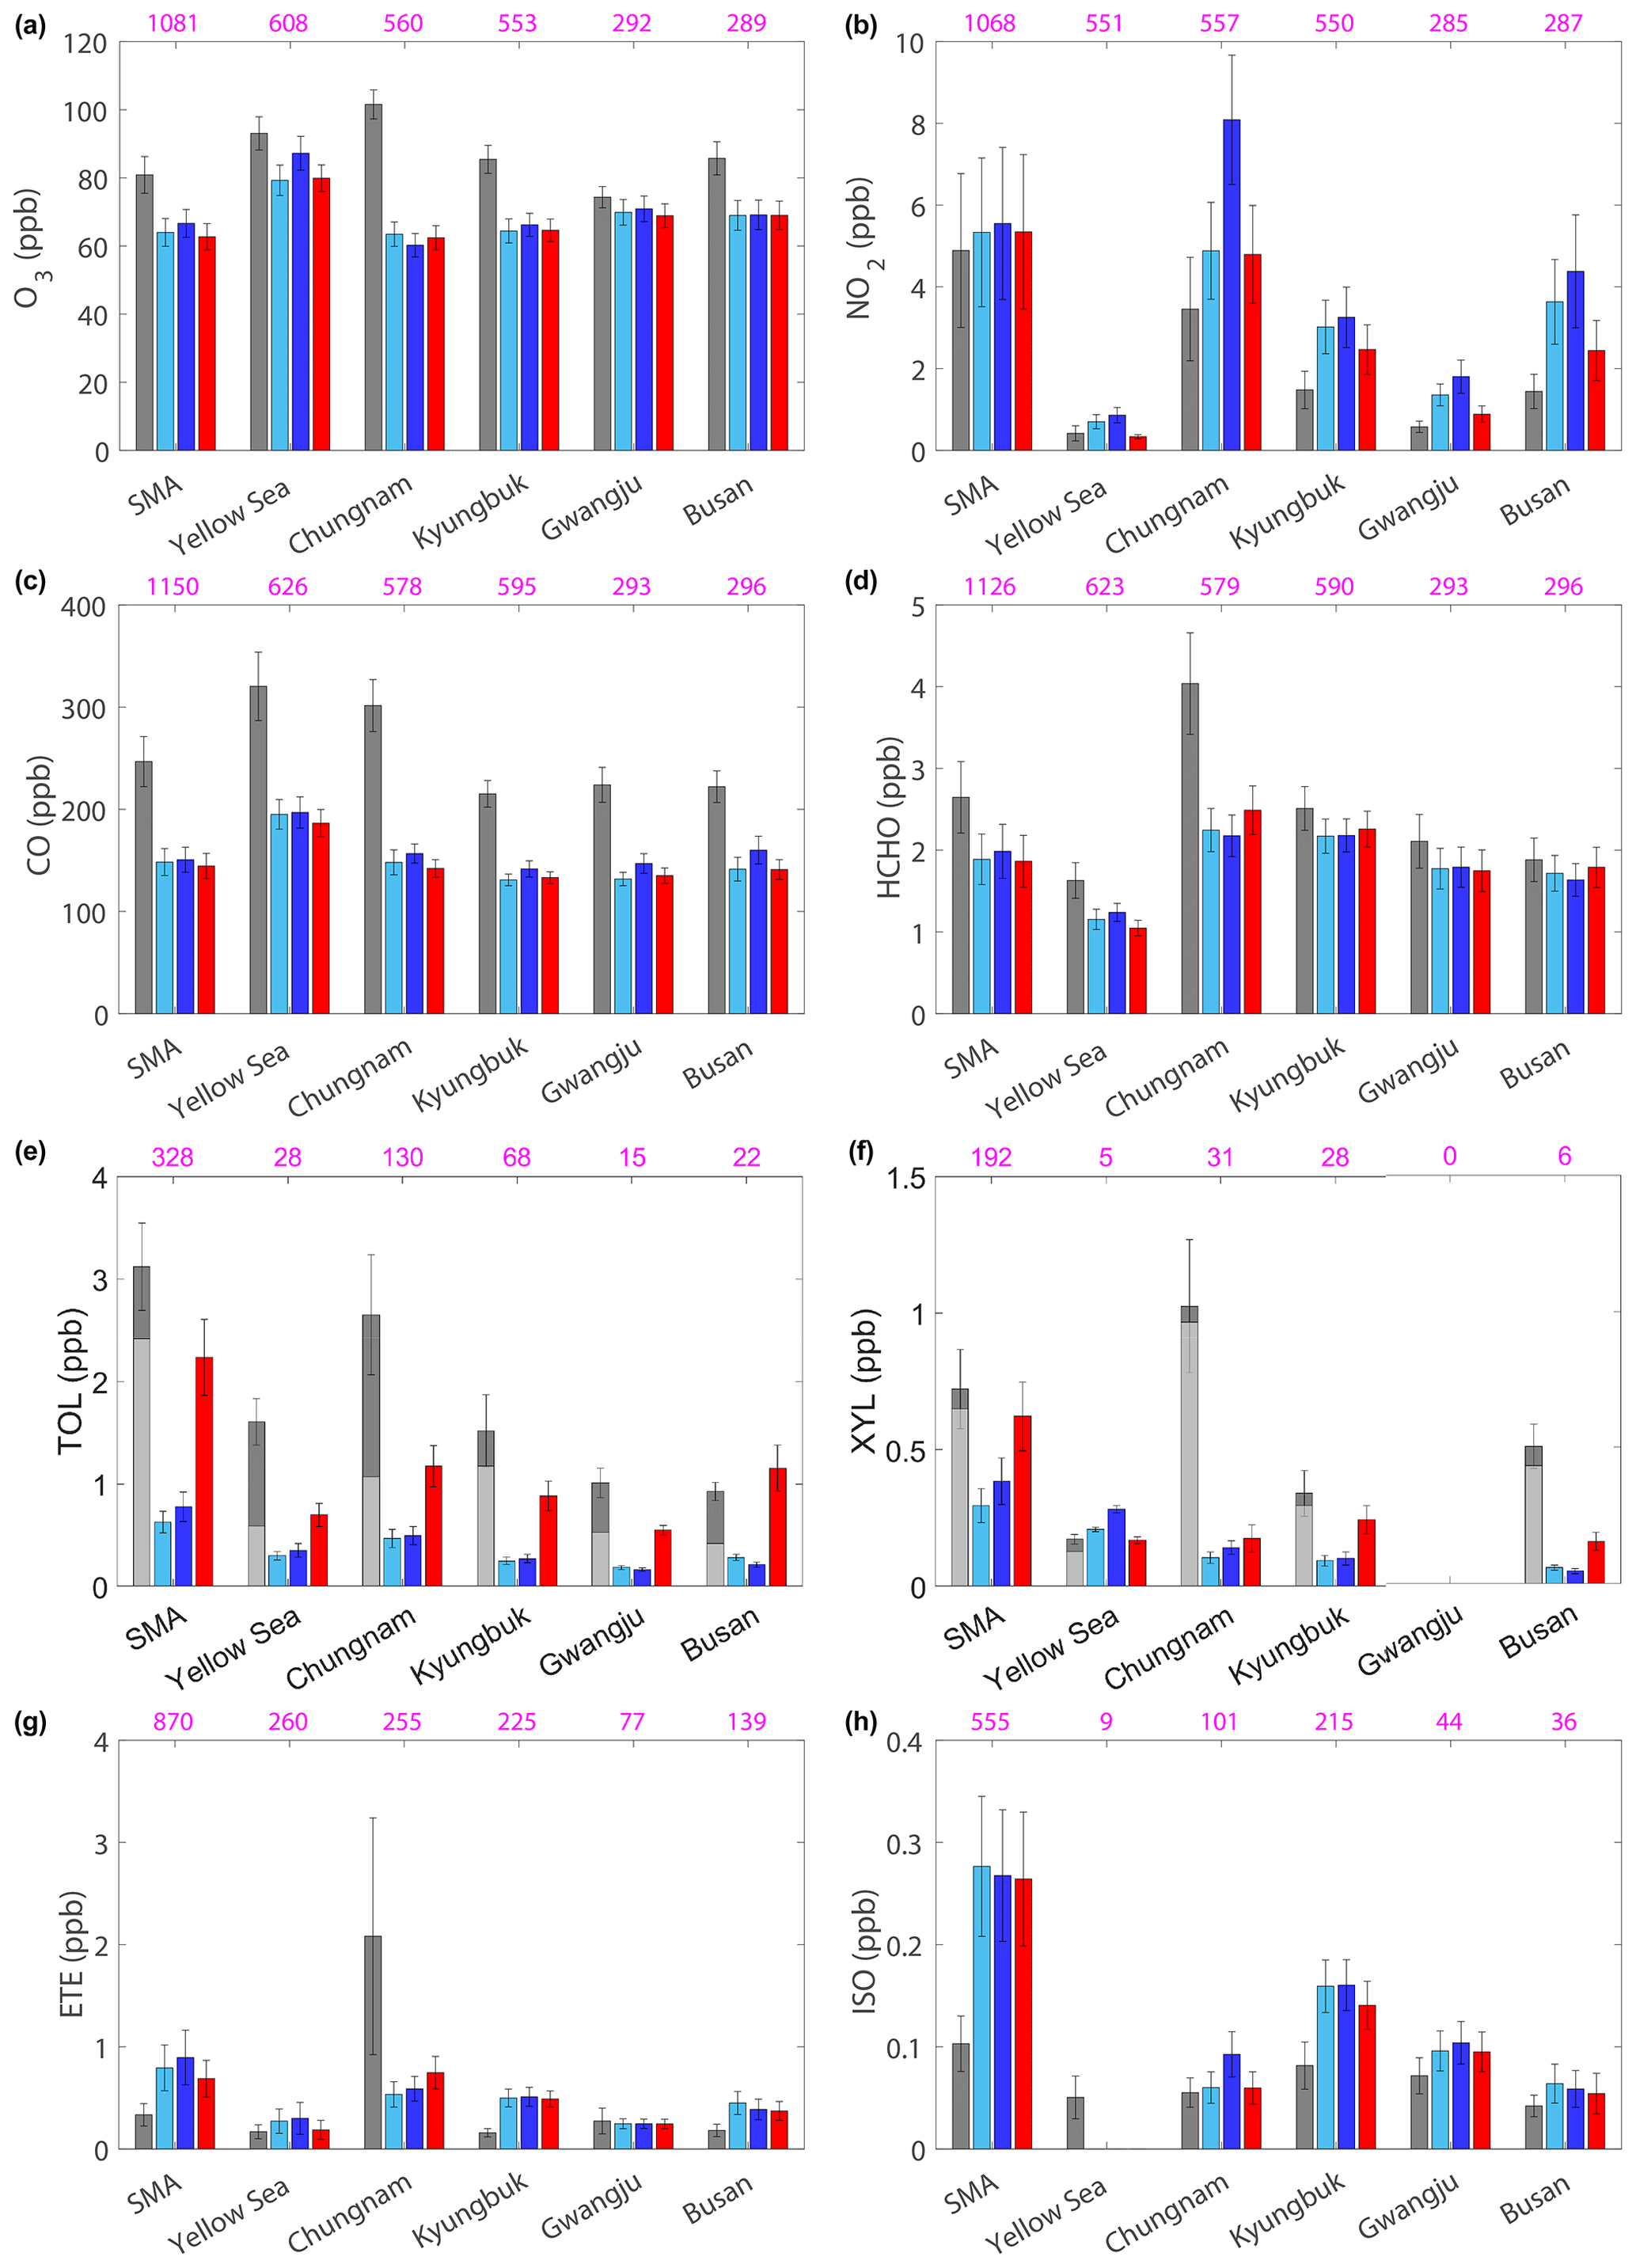
Figure 8The mean (bars) and standard deviations (whiskers) of (a) O3, (b) NO2, (c) CO, (d) HCHO, (e) TOL, (f) XYL, (g) ethene (ETE), and (h) isoprene (ISO) (unit: ppb) from DC-8 (dark grey), EDV2 (sky blue), EDV3 (blue), and KOV5 (red) are shown for each box, respectively. TOL and XYL are calculated based on Table S8 (Supplement). The contribution of toluene to TOL and m/p-xylene + o-xylene to XYL is represented with light-grey bars (e, f). The sampling numbers are represented in magenta above the plots.
The flight tracks that surveyed large power plants and factories in the Chungnam region on a daily basis are shown in Fig. S10. The largest negative model O3 bias was observed over the Chungnam region, with a difference of 38–41 ppb. Emission estimation uncertainties can be significant over this region, where there are large point sources such as coal-burning power plants and petrochemical industries. The model NO2 agreed with the aircraft observations in SMA, but it tends to overestimate the measurements in the other areas. There were substantial model overestimations of NO2 with EDV3 over the Chungnam and Busan areas, while KOV5 showed the most reasonable model NO2 simulations. The model CO near the surface was underestimated in the entire domain, resulting in high negative model CO biases relative to the aircraft observations across the six regions (Fig. 8). We additionally conducted a sensitivity test to investigate the contribution of CO to O3 concentrations in SMA (Fig. S11). Doubling CO emissions in China did not significantly change O3 concentrations at all levels under 2 km. Only 1.4 ppb of O3 concentrations is changed on average during all flight observations.
We also evaluated the model HCHO, which can be formed by oxidation of other VOCs but also directly emitted by anthropogenic sources, to investigate uncertainties in anthropogenic VOC emissions. The model HCHO was underestimated by all emission inventories for all subregions, with negative biases being evident in the SMA, Yellow Sea, and Chungnam regions.
Other model VOC species, such as TOL, XYL, ETE, and ISO, were also analyzed. These VOC species are classified by their chemical structures and reactivities in the RACM (Stockwell et al., 1997) (Table S4). For example, TOL includes toluene and relatively less reactive aromatics, while XYL includes xylene and more reactive aromatics. The WAS data from DC-8 were lumped into RACM (Table S8, Lu et al., 2013) and were compared with aircraft observations. When the model TOL or XYL was compared with the observed toluene and xylene, the model using KOV5 reasonably reproduced the observed concentrations (light-grey bars in Fig. 8). However, the model TOL (even using KOV5) underestimated the observed lumped TOL for most of the regions except for Busan (bars including the dark-grey part in Fig. 8). The model using KOV5 reasonably reproduced the observed xylene or XYL, except for the Chungnam and Busan regions. The observed ethene (or ETE) concentrations were low (<0.5 ppb), except for the Chungnam region, where the average of measurements was 2.1 ppb. The model ethene concentration was higher than the observations for the SMA, Kyungbuk, and Busan regions, while it had a large negative bias (−1.6 to −1.3 ppb) for the Chungnam region. Regarding ISO, one of the most important biogenic VOCs, the model values were larger than the observations by a factor of 2.
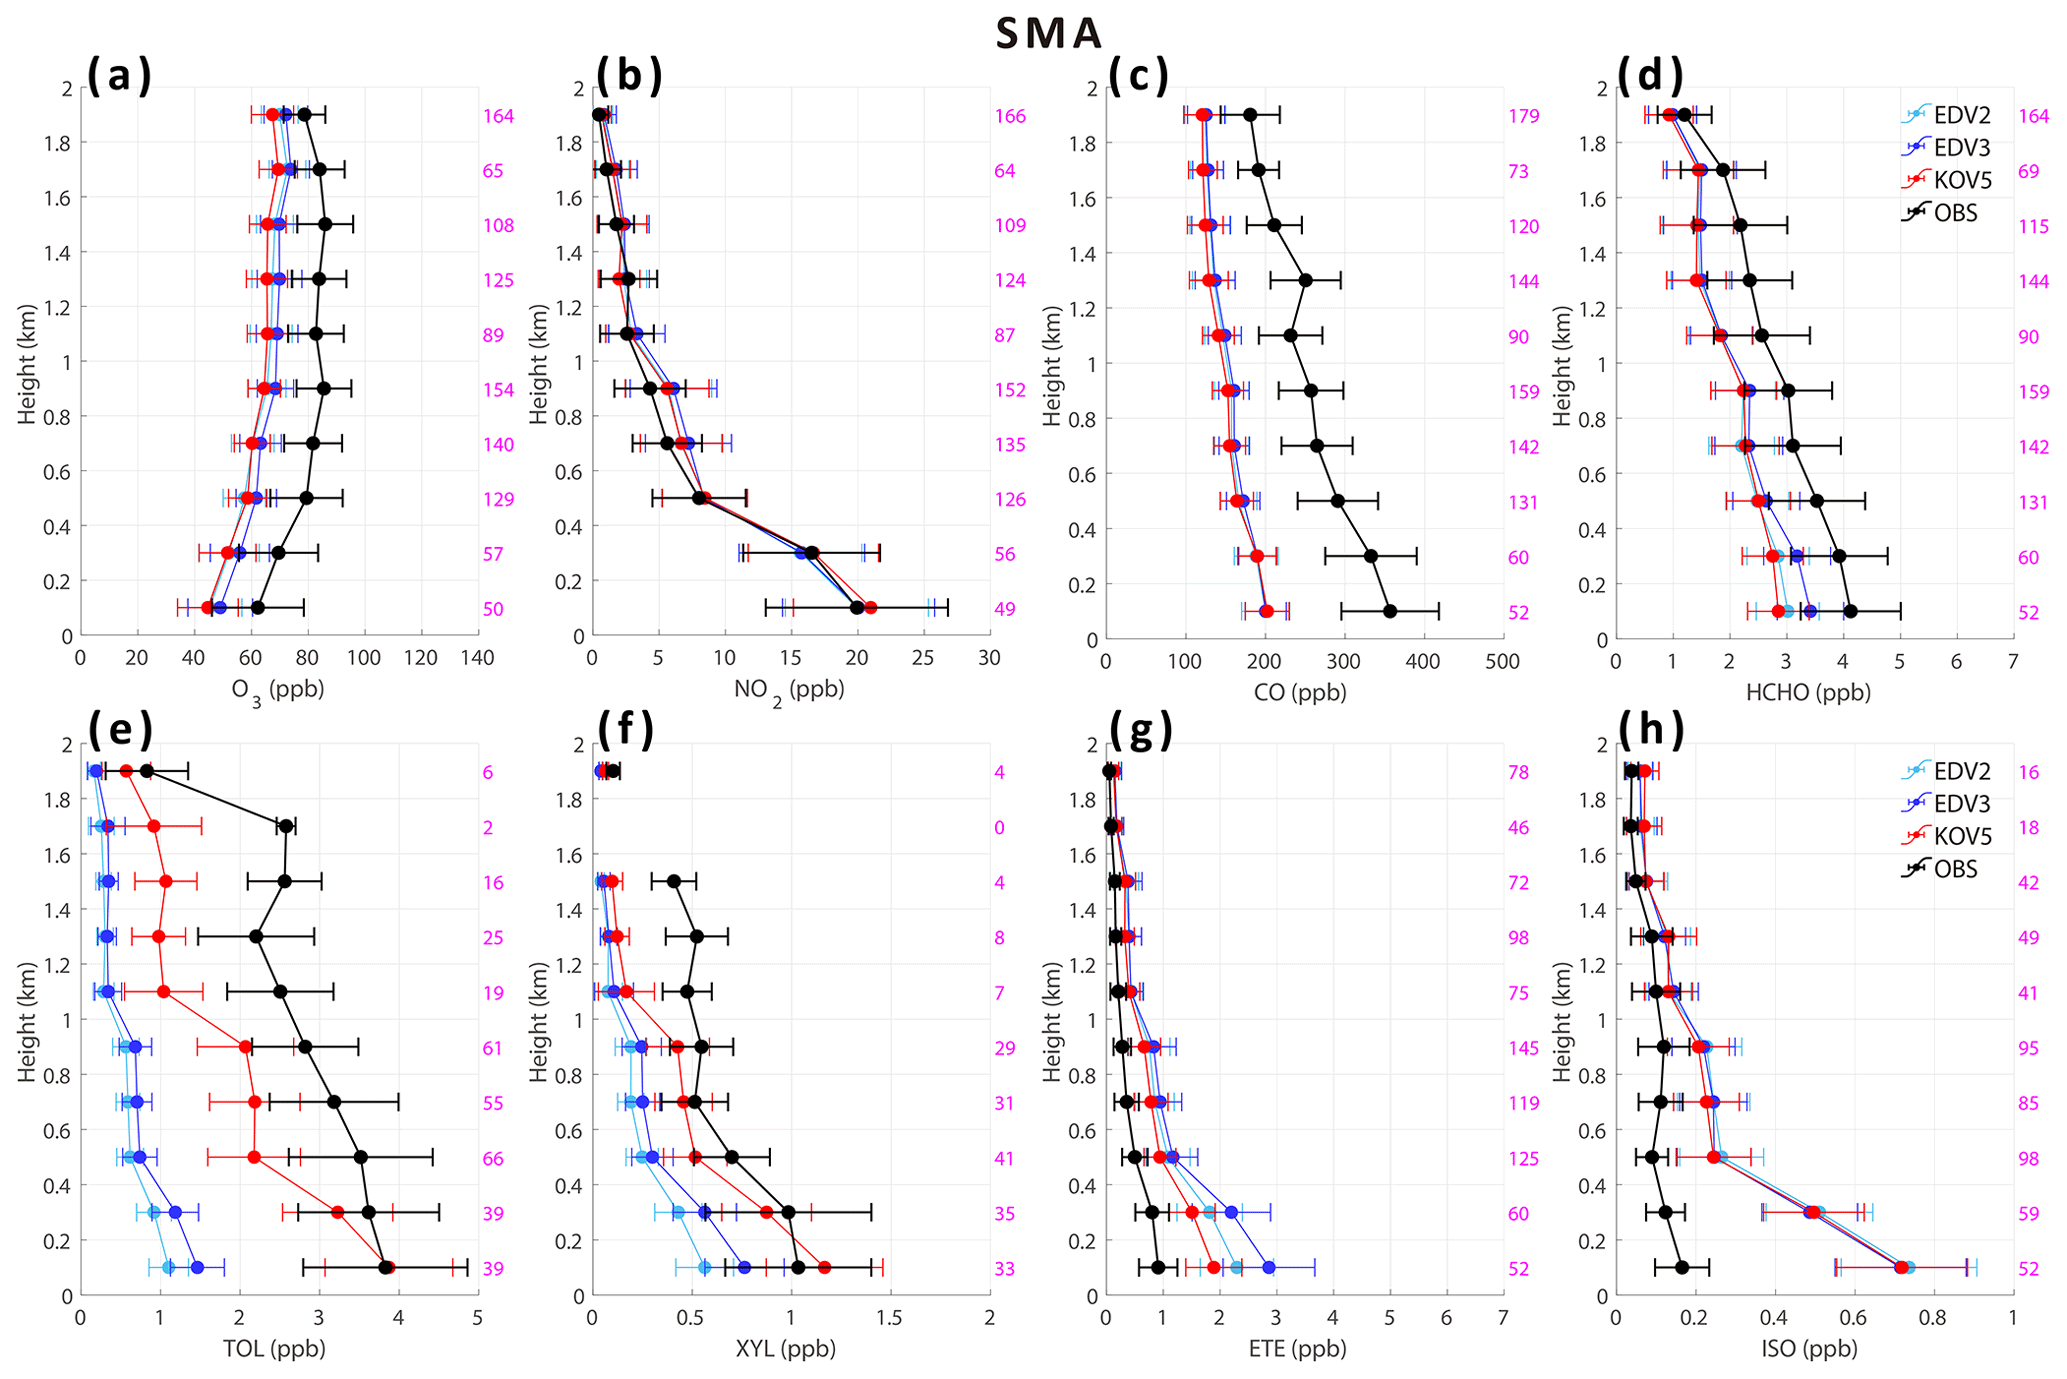
Figure 9Vertically averaged (a) O3, (b) NO2, (c) CO, (d) HCHO, (e) TOL, (f) XYL, (g) ETE, and (h) ISO from DC-8 (black), EDV2 (sky blue), EDV3 (blue), and KOV5 (red) in SMA under 2 km height above ground level. The standard deviations are represented with black whiskers in each 200 m layer. The sample number is presented in magenta on the right side of the plots.
In summary, underestimated CO and aromatic VOCs are the main features of the model evaluation with aircraft observations, along with underestimated ozone and HCHO. The largest discrepancies occur over the Chungnam region, where large point sources are located on the west coast of South Korea. The detailed statistics over the SMA and Chungnam area can be obtained from the Supplement (Tables S9–S10).
Figure 9 displays the vertical distributions of observed and simulated O3 and related species over SMA. The shapes of the simulated profile were in agreement with the observations. Particularly, the model accurately reproduced the observed NO2 profiles, though the surface NO2 is underestimated by −4.2 to −0.8 ppb in SMA (Table 2 and Fig. 9b). The underestimation of simulated surface NO2 is explained by the overestimation of the molybdenum converter method; surface concentrations of NO2 from the molybdenum converter are larger than those from the photolytic converter by 13.6 % on average and 64 % at 16:00 (Fig. 10). Although the diurnal pattern of surface NO2 at 12:00–20:00 LT is explained by the overestimation by measurements using a molybdenum converter, there are still some other possible reasons: (1) the emission diurnal profile used in this study was developed for the Los Angeles Basin, which may need to be adjusted for SMA, and (2) the uncertainty of HOx and ROx radicals from other sources can affect the NO2 concentrations.
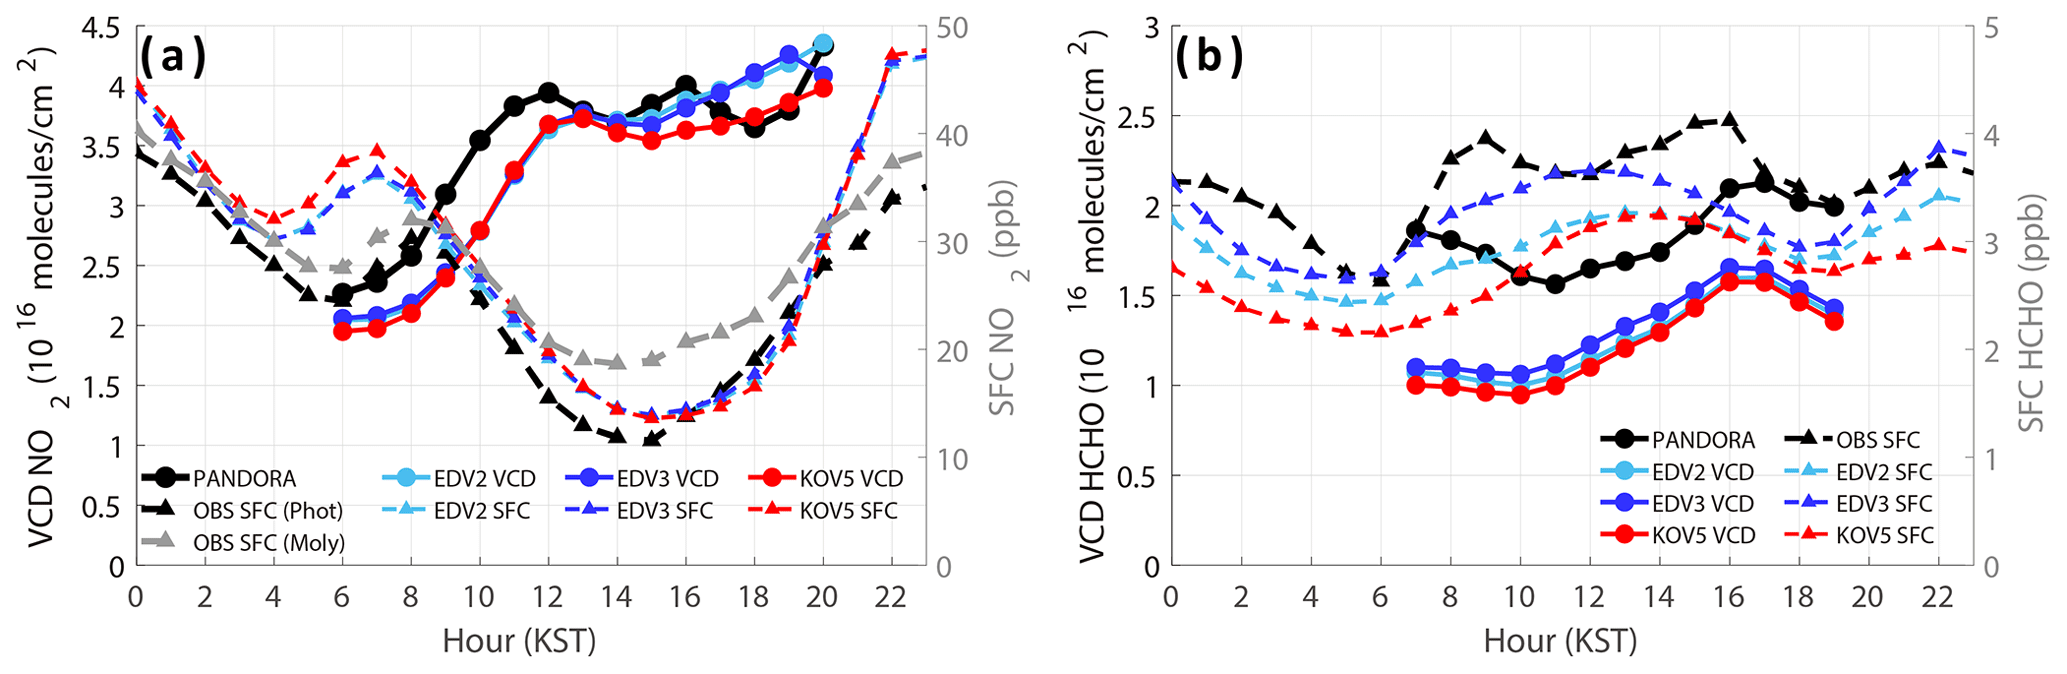
Figure 10The diurnal cycles of vertical columns and surface concentrations of (a) NO2 and (b) HCHO from the Pandora spectrometer (column) and ground-based instruments (TEI 42i NOx analyzer and Aerodyne QCL) at the Olympic Park site (37.5232° N, 127.126° E). EDV2 (sky blue), EDV3 (blue), and KOV5 (red) are compared with observations. The WRF-Chem vertical column concentrations are produced by summing all vertical layers.
However, the simulated O3 and HCHO had negative biases of 16.4 and 0.73 ppb, respectively, persisting from the surface to 2 km. Additionally, the simulated CO underestimated the observations by 40 % throughout the vertical layer. While the model TOL and XYL, utilizing KOV5, agreed well with the observations at surface level and had the lowest bias of −0.88 and −0.12 ppb under 2 km, the results using EDV2 and EDV3 substantially underestimated the observations throughout the layer (Table S9). On the other hand, the model-simulated ETE and ISO overestimated the observations below 1 km over SMA.
3.3.2 The ground-based observations
During the KORUS-AQ campaign, Pandora and surface measurements were co-located at Olympic Park. Figure 10 compares the observed diurnal cycle of Pandora vertical columns and surface concentrations of NO2 and HCHO with the model simulations. NO2 measurements were made using a photolytic converter, providing better accuracy compared to measurement with a molybdenum converter. All emissions reasonably simulated the diurnal patterns of vertical column and surface NO2 and HCHO concentrations.
The surface NO2 peak appeared at 07:00 LT in the model and 08:00 LT in the observations, associated with the increase in traffic and the under-developed convective boundary layer. On the other hand, the Pandora NO2 column amount increased from 06:00 to 12:00 LT and stayed at that value throughout the afternoon, indicating the increase of NOx emissions from morning to afternoon. The model-simulated NO2 columns agreed with those from Pandora in terms of absolute values and diurnal variations. The opposite patterns between surface and column NO2 were attributed to the change of boundary layer height; NO2 is concentrated near the surface layer as the mixed layer is shallow in the morning and vertically well mixed during the daytime, resulting in low surface NO2 concentrations (Crawford et al., 2020). On the other hand, vertical column NO2 concentrations show large values in the afternoon due to the continued emission of NOx.
All three emission inventories resulted in simulations that underestimated both column and surface HCHO values by up to molecules cm−2 (−46 %) at 07:00 LT and −0.9 ppbv (−26 %) at the surface on average. The underestimations of the model HCHO relative to the Pandora and surface observations are similar to findings from comparisons of the model results with the aircraft data (Fig. 9). Therefore, the model VOC performance needs to be investigated at Olympic Park.
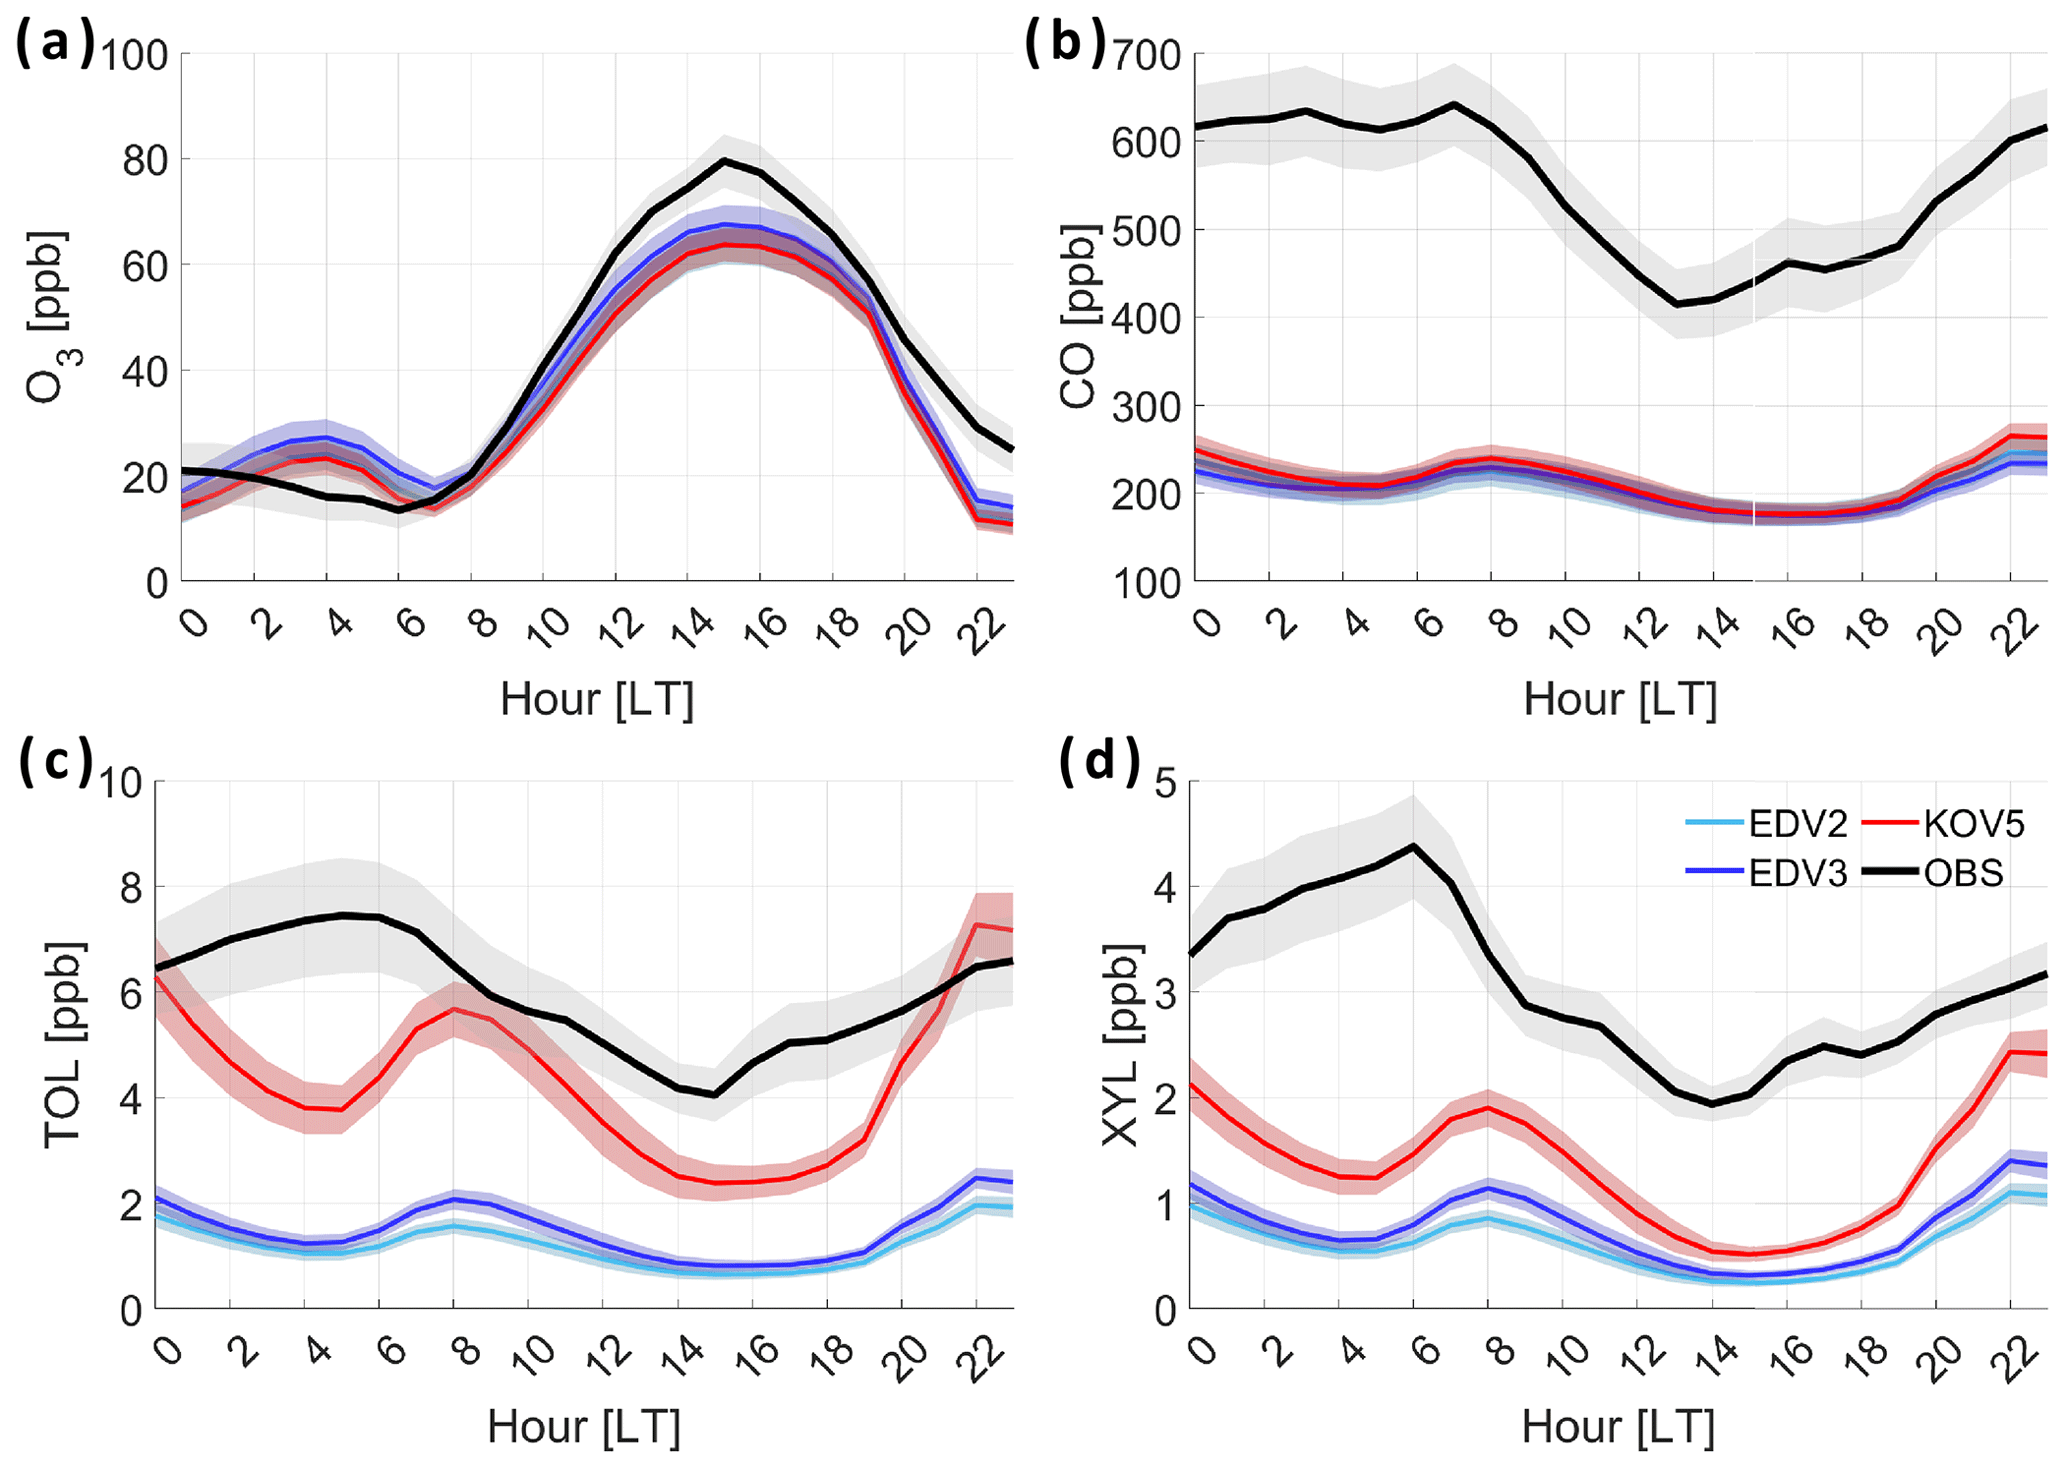
Figure 11Diurnal cycles of surface (a) O3, (b) CO, (c) TOL, and (d) XYL at the Olympic Park site. EDV2 (sky blue), EDV3 (blue), and KOV5 (red) are compared with the observations. standard deviations are represented with grey shades. The average period is from 11 May to 10 June.
The diurnal variations of the model O3, CO, TOL, and XYL were evaluated against the surface observations at Olympic Park acquired during the KORUS-AQ campaign (Fig. 11). The diurnal pattern and hourly averaged mixing ratio of O3 were well simulated with the three emission inventories with slight model negative biases. The observed CO was 2.7 times higher than the model on average. Considering the diurnal profile of observed TOL and XYL, KOV5 exhibited smaller negative biases than EDV2 and EDV3, but it still showed negative biases. The model TOL and XYL showed peak concentrations at 08:00 LT, but the observation had a maximum value at 06:00 LT. The model biases of XYL (−3.7 to −0.6 ppb, −89 % to −20 %) were much larger than those in TOL at the surface. Our study demonstrates that the improvement of VOC emissions and chemistry representations in the model is necessary for better simulations of air quality over SMA and South Korea.
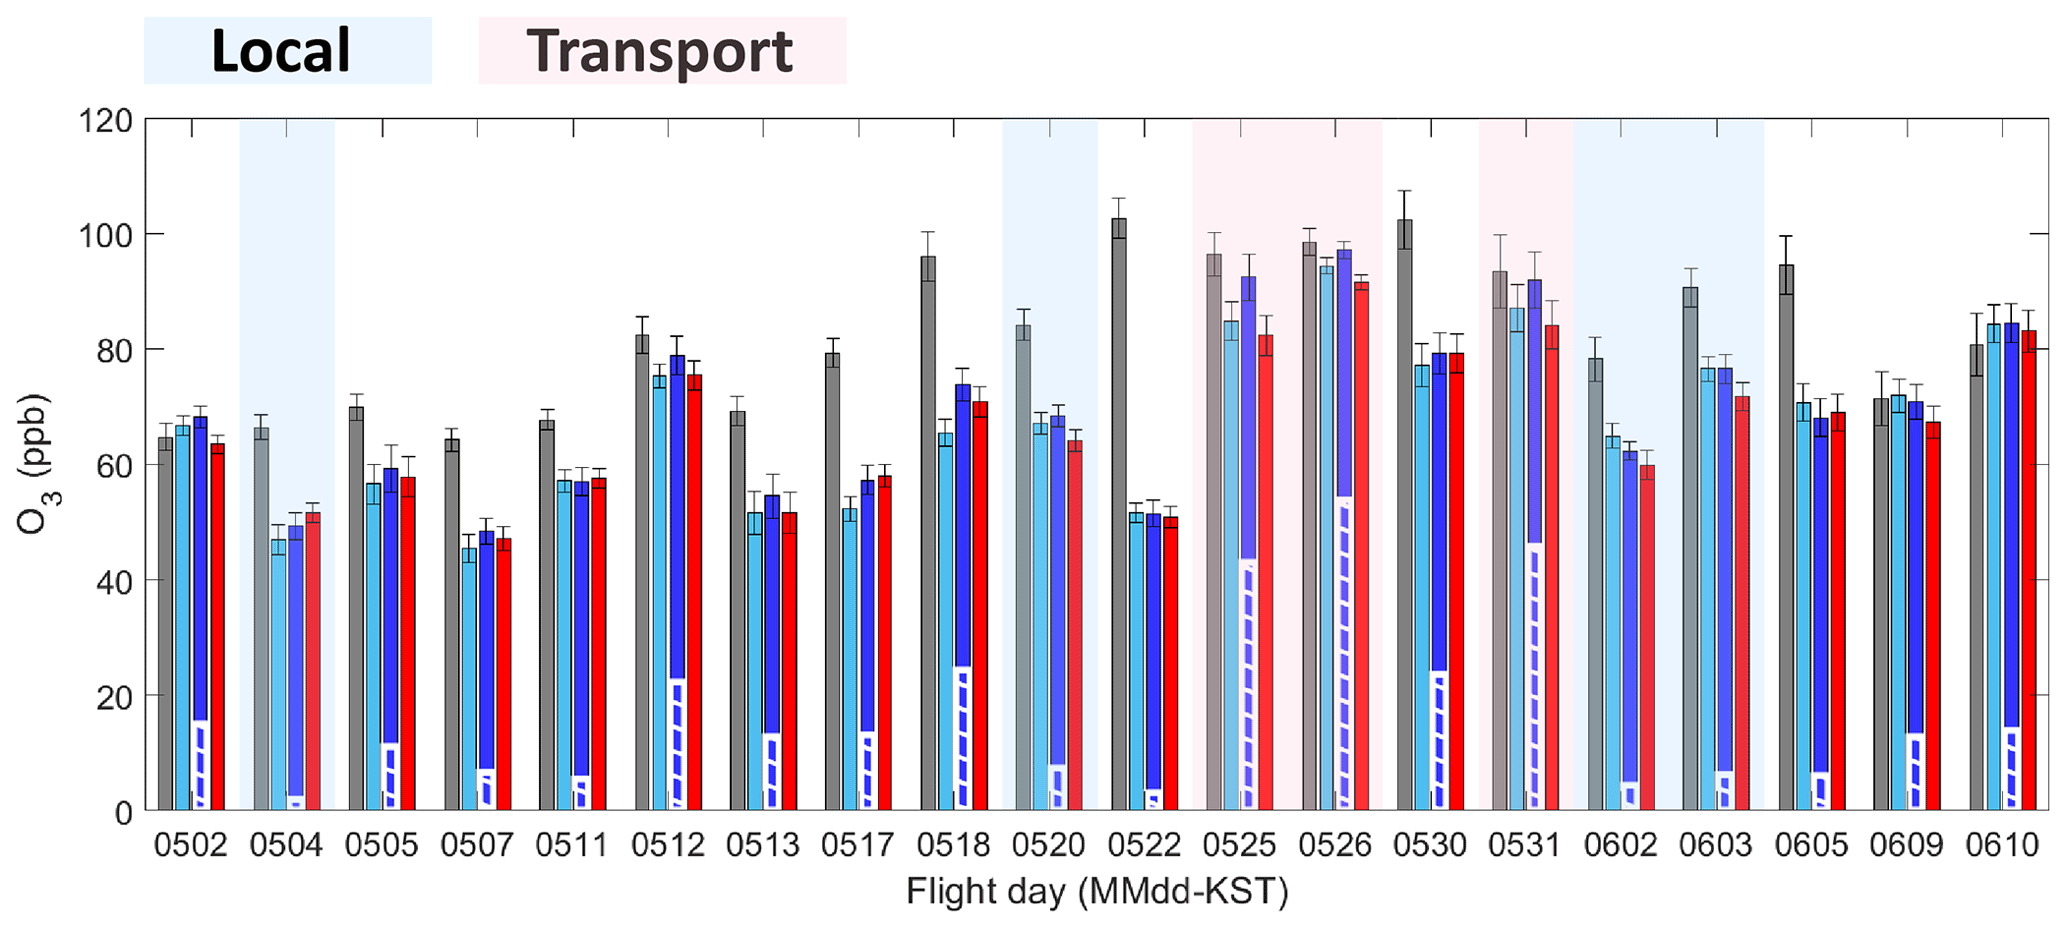
Figure 12Averaged O3 (bars) and standard deviations (whiskers) (unit: ppbv) for the 20 DC8 flights (under 2 km height). The observations (grey) are compared with the model results utilizing EDV2 (sky blue), EDV3 (blue), and KOV5 (red). Hatch-filled white bars over blue bars are the contribution of Chinese emissions to O3 concentrations obtained from the default and sensitivity model runs with/without Chinese anthropogenic emissions. The local (4 and 20 May and 2 and 3 June) and transport (25, 26, and 31 May) cases are shaded in light blue and orange, respectively.
3.4 The model performance over South Korea for the local and transport cases
Previous studies have used meteorological conditions to classify synoptic patterns that affect air pollutant concentrations (Park et al., 2021; Peterson et al., 2019). In contrast, we defined the transport and local cases by comparing model results that used the EDV3 base emission and the EDV3 zero-out-Chinese emission (see Fig. 12). The local case comprises 4 May, 20 May, 2 June, and 3 June (Fig. S12), while the transport case includes 25, 26, and 31 May (Fig. S13). The local (transport) case in this study generally aligns with the stagnation and blocking (transport) cases in Peterson et al. (2019); the stagnation and blocking constitute the period that a large anticyclone was located over South Korea, and the transport case is the period that South Korea was largely affected by long-range transport of air pollutants by westerly wind. The local case has a Chinese contribution to O3 of under 11 %, whereas the transport case has a Chinese contribution to O3 of over 46 %. EDV3 performed better in simulating O3 for the transport case compared to EDV2 and KOV5, with a bias of only 2.7 ppb in comparison with the DC-8 airborne observations. In contrast, for the local case, all emissions had a negative bias ranging from 15.5–18.2 ppb. See Tables S11 and S12 to obtain detailed information of model performances against DC-8 measurements for different cases. Surface concentrations of O3 at Olympic Park also exhibited enhanced contributions from Chinese anthropogenic emissions for the transport case (Fig. S14). This section focuses on the model simulations using EDV3 and its modified versions, EDV3_Ch2, EDV3_Ko2, and EDV3_ChKo2 (doubling Chinese and South Korean CO and VOC emissions).
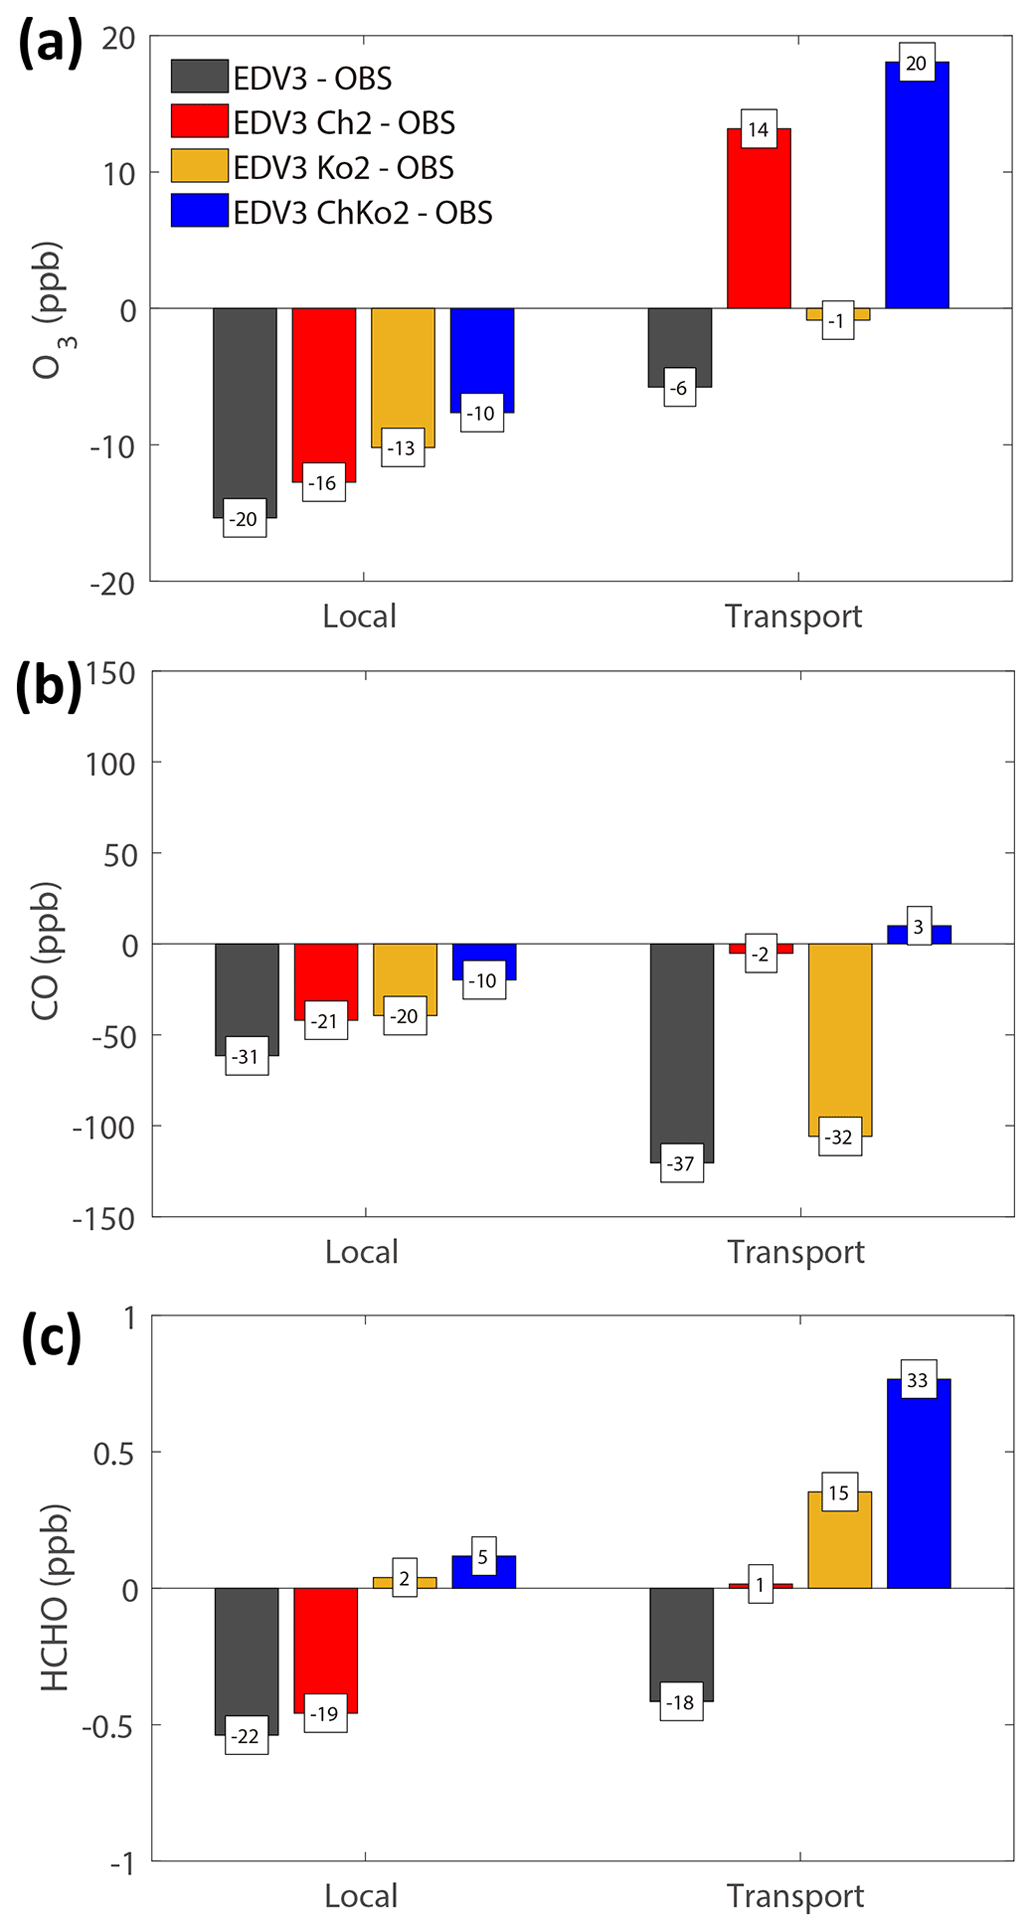
Figure 13The biases in (a) the model O3, (b) CO, and (c) HCHO concentrations (bars) relative to the DC-8 observations under 2 km height over SMA (dark grey: EDV3, red: EDV3 Ch2, blue: EDV3 ChKo2): (left panel) local and (right panel) transport case. Fractional differences (%) are shown in the white boxes.
Figure 13 illustrates the biases in the model O3, CO, and HCHO using EDV3 and its variants relative to DC-8 observations over SMA. The plot highlights differences in biases for the local and transport cases. The model O3 biases were negative, and the absolute values of biases were larger in the local case than in the transport case (−20 % versus −6 %). The model CO biases were also negative, and the absolute values of biases were larger in the transport case than in the local case. The model HCHO biases were negative and similar for the two cases, except for a larger discrepancy between the model and observations in the local case than in the transport case.
Doubling Chinese CO and VOC emissions (EDV3_Ch2) only slightly reduced O3 biases in the local case, whereas doubling South Korean CO and VOC emissions (EDV_Ko2) reduced biases more compared to the EDV3_Ch2 case. Doubling South Korean CO and VOC emissions as well as Chinese CO and VOC emissions (EDV3 ChKo2) led to the best results in O3 and CO for the local case. For the transport case, doubling Chinese CO and VOC emissions reduced biases to almost zero for CO and HCHO, but the model O3 was much overestimated, with 14 % positive biases (from an original bias of −6 %). Doubling South Korean CO and VOC emissions reduced the biases in O3 and CO a bit but overestimated HCHO. The overestimation of O3 in the transport period in the EDV3_Ch2 and EDV3_ChKo2 cases can be explained not only by excessive ISO but also by overpredicted background O3 from doubled CO and VOC emissions in China (Tables S9–S13). Doubled CO and VOC emissions overestimated O3 concentrations over the Yellow Sea, which implies that the enhanced background O3 increase can increase the O3 level in SMA (Fig. S15) (Kim et al., 2023).
Further increasing South Korean CO and VOC emissions in addition to the increase of Chinese CO and VOC emissions led to overestimations of O3 (20 %) and HCHO (33 %). These sensitivity tests modifying EDV3 indicate that increases in CO and VOC emissions over South Korea improve the model O3, CO, and VOC simulations. However, increasing Chinese VOC (and CO) emissions may overestimate the model O3 for the studied period.
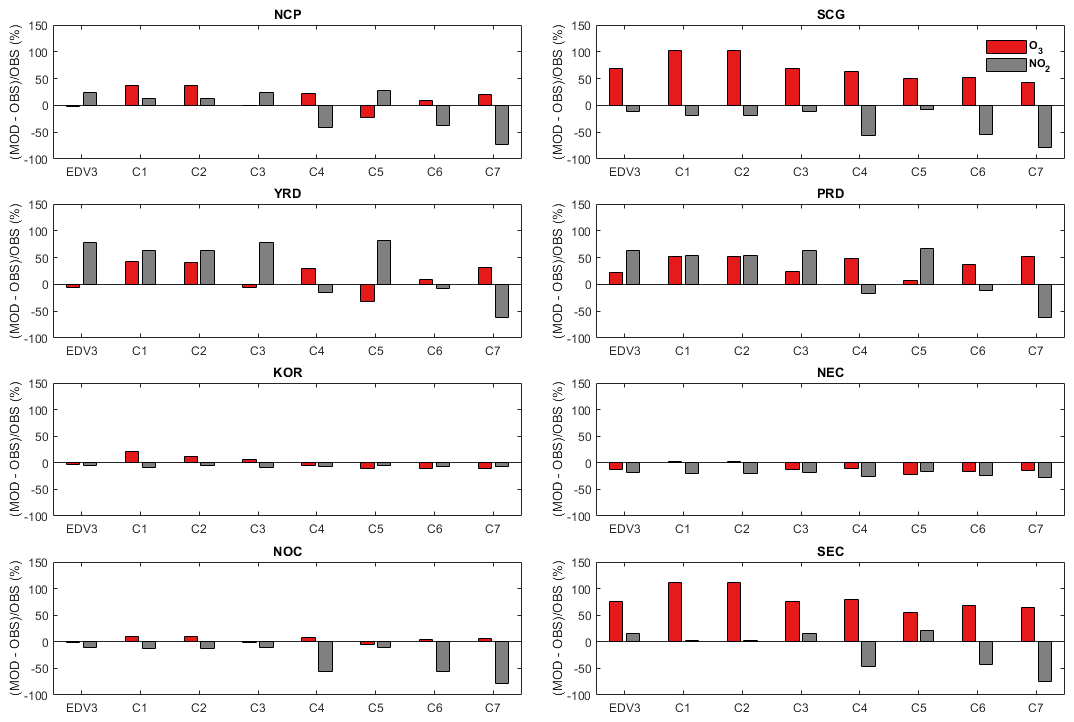
Figure 14Comparison of relative biases ((model−observation) / observation, unit: %) of daily O3 and NO2 at surface observation sites during the KORUS-AQ campaign period from sensitivity simulation (C1–7) with EDV3 in each region (NCP, SCG, YRD, PRD, KOR, NEC, NOC, and SEC). C1, EDGAR-HTAP v3 with double CO and VOC emission in China and South Korea; C2, EDGAR-HTAP v3 with double CO and VOC emission in China; C3, EDGAR-HTAP v3 with double CO and VOC emission in South Korea; C4, EDGAR-HTAP v3 with 50 % NOx reduction in China; C5, EDGAR-HTAP v3 with 50 % VOC reduction in China; C6, EDGAR-HTAP v3 with 50 % NOx and VOC reduction in China; and C7, EDGAR-HTAP v3 with 75 % NOx reduction in China.
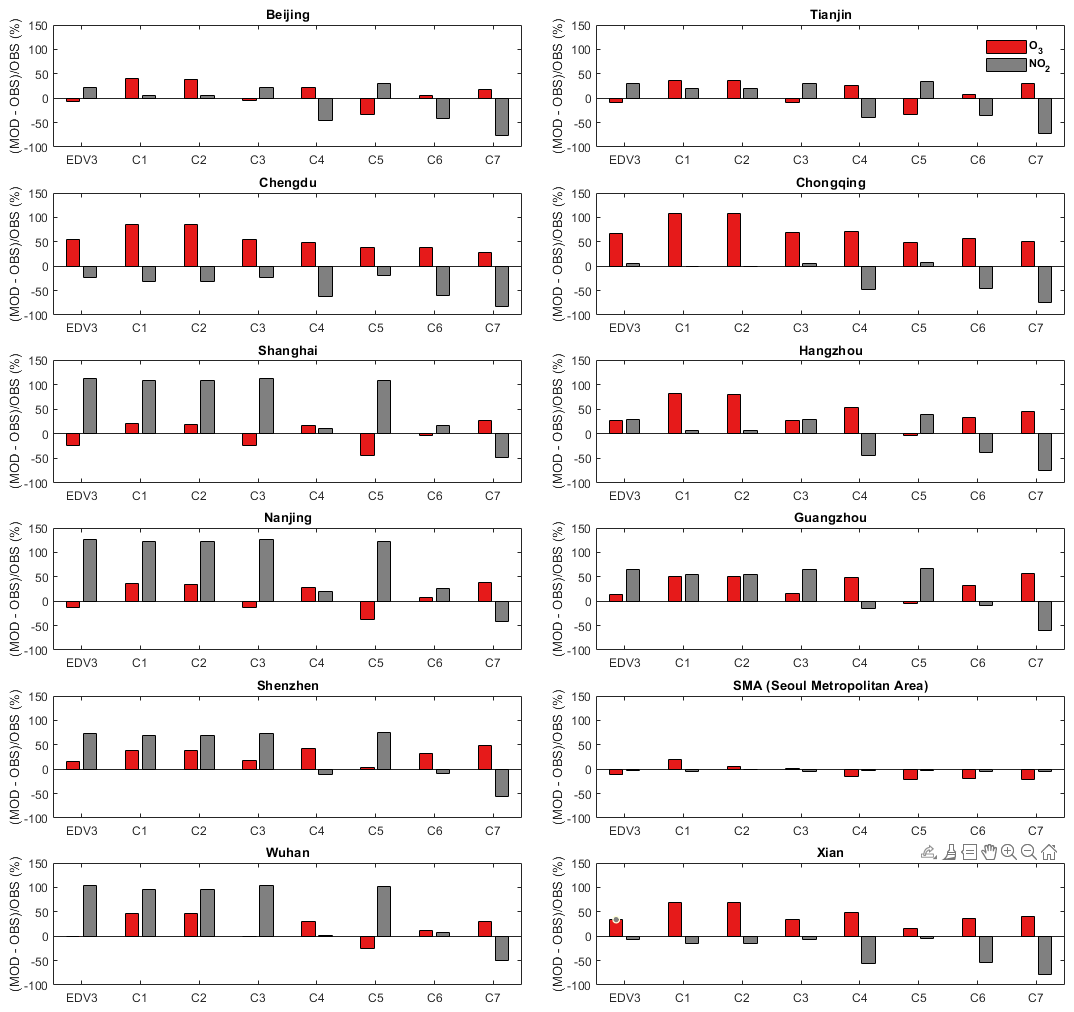
Figure 15Same as Fig. 14 except that the region is changed to cities: Beijing (39.4–41.1° N, 115.4–117.5° E), Tianjin (38.55–40.25° N, 116.7–118.1° E), Chengdu (30.05–31.5° N, 103–105° E), Chongqing (28.15–32.25° N, 105.3–110.2° E), Shanghai (30.7–31.5° N, 120.85–122° E), Hangzhou (29.2–30.6° N, 118.3–120.9° E), Nanjing (31.2–32.65° N, 118.35–119.25° E), Guangzhou (22.55–24° N, 112.9-114.05° E), Shenzhen (22.4–22.9° N, 113.7–114.65° E), SMA (37.2–37.8° N, 126.5–127.3° E), Wuhan (29.95–31.4° N, 113.65–115.1° E), and Xian (33.65–34.75° N, 107.65–109.9° E).
Due to unprecedentedly rich observational data sets acquired during KORUS-AQ, we investigated the status of O3 simulations and outlined directions for their improvements in SMA and South Korea. In this section, strategies for the enhanced accuracy of surface O3 simulations over urban and regional areas in China and South Korea are discussed. The discussion is based on the model simulations incorporating various emission scenarios derived from EDV3. In Figs. 14 and 15, diverse emission cases are labeled from C1 to C7. Specifically C1, C2, and C3 correspond to EDV3_ChKo2, EDV3_Ch2, and EDV3_Ko2, respectively. Meanwhile, C4, C5, C6, and C7 represent scenarios involving a 50 % reduction in Chinese NOx emissions, a 50 % reduction in Chinese VOC emissions, a simultaneous 50 % reduction in both Chinese NOx and VOC emissions, and a 75 % reduction of Chinese NOx emissions, respectively, as discussed in Kim et al. (2023). Examining various options involving the increase and decrease of NOx and VOC emissions from C1 to C7 sheds light on the direction for improving O3 simulations.
Figure 14 illustrates the model O3 and NO2 biases (%) in each region for all cases based on EDV3 (Tables S14–S15 for details). EDV3 demonstrated good performance in simulating O3 and NO2 for the NCP, KOR, NEC, and NOC region. The most substantial model O3 biases were observed in SCG and SEC, with minimal model NO2 biases. Conversely, the largest model NO2 biases were found in YRD and PRD, accompanied by modest model O3 biases. Improvements are needed for model O3 in SCG, SEC, YRD, and PRD with reasonable NO2 simulations. For SCG and SEC, the C5 case (50 % VOC emission reduction only) exhibited the lowest O3 biases. The doubled Chinese VOC emission case (C1 and C2) in SCG and SEC resulted in increased O3 biases to ∼100 %, compared to 68 % in the EDV3 case. In this study, the anthropogenic VOC emissions were reduced. Further reductions of biogenic VOC emissions as well as anthropogenic emissions need to be explored in the future. For SCG and SEC, a reduction in NOx emissions also led to a slight decrease in O3 biases. FNR values for the two regions are about 1.3, which turned out to be still VOC-limited or in a transitional state. For the YRD and PRD regions, first, NOx emissions need to be reduced to improve NO2 biases in the model. The C6 case (50 % reductions in both NOx and VOC emissions) yielded the most favorable O3 and NO2 simulations. Solely reducing NOx emissions (as in the C4 case) increased O3 biases by 26 %–37 % relative to EDV3. The FNR values for YRD and PRD were 0.32 and 0.52, respectively, placing them in the VOC-limited regime (FNR <1). In general, an increase in Chinese VOC emissions (as observed in cases C1 and C2) resulted in elevated surface ozone levels for all regions, including KOR. For NCP, KOR, NEC, and NOC, where the model O3 and NO2 agree with the observations, reducing VOC proves to be an effective strategy for decreasing surface O3. The biases of Ox typically follow O3 biases across cases in all regions except NCP, YRD, PRD, and NOC, which experience high NOx conditions. Refer to Fig. S16 for analysis of Ox along with O3 across various regions. In these specific regions, a substantial reduction in NOx levels (as in C4 and C7) resulted in an increase in O3 bias, while there was a decrease in Ox.
In Fig. 15, the model O3 and NO2 biases (%) in the 12 megacities in China and South Korea are illustrated for all cases. Refer to Tables S16 and S17 for specific values. EDV3 showed effective performance in simulating O3 and NO2 for cities such as Beijing, Tianjin, Hangzhou, SMA, and Xian. The most substantial model O3 biases were observed in Chengdu and Chongqing, with minimal model NO2 biases. In contrast, notable model NO2 biases were identified in Shanghai, Nanjing, Guangzhou, Shenzhen, and Wuhan, accompanied by modest model O3 biases. For Chengdu and Chongqing, situated roughly in SCG, the C5 case (50 % VOC emission reduction only) results in the lowest O3 biases with decent NO2 simulations. For Shanghai, Nanjing, Guangzhou, Shenzhen, and Wuhan, case C6 (50 % reductions in both NOx and VOC emissions) produced the most favorable O3 and NO2 simulations. Simply reducing NOx emissions (as in case C4) increased O3 biases in these cities. Overall, the increase in Chinese VOC emissions (cases C1 and C2) resulted in elevated surface ozone levels for all cities, including SMA with an increase in biases, except for Shanghai. Reduction of only VOC emissions (C5) led to the lowest surface O3 levels for all cities. The biases of Ox generally follow O3 biases in Chengdu and Chongqing, where the simulated O3 initially exhibits a notably high positive bias (50 %–60 %), attributable to high VOC. Refer to Fig. S17 for an analysis of Ox and O3 across cases and cities. In contrast, for other cities experiencing high NOx conditions with positive NO2 biases, a reduction in NOx levels (as in C4 and C7) led to a decrease in Ox (and its bias for most cities). However, there was a simultaneous increase in O3 and its bias, attributed to the NOx-saturated regime (Fig. S17).
We conducted sensitivity tests using WRF-Chem with three different bottom-up emission inventories (EDGAR-HTAP v2 and v3 and KORUS v5) to investigate the impacts of different emissions on the simulation of O3 and precursors in East Asia. This study is the first to use EDGAR-HTAP v3 with WRF-Chem v4.4 and extends the validation domain to the whole of China during the KORUS-AQ campaign period. We extensively evaluated these emission inventories using both ground and aircraft observations in East Asia.
The three emission inventories accurately reproduced the diurnal profiles and absolute values of surface O3 for most subregions in China, except for the SCG and SEC areas. However, discrepancies were observed in the model performance for the MDA8 O3 concentrations, with poor correlations observed over regions with high HCHO concentrations (south of 30° N) and relatively low ratios of FNR (north of 30° N). The emission inventories reasonably reproduced the spatial distribution of daily surface NO2 concentrations. However, we found that CO was considerably underestimated by the emission inventories over both China and South Korea.
We evaluated the model simulations against vertical profile measurements of O3, NO2, CO, HCHO, TOL, XYL, ETE, and ISO from the DC-8 aircraft, as well as surface observations over South Korea. The simulated vertical shapes of O3, NO2, CO, HCHO, TOL, XYL, ETE, and ISO agreed well with the DC-8 measurements in the SMA, although negative biases were observed for O3, CO, TOL, XYL, and HCHO, with the largest discrepancy between the model results and observations in the Chungnam area. When we compared the simulations with the surface in situ measurements and Pandora observations at the Olympic Park in Seoul, the model accurately reproduced the diurnal patterns of surface and vertical columns of NO2 and HCHO. However, we found that the model underestimated TOL and XYL. This underestimation of TOL and XYL is one of the reasons that the model underestimates O3 concentrations, as VOCs contribute to NO-to-NO2 conversions, resulting in O3 production via photochemistry.
We also classified the flight tracks into two categories: local and transport cases. We found that the negative bias of O3 was much larger under the local case than the transport case. When the increment of CO and VOC emissions in South Korea is taken into account, the biases of O3 are significantly reduced, indicating the need for local emission adjustments to decrease O3 bias in South Korea.
To improve surface O3 simulations over China and South Korea using EDV3, lowering VOC emissions is advantageous for SCG and SEC, including urban areas like Chengdu and Chongqing. Meanwhile, for YRD and PRD regions, as well as cities such as Shanghai, Nanjing, Guangzhou, Shenzhen, and Wuhan, both NOx and VOC emissions should be reduced to enhance model performances. Increasing VOC emissions adversely affected the model's accuracy in simulating O3 in China, leading to increased biases.
Our study revealed a consistent overestimation of isoprene over SMA. The uncertainty of biogenic VOC emissions from MEGAN can affect the model O3 performance. Therefore, to achieve more accurate simulations of O3 in East Asia, it is essential to explore precise representations of both anthropogenic and biogenic VOC emissions.
WRF-Chem source codes are distributed by NCAR (https://doi.org/10.5065/D6MK6B4K, Shamarock et al., 2021). WRF-Chem v4.4 is available in GitHub (wrf-model, 2022). The exact version of WRF-Chem codes and the configuration files are archived at https://doi.org/10.5281/zenodo.8260026 (Kim et al., 2023). National Centers for Environmental Prediction (NCEP) FNL data can be accessed from Research Data Archive (RDA) (https://doi.org/10.5065/D6M043C6, NCEP, 2019). The CAM-chem data for boundary conditions are also obtained from RDA (ACOM, 2019; https://doi.org/10.5065/CKR4-GP38). The EDGAR-HTAP v2 data can be downloaded from the website (https://edgar.jrc.ec.europa.eu/dataset_htap_v2, European Commission. 2015). The EDGAR-HTAP v3 is archived on Zenodo (https://doi.org/10.5281/zenodo.7516361, Crippa, 2023). The KORUS-AQ data are available from the AirKorea website (https://www-air.larc.nasa.gov/cgi-bin/ArcView/korusaq, last access: 28 June 2017) (https://doi.org/10.5067/Suborbital/KORUSAQ/DATA01, NASA, 2022). The EDGAR-HTAP v2 and v3 and KORUS v5 data including emission processing programs are available at https://doi.org/10.5281/zenodo.8260026 (Kim et al., 2023).
The supplement related to this article is available online at: https://doi.org/10.5194/gmd-17-1931-2024-supplement.
KMK conducted simulations and analysis and wrote the paper. SWK designed this study, secured funding, performed analysis, and wrote the paper. SS supported model setup and contributed to refining the paper. DRB measured VOC data from DC-8. SC acquired ground-based in situ VOC data at Olympic Park. JHC performed analysis and wrote the paper. LKE and GGP assisted in setting up the model emissions and discussed the model performance. AF measured HCHO data from DC-8. JRH measured Pandora data (NO2, HCHO). JH retrieved PBL height and discussed the results. JJ acquired NO2 data at Olympic Park with different methods. AJW acquired NO2 and O3 data from DC-8. JHW and QZ provided emissions inventories and related information. All authors reviewed the manuscript.
At least one of the (co-)authors is a member of the editorial board of Geoscientific Model Development. The peer-review process was guided by an independent editor, and the authors also have no other competing interests to declare.
Publisher’s note: Copernicus Publications remains neutral with regard to jurisdictional claims made in the text, published maps, institutional affiliations, or any other geographical representation in this paper. While Copernicus Publications makes every effort to include appropriate place names, the final responsibility lies with the authors.
This work was supported by the National Research Foundation of Korea (NRF) grant, funded by the Korea government (MSIT) (no. 2020R1A2C2014131). Si-Wan Kim also acknowledges support from NRF-2018R1A5A1024958. All the computing resources are provided by the National Center for Meteorological Supercomputer. The National Center for Atmospheric Research (NCAR) is sponsored by the National Science Foundation (NSF) (NNX16AD96G). We would like to express our gratitude to Glen Diskin for generously providing the CO data from the DC-8 aircraft. We also thank Andrew Whitehill and Russell Long for providing the HCHO data from Olympic Park. We would also like to thank Meng Li and Brian McDonald for their valuable discussions, which greatly enhanced our understanding.
This research has been supported by the Ministry of Science and ICT, South Korea (grant nos. 2020R1A2C2014131 and NRF-2018R1A5A1024958), and the National Science Foundation (grant no. NNX16AD96G).
This paper was edited by Havala Pye and reviewed by two anonymous referees.
Anenberg, S. C., Henze, D. K., Tinney, V., Kinney, P. L., Raich, W., Fann, N., Malley, C. S., Roman, H., Lamsal, L., Duncan, B., Martin, R. V., van Donkelaar, A., Brauer, M., Doherty, R., Jonson, J. E., Davila, Y., Sudo, K., and Kuylenstierna, J. C. I.: Estimates of the global burden of ambient PM2.5, Ozone, and NO2 on asthma incidence and emergency room visits, Environ. Health Persp., 126, 107004, https://doi.org/10.1289/EHP3766, 2018.
Atmospheric Chemistry Observations & Modeling/National Center for Atmospheric Research/University Corporation for Atmospheric Research: CESM2.1 The Community Atmosphere Model with Chemistry (CAM-chem) Outputs as Boundary Conditions, Research Data Archive at the National Center for Atmospheric Research, Computational and Information Systems Laboratory [data set], https://doi.org/10.5065/CKR4-GP38, 2019.
Buchholz, R. R., Emmons, L. K., Tilmes, S., and The CESM2 Development Team: CESM2.1/CAM-chem Instantaneous Output for Boundary Conditions, UCAR/NCAR – Atmospheric Chemistry Observations and Modeling Laboratory, Lat: −5 to 45, Lon: 75 to 145, 28 Nov 2022, https://doi.org/10.5065/NMP7-EP60, 2019.
Carter, W. P.: Documentation of the SAPRC-99 chemical mechanism for VOC reactivity assessment, Contract, 92, 95–308, https://intra.engr.ucr.edu/~carter/pubs/s99doc.pdf (last access: 9 June 2023), 2000.
Choi, J., Henze, D. K., Cao, H., Nowlan, C. R., Abad, G. G., Kwon, H.-A., Lee, H.-M., Oak, Y. J., Park, R. J., Bates, K. H., Massakkers, J. D., Wisthaler, A., and Weinheimer, A. J.: An Inversion Framework for Optimizing Non-Methane VOC Emissions Using Remote Sensing and Airborne Observations in Northeast Asia During the KORUS-AQ Field Campaign, J. Geophys. Res.-Atmos., 127, e2021JD035844, https://doi.org/10.1029/2021JD035844, 2022.
Colman, J. J., Swanson, A. L., Meinardi, S., Sive, B. C., Blake, D. R., and Rowland, F. S.: Description of the analysis of a wide range of volatile organic compounds in Whole Air Samples collected during PEM-Tropics A and B, Anal. Chem., 73, 3723–3731, https://doi.org/10.1021/ac010027g, 2001.
Crawford, J. H., Ahn, J.-Y., Al-Saadi, J., Chang, L., Emmons, L. K., Kim, J., Lee, G., Park, J.-H., Park, R. J., Woo, J. H., Song, C.-K., Hong, J.-H., Hong, Y.-D., Lefer, B. L., Lee, M., Lee, T., Kim, S., Min, K.-E., Yum, S. S., Shin, H. J., Kim, Y.-W., Choi, J.-S., Park, J.S., Szykman, J. J., Long, R. W., Jordan, C. E., Simpson, I. J., Fried, A., Dibb, J. E., Cho, S., and Kim, Y. P.: The Korea-United States Air Quality (KORUS-AQ) field study, Elem. Sci. Anth., 9, 00163, https://doi.org/10.1525/elementa.2020.00163, 2020.
Crippa, M.: HTAP_v3 emission mosaic [edgart_HTAPv3_2016_*], Zenodo [data set], https://doi.org/10.5281/zenodo.7516361, 2023.
Crippa, M., Guizzardi, D., Butler, T., Keating, T., Wu, R., Kaminski, J., Kuenen, J., Kurokawa, J., Chatani, S., Morikawa, T., Pouliot, G., Racine, J., Moran, M. D., Klimont, Z., Manseau, P. M., Mashayekhi, R., Henderson, B. H., Smith, S. J., Suchyta, H., Muntean, M., Solazzo, E., Banja, M., Schaaf, E., Pagani, F., Woo, J.-H., Kim, J., Monforti-Ferrario, F., Pisoni, E., Zhang, J., Niemi, D., Sassi, M., Ansari, T., and Foley, K.: The HTAP_v3 emission mosaic: merging regional and global monthly emissions (2000–2018) to support air quality modelling and policies, Earth Syst. Sci. Data, 15, 2667–2694, https://doi.org/10.5194/essd-15-2667-2023, 2023.
Dunlea, E. J., Herndon, S. C., Nelson, D. D., Volkamer, R. M., San Martini, F., Sheehy, P. M., Zahniser, M. S., Shorter, J. H., Wormhoudt, J. C., Lamb, B. K., Allwine, E. J., Gaffney, J. S., Marley, N. A., Grutter, M., Marquez, C., Blanco, S., Cardenas, B., Retama, A., Ramos Villegas, C. R., Kolb, C. E., Molina, L. T., and Molina, M. J.: Evaluation of nitrogen dioxide chemiluminescence monitors in a polluted urban environment, Atmos. Chem. Phys., 7, 2691–2704, https://doi.org/10.5194/acp-7-2691-2007, 2007.
Emmons, L. K., Walters, S., Hess, P. G., Lamarque, J.-F., Pfister, G. G., Fillmore, D., Granier, C., Guenther, A., Kinnison, D., Laepple, T., Orlando, J., Tie, X., Tyndall, G., Wiedinmyer, C., Baughcum, S. L., and Kloster, S.: Description and evaluation of the Model for Ozone and Related chemical Tracers, version 4 (MOZART-4), Geosci. Model Dev., 3, 43–67, https://doi.org/10.5194/gmd-3-43-2010, 2010.
Emmons, L. K., Schwantes, R. H., Orlando, J. J., Tyndall, G., Kinnison, D., Lamarque, J.-F., Marsh, D., Mills, M. J., Tilmes, S., Bardeen, C., Buchholz, R. R., Conley, A., Gettelman, A., Garcia, R., Simpson, I., Blacke, D. R., Meinardi, S., and Pétron, G.: The Chemistry Mechanism in the Community Earth System Model version 2 (CESM2), J. Adv. Model. Earth Sy., 12, e2019MS001882, https://doi.org/10.1029/2019MS001882, 2020.
European Commission: EDGAR FOR HTAP V2, [data set] http://edgar.jrc.ec.europa.eu/htap_v2/, last access: 1 May 2015.
Franklin, B. A., Brook, R., and Arden Pope III, C.: Air Pollution and Cardiovascular Disease, Curr. Probl. Cardiol., 40, 207–238, https://doi.org/10.1016/j.cpcardiol.2015.01.003, 2015.
Gaubert, B., Emmons, L. K., Raeder, K., Tilmes, S., Miyazaki, K., Arellano Jr., A. F., Elguindi, N., Granier, C., Tang, W., Barré, J., Worden, H. M., Buchholz, R. R., Edwards, D. P., Franke, P., Anderson, J. L., Saunois, M., Schroeder, J., Woo, J.-H., Simpson, I. J., Blake, D. R., Meinardi, S., Wennberg, P. O., Crounse, J., Teng, A., Kim, M., Dickerson, R. R., He, H., Ren, X., Pusede, S. E., and Diskin, G. S.: Correcting model biases of CO in East Asia: impact on oxidant distributions during KORUS-AQ, Atmos. Chem. Phys., 20, 14617–14647, https://doi.org/10.5194/acp-20-14617-2020, 2020.
Goldberg, D. L., Saide, P. E., Lamsal, L. N., de Foy, B., Lu, Z., Woo, J.-H., Kim, Y., Kim, J., Gao, M., Carmichael, G., and Streets, D. G.: A top-down assessment using OMI NO2 suggests an underestimate in the NOx emissions inventory in Seoul, South Korea, during KORUS-AQ, Atmos. Chem. Phys., 19, 1801–1818, https://doi.org/10.5194/acp-19-1801-2019, 2019.
Grell, G. A., Peckham, S. E., Schmitz, R., McKeen, S. A., Frost, G., Shamarock, W. C., and Eder, B.: Fully coupled “online” chemistry within the WRF model, Atmos. Environ., 39, 6957–6975, https://doi.org/10.1016/j.atmosenv.2005.04.027, 2005.
Guenther, A., Karl, T., Harley, P., Wiedinmyer, C., Palmer, P. I., and Geron, C.: Estimates of global terrestrial isoprene emissions using MEGAN (Model of Emissions of Gases and Aerosols from Nature), Atmos. Chem. Phys., 6, 3181–3210, https://doi.org/10.5194/acp-6-3181-2006, 2006.
Jang, Y., Lee, Y., Kim, J., Kim, Y., and Woo, J.-H.: Improvement China point source for improving bottom-up emission inventory, Asia-Pac. J. Atmos. Sci., 56, 107–118, https://doi.org/10.1007/s13143-019-00115-y, 2020.
Janssens-Maenhout, G., Crippa, M., Guizzardi, D., Dentener, F., Muntean, M., Pouliot, G., Keating, T., Zhang, Q., Kurokawa, J., Wankmüller, R., Denier van der Gon, H., Kuenen, J. J. P., Klimont, Z., Frost, G., Darras, S., Koffi, B., and Li, M.: HTAP_v2.2: a mosaic of regional and global emission grid maps for 2008 and 2010 to study hemispheric transport of air pollution, Atmos. Chem. Phys., 15, 11411–11432, https://doi.org/10.5194/acp-15-11411-2015, 2015.
Jordan, C. E., Crawford, J. H., Beyersdorf, A. J., Eck, T. F., Halliday, H. S., Vault, B. A., Chang, L.-S., Park, J., Park, R., Lee, G., Kim, H., Ahn, J.-Y., Cho, S., Shin, H. J., Lee, J. H., Jung, J., Kim, D.-S., Lee, M., Lee, T., Whitehill, A., Szykman, J., Schueneman, M K., Campuzano-Jost, P., Jimenez, J. L., DiGangi, J. P., Diskin, G. S., Anderson, B. E., Moore, R. H., Ziemba, L. D., Fenn, M. A., Hair, J. W., Kuehan, R. E., Holz, R. E., Chen, G., Travis, K., Shook, M., Peterson, D. A., Lamb, K. D., and Schwarz, J. P.: Investigation of factors controlling PM2.5 variability across the South Korean Peninsula during KORUS-AQ, Elem. Sci. Anth., 8, 28, https://doi.org/10.1525/elementa.424, 2020.
Jung, J., Lee, J., Kim, B., and Oh, S.: Seasonal variations in the NO2 artifact from chemiluminescence measurements with a molybdenum converter at a suburban site in Korea (downwind of the Asian continental outflow) during 2015–2016, Atmos. Environ., 165, 290–300, https://doi.org/10.1016/j.atmosenv.2017.07.010, 2017.
Kim, K.-M., Kim, S.-W., Choi, M., Kim, M., Kim J., Shina, I., Kim, J., Chung, C.Y., Yeo, H., Kim, S.-W., Joo, S. J., MckKeen, S. A., and Zhang, L.: Modeling Asian Dust Storms Using WRF-Chem During the DRAGON-Asia Field Campaign in April 2012, J. Geophys. Res.-Atmos., 126, e2021JD034793, https://doi.org/10.1029/2021JD034793, 2021.
Kim, K.-M., Kim, S.-W., Seo, S., Blake, D. R., Cho, S., Crawford, J. H., Emmons, L., Fried, A., Herman, J. H., Hong, J., Jung, J., Pfister, G., Weinheimer, A. J., Woo, J.-H., and Zhang, Q.: WRF-Chem configurations and input data sets for sensitivity tests of emission inventories, Zenodo [data set], https://doi.org/10.5281/zenodo.8260026, 2023.
Kim, S.-W., McDonald, B. C., Baidar, S., Brown, S. S., Dube, B., Ferrare, R. A., Frost, G. J., Harley, R. A., Holloway, J. S., Lee, H.-J., McKeen, S. A., Neuman, J. A., Bowak, J. B., Oetjen, H., Ortega, I., Pollack, I. B., Roberts, J. M., Ryerson, T. B., Scarino, A. J., Senff, C. J., Thalman, R., Trainer, M., Volkamer, R., Wagner, N., Washenfelder, R. A., Waxman, E., and Young, C. J.: Modeling the weekly cycle of NOx and CO emissions and their impacts on O3 in the Los Angeles-South Coast Air Basin during the CalNex 2010 field campaign, J. Geophys. Res.-Atmos., 121, 1340–1360, https://doi.org/10.1002/2015JD024292, 2016.
Kim, S.-W., Kim, K.-M., Jeong, Y., Seo, S., Park, Y., and Kim, J.: Changes in surface ozone in South Korea on diurnal to decadal timescales for the period of 2001–2021, Atmos. Chem. Phys., 23, 12867–12886, https://doi.org/10.5194/acp-23-12867-2023, 2023.
Kwon, H.-A., Park, R. J., Oak, Y. J., Nowlan, C. R., Janz, S. J., Kowalewski, M. G., Fried, A., Walega, J., Bates, K. H., Choi, J., Blake, D. R., Wisthaler, A., and Woo, J.-H.: Top-down estimates of anthropogenic VOC emissions in South Korea using formaldehyde vertical column densities from aircraft during the KORUS-AQ campaign, Elem. Sci. Anth., 9, 00109, https://doi.org/10.1525/elementa.2021.00109, 2021.
Kurokawa, J. and Ohara, T.: Long-term historical trends in air pollutant emissions in Asia: Regional Emission inventory in ASia (REAS) version 3, Atmos. Chem. Phys., 20, 12761–12793, https://doi.org/10.5194/acp-20-12761-2020, 2020.
Lee, B.-J., Kim, B., and Lee, K.: Air pollution exposure and cardiovascular disease, Toxicol. Res., 30, 71–75, https://doi.org/10.5487/TR.2014.30.2.071, 2014.
Lee, J. H., Hong, J.-W., Lee, K. M., Hong, J., Velasco, E., Lim, Y., Lee, J., Nam, K., and Park, J.: Ceilometer monitoring of boundary layer height in Seoul and its application to evaluate the dilution effect on air pollution, Bound. Lay. Meteorol., 171, 435–455, https://doi.org/10.1007/s10546-019-00452-5, 2019.
Li, M., Zhang, Q., Streets, D. G., He, K. B., Cheng, Y. F., Emmons, L. K., Huo, H., Kang, S. C., Lu, Z., Shao, M., Su, H., Yu, X., and Zhang, Y.: Mapping Asian anthropogenic emissions of non-methane volatile organic compounds to multiple chemical mechanisms, Atmos. Chem. Phys., 14, 5617–5638, https://doi.org/10.5194/acp-14-5617-2014, 2014.
Li, Q., Zhang, L., Wang, T., Tham, Y. J., Ahmadov, R., Xue, L., Zhang, Q., and Zheng, J.: Impacts of heterogeneous uptake of dinitrogen pentoxide and chlorine activation on ozone and reactive nitrogen partitioning: improvement and application of the WRF-Chem model in southern China, Atmos. Chem. Phys., 16, 14875–14890, https://doi.org/10.5194/acp-16-14875-2016, 2016.
Liu, Z., Doherty, R. M., Wild, O., Hollaway, M., and O’Connor, F. M.: Contrasting chemical environments in summertime for atmospheric ozone across major Chinese industrial regions: the effectiveness of emission control strategies, Atmos. Chem. Phys., 21, 10689–10706, https://doi.org/10.5194/acp-21-10689-2021, 2021.
Lu, K. D., Hofzumahaus, A., Holland, F., Bohn, B., Brauers, T., Fuchs, H., Hu, M., Häseler, R., Kita, K., Kondo, Y., Li, X., Lou, S. R., Oebel, A., Shao, M., Zeng, L. M., Wahner, A., Zhu, T., Zhang, Y. H., and Rohrer, F.: Missing OH source in a suburban environment near Beijing: observed and modelled OH and HO2 concentrations in summer 2006, Atmos. Chem. Phys., 13, 1057–1080, https://doi.org/10.5194/acp-13-1057-2013, 2013.
Manning, W. J. and von Tiedemann, A.: Climate change: Potential effects of increased atmospheric carbon dioxide (CO2), ozone (O3), and ultraviolet-B (UV-B) radiation on plant diseases, Environ. Pollut., 88, 219–245, https://doi.org/10.1016/0269-7491(95)91446-R, 1995.
Miyazaki, K., Sekiya, T., Fu, D., Bowman, K. W., Kulawik, S. S., Sudo, K., Walker, T., Kanaya, Y., Takigawa, M., Ogochi, K., Eskes, H., Boersma, K. F., Thompson, A. M., Gaubert, B., Barre, J., and Emmons, L. K.: Balance of Emission and Dynamical Controls on Ozone During the Korea-United States Air Quality Campaign From Multiconstituent Satellite Data Assimilation, J. Geophys. Res.-Atmos., 124, 387–413, https://doi.org/10.1029/2018JD028912, 2019.
NASA Langley Research Center's (LaRC) ASDC DAAC: Korea United States Air Quality Study, [data set], https://doi.org/10.5067/Suborbital/KORUSAQ/DATA01, 2022.
National Centers for Environmental Prediction/National Weather Service/NOAA/U.S. Department of Commerce: NCEP FNL Operational Model Global Tropospheric Analyses, continuing from July 1999, updated daily, Research Data Archive at the National Center for Atmospheric Research, Computational and Information Systems Laboratory [data set], https://doi.org/10.5065/D6M043C6, 2019.
Park, R. J., Oak, Y. J., Emmons, L. K., Kim, C.-H., Pfister, G. G., Carmichael, G. R., Saide, P. E., Cho, S.-Y., Kim, S., Woo, J.-H., Crawford, J. H., Gaubert, B., Lee, H.-J., Park, S.-Y., Jo, Y.-J., Gao, M., Tang, B., Stanier, C. O., Shin, S. S., Park, H. Y., Bae, C., and Kim, E.: Multi-model intercomparisons of air quality simulations for the KORUS-AQ campaign, Elem. Sci. Anth., 9, 00139, https://doi.org/10.1525/elementa.2021.00139, 2021.
Peterson, D. A., Hyer, E. J., Han, S.-O., Crawford, J. H., Park, R. J., Holz, R., Kuehn, R. E., Eloranta, E., Knote, C., Jordan, C. E., and Lefer, B. L.: Meteorology influencing springtime air quality, pollution transport, and visibility in Korea, Elem. Sci. Anth., 7, 57, https://doi.org/10.1525/elementa.395, 2019.
Richter, D., Weibring, P., Walega, J. G., Fried, A., Supler, S. M., and Taubman, M. S.: Compact highly sensitive multi-species airborne mid-IR spectrometer, Appl. Phys. B, 119, 119–131, https://doi.org/10.1007/s00340-015-6038-8, 2015.
Rosenzweig, C., Karoly, D., Vicarelli, M., Neofotis, P., Wu, Q., Casassa, G., Menzel, A., Root, T. L., Estrella, N., Seguin, B., Tryjanowski, P., Liu, C., Rawlins, S., and Imeson, A.: Attributing physical and biological impacts to anthropogenic climate change, Nature, 453, 353–357, https://doi.org/10.1038/nature06937, 2008.
Saikawa, E., Kim, H., Zhong, M., Avramov, A., Zhao, Y., Janssens-Maenhout, G., Kurokawa, J.-I., Klimont, Z., Wagner, F., Naik, V., Horowitz, L. W., and Zhang, Q.: Comparison of emissions inventories of anthropogenic air pollutants and greenhouse gases in China, Atmos. Chem. Phys., 17, 6393–6421, https://doi.org/10.5194/acp-17-6393-2017, 2017.
Sharma, A., Ojha, N., Pozzer, A., Mar, K. A., Beig, G., Lelieveld, J., and Gunthe, S. S.: WRF-Chem simulated surface ozone over south Asia during the pre-monsoon: effects of emission inventories and chemical mechanisms, Atmos. Chem. Phys., 17, 14393–14413, https://doi.org/10.5194/acp-17-14393-2017, 2017.
Sicard, P., Crippa, P., De Marco, A., Castruccio, S., Giani, P., Cuesta, J., Paoletti, E., Feng, Z., and Anav, A.: High spatial resolution WRF-Chem model over Asia: Physics and chemistry evaluation, Atmos. Environ., 244, 118004, https://doi.org/10.1016/j.atmosenv.2020.118004, 2021.
Skamarock, W. C., Klemp, J. B., Dudhia, J., Gill, D. O., Liu, Z., Berner, J., Wang, W., Powers, J. G., Duda, M. G., Barker, D., and Huang, X. -yu.: A Description of the Advanced Research WRF Model Version 4.3 (No. NCAR/TN-556+STR), https://doi.org/10.5065/1dfh-6p97, 2021.
Souri, A. H., Nowlan, C. R., González Abad, G., Zhu, L., Blake, D. R., Fried, A., Weinheimer, A. J., Wisthaler, A., Woo, J.-H., Zhang, Q., Chan Miller, C. E., Liu, X., and Chance, K.: An inversion of NOx and non-methane volatile organic compound (NMVOC) emissions using satellite observations during the KORUS-AQ campaign and implications for surface ozone over East Asia, Atmos. Chem. Phys., 20, 9837–9854, https://doi.org/10.5194/acp-20-9837-2020, 2020.
Spinei, E., Tiefengraber, M., Müller, M., Gebetsberger, M., Cede, A., Valin, L., Szykman, J., Whitehill, A., Kotsakis, A., Santos, F., Abbuhasan, N., Zhao, X., Fioletov, V., Lee, S. C., and Swap, R.: Effect of polyoxymethylene (POM-H Delrin) off-gassing within the Pandora head sensor on direct-sun and multi-axis formaldehyde column measurements in 2016–2019, Atmos. Meas. Tech., 14, 647–663, https://doi.org/10.5194/amt-14-647-2021, 2021.
Stockwell, W. R., Kirchner, F., and Kuhn, M.: A new mechanism for regional atmospheric chemistry modeling, J. Geophys. Res.-Atmos., 102, 25847–25879, https://doi.org/10.1029/97JD00849, 1997.
Tang, W., Emmons, L. K., Arellano Jr., A. F., Gaubert, B., Knote, C., Tilmes, S., Buchholz, R. R., Pfister, G. G., Diskin, G. S., Blake, D. R., Blake, N. J., Meinardi, S., DiGangi, J. P., Choi, Y., Woo, J.-H., He, C., Schroeder, J. R., Suh, I., Lee, H.-J., Kanaya, Y., Jung, J., Lee, Y., and Kim, D.: Source Contributions to Carbon Monoxide Concentrations During KORUS-AQ Based on CAM-chem Model Applications, J. Geophys. Res.-Atmos., 124, 2796–2822, https://doi.org/10.1029/2018JD029151, 2019.
Travis, K. R., Crawford, J. H., Chen, G., Jordan, C. E., Nault, B. A., Kim, H., Jimenez, J. L., Campuzano-Jost, P., Dibb, J. E., Woo, J.-H., Kim, Y., Zhai, S., Wang, X., McDuffie, E. E., Luo, G., Yu, F., Kim, S., Simpson, I. J., Blake, D. R., Chang, L., and Kim, M. J.: Limitations in representation of physical processes prevent successful simulation of PM2.5 during KORUS-AQ, Atmos. Chem. Phys., 22, 7933–7958, https://doi.org/10.5194/acp-22-7933-2022, 2022.
Wada, A., Matsueda, H., Murayama, S., Taguchi, S., Kamada, A., Nosaka, M., Tsuboi, K., and Sawa, Y.: Evaluation of anthropogenic emissions of carbon monoxide in East Asia derived from the observations of atmospheric radon-222 over the western North Pacific, Atmos. Chem. Phys., 12, 12119–12132, https://doi.org/10.5194/acp-12-12119-2012, 2012.
Wiedinmyer, C. and Emmons, L.: Fire Inventory from NCAR version 2 Fire Emission, Research Data Archive at the National Center for Atmospheric Research, Computational and Information Systems Laboratory, https://doi.org/10.5065/XNPA-AF09, 2022.
Wild, O., Prather, M. J., and Akimoto, H.: Indirect long-term global radiative cooling from NOx Emissions, Geophys. Res. Lett., 28, 1719–1722, https://doi.org/10.1029/2000GL012573, 2001.
Woo, J.-H., Choi, K.-C., Kim, H. K., Baek, B. H., Jang, M., Eum, J.-H., Song, C. H., Ma, Y.-I., Sunwoo, Y., Chang, L.-S., and Yoo, S. H.: Development of an anthropogenic emissions processing system for Asia using SMOKE, Atmos. Environ., 58, 5–13, https://doi.org/10.1016/j.atmosenv.2011.10.042, 2012.
wrf-model: WRF, Github [code], https://github.com/wrf-model/WRF/releases/tag/v4.4, last access: 18 May 2022.
Zhang, Y.-L. and Cao, F.: Fine particulate matter (PM2.5) in China at a city level, Sci. Rep., 5, 14884, https://doi.org/10.1038/srep14884, 2015.
Zhang, Y., Zhang, R., Yu, J., Zhang, Z., Yang, W., Zhang, H., Lyu, S., Wang, Y., Dai, W., Wang, Y., and Wang, X.: Isoprene Mixing Ratios Measured at Twenty Sites in China During 2012–2014: Comparison With Model Simulation, J. Geophys. Res.-Atmos., 125, e2020JD033523, https://doi.org/10.1029/2020JD033523, 2020.
Zheng, B., Tong, D., Li, M., Liu, F., Hong, C., Geng, G., Li, H., Li, X., Peng, L., Qi, J., Yan, L., Zhang, Y., Zhao, H., Zheng, Y., He, K., and Zhang, Q.: Trends in China's anthropogenic emissions since 2010 as the consequence of clean air actions, Atmos. Chem. Phys., 18, 14095–14111, https://doi.org/10.5194/acp-18-14095-2018, 2018.
Zhong, M., Saikawa, E., Liu, Y., Naik, V., Horowitz, L. W., Takigawa, M., Zhao, Y., Lin, N.-H., and Stone, E. A.: Air quality modeling with WRF-Chem v3.5 in East Asia: sensitivity to emissions and evaluation of simulated air quality, Geosci. Model Dev., 9, 1201–1218, https://doi.org/10.5194/gmd-9-1201-2016, 2016.
- Abstract
- Introduction
- Data and methods
- Results
- Discussion: strategy for accurate surface O3 simulations over urban and regional areas in China and South Korea
- Summary and conclusions
- Code and data availability
- Author contributions
- Competing interests
- Disclaimer
- Acknowledgements
- Financial support
- Review statement
- References
- Supplement