the Creative Commons Attribution 4.0 License.
the Creative Commons Attribution 4.0 License.
 | 14 Feb 2024
The implementation of dust mineralogy in COSMO5.05-MUSCAT
Sofía Gómez Maqueo Anaya
Dietrich Althausen
Matthias Faust
Holger Baars
Bernd Heinold
Julian Hofer
Ina Tegen
Albert Ansmann
Ronny Engelmann
Annett Skupin
Birgit Heese
Kerstin Schepanski
Mineral dust aerosols are composed of a complex assemblage of various minerals depending on the region in which they originated. Given the different mineral composition of desert dust aerosols, different physicochemical properties and therefore varying climate effects are expected.
Despite the known regional variations in mineral composition, chemical transport models typically assume that mineral dust aerosols have uniform composition. This study adds, for the first time, mineralogical information to the mineral dust emission scheme used in the chemical transport model COSMO–MUSCAT. We provide a detailed description of the implementation of the mineralogical database, GMINER (Nickovic et al., 2012), together with a specific set of physical parameterizations in the model's mineral dust emission module, which led to a general improvement of the model performance when comparing the simulated mineral dust aerosols with measurements over the Sahara region for January–February 2022.
The simulated mineral dust aerosol vertical distribution is tested by a comparison with aerosol lidar measurements from the lidar system PollyXT, located at Cape Verde. For a lofted mineral dust aerosol layer on 2 February at 05:00 UTC the lidar retrievals yield a dust mass concentration peak of 156 µg m−3, while the model calculates the mineral dust peak at 136 µg m−3. The results highlight the possibility of using the model with resolved mineral dust composition for interpretation of the lidar measurements since a higher absorption in the UV–Vis wavelengths is correlated with particles having a higher hematite content. Additionally, the comparison with in situ mineralogical measurements of dust aerosol particles shows that more of them are needed for model evaluation.
- Article
(6902 KB) - Full-text XML
- BibTeX
- EndNote


Mineral dust aerosols impact climate in multiple ways. They interact with both shortwave and longwave radiation, modifying the atmospheric radiation balance (Kok et al., 2023; Mahowald et al., 2010). Furthermore, they modify cloud properties by acting as cloud condensation nuclei or as ice-nucleating particles (Atkinson et al., 2013; Hoose et al., 2008; Chatziparaschos et al., 2023). Since mineral dust aerosols are a complex assemblage of various minerals with their distinct physicochemical properties (Formenti et al., 2011), differences of their atmospheric radiative impact will arise as a consequence of distinct mineral content. For example, whether the presence of mineral dust aerosols in the atmosphere will result in cooling or warming of the atmospheric column depends on the mineral dust aerosol composition and its size distribution as well as on surface albedo (Balkanski et al., 2007). In particular, minerals containing iron oxides are correlated to a distinct interaction with radiation in the UV–Vis wavelength region that carries the possibility of modifying the interaction between the mineral dust aerosols and the atmosphere radiation budget (Kok et al., 2023; Li et al., 2021; Baldo et al., 2020; Balkanski et al., 2007). Furthermore, the feldspar mineral is active as ice-nucleating particles under mixed-phased cloud conditions (Harrison et al., 2019; Atkinson et al., 2013). Considering that mineral dust aerosols are identified in the atmosphere as the dominant natural ice-nucleating aerosol (Hoose et al., 2008), recognizing mineral composition of dust aerosol particles is crucial for a more accurate representation of the atmosphere–mineral dust interaction. Moreover, mineralogical composition can be used to identify dust source regions. Soils that commonly produce mineral dust aerosols, so-called mineral-dust-productive soils, are classified by their distinct combination of mineral fraction contents (Formenti et al., 2011, 2014; Scheuvens et al., 2013).
Despite known regional variations in the mineral composition, chemical transport models typically assume that mineral dust aerosols have uniform composition (Perlwitz et al., 2015a). Therefore, the introduction of mineralogical information in chemical transport models is required for a more accurate simulation of the interaction between mineral dust aerosols and radiation, as well as ice nucleation and ultimately weather forecasts and climate simulations (Nickovic et al., 2012; Perlwitz et al., 2015a). The addition of mineral composition to mineral dust simulations becomes even more crucial when considering that dust emissions are likely to change in the future in response to anthropogenic changes in climate and consequent changes in the natural vegetation pattern and in land use. Dust emissions from new sources due to human activity will have the consequence of a change in the overall composition of airborne dust and therefore modify their atmospheric interactions (Harrison et al., 2001).
Adding mineralogical fractions to mineral dust aerosol simulations in chemical transport models requires specifying the geographic distribution of minerals in mineral-dust-productive soils at a high spatial resolution. Claquin et al. (1999) proposed that the soil mineral fractions are approximately related to the soil type, taking into account the size distribution, the chemistry, and the color of the soil according to the FAO74 classification (FAO-UNESCO, 1974). They derived an average surface mineralogy that can be inferred for each soil unit of arid soil. Nickovic et al. (2012) extended this approach by including new soil types and phosphorus concentrations. This study presents the inclusion of the Nickovic et al. (2012) high-resolution mineralogical database, GMINER (Global Mineral Database), in the mineral dust emission scheme considered in the regional chemical transport model COSMO–MUSCAT (COSMO: COnsortium for Small-scale Modelling; MUSCAT: MultiScale Chemistry Aerosol Transport Model). Our project focuses on the region of the Sahara, which is of crucial importance for the global atmospheric mineral dust load (Prospero et al., 2002). In addition, the ability of COSMO–MUSCAT to accurately reflect the mineral dust life cycle (i.e., emission, transport, and deposition) has been thoroughly validated for the region, as shown by Heinold et al. (2011) and Schepanski et al. (2017, 2009), among others. This study is the first time that soil mineralogical information has been included in the mineral dust emission scheme for the regional chemical transport model COSMO–MUSCAT, and it is among the first studies to include mineralogical information in the mineral dust life cycle for regional models (Menut et al., 2020; Solomos et al., 2023).
Studies that have added mineral information to mineral dust aerosol simulations and focused on the direct radiative forcing of mineral dust aerosols include Scanza et al. (2015) and Li et al. (2021). They used the Community Atmosphere Model 4 (CAM4) and the Community Atmosphere Model 5 (CAM5), respectively. On a similar research line, Journet et al. (2014) use their updated high-resolution mineralogical database to infer mineral dust single-scattering albedo via the amount of mineral-contained iron oxide. The model used for that study is LMDz-INCA (LMDz: Laboratoire de Météorologie Dynamique; INCA: INteraction with Chemistry and Aerosols), which is a coupled general circulation model (LMDz) with a chemistry–aerosol model (INCA). A modeling effort comparing the mineralogical databases of Journet et al. (2014) and Nickovic et al. (2012) with mineral measurements on a global model can be found in Gonçalves Ageitos et al. (2023), who used MONARCH (Multiscale Online Nonhydrostatic AtmospheRe CHemistry model) to assess the sensitivity to the different mineralogy databases and their effect on the calculation of the direct radiative effect of dust.
The studies performed by Perlwitz et al. (2015a, b) apply a different approach focusing on predicting regional variations of aerosol mineral composition as a function of particle size by considering that the aerosol mineral content may differ from that of the mineral-dust-productive soil. This has been implemented in the NASA Goddard Institute for Space Studies (GISS) Earth System ModelE2 in which the dust emission scheme follows the work of Kok (2011). Other modeling studies implementing mineralogy databases with the purpose of researching the link between minerals and their ice-nucleating properties involve the work of Hoose et al. (2008), who used the aerosol–climate modeling system ECHAM5-HAM (global general circulation model ECHAM5 with a coupled aerosol chemistry and microphysics package HAM), and the work of Atkinson et al. (2013), who implemented mineralogical information in a two-moment microphysical aerosol scheme called GLOMAP (GLObal Model of Aerosol Processes) that runs within the TOMCAT (Toulouse Off-line Model of Chemistry And Transport) chemical transport model in order to specifically explore the role of feldspar for ice nucleation in mixed-phase clouds. Furthermore, the study from Chatziparaschos et al. (2023) used the global 3D chemistry transport model TM4-ECPL in order to investigate the role of feldspar and quartz as ice-nucleating particles.
This paper aims at describing and validating both the implementation of mineralogy and the set of physical parameterizations used to simulate the atmospheric life cycle of mineral dust. Ways in which further studies could benefit from a model with resolved mineralogy are highlighted throughout the comparisons with dust-related measurements. This paper is structured as follows: the Methodology section starts with a general description of the COSMO–MUSCAT model (Sect. 2.1), followed by the definition of the simulated mineral dust life cycle and a comprehensive explanation of the modifications done to the dust emission parameterization (Sect. 2.2), including the implementation of the mineralogical information (Sect. 2.3). The Methodology section closes by describing a particular model setup together with the model validation methods and data acquisition (Sect. 2.5). In the Results section, the aerosol optical thickness (AOT) comparisons between model results and both ground-based and spaceborne remote sensing are presented first (Sect. 3.1). Secondly, mineral mass concentration maps are compared together with mineral mass measurements (Sect. 3.2). The section ends with a vertical profile comparison for Mindelo, São Vicente, in the Cape Verde archipelago (Sect. 3.3). In the “Conclusions and implications” section future research opportunities with regard to mineral optical properties are highlighted.
2.1 Model description
The COSMO–MUSCAT model is a mesoscale atmospheric model system that consists of two online-coupled models. COSMO is a regional forecast model from the German Weather Service (DWD) which solves the governing equations throughout a terrain-following coordinate system (Baldauf et al., 2011). MUSCAT, driven by the meteorological model, is the chemical transport model that calculates the atmospheric advective transport of aerosols taking into account time-dependent mass balance equations (Heinold et al., 2011; Wolke et al., 2012). Mineral dust aerosols transported in MUSCAT are considered to be passive tracers, meaning that dust aerosol particles are not chemically aged or involved in any other chemical reactions.
The capability of COSMO–MUSCAT to simulate the Saharan mineral dust aerosol distribution has been validated in the scope of several studies. This includes the study by Heinold et al. (2011), who simulated the transport of mineral dust and biomass burning smoke from the Sahara towards the Atlantic, whereas the study by Tegen et al. (2013) modeled dust source activation for over 2 years. Both studies compared and validated their simulations with both ground-based and spaceborne remote sensing measurements and found good agreement with the observations. A further validation is shown by Schepanski et al. (2009), who validated model results for both winter and summer distinctive meteorological conditions. In Schepanski et al. (2016) a more recent version of the model is used for simulating North African dust transport towards the Mediterranean, and it is validated by the comparison of dust loading data from both spaceborne and ground-based remote sensing measurements. The conclusion from this study is that the model is trustworthy for simulating the mineral dust life cycle within the atmospheric circulation. A similar conclusion is reached by the comparison done in Schepanski et al. (2017), where the model was used for simulating the Saharan dust outflow towards the North Atlantic.
The atmospheric mineral dust life cycle is simulated following physical parameterizations defined in MUSCAT. These parameterizations depend on the COSMO meteorological and hydrological fields that get updated for each advection time step. These physical parameterizations include (1) dust emission following Tegen et al. (2002) updated by some modifications to consider specific soil mineralogical fractions. The modifications are thoroughly explained in Sect. 2.2 and 2.3. (2) Aerosol transport is simulated by solving a third-order upwind scheme via temporal integration (Wolke and Knoth, 2000), and (3) aerosol removal includes both dry and wet deposition processes. The computation of dry deposition follows Seinfeld and Pandis (2016) and Zhang et al. (2001), while wet deposition, which comprises both rain-out and wash-out, is parameterized following Berge (1997) and Jakobsen et al. (1997). A full description of the deposition scheme can be found in Heinold et al. (2011).
As part of the simulated mineral dust life cycle, COMO–MUSCAT can take into account the aerosol–radiation interactions (Helmert et al., 2007). For the purposes of this study, the aerosol radiative feedback is not considered.
2.2 Dust emission
Dust emission is a nonlinear process that occurs when the surface wind speed exceeds a threshold. This threshold is based on the wind speed needed to produce a momentum change via vertical shear stress at the soil surface that would be enough to create particle mobilization. Such particle mobilization is based on the soil friction velocity, which in turn depends on the soil particle size distribution as well as on surface conditions like vegetation cover and soil moisture. The threshold friction velocities for each particle size distribution are calculated following the parameterizations developed by Marticorena and Bergametti (1995).
In order to calculate the soil threshold fiction velocities, first a calculation of the wind-produced surface friction velocity is needed. The wind-derived surface friction velocity, in turn, depends on the surface wind speed and on the assumption of a neutral atmospheric stratification and adiabatic conditions. Hence, the logarithmic layer profile theory (Priestley, 1959) is applied for its calculation, that being
Here a modification of the formula is implemented following Darmenova et al. (2009). They recommend that, when using the emission scheme developed by Marticorena and Bergametti (1995), a fixed value for the local aerodynamic roughness length, z0, be used in the logarithmic wind profile implementation (Eq. 1). The fixed value is set to a representative value for bare (desert) surfaces, z0 = 0.01 m. Specifically, we use the 10 m wind speed as the surface wind velocity (U(z)), since this calculation represents the model wind speed which is the closest to the surface; z is the thickness of the surface layer, and κ represents the von Kármán constant.
Dust emissions can then only take place where the particle-size-dependent friction velocity is high enough to mobilize dust particles and where the soil conditions would allow such emissions. When the particle mobilization starts, the first movement is parameterized as a horizontal particle flux,
where G represents the horizontal particle flux, ρa is the air density, g denotes the gravitational acceleration, u∗ is the surface friction velocity, and u∗tr is the threshold friction velocity that depends on the soil particle diameter (Dpi). i represents the different size fractions which the diameter depends upon as well as the relative surface area covered by that size fraction, si. For our setup, we have 196 particle size classes (i). The condition for Eq. (2) stresses the fact that mobilization of dust will only happen when the surface friction velocity surpasses the particle-size-dependent threshold friction velocity. Processes such as saltation and bombardment (Marticorena and Bergametti, 1995) are already considered for the derivation of Eq. (2). After these processes, the flux that is allowed to be transported in the atmosphere is parameterized as a vertical particle flux,
where F represents the vertical particle flux and α is the sandblasting efficiency, which is a ratio between the horizontal fluxes and vertical fluxes and is prescribed for each soil type, considering its percentage of clay, silt, and sand composition of the soil per grid cell as implemented in Tegen et al. (2002). Aeff is the erodible area which depends on vegetation cover and roughness length, Asnow is the part of Aeff covered by snow, and Iθ represents the influence of soil moisture (Fécan et al., 1999). When certain amounts of vegetation and soil moisture are present, they will have the effect of suppressing mineral dust emission.
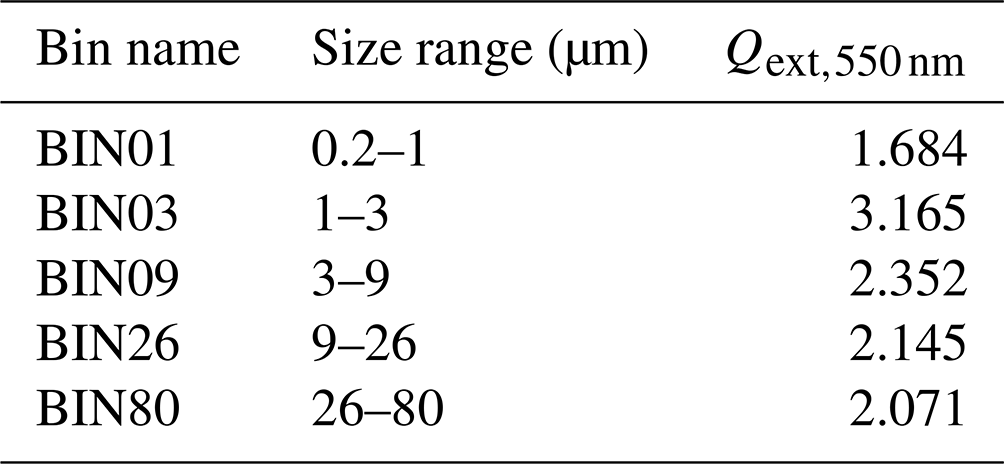
Vertical dust particle fluxes are then transported into the atmosphere depending on the particle size distribution. The particle fluxes are distributed over five independent size classes described in Table 1. As illustrated by Eqs. (2) and (3), soil conditions such as particle size distribution, soil moisture, vegetation, and roughness length have to be considered as part of the dust emission scheme. Some of the soil conditions inhibit mineral dust emissions, such as soil moisture and vegetation cover. For soil moisture, a threshold is calculated for each grid cell; if the moisture is below this threshold, dust emission is allowed to continue unaltered, but if it is above it, then a linear relationship is followed that suppresses dust emission. The approach follows the parameterization developed by Fécan et al. (1999), and the volumetric soil water content data are obtained for the first soil layer as given by the ERA5-Land hourly data (Muñoz Sabater and Copernicus Climate Change Service, 2019). Since vegetation cover greatly influences mineral dust emission (Marticorena et al., 1997; Tegen et al., 2002), a limit is set for the fraction of vegetation cover per grid cell that will suppress dust emission. This fraction is set to 0.5 for deserts, and a linear relationship is established between the vegetation cover fraction and the suppression of mineral dust emission following Tegen et al. (2002). Soil vegetation cover information is obtained from the Copernicus Global Land Service, where satellite-retrieved FCOVER is the fraction of vegetation cover that corresponds to the fraction of ground covered by green vegetation (Fuster et al., 2020). Soil roughness length is a potential mineral dust emission inhibitor as quantified in the calculation of the particle-dependent threshold friction velocity in the Marticorena and Bergametti (1995) mineral dust emission scheme. The aerodynamic roughness length dataset developed by Prigent et al. (2005) is used here as the soil roughness length considered for the mineral dust emission calculations. The particle size distribution for soils, described by the most commonly used size populations, i.e., clay, silt, and sand, is obtained from the SoilGrids database (Poggio et al., 2021). In addition, a dust source activation frequency map derived from MSG-SEVIRI IR channels as described in Schepanski et al. (2007) is used to verify dust-emitting areas.
Table 1Description of five independent MUSCAT size classes for mineral dust aerosol transport. Their size limits are indicated together with the dimensionless dust extinction efficiency at 550 nm, Qext,550 nm (Sokolik and Toon, 1996), which is used as a first approximation to calculate atmospheric aerosol optical thickness (AOT) for validation purposes.
2.3 Mineralogy implementation
The relation between soil particle size distribution and type with its fractional mineral abundance is described by Nickovic et al. (2012), where the high-resolution mineralogical database, GMINER, is introduced. GMINER exclusively considers mineral fractions for mineral-dust-productive soils and it is specifically aimed at atmospheric dust modeling. The mineralogical database follows the Claquin et al. (1999) procedure, which establishes the identification of mineral-dust-productive soils following the FAO74 classification and provides information on soil populations of clay- and silt-sized particles. Effective fractions of minerals in soils are determined by combining soil texture classes. GMINER is consequently a database that establishes the relationship between different mineral-dust-productive soil types and the following minerals: quartz, feldspar, calcite, gypsum, illite, kaolinite, smectite, and hematite. Phosphorus, which is found in several minerals and the concentration of which is crucial for its role in ocean fertilization, was also added. Mineral and phosphorus fractions are distributed over the clay and silt particle size population, where clay is defined as particles with sizes less than 2 µm and silt is classified as particle sizes between 2 and 50 µm. In such a framework, certain minerals are considered to have contributions to both clay and silt size populations as is the case with quartz, while other minerals just have contributing fractions to either clay or silt sizes. For example, illite contributes only to the soil clay particle size population and feldspar is only considered part of the silt particle size population. It is noteworthy that the particle size of 2 µm, which acts as the division between mineral contents in clay- and silt-sized particles, is thought of as arbitrary and was used for the creation of the database as a first approximation (Nickovic et al., 2012). For the present study that value remains unchanged.
The mineralogical fractions of dust aerosol particles are assumed to be the same as these mineral fractions of the soil source. This implies that the changes in particle size distribution due to the saltation and sandblasting processes do not affect the mineral distribution, even though the general mineral dust particle size distribution is modified during emission (Journet et al., 2014; Marticorena and Bergametti, 1995; Perlwitz et al., 2015a). The GMINER dataset considers a mineral mass size distribution defined by the sizes that could be emitted: the smallest particle classes, silt and clay. These two smallest size classes are considered light enough to remain suspended in the atmosphere for several days. Nonetheless, the approach by Nickovic et al. (2012) introduces other various sources of uncertainty. For instance, the relation between mineral composition and soil type is derived from sparse measurements, and they are generalized for soil types. That means that regional variations in mineral content for a particular soil type are not considered. Furthermore, some measurements are based on wet sedimentation techniques that disturb the original soil composition, breaking aggregates and therefore replacing them with smaller particles. That causes a larger allocation of mineral fractions to clay-sized populations than could exist in undisturbed soil. Such allocation could have a big effect on the modeled phyllosilicate (illite, kaolinite, and smectite) content since measurements suggest that these minerals are found at coarser sizes (Kandler et al., 2009). These uncertainties could cause large differences in soil size distributions during emission (Journet et al., 2014; Perlwitz et al., 2015a).
Previous modeling studies that consider the change in mineral mass particle size distribution from the parent soil to the aerosol regime include Perlwitz et al. (2015a, b), Gonçalves Ageitos et al. (2023), Pérez García-Pando et al. (2016), Scanza et al. (2015), and Li et al. (2021). They all take into account a size modification of the emitted dust via the Kok (2011) brittle fragmentation theory, which is a dust emission scheme that allows the treatment of individual particles by taking into account an invariant soil size distribution. This emission scheme differs in several ways from the emission scheme currently used in COSMO–MUSCAT; the most crucial difference is the need for mineral dust bulk physical characteristics in the Marticorena and Bergametti (1995) emission scheme (see their Eqs. 29–33). This suggests that the exact physical parameters that rule the size distribution change depend on the mineral dust emission scheme used, which can vary substantially. There is currently no physical parameterization that would take into account the change in mineral mass particle size distribution by considering the Marticorena and Bergametti (1995) dust emission scheme. Moreover, several studies (Solomos et al., 2023; Atkinson et al., 2013; Hoose et al., 2008; Journet et al., 2014) have assumed that the particle size distribution of the emitted minerals resembles that of the mineral-dust-productive soil.
Measurements of the different particle size distributions between source soil composition and suspended mineral dust are sparse. Such measurements are not straightforward and the amounts of mineral dust aerosol collected downwind of the source are small (Journet et al., 2014). Nevertheless, Caquineau et al. (1998) and Lafon et al. (2004) have shown that the relative proportions of clay-sized minerals in mineral dust aerosol are close to those of the mineral-dust-productive soils and are conserved during transport. On the other hand, mineral distribution in silt sizes appears to not be the same as the distribution found on the soil. Perlwitz et al. (2015a) suggest that this is because of the wet-sieving technique used to measure the mineral content on the soil.
In addition, measurements have suggested that the mineral composition changes the density of mineral dust, mostly due to the presence of minerals with iron oxide content, which are heavier than other minerals (Kandler et al., 2009). For the present study, a bulk mineral dust density is considered and set to 2650 kg m3. This parameter is selected as such due to sensitivity tests (not shown) that show that possible changes in the density due to iron oxide content have a negligible effect on mineral dust mass concentrations.
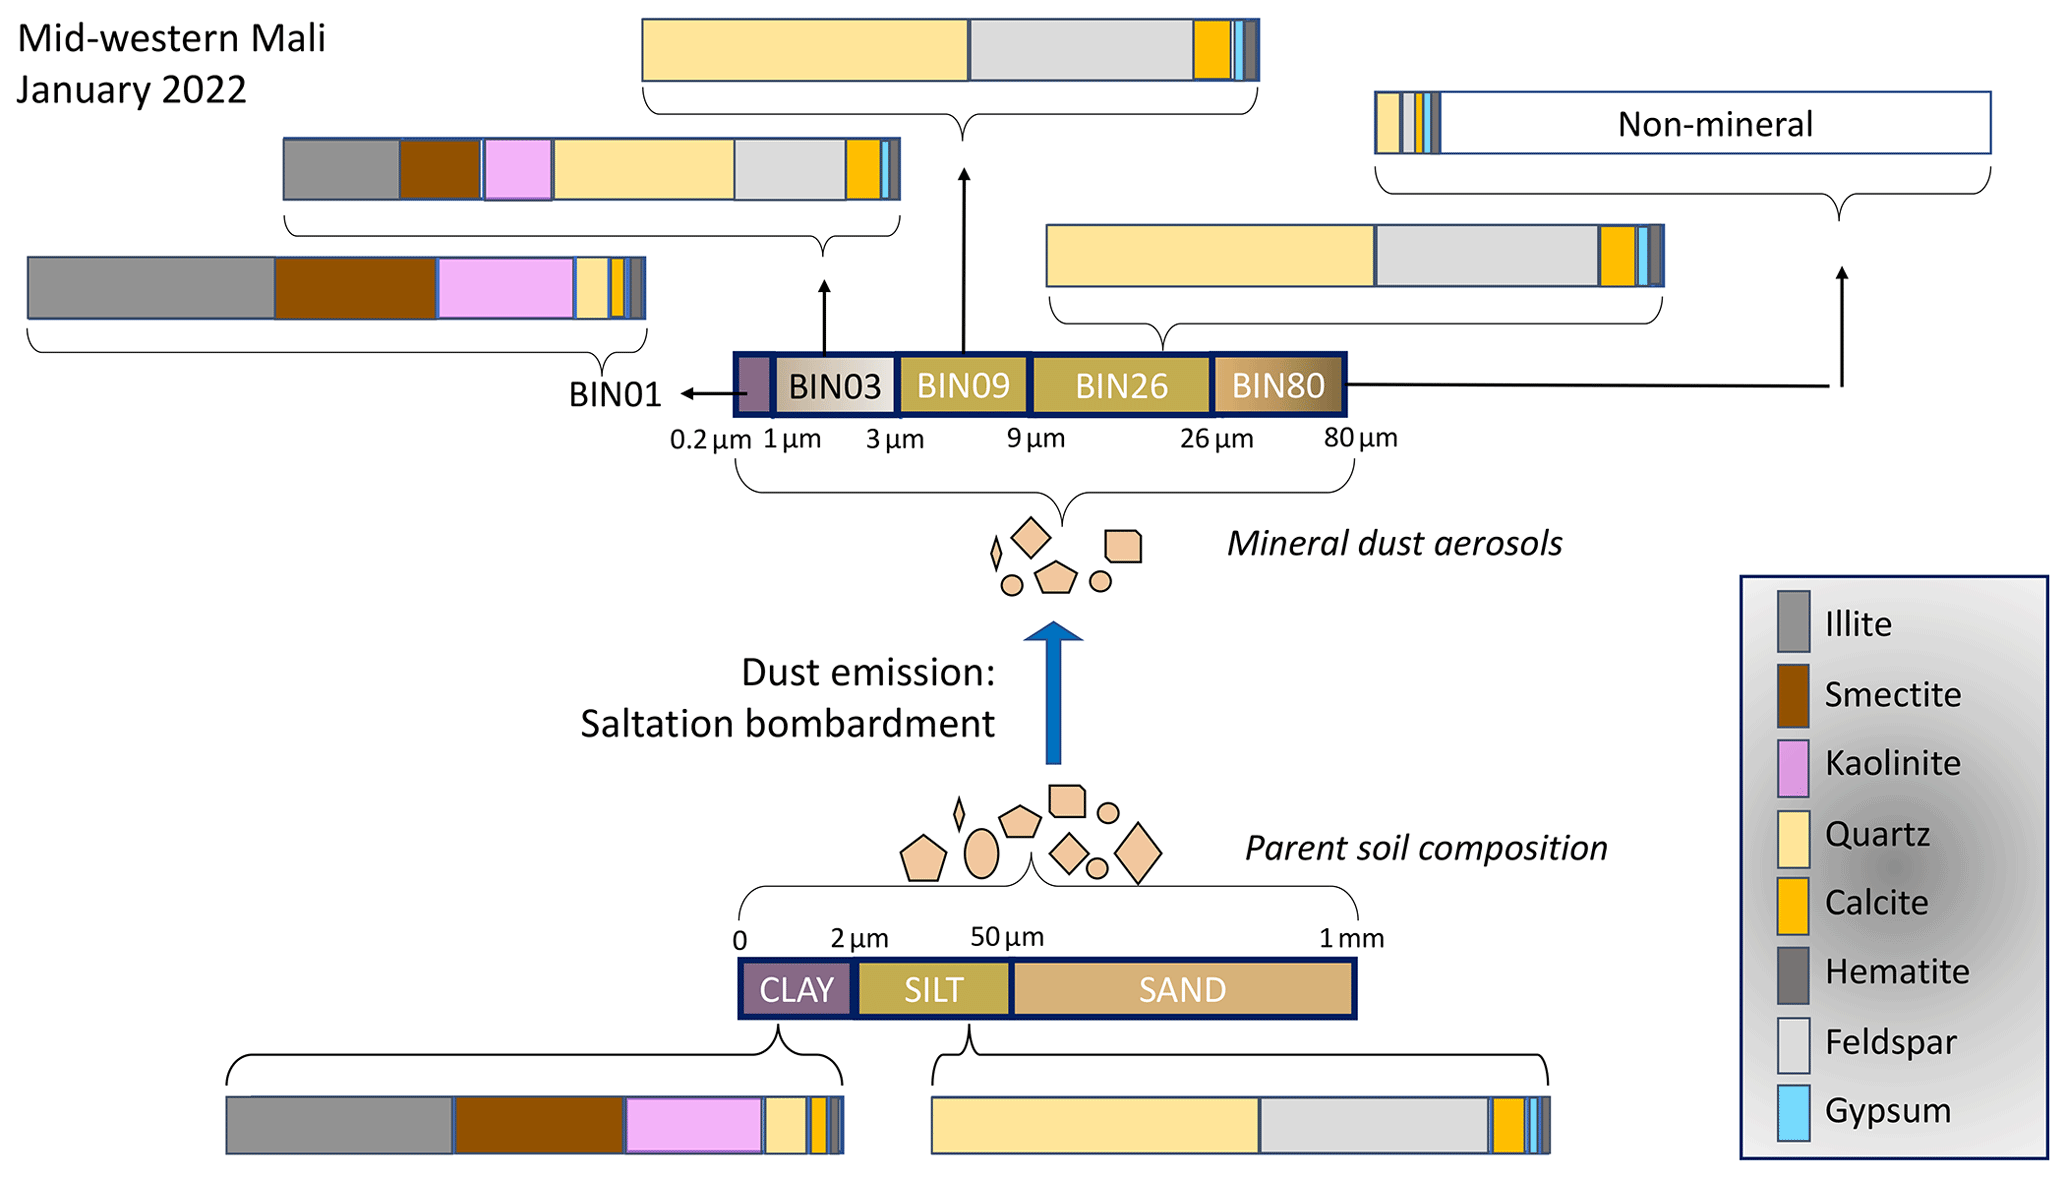
Figure 1The scheme represents mineral dust as consisting of a mixture of different minerals with different portions for both mineral-dust-productive soil and aerosol size distributions. The bin names are a MUSCAT convention that represents size classes in which the aerosol is transported; for more information see Table 1. Boxes with a thicker surrounding line represent particle size distribution, while the thinner line surrounding boxes represents mineral fractions. The mineral proportions depicted are representative for both mineral-dust-productive soil and aerosol compositions for a grid cell in midwestern Mali (17.85∘ N, 4.85∘ W). Aerosol size distribution is taken for 27 January 2022 at 21:00 UTC.
Figure 1 shows a representation of the partitioning of the dust particles regarding their mineral content for both the source soil size distribution and the aerosol size distribution for a particular grid cell located in midwestern Mali. Mineralogy for dust particles is derived from a simulated dust emission flux that took place on 27 January 2022 at 21:00 UTC. The emitted mass fractions are normalized so that within each size bin, the sum over all minerals is unity. The normalization is chosen to show the mineral proportions in each size class for both the soil composition and the mineral dust aerosol size classes. The vertical emission size classes are described in Sect. 2.2 and Table 1.
For each size bin, emission fluxes in are calculated taking into account the meteorological conditions of that location and time. Mineral fractions are appointed following the mineral-dust-productive soil mineral fraction. For the mineral calculation, clay- and silt-sized minerals divide the total mineral dust emission for each size class. As such, for BIN03 (1–3 µm), a mixture of clay- and silt-sized minerals divides the size class total emission, and for BIN80 (26–80 µm) mineral fractions represent only a small portion of the overall mineral dust emission content. This is due to the cut on the mineralogical dataset where the classification ends with particles with diameters of 50 µm; therefore, all the particles that are bigger than that in the model are considered to not have any kind of mineral information.
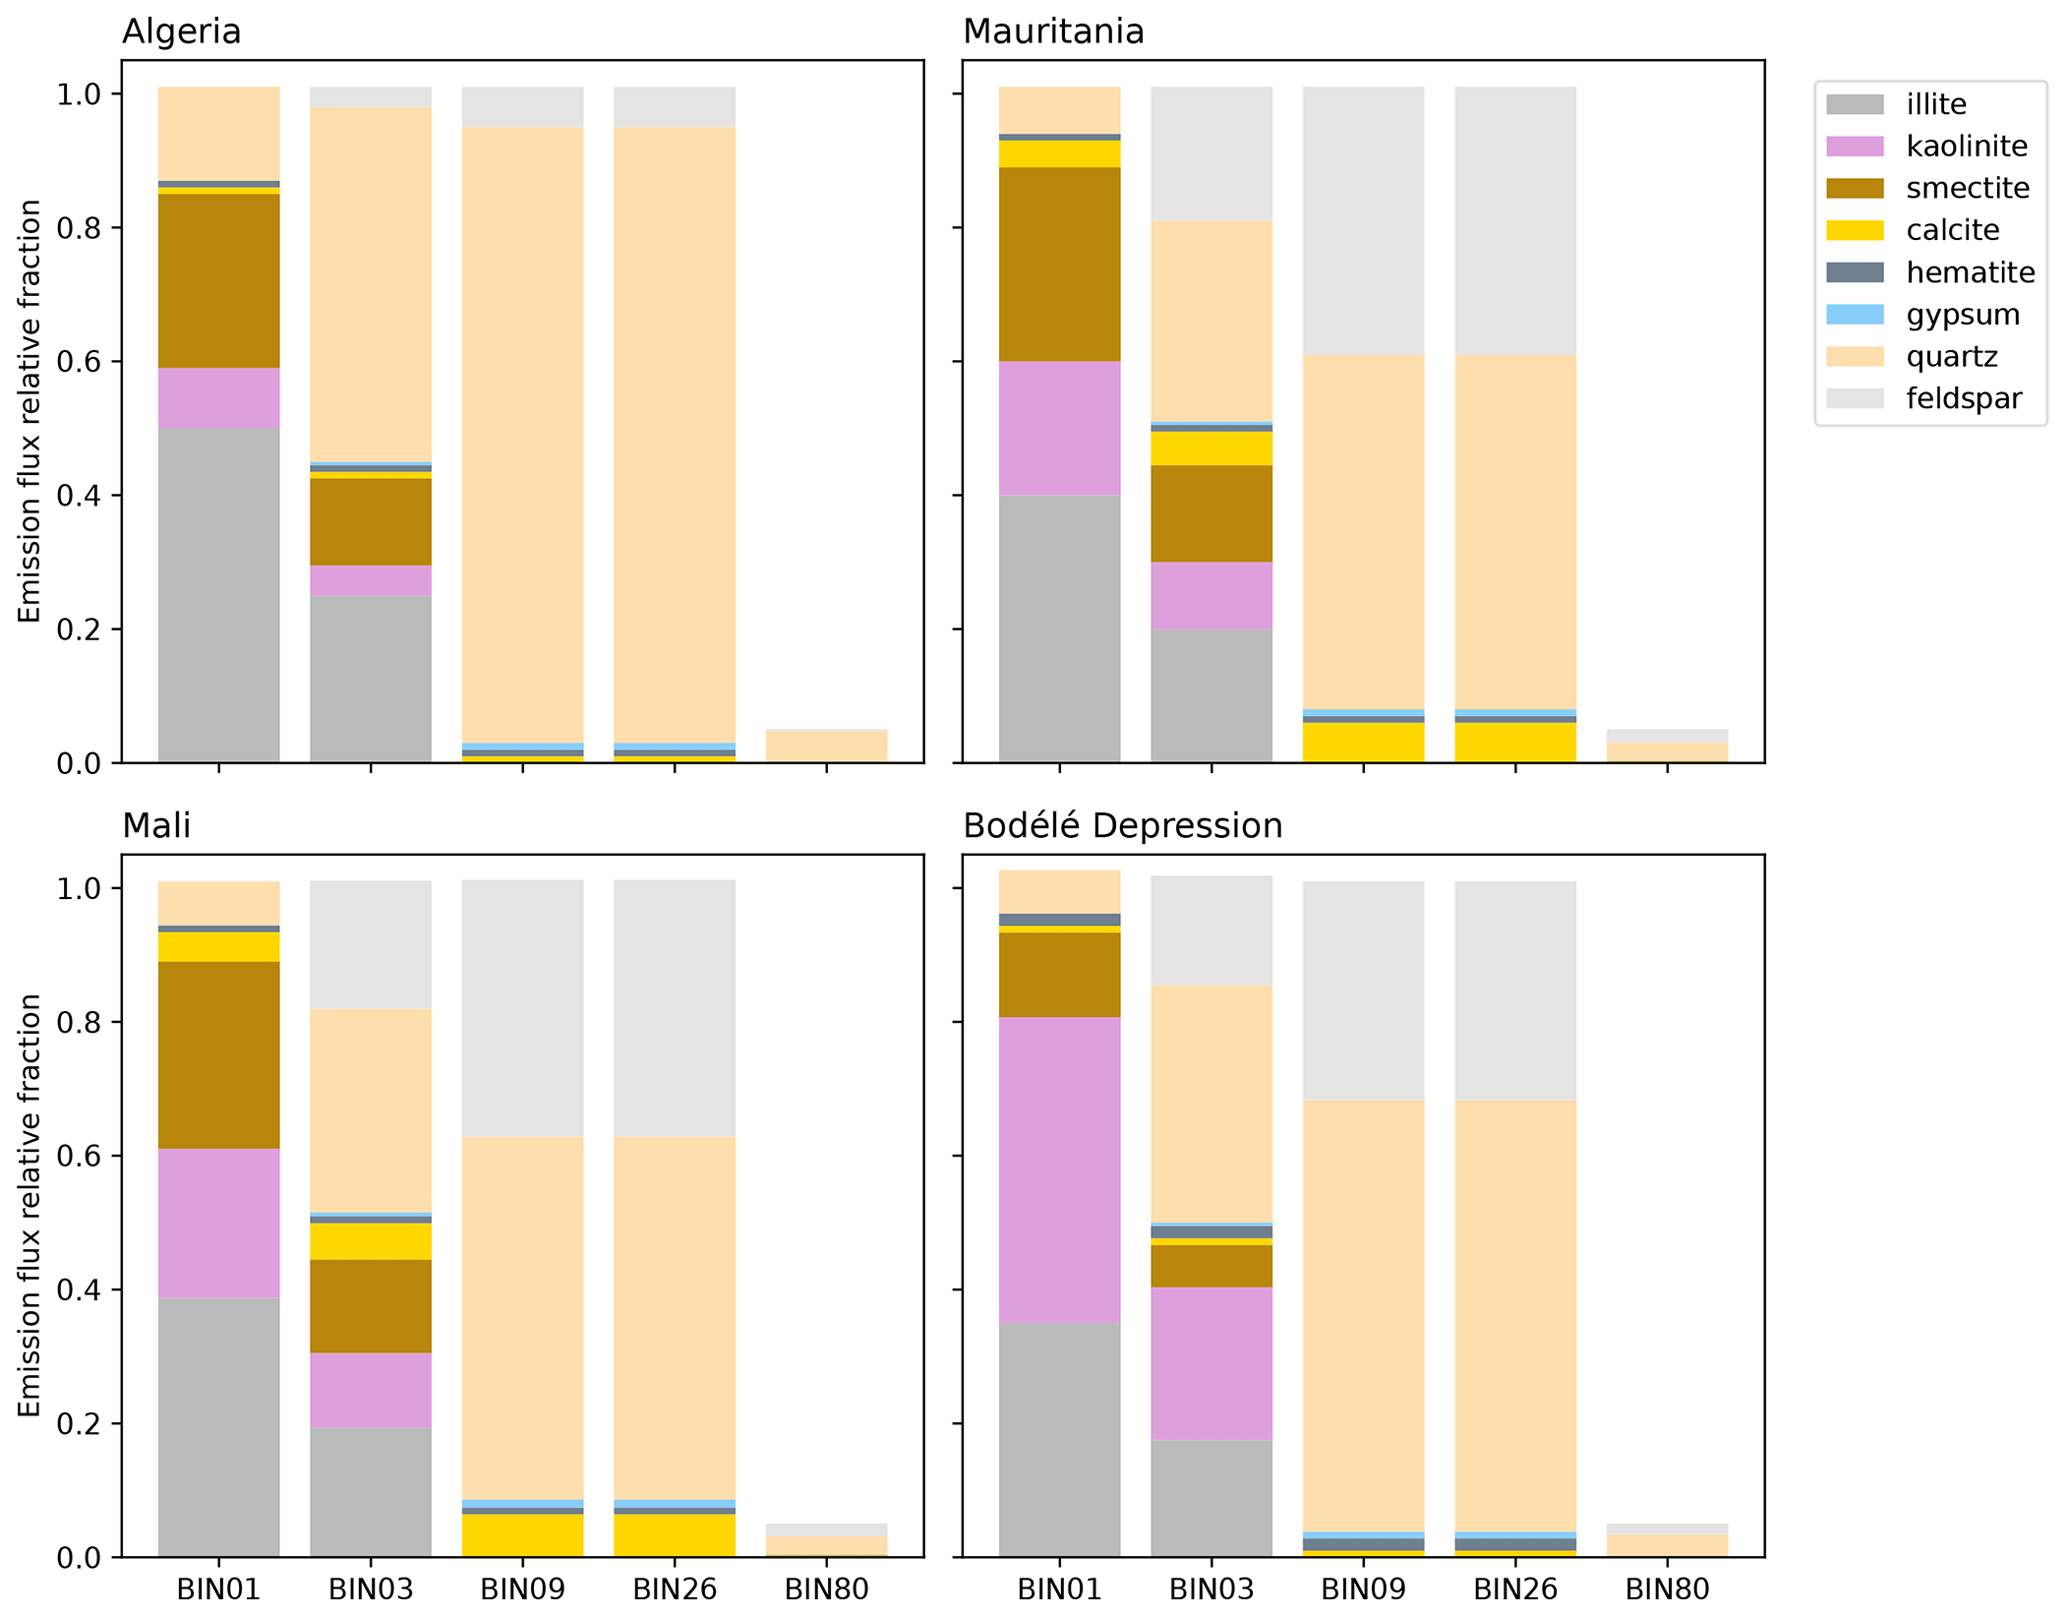
Figure 2Relative contribution of each mineral emission flux to the bin's total emission flux. The bin names are a MUSCAT convention that represents size classes in which the aerosol is transported; for more information see Table 1. Dust emission fluxes are calculated for 27 January 2022 at 21:00 UTC. Entrainment into the atmosphere is then conducted via these five size classes where each class is fractioned by their mineral composition as portrayed. Coordinates of the locations are as follows: Algeria (31.1∘ N, 1.9∘ E), Mauritania (21.25∘ N, 15∘ W), Mali (17.85∘ N, 4.9∘ W), Bodélé Depression (17∘ N, 18∘ E).
Figure 2 represents the mineral fraction distribution for mineral dust aerosols in different regions. The mineral fractions are spread out for each of the MUSCAT dust size classes according to their size distribution at the source soil. In Fig. 2, the relative mineral contribution to a normalized emission per size bin is shown. It is worth mentioning that, for this approach, minerals are considered to be externally mixed, meaning that each particle of mineral dust is composed of an individual mineral, even though, in reality, mineral dust in the atmosphere is a mixture of internally and externally mixed minerals (Atkinson et al., 2013).
Figure 2 also illustrates the differences between the mineralogical composition in the Sahara. The Saharan compositional fingerprints can be pointed out as indicated by Formenti et al. (2011, 2014) and Scheuvens et al. (2013). Specifically, a decrease in the illite to kaolinite ratio is observed from northern Africa (Algeria) towards the southwestern Sahara (Mali). An increment on calcite is also observed when moving southwards in the desert. The Bodélé Depression is illustrated here as the most active mineral dust source in the world (Prospero et al., 2002) and a region with a distinct mineral composition, where there is a very low calcite content combined with a very low kaolinite to illite ratio due to a high kaolinite content.
2.4 Observational data for model evaluation
AERONET (AErosol RObotic NETwork) provides sun-photometer measurements (Holben et al., 1998) which are used for a quantitative model evaluation. AOT is measured at the 500 nm wavelength and at 675 nm from which the values for AOT at 550 nm are interpolated and compared with modeled values. Stations around the Sahara are selected for the period of January–February 2022. The considered stations are Mindelo (located at São Vicente, Cape Verde), Santa Cruz (Tenerife) off the northwestern African coast, Dakar Belair in Senegal, IER Cinzana in Mali, and Banizoumbou in Niger. AERONET data used were cloud-screened and calibrated, and they are AERONET-indicated by the quality level of 2.0 for the stations Mindelo, Dakar Belair, Santa Cruz Tenerife, and Banizoumbou; where quality level 2.0 data were not available, cloud-screened data and/or level 1.5 data are used (IER Cinzana).
Furthermore, the spatial and temporal distribution of the modeled dust is evaluated by comparing the AOT derived from the modeled dust and AOT obtained by satellite retrievals. The satellite-retrieved AOT used here is the land–ocean mean AOT at 550 nm obtained through the Visible Infrared Imaging Radiometer Suite (VIIRS) instruments on board the Suomi National Polar-Orbiting Partnership (S-NPP) and the Deep Blue Level 3 retrieval algorithm (Sayer et al., 2018). A regridding is necessary for comparison purposes in the sense that the model results are regridded to the coarser 1∘ × 1∘ satellite-retrieved data.
The evaluation of the model capacity to simulate mineral concentrations is done by comparing with former in situ measurements. Aerosol mineral-specific mass concentration measurements are sparse and rare. From the gathered in situ mineralogical measurements, a selection was made based on specific meteorological conditions. COSMO–MUSCAT mineral data are, in this instance, restricted to January and February of 2022, and taking into account that mineral dust transport changes throughout the year (Schepanski et al., 2009), the meteorological conditions need to be taken into account for a more precise comparison. From the literature review, a first selection was made for the measurements inside the model domain. Then if the measurements correspond to more than two dust events a general consideration was made regarding two classifications of meteorological conditions, one for the northern hemispheric summer months and another for the northern hemispheric winter months. Since the modeled period is part of the second classification, the reported mineral mass concentrations were compared for the mean of the whole modeled period. In the case where the measurements just represent one or two dust events, then the meteorological conditions for the specific case were investigated through both archive meteorological data and archive satellite retrievals, specifically the dust RGB product from the MSG-SEVIRI satellite archive (Schmetz et al., 2002). In this way, a general idea of the dust source area is derived, and if a similar source is found in the modeled period then the reported mineral mass concentrations are compared with the simulated mineral mass concentrations from those individual dust events. Furthermore, some measurements consider different size ranges. Whenever the measurements are reported as bulk size, the measurements are compared to the sum of the modeled bin sizes. Otherwise, the comparison is done taking into account the measurement size differences by being compared to the correspondent modeled size bin. The measurements that were selected following the criteria can be found in Appendix Table A1.
The evaluation of the model's capacity to reproduce the vertical mineral dust aerosol layering is also performed over an specific location by comparing simulated mineral dust concentration with results from aerosol lidar measurements. Lidar measurements were taken with an automated multiwavelength Raman polarization and water vapor lidar, PollyXT (Engelmann et al., 2016), located at the OSCM (Ocean Science Center Mindelo) in Mindelo, São Vicente, Cape Verde. From these measurements, optical properties that aid in the characterization of aerosols can be obtained by following a retrieval method based on a combined Raman and elastic-backscattered signals (Baars et al., 2016; Hofer et al., 2017; Haarig et al., 2022), where both extensive, i.e., backscattering and extinction coefficients, and intensive, i.e., lidar ratio, Ångström exponent, and depolarization ratio, optical properties can be retrieved. For PollyXT these retrievals can be done at three wavelengths: 355, 532, and 1064 nm. A detailed explanation of how the dust mass fraction is derived from lidar retrievals is given in Sect. 2.5.3. The advantage of the comparison with lidar data is that it can indicate two things implicitly in a positive comparison: first, it can be used to confirm the simulated data, and second, some measured lidar datasets can hint to different Saharan origins by linking a specific feature in the UV–Vis signals in lidar measurements to the modeled UV-absorbing mineral concentrations (Veselovskii et al., 2020).
2.5 Experimental setup
2.5.1 Model setup
The COSMO–MUSCAT model domain is set up to include the major part of the Sahara and Cape Verde and constrained by the following coordinates: 38.49∘ N, 30.75∘ W–0.38∘ S, 39.32∘ E. The horizontal grid spacing is 0.25∘ (28 km) and the vertical resolution contains 40 levels, with a layer thickness of 20 m for the first (bottom) layer. The meteorological data that act as initial and boundary data for COSMO–MUSCAT are provided by the DWD with 3-hourly wind fields for the period January–February 2022. The model runs are re-initialized in overlapping cycles every 48 h in order to keep the meteorology updated. For each 48 h run, COSMO has a spin-up time of 24 h, where MUSCAT is not running. After the spin-up time, MUSCAT starts running in parallel and computes the aerosol transport processes for the next 24 h in order to complete the cycle. Aerosol calculations are obtained from the second part of the described cycle. For the process to start again, COSMO is re-initialized 24 h before the last MUSCAT cycle finishes, and when MUSCAT starts running again it uses the data produced in the last cycle as initial conditions.
The soil input files used for MUSCAT are a dust activation frequency map derived from MSG-SEVIRI IR channels (Schepanski et al., 2007), a soil vegetation file from Copernicus Global Land Service (Fuster et al., 2020), a soil moisture file from the ERA5-Land hourly data (Muñoz Sabater and Copernicus Climate Change Service, 2019), an aeolian roughness length dataset developed by Prigent et al. (2005), a soil particle size distribution obtained from the SoilGrids database (Poggio et al., 2021), and the mineralogical database GMINER (Nickovic et al., 2012) newly introduced in this study. The use of these soil datasets and the domain constraints has the consequence that only continental mineral dust sources are regarded.
2.5.2 Model diagnostic
Aerosol optical thickness (AOT) is a measure of particle load in the atmosphere. Dust emission and deposition flux measurements are not extensively available or easy to realize (Schepanski et al., 2017), but the amount of mineral dust in the atmosphere can be assessed through their AOT. AOT measurements at 550 nm from both ground-based and spaceborne remote sensing instruments are extensively available. Hence, AOT is chosen for evaluating the model's ability to simulate the mineral dust life cycle. It is noteworthy for the comparison that the model considers only mineral dust aerosols, whereas the retrieved AOT is done via remote sensing measurements that are affected by all types of atmospheric aerosol particles. However, AOT measurements for the studied region are considered to be dominated by mineral dust. Validating the simulated mineral dust aerosol loading through the comparison with AOT retrievals is quite common for the Sahara as in Heinold et al. (2011, 2016), Schepanski et al. (2015, 2016, 2017), and Tegen et al. (2013).
AOTs for the 550 nm wavelength from the simulated mineral dust aerosol concentrations are calculated following
where Qext,550 nm is the dimensionless dust extinction efficiency at 550 nm that varies according to the particle size class j effective radius reff(j), ρdust is the particle density set at 2650 kg m3, and M(j) is the column mass load of mineral dust given in kg m−2 obtained from the simulation results. The values of Qext,550 nm (Table 1) are calculated from refractive indices computed by Sokolik and Toon (1996), who consider a fixed composition for dust for their calculation, although it is documented that variations in dust composition affect the particle optical properties (Journet et al., 2014; Wagner et al., 2012). Nonetheless, this calculation is used as a first approximation for comparison purposes with the retrieved AOT obtained from both the ground-based sun photometers from AERONET (Holben et al., 1998) and from the satellite instrument VIIRS (Visible Infrared Imaging Suite).
2.5.3 Lidar-based dust mass fraction
PollyXT lidar measurements include the retrieval of aerosol optical properties. Such measurements are influenced by other aerosols besides mineral dust. Tesche et al. (2011b) show how to separate the optical properties of dust and non-dust components. An application of such separation is implemented for this study, where we aim at a direct comparison by calculating mineral dust mass fractions from the PollyXT-retrieved optical properties. A one-to-one comparison can then be made with the simulated mineral dust mass concentrations at the grid cell where Mindelo is included. For the calculation of the mineral dust mass fraction from the lidar measurements, the method POLIPHON presented in Ansmann et al. (2019) is used. The method uses conversion parameters determined from AERONET aerosol climatologies that divide the aerosol load between mineral dust aerosols and non-dust aerosols. Specifically for the calculation of mineral dust and non-dust mass fractions, the particle depolarization ratios at 532 nm are used to calculate the fractions of mineral dust and non-dust aerosols in the backscatter and extinction coefficients. Backscatter coefficients at 532 nm are then used for calculating the final dust mass fraction. Several assumptions are included in the POLIPHON method; for instance, the homogenization of optical property values for all mineral dust particles disregards the dust source region, therefore disregarding compositional differences.
For the single point measurement comparison, it is important to consider that local measurements represent values at that single point while the model provides values for the whole grid cell.
This section contains the results for the specific model setup based on the Sahara including the Cape Verde archipelago as detailed in Sect. 2.5.1. The model, COSMO–MUSCAT, simulates the mineral dust life cycle for the months of January–February 2022 over the region and now includes mineralogical information. The section starts by showing comparisons of the atmospheric aerosol loading through AOT calculations as explained in Sect. 2.5.2. AERONET and VIIRS–SNPP AOT values are compared with the model-derived AOT values. Afterwards, the ability of the model to simulate mineral mass content is shown via comparisons with field measurements and by displaying the mineral distribution throughout the domain via total column mineral mass maps. Lastly, local comparisons are done for São Vicente, Cape Verde. We compare the simulated mineral dust mass concentration vertical profile for the grid cell where São Vicente is with the lidar-derived mineral dust mass concentration vertical profile. The lidar-derived dust mass concentration is obtained from the lidar PollyXT-retrieved optical properties as described in Sect. 2.5.3. In addition the temporal evolutions of column dust mass concentrations from the simulation results and from the lidar retrievals are compared for the time period of 1 to 2 February 2022 in the early morning.
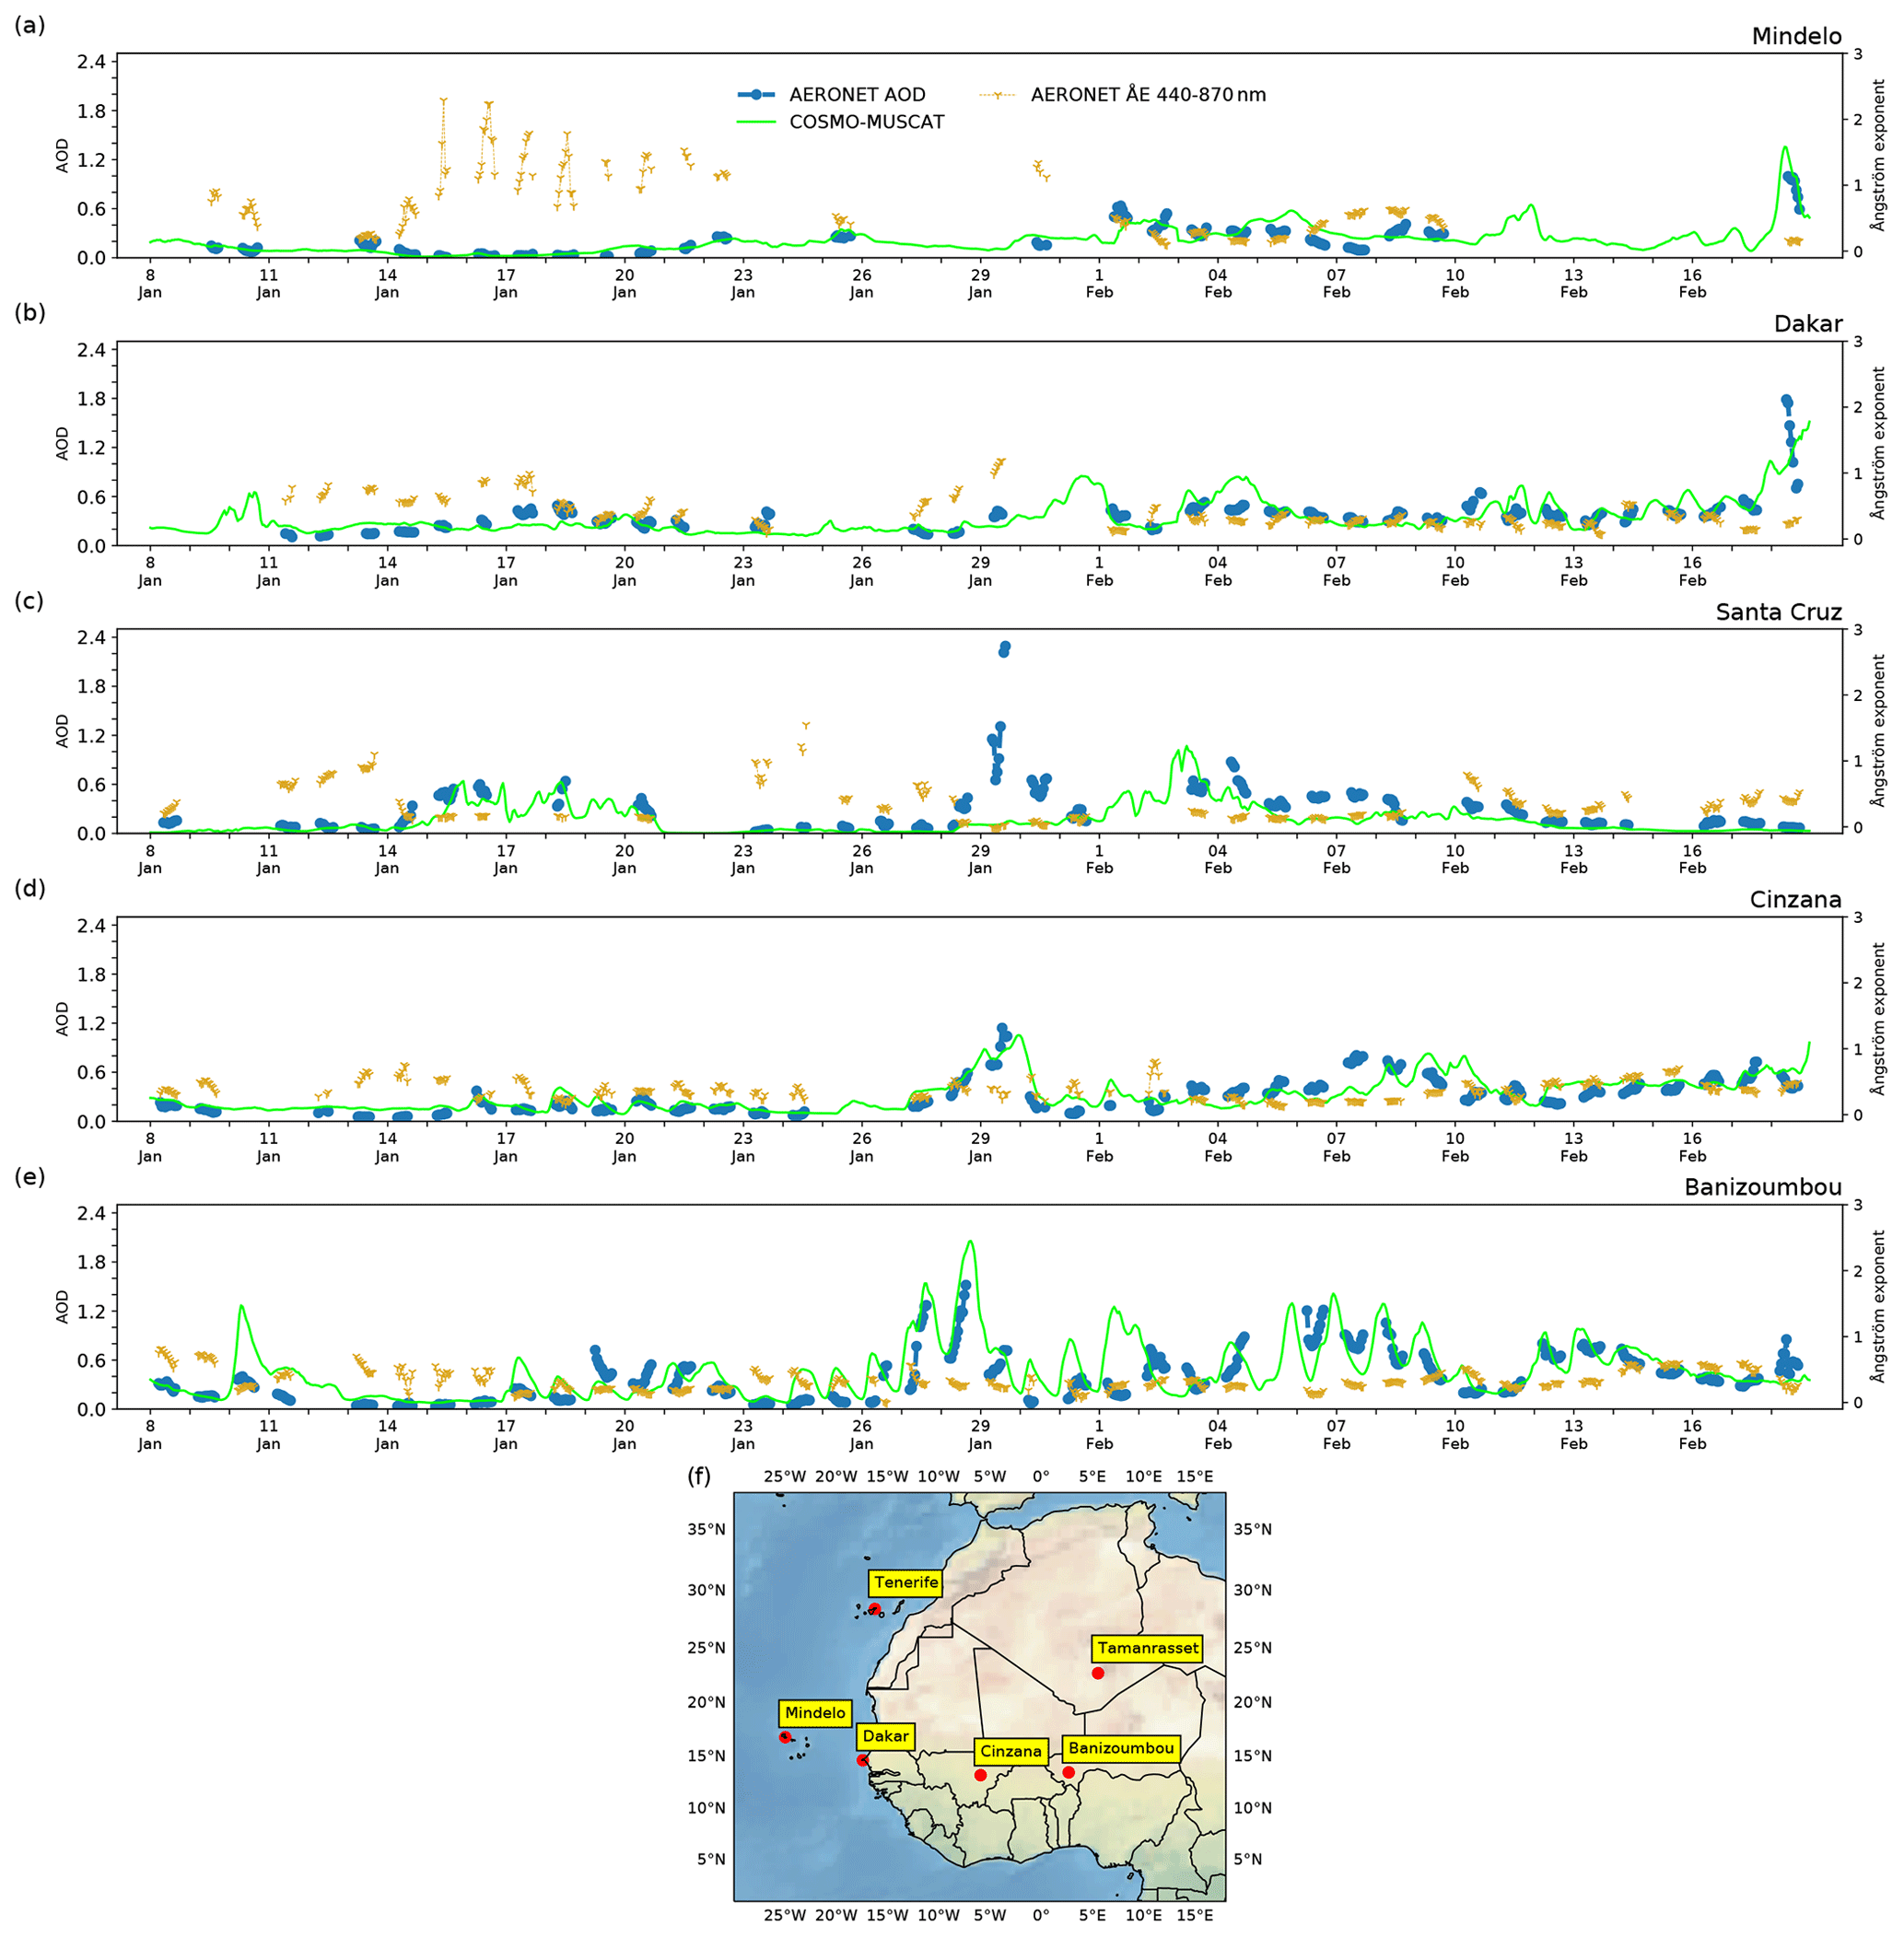
Figure 3Dust AOT at 550 nm calculated from COSMO–MUSCAT dust concentration fields (green) and AOT at 550 nm and the Ångström exponent (ÅE) from the 440–870 nm wavelength range from AERONET sun-photometer measurements (blue and gold) for January–February 2022, where each x-axis tick represents 12:00 UTC for each day in the range of 8 January to 18 February 2022. Five different stations across the Sahara and downwind locations are shown. (a) Mindelo (16.878∘ N, 24.995∘ W; Cape Verde; level 2.0), (b) Dakar Belair (14.702∘ N, 17.426∘ W; Senegal; level 2.0), (c) Santa Cruz Tenerife (28.473∘ N, 16.247∘ W; Spain; level 2.0), (d) IER Cinzana (13.278∘ N, 5.934∘ W; Mali; level 1.5), (e) Banizoumbou (13.547∘ N, 2.665∘ E; Niger; level 2.0), (f) AERONET station geographic locations and names used in this comparison.
3.1 Evaluation of modeled dust aerosol optical thickness
3.1.1 COSMO–MUSCAT vs. AERONET comparison
Figure 3 shows the comparison between simulation-based AOT calculations and the AOT from AERONET. The selected AERONET stations are directly affected by the Saharan dust plumes for the studied period: January–February 2022. The locations of these stations are shown in Fig. 3f. The stations were chosen downwind of the source regions and on the dust transport pathways towards the Atlantic, specifically towards Cape Verde.
The simulated dust AOT magnitudes and temporal variabilities agree very well with AERONET results (Fig. 3a–e). A single exception is found for the station Santa Cruz, Tenerife, on 29 January 2022, where the AOT peak was much higher than the simulated values. That day an anticyclone system formed over the region that allowed a heavy dust load to be swiftly transported from the central Sahara towards Tenerife. COSMO replicates that situation well but shifts the center of the pressure system a couple of degrees northward, which changed the simulated dust transport route. The shifting of the pressure system had two consequences that caused COSMO–MUSCAT's low-mineral-dust AOT for Tenerife on 29 January 2022: (1) most of the simulated dust plume was transported north of Tenerife and is therefore not captured on the grid cell that corresponds to the sun photometer's location. (2) Due to the change in the pressure system position, precipitation that occurred in the area moved to Tenerife on 29 January 2022, which activated MUSCAT's mineral dust wet deposition scheme, resulting in even less mineral dust remaining in the atmosphere.
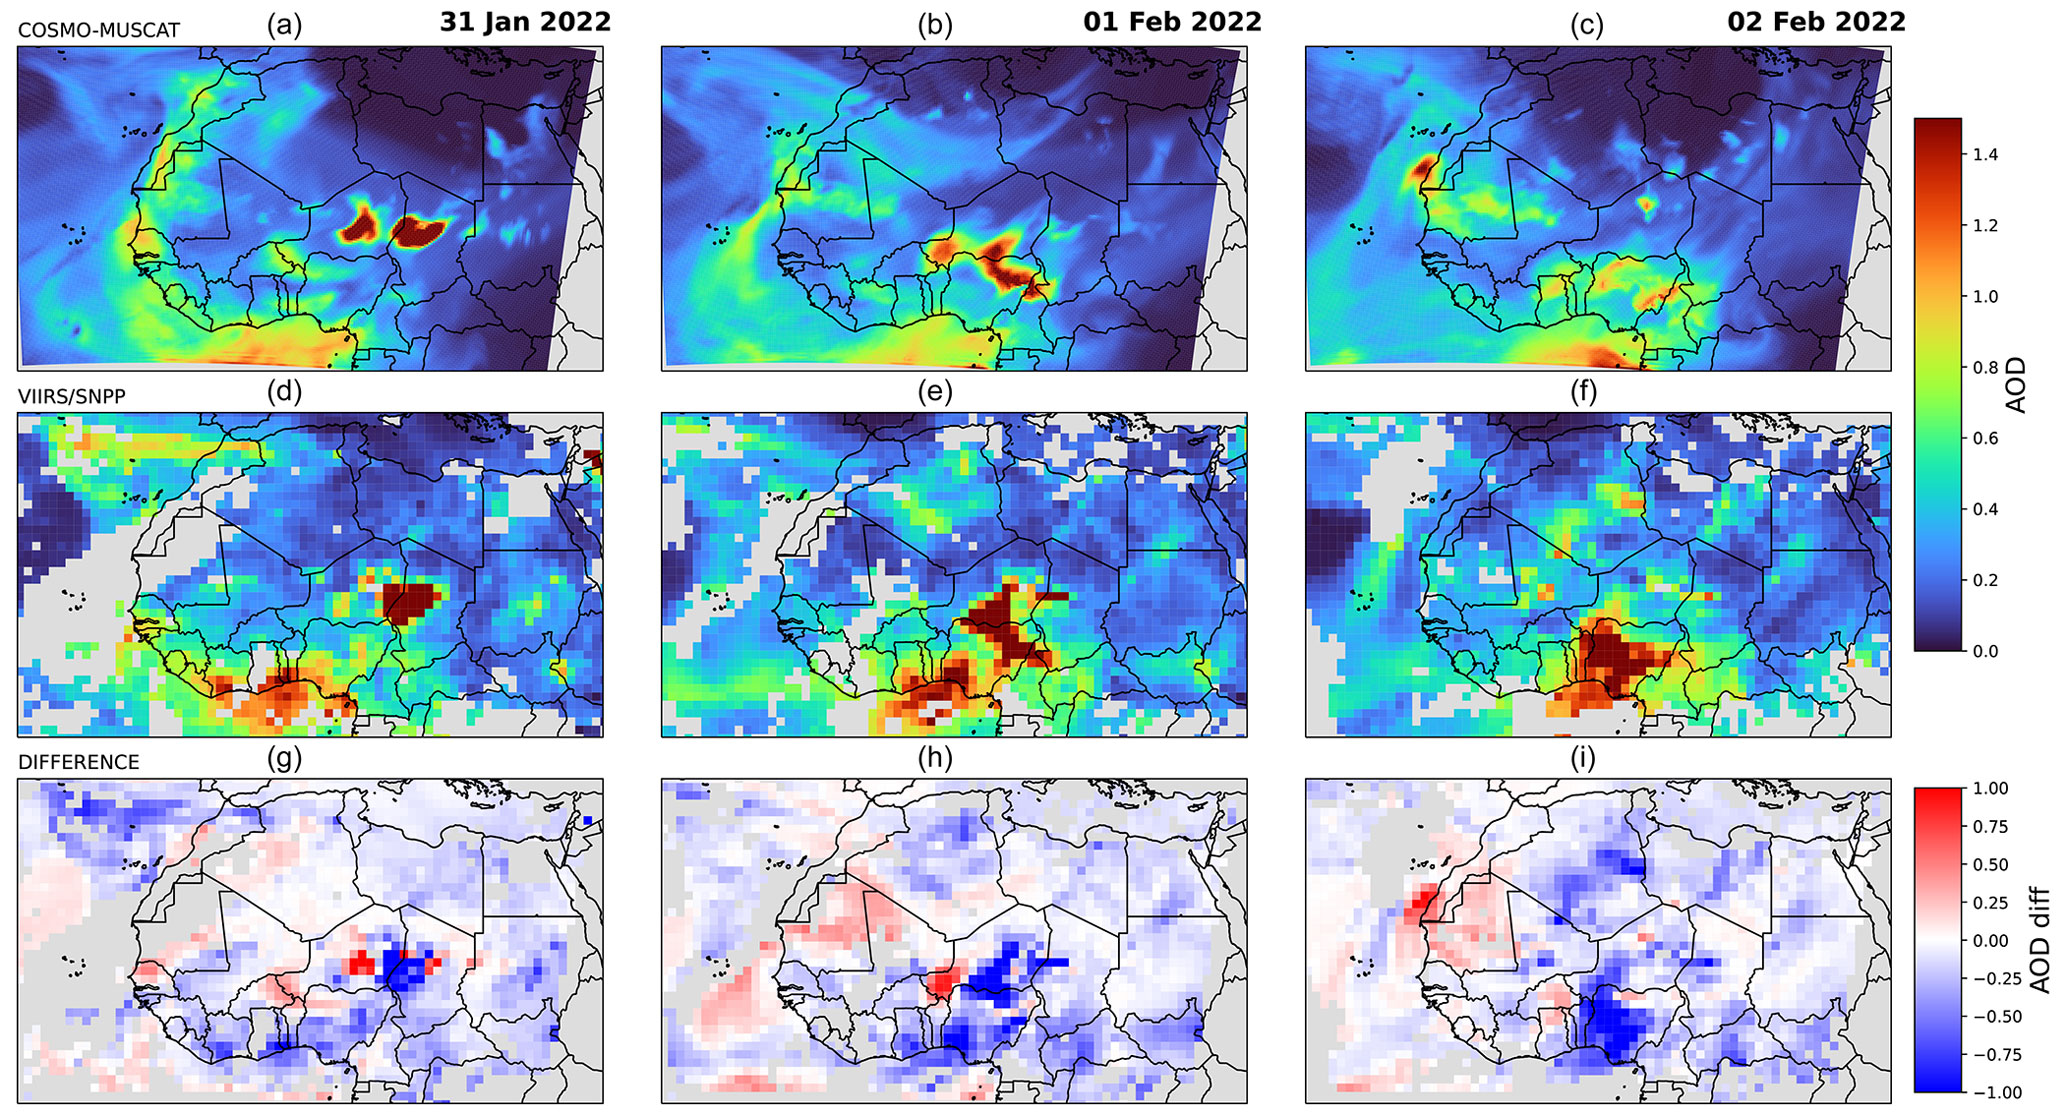
Figure 4The evolution of two dust outbreaks in the Sahara for 31 January as well as 1 and 2 February 2022. Maps are shown for 12:00 UTC. Color shading represents AOT at 550 nm in panels(a)–(f). Gray shading indicates no data. Panels (a)–(c) show maps of COSMO–MUSCAT-derived dust AOT. Panels (d)–(f) show the maps of AOT retrieved by VIIRS–SNPP. Panels (g)–(i) show the difference between the model and observations, that being model-derived AOT – satellite-retrieved AOT.
The comparison with the station at Cinzana is noteworthy since the compared values are always in the same range of magnitude, with the biggest AOT difference being 0.5, and the temporal evolution is well portrayed by the modeled values. Moreover it needs to be kept in mind that the model-derived AOT is due to mineral dust only, while the AERONET-measured AOT is influenced by a wider array of aerosol types, as can be seen in the Ångström exponents (ÅEs) from the 440–870 nm wavelength range values. Typically, a dust-only ÅE-related value is below 0.3 (Ansmann et al., 2019). Instances where the AERONET AOT values are bigger than the simulation-derived AOTs are therefore expected and can be seen, for example, between 15 and 19 January at the Dakar station.
3.1.2 COSMO–MUSCAT vs. VIIRS–SNPP comparison
The spatial and temporal distribution of atmospheric mineral dust is illustrated for the days 31 January to 2 February 2022 in Fig. 4. Maps of model-derived mineral dust AOT at 550 nm, the VIIRS–SNPP AOT retrievals at the same wavelength, and the difference (COSMO–MUSCAT AOT minus VIIRS–SNPP AOT) are shown. Gray areas in the VIIRS–SNPP maps indicate cloudiness that obscured the aerosol plume and therefore no AOT retrievals were possible. A strong mineral dust outbreak across the Sahara leading towards the Atlantic Ocean occurred during these days. The model simulates active dust source regions across West Africa and the Bodélé Depression. Simulated dust plumes above Niger and around the Bodélé Depression in northern Chad temporally match VIIRS–SNPP observations well, whereas differences are present for dust source regions across the western parts of the Sahara (e.g., Mauritania). The modeled dust AOT above Senegal, Mauritania, the western Sahara, and Morocco cannot be fully compared with VIIRS–SNPP retrievals due to cloud coverage. This is evident, e.g., on 31 January in the western Sahara emissions.
Over Mali and Mauritania, simulated AOTs are slightly overestimated compared to the MODIS retrievals. In contrast, AOTs are underestimated over the Bodélé Depression, which is known as a mineral dust emission hotspot. For example, on 31 January both VIIRS–SNPP and COSMO–MUSCAT show high AOTs over the Bodélé Depression and Niger, but the difference map shows that the model is overpredicting AOTs over Niger and underpredicting above the Bodélé Depression. On average and for the period considered, the difference maps shows that the simulation-based AOT values agree reasonably well with the VIIRS–SNPP-retrieved AOT.
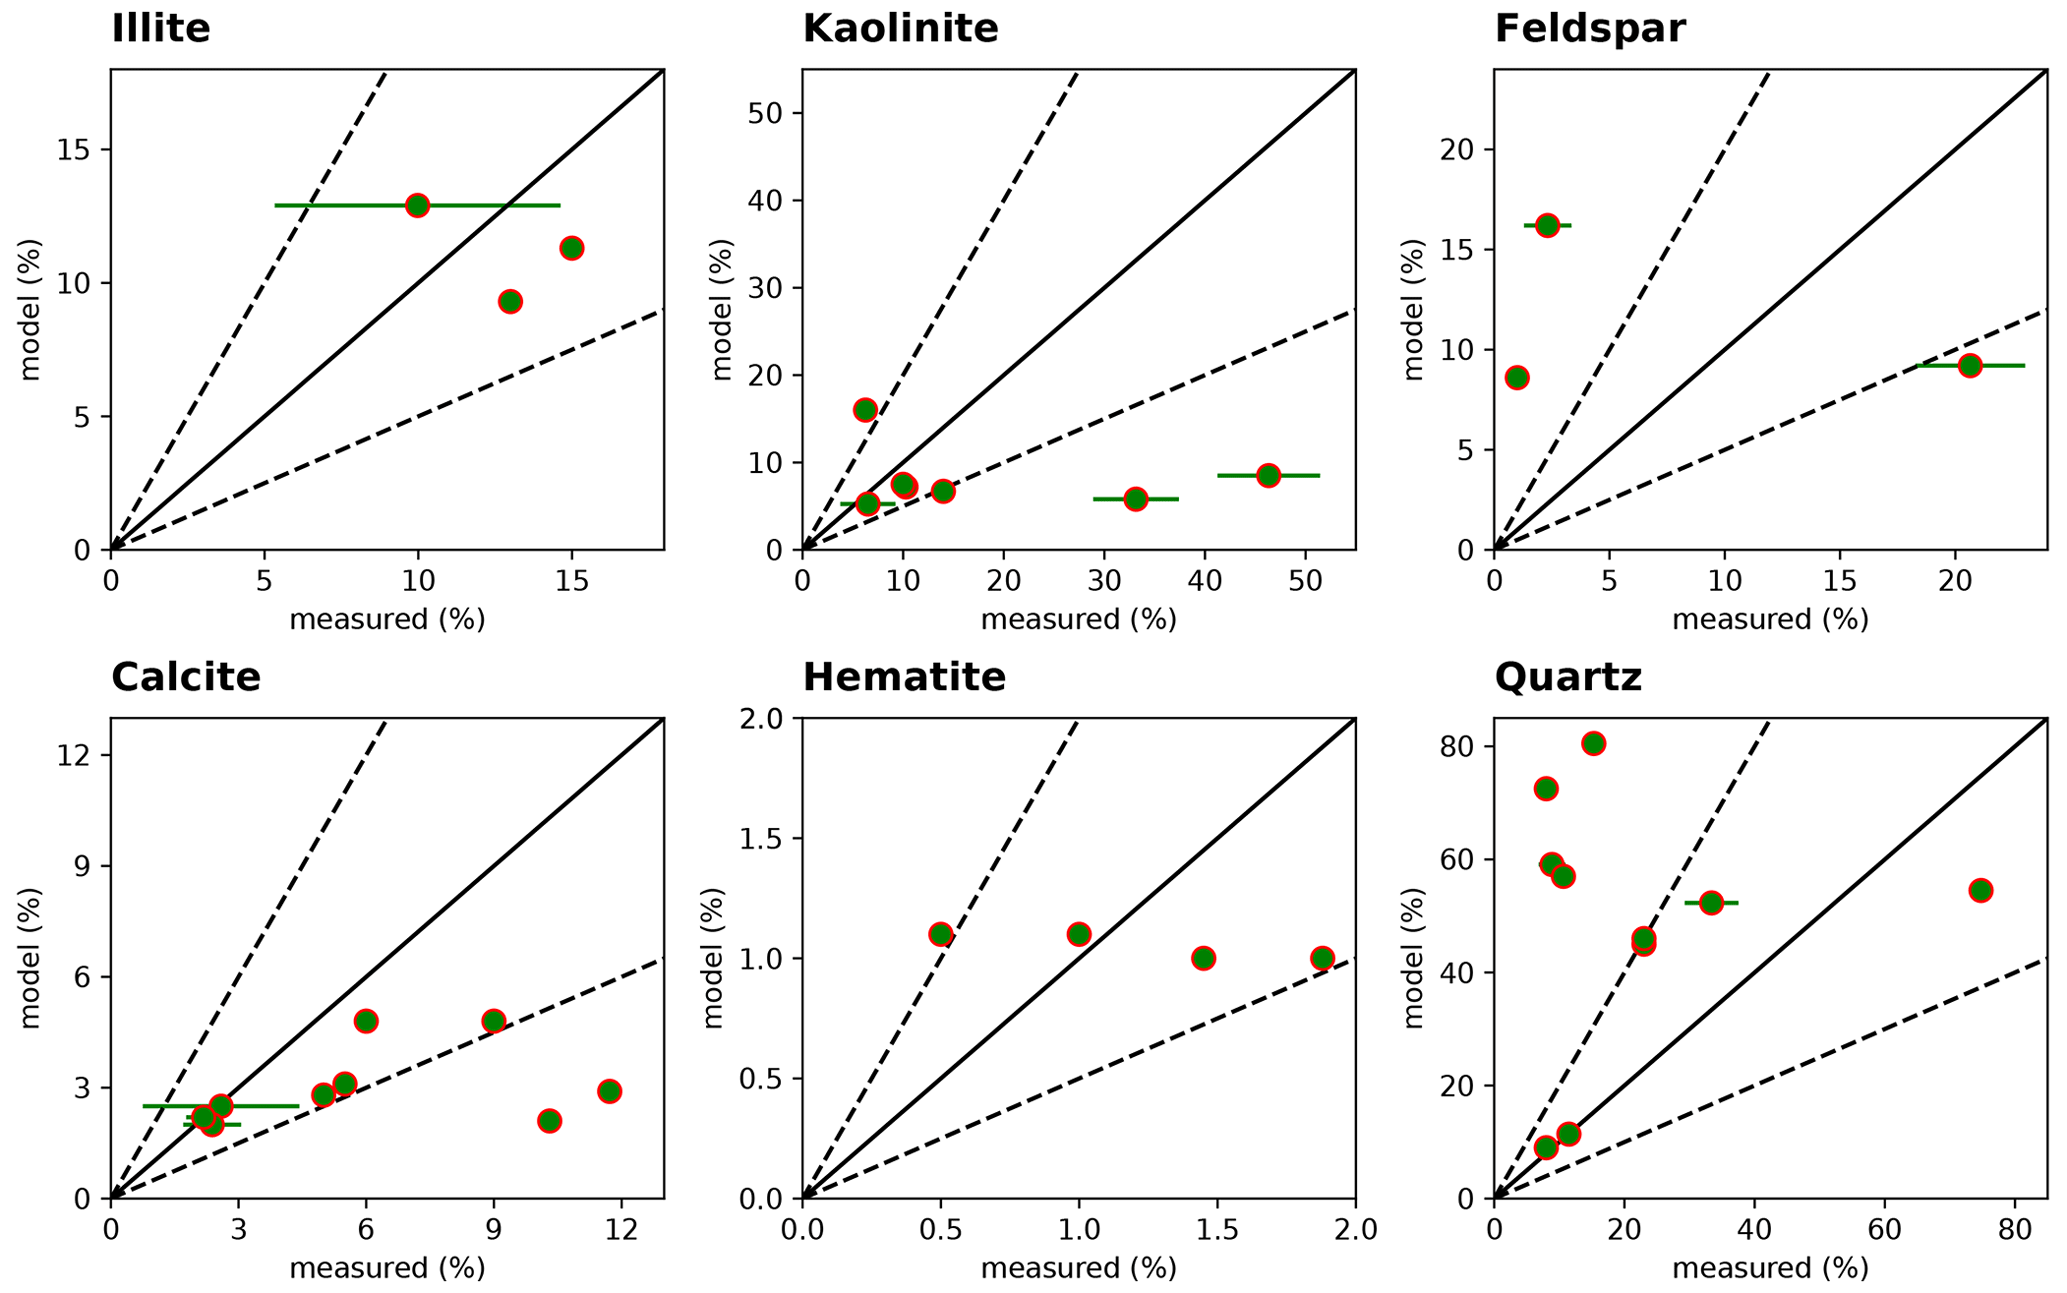
Figure 5Scatterplots of mineral mass percentages of illite, kaolinite, feldspar, calcite, hematite, and quartz measured vs. simulated by COSMO–MUSCAT (see Table A1). The dashed lines represent the ratios of 2:1 and 1:2 between the simulated and observed mineral percentages. The error bars are present when reported in the measurements.
For 1 February, VIIRS–SNPP shows high AOT values in both the southern and northern parts of Nigeria. The northern part matches COSMO–MUSCAT-derived AOT and can therefore be attributed to mineral dust aerosols, although from the difference map, COSMO–MUSCAT seems to be underestimating the amount of dust in the atmosphere. High dust emissions are shown by the simulations for the day before (emissions not shown in the figure) over the southern part of Niger, while the southern Nigeria high-AOT spot shown in VIIRS–SNPP does not appear in the simulated results. The area is not recognized as a highly active mineral dust source region, but it is indeed related to high aerosol emissions due to biomass burning during the northern hemispheric winter (Heinold et al., 2011; Tesche et al., 2011b). Such aerosols are most likely the reason for a higher AOT over the region. A similar behavior is found as well on 2 February above the same region, where the highest differences of the whole domain are found.
Dust plume pathways can be traced in both the model and VIIRS–SNPP maps through the 3 days. For 31 January, mineral dust is located over the Bodélé Depression and travels southwards towards the equatorial Atlantic Ocean as seen in both plots for 1 and 2 February. At the same time another dust plume is observed over Mauritania and traveling over the Atlantic Ocean, heading towards Cape Verde. It is noteworthy that the differences above the Cape Verde region are almost zero, pointing to very good agreement between VIIRS–SNPP and the simulated results. The pathways of the mineral dust plumes cannot be fully compared since there is no more VIIRS–SNPP information over the Atlantic towards Cape Verde for 31 January and 1 February or over the equatorial Atlantic Ocean on 2 February. A negative bias of around 10 % over bright surfaces for VIIRS–SNPP AOT retrievals has been reported when compared to AERONET values (Sayer et al., 2019). A tendency towards more negative biases in the bright regime is also reported when AOT values grow bigger than 1.0 (Sayer et al., 2019). This negative bias affects the comparison of model and VIIRS–SNPP AOT.
3.2 Evaluation of modeled mineral dust composition
Measurements of mineral dust aerosol composition are rare and sparse across the Sahara; nevertheless, some have been reported throughout the years. For the comparison of modeled mineral composition with measurements shown in Fig. 5, we used a specific dataset of past measurements that best matched our simulated meteorological conditions as explained in Sect. 2.4.
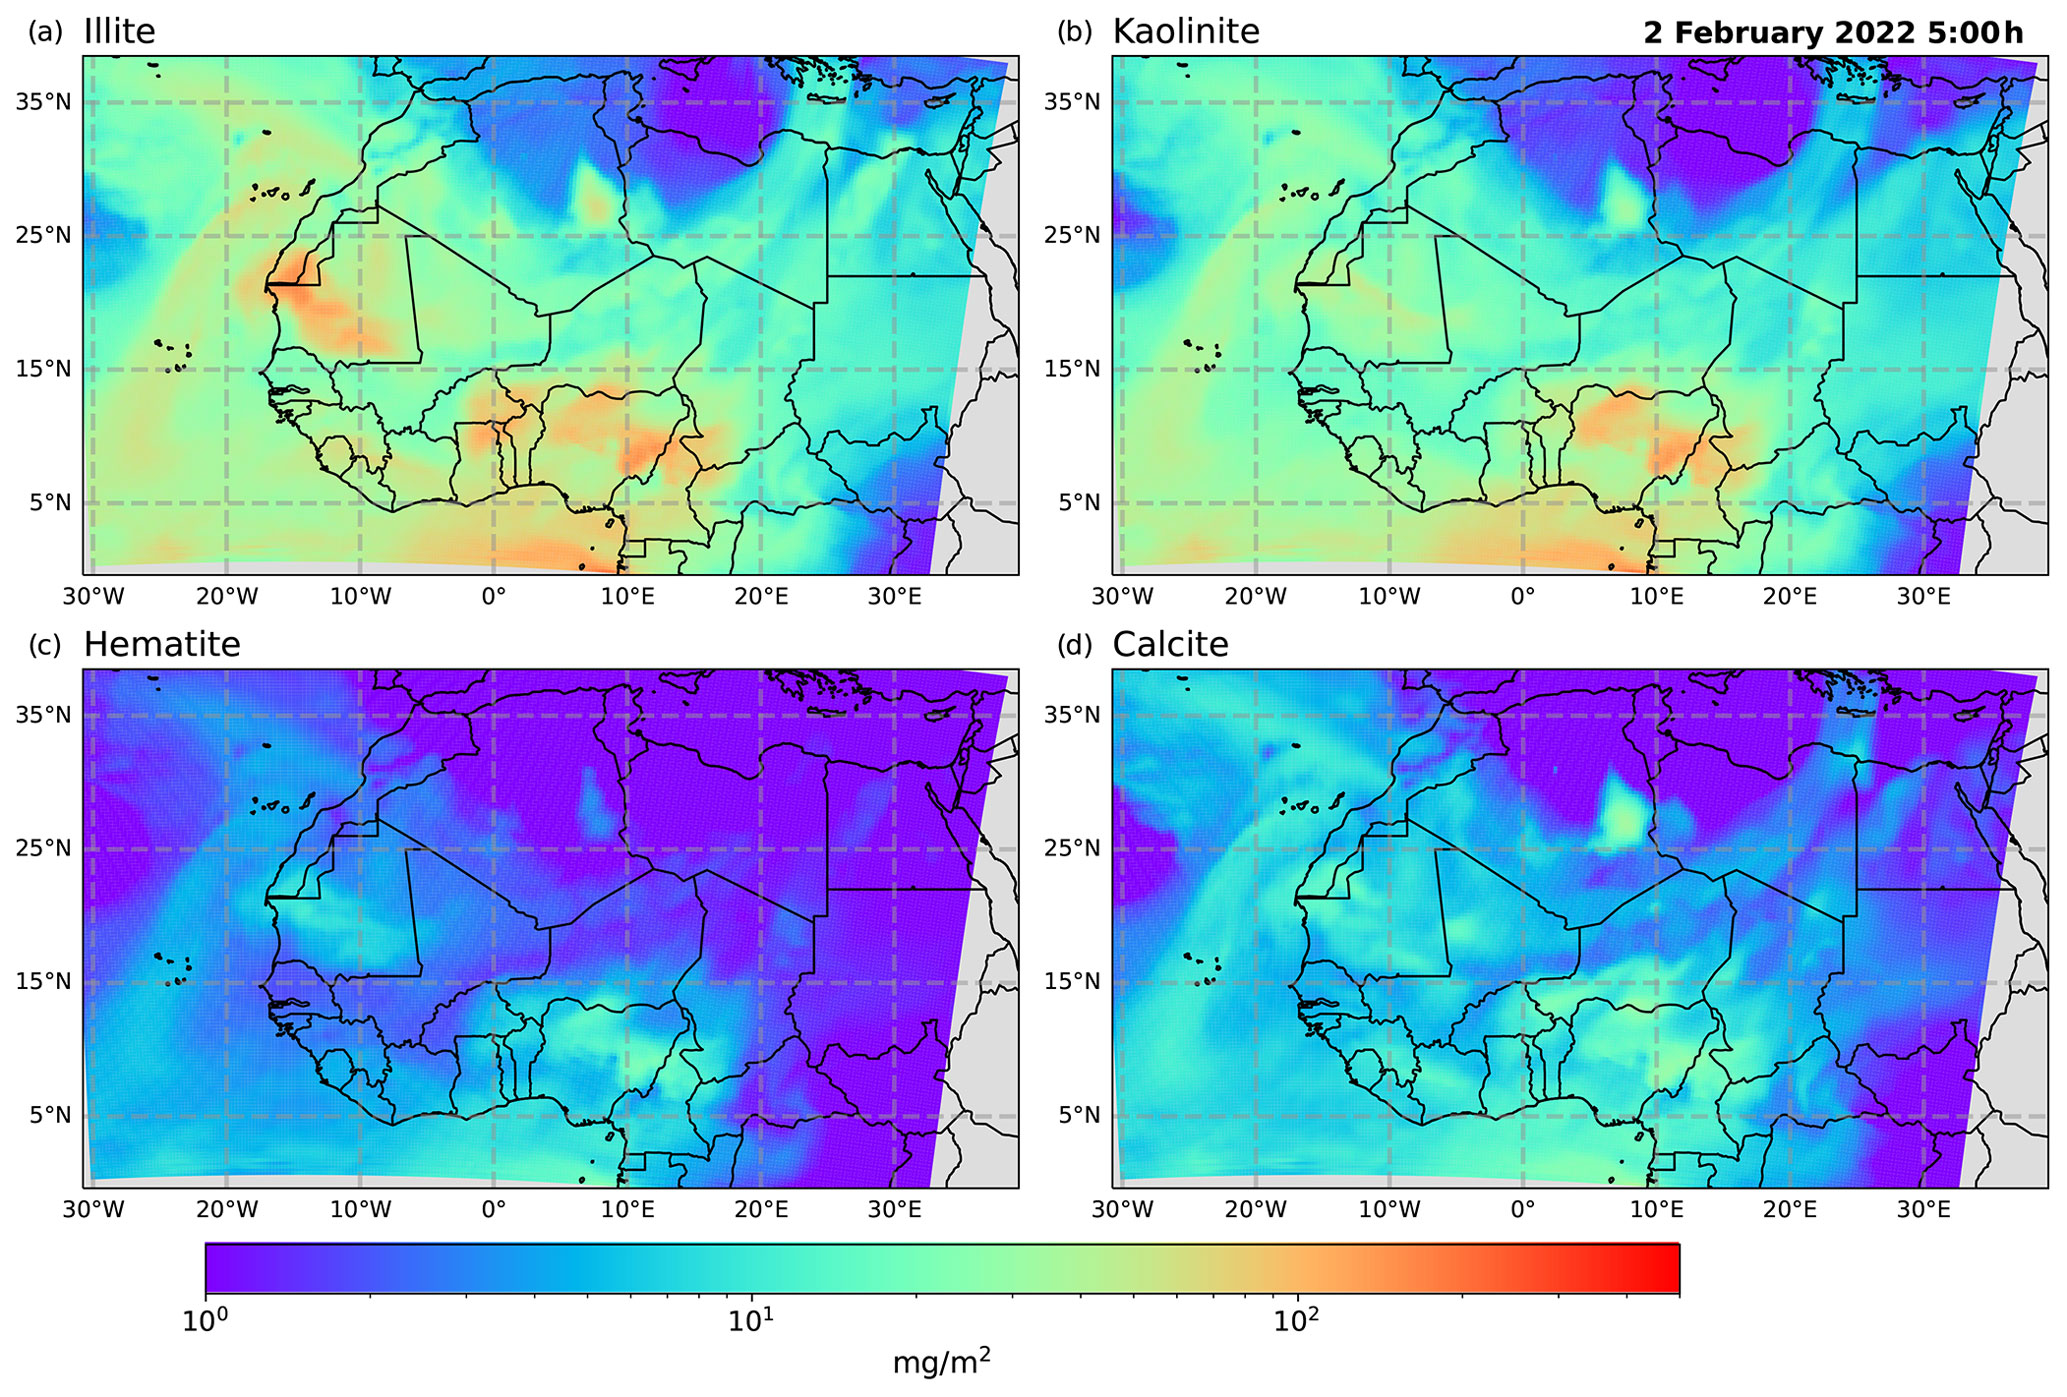
Figure 6COSMO–MUSCAT total column mineral dust mass concentration [mg m−2] for 2 February 2022 at 05:00 UTC of mineral mass concentration in mg m−2. (a) Illite concentration, (b) kaolinite concentration, (c) hematite concentration, (d) calcite concentration. Note the logarithmic scale.
Figure 5 shows two rows of individual mineral comparisons of measured vs. modeled mineral data. Both are represented as a percentage of the dust aerosol mass. The phyllosilicate minerals shown in the figure (i.e., illite and kaolinite) are on average underrepresented by the model. Feldspar minerals are special cases since different definitions of these minerals are used for different set of measurements (Formenti et al., 2008; Jeong and Achterberg, 2014), while the mineral fractions described in the GMINER database contain a broad definition of the mineral. Quartz is on average overrepresented by the model. Hematite comparisons show neither an overrepresentation or underrepresentation since the sample number is too low to be representative. Moreover, the model calculates similar amounts of mineral mass for all the dust events, which is not representative of the diversity of this mineral in source regions. Calcite comparisons are noteworthy since they fit best within the whole mineral comparison array with an underrepresentation tendency from the modeled values. Calcite and quartz are the only minerals in the model that are represented in both clay and silt sizes. As seen in Perlwitz et al. (2015a), better agreement between modeled and measured mineral data was found when considering a re-aggregation coefficient that appoints mineral fractions to both clay and silt sizes; such a coefficient would increase the mass concentration of the phyllosilicates while decreasing the mass concentration of quartz.
The atmospheric column mass concentrations for individual minerals over the whole region from COSMO–MUSCAT are shown in Fig. 6 for 2 February 2022 at 05:00 UTC. The simulated atmospheric mineral mass column mimics the mineral composition of mineral-dust-productive soil. As a consequence, we observe high kaolinite values that came from dust emissions over central Mali, which has a higher content of kaolinite than the other activate dust emission regions at this time (see Fig. 2 for more information on the mineral fractions of this specific location). High illite aerosol concentrations are found in both the southeastern Sahara and the northwestern Sahara, resembling illite concentrations in mineral-dust-productive soil as can be seen in Formenti et al. (2011, 2014), Nickovic et al. (2012), and Scheuvens et al. (2013). Illite soil concentrations generally increase when moving towards the north and west of the Sahara. Hematite concentrations are rather low in the whole domain with some exceptions above Nigeria and Cameroon. Most likely this higher hematite aerosol concentration is a consequence of mineral dust emitted from Niger and transported southwards, since higher soil hematite contents for the whole desert are found in southern Niger and central Mali. Calcite content is high east of the Atlas Mountains, where the calcite soil concentrations are the highest for the whole region. Rising calcite concentrations over the southeastern Sahara can also be seen in Fig. 6, which may be due to some significant calcite soil concentrations found where kaolinite soil content is the highest (Formenti et al., 2014; Nickovic et al., 2012). The high illite content over the Atlantic Ocean comes from the western Sahara dust emissions as pointed out in Sect. 3.1.2. Interestingly, concentrations of both kaolinite and illite over Cape Verde show similar mass loadings, which points to the differences in mineral fractions from the two different dust-active regions seen in Fig. 4. The western Sahara dust-emitting region is known to have a high illite to kaolinite ratio, while the Sahelian dust-emitting area is known to contain a larger amount of kaolinite. The column concentrations of the minerals at Cape Verde are due to mixing of these two plumes.
Hematite concentrations are shown in Fig. 6 because of its distinct optical properties. Most of the minerals found in the GMINER dataset have similar optical properties in the shortwave part of the spectrum, from 200 to 4000 nm (Journet et al., 2014). The exceptions are minerals considered to be proxies for iron oxide content, those being hematite and goethite (Lafon et al., 2004; Wagner et al., 2012; Zhang et al., 2001). In the GMINER dataset, the hematite mineral represents both the hematite and the goethite mineral content. Hematite and goethite are more absorbing in the UV part of the spectrum (Wagner et al., 2012; Di Biagio et al., 2019), than the other minerals found in mineral dust. It is noteworthy that even amounts as low as 1.4 % to 2.5 % hematite content in volume can significantly modify the mineral dust direct radiative effect. Balkanski et al. (2007) show that a change of 0.6 % of hematite content, in weighted volume, has an impact of 4 W m−2 on column heating. Therefore, the mass concentration of a certain mineral in the atmosphere does not directly translate to its radiative impact. Relatively small quantities of hematite content in mineral dust aerosol dominate the shortwave interaction and have direct effects on atmospheric column heating.
3.3 Comparison to lidar remote sensing and model-based attribution of local mineralogical properties
Mineral dust is mixed in the atmosphere over the African continent by turbulent mixing within the planetary boundary layer, reaching up to 3–5 km, and subsequently gets transported following the regional meteorological drivers. During such transport, the mineral dust plume can remain near the surface or can be transported in elevated layers over the adjacent Atlantic Ocean. The elevation of the Saharan dust layer depends on the season; during northern hemispheric winter, transported Saharan mineral dust is mostly observed in near-surface layers (Schepanski et al., 2009).
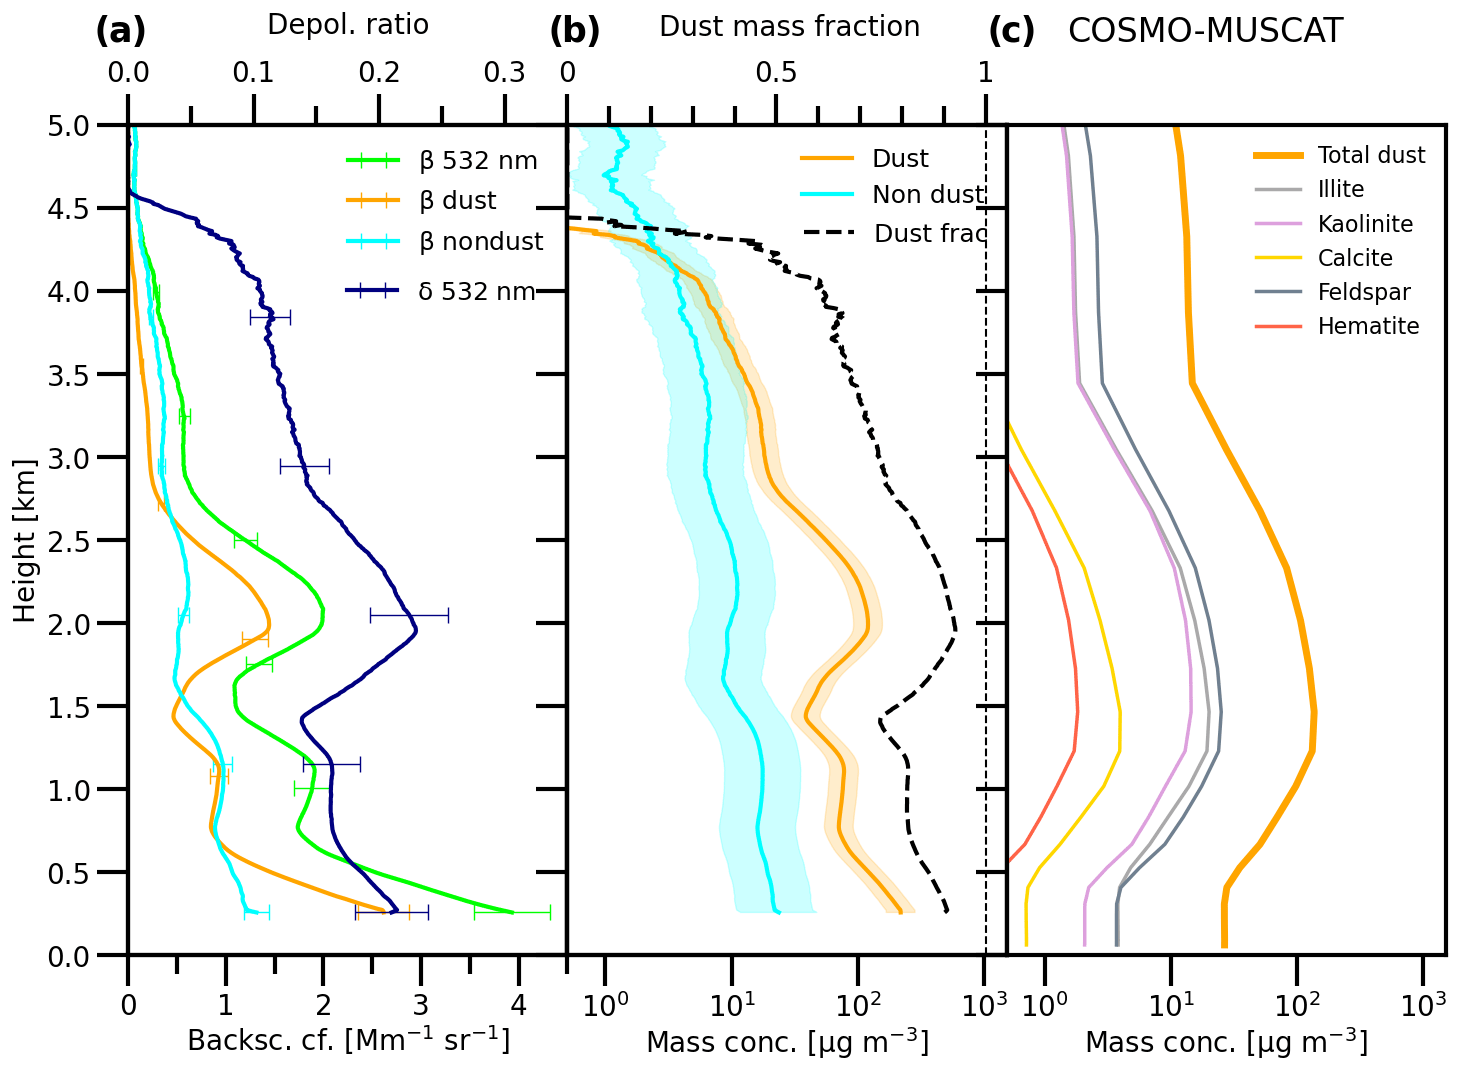
Figure 7Vertical profiles of lidar-retrieved optical and microphysical properties (obtained by applying the POLIPHON method to the polarization lidar measurements) as well as modeled mineralogical composition. The lidar measurement was performed on 2 February 2022 from 04:30–05:29 UTC in Mindelo. The 532 nm particle backscatter coefficient (a, light green) and the particle linear depolarization ratio (a, dark blue) are the inputs to obtain the separated dust and non-dust profiles in panels (a) and (b). The POLIPHON products are the derived 532 nm dust backscatter coefficient (a, orange) and non-dust backscatter coefficient (a, light blue), the dust mass concentration (b, orange) and non-dust mass concentration (b, light blue), and the dust mass fraction (b, black, ratio of the dust to total particle mass concentration; the dashed black vertical line indicates a dust mass fraction of 1). Vertical profiles of simulated mineral dust mass concentrations from the COSMO–MUSCAT model (c). The vertical profile corresponds to values calculated for the grid cell where Mindelo, Cape Verde, is found in the model. Each data point represents the concentration in the middle of the vertical model layer. Total mineral dust mass concentration (c, orange) is shown together with the mass contributions of some selected minerals.
From 1 February at 18:00 UTC to 2 February 2022 at 06:00 UTC, two lofted aerosol layers were observed by the lidar PollyXT above Mindelo, São Vicente. To determine whether and how much dust is present in these two lofted aerosol layers, a fine temporal resolution is needed to avoid averaging over dust and non-dust parts of the retrieved profiles. From the finer temporal resolution, optical properties can be retrieved, which can confirm whether the measured values fit the mineral dust optical property reference values (see Table 2 in Tesche et al., 2011a). For this particular day, a specific time period between 04:30 and 05:29 UTC for 2 February 2022 was selected as the finer temporal resolution. Figure 7a shows two of the optical properties retrieved for the 532 nm wavelength channel, where the backscattering coefficient (β) is shown in light green and the particle depolarization ratio (δ) in dark blue.
In Fig. 7, the two lofted aerosol layers are clearly visible; the first one starts at 650 m and ends at 1.4 km, while the second layer starts at 1.6 km and ends at around 4.5 km. In order to appoint the aerosol types found in the layers, an analysis of the lidar-retrieved intensive (i.e., independent of the aerosol amount) optical properties is necessary. From this retrieval, lidar ratios (LRs) at both 355 and 532 nm wavelengths are for the first lofted aerosol layer 65 and 60 sr and for the second lofted aerosol layer 60 and 57 sr, which are numbers that fit the range specified by Tesche et al. (2011a) characterizing smoke and mineral dust mixture (i.e., 67 ± 14 and 67 ± 12 sr). Furthermore, the particle depolarization ratios (δ) for both wavelengths are for the lower lofted layer 0.15 and 0.17 and for the upper lofted layer 0.17 and 0.23, which are values too low to point to pure mineral dust in the layers, and again correspond rather well to the range that Tesche et al. (2011a) identified as smoke and dust mixture (i.e., 0.16 ± 0.04 and 0.16 ± 0.03). Therefore, the intensive aerosol optical properties retrieved from PollyXT signals from 2 February 2022 for 04:30–05:29 UTC reveal that both lofted aerosol layers are composed of a mixture of smoke and mineral dust.
Figure 7 also shows the results of applying the POLIPHON method (see Sect. 2.5.3) to the vertical profiles of optical properties measured with lidar. The POLIPHON result clearly shows that a mixture of dust and non-dust aerosol particles is present in the atmosphere above Mindelo (Fig. 7a and b). The simulated vertical profile of mineral dust from COSMO–MUSCAT is pictured in Fig. 7c. The total mineral dust mass concentration is shown by the thicker line, while the other lines represent the mass concentrations of quartz, illite, kaolinite, calcite, and hematite. The simulated profile does not represent the layered structure of the vertical aerosol distribution. The lidar-retrieved vertical profile, on the other hand, shows two separated lofted dust layers due to an aerosol-free air mass intrusion with a 100 m thickness between them. The thickness of the aerosol-free layer that separates the two layers is thinner than the correspondent vertical level at this altitude in the model, which extends from 1229–1466 m. The model vertical resolution is therefore too coarse to be able to simulate the clean air mass intrusion between the lofted mineral dust layers. This fact has the consequence that the simulated dust layer appears to be one dust layer in the model instead of the layered mineral dust plumes observed by the lidar. The differences between the lidar-retrieved vertical profile and the simulated profile include the two-lofted-layer structure shown in the lidar results and the specific heights at which the maximum mineral dust mass concentrations are found. From the PollyXT-derived dust mass concentration vertical profile, the peak of dust mass concentration for the lower lofted layer is found at 1.1 km with a mineral dust mass concentration of 101 µg m−3, while for the upper lofted layer, the peak is found at 2 km with a mineral dust mass concentration of 156 µg m−3. The simulated profile shows one single dust layer with elevated dust mass concentrations between 0.5 and 3.5 km and a peak dust mass concentration of 136 µg m−3 at 1.5 km height. COSMO–MUSCAT positions the lofted dust layer peak 500 m below from the peak of the upper lofted layer retrieved from the lidar signals, but the peak dust mass concentrations differ by 20 µg m−3. For the lower lofted layer, the dust mass concentration peak obtained from POLIPHON compares well with the dust mass concentration calculated by COSMO–MUSCAT at the same height, since the model calculates 115 µg m−3 for 1.1 km.
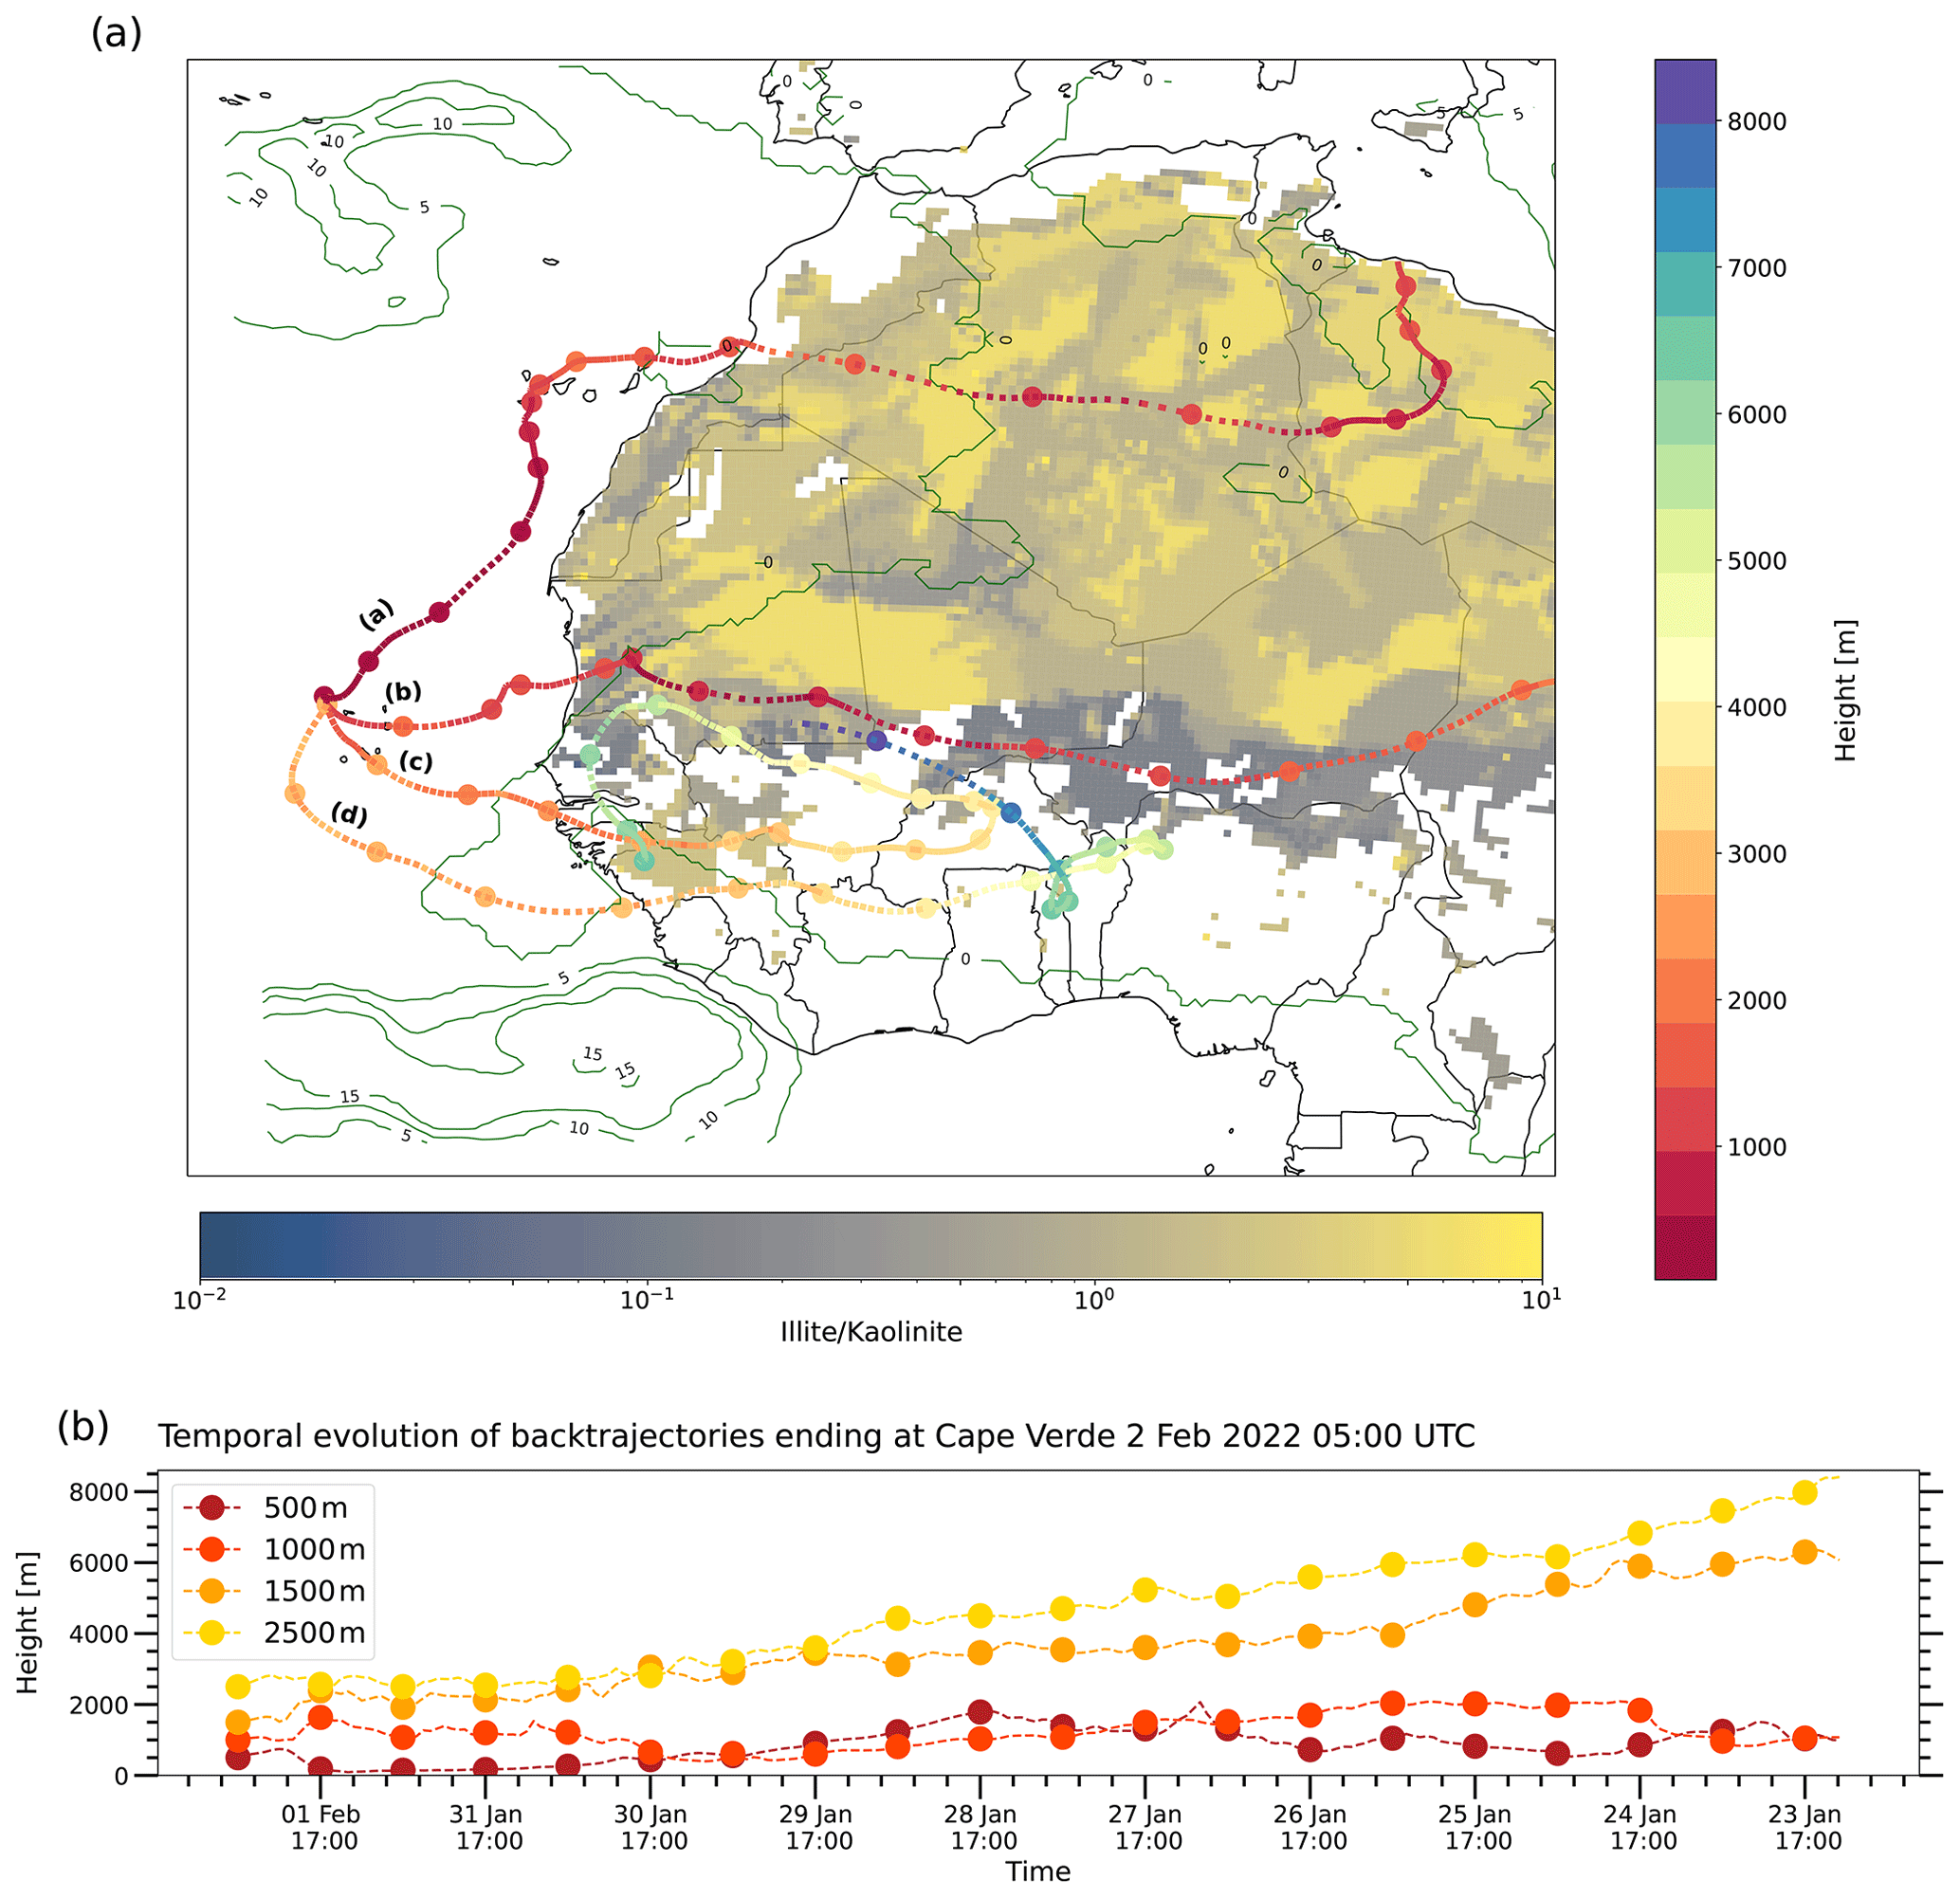
Figure 8Back trajectories calculated from COSMO–MUSCAT outputs using LAGRANTO (Miltenberger et al., 2013). Panel (a) shows back trajectories starting on 2 February at 05:00 UTC above São Vicente, Cape Verde, at the following heights above sea level: (a) 500 , (b) 1000 , (c) 1500 , and (d) 2500 . Average precipitation from 30 January at 00:00 UTC to 2 February at 05:00 UTC is portrayed by contour lines. The illite to kaolinite ratio is shown in the background in blue and yellow colors; blue shows the soils in which kaolinite is predominant and yellow shows the soils in which illite is the leading mineral fraction. Panel (b) shows the temporal evolution of the individual back trajectories.
The dust mass concentration differences below the lower lofted layer need a more detailed discussion. From the model data, the mineral dust above Mindelo for 2 February at 05:00 UTC came from two different source regions in the Sahara as shown in Fig. 8a. The modeled air masses that transported dust towards Cape Verde at the lowest altitudes came from the northwestern Sahara (back trajectory (a) in Fig. 8a). Along the trajectory of these air masses, where dust was in transit in between the Canary Islands and the Cape Verde archipelago, clouds were prominent, as depicted for 31 January in Fig. 4. From satellite retrievals (not shown) precipitation took place in the vicinity of the pathway of these air masses transporting dust at near-surface altitudes. COSMO–MUSCAT simulates the dust transport and precipitation, but the precipitation area simulated is larger than the one shown by satellite retrievals. The area covered by the simulated precipitation directly affected the modeled dust transport pathway. Precipitation activated the wet deposition scheme and mineral dust was lost in the simulated transport. Furthermore, the possibility cannot be discarded that some of the mineral dust captured by the lidar signals below 650 m altitude could be due to local mineral dust emissions, which are not included in the model. Nonetheless, it should be kept in mind that for single-point measurements and modeling result comparisons, local measurements may not be entirely representative of a whole model grid cell (28 km × 28 km).
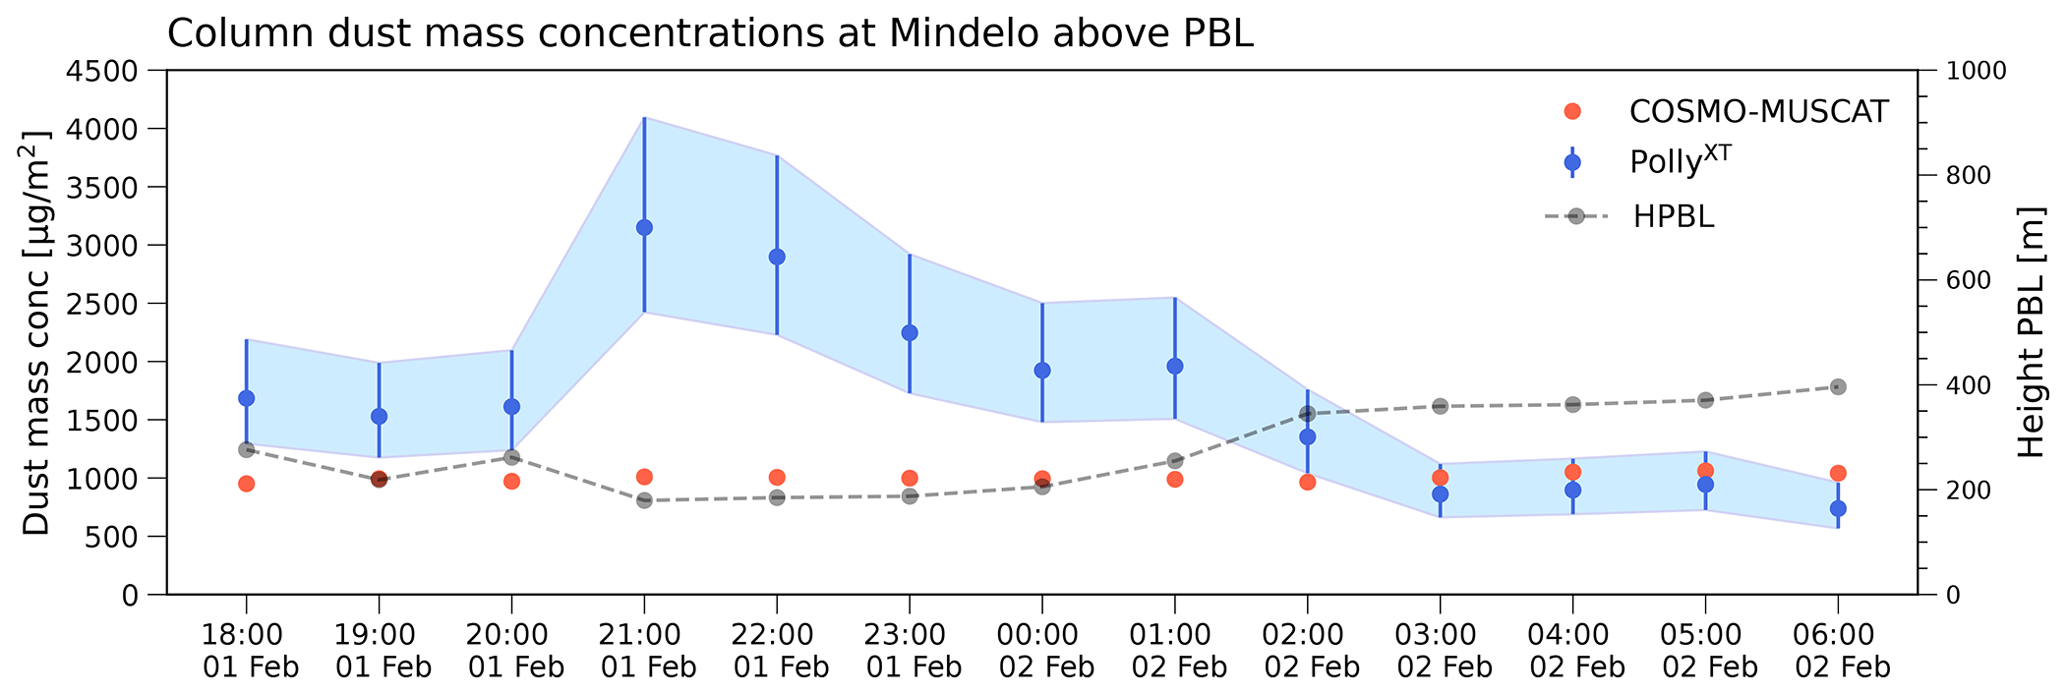
Figure 9Column dust mass concentrations above the height of the planetary boundary layer. Temporal evolution of both PollyXT-derived dust mass concentrations and COSMO–MUSCAT results for each hour between 1 February 2023 at 18:00 UTC and 2 February 2023 at 06:00 UTC. The height of the planetary boundary layer (HPBL) calculated from COSMO–MUSCAT is given by the black circles.
Figure 7c illustrates specific mineral mass concentrations, where quartz represents the highest contribution to the total simulated mineral dust. Illite and kaolinite have similar contributions, but their vertical distributions differ due to the different dust source regions. The different origins depicted by Fig. 8a differ in their illite to kaolinite content, where the northwestern African source region has a higher illite content, and the source regions corresponding to the Sahel area have a higher kaolinite content. Consequently, the vertical profile simulated above São Vicente shows a higher amount of illite mass concentration at lower altitudes, whereas the kaolinite mass concentration increases at a higher altitude.
Hematite is included here as it is assumed to represent the iron oxide content, which is known to absorb in the UV wavelength and therefore influence optical retrievals (Wagner et al., 2012; Di Biagio et al., 2019). Specifically, higher hematite presence is linked to higher UV absorption, which could be identified on the lidar-retrieved intensive optical property, i.e., the lidar ratio, since this optical property is influenced only by shape and composition (Veselovskii et al., 2020). Hematite content on this day was almost negligible and consequently no significant UV signature can be observed from the lidar-retrieved optical properties.
Figure 9 shows the comparison of the PollyXT-derived and simulated dust mass column concentrations above the planetary boundary layer. The atmospheric column for this comparison starts above the planetary boundary layer for two reasons: (1) the lack of local sources in the model and (2) depolarization measurements that cannot be retrieved close to the surface due to PollyXT characteristics; therefore, no dust mass fraction can be derived.
In the Fig. 9, the PollyXT-derived column dust mass concentrations vary more than the simulated column dust mass concentrations from 1 February at 18:00 UTC to 2 February at 06:00 UTC. For the first half of the time period considered here (i.e., 1 February at 18:00 UTC to 2 February at 01:00 UTC), the height of the planetary boundary layer is below the residual dust fraction found below the first lofted dust layer, and therefore PollyXT retrieval is more affected by it than in the second half of the comparison. In the model calculations, the residual dust fraction is underpredicted as a consequence of the abovementioned meteorological and simulation conditions. For the second half of the time period considered (i.e., 2 February from 01:00 to 06:00 UTC), the planetary boundary layer is above the residual dust fraction and therefore lidar column dust mass concentrations drop since it is only taking into account the lofted aerosol layers. For this half of the temporal comparison, the simulated column dust mass concentrations are very close to the PollyXT-retrieved column dust mass concentrations, which indicates that the lofted layers are well simulated.
The AOT and lidar comparisons are discussed first. It is noteworthy that the AOT comparisons are not intended to yield the same results since both AERONET and VIIRS–SNPP estimates include all the aerosols that interact with radiation at 550 nm, while the model is only considering mineral dust aerosols. Nonetheless, the region is known for AOT retrievals which are dominated by mineral dust aerosols.
Compared to AERONET AOT (Fig. 3), the model follows the temporal–spatial evolution very well, and observed and modeled dust AOTs agree. The same trend is found for the VIIRS–SNPP comparison (Fig. 4), where the averages of the difference maps are slightly negative, indicating somewhat higher values from the VIIRS–SNPP retrievals. Additionally, during the northern hemispheric winter season the Sahel and the Gulf of Guinea regions actively emit aerosols due to biomass burning (Heinold et al., 2011; Tesche et al., 2011b), so during this time of the year it is likely that the atmospheric burden due to aerosols will not be only due to mineral dust aerosols. Therefore, higher AOT values from VIIRS–SNPP than from the simulated results are expected since the model only simulates dust aerosols. Yet a definitive assessment regarding whether the simulated mineral dust is underpredicted or overpredicted is difficult to obtain from this comparison, in part because VIIRS–SNPP is reported to show negative biases over this region (Sayer et al., 2019). A negative bias could explain some differences for certain mineral dust hotspots, such as Niger on 31 January, but does not explain the differences in the Bodélé Depression. In order to understand if the model is underrepresenting Bodélé Depression dust emission, more studies are required, especially since the region is known to have very specific soil characteristics requiring special considerations for simulation (Tegen et al., 2006).
Generally, the AOT spatial distribution retrieved by VIIRS–SNPP for which the majority could be attributed to mineral dust is similar to the calculated one from COSMO–MUSCAT simulations, which suggests that the atmospheric dust life cycle including dust plume trajectories in the studied period is well calculated. Both AERONET and VIIRS–SNPP AOT comparisons show a similar trend in the spatial–temporal coverage, as well as similar magnitudes to those measured. It can be concluded that overall COSMO–MUSCAT simulates the emission, transport, and deposition realistically by including the relevant and determining atmospheric processes.
The vertical distribution for 2 February 2022 at 05:00 UTC shown in Fig. 7 is reasonably well represented by the model. The two-lofted-layer structure is not shown in the modeling results. The air mass intrusion that separates the two mineral dust layers is too thin to be simulated, since the thickness of the vertical layer where this occurs is 237 m and the thickness of the air mass is roughly 100 m. Consequently, the two-lofted-layer structure cannot be simulated with the vertical resolution used. A more significant difference is that the high dust mass concentrations below the lower lofted layer are not represented in the model. The model does not simulate this due to a simulated pressure system movement that shifted precipitation towards the trajectory of the dust plume over the Atlantic Ocean and due to the model not simulating any local emission for the Cape Verde archipelago.
From the comparison of the column dust mass concentrations it can be concluded that the model represents the vertical temporal distribution of the mineral dust layer reasonably well. Nevertheless, the ability of the model to represent the vertical structure of mineral dust mass concentration in the atmosphere cannot be assessed based on a one-case example. Additionally, single-point measurements may not be entirely representative of a whole model grid cell, and further validation with lidar-retrieved profiles is encouraged, including validations among different seasons.
The abovementioned results depend on comparisons between the simulated mineral dust and measurements based on the assumption of homogeneous mineral dust optical properties (i.e., both the AOT calculation from mineral dust mass concentrations and the POLIPHON method). However, as observed from the measurements of the ÅE in Fig. 3, more aerosol types than just dust (with typical values of 0.3 < ÅE) are present. The differences found in the simulated mineral dust and measurements discussed here could in part be attributed to this assumption. For example, the study of Balkanski et al. (2007) that focused on the evaluation of dust radiative forcing suggested that the reason for model overestimations of aerosol mineral dust is the discrepancy in mineral shortwave refractive indices. Their study shows, how, by modifying the homogeneously assumed optical properties of mineral dust, better agreements with AERONET measurements can be found.
The specific mineral mass composition comparisons illustrate a strong demand for more mineral composition measurements. The feldspar comparison cannot be analyzed since different definitions of the minerals are used through the measurements (e.g., K-feldspar or other feldspar as seen in Formenti et al., 2008; Jeong and Achterberg, 2014), while GMINER considers a general form of the feldspar mineral. The quartz comparison shows that the model is overrepresenting the amount of quartz in the atmosphere, while the illite and kaolinite comparisons show an underrepresentation from the model. Both results support the suggestion by Perlwitz et al. (2015a) that illite and kaolinite should also be considered in the silt size regime. Calcite that is considered in both silt and clay size ranges in the model compares best to the observations. Hematite composition cannot be analyzed due to the scarcity of the measurements. Nonetheless, is it noteworthy that most of the measurements fall in the same order of magnitude as the simulated results. Additionally, the uncertainty caused by the mineral mass aerosol size distribution not changing from the parent soil mineral mass size distribution cannot be neglected. The changes in the mineral mass size distributions and the addition of re-aggregation coefficients, which would consider phyllosilicates to also be present in silt sizes (Perlwitz et al., 2015a), would have the biggest impact on the quartz mass fraction by reducing its mass percentage significantly. Based on the redistribution of mineral aerosol masses shown in Gonçalves Ageitos et al. (2023), Perlwitz et al. (2015a, b), and Pérez García-Pando et al. (2016), it is further hypothesized that both illite and kaolinite aerosol mass percentages would increase and quartz diminish, probably causing a skew of the comparisons shown in Fig. 5 towards the 1:1 line.
The results suggest that the model is successfully including mineralogy in the simulation of the dust life cycle. The results also show that the model is able to reproduce the meteorological drivers that lead to a specific seasonal behavior. However, more comparisons are needed, especially mineral mass and vertical profile comparisons together with studies that consider the distinct mineral dust optical properties dependent on mineral composition.
An implementation of soil mineralogical composition into COSMO–MUSCAT's dust emission scheme is presented. The objective of the implementation is to be able to predict mineral mass concentration in the atmosphere. The simulated mineral mass is part of the mineral dust aerosol emitted from the Sahara and transported towards the Atlantic Ocean. Special focus is given to the Cape Verde archipelago since a large array of measurement devices and approaches are available for validation purposes. The validations are presented for both a specific case of mineral dust plumes originating at the beginning of February 2022 and the general spatial–temporal evolution of mineral dust mass concentrations in the atmosphere for January–February 2022. Most of the comparisons presented rely on an assumption of homogeneity for mineral dust optical properties.
The explicit representation of dust mineralogy in COSMO–MUSCAT is part of a handful of studies (Solomos et al., 2023; Menut et al., 2020) that include dust mineralogy in the set of parameterizations describing the mineral dust life cycle in a regional atmospheric model, which opens the possibilities for comparing with specific field measurements. Comparisons with measurements show that the model represents the mineral content well. Nonetheless, the comparison with mineral mass concentrations showcases the lack of measurements and therefore opens up the possibility of validating mineral masses in other ways. It would be of particular interest to be able to use remote sensing methods to specify the effects of mineral composition, e.g., their iron oxide content. By considering the amount of iron oxide simulated in the atmosphere a link could be made with regards to changes in the optical retrieved properties for specific iron-heavy simulated layers. If such a link is determined, a correlation between the amount of simulated iron oxide content and the UV–Vis response to it could be established (Balkanski et al., 2007; Veselovskii et al., 2020; Li et al., 2019; Zhang et al., 2015) and therefore measured. This information could be used later for both monitoring mineral dust aerosols through lidar measurements and creating a more accurate description of mineral dust aerosols and their coupling with radiative transfer processes in atmospheric models.
The regional chemistry transport model MUSCAT contains a radiative transfer feedback mechanism which could be further improved with mineral individual optical properties, depending on source regions and their specific mineral constitution. Considering the diversity of dust compositions and their specific relation with the UV–Vis–IR wavelengths provides an excellent opportunity for further research into the direct radiative effect of dust. Such an inclusion has already been suggested by Balkanski et al. (2007), who showed better matches to observations when varying mineral dust refractive indices by considering a fixed iron oxide content. This suggests to us that varying mineral dust optical properties depending on their source regions and mineral content could only aid in improving predictions for the atmospheric radiative balance.
In summary, the comparisons with measurements presented show that the general spatial–temporal evolution comparison matches the simulated mineral dust mass concentrations well. For instance, the temporal evolution and simulation-based AOT calculations almost always resemble the AERONET-station-measured AOT in the studied period. The simulated mineral dust mass concentration vertical profile fits the lidar-retrieved aerosol profile over Mindelo, São Vicente, Cape Verde, generally but misses a near-surface portion of mineral dust due to a wider coverage of simulated precipitation and a lack of local emissions in the model.
In the technical aspect of the mineralogical implementation of the model emission scheme some recommendations can be considered in order to improve the accuracy of the mineral mass concentration predictions in the atmosphere. The largest modification could be the consideration of the change in particle size distribution from the mineral-dust-productive soil and the aerosol mineral composition following Perlwitz et al. (2015a, b), Pérez García-Pando et al. (2016), Gonçalves Ageitos et al. (2023), Li et al. (2021), and Scanza et al. (2015). Another possible improvement is the consideration of different densities between minerals, as iron-oxide-containing minerals have densities that are twice that of other minerals (Perlwitz et al., 2015a). Nevertheless, validation through measurements is the only way to verify the effect of these changes. We stress again the need for more mineral mass concentration measurements.
Crucially, the implementation of mineralogical information into the dust emission scheme of COSMO–MUSCAT is a key element for the investigation of the relation of the lidar-retrieved vertical profiles and mineral masses. Such a relation implies a possible link between lidar-measured optical properties and dust source regions. Since this relation is currently thought of as an association between iron oxide content and lidar ratio, the focus of further modeling projects should then be the accurate representation of iron oxide content. In such a framework, internal mixtures of iron oxide content could also be considered in the mineralogical parameterization following previous modeling efforts such as in Perlwitz et al. (2015a, b).
Table A1Mineral fraction data used in the model evaluation. The measurements were selected on the basis of the dust plume origins. Where the measurements represent a whole period, northern hemispheric winter was selected to match our simulation period. When measurements come from specific dust events, then the comparison with the modeled data is done taking into account the dust plume origins.
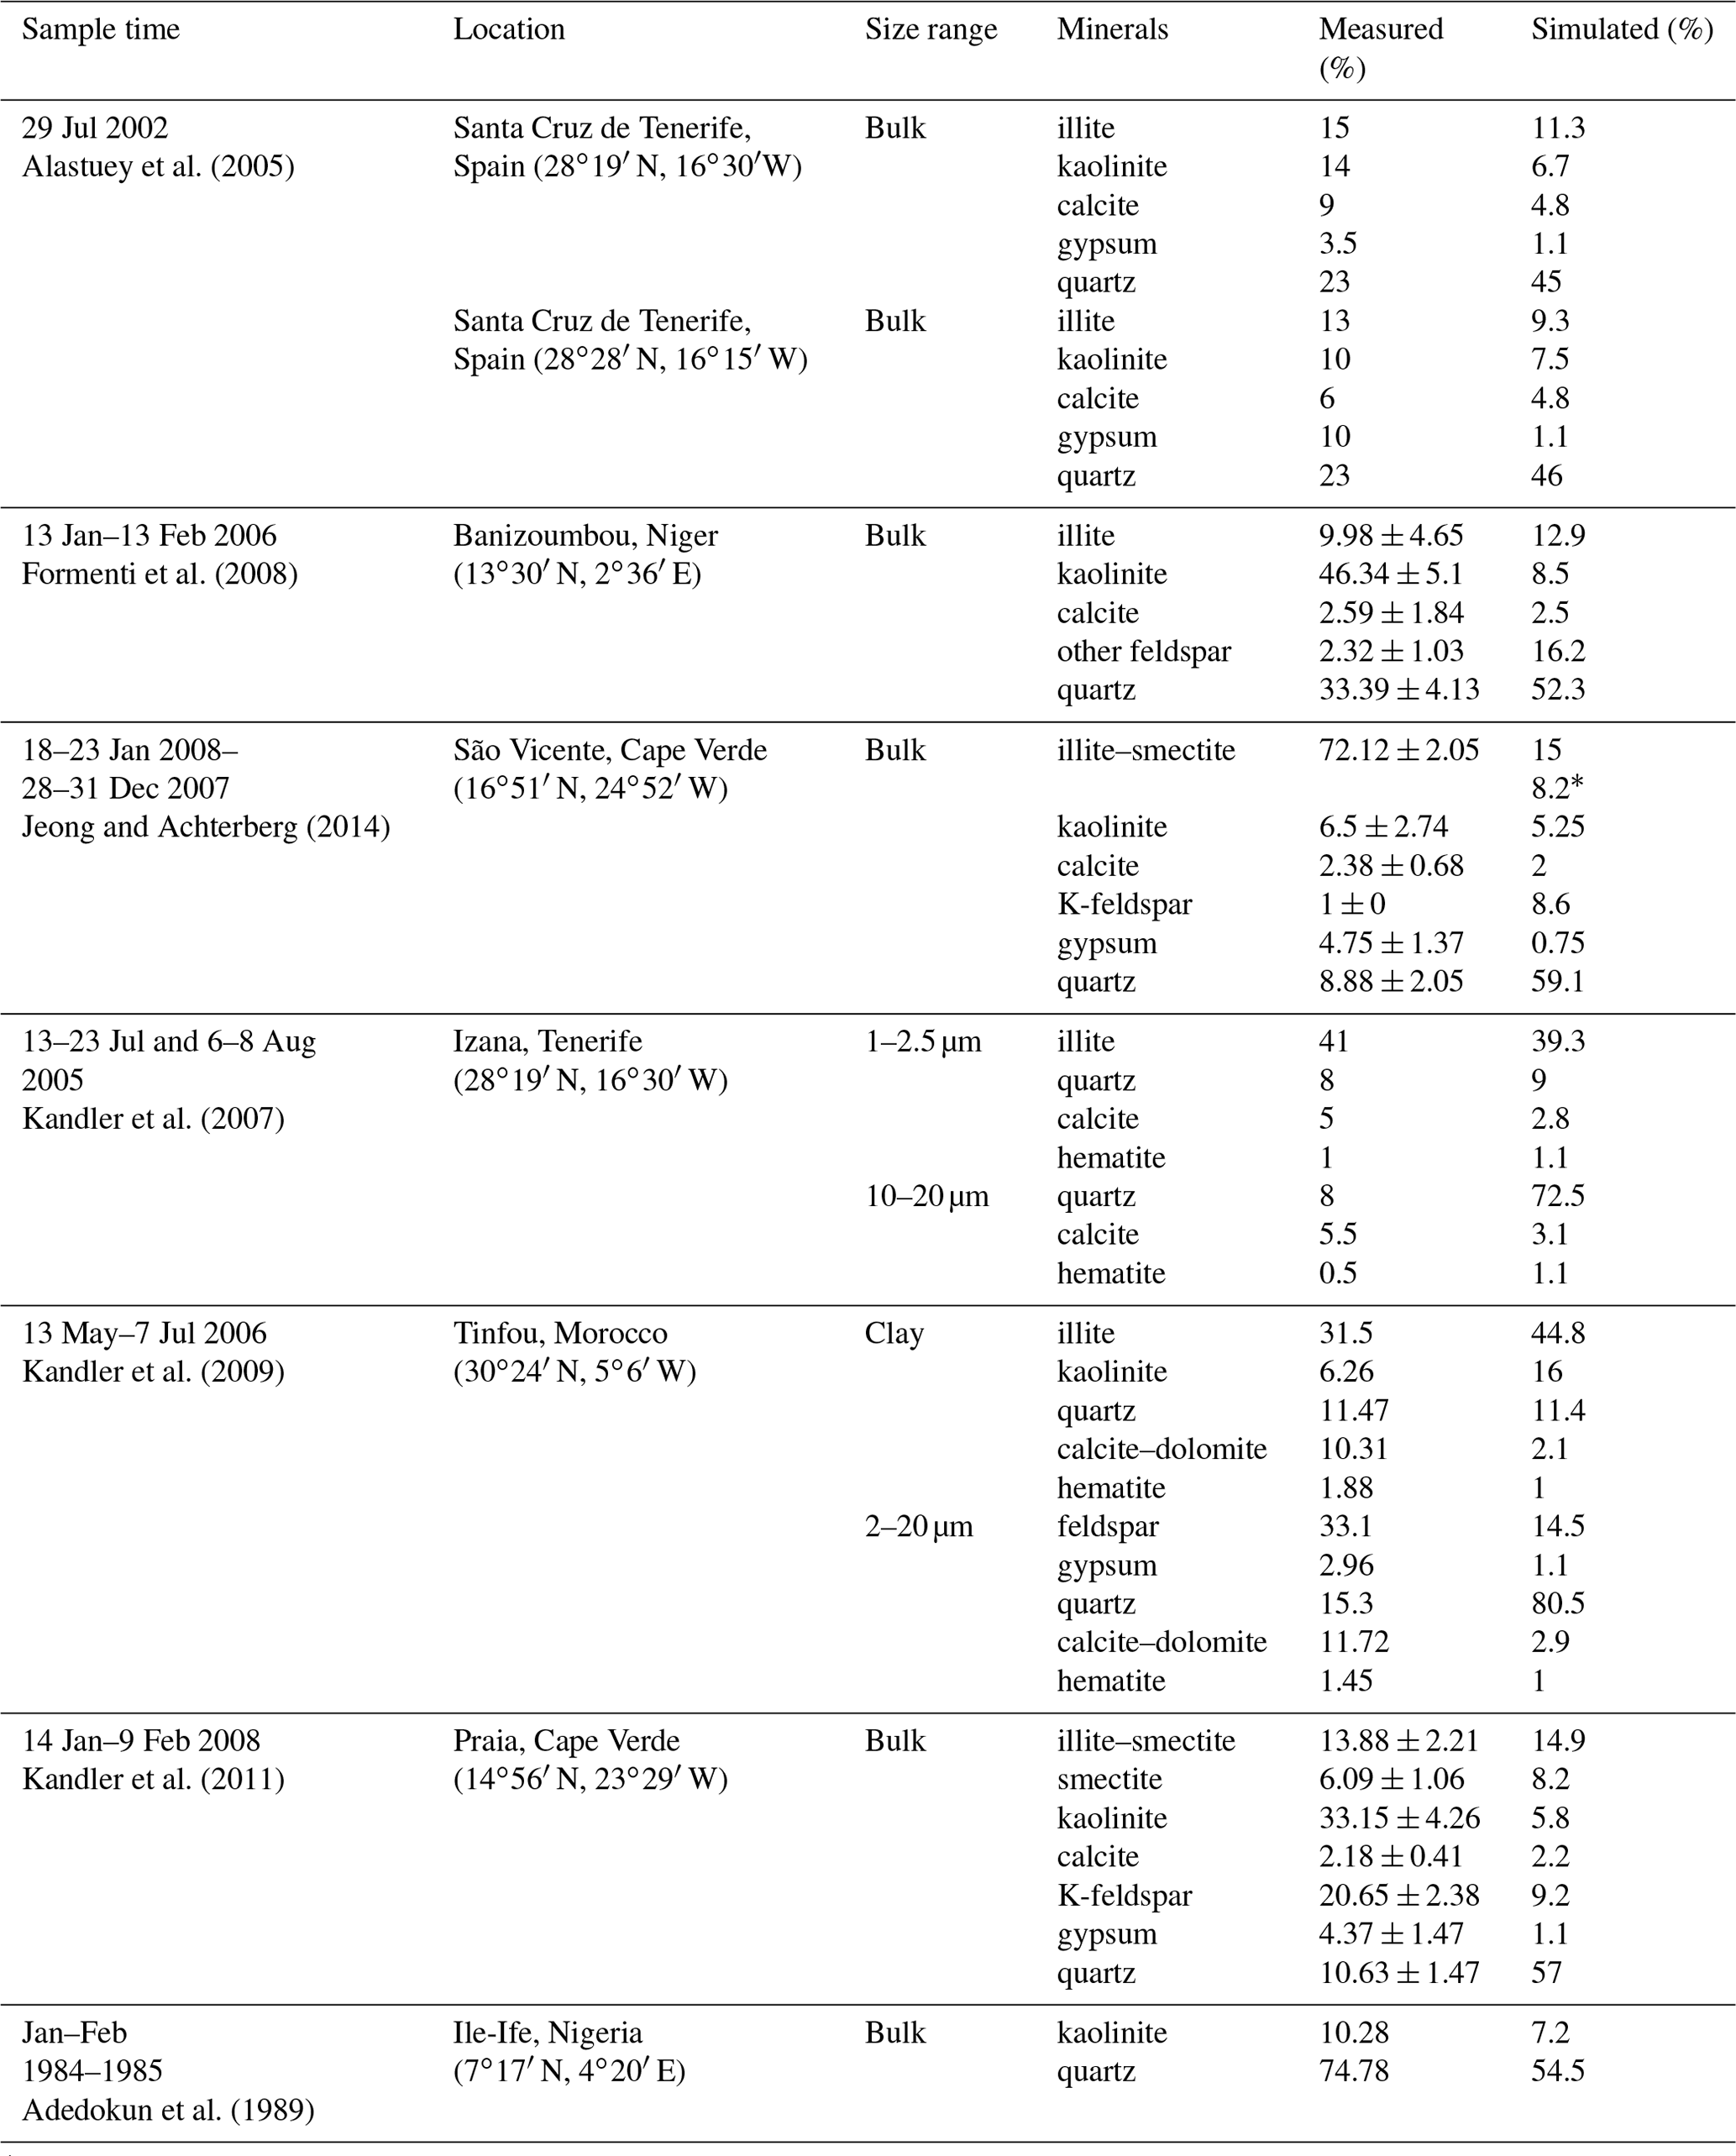
∗ Modeled results are reported in the following way: first illite, then smectite.
The MUSCAT source code containing the mineralogical implementation described in this paper is available at https://doi.org/10.5281/zenodo.8321174 (Gómez Maqueo Anaya et al., 2023a). Additionally, a dust test case folder with input files based on the contents of this paper can be found at https://doi.org/10.5281/zenodo.8320600 (Gómez Maqueo Anaya and Faust, 2023). The COSMO model was available under license, which allowed its use for noncommercial research practices (more info at http://www.cosmo-model.org/content/consortium/licencing.htm (last access: 12 February 2024). Parts of MUSCAT that involve the coupling with COSMO are excluded from the published code in order to avoid breaking the COSMO licensing agreement (https://doi.org/10.5281/zenodo.10013818, Wolke et al., 2023).
The aerosol optical properties retrieved from PollyXT signals are published at https://doi.org/10.5281/zenodo.8100298 (Gómez Maqueo Anaya et al., 2023b).
SGMA wrote the manuscript draft; DA and KS reviewed and edited the manuscript; DA and KS provided resources such as study materials, instrumentation, and analysis tools and were part of the conceptualization of the project; MF – software development (restructured the code around MUSCAT dust emission scheme); SGMA, MF, BH, KS, and IT contributed to code development surrounding the mineralogy inclusion; SGMA, DA, HB, JH, and AA were part of the formal analysis of lidar data. AS, BH, HB, and RE are part of the maintenance and continuous improvement of the PollyXT lidar device(s).
The contact author has declared that none of the authors has any competing interests.
The results contain modified Copernicus Climate Change Service information 2020 and 2022. Neither the European Commission nor ECMWF is responsible for any use that may be made of the Copernicus information or data it contains.
Publisher's note: Copernicus Publications remains neutral with regard to jurisdictional claims made in the text, published maps, institutional affiliations, or any other geographical representation in this paper. While Copernicus Publications makes every effort to include appropriate place names, the final responsibility lies with the authors.
This study is done in the framework of the DUSTRISK (a risk index for health effects of mineral dust and associated microbes) project, funded by the Leibniz Collaborative Excellence Programme.
Furthermore, we also acknowledge the support through ACTRIS-2 from the European Union's Horizon 2020 research and innovation program and ACTRIS PPP under the Horizon 2020 – Research and Innovation Framework Programme.
The study by Muñoz Sabater and Copernicus Climate Change Service (2019) and Muñoz Sabater et al. (2021) was downloaded from the Copernicus Climate Change Service (C3S) Climate Data Store.
The AERDB D3 VIIRS NOAA20 Aerosol Optical Thickness 550 Land Ocean Mean daily L3 1∘ × 1∘ grid datasets were acquired from the Level-1 and Atmosphere Archive and Distribution System (LAADS) Distributed Active Archive Center (DAAC), located in the Goddard Space Flight Center in Greenbelt, Maryland.
Further thanks are due to the Deutscher Wetterdienst (DWD) for cooperation and support, to the developers of the LAGRANTO–COSMO tool, and to all PIs of the AERONET stations used in this study for maintaining the instruments, obtaining the measurements, and providing data.
We want to thank all the TROPOS team members involved in PollyNET, the network dedicated to providing continuous aerosol data from automated Raman polarization lidars (Baars et al., 2016, https://polly.tropos.de/, last access: 12 February 2024).
This research has been supported by the Bundesministerium für Wirtschaft und Energie (grant no. 50EE1721C), Horizon 2020 (grant nos. 654109 and 7395302), and the Leibniz-Institut für Troposphärenforschung (grant no. K255/2019).
The publication of this article was funded by the Open Access Fund of the Leibniz Association.
This paper was edited by Jason Williams and reviewed by two anonymous referees.
Adedokun, J. A., Emofurieta, W. O., and Adedeji, O. A.: Physical, mineralogical and chemical properties of harmattan dust at Ile-Ife, Nigeria, Theor. Appl. Climatol., 40, 161–169, https://doi.org/10.1007/BF00866179, 1989. a
Alastuey, A., Querol, X., Castillo, S., Escudero, M., Avila, A., Cuevas, E., Torres, C., Romero, P.-M., Exposito, F., García, O., Pedro Diaz, J., Dingenen, R. V., and Putaud, J. P.: Characterisation of TSP and PM2.5 at Izaña and Sta. Cruz de Tenerife (Canary Islands, Spain) during a Saharan Dust Episode (July 2002), Atmos. Environ., 39, 4715–4728, https://doi.org/10.1016/j.atmosenv.2005.04.018, 2005. a
Ansmann, A., Mamouri, R.-E., Hofer, J., Baars, H., Althausen, D., and Abdullaev, S. F.: Dust mass, cloud condensation nuclei, and ice-nucleating particle profiling with polarization lidar: updated POLIPHON conversion factors from global AERONET analysis, Atmos. Meas. Tech., 12, 4849–4865, https://doi.org/10.5194/amt-12-4849-2019, 2019. a, b
Atkinson, J. D., Murray, B. J., Woodhouse, M. T., Whale, T. F., Baustian, K. J., Carslaw, K. S., Dobbie, S., O'Sullivan, D., and Malkin, T. L.: The importance of feldspar for ice nucleation by mineral dust in mixed-phase clouds, Nature, 498, 355–358, https://doi.org/10.1038/nature12278, 2013. a, b, c, d, e
Baars, H., Kanitz, T., Engelmann, R., Althausen, D., Heese, B., Komppula, M., Preißler, J., Tesche, M., Ansmann, A., Wandinger, U., Lim, J.-H., Ahn, J. Y., Stachlewska, I. S., Amiridis, V., Marinou, E., Seifert, P., Hofer, J., Skupin, A., Schneider, F., Bohlmann, S., Foth, A., Bley, S., Pfüller, A., Giannakaki, E., Lihavainen, H., Viisanen, Y., Hooda, R. K., Pereira, S. N., Bortoli, D., Wagner, F., Mattis, I., Janicka, L., Markowicz, K. M., Achtert, P., Artaxo, P., Pauliquevis, T., Souza, R. A. F., Sharma, V. P., van Zyl, P. G., Beukes, J. P., Sun, J., Rohwer, E. G., Deng, R., Mamouri, R.-E., and Zamorano, F.: An overview of the first decade of PollyXT: an emerging network of automated Raman-polarization lidars for continuous aerosol profiling, Atmos. Chem. Phys., 16, 5111–5137, https://doi.org/10.5194/acp-16-5111-2016, 2016. a, b
Baldauf, M., Seifert, A., Förstner, J., Majewski, D., Raschendorfer, M., and Reinhardt, T.: Operational Convective-Scale Numerical Weather Prediction with the COSMO Model: Description and Sensitivities, Mon. Weather Rev., 139, 3887–3905, https://doi.org/10.1175/MWR-D-10-05013.1, 2011. a
Baldo, C., Formenti, P., Nowak, S., Chevaillier, S., Cazaunau, M., Pangui, E., Di Biagio, C., Doussin, J.-F., Ignatyev, K., Dagsson-Waldhauserova, P., Arnalds, O., MacKenzie, A. R., and Shi, Z.: Distinct chemical and mineralogical composition of Icelandic dust compared to northern African and Asian dust, Atmos. Chem. Phys., 20, 13521–13539, https://doi.org/10.5194/acp-20-13521-2020, 2020. a
Balkanski, Y., Schulz, M., Claquin, T., and Guibert, S.: Reevaluation of Mineral aerosol radiative forcings suggests a better agreement with satellite and AERONET data, Atmos. Chem. Phys., 7, 81–95, https://doi.org/10.5194/acp-7-81-2007, 2007. a, b, c, d, e, f
Berge, E.: Transboundary air pollution in Europe. Part 2: Numerical addendum to emissions, dispersion and trends of acidifying and eutrophying agents, https://www.osti.gov/etdeweb/biblio/646220 (last access: 12 February 2024), 1997. a
Caquineau, S., Gaudichet, A., Gomes, L., Magonthier, M.-C., and Chatenet, B.: Saharan dust: Clay ratio as a relevant tracer to assess the origin of soil-derived aerosols, Geophys. Res. Lett., 25, 983–986, https://doi.org/10.1029/98GL00569, 1998. a
Chatziparaschos, M., Daskalakis, N., Myriokefalitakis, S., Kalivitis, N., Nenes, A., Gonçalves Ageitos, M., Costa-Surós, M., Pérez García-Pando, C., Zanoli, M., Vrekoussis, M., and Kanakidou, M.: Role of K-feldspar and quartz in global ice nucleation by mineral dust in mixed-phase clouds, Atmos. Chem. Phys., 23, 1785–1801, https://doi.org/10.5194/acp-23-1785-2023, 2023. a, b
Claquin, T., Schulz, M., and Balkanski, Y.: Modeling the mineralogy of atmospheric dust sources, J. Geophys. Res.-Atmos., 104, 22243–22256, https://doi.org/10.1029/1999JD900416, 1999. a, b
Darmenova, K., Sokolik, I. N., Shao, Y., Marticorena, B., and Bergametti, G.: Development of a physically based dust emission module within the Weather Research and Forecasting (WRF) model: Assessment of dust emission parameterizations and input parameters for source regions in Central and East Asia, J. Geophys. Res.-Atmos., 114, D14201, https://doi.org/10.1029/2008JD011236, 2009. a
Di Biagio, C., Formenti, P., Balkanski, Y., Caponi, L., Cazaunau, M., Pangui, E., Journet, E., Nowak, S., Andreae, M. O., Kandler, K., Saeed, T., Piketh, S., Seibert, D., Williams, E., and Doussin, J.-F.: Complex refractive indices and single-scattering albedo of global dust aerosols in the shortwave spectrum and relationship to size and iron content, Atmos. Chem. Phys., 19, 15503–15531, https://doi.org/10.5194/acp-19-15503-2019, 2019. a, b
Engelmann, R., Kanitz, T., Baars, H., Heese, B., Althausen, D., Skupin, A., Wandinger, U., Komppula, M., Stachlewska, I. S., Amiridis, V., Marinou, E., Mattis, I., Linné, H., and Ansmann, A.: The automated multiwavelength Raman polarization and water-vapor lidar PollyXT: the neXT generation, Atmos. Meas. Tech., 9, 1767–1784, https://doi.org/10.5194/amt-9-1767-2016, 2016. a
Fécan, F., Marticorena, B., and Bergametti, G.: Parametrization of the increase of the aeolian erosion threshold wind friction velocity due to soil moisture for arid and semi-arid areas, Ann. Geophys., 17, 149–157, https://doi.org/10.1007/s00585-999-0149-7, 1999. a, b
Formenti, P., Rajot, J. L., Desboeufs, K., Caquineau, S., Chevaillier, S., Nava, S., Gaudichet, A., Journet, E., Triquet, S., Alfaro, S., Chiari, M., Haywood, J., Coe, H., and Highwood, E.: Regional variability of the composition of mineral dust from western Africa: Results from the AMMA SOP0/DABEX and DODO field campaigns, J. Geophys. Res.-Atmos., 113, D00C13, https://doi.org/10.1029/2008JD009903, 2008. a, b, c
Formenti, P., Schütz, L., Balkanski, Y., Desboeufs, K., Ebert, M., Kandler, K., Petzold, A., Scheuvens, D., Weinbruch, S., and Zhang, D.: Recent progress in understanding physical and chemical properties of African and Asian mineral dust, Atmos. Chem. Phys., 11, 8231–8256, https://doi.org/10.5194/acp-11-8231-2011, 2011. a, b, c, d
Formenti, P., Caquineau, S., Desboeufs, K., Klaver, A., Chevaillier, S., Journet, E., and Rajot, J. L.: Mapping the physico-chemical properties of mineral dust in western Africa: mineralogical composition, Atmos. Chem. Phys., 14, 10663–10686, https://doi.org/10.5194/acp-14-10663-2014, 2014. a, b, c, d
Fuster, B., Sánchez-Zapero, J., Camacho, F., García-Santos, V., Verger, A., Lacaze, R., Weiss, M., Baret, F., and Smets, B.: Quality Assessment of PROBA-V LAI, fAPAR and fCOVER Collection 300 m Products of Copernicus Global Land Service, Remote Sens.-Basel, 12, 1017, https://doi.org/10.3390/rs12061017, 2020. a, b
Gómez Maqueo Anaya, S. and Faust, M.: Dustonly – Sample Data (v0.1), Zenodo [data set], https://doi.org/10.5281/zenodo.8320600, 2023. a
Gómez Maqueo Anaya, S., Faust, M., Heinold, B., Schepanski, K., and Tegen, I.: Dustonly/Dustonly: v1.0 (v1.0), Zenodo [code], https://doi.org/10.5281/zenodo.8321174, 2023a. a
Gómez Maqueo Anaya, S., Althausen, D., Faust, M., Baars, H., Heinold, B., Hofer, J., Tegen, I., Ansmann, A., Engelmann, R., Skupin, A., Heese, B., and Schepanski, K.: PollyXT manual retrieval for 2-Feb-2022 4:30 -5:29 UTC at Mindelo, Cabo Verde, Zenodo [data set], https://doi.org/10.5281/zenodo.8100298, 2023b. a
Gonçalves Ageitos, M., Obiso, V., Miller, R. L., Jorba, O., Klose, M., Dawson, M., Balkanski, Y., Perlwitz, J., Basart, S., Di Tomaso, E., Escribano, J., Macchia, F., Montané, G., Mahowald, N. M., Green, R. O., Thompson, D. R., and Pérez García-Pando, C.: Modeling dust mineralogical composition: sensitivity to soil mineralogy atlases and their expected climate impacts, Atmos. Chem. Phys., 23, 8623–8657, https://doi.org/10.5194/acp-23-8623-2023, 2023. a, b, c, d
Haarig, M., Ansmann, A., Engelmann, R., Baars, H., Toledano, C., Torres, B., Althausen, D., Radenz, M., and Wandinger, U.: First triple-wavelength lidar observations of depolarization and extinction-to-backscatter ratios of Saharan dust, Atmos. Chem. Phys., 22, 355–369, https://doi.org/10.5194/acp-22-355-2022, 2022. a
Harrison, A. D., Lever, K., Sanchez-Marroquin, A., Holden, M. A., Whale, T. F., Tarn, M. D., McQuaid, J. B., and Murray, B. J.: The ice-nucleating ability of quartz immersed in water and its atmospheric importance compared to K-feldspar, Atmos. Chem. Phys., 19, 11343–11361, https://doi.org/10.5194/acp-19-11343-2019, 2019. a
Harrison, S. P., Kohfeld, K. E., Roelandt, C., and Claquin, T.: The role of dust in climate changes today, at the last glacial maximum and in the future, Earth-Sci. Rev., 54, 43–80, https://doi.org/10.1016/S0012-8252(01)00041-1, 2001. a
Heinold, B., Tegen, I., Schepanski, K., Tesche, M., Esselborn, M., Freudenthaler, V., Gross, S., Kandler, K., Knippertz, P., Müller, D., Schladitz, A., Toledano, C., Weinzierl, B., Ansmann, A., Althausen, D., Müller, T., Petzold, A., and Wiedensohler, A.: Regional modelling of Saharan dust and biomass-burning smoke: Part 1: Model description and evaluation, Tellus B, 63, 781–799, https://doi.org/10.1111/j.1600-0889.2011.00570.x, 2011. a, b, c, d, e, f, g
Heinold, B., Tegen, I., Schepanski, K., and Banks, J. R.: New developments in the representation of Saharan dust sources in the aerosol–climate model ECHAM6-HAM2, Geosci. Model Dev., 9, 765–777, https://doi.org/10.5194/gmd-9-765-2016, 2016. a
Helmert, J., Heinold, B., Tegen, I., Hellmuth, O., and Wendisch, M.: On the direct and semidirect effects of Saharan dust over Europe: A modeling study, J. Geophys. Res.-Atmos., 112, 2006JD007444, https://doi.org/10.1029/2006JD007444, 2007. a
Hofer, J., Althausen, D., Abdullaev, S. F., Makhmudov, A. N., Nazarov, B. I., Schettler, G., Engelmann, R., Baars, H., Fomba, K. W., Müller, K., Heinold, B., Kandler, K., and Ansmann, A.: Long-term profiling of mineral dust and pollution aerosol with multiwavelength polarization Raman lidar at the Central Asian site of Dushanbe, Tajikistan: case studies, Atmos. Chem. Phys., 17, 14559–14577, https://doi.org/10.5194/acp-17-14559-2017, 2017. a
Holben, B. N., Eck, T. F., Slutsker, I., Tanré, D., Buis, J. P., Setzer, A., Vermote, E., Reagan, J. A., Kaufman, Y. J., Nakajima, T., Lavenu, F., Jankowiak, I., and Smirnov, A.: AERONET–A Federated Instrument Network and Data Archive for Aerosol Characterization, Remote Sens. Environ., 66, 1–16, https://doi.org/10.1016/S0034-4257(98)00031-5, 1998. a, b
Hoose, C., Lohmann, U., Erdin, R., and Tegen, I.: The global influence of dust mineralogical composition on heterogeneous ice nucleation in mixed-phase clouds, Environ. Res. Lett., 3, 025003, https://doi.org/10.1088/1748-9326/3/2/025003, 2008. a, b, c, d
Jakobsen, H. A., Berge, E., and Jonson, J. E.: The Multi-layer Eulerian Model: Model Description and Evaluation of Transboundary Fluxes of Sulphur and Nitrogen for One Year, DNMI Research Report 49, Meteorological Synthesizing Centre-West, eCE Co-Operative Programme for and Europe, Evaluation of the Long Range Transmission of Air Pollutants in and Meteorological Synthesizing Centre–West, Norway, Oslo, https://books.google.de/books?id=Lu8ivwEACAAJ (last access: 12 February 2024), 1997. a
Jeong, G. Y. and Achterberg, E. P.: Chemistry and mineralogy of clay minerals in Asian and Saharan dusts and the implications for iron supply to the oceans, Atmos. Chem. Phys., 14, 12415–12428, https://doi.org/10.5194/acp-14-12415-2014, 2014. a, b, c
Journet, E., Balkanski, Y., and Harrison, S. P.: A new data set of soil mineralogy for dust-cycle modeling, Atmos. Chem. Phys., 14, 3801–3816, https://doi.org/10.5194/acp-14-3801-2014, 2014. a, b, c, d, e, f, g, h
Kandler, K., Benker, N., Bundke, U., Cuevas, E., Ebert, M., Knippertz, P., Rodríguez, S., Schütz, L., and Weinbruch, S.: Chemical composition and complex refractive index of Saharan Mineral Dust at Izaña, Tenerife (Spain) derived by electron microscopy, Atmos. Environ., 41, 8058–8074, https://doi.org/10.1016/j.atmosenv.2007.06.047, 2007. a
Kandler, K., Schütz, L., Deutscher, C., Ebert, M., Hofmann, H., Jäckel, S., Jaenicke, R., Knippertz, P., Lieke, K., Massling, A., Petzold, A., Schladitz, A., Weinzierl, B., Wiedensohler, A., Zorn, S., and Weinbruch, S.: Size distribution, mass concentration, chemical and mineralogical composition and derived optical parameters of the boundary layer aerosol at Tinfou, Morocco, during SAMUM 2006, Tellus B, 61, 32, https://doi.org/10.1111/j.1600-0889.2008.00385.x, 2009. a, b, c
Kandler, K., Schütz, L., Jäckel, S., Lieke, K., Emmel, C., Müller-Ebert, D., Ebert, M., Scheuvens, D., Schladitz, A., Šegvić, B., Wiedensohler, A., and Weinbruch, S.: Ground-based off-line aerosol measurements at Praia, Cape Verde, during the Saharan Mineral Dust Experiment: microphysical properties and mineralogy, Tellus B, 63, 459–474, https://doi.org/10.1111/j.1600-0889.2011.00546.x, 2011. a
Kok, J. F.: A scaling theory for the size distribution of emitted dust aerosols suggests climate models underestimate the size of the global dust cycle, P. Natl. Acad. Sci. USA, 108, 1016–1021, https://doi.org/10.1073/pnas.1014798108, 2011. a, b
Kok, J. F., Storelvmo, T., Karydis, V. A., Adebiyi, A. A., Mahowald, N. M., Evan, A. T., He, C., and Leung, D. M.: Mineral dust aerosol impacts on global climate and climate change, Nat. Rev. Earth Environ., 4, 71–86, https://doi.org/10.1038/s43017-022-00379-5, 2023. a, b
Lafon, S., Rajot, J.-L., Alfaro, S. C., and Gaudichet, A.: Quantification of iron oxides in desert aerosol, Atmos. Environ., 38, 1211–1218, https://doi.org/10.1016/j.atmosenv.2003.11.006, 2004. a, b
Li, L., Dubovik, O., Derimian, Y., Schuster, G. L., Lapyonok, T., Litvinov, P., Ducos, F., Fuertes, D., Chen, C., Li, Z., Lopatin, A., Torres, B., and Che, H.: Retrieval of aerosol components directly from satellite and ground-based measurements, Atmos. Chem. Phys., 19, 13409–13443, https://doi.org/10.5194/acp-19-13409-2019, 2019. a
Li, L., Mahowald, N. M., Miller, R. L., Pérez García-Pando, C., Klose, M., Hamilton, D. S., Gonçalves Ageitos, M., Ginoux, P., Balkanski, Y., Green, R. O., Kalashnikova, O., Kok, J. F., Obiso, V., Paynter, D., and Thompson, D. R.: Quantifying the range of the dust direct radiative effect due to source mineralogy uncertainty, Atmos. Chem. Phys., 21, 3973–4005, https://doi.org/10.5194/acp-21-3973-2021, 2021. a, b, c, d
Mahowald, N. M., Kloster, S., Engelstaedter, S., Moore, J. K., Mukhopadhyay, S., McConnell, J. R., Albani, S., Doney, S. C., Bhattacharya, A., Curran, M. A. J., Flanner, M. G., Hoffman, F. M., Lawrence, D. M., Lindsay, K., Mayewski, P. A., Neff, J., Rothenberg, D., Thomas, E., Thornton, P. E., and Zender, C. S.: Observed 20th century desert dust variability: impact on climate and biogeochemistry, Atmos. Chem. Phys., 10, 10875–10893, https://doi.org/10.5194/acp-10-10875-2010, 2010. a
Marticorena, B. and Bergametti, G.: Modeling the atmospheric dust cycle: 1. Design of a soil-derived dust emission scheme, J. Geophys. Res.-Atmos., 100, 16415–16430, https://doi.org/10.1029/95JD00690, 1995. a, b, c, d, e, f, g
Marticorena, B., Bergametti, G., Aumont, B., Callot, Y., N'Doumé, C., and Legrand, M.: Modeling the atmospheric dust cycle: 2. Simulation of Saharan dust sources, J. Geophys. Res.-Atmos., 102, 4387–4404, https://doi.org/10.1029/96JD02964, 1997. a
Menut, L., Siour, G., Bessagnet, B., Couvidat, F., Journet, E., Balkanski, Y., and Desboeufs, K.: Modelling the mineralogical composition and solubility of mineral dust in the Mediterranean area with CHIMERE 2017r4, Geosci. Model Dev., 13, 2051–2071, https://doi.org/10.5194/gmd-13-2051-2020, 2020. a, b
Miltenberger, A. K., Pfahl, S., and Wernli, H.: An online trajectory module (version 1.0) for the nonhydrostatic numerical weather prediction model COSMO, Geosci. Model Dev., 6, 1989–2004, https://doi.org/10.5194/gmd-6-1989-2013, 2013. a
Muñoz Sabater, J. and Copernicus Climate Change Service, S.: ERA5-Land hourly data from 2001 to present, Copernicus, [data set], https://doi.org/10.24381/CDS.E2161BAC, 2019. a, b, c
Muñoz-Sabater, J., Dutra, E., Agustí-Panareda, A., Albergel, C., Arduini, G., Balsamo, G., Boussetta, S., Choulga, M., Harrigan, S., Hersbach, H., Martens, B., Miralles, D. G., Piles, M., Rodríguez-Fernández, N. J., Zsoter, E., Buontempo, C., and Thépaut, J.-N.: ERA5-Land: a state-of-the-art global reanalysis dataset for land applications, Earth Syst. Sci. Data, 13, 4349–4383, https://doi.org/10.5194/essd-13-4349-2021, 2021. a
Nickovic, S., Vukovic, A., Vujadinovic, M., Djurdjevic, V., and Pejanovic, G.: Technical Note: High-resolution mineralogical database of dust-productive soils for atmospheric dust modeling, Atmos. Chem. Phys., 12, 845–855, https://doi.org/10.5194/acp-12-845-2012, 2012. a, b, c, d, e, f, g, h, i, j, k
Perlwitz, J. P., Pérez García-Pando, C., and Miller, R. L.: Predicting the mineral composition of dust aerosols – Part 2: Model evaluation and identification of key processes with observations, Atmos. Chem. Phys., 15, 11629–11652, https://doi.org/10.5194/acp-15-11629-2015, 2015a. a, b, c, d, e, f, g, h, i, j, k, l, m, n
Perlwitz, J. P., Pérez García-Pando, C., and Miller, R. L.: Predicting the mineral composition of dust aerosols – Part 1: Representing key processes, Atmos. Chem. Phys., 15, 11593–11627, https://doi.org/10.5194/acp-15-11593-2015, 2015b. a, b, c, d, e
Pérez García-Pando, C., Miller, R. L., Perlwitz, J. P., Rodríguez, S., and Prospero, J. M.: Predicting the mineral composition of dust aerosols: Insights from elemental composition measured at the Izaña Observatory, Geophys. Res. Lett., 43, 10520–10529, https://doi.org/10.1002/2016GL069873, 2016. a, b, c
Poggio, L., de Sousa, L. M., Batjes, N. H., Heuvelink, G. B. M., Kempen, B., Ribeiro, E., and Rossiter, D.: SoilGrids 2.0: producing soil information for the globe with quantified spatial uncertainty, SOIL, 7, 217–240, https://doi.org/10.5194/soil-7-217-2021, 2021. a, b
Priestley, C. H. B.: Turbulent transfer in the lower atmosphere, http://hdl.handle.net/102.100.100/333442?index=1 (last access: 12 February 2024), 1959. a
Prigent, C., Aires, F., Rossow, W. B., and Robock, A.: Sensitivity of satellite microwave and infrared observations to soil moisture at a global scale: Relationship of satellite observations to in situ soil moisture measurements, J. Geophys. Res.-Atmos., 110, D07110, https://doi.org/10.1029/2004JD005087, 2005. a, b
Prospero, J. M., Ginoux, P., Torres, O., Nicholson, S. E., and Gill, T. E.: Environmental Characterization of Global Sources of Atmospheric Soil Dust Identified with the Nimbus 7 Total Ozone Mapping Spectrometer (toms) Absorbing Aerosol Product, Rev. Geophys., 40, 2-1–2-31, https://doi.org/10.1029/2000RG000095, 2002. a, b
Sayer, A. M., Hsu, N. C., Lee, J., Bettenhausen, C., Kim, W. V., and Smirnov, A.: Satellite Ocean Aerosol Retrieval (SOAR) Algorithm Extension to S-NPP VIIRS as Part of the “Deep Blue” Aerosol Project: NASA VIIRS OCEAN AEROSOL PRODUCTS, J. Geophys. Res.-Atmos., 123, 380–400, https://doi.org/10.1002/2017JD027412, 2018. a
Sayer, A. M., Hsu, N. C., Lee, J., Kim, W. V., and Dutcher, S. T.: Validation, Stability, and Consistency of MODIS Collection 6.1 and VIIRS Version 1 Deep Blue Aerosol Data Over Land, J. Geophys. Res.-Atmos., 124, 4658–4688, https://doi.org/10.1029/2018JD029598, 2019. a, b, c
Scanza, R. A., Mahowald, N., Ghan, S., Zender, C. S., Kok, J. F., Liu, X., Zhang, Y., and Albani, S.: Modeling dust as component minerals in the Community Atmosphere Model: development of framework and impact on radiative forcing, Atmos. Chem. Phys., 15, 537–561, https://doi.org/10.5194/acp-15-537-2015, 2015. a, b, c
Schepanski, K., Tegen, I., Laurent, B., Heinold, B., and Macke, A.: A new Saharan dust source activation frequency map derived from MSG-SEVIRI IR-channels, Geophys. Res. Lett., 34, L18803, https://doi.org/10.1029/2007GL030168, 2007. a, b
Schepanski, K., Tegen, I., and Macke, A.: Saharan dust transport and deposition towards the tropical northern Atlantic, Atmos. Chem. Phys., 9, 1173–1189, https://doi.org/10.5194/acp-9-1173-2009, 2009. a, b, c, d
Schepanski, K., Klüser, L., Heinold, B., and Tegen, I.: Spatial and temporal correlation length as a measure for the stationarity of atmospheric dust aerosol distribution, Atmos. Environ., 122, 10–21, https://doi.org/10.1016/j.atmosenv.2015.09.034, 2015. a
Schepanski, K., Mallet, M., Heinold, B., and Ulrich, M.: North African dust transport toward the western Mediterranean basin: atmospheric controls on dust source activation and transport pathways during June–July 2013, Atmos. Chem. Phys., 16, 14147–14168, https://doi.org/10.5194/acp-16-14147-2016, 2016. a, b
Schepanski, K., Heinold, B., and Tegen, I.: Harmattan, Saharan heat low, and West African monsoon circulation: modulations on the Saharan dust outflow towards the North Atlantic, Atmos. Chem. Phys., 17, 10223–10243, https://doi.org/10.5194/acp-17-10223-2017, 2017. a, b, c, d
Scheuvens, D., Schütz, L., Kandler, K., Ebert, M., and Weinbruch, S.: Bulk composition of northern African dust and its source sediments – A compilation, Earth Sci Rev., 116, 170–194, https://doi.org/10.1016/j.earscirev.2012.08.005, 2013. a, b, c
Schmetz, J., Pili, P., Tjemkes, S., Just, D., Kerkmann, J., Rota, S., and Ratier, A.: An Introduction to Meteosat Second Generation (MSG), B. Am. Meteorol. Soc., 83, 992–992, https://doi.org/10.1175/BAMS-83-7-Schmetz-2, 2002. a
Seinfeld, J. H. and Pandis, S. N.: Atmospheric Chemistry and Physics: From Air Pollution to Climate Change, 3rd Edition, 3 edn., John Wiley & Sons, Hoboken, ISBN 978-1-119-22117-3, https://www.wiley.com/en-us/Atmospheric+Chemistry+and+Physics%3A+From+Air+Pollution+to+Climate+Change%2C+3rd+Edition-p-9781118947401 (last access: 12 February 2024), 2016. a
Sokolik, I. N. and Toon, O. B.: Direct radiative forcing by anthropogenic airborne mineral aerosols, Nature, 381, 681–683, https://doi.org/10.1038/381681a0, 1996. a, b
Solomos, S., Spyrou, C., Barreto, A., Rodríguez, S., González, Y., Neophytou, M. K. A., Mouzourides, P., Bartsotas, N. S., Kalogeri, C., Nickovic, S., Vukovic Vimic, A., Vujadinovic Mandic, M., Pejanovic, G., Cvetkovic, B., Amiridis, V., Sykioti, O., Gkikas, A., and Zerefos, C.: The Development of METAL-WRF Regional Model for the Description of Dust Mineralogy in the Atmosphere, Atmosphere, 14, 1615, https://doi.org/10.3390/atmos14111615, 2023. a, b, c
Tegen, I., Harrison, S. P., Kohfeld, K., Prentice, I. C., Coe, M., and Heimann, M.: Impact of vegetation and preferential source areas on global dust aerosol: Results from a model study, J. Geophys. Res.-Atmos., 107, AAC 14-1–AAC 14-27, https://doi.org/10.1029/2001JD000963, 2002. a, b, c, d
Tegen, I., Heinold, B., Todd, M., Helmert, J., Washington, R., and Dubovik, O.: Modelling soil dust aerosol in the Bodélé depression during the BoDEx campaign, Atmos. Chem. Phys., 6, 4345–4359, https://doi.org/10.5194/acp-6-4345-2006, 2006. a
Tegen, I., Schepanski, K., and Heinold, B.: Comparing two years of Saharan dust source activation obtained by regional modelling and satellite observations, Atmos. Chem. Phys., 13, 2381–2390, https://doi.org/10.5194/acp-13-2381-2013, 2013. a, b
Tesche, M., Gross, S., Ansmann, A., Müller, D., Althausen, D., Freudenthaler, V., and Esselborn, M.: Profiling of Saharan dust and biomass-burning smoke with multiwavelength polarization Raman lidar at Cape Verde, Tellus B, 63, 649–676, https://doi.org/10.1111/j.1600-0889.2011.00548.x, 2011a. a, b, c
Tesche, M., Müller, D., Gross, S., Ansmann, A., Althausen, D., Freudenthaler, V., Weinzierl, B., Veira, A., and Petzold, A.: Optical and microphysical properties of smoke over Cape Verde inferred from multiwavelength lidar measurements, Tellus B, 63, 677, https://doi.org/10.1111/j.1600-0889.2011.00549.x, 2011b. a, b, c
Veselovskii, I., Hu, Q., Goloub, P., Podvin, T., Korenskiy, M., Derimian, Y., Legrand, M., and Castellanos, P.: Variability in lidar-derived particle properties over West Africa due to changes in absorption: towards an understanding, Atmos. Chem. Phys., 20, 6563–6581, https://doi.org/10.5194/acp-20-6563-2020, 2020. a, b, c
Wagner, R., Ajtai, T., Kandler, K., Lieke, K., Linke, C., Müller, T., Schnaiter, M., and Vragel, M.: Complex refractive indices of Saharan dust samples at visible and near UV wavelengths: a laboratory study, Atmos. Chem. Phys., 12, 2491–2512, https://doi.org/10.5194/acp-12-2491-2012, 2012. a, b, c, d
Wolke, R. and Knoth, O.: Implicit–explicit Runge–Kutta methods applied to atmospheric chemistry-transport modelling, Environ. Model. Softw., 15, 711–719, https://doi.org/10.1016/S1364-8152(00)00034-7, 2000. a
Wolke, R., Schröder, W., Schrödner, R., and Renner, E.: Influence of grid resolution and meteorological forcing on simulated European air quality: A sensitivity study with the modeling system COSMO–MUSCAT, Atmos. Environ., 53, 110–130, https://doi.org/10.1016/j.atmosenv.2012.02.085, 2012. a
Wolke, R., Knoth, O., Stoll, J., Heinold, B., Tegen, I., Faust, M., Schepanski, K., and Gómez Maqueo Anaya, S.: COSMO5.05-MUSCAT for “The implementation of dust mineralogy in COSMO5.05-MUSCAT”, Zenodo [code], https://doi.org/10.5281/zenodo.10013819, 2023. a
Zhang, L., Gong, S., Padro, J., and Barrie, L.: A size-segregated particle dry deposition scheme for an atmospheric aerosol module, Atmos. Environ., 35, 549–560, https://doi.org/10.1016/S1352-2310(00)00326-5, 2001. a, b
Zhang, X. L., Wu, G. J., Zhang, C. L., Xu, T. L., and Zhou, Q. Q.: What is the real role of iron oxides in the optical properties of dust aerosols?, Atmos. Chem. Phys., 15, 12159–12177, https://doi.org/10.5194/acp-15-12159-2015, 2015. a
- Abstract
- Introduction
- Methodology
- Results
- Discussion
- Conclusions and implications
- Appendix A: Measured mineral fraction data used for model comparison
- Code availability
- Data availability
- Author contributions
- Competing interests
- Disclaimer
- Acknowledgements
- Financial support
- Review statement
- References