the Creative Commons Attribution 4.0 License.
the Creative Commons Attribution 4.0 License.
 | 06 Feb 2023
Implementation of HONO into the chemistry–climate model CHASER (V4.0): roles in tropospheric chemistry
Phuc Thi Minh Ha
Yugo Kanaya
Fumikazu Taketani
Maria Dolores Andrés Hernández
Benjamin Schreiner
Klaus Pfeilsticker
Kengo Sudo
Nitrous acid (HONO) is an important atmospheric gas given its contribution to the cycles of NOx and HOx, but its role in global atmospheric photochemistry is not fully understood. This study implemented three pathways of HONO formation in the chemistry–climate model CHASER (MIROC-ESM) to explore three physical phenomena: gas-phase kinetic reactions (GRs), direct emission (EM), and heterogeneous reactions on cloud and aerosol particles (HRs). We evaluated the simulations by the atmospheric aircraft-based measurements from EMeRGe-Asia-2018 (Effect of Megacities on the Transport and Transformation of Pollutants on the Regional to Global Scales), ATom-1 (atmospheric tomography), observations from the ship R/V Mirai, EANET (Acid Deposition Monitoring Network in eastern Asia)/EMEP (European Monitoring and Evaluation Programme) ground-based stationary observations, and the OMI (Ozone Monitoring Instrument). We showed that the inclusion of the HONO chemistry in the modelling process reduced the model bias against the measurements for PM2.5, NO/HNO3, NO2, OH, HO2, O3, and CO, especially in the lower troposphere and the North Pacific (NP) region.
We found that the retrieved global abundance of tropospheric HONO was 1.4 TgN. Of the three source pathways, HRs and EM contributed 63 % and 26 % to the net HONO production, respectively. We also observed that reactions on the aerosol surfaces contributed larger amounts of HONO (51 %) than those on the cloud surfaces (12 %). The model exhibited significant negative biases for daytime HONO in the Asian off-the-coast region, compared with the airborne measurements by EMeRGe-Asia-2018, indicating the existence of unknown daytime HONO sources. Strengthening of aerosol uptake of NO2 near the surface and in the middle troposphere, cloud uptake, and direct HONO emission were all potential yet-unknown HONO sources. The most promising daytime source for HONO found in this study was the combination of enhanced aerosol uptake of NO2 and surface-catalysed HNO3 photolysis (maxST+JANO3-B case), which could also remedy the model bias for NO2 and O3 during EMeRGe. We also found that the simulated HONO abundance and its impact on NOx–O3 chemistry were sensitive to the yield of the heterogeneous conversion of NO2 to HONO (vs. HNO3).
Inclusion of HONO reduced global tropospheric NOx (NO + NO2) levels by 20.4 %, thereby weakening the tropospheric oxidizing capacity (OH, O3) occurring for NOx-deficit environments (remote regions and upper altitudes), which in turn increased CH4 lifetime (13 %) and tropospheric CO abundance (8 %). The calculated reduction effect on the global ozone level reduced the model overestimates for tropospheric column ozone against OMI spaceborne observations for a large portion of the North Hemisphere. HRs on the surfaces of cloud particles, which have been neglected in previous modelling studies, were the main drivers of these impacts. This effect was particularly salient for the substantial reductions of levels of OH (40 %–67 %) and O3 (30 %–45 %) in the NP region during summer, given the significant reduction of the NOx level (50 %–95 %). In contrast, HRs on aerosol surfaces in China (Beijing) enhanced OH and O3 winter mean levels by 600 %–1700 % and 10 %–33 %, respectively, with regards to their minima in winter. Furthermore, sensitivity simulations revealed that the heterogeneous formation of HONO from NO2 and heterogenous photolysis of HNO3 coincided in the real atmosphere. Nevertheless, the global effects calculated in the combined case (enhancing aerosol uptakes of NO2 and implementing heterogeneous photolysis of HNO3), which most captured the measured daytime HONO level, still reduced the global tropospheric oxidizing capacity. Overall, our findings suggest that a global model that does not consider HONO heterogeneous mechanisms (especially photochemical heterogeneous formations) may erroneously predict the effect of HONO in remote areas and polluted regions.
- Article
(20486 KB) - Full-text XML
-
Supplement
(3855 KB) - BibTeX
- EndNote


Nitrous acid (HONO) is an important atmospheric gas as it participates in the cycles of nitrogen oxides (NOx = NO + NO2) and radical chemistry (OH, HO2, and RO2) (Kanaya et al., 2007; Ren et al., 2013; Whalley et al., 2018). Researchers have suggested to include the HONO chemistry in atmospheric chemistry models for more accurate simulations of oxidative substances (Jacob, 2000; Li et al., 2011). Despite the empirical evidence indicating that the HONO concentrations in urban environments can reach 14 ppbv at night and can reach several hundred pptv throughout the day (Appel et al., 1990; Febo et al., 1996; Kanaya et al., 2007; Lee et al., 2016; Tan et al., 2017; Whalley et al., 2018), the HONO formation mechanism remains unclear. More specifically, the mechanisms of the HONO daytime sources have recently attracted considerable attention of researchers (Kleffmann et al., 2003; Li et al., 2014; VandenBoer et al., 2013; Xue et al., 2022a, b; Ye et al., 2018).
The only homogeneous reaction known to produce HONO in the troposphere is the direct combination of OH and NO (Reaction R2). Note that the major loss of HONO occurs via photolysis (Reaction R1) in the atmosphere at 300–405 nm:
Moreover, the photolysis of HONO (Reaction R1) has attracted considerable attention in the literature as a critical source of OH radicals in the polluted urban atmosphere (e.g. Calvert et al., 1994; Harris et al., 1982; Jenkin et al., 1988; Platt and Perner, 1980). The OH level at sunrise can be increased by a factor of 5 due to the photolysis of HONO, with the regional daily maximum O3 level increasing by 8 % (Jenkin et al., 1988). Besides the direct loss via photolysis, the reaction of HONO with OH (Reaction R3) may also contribute to the daytime loss of HONO (Burkholder et al., 1992).
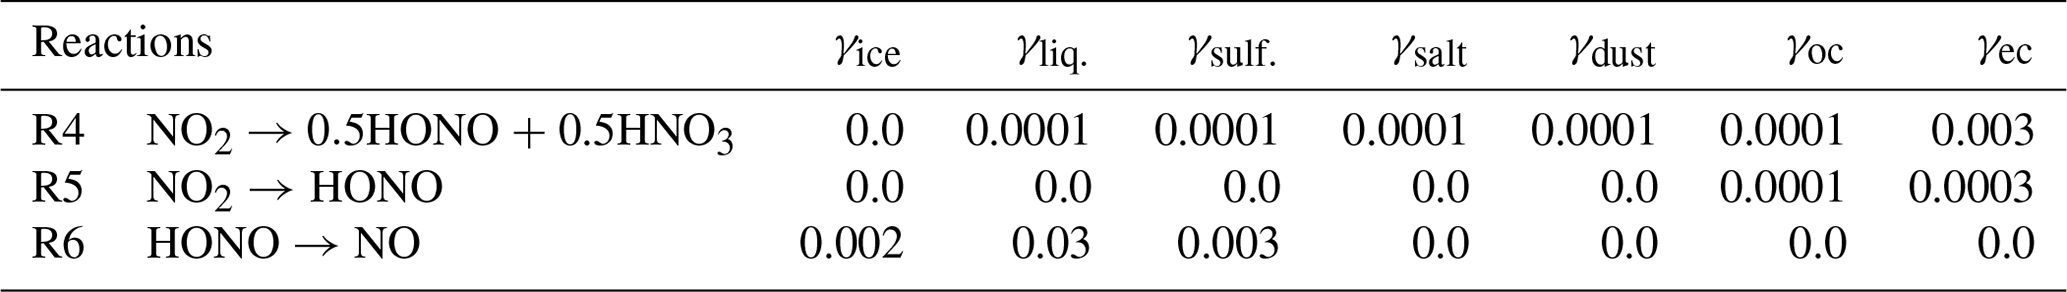
Notably, some nighttime measurements hinted on the heterogeneous sources of HONO from aerosol surfaces. For instance, Harrison and Kitto (1994) have provided evidence about the HONO source from high-concentration episodes of >10 ppbv NO2 for grassland in eastern England (Harrison and Kitto, 1994). Two reactions have been widely suggested to produce HONO on aerosol surfaces: 2NO2 + H2O → HONO + HNO3 and NO + NO2 + H2O → 2HONO. The first process has been proven to be first order with NO2 and H2O in reaction chamber studies (Sakamaki et al., 1983, Jenkin et al., 1988). The second process was evaluated by using laboratory surfaces (Sakamaki et al., 1983, Jenkin et al., 1988) and by using field observations in the presence of high O3 and when NO2 was the dominant form of NOx (Kessler and Platt, 1984). As a result, the second process was proposed as a peculiarly important source of HONO in the urban atmosphere (Ammann et al., 1998; Gerecke et al., 1998). In the past two decades, researchers have investigated the heterogeneous NO2 reactivity on vegetated, aqueous, sea salt, carbonaceous, and soot surfaces (Acker et al., 2001, 2006; Arens et al., 2001; Kleffmann and Wiesen, 2005; Kleffmann et al.,1998; Lammel and Cape, 1996; Lee et al., 2016; Notholt et al., 1992; Reisinger, 2000; Rubio et al., 2002; Stutz et al., 2002). In our model, these two processes are simplified as NO2 → 0.5 HONO + 0.5 HNO3 (Reaction R4) and NO2 → HONO (Reaction R5).
Also, some modelling studies have reported overestimations of HONO over remote areas, indicating the HONO release from or deposition in snow (Chu et al., 2000; Fenter and Rossi, 1996; Kerbrat et al., 2010), partitioning to cloud water (Bongartz et al. 1994; Cape et al., 1992; Harrison and Collins, 1998; Mertes and Wahner, 1995), and deliquescent aerosol surfaces (Harrison and Collins, 1998). The loss process occurs via the reaction HONO + H2O → NO− + H3O+, simplified in our model as HONO → NO (Reaction R6) for surfaces of liquid and aqueous sulfate aerosols.
The natural sources of HONO include plant foliar cuticles or soil biological crust (Hayashi and Noguchi, 2006; Oswald et al., 2013; Porada et al., 2019; Su et al., 2011), with an estimated global total emission of 0.69 Tg yr−1 of HONO–N (Porada et al., 2019). Given the widespread occurrence of nitrite-fertilized soil in natural environment, highly acidic soils are arguably the strong sources of HONO and OH (Su et al., 2011). This potentially important source has been likely overseen by many previous modelling studies at both global and regional scales. Soil emissions could sustain the daytime HONO budget at relatively low aerosol concentrations (Lu et al., 2018). Anthropogenic activities can also directly emit HONO through incomplete combustion, as vehicles, for instance, can yield concentrations as high as 7 ppb (Kirchstetter et al., 1996; Kurtenbach et al., 2001). In regional air quality models, HONO sources from vehicles and vessels are often given at 0.8 %–2.3 % of the NOx emissions level, given the differences between gasoline and diesel vehicle types (e.g. Aumont et al., 2003; Kurtenbach et al., 2001; Li et al., 2011; Zhang et al., 2016).
Many field observational studies reported unknown HONO sources during the day, and various mechanisms have been proposed as efficient daytime HONO formation mechanisms. The photolysis of particle-phase NO <300 nm has been previously suggested as a supplemental NOx source (Romer et al., 2018) and can be the efficient HONO production mechanism during the daytime in an aqueous environment with low pH and the presence of OH scavengers (Benedict et al., 2017a, b; Scharko et al., 2014; Ye et al., 2018). Another study addressed the altitudes below 300 m, where HONO deposited onto the ground surface at night and further proposed to be a significant reservoir for HONO during the day (VandenBoer et al., 2013). Such a parameter for ground surfaces in a global model is somewhat uncertain. Moreover, the HONO source from ground surfaces may only affect the lower boundary layer while insignificantly contributing to the tropospheric HONO budget (Ye et al., 2018; Zhang et al., 2009). Furthermore, the particle-phase NO photolysis can occur on both ground and aerosol surfaces (HNO3 + hν → HONO) with a 2-orders-of-magnitude-faster rate than its rate in the gas phase (Lee et al., 2016; Lu et al., 2018). Photolysis of ortho-nitrophenols, photoexcited NO2 gas reaction (HO2×H2O + NO2 → HONO), and photosensitized heterogeneous conversion of NO2 on ground surfaces are all potential daytime HONO sources (Jorba et al., 2012; Lee et al., 2016; Li et al., 2014), yet the mechanisms are complicated, and their efficiency is merely evaluated for ground-based observation.
Many scholars have scrupulously addressed the effects of HONO in polluted regions as well. For instance, HONO-induced enhancements in winter daytime HOx (up to >200 % for OH) and O3 (6 %–12 %) over urban sites in China have been reported (Li et al., 2011; Lu et al., 2018; Zhang et al., 2016). A box modelling study analysed the detailed budget of HONO in London and found that HONO chemistry increased OH by 20 % during the day (Lee et al., 2016). A global modelling study found increments for OH and O3 across the globe and throughout the troposphere, with a maximum of 30 ppb O3 in eastern Asia and slight NO2 increment, although the results were evaluated with only ground-based data (Jorba et al., 2012). However, enhanced O3 levels in response to additional OH production from the HONO photolysis only occur in high-NOx regions, although they can be decreased in some areas under low-NOx conditions (Jorba et al., 2012). At the same time, another 3D modelling study used a constant occurrence ratio for x of 0.02 globally and reported similar patterns for O3 changes regarding HONO chemistry (Elshorbany et al., 2012). The NOx reduction effects that follow the NO2 conversion are suggested to be more critical over the oceans than over continental regions, with up to 20 % NOx reduction and 5 %–20 % HNO3 enhancement over ocean regions of the lower troposphere (Martin et al., 2003).
As H2O is required for the uptake of NO2 on surfaces, wet surfaces have been broadly recommended as favoured surfaces for NO2 uptake. Therefore, cloud droplets can be an important surface for heterogeneous reactions of NO2 because they are ubiquitous in the troposphere. Heterogeneous reactions by clouds can have a similar impact to aerosol particles on tropospheric O3 and OH levels (Holmes et al., 2019). However, this aspect has been overlooked many times in previous studies, leading to potentially underestimating (or even dismissing) the potential effects over remote environments.
This study introduced HONO photochemical processes into the global atmospheric chemistry model CHASER V4.0, which did not consider HONO chemistry before. The standard model configuration used basic mechanisms of HONO chemistry, while various sensitivity cases implementing other potential HONO sources were also conducted to force simulation into an agreement with the observed HONO values. The main idea for the HONO inclusion was to elaborate the model simulation for tropospheric oxidative substances while focusing on aerosol and cloud processes. The model included the detailed online calculation of O3–HOx–NOx–CH4–CO coupling and oxidation of non-methane hydrocarbons (NMHCs) (Sudo et al., 2002) and heterogeneous processes for N2O5, HO2, and RO2 radicals (Ha et al., 2021; Sekiya and Sudo, 2014; Sekiya et al., 2018; Sudo and Akimoto, 2007). In Sect. 2, we describe the approach, including the model description and configuration. In Sect. 3.1, simulated daytime HONO was verified with aircraft measurements for an Asian off-the-coast region. In addition, our model was evaluated by the available observations for atmospheric species, including aircraft, ship, and ground station observations, particularly addressing the roles of the HRs. Section 3.2 presents the model results for HONO distributions, verification for global effects on tropospheric column ozone (TCO) with the Ozone Monitoring Instrument (OMI) spaceborne observations, global HONO impacts including different effects from each pathway, and a discussion on the uncertainty of the calculated effects. Finally, Sect. 4 effectively represents the summary and concluding remarks.
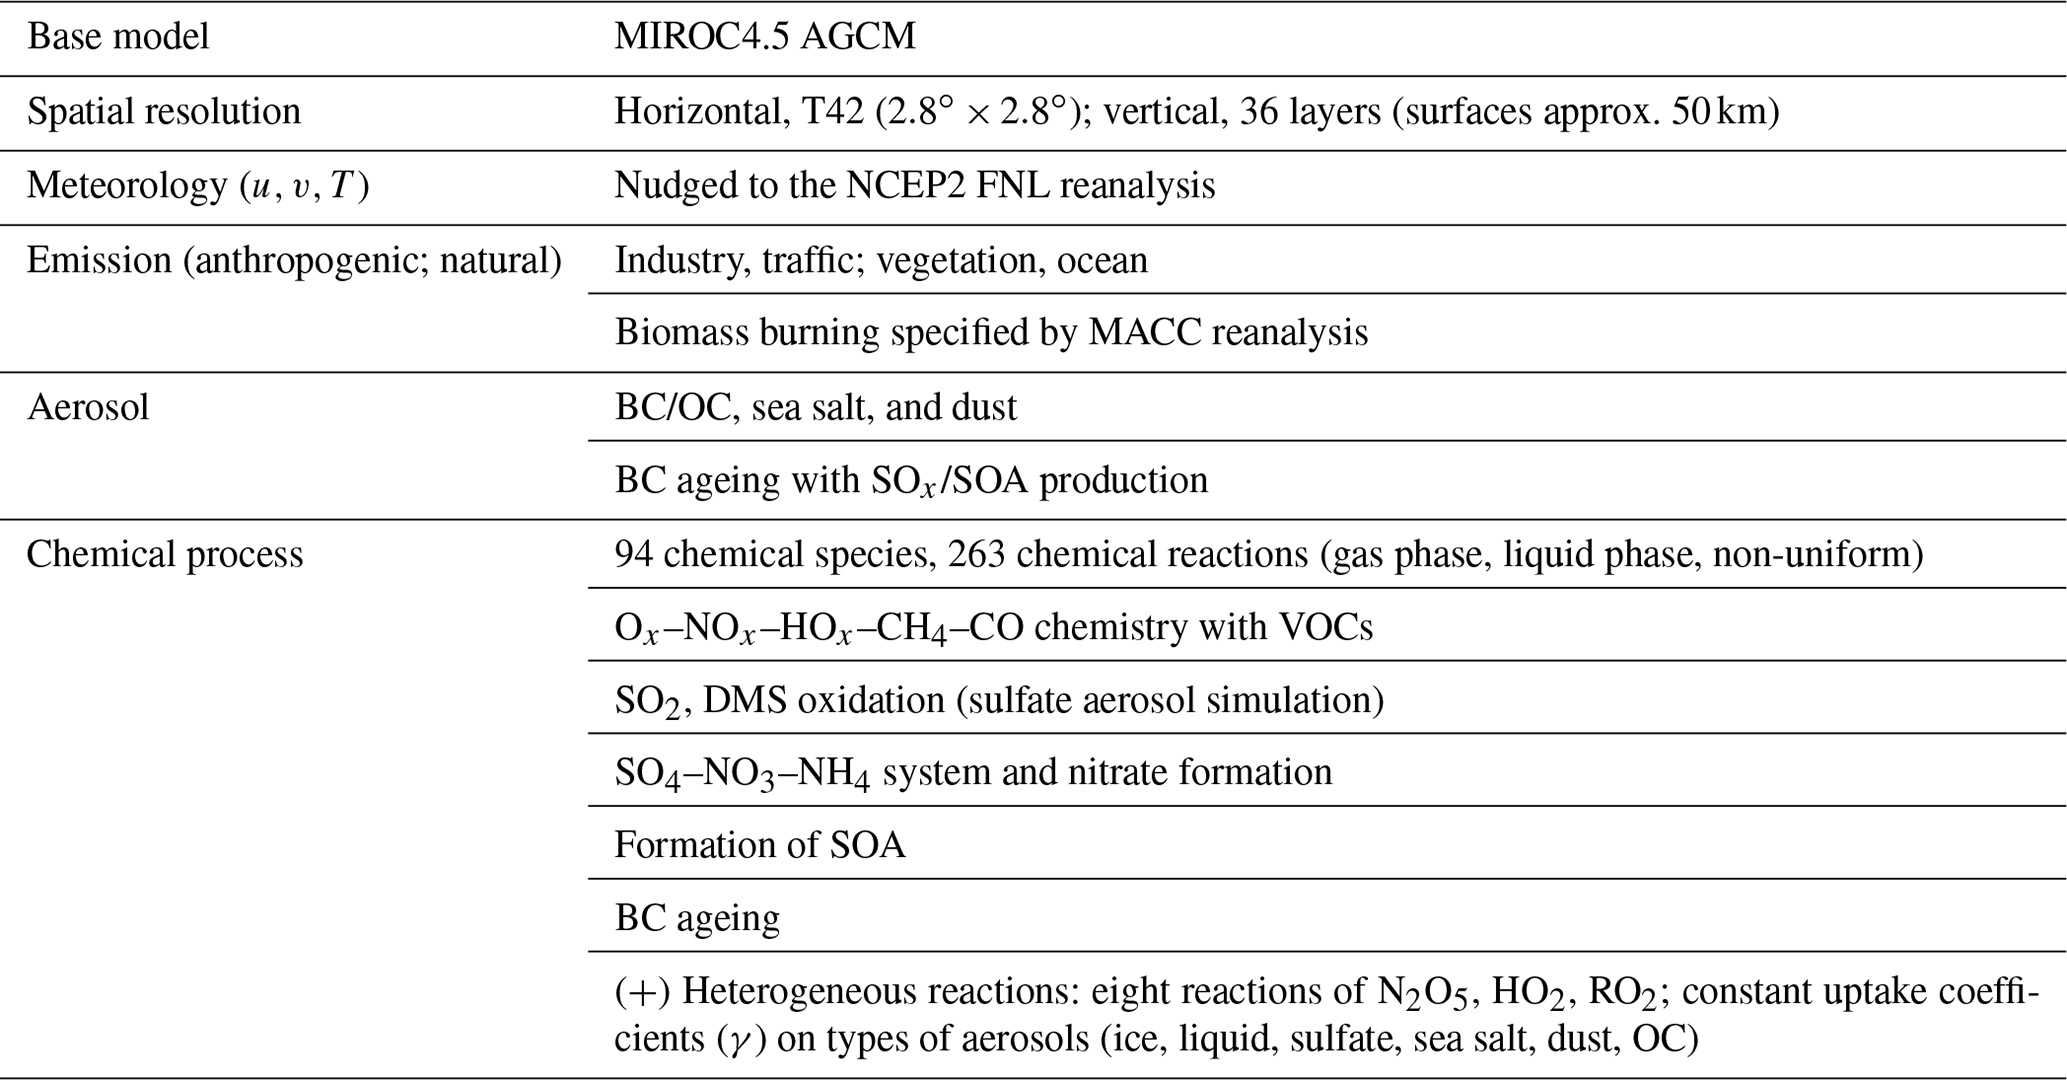
Table 1Computation packages in the chemistry–climate model CHASER.
2.1 Global chemistry model
This study applied the global chemistry model CHASER (MIROC-ESM) (Sudo et al., 2002, Suda and Akimoto, 2007; Watanabe et al., 2011), which considered the detailed photochemistry in the troposphere and stratosphere. The chemistry component of the model, based on CHASER V4.0, retrieved the concentrations of 94 total species and 258 chemical reactions (57 photolytic, 180 kinetic, and 21 heterogeneous reactions on tropospheric aerosol and cloud surfaces and polar stratospheric clouds) (Table 1), excluding the new HONO chemistry implemented in this study. We used the HTAP-II (Hemispheric Transport of Air Pollution) emission inventory for 2008 (https://edgar.jrc.ec.europa.eu/dataset_htap_v2, last access: 16 November 2021) for O3 and aerosol precursors (NOx, CO, VOCs, SO2), with biomass burning emissions derived from the MACC (Monitoring Atmospheric Composition and Climate) reanalysis system (https://gmao.gsfc.nasa.gov/reanalysis/MERRA/ceop.php, last access: 16 November 2021). The details about CHASER could be found in the earlier studies (Ha et al., 2021; Morgenstern et al., 2017; Sekiya et al., 2018). In this study, the newly added HONO system included three pathways of HONO formation and interactions: (1) gas-phase formation via the NO + OH Reaction (R2), the photolysis of HONO Reaction (R1), and Reaction (R3) of HONO with OH, hereafter denoted as GRs; (2) HONO direct emissions estimated from anthropogenic- and soil-NOx emissions (hereafter denoted as EM); and (3) the HONO conversion from NO2 (Reactions R4, R5) and its loss on liquid/ice surfaces and aqueous aerosols (Reaction R6), hereafter denoted as HRs.
The investigation on heterogeneous photolysis of HNO3 (HNO3 + hν → HONO), which was suggested as an efficient HONO source at daytime (Lee et al., 2016; Zhou et al., 2011), is presented in chap. 3 as sensitivity cases in the effort of making the simulation for daytime HONO compatible with measurement. This photolysis was simply accessed in the model via its rate using a multiplication factor to the gas-phase HNO3 photolysis (HNO3 + hν → OH + NO2) (see Sect. 3.1.2). Another proposed daytime HONO source from the light-dependent gas-phase reaction of HO2 and NO2 (HO2×H2O + NO2 → HONO) (Li et al., 2014) was not investigated in this study. However, a simple gas-phase reaction of HO2 and NO2 (HO2 + NO2 → HONO + O2) (Burkholder et al., 2015) was introduced, but it did not successfully preserve the total reactive nitrogen chemistry (NOy); hence, it was omitted in this study.
2.2 Experimental setup
The Global Emissions Initiative (GEIA) inventory (http://www.geiacenter.org/, last access: 16 June 2021) was applied to quantify the soil NOx emissions (6 TgN yr−1) and anthropogenic NOx emissions (45 TgN yr−1). Since this broadly applied inventory was not currently available for HONO, this study tentatively imposed the HONO direct emissions based on the above NOx emission inventory through a constant factor of 0.1 (10 % of NOx emissions). This assumption (soils + combustion) led to a global HONO soil-emission estimate of about 0.6 TgN yr−1, equivalent to the estimate from Porada et al. (2019), and it suggested that the anthropogenic emission for HONO is 4.5 TgN yr−1. For HONO from exhaust sources, this factor (10 %) was considerably higher than the previously reported estimate of 0.7 %, derived for combustion (Xue et al., 2022b), or 0.8 %–2.3 % for on-road vehicles (Aumont et al., 2003; Kurtenbach et al., 2001; Li et al., 2011) and 3 %–6 % for commercial aircraft (Lee et al., 2011). However, this factor of HONO emission (10 % NOx emission) intended to show the apparent potential impacts of direct HONO sources on the tropospheric chemistry.
The photolysis reaction HONO + hν → OH + NO (300<λ<405 nm) (Reaction R1) was employed with the wavelength-dependent cross sections following the recent study of Burkholder et al. (2015).
The kinetic homogeneous reactions NO + OH + M → HONO + M (Reaction R2) and HONO + OH → NO2 + H2O (Reaction R3) were applied with the low- and high-pressure-limit rate constants, which were temperature dependent, as suggested in the aforementioned study.
In CHASER, the heterogeneous chemistry of interest was simplified as a first-order chemical loss in the aerosol phase for a species transferred from the gas phase. The rate of this pseudo-loss was combined, and the first-order-loss rate for heterogeneous processes was calculated by using the Schwartz theory (Jacob, 2000; Schwartz, 1986), being simply treated with the mass transfer limitations in addition to the reactive uptake coefficient (γ) (Ha et al., 2021). Note that only surface reactions were considered in CHASER, and there was no bulk particle reaction for the HR scheme.
The uptake coefficient parameter (γ) is defined as the net probability that a molecule X undergoing a gas-kinetic collision with a surface is taken up onto the surface. An average uptake coefficient for NO2 (Reaction R4) of 10−4 (10−6–10−3) for the conversion of aqueous aerosols and clouds has been previously suggested (Jacob, 2000; Kleffmann et al., 1998; Li et al., 2018; Lu et al., 2018). The NO2 uptake by organic carbon aerosols has been reported to have similar coefficient values (Salgado-Muñoz and Rossi, 2002). The uptake coefficient for fresh black carbon is highly efficient and equals (Ammann et al., 1998; Li et al., 2018). The parameters for the uptake coefficients of Reaction (R4) applied in the CHASER model are shown in Table 2.
As previous studies have noted, the fast initial uptake of NO2 is observed on soot with an uptake coefficient in the range of 10−1–10−4 (Ammann et al., 1998). However, it rapidly decreased to ∼ 10−7 over 5 min (Kleffmann et al., 1999) and to for 5 d aged surfaces (Saathoff et al., 2001). In organic soot, γ is in the range of 10−4–10−6 (Al-Abadleh et al., 2000; Arens et al., 2001; Salgado-Muñoz et al., 2002). In CHASER, the NO2 conversion on organic carbon and soot (Reaction R5) was tentatively applied with uptake coefficients of 10−4 and , respectively, which also falls within the previously suggested range (10−6–10−3) considering the higher efficiency for soot (Table 2).
Table 2Uptake coefficients for heterogeneous formation and loss of HONO.
Also, previous laboratory experiments have introduced a wide range for the uptake coefficient of HONO by Reaction (R6), that is, at 178 K to at 200 K for the ice surface (Fenter and Rossi, 1996; Chu et al., 2000) and – at 278 K (Mertes and Wahner, 1995) or 0.03–0.15 at 297 K (Bongartz et al. 1994) for liquid water surfaces. In the aerosol flow reactor experiment on deliquescent sodium chloride and ammonium sulfate droplets at 279 K, the HONO reactive uptake coefficient of 0.0028 for 85 % relative humidity has been previously obtained (Harrison and Collins, 1998). In CHASER, the aforementioned reference values for HONO uptake on ice, liquid clouds, and aqueous sulfate were simply averaged to be used as a heterogeneous loss of HONO (Reaction R6) in the atmosphere (Table 2: last row).
2.3 Simulations
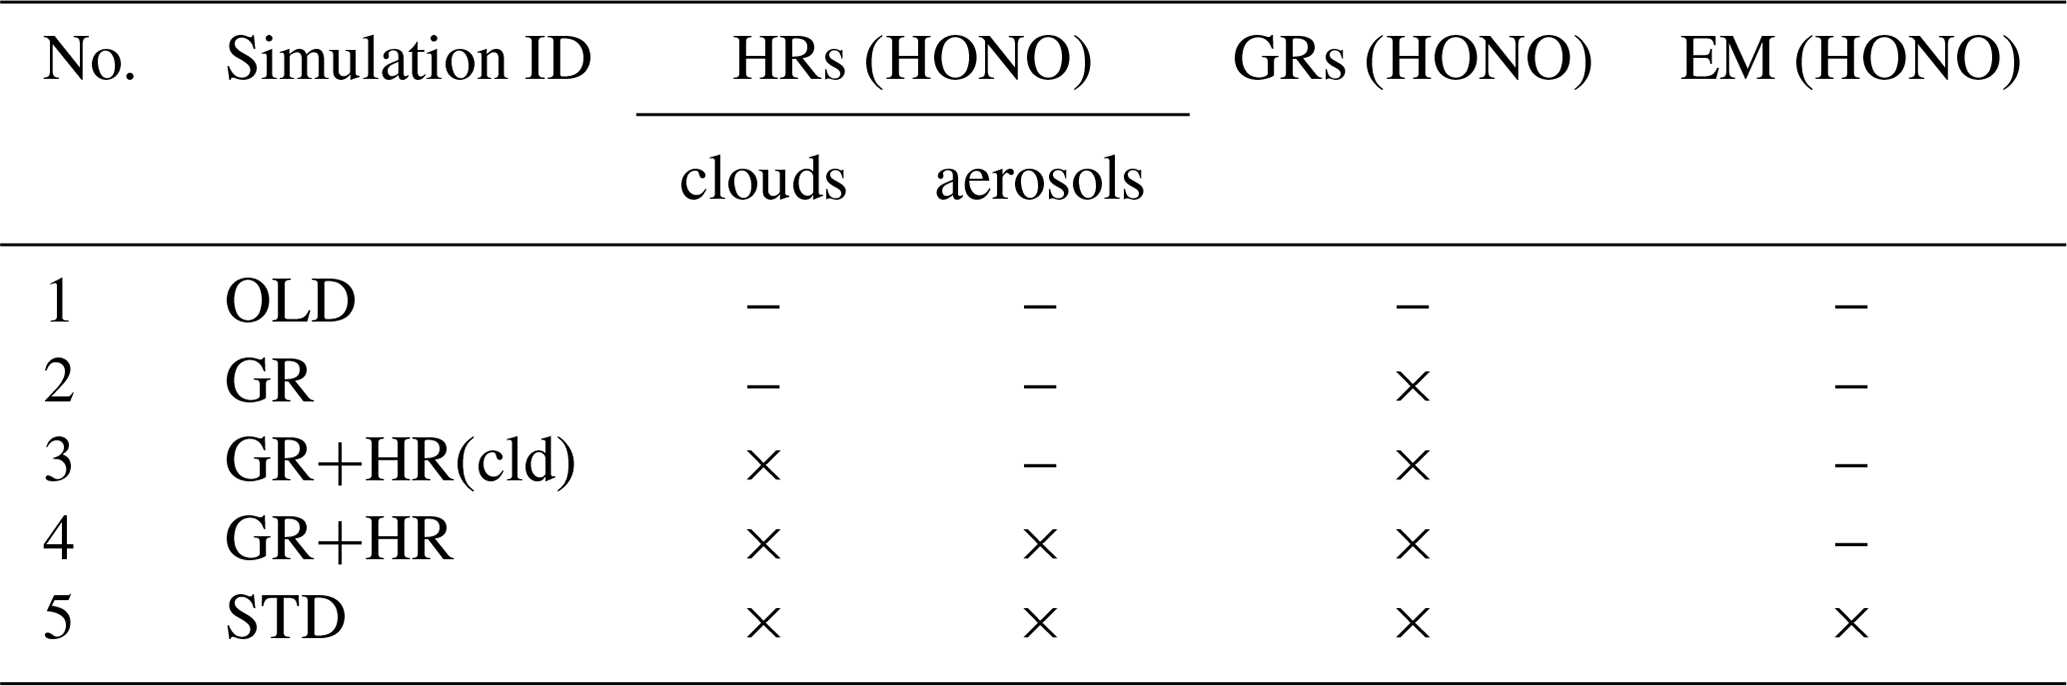
In this study, two main simulations, OLD and STD, and three sensitivity simulations (Table 3, no. 2–4) were conducted to isolate the distinct impacts of each pathway of the HONO chemistry for different surface types considered in the model (Table 3). The OLD simulation was run with the base model configuration without any HONO species and HONO-related processes. The heterogeneous scheme in the OLD simulation contained eight reactions on N2O5 (N2O5 → 2HNO3), HO2 (HO2 → 0.5 H2O2 + 0.5 O2), and RO2 (RO2 → inert products) (Ha et al., 2021). The control case (STD) considered all three types of HONO sources: direct emissions (EMs), gas-phase reactions (GRs), and heterogeneous reactions (HRs). To quantify the effects of each mechanism using Eq. (1), two sensitivity cases (GR, GR+HR) intentionally implemented GRs (Reactions R1, R2, R3) into the OLD case and HRs (Reactions R1, R2, R3, R4, R5, R6) into the GR case, respectively. GR+HR(cld) was another sensitive case like GR+HR, with HRs on aerosols excluded to investigate the different effects of clouds and aerosols. Equation (1) determines the effects of each mechanism on atmospheric species i (i = OH, O3, NOx, CO) by concentration differences of i in two relevant cases being compared to that in the OLD case.
where Case1i and Case2i are the concentrations of i in two separate cases: GR and OLD cases for the pure effects by the gaseous mechanism, GR+HR and GR cases for the effects of heterogeneous mechanisms, STD and GR+HR cases for the HONO emissions effects, and GR+HR(cld) and GR cases for the effects of heterogeneous reactions that exclusively occur on ice and cloud particles.
Table 4Lists of the datasets used in this study for verification. Related simulations with their original model time step are interpolated to the comparing time step.
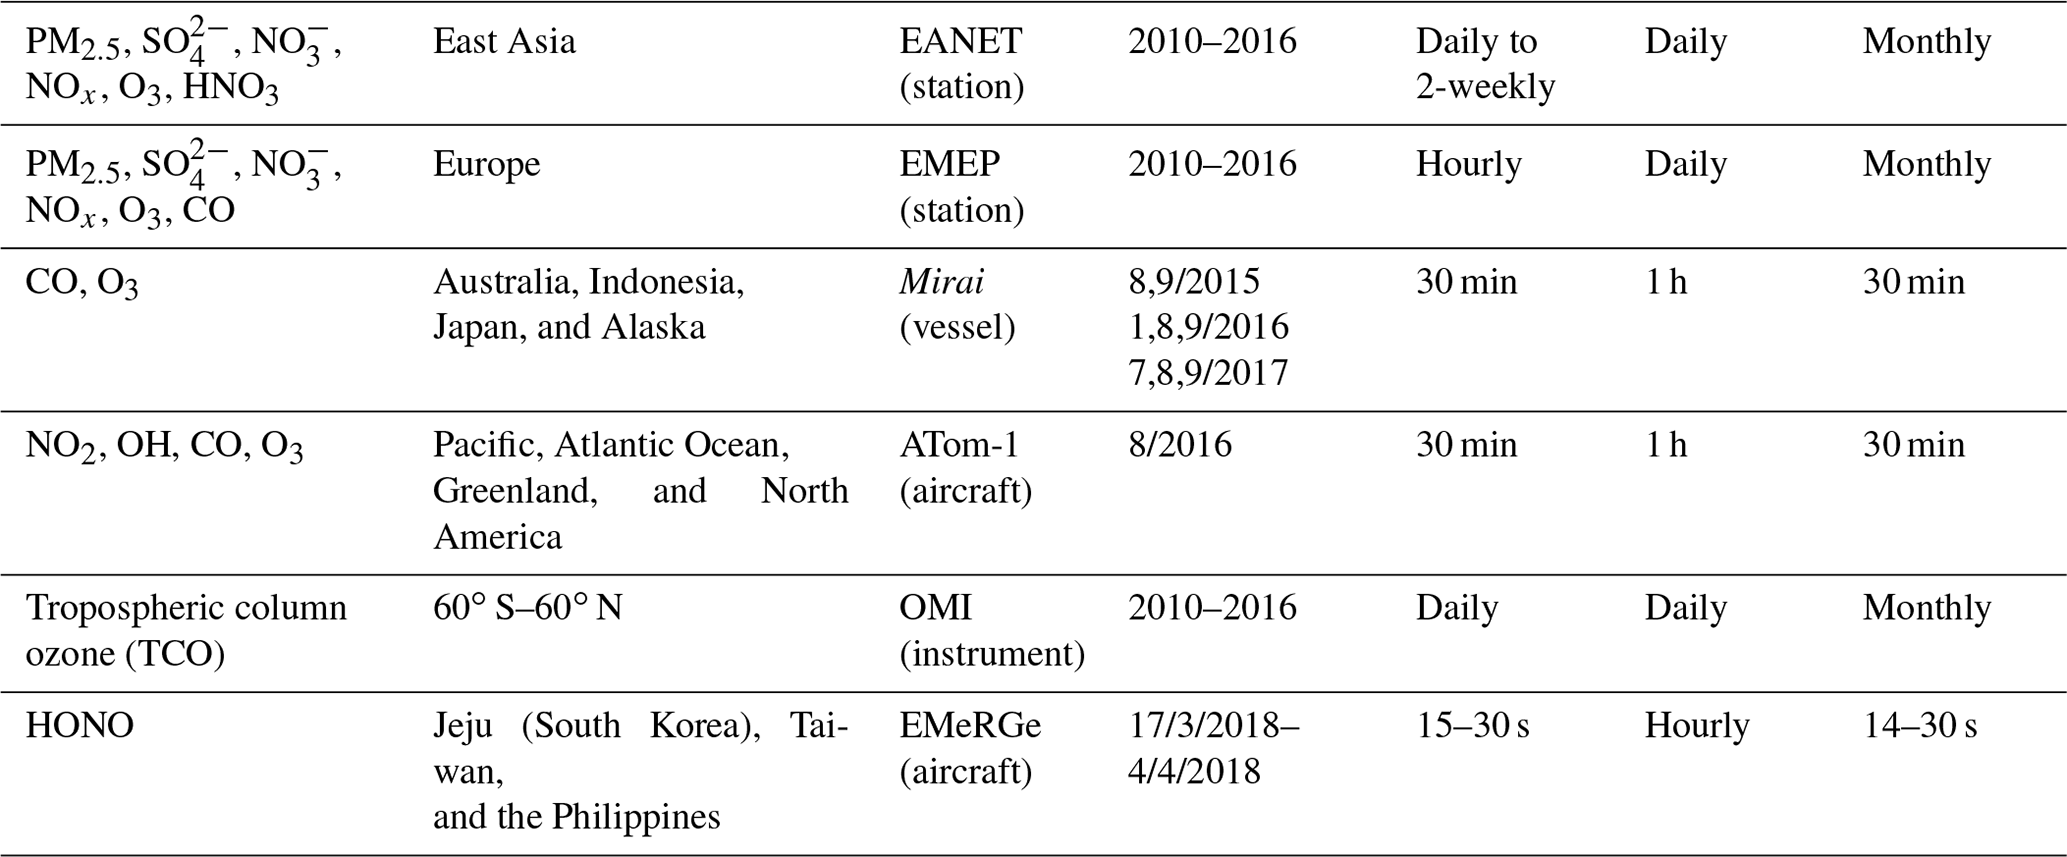

Figure 1Location of measurements. (a) EANET stations for NOx and O3 and (b) for PM2.5, SO, NO, and HNO3, (c) EMEP stations, and (d) ATom-1 cruising altitudes are plotted. In panels (a) and (b), each number describes the station name (see Table S1 in the Supplement). In panel (d), the numbers show the flight tracks.
2.4 Observation data for model evaluation
We evaluated the OLD, STD, and sensitivity simulations with aircraft, ship-based, ground-based, and satellite measurements. The observational information and locations of the ship/aircraft tracks and surface sites for the observations used in this study are summarized in Table 4, Figs. 1 and 6, and Fig. S6 in the Supplement.
Daytime HONO concentrations were analysed by using the DLR HALO aircraft (Deutsches Zentrum für Luft- und Raumfahrt High Altitude and LOng Range Research Aircraft) measurements made during the EMeRGe-Asia (Effect of Megacities on the Transport and Transformation of Pollutants on the Regional to Global Scales) campaign in March and April 2018, over an off-the-coast region between South Korea (including Jeju Island as part of the domain), Taiwan, and the Philippines (http://www.iup.uni-bremen.de/emerge/home/, last access: 16 November 2021). The measuring time falls in the range of 00:00 to 09:00 UTC, around 08:00 to 17:00 in local time (UTC+8). The payload during the EMeRGe-Asia mission could be retrieved from the similar mission EMeRGe-Europe (Andrés Hernández et al., 2021). Verification with EMeRGe data helps explore the daytime HONO chemistry mechanisms in the free troposphere.
To verify the vertical profiles of atmospheric species for the oceanic tropospheric environment, ATom-1 aircraft measurements (https://espo.nasa.gov/atom/content/ATom, last access: 16 June 2021) for NO2, OH, CO, and O3 during August 2018 were employed. We also utilized the ship-based observational data from the R/V Mirai cruise (http://www.jamstec.go.jp/e/about/equipment/ships/mirai.html, last access: 16 June 2021) undertaken by Japan Agency for Marine-Earth Science and Technology (JAMSTEC) for surface CO and O3 in summers 2015–2017 along the Japan–Alaska routes. The monthly data from 45 stations during 2010–2016 were used to verify aerosol surface concentrations (sulfate, nitrate) and trace gases (HNO3, NOx, O3) in the Acid Deposition Monitoring Network in eastern Asia (EANET: https://www.eanet.asia/, last access: 16 June 2021). We also used the European Monitoring and Evaluation Programme (EMEP: https://www.emep.int/, last access: 16 June 2021) data, which compiles observations over 245 European stations. To this end, simulated tropospheric column ozone was also evaluated by using tropospheric column O3 (TCO) derived from the OMI (Ozone Monitoring Instrument) spaceborne observations (https://daac.gsfc.nasa.gov/, last access: 16 June 2021). For these evaluations and verifications, the model data were compiled in the monthly or hourly time step, interpolated corresponding to the observed data time step and coordinates.
A model bias for each species was calculated as the difference between the simulated and observed concentrations, as shown in Eq. (2), where N is the total number of data points used in the calculation.
3.1 Verification and validation of model simulations for cloud fraction, surface area density, atmospheric species, and effects on HONO mechanisms
3.1.1 Cloud fraction and surface area density for cloud and aerosols
In this study, besides NO2 conversion onto clouds and aqueous particles (Reaction R4), the losses of HONO onto the ice and liquid clouds (Reaction R6) are also included. Therefore, for accurate simulations of HRs, we need to examine the cloud distribution. The CHASER model applied the common cloud maximum–random overlap assumptions (MRAN) in the radiation and cloud microphysics schemes as other general circulation models to estimate the distribution of the cloud fraction. The verification by using the satellite observation data ISCCP D2, CALIPSO-GOCCP, and reanalysis data JRA55 generally revealed good correlation, whereas notable (10 %–20 %) underestimation for the entire troposphere was yet salient. During June–July–August (JJA), CHASER's cloud fraction was likely overestimated for the lower troposphere of the North Pacific (NP) region (10 %–20 % compared to JRA55 reanalysis data). This finding indicated that thorough scrutiny of any impacts in this region is highly required (see the discussion in Sect. 3.2). Note that more detailed information for cloud verification for CHASER has been provided by Ha et al. (2021).
The heterogeneous processes by clouds and aerosol particles were parameterized by using surface area density (SAD) estimations alongside the cloud fraction and aerosol concentration. During DJF, the simulated total SAD was attributed to all types of aerosols. However, for JJA, liquid clouds and sulfate aerosols were the principal SAD sources. This was a peculiarly visible pattern for the northern polar and mid-latitude maritime regions. The performance for aerosol SAD in our model was in line with the earlier report by Thornton et al. (2008), except for sea salt density, which was very low in our model (up to 2 µm2 cm−3) compared to their work (up to 75 µm2 cm−3). This disagreement might be ascribed to the two models' different size distributions for sea salt. The calculated SAD for the liquid cloud was 2 orders of magnitude higher than SAD for ice cloud and total aerosols. Liquid cloud SAD maximized at ∼800 hPa in the tropical convective systems and over the mid-latitude storm tracks, reaching ∼50 000 µm2 cm−3 at the surface of the North Pacific region in JJA. Sulfate aerosols dominated above 600 hPa for the Northern Hemisphere (∼ 20 µm2 cm−3) among the total aerosol surface area, followed by organic carbons and soil dust (∼10 µm2 cm−3 in JJA). At the surface layer, sulfate aerosols were prevalent in DJF for the Chinese region (>1000 µm2 cm−3), the northeastern US (∼500 µm2 cm−3), and North Pacific region in JJA (∼250 µm2 cm−3). SAD for soil dust dominated in desert regions, with annual average values >100 µm2 cm−3. Organic carbon (OC) was dominant in winter over biomass burning regions such as China (up to 1000 µm2 cm−3) and South Africa (up to 800 µm2 cm−3). For the Chinese region, SAD for black carbon (BC) could reach 600 µm2 cm−3 in DJF and 75 µm2 cm−3 in India. The total-aerosol SAD for the northern high-latitude and mid-latitude oceans was ∼75 µm2 cm−3, consistent with the estimation by Thornton et al. (2008).
3.1.2 Daytime concentrations of HONO and other atmospheric species
This section evaluated CHASER-based HONO estimates using the HONO measurements collected during the EMeRGe campaign off the coast of eastern Asia in spring 2018 (Andrés Hernández et al., 2021). This is the first global HONO modelling work using EMeRGe as the validation source. The HONO measurements in the free troposphere could provide essential information on the underlying gas-phase and heterogeneous HONO formation mechanisms as most current HONO measurements were conducted in the surface air. The daytime HONO concentration was retrieved from the aircraft-borne limb measurements using the HALO mini-DOAS (differential optical absorption spectroscopy) instrument, in which the absorbed UV light (310–440 nm) by HONO was detected (Hüneke et al., 2017). The mini-DOAS's measurement method relies on near-UV/VIS/IR skylight spectroscopy in nadir and limb geometry. Data evaluation consists of three steps: (1) retrieval of slant column densities (SCDs) of trace gases by the DOAS method (Platt and Stutz, 2008), (2) forward radiative transfer modelling for each measurement using McArtim (Deutschmann et al., 2011), and (3) retrieval of concentration through a new scaling method for UV/VIS data (Stutz et al., 2017; Hüneke et al., 2017; Werner et al., 2017; Kluge et al., 2020; Rotermund et al., 2021).

Figure 2Vertical profiles of (a) HONO, (b) NO2, (c) CO, and (d) O3 measured in the EMeRGe campaign and calculated in the sensitivity runs. Diamonds (for OBS, STD, OLD), batches (for maxST, JANO3-B, JANO3-C cases), and filled circles (for maxST+JANO3-B, maxST+JANO3-C cases) show mean vertical concentrations, and the corresponding boxes indicate 25th–75th percentile value ranges. In panel (a), whiskers with two caps show minimum and maximum HONO levels; all sensitivity runs are shown except OLD (the case without HONO chemistry). In all plots, black is for observation (OBS), colours are for simulations: STD (red), OLD (grey), maxST (magenta), JANO3-B (cyan), JANO3-C (orange), maxST+JANO3-B (filled cyan), and maxST+JANO3-C (filled orange).
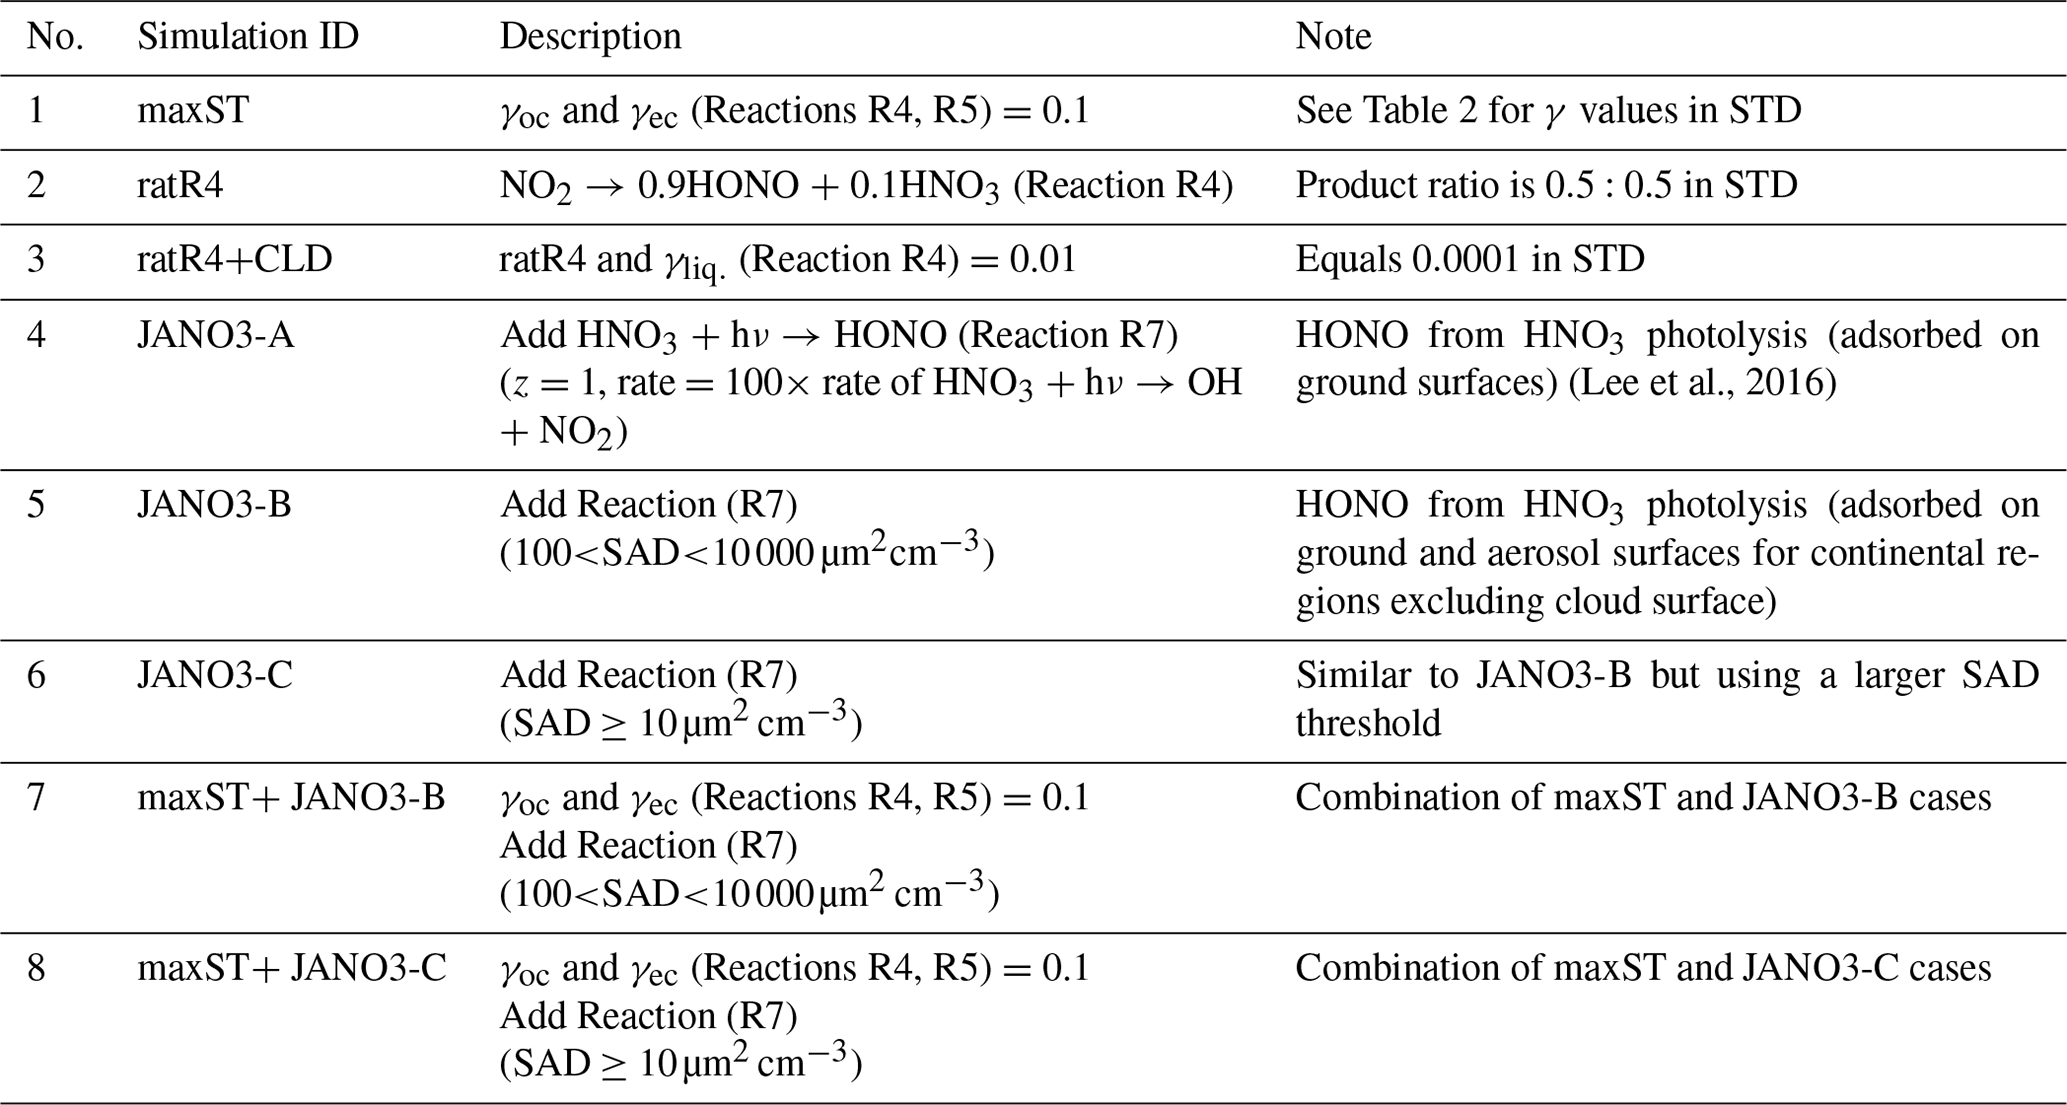
Additional sensitivity runs were conducted to explore potential HONO sources during the daytime (Table 5). The ratR4+CLD case is run in an attempt to produce more HONO from heterogeneous sources by altering the HONO:HNO3 yield ratio in Reaction (R4) to 0.9:0.1, and γliq. increased 100-fold (10−4 → 10−2). The main idea here is to evaluate whether the missing HONO source was sensitive to cloud uptake in this region or not. The maxST case maximized the uptake coefficients (γ values) of NO2 on organic and black carbons to 0.1 (Reactions R4, R5), to estimate the separate role of soot uptake under daytime conditions (George et al., 2005; Monge et al., 2010; Ndour et al., 2008), which could achieve an unrealistically high γ value of 10−1 (Ammann et al., 1998; Kalberer et al., 1999). In three other runs (JANO3-A, JANO3-B, JANO3-C), the photolysis of aerosol nitrate/adsorbed HNO3 on the ground and other surfaces (NO/HNO3) was examined, simply as HNO3 + hν → HONO (Reaction R7). These heterogeneous photolyses of HNO3 were previously proposed as potential HONO sources during the day (Lee et al., 2016; Scharko et al., 2014; Zhou et al., 2011). Because aerosol nitrate and aqueous surfaces are ubiquitous in the atmosphere, the photolysis (Reaction R7) was simply set for the gaseous HNO3 species to occur in particular model spatial grids exposing ground surfaces and sufficient surface area density for aerosols and clouds. The photolysis (Reaction R7) was taken at a rate 2 orders of magnitude faster than the gas-phase photolysis rate of HNO3 (HNO3 + hν → OH + NO2) (Zhou et al., 2011) and presumably yields 100 % HONO to access the maximum effects by this photolysis (Lee et al., 2016). This setting allows Reaction (R7) not only to occur at the surfaces of particles but also in the gas and bulk phases. However, in this test, Reaction (R7) generally refers to surface-catalysed photolysis or heterogeneous photolysis of HNO3. The JANO3-A case investigated the photolysis of adsorbed HNO3 on ground surfaces by implementing Reaction (R7) for the first vertical layer (z=1). The JANO3-B case explored photolysis of nitrate particles and adsorbed HNO3 gas on both ground surfaces and aerosol surfaces, applying Reaction (R7) for model grid cells with the SAD of 10−6–10−4 cm2 cm−3 (100 to 10 000 µm2 cm−3) to use the 10−4 cm2 cm−3 threshold to exclude cloud surfaces (Sect. 3.1.1). The JANO3-C case examined Reaction (R7) for regions present of all particles with SAD cm2 cm−3 (10 µm2 cm3). The SAD of 10−6 and 10−7 cm2 cm−3 was supposed to be the threshold for continental aerosols. The specifications of HONO chemistry in the maxST case and JANO3-B/JANO3-C cases were also combined in two additional cases (maxST+JANO3-B and maxST+JANO3-C, respectively), with the expectation that the opposite effects of the separate cases on NO2–O3–CO chemistry could compensate for each other in the combined cases; this is discussed in the following. Other tests examined the possible HONO sources from aviation crafts (AIRC), amplified emissions (EM×8), and amplified homogeneous HONO formation Reaction (R2) (GR×8), descriptions of which were listed in Table S3 in the Supplement.
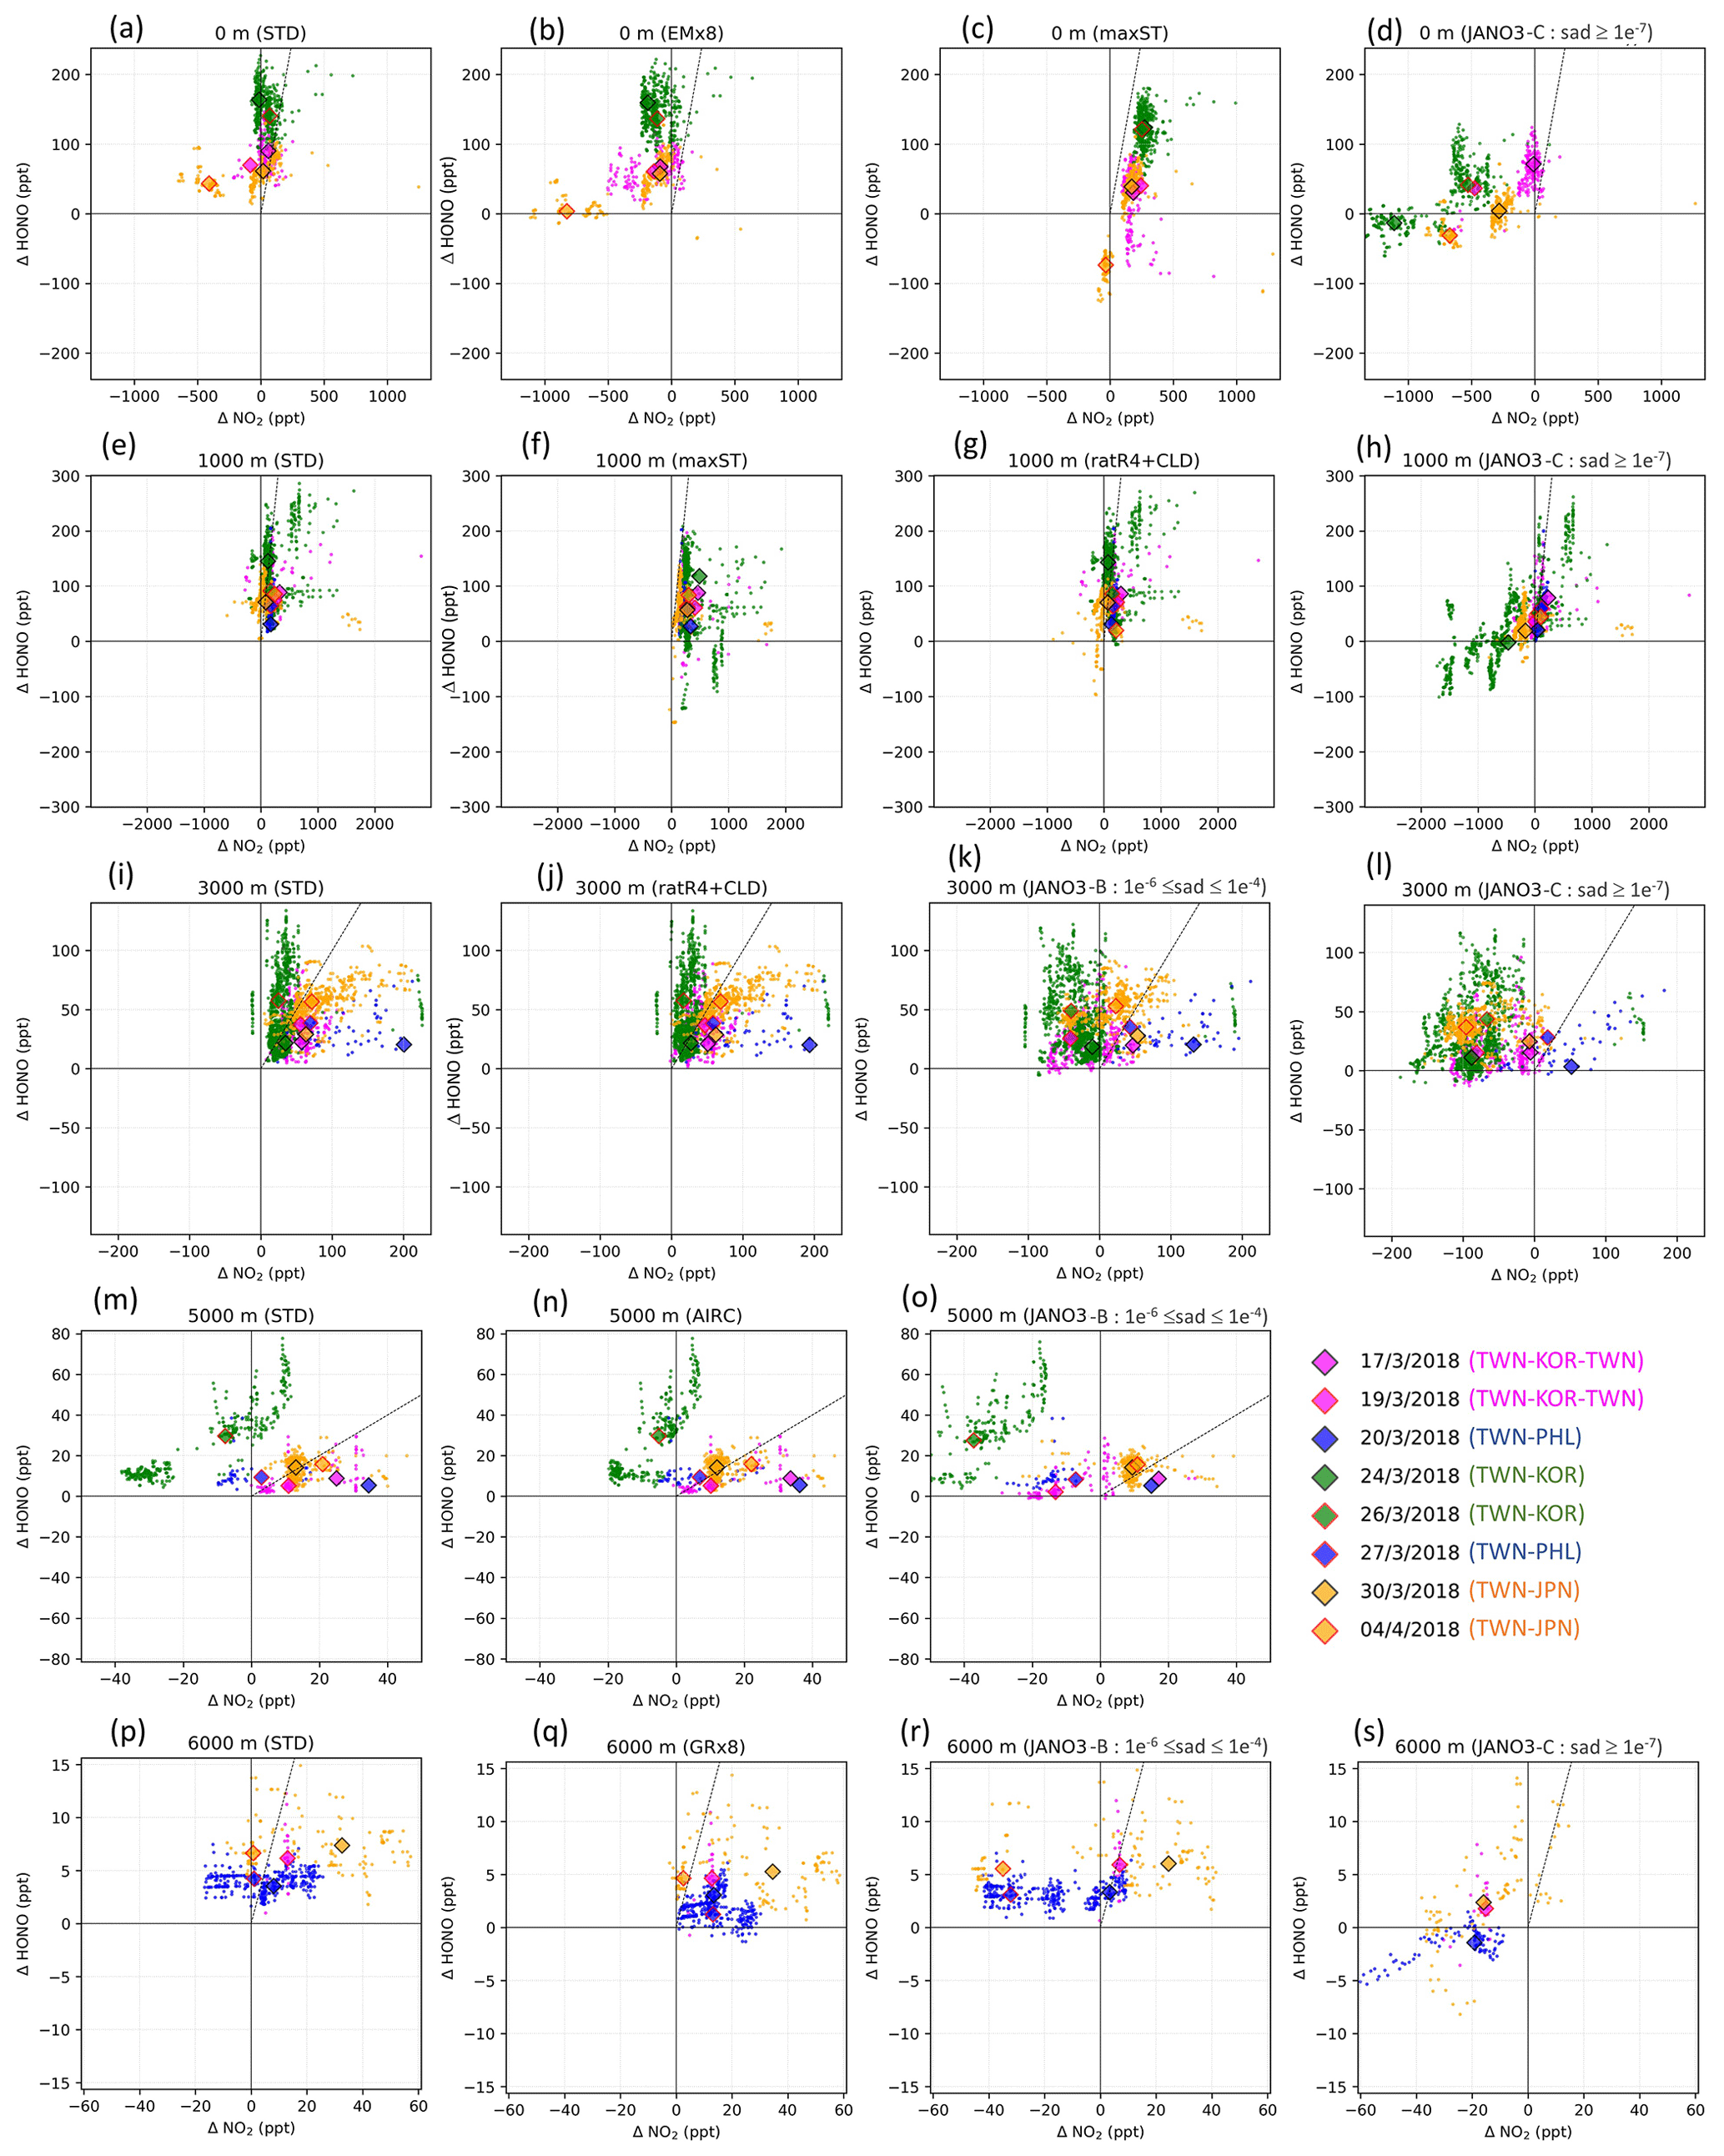
Figure 3The model's discrepancies from measurements for HONO (ΔHONO) versus that for NO2 (). Only results from STD (first column) and helpful sensitivity cases (second, third, and fourth columns) are plotted. The scale is shared for each row. The altitude range (0, 1000, 3000, 5000, 6000 m ±500 m) and the sensitivity case names are shown at the top of each panel. Small points represent discrepancies distribution (observation – model). Diamonds mark the median point of each cruise distribution. Edge and fill colours indicate flight cruises (see legend). Vertical, horizontal, and diagonal lines show , ΔHONO= 0, and , respectively.
The correlation coefficient (R) and model biases against EMeRGe for HONO are shown in Table S4. As seen for the STD run, general underestimations of HONO simulations were identified, in which better correlations were found at 1000–2000 m (R=0.31–0.49). Vertical profiles for HONO and other species (NO2, O3, CO), retrieved from the EMeRGe flights, were applied for the measurement-based model evaluation (Fig. 2). The model discrepancies for the measurement for HONO (ΔHONO) and NO2 () in each flight trajectory, i.e. from Taiwan to South Korea, Japan, and the Philippines, were separated into bins of altitude ranges 0–1000–3000–5000–6000 m (Fig. 3). The frequency distributions of , and ΔCO are shown in Figs. S7 and S8. Figure 2a shows the vertical average score (cruising altitudes ±500 m) for the measured (black) and simulated HONO concentrations in STD (reds) and those results of sensitivity cases. The measured daytime HONO concentration was close to the boundary layer (below 1000 m) over Taiwan, averaged at 115 ppt, and peaked at ∼250 ppt. Also, the HONO concentration decreased up to 9000 m (±500 m), with mean values dropping from 70 ppt (2000±500 m) to <20 ppt (5000±500 m) and <10 ppt above. These measured HONO values for this Asian coastal region were surprisingly high, which range from 10–115 ppt for 2000±500 m altitudes, compared to Wang's report of <100 ppt (maximum) and <30 ppt (4 daytime hour means) for 1500–2000 m altitudes measured by a MAX-DOAS at a station near the HONO source (Wang et al., 2019). This indicates that the source of HONO during EMeRGe might relate to mechanisms other than emission sources. In this study, the simulated HONO concentration in the STD case significantly underestimated the observations. They reached only 30–70 ppt at 1000 m and nearly zero from 2000 m upward (Fig. 2a: red versus black triangles for the simulation and the observations, respectively). These discrepancies indicate a significant unknown HONO source during the daytime, although the proposed heterogeneous HONO formation mechanisms were incorporated in our model. This finding adds another instance of evidence about missing HONO sources in the polluted boundary layer and free troposphere (e.g. Kleffmann et al., 2003; Li et al., 2014; VandenBoer et al., 2013; Xue et al., 2022a; Ye et al., 2018).
In Fig. 3, which shows model discrepancies, the measured NO2 below 3000 m (±500 m) close to land was well captured in the model (Fig. 3a, e, i: magenta and green), with 34 % of the data being quite close for NO2 (±70 ppt) (Fig. S7d). However, the modelling still underestimated the simulated HONO mixing ratio by up to 250 ppt (Fig. 3a: green). Over the region off the coast of Taiwan bound to Japan, NO2 was overestimated by up to 600 ppt in the model, corresponding to 20–70 ppt missing HONO (Fig. 3a, e: small orange area left of vertical line). The missing HONO can be driven by low HONO emission from land and low uptake of NO2 on organic carbon and soot, as the amplified EM×8 and maxST cases could alleviate the model underestimates for HONO (Fig. 3a vs. b: orange; Fig. 3a vs. c and e vs. f: green and magenta). The model also underestimated O3 and CO, usually by 25 ppb O3 (freq. 79 %) and 100 ppb CO (freq. 60 %) (Figs. S10, S11), which were larger than the model biases against ATom-1 observations (Sect. 3.1.3; Fig. 5) because of possible inland influence. A more accurate and detailed emission inventory for substances such as HONO, NOx, and CO was thus sensible as this region is the outflow of the Pearl River Delta and Yangtze River Delta regions. Besides the uptake on organic and black carbon, identified in the maxST simulations, we identified the NO2 uptake on sulfate nearly as important through a parallel test (not shown). In particular, the heterogeneous photolysis of HNO3 could not provide a significant HONO amount near Taiwan, South Korea, and Japan (in the JANO3-B and JANO3-C cases) and a small HONO amount for the Philippines bounding route (in JANO3-C case) for the altitudes below 2500 m (Fig. 3d, h: green, orange, blue).
For the middle troposphere (5000–6000±500 m) over the island of Taiwan, too abundant NO2 was predicted by the model during the cruises bounding to South Korea (up to 40 ppt) and the Philippines (up to 20 ppt) (Fig. 3m, p: small green and blue areas left of the vertical line). These overabundances might hint on the deep stratospheric intrusion in springtime that caused imperfect downward mixing fluxes (Lin et al., 2012; Stohl et al., 2003; Trickl et al., 2014). This excessive NO2 and the corresponding missing HONO were also sensitive to the AIRC and GR×8 cases (Fig. 3n, q), indicating that aircraft exhaust of HONO could adjust the HONO:NO2 ratio and more homogeneous HONO production might contribute more, given the high abundances of oxidizing substances at these altitudes. The possibility of emission of aviation-induced particles on which NOx to HONO conversion could reach 45 % (Meilinger et al., 2005) could support the need for NO2 reduction and HONO formation for this height across EMeRGe's near-land domains. Moreover, the surface-catalysed photolysis of HNO3 in the JANO3-C runs could serve as an efficient source and greatly reduced the model negative bias for HONO at 6000 m. However, the model overestimated NO2 levels in this case ( negative in Fig. 3s) because HNO3 was more photolysed to HONO and served less as a NOx removal process.
The model underestimation for HONO was also associated with the concurrent underestimation of NO2, observed more often at the altitudes of >1000 m. The erroneous NO2 concentrations of ∼1.8 ppb (1000 m) and ∼220 ppt (3000 m) across Taiwan were linked with a lack of HONO of as high as 290 ppt (1000 m) and 140 ppt (3000 m) (Fig. 3e, i). These likely inadequate NO2 abundances could be partially alleviated through the enhanced HONO:NOx emission ratio and more efficient NOx-recycling process in the ratR4+CLD cases, respectively (Fig. 3g, j). Here, the missing HONO was largely supplemented only at ∼1000 m over the marine environment (Taiwan–Japan cruise), when we identified more products for HONO on cloud in the ratR4+CLD case (Fig. 3e, g: red-orange diamonds). At ∼6000 m, small deficits of 60 ppt NO2 corresponding to ∼10 ppt HONO (Fig. 3p: orange and magenta) might correspond to lightning NOx emissions (Sudo et al., 2002) and stratospheric sources. Some homogeneous mechanisms at ∼6000 m as in the GR×8 could be effective (Fig. 3n, o). Moreover, the heterogeneous photolysis of HNO3 in the JANO3-C case could be an effective HONO supplement above 5500 m (Fig. 3s), while this photolysis acted as a NO2 production mechanism at any altitudes.
In general, the upper limit for the aerosol-uptake coefficients (maxST case) may be applicable for the lowest cruising altitudes, which induced the increase of modelled HONO levels during both daytime and nighttime (Fig. S10). The photolysis of adsorbed HNO3 on ground surfaces implemented in the JANO3-A case was impractical to be a source for HONO during EMeRGe, as this case only provided a mild HONO amount at a thin surface layer (<500 m; not shown). Fortunately, the surface-catalysed photolysis of HNO3 in JANO3-B and JANO3-C cases could remedy the model-measurement discrepancies; i.e. RHONO>0.6 and the model bias for HONO was reduced from −112 ppt (STD) to −22 ppt (JANO3-B) and −18 ppt (JANO3-C) for 0–500 m altitudes (Table S4). The HONO source from this photolysis of HNO3 was sufficient for continental and near-land regions. In particular, the photolysis of HNO3 adsorbed on particles with smaller SAD (JANO3-C case) was responsible for the 500–3000 m atmosphere around Philippines and South Korea and at higher altitudes where robust solar radiance might enhance the HNO3 photolysis. In the combined cases (maxST+JANO3-B and maxST+JANO3-C), HONO production was boosted, and the estimated NOO3 concentrations were best captured for 2000–5000 m (±500 m) altitudes (Fig. 2a, b, d: black diamonds vs. orange circles). Furthermore, the sensitivity cases including combined cases changed the global tropospheric effects differently, as discussed in Sect. 3.2.3.
The remaining drawbacks in reproducing HONO and other atmospheric species (NO2, O3, CO) by model urges further elucidation of efficient HONO formation mechanisms. To this end, one needs (1) to elaborate the combined HONO production mechanisms from enhanced NO2 aerosol uptakes and HNO3 photolysis alongside testification other potential HONO formation mechanisms and NOx-recycling processes; (2) to simulate the lower and upper limits for the uptake coefficients of NO2 on aerosols and clouds; (3) to provide better emission inventories for anthropogenic sources of pollutants from Southeast Asia and East Asia, lightning-produced NOx and HOx, and aviation-induced aerosols; and (4) to improve the vertical mixing and air mass transport from the stratosphere.
3.1.3 NO2, OH, HO2, O3, and CO concentrations within the oceanic free troposphere
The model performance of the free troposphere was evaluated through the atmospheric tomography (ATom-1) aviation in August 2016 for NO2, OH, CO, HO2, and O3. The STD run reconstructed the chemical field observed in ATom-1 with moderate or strong positive correlations for NO2, OH, CO, and O3 (, , ROH=0.579, RCO=0.659; Table S2). For the NP region, the model correlations for these species were slightly lower (, , ROH=0.407, RCO=0.596; Table S2). The R values for NO2 and CO were consistently higher in the STD run than those in the OLD run, while for OH and O3, the R values are only improved for the NP region (Table S2).
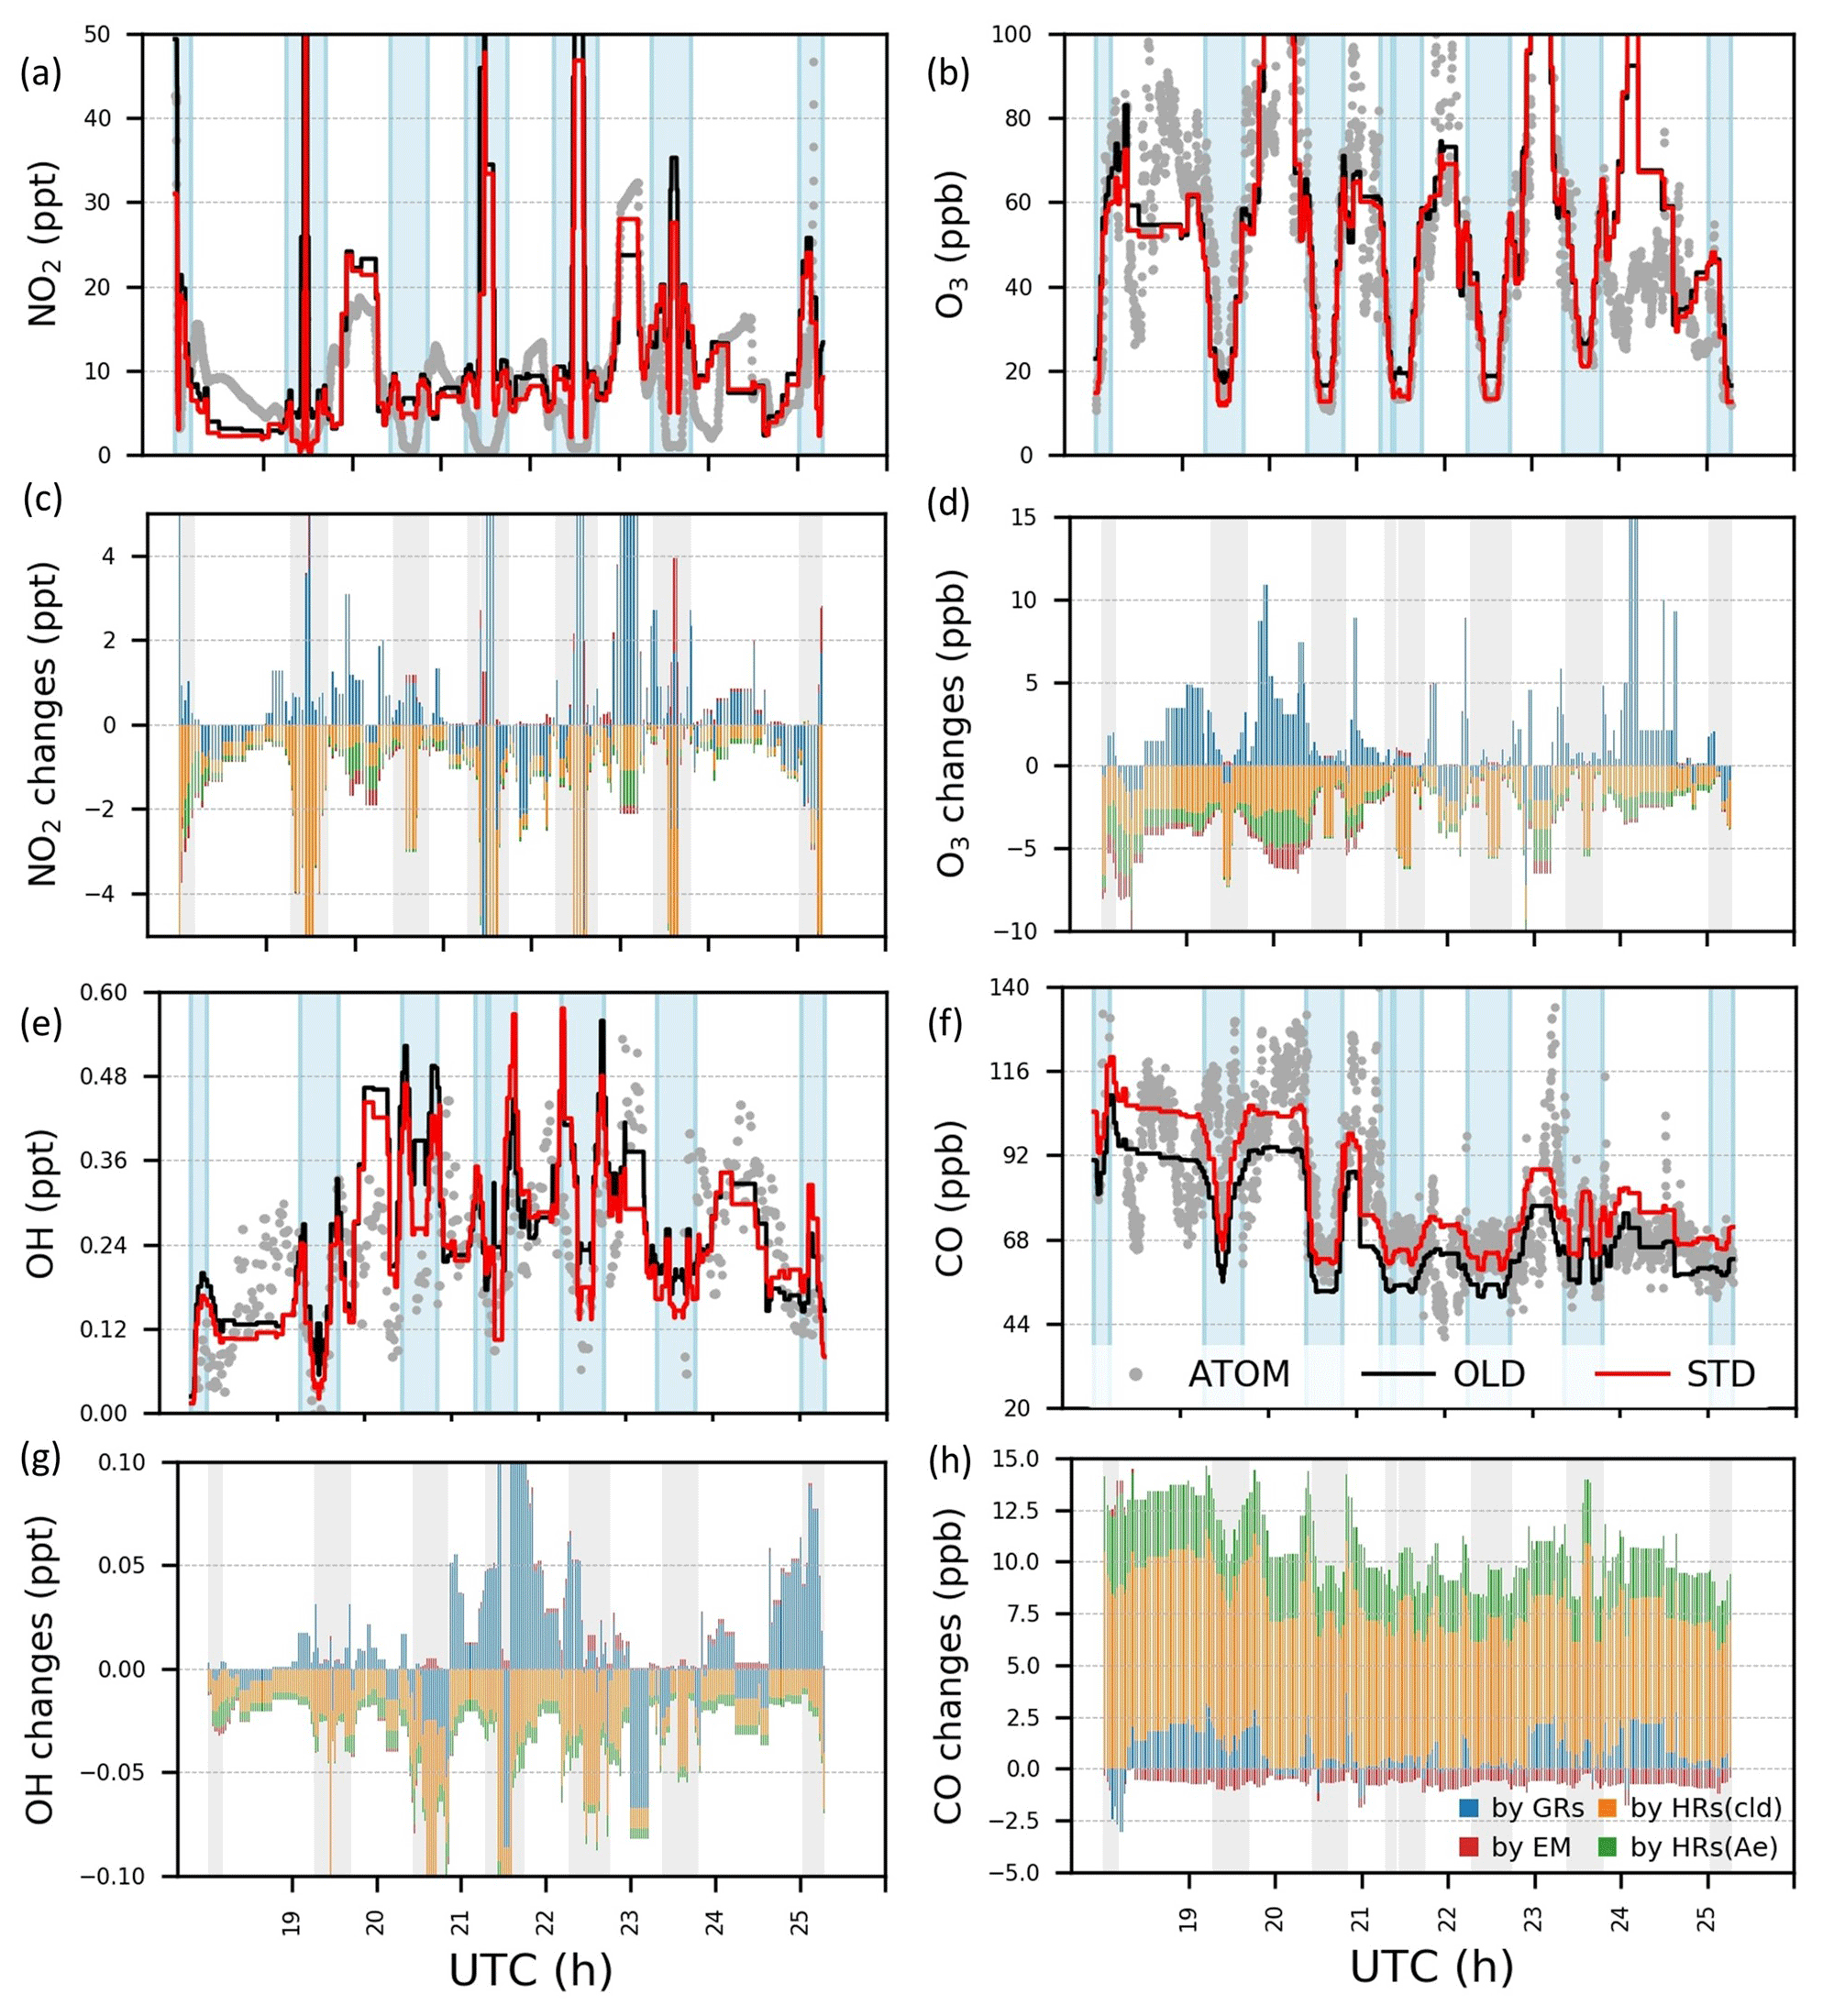
Figure 4Concentrations and variations by HONO chemistry for NO2, O3, OH, and CO during ATom-1 flight no. 2 (20–62∘ N, 198–210∘ E). In panels (a)–(b) and panels (e)–(f), concentrations by observation (grey dots) and simulations in the OLD case (black lines) and in the STD case (red lines) are plotted. In panels (c)–(d) and panels (g)–(h), changes in concentrations by GRs (blue bars), EM (red), HRs on clouds (orange), and HRs on aerosols (green) are plotted. Vertical blue and grey columns reflect the data for the regions with air pressure P>500 hPa.
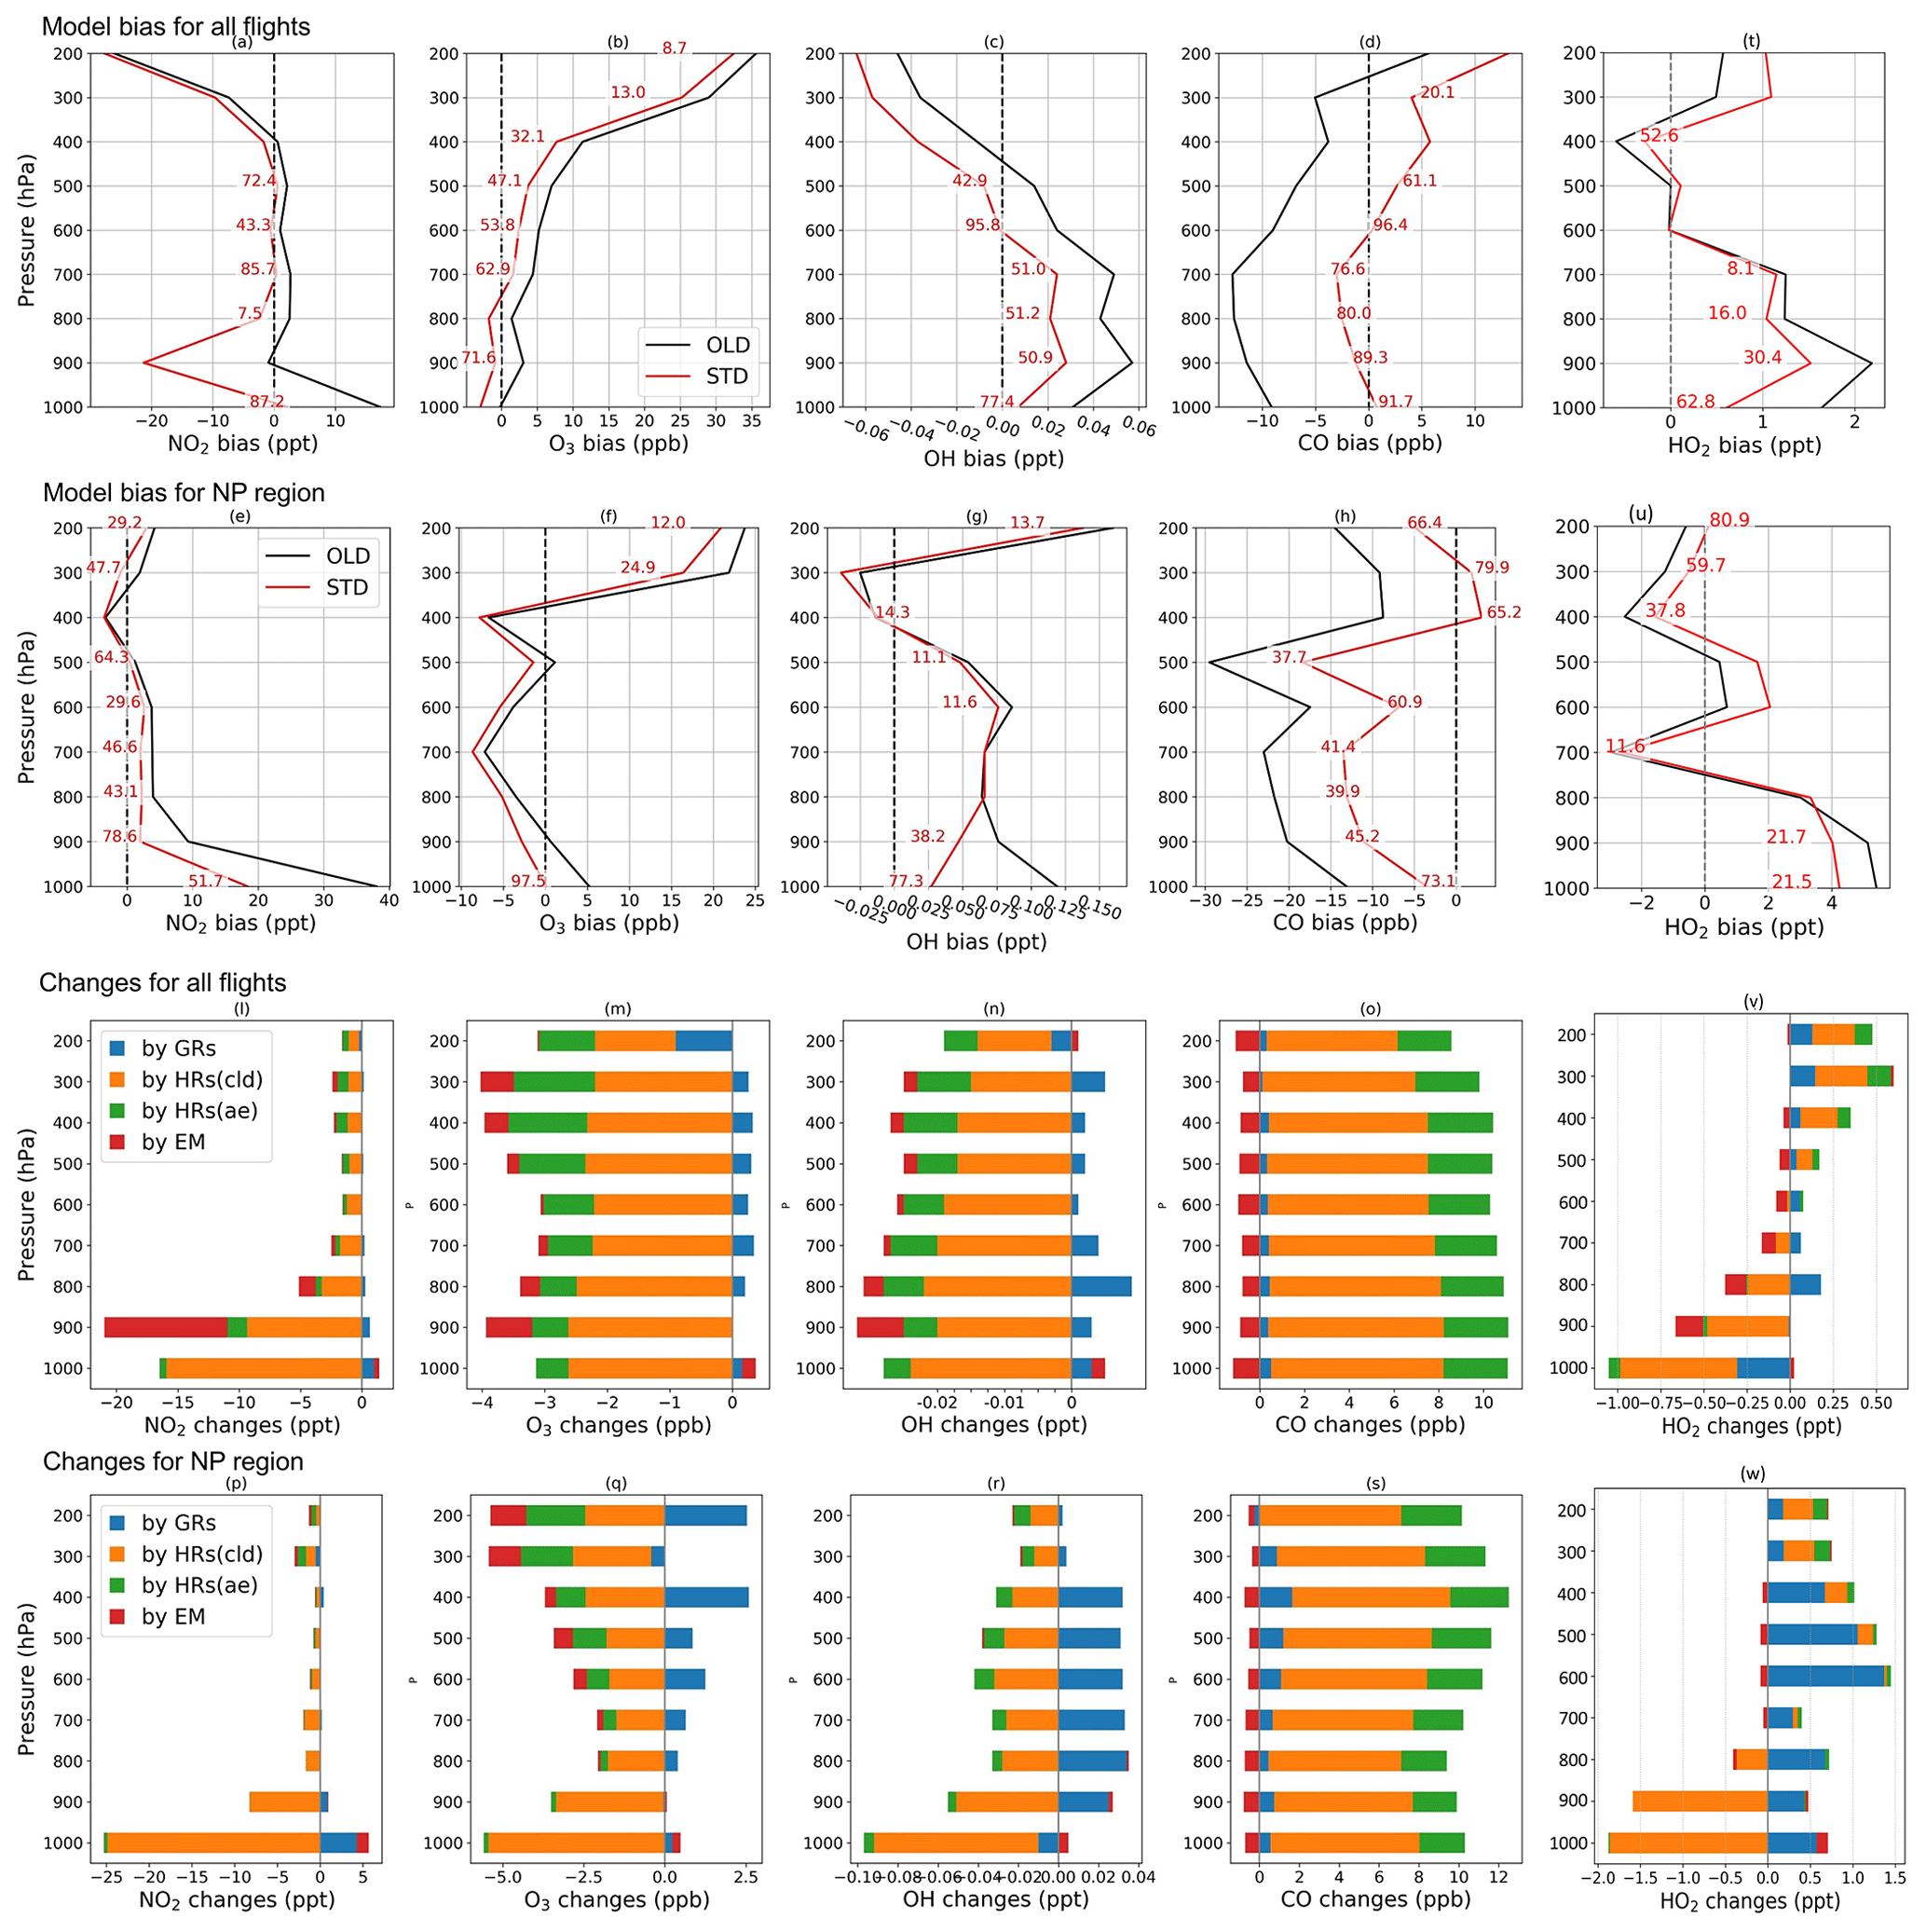
Figure 5Vertical profile of model bias against aerial ATom-1 data (a–h, t–u) and changes by HONO chemistry (l–s, v–w) for NO2, O3, OH, CO, and HO2 (from left to right columns). Biases in OLD (black lines) and STD (red lines) runs are calculated for all flights (a–d, t) and NP region (e–h, u). The red numerical texts are the relative reductions (%) of the bias in the STD run compared to that in the OLD run. Changes by GRs (blue), HRs on clouds (orange), HRs on aerosols (green), and EM (red) are calculated for all flights (l–o, v) and NP region (p–s, w).
Figure 4 shows measured (grey) and simulated (red and black) NO2, O3, OH, and CO concentrations and the effects of including HONO in the simulation for the NP region (flight no. 2 on 3 August). Figure 5 displays vertical profiles of the model biases in STD vs. OLD cases and photochemical effects by each HONO formation mechanism. Here, the data in all flights or in the NP region were classified based on the air pressure from 1000–200 hPa (±50 hPa) and separated into nine bins. In the NP region, the OLD run (black lines) tended to overestimate NO2, O3, OH, and HO2, but it underestimated CO at the lower troposphere, whereas the unsteady discrepancies at the upper layer were visible (Fig. 4a, b, e, f). All five species tended to be underestimated near the tropopause (300–400 hPa) and to be overestimated in the lower stratosphere (Fig. 5e–h, u). The HONO inclusion in the STD run (red lines) reduced NO2, OH, and O3 and increased CO levels, thereby dwindling the model biases for NO2, OH, and CO in the NP region except near the tropopause (Fig. 5e, g, h). HO2 was reduced near the surface layer and increased from the middle troposphere (Fig. 5v, w), reducing model bias for most parts of HO2's vertical profile (Fig. 5t, u). The reduction in the HO2 level near the surface might follow a similar cloud effect as that for OH, which turned into minor increases in the HO2 level at the middle and high atmosphere, given a lower HO2 level at these altitudes.
In the NP region, the surface NO2 level was reduced under the effects of HONO uptake on clouds (Fig. 4c: orange bars in vertical grey columns and Fig. 5p). Hence, O3 and OH were correspondingly reduced as their formations are presumably limited in the absence of sufficient NOx, that is, lacking atomic oxygen from NO2 photolysis and OH formation via HO2 + NO → OH + NO2 (Fig. 4d, g: orange bars in grey columns and Fig. 5q, r). Near the surface, aerosol HRs only slightly affected atmospheric species, whereas at high altitudes, the aerosol uptake was more relevant, especially for O3 concentrations (Fig. 4c, d, g, h and Fig. 5q–s: green bars), due to the contribution of aerosol direct effects to the O3 level (Xing et al., 2017). The dominant cloud effects near the surface appeared plausible for an ocean region with high cloud fractions at the lowest layer (Fig. S2). GRs also affected OH, O3, HO2, and CO, whereas the effects manifest in the upper troposphere rather than in the lower troposphere. This was likely the most influential factor that increases OH, HO2, and O3 levels at these high altitudes (Fig. 4d, g and Fig. 5: blue bars). The additional HONO from direct emissions had minor effects on NO2 and OH but contributed to the reductions of O3 and CO at high altitudes (Fig. 4c, d, g and Fig. 5q, s: red bars). At 900 hPa, the HONO emissions significantly reduced NO2 near the continental areas (Fig. 5l: red bars) due to its uptake by particles. These effects of the HONO chemistry in the STD simulation somewhat reduce the model biases for NO2, O3, OH, HO2, and CO (Fig. 5a–h, t, u: red numerical texts are the percentage reduction in model bias). Note that these biases were very pronounced near the surface (∼1000 hPa) in the NP region (51.7 % for NO2 and 77.3 % for OH). To capture the patterns identified by observations in the upper troposphere, except the NP region, more robust increases for NO2, OH, and HO2 levels were still required (Fig. 5a, c, t). At these altitudes, NOx and HOx sources from lightning (Brune et al., 2021) or aviation could also be relevant, as discussed in Sect. 3.1.2.
Table 6Model comparison with Mirai cruises: no outlier filter is applied. N is the available data for each calculation. Correlation coefficient (R, no unit) and biases (ppbv) in the STD run are shown as bold if better than those in the OLD run.

3.1.4 Surface O3 and CO in the marine environment
The simulations was also compared with the research vessel (R/V) Mirai's observation in the western Pacific Ocean for O3 and CO. The interpolation of model results for six cruises was provided, with four cruises across the Japan–Alaska region (40–75∘ N, 140∘ E–150∘ W) in July, August, and September 2015–2017 (summer), as well as one cruise for the Indonesia–Australia region (5–25∘ S, 105–115∘ E) and one cruise for the Indonesia–Japan region (10–35∘ N, 129–140∘ E) in December 2015 and January 2016 (winter). All the measured and simulated data were provided, whereas the data for the NP region (40–60∘ N) were analysed separately, as discussed in Sect. 3.2. More detailed information about the R/V Mirai can be found in Kanaya et al. (2019). Furthermore, the model evaluation with Mirai for the OLD run can be found in Ha et al. (2021).
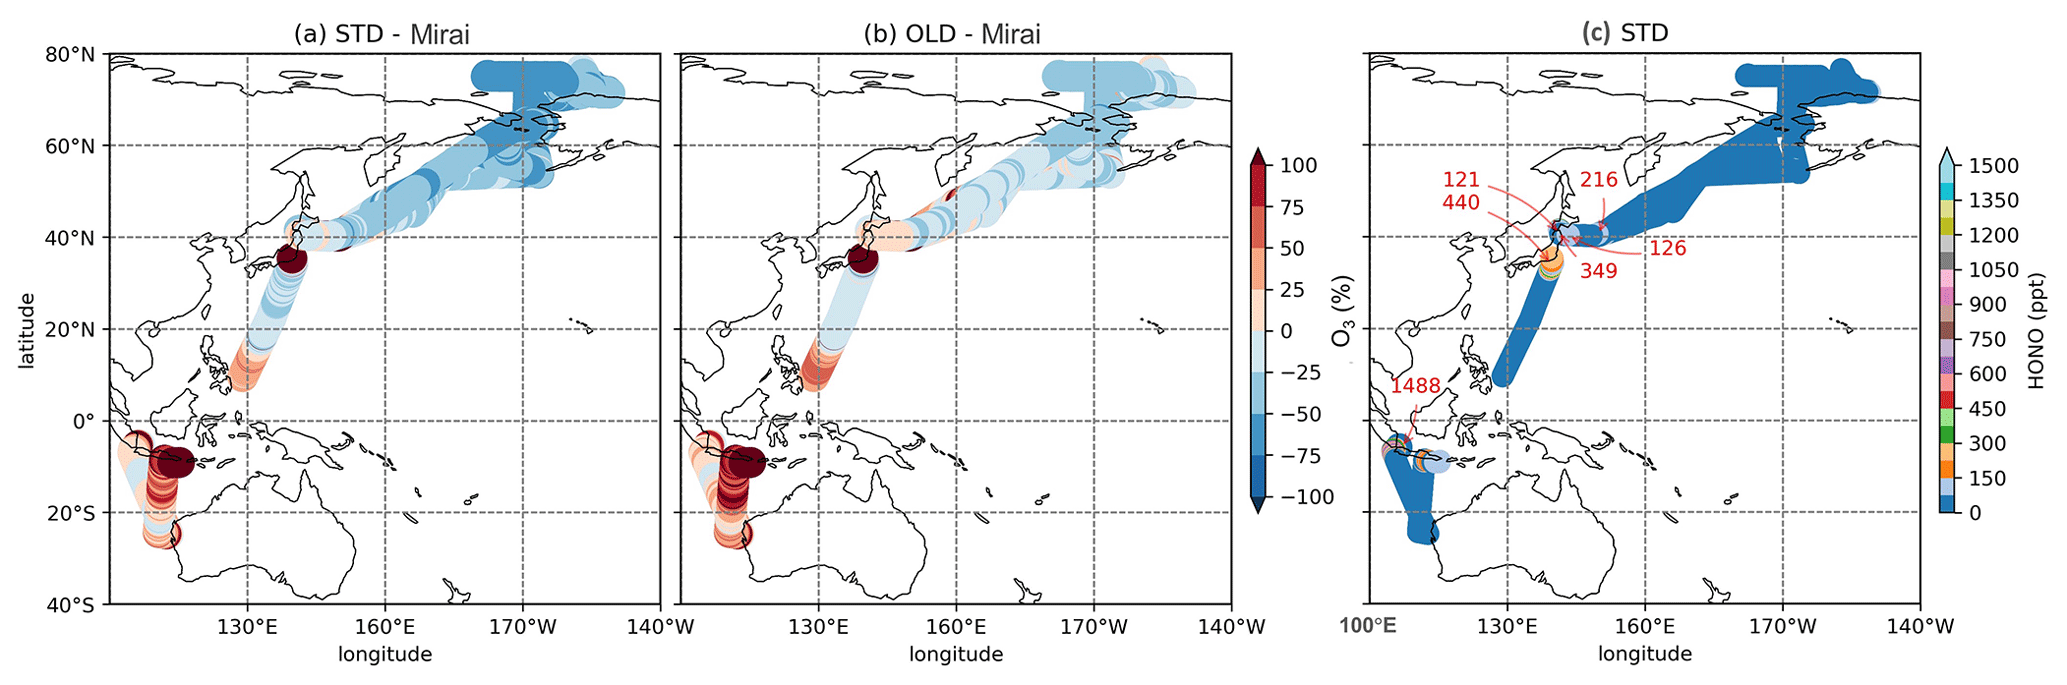
Figure 6Percentage discrepancies of STD (a) and OLD (b) simulations from Mirai for O3 and HONO concentration in STD (c). The red numbers in panel (c) indicate maximum HONO concentrations for each cruise.

Figure 7Validation with ship-based data. Observed and simulated concentrations (a, c) and daily mean effects by HONO chemistry (b, d) for O3 and CO during Mirai cruises. (a, c) Grey dots: observation; black lines: OLD case; red lines: STD case. (b, d) Blue bars: changes by GRs; orange: changes by HRs on clouds; green: changes by HRs on aerosols; red: changes by EM. The left axis exhibits the concentrations and changes (ppbv). The right axis shows cruising latitudes plotted as dashed lines. The horizontal axis is travel times (UTC). Vertical light-blue shaded areas are for data in the NP region (40–60∘ N, 140–240∘ E).
Table 6 shows correlation coefficients, which indicated that the STD simulation for CO and O3 agreed well with Mirai (). However, these correlation coefficients were slightly worsened compared with the OLD case. Although the HONO inclusion mostly reduced the model bias for CO, especially in the NP region (−16.158 to −4.948 ppb), the model bias for O3 was increased. The model biases exhibited a negative trend for both CO and O3 in the OLD case. This simulation pattern for O3 in the NP region was in line with the OMI comparison (Sect. 3.1.1). This finding seemingly indicated an insufficient downward mixing process of O3 in the free troposphere or inconsistent surface deposition (Ha et al., 2021; Kanaya et al., 2019). However, the CO underestimations in the NP region might mark the inadequate CO emission in the HTAP inventory in CHASER (Ha et al., 2021). In Fig. 6a and c, overestimations of CO and O3 were visible along Japan–Indonesia–Australia (Track-2) during the low episodes in December/January. Here, the larger model biases might account for the model's insufficient halogen chemistry (Kanaya et al., 2019; Ha et al., 2021). Figure 6 shows the model's percentage discrepancies for O3 from Mirai's data, except those from HONO concentrations interpolated for these regions. The underestimated simulations of O3 were enlarged, especially in the Japan–Alaska region, being driven by the reduction effects in the STD case. In another way, these effects weakened the O3 overestimates across the land areas, namely, over the region near Japan and Indonesia–Australia. Moreover, the higher HONO levels were identified for these offshore data with up to 1.4 ppb abundances (Fig. 6c: red numbers). This high HONO level might underestimate an accurate level as a stronger reduction for O3 was still required for the STD run (Fig. 6a: red marks).
The effects of the HONO chemistry along the R/V Mirai tracks exhibited various trends for each mechanism. Figure 7b and d illustrate O3 and CO changes triggered by the HONO gas reactions (GRs), uptakes (HRs), and emission (EM). The gaseous reactions (blue bars) had mostly increased CO levels due to the reduced OH and O3 levels (Fig. S14). The gaseous mechanisms caused some reductions at the peak CO level because the higher OH level from HONO photolysis near the land domain or extra OH flux from the stratosphere near 60∘ N latitude could dilute CO. Furthermore, the O3 level was slightly increased due to GRs north of 60∘ N, as GRs was a source for NO2 and thus enhanced O3 formation at these high latitudes (Fig. S14). The O3 level was often decreased in the NP region since minor NO2 increased and stronger OH reduction was seen for this region (Fig. S14). The change tendencies in O3 near land areas were varied (T2, T3) because the vertical effects to NOx and OH were stronger during DJF for this region (Fig. S14). HRs, largely consuming NO2, reduced O3 (as large as 8 ppb) and increased CO (∼10 ppb) levels (Fig. 7b, d: orange+green). HRs (particularly HRs on cloud surfaces, shown by orange bars), exerted the strongest contribution to the calculated changes in O3 and CO among the three HONO pathways. This predominant cloud effect was also prominent in the previous comparisons, especially EMEP (Fig. 10ii, jj: blue), thereby indicating substantial effects of clouds at the mid-latitudes where the cloud SAD is higher (Fig. S1). HRs on aerosols (green bars) had minor contributions during all cruises, despite causing a marked increase in the O3 concentrations off the coast of Japan (track no. 3). It should be noted that this is not enough to explain the simulation bias with regard to the measurements. The additional HONO from direct emission (red bars) mainly increased O3 and reduced CO concentrations, especially near land (latitude <50∘ N). This finding resonated with the comparison for continental stations (Fig. 10cc, ff, ii, jj: orange). The overall effects of the HONO chemistry along Mirai cruises tended to reduce O3 and increase CO levels. For the NP region, the CO level increased and the OH level reduction also ameliorated the model performance. The improved model performance is evidenced from the comparison of the simulation with ATom-1 aircraft data as well (Fig. 5g, h). Thus, the strengthened underestimation of O3 concentration in the NP region was not likely driven by HR on cloud particles (Sect. 3.1.1 and Ha et al., 2021). It was rather related to the inconsistencies in the surface deposition of ozone. These inconsistencies were supported by empirical evidence as the negative bias in this comparison turns neutral or positive for the aircraft measurements in the same region (Fig. 5f: at 1000 hPa).
Overall, the comparisons between the model and ATom-1 Mirai might indicate that the HRs on cloud surfaces were the main contributing factor to the marine boundary's photochemistry, whose effects emerged during the ATom-1 flights in the marine atmosphere. GRs and aerosol HRs had a stronger impact on atmospheric chemistry at higher altitudes than the near-surface layer. Also, their effects should be enhanced through the additional NOx and HONO sources to reconcile the model simulations with the observations.
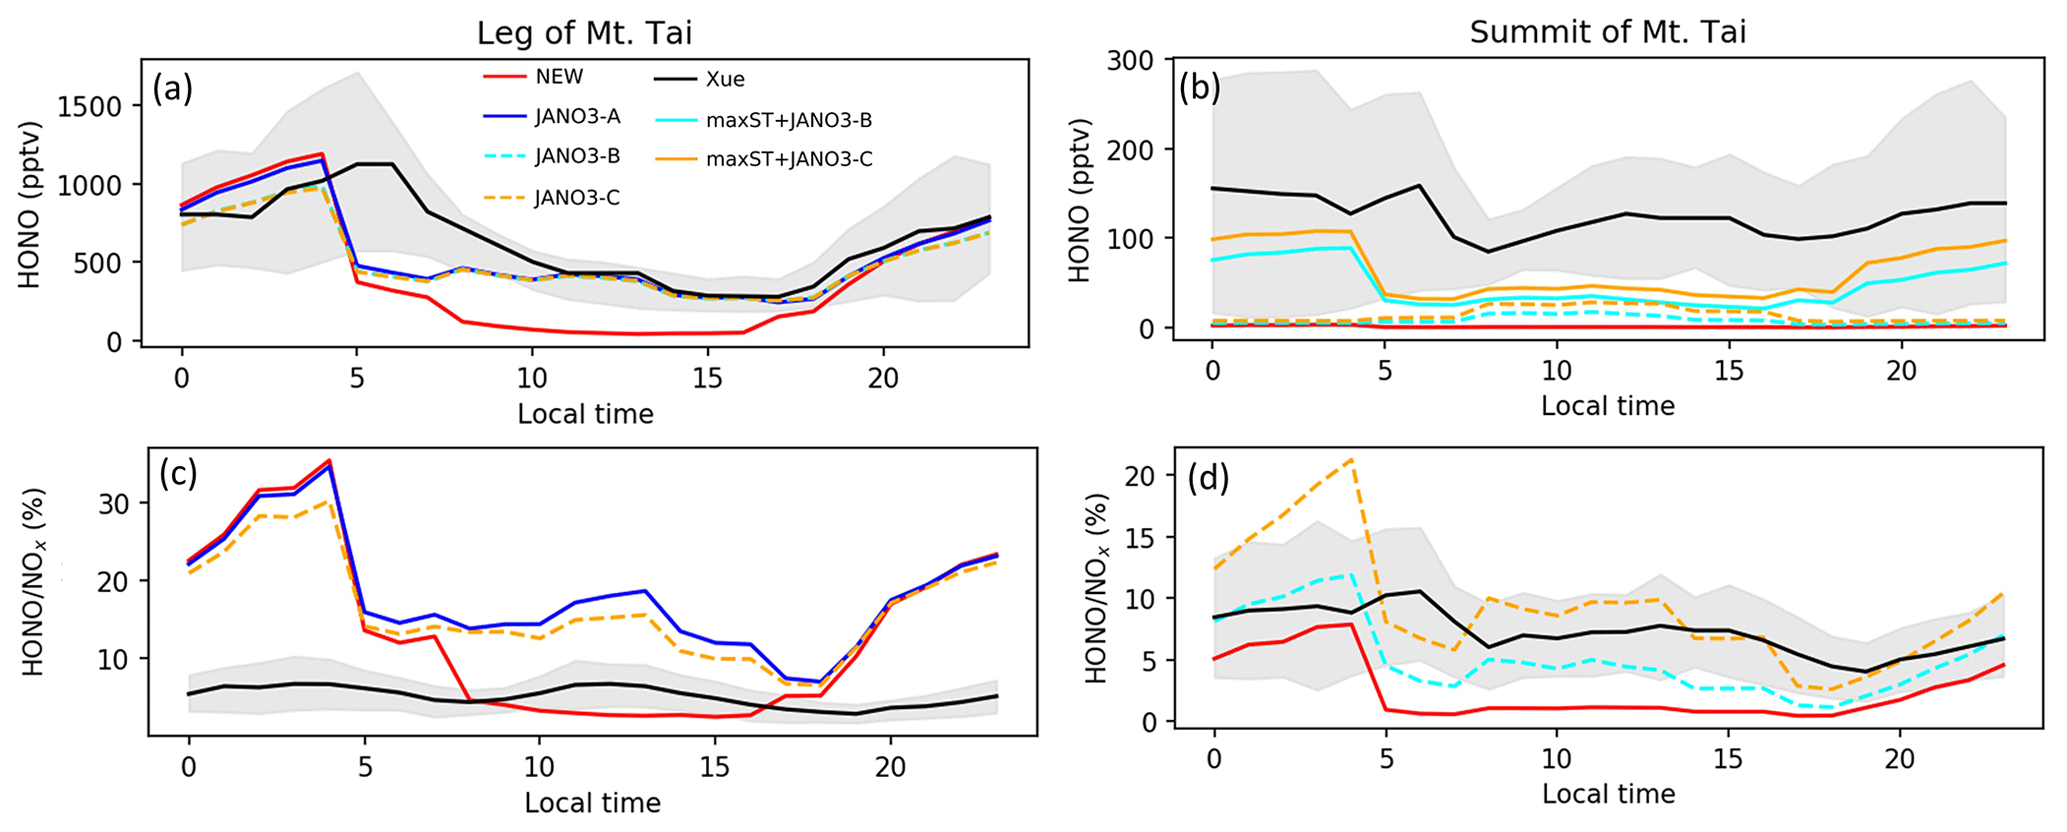
Figure 8HONO and HONO:NOx ratio concentrations estimated in the model and reproduced from Xue et al. (2022a) for Mt Tai's foot and summit stations during July. Shaded area shows minimum–maximum ranges, while colours show simulations as in legend.
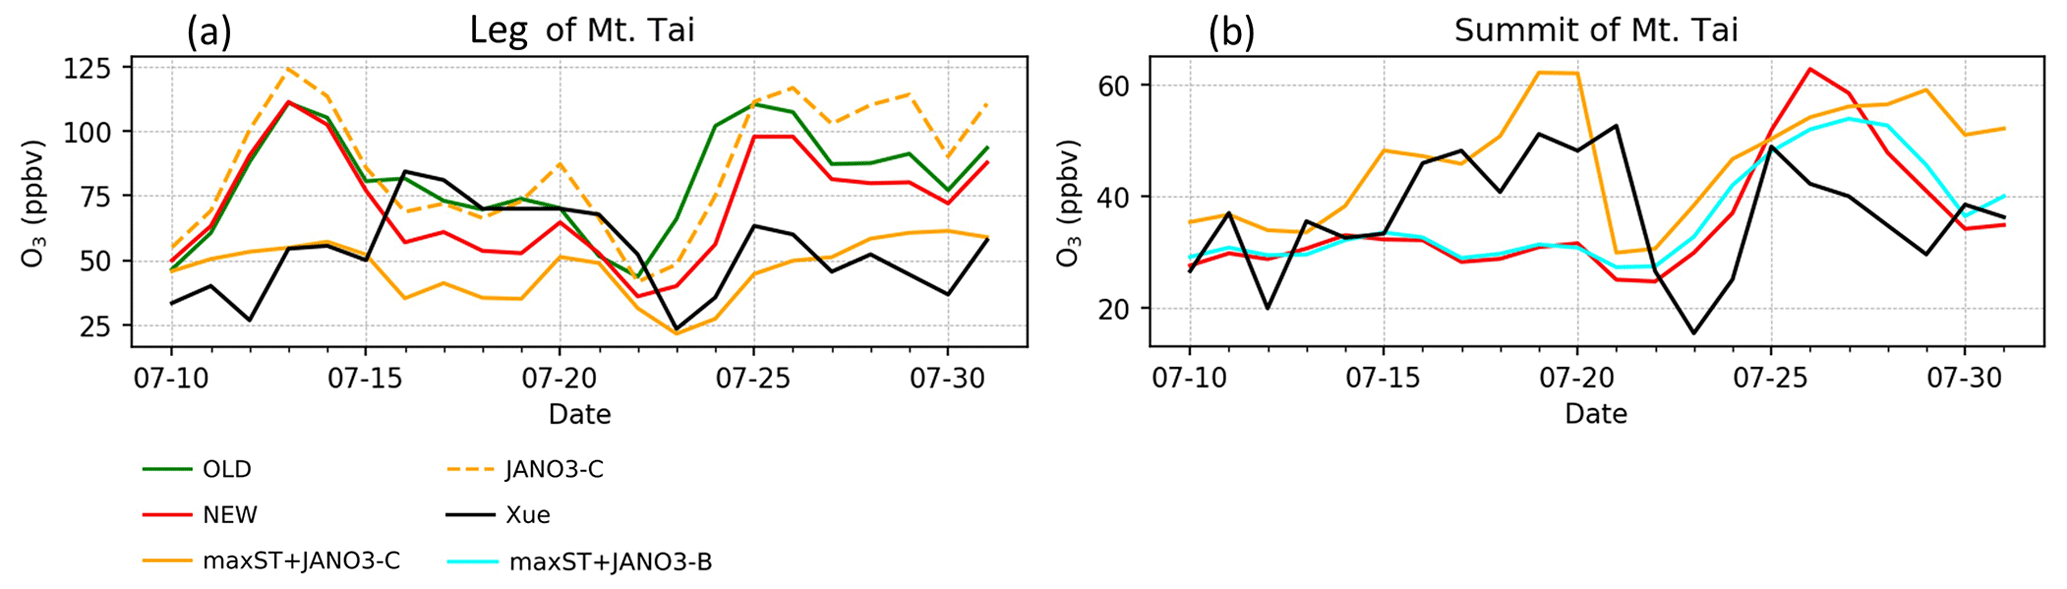
Figure 9Daytime (05:00–18:00) average O3 concentration during 9–31 July 2018 at the foot and summit of Mt Tai simulated in the model (coloured) and reproduced from Fig. 7 in Xue et al. (2022a) (black). In panel (b), JANO3-B/C cases are overlapped with maxST+JANO3-B/C cases, respectively.
3.1.5 HONO, NOx, O3, and other atmospheric species at ground-based stations
In this part, HONO concentration and HONO-related species measured for summer 2018 at the leg (150 m) and the summit (1534 m) of Mt Tai (Shandong province, China) by Xue et al. (2022a) were reproduced using a data extraction tool from images (Fig. 5 in Xue et al., 2022a). We compared our model's additional sensitivity simulations (Table 5) with Xue's measurements (Fig. 8). The HONO estimated in the STD case for the foot station was rapidly reduced after 4:00 (from ∼1100 pptv), while the observed HONO level peaks at ∼6:00 and remains about 0.5 ppbv at noon (Fig. 8a). The HONO level produced by the sole NO photolysis on ground, aerosols, and cloud particles (JANO3-A/B/C cases – respectively in solid blue, dashed cyan, and dashed orange lines in Fig. 8a) can append moderately the simulated daytime HONO to reach the ground-based observatory levels comparing to the STD case. This addition indicated a partially important role of NO photolysis on all surfaces to HONO sources since early morning. Also, NO photolysis adjusted the ratio of HONO:NOx more analogue to the observed daytime ratios at the ground (Fig. 8c, d). The lack of NO2 sources, especially during nighttime (Fig. S15), even in the OLD case (without HONO chemistry), was one of the reasons for the remaining unknown HONO sources existing during ∼5:00–11:00. The combined cases (maxST+JANO3-A/B/C cases) produced too much HONO at the leg compared to observations (not shown in Fig. 8), indicating the improper mechanism of enhanced NO2 aerosol uptakes for ground-based stations. In contrast, the enhanced aerosol uptakes were more compatible with observation at the summit, where these combined cases provided the best agreement to observation (Fig. 8a, b: solid cyan and orange lines). However, the best simulation for HONO at the summit station only reached the lower line of the averaged daytime HONO level (Fig. 8b). Xue suggested that the high HONO level at the summit of Mt Tai was dominated by the rapid upward transport from the ground and the in situ heterogeneous formation on the mountain surfaces (Xue et al., 2022a), which the mismatching between the actual locations and the coarse model grid (2.8∘) of our model, including vertical layer, might not provide. Similar to NO2, the simulated CO concentrations at Mt Tai were very low (∼200 ppb at the foot station in the STD case versus ∼400–600 ppb measured CO; not shown), even in the OLD case. In our model, the inadequate emission inventory of CO and NO2 for the Asian region using HTAP-II-2008 and the coarse model resolution () were the reasons for the low ground-based emissions and vertical transport (Ha et al., 2021). Such emission inventory and vertical transportation improvement could further close the HONO observation gap and reduce the unrealistically high HONO:NOx ratios. Such a study could better show the validity of the HONO production mechanisms from enhanced NO2 aerosol uptake and NO photolysis (combined cases) for the summit station.
The above discussion confirmed that NO photolysis (Reaction R7) on the ground, aerosols, and clouds surfaces (JANO3-A/B/C cases) enhanced daytime HONO but being ignorant of the NO2 level (Fig. S15) due to an absent NOx recovery process (Ha et al., 2021). However, HONO sources via Reaction (R7) in the JANO3-A/B/C cases still increased daytime O3 levels at the foot of Mt Tai (Fig. 9a) as a result of rapid NOx cycling. Either the JANO3-A/B/C or the combined maxST+JANO3-B/C case was closest to O3 observation during cleaner (50–75 ppb O3 on 16–22 July) or dirtier episodes (<50 ppb O3), suggesting an enhanced role of aerosol uptakes during the polluted episode (indicated by the corresponding increases for CO; Fig. 7 in Xue et al., 2022a). At the summit station, NO photolysis in the JANO3-C and maxST+JANO3-C cases (all surfaces including clouds) boosted O3 up to the observational level, indicating the contribution of cloud surface at the summit (∼1500 m).
The effects of HONO chemistry in the continental near-surface layer of East Asia and Europe were also investigated. To this end, we conducted model comparisons versus EANET and EMEP stationary observations for mass and gaseous concentrations of PM2.5, SO, NO, HNO3, NOx, O3, and CO (CO for EMEP only). Table 7 shows the correlation coefficients (R) and model biases for each species in the OLD and STD cases. The OLD simulation had its fair correlations and RMSEs with observation for SO (R(EANET) = 0.56, R(EMEP) = 0.63), NO (R(EANET) = 0.36, R(EMEP) = 0.71), and HNO3 (R(EANET) = 0.18, R(EMEP) = 0.12), which were in line with other atmospheric chemistry models' R and RMSE values against EANET and EMEP (Bian et al., 2017), as also discussed in Ha et al. (2021).
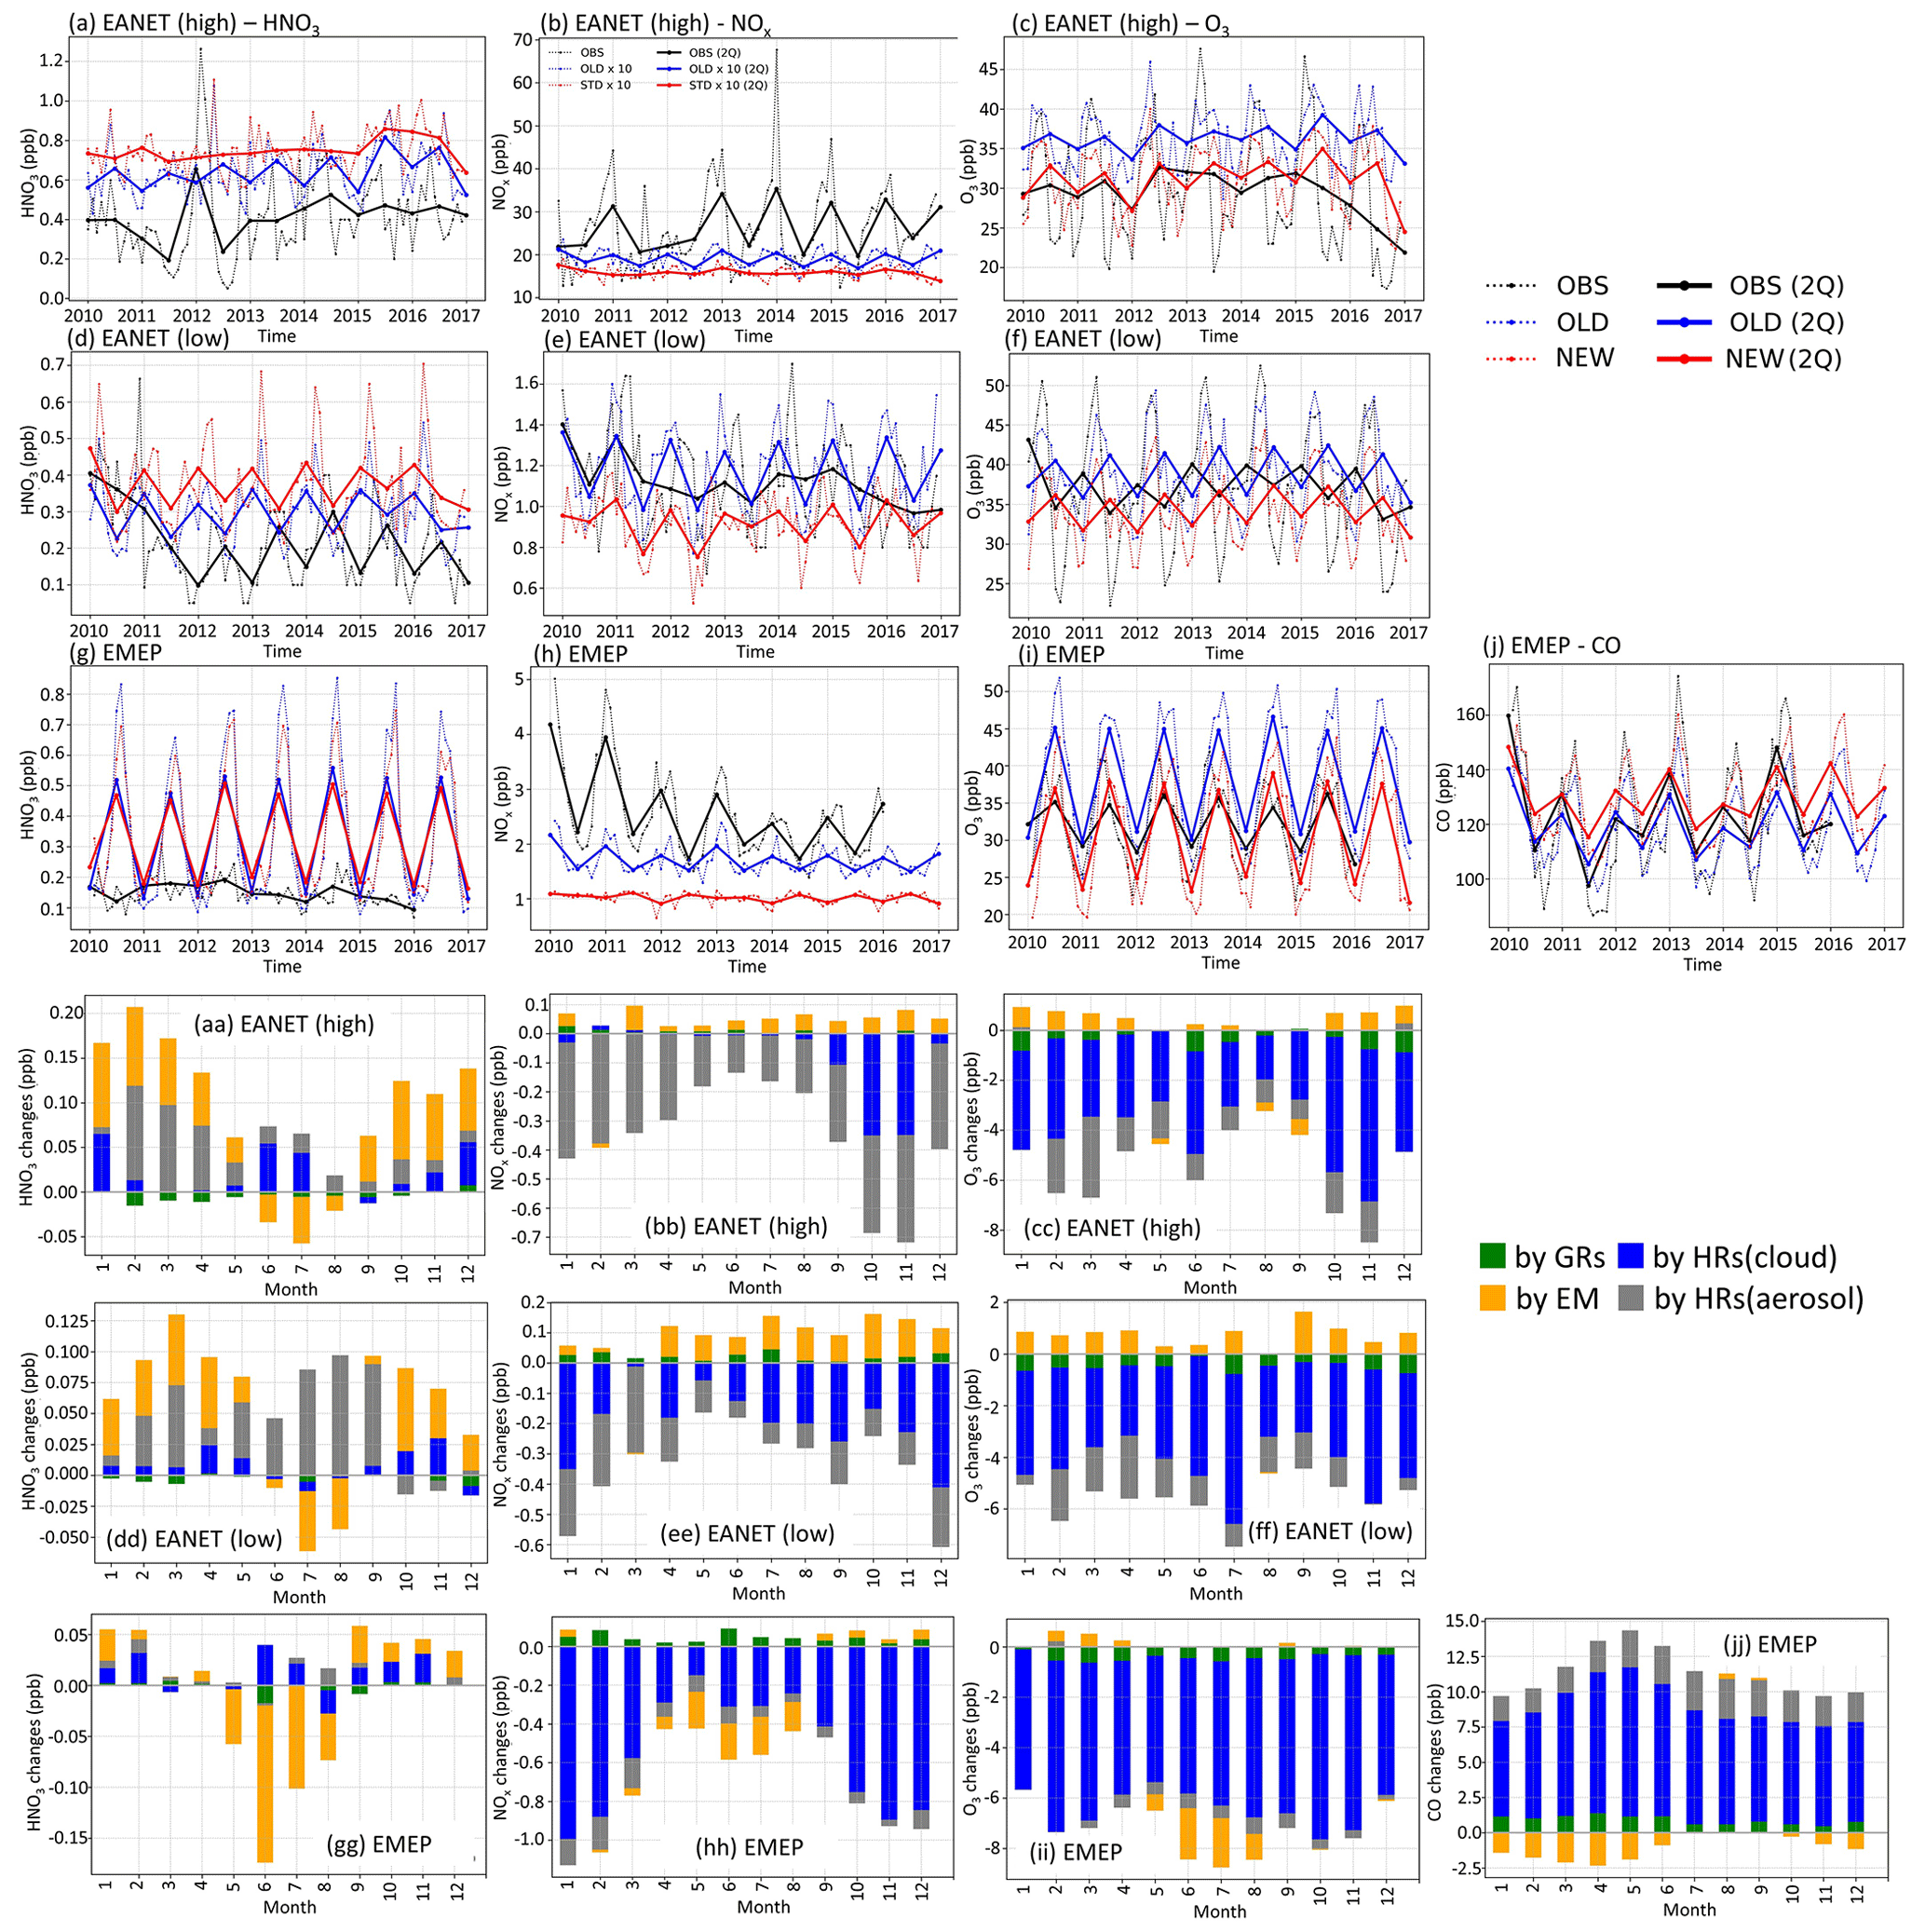
Figure 10Concentrations and changes by HONO inclusion for EANET and EMEP stations. (a–j) Observed and simulated concentrations during 2010–2016. Black lines: observation; red: STD case; blue: OLD case. In panel (b), concentrations in STD and OLD are increased 10 times for better visualization (red and blue lines). For each group of stations, dotted lines are all the station medians from each station's monthly-mean values. Thick solid lines represent two-quarters averaged from dotted lines. (aa–jj) Calculated monthly-mean changes by HONO chemistry. Green bars: monthly changes by GRs; blue: monthly changes by HRs on clouds; grey: monthly changes by HRs on aerosols; orange: monthly changes by EM. Stations are grouped as high-NOx EANET (first and fourth rows), low-NOx EANET (second and fifth rows), and all EMEP stations (third and sixth rows). First column: HNO3; second column: NOx; third column: O3; fourth column: CO.
Figure 10 compares the measured versus simulated HNO3, NOx, HONO, O3, and CO concentrations for the EANET and EMEP stations. The stations were divided into three groups: (1) high-NOx EANET stations, including Jinyunshan (China), Kanghwa, Imsil, Jeju (South Korea), Bangkok, Nai Mueang, Samut Prakan, Si Phum (Thailand), Metro Manila (Philippines), and Ulaanbaatar (Mongolia); (2) other EANET stations (39 for HNO3, 22 for O3, and 15 for NOx); and (3) all EMEP stations. The ground-based observations in the period 2010–2016 revealed the slightly decreasing NOx for moderate NOx concentrations, as well as PM2.5, and aerosols (Figs. 10e, h and S4e, g, h, i). These decreasing trends were not captured by our simulations, which used the high-emission scenario for the EDGAR/HTAP-2008 inventory. Note that NOx and PM2.5 concentrations were generally underestimated in the model (OLD), especially in high-NOx regions (Figs. 10b, e, h and S4a, d, g) with the model's averaged biases of −0.8 ppb NOx for EMEP and −4 ppb NOx for EANET (Table 7). These underestimations were stronger during winter, particularly for the high-NOx regions. It was possible that complex domestic sources could lead to diluted emissions for the simulations' moderate horizontal resolution (∼2.8∘). Higher model resolutions, such as 1.1∘, 0.56∘, or even higher, could remedy such effects (Sekiya et al., 2018).
Table 7Model comparison of different species with observations at the EMEP and EANET stations. Three-sigma-rule outlier detection is applied for each station before calculating correlation coefficients R. NOx data are filtered once more using the two-sigma rule. R and bias of the STD run are shown as bold if improved compared to the OLD run. Units for model biases: µm m−3 for PM2.5, SO, and NO; ppb for HNO3, NOx, O3, and CO.
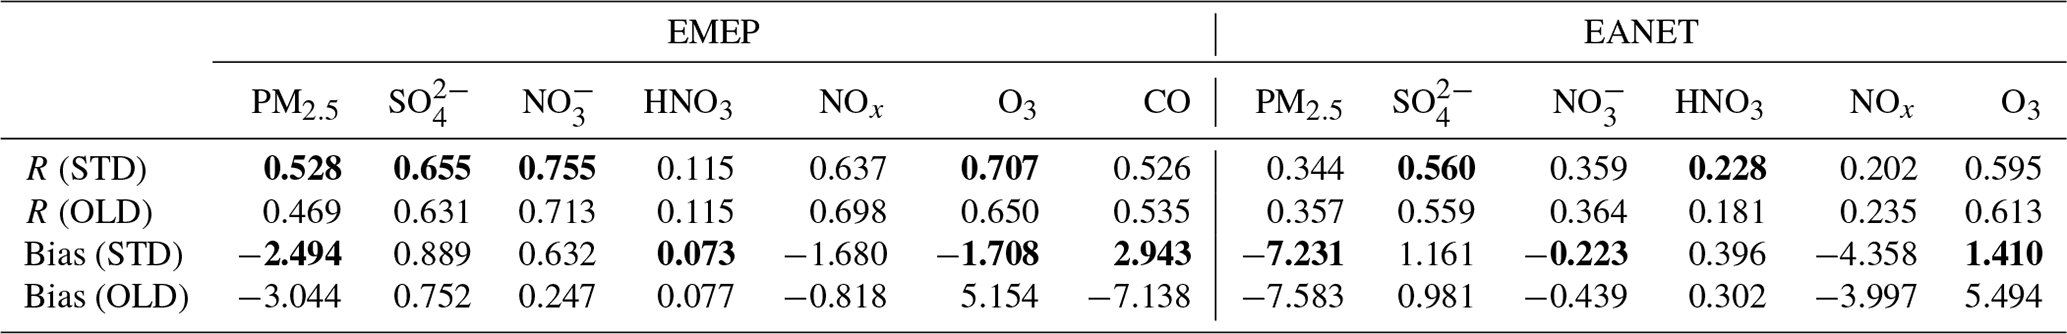
HONO chemistry in the STD case increased HNO3, NO, SO, and PM2.5 for EANET and EMEP stations compared to the OLD case (Figs. 10 and S4: red vs. blue lines). HNO3 and NO were increased as the products of NO2 conversion (Reaction R4); thus, the model underprediction for NO in EANET stations was mitigated (bias OLD → STD: m m−3). As a result of the increased OH level at the surface of these ground-based stations, SO was also increased (Li et al., 2015; Lu et al., 2018) (Fig. S4j, k, l), although this effect enlarged the model overestimation for SO species at EANET and EMEP stations (Table 7). The consequent increase in PM2.5, though minor, remedied the model underestimate for PM2.5, e.g. model bias in OLD → STD: m m−3 (EMEP). Unfortunately, the model overestimate for HNO3 in the OLD case was enlarged with the inclusion of HONO.
In the STD case, including HONO photochemistry, the negative biases of NOx in the model had been adversely enhanced due to the NO2 loss processes (bias OLD → STD: ppb for EANET; Table 7). These processes also suppressed the NOx seasonality observed at most sites (Fig. 10b, h, red lines). The lack of seasonality was driven by the substantial loss of NO2 on the surfaces of atmospheric particles during winter. For EANET's low-NOx and EMEP stations, this huge NO2 loss was attributed to cloud surfaces (Fig. 10ee, hh: blue bars). However, NO2 uptake by aerosols has a comparable contribution effect to the cloud effect in high-NOx environments such as Jinyunshan (Fig. 10bb, grey bars). Namely, nearly half of the NO2 was converted to HNO3 in Reaction R4; Fig. 10aa, dd, gg) without an efficient recycling process, leading to an overall removal of NOx. This lack of NOx could be the main driver for the seasonal NOx deterioration and the exacerbated overestimations of HNO3 by simulations.
The STD O3 simulation exhibited moderate and strong positive correlations with EANET and EMEP observations, 0.595 and 0.707, respectively (Table 7). The model improvements for SO, NO, PM2.5, and HNO3 were minor. However, the model improvement for O3 was considerable, with a bias reduction of ∼67 % for EMEP and ∼74 % for EANET (Table 4). In the STD case, too little NOx was left from its heterogeneous loss, causing a net O3 chemical destruction (because lacking atomic oxygen from NO2 photolysis), which in turn reduced the model overestimates for O3 in the OLD case (Table 7; Fig. 10c, f, i, red versus blue lines). However, further improvements in the chemical scheme were necessary to reproduce the O3 measurements better; namely, a larger O3 reduction for the summer and a reduced effect in simulated O3 for the winter might alleviate the undesired effects. A delayed minimum from summer (as observed) to early winter (calculated in OLD and STD runs) causing opposite seasonality for O3 was prominent for the low-NOx EANET stations (Fig. 10f). The effects of HONO chemistry on the mean OH levels were small, although it showed slight increases for OH's minima (Fig. S4j, k, l). Thus, due to the apparent O3 reduction for EMEP stations, CO was increased. Despite the reductions in NOx and O3 levels being exaggerated during winter, the increment in CO reconciled the model's underestimation of CO high peaks in spring (Fig. 10j), thereby strongly dwindling the bias for CO by ∼59 % (Table 4). However, the CO concentrations during summer should be reduced in the STD case to capture the measurement. This finding might indicate inadequate HONO emissions for the EMEP stations (Fig. 10jj: orange), which otherwise had reducing effects on NOx, O3, and CO levels during summertime.
The breakdown scrutinies for aerosols and clouds effects for the ground-based stations (EANET/EMEP) also revealed the vast role of cloud uptakes in the HONO impacts on NO aerosols, NOx, O3, and CO (Figs. 10 and S16: blue bars), while the HONO impacts on HNO3, PM2.5, and SO aerosols were governed by aerosol uptakes and HONO emission (grey and yellow bars).
The existing ill reproduction in NOx's seasonality and overestimations for HNO3 might be amended by an explicit inventory for direct NOx emissions and an efficient NOx-recycling process. Such a mechanism via HNO3 uptakes on soot surfaces (HNO3 → NO2) was also tested in this study using the uptake coefficient range from (Lary et al., 1997; Akimoto et al., 2019). Unfortunately, this heterogeneous HNO3 conversion could not solely serve as a productive NOx-recycling process in the EANET/EMEP stations (not shown). Among the additional cases described in Table 5, the alternated HONO:HNO3 (0.9:0.1) product ratio of Reaction (R4) (ratR4 case) showed a good remedy for NOx at EMEP stations (Fig. S11g: brown vs. black). For the EANET sites, the photolysis of adsorbed HNO3 on ground surfaces (JANO3-A case) avoiding NOx removal via HNO3 could remedy the NOx seasonality issue for these ground-based stations (Fig. S11a, d: green vs. black). However, the photolysis of adsorbed HNO3 on ground surfaces and aerosol/cloud surfaces (JANO3-B and JANO3-C cases) was not an effective NOx-recycling process for EANET/EMEP measurements, leaving only slight differences in surface NOx levels compared to the STD case (Fig. S11a, d, g: cyan and orange vs. reds). However, the heterogeneous photolysis of HNO3 increased O3 and OH at the high-NOx regions instead of O3 reduction in the STD case (Fig. S11b, c: cyan and orange vs. blue), which brought reconciliation to the underestimates for O3 peak in springs (Fig. S11e: dotted cyan vs. dotted black), although the runs with HNO3 photolysis still did not capture the O3 minimum in summer. Only the ratR4 case could capture the O3 minimum in summer among the sensitivity cases, which indicated the need for stronger NOx-recycling processes for these ground-based stations.
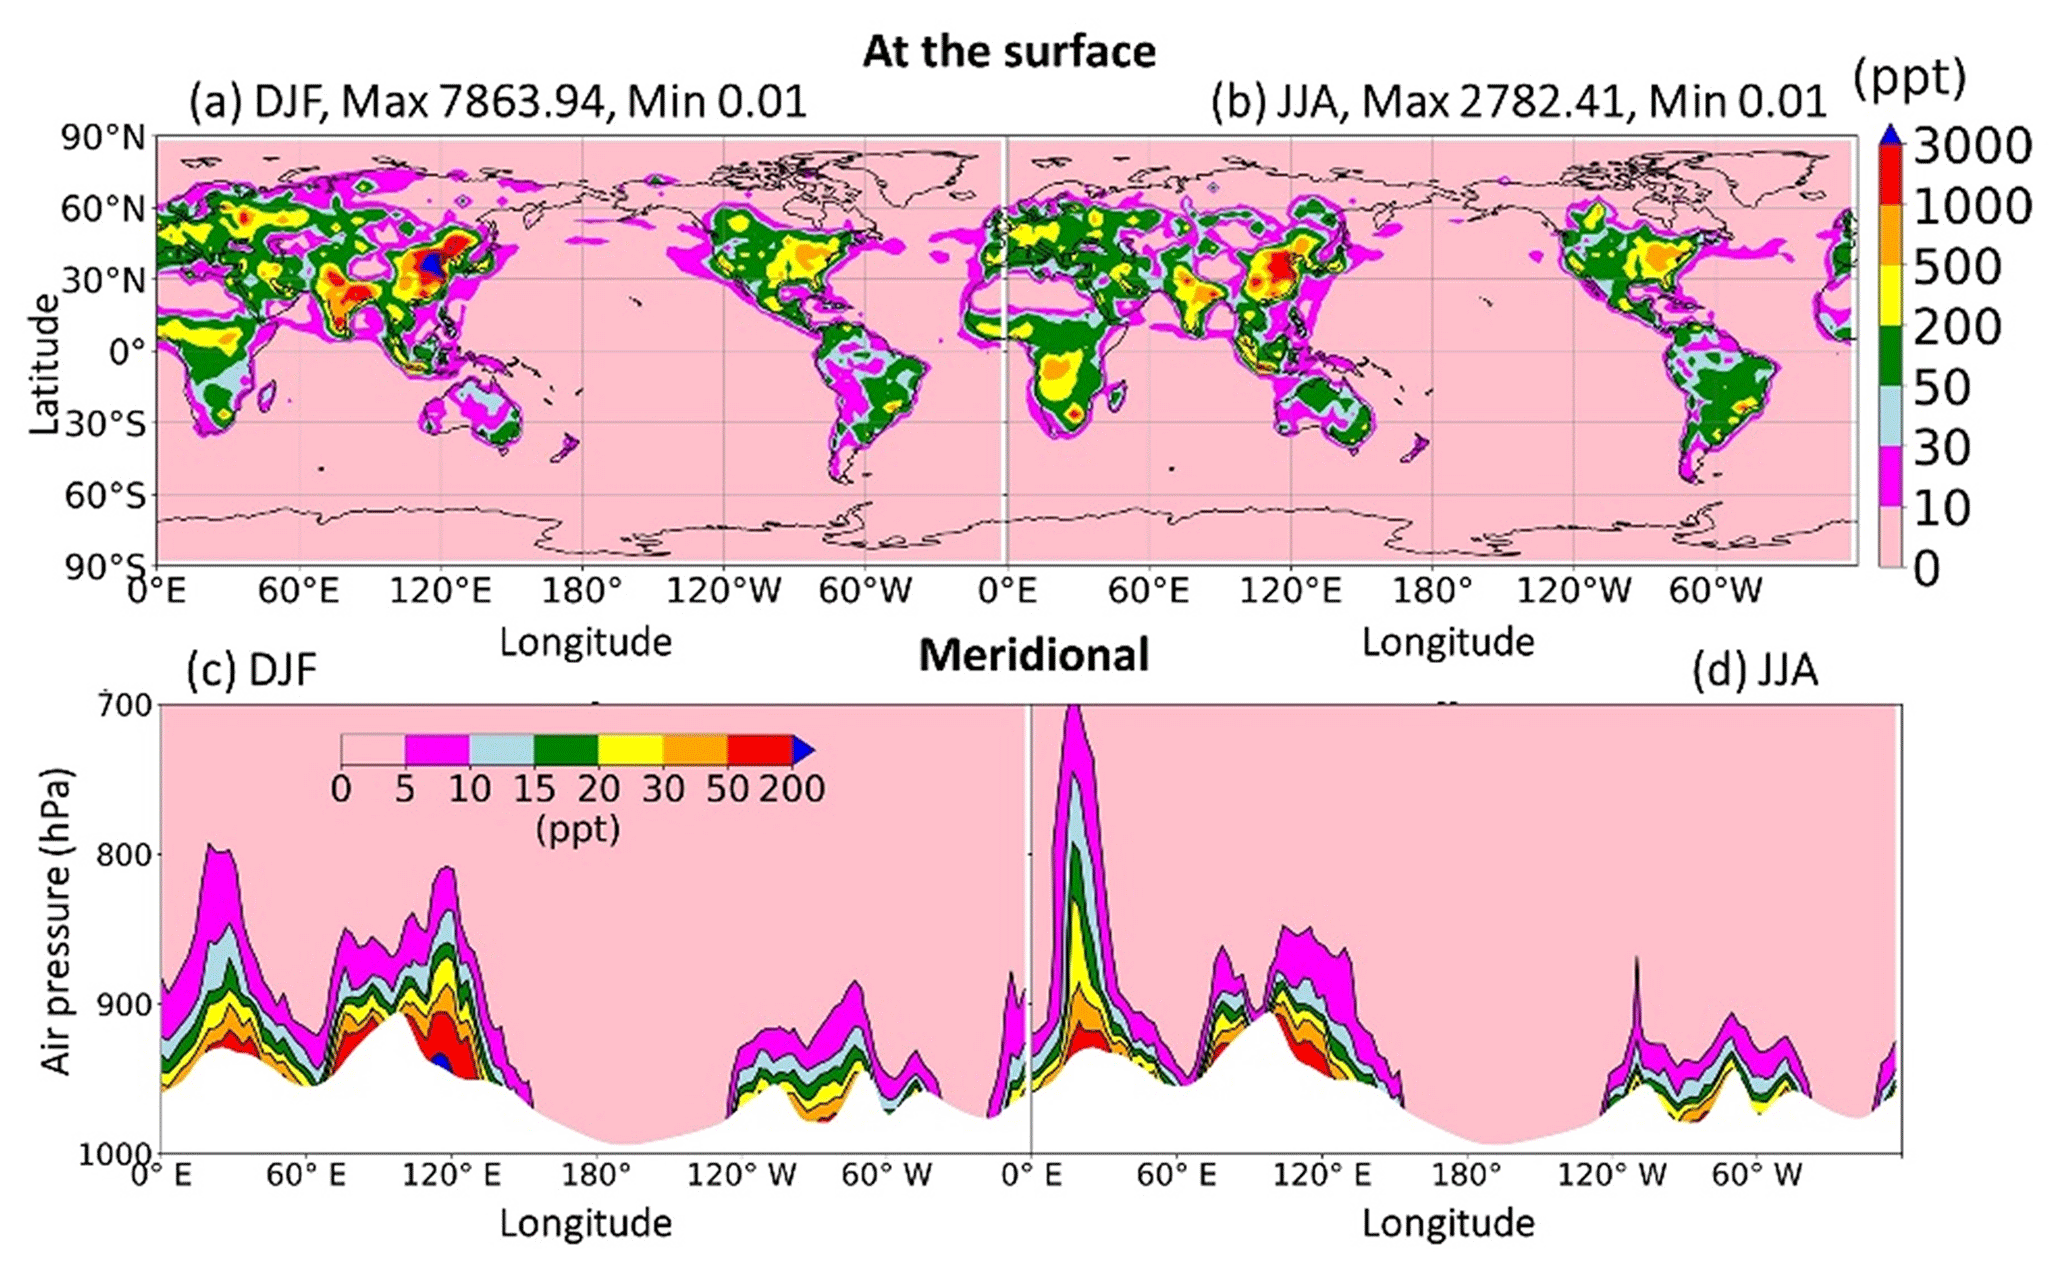
Figure 11Distribution of HONO levels at the surface (a–b) and meridional mean (c–d).
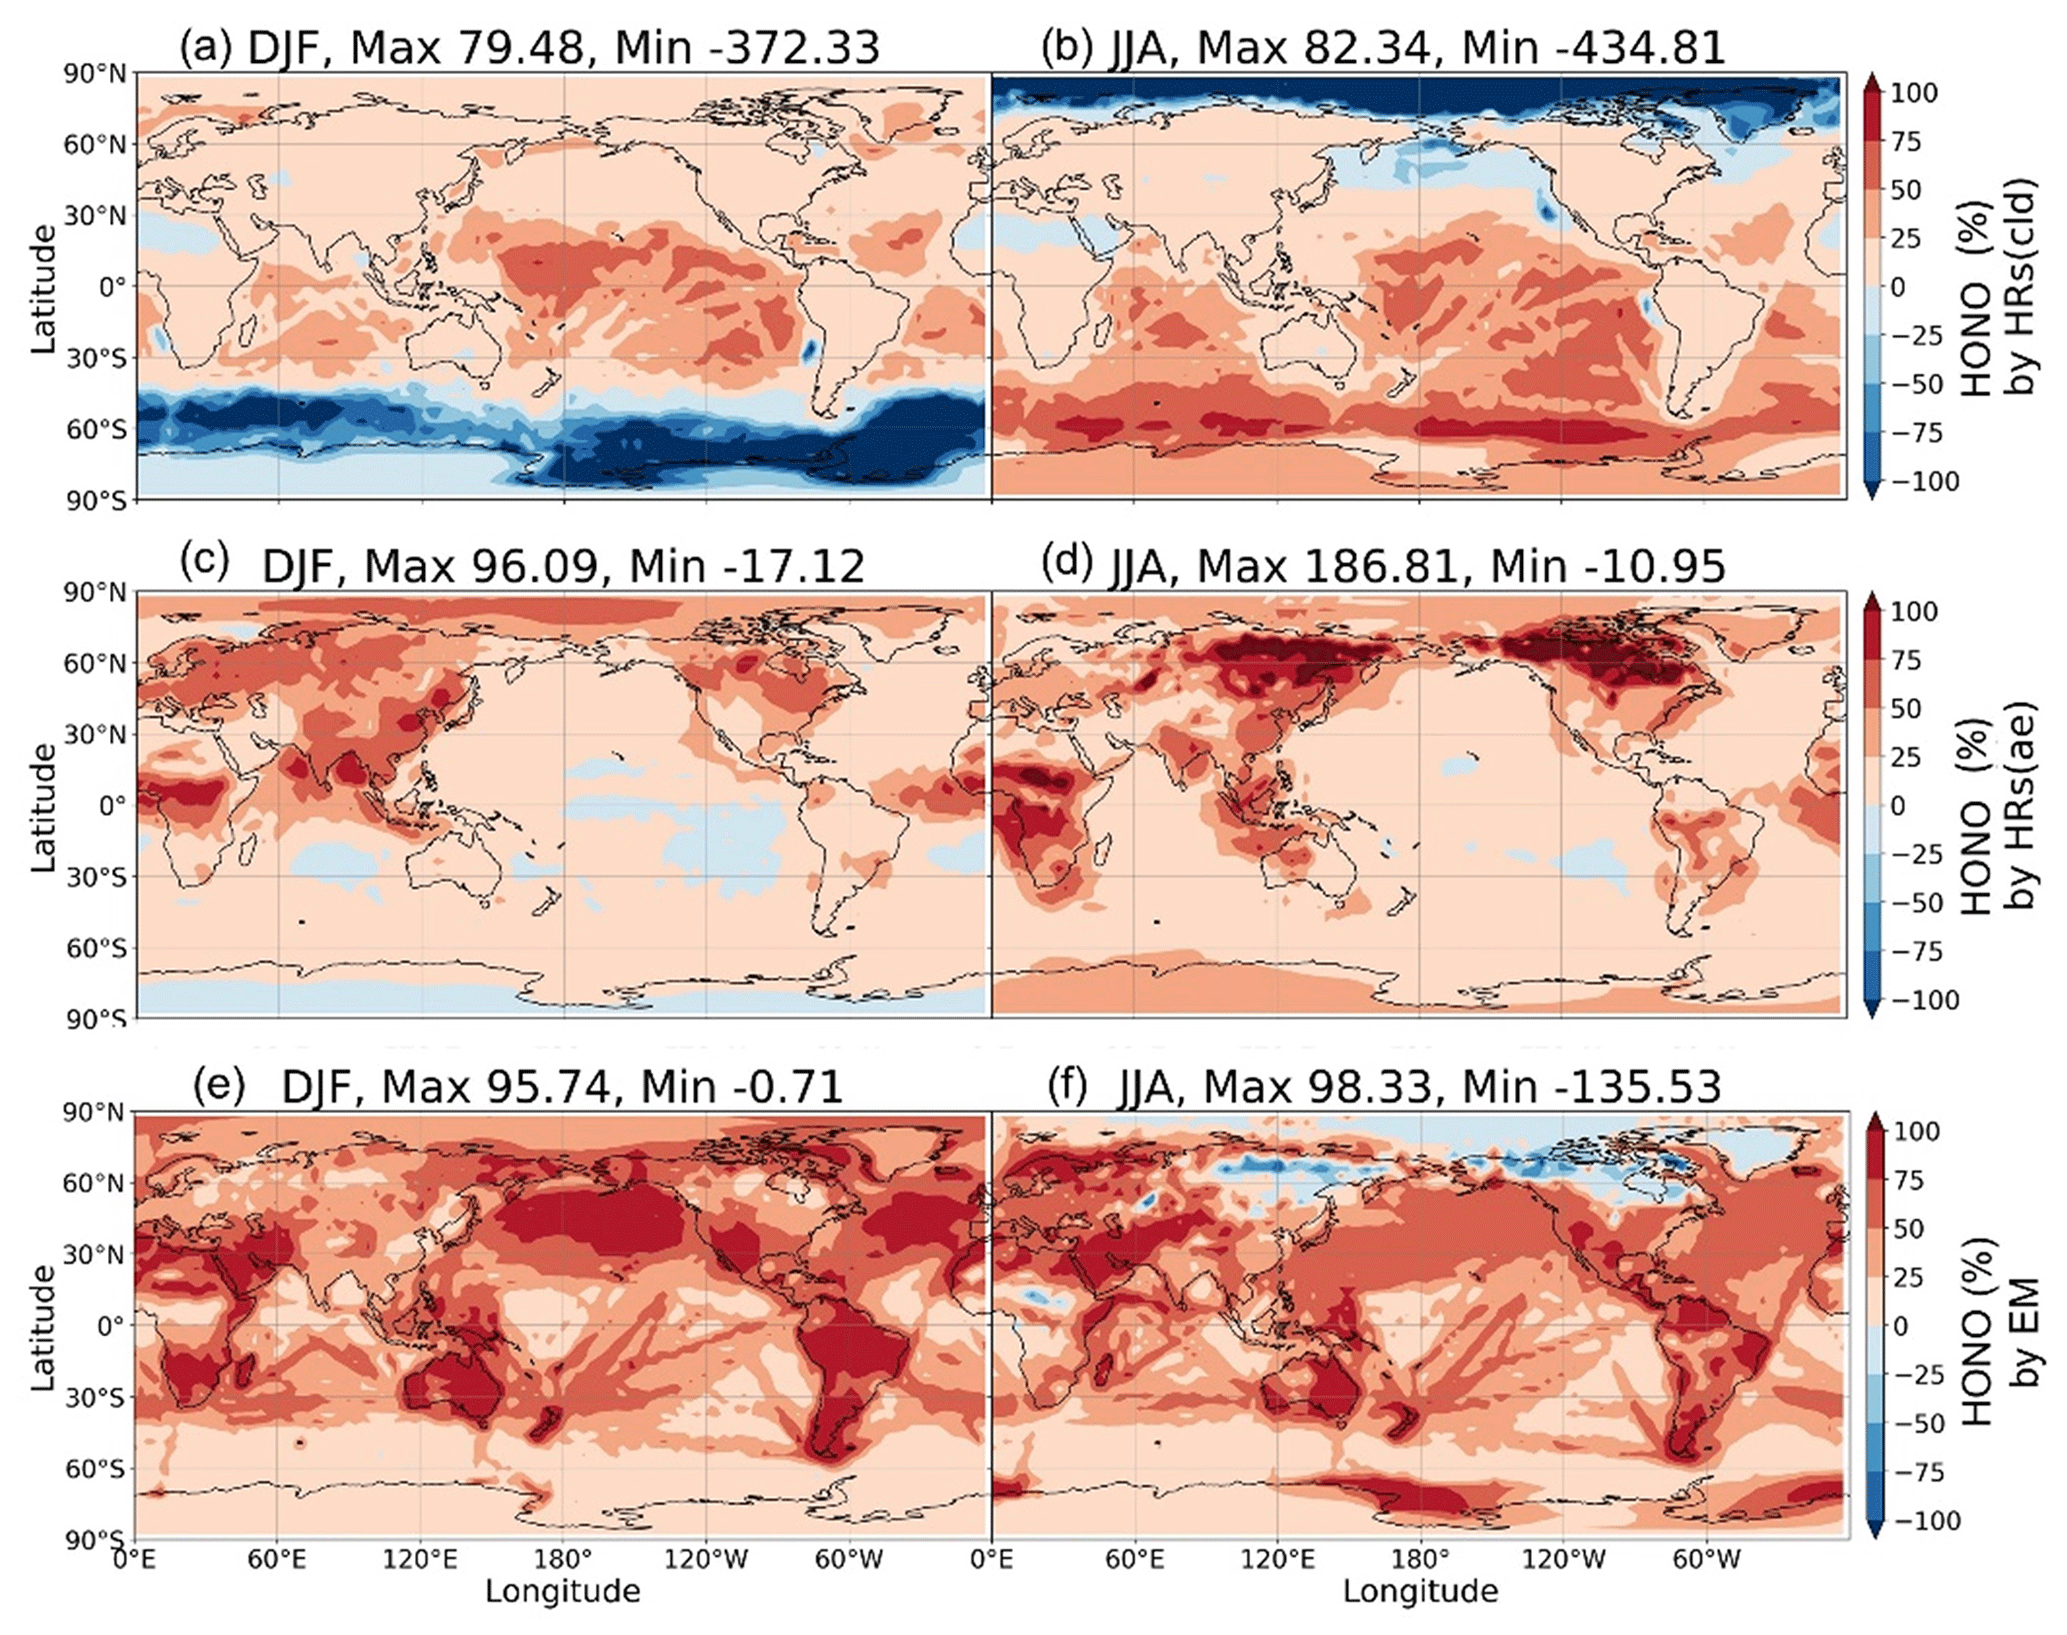
Figure 12Contribution of HRs and EM to surface HONO concentrations. Contributions of HRs onto ice and clouds (a, b), HRs onto aerosols (c, d), and EM (e, f) in DJF (a, c, e) and JJA (b, d, f) are plotted. Each contribution is determined by the difference of HONO in two simulations: (a, b) GR+HR(cld) and GR; (c, d) GR+HR and GR+HR(cld); and (e, f) STD and GR+HR, divided by HONO in the STD case. The maximum and minimum values are out-scaled and hence displayed at the top of each panel.
3.2 Distribution of HONO and global effects of HONO chemistry
3.2.1 Global HONO distribution and burden
This section sheds light on the global HONO distribution computed for the STD case. The surface HONO concentration peaked over the geographical region that includes China, with seasonal mean levelled up to 2.8 ppbv during summer and 7.8 ppbv during winter (Fig. 11a, b). The winter peak agreed with observations for a large industrial region in the Yangtze River Delta of China (Zheng et al., 2020). The high concentrations of HONO were also identified in other industrial regional clusters: the northeastern US (seasonal mean up to 0.5–1 ppbv); India (up to 1–3 ppbv); forest regions, especially the extratropical evergreen forest in Europe (up to 1–3 ppbv); and Africa (up to 0.5–1 ppbv). Over the ocean, HONO levels remained at 10–30 pptv in the coastal regions and below 10 pptv far off the coast. The simulated HONO distribution was in line with a previous study (Elshorbany et al., 2012) despite the peaks over polluted Chinese areas being markedly higher in our model (10-fold). The overestimation associated with the soot uptake in our model has been previously neglected. The highest HONO concentrations (10–30 pptv) in the free troposphere (at 2500 m) were simulated over Africa's biomass burning region during wet months (JJA) (Fig. 11c, d), which could arise due to the NO2 uptake on aerosols, originated from this wildfire source.
In the model, HRs and EM were the main contributors to HONO at the surface layer (Fig. 12) by providing efficient HONO formation and promoting gas Reaction (R2). Of the various surfaces provided for HRs in our model, liquid/ice cloud particle surfaces were supposed to catalyse significant photochemical effects in remote regions. This phenomenon has not been previously addressed in other studies in detail. The uptake of liquid/ice cloud particles either increased HONO formation via Reaction (R4) for the tropical and southern oceans or reduced it via Reaction (R6) along 60∘ S in DJF and the Arctic in JJA (Fig. 12a, b). Besides cloud particles, HRs on aqueous aerosols also produced HONO in a continental atmosphere rich in sulfate, dust, and soot particles (Fig. 12c, d). EM included in the model has sharply increased the HONO level over deserts (Sahara, Arabian), grasslands (South Africa, South America), and boreal and agricultural land (western Europe, Australia). This finding agreed well with another study, based on spaceborne observations for HONO in wildfire plumes (Theys et al., 2020) and along-ship tracks in the marine boundary layer (Fig. 12e, f).
Table 8Global sources and sinks of tropospheric HONO calculated by CHASER (2011). The bold figures signify the two pathways that contribute the most to tropospheric HONO.
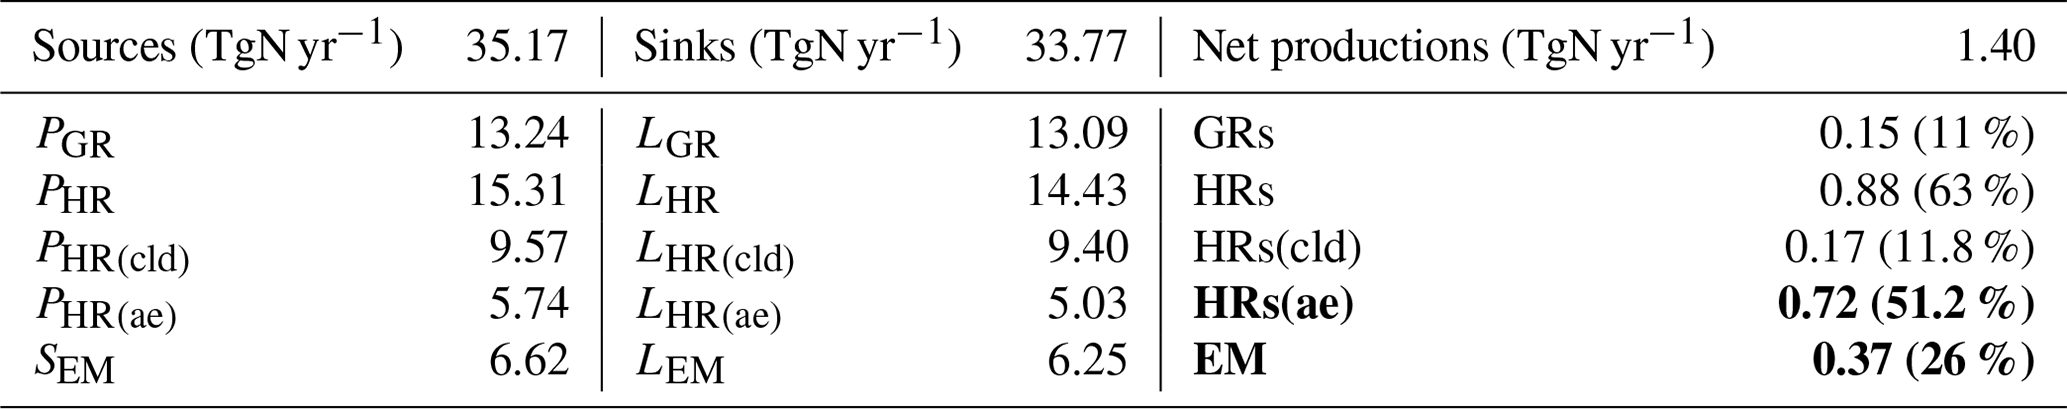
Table 8 summarizes the global sources and sinks of tropospheric HONO quantified by CHASER. The simulations indicated that GRs contribute only 11 % of the HONO net production. HRs and EM produced more significant HONO (63 % and 26 % HONO net production, respectively). The pyrogenic HONO emission estimated in this study might be underestimated as the HONO:NOx emission ratio could be enhanced by up to 1 at extratropical evergreen forests (universally 0.1 in this study (STD)) (Theys et al., 2020). For large metropolitan areas such as those in China, HRs and EM had also been reported as the two most significant contributors to HONO formation, at ∼59 % and 26 %–29 %, respectively (Li et al., 2011; Zhang et al., 2016). Of the various surfaces provided for HRs, aerosols represent a more effective HONO formation site (∼51.2 %) compared with ice and clouds, as they are contributing only 11.8 % to HONO production. Moreover, the HONO loss through photolysis Reactions (R1) and (R3) was equivalent to its uptake onto the particle Reaction (R6). In equilibrium, the tropospheric abundance of HONO averaged over the globe was estimated to be 1.4 TgN in our model.
HONO production calculated in sensitivity cases (Sect. 3.1.2) is recorded in Table S5 (last column), and the spatial distributions are plotted in Fig. S12. The small supplement by the photolysis of adsorbed HNO3 on ground surfaces (JANO3-A case) to surface HONO concentration and tropospheric HONO burden (1.40→1.45 TgN) was consistent with the discussion for the EMeRGe campaign. In the JANO3-B and JANO3-C cases, tropospheric HONO burden was increased to 2.02 and 2.93 TgN, respectively, mainly remaining for the lower troposphere (∼600 hPa) (Fig. S12g, h). Compared to HNO3 photolysis, the enhanced aerosol uptake (maxST case) produced HONO more extensively over the source region and in the winter hemisphere where there was no photolysis (Fig. S12a–d). Therefore, the maxST case did not produce enough HONO during EMeRGe (worse than the JANO3 cases). However, the global HONO burden in the maxST case was added to 7.79 TgN, which might be because we set the enhanced aerosol uptake of NO2 for all environments. The combined cases (maxST+JANO3-B or maxST+JANO3-C), although appropriately approaching daytime HONO production as well as NO2 and O3 levels during EMeRGe, incredibly escalated the global HONO burden to 12.64 and 17.13 TgN, respectively (Table S5), more via the enhanced aerosol-uptake setting that could reach the upper troposphere (Fig. S12k, l). However, it might be more realistic if HONO production stayed at the lower troposphere (Eshorbany et al., 2012). In future work for the combined cases as standard cases, the amplified NO2 conversion on aerosols should be confined to high SAD regions (Kalberer et al., 1999; Stadler and Rossi, 2000) or to the daytime only (Notholt et al., 1992; Stemmler, 2007).
P denotes chemical production, S denotes source (emission + chemical production), and L denotes loss. The numbers in parentheses represent the portion of each pathway to the total HONO net production. Bold lines show the most significant contributing mechanisms to the HONO burden.

Figure 13TCO percentage differences between model and OMI. (a, c, e) STD versus OMI and (b, d, f) OLD versus OMI for annual (a, b), December–January–February (DJF) (c, d), and June–July–August (JJA) (e, f). (g, h, k) Differences for the maxST+JANO3-B case versus OMI for annual, DJF, and JJA, respectively (g, h, k).
3.2.2 Global effects on tropospheric column ozone
The comparison between the simulation and OMI spaceborne observations for tropospheric column ozone (TCO) can be examined as a global effect for ozone. In Fig. 13, the STD run with HONO inclusion improved the overall tropospheric column ozone (TCO) distribution observed by the OMI, especially at the mid-latitudes. Figure S3 indicated a TCO reduction when HONO chemistry was included in the STD case (red lines vs. green lines). Although HONO photolysis Reaction (R1) was a source of OH, supposedly increasing the tropospheric oxidizing capacity, the calculation in the STD case showed the OH and O3 increased only occur at the surface of polluted sites (Fig. 14a, e). The NO2 conversion to HONO and HNO3 (Reaction R4) became a NOx's removal pathway at remote regions, thus restricting the formation of O3 and OH for the larger part of the troposphere (lacking atomic oxygen from NO2 photolysis). Figure 13 shows that the O3-reducing effects of HONO chemistry greatly reduced the model overestimates in the OLD simulation for the general Northern Hemisphere and polluted regions such as China. However, in the NP region, the inclusion of HONO only reduced the model overestimates during the insignificant episodes of TCO (autumn to early winter) while extending the underestimates for TCO for the rest of the year (Fig. S3b). These O3 underestimates in the NP region are also visible for the modelled surface air versus the measurements during the Mirai cruises (Fig. 6a, b). Notably, these underestimates for O3 could hold up to 400 hPa, as seen in comparison with the ATom-1 flights (Fig. 5f: 400–900 hPa). This phenomenon could be related to the stratospheric downward transport and insufficient vertical mixing, as discussed in Sects. 3.1.3 and 3.1.4, for comparisons in the NP region's surface air and free troposphere. Although the HONO level in STD remained <10 ppt for this area (Fig. 11), the O3-reducing effects exacerbated the model discrepancy. The HONO photochemistry was unlikely to be the primary driver of this phenomenon as the ozone simulation was improved over the continents when the HONO photochemistry is included.
In the combined sensitivity case maxST+JANO3-B (Sect. 3.1.2), O3 was further reduced than the STD case. The reduction in TCO might be due to the enhanced NO2 uptake on aerosols, leading to more substantial O3 formation restriction. The maxST+JANO3-B case showed better harmony with OMI for the regions of TCO overestimations (Fig. 13g, h, k), especially the annual mean (g panel). However, the underestimates of TCO, including the NP region, were worsened. These results indicated that the reduction for O3 by HONO chemistry was reasonable, and the combined cases such as maxST+JANO3-B could be plausible, although the estimated reduction degree should be reduced by elaborating the maxST's reactive conditions.
3.2.3 Implication of HONO on the tropospheric photochemistry
In this section, the global impact of HONO photochemistry is elucidated. To this end, Table 8 summarizes the HONO budget and the contribution of each pathway to the HONO photochemical cycle. Table 9 describes its consequences for the lifetime of CH4 and the budgets of NOx, O3, and CO. The gaseous reactions of HONO tended to increase the abundance of NOx, O3, and CO (+1.01 %, +0.15 %, +0.44 %, respectively) and CH4 lifetime (+0.36 %) in the troposphere. Without heterogeneous and direct emissions, the relatively low HONO formation by gaseous reactions (11 % of the total net HONO production; Table 8) did not cause any significant effects on NOx, O3, and CO in the troposphere.
Table 9CH4 lifetime and tropospheric abundances for NOx, O3, and CO and the changes by HONO chemistry.
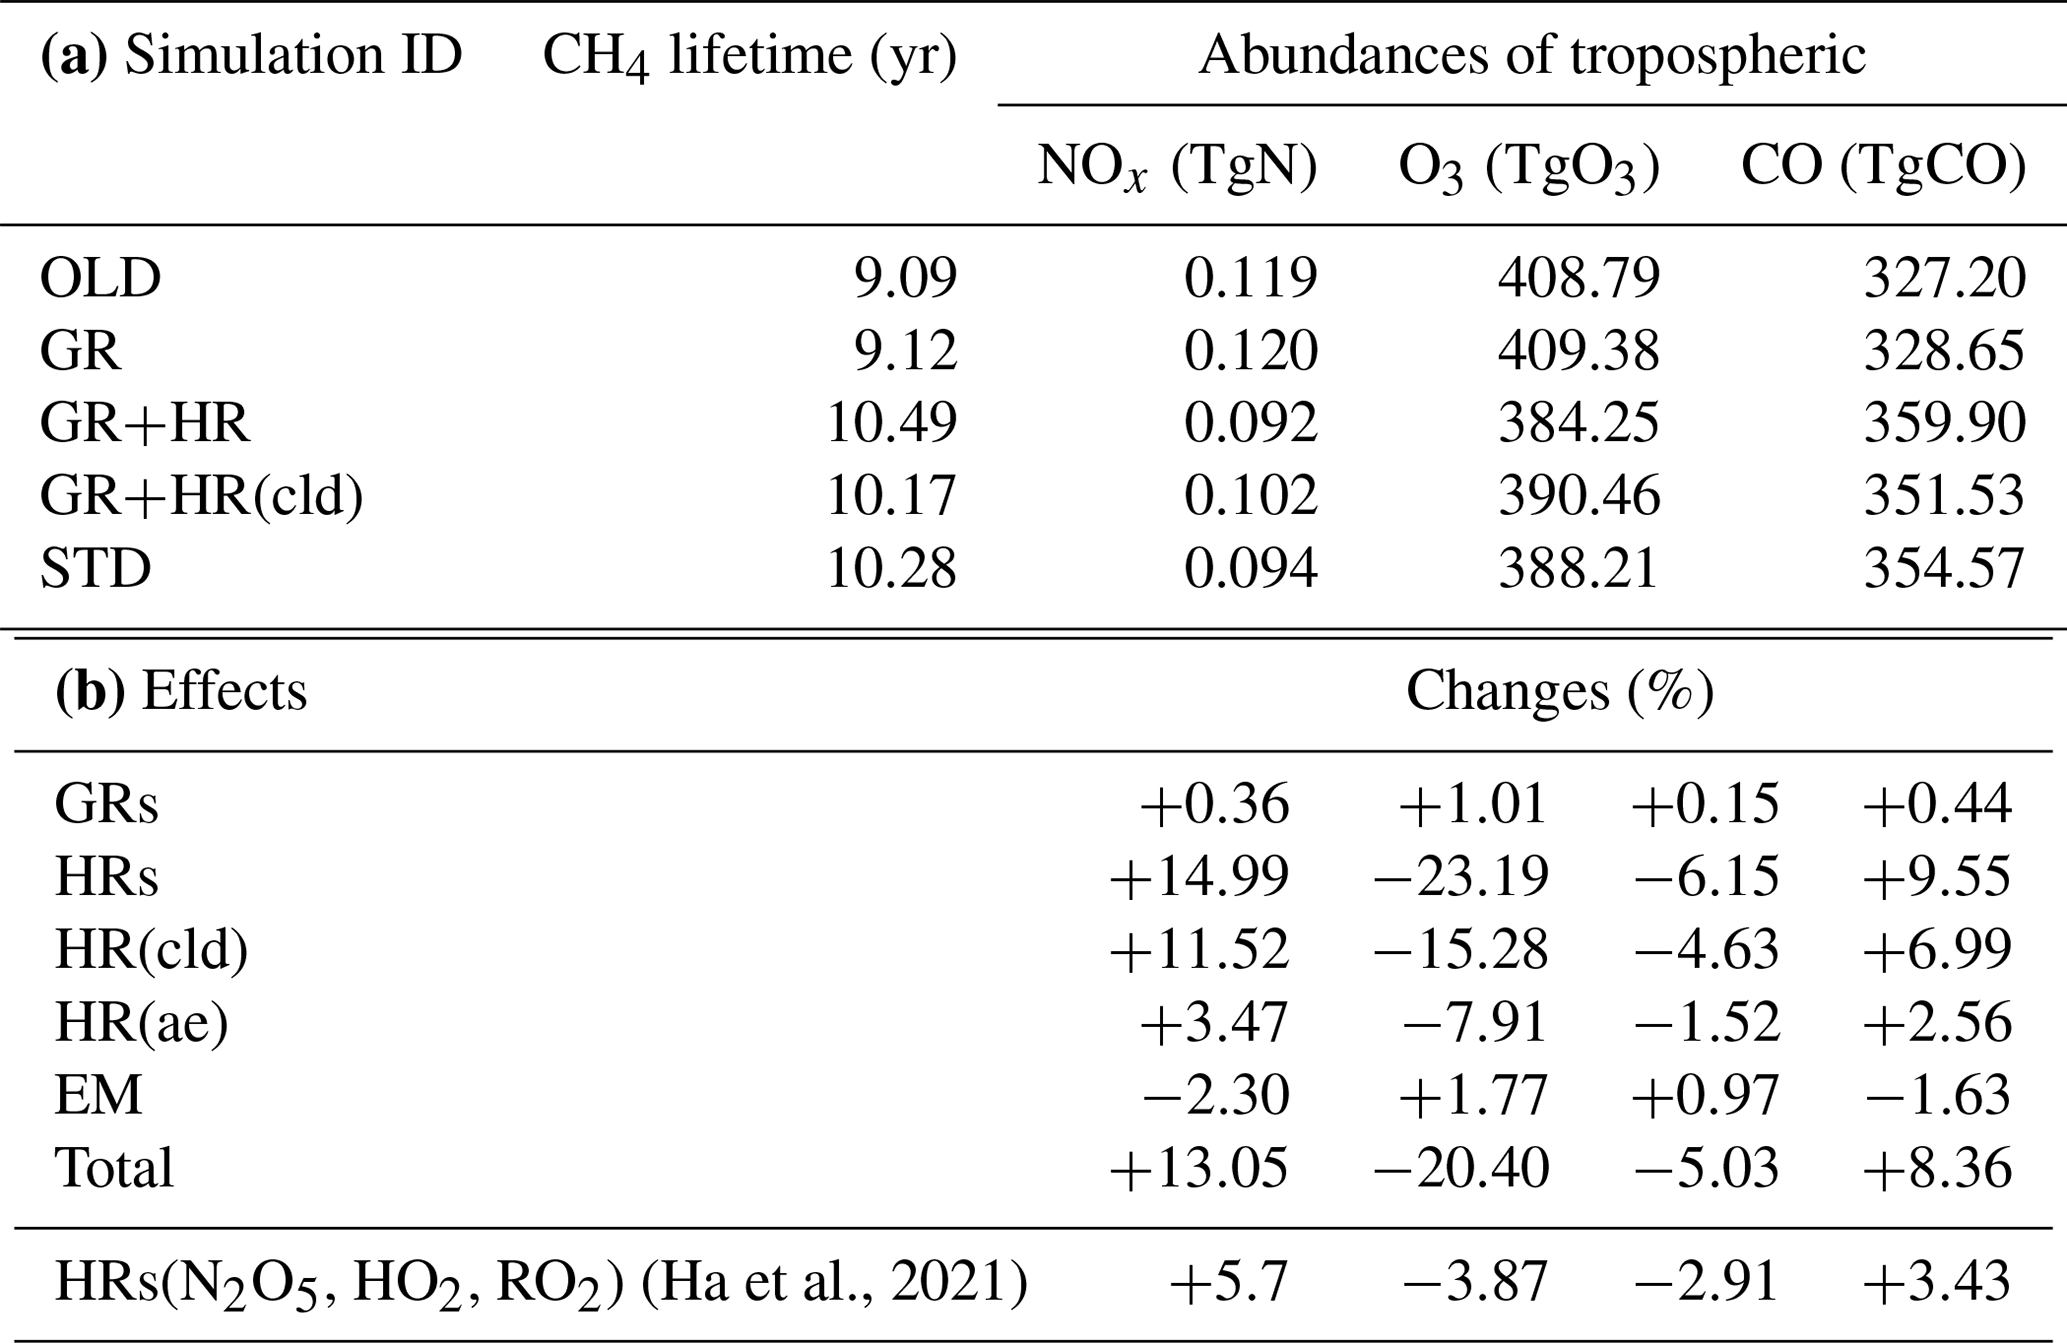
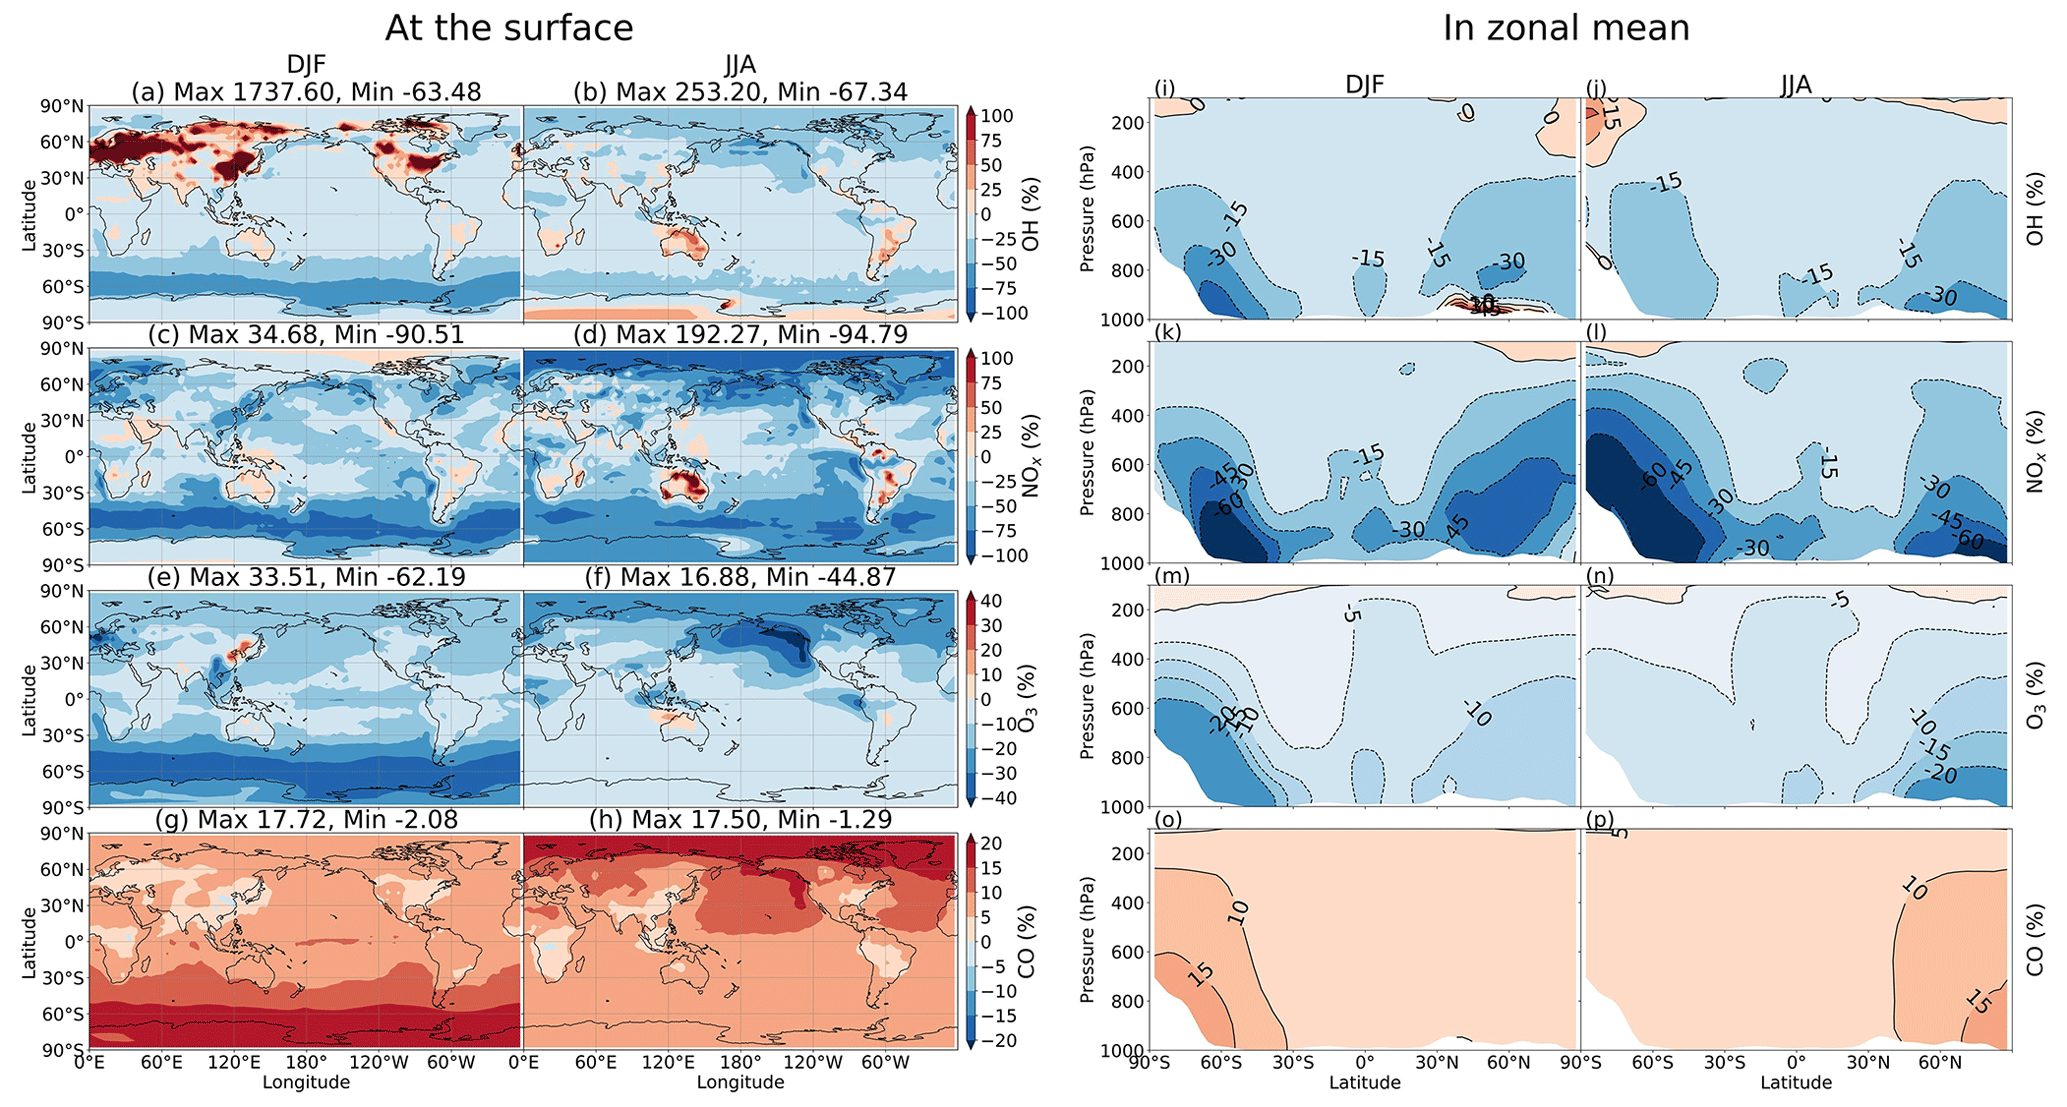
Figure 14Effects of the HONO photochemistry on the tropospheric oxidants OH (first row of panels), NOx (second row of panels), O3 (third row of panels), and (CO last row of panels). Effects at the surface (a–h) and zonal means (i–p) are shown.
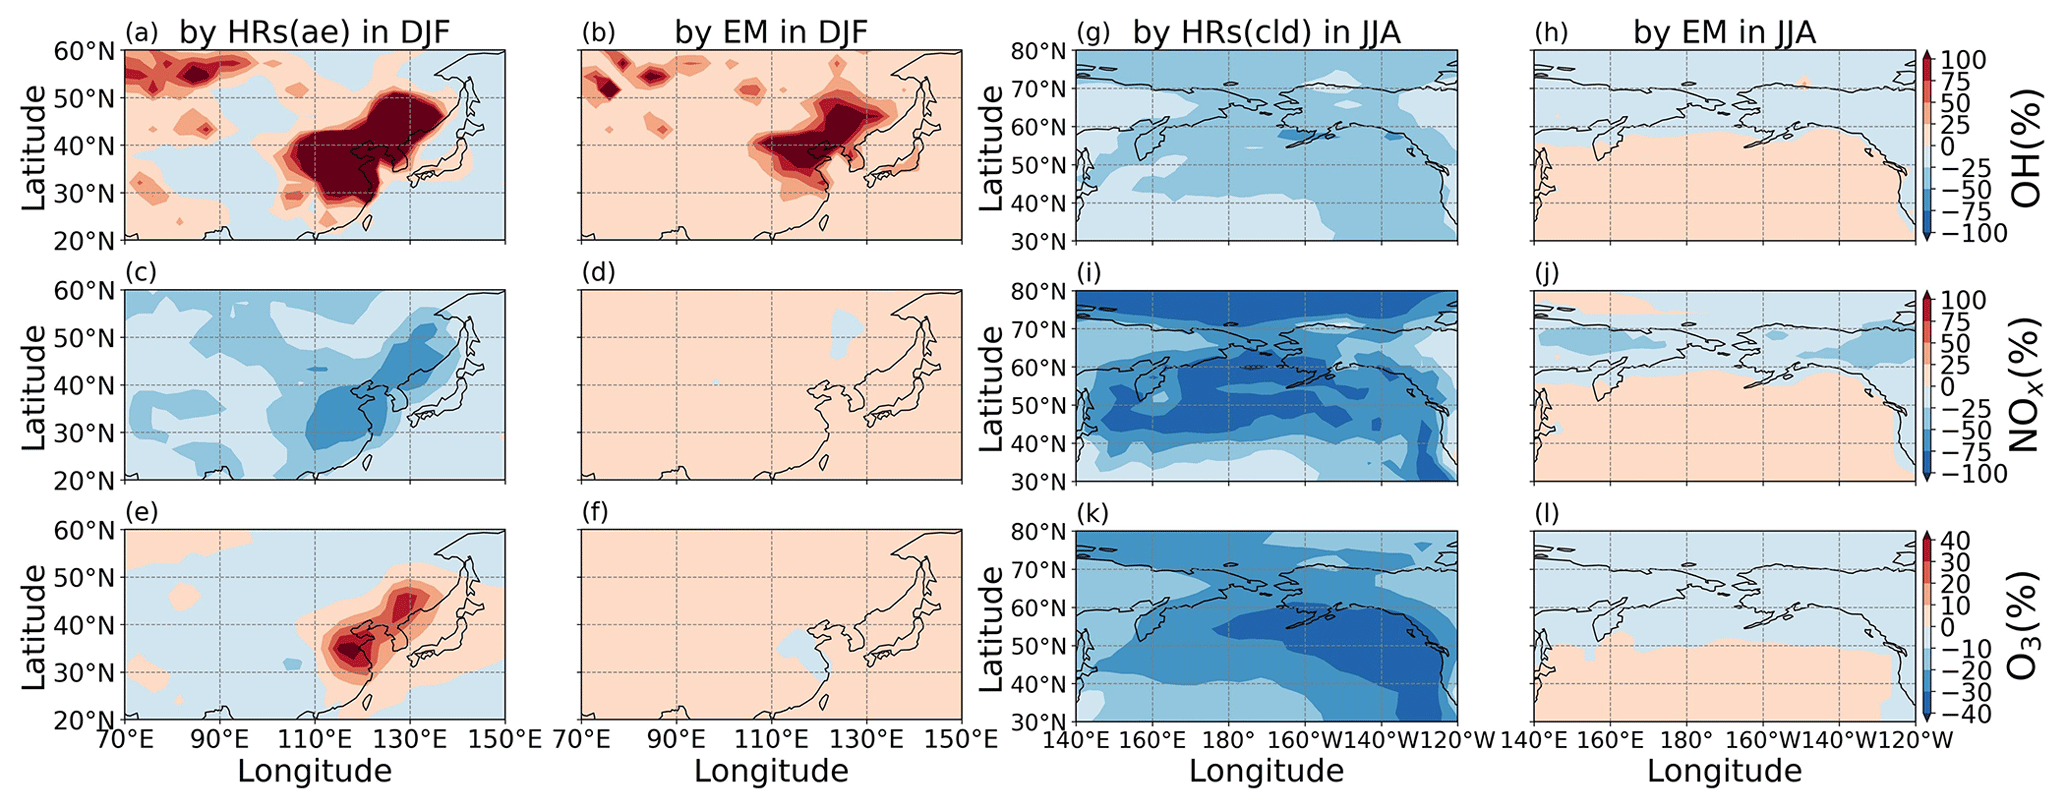
Figure 15Effects of HONO photochemistry for the surface layer, for OH (a–b, g–h), NOx (c–d, i–j), and O3 (e–f, k–l) over the northeastern China region in DJF (a–f) and the NP region in JJA (g–l) from dominant pathways of HONO by heterogeneous reactions of aerosols (a, c, e), heterogeneous reactions ice and clouds (g, i, k), and direct HONO emission (b, d, f, h, j, l).
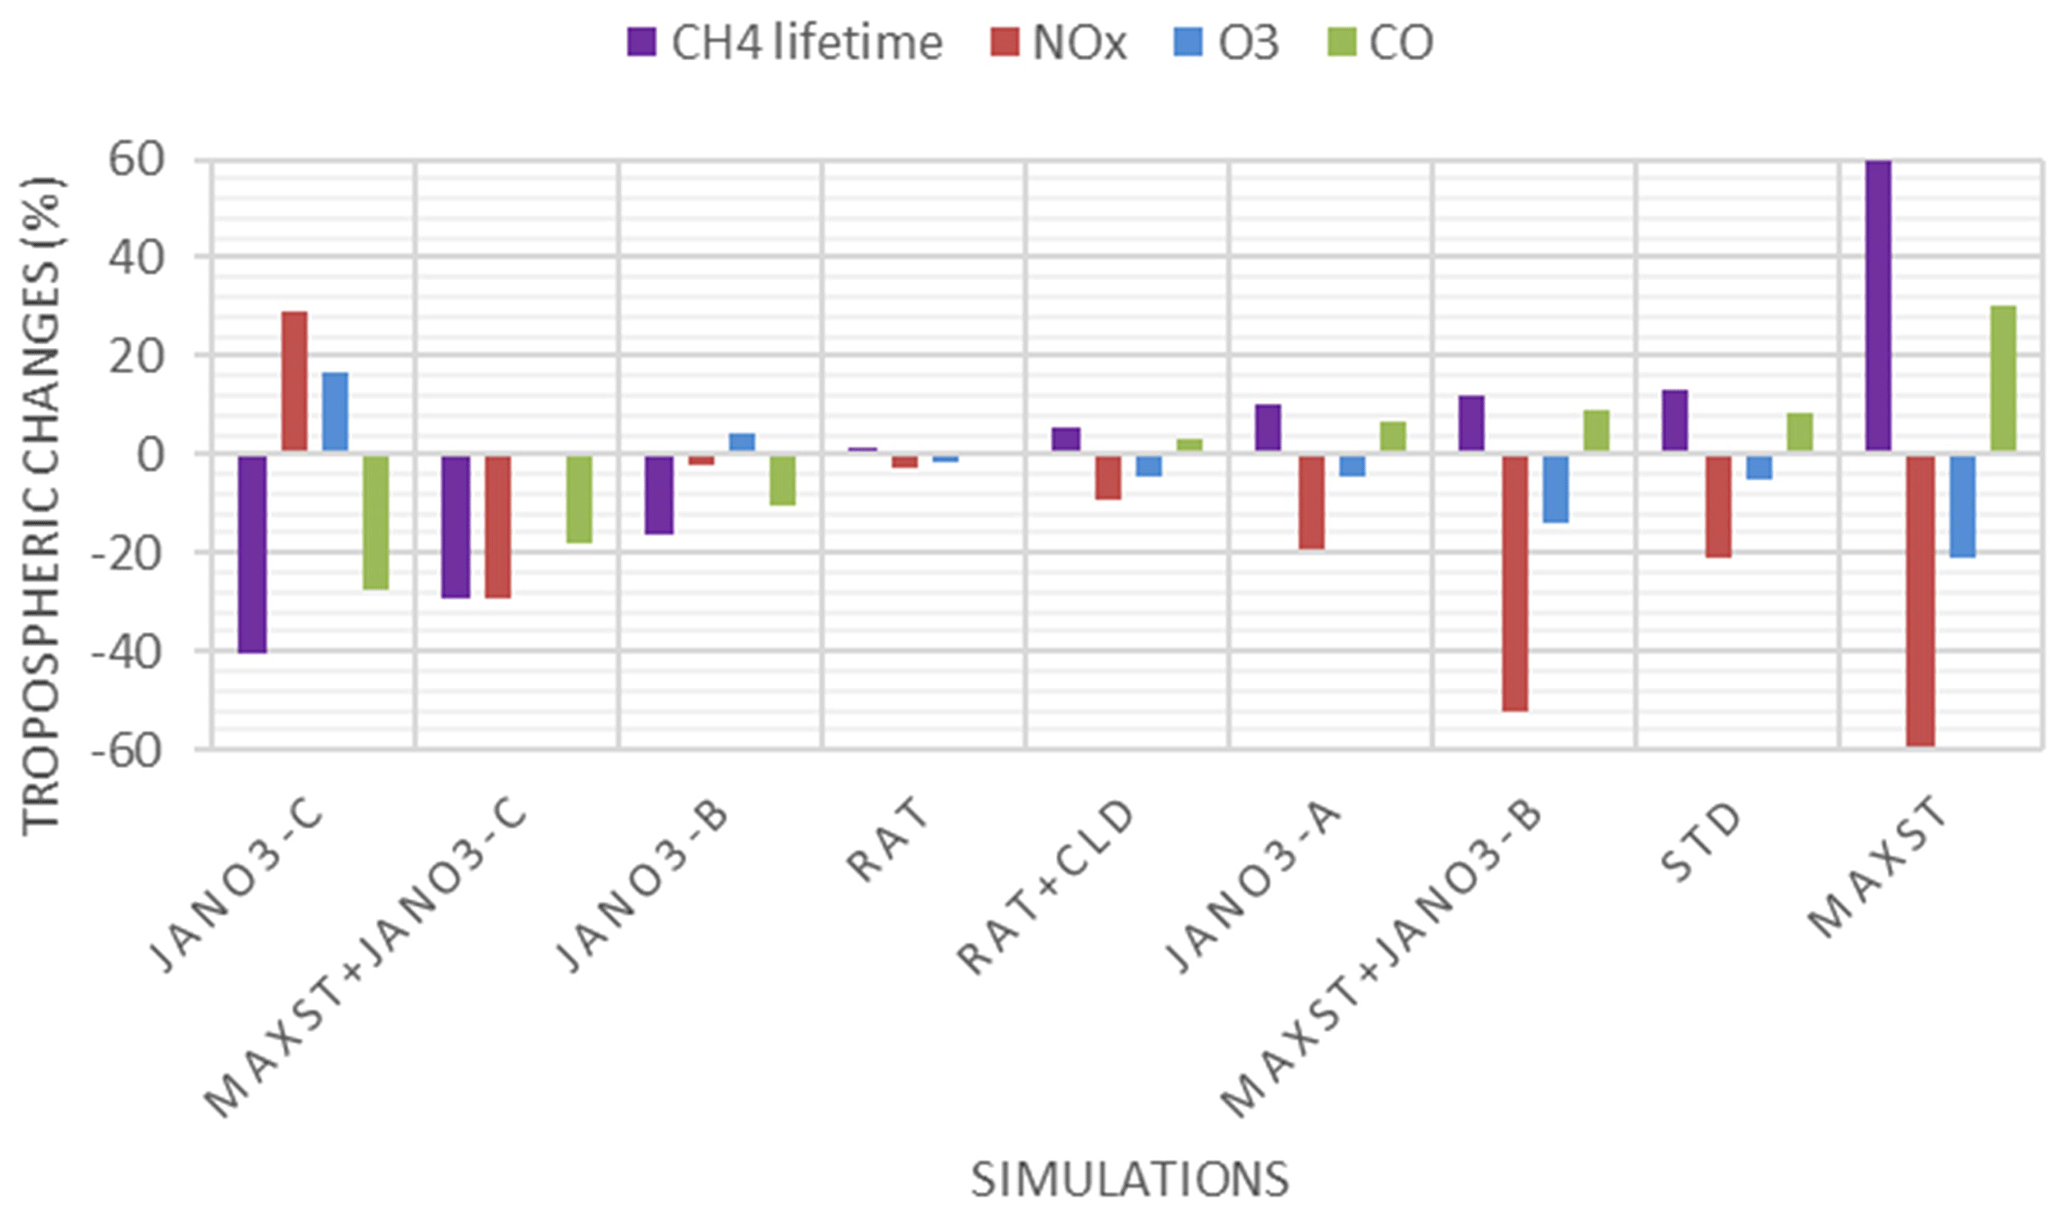
Figure 16Calculated global-mean changes of tropospheric abundances in additional simulations compared to the OLD case (without HONO chemistry). From left to right, the order of shown simulations follows the percentage change magnitudes in CH4 lifetime (largest negative change to largest positive change; purple bars). Other bars show percentage changes in NOx (red), O3 (blue), and CO (grey).
Heterogeneous reactions that produce HONO were the most salient contributing factors to tropospheric chemistry, thereby decreasing the tropospheric oxidizing capacity and increasing the CH4 lifetime by 15 % and CO abundance by 10 %. HRs also reduced the NOx level by 23 % and the O3 level by 6 %, respectively (Table 9). The global HONO distribution from Fig. 14 was mainly caused by the HR formation of HONO. Here, the reducing effects for NOx levels, with consequences for OH and O3 level reductions by heterogeneous reactions, were significant at middle to high latitudes during summer – more specifically, in DJF along 60∘ S and the Arctic and NP oceans during JJA, which amounted to about a −100 % reduction in the NOx level at the surface (−60 % reduction in OH and −40 % reduction in O3) (Fig. 14a–f: blue areas). These reductions in NOx, OH, and O3 levels extended up to 400 hPa at high N/S latitudes (Fig. 14k, l). All these reduction effects for NOx, OH, and O3 levels were due to the removal of HONO on ice and cloud particles (Reaction R6) (Fig. 12a, b: blue fields). On the one hand, it accelerated the conversion of NO2 to HONO and ultimately strengthened its deposition by particulate nitrate (Reaction R4) (Fig. S13a). On the other hand, HRs occurring on aerosol surfaces led to increments in OH and O3 near the surface of polluted regions during winter. These were the main contributors to the regional photochemical effects over China, western Europe, and eastern US regions in winter (up to −74 % reduction in NOx, +1500 % increase in OH, and +48 % increase in O3; Figure 14a, c, e). However, these OH and O3 level increases were only accumulated in the surface layer (only small red areas at ∼1000 hPa in Fig. 14i, m). Compared to HRs on aerosol, HRs on clouds exhibited twice the effectiveness when reducing the tropospheric NOx level (−15 % versus −8 %) and caused 3 times the effects on the tropospheric oxidation capacity (+11.5 % in CH4 lifetime, −4.6 % in O3, +7 % in CO), compared with HRs on aerosol (+3.5 % CH4 lifetime, −1.5 % O3, +2.6 % CO) (Table 9).
Given the direct emissions of HONO (∼10 % of NOx emission inventory), the surface NOx, O3, and OH concentrations were generally enhanced in the STD case compared to the GR+HR case. They induced the concentration modification for NOx (+1.77 %), O3 (+0.97 %), and CO (−1.63 %), as well as a significant reduction (−2.3 %) in the CH4 lifetime (Table 9). Remarkable enhancements for NOx (up to +198 %), OH (+243 %), and O3 (+24 %) (Fig. 14b, d, f: red fields) were identified for the cropland and shrubland/forest regions in Australia, South America, and South Africa during JJA, as well as the boreal vegetation prevailing at middle to high latitudes in Europe, North America, and the polluted Chinese region in DJF (up to +748 % OH) (Fig. 14a: red fields). NOx and OH were elevated in these mid-latitude regions because of the enhanced HONO photolysis (Reaction R1) by the additional HONO source. However, OH, NOx, and O3 levels were reduced near the surface of the Northern Hemisphere's land during summer (up to −47 % reduction in OH, −82 % reduction in NOx, and −15 % reduction in O3) (Fig. 14b, d, f). The latter phenomenon was similar to the heterogeneous cloud effects for the high latitudes discussed above.
Overall, the inclusion of the three HONO processes (gas phase, aerosol and cloud uptakes, direct emission) caused changes of −20 % in NOx, −5 % in O3, and +8 % in CO, as well as a significant increase of +13 % CH4 lifetime in the troposphere (Table 9). Figure 15 highlights the consequences of HOx, NOx, and O3 for the Chinese and NP regions. The NOx level reduction accumulated in the Arctic and Antarctic during summer, especially over the NP ocean (reducing the NOx level by 60 %–90 %; Fig. 15i). These reductions in NO2 and HONO concentrations were due to their uptake onto ice and clouds in these regions. However, these reducing effects caused further reductions in OH and O3 levels for a larger part of the troposphere. As NOx was essential in regulating O3 and OH in the troposphere, a reduction of the NOx level increased the HO2:OH ratio (due to the HO2 + NO → OH + NO2 reaction), which restrained the formation of OH and ultimately of O3. Moreover, a NO2-deficit environment directly affected the O3 level as NO2 was a primary source of an oxygen atom that engages in the formation of O3. Thus, in summer, both OH and O3 levels were drastically reduced over the NP region (35 %–67 % for OH, 30 %–43 % for O3; Fig. 15g, k), and the CO level was increased by 18 % in this region (Fig. 14h).
The significant impacts of HONO photochemistry were especially relevant over eastern China in winter, which might reduce the NOx level by 48 %–78 % (Fig. 12c) due to the uptake of NO2 onto aqueous aerosols. At the surface, the OH level was enormously increased as a result of HONO photolysis (Reaction R1), heterogeneous NO2 conversions (Reactions R4, R5), and additional direct emissions (Fig. 15a, b). The corresponding increase in the O3 level was only identified at the surface of the Beijing region during winter, with +28.8 % caused by HRs on aerosols (Fig. 15e). For Beijing with high NOx emissions, VOC-limited O3 chemistry was likely the driving mechanism (Liu et al., 2010). The vast increases in OH and O3 levels over Beijing in winter were basically in line with the present knowledge of HONO photochemistry (e.g. Lu et al., 2018). Elshorbany et al. (2012) also reported an increase in OH (2–5×10⁶ molecules cm−3) and O3 (0.3–0.5 ppbv) concentrations over polluted regions in China during winter. Compared with Elshorbany's work, the increases in OH and O3 concentrations in our model were higher due to the different HONO mechanisms applied in the two models, simply an averaged HONO:NOx ratio (0.02) in their model. In particular, our newly added heterogeneous reactions on cloud particles (Reaction R4) caused significant reductions in OH, NOx, and O3 levels in the NP region during summer, which their model did not cover. The overall reductions in tropospheric oxidizing capacity due to HONO photochemistry were in line with the expected response to heterogeneous processes (Liao et al., 2003; Martin et al., 2003) and agreed with those previously reported for other HRs (HO2, N2O5, and RO2; Ha et al., 2021; Table 9). Our findings indicate that a global model without heterogeneous processes for HONO would neglect the significant changes in OH and O3 concentrations in remote areas and, thus, will underestimate the potential effects in polluted regions.
As mentioned above, the relative importance of ice and cloud surfaces to the oxidant chemistry was negative for Arctic and NP regions. NO2's uptakes on ice and cloud surfaces (Reaction R4) were the main reason for the reductions in surface NOx, OH, and O3 concentrations in these regions during JJA (Fig. S13a). These reductions also occurred for the free troposphere, which generally improved the model comparison with ATom (Fig. 5) and partially improved in CO simulation by cloud effect (Fig. 7). To HONO formation, enhancement of NO2's uptake coefficient on cloud surface (γliq. (Reaction R4) = 10), along with changing the HONO:HNO3 yield ratio from 0.5:0.5 to 0.9:0.1 in Reaction (R4) in the ratR4+CLD case compared to the STD case, helped preserve more NOx during EMeRGe's flights. Here, a supplement for HONO production is only seen in the ratR4+CLD case for the marine environment ∼1000 m near Japan (Fig. 3g: red-bordered orange diamonds). The ratR4+CLD case introducing an approach to recycle NOx led to lowered global effects of HONO (only −8.57 % NOx globally, CH4 lifetime=9.6 years; Fig. 16). For the ground-based station in comparison with Xue's data (Xue et al., 2022a), the NO photolysis in JANO3-C and maxST+JANO3-C cases (all surfaces including clouds) boosted the O3 level, which improved the agreement with observed O3 at the Mt Tai summit station, indicating the contribution of cloud surface to O3 formation at the altitudes ∼1500 m over a mountainous area (Fig. 9b). The NO photolysis on cloud surface in the JANO3-C case could also be an effective HONO supplement for the tropospheric part above 2000 m over the Asian coastal region compared with EMeRGe's data as compared to the JANO3-B case, which excluded clouds (Fig. 2a). The simulated concentrations of NO2 and O3 also agreed better with the measured data in this comparison.
Contrary to cloud surfaces, the aerosol effect was only crucial for regional photochemistry at the surface layer of polluted regions, such as China, western Europe, and the eastern US in winter time (Fig. 14). As discussed above, aerosol uptakes reduce NOx but increase regional OH and O3 levels. For the sensitivity of HONO formation to aerosol effect, the cases JANO3-B and maxST+JANO3-B, which only included ground and aerosol surfaces for NO photolysis, also remedied the discrepancies for the daytime HONO level across various altitudes during EMeRGe flights (Fig. 2a). For the comparison with Mt Tai station, enhanced uptakes of NO2 onto aerosol surfaces in the combined cases (maxST+JANO3-B/C) provided more HONO production at the summit (Fig. 8b), as well as adjusting O3 levels at both foot and summit stations during the polluted episode (Fig. 9).
The estimated global effects of HONO chemistry in the STD case was the abatement of global tropospheric oxidizing power, despite surface OH and O3 levels being increased at polluted sites. The reduction tendency in global OH and O3 contrasted with other modelling studies (e.g. Elshorbany et al., 2012; Jorba et al., 2012; Lee et al., 2016; Zhang et al., 2021). Some discussions on the tendency of HONO's global effects are addressed here. The positive or negative impacts on oxidizing species (OH and O3) were constrained to HONO formation mechanisms rather than NOx concentration. For high-NOx regions such as EANET stations with 6-month-averaged NOx higher than 20 ppb, O3 and OH were reduced due to NOx removal via NO2 uptakes (Fig. 8b, c), especially at night. If NOx was highly underestimated in the model for these high-NOx regions and an efficient NOx-recycling process was still absent, OH and O3 might be reduced daily. The calculation for daytime only in comparison with Xue's data showed that O3 could be increased when a complementary HONO source was provided via NO photolysis (Fig. 9a) and sole enhancement of the aerosol effect rather than both aerosols and clouds (JANO3-C versus JANO3-B; Fig. 9b), even though NO2 was still underestimated with a large extent in the model (Fig. S15). At higher altitudes over remote regions in the ATom (NO2<10 ppb) and EMeRGe comparisons, OH and O3 can be increased due to more potent gas-phase chemistry of HONO in the STD case, including HONO photolysis (Fig. 4) and particle NO photolysis (Fig. 2).
The amplified aerosol uptake of NO2 (maxST case) further reduced an unrealistic degree of global NOx abundance (−55.4 %) and tropospheric oxidizing capacity, leading to 14.5 years for a global CH4 lifetime. The ratR4+CLD case introducing an approach to recycle NOx led to lowered global effects of HONO (only 8.57 % of NOx was reduced globally, CH4 lifetime=9.6 years). The photolysis of adsorbed HNO3 on ground surfaces (JANO3-A case) still showed reductions in global OH and O3 abundances (Table S5). The ground-surface HNO3 photolysis in the JANO3-A case caused only minor changes for a thin surface layer, which is in line with other studies (Ye et al., 2018; Zhang et al., 2009). In JANO3-B and JANO3-C cases, a recycling process for NOx via HNO3 photolysis was expected. However, only the JANO3-C case showed an increment in global NOx and O3 (+29 % and +16.1 %, respectively), leading to only 5.4 years for the global CH4 lifetime, which was impractical. This was because that simplified approach and maximum thresholds for the phase HNO3 photolysis were used. The combined case maxST+JANO3-B led to more convincing effects (CH4 lifetime was 10.2 years; Table S5), which held the same tendencies as those calculated in the STD case. However, validating this combined case was only conducted for the daytime environment during EMeRGe (Sect. 3.1.2) and for TCO at northern mid-latitudes with OMI (Fig. 13).
Figure 16 illustrates the calculated global-mean changes of tropospheric abundances in additional simulations from those in the OLD case (without HONO chemistry). The simulations of the largest negative to largest positive magnitudes of changes (%) in CH4 lifetime (purple bars) are shown from left to right. Other bars show percentage changes in NOx (red), O3 (blue), and CO (green). In simulations including ratR4, ratR4+CLD, JANO3-A, maxST+JANO3-B, and maxST cases, HONO's impacts on tropospheric CH4 lifetime and abundances of NOx, O3, and CO showed similar tendencies to those impacts in the STD simulation. These similarities indicated that the heterogeneous chemistry of HONO has a general tendency to reduce tropospheric oxidizing capacity (OH and O3) as a result of NOx removal globally via NO2's uptakes on aerosols and clouds. In these settings, more substantial reductions in oxidizing species and NOx were seen in maxST and maxST+JANO3-B cases via enhanced aerosol uptakes of NO2. The particle-phase NO photolysis can solely compensate for NOx removal processes and act as an efficient NOx-recycling mechanism (on a global scale), which can be seen in the JANO3-B and JANO3-C cases. The enhanced aerosol uptake in the maxST setting of the combined maxST+JANO3-C case neutralized this compensation. However, the tropospheric oxidizing capacity (OH and O3) was increased in the cases configured with NO photolysis (JANO3-B/C, maxST+JANO3-C cases), leading to a reduction in global CH4 lifetime. The quantitative impact was unrealistic in some cases, e.g. 30 % of CH4 lifetime in the maxST+JANO3-C case or −50 % of global NOx in the maxST+JANO3-B case, proven as the proper mechanism for a particular environment (along EMeRGe-Asia-2018 flights) and not globally. Thus, these changes merely provided the tendencies of impact sensitivity for different pathways of HONO formation, still with high uncertainty in their magnitudes.
In conclusion, we suggest the global effect tendency was towards tropospheric oxidizing capacity reduction, although further elaboration for enhanced aerosol uptakes of NO2 and surface-catalysed photolysis of HNO3 could drive the effect magnitude. The implication of HONO chemistry in a bottom-up-approached global model such as CHASER needs an intense examination of possible HONO sources and profound evaluations with observed HONO in the troposphere.
The HONO photochemical processes, including (1) the gas-phase reaction involving HONO, (2) direct HONO emission from combustion and soil crust, and (3) heterogeneous processes involving HONO, were added to the chemistry–climate model (CHASER), which did not consider HONO chemistry before. We compared the measurements during the EMeRGe flights off the coastal region of East Asia and discerned good agreement between the measured and simulated NO2, O3, and CO profiles. However, the model does not reflect the influence of the Chinese river delta regions, as the large reductions in air masses affected by land emissions were identified. The model also stood out with NO2, OH, HO2, and CO improvements in the NP region, compared with the observations made during Mirai and ATom-1, although the simulation underestimations of surface O3 in this region were associated with the inconsistent surface deposition or vertical fluxes (from the stratosphere) becoming strong. We found that the model biases were reduced against the EANET/EMEP stationary observations for PM2.5, NO3 components, O3, and CO concentrations when the HONO photochemistry was included.
In the model, the tropospheric abundance for HONO was 1.4 TgN, with 26 % from direct emissions and 63 % from HRs, in which HRs on clouds caused 11.8 % and HRs on aerosols caused 51.2 %. The HONO concentrations over the continents ranged from 30 ppt to 7 ppb and were maximized due to HRs over eastern China during winter. Only 5–10 ppt of HONO could be transported up to ∼2000 m, indicating that its impacts remained mainly in the planetary boundary layer. We argue that these simulated HONOs might underestimate the actual concentrations off the coast of eastern Asia in spring 2018. The unknown daytime HONO concentrations of up to 200 ppt measured in the boundary layer and free troposphere during the EMeRGe campaign were not reproduced by the STD simulation. Fortunately, the measured HONO was moderately captured by the combined simulation, which enhanced aerosol uptakes of NO2 and heterogeneous photolysis of HNO3 (maxST+JANO3-B case). However, the enhancement for NO2 uptakes on aerosols should be confined to particular environments to eliminate the effect exaggeration. Moreover, a further improvement of the model performance for the HONO photochemistry requires (1) the revised model's emission inventory with the emission sources of NOx and CO from southeastern and eastern Asia, (2) the lighting-related NOx module to be upgraded, and (3) the vertical mixing and downward fluxes from the stratosphere to be elaborated.
One or more renoxification mechanisms converting HNO3 into NOx should be added to the model to overcome the observed and simulated NOx seasonality mismatches. Shifting the product ratio towards more HONO and less HNO3 in Reaction (R4) could also provide more HONO and mitigated the deteriorated representation of NOx seasonality. The sensitivity tests also suggested that more robust aerosol processing in polluted areas and less HNO3 product in R4 could further reduce the O3 level in summer, reducing the bias against measurements. The photolysis of adsorbed HNO3 on ground surfaces (JANO3-A case) could also serve as a recycling process for NOx at Asian ground-based sites (EANET).
As calculated in the STD case, HONO chemistry reduced the global tropospheric oxidizing capacity, including OH and O3 levels on the global scale. It should be underlined that this finding is rather unexpected and contrasts with the increasing oxidation capacity previously reported for polluted areas. However, the global reduction effect on O3 reduced the overestimations of OMI-based TCO by simulations, which notably included the geographical Chinese region. Of the three HONO sources, HRs produced the most prominent effects on the tropospheric photochemistry: reducing OH, NOx, and O3 and increasing CO levels in the troposphere, leading to a +13.05 % longer CH4 lifetime and −20.4 % less NOx, −5.03 % less O3, as well as an increased CO (+8.36 %) abundance. In winter near the surface, gas-phase reactions involving HONO and NO2 conversions on soot induced significant photochemical effects over eastern Chinese regions, with changes of −60 % in NOx, +1700 % in OH, and +33 % in O3. During summer, HRs on ice and cloud particles could cause significant changes of −67 % in OH, −45 % in O3, −75 % in NOx, and +17 % in CO in the NP region. Albeit the more significant contribution of aerosols' heterogeneous reactions to the net HONO production, the heterogeneous processes involving ice and cloud particles were more significant globally. Our results from sensitivity tests demonstrated that the tendencies and magnitudes of HONO's global effects debated along with the effort regarding daytime HONO formation mechanisms. In capturing HONO measurement during EMeRGe campaign, the combined case enhancing NO2 aerosol uptake and implementing heterogeneous photolysis of HNO3 (maxST+JANO3-B) still resulted in the reduction for global tropospheric oxidizing capacity. In this case, the effect magnitude was smaller for CH4 lifetime, but those for the NOx–O3–CO chemistry were stronger compared with the calculation in the STD case. Overall, our results proved that a global model without heterogeneous HONO formation, especially photochemical heterogeneous HONO formations, could bias the overall impacts of HONO on tropospheric photochemistry as it neglected the photochemical effects of HONO in remote areas and underestimated them in polluted regions. Our new finding on the tropospheric oxidizing capacity reduction may affect climate change mechanisms and, as a result, may influence its mitigation policies.
The CHASER V4.0 source code and input data to recreate this work's results can be acquired from the repository at https://doi.org/10.5281/zenodo.4153452 (Ha et al., 2020).
The primary data from R/V Mirai cruises for the period 2015–2017 are available from http://www.godac.jamstec.go.jp/darwin/e (Japan Agency for Marine-Earth Science and Technology, 2023). Due to a recent data security incident, the data owner (JAMSTEC) has suspended public access to this dataset. For any inquiries, please send an email to yugo@jamstec.go.jp. The data collected by the HALO aircraft during the EMeRGe campaign are listed on https://www.iup.uni-bremen.de/emerge/home/halo_payload.html (Institut für Umweltphysik, 2023) and can be acquired via email to Lola Andrés Hernández (lola@iup.physik.uni-bremen.de).
The supplement related to this article is available online at: https://doi.org/10.5194/gmd-16-927-2023-supplement.
PTMH composed all simulations and text. KS has the model code and supervised the findings of this study. YK and FT provided R/V Mirai ship data. MDAH, BS, and KP provided EMeRGe-Asia data. All authors have equally contributed to the discussion provided within the manuscript and post-writing formatting and revisions.
The contact author has declared that none of the authors has any competing interests.
Publisher’s note: Copernicus Publications remains neutral with regard to jurisdictional claims in published maps and institutional affiliations.
We are grateful to the NASA scientists and staff for providing ATom data (https://espo.nasa.gov/atom/content/ATom, last access: 30 June 2020) and OMI data (https://daac.gsfc.nasa.gov/, last access: 30 June 2019). The simulations were completed using a supercomputer (NEC SX-Ace and SX-Aurora TSUBASA) at NIES Japan. The surface observational data for model validation were obtained from the monitoring networks EANET (https://www.eanet.asia/, last access: 25 February 2020) and EMEP (https://www.emep.int/, last access: 25 February 2020). We also would like to thank the four anonymous reviewers for their constructive comments and helpful suggestions on the earlier draft of the manuscript.
This research has been supported by the Japan Society for the Promotion of Science (JSPS KAKENHI grant numbers JP20H04320, JP19H05669, and JP19H04235), the Ministry of the Environment, Government of Japan (grant nos. S-12 and S-20), and the Deutsche Forschungsgemeinschaft (grant nos. HALO-SPP 1294, PF 384/16, PF 384/17, and PF 384/19).
This paper was edited by Jason Williams and reviewed by two anonymous referees.
Acker, K., Möller, D., Wieprecht, W., Auel, R., Kalass, D., and Tscherwenka, W.: Nitrous and nitric acid measurements inside and outside of clouds at Mt. Brocken, Water Air Soil Poll., 130, 331–336, https://doi.org/10.1023/A:1013808529303, 2001.
Acker, K., Febo, A., Trick, S., Perrino, C., Bruno, P., Wiesen, P., Moller, D., Wieprecht, W., Auel, R., Giusto, M., Geyer, A., Platt, U., and Allegrini, I.: Nitrous acid in the urban area of Rome, Atmos. Environ., 40, 3123–3133, https://doi.org/10.1016/j.atmosenv.2006.01.028, 2006.
Akimoto, H., Nagashima, T., Li, J., Fu, J. S., Ji, D., Tan, J., and Wang, Z.: Comparison of surface ozone simulation among selected regional models in MICS-Asia III – effects of chemistry and vertical transport for the causes of difference, Atmos. Chem. Phys., 19, 603–615, https://doi.org/10.5194/acp-19-603-2019, 2019.
Al-Abadleh, H. A. and Grassian, V. H.: Heterogeneous reaction of NO2 on hexane soot: A Knudsen cell and FT-IR study, J. Phys. Chem. A, 104, 11926–11933, 2000.
Ammann, M., Kalberer, M., Jost, D. T., Tobler, L., Rossler, E., Piguet, D., Gaggeler, H. W., and Baltensperger, U.: Heterogeneous production of nitrous acid on soot in polluted air masses, Nature, 395, 157–160, 1998.
Andrés Hernández, M. D., Hilboll, A., Ziereis, H., Förster, E., Krüger, O. O., Kaiser, K., Schneider, J., Barnaba, F., Vrekoussis, M., Schmidt, J., Huntrieser, H., Blechschmidt, A.-M., George, M., Nenakhov, V., Klausner, T., Holanda, B. A., Wolf, J., Eirenschmalz, L., Krebsbach, M., Pöhlker, M. L., Hedegaard, A. B., Mei, L., Pfeilsticker, K., Liu, Y., Koppmann, R., Schlager, H., Bohn, B., Schumann, U., Richter, A., Schreiner, B., Sauer, D., Baumann, R., Mertens, M., Jöckel, P., Kilian, M., Stratmann, G., Pöhlker, C., Campanelli, M., Pandolfi, M., Sicard, M., Gomez-Amo, J. L., Pujadas, M., Bigge, K., Kluge, F., Schwarz, A., Daskalakis, N., Walter, D., Zahn, A., Pöschl, U., Bönisch, H., Borrmann, S., Platt, U., and Burrows, J. P.: Overview: On the transport and transformation of pollutants in the outflow of major population centres – observational data from the EMeRGe European intensive operational period in summer 2017, Atmos. Chem. Phys. Discuss. [preprint], https://doi.org/10.5194/acp-2021-500, in review, 2021.
Appel, B. R., Winer, A. M., Tokiwa, Y., and Biermann, H. W.: Comparison of atmospheric nitrous acid measurements by annular denuder and differential optical absorption systems, Atmos. Environ., 24A, 611–616, 1990.
Arens, F., Gutzwiller, L., Baltensperger, U., Gaggeler, H., and Ammann, M.: Heterogeneous reaction of NO2 on diesel soot particles, Environ. Sci. Technol., 35, 2191–2199, 2001.
Aumont, B., Chervier, F., and Laval, S.: Contribution of HONO sources to the NOx/HOx/O3 chemistry in the polluted boundary layer, Atmos. Environ., 37, 487–498, 2003.
Benedict, K. B. and Anastasio, C.: Quantum Yields of Nitrite (NO) from the Photolysis of Nitrate (NO) in Ice at 313 nm, J. Phys. Chem. A, 2017, 8474–8483, https://doi.org/10.1021/acs.jpca.7b08839, 2017.
Benedict, K. B., McFall, A. S., and Anastasio, C.: Quantum Yield of Nitrite from the Photolysis of Aqueous Nitrate above 300 nm, Environ. Sci. Technol., 51, 4387–4395, https://doi.org/10.1021/acs.est.6b06370, 2017.
Bian, H., Chin, M., Hauglustaine, D. A., Schulz, M., Myhre, G., Bauer, S. E., Lund, M. T., Karydis, V. A., Kucsera, T. L., Pan, X., Pozzer, A., Skeie, R. B., Steenrod, S. D., Sudo, K., Tsigaridis, K., Tsimpidi, A. P., and Tsyro, S. G.: Investigation of global particulate nitrate from the AeroCom phase III experiment, Atmos. Chem. Phys., 17, 12911–12940, https://doi.org/10.5194/acp-17-12911-2017, 2017.
Bongartz, A., Kames, J., Schurath, U., George, C., Mirabel, P., and Ponche, J. L. J.: Experimental determination of HONO mass accommodation coefficients using two different techniques, Atmos. Chem., 18, 149–169, 1994.
Brune, W. H., McFarland, P. J., Bruning, E., Waugh, S., MacGorman, D., Miller, D. O., Jenkins, J. M., Ren, X., Mao, J., and Peischl, J.: Extreme oxidant amounts produced by lightning in storm clouds, Science, 372, 711–715, 2021.
Burkholder, J. B., Mellouki, A., Talukdar, R., and Ravishankara, A. R.: Rate coefficients for the reaction of OH with HONO between 298 and 373 K, Int. J. Chem. Kinet., 24, 711–725, 1992.
Burkholder, J. B., Sander, S. P., Abbatt, J., Barker, J. R., Huie, R. E., Kolb, C. E., Kurylo, M. J., Orkin, V. L., Wilmouth, D. M., and Wine, P. H.: Chemical Kinetics and Photochemical Data for Use in Atmospheric Studies, Evaluation No. 18, JPL Publication 15–10, Jet Propulsion Laboratory, Pasadena, http://jpldataeval.jpl.nasa.gov (last access: 30 June 2019), 2015.
Calvert, J. G., Yarwood, G., and Dunker, A. M.: An evaluation of the mechanism of nitrous acid formation in the urban atmosphere, Res. Chem. Intermediat., 20, 463–502, 1994.
Cape, J. N., Hargreaves, K. J., Storeton-West, R., Fowler, D., Colvile, R. N., Choularton, T. W., and Gallagher, M. W.: The contribution of HONO to rural NOy chemistry as inferred from measurements of nitrite in orographic cloud, Atmos. Environ., 26A, 2301–2307, 1992.
Chu, L., Diao, G., and Chu, L. T.: Heterogeneous Interaction and Reaction of HONO on Ice Films between 173 and 230 K, J. Phys. Chem. A, 104, 3150–3158, 2000.
Deutschmann, T., Beirle, S., Frieß, U., Grzegorski, M., Kern, C., Kritten, L., Platt, U., Prados-Roman, C., Puíīte, J., Wagner, T., Werner, B., and Pfeilsticker, K.: The Monte Carlo atmospheric radiative transfer model McArtim: Introduction and validation of Jacobians and 3D features, J. Quant. Spectrosc. Ra., 112, 1119–1137, https://doi.org/10.1016/j.jqsrt.2010.12.009, 2011.
Elshorbany, Y. F., Steil, B., Brühl, C., and Lelieveld, J.: Impact of HONO on global atmospheric chemistry calculated with an empirical parameterization in the EMAC model, Atmos. Chem. Phys., 12, 9977–10000, https://doi.org/10.5194/acp-12-9977-2012, 2012.
Febo, A., Perrino, C., and Allegrini, I.: Measurement of nitrous acid in Milan, Italy, by DOAS and diffusion denuders, Atmos. Environ., 30, 3599–3609, 1996.
Fenter, F. F. and Rossi, M. J.: Heterogeneous Kinetics of HONO on H2SO4 Solutions and on Ice: Activation of HCl, J. Phys. Chem., 100, 13765–13775, 1996.
George, C., Strekowski, R. S., Kleffmann, J., Stemmler, K., and Ammann, M.: Photoenhanced uptake of gaseous NO2 on solid organic compounds: A photochemical source of HONO?, Faraday Discuss., 130, 195–210, 2005.
Gerecke, A., Thielmann, A., Gutzwiller, L., Rossi M. J.: The chemical kinetics of HONO formation resulting from heterogeneous interaction of NO2 with flame soot, Geophys. Res. Lett., 25, 2453–2456, https://doi.org/10.1029/98GL01796, 1998.
Ha, T. M. P., Taketani, F., Kanaya, Y., Matsuda, R., and Sudo, K.: Effects of heterogeneous reactions on global tropospheric chemistry (CHASER-V4.0), Zenodo [code], https://doi.org/10.5281/zenodo.4153452, 2020.
Kleinert, F., Leufen, L. H., and Schultz, M. G.: IntelliO3-ts v1.0: a neural network approach to predict near-surface ozone concentrations in Germany, Geosci. Model Dev., 14, 1–25, https://doi.org/10.5194/gmd-14-1-2021, 2021.
Harris, G. W., Carter, W. P. L., Winer, A. M., Pitts, J. N., Platt, U., and Perner, D.: Observations of nitrous acid in the Los Angeles atmosphere and implications for predictions of ozone-precursor relationships, Environ. Sci. Technol., 16, 414–419, 1982.
Harrison, R. M. and Collins, G. M.: Measurements of reaction coefficients of NO2 and HONO on aerosol particles, J. Atmos. Chem., 30, 397–406, 1998.
Harrison, R. M. and Kitto, N.: Evidence for a surface source of atmospheric nitrous acid, Atmos. Environ., 28, 1089–1094, 1994.
Hayashi, K. and Noguchi, I.: Indirect emission of nitrous acid from grasslands indicated by concentration gradients, J. Jpn. Soc. Atmos. Environ., 41, 279–287, 2006.
Holmes, C. D., Bertram, T. H., Confer, K. L., Graham, K. A., Ronan, A. C., Wirks, C. K., and Shah, V.: The Role of Clouds in the Tropospheric NOx Cycle: A New Modeling Approach for Cloud Chemistry and Its Global Implications, Geophys. Res. Lett., 46, 4980–4990, https://doi.org/10.1029/2019GL081990, 2019.
Hüneke, T., Aderhold, O.-A., Bounin, J., Dorf, M., Gentry, E., Grossmann, K., Grooß, J.-U., Hoor, P., Jöckel, P., Kenntner, M., Knapp, M., Knecht, M., Lörks, D., Ludmann, S., Matthes, S., Raecke, R., Reichert, M., Weimar, J., Werner, B., Zahn, A., Ziereis, H., and Pfeilsticker, K.: The novel HALO mini-DOAS instrument: inferring trace gas concentrations from airborne UV/visible limb spectroscopy under all skies using the scaling method, Atmos. Meas. Tech., 10, 4209–4234, https://doi.org/10.5194/amt-10-4209-2017, 2017.
Institut für Umweltphysik: Universität Bremen, EMeRGe (Effect of Megacities on the Transport and Transformation of Pollutants on the Regional to Global Scales), https://www.iup.uni-bremen.de/emerge/home/halo_payload.html, last access: 30 January 2023.
Jacob, D. J.: Heterogeneous chemistry and tropospheric ozone, Atmos. Environ., 34, 2131–2159, 2000.
Japan Agency for Marine-Earth Science and Technology: Application for Request of Data or Samples Obtained by JAMSTEC's Research Vessels and Submersibles, GODAC [data set], http://www.godac.jamstec.go.jp/darwin/e, last access: 30 January 2023.
Jenkin, M. E., Cox, R. A., and Williams, D. J.: Laboratory studies of the kinetics of formation of nitrous acid from the thermal reaction of nitrogen dioxide and water vapour, Atmos. Environ., 22, 487–498, 1988.
Jorba, O., Dabdub, D., Blaszczak-Boxe, C., Pérez, C., Janjic, Z., Baldasano, J. M., Spada, M., Badia, A., and Gonçalves, M.: Potential significance of photoexcited NO2 on global air quality with the NMMB/BSC chemical transport model, J. Geophys. Res., 117, D13301, https://doi.org/10.1029/2012JD017730, 2012.
Kalberer, M., Ammann, M., Arens, F., Gaggeler, H. W., and Baltensperger, U.: Heterogeneous formation of nitrous acid (HNO2) on soot aerosol particles, J. Geophys. Res., 104, 13825–13832, 1999.
Kanaya, Y., Cao, R., Akimoto, H., Fukuda, M., Komazaki, Y., Yokouchi, Y., Koike, M., Tanimoto, H., Takegawa, N., and Kondo, Y.: Urban photochemistry in central Tokyo: 1. Observed and modeled OH and HO2 radical concentrations during the winter and summer of 2004, J. Geophys. Res., 112, D21312, https://doi.org/10.1029/2007JD008670, 2007.
Kanaya, Y., Miyazaki, K., Taketani, F., Miyakawa, T., Takashima, H., Komazaki, Y., Pan, X., Kato, S., Sudo, K., Sekiya, T., Inoue, J., Sato, K., and Oshima, K.: Ozone and carbon monoxide observations over open oceans on Mirai from 67∘ S to 75∘ N during 2012 to 2017: testing global chemical reanalysis in terms of Arctic processes, low ozone levels at low latitudes, and pollution transport, Atmos. Chem. Phys., 19, 7233–7254, https://doi.org/10.5194/acp-19-7233-2019, 2019.
Kerbrat, M., Huthwelker, T., Gaggeler, H. W., and Ammann, M.: Interaction of Nitrous Acid with Polycrystalline Ice: Adsorption on the Surface and Diffusion into the Bulk, J. Phys. Chem. C, 114, 2208–2219, 2010.
Kessler, C. and Platt, U.: Nitrous acid in polluted air masses: sources and formation pathways, in: Physicochemical Behaviour of Atmospheric Pollutan/s, Proc. 3rd Europ. Sump. Varese, Iralv, edited by: Versino B. and Angdletti, G.j, Reidel, Doidrecht, 412–422, https://doi.org/10.1007/978-94-009-6505-8_44, 1984.
Kirchstetter, T. W., Harley, R. A., and Littlejohn, D.: Measurement of Nitrous Acid in Motor Vehicle Exhaust, Environ. Sci. Technol., 30, 2843–2849, 1996.
Kleffmann, J. and Wiesen, P.: Heterogeneous conversion of NO2 and NO on HNO3 treated soot surfaces: atmospheric implications, Atmos. Chem. Phys., 5, 77–83, https://doi.org/10.5194/acp-5-77-2005, 2005.
Kleffmann, J., Becker, K. H., and Wiesen, P.: Heterogeneous NO2 conversion processes on acid surfaces: possible atmospheric implications, Atmos. Environ., 32, 2721–2729, 1998.
Kleffmann, J., Becker, K. H., Lackhoff, M., and Wiesen, P.: Heterogeneous conversion of NO2 on carbonaceous surfaces, Phys. Chem. Chem. Phys., 1, 5443–5450, https://doi.org/10.1039/A905545B, 1999.
Kleffmann, J., Kurtenbacha, R., Lorzer, J., Wiesen, P., Kalthoff, N., Vogel, B., and Vogel, H.: Measured and simulated vertical profiles of nitrous acid – Part I: Field measurements, Atmos. Environ., 37, 2949–2955, 2003.
Kluge, F., Hüneke, T., Knecht, M., Lichtenstern, M., Rotermund, M., Schlager, H., Schreiner, B., and Pfeilsticker, K.: Profiling of formaldehyde, glyoxal, methylglyoxal, and CO over the Amazon: normalized excess mixing ratios and related emission factors in biomass burning plumes, Atmos. Chem. Phys., 20, 12363–12389, https://doi.org/10.5194/acp-20-12363-2020, 2020.
Kurtenbach, R., Becker, K. H., Gomes, J. A. G., Kleffmann, J., Lorzer, J. C., Spittler, M., Wiesen, P., Ackermann, R., Geyer, A., and Platt, U.: Investigations of emissions and heterogeneous formation of HONO in a road traffic tunnel, Atmos. Environ., 35, 3385–3394, 2001.
Lammel, G. and Cape, J. N.: Nitrous Acid and Nitrite in the Atmosphere, Chem. Soc. ReV., 25, 361-369, https://doi.org/10.1039/CS9962500361, 1996.
Lary, D. J., Lee, A. M., Toumi, R., Newchurch, M. J., Pirre, M., and Renard, J. B.: Carbon aerosols and atmospheric photochemistry, J. Geophys. Res., 102, 3671–3682, 1997.
Lee, B. H., Santoni, G. W., Wood, E. C., Herndon, S. C., Miake-Lye, R. C., Zahniser, M. S., Wofsy, S. C., and Munger, J. W.: Measurements of Nitrous Acid in Commercial Aircraft Exhaust at the Alternative Aviation Fuel Experiment, Environ. Sci. Technol., 45, 7648–7654, dx.doi.org/10.1021/es200921t, 2011.
Lee, J. D., Whalley, L. K., Heard, D. E., Stone, D., Dunmore, R. E., Hamilton, J. F., Young, D. E., Allan, J. D., Laufs, S., and Kleffmann, J.: Detailed budget analysis of HONO in central London reveals a missing daytime source, Atmos. Chem. Phys., 16, 2747–2764, https://doi.org/10.5194/acp-16-2747-2016, 2016.
Li, J., Chen, X., Wang, Z., Du, H., Yang, W., Sun, Y., Hu, B., Li, J., Wang, W., Wang, T., Fu, P., and Huang, H.: Radiative and heterogeneous chemical effects of aerosols on ozone and inorganic aerosols over East Asia, Sci. Total Environ., 622–623, 1327–1342, https://doi.org/10.1016/j.scitotenv.2017.12.041, 2018.
Li, X., Rohrer, F., Hofzumahaus, A., Brauers, T., Häseler, R., Bohn, B., Broch, S., Fuchs, H., Gomm, S., Holland, F., Jäger, J., Kaiser, J., Keutsch, F. N., Lohse, I., Lu, K., Tillmann, R., Wegener, R., Wolfe, G. M., Mentel, T. F., Kiendler-Scharr, A., and Wahner, A.: Missing Gas-Phase Source of HONO Inferred from Zeppelin Measurements in the Troposphere, Science, 344, 292–296, https://doi.org/10.1126/science.1248999, 2014.
Li, Y., An, J., Min, M., Zhang, W., Wang, F., Xie, P.: Impacts of HONO sources on the air quality in Beijing, Tianjin and Hebei Province of China, Atmos. Environ., 45, 4735–4744, 2011.
Li, Y., An, J., Kajino, M., Gultepe, I., Chen, Y., Song, T., and Xin, J.: Impacts of additional HONO sources on O3 and PM2.5 chemical coupling and control strategies in the Beijing-Tianjin-Hebei region of China, Tellus B, 67, 23930, https://doi.org/10.3402/tellusb.v67.23930, 2015.
Liao, H., Adams, P., Serena, H. C., Seinfeld, J. H., Mickley, L., and Jacob, D. J.: Interactions between Tropospheric Chemistry and Aerosols in a Unified GCM Simulation, J. Geophys. Res., 108, 4001, https://doi.org/10.1029/2001JD001260, 2003.
Lin, M., Fiore, A. M., Cooper, O. R., Horowitz, L. W., Langford, A. O., Levy II, H., Johnson, B. J., Naik, V., Oltmans, S. J., and Senff, C. J.: Springtime high surface ozone events over the western United States: Quantifying the role of stratospheric intrusions, J. Geophys. Res., 117, D00V22, https://doi.org/10.1029/2012JD018151, 2012.
Liu, X.-H., Zhang, Y., Xing, J., Zhang, Q., Wang, K., Streets, D. G., Jang, C., Wang, W.-X., and Hao, J.-M.: Understanding of regional air pollution over China using CMAQ, part II, Process analysis and sensitivity of ozone and particulate matter to precursor emissions, Atmos. Environ., 44, 3719–3727, 2010.
Lu, X., Wang, Y., Li, J., Shen, L., and Fung, C. H. J.: Evidence of heterogeneous HONO formation from aerosols and the regional photochemical impact of this HONO source, Environ. Res. Lett., 13, 114002, https://doi.org/10.1088/1748-9326/aae492, 2018.
Martin, R. V., Jacob, D. J., Yantosca, R. M., Chin, M., and Ginoux, P.: Global and regional decreases in tropospheric oxidants from photochemical effects of aerosols, J. Geophys. Res., 108, 4097, https://doi.org/10.1029/2002JD002622, 2003.
Meilinger, S. K., Kärcher, B., and Peter, Th.: Microphysics and heterogeneous chemistry in aircraft plumes – high sensitivity on local meteorology and atmospheric composition, Atmos. Chem. Phys., 5, 533–545, https://doi.org/10.5194/acp-5-533-2005, 2005.
Mertes, S. and Wahner, A.: Uptake of nitrogen dioxide and nitrous acid on aqueous surfaces, J. Phys. Chem., 99, 14000–14006, 1995.
Monge, M. E., D'Anna, B., Mazri, L., Giroir-Fendler, A., Ammann, M., Donaldson, D. J., and George, C.: Light changes the atmospheric reactivity of soot, Proc. Natl. Acad. Sci. USA, 107, 6605–6609, 2010.
Morgenstern, O., Hegglin, M. I., Rozanov, E., O'Connor, F. M., Abraham, N. L., Akiyoshi, H., Archibald, A. T., Bekki, S., Butchart, N., Chipperfield, M. P., Deushi, M., Dhomse, S. S., Garcia, R. R., Hardiman, S. C., Horowitz, L. W., Jöckel, P., Josse, B., Kinnison, D., Lin, M., Mancini, E., Manyin, M. E., Marchand, M., Marécal, V., Michou, M., Oman, L. D., Pitari, G., Plummer, D. A., Revell, L. E., Saint-Martin, D., Schofield, R., Stenke, A., Stone, K., Sudo, K., Tanaka, T. Y., Tilmes, S., Yamashita, Y., Yoshida, K., and Zeng, G.: Review of the global models used within phase 1 of the Chemistry–Climate Model Initiative (CCMI), Geosci. Model Dev., 10, 639–671, https://doi.org/10.5194/gmd-10-639-2017, 2017.
Ndour, M., D'Anna, B., George, C., Ka, O., Balkanski, Y., Kleffmann, J., Stemmler, K., and Ammann, M.: Photoenhanced uptake of NO2 on mineral dust: Laboratory experiments and model simulations, Geophys. Res. Lett., 35, L05812, https://doi.org/10.1029/2007GL032006, 2008.
Network Center for EANET: EANET Data on the Acid Deposition in the East Asian Region, EANET [data set], https://monitoring.eanet.asia/document/public/index, last access: 25 February 2020.
Notholt, J., Hjorth, J., and Raes, F.: Formation of HNO2 on aerosol surfaces during foggy periods in the presence of NO and NO2, Atmos. Environ. 26A, 211–217, 1992.
Oswald, R., Behrendt, T., Ermel, M., Wu, D., Su, H., Cheng, Y., Breuninger, C., Moravek, A., Mougin, E., Delon, C., Loubeta, B., Pommerening-Röserm, A., Sörgelu, M., Pöschlt, U., Hoffmannm, T., Andreaef, M. O., Meixnerand, F. X., and Trebs, I.: HONO emissions from soil bacteria as a major source of atmospheric reactive nitrogen, Science, 341, 1233–1235, https://doi.org/10.1126/science.1242266, 2013.
Veefkind, P.: OMI/Aura Ozone (O3) DOAS Total Column Daily L2 Global Gridded V3, Greenbelt, MD, USA, Goddard Earth Sciences Data and Information Services Center (GES DISC), Aura [data set], https://doi.org/10.5067/Aura/OMI/DATA2013, 2012.
Platt, U. and Perner, D.: Direct Measurements of Atmospheric CH2O, HNO2, O3, NO2, and SO2 by Differential Optical Absorption in the Near UV, J. Geophys. Res., 85, 7453–7458, 1980.
Platt, U. and Stutz, J.: Differential Optical Absorption Spectroscopy, Principles and Applications, in: Physics of Earth and Space Environments, Springer, Berlin, Heidelberg, https://doi.org/10.1007/978-3-540-75776-4, 2008.
Porada, P., Tamm, A., Raggio, J., Cheng, Y., Kleidon, A., Pöschl, U., and Weber, B.: Global NO and HONO emissions of biological soil crusts estimated by a process-based non-vascular vegetation model, Biogeosciences, 16, 2003–2031, https://doi.org/10.5194/bg-16-2003-2019, 2019.
Reisinger, R. A.: Observations of HNO2 in the polluted winter atmosphere: possible heterogeneous production on aerosols, Atmos. Environ., 34, 3865–3874, 2000.
Ren, X, Duin, D. van, Cazorla, M., Chen, S., Mao, J., Zhang, L., Brune, W. H., Flynn, J. H., Grossberg, N., Lefer, B. L., Rappenglück, B., Wong, K. W., Tsai, C., Stutz, J., Dibb, J. E., Jobson, B. T., Luke, W. T., and Kelley, P.: Atmospheric oxidation chemistry and ozone production: Results from SHARP 2009 in Houston, Texas, USA, J. Geophys. Res.-Atmos., 118, 5770–5780, https://doi.org/10.1002/jgrd.50342, 2013.
Romer, P. S., Wooldridge, P. J., Crounse, J. D., Kim, M. J., Wennberg, P. O., Dibb, J. E., Scheuer, E., Blake, D. R., Meinardi, S., Brosius, A. L., Thames, A. B., Miller, D. O., Brune, W. H., Hall, S. R., Ryerson, T. B., and Cohen, R. C.: Constraints on Aerosol Nitrate Photolysis as a Potential Source of HONO and NOx, Environ. Sci. Technol., 2018, 13738–13746, https://doi.org/10.1021/acs.est.8b03861, 2018.
Rotermund, M. K., Bense, V., Chipperfield, M. P., Engel, A., Grooß, J.-U., Hoor, P., Hüneke, T., Keber, T., Kluge, F., Schreiner, B., Schuck, T., Vogel, B., Zahn, A., and Pfeilsticker, K.: Organic and inorganic bromine measurements around the extratropical tropopause and lowermost stratosphere: insights into the transport pathways and total bromine, Atmos. Chem. Phys., 21, 15375–15407, https://doi.org/10.5194/acp-21-15375-2021, 2021.
Rubio, M. A., Lissi, E., and Villena, G.: Nitrite in rain and dew in Santiago city, Chile, Its possible impact on the early morning start of the photochemical smog, Atmos. Environ. 32, 293–297, 2002.
Saathoff, H., Naumann, K.-H., Riemer, N., Kamm, S., Mohler, O., Schurath, U., Vogel, H., and Vogel, B.: The loss of NO2, HNO3, NON2O5, and HOHOONO2 on soot aerosol: A chamber and modeling study, Geophys. Res. Lett., 28, 1957–1960, 2001.
Salgado-Muñoz, M. S. and Rossi, M. J.: Heterogeneous reactions of HNO3 with flame soot generated under different combustion conditions, Reaction mechanism and kinetics, Phys. Chem. Chem. Phys., 4, 5110–5118, 2002.
Sakamaki, F., Hatakeyama, S., and Akimoto, H.: Formation of nitrous acid and nitric acid in the heterogeneous dark reaction of nitrogen dioxide and water vapour in smog chamber, J. Them. Kinet., 15, 1013–1029, 1983.
Scharko, N. K., Berke, A. E., and Raff, J. D.: Release of Nitrous Acid and Nitrogen Dioxide from Nitrate Photolysis in Acidic Aqueous Solutions, Environ. Sci. Technol., 2014, 11991–12001, dx.doi.org/10.1021/es503088x, 2014.
Schwartz, S. E.: Mass-Transport Considerations Pertinent to Aqueous Phase Reactions of Gases in Liquid-Water Clouds, in: Chemistry of Multiphase Atmospheric Systems, Springer, Berlin, Heidelberg, 415–471, ISBN 9783642706295, 1986.
Sekiya, T. and Sudo, K.: Roles of transport and chemistry processes in global ozone change on interannual and multidecadal time scales, J. Geophys. Res., 119, 4903–4921, https://doi.org/10.1002/2013JD020838, 2014.
Sekiya, T., Miyazaki, K., Ogochi, K., Sudo, K., and Takigawa, M.: Global high-resolution simulations of tropospheric nitrogen dioxide using CHASER V4.0, Geosci. Model Dev., 11, 959–988, https://doi.org/10.5194/gmd-11-959-2018, 2018.
Stadler, D., Rossi, M. J.: The reactivity of NO2 and HNO2 on flame soot at ambient temperature: The influence of combustion conditions, Physical Chemistry Chemical Physics 2, 5420–5429, https://doi.org/10.1039/b005680o, 2000.
Stemmler, K., Ndour, M., Elshorbany, Y., Kleffmann, J., D'Anna, B., George, C., Bohn, B., and Ammann, M.: Light induced conversion of nitrogen dioxide into nitrous acid on submicron humic acid aerosol, Atmos. Chem. Phys., 7, 4237–4248, https://doi.org/10.5194/acp-7-4237-2007, 2007.
Stohl, A., Bonasoni, P., Cristofanelli, P., Collins, W., Feichter, J., Frank, A., Forster, C., Gerasopoulos, E., Gäggeler, H., James, P., Kentarchos, T., Kromp-Kolb, H., Krüger, B., Land, C., Meloen, J., Papayannis, A., Priller, A., Seibert, P., Sprenger, M., Roelofs, G. J., Scheel, H. E., Schnabel, C., Siegmund, P., Tobler, L., Trickl, T., Wernli, H., Wirth, V., Zanis, P., and Zerefos, C.: Stratosphere-troposphere exchange: A review, and what we have learned from STACCATO, J. Geophys. Res., 108, 8516, https://doi.org/10.1029/2002JD002490, 2003.
Stutz, J., Alicke, B., and Neftel, A.: Nitrous acid formation in the urban atmosphere: Gradient measurements of NO2 and HONO over grass in Milan, Italy, J. Geophys. Res., 107, 8192, https://doi.org/10.1029/2001JD000390, 2002.
Stutz, J., Werner, B., Spolaor, M., Scalone, L., Festa, J., Tsai, C., Cheung, R., Colosimo, S. F., Tricoli, U., Raecke, R., Hossaini, R., Chipperfield, M. P., Feng, W., Gao, R.-S., Hintsa, E. J., Elkins, J. W., Moore, F. L., Daube, B., Pittman, J., Wofsy, S., and Pfeilsticker, K.: A new Differential Optical Absorption Spectroscopy instrument to study atmospheric chemistry from a high-altitude unmanned aircraft, Atmos. Meas. Tech., 10, 1017–1042, https://doi.org/10.5194/amt-10-1017-2017, 2017.
Su, H., Cheng, Y., Oswald, R., Behrendt, T., Trebs, I., Meixner, F. X., Andreae, M. O., Cheng, P., Zhang, Y., and Pöschl, U.: Soil Nitrite as a Source of Atmospheric HONO and OH Radicals, Science, 333, 1616–1618, https://doi.org/10.1126/science.1207687, 2011.
Sudo, K. and Akimoto, H.: Global source attribution of tropospheric ozone: Long-range transport from various source regions, J. Geophys. Res.-Atmos., 112, D12302, https://doi.org/10.1029/2006JD007992, 2007.
Sudo, K., Takahashi, M., Kurokawa, J. I., and Akimoto, H.: CHASER: A global chemical model of the troposphere 1. Model description, J. Geophys. Res.-Atmos., 107, 4339, https://doi.org/10.1029/2001JD001113, 2002.
Tan, Z., Fuchs, H., Lu, K., Hofzumahaus, A., Bohn, B., Broch, S., Dong, H., Gomm, S., Häseler, R., He, L., Holland, F., Li, X., Liu, Y., Lu, S., Rohrer, F., Shao, M., Wang, B., Wang, M., Wu, Y., Zeng, L., Zhang, Y., Wahner, A., and Zhang, Y.: Radical chemistry at a rural site (Wangdu) in the North China Plain: observation and model calculations of OH, HO2 and RO2 radicals, Atmos. Chem. Phys., 17, 663–690, https://doi.org/10.5194/acp-17-663-2017, 2017.
Theys, N., Volkamer, R., Müller, J.-F. , Zarzana, K. J., Kille, N., Clarisse, L., De Smedt, I., Lerot, C., Finkenzeller, H., Hendrick, F., Koenig, T. K., Lee, C. F., Knote, C., Yu, H., and Roozendael, M. V.: Global nitrous acid emissions and levels of regional oxidants enhanced by wildfires, Nat. Geosci., 13, 681–686, https://doi.org/10.1038/s41561-020-0637-7, 2020.
Thornton, J. A., Jaeglé, L., and McNeill, V. F.: Assessing known pathways for HO2 loss in aqueous atmospheric aerosols: Regional and global impacts on tropospheric oxidants, J. Geophys. Res.-Atmos., 113, D05303, https://doi.org/10.1029/2007JD009236, 2008.
Tørseth, K., Aas, W., Breivik, K., Fjæraa, A. M., Fiebig, M., Hjellbrekke, A. G., Lund Myhre, C., Solberg, S., and Yttri, K. E.: Introduction to the European Monitoring and Evaluation Programme (EMEP) and observed atmospheric composition change during 1972–2009, Atmos. Chem. Phys., 12, 5447–5481, https://doi.org/10.5194/acp-12-5447-2012, 2012.
Trickl, T., Vogelmann, H., Giehl, H., Scheel, H.-E., Sprenger, M., and Stohl, A.: How stratospheric are deep stratospheric intrusions?, Atmos. Chem. Phys., 14, 9941–9961, https://doi.org/10.5194/acp-14-9941-2014, 2014.
VandenBoer, T. C., Brown, S. S., Murphy, J. G., Keene, W. C., Young, C. J., Pszenny, A. A. P., Kim, S., Warneke, C., de Gouw, J. A., Maben, J. R., Wagner, N. L., Riedel, T. P., Thornton, J. A., Wolfe, D. E., Dubé, W. P., Öztürk, F., Brock, C. A., Grossberg, N., Lefer, B., Lerner, B., Middlebrook, A. M., and Roberts, J. M.: Understanding the role of the ground surface in HONO vertical structure: High resolution vertical profiles during NACHTT-11, J. Geophys. Res.-Atmos., 118, 10155–10171, https://doi.org/10.1002/jgrd.50721, 2013.
Wang, Y., Dörner, S., Donner, S., Böhnke, S., De Smedt, I., Dickerson, R. R., Dong, Z., He, H., Li, Z., Li, Z., Li, D., Liu, D., Ren, X., Theys, N., Wang, Y., Wang, Y., Wang, Z., Xu, H., Xu, J., and Wagner, T.: Vertical profiles of NO2, SO2, HONO, HCHO, CHOCHO and aerosols derived from MAX-DOAS measurements at a rural site in the central western North China Plain and their relation to emission sources and effects of regional transport, Atmos. Chem. Phys., 19, 5417–5449, https://doi.org/10.5194/acp-19-5417-2019, 2019.
Watanabe, S., Hajima, T., Sudo, K., Nagashima, T., Takemura, T., Okajima, H., Nozawa, T., Kawase, H., Abe, M., Yokohata, T., Ise, T., Sato, H., Kato, E., Takata, K., Emori, S., and Kawamiya, M.: MIROC-ESM 2010: model description and basic results of CMIP5-20c3m experiments, Geosci. Model Dev., 4, 845–872, https://doi.org/10.5194/gmd-4-845-2011, 2011.
Werner, B., Stutz, J., Spolaor, M., Scalone, L., Raecke, R., Festa, J., Colosimo, S. F., Cheung, R., Tsai, C., Hossaini, R., Chipperfield, M. P., Taverna, G. S., Feng, W., Elkins, J. W., Fahey, D. W., Gao, R.-S., Hintsa, E. J., Thornberry, T. D., Moore, F. L., Navarro, M. A., Atlas, E., Daube, B. C., Pittman, J., Wofsy, S., and Pfeilsticker, K.: Probing the subtropical lowermost stratosphere and the tropical upper troposphere and tropopause layer for inorganic bromine, Atmos. Chem. Phys., 17, 1161–1186, https://doi.org/10.5194/acp-17-1161-2017, 2017.
Whalley, L. K., Stone, D., Dunmore, R., Hamilton, J., Hopkins, J. R., Lee, J. D., Lewis, A. C., Williams, P., Kleffmann, J., Laufs, S., Woodward-Massey, R., and Heard, D. E.: Understanding in situ ozone production in the summertime through radical observations and modelling studies during the Clean air for London project (ClearfLo), Atmos. Chem. Phys., 18, 2547–2571, https://doi.org/10.5194/acp-18-2547-2018, 2018.
Wofsy, S.C., Afshar, S., Allen, H. M., Apel, E. C., Asher, E. C., Barletta, B., Bent, J., Bian, H., Biggs, B. C., Blake, D. R., Blake, N., Bourgeois, I., Brock, C. A., Brune, W. H., Budney, J. W., Bui, T. P., Butler, A., Campuzano-Jost, P., Chang, C. S., Chin, M., Commane, R., Correa, G., Crounse, J. D., Cullis, P. D., Daube, B.C., Day, D. A., Dean-Day, J. M., Dibb, J. E. DiGangi, J. P., Diskin, G. S., Dollner, M., Elkins, J. W., Erdesz, F., Fiore, A. M., Flynn, C. M., Froyd, K. D., Gesler, D. W., Hall, S. R., Hanisco, T. F., Hannun, R. A., Hills, A. J., Hintsa, E. J., Hoffman, A., Hornbrook, R. S., Huey, L. G., Hughes, S., Jimenez, J. L., Johnson, B. J., Katich, J. M., Keeling, R.F., Kim, M. J., Kupc, A., Lait, L. R., McKain, K., Mclaughlin, R. J., Meinardi, S., Miller, D. O., Montzka, S. A., Moore, F. L., Morgan, E. J., Murphy,D. M., Murray, L. T., Nault, B. A., Neuman, J. A., Newman, P. A., Nicely, J. M., Pan, X., Paplawsky, W., Peischl, J., Prather, M. J., Price, D. J., Ray, E. A., Reeves, J. M., Richardson, M., Rollins, A. W., Rosenlof, K. H., Ryerson, T. B., Scheuer, E., Schill, G. P., Schroder, J. C., Schwarz, J. P., St.Clair, J. M., Steenrod, S. D., Stephens, B. B., Strode, S. A., Sweeney, C., Tanner, D., Teng, A. P., Thames, A. B., Thompson, C. R., Ullmann, K., Veres, P. R., Wagner, N. L., Watt, A., Weber, R., Weinzierl, B. B., Wennberg, P. O., Williamson, C. J., Wilson, J. C., Wolfe, G. M., Woods, C. T., Zeng, L. H., and Vieznor, N.: ATom: Merged Atmospheric Chemistry, Trace Gases, and Aerosols, Version 2, ORNL DAAC, Oak Ridge, Tennessee, USA, https://doi.org/10.3334/ORNLDAAC/1925, 2021.
Xing, J., Wang, J., Mathur, R., Wang, S., Sarwar, G., Pleim, J., Hogrefe, C., Zhang, Y., Jiang, J., Wong, D. C., and Hao, J.: Impacts of aerosol direct effects on tropospheric ozone through changes in atmospheric dynamics and photolysis rates, Atmos. Chem. Phys., 17, 9869–9883, https://doi.org/10.5194/acp-17-9869-2017, 2017.
Xue, C., Ye, C., Kleffmann, J., Zhang, C., Catoire, V., Bao, F., Mellouki, A., Xue, L., Chen, J., Lu, K., Zhao, Y., Liu, H., Guo, Z., and Mu, Y.: Atmospheric measurements at Mt. Tai – Part I: HONO formation and its role in the oxidizing capacity of the upper boundary layer, Atmos. Chem. Phys., 22, 3149–3167, https://doi.org/10.5194/acp-22-3149-2022, 2022a.
Xue, C., Ye, C., Kleffmann, J., Zhang, W., He, X., Liu, P., Zhang, C., Zhao, X., Liu, C., Ma, Z., Liu, J., Wang, J., Lu, K., Catoire, V., Mellouki, A., and Mu, Y.: Atmospheric measurements at Mt. Tai – Part II: HONO budget and radical (ROx + NO3) chemistry in the lower boundary layer, Atmos. Chem. Phys., 22, 1035–1057, https://doi.org/10.5194/acp-22-1035-2022, 2022b.
Ye, C., Zhou, X., Pu, D., Stutz, J., Festa, J., Spolaor, M., Tsai, C., Cantrell, C., Mauldin III, R. L., Weinheimer, A., Hornbrook, R. S., Apel, E. C., Guenther, A., Kaser, L., Yuan, B., Karl, T., Haggerty, J., Hall, S., Ullmann, K., Smith, J., and Ortega, J.: Tropospheric HONO distribution and chemistry in the southeastern US, Atmos. Chem. Phys., 18, 9107–9120, https://doi.org/10.5194/acp-18-9107-2018, 2018.
Zhang, L., Wang, T., Zhang, Q., Zheng, J., Xu, Z., and Lv, M.: Potential sources of nitrous acid (HONO) and their impacts on ozone: A WRF-Chem study in a polluted subtropical region, J. Geophys. Res.-Atmos., 121, 3645–3662, 2016.
Zhang, N., Zhou, X., Shepson, P. B., Gao, H., Alaghmand, M., and Stirm, B.: Aircraft measurement of HONO vertical profiles over a forested region, Geophys. Res. Lett., 36, L15820, https://doi.org/10.1029/2009GL038999, 2009.
Zhang, S., Sarwar, G., Xing, J., Chu, B., Xue, C., Sarav, A., Ding, D., Zheng, H., Mu, Y., Duan, F., Ma, T., and He, H.: Improving the representation of HONO chemistry in CMAQ and examining its impact on haze over China, Atmos. Chem. Phys., 21, 15809–15826, https://doi.org/10.5194/acp-21-15809-2021, 2021.
Zheng, J., Shi, X., Ma, Y., Ren, X., Jabbour, H., Diao, Y., Wang, W., Ge, Y., Zhang, Y., and Zhu, W.: Contribution of nitrous acid to the atmospheric oxidation capacity in an industrial zone in the Yangtze River Delta region of China, Atmos. Chem. Phys., 20, 5457–5475, https://doi.org/10.5194/acp-20-5457-2020, 2020.
Zhou, X., Zhang, N., TerAvest, M., Tang, D., Hou, J., Bertman, S., Alaghmand, M., Shepson, P. B., Carroll, M. A., Griffith, S., Dusanter, S., and Stevens, P. S.: Nitric acid photolysis on forest canopy surface as a source for tropospheric nitrous acid, Nat. Geosci., 4, 440–443, https://doi.org/10.1038/NGEO1164, 2011.