the Creative Commons Attribution 4.0 License.
the Creative Commons Attribution 4.0 License.
 | 12 Jul 2023
The Fire Inventory from NCAR version 2.5: an updated global fire emissions model for climate and chemistry applications
Christine Wiedinmyer
Yosuke Kimura
Elena C. McDonald-Buller
Louisa K. Emmons
Rebecca R. Buchholz
Wenfu Tang
Keenan Seto
Maxwell B. Joseph
Kelley C. Barsanti
Annmarie G. Carlton
Robert Yokelson
We present the Fire Inventory from National Center for Atmospheric Research (NCAR) version 2.5 (FINNv2.5), a fire emissions inventory that provides publicly available emissions of trace gases and aerosols for various applications, including use in global and regional atmospheric chemistry modeling. FINNv2.5 includes numerous updates to the FINN version 1 framework to better represent burned area, vegetation burned, and chemicals emitted. Major changes include the use of active fire detections from the Visible Infrared Imaging Radiometer Suite (VIIRS) at 375 m spatial resolution, which allows smaller fires to be included in the emissions processing. The calculation of burned area has been updated such that a more rigorous approach is used to aggregate fire detections, which better accounts for larger fires and enables using multiple satellite products simultaneously for emissions estimates. Fuel characterization and emissions factors have also been updated in FINNv2.5. Daily fire emissions for many trace gases and aerosols are determined for 2002–2019 (Moderate Resolution Imaging Spectroradiometer (MODIS)-only fire detections) and 2012–2019 (MODIS + VIIRS fire detections). The non-methane organic gas emissions are allocated to the species of several commonly used chemical mechanisms. We compare FINNv2.5 emissions against other widely used fire emissions inventories. The performance of FINNv2.5 emissions as inputs to a chemical transport model is assessed with satellite observations. Uncertainties in the emissions estimates remain, particularly in Africa and South America during August–October and in southeast and equatorial Asia in March and April. Recommendations for future evaluation and use are given.
Please read the corrigendum first before continuing.
-
Notice on corrigendum
The requested paper has a corresponding corrigendum published. Please read the corrigendum first before downloading the article.
-
Article
(5622 KB)
- Corrigendum
-
Supplement
(2889 KB)
-
The requested paper has a corresponding corrigendum published. Please read the corrigendum first before downloading the article.
- Article
(5622 KB) - Full-text XML
- Corrigendum
-
Supplement
(2889 KB) - BibTeX
- EndNote


Open fires, such as wildfires, prescribed burns, agricultural fires, and land-clearing fires, are sources of atmospheric pollutants. Fire activity contributes to local, regional, and global emissions of greenhouse gases including carbon dioxide (CO2) and methane (CH4), reactive gases such as non-methane organic gases (NMOGs) and nitrogen oxides (NOx) that form ozone, dioxins and other air toxics, and particulate matter (PM). Fire emissions and their transport change the atmospheric composition to cause impacts at many scales, with implications for air quality (e.g., Burke et al., 2021; Jaffe et al., 2020; Liu et al., 2017; Tang et al., 2022; Bourgeois et al., 2021; Xu et al., 2020, 2021), regional and global climate (e.g., Dintwe et al., 2017; Jin et al., 2012; Liu et al., 2019), visibility (e.g., Ford et al., 2018; Jaffe et al., 2020; Val Martin et al., 2015), and human health outcomes (e.g., Liu et al., 2017; Reid et al., 2016; Xu et al., 2020). Many factors contribute to the spatial and temporal patterns and severity of fires and their emissions, including agricultural, forest, and waste management practices, land use change, climatic factors such as temperature, rainfall, and drought conditions, and ecosystem diversity and health (e.g., Armenteras et al., 2021; Kelly et al., 2020; Pausas and Keeley, 2021). Future climate, policy, and human development patterns, including in the wildland–urban interface (WUI), will have complex interactions on the effects of fires that may require adaptive strategies for communities (Schoennagel et al., 2017).
Accurate estimates of fire emissions are required to understand chemistry and climate, to assess ambient pollutant concentrations and population exposure, and to evaluate the effectiveness of emissions control programs for air quality planning and management. The FINN (Fire INventory from NCAR; Wiedinmyer et al., 2011; https://www2.acom.ucar.edu/modeling/finn-fire-inventory-ncar, last access: 7 July 2023) inventory was developed more than 10 years ago to provide daily global estimates of pollutant emissions from open fires with a high spatial and temporal resolution for use in air quality, atmospheric composition, and climate modeling applications. The National Center for Atmospheric Research (NCAR) has served as the central repository for FINN global emissions files spanning 2002–2020 (https://www.acom.ucar.edu/Data/fire/, last access: 6 July 2023). FINN estimates have been downloaded more than 13 450 times since 29 August 2013, as of 10 July 2023, and the original model has been cited 998 times (Clarivate Web of Science, http://www.webofscience.com, last access: 10 July 2023). FINN emissions estimates have been applied in regions of the world that experience high fire activity to evaluate the influences on air quality and public health (e.g., Crippa et al., 2016; Kulkarni et al., 2020; Nawaz and Henze, 2020; Nuryanto, 2015; Pimonsree and Vongruang, 2018; Takami et al., 2020), to assess emissions trends (e.g., Ma et al., 2018; Shen et al., 2019), to examine the effects of changing climate and development patterns on wildfire emissions (e.g., Hurteau et al., 2014), and in comparisons with surface, aircraft, and satellite-based observations (e.g., Reddington et al., 2019; Stavrakou et al., 2016), as well as with inventories developed using other fire emissions modeling systems (e.g., Bray et al., 2018; Faulstich et al., 2022; Kiely et al., 2019; Koplitz et al., 2018; Larkin et al., 2014; Liu et al., 2020; Pereira et al., 2016; Urbanski et al., 2018). Real-time emissions estimates from FINN version 1 (FINNv1) are currently used in the NCAR Whole Atmosphere Community Climate Model (WACCM) chemistry and aerosol forecasts (http://www.acom.ucar.edu/waccm/forecast/, last access: 6 July 2023).
The FINNv1 model is based on a bottom-up approach to estimate the emissions described by Wiedinmyer et al. (2011). In FINNv1, global observations from the Moderate Resolution Imaging Spectroradiometer (MODIS) sensors on board the National Aeronautics and Space Administration's (NASA) Terra and Aqua satellites are used to detect fire activity, beginning with the MODIS Rapid Response (MRR) system or the MODIS Adaptive Processing System (MODAPS) Collection 5 (NASA/University of Maryland, 2002; Davies et al., 2009). Fuel characterization in FINNv1 is based on the Collection 5 MODIS Land Cover Type (LCT) product for 2005 (Friedl et al., 2010), with land cover classifications defined by the International Geosphere–Biosphere Programme (IGBP) and the Collection 3 MODIS Vegetation Continuous Fields (VCF) product for 2001 (Carroll et al., 2011; Hansen et al., 2003, 2005). Fuel loadings are assigned from Hoelzemann (2004) or Akagi et al. (2011). Estimates of fuel burned use the approach of Ito and Penner (2004). Emissions factors by land cover classification for trace gases and particulate air pollutants in FINNv1 are based on the published literature at the time (Akagi et al., 2011; Andreae and Merlet, 2001; Andreae and Rosenfeld, 2008; McMeeking, 2008).
FINN version 2.5 (FINNv2.5) has extensive updates to the input data and processing used for the detection of fire activity, characterization of annual land use and/or land cover and vegetation density, determination of area burned, and the application of fuel loadings by global region compared to the FINNv1 configuration. FINNv2.5 also includes revisions to emissions factors based on the current literature. Here we describe the development of FINNv2.5, released in 2022 (Wiedinmyer and Emmons, 2022). Global emissions for 2002 through 2021 have been created and are online for public use, for inclusion in emissions inventories and chemical and climate modeling applications, and for comparisons with previous versions of FINN and results from other fire emissions models.
FINNv2.5 uses the same FINNv1 bottom-up methodology (Seiler and Crutzen, 1980; Wiedinmyer et al., 2011) as defined by the following overall equation:
where the emissions (E; mass of pollutant i) are the product of the area burned at location x and time t [A(x,t)], the biomass at location x [B(x)], the fraction of biomass that is burned (FB), and an emissions factor (EFi; mass of pollutant i per biomass burned).
The FINNv2.5 model framework has the following three components: (1) burned area and land cover determination (Sect. 2.1–2.3), (2) fuel consumption and emissions calculation (Sect. 2.4), and (3) speciation of the non-methane organic gases (NMOGs; Sect. 2.5).
2.1 Fire location and timing
FINNv2.5 first determines the burned area from daily satellite detections of active fires. FINNv2.5 uses MODIS detections (nominal 1 km2 resolution; Giglio et al., 2006), as in FINNv1, and adds the option to use active fire detections at 375 m resolution from the Visible Infrared Imaging Radiometer Suite (VIIRS; Csiszar et al., 2014), on board the Suomi National Polar-orbiting Partnership (Suomi-NPP) satellite, alone or in combination with MODIS active fire data. The use of VIIRS 375 m detections is a major advancement from the use of MODIS-only fire detections, as this product better captures small fires. VIIRS detections are available from 2012 to the current year.
The MODIS Collection 6 (MCD14DL) and VIIRS active fire products are obtained from NASA's Fire Information for Resource Management System (FIRMS) data portal (https://firms.modaps.eosdis.nasa.gov/download/, last access: 19 June 2022). The MODIS product provides the location, overpass time (Coordinated Universal Time, UTC), and confidence of daily fire detections. Data confidence in the MODIS product is specified by a numerical scale of 0 % to 100 %. Detections with a confidence specification of less than 20 % are eliminated from our calculation in FINNv2.5, as was done in earlier FINN versions. Daily global coverage is not accomplished at latitudes between approximately 23.5∘ N and 23.5∘ S, due to the observational swath width. To account for the lack of daily observations, fire detections in these equatorial regions only are counted for a 2 d period; each fire is assumed to continue into the next day. Regardless of whether the detection is from MODIS or VIIRS, the intent is to repeat the fire at the same location, since there is not a clear alternative at this time in these global regions, as described by Wiedinmyer et al. (2011).
With its improved spatial resolution of 375 m, the VIIRS product provides a more sensitive detection of the fires of relatively small areas, fully global coverage, improved mapping of large fire perimeters, and improved nighttime performance relative to MODIS fire detections (Schroeder et al., 2014). The higher detection rates of small fires can be particularly important for areas of the world such as southeast Asia, where burning of agriculture is common, and in the southeastern USA, where there is a large amount of managed burning. Detection confidence is provided by the VIIRS product and is specified by three categories, namely low, nominal, and high. In the FINNv2.5 preprocessor, detections with a confidence specification identified as low are eliminated from the analysis. We only include data attributed to thermal anomalies from vegetation fires (type = 0; i.e., other thermal anomaly types associated with active volcanos or other static land sources are filtered from the product).
The processing of the two simultaneous fire products in FINNv2.5 does not lead to double-counting of the fires; the FINNv2.5 method determines the spatial union of all adjacent detections for a given day as the daily burned area of a fire, as described below in Sect. 2.2. The identity of the sensor is not relevant for the determination of the burned area, as long as the pixel size for each detection is correctly represented (i.e., 0.14 km2 for VIIRS and 1 km2 for MODIS). FINNv2.5 and earlier versions do not account for the effects of burning from earlier days for fire detections at the same location; i.e., the fraction burned is consistent with unperturbed vegetation on the first day, regardless of the persistence of fire activity, and emissions scale directly with the detection of a thermal anomaly in the same location over multiple days.
The active fire products report the time of acquisition in Coordinated Universal Time (UTC). In contrast to previous versions of the model, the FINNv2.5 preprocessor uses local time in the specification of the date of a fire detection in order to facilitate comparisons of emissions estimates with observational data.
2.2 Burned area
FINNv1 estimates burned area for each fire pixel identified individually, and the nominal pixel size for the MODIS fire detections, 1 km2, is assumed per detection. Spatially overlapping detections are eliminated from further analysis. It was recognized that for large fires in forested regions, an array of multiple discrete detections is typically reported, and an estimate of a contiguous area that represents the total area burned by a fire is needed. We improved the burned area estimate in FINNv2 to better represent the area associated with each fire.
A fire event in the western USA is shown in Fig. 1a to illustrate the new approach for estimating the area burned. For FINNv2.5, each reported active fire detection (Fig. 1b) is assigned a square area of 0.14 km2 from VIIRS or 1 km2 from MODIS (Fig. 1c), based on the nominal horizontal resolution of the data (denoted as the instrument resolution square). Detections determined to be in proximity with one another are aggregated by two different approaches, depending on the land cover type and forest cover. Initially, it is assumed that multiple detections by adjacent pixels in a satellite sensor array are part of a larger fire, and these detections are merged. The scan and track sizes of the satellite pixel are provided by the fire detection product and define the actual resolution of the fire detection. The scan and track sizes for each fire detection are used for identifying groups of records that represent contiguous or overlapping detections. A rectangle with easterly and northerly sizes equal to 110 % of the scan and track sizes is established for each detection (denoted as the detection rectangle; Fig. 1d), with the objective of identifying adjacent neighboring detections but not for direct application to the burned area estimation. Fire detections are identified as being from one larger fire when any of the satellite detection rectangles overlap. To minimize an overestimation of the burned area, a convex hull is generated between corresponding pairs of detection rectangles that directly intersect. The union of pairwise convex hulls from a cluster forms an extended fire polygon that represents the tentative estimated burned area for a single fire event or group of nearby fires for the day (Fig. 1d). This approach effectively fills any gap between instrument resolution squares.
For each of the extended polygons, the MOD44B v006 MODIS/Terra VCF annual product (https://lpdaac.usgs.gov/products/mod44bv006/, last access: 13 July 2022) is overlaid (Sect. 2.3), and the average tree cover fraction is determined (Fig. 1e). For forested areas with tree cover ≥50 %, as determined by the VCF product, the merged polygons are accepted as the final burned area estimate. Otherwise, the merging is not used, and instead, an alternative, more conservative, approach is applied to determine the burned area for the region. This alternative approach is used to prevent overestimation of emissions in regions with many small fires, as in the savanna fires in sub-Saharan Africa. The alternative polygon aggregation is achieved by aggregating nearby detections only when the instrument pixels themselves are intersecting (Fig. 1c) and therefore not with the extended detection footprints (Fig. 1d). The result is an aggregation algorithm that is repeated with a smaller set of detections to determine the alternative conservative set of polygons (denoted as the conservative fire polygon). The final burned area polygons in Fig. 1f show examples of a composite of polygons based on these two different aggregation approaches. Note that at the bottom of Fig. 1f there is a region with less than 50 % tree cover that has a smaller final burned area polygon estimate than the extended polygon (blue). In contrast, the polygon in the center of Fig. 1f, which is a forested area with more than 50 % tree cover, uses the extended polygon determined in Fig. 1d (further information about this aggregation is given in Sect. S1 in the Supplement).
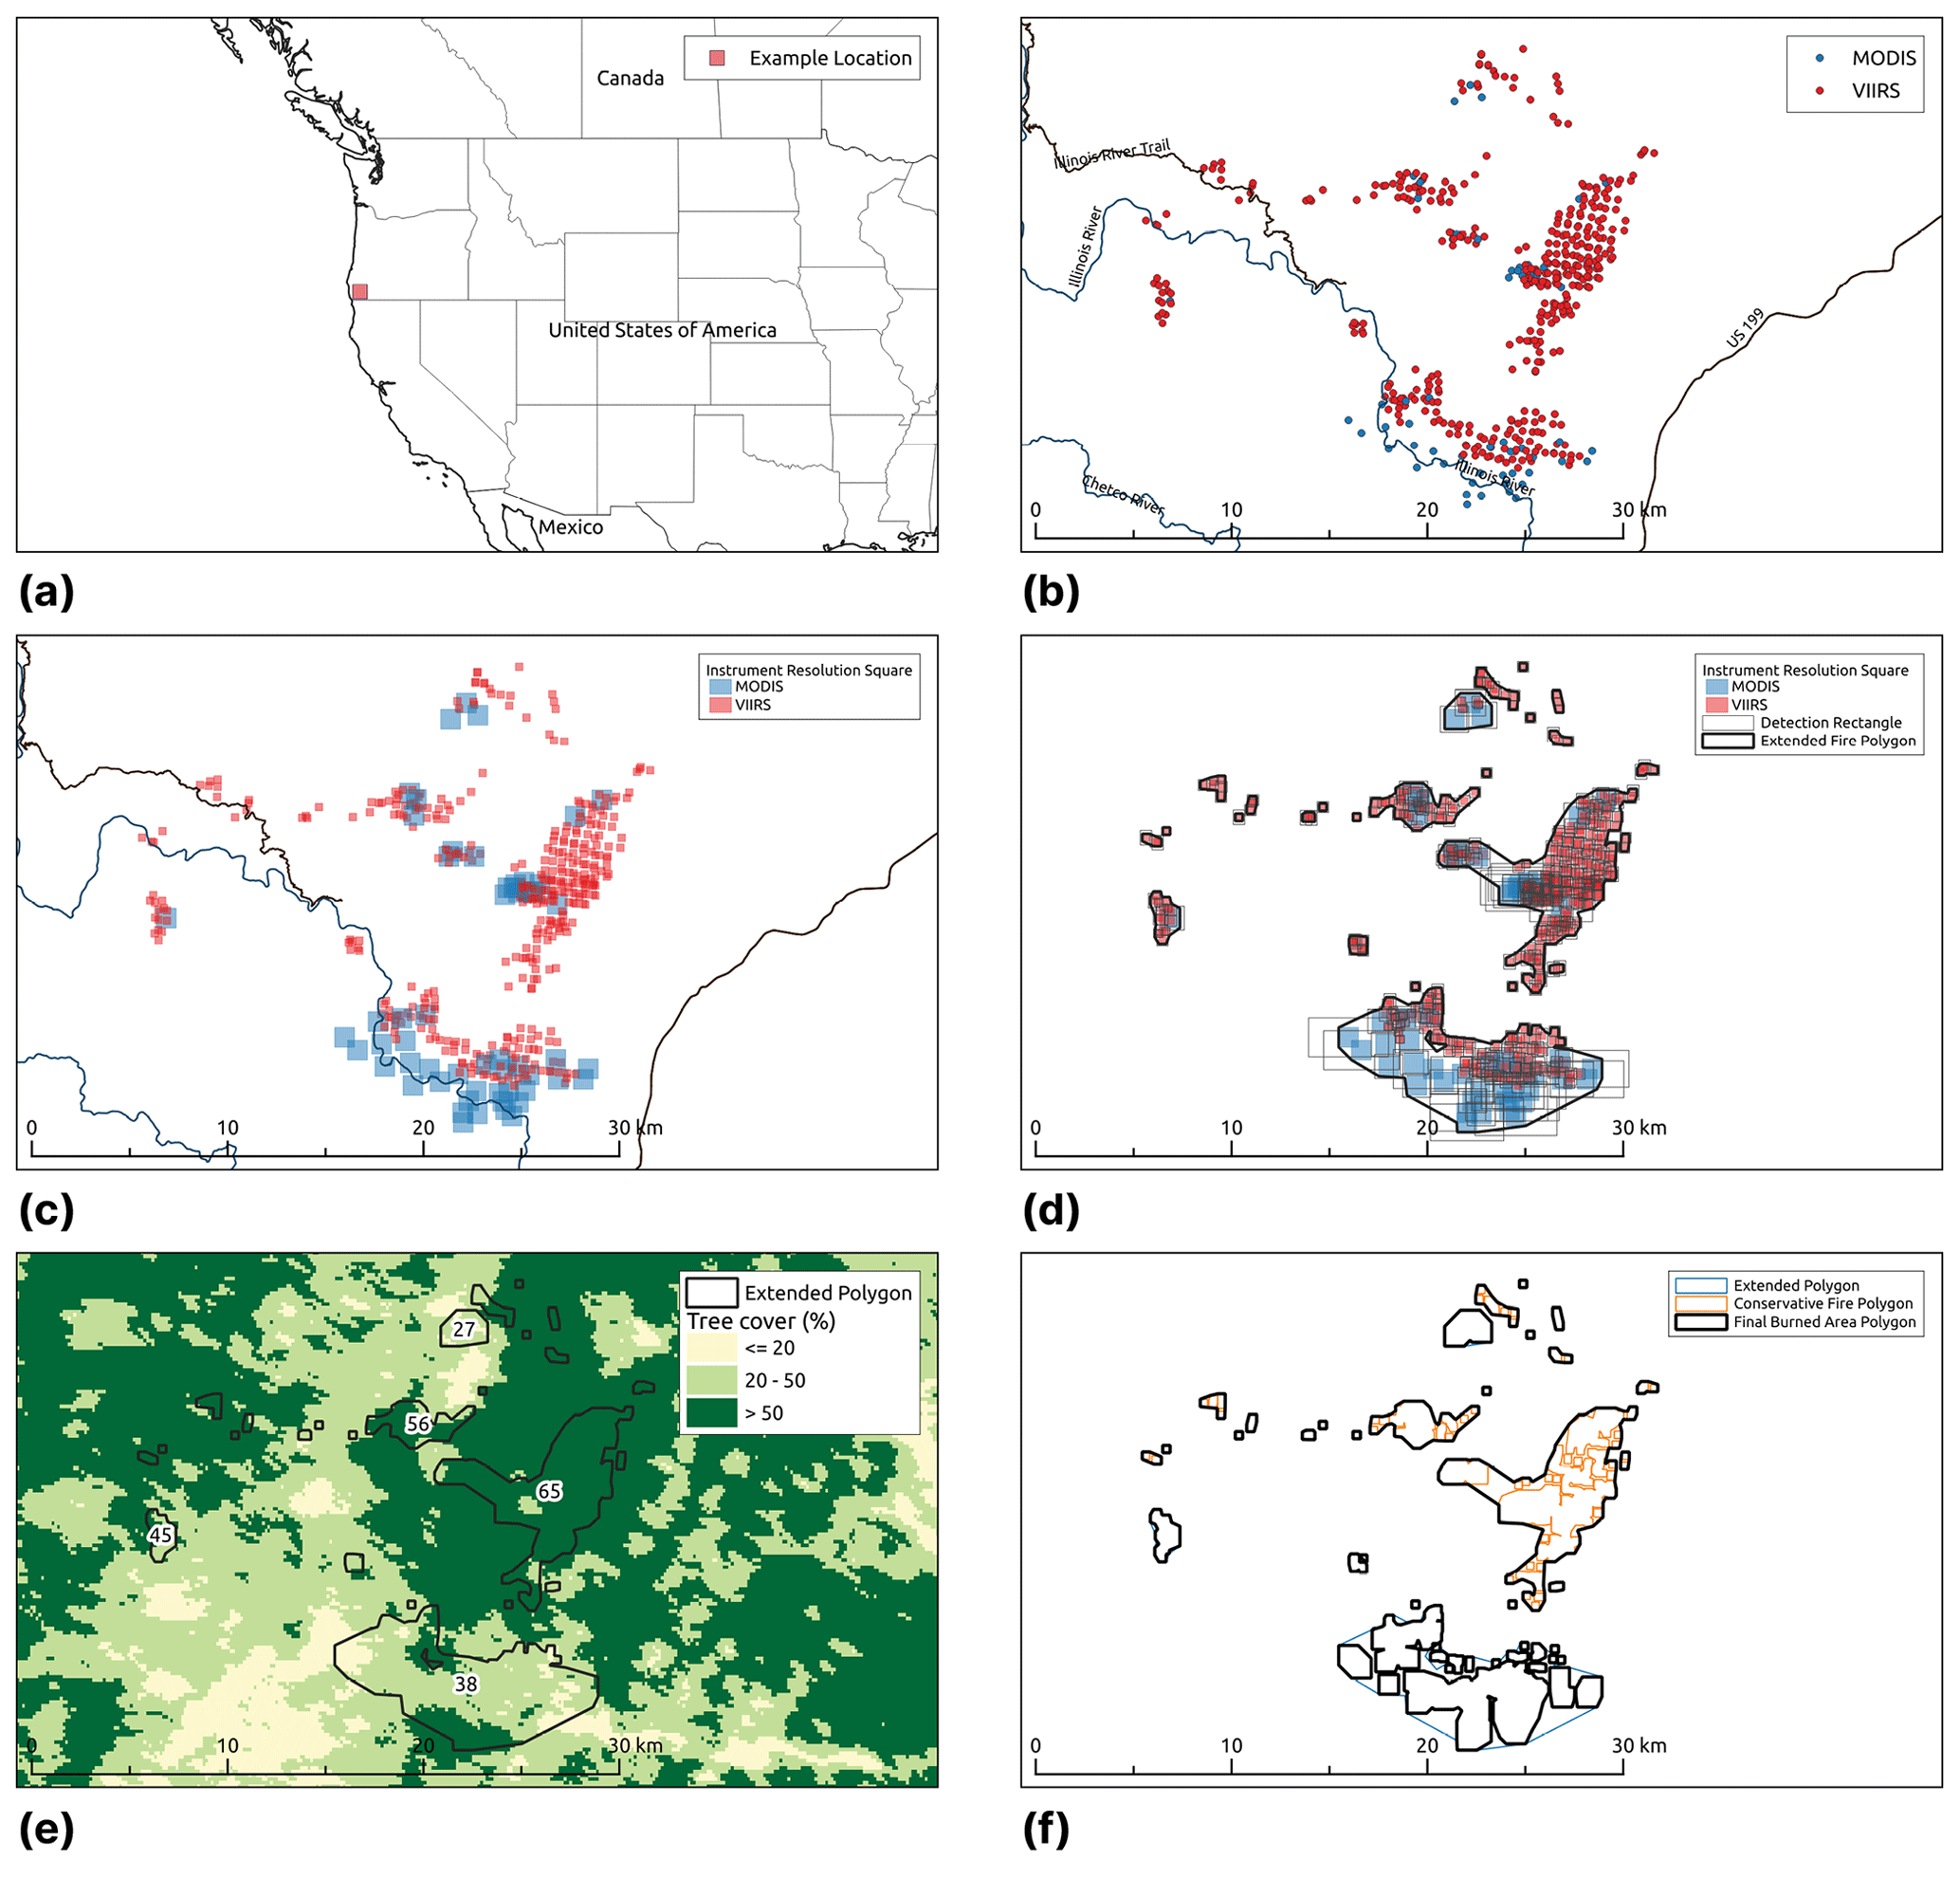
Figure 1Illustration of the burned area determination used in the FINNv2.5 preprocessor for 11 August 2018 when both MODIS and VIIRS fire detections are applied. (a) Example fire location, (b) active fire detections, (c) burned area per detection based on instrument resolution, (d) detection clusters joined for the determination of the extended burned area, (e) determination of the average percent of tree cover (labeled as VCF) for merged polygons, and (f) final burned area polygons reflecting either extended or conservative polygons based on the percent of tree cover.
Subsequently, the final burned area polygons are subdivided using a Voronoi tessellation algorithm in order to develop emissions estimates by land cover classification, as described in Sect. 2.3 and 2.4. Each of the undivided final burned area polygons are assigned a unique fire ID to enable users to group emissions estimates from a presumed single fire event.
2.3 Fuel loading and vegetation inputs
The NASA MODIS VCF product provides estimates of the percentage of bare surface, herbaceous, and forested cover at a horizontal resolution of 250 m (Fig. S1). For each fire area, the subdivided polygons described in Sect. 2.2 (Fig. 1g) are overlaid on the vegetation cover data from the MOD44B v006 MODIS/Terra VCF annual product (https://lpdaac.usgs.gov/products/mod44bv006/, last access: 13 July 2022; Fig. 1e). The VCF data for the prior year are chosen, so that the VCF before any land cover changes due to fire are used in the emissions estimation process. The VCF raster is clipped to the geometry of the fire polygon, and the averages of the VCF tree, herbaceous, and bare cover are calculated for each fire polygon.
FINNv2.5 uses the Terra and Aqua combined MODIS LCT MCD12Q1 Version 6 data product with the International Geosphere–Biosphere Programme (IGBP) classification scheme (https://lpdaac.usgs.gov/products/mcd12q1v006/, last access: 13 July 2022) as its default land cover information. Figure 2 shows the global distribution of land cover applied as the default in FINNv2.5. Each subdivided polygon (for example, in Fig. 3) is assigned the factional coverage of 1 of 16 land cover classifications (Table 1). Similar to the application of the VCF information, land use data from the previous year are used.
Use of the LCT and VCF products in FINNv2.5 is an improvement on FINNv1. FINNv1 used one static map of LCT and VCF (from 2002) for any year processed. FINNv2.5 employs year-specific MODIS LCT and VCF maps that change annually. Furthermore, the specific vegetation assignments for each subdivided polygon enable different vegetation types and coverage to be represented across larger fires. These input data and processes enable better representation of the vegetation that is burned.
All fire polygons are assigned to 1 of 13 global regions (Wiedinmyer et al., 2011) used to assign fuel loadings (Sect. 2.4). This completes the first component of the FINNv2.5 modeling framework and results in a file of daily burned areas and associated land cover information.
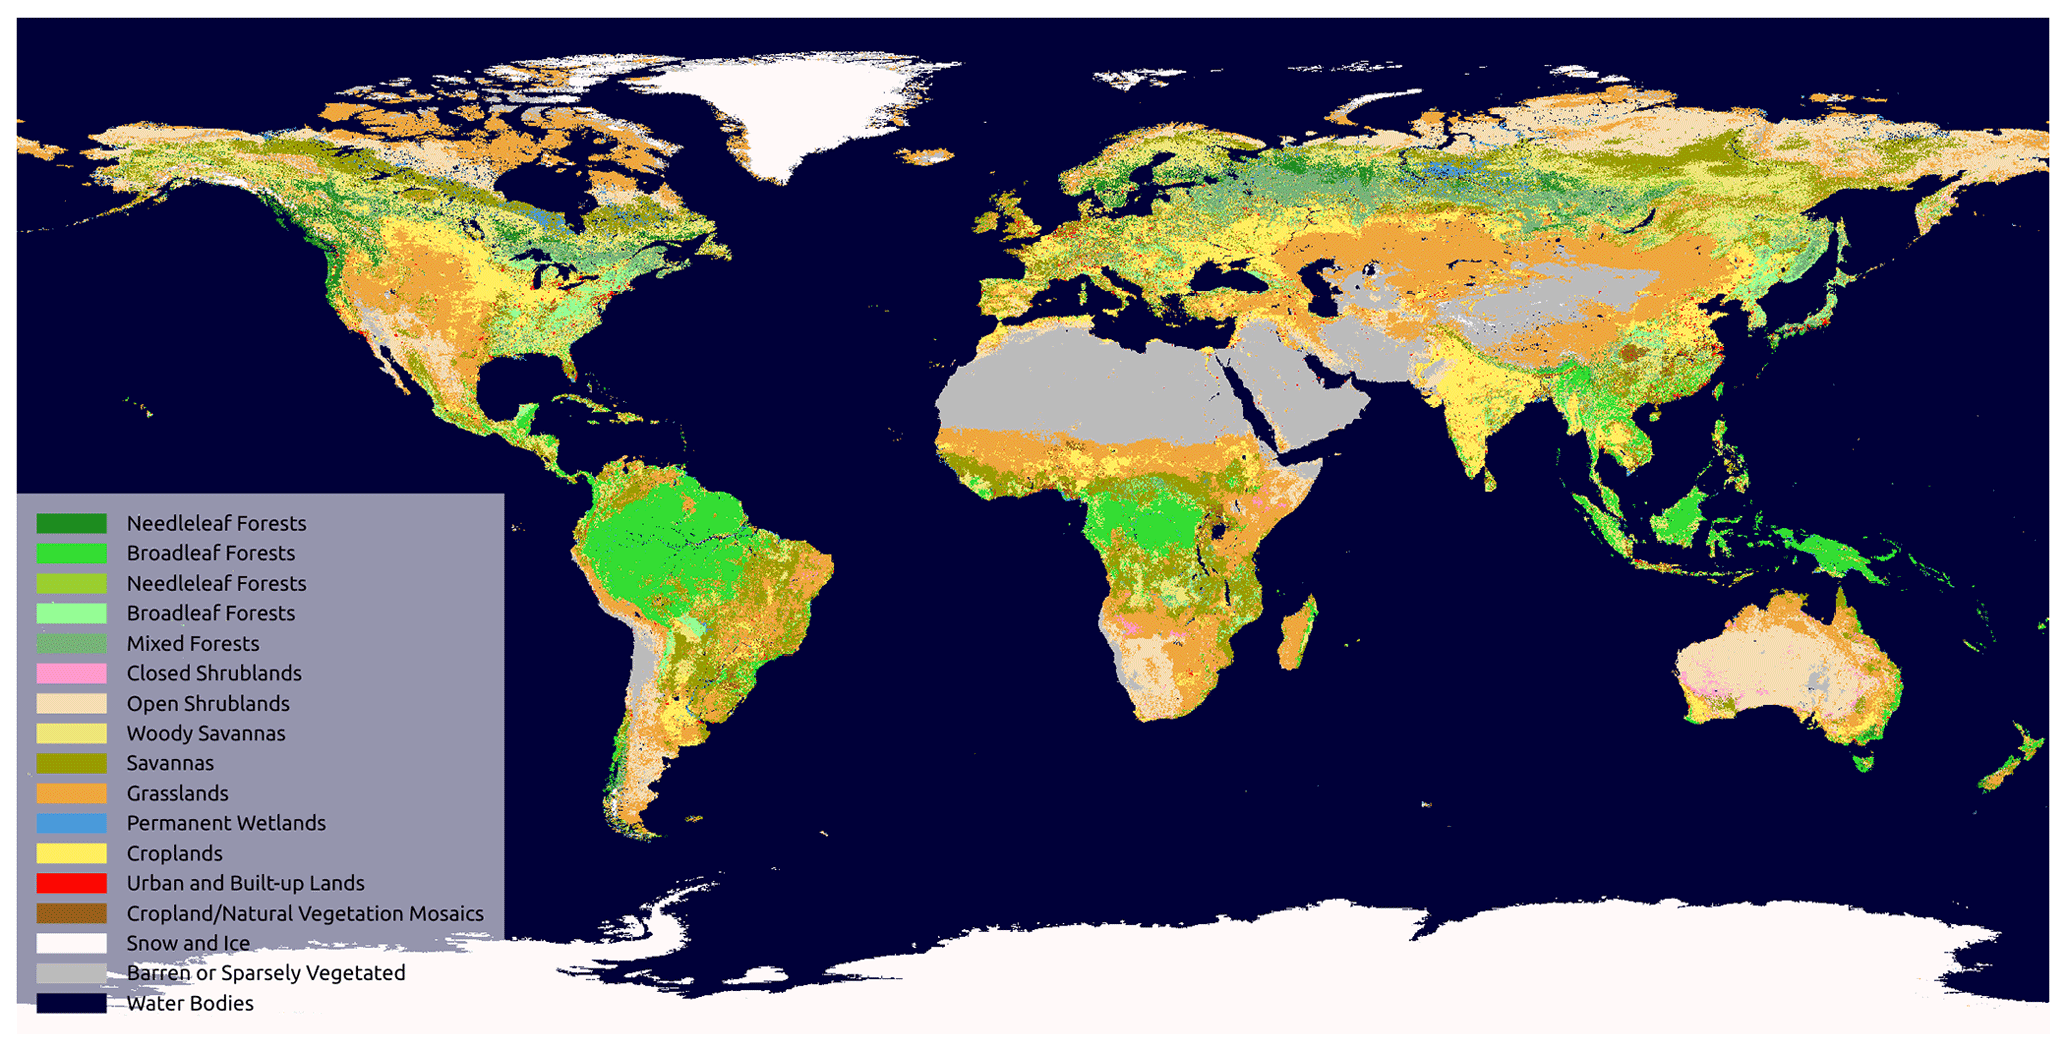
Figure 2MCD12Q1 Version 6 data product with the International Geosphere–Biosphere Programme (IGBP) classification scheme.
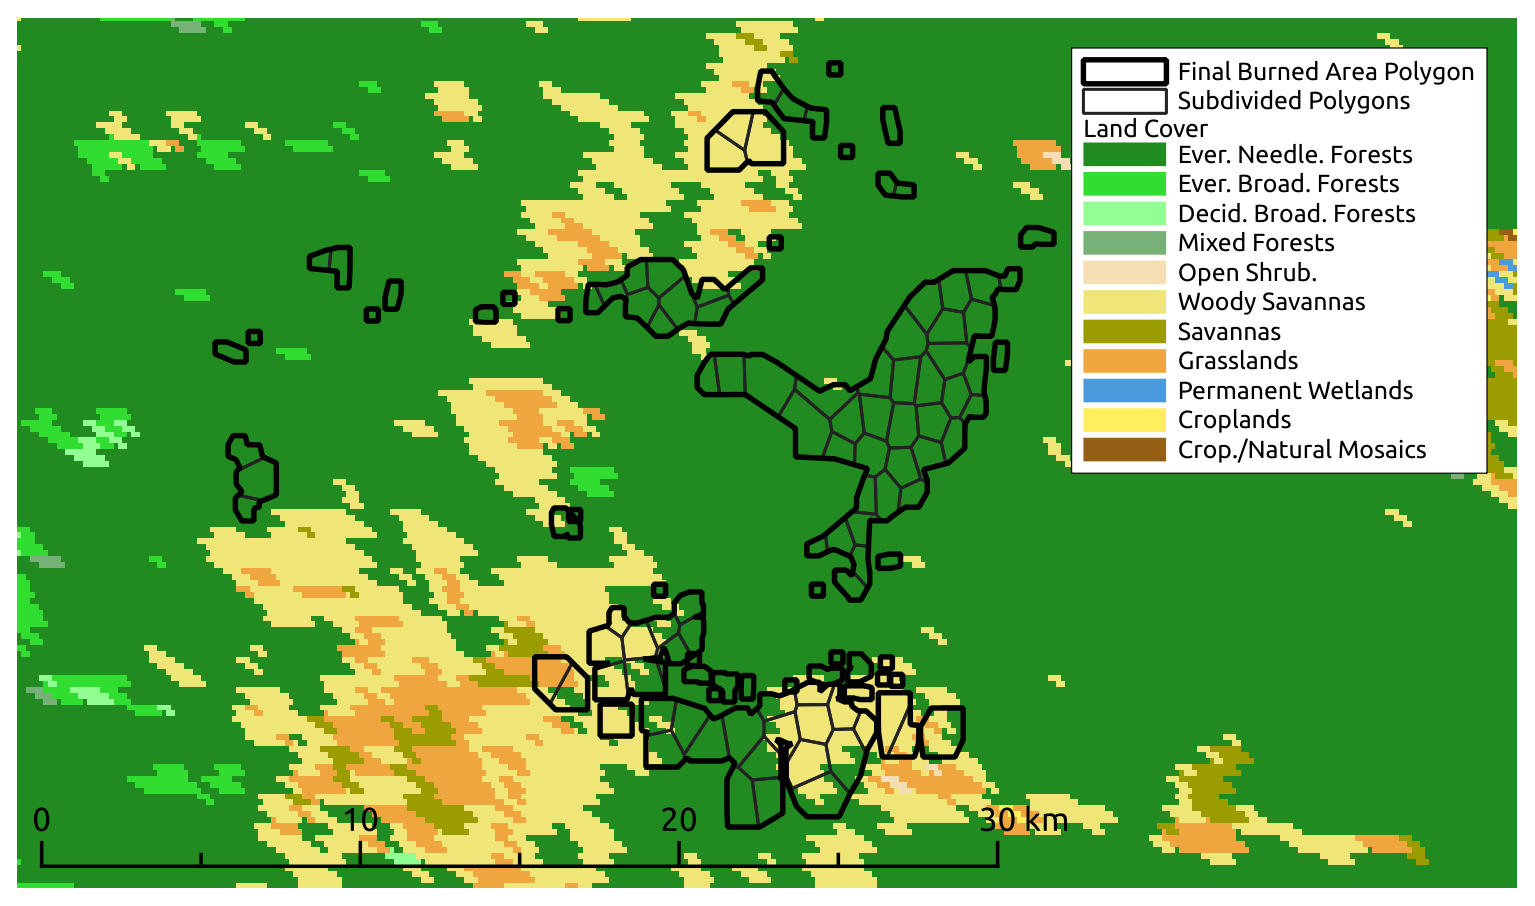
Figure 3Illustration of the burned area determination used in the FINNv2.5 preprocessor for 11 August 2018 (continued from Fig. 1), showing the subdivision of the burned area polygons to develop emissions estimates by the MODIS IGBP land cover classification.
2.4 Emissions calculation
The next step of the model framework is the emissions calculation. In this step, the daily burned area and associated vegetation information (described above) are assigned associated fuel loadings. Using the same process described by Wiedinmyer et al. (2011), where the biomass burned is assigned based on land cover type and global region (B), the fraction of the biomass that is burned (FB) is assigned as a function of tree and herbaceous cover, emissions factors (EFs) are determined based on land cover, and daily pollutant emissions estimates are calculated following Eq. (1). Overall, the emissions calculation process follows this framework, as described by Wiedinmyer et al. (2011), with the following exceptions.
Similar to earlier FINN versions (Wiedinmyer et al., 2011), the 16 IGBP land cover classifications of the LCT product are mapped to consolidated vegetation types, depending on the land cover class and latitude that distinguish tropical, temperate, and boreal forests (Table 1). The consolidated vegetation types used in FINNv2.5 are grassland and savanna, woody savanna or shrubs, tropical forest, temperate forest, boreal forest, temperate evergreen forest, and crops.
Table 1LCT IGBP and generic vegetation type descriptions.
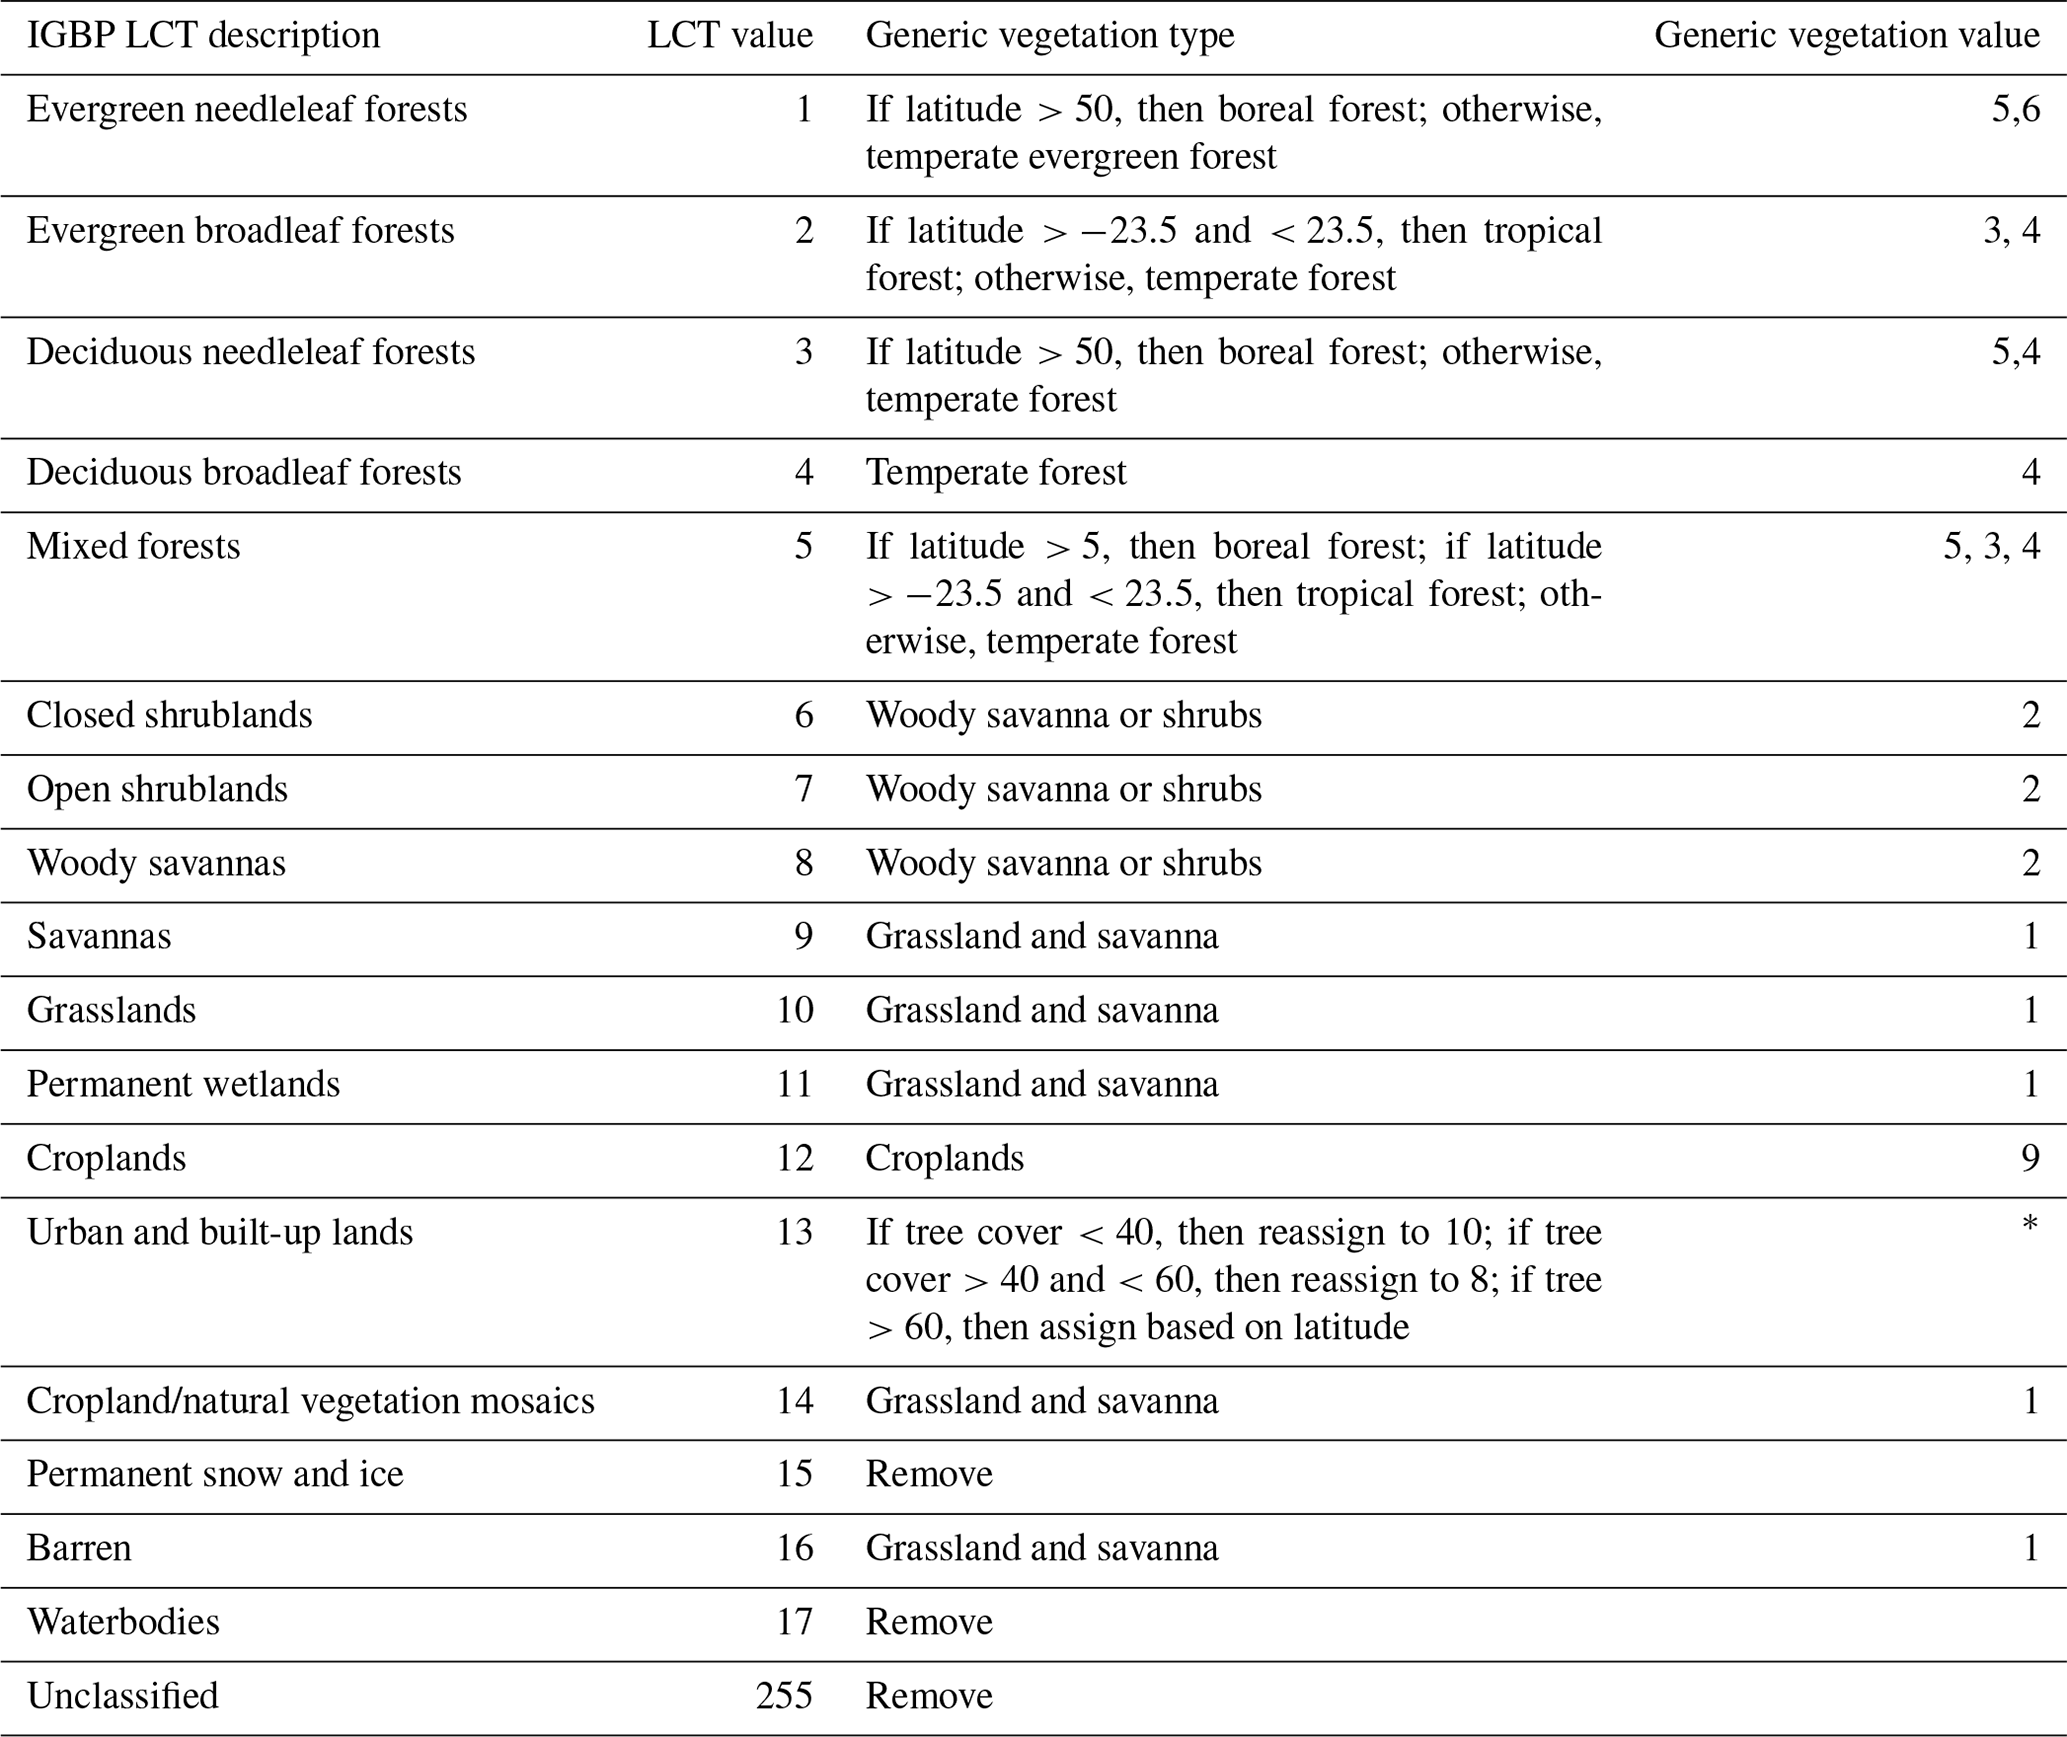
* If latitude >50, then boreal forest; if latitude and <30, then tropical forest; otherwise, temperate forest.
The fuel loading, or the potential maximum amount of biomass available to be burned (B(x) in Eq. 1), is assigned by generic vegetation type and global region (Table 2). Selected values were updated for FINNv2.5 from earlier versions of FINN, based on van Leeuwen et al. (2014). The fuel loading for crops was updated to 902 g m−2, based on an average from the literature (Akagi et al., 2011; van Leeuwen et al., 2014; Pouliot et al., 2017). Specific crop types are not identified in the version described here.
Table 2Fuel loadings (g m−2) assigned by generic land cover type and global region. These values are as described by Wiedinmyer et al. (2011), unless noted otherwise. Values in bold indicate those updated for FINNv2.5, based on van Leeuwen et al. (2014).
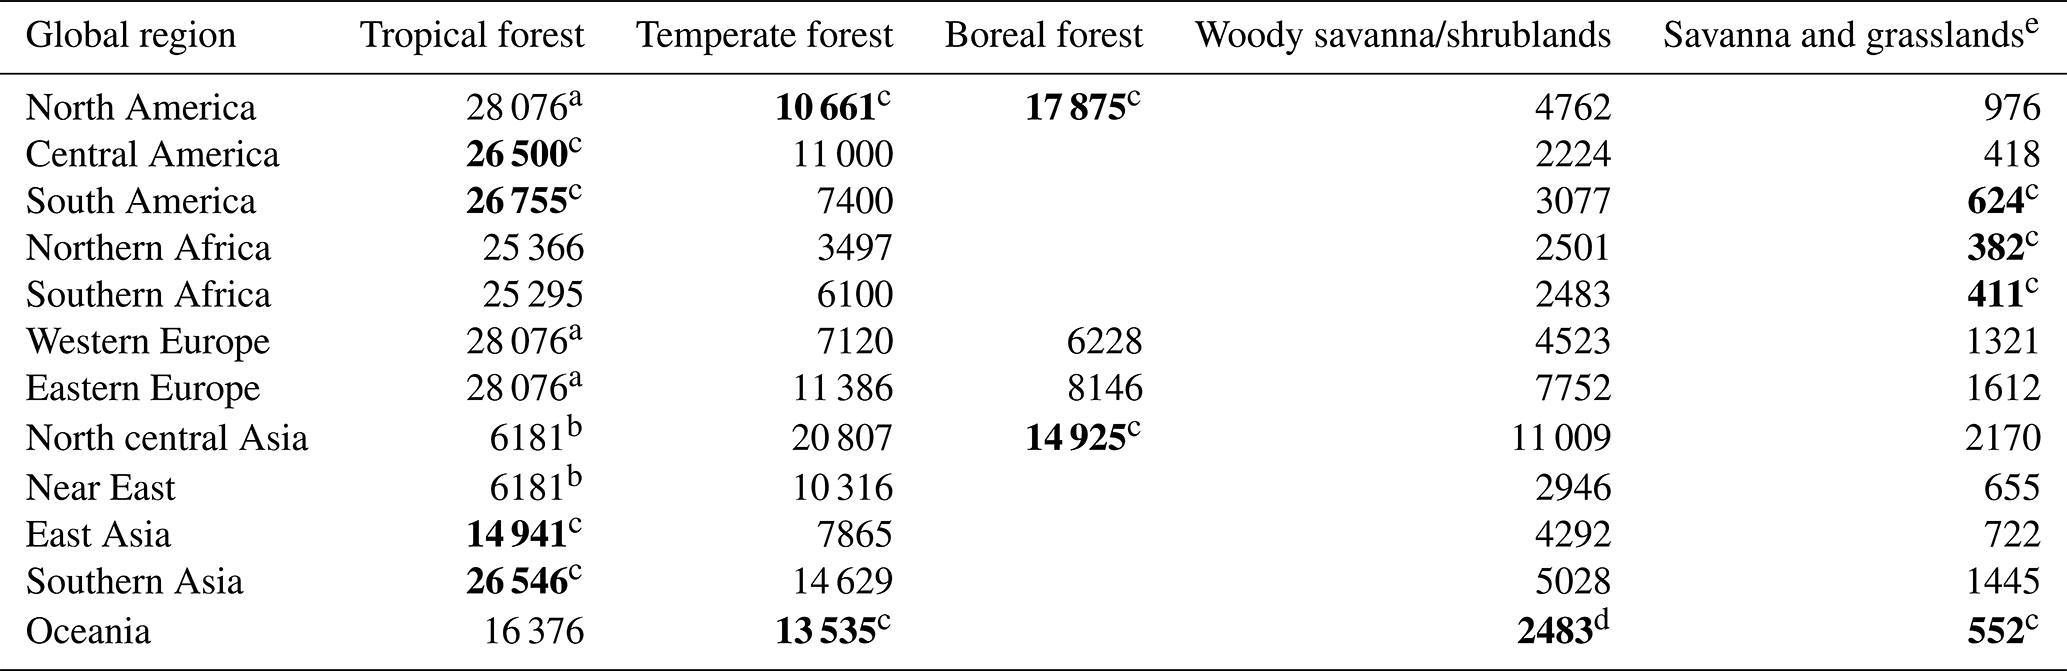
a Tropical forest class added for North America and Europe (in LCT). b All of Asia is assigned equal tropical forest values. c Taken from van Leeuwen et al. (2014). d Taken as the same for African woody savanna from van Leeuwen et al. (2014). e Croplands are assigned the same fuel loading as grasslands.
For North America, FINNv2.5 utilizes the fuel loadings for coarse/woody and herbaceous vegetation by land cover type derived from the Fuel Characteristic Classification System (FCCS) of the U.S. Department of Agriculture Forest Service (https://www.landfire.gov/fccs.php, last access: 23 December 2018), as described by McDonald-Buller et al. (2015). These fuel loadings (Table 3) have priority over the regional default fuel loadings (Table 2).
Table 3North American fuel loadings (g m−2) by land cover type for coarse/woody and herbaceous vegetation. These values are based on the Fuel Characteristic Classification System (FCCS; https://www.landfire.gov/fccs.php, last access: 23 December 2018), with the exception of croplands∗.
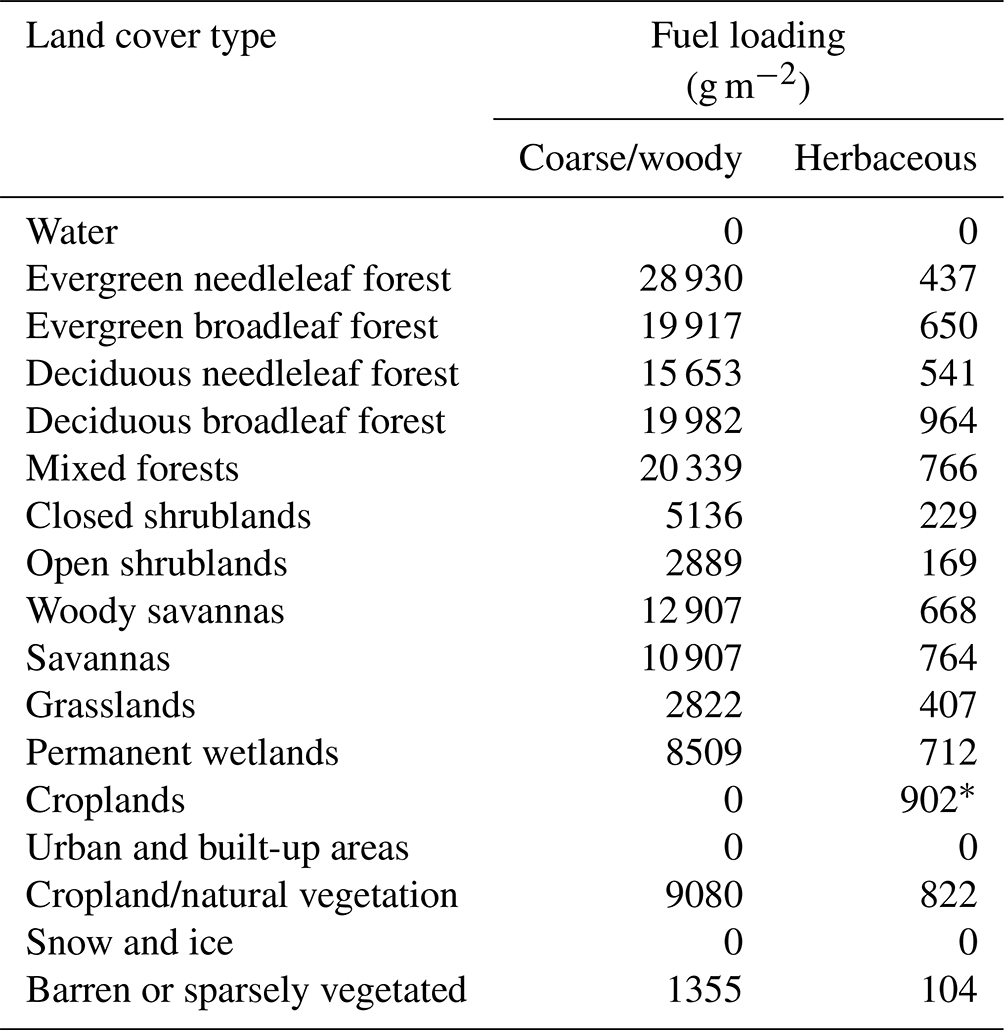
∗ Taken as an average from van Leeuwen et al. (2014), Akagi et al. (2011), and McCarty et al. (2012).
Emissions factors are assigned based on the generic vegetation type. Since the original release of FINNv1 in 2011, there have been many studies to measure emissions factors from wildland fires. We have updated the emissions factors from FINNv1.5 with the results from recent publications (Table 4).
Table 4Emissions factors (g kg−1) for FINNv2.5.
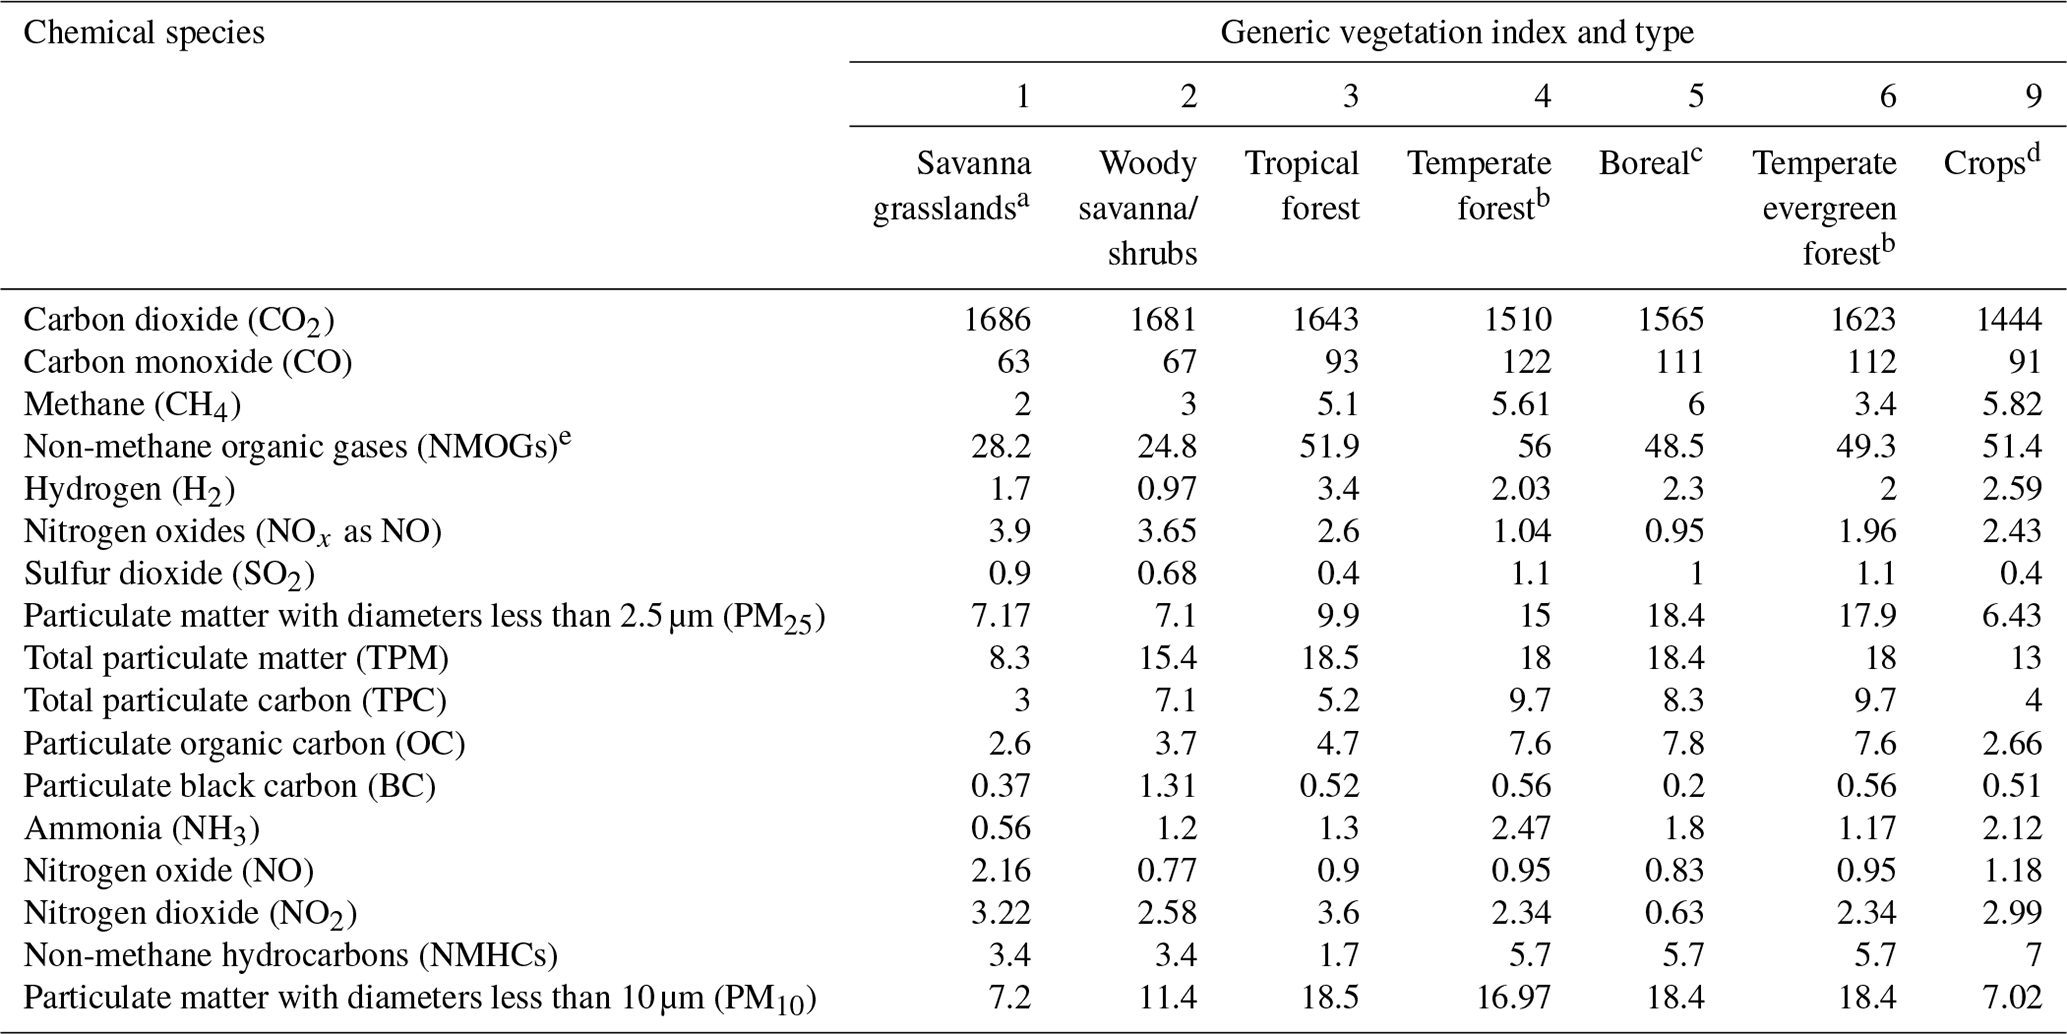
a Emissions factors for tropical forests, savannah/grasslands, and woody savannah/shrubs are updated to the average values from Akagi et al. (2011; updated in February 2015). b Emissions factors for temperate forest and temperate evergreen forests are the average values from Akagi et al. (2011; updated February 2015), and the results are from Liu et al. (2017), Paton-Walsh et al. (2014), and Urbanski (2014). For temperate evergreen forest, only the results from evergreen forests are included. c Boreal forest emissions factors are the average of Akagi et al. (2011), with the emissions factors from boreal forest taken from Urbanski (2014). d Crop emissions factors are updated with the average values from Akagi et al. (2011) and results from Fang et al. (2017), Liu et al. (2016), Santiago-De La Rosa et al. (2018), and Stockwell et al. (2015; Table S3). e NMOG emissions factors now include identified and unidentified compounds.
2.5 Allocation of non-methane organic gases to chemical mechanisms
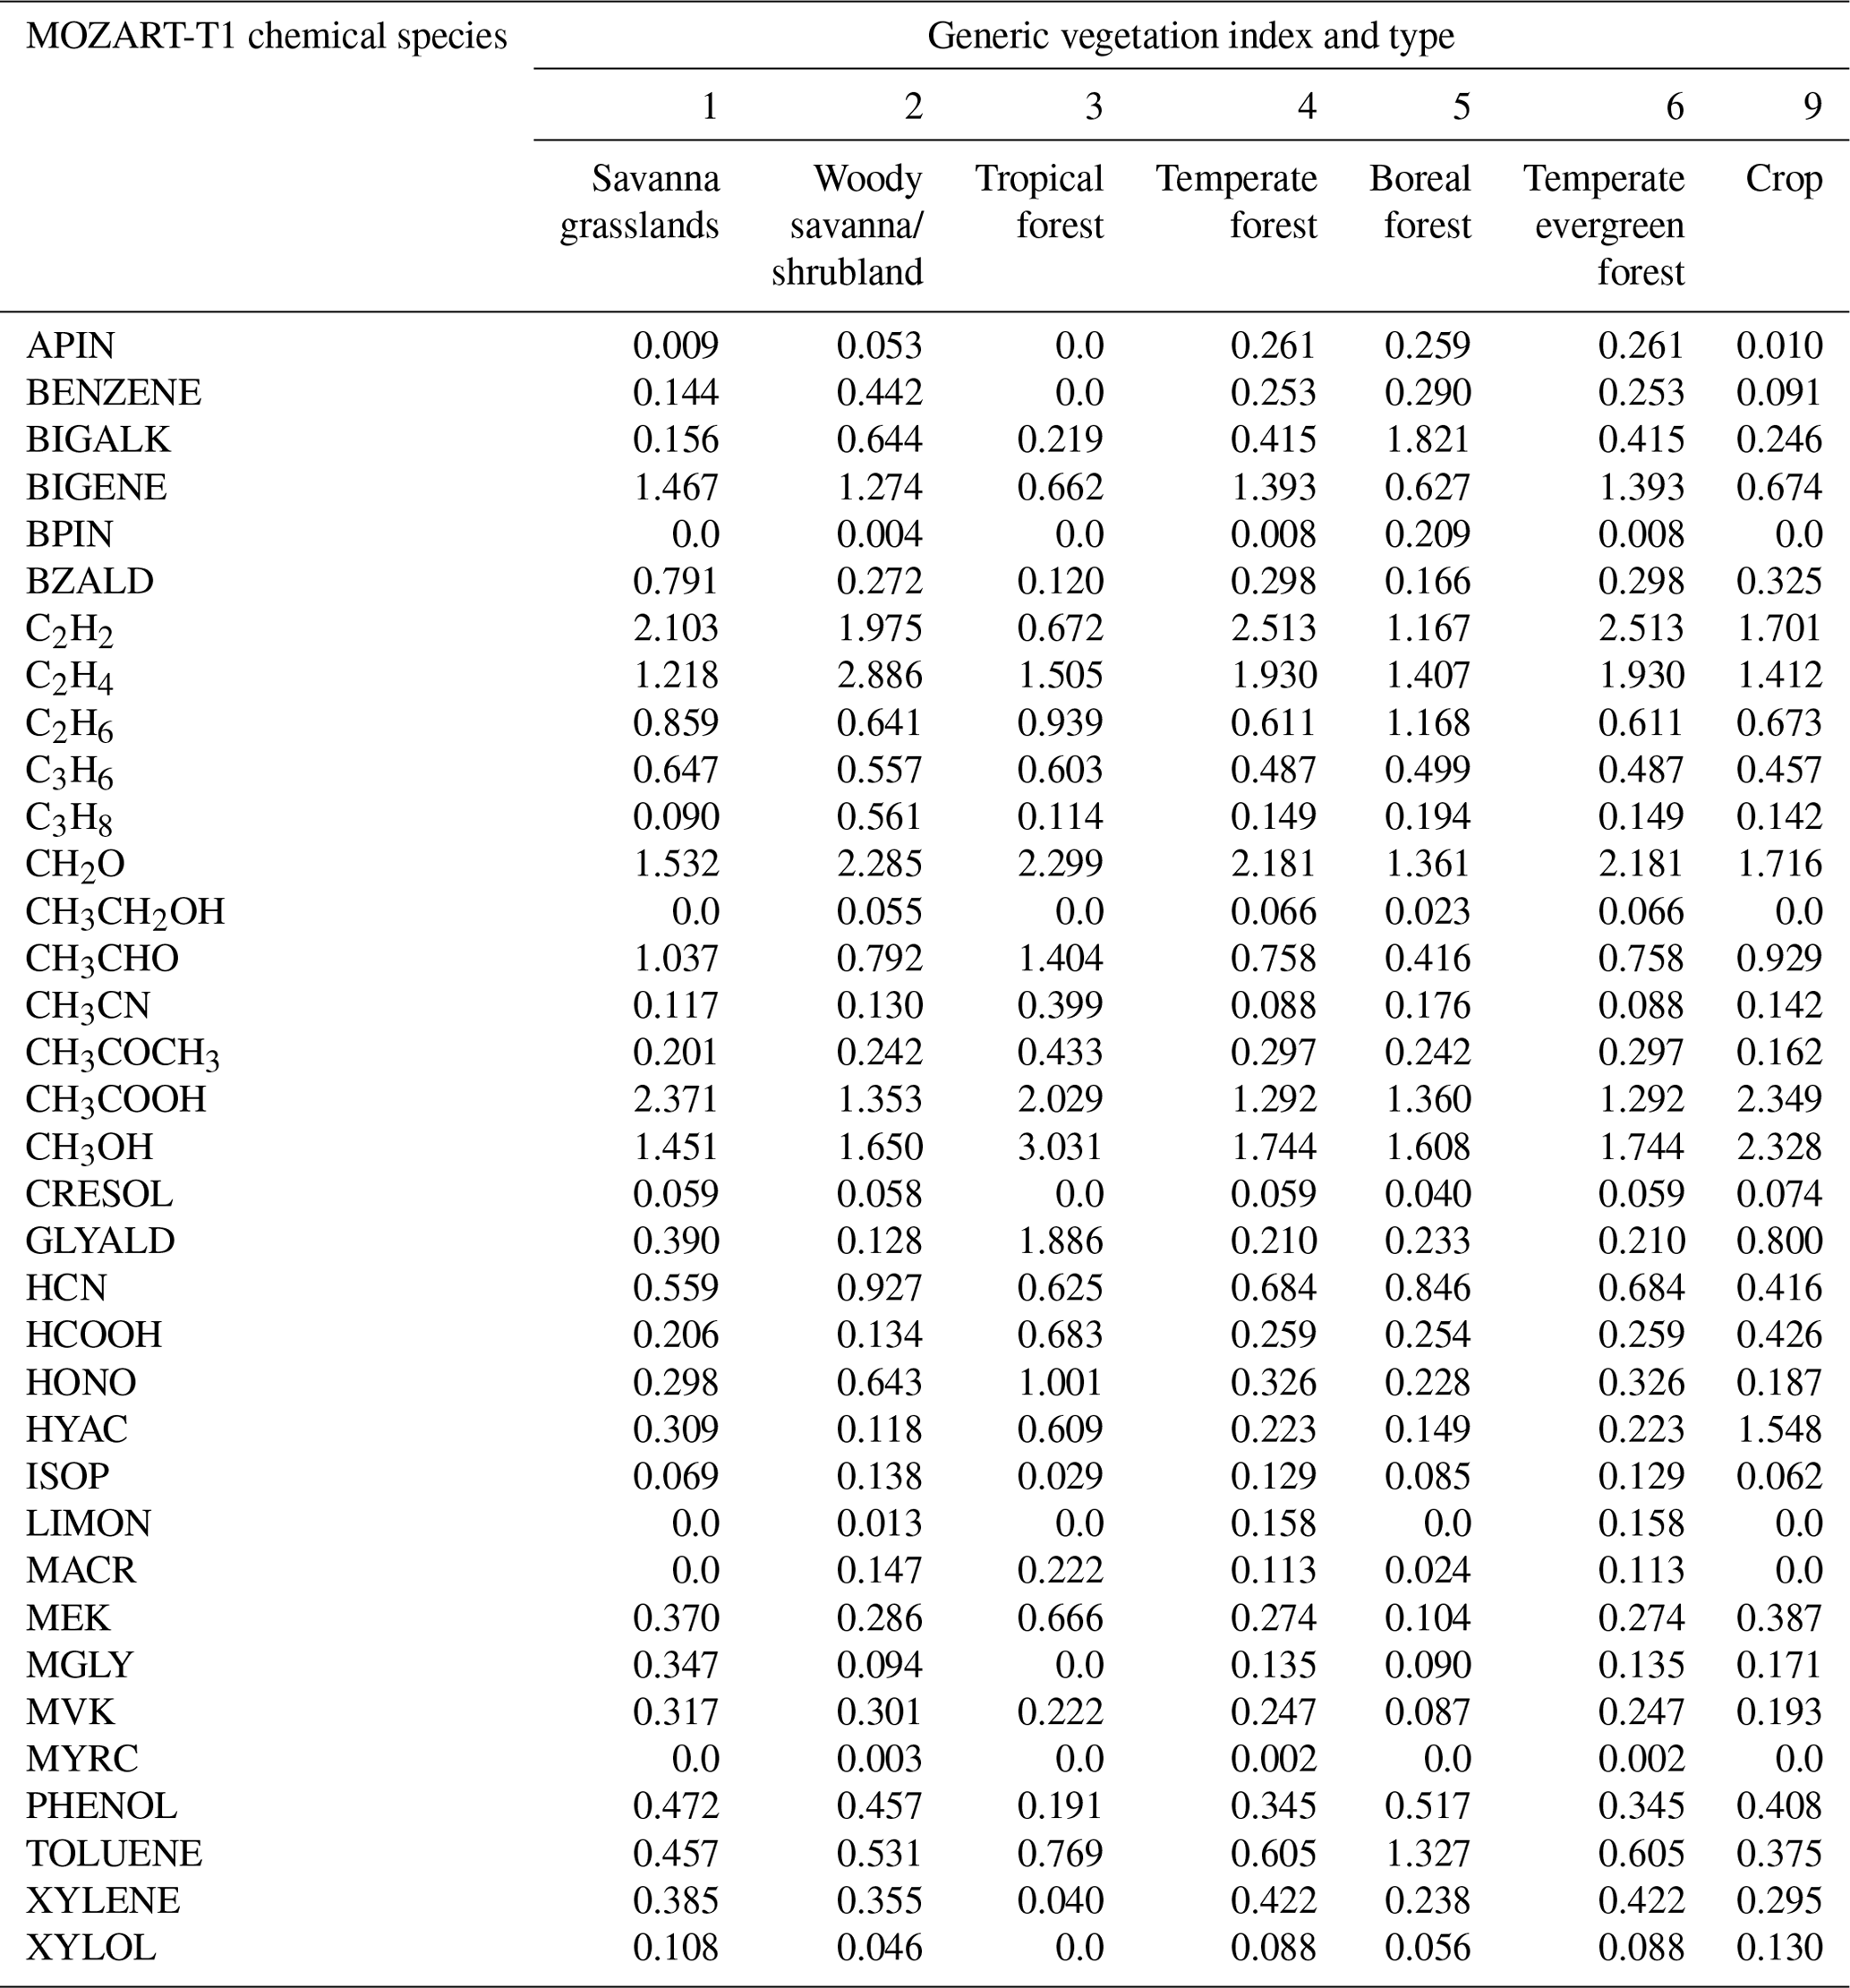
Wiedinmyer et al. (2011) provided mappings from the total mass NMOG emissions values calculated by the FINN model to the surrogate species of three chemical mechanisms commonly used in chemical transport models, namely MOZART (Model for Ozone and Related chemical Tracers), SAPRC99 (Statewide Air Pollution Research Center Mechanism), and GEOS-Chem (Goddard Earth Observing System with Chemistry). The mapping of NMOG emissions to the MOZART-T1 chemical mechanism was created for FINNv2.5, based on recent published emissions data and updates in the chemical mechanisms (Table 5). To convert the total NMOC to the individual mechanism species, the total NMOG mass estimated by FINN should be multiplied by the mapping value (mole species in kg NMOG−1; e.g., Table 5) to assign the molar emissions of the surrogate species. The mappings to the SAPRC99 and GEOS-Chem have not been updated and are the same as those described by Wiedinmyer et al. (2011).
Table 5Factors to map the total NMOG mass emissions to the MOZART-T1 chemical species (mole species in kg NMOG−1). MOZART-T1 species are defined in Emmons et al. (2020; their Table S1).
3.1 Emissions estimates
The FINNv2.5 model was run in two ways to produce emissions for evaluation and assessment, namely (1) for comparison with the previous version of FINN (FINNv1.5) using MODIS-only fire detections and calculated starting in 2002 (FINNv2.5(MODIS)) and (2) by using both MODIS and VIIRS fire detections and calculated starting in 2012 (FINNv2.5(MODIS + VIIRS). The FINNv2.5 emissions files are freely available for use by the community (Wiedinmyer and Emmons, 2022). Results through 2019 are presented in this work.
Estimates from several versions of FINN are compared to other emissions inventories, such as the Global Fire Emissions Database (GFED; van der Werf et al., 2017), Fire Energetics and Emissions Research (FEER; Ichoku and Ellison, 2014), the Global Fire Assimilation System (GFAS; Kaiser et al., 2012), and the Quick Fire Emissions Dataset (QFED) version 2.5 (Darmenov and da Silva, 2015; Fig. 4). The comparisons are done by the global region that follows (Giglio et al., 2010; Fig. 4).
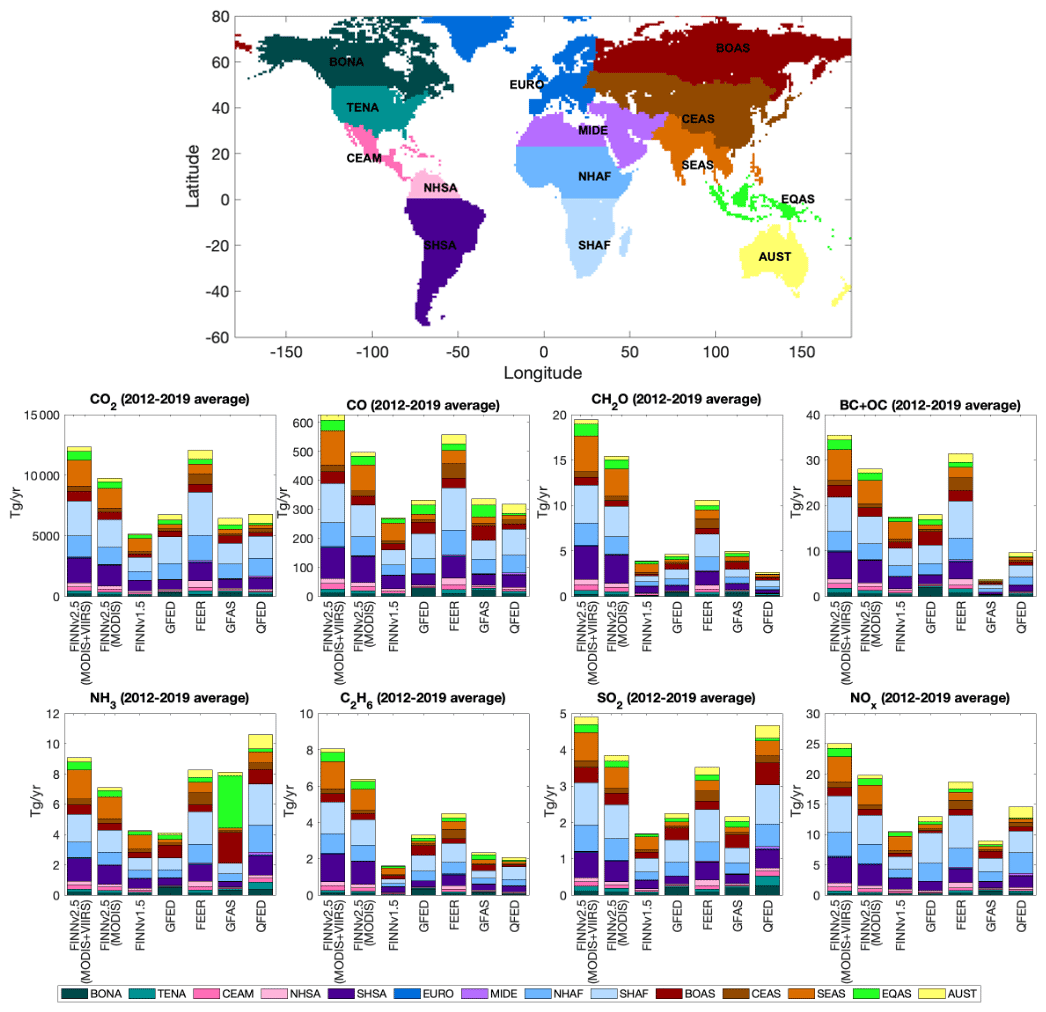
Figure 4Annually averaged (2012–2019) emissions of CO2, CO, formaldehyde (CH2O), particulate black carbon (BC) plus organic carbon (OC), ammonia (NH3), ethane (C2H6), sulfur dioxide (SO2), and nitrogen oxide (NOx) from the Fire Inventory from NCAR version 2.5 (FINNv2.5(MODIS + VIIRS), FINNv2.5MODIS-only version (FINNv2.5 (MODIS)), FINNv1.5, Global Fire Emissions Database (GFED), Fire Energetics and Emissions Research (FEER), Global Fire Assimilation System (GFAS), and Quick Fire Emissions Dataset (QFED). Bars show global totals broken up into regional totals by color (Giglio et al., 2010). The regions are shown in the global map here, namely boreal North America (BONA), temperate North America (TENA), central America (CEAM), Northern Hemisphere South America (NHSA), Southern Hemisphere South America (SHSA), Europe (EURO), the Middle East (MIDE), Northern Hemisphere Africa (NHAF), Southern Hemisphere Africa (SHAF), boreal Asia (BOAS), central Asia (CEAS), Southeast Asia (SEAS), equatorial Asia (EQAS), and Australia and New Zealand (AUST). For comparisons with earlier versions of FINN, see Fig. S2.
Figure 4 compares the annual averaged (2012–2019) emissions of key pollutants from several versions of FINN and the other inventories by region. For all emitted species, FINNv2.5(MODIS + VIIRS) global emissions are higher than, and approximately double, those predicted by FINNv1.5. This is the case, even when only MODIS fire detections are considered. The increase in emissions from previous versions is primarily due to the new processing of the area burned. In previous versions, the fire area was determined from a satellite detection pixel only; the updated version here also includes the composite of many detections into larger areas of fire activity (Sect. 2.1). The inclusion of VIIRS into the FINNv2.5(MODIS + VIIRS) inventory globally adds approximately 25 % above the FINNv2.5(MODIS) processing for all emitted species. Further, emissions of NMOGs and the individual species that make up NMOGs (e.g., CH2O and C2H6 in Fig. 4) are increased significantly due to the use of updated emissions factors from recent field campaigns. Previous studies have shown low biases in FINN regional and species-specific estimates; for example, CO in the western USA (Pfister et al., 2011) and Australia (Desservettaz et al., 2022) and particulate carbon in North America (Carter et al., 2020). The updated version is expected to correct some of these prior biases.
FINNv2.5(MODIS + VIIRS) emissions estimates are overall at the higher end of the range of annual global total emissions provided by our sample of other commonly used emissions inventories, likely due to a combination of the aggregated burned areas and the fact that FINNv2.5(MODIS + VIIRS) includes fire information from VIIRS, which captures more small fires. However, depending on the pollutant emitted, a comparison across different emissions inventories shows varied results. For example, both CO2 and CO global annual emissions from FINNv2.5 (MODIS and MODIS + VIIRS) are higher than QFED, but black carbon (BC) and ammonia (NH3) are lower in FINNv2.5 than QFED. The primary drivers of these differences are the assumed fuel type burned and associated emissions factors. This difference in emissions amounts between inventories is more variable when looking regionally and year to year (e.g., Figs. 5 and S4).
In general, the year-to-year variabilities in the annual fire emissions are consistent between different inventories, and mainly the magnitudes of the emissions differ (Figs. 5, S5, and S6). FINNv2.5(MODIS + VIIRS) is often among the inventories that produces the highest CO emissions in all 14 global regions. Some notable exceptions are boreal North America and boreal Asia, where GFAS and sometimes GFED estimate higher emissions. This is likely due to the representation of smoldering peat fires in the high latitudes that are represented as a specific vegetation type in the GFED and GFAS inventories but not in FINNv2.5. (Note that Kiely et al., 2019, developed a parameterization used in FINNv2 to represent regional peat emissions in Indonesia, but this was not included in FINNv2.5.) Similarly, in equatorial Asia, GFED and GFAS estimate the highest CO emissions for the years when much of the tropical peatland burned. The magnitude of FINNv2.5(MODIS + VIIRS) CO emissions in Australia and New Zealand has increased relative to FINNv1.5, which compares better to downwind surface measurements of instantaneous mixing ratios (Desservettaz et al., 2022). However, regional FINNv2.5(MODIS + VIIRS and MODIS) emissions remain lower than three other emissions inventories (GFAS, QFED, and FEER) in Australia and New Zealand. A similar result is seen over the Middle East, which suggests a potential role of extremely dry landscapes in causing inter-inventory differences. For most other regions, FEER is the only inventory that produces emissions that are as high in magnitude, or sometimes higher, as FINNv2.5(MODIS + VIIRS).
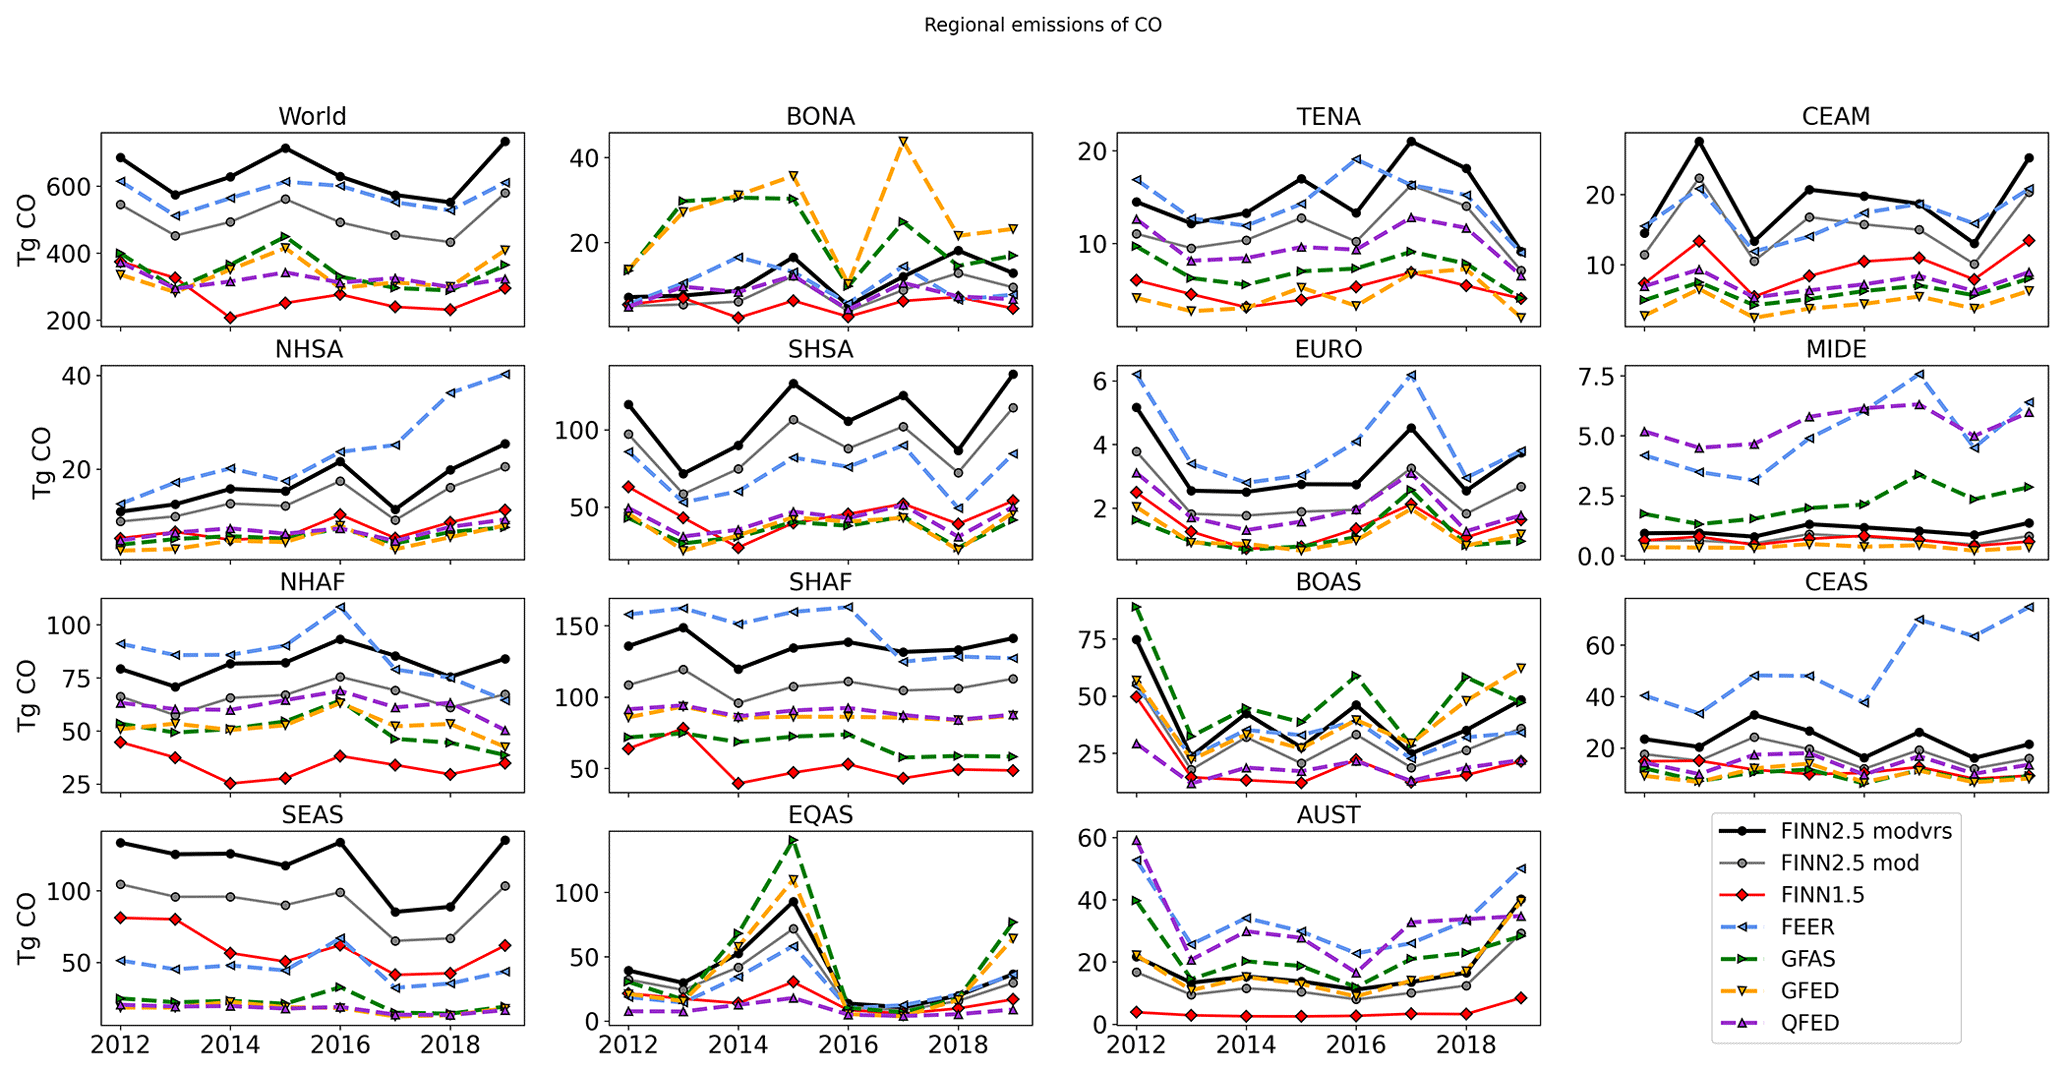
Figure 5Annual total emissions of CO by region between 2012 and 2019 from the Fire Inventory from NCAR version 2.5 with MODIS and VIIRS (FINNv2.5 modvrs; black symbols), FINNv2.5 MODIS-only version (FINNv2.5 mod; gray symbols), FINNv1.5, Global Fire Emissions Database (GFED), Fire Energetics and Emissions Research (FEER), Global Fire Assimilation System (GFAS), and Quick Fire Emissions Dataset (QFED). Regions are defined in Giglio et al. (2010; refer to Fig. 4). For comparisons with earlier versions of FINN, see Fig. S3. For comparisons of CH2O and PM2.5 emissions, see Figs. S4 and S5, respectively.
The seasonal change in the regional fire emissions for CO in FINNv2.5(MODIS + VIIRS) is shown in Fig. 6, with other inventories in Fig. S4. Globally, fire emissions peak in August–September, with the largest emissions in Southern Hemisphere Africa and Southern Hemisphere South America. As mentioned above, GFED and GFAS show an increase in boreal North America in July and August that is not as prevalent in FINNv2.5(MODIS + VIIRS).
FINNv2.5(MODIS + VIIRS) also has an emissions peak in March, which is driven primarily by emissions in Southeast Asia. March–April is a peak fire season in the Northern Hemisphere tropics, and in mainland Southeast Asia, the season is driven primarily by small, agricultural fires. FINNv2.5(MODIS + VIIRS) uses VIIRS fire detections, which detect these small fires to a greater extent than MODIS. Most inventories show this second peak in emissions during March and April; however, it is not seen in GFED, nor is it as pronounced in the other inventories (Fig. S6). Consequently, determining the cause of different fire emissions in Southeast Asia is a target for future research. Although the magnitude of the regional emissions in FINNv2.5(MODIS + VIIRS) is 2–3 times higher than FINNv1.5, the seasonality is similar.
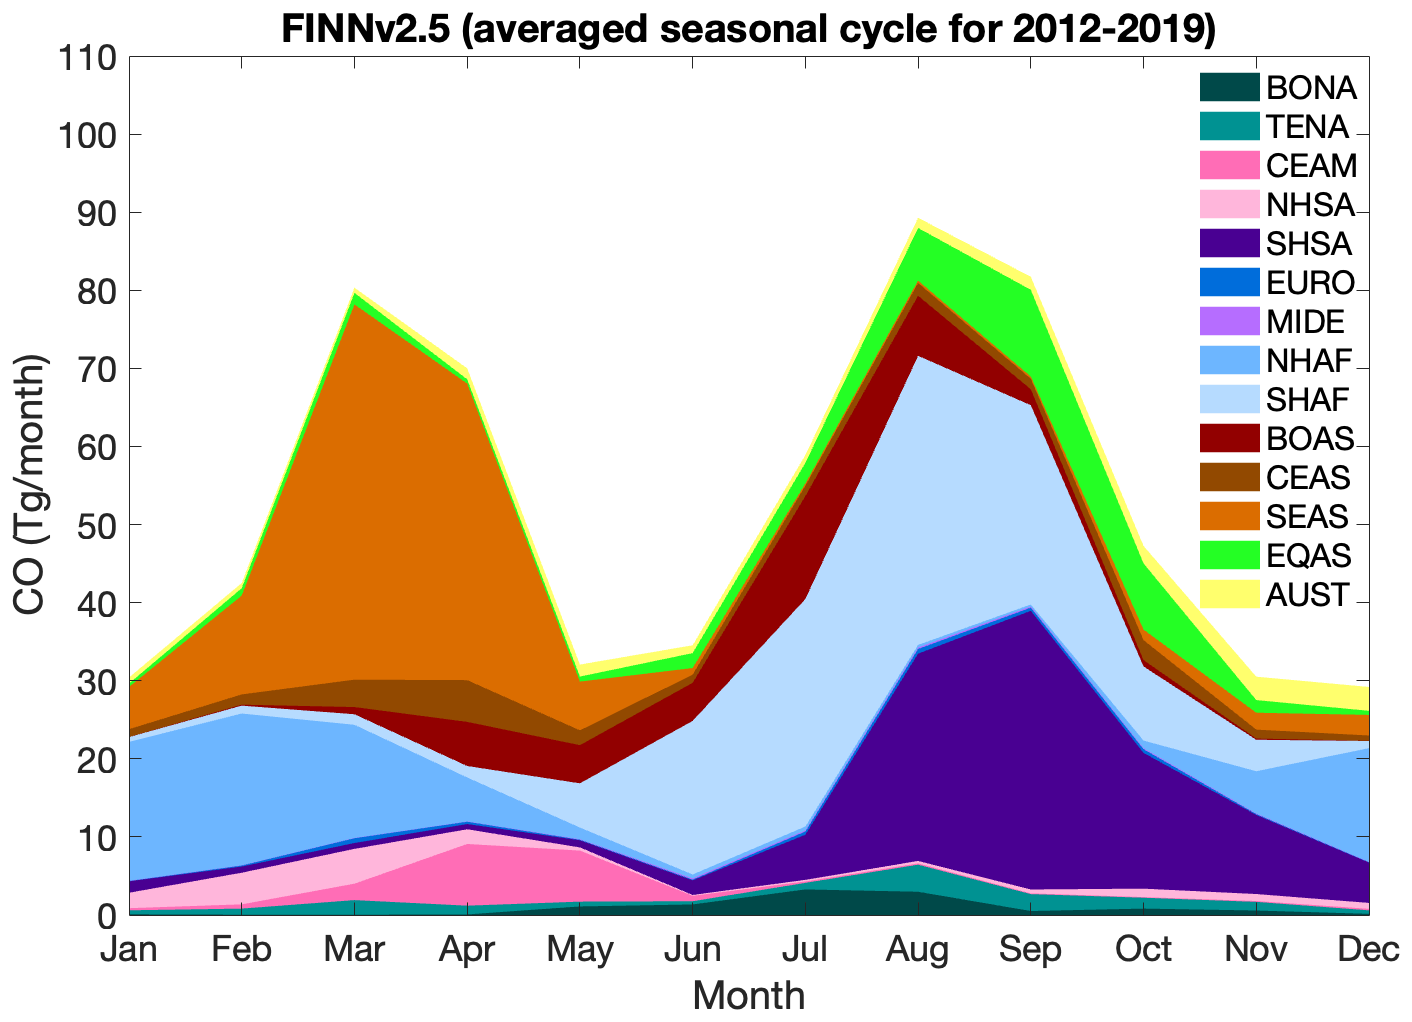
Figure 6Seasonal cycle of fire emissions of CO from FINNv2.5(MODIS + VIIRS; averaged for 2012–2019) by global region. Region definitions follow Giglio et al. (2010) and are described in Fig. 4.
3.2 Model simulation using FINNv2.5 compared to satellite products
As shown above, the emissions estimates from the different fire emissions models can vary substantially in time and space. It is difficult to know which emissions estimates most closely represent reality. One way to assess the emissions is to use them as input to an atmospheric chemistry model and calculate pollutant concentrations that can then be compared to in situ measurements and satellite observations. To further evaluate FINNv2.5(MODIS + VIIRS) and understand its uncertainties and limitations, we performed a simulation with the Community Atmosphere Model with Chemistry (CAM-chem), a component of the Community Earth System Model (CESM2.2.0; Emmons et al., 2020). For this simulation, the temperature and winds of CAM-chem are nudged to the Modern-Era Retrospective analysis for Research and Applications, version 2 (MERRA-2) reanalysis fields. Anthropogenic emissions are from the Copernicus Atmosphere Monitoring Service (CAMS) v5.1 inventory (Soulie et al., 2023), and biogenic emissions are calculated online with the Model of Emissions of Gases and Aerosols from Nature (MEGAN) version 2.1 (described in Emmons et al., 2020). Results for the year 2018, after several years of spin-up, are shown here.
The model results with FINNv2.5 emissions are compared to the CO column density from the Measurement of Pollution in the Troposphere (MOPITT) instrument retrievals (version 8, Level 3, gridded monthly joint product; MOP03J.008; Deeter et al., 2019), and aerosol optical depth (AOD) from MODIS (Level 3 gridded monthly global product; MOD08_M3 and MYD08_M3; MODIS Atmosphere Science Team, 2017; Figs. 7 and 8). For the comparisons to the MOPITT retrievals, the model CO profiles are transformed with the MOPITT averaging kernels and an a priori profile. The joint retrieval product combines the thermal-infrared (TIR) and near-infrared (NIR) radiances to provide greater sensitivity to the boundary layer than the TIR retrievals alone.
Overall, CAM-chem driven with FINNv2.5(MODIS + VIIRS) overestimates satellite-observed AOD and CO over the Amazon basin and central Africa during the 2018 fire season (Figs. 7–9). This result suggests that FINNv2.5(MODIS + VIIRS) overestimates fire emissions over the Amazon basin and central Africa in the 2018 fire season. This overestimation could be due to a number of reasons, including inaccurate ecosystem identification (e.g., tropical forest rather than shrublands or less wooded landscapes) and/or fuel loading assignments. The model also overestimates AOD, but not CO, over Australia and northern Africa. These discrepancies are likely due to overestimated dust emissions in the model simulation rather than overestimated fire emissions from FINNv2.5(MODIS + VIIRS).
There are important fire regions in which the model predictions and observations agree. For example, the CAM-chem results using FINNv2.5(MODIS + VIIRS) simulate column-measured CO in August 2018 (Fig. 9) for the Pacific Northwest well. This is consistent with a previous study, which evaluated CAM-chem with regional refinement over the Pacific Northwest with aircraft observations during the Western wildfire Experiment for Cloud chemistry, Aerosol absorption and Nitrogen (WE-CAN; Tang et al., 2022) and found that simulated CO concentrations agreed reasonably with aircraft measurements.
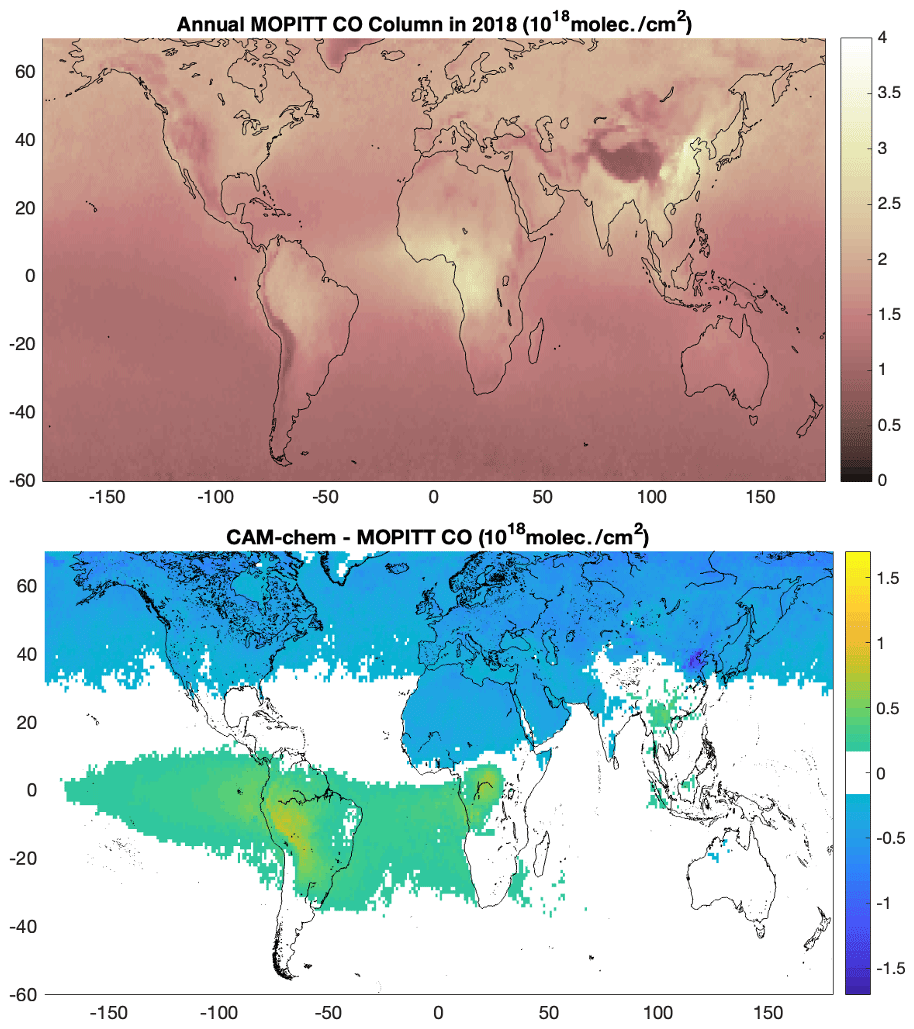
Figure 7Global distribution of CO column density from the Measurement of Pollution in the Troposphere (MOPITT) averaged for 2018, and the corresponding Community Atmosphere Model with Chemistry (CAM-chem) model simulation bias (model minus observations) for CO column density. The CAM-chem simulation used FINNv2.5(MODIS + VIIRS) for fire emissions.
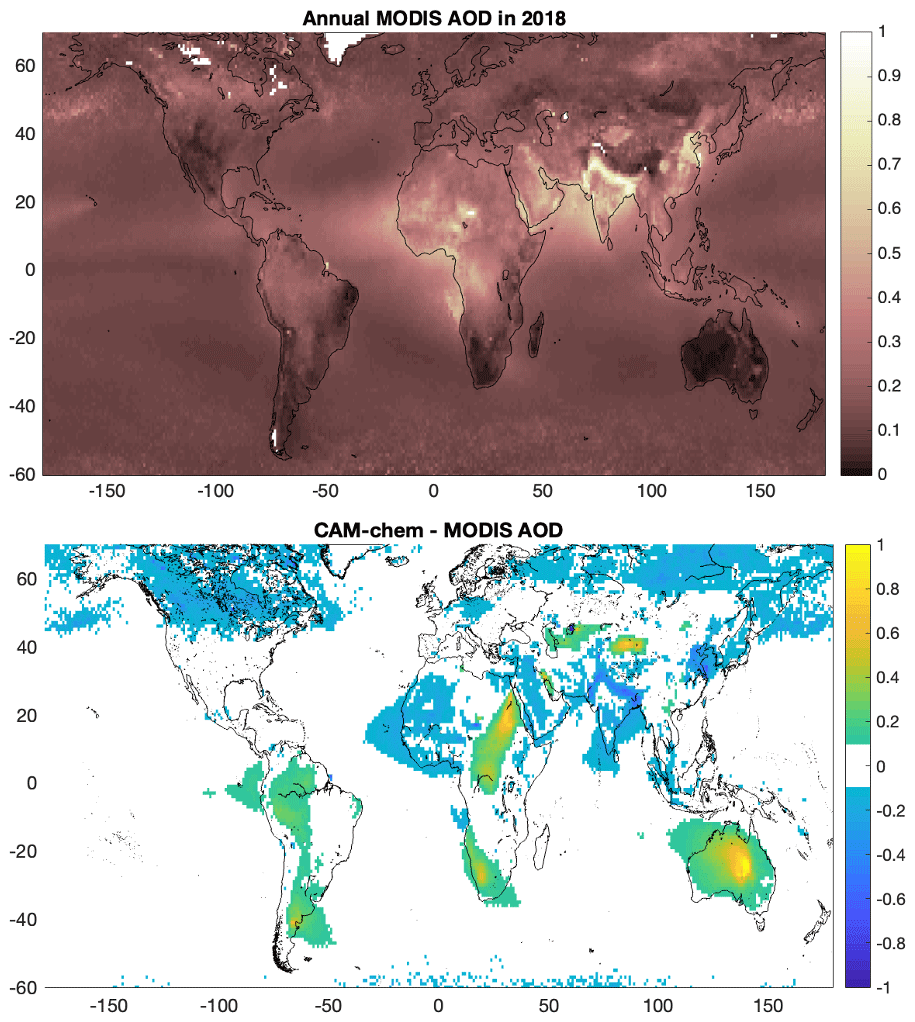
Figure 8Global distribution of aerosol optical depth (AOD) from the Moderate Resolution Imaging Spectroradiometer (MODIS) averaged for 2018 and the corresponding Community Atmosphere Model with Chemistry (CAM-chem) model simulation bias (model minus observation) for AOD. The CAM-chem simulation used FINNv2.5(MODIS + VIIRS) for fire emissions.
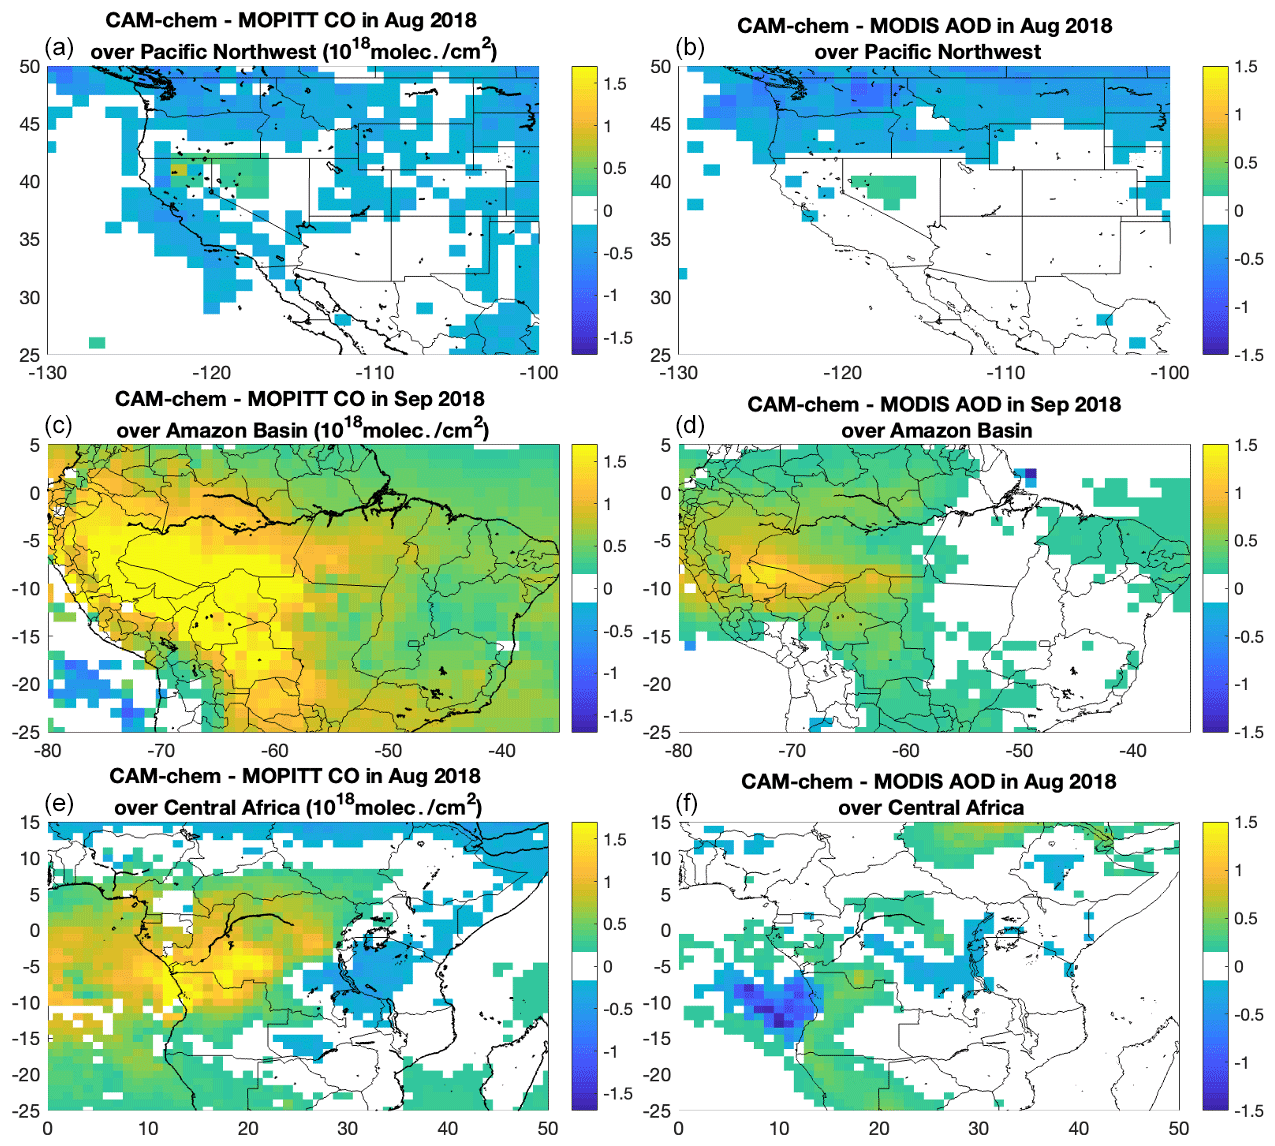
Figure 9Community Atmosphere Model with Chemistry (CAM-chem) model simulation bias from the MOPITT CO column density (a, c, e) and MODIS AOD (b, d, f) for three regions. (a, b) The Pacific Northwest, USA, in August 2018. (c, d) Amazon basin in September 2018. (e, f) Central Africa in August 2018. The months are selected to represent the fire season in each region. Absolute values modeled with CAM-chem are shown in Fig. S7.
3.3 Uncertainties
Despite updates to the input data, parameters, and processing, FINNv2.5 emissions estimates remain uncertain. Uncertainties are caused by the natural variability associated with the various inputs to the model and the model assumptions and processes used to create the estimates. Uncertainties may arise due to missed fire detections caused by cloud or smoke cover, timing, and incomplete global coverage from the polar orbiting satellite paths. Furthermore, the assumed vegetation type in active fires is highly variable, and the use of different vegetation maps can introduce large changes in the predicted emissions. The assumed fuel loading, fraction burned, and resulting fuel consumption can be highly variable in space and time, whereas the model assumes best-guess average values for generic ecosystems by global region. The emissions factors used also add some uncertainty to the estimates, which is particularly highlighted in the emissions estimates of particles and reactive gases. Other issues arise when VIIRS and MODIS are used in combination to drive the emissions estimates, compared to the MODIS-only version. We recognize that the addition of a second dataset from VIIRS increases the emissions compared to those estimated using MODIS only.
Wiedinmyer et al. (2011) estimated an uncertainty that is a factor of 2 in the FINNv1 estimates. Other efforts have assigned uncertainty to fire emissions estimates (e.g., Kennedy et al., 2020; Soares et al., 2015; Urbanski et al., 2011); however, limitations in our ability to directly measure fire emissions (fluxes) prevent a comprehensive, global evaluation of existing inventories. Discrepancies between model predictions and evaluations with model output, in situ measurements, and satellite observations can help identify the processes in the models that drive the uncertainties and the regions across the globe that are the most important and uncertain. Results from the evaluation presented here suggest that high uncertainties in emissions occur in South America and southern Africa and in southeast and equatorial Asia. Emissions across boreal North America should also be assessed; wide variations in organic carbon (OC) and BC emissions in this region lead to significant uncertainty in the ability to estimate air quality and climate impacts from biomass burning (Carter et al., 2020). Furthermore, while CO and AOD are often used to assess aerosol and CO emissions estimates, the emissions of other important pollutants are more highly variable across inventories and should be further constrained.
FINN version 2.5 was created by updating multiple processes and parameters of the original FINN model framework. This version includes an improved area burned calculation, uses year-specific land cover and vegetation datasets, updates the fuel loading and emissions factors, and enables the use of multiple fire detection satellite inputs (for example, MODIS and VIIRS). The Python code to process the burned area and overlaid land cover, in addition to the IDL (Interactive Data Language) code to calculate the emissions and speciate the NMOGs, is freely available to the community for use as is or can be further developed (https://github.com/NCAR/finn-preprocessor, last access: 7 July 2023; the current code is archived at https://doi.org/10.5065/XNPA-AF09; Wiedynmyer and Emmons, 2022). The resulting emissions files for 2002–2021 are also freely available in several volatile organic compound (VOC) speciation types and gridded formats (Wiedinmyer and Emmons, 2022).
Specific, one-time modifications to FINN have included emissions from peat in Southeast Asia (Kiely et al., 2019) and the consideration of burn severity in the emissions calculations from California (Xu et al., 2022). These may be incorporated into future versions of FINN. Future efforts will also improve emissions estimates for fires in the wildland–urban interface.
The FINNv2.5(MODIS + VIIRS) emissions estimates remain uncertain, and more evaluations and model comparisons are recommended, especially in Southern Hemisphere South America and Africa during August–October, in addition to southeastern and equatorial Asia in March–April. FINNv2.5(MODIS + VIIRS) does, however, appear to simulate emissions in the western USA better, compared to earlier versions (e.g., Pfister et al., 2011). The vegetation type and associated fuel loading and consumption are large sources of uncertainty; the use of a different global vegetation map, other than the MODIS LCT, can lead to large variations in the predicted emissions. Future efforts to improve fire emissions estimates should focus on these components of the model.
The code to process the burned area and overlaid land cover, and to calculate the emissions and speciate the NMOGs, is available at https://github.com/NCAR/finn-preprocessor (last access: 7 July 2023) for updated versions, and the current version (v2.5.2) is archived at https://doi.org/10.5281/zenodo.7860860 (Wiedynmyer and Emmons, 2023).
Emissions calculated from the FINNv2.5 algorithms, for MODIS and MODIS + VIIRS fire detections with MOZART VOC speciation types, are archived at https://doi.org/10.5065/XNPA-AF09 (Wiedinmyer and Emmons, 2022) and https://doi.org/10.5281/zenodo.7868652 (Wiedinmyer and Emmons, 2023). The FINNv2.5 emissions, including emissions files for SAPRC and GEOS-Chem VOC speciation, in addition to tools for subsetting, are available from the NCAR Research Data Archive (https://rda.ucar.edu/datasets/ds312.9/, last access: 7 July 2023; https://doi.org/10.5065/XNPA-AF09; Wiedinmyer and Emmons, 2022). Files are provided with emissions for each fire (ungridded; zipped text files) and are also gridded to 0.1×0.1∘ (netCDF files). Both sets of files are available for emissions from MODIS-only and MODIS + VIIRS fire detections at https://doi.org/10.5065/XNPA-AF09 (Wiedinmyer and Emmons, 2022).
The supplement related to this article is available online at: https://doi.org/10.5194/gmd-16-3873-2023-supplement.
CW contributed to all aspects of the project, from the model design, management, and resource acquisition to the model development and evaluation. CW prepared the paper, with contributions from all co-authors. LKE, WT, and RRB assisted with the implementation and evaluation and led the deployment of the emissions files online. ECMB acquired resources for the development and advised on the model development and evaluation. YK led the model development. MBJ and KS provided technical support for the model development and model simulations. KCB, AGC, and RY provided key input to the model development and evaluation.
The contact author has declared that none of the authors has any competing interests.
The findings, opinions and conclusions are the work of the authors and do not necessarily represent findings, opinions, or conclusions of the State of Texas Air Quality Research Program (AQRP) or the Texas Commission on Environmental Quality (TCEQ).
Publisher's note: Copernicus Publications remains neutral with regard to jurisdictional claims in published maps and institutional affiliations.
The authors thank the many users of the FINN emissions estimates for their support in the evaluation and quality assurance and quality control efforts.
The development of the FINNv2.5 model framework, the estimates, and the evaluation have been supported through several different funding sources, including the NOAA Climate Program Office (CPO; grant no. NA17OAR4310103), U.S. National Science Foundation (NSF; grant no. 1822406), and NASA (grant no. 80NSSC18K0681). Funding has also been provided by the Texas Air Quality Research Program (AQRP; project nos. 14-011 and 18-022) at The University of Texas at Austin through the Texas Emission Reduction Program and the Texas Commission on Environmental Quality (TCEQ). Support for most Cooperative Institute for Research in Environmental Sciences (CIRES) employees is from NOAA (grant nos. NA17OAR4320101 and NA22OAR4320151). Support for Kelley C. Barsanti was also from NOAA CPO (grant no. NA17OAR4310007). Robert Yokelson has been supported by the NSF (grant nos. AGS-1748266 and AGS-1349976), NOAA CPO (grant no. NA16OAR4310100), and NASA (grant no. NNX14AP45G). This material is based upon work supported by the National Center for Atmospheric Research, which is a major facility sponsored by the NSF (grant no. 1852977).
This paper was edited by Samuel Remy and reviewed by Johannes Kaiser and two anonymous referees.
Akagi, S. K., Yokelson, R. J., Wiedinmyer, C., Alvarado, M. J., Reid, J. S., Karl, T., Crounse, J. D., and Wennberg, P. O.: Emission factors for open and domestic biomass burning for use in atmospheric models, Atmos. Chem. Phys., 11, 4039–4072, https://doi.org/10.5194/acp-11-4039-2011, 2011.
Andreae, M. O. and Merlet, P.: Emission of trace gases and aerosols from biomass burning, Global Biogeochem. Cycles, 15, 955–966, https://doi.org/10.1029/2000GB001382, 2001.
Andreae, M. O. and Rosenfeld, D.: Aerosol–cloud–precipitation interactions. Part 1. The nature and sources of cloud-active aerosols, Earth-Sci. Rev., 89, 13–41, https://doi.org/10.1016/j.earscirev.2008.03.001, 2008.
Armenteras, D., Dávalos, L. M., Barreto, J. S., Miranda, A., Hernández-Moreno, A., Zamorano-Elgueta, C., González-Delgado, T. M., Meza-Elizalde, M. C., and Retana, J.: Fire-induced loss of the world's most biodiverse forests in Latin America, Sci. Adv., 7, eabd3357, https://doi.org/10.1126/sciadv.abd3357, 2021.
Bourgeois, I., Peischl, J., Neuman, J. A., Brown, S. S., Thompson, C. R., Aikin, K. C., Allen, H. M., Angot, H., Apel, E. C., Baublitz, C. B., Brewer, J. F., Campuzano-Jost, P., Commane, R., Crounse, J. D., Daube, B. C., DiGangi, J. P., Diskin, G. S., Emmons, L. K., Fiore, A. M., Gkatzelis, G. I., Hills, A., Hornbrook, R. S., Huey, L. G., Jimenez, J. L., Kim, M., Lacey, F., McKain, K., Murray, L. T., Nault, B. A., Parrish, D. D., Ray, E., Sweeney, C., Tanner, D., Wofsy, S. C., and Ryerson, T. B.: Large contribution of biomass burning emissions to ozone throughout the global remote troposphere, P. Natl. Acad. Sci. USA, 118, e2109628118, https://doi.org/10.1073/pnas.2109628118, 2021.
Bray, C. D., Battye, W., Aneja, V. P., Tong, D. Q., Lee, P., and Tang, Y.: Ammonia emissions from biomass burning in the continental United States, Atmos. Environ., 187, 50–61, https://doi.org/10.1016/j.atmosenv.2018.05.052, 2018.
Burke, M., Driscoll, A., Heft-Neal, S., Xue, J., Burney, J., and Wara, M.: The changing risk and burden of wildfire in the United States, P. Natl. Acad. Sci. USA, 118, e2011048118, https://doi.org/10.1073/pnas.2011048118, 2021.
Carroll, M., Townshend, J. R. G., Hansen, M. C., Dimiceli, C., Sohlberg, R. A., and Wurster, K.: Vegetative Cover Conversion and Vegetation Continuous Fields, in: Land Remote Sensing and Global Environmental Change: NASA's Earth Observing System and the Science of Aster and MODIS, vol. 11, Springer-Verlag, 725–746, 2011.
Carter, T. S., Heald, C. L., Jimenez, J. L., Campuzano-Jost, P., Kondo, Y., Moteki, N., Schwarz, J. P., Wiedinmyer, C., Darmenov, A. S., da Silva, A. M., and Kaiser, J. W.: How emissions uncertainty influences the distribution and radiative impacts of smoke from fires in North America, Atmos. Chem. Phys., 20, 2073–2097, https://doi.org/10.5194/acp-20-2073-2020, 2020.
Crippa, P., Castruccio, S., Archer-Nicholls, S., Lebron, G. B., Kuwata, M., Thota, A., Sumin, S., Butt, E., Wiedinmyer, C., and Spracklen, D. V.: Population exposure to hazardous air quality due to the 2015 fires in Equatorial Asia, Sci. Rep., 6, 37074, https://doi.org/10.1038/srep37074, 2016.
Csiszar, I., Schroeder, W., Giglio, L., Ellicott, E., Vadrevu, K. P., Justice, C. O., and Wind, B.: Active fires from the Suomi NPP Visible Infrared Imaging Radiometer Suite: Product status and first evaluation results: ACTIVE FIRES FROM SUOMI NPP VIIRS, J. Geophys. Res.-Atmos., 119, 803–816, https://doi.org/10.1002/2013JD020453, 2014.
Darmenov, A. and da Silva, A.: The quick fire emissions dataset (QFED) – Documentation of versions 2.1, 2.2, and 2.4, NASA//TM-2015-104606, https://gmao.gsfc.nasa.gov/pubs/docs/Darmenov796.pdf (last access: 10 July 2023), 2015.
Davies, D. K., Ilavajhala, S., Wong, M. M., and Justice, C. O.: Fire Information for Resource Management System: Archiving and Distributing MODIS Active Fire Data, IEEE T. Geosci. Remote, 47, 72–79, https://doi.org/10.1109/TGRS.2008.2002076, 2009.
Deeter, M. N., Edwards, D. P., Francis, G. L., Gille, J. C., Mao, D., Martínez-Alonso, S., Worden, H. M., Ziskin, D., and Andreae, M. O.: Radiance-based retrieval bias mitigation for the MOPITT instrument: the version 8 product, Atmos. Meas. Tech., 12, 4561–4580, https://doi.org/10.5194/amt-12-4561-2019, 2019.
Desservettaz, M. J., Fisher, J. A., Luhar, A. K., Woodhouse, M. T., Bukosa, B., Buchholz, R. R., Wiedinmyer, C., Griffith, D. W. T., Krummel, P. B., Jones, N. B., Deutscher, N. M., and Greenslade, J. W.: Australian Fire Emissions of Carbon Monoxide Estimated by Global Biomass Burning Inventories: Variability and Observational Constraints, J. Geophys. Res.-Atmos., 127, e2021JD035925, https://doi.org/10.1029/2021JD035925, 2022.
Dintwe, K., Okin, G. S., and Xue, Y.: Fire-induced albedo change and surface radiative forcing in sub-Saharan Africa savanna ecosystems: Implications for the energy balance, J. Geophys. Res.-Atmos., 122, 6186–6201, https://doi.org/10.1002/2016JD026318, 2017.
Emmons, L. K., Schwantes, R. H., Orlando, J. J., Tyndall, G., Kinnison, D., Lamarque, J., Marsh, D., Mills, M. J., Tilmes, S., Bardeen, C., Buchholz, R. R., Conley, A., Gettelman, A., Garcia, R., Simpson, I., Blake, D. R., Meinardi, S., and Pétron, G.: The Chemistry Mechanism in the Community Earth System Model Version 2 (CESM2), J. Adv. Model. Earth Sy., 12, e2019MS001882, https://doi.org/10.1029/2019MS001882, 2020.
Fang, Z., Deng, W., Zhang, Y., Ding, X., Tang, M., Liu, T., Hu, Q., Zhu, M., Wang, Z., Yang, W., Huang, Z., Song, W., Bi, X., Chen, J., Sun, Y., George, C., and Wang, X.: Open burning of rice, corn and wheat straws: primary emissions, photochemical aging, and secondary organic aerosol formation, Atmos. Chem. Phys., 17, 14821–14839, https://doi.org/10.5194/acp-17-14821-2017, 2017.
Faulstich, S. D., Schissler, A. G., Strickland, M. J., and Holmes, H. A.: Statistical Comparison and Assessment of Four Fire Emissions Inventories for 2013 and a Large Wildfire in the Western United States, Fire, 5, 27, https://doi.org/10.3390/fire5010027, 2022.
Ford, B., Val Martin, M., Zelasky, S. E., Fischer, E. V., Anenberg, S. C., Heald, C. L., and Pierce, J. R.: Future Fire Impacts on Smoke Concentrations, Visibility, and Health in the Contiguous United States, GeoHealth, 2, 229–247, https://doi.org/10.1029/2018GH000144, 2018.
Friedl, M. A., Sulla-Menashe, D., Tan, B., Schneider, A., Ramankutty, N., Sibley, A., and Huang, X.: MODIS Collection 5 global land cover: Algorithm refinements and characterization of new datasets, Remote Sens. Environ., 114, 168–182, https://doi.org/10.1016/j.rse.2009.08.016, 2010.
Giglio, L., Csiszar, I., and Justice, C. O.: Global distribution and seasonality of active fires as observed with the Terra and Aqua Moderate Resolution Imaging Spectroradiometer (MODIS) sensors: GLOBAL FIRE DISTRIBUTION AND SEASONALITY, J. Geophys. Res., 111, https://doi.org/10.1029/2005JG000142, 2006.
Giglio, L., Randerson, J. T., van der Werf, G. R., Kasibhatla, P. S., Collatz, G. J., Morton, D. C., and DeFries, R. S.: Assessing variability and long-term trends in burned area by merging multiple satellite fire products, Biogeosciences, 7, 1171–1186, https://doi.org/10.5194/bg-7-1171-2010, 2010.
Hansen, M. C., DeFries, R. S., Townshend, J. R. G., Carroll, M., Dimiceli, C., and Sohlberg, R. A.: Global Percent Tree Cover at a Spatial Resolution of 500 Meters: First Results of the MODIS Vegetation Continuous Fields Algorithm, Earth Interact., 7, 1–15, https://doi.org/10.1175/1087-3562(2003)007<0001:GPTCAA>2.0.CO;2, 2003.
Hansen, M. C., Townshend, J. R. G., DeFries, R. S., and Carroll, M.: Estimation of tree cover using MODIS data at global, continental and regional/local scales, Int. J. Remote Sens., 26, 4359–4380, https://doi.org/10.1080/01431160500113435, 2005.
Hoelzemann, J. J.: Global Wildland Fire Emission Model (GWEM): Evaluating the use of global area burnt satellite data, J. Geophys. Res., 109, D14S04, https://doi.org/10.1029/2003JD003666, 2004.
Hurteau, M. D., Westerling, A. L., Wiedinmyer, C., and Bryant, B. P.: Projected Effects of Climate and Development on California Wildfire Emissions through 2100, Environ. Sci. Technol., 140203132416003, https://doi.org/10.1021/es4050133, 2014.
Ichoku, C. and Ellison, L.: Global top-down smoke-aerosol emissions estimation using satellite fire radiative power measurements, Atmos. Chem. Phys., 14, 6643–6667, https://doi.org/10.5194/acp-14-6643-2014, 2014.
Ito, A. and Penner, J.: Global estimates of biomass burning emissions based on satellite imagery for the year 2000, J. Geophys. Res., 109, D14S05, https://doi.org/10.1029/2003JD004423, 2004.
Jaffe, D. A., O'Neill, S. M., Larkin, N. K., Holder, A. L., Peterson, D. L., Halofsky, J. E., and Rappold, A. G.: Wildfire and prescribed burning impacts on air quality in the United States, J. Air Waste Manag. A., 70, 583–615, https://doi.org/10.1080/10962247.2020.1749731, 2020.
Jin, Y., Randerson, J. T., Goulden, M. L., and Goetz, S. J.: Post-fire changes in net shortwave radiation along a latitudinal gradient in boreal North America: FIRE-INDUCED LATITUDINAL SURFACE FORCING, Geophys. Res. Lett., 39, https://doi.org/10.1029/2012GL051790, 2012.
Kaiser, J. W., Heil, A., Andreae, M. O., Benedetti, A., Chubarova, N., Jones, L., Morcrette, J.-J., Razinger, M., Schultz, M. G., Suttie, M., and van der Werf, G. R.: Biomass burning emissions estimated with a global fire assimilation system based on observed fire radiative power, Biogeosciences, 9, 527–554, https://doi.org/10.5194/bg-9-527-2012, 2012.
Kelly, L. T., Giljohann, K. M., Duane, A., Aquilué, N., Archibald, S., Batllori, E., Bennett, A. F., Buckland, S. T., Canelles, Q., Clarke, M. F., Fortin, M.-J., Hermoso, V., Herrando, S., Keane, R. E., Lake, F. K., McCarthy, M. A., Morán-Ordóñez, A., Parr, C. L., Pausas, J. G., Penman, T. D., Regos, A., Rumpff, L., Santos, J. L., Smith, A. L., Syphard, A. D., Tingley, M. W., and Brotons, L.: Fire and biodiversity in the Anthropocene, Science, 370, eabb0355, https://doi.org/10.1126/science.abb0355, 2020.
Kennedy, M. C., Prichard, S. J., McKenzie, D., and French, N. H. F.: Quantifying how sources of uncertainty in combustible biomass propagate to prediction of wildland fire emissions, Int. J. Wildland Fire, 29, 793, https://doi.org/10.1071/WF19160, 2020.
Kiely, L., Spracklen, D. V., Wiedinmyer, C., Conibear, L., Reddington, C. L., Archer-Nicholls, S., Lowe, D., Arnold, S. R., Knote, C., Khan, M. F., Latif, M. T., Kuwata, M., Budisulistiorini, S. H., and Syaufina, L.: New estimate of particulate emissions from Indonesian peat fires in 2015, Atmos. Chem. Phys., 19, 11105–11121, https://doi.org/10.5194/acp-19-11105-2019, 2019.
Koplitz, S. N., Nolte, C. G., Pouliot, G. A., Vukovich, J. M., and Beidler, J.: Influence of uncertainties in burned area estimates on modeled wildland fire PM2.5 and ozone pollution in the contiguous U.S., Atmos. Environ., 191, 328–339, https://doi.org/10.1016/j.atmosenv.2018.08.020, 2018.
Kulkarni, S. H., Ghude, S. D., Jena, C., Karumuri, R. K., Sinha, B., Sinha, V., Kumar, R., Soni, V. K., and Khare, M.: How Much Does Large-Scale Crop Residue Burning Affect the Air Quality in Delhi?, Environ. Sci. Technol., 54, 4790–4799, https://doi.org/10.1021/acs.est.0c00329, 2020.
Larkin, N. K., Raffuse, S. M., and Strand, T. M.: Wildland fire emissions, carbon, and climate: U.S. emissions inventories, Forest Ecol. Manage., 317, 61–69, https://doi.org/10.1016/j.foreco.2013.09.012, 2014.
Liu, T., Mickley, L. J., Marlier, M. E., DeFries, R. S., Khan, M. F., Latif, M. T., and Karambelas, A.: Diagnosing spatial biases and uncertainties in global fire emissions inventories: Indonesia as regional case study, Remote Sens. Environ., 237, 111557, https://doi.org/10.1016/j.rse.2019.111557, 2020.
Liu, X., Zhang, Y., Huey, L. G., Yokelson, R. J., Wang, Y., Jimenez, J. L., Campuzano-Jost, P., Beyersdorf, A. J., Blake, D. R., Choi, Y., St.Clair, J. M., Crounse, J. D., Day, D. A., Diskin, G. S., Fried, A., Hall, S. R., Hanisco, T. F., King, L. E., Meinardi, S., Mikoviny, T., Palm, B. B., Peischl, J., Perring, A. E., Pollack, I. B., Ryerson, T. B., Sachse, G., Schwarz, J. P., Simpson, I. J., Tanner, D. J., Thornhill, K. L., Ullmann, K., Weber, R. J., Wennberg, P. O., Wisthaler, A., Wolfe, G. M., and Ziemba, L. D.: Agricultural fires in the southeastern U.S. during SEAC4RS: Emissions of trace gases and particles and evolution of ozone, reactive nitrogen, and organic aerosol, J. Geophys. Res.-Atmos., 121, 7383–7414, https://doi.org/10.1002/2016JD025040, 2016.
Liu, X., Huey, L. G., Yokelson, R. J., Selimovic, V., Simpson, I. J., Müller, M., Jimenez, J. L., Campuzano-Jost, P., Beyersdorf, A. J., Blake, D. R., Butterfield, Z., Choi, Y., Crounse, J. D., Day, D. A., Diskin, G. S., Dubey, M. K., Fortner, E., Hanisco, T. F., Hu, W., King, L. E., Kleinman, L., Meinardi, S., Mikoviny, T., Onasch, T. B., Palm, B. B., Peischl, J., Pollack, I. B., Ryerson, T. B., Sachse, G. W., Sedlacek, A. J., Shilling, J. E., Springston, S., St. Clair, J. M., Tanner, D. J., Teng, A. P., Wennberg, P. O., Wisthaler, A., and Wolfe, G. M.: Airborne measurements of western U.S. wildfire emissions: Comparison with prescribed burning and air quality implications, J. Geophys. Res.-Atmos., 122, 6108–6129, https://doi.org/10.1002/2016JD026315, 2017.
Liu, Z., Ballantyne, A. P., and Cooper, L. A.: Biophysical feedback of global forest fires on surface temperature, Nat. Commun., 10, 214, https://doi.org/10.1038/s41467-018-08237-z, 2019.
Ma, G., Zhao, T., Kong, S., Bao, Y., Chen, C., Gong, S., Guo, J., Yu, C., Wu, M., Chang, J., and You, Y.: Variations in FINN Emissions of Particulate Matters and Associated Carbonaceous Aerosols from Remote Sensing of Open Biomass Burning over Northeast China during 2002–2016, Sustainability, 10, 3353, https://doi.org/10.3390/su10093353, 2018.
McCarty, J. L., Pouliot, G., Raffuse, S. M., Ruminski, M., Szykman, J., and Soja, A. J.: Using Satellite Data to Quantify Cropland Burning and Related Emissions in the Contiguous United States: Lessons Learned, in: Emission Inventories – Meeting the Challenges Posed by Emerging Global, National, Regional and Local Air Quality Issues, International Emission Inventory Conference, 14–17 May 2012, session 2, talk 5, Tampa, Florida, 2012.
McDonald-Buller, E., Wiedinmyer, C., Kimura, Y., and Allen, D.: Effects of land use data on dry deposition in a regional photochemical model for eastern Texas, J. Air Waste Manage. Assoc., 51, 1211–1218, https://doi.org/10.1080/10473289.2001.10464340, 2001.
McMeeking, G. R.: The optical, chemical, and physical properties of aerosols and gases emitted by the laboratory combustion of wildland fuels, Ph.D. Dissertation, Department of Atmospheric Sciences, Colorado State University, Ft. Collins, CO, 109–113, 2008.
MODIS Atmosphere Science Team: MODIS/Terra Aerosol Cloud Water Vapor Ozone Monthly L3 Global 1Deg CMG, https://doi.org/10.5067/MODIS/MOD08_M3.061, 2017.
NASA/University of Maryland: MODIS Hotspot/Active Fire Detections, Data set, MODIS Rapid Response Project, NASA/GSFC (producer), University of Maryland, Fire Information for Resource Management System (distributors), http://maps.geog.umd.edu (last access: 19 June 2022), 2002.
Nawaz, M. O. and Henze, D. K.: Premature Deaths in Brazil Associated With Long-Term Exposure to PM2.5 From Amazon Fires Between 2016 and 2019, GeoHealth, 4, e2020GH000268, https://doi.org/10.1029/2020GH000268, 2020.
Nuryanto, D. E.: Simulation of Forest Fires Smoke Using WRF-Chem Model with FINN Fire Emissions in Sumatera, Proc. Environ. Sci., 24, 65–69, https://doi.org/10.1016/j.proenv.2015.03.010, 2015.
Paton-Walsh, C., Smith, T. E. L., Young, E. L., Griffith, D. W. T., and Guérette, É.-A.: New emission factors for Australian vegetation fires measured using open-path Fourier transform infrared spectroscopy – Part 1: Methods and Australian temperate forest fires, Atmos. Chem. Phys., 14, 11313–11333, https://doi.org/10.5194/acp-14-11313-2014, 2014.
Pausas, J. G. and Keeley, J. E.: Wildfires and global change, Front. Ecol. Environ., 19, 387–395, https://doi.org/10.1002/fee.2359, 2021.
Pereira, G., Siqueira, R., Rosário, N. E., Longo, K. L., Freitas, S. R., Cardozo, F. S., Kaiser, J. W., and Wooster, M. J.: Assessment of fire emission inventories during the South American Biomass Burning Analysis (SAMBBA) experiment, Atmos. Chem. Phys., 16, 6961–6975, https://doi.org/10.5194/acp-16-6961-2016, 2016.
Pfister, G. G., Avise, J., Wiedinmyer, C., Edwards, D. P., Emmons, L. K., Diskin, G. D., Podolske, J., and Wisthaler, A.: CO source contribution analysis for California during ARCTAS-CARB, Atmos. Chem. Phys., 11, 7515–7532, https://doi.org/10.5194/acp-11-7515-2011, 2011.
Pimonsree, S. and Vongruang, P.: Impact of biomass burning and its control on particulate matter over a city in mainland Southeast Asia during a smog episode, Atmos. Environ., 195, 196–209, https://doi.org/10.1016/j.atmosenv.2018.09.053, 2018.
Pouliot, G., Rao, V., McCarty, J. L., and Soja, A.: Development of the crop residue and rangeland burning in the 2014 National Emissions Inventory using information from multiple sources, J. Air Waste Manag. A., 67, 613–622, https://doi.org/10.1080/10962247.2016.1268982, 2017.
Reddington, C. L., Morgan, W. T., Darbyshire, E., Brito, J., Coe, H., Artaxo, P., Scott, C. E., Marsham, J., and Spracklen, D. V.: Biomass burning aerosol over the Amazon: analysis of aircraft, surface and satellite observations using a global aerosol model, Atmos. Chem. Phys., 19, 9125–9152, https://doi.org/10.5194/acp-19-9125-2019, 2019.
Reid, C. E., Brauer, M., Johnston, F. H., Jerrett, M., Balmes, J. R., and Elliott, C. T.: Critical Review of Health Impacts of Wildfire Smoke Exposure, Environ. Health Perspect., 124, 1334–1343, https://doi.org/10.1289/ehp.1409277, 2016.
Santiago-De La Rosa, N., González-Cardoso, G., Figueroa-Lara, J. de J., Gutiérrez-Arzaluz, M., Octaviano-Villasana, C., Ramírez-Hernández, I. F., and Mugica-Álvarez, V.: Emission factors of atmospheric and climatic pollutants from crop residues burning, J. Air Waste Manag. A., 68, 849–865, https://doi.org/10.1080/10962247.2018.1459326, 2018.
Schoennagel, T., Balch, J. K., Brenkert-Smith, H., Dennison, P. E., Harvey, B. J., Krawchuk, M. A., Mietkiewicz, N., Morgan, P., Moritz, M. A., Rasker, R., Turner, M. G., and Whitlock, C.: Adapt to more wildfire in western North American forests as climate changes, P. Natl. Acad. Sci. USA, 114, 4582–4590, https://doi.org/10.1073/pnas.1617464114, 2017.
Schroeder, W., Oliva, P., Giglio, L., and Csiszar, I. A.: The New VIIRS 375 m active fire detection data product: Algorithm description and initial assessment, Remote Sens. Environ., 143, 85–96, https://doi.org/10.1016/j.rse.2013.12.008, 2014.
Seiler, W. and Crutzen, P. J.: Estimates of gross and net fluxes of carbon between the biosphere and the atmosphere from biomass burning, Clim. Change, 2, 207–247, 1980.
Shen, L., Jacob, D. J., Zhu, L., Zhang, Q., Zheng, B., Sulprizio, M. P., Li, K., De Smedt, I., González Abad, G., Cao, H., Fu, T., and Liao, H.: The 2005–2016 Trends of Formaldehyde Columns Over China Observed by Satellites: Increasing Anthropogenic Emissions of Volatile Organic Compounds and Decreasing Agricultural Fire Emissions, Geophys. Res. Lett., 46, 4468–4475, https://doi.org/10.1029/2019GL082172, 2019.
Soares, J., Sofiev, M., and Hakkarainen, J.: Uncertainties of wild-land fires emission in AQMEII phase 2 case study, Atmos. Environ., 115, 361–370, https://doi.org/10.1016/j.atmosenv.2015.01.068, 2015.
Soulie, A., Granier, C., Darras, S., Zilbermann, N., Doumbia, T., Guevara, M., Jalkanen, J.-P., Keita, S., Liousse, C., Crippa, M., Guizzardi, D., Hoesly, R., and Smith, S. J.: Global Anthropogenic Emissions (CAMS-GLOB-ANT) for the Copernicus Atmosphere Monitoring Service Simulations of Air Quality Forecasts and Reanalyses, ECCAD, https://doi.org/10.24380/eets-qd81 (last access: 7 July 2023), 2023.
Stavrakou, T., Müller, J.-F., Bauwens, M., De Smedt, I., Lerot, C., Van Roozendael, M., Coheur, P.-F., Clerbaux, C., Boersma, K. F., van der A, R., and Song, Y.: Substantial Underestimation of Post-Harvest Burning Emissions in the North China Plain Revealed by Multi-Species Space Observations, Sci. Rep., 6, 32307, https://doi.org/10.1038/srep32307, 2016.
Stockwell, C. E., Veres, P. R., Williams, J., and Yokelson, R. J.: Characterization of biomass burning emissions from cooking fires, peat, crop residue, and other fuels with high-resolution proton-transfer-reaction time-of-flight mass spectrometry, Atmos. Chem. Phys., 15, 845–865, https://doi.org/10.5194/acp-15-845-2015, 2015.
Takami, K., Shimadera, H., Uranishi, K., and Kondo, A.: Impacts of Biomass Burning Emission Inventories and Atmospheric Reanalyses on Simulated PM10 over Indochina, Atmosphere, 11, 160, https://doi.org/10.3390/atmos11020160, 2020.
Tang, W., Emmons, L. K., Buchholz, R. R., Wiedinmyer, C., Schwantes, R. H., He, C., Kumar, R., Pfister, G. G., Worden, H. M., Hornbrook, R. S., Apel, E. C., Tilmes, S., Gaubert, B., Martinez-Alonso, S., Lacey, F., Holmes, C. D., Diskin, G. S., Bourgeois, I., Peischl, J., Ryerson, T. B., Hair, J. W., Weinheimer, A. J., Montzka, D. D., Tyndall, G. S., and Campos, T. L.: Effects of Fire Diurnal Variation and Plume Rise on U.S. Air Quality During FIREX-AQ and WE-CAN Based on the Multi-Scale Infrastructure for Chemistry and Aerosols (MUSICAv0), J. Geophys. Res.-Atmos., 127, e2022JD036650, https://doi.org/10.1029/2022JD036650, 2022.
Urbanski, S.: Wildland fire emissions, carbon, and climate: Emission factors, Forest Ecol. Manage., 317, 51–60, https://doi.org/10.1016/j.foreco.2013.05.045, 2014.
Urbanski, S. P., Hao, W. M., and Nordgren, B.: The wildland fire emission inventory: western United States emission estimates and an evaluation of uncertainty, Atmos. Chem. Phys., 11, 12973–13000, https://doi.org/10.5194/acp-11-12973-2011, 2011.
Urbanski, S. P., Reeves, M. C., Corley, R. E., Silverstein, R. P., and Hao, W. M.: Contiguous United States wildland fire emission estimates during 2003–2015, Earth Syst. Sci. Data, 10, 2241–2274, https://doi.org/10.5194/essd-10-2241-2018, 2018.
Val Martin, M., Heald, C. L., Lamarque, J.-F., Tilmes, S., Emmons, L. K., and Schichtel, B. A.: How emissions, climate, and land use change will impact mid-century air quality over the United States: a focus on effects at national parks, Atmos. Chem. Phys., 15, 2805–2823, https://doi.org/10.5194/acp-15-2805-2015, 2015.
van der Werf, G. R., Randerson, J. T., Giglio, L., van Leeuwen, T. T., Chen, Y., Rogers, B. M., Mu, M., van Marle, M. J. E., Morton, D. C., Collatz, G. J., Yokelson, R. J., and Kasibhatla, P. S.: Global fire emissions estimates during 1997–2016, Earth Syst. Sci. Data, 9, 697–720, https://doi.org/10.5194/essd-9-697-2017, 2017.
van Leeuwen, T. T., van der Werf, G. R., Hoffmann, A. A., Detmers, R. G., Rücker, G., French, N. H. F., Archibald, S., Carvalho Jr., J. A., Cook, G. D., de Groot, W. J., Hély, C., Kasischke, E. S., Kloster, S., McCarty, J. L., Pettinari, M. L., Savadogo, P., Alvarado, E. C., Boschetti, L., Manuri, S., Meyer, C. P., Siegert, F., Trollope, L. A., and Trollope, W. S. W.: Biomass burning fuel consumption rates: a field measurement database, Biogeosciences, 11, 7305–7329, https://doi.org/10.5194/bg-11-7305-2014, 2014.
Wiedinmyer, C. and Emmons, L.: Fire Inventory from NCAR version 2 Fire Emission. Research Data Archive at the National Center for Atmospheric Research, Computational and Information Systems Laboratory [data set], https://doi.org/10.5065/XNPA-AF09, 2022.
Wiedinmyer, C. and Emmons, L.: Fire INventory from NCAR (FINN) v2.5(MODIS), MOZART VOC speciation (v2.5), Zenodo [code], https://doi.org/10.5281/zenodo.7868652 (last access: 7 July 2023), 2023.
Wiedinmyer, C., Akagi, S. K., Yokelson, R. J., Emmons, L. K., Al-Saadi, J. A., Orlando, J. J., and Soja, A. J.: The Fire INventory from NCAR (FINN): a high resolution global model to estimate the emissions from open burning, Geosci. Model Dev., 4, 625–641, https://doi.org/10.5194/gmd-4-625-2011, 2011.
Wiedynmyer, C.: FINN (Fire INventory from NCAR) Preprocessor and Emission Estimator (v2.5.2), Zenodo [code], https://doi.org/10.5281/zenodo.7860860 (last access: 7 July 2023), 2023.
Xu, L., Crounse, J. D., Vasquez, K. T., Allen, H., Wennberg, P. O., Bourgeois, I., Brown, S. S., Campuzano-Jost, P., Coggon, M. M., Crawford, J. H., DiGangi, J. P., Diskin, G. S., Fried, A., Gargulinski, E. M., Gilman, J. B., Gkatzelis, G. I., Guo, H., Hair, J. W., Hall, S. R., Halliday, H. A., Hanisco, T. F., Hannun, R. A., Holmes, C. D., Huey, L. G., Jimenez, J. L., Lamplugh, A., Lee, Y. R., Liao, J., Lindaas, J., Neuman, J. A., Nowak, J. B., Peischl, J., Peterson, D. A., Piel, F., Richter, D., Rickly, P. S., Robinson, M. A., Rollins, A. W., Ryerson, T. B., Sekimoto, K., Selimovic, V., Shingler, T., Soja, A. J., St. Clair, J. M., Tanner, D. J., Ullmann, K., Veres, P. R., Walega, J., Warneke, C., Washenfelder, R. A., Weibring, P., Wisthaler, A., Wolfe, G. M., Womack, C. C., and Yokelson, R. J.: Ozone chemistry in western U.S. wildfire plumes, Sci. Adv., 7, eabl3648, https://doi.org/10.1126/sciadv.abl3648, 2021.
Xu, Q., Westerling, A. L., Notohamiprodjo, A., Wiedinmyer, C., Picotte, J. J., Parks, S. A., Hurteau, M. D., Marlier, M. E., Kolden, C. A., Sam, J. A., Baldwin, W. J., and Ade, C.: Wildfire burn severity and emissions inventory: an example implementation over California, Environ. Res. Lett., 17, 085008, https://doi.org/10.1088/1748-9326/ac80d0, 2022.
Xu, R., Yu, P., Abramson, M. J., Johnston, F. H., Samet, J. M., Bell, M. L., Haines, A., Ebi, K. L., Li, S., and Guo, Y.: Wildfires, Global Climate Change, and Human Health, N. Engl. J. Med., 383, 2173–2181, https://doi.org/10.1056/NEJMsr2028985, 2020.
The requested paper has a corresponding corrigendum published. Please read the corrigendum first before downloading the article.
- Article
(5622 KB) - Full-text XML
- Corrigendum
-
Supplement
(2889 KB) - BibTeX
- EndNote