the Creative Commons Attribution 4.0 License.
the Creative Commons Attribution 4.0 License.
 | 05 Jun 2023
How is a global sensitivity analysis of a catchment-scale, distributed pesticide transfer model performed? Application to the PESHMELBA model
Claire Lauvernet
Bruno Sudret
Arthur Vidard
Pesticide transfers in agricultural catchments are responsible for diffuse but major risks to water quality. Spatialized pesticide transfer models are useful tools to assess the impact of the structure of the landscape on water quality. Before considering using these tools in operational contexts, quantifying their uncertainties is a preliminary necessary step. In this study, we explored how global sensitivity analysis could be applied to the recent PESHMELBA pesticide transfer model to quantify uncertainties on transfer simulations. We set up a virtual catchment based on a real one, and we compared different approaches for sensitivity analysis that could handle the specificities of the model: a high number of input parameters and a limited size of sample due to computational cost and spatialized output. After a preliminary screening step, we calculated Sobol' indices obtained from polynomial chaos expansion, Hilbert–Schmidt independence criterion (HSIC) dependence measures and feature importance measures obtained from random forest surrogate model. Results from the different methods were compared regarding both the information they provide and their computational cost. Sensitivity indices were first computed for each landscape element (site sensitivity indices). Second, we proposed to aggregate them at the hillslope and the catchment scale in order to get a summary of the model sensitivity and a valuable insight into the model hydrodynamic behaviour. Conclusions about the advantages and disadvantages of each method may help modellers to conduct global sensitivity analysis on other such modular and distributed hydrological models as there has been a growing interest in these approaches in recent years.
- Article
(4604 KB) - Full-text XML
- BibTeX
- EndNote


Pesticide transfers from fields to water bodies are a major but also complex environmental concern. Significant efforts are required to assess risks for aquatic ecosystems and human lives. To do so, numerical models that simulate pesticide transfers and fate are necessary tools to support risk management. Among others things, such models make it possible to explore and compare scenarios of exposure and to assess mitigation measures. For this purpose and to support decision-making, physically based models such as in Reichenberger et al. (2007) or Dosskey et al. (2011) are particularly valuable. When they are distributed at the scale of the catchment, these models also make it possible to take into account the landscape configuration. This is of particular interest as the landscape configuration is of big influence on transfers and regulation, and corrective actions can thus be relevantly set up at this scale. PESHMELBA (Rouzies et al., 2019) is such a modular, process-based and distributed model that simulates pesticide transfers and fate at the scale of small agricultural catchments and that takes into account the impact of the landscape composition. However, PESHMELBA is characterized by a complex structure, numerous couplings and interactions that raise additional challenges about diagnosing model behaviour and uncertainty quantification (Gupta et al., 2008; van Griensven et al., 2006). To address the issue of uncertainty quantification, sensitivity analysis is a powerful tool that is being increasingly used in environmental models (Hamby, 1994; Tang et al., 2007; Nossent et al., 2011; Garcia et al., 2019; Alipour et al., 2022). Among its objectives, sensitivity analysis contributes to obtaining greater insight about the model behaviour. It also contributes to identifying which input factors should be best characterized so as to significantly reduce the total uncertainty.
In the field of pesticide transfer modelling, Dubus et al. (2003) and Holvoet et al. (2005) first performed one-at-a-time (OAT) sensitivity analysis, meaning that each parameter influence was scrutinized individually, while other parameters were set to their nominal values. Although simple and computationally cheap to set, results from OAT analysis may be inaccurate in the case of a non-linear input–output relationship (Saltelli et al., 2004; Nossent and Bauwens, 2012). As a result, global sensitivity analysis (GSA) that varies all input factors simultaneously, on their entire ranges of definition, is favoured to address the sensitivity of environmental models. A large range of GSA methods exist which are not theoretically nor practically equivalent to set, and the method should be carefully chosen depending on the application characteristics (Song et al., 2015; Pianosi et al., 2016; Sarrazin et al., 2016). In the field of pesticide transfer modelling, studies mainly use variance decomposition methods. This approach is particularly appreciated as it allows us to characterize not only the contribution of each input factor individually but also the contributions of interactive effects between input factors. In addition, sensitivity indices calculated from variance-based methods are easy to interpret because they represent the portion of output variance that can be apportioned to an input factor (Saltelli, 2002). The Sobol' method (Sobol, 1993) is the most popular variance-based method, and it has been widely used in pesticide studies (e.g. Hong and Purucker, 2018; Gatel et al., 2019; D'Andrea et al., 2020; Faúndez Urbina et al., 2020). In some other studies (Fox et al., 2010; Lauvernet and Muñoz-Carpena, 2018), variance decomposition is also performed based on Fourier transform methods (FAST and eFAST methods). However, such variance decomposition methods are characterized by a high computational cost (meaning that they require a lot of model evaluations to compute sensitivity indices) that cannot always be afforded. As the computational cost quickly increases with the number of input factors, a classical approach consists in first applying a screening step to identify (if there are) parameters that have a negligible influence on the output variability. Non-influential parameters are then removed or set to constant values. Once the input space dimension has been reduced, variance decomposition can be applied on the reduced set of input factors to classify remaining input factors according to their relative contribution to output variability (ranking step).
Fox et al. (2010)Lauvernet and Muñoz-Carpena (2018)Hong and Purucker (2018)Gatel et al. (2019)(Tissot and Prieur, 2015)D'Andrea et al. (2020)Faúndez Urbina et al. (2020)Table 1Examples of global sensitivity analysis performed on pesticide transfer models.
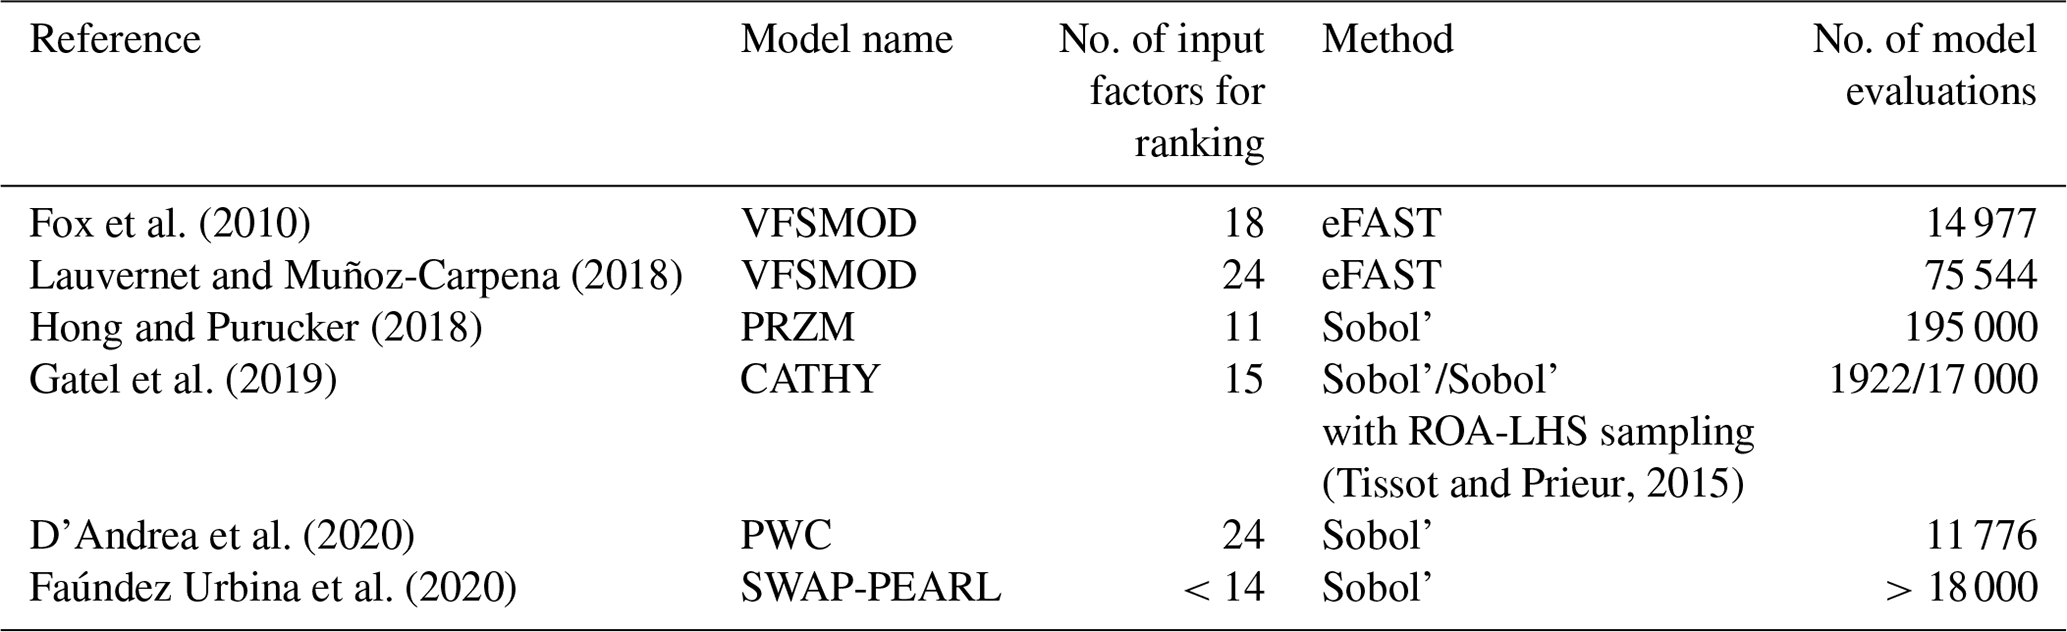
Table 1 summarizes the characteristics of the GSA application for the previously cited pesticide studies (such a table is meant to provide some typical examples rather than be an exhaustive list of studies on the field of pesticide modelling). It shows that in these studies, the input space scrutinized for ranking contains at most 24 parameters (in some cases after a screening step) and that the ranking step always uses more than 10 000 simulations. However, in the case of the PESHMELBA model (and probably of other distributed, physically based, hydrological and pesticide models) a classical application involves around 150 parameters. In addition, 10 000 simulations may be very hard to reach in realistic applications due to computation time. Such characteristics make classical approaches for variance-based GSA quite hard to apply to PESHMELBA. Then, there is a need for exploring other, low-computational-cost GSA methods to perform a ranking task in the PESHMELBA model. Recently, new GSA approaches that require much less model evaluations have emerged. For instance, computing a metamodel based on polynomial chaos expansion on the model (Ghanem and Spanos, 1991) allows us to compute Sobol' sensitivity indices directly, for a very limited computational cost (Sudret, 2008; Fajraoui et al., 2011; Wang et al., 2015). From a totally different point of view, the Hilbert–Schmidt independence criterion (HSIC) proposed by Gretton et al. (2005b) is used as a sensitivity measure in Da Veiga (2015). It describes the global dependence between the output and each input factor from a probabilistic point of view, also from a very limited computational budget. Finally, the growing interest for machine learning techniques is paving the way for new approaches of GSA, such as the random forest method (RF). Its structure provides valuable information on feature importance that can be processed as sensitivity indices like in Harper et al. (2011) and Aulia et al. (2019) (see Antoniadis et al., 2021, for a review on the use of random forests for sensitivity analysis). However, such innovative methods have never been applied to a complex, distributed pesticide transfer model before.
Therefore, the objective of this paper is to evaluate and to compare three new, low-computational-cost GSA methods for application to the PESHMELBA model. The methods will be especially compared in terms of interpretability of the sensitivity indices they provide and reliability (based on the study of their convergence rate). We also investigate whether such approaches suit the spatialized aspect of PESHMELBA. To do so, we investigate the relevancy of computing both local and aggregated indices following the recommendations from Saint-Geours (2012). The analysis is performed on a virtual scenario based on a real catchment in the Beaujolais region (France). The paper is organized as follows: we describe the PESHMELBA model in Sect. 2.1 and the model setup in Sect. 2.2. The input sampling is described in Sect. 2.3, and then we introduce the different GSA approaches and the methodology used for landscape analysis from Sect. 2.4 to Sect. 2.6. Results are presented in Sect. 3. They focus successively on screening (Sect. 3.1), comparison of GSA methods (Sect. 3.2) and spatial analysis (Sect. 3.3). Finally, Sect. 4 gathers some points of discussion.
2.1 The PESHMELBA model
The PESHMELBA model represents a catchment as a set of interconnected components that stand for landscape elements such as plots, vegetative filter strips (VFSs), ditches, hedges or rivers (Rouzies et al., 2019). In order to respect the spatial organization and the heterogeneity of the landscape, it deals with mesh elements that can be surfaces or lines. Surface mesh elements are called homogeneous units (HUs). A HU is a portion of landscape that is homogeneous in terms of hydrodynamic processes and agricultural practices. Linear mesh elements are called reaches. A reach is characterized by its nature (so far ditch, river or hedge) and by its neighbouring components: it is at most in contact with one elementary mesh element on each bank. In addition to its geometric or hydrodynamic properties, each mesh element is characterized by its one-way connections with the neighbouring components that stand at a lower altitude. One or several processes are represented on each element depending on its nature. Lateral transfers at surface and in the subsurface between elements are also integrated. Independent codes called units are used to simulate the different processes, depending on the knowledge the user has on the targeted catchment functioning. Then, the OpenPALM coupler (Fouilloux and Piacentini, 1999; Buis et al., 2006) is used to couple the units and to build the complete application. OpenPALM has adapted features to easily deal with spatial and temporal aspects of the model. For example, synchronization tools make it possible to couple processes with different time steps. The final structure is highly modular, and process representations can easily be added, upgraded or removed depending on the landscape description. These features make PESHMELBA particularly suitable for scenario exploration. PESHMELBA focuses on surface and subsurface transfers of water and pesticides. An extensive description of elements and processes already included can be found in Rouzies et al. (2019). The PESHMELBA version used in this study integrates a representation of water and pesticide transfers on plots, VFSs and rivers. Each plot or VFS is represented by a unique column of soil divided into vertical cells. In such a column, vertical infiltration is simulated using a solution of the 1D Richards equation proposed by Ross (2003). An adapted set of parameters makes it possible to represent high infiltration rate, surface runoff reduction, and enhanced adsorption and degradation on VFSs. Root-water uptake is integrated based on Varado et al. (2006). Surface runoff routing is represented based on the kinematic wave (Lighthill and Whitham, 1955), and the Darcy law (Darcy, 1857) is used for lateral subsurface transfers. In addition to shallow groundwater tables, PESHMELBA also represents shallowly perched water tables and associated lateral transfers. Finally, the reactive transfer of solutes is represented: advection and degradation, based on a first-order law, and adsorption, based on linear or Freundlich isotherms, are integrated. Each river or ditch reach is represented by a unique tank. The River1D module (Branger et al., 2010) solves the kinematic wave equation for water routing and pesticide advection in the network. Groundwater–river exchanges are represented by the Miles formulation adapted by Dehotin et al. (2008).
2.2 Model setup
A virtual scenario of limited size is set from a portion of La Morcille catchment (France) in order to explore the different GSA methods and to ease interpretation of spatialized results. The chosen portion is selected so as to remain representative of the global composition of La Morcille catchment in terms of soil, slope, type and size of elements, as well as interface length between them. The chosen scenario is composed of 10 vineyard plots, four vegetative filter strips and five river reaches that delimit a left and a right slope (see Fig. 1).
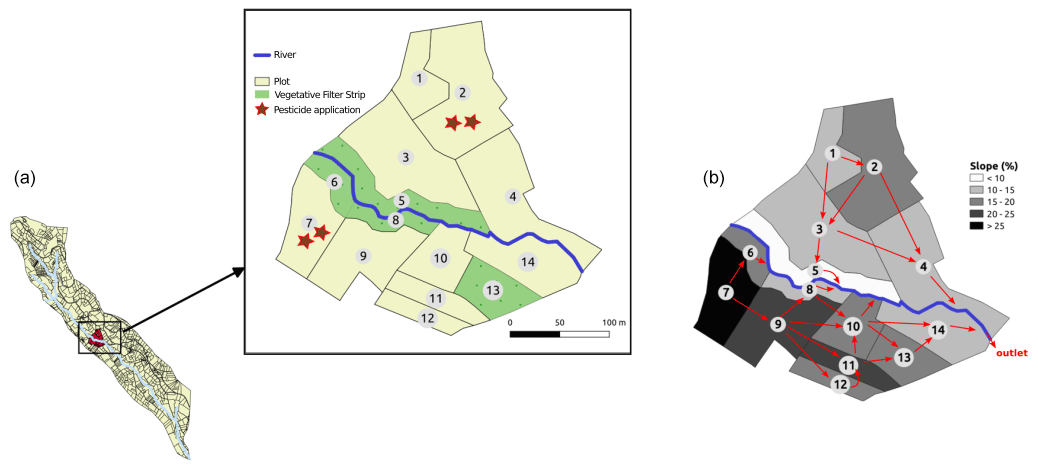
Figure 1(a) Portion of La Morcille catchment selected to perform sensitivity analysis. Yellow units stand for vineyard plots, while green units stand for vegetative filter strips. Brown stars denote locations of pesticide application. (b) Slopes and connections between elements.
Soils types on the catchment are mainly sandy (Peyrard et al., 2016). We use the classification from Frésard (2010) that groups soil types into three main soil units (SUs). Each SU is defined by the vertical succession of three or four soil layers, also called soil horizons: one surface horizon, one or two intermediary horizons, and one deep horizon, as depicted in Fig. 2. Note that interface depths can vary from one SU to another. The reader may refer to Rouzies et al. (2019) for further details on how soil types and soil horizons are represented in PESHMELBA. At the catchment scale, the classification results in the following SU (see Fig. 2): sandy soil (SU1), sandy soil on clay on the right bank plateau (SU2), and heterogeneous sandy soils on lower slopes and thalwegs (SU3). Spatial arrangement is set in order to be as realistic as possible in terms of possible interfaces between SUs. Each SU is set at least on one vineyard plot and one VFS on the virtual scenario.
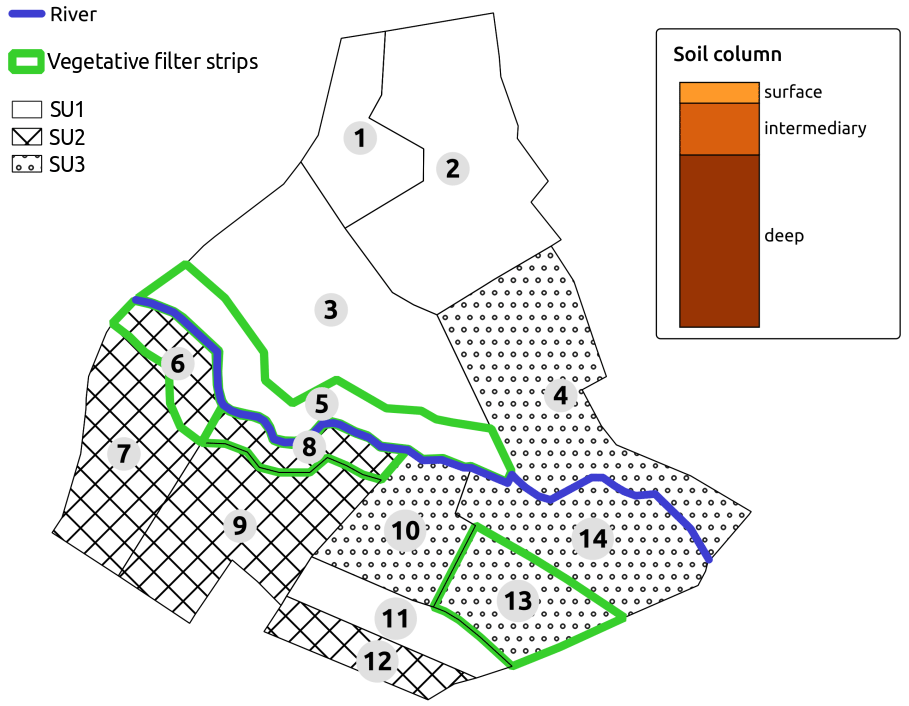
Figure 2Soil type locations for the case study. Green contours show the vegetative filter strips.
Considering the different soil horizons whose hydrodynamic behaviour and texture must be parameterized, the two types of vegetation (grassland and vineyard), and the different landscape element types (plots, VFSs and river reaches) that are simulated, the scenario results in 145 input parameters to be considered for sensitivity analysis. They are described in Table 2 as well as the spatial level on which they are set and their values for the nominal simulation.
(Schaap and van Genuchten, 2006)Table 2Input factor description, corresponding spatial level definition and value for the nominal scenario. Nominal values are explicitly distinguished between vineyard plots and VFSs with the character “–” when needed.
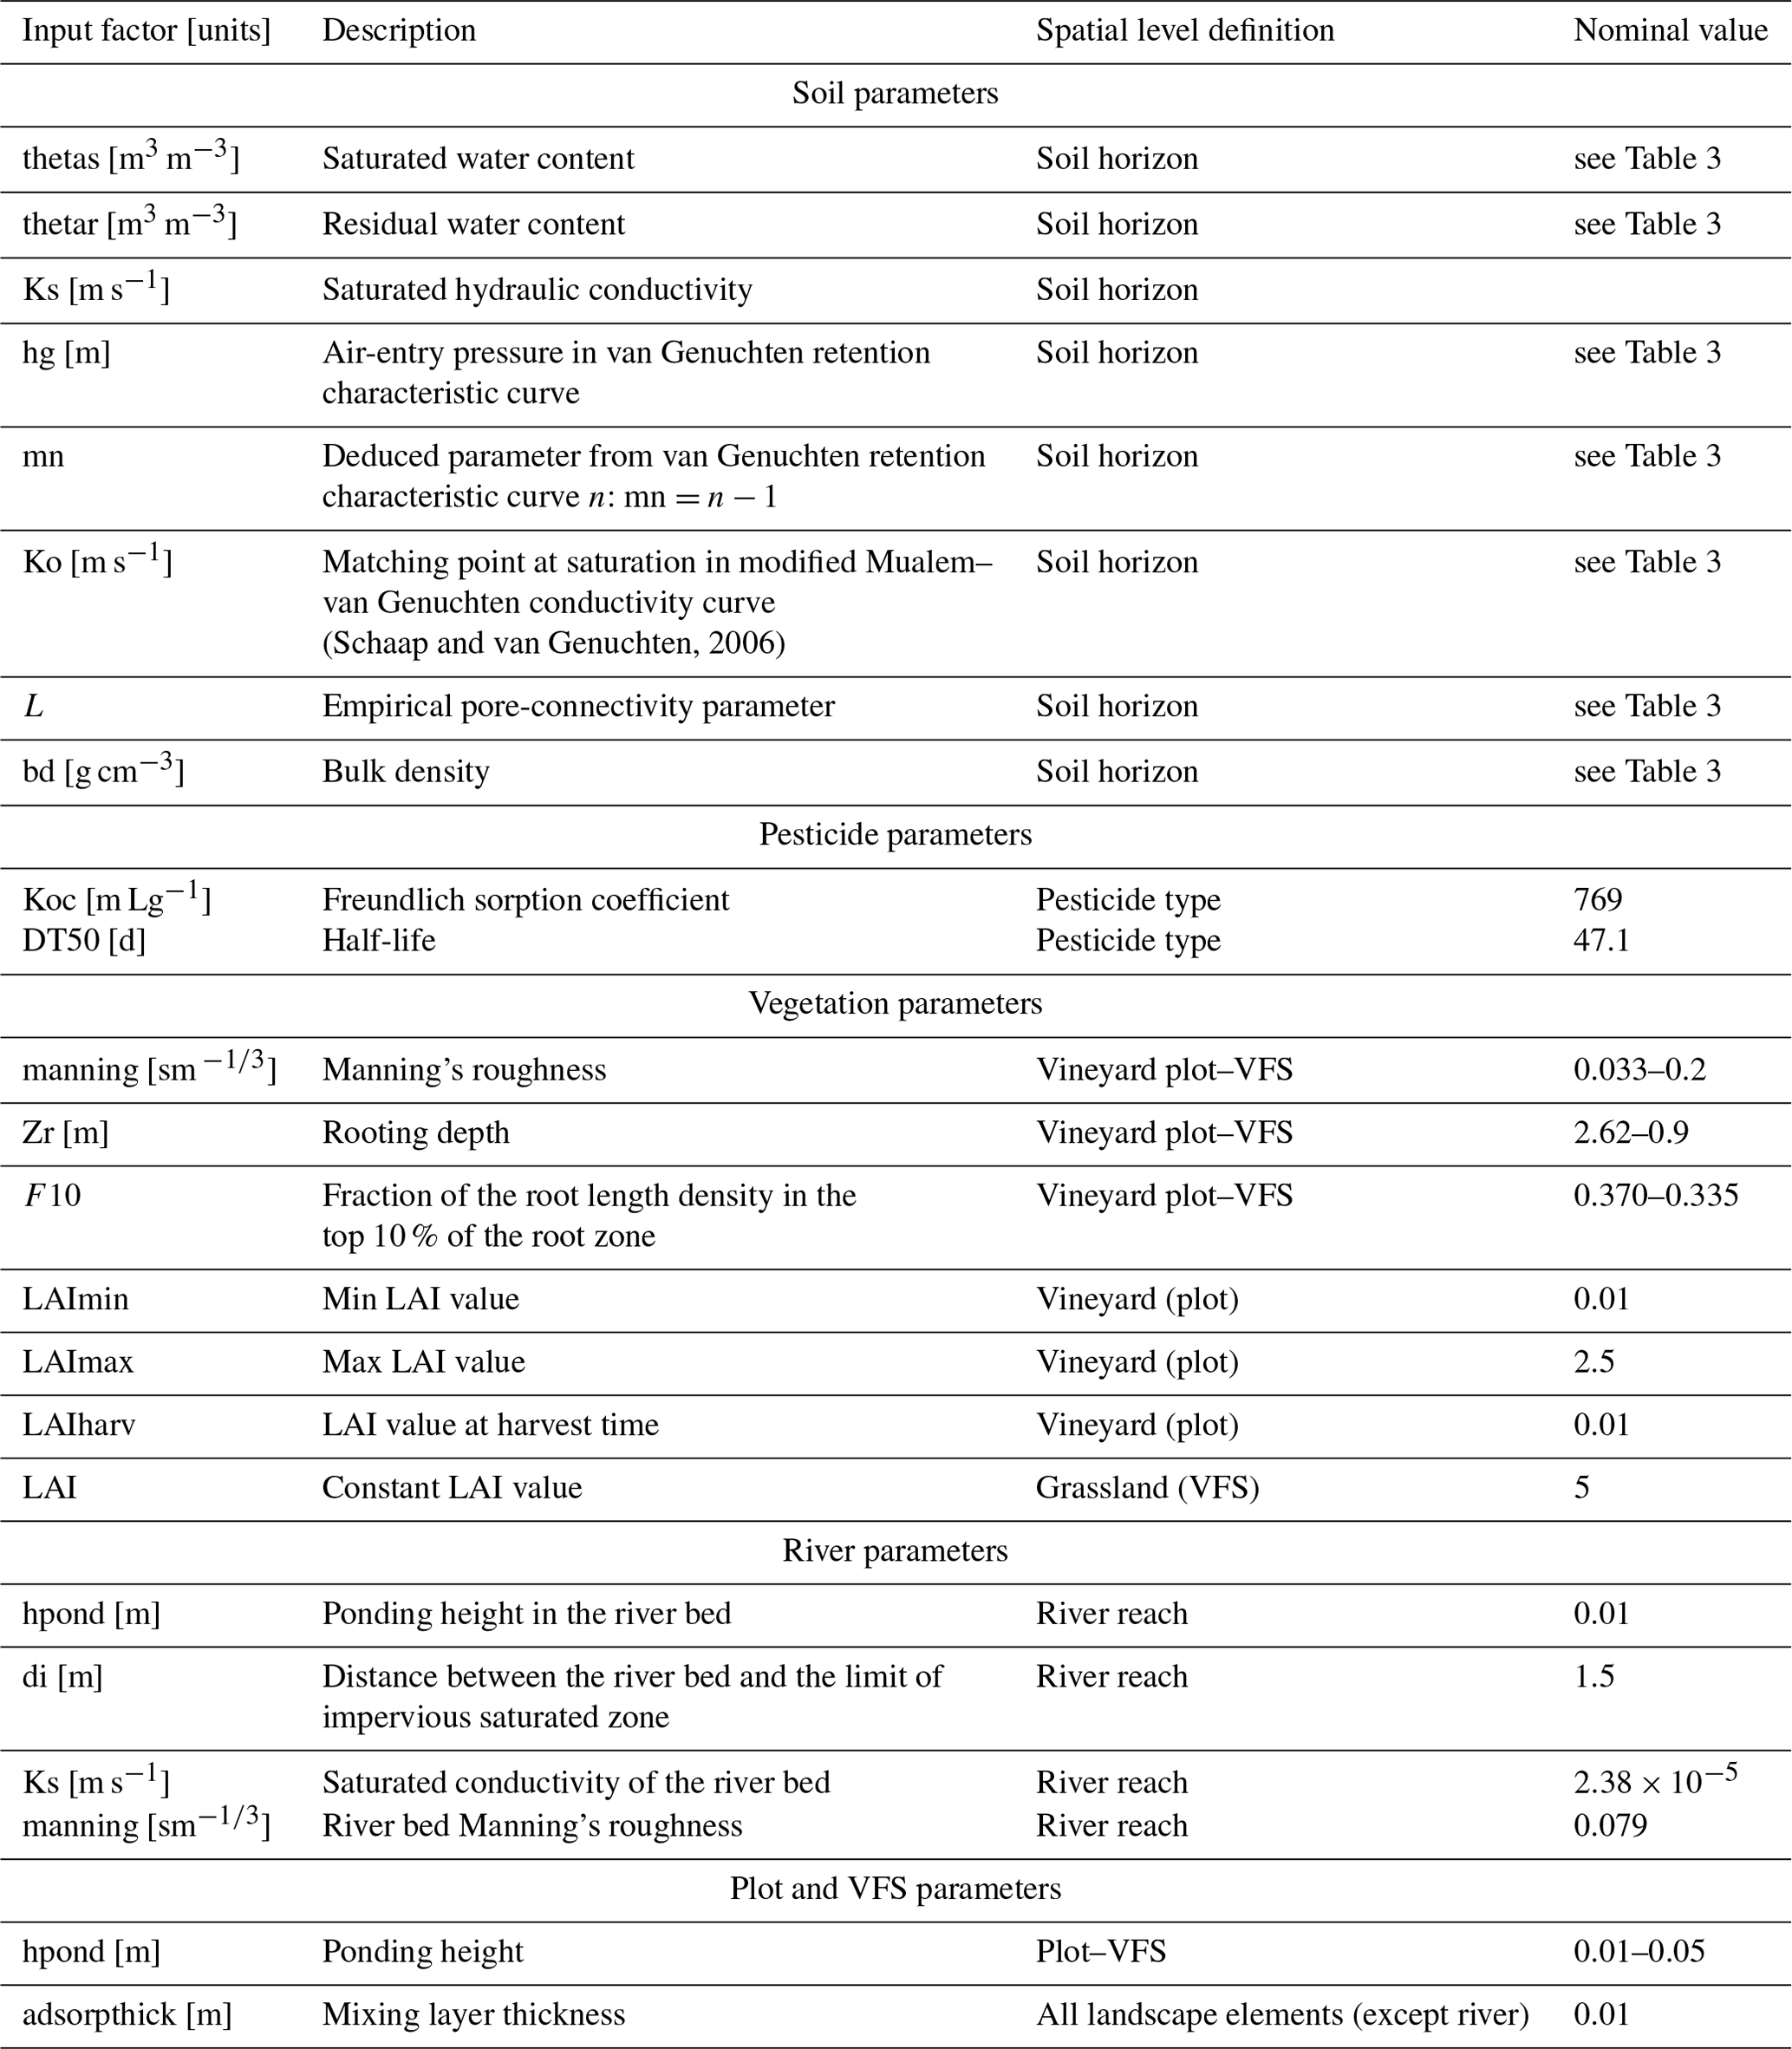
For the nominal scenario, values for bulk density bd and organic carbon content moc are available from Van den Bogaert (2011) and Randriambololohasinirina (2012). They are, as well as hydrodynamic parameters for each soil type, described in Table 3. Retention values measured by Van den Bogaert (2011) are used to fit retention curve using the SWRCfit tool (Seki, 2007). A Schaap–van Genuchten conductivity curve is used (Schaap and van Genuchten, 2006; Ross, 2006), whose matching points at saturation Ko and empirical pore connectivity L are derived from conductivity data and retention parameters from retention curve fitting. Surface organic carbon content is set equal to that of the first soil horizon on plots and VFSs. For each SU, only the first soil horizon on VFSs differs from vineyard plots so as to highlight enhanced infiltration capacities. The surface horizon on VFSs is characterized by a 2.8 % organic carbon content (Randriambololohasinirina, 2012) and a saturated hydraulic conductivity of 150 mm h−1 (or m s−1) following Catalogne et al. (2018). In the absence of data to characterize potential anisotropy of vertical and horizontal saturated conductivities Ksv and Ksh, isotropy is considered; thus the ratio is set to 1 in the catchment.
Table 3Soil parameters for SU1, 2 and 3. Hydrodynamic parameters are based on the van Genuchten retention curve and on Schaap–van Genuchten conductivity curve fitting. Parameters are described in Table 2. Values for the surface horizon are explicitly distinguished between plot and VFS when they are different. Horizons 11, 12 and 13 are surface horizons for plots, whereas horizons 14, 15 and 16 are surface horizons for VFSs.
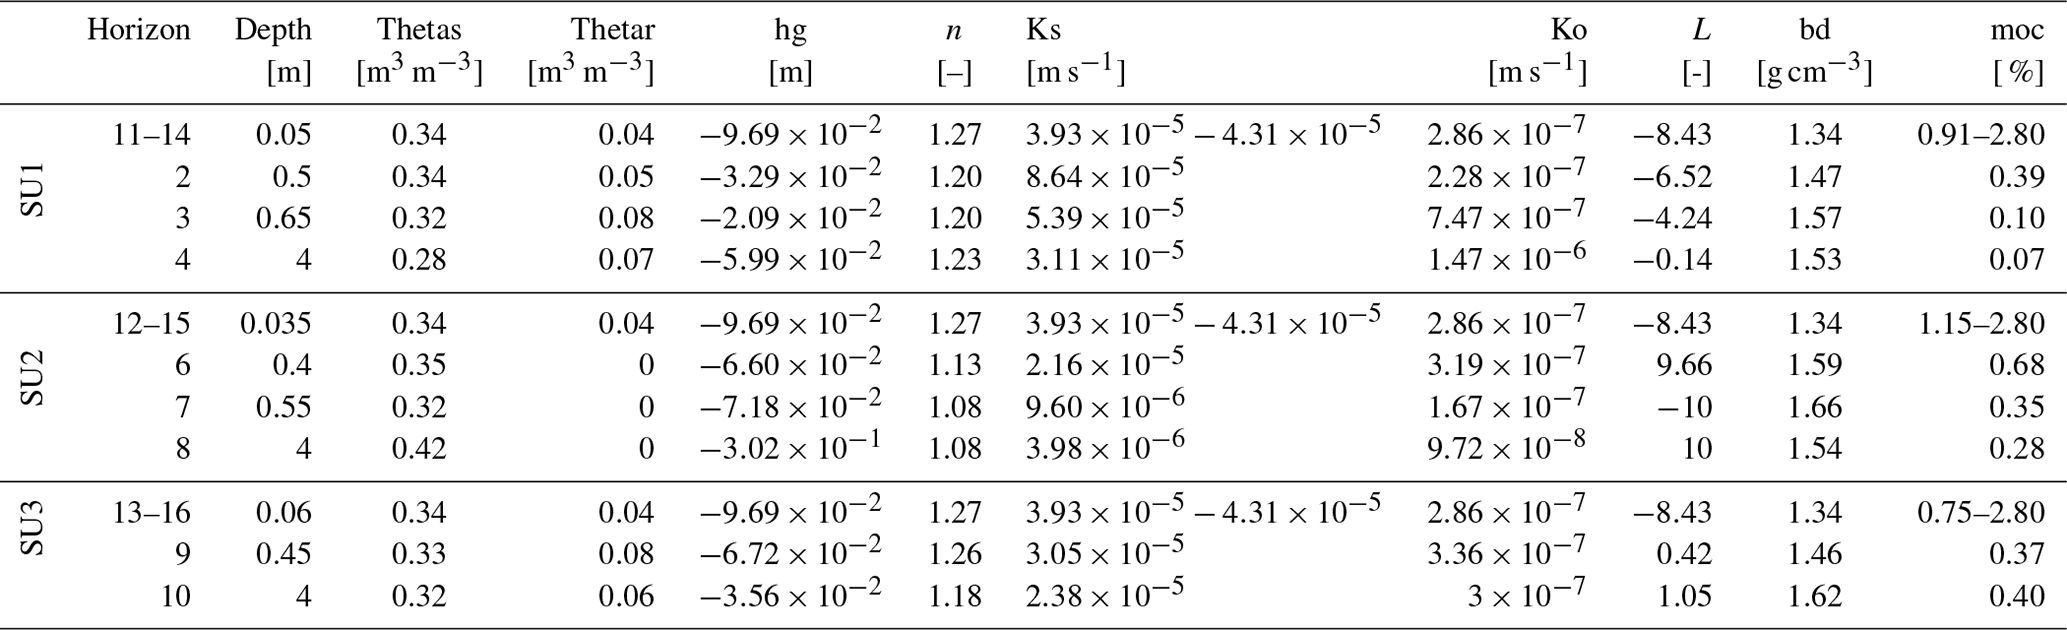
The pesticide chosen in this study is tebuconazole as it is a fungicide widely used in the La Morcille catchment. It is a slightly mobile molecule, and we use a Freundlich isotherm to describe its adsorption equilibrium. Adsorption parameters are obtained from Lewis et al. (2016) (Koc =769 mL g−1, Freundlich isotherm exponent = 0.84). The surface degradation coefficient is also taken from Lewis et al. (2016) (DT50 =47.1 d), and a decreasing degradation rate as a function of depth is set as in FOCUS (2001). A 500 g application is considered at the beginning of the simulation on plots 2 and 7 (see Fig. 1). Most of the transformation and adsorption of tebuconazole are supposed to happen on plots and VFSs at this modelling scale. Therefore, no adsorption or degradation is simulated in the river.
A no-flux boundary condition is applied on all sides except on the surface where rain and potential evapotranspiration are considered. Rain data are extracted from the BDOH database (Gouy et al., 2015). A 3-month simulation is performed for a time period characterized by long and intense rain events (670 mm cumulated), allowing for significant water and pesticide transfers both by surface runoff and subsurface saturated transfers. Potential evapotranspiration (PET) data are obtained from MeteoFrance for the neighbouring site of Liergues (MeteoFrance, 2008). Data are averaged over 10 d periods and corrected by a factor of −11 % to match the La Morcille site as recommended in Durand (2014) and Caisson (2019). Rain and PET data for the simulation are summarized in Fig. 3.
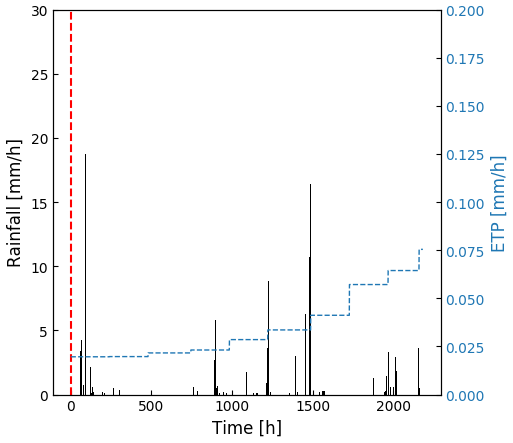
Figure 3Climatic forcing (rain and potential evapotranspiration) for the simulation. The dotted red line stands for the one-shot pesticide application.
Although virtual, we aim at setting initial conditions as plausible as possible for this scenario. As running the model on a warm-up period is not possible due to data availability and computational cost limitation, initial water table levels are deduced from piezometric data on a neighbouring hillslope, and all soil columns are supposed to be in hydrostatic equilibrium at the beginning of the simulation. Data from several piezometers are available on a transect, perpendicular to the river. Data are extrapolated over the virtual hillslope width on both sides of the river. An upstream 0.177 m3 s−1 flow is considered in the river based on local measurements (Gouy et al., 2015).
Two types of vegetation are represented in this scenario. Vineyard cover is considered on plots, while permanent grassland is simulated on VFSs. Considering the period of simulation (3 months), a fixed root depth (Zr =2.62 m) and a fixed root density in the first 10 % of the root depth (F10 =37 %) are considered for vineyards following values reported in Smart et al. (2006) and confirmed by expert knowledge in the area. The root depth (Zr) is set to 0.9 m, and the root density in the first 10 % of the root depth (F10) is set to 33.5 % for grassland (Brown et al., 2007). For vineyards, the leaf area index (LAI) is assumed to increase from a minimum value LAImin from leaves formation until a maximum value LAImax before declining until harvest LAIharv. Dates and associated values for this development cycle are taken from Brown et al. (2007), and they are detailed in Appendix A1. On grassland, the LAI is assumed to remain constant, and a nominal value of 5 is chosen based on Brown et al. (2007). In Table 2, the reader should note that the LAI parameter relates to the constant LAI value for grassland, while LAImin, LAImax and LAIharv relate to vineyard plots. The remaining parameters for the root extraction model are also fixed to nominal values proposed by Varado et al. (2006) and Li et al. (2001). Manning coefficients are set from data reported in Arcement and Schneider (1989). A mature row crop value (0.033 s m) is chosen for vineyards, while a high grass pasture value (0.2 s m) is set for VFS cover.
Finally, ponding height is set to 0.01 m for vineyard plots, while an increased value is set for VFSs (0.05 m). According to Gao et al. (2004) and Walter et al. (2007), the surface mixing layer thickness is set to 0.01 m in both plot and VFS domains. In the river, the distance between the river bed and the limit of impervious saturated zone (di) is set to 1.5 m (electrical resistivity tomography field measure, Rémi Dubois, personal communication, 2020), and the saturated hydraulic conductivity (Ks) is set to m s−1 accordingly to local saturated conductivities in the neighbouring soil. The ponding height is set to 0.01 m, while the Manning coefficient is chosen equal to 0.079 s m, as suggested in Arcement and Schneider (1989) for channels with limited obstruction.
2.3 Input sampling
The input factor distributions are set to be as representative as possible of the available data on the catchment and the associated uncertainties. Mean values are taken from the nominal scenario described in Sect. 2.2. Distributions and standard deviations are assigned based on experimental measurements from the catchment of application, available scientific literature or expert knowledge. All assigned distributions and corresponding statistics are summarized in Appendix B.
As commonly found in the literature (Coutadeur et al., 2002; Fox et al., 2010; Schwen et al., 2011; Dairon, 2015; Dubus et al., 2003; Dubus and Brown, 2002), a lognormal distribution is assigned to the saturated hydraulic conductivity Ks. A 20 % coefficient of variation (CV) is used so as to remain representative of each soil horizon hydrodynamic behaviour. Distributions for Schaap–van Genuchten parameters could not be found in the literature; thus the empirical pore-connectivity parameter L is assigned a uniform distribution ±20 % around the mean value (Zajac, 2010). As the matching point at saturation in the modified Mualem–van Genuchten conductivity curve Ko has the same physical meaning as Ks, a lognormal distribution is also assigned to this parameter and a 20 % CV is set. Saturated water content thetas, residual water content thetar, van Genuchten parameter mn and air-entry pressure hg are assigned normal distributions (Schwen et al., 2011; Alletto et al., 2015; Dairon, 2015; Gatel et al., 2019). A 10 % CV is set for thetas (Gatel et al., 2019; Lauvernet and Muñoz-Carpena, 2018), and thetar is assigned a 25 % CV (Gatel et al., 2019). A 10 % CV is set for mn and hg (Schwen et al., 2011; Alletto et al., 2015; Gatel et al., 2019). A uniform distribution is assigned to organic carbon content moc (Lauvernet and Muñoz-Carpena, 2018). A triangular distribution is assigned to the Freundlich sorption coefficient Koc (Lauvernet and Muñoz-Carpena, 2018), and a normal distribution is assigned to the half-life DT50. A 60 % CV is assigned to Koc and DT50 distributions as such parameters are considered relatively uncertain (Dubus et al., 2003). Triangular distributions are assigned to Manning's roughness (manning) on plots and for the river bed (Lauvernet and Muñoz-Carpena, 2018; Gatel et al., 2019). A uniform distribution with a ±20 % range around the mean value is assigned to remaining input factors as little information could be found in the literature (Zajac, 2010).
Using a fully distributed model such as PESHMELBA raises the issue of sampling strategy. Indeed, in this case study, even if the site is only composed of 14 surface units, the large number of soil horizons on the catchment, considering the hydrodynamic distinction between plots and VFSs, also dramatically increases the number of parameters. Sampling all parameters on each spatial unit leads to a huge number of simulations that could not be computationally afforded. Moreover, such independent sampling on a very large number of parameters may lead to misinterpretation of the sensitivity analysis results as the influence of physical processes could not be distinguished from spatial arrangement. For each sample, one set of soil parameters is therefore sampled for each soil horizon, and those parameters are applied to all spatial units that contain this horizon which sets the number of parameters to be considered in the GSA at 145.
2.4 Methodology for global sensitivity analysis in the PESHMELBA model
Although the PESHMELBA model is dynamic, model outputs considered in this paper are scalar quantities rather than temporal series to keep the problem simple. In order to investigate PESHMELBA abilities to properly represent transfers in a heterogeneous landscape, sensitivity analysis is performed on four hydrological and quality variables: (1) cumulated water volume transferred in the subsurface (saturated lateral transfers), (2) pesticide mass transferred in the subsurface (saturated lateral transfers) (3) cumulated water volume transferred on surface (surface runoff) and (4) cumulated pesticide mass transferred on surface (surface runoff). However, these quantities are spatialized, leading to multidimensional outputs. To deal with the spatialized aspect, GSA is first performed on scalar quantities, on each landscape element (see Sect. 2.4.1 to 2.4.3), then sensitivity indices are aggregated in a second time to provide catchment-scale sensitivity indices (see Sect. 2.6).
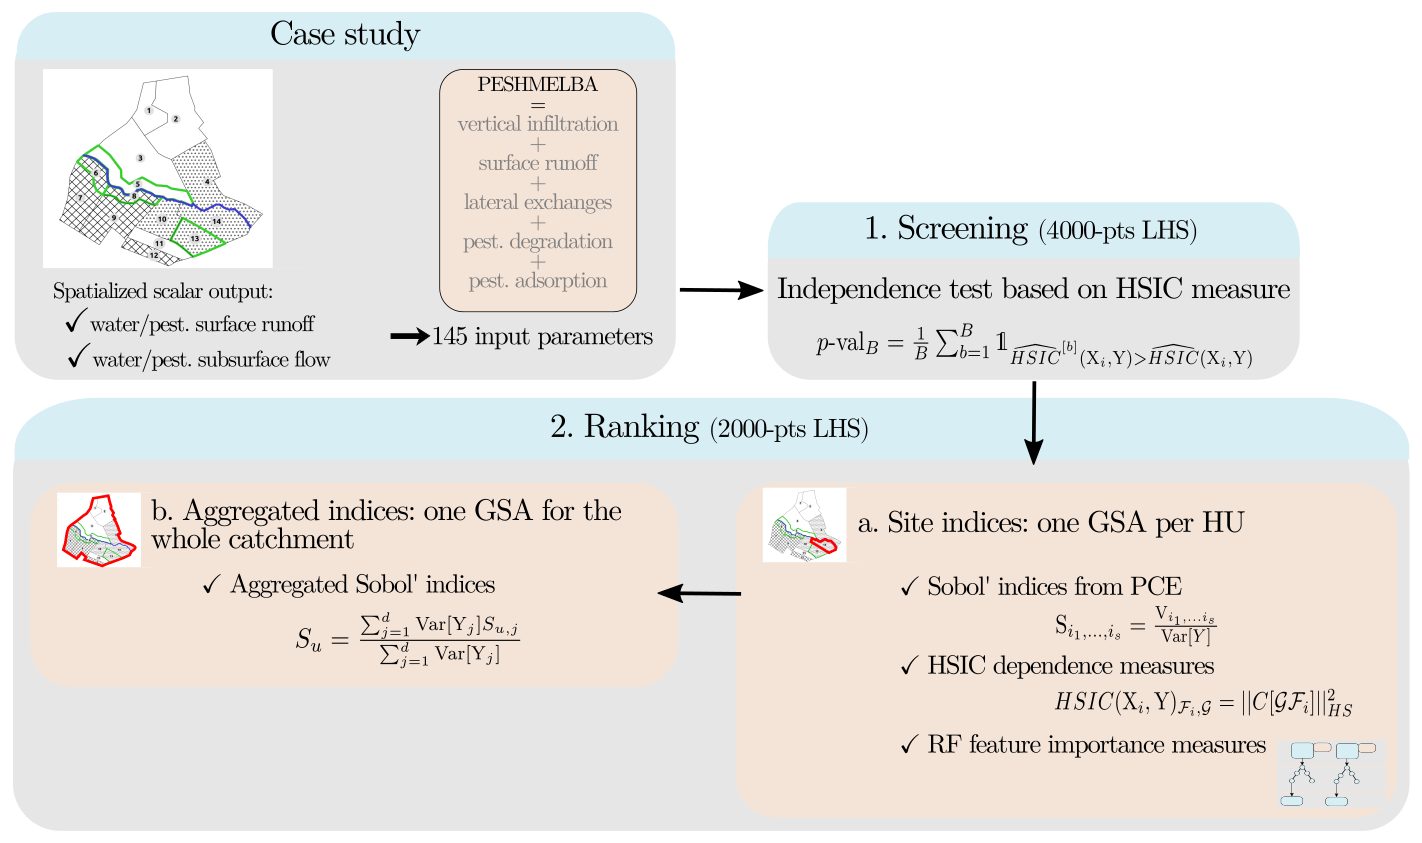
Figure 4Full workflow used to perform GSA on the PESHMELBA model in three steps: (1) screening, (2a) ranking at a local scale and (2b) ranking at the catchment scale.
The full workflow used to perform GSA in the PESHMELBA model is summarized in Fig. 4. Considering the high number of input parameters, a screening step is first performed to decrease the dimension of the problem. Screening is performed with a statistical independence test based on the HSIC measure (see Sect. 2.4.2) on an initial 4000-point Latin hypercube sample (LHS; McKay et al., 1979). Second, a new 2000-point LHS obtained from the reduced set of input parameters is computed to perform ranking. Sensitivity indices are computed from the 2000-point sample based on (1) variance decomposition (Sect. 2.4.1), (2) the HSIC dependence measure (Sect. 2.4.2) and (3) the feature importance measure obtained from random forests (Sect. 2.4.3). These methods are all global and model-free, and all suit non-linear, non-monotonic models. In addition, they all belong to the category of “given-data” methods which means that the input sample they consider does not require a specific structure. This is of particular interest for models that are computationally costly as it allows us to take advantage of pre-existing simulations. That is why such methods have known a growing interest in recent years (Saltelli et al., 2021; Sheikholeslami et al., 2021). However, such methods may not be equally costly to set, and they define the notion of sensitivity in contrasted ways. We compare them regarding the information they provide, their accuracy and their robustness.
In what follows, we denote Y∈ℝ, a given scalar output from PESHMELBA. Y is function of a multivariate input random vector Y=ℳ(X), where contains the 145 input parameters considered in this case study and where ℳ is the PESHMELBA model.
2.4.1 Variance decomposition
Variance-based methods aim at determining how input factors contribute to the output variance (Faivre et al., 2013). One of the most popular variance-based method is the Sobol' method (Sobol, 1993). The Sobol' indices capture the direct impact of any input and also describe the impact of input parameters in interaction with others. It is based on the decomposition of the total variance of the output:
where indicates the portion of variance that can be attributed to interactions between input parameters . From the above, one can define Sobol' indices as
By definition, . In particular, first-order sensitivity indices only account for the main effects of parameter Xi. They can be interpreted as the decrease in the total output variance that could be obtained when removing the uncertainty about Xi when setting Xi to a fixed value (Tarantola et al., 2002). These indices are usually calculated as a first step as they often account for a large portion of the variance (Faivre et al., 2013). Total sensitivity indices evaluate the total effect of an input factor Xi on the output by taking into account its main effect Si and all interaction terms that involve it:
The total sensitivity index stands for the portion of total output variance that remains as long as Xi stays unknown (Tarantola et al., 2002).
Sobol' indices' direct computation requires a large sample size that can not be afforded in this case study. As a result, we compute Sobol' indices from a limited sample size, based on polynomial chaos expansion (PCE; Sudret, 2008) in order to circumvent such difficulty. This approach consists in building a surrogate model of which analytical polynomial expression is directly related to Sobol' indices. Building a PCE and deducing the associated Sobol' indices thus only requires a training sample of limited size and knowledge about each input parameter marginal distribution. More precisely, PCE provides a functional approximation of the computational model based on the projection of the model output on a suitable basis of stochastic polynomial functions in the random inputs (Ghanem and Spanos, 1991). For any square integrable scalar output random variable Y, its polynomial chaos expansion is expressed as follows:
where the Ψα's are multivariate orthonormal polynomials built according to the marginal probability density functions of each input factor, and γα values are the associated coordinates. Expansion from Eq. (4) is usually truncated to a finite sum for practical computation, using for example a truncation scheme based on least-angle regression (Blatman and Sudret, 2011). The Sobol’ indices can then be obtained analytically from the coefficients γα (see Sudret, 2008, for a demonstration of the relation between PCE and Sobol' indices). In our study, the UQLab MATLAB software (Marelli and Sudret, 2014) is used to compute Sobol' indices from the 2000-point LHS (step 2a, Fig. 4). We use a q-norm- and degree-adaptive sparse PCE based on the least-angle regression scheme (LARS; Blatman and Sudret, 2011), with q norm and a maximum degree of 3.
2.4.2 The HSIC dependence measure
Sensitivity measures based on the Hilbert–Schmidt independence criterion (HSIC; Da Veiga, 2015) belong to the category of dependence measures that quantify, from a probabilistic point of view, the dependence between each input and the output. The greater the dependency between the input factor and the output, the greater the associated sensitivity measure. The Hilbert–Schmidt independence criterion used for GSA is based on the cross-correlation between any non-linear transformations of some input factor Xi and the output Y (De Lozzo and Marrel, 2016). Such a dependence measure simultaneously captures a very broad spectrum of forms of dependency between the variables (Meynaoui et al., 2018). These indices can be estimated from small samples (a few hundreds of points) and do not depend on the number of inputs, which is a huge advantage.
The HSIC theory relies on reproducing kernel Hilbert space (RKHS) and kernel functions. Let ℱi denote the RKHS composed of all continuous bounded functions of input Xi, with values in ℝ and 𝒢 the RKHS composed of real-valued continuous bounded functions of output Y with values in ℝ. (i.e. ) is the inner product on ℱi (i.e. 𝒢), and (i.e. kY) is the corresponding kernel function that defines such a scalar product. The HSIC measure corresponds to the square of the Hilbert–Schmidt norm of the cross-covariance operator , which is
where and (vk)k≥0 are orthogonal bases of ℱi and 𝒢 respectively.
The resulting sensitivity indexes proposed by Da Veiga (2015) are defined for each input factor as
Based on Gretton et al. (2005a), an estimator of the HSIC can be computed from an N sample of (Xi, Y):
where is the centring matrix , and and are the Gram matrices defined as and , where and kY are the kernel functions associated with each RKHS. In this study, and following De Lozzo and Marrel (2014, 2016) and Da Veiga (2015), we choose a Gaussian kernel as it is a universal kernel that can fully characterize the independence of variables and that can be used for scalar or vectorial variables. For a vectorial variable x∈ℝq, it is expressed as follows:
with the Euclidian norm in ℝq and where the hyperparameter λ is called the bandwidth parameter of the kernel. In this study, the bandwidth λ is estimated from the inverse of the empirical standard deviation of the sample.
When using a universal kernel, the HSIC indices can also be statistically used for screening purposes (De Lozzo and Marrel, 2014). A statistical test can be set with the null hypothesis “Xi and Y are independent”. Considering an experimental design of N points () and the associated output points (), an estimator of the dependence measure HSIC(Xi,Y) is firstly computed. Then B bootstrap versions Y[1], ..., Y[B] are resampled from the original output sample () with replacement so as to contain the same number of points N. For each Y[B] the input points associated with Xi are not resampled. Indeed, under the independence hypothesis, any values of Y can be associated with Xi. For each bootstrap version b, an estimator is computed. Then, the associated bootstrapped p value is given by
Finally, denoting α the significance level, if p valB<α, the independence hypothesis is rejected, otherwise it is accepted. In this study, such a statistical test is used to perform screening based on 100 bootstrap replicates and a 1 % significance level. The R code provided in De Lozzo and Marrel (2016) (see their Supplement) to compute the HSIC measure has been adapted in Python to perform both screening and ranking.
2.4.3 Random forest
Random forests (Breiman, 2001) belong to ensemble machine learning techniques. The method consists in creating a surrogate by averaging results from an ensemble of K decision trees created independently. A decision tree is composed of an ensemble of discriminatory binary conditions contained in nodes. Such conditions are hierarchically applied from a root node to a terminal node (tree leaf) (Rodriguez-Galiano et al., 2014). The input space is therefore successively partitioned into smaller groups that correspond to the nodes according to a response variable. Such splitting goes on until reaching a minimum threshold of members per node. In this study, we consider regression trees that focus on continuous response variables.
As each individual decision tree is very sensitive to the input dataset, bagging is used to avoid correlations between them and to ensure model stability. It consists in training each decision tree from a different training dataset smaller than the original one. Such subsets are built from the original one by resampling with replacement, making some members be used more than once, while others may not be used. Such a technique makes the random forests more robust when facing slight variations in the input space and increases accuracy of the prediction (Breiman, 1996, 2001). The samples that are not used to grow a tree are called “out-of-bag” (OOB) data and will be used for the test step. The RF workflow is summarized in Fig. 5.
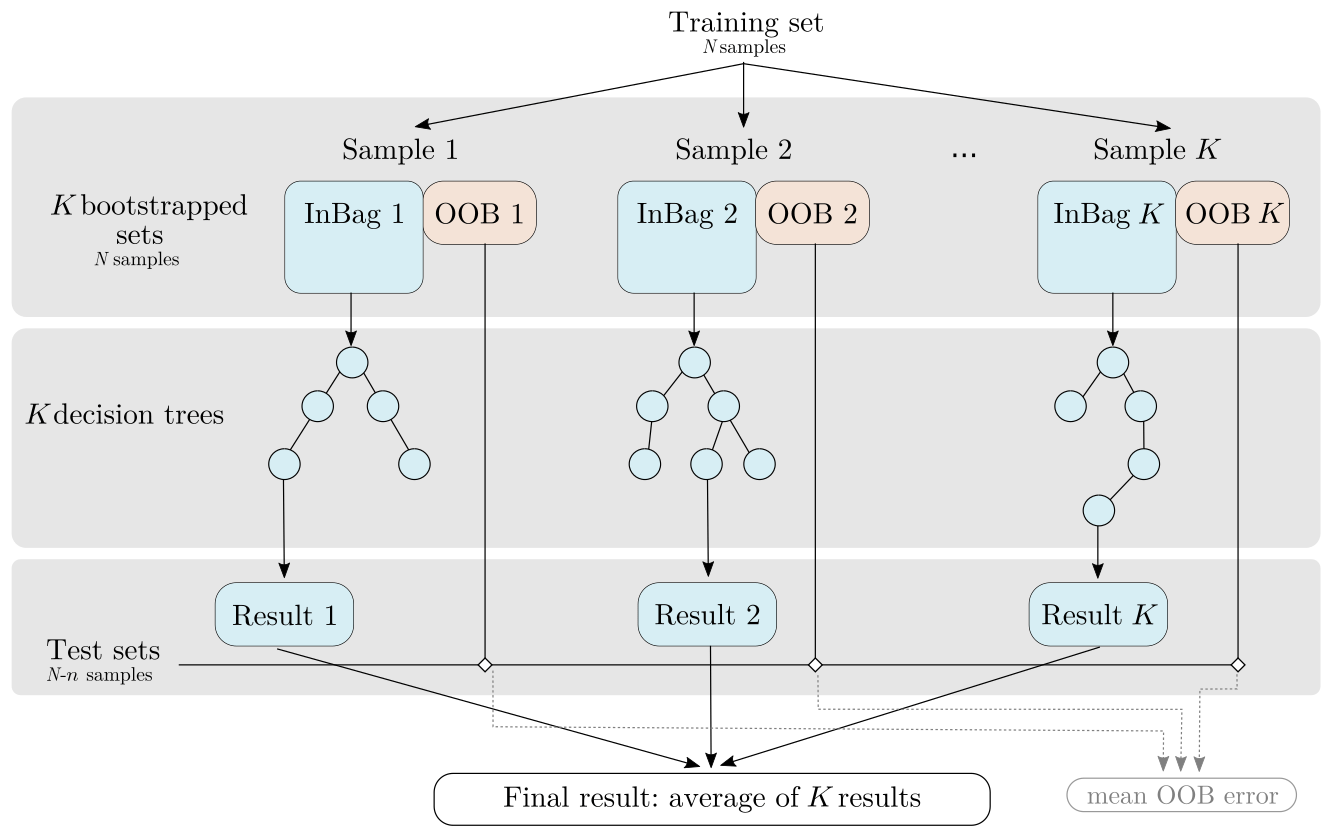
Figure 5RF workflow (adapted from Rodriguez-Galiano et al., 2014). K bootstrapped sets are extracted from the original training set. Part of each set “InBag” is used to grow an independent decision tree, and the final regression value is the average of all trees. The remaining portion of each tree's “out-of-bag” (OOB) data is used as a test set.
RF structure can be used to provide knowledge about how influential each input factor is. This measure is referred to as feature importance in the RF formalism. The random forest is first trained on the targeted output variable Y using a N-point sample (Xj,Yj) for . Once the forest has been trained, each input factor Xi is permuted individually so as to break the link between Xi and Y. The effect of such permutation on the model accuracy is then investigated. A large decrease in accuracy indicates that the input factor is highly influential, whereas a small decrease in accuracy indicates that it has little influence. Different algorithms exist to compute such mean decrease in accuracy (MDA) (see Bénard et al., 2022, for an extensive review of the different formulations in the existing R and Python packages), and we focus here on the original formulation from Breiman paper (Breiman, 2001). The decrease in accuracy is originally computed from the mean square error between predictions from OOB data with and without permutation for each tree. Results are then averaged over all trees to get the MDA. The algorithm for feature importance calculation is extensively described in various papers (e.g. Soleimani, 2021; Bénard et al., 2022), and it is recalled in what follows.
-
For each tree k,
-
estimate , the error from the OOB sample ℒk:
where is the estimated RF metamodel.
-
For each input factor Xi,
-
randomly permute xi in {xj∈ℒk} to generate a new input set .
-
Estimate using the permuted input set
-
-
-
For each input factor Xi,
-
compute the mean decrease in accuracy MDAi as
where K is the total number of trees.
-
Despite the “black-box” aspect of RF building, recent works theoretically establish a link between mean decrease in accuracy and Sobol' total indices when input parameters are assumed independent. Indeed, Gregorutti et al. (2017) establish that for all input parameters Xi,
In this study, the randomForestSRC R package (Ishwaran and Kogalur, 2020) is used to obtain feature importance measures, and the number of trees used to train the RF is set to 500.
2.5 Robustness and reliability assessment of the sensitivity indices
In order to assess the robustness of the calculated sensitivity indices, an additional 200-point test set is first used to assess PCE and RF metamodel performances. In a second time, 95 % confidence intervals on sensitivity indices are computed for all methods but by different means: the bootstrap resampling procedure provided in UQLab is used to calculate confidence intervals on PCE-based Sobol' indices (see Marelli and Sudret, 2018, for justification). In the case of random forests, building extra bootstraps could affect the consistency of the OOB sample as the RF structure already includes a bootstrap step to build each tree. Then, we use a subsampling approach without replacement with a subsample size set to 80 % of the initial sample size to get error bounds on feature importance measures. The same procedure is applied to estimate error bounds on HSIC indices. As typically found in similar studies (Archer et al., 1997; Yang, 2011), 1000 bootstrap resamples are used for all methods. In addition, the reliability of each ranking method is assessed by monitoring its convergence properties. To do so, sensitivity indices and associated confidence intervals are calculated on samples of growing sizes. A new sample is generated for each size in , where the maximum size (2000) points corresponds to the maximum computational budget available for ranking we guess for a catchment-scale application. It is noted that we create a new sample for each sample size to keep all samples as independent as possible, but such an approach may be too costly in a catchment scale application. In such a case, another strategy could be to generate the sample for ranking from the initial LHS used for screening, dropping the dimensions corresponding to the non-influential inputs.
2.6 Aggregated sensitivity indices
After computing local sensitivity indices for each landscape unit on a scalar quantity, aggregated indices are computed at the catchment scale (step 2b, Fig. 4). Catchment-scale sensitivity indices are computed considering a multidimensional output Y∈ℝd that gathers scalar outputs for each landscape unit. Sobol' indices are aggregated at the catchment scale following the formulation by Gamboa et al. (2013) for generalized Sobol' indices:
where u is a subset of , Var[Yj] is the variance of the scalar jth component of Y and Su,j is the Sobol' indices of subset u on Yj. Equation (14) then formulates catchment-scale indices as an average of Sobol' indices on each landscape unit weighted by local output variances. First- and total-order Sobol' indices can be notably computed this way. Their computation can be made in a second step after performing local Sobol' analysis on each landscape unit, but a direct estimator is also proposed in Gamboa et al. (2013) avoiding numerous local analysis in the case of high-dimensional model output. For HSIC and RF sensitivity indices, the definitions for scalar output remain valid for vectorial output. Catchment-scale indices can thus be directly computed on Y when moving to a multidimensional case.
3.1 Screening
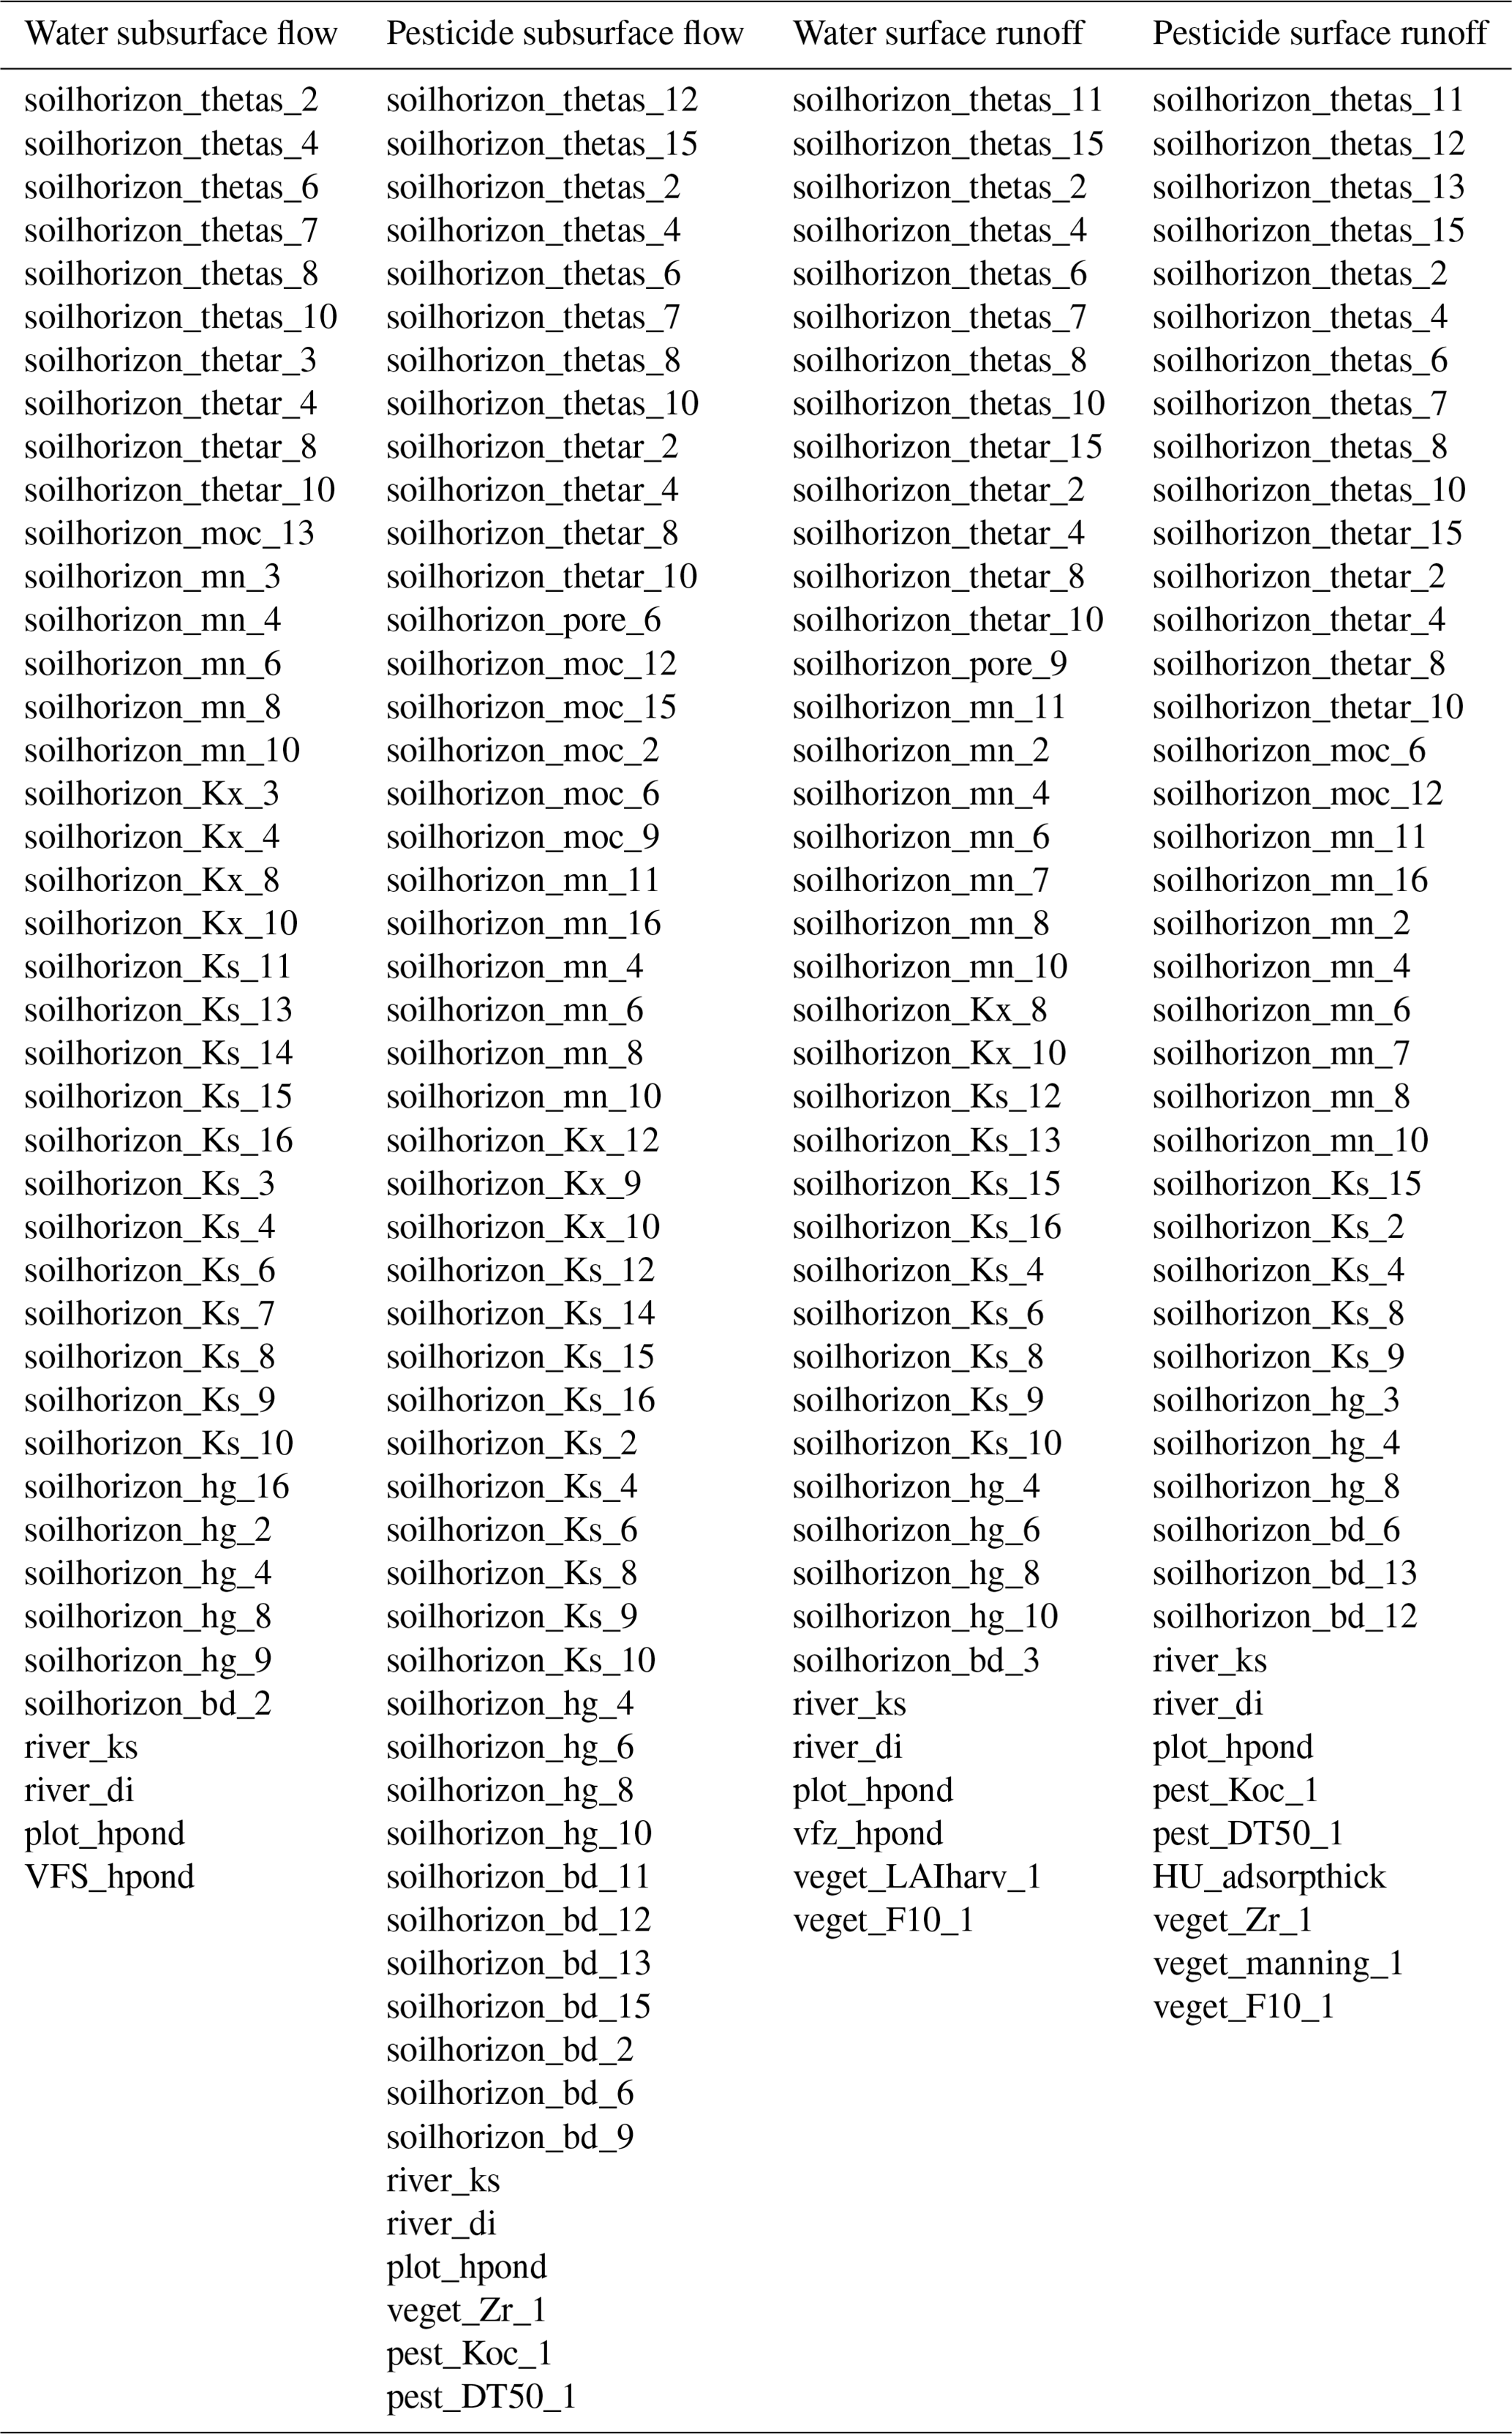
Screening is performed on the 4000-point LHS. Simulations are run on the HIICS cluster (26 nodes, 692 cores, 64 to 256 GO of RAM per server) available at INRAE, France, for a simulation time of 12 000 CPU hours. Screening is performed at a site scale, on each HU individually, to remain as conservative as possible. Influential parameters at the catchment scale are then deduced from the union of influential parameters for each site. After screening and union, 42 influential parameters are selected for water subsurface flow, 54 parameters are selected for pesticide subsurface flow, 43 parameters are selected for water surface runoff, and 45 parameters are retained for pesticide surface runoff. The remaining parameters are given in Appendix C1.
3.2 Ranking on a single HU
For the ranking task, the three methods (Sobol' indices from PCE, HSIC and RF) are applied on each HU based on a 2000-point LHS generated for each scrutinized variable from the set of screened input parameters. Again, simulations are performed on the HIICS cluster, for a simulation time of 6000 CPU hours per variable. Columns 1 and 2 in Fig. 6 show Sobol' total- and first-order indices, while columns 3 and 4 show HSIC and RF sensitivity indices for the most influential parameters according to Sobol' total-order indices for the four variables on HU14.
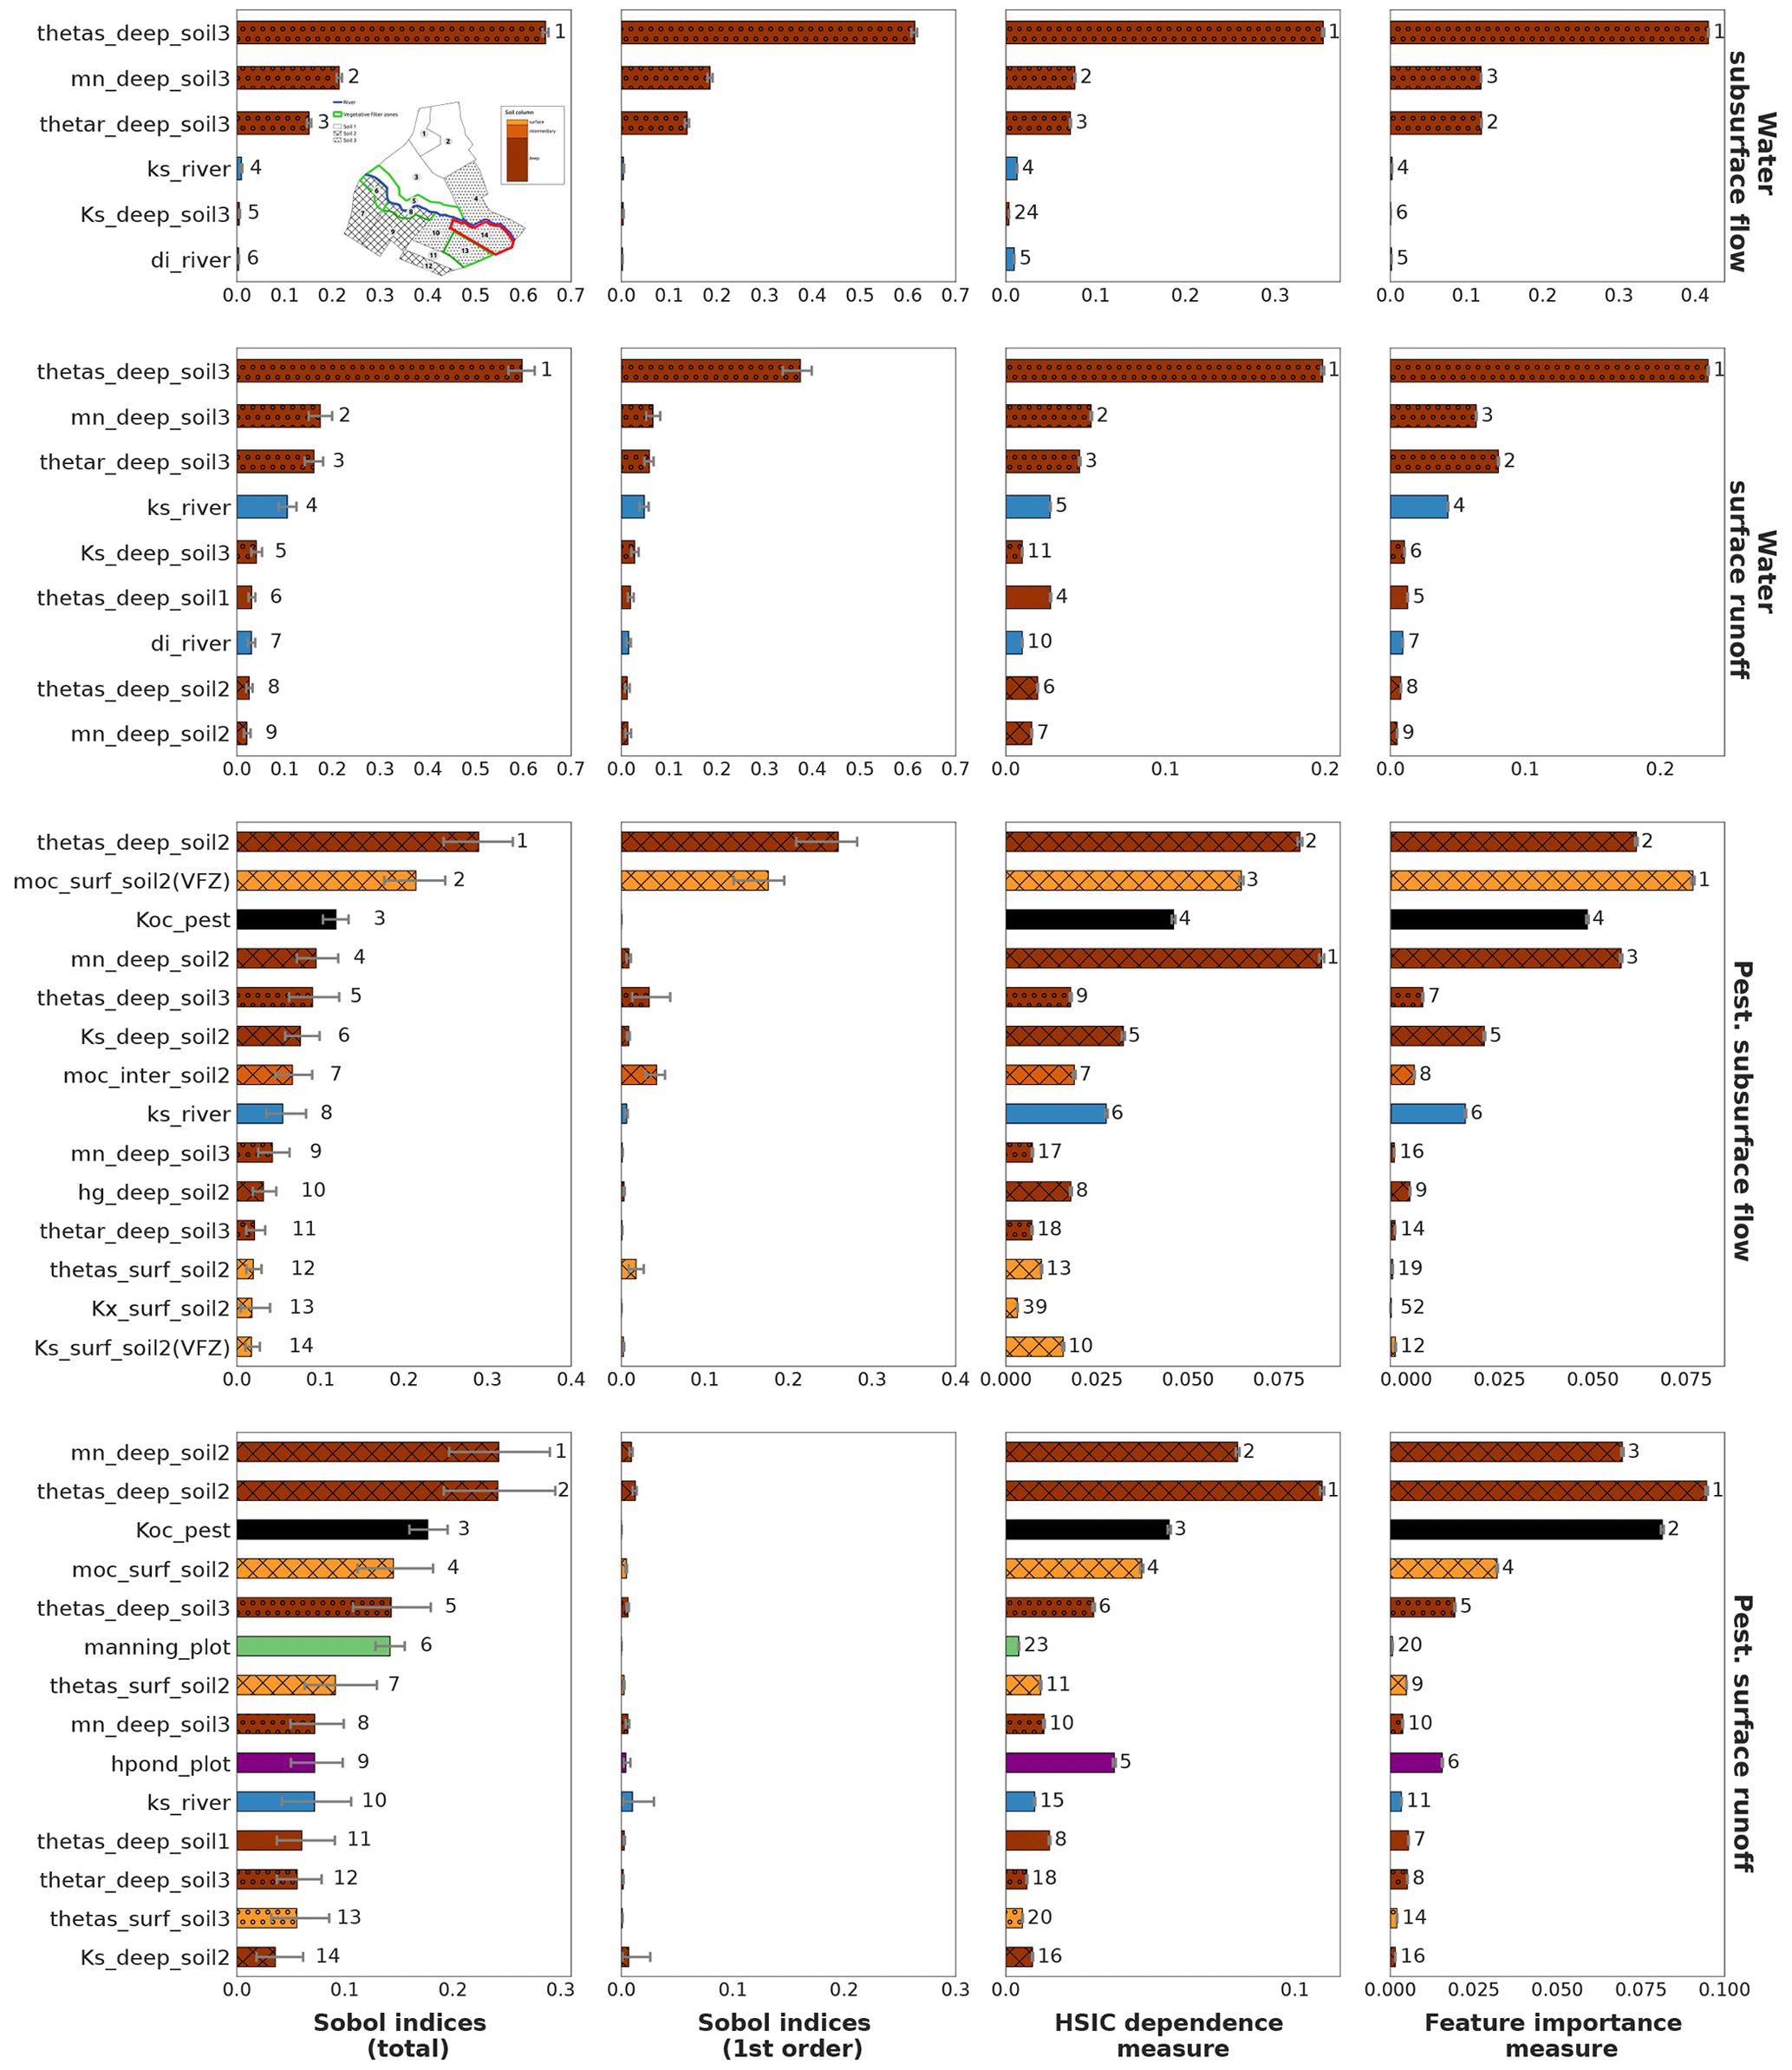
Figure 6Sobol' total- and first-order indices computed using PCE, HSIC and RF site sensitivity indices for all output variables on HU14 with associated 95 % confidence intervals. RF feature importance measures are normalized by 2Var[Y] following Eq. (13). HU14 is displayed with a red contour in the top left figure. For all methods, displayed parameters are the most influential parameters regarding Sobol' total-order indices. The bar colours are related to physical processes: brown is related to soil parameters, and the darker the brown, the deeper the parameter; blue is related to river parameters, whereas green is related to vegetation parameters. The filling in of brown bars refers to the soil type of the parameter: soil 1 is not filled, and soil 2 is cross-hatched, whereas soil 3 is filled with circles. For each method, numbers next to bars stand for the ranking position of parameters.
3.2.1 Physical interpretation
Considering Sobol' indices, influential parameters that are identified highly differ from one output variable to the other. They are linked to distinct physical processes that may interact with the other ones. This way, sensitivity analysis brings knowledge about the way PESHMELBA represents the hydrological functioning of the virtual catchment. Water subsurface flow (top line) is driven by deep soil hydrodynamic parameters both related to vertical infiltration and subsurface saturated transfers. Water surface runoff (line 2) is also mainly influenced by deep soil parameters. Overland flow is therefore identified as being mostly due to saturation rather than to rainfall excess. Subsurface exchanges with the river are also identified as an influential process as the river bed saturated conductivity (Ks_river) is part of the most influential parameters. Such a finding is consistent with the position of HU14, which is directly connected to the river but also to many plots (see Fig. 1). Pesticide variables (line 3 and 4) are influenced by a higher diversity of parameters that characterize contrasted and interactive physical processes. Indeed, both pesticide subsurface flow and surface runoff are mostly influenced by deep soil parameters such as the saturated water content (thetas). Parameters linked to pesticide adsorption such as the pesticide adsorption coefficient and the organic carbon content (moc) of surface and intermediary soil horizons also rank among the top influential parameters. Additionally, the roughness coefficient (manning_plot) and the ponding height (hpond_plot) that are related to surface runoff calculation are also ranked as highly influential on pesticide surface runoff.
3.2.2 Comparison of methods
The rankings that are provided by the three methods are broadly consistent giving confidence in their robustness. Looking in more detail, HSIC and RF indices are more similar to Sobol' total-order indices than to Sobol' first-order indices, contrary to the conclusions of De Lozzo and Marrel (2016) on comparison of Sobol' and HSIC indices. The most influential parameters that are identified by Sobol' total-order indices are also captured by the other methods. Indeed, the different rankings show that the top-10 rankings based on Sobol' total-order indices contain at least the five most influential parameters based on HSIC and RF rankings. Then, Fig. 6 does not miss any preponderant parameters for the HSIC and RFs. In addition, while rankings from the three methods only exhibit slight differences for water variables, differences between rankings are more pronounced for pesticide variables. In that case, most parameters have zero or very low first-order Sobol' indices, characterizing nearly purely interacting effects. However, not all differences between rankings come from interactive effects. As an example, manning_plot and hpond_plot that appear in the pesticide surface runoff top-10 ranking according to Sobol' indices are both characterized by nearly fully interactive effects. However, hpond_plot is also ranked as influential according to the HSIC and RFs, while manning_plot is missed by both of them.
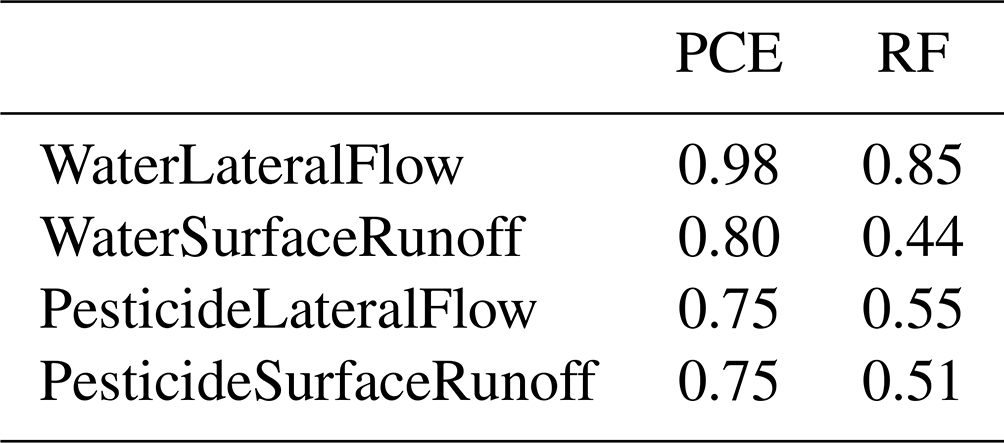
Regarding error bounds, they are very small for the HSIC and RFs, contrary to Sobol' indices estimates. The HSIC is expected to be very accurate from very small sample sizes (Da Veiga et al., 2021), which may explain such differences of magnitude for error of Sobol' and HSIC indices. Regarding RF error bounds, we incriminate the resampling strategies that differ from the Sobol' method. Indeed, while the bootstrap technique has been proven to assess the quality of the PCE (Marelli and Sudret, 2018), the subsampling technique set on RF only targets the precision of feature importance measures. A more adapted subsampling approach, for example, based on Ishwaran and Lu (2019) should probably be further investigated on bigger samples to better compute RF sensitivity indices and to accurately assess their quality. In addition to Fig. 6, Table 4 gathers the quality scores Q2 for PCE and RF metamodels on the test set. Results show that the RF metamodel performs much more poorly than the PCE for all variables. Such poor performances may explain the discrepancies between RF feature importance measures and Sobol' total-order indices. Indeed, RF feature importance indices have been proven to relate to Sobol' total-order indices (Gregorutti et al., 2017), but this relation (see Eq. 13) is not respected in this study. These results thus underline how crucial it is to analyse both the quality of the metamodel and the quality of the indices it calculates and not just one of the two.
Table 4Q2 score for all variables on HU14 calculated from the 200-point test set. The Q2 score is calculated as , where is the empirical mean of the sample.
3.2.3 Convergence rate
In order to assess each method convergence rate, sensitivity indices are calculated for growing sample sizes, from 50 to 2000 points. Results for water surface runoff and pesticide surface runoff are presented respectively in Figs. 7 and 8. Results for water (i.e. pesticide) subsurface flow are not presented as they come to the same conclusions as for water (i.e. pesticide) surface runoff.
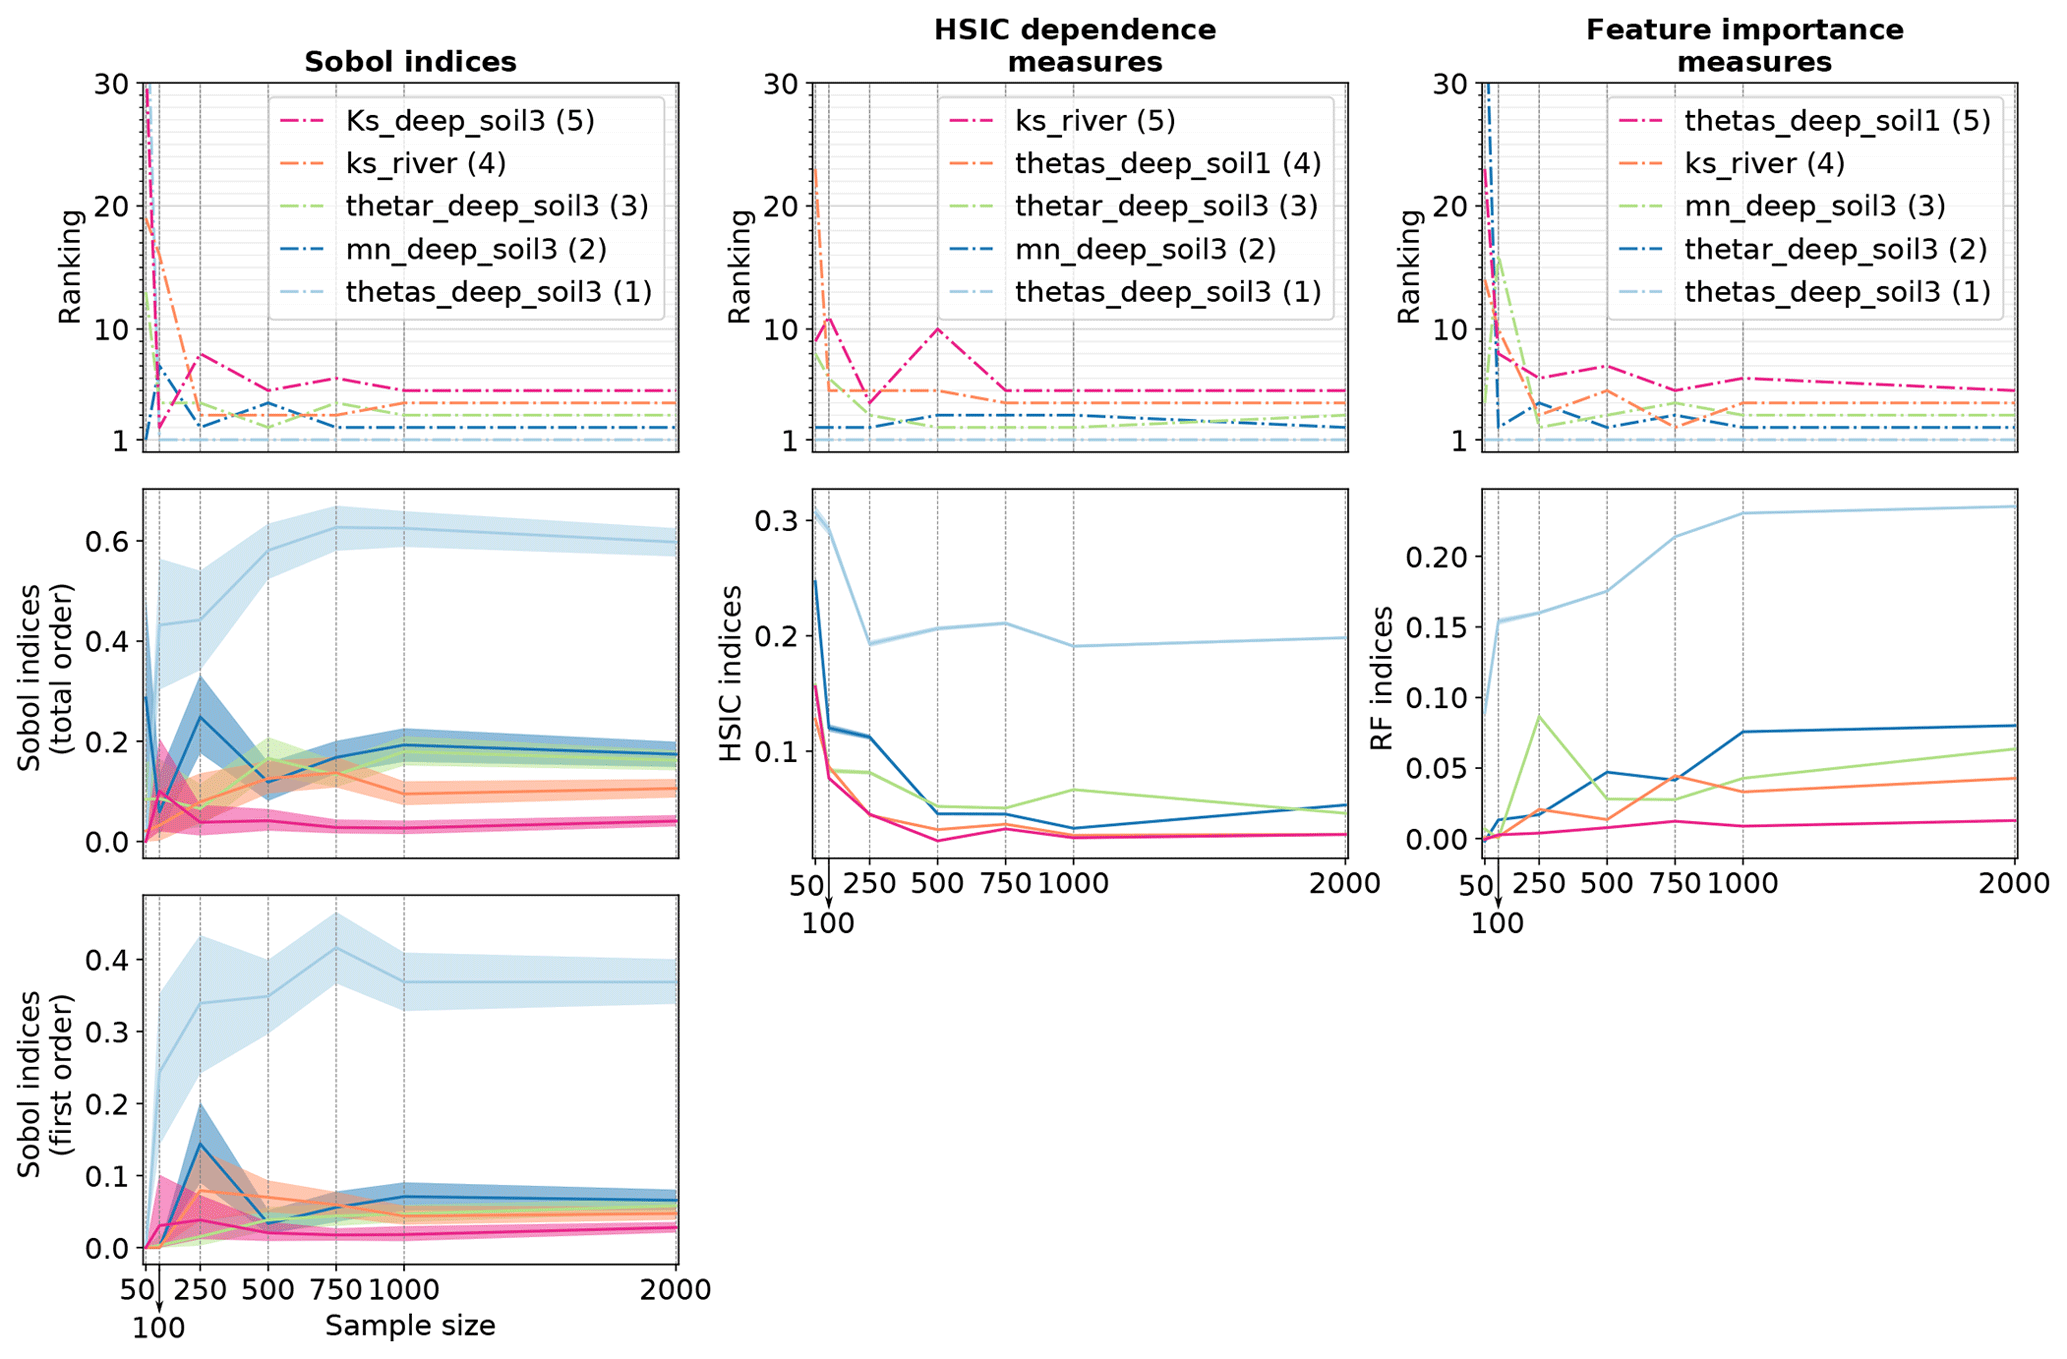
Figure 7Convergence plot for solute water runoff variable: the figure shows the ranking for the five most influential parameters identified with a sample of 2000 points as well as the corresponding sensitivity indices' values with associated 95 % confidence intervals for growing sample sizes (even if they are hardly visible for the HSIC and RFs, confidence intervals are displayed on all plots from line 2). In the legend, the number in brackets is the ranking position of the parameter in the case of a sample of 2000 points.
Figure 7 shows that Sobol' indices are close from stability for sample sizes from 1000 points as ranking and Sobol' total- and first-order indices are rather stable. The 95 % confidence intervals associated with Sobol' indices (first- and total-order) also seem to be rather stable for sample sizes from 1000 points. Considering HSIC and RF indices, ranking differences for the five most sensitive input factors are less than one position for sample sizes from 1000 points, which roughly suits the convergence criteria for parameter ranking defined in Sarrazin et al. (2016). Identically, for both methods, sensitivity indices' values and 95 % confidence intervals show little variability. As already noticed in Fig. 6, the 95 % confidence intervals for the HSIC and RFs are much smaller than for PCE. Again, such results should be interpreted with caution as confidence intervals are not calculated in the same way as for the different methods. On the whole, the HSIC method reaches convergence first as ranking and sensitivity indices' values stabilize for sample sizes from 750, while 1000 points are necessary for Sobol' and RF methods.
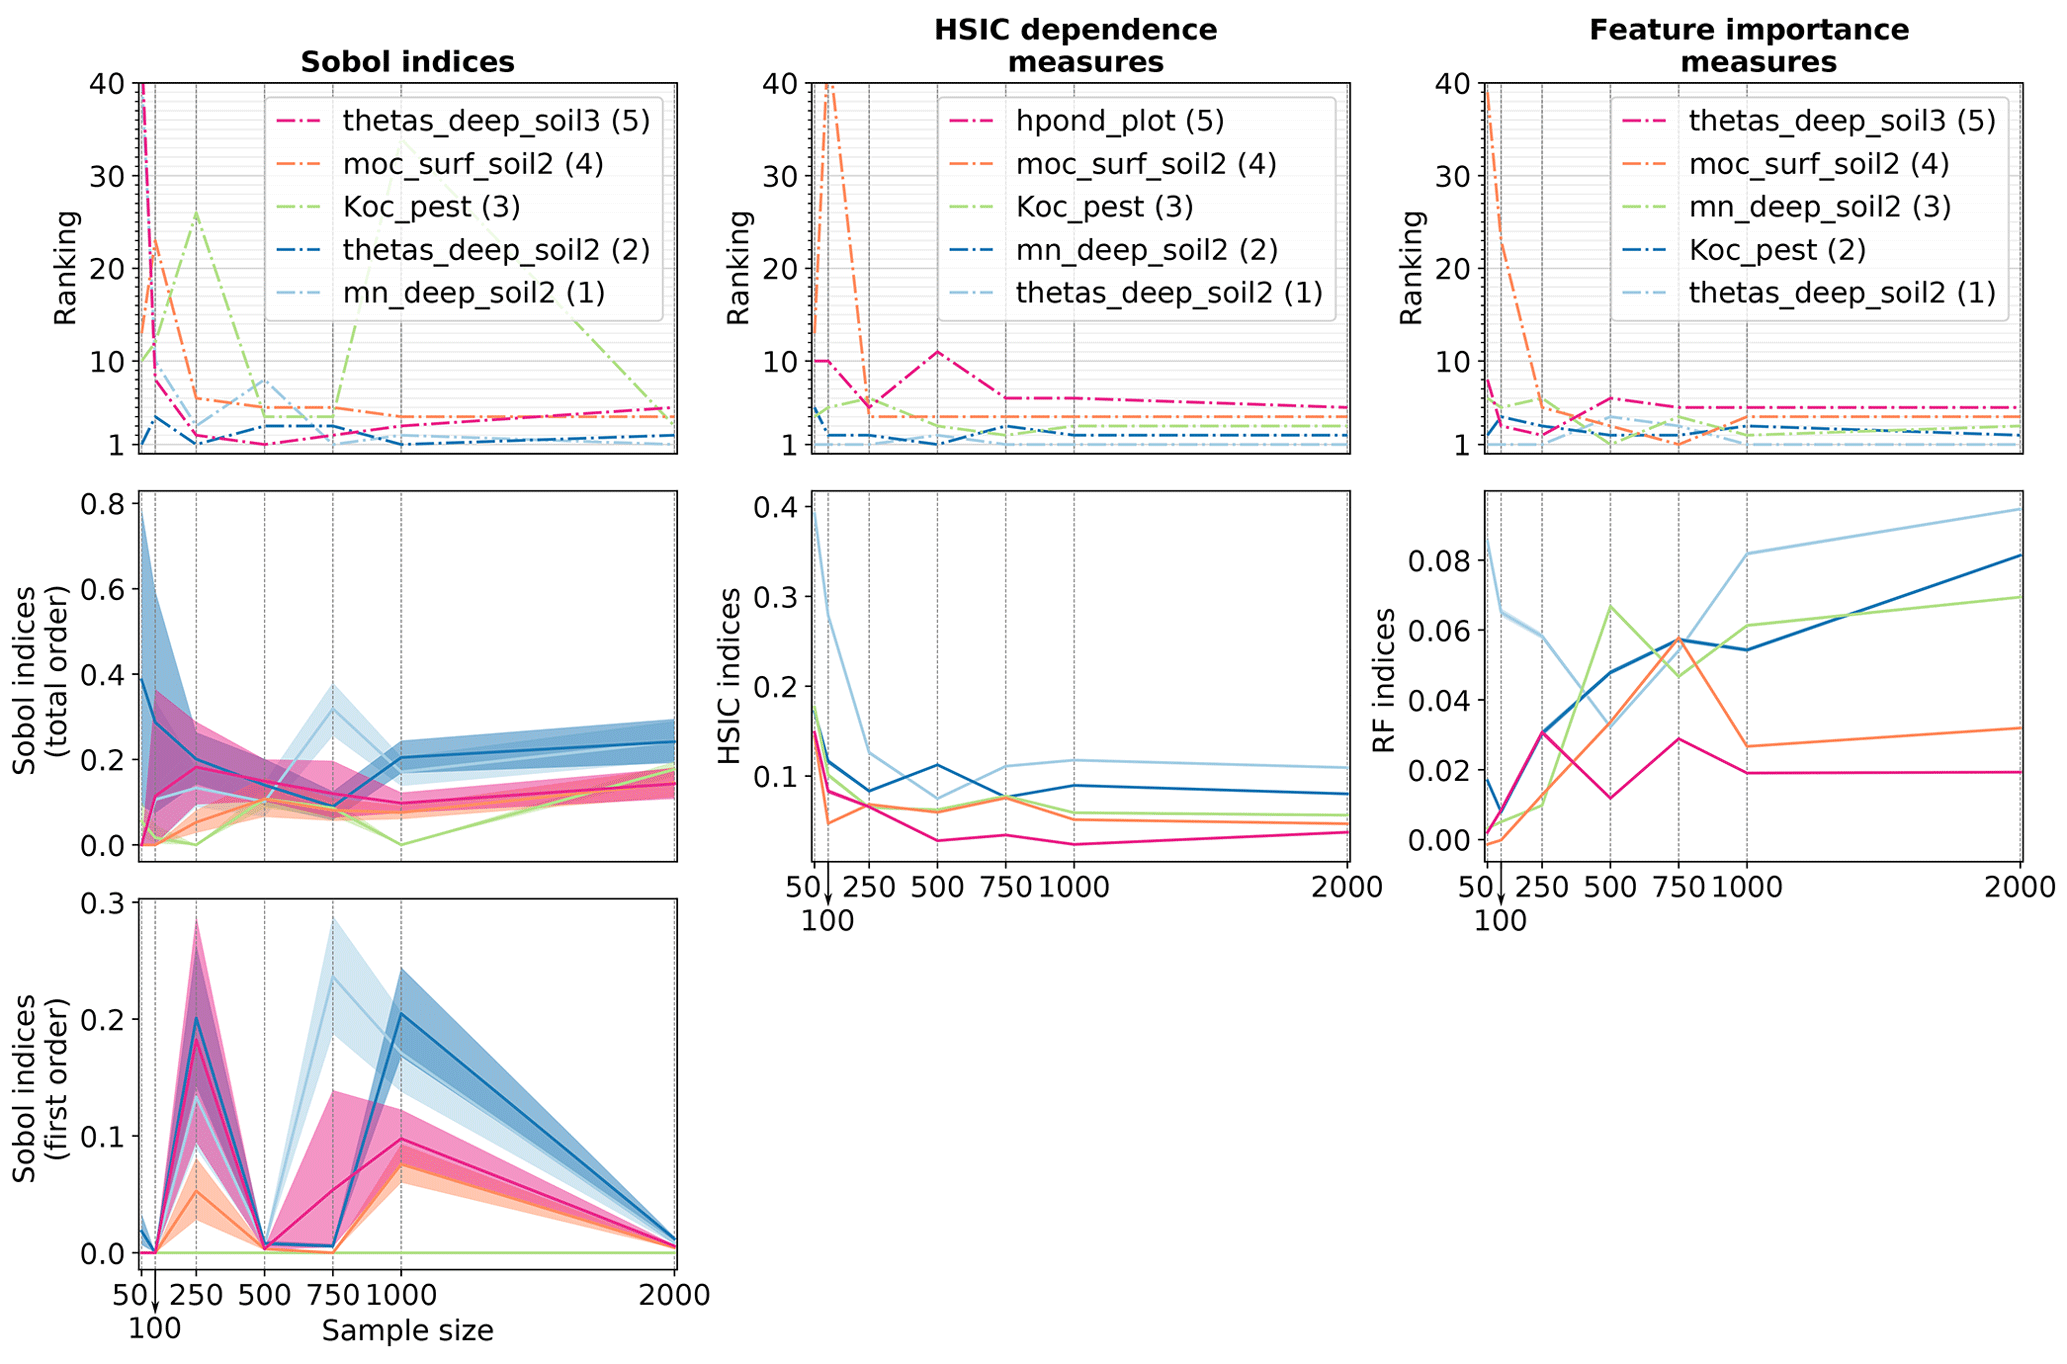
Figure 8Convergence plot for solute surface runoff variable: the figure shows the ranking for the five most influential parameters identified with a sample of 2000 points as well as the corresponding sensitivity indices' values with associated 95 % confidence intervals for growing sample sizes (even if they are hardly visible for the HSIC and RFs, confidence intervals are displayed on all plots from line 2). In the legend, the number in brackets is the ranking position of the parameter in the case of a sample of 2000 points.
Results about pesticide surface runoff (Fig. 8) are more contrasted. Ranking and sensitivity indices' values from PCE show more variability than for water variables. This is especially the case for first-order Sobol' indices, which shows that 2000 may not be a sufficient sample size to get robust results. Ranking and total-order indices are more stable, except for the parameter Koc_pest. This parameter is characterized by fully interactive effects, which may explain why calculating robust Sobol' indices is a more complex task. Ranking and sensitivity measures from the HSIC stabilize from 750 points, while the error bounds remain very limited for all sample sizes. Finally, RF ranking and indices are almost stable from 1000 points, except for Koc_pest, whose RF value still shows variability for the biggest sample sizes.
3.3 Landscape analysis
In this section, we focus on Sobol' indices (first- and total-order) despite larger error bounds as it is the only method used in this study that allows us to get separate information on interactive effects. Site rankings such as those presented in Fig. 6 are gathered for all HUs in the form of sensitivity maps in Fig. 9 for water surface runoff and in Fig. 10 for pesticide surface runoff. Broadly speaking, both maps show strong spatial heterogeneities regarding influential parameters, and a contrasted behaviour between right and left banks can be identified. For both output variables, hydrodynamic parameters (thetas, thetar and mn) of deep horizon from soil 1 (i.e. 2 and 3) are mainly influential only on HUs characterized by soil 1 (i.e. 2 and 3) (see Fig. 2 for a reminder of soil types). The local hydrodynamic parameters are found to be dominating, explaining the output variable variance. A particular case is HU4 (indicated by an array on both Figs. 9 and 10), which is characterized by soil 3, while parameters from soil 1 explained most of the variance of both water and pesticide surface runoff variables. The location of HU4, near the outlet, downstream several soil-1 HUs, may explain such spatial interactions. In addition to specific soil parameters, other parameters such as Manning's roughness on vineyard plots (manning_plot) or the coefficient of adsorption (Koc_pest) have a greater influence on HUs from the right bank (bottom part of the catchment in the figure). In addition, comparison of first-order and total-order maps shows quite similar results for water surface runoff on the one hand. It indicates that direct effects are significant for all influential parameters. On the other hand, direct effects are far from dominant on pesticide surface runoff. Once again, most parameters are influential nearly only in interaction with other parameters since the first-order indices are very low compared to the total-order indices.
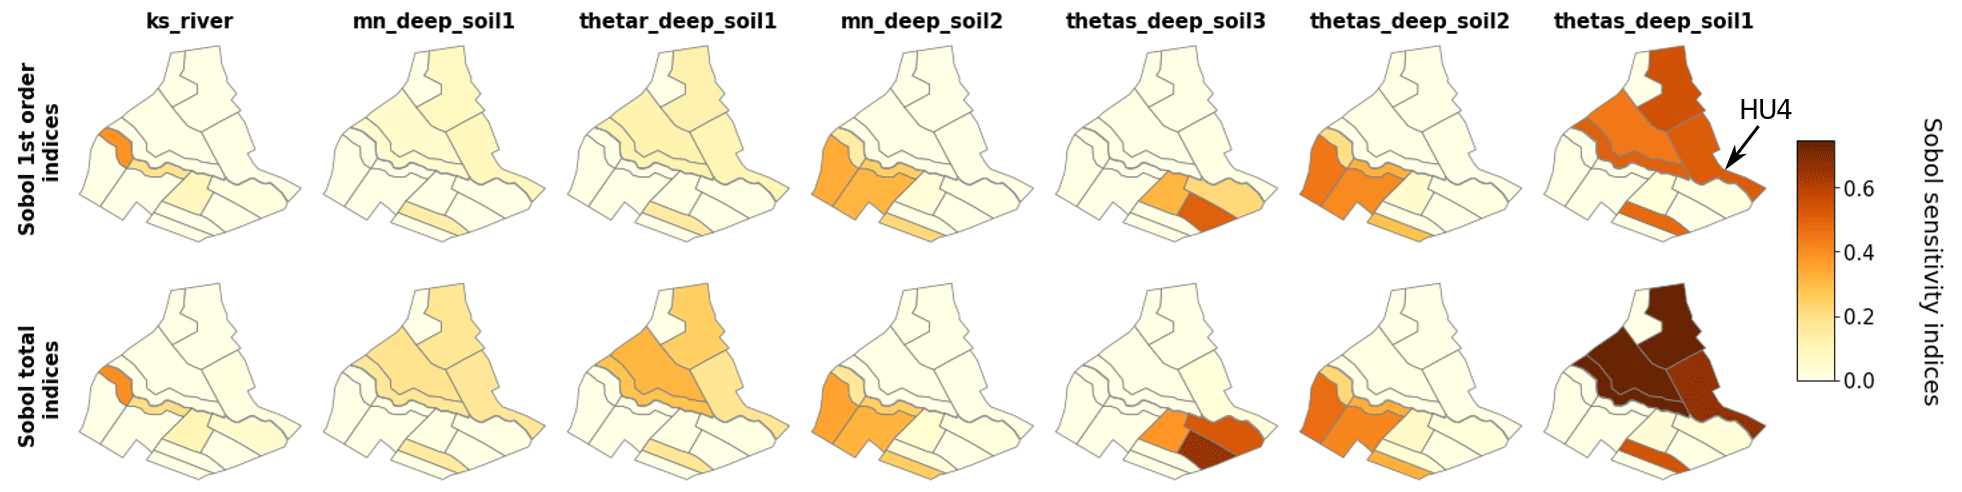
Figure 9Maps of Sobol' site sensitivity indices for water surface runoff for the most significantly influential parameters.
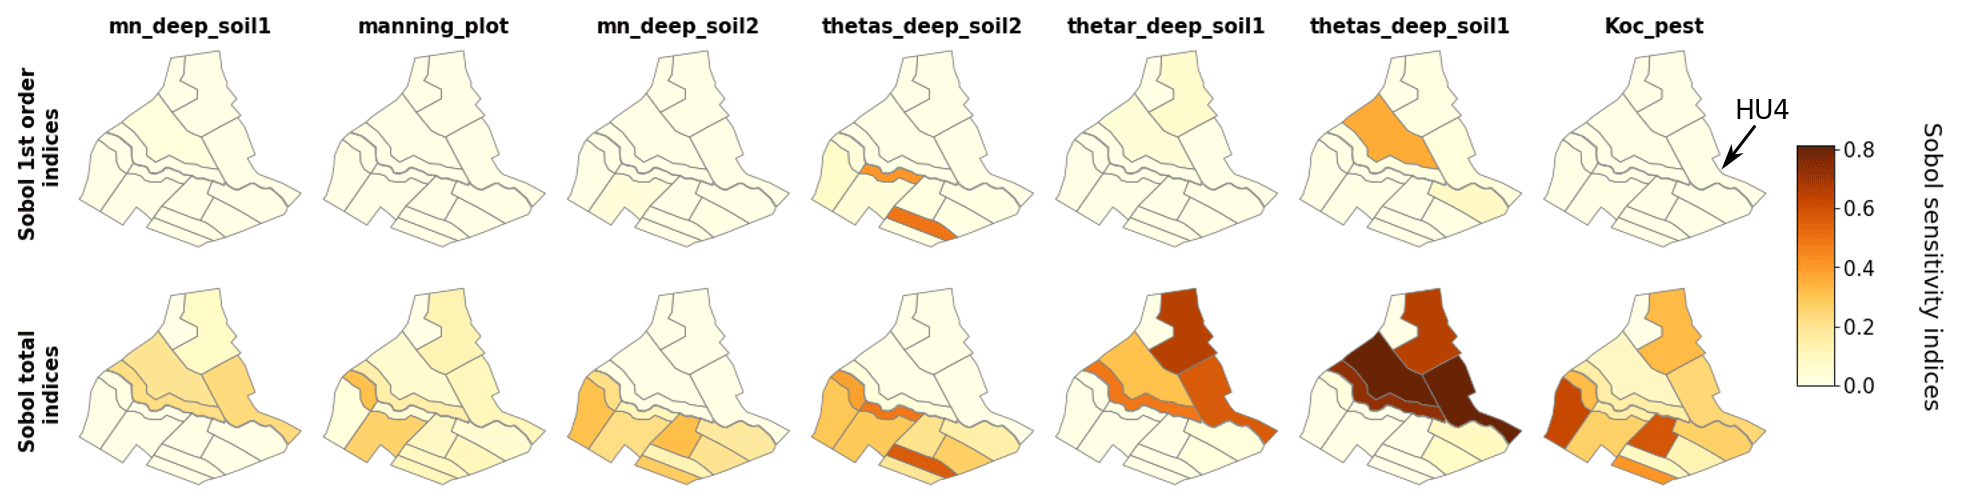
Figure 10Maps of Sobol' site sensitivity indices for pesticide surface runoff for the most significantly influential parameters.
Finally, Fig. 11 shows aggregated sensitivity indices for water and pesticide surface runoff variables following Gamboa et al. (2013). Since the two banks have contrasted behaviours, aggregated indices are first calculated at the intermediary scale of the bank, then at the catchment scale. For both output variables, rankings strongly differ on each slope. As proposed at a local scale in Sect. 3.2, aggregated indices at this scale may constitute summarized information about the physical processes dominating in PESHMELBA to explain the output variable. For water surface runoff, hydrodynamic soil parameters related to vertical infiltration (thetas, thetar and mn) dominate. The influence of Ks_river is only significant in the right bank. The difference of altitude between the right and left bank may explain this contrast in the activation of saturated exchanges between water tables and the river. For pesticide surface runoff, deep horizon parameters from soil 1 and the pesticide adsorption coefficient (Koc) explain a major portion of the output variance on the left bank, while pesticide half-life time (DT50) and surface runoff parameter (hpond_plot) have lower or no impact. Conversely, surface parameters (manning_plot and hpond_plot) have a higher impact on the right slope. In that bank, soil horizons are characterized by lower permeabilities that may result in stronger surface runoff generation than on left bank. In addition, pesticide parameters (Koc and DT50) are also more influential. More broadly, these results show that pesticide surface runoff may result from the activation and interactions of more physical processes on the right bank than on the left bank.
4.1 On screening
For all variables considered, the number of input parameters retained after screening remained quite high, proving that performing screening on PESHMELBA variables is a challenging task. We can first incriminate the many physical processes interacting in PESHMELBA in a spatially distributed way, each of them with its own set of characteristic parameters. However, it can also be explained by the methodology that may not be discriminating enough. Many previous studies developed efficient screening techniques for complex environmental models (e.g. Tang et al., 2007; Nossent et al., 2011; Touzani and Busby, 2014; Becker et al., 2018; Garcia et al., 2019; Sheikholeslami et al., 2019). Exploring other screening approaches is beyond the scope of this study, but future work may focus on applying and critically comparing these techniques, especially with very limited sample size (inferior to 2000 points for example).
4.2 On the choice of a ranking method
By exploring several methods for ranking, the aim was to analyse their specificities and the interest of each one for the sensitivity analysis of a complex environmental model, characterized by many parameters and a high computational cost such as PESHMELBA. Considering the results of this study, we believe that the choice of the method depends on the properties of the model, the objective of the sensitivity analysis and the sample size available:
-
The Sobol' method remains attractive when sensitivity analysis is used to gain knowledge about the model by finely analysing its behaviour. Indeed, Sobol' indices provide a clear interpretation of the calculated indices (percentages of variance explained) and explicit information about the interactions between parameters. These elements are particularly valuable when one wishes to use sensitivity analysis to understand the functioning of the model, and this is why this approach is still widely used in the hydrological community. In the case of variables that are reasonably complex and that are not characterized by too much interactions of physical processes (such as water variables in our case), using chaos polynomials to estimate Sobol' indices is particularly interesting and efficient since it allows the use of a pre-existing sample, of very limited size. Conclusions are much contrasted for complex variables such as pesticide variables as convergence results showed that 2000 points may not be enough to get fully robust Sobol' indices. This is particularly the case for parameters that are mainly characterized by interactive effects.
-
If the sensitivity analysis aims at simplifying the model or focusing the calibration efforts, if the physical interpretation of the results is not a priority and if one has a pre-existing sample of very limited size (inferior to 750 points in our case), the use of HSIC indices is a good option as it provides robust sensitivity indices. However, it is important to note that using the HSIC dependence measure for sensitivity analysis is a recent idea and that there is still little knowledge available about identifying and differentiating the types of dependency that are captured. In addition, the choice of the kernel may affect the ranking results because each specific kernel is likely to give more or less importance to the infinite number of dependency forms that are captured by the HSIC. The question of the choice of the kernel is delicate, and it is still not addressed very much in the literature. While a few papers propose to choose the type and parameterization of the kernels in a way that maximizes the possible dependence between Xi and Y (Fukumizu et al., 2008; Balasubramanian et al., 2013), the interpretation of the results seems to be less clear. On the other hand, there are still relatively few works that apply this method for GSA, and the limitations are not necessarily all identified yet. Using the HSIC for a classification exercise will therefore remain delicate as long as there is no consensus on the choice of the kernel and the interpretation of the results. However, these problems do not arise when using the HSIC for screening, and such a method is therefore perhaps to be preferred for this type of exercise.
-
The RF indices are also of interest in sensitivity analysis task as they are supposed to provide an estimator of total-order Sobol' indices. Those indices can thus be easily interpreted, and as for the other methods, they can be estimated from a pre-existing sample. However, PCE is still to be preferred since it provides more complete information including not only the total-order Sobol' indices but also the indices at all orders. In addition, our results showed that the metamodel constructed by RF is of lower quality than the one constructed by PCE at equivalent sample size, giving less confidence in the resulting sensitivity indices.
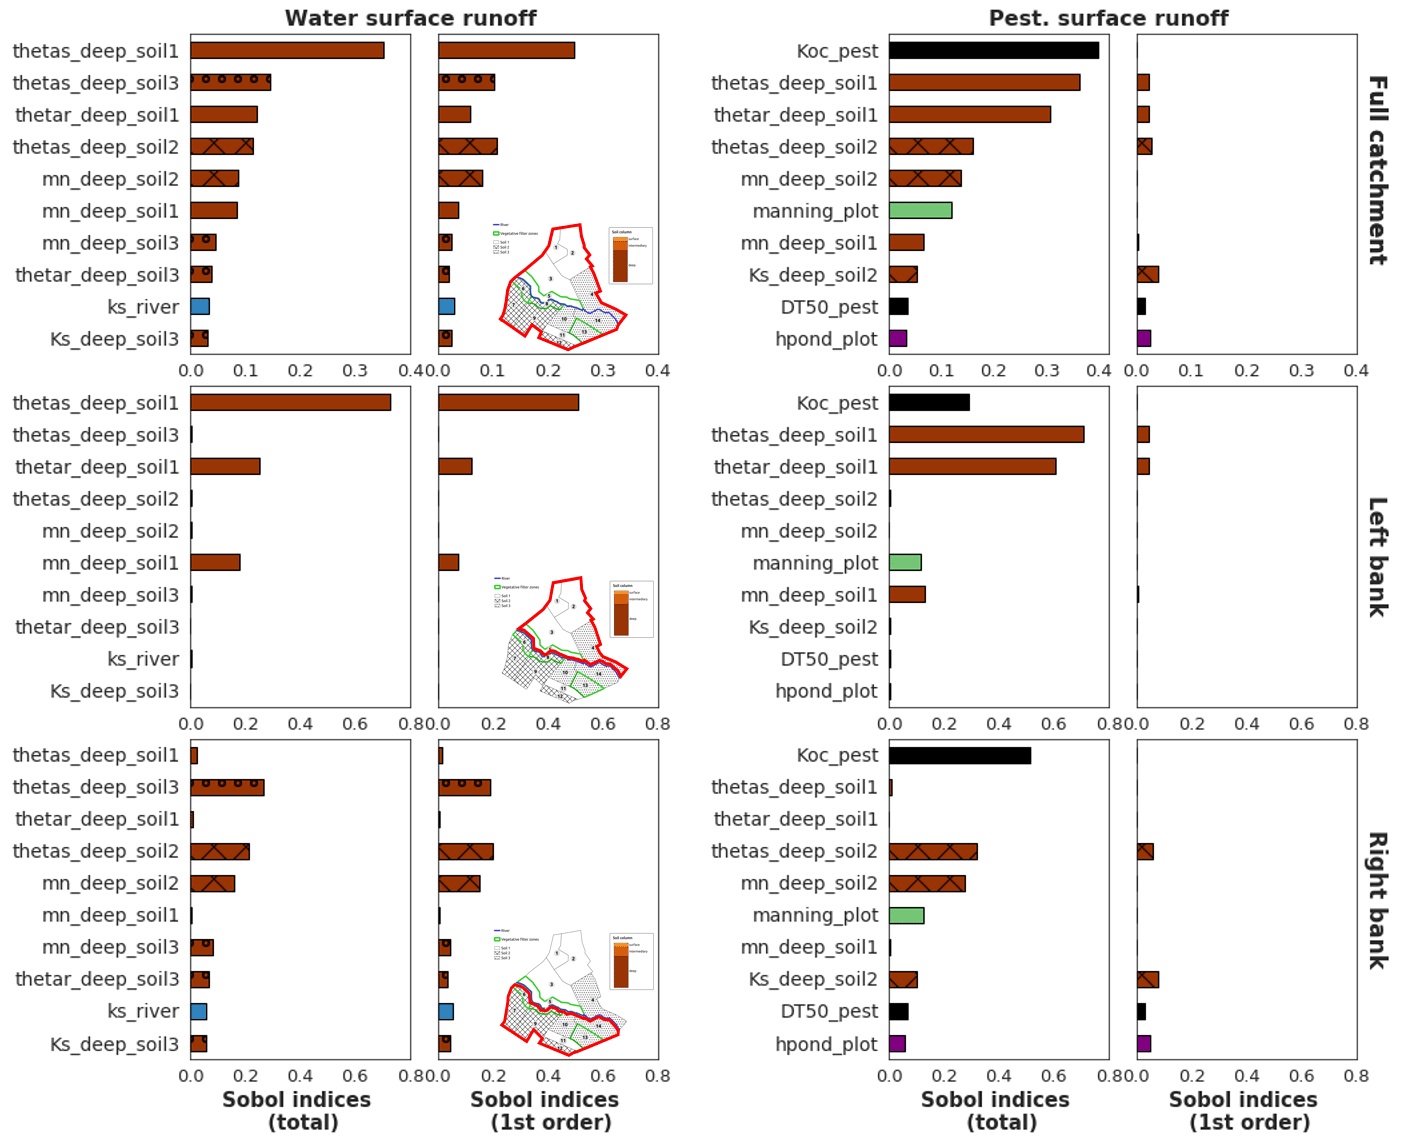
Figure 11Sobol' first-order and total-order aggregated sensitivity indices for water surface runoff (left) and pesticide surface runoff (right) calculated at the scale of the catchment (top), left bank (middle) and right bank (bottom). Displayed parameters are the 11 most influential parameters regarding Sobol' indices at the catchment scale for each output variable. The bar colours are related to physical processes: brown is related to soil parameters, and the darker the brown, the deeper the parameter is; blue is related to river parameters, and green is related to vegetation parameters. The filling in of brown bars refers to the soil type of the parameter: soil 1 is not filled, and soil 2 is cross-hatched, while soil 3 is filled with circles.
Beyond the comparison of the different methods, we also tried to evaluate if it was possible and useful to combine several of these methods. However, considering the results obtained, we believe that combining the tested methods is still of little interest for hydrologists to better understand the model functioning. Indeed, the differences we found in rankings remain difficult to interpret. This is particularly the case when combining Sobol' and HSIC indices, due to the fact that the results from the HSIC dependence measure remain fuzzy to interpret.
4.3 On choosing local or aggregated sensitivity analysis
Results about landscape analysis showed that, on the one hand, sensitivity maps provide local, detailed information about influential parameters on each location of the catchment. However they are computationally costly as one GSA per HU must be performed. This approach may be hard or even impossible to transpose to a real catchment scale composed of several hundred elements. On the other hand, catchment-scale aggregated indices provide synthetic information at a lower computational cost, but the spatialized aspect of the GSA is lost. As pointed out in Marrel et al. (2015), both approaches are complementary and provide precious knowledge about the model functioning, but they cannot always be performed together. As a compromise, we propose to use the scale of the bank, or more generally of the hillslope, as it may constitute an adapted intermediary scale to meet both requirements of detailed results for physical interpretation and computational efficiency. Indeed, in this study Sobol' aggregated indices were directly computed from site sensitivity indices as they were available, but a pick–freeze estimator (Gamboa et al., 2013; De Lozzo and Marrel, 2016) can be used for a direct computation of Sobol' generalized indices. In our case, such overview of sensitivity analysis allows us to focus calibration efforts on deep soil hydrodynamic parameters and pesticide adsorption coefficient to improve the quality of the simulation of both water and pesticide surface flows.
In this paper, we have described the first global sensitivity analysis of the modular and coupled PESHMELBA model. For this experiment, a simplified catchment was set in order to explore different approaches for GSA and to propose a methodology for future real applications. First, we performed screening using an independence test based on the HSIC dependence measure, dividing the dimension of the problem by 3. Second, we compared several innovative methods to compute sensitivity measures on each landscape element individually. Sobol' indices were found to be particularly attractive as they provide easy-to-interpret sensitivity measures. However, in the case of complex variables with dominant interactive effects, results showed that they may not be computed from very small samples. Third, we gathered such local sensitivity indices into sensitivity maps that highlighted local contributions of parameters. Finally, we computed aggregated indices at larger scales, on the whole catchment and on each bank hillslope since this scale still reflects spatial heterogeneities of hydrodynamic processes. This study constitutes the first attempt of global sensitivity analysis of the PESHMELBA model. Future research should go a step further by considering the other sources of uncertainties that can affect the model and interact with parameter uncertainties. The impact of forcings, soil types, quantities and dates of application of pesticides should be addressed as already done in Holvoet et al. (2005) for instance. Additionally, parameters were assumed to be independent in this study, but this assumption may be arguable, especially for hydrodynamic parameters. For the three methods, sensitivity indices that are produced are meaningless in the case of dependent inputs. Dealing with dependent parameters has already been explored in the case of Sobol' indices and the HSIC measure, for example, based on Shapley effects (Da Veiga et al., 2021), but again, these formulations should be extensively tested with complex variables and very small sample sizes. Finally, it would also be necessary to investigate sensitivity of some time series to get a more comprehensive vision of the model functioning. To do so, the temporal series can be analysed as a multivariate output for example with clustering-based GSA (Roux et al., 2021) or using the principal components of the model’s functional outputs. The definition and the use of adequate hydrological signatures such as proposed in Branger and McMillan (2020) and Horner (2020) may also be of interest to understand space–time variability and to capture a broader range of physical processes. Global sensitivity analysis is a necessary but not yet systematic step to model evaluation, especially in the case of spatialized, risk assessment models that can be complex to deal with. This study brings additional knowledge on GSA strategies for modellers who deal with such complex models and thus paves the way for systematic analysis of environmental exposure models.
Table A1Top: parameters and associated dates used to describe LAI evolution for vineyard cover. Bottom: constant LAI value set on grassland cover.
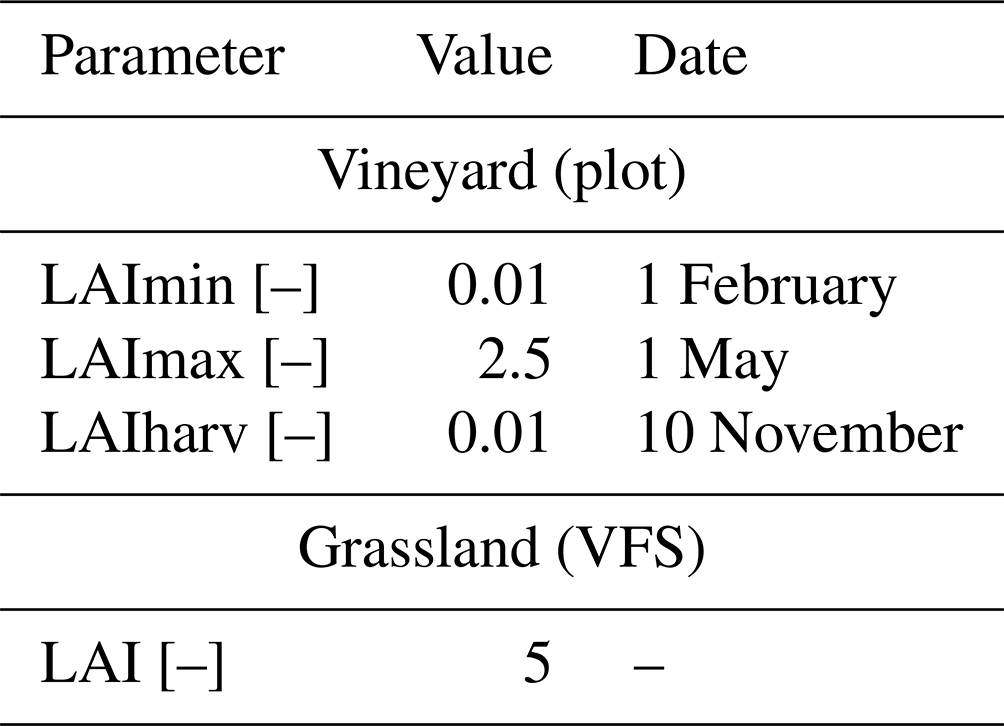
Table B1Distribution and statistics of the assigned probability density functions (pdfs) for the 145 input parameters, uniform: U(min,max), triangular: T(min,mean,max), normal: N(mean,standard deviation), lognormal: LN(mean,standard deviation) and truncated normal: TN(mean, standard deviation, min,max).
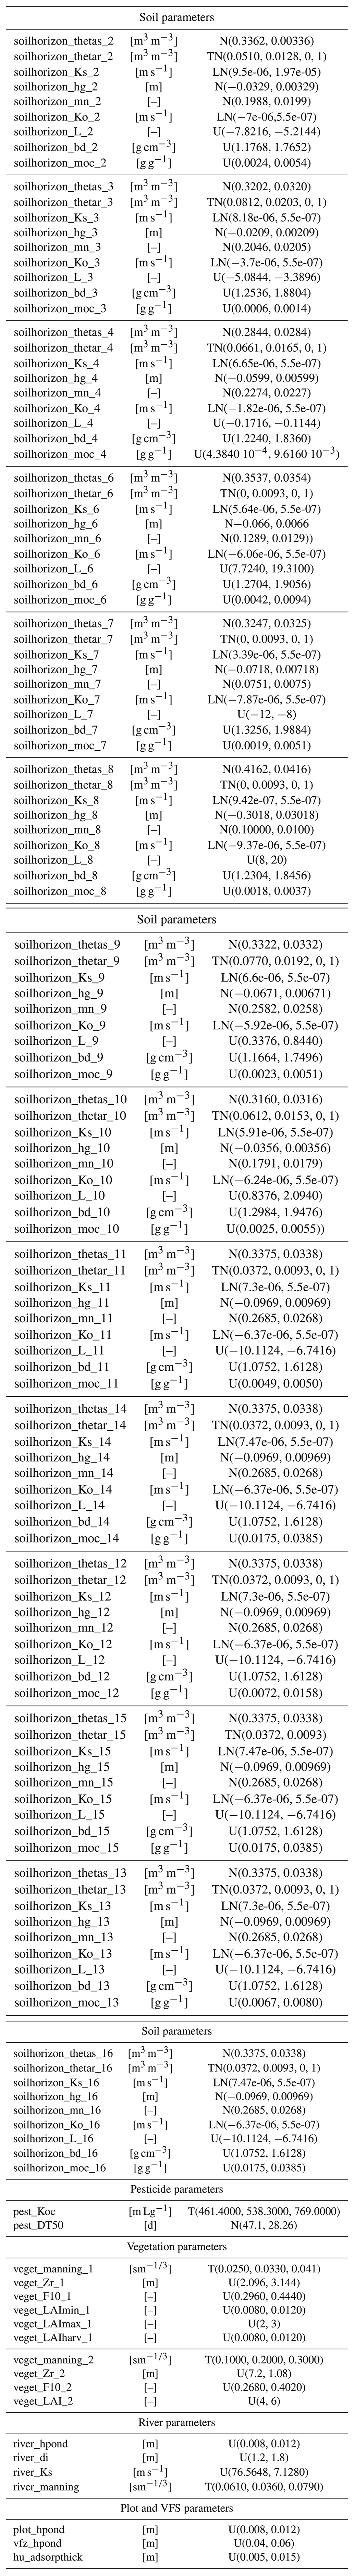
Table C1Remaining parameters after the screening step for each output variable. In the XXX_XXX_XXX syntax of parameter names, the first block is the type of element the parameter refers to (soil horizon, river, vegetation, pesticide, HU or VFS), and the second part is the parameter name, while the last part is the element index the parameter refers to (soil horizon or vegetation type).
The PESHMELBA model is an open-source model coded in Python (Version 2.7.17) and Fortran 90 and embedded in the OpenPALM coupler (Version 4.3.0). The code for the OpenPALM coupler is available from http://www.cerfacs.fr/globc/PALM_WEB/user.html#download (Fouilloux and Piacentini, 1999) after registration. The exact version of PESHMELBA used to produce the simulations is archived on Zenodo (https://doi.org/10.15454/2HAU8R, Rouzies et al., 2022a) as are input data and scripts used to produce all the sensitivity indices presented in this paper (https://doi.org/10.15454/2YVY4O, Rouzies et al., 2022b). These scripts use the open-source MATLAB software for uncertainty quantification UQLab Version 2.0.0 (https://www.uqlab.com, Marelli and Sudret, 2014). The R package randomForestSRC is freely available for download at https://cran.r-project.org (R Core Team, 2017).
All authors contributed to writing the text and to all stages of editing. PCE computation was performed by BS and ER, whereas HSIC and RF indices' computation was led by ER, with extensive support from CL and AV.
The contact author has declared that none of the authors has any competing interests.
Publisher’s note: Copernicus Publications remains neutral with regard to jurisdictional claims in published maps and institutional affiliations.
The authors kindly acknowledge Jérémy Verrier for his support on HIICS cluster usage, Stefano Marelli for his support on UQlab and PCE usage for GSA, Bertrand Ioss for his advice on the computation of RF feature importance measures, and Julien Pelamatti for his help on interpreting HSIC results.
This paper was edited by Charles Onyutha and reviewed by Fanny Sarrazin, Heng Dai, Razi Sheikholeslami, and one anonymous referee.
Alipour, A., Jafarzadegan, K., and Moradkhani, H.: Global sensitivity analysis in hydrodynamic modeling and flood inundation mapping, 152, 105398, https://doi.org/10.1016/j.envsoft.2022.105398, 2022. a
Alletto, L., Pot, V., Giuliano, S., Costes, M., Perdrieux, F., and Justes, E.: Temporal variation in soil physical properties improves the water dynamics modeling in a conventionally-tilled soil, Geoderma, 243–244, 18–28, https://doi.org/10.1016/j.geoderma.2014.12.006, 2015. a, b
Antoniadis, A., Lambert-Lacroix, S., and Poggi, J.-M.: Random forests for global sensitivity analysis: A selective review, Reliab. Eng. Syst. Safe., 206, 107312, https://doi.org/10.1016/j.ress.2020.107312, 2021. a
Arcement, G. and Schneider, V.: Guide for selecting Manning's roughness coefficients for natural channels and flood plains, Tech. rep., U.S. G.P.O, 1989. a, b
Archer, G. E. B., Saltelli, A., and Sobol, I. M.: Sensitivity measures, ANOVA-like Techniques and the use of bootstrap, J. Stat. Comput. Sim., 58, 99–120, https://doi.org/10.1080/00949659708811825, 1997. a
Aulia, A., Jeong, D., Mohd Saaid, I., Kania, D., Taleb Shuker, M., and El-Khatib, N. A.: A Random Forests-based sensitivity analysis framework for assisted history matching, J. Petrol. Sci. Eng., 181, 106237, https://doi.org/10.1016/j.petrol.2019.106237, 2019. a
Balasubramanian, K., Sriperumbudur, B. K., and Lebanon, G.: Ultrahigh Dimensional Feature Screening via RKHS Embeddings, International Conference on Artificial Intelligence and Statistics, 2013. a
Becker, W. E., Tarantola, S., and Deman, G.: Sensitivity analysis approaches to high-dimensional screening problems at low sample size, J. Stat. Comput. Sim., 88, 2089–2110, https://doi.org/10.1080/00949655.2018.1450876, 2018. a
Bénard, C., Da Veiga, S., and Scornet, E.: Mean decrease accuracy for random forests: inconsistency, and a practical solution via the Sobol-MDA, Biometrika, 109, 881–900, https://doi.org/10.1093/biomet/asac017, 2022. a, b
Blatman, G. and Sudret, B.: Adaptive sparse polynomial chaos expansion based on least angle regression, J. Comput. Phys., 230, 2345–2367, https://doi.org/10.1016/j.jcp.2010.12.021, 2011. a, b
Branger, F. and McMillan, H. K.: Deriving hydrological signatures from soil moisture data, Hydrol. Process., 34, 1410–1427, https://doi.org/10.1002/hyp.13645, 2020. a
Branger, F., Braud, I., Debionne, S., Viallet, P., Dehotin, J., Henine, H., Nedelec, Y., and Anquetin, S.: Towards multi-scale integrated hydrological models using the LIQUID® framework. Overview of the concepts and first application examples, Environ. Modell. Softw., 25, 1672–1681, https://doi.org/10.1016/j.envsoft.2010.06.005, 2010. a
Breiman, L.: Bagging predictors, Mach. Learn., 24, 123–140, 1996. a
Breiman, L.: Random forests, Mach. Learn., 45, 5–32, 2001. a, b, c
Brown, C., Alix, A., Alonso-Prados, J.-L., Auteri, D., Gril, J.-J., Hiederer, R., Holmes, C., Huber, A., de Jong, F., M. Liess, S., Loutseti, Mackay, N., Maier, W.-M., Maund, S., Pais, C., Reinert, W., Russell, M., Schad, T., Stadler, R., Streloke, M., Styczen, M., and van de Zande, J.: Landscape and mitigation factors in aquatic risk assessment. Volume 2: detailed technic, Tech. rep., European Commission, SANCO/10422/2005 v2.0, 2007. a, b, c
Buis, S., Piacentini, A., and Déclat, D.: PALM: a computational framework for assembling high-performance computing applications, Concurr. Comp.-Pract. E., 18, 231–245, https://doi.org/10.1002/cpe.914, 2006. a
Caisson, A.: Prise en main et application d’un modèle spatialisé à base physique (CATHY) sur un versant expérimental pour la mise en place d'un système d’assimilation de données, Master's thesis, ENGEES, 2019. a
Catalogne, C., Lauvernet, C., and Carluer, N.: Guide d’utilisation de l’outil BUVARD pour le dimensionnement des bandes tampons végétalisées destinées à limiter les transferts de pesticides par ruissellement, Tech. rep., Agence française pour la biodiversité, 2018. a
Coutadeur, C., Coquet, Y., and Roger-Estrade, J.: Variation of hydraulic conductivity in a tilled soil, Eur. J. Soil Sci., 53, 619–628, https://doi.org/10.1046/j.1365-2389.2002.00473.x, 2002. a
Da Veiga, S.: Global sensitivity analysis with dependence measures, J. Stat. Comput. Sim., 85, 1283–1305, https://doi.org/10.1080/00949655.2014.945932, 2015. a, b, c, d
Da Veiga, S., Gamboa, F., Iooss, B., and Prieur, C.: Basics and Trends in Sensitivity Analysis, Society for Industrial and Applied Mathematics, https://doi.org/10.1137/1.9781611976694, 2021. a, b
Dairon, R.: Identification des processus dominants de transfert des produits phytosanitaires dans le sol et évaluation de modèles numériques pour des contextes agro-pédo-climatiques variés, PhD thesis, Université Claude Bernard – Lyon 1, 2015. a, b
D'Andrea, M. F., Letourneau, G., Rousseau, A. N., and Brodeur, J. C.: Sensitivity analysis of the Pesticide in Water Calculator model for applications in the Pampa region of Argentina, Sci. Total Environ., 698, 134232, https://doi.org/10.1016/j.scitotenv.2019.134232, 2020. a, b
Darcy, H.: Recherches expérimentales relatives au mouvement de l'eau dans les tuyaux, Impr. Impériale, 1857. a
De Lozzo, M. and Marrel, A.: New improvements in the use of dependence measures for sensitivity analysis and screening, J. Stat. Comput. Sim., 86, 3038–3058, https://doi.org/10.1080/00949655.2016.1149854, 2014. a, b
De Lozzo, M. and Marrel, A.: Sensitivity analysis with dependence and variance-based measures for spatio-temporal numerical simulators, Stoch. Env. Res. Risk A., 31, 1437–1453, https://doi.org/10.1007/s00477-016-1245-3, 2016. a, b, c, d, e
Dehotin, J., Braud, I., Vazquez, R., Debionne, S., and Viallet, P.: Prise en compte de l'hétérogénéité des surfaces continentales dans la modélisation couplées zone non saturé-zone saturée, Bulletin du GFHN, 54, 57–62, 2008. a
Dosskey, M. G., Helmers, M. J., and Eisenhauer, D. E.: A design aid for sizing filter strips using buffer area ratio, J. Soil Water Conserv., 66, 29–39, https://doi.org/10.2489/jswc.66.1.29, 2011. a
Dubus, I. G. and Brown, C. D.: Sensitivity and First-Step Uncertainty Analyses for the Preferential Flow Model MACRO, J. Environ. Qual., 31, 227–240, https://doi.org/10.2134/jeq2002.2270, 2002. a
Dubus, I. G., Brown, C. D., and Beulke, S.: Sensitivity analyses for four pesticide leaching models, Pest Manag. Sci., 59, 962–982, https://doi.org/10.1002/ps.723, 2003. a, b, c
Durand, C.: Modélisation du transfert de pesticides à l'échelle de la parcelle. Application au bassin versant de la Morcille (Nord Beaujolais, 69) et analyse de sensibilité du modèle, Master's thesis, ENGEES, 2014. a
Faivre, R., Iooss, B., Mahévas, S., Makowski, D., and Monod, H.: Analyse de sensibilité et exploration de modèles, Collection Savoir-Faire, Editions Quae, hal-01173750, 2013. a, b
Fajraoui, N., Ramasomanana, F., Younes, A., Mara, T., Ackerer, P., and Guadagnini, A.: Use of global sensitivity analysis and polynomial chaos expansion for interpretation of nonreactive transport experiments in laboratory-scale porous media, Water Resour. Res., 47, W02521, https://doi.org/10.1029/2010WR009639, 2011. a
Faúndez Urbina, C. A., van den Berg, F., van Dam, J. C., Tang, D. W. S., and Ritsema, C. J.: Parameter sensitivity of SWAP-PEARL models for pesticide leaching in macroporous soils, Vadose Zone J., 19, e20075, https://doi.org/10.1002/vzj2.20075, 2020. a, b
FOCUS: FOCUS surface water scenarios in the EU evaluation process under 91/414/EEC, European commission, report of the FOCUS Working Group on Surface Water Scenarios, EC Document Reference SANCO/4802/2001, 2001. a
Fouilloux, A. and Piacentini, A.: The PALM Project: MPMD paradigm for an oceanic data assimilation software, in: Euro-Par'99 Parallel Processing: 5th International Euro-Par Conference Toulouse, France, 31August–3 September 1999, Proceedings, 1423–1430, Springer Berlin Heidelberg, Berlin, Heidelberg, https://doi.org/10.1007/3-540-48311-X_200, 1999 (data available at: http://www.cerfacs.fr/globc/PALM_WEB/user.html#download, last access: 15 June 2020). a, b
Fox, G. A., Muñoz-Carpena, R., and Sabbagh, G. J.: Influence of flow concentration on parameter importance and prediction uncertainty of pesticide trapping by vegetative filter strips, J. Hydrol., 384, 164–173, https://doi.org/10.1016/j.jhydrol.2010.01.020, 2010. a, b, c
Frésard, F.: Cartographie des sols d’un petit bassin versant en Beaujolais viticole, en appui à l’évaluation du risque de contamination des eaux par les pesticides, Master's thesis, Université de Franche Comté, 2010. a
Fukumizu, K., Gretton, A., Xiaohai, S., and Schölkopf, B.: Kernel Measures of Conditional Dependence, in: Advances in Neural Information Processing Systems 20, edited by: Platt, J. C., Koller, D., Singer, Y., and Roweis, S. T., Curran Associates, Inc., 489–496, 2008. a
Gamboa, F., Janon, A., Klein, T., and Lagnoux, T.: Sensitivity indices for multivariate outputs, C. R. Math., 351, 307–310, https://doi.org/10.1016/j.crma.2013.04.016, 2013. a, b, c, d
Gao, B., Walter, M., Steenhuis, T., Hogarth, W., and Parlange, J.: Rainfall induced chemical transport from soil to runoff: theory and experiments, J. Hydrol., 295, 291–304, https://doi.org/10.1016/j.jhydrol.2004.03.026, 2004. a
Garcia, D., Arostegui, I., and Prellezo, R.: Robust combination of the Morris and Sobol methods in complex multidimensional models, Environ. Modell. Softw., 122, 104517, https://doi.org/10.1016/j.envsoft.2019.104517, 2019. a, b
Gatel, L., Lauvernet, C., Carluer, N., Weill, S., and Paniconi, C.: Sobol global sensitivity analysis of a coupled surface/subsurface water flow and reactive solute transfer model on a real hillslope, Water, 12, 121, https://doi.org/10.3390/w12010121, 2019. a, b, c, d, e, f, g
Ghanem, R. G. and Spanos, P. D.: Spectral stochastic finite-element formulation for reliability analysis, J. Eng. Mech., 117, 2351–2372, 1991. a, b
Gouy, V., Liger, L., Carluer, N., and Margoum, C.: Site Atelier Ardières Morcille, Irstea, BDOH, https://doi.org/10.17180/obs.saam, 2015. a, b
Gregorutti, B., Michel, B., and Saint-Pierre, P.: Correlation and variable importance in random forests, Stat. Comput., 27, 659–678, https://doi.org/10.1007/s11222-016-9646-1, 2017. a, b
Gretton, A., Bousquet, O., Smola, A., and Schölkopf, B.: Measuring statistical dependence with Hilbert-Schmidt norms, in: International conference on algorithmic learning theory, 63–77, Springer, https://doi.org/10.1007/11564089_7, 2005a. a
Gretton, A., Herbrich, R., Smola, A., Bousquet, O., and Schölkopf, B.: Kernel Methods for Measuring Independence, J. Mach. Learn. Res., 6, 2075–2129, 2005b. a
Gupta, H. V., Wagener, T., and Liu, Y.: Reconciling theory with observations: elements of a diagnostic approach to model evaluation, Hydrol. Process., 22, 3802–3813, https://doi.org/10.1002/hyp.6989, 2008. a
Hamby, D. M.: A review of techniques for parameter sensitivity analysis of environmental models, Environ. Monit. Assess., 32, 135–154, https://doi.org/10.1007/BF00547132, 1994. a
Harper, E. B., Stella, J. C., and Fremier, A. K.: Global sensitivity analysis for complex ecological models: a case study of riparian cottonwood population dynamics, Ecol. Appl., 21, 1225–1240, https://doi.org/10.1890/10-0506.1, 2011. a
Holvoet, K., van Griensven, A., Seuntjens, P., and Vanrolleghem, P. A.: Sensitivity analysis for hydrology and pesticide supply towards the river in SWAT, Phys. Chem. Earth, 30, 518–526, https://doi.org/10.1016/j.pce.2005.07.006, 2005. a, b
Hong, T. and Purucker, S. T.: Spatiotemporal sensitivity analysis of vertical transport of pesticides in soil, Environ. Modell. Softw., 105, 24–38, https://doi.org/10.1016/j.envsoft.2018.03.018, 2018. a, b
Horner, I.: Design and evaluation of hydrological signatures for the diagnostic and improvement of a process-based distributed hydrological model, PhD thesis, Université Grenoble Alpes, thèse de doctorat dirigée par Branger, Flora Océan, Atmosphère, Hydrologie Université Grenoble Alpes 2020, http://www.theses.fr/2020GRALU014 (last access: 15 March 2022), 2020. a
Ishwaran, H. and Kogalur, U.: Fast Unified Random Forests for Survival, Regression, and Classification (RF-SRC), R package version 2.9.3., 2020. a
Ishwaran, H. and Lu, M.: Standard errors and confidence intervals for variable importance in random forest regression, classification, and survival, Stat. Med., 38, 558–582, https://doi.org/10.1002/sim.7803, 2019. a
Lauvernet, C. and Muñoz-Carpena, R.: Shallow water table effects on water, sediment, and pesticide transport in vegetative filter strips – Part 2: model coupling, application, factor importance, and uncertainty, Hydrol. Earth Syst. Sci., 22, 71–87, https://doi.org/10.5194/hess-22-71-2018, 2018. a, b, c, d, e, f
Lewis, K.-A., Tzilivakis, J., Warner, D., and Green, A.: An international database for pesticide risk assessments and management, Hum. Ecol. Risk Assess., 22, 1050–1064, https://doi.org/10.1080/10807039.2015.1133242, 2016. a, b
Li, K., De Jong, R., and Boisvert, J.: An exponential root-water-uptake model with water stress compensation, J. Hydrol., 252, 189–204, https://doi.org/10.1016/S0022-1694(01)00456-5, 2001. a
Lighthill, M. J. and Whitham, G. B.: On kinematic waves I. Flood movement in long rivers, P. Roy. Soc. Lond. A, 229, 281–316, https://doi.org/10.1098/rspa.1955.0088, 1955. a
Marelli, S. and Sudret, B.: UQLab: A framework for uncertainty quantification in Matlab, in: Proc. 2nd Int. Conf. on Vulnerability, Risk Analysis and Management (ICVRAM2014), https://doi.org/10.1061/9780784413609.257, 2014 (data available at: https://www.uqlab.com, last access: 11 January 2022). a, b
Marelli, S. and Sudret, B.: An active-learning algorithm that combines sparse polynomial chaos expansions and bootstrap for structural reliability analysis, Struct. Saf., 75, 67–74, https://doi.org/10.1016/j.strusafe.2018.06.003, 2018. a, b
Marrel, A., Marie, N., and De Lozzo, M.: Advanced surrogate model and sensitivity analysis methods for sodium fast reactor accident assessment, Reliab. Eng. Syst. Safe., 138, 232–241, https://doi.org/10.1016/j.ress.2015.01.019, 2015. a
McKay, M. D., Beckman, R. J., and Conover, W. J.: A comparison of three methods for selecting values of input variables in the analysis of output from a computer code, Technometrics, 21, 239–245, https://doi.org/10.2307/1268522, 1979. a
MeteoFrance: Evapotranspiration potentielle MONTHEIH, [data set], 2008. a
Meynaoui, A., Marrel, A., and Laurent-Bonneau, B.: Méthodologie basée sur les mesures de dépendance HSIC pour l'analyse de sensibilité de second niveau, in: 50èmes Journées de Statistique (JdS2018), Palaiseau, France, cea-02339273, 2018. a
Nossent, J. and Bauwens, W.: Multi-variable sensitivity and identifiability analysis for a complex environmental model in view of integrated water quantity and water quality modeling, Water Sci. Technol., 65, 539–549, https://doi.org/10.2166/wst.2012.884, 2012. a
Nossent, J., Elsen, P., and Bauwens, W.: Sobol’ sensitivity analysis of a complex environmental model, Environ. Modell. Softw., 26, 1515–1525, https://doi.org/10.1016/j.envsoft.2011.08.010, 2011. a, b
Peyrard, X., Liger, L., Guillemain, C., and Gouy, V.: A trench study to assess transfer of pesticides in subsurface lateral flow for a soil with contrasting texture on a sloping vineyard in Beaujolais, Environ. Sci. Pollut. Res., 13, https://doi.org/10.1007/s11356-015-4917-5, 2016. a
Pianosi, F., Beven, K., Freer, J., Hall, J., Rougier, J., Stephenson, D., and Wagener, T.: Sensitivity analysis of environmental models: A systematic review with practical workflow, Environ. Modell. Softw., 79, 214–232, https://doi.org/10.1016/j.envsoft.2016.02.008, 2016. a
Randriambololohasinirina, P.: Pesticide dissipation properties in soils of a wine-growing watershe., Master's thesis, Université Pierre et Marie Curie (Paris 6); Institut des Sciences et Industries du Vivant et de l’Environnement, 2012. a, b
R Core Team: R: A Language and Environment for Statistical Computing, R Foundation for Statistical Computing, Vienna, Austria, https://www.R-project.org/ (last access: 1 November 2022), 2017. a
Reichenberger, S., Bach, M., Skitschak, A., and Frede, H.-G.: Mitigation strategies to reduce pesticide inputs into ground- and surface water and their effectiveness; A review, Sci. Total Environ., 384, 1–35, https://doi.org/10.1016/j.scitotenv.2007.04.046, 2007. a
Rodriguez-Galiano, V., Mendes, M., Garcia-Soldado, M., Chica-Olmo, M., and Ribeiro, L.: Predictive modeling of groundwater nitrate pollution using Random Forest and multisource variables related to intrinsic and specific vulnerability: A case study in an agricultural setting (Southern Spain), Sci. Total Environ., 476-477, 189–206, https://doi.org/10.1016/j.scitotenv.2014.01.001, 2014. a, b
Ross, P. J.: Modeling soil water and solute transport – fast, simplified numerical solutions, Agron. J., 95, 1352–1361, https://doi.org/10.2134/agronj2003.1352, 2003. a
Ross, P. J.: Fast solution of Richards’ equation for flexible soil hydraulic property descriptions, Tech. rep., CSIRO, https://doi.org/10.4225/08/5859741868a90, 2006. a
Roux, S., Buis, S., Lafolie, F., and Lamboni, M.: Cluster-based GSA: Global sensitivity analysis of models with temporal or spatial outputs using clustering, Environ. Modell. Softw., 140, 105046, https://doi.org/10.1016/j.envsoft.2021.105046, 2021. a
Rouzies, E., Lauvernet, C., Barachet, C., Morel, T., Branger, F., Braud, I., and Carluer, N.: From agricultural catchment to management scenarios: A modular tool to assess effects of landscape features on water and pesticide behavior, Sci. Total Environ., 671, 1144–1160, https://doi.org/10.1016/j.scitotenv.2019.03.060, 2019. a, b, c, d
Rouzies, E., Lauvernet, C., Sudret, B., and Vidard, A.: Software for: How to perform global sensitivity analysis of a catchment-scale, distributed pesticide transfer model? Application to the PESHMELBA model, Zenodo [software], https://doi.org/10.15454/2HAU8R, 2022a. a
Rouzies, E., Lauvernet, C., Sudret, B., and Vidard, A.: Code availability and data for: How to perform global sensitivity analysis of a catchment-scale, distributed pesticide transfer model? Application to the PESHMELBA model, Zenodo [code], https://doi.org/10.15454/2YVY4O, 2022b. a
Saint-Geours, N.: Analyse de sensibilité de modèles spatialisés : application à l'analyse coût-bénéfice de projets de prévention du risque d'inondation, PhD thesis, Université de Montpellier 2, tel-00761032, 2012. a
Saltelli, A.: Sensitivity analysis for importance assessment, Risk Analysis, 22, 579–590, https://doi.org/10.1111/0272-4332.00040, 2002. a
Saltelli, A., Tarantola, S., Campolongo, F., and Ratto, M.: Sensitivity Analysis in Practice: A Guide to Assessing Scientific Models, Wiley, https://doi.org/10.1002/0470870958, 2004. a
Saltelli, A., Jakeman, A., Razavi, S., and Wu, Q.: Sensitivity analysis: A discipline coming of age, Environ. Modell. Softw., 146, 105226, https://doi.org/10.1016/j.envsoft.2021.105226, 2021. a
Sarrazin, F., Pianosi, F., and Wagener, T.: Global sensitivity analysis of environmental models: convergence and validation, Environ. Modell. Softw., 79, 135–152, https://doi.org/10.1016/j.envsoft.2016.02.005, 2016. a, b
Schaap, M. G. and van Genuchten, M. T.: A modified Mualem-van Genuchten formulation for improved description of the hydraulic conductivity near saturation, Vadose Zone J., 5, 27–34, 2006. a, b
Schwen, A., Bodner, G., Scholl, P., Buchan, G., and Loiskandl, W.: Temporal dynamics of soil hydraulic properties and the water-conducting porosity under different tillage, Soil Till. Res., 113, 89–98, https://doi.org/10.1016/j.still.2011.02.005, 2011. a, b, c
Seki, K.: SWRC fit – a nonlinear fitting program with a water retention curve for soils having unimodal and bimodal pore structure, Hydrol. Earth Syst. Sci. Discuss., 4, 407–437, https://doi.org/10.5194/hessd-4-407-2007, 2007. a
Sheikholeslami, R., Razavi, S., Gupta, H. V., Becker, W., and Haghnegahdar, A.: Global sensitivity analysis for high-dimensional problems: How to objectively group factors and measure robustness and convergence while reducing computational cost, Environ. Modell. Softw., 111, 282–299, https://doi.org/10.1016/j.envsoft.2018.09.002, 2019. a
Sheikholeslami, R., Gharari, S., Papalexiou, S. M., and Clark, M. P.: VISCOUS: A Variance-Based Sensitivity Analysis Using Copulas for Efficient Identification of Dominant Hydrological Processes, Water Resour. Res., 57, e2020WR028435, https://doi.org/10.1029/2020WR028435, 2021. a
Smart, D., Schwass, E., Lakso, A., and Morano, L.: Grapevine rooting patterns: A comprehensive analysis and a review, Am. J. Enol. Viticult., 57, 89–104, 2006. a
Sobol, I.: Sensitivity estimates for nonlinear mathematical models, Mathematical Modelling and Computational Experiments, 1, 407–414, 1993. a, b
Soleimani, F.: Analytical seismic performance and sensitivity evaluation of bridges based on random decision forest framework, Structures, 32, 329–341, https://doi.org/10.1016/j.istruc.2021.02.049, 2021. a
Song, X., Zhang, J., Zhan, C., Xuan, Y., Ye, M., and Xu, C.: Global sensitivity analysis in hydrological modeling: Review of concepts, methods, theoretical framework, and applications, J. Hydrol., 523, 739–757, https://doi.org/10.1016/j.jhydrol.2015.02.013, 2015. a
Sudret, B.: Global sensitivity analysis using polynomial chaos expansions, Reliab. Eng. Syst. Safe., 93, 964–979, https://doi.org/10.1016/j.ress.2007.04.002, 2008. a, b, c
Tang, Y., Reed, P., Wagener, T., and van Werkhoven, K.: Comparing sensitivity analysis methods to advance lumped watershed model identification and evaluation, Hydrol. Earth Syst. Sci., 11, 793–817, https://doi.org/10.5194/hess-11-793-2007, 2007. a, b
Tarantola, S., Giglioli, N., Jesinghaus, J., and Saltelli, A.: Can global sensitivity analysis steer the implementation of models for environmental assessments and decision-making?, Stoch. Env. Res. Risk A., 16, 63–76, https://doi.org/10.1007/s00477-001-0085-x, 2002. a, b
Tissot, J.-Y. and Prieur, C.: A randomized orthogonal array-based procedure for the estimation of first- and second-order Sobol' indices, J. Stat. Comput. Sim., 85, 1358–1381, https://doi.org/10.1080/00949655.2014.971799, 2015. a
Touzani, S. and Busby, D.: Screening Method Using the Derivative-based Global Sensitivity Indices with Application to Reservoir Simulator, Oil Gas Sci. Technol., 69, 619–632, https://doi.org/10.2516/ogst/2013195, 2014. a
Van den Bogaert, R.: Typologie des sols du bassin versant de la Morcille, caractérisation de leur propriétés hydrauliques et test de fonctions de pédotransfert, Master's thesis, Université Pierre et Marie Curie, AgroParisTech, hal-01192203, 2011. a, b
van Griensven, A., Meixner, T., Grunwald, S., Bishop, T., Diluzio, M., and Srinivasan, R.: A global sensitivity analysis tool for the parameters of multi-variable catchment models, J. Hydrol., 324, 10–23, https://doi.org/10.1016/j.jhydrol.2005.09.008, 2006. a
Varado, N., Braud, I., and Ross, P.: Development and assessment of an efficient vadose zone module solving the 1D Richards' equation and including root extraction by plants, J. Hydrol., 323, 258–275, https://doi.org/10.1016/j.jhydrol.2005.09.015, 2006. a, b
Walter, M., Gao, B., and Parlange, J.-Y.: Modeling soil solute release into runoff with infiltration, J. Hydrol., 347, 430–437, https://doi.org/10.1016/j.jhydrol.2007.09.033, 2007. a
Wang, S., Huang, G., Baetz, B., and Huang, W.: A polynomial chaos ensemble hydrologic prediction system for efficient parameter inference and robust uncertainty assessment, J. Hydrol., 530, 716–733, https://doi.org/10.1016/j.jhydrol.2015.10.021, 2015. a
Yang, J.: Convergence and uncertainty analyses in Monte-Carlo based sensitivity analysis, Environ. Modell. Softw., 26, 444–457, https://doi.org/10.1016/j.envsoft.2010.10.007, 2011. a
Zajac, Z. B.: Global sensitivity and uncertainty analysis of spatially distributed watershed models, PhD thesis, University of Florida, 2010. a, b
- Abstract
- Introduction
- Material and methods
- Results
- Discussion
- Conclusions
- Appendix A: Parameters for LAI evolution law
- Appendix B: Input parameter distributions
- Appendix C: Screening results
- Code and data availability
- Author contributions
- Competing interests
- Disclaimer
- Acknowledgements
- Review statement
- References