the Creative Commons Attribution 4.0 License.
the Creative Commons Attribution 4.0 License.
 | 06 Apr 2023
The impact of lateral boundary forcing in the CORDEX-Africa ensemble over southern Africa
Maria Chara Karypidou
Stefan Pieter Sobolowski
Lorenzo Sangelantoni
Grigory Nikulin
Eleni Katragkou
The region of southern Africa (SAF) is among the most exposed climate change hotspots and is projected to experience severe impacts across multiple economical and societal sectors. For this reason, producing reliable projections of the expected impacts of climate change is key for local communities. In this work we use an ensemble of 19 regional climate model (RCM) simulations performed in the context of the Coordinated Regional Climate Downscaling Experiment (CORDEX) – Africa and a set of 10 global climate models (GCMs) participating in the Coupled Model Intercomparison Project Phase 5 (CMIP5) that were used as the driving GCMs in the RCM simulations. We are concerned about the degree to which RCM simulations are influenced by their driving GCMs, with regards to monthly precipitation climatologies, precipitation biases and precipitation change signal, according to the Representative Concentration Pathway (RCP) 8.5 for the end of the 21st century. We investigate the degree to which RCMs and GCMs are able to reproduce specific climatic features over SAF and over three sub-regions, namely the greater Angola region, the greater Mozambique region, and the greater South Africa region. We identify that during the beginning of the rainy season, when regional processes are largely dependent on the coupling between the surface and the atmosphere, the impact of the driving GCMs on the RCMs is smaller compared to the core of the rainy season, when precipitation is mainly controlled by the large-scale circulation. In addition, we show that RCMs are able to counteract the bias received by their driving GCMs; hence, we claim that the cascade of uncertainty over SAF is not additive, but indeed the RCMs do provide improved precipitation climatologies. The fact that certain bias patterns during the historical period (1985–2005) identified in GCMs are resolved in RCMs provides evidence that RCMs are reliable tools for climate change impact studies over SAF.
- Article
(23312 KB) - Full-text XML
-
Supplement
(11128 KB) - BibTeX
- EndNote


The region of southern Africa (SAF) is among the most exposed climate change hotspots (Diffenbaugh and Giorgi, 2012) and is projected to experience severe impacts across multiple economical and societal sectors (Conway et al., 2015; Masipa, 2017; Shew et al., 2020). Poverty, food insecurity, and high levels of malnutrition (Misselhorn and Hendriks, 2017) render SAF particularly vulnerable to the impacts of climate change (Casale et al., 2010; Luan et al., 2013; Wolski et al., 2020). In addition, the population's reliance on rain-fed agriculture makes strategic planning necessary, as it aims to mitigate the impact of climate change on local communities.
Global climate models (GCMs) participating in the Coupled Model Intercomparison Project Phase 5 (CMIP5) (Taylor et al., 2012) project a significant decline in annual precipitation over SAF (IPCC and Stocker, 2013), with the most pronounced changes projected under Representative Concentration Pathway 8.5 (RCP8.5) (Sillmann et al., 2013). This reduction is also identified in the regional climate model (RCM) simulations performed in the context of the Coordinated Regional Climate Downscaling Experiment (CORDEX) – Africa domain (Nikulin et al., 2012; Giorgi and Gutowski, 2015). More specifically, according to CORDEX-Africa simulations, annual precipitation is expected to decline by up to 50 % by the end of the 21st century (Pinto et al., 2018), while the duration of dry spells is projected to increase (Dosio et al., 2019). Despite this, extreme rain events are expected to increase in frequency and intensity (Pinto et al., 2016; Abiodun et al., 2019). Nevertheless, for a global warming level of 2 ∘C, certain parts of SAF (northern Angola, Zambia, northern Mozambique, and eastern South Africa) are projected to experience precipitation increase during specific times of the year (Maúre et al., 2018).
The question of whether or not RCMs produce demonstrable added value relative to their driving GCMs has often fuelled debate between the RCM and GCM modelling communities (Lloyd et al., 2021). The outcome of the debate is not binary. The literature provides ample evidence that there is indeed evidence of added value in RCMs, but it is dependent on the region examined, the season, and the climate mechanisms that are at play (Luca et al., 2016; Feser et al., 2011). RCM ensembles such as those developed within CORDEX-Africa endeavour to provide added value by dynamically downscaling historical and scenario simulations originating from coarse-resolution GCMs (Dosio et al., 2019). The added value in RCM simulations arises as a result of their higher horizontal resolution (<50 km), which makes it possible for atmospheric waves and synoptic-scale disturbances to be represented in a more realistic manner. An additional aspect that further contributes towards this end is the more accurate representation of land surface characteristics (topography, land use, etc.) in RCMs (Di Luca et al., 2013). Moreover, the physics of an RCM can be targeted for processes specific to the region it is being run for, giving it a local advantage over GCMs that may have had their physics developed for global applications. Nevertheless, RCMs also are accompanied by a set of model deficiencies that affect the final output of the downscaled data (Boberg and Christensen, 2012). In Sørland et al. (2018) it is reported that although RCM biases are affected by the driving GCMs, they are nonetheless not additive, a result that counters the common “cascade of uncertainty” criticism. Still, uncertainty arising from both the driving GCM (Moalafhi et al., 2017) and the downscaling RCM affect the final product (Nikulin et al., 2012), and it is important to diagnose the sources and causes of these errors (Déqué et al., 2012).
Attributing total uncertainty to its respective components is key for a better assessment of the reliability of RCM simulations (Christensen and Kjellström, 2022). GCMs provide the lateral boundary conditions to the RCMs and each RCM receives, absorbs, and modulates the received atmospheric forcing in different ways, depending on the numerical formulations and parameterization schemes employed. Discerning between the signal received from the GCM and the signal produced by the RCM is critical for assessing the robustness with which different modelling systems are able to accurately reproduce observed climatologies and generate reliable estimates of the expected climate change. In addition, the manner in which an RCM responds to the atmospheric forcing provided by a GCM can be region specific (Rana et al., 2020; Wu and Gao, 2020) (e.g. regions located in close proximity to the boundaries of the RCM domain can be more severely affected by the driving GCMs than regions at the centre of the RCM domain, or there can be region-specific response around complex topography versus lowlands). Also, the degree to which an RCM is influenced by the driving GCM can be process specific. For instance, when there is a strong large-scale circulation signal that is introduced to an RCM domain (e.g. advective mid-latitude storms), it is likely that the RCM will be able to reproduce the information that is received at its lateral boundaries; however, the GCM's impact on the RCM simulation may also vary depending on how far a region lies from the RCM domain boundaries (Kim et al., 2020). If, however, the large-scale forcing is weak, then the atmospheric conditions simulated within the RCM domain are more dependent on the dynamic and thermodynamic processes employed by the RCM (e.g. convective thunderstorms).
In this work we aim to assess whether it is the RCMs or their driving GCMs that dominate monthly precipitation climatology, monthly precipitation bias, and climate change signal over SAF. We take into account the region-specific characteristics of this question by analysing SAF and three subregions, namely southeastern Angola, Mozambique, and South Africa. We also consider the different atmospheric processes that are at play over each region by analysing monthly climatologies. Precipitation over SAF results from various atmospheric processes that are highly variable during the rainy season (October–March); thus, by performing the analysis on a monthly basis, we are able to indirectly study how certain processes are reproduced by GCM and RCM simulations. In order to differentiate between the signal emanating from the RCMs and that emanating from their driving GCMs, we use the analysis of variance (ANOVA) in both the GCM and the RCM ensembles (Déqué et al., 2007, 2012). Since the information provided by RCMs will eventually be used by both climate and non-climate scientists, especially in light of climate change impact studies, we aim to provide some information with regard to how much each RCM is affected by its driving GCM and what climate change signals are consistent in both RCMs and GCMs.
2.1 Data
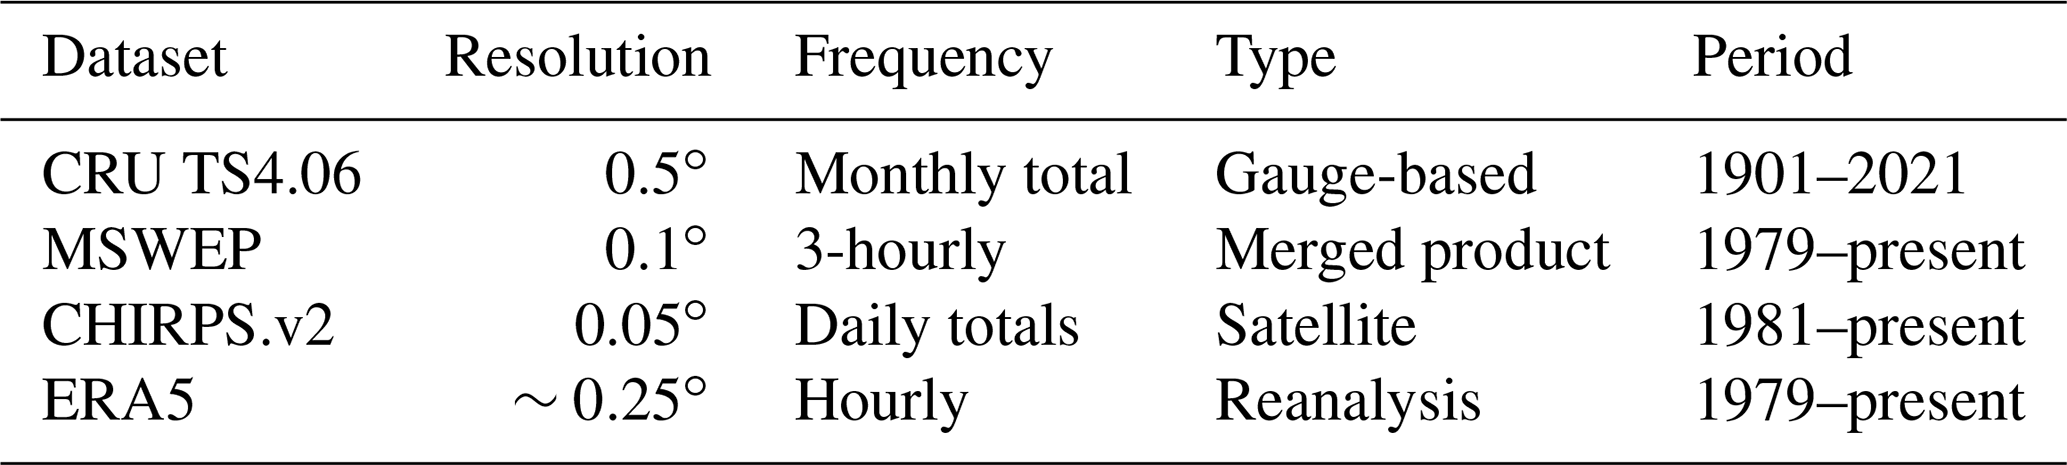
The data analysed in the current work consist of RCM simulations performed in the context of CORDEX-Africa, a set of simulations performed in the context of CMIP5, the CHIRPS satellite rainfall product (Funk et al., 2015), the ERA5 reanalysis dataset (Hersbach et al., 2020), the CRU gridded observational dataset (Harris et al., 2020), and the MSWEP precipitation product (Beck et al., 2019). More specifically, the CORDEX-Africa simulations selected are those that were driven by more than two GCMs (at least three simulations available using the same RCM driven by at least three different GCMs) and for which there are runs available for both the historical and the future period under RCP8.5. All RCMs employed a relaxation zone that was either 10 grid points wide (CCLM4-8-17.v1) or 8 grid points wide (RCA4.v1 and REMO2009.v1). Relaxation in all RCM simulations was performed using Davies' method (Davies, 1976, 1983). The CMIP5 GCMs selected are the ones that were used to drive the CORDEX-Africa simulations. All RCM and GCM simulations were retrieved from the Earth System Grid Federation. The CHIRPS rainfall product is used for calculating precipitation biases in both the CORDEX-Africa and CMIP5 ensembles. CHIRPS is available at 5 km spatial resolution, and for the calculation of biases it was remapped to the coarser-resolution grid using conservative remapping. A fact that is commonly obscured is that observational datasets are often considered “ground truth”; however, they are also subject to multiple sources of uncertainty, caused by the underlying station datasets used, the statistical algorithms employed in spatial interpolation methods, or the algorithms employed in satellite rainfall products (Le Coz and van de Giesen, 2020). More specifically, over southern Africa it was found that gauge-based products employing spatial interpolation methods displayed high uncertainty over regions where the underlying station network was scarce, mainly over the Angola region and the northern parts of SAF (Karypidou et al., 2022). In addition, it was found that this attribute was inherited by all rainfall satellite products that were using direct merging techniques with gauge-based datasets. Here, we display monthly precipitation during the historical period (1985–2005) across four observational datasets, given in Table 1. More specifically, we use the CRUv4.06 dataset (Harris et al., 2020), which is a purely gauge-based product (employing station data and a spatial interpolation algorithm to provide a spatially continuous gridded product), ERA5 (Hersbach et al., 2020), which is a reanalysis product, CHRIPS (Funk et al., 2015), which is a satellite rainfall product, and finally, MSWEP (Beck et al., 2017), which is a product merging station data, satellite data, and dynamic model outputs. All datasets have been analysed using monthly mean values. The results are displayed in Fig. 1. As shown, there is a substantial agreement among them, with regard to both the spatial and temporal patterns of monthly precipitation over southern Africa.
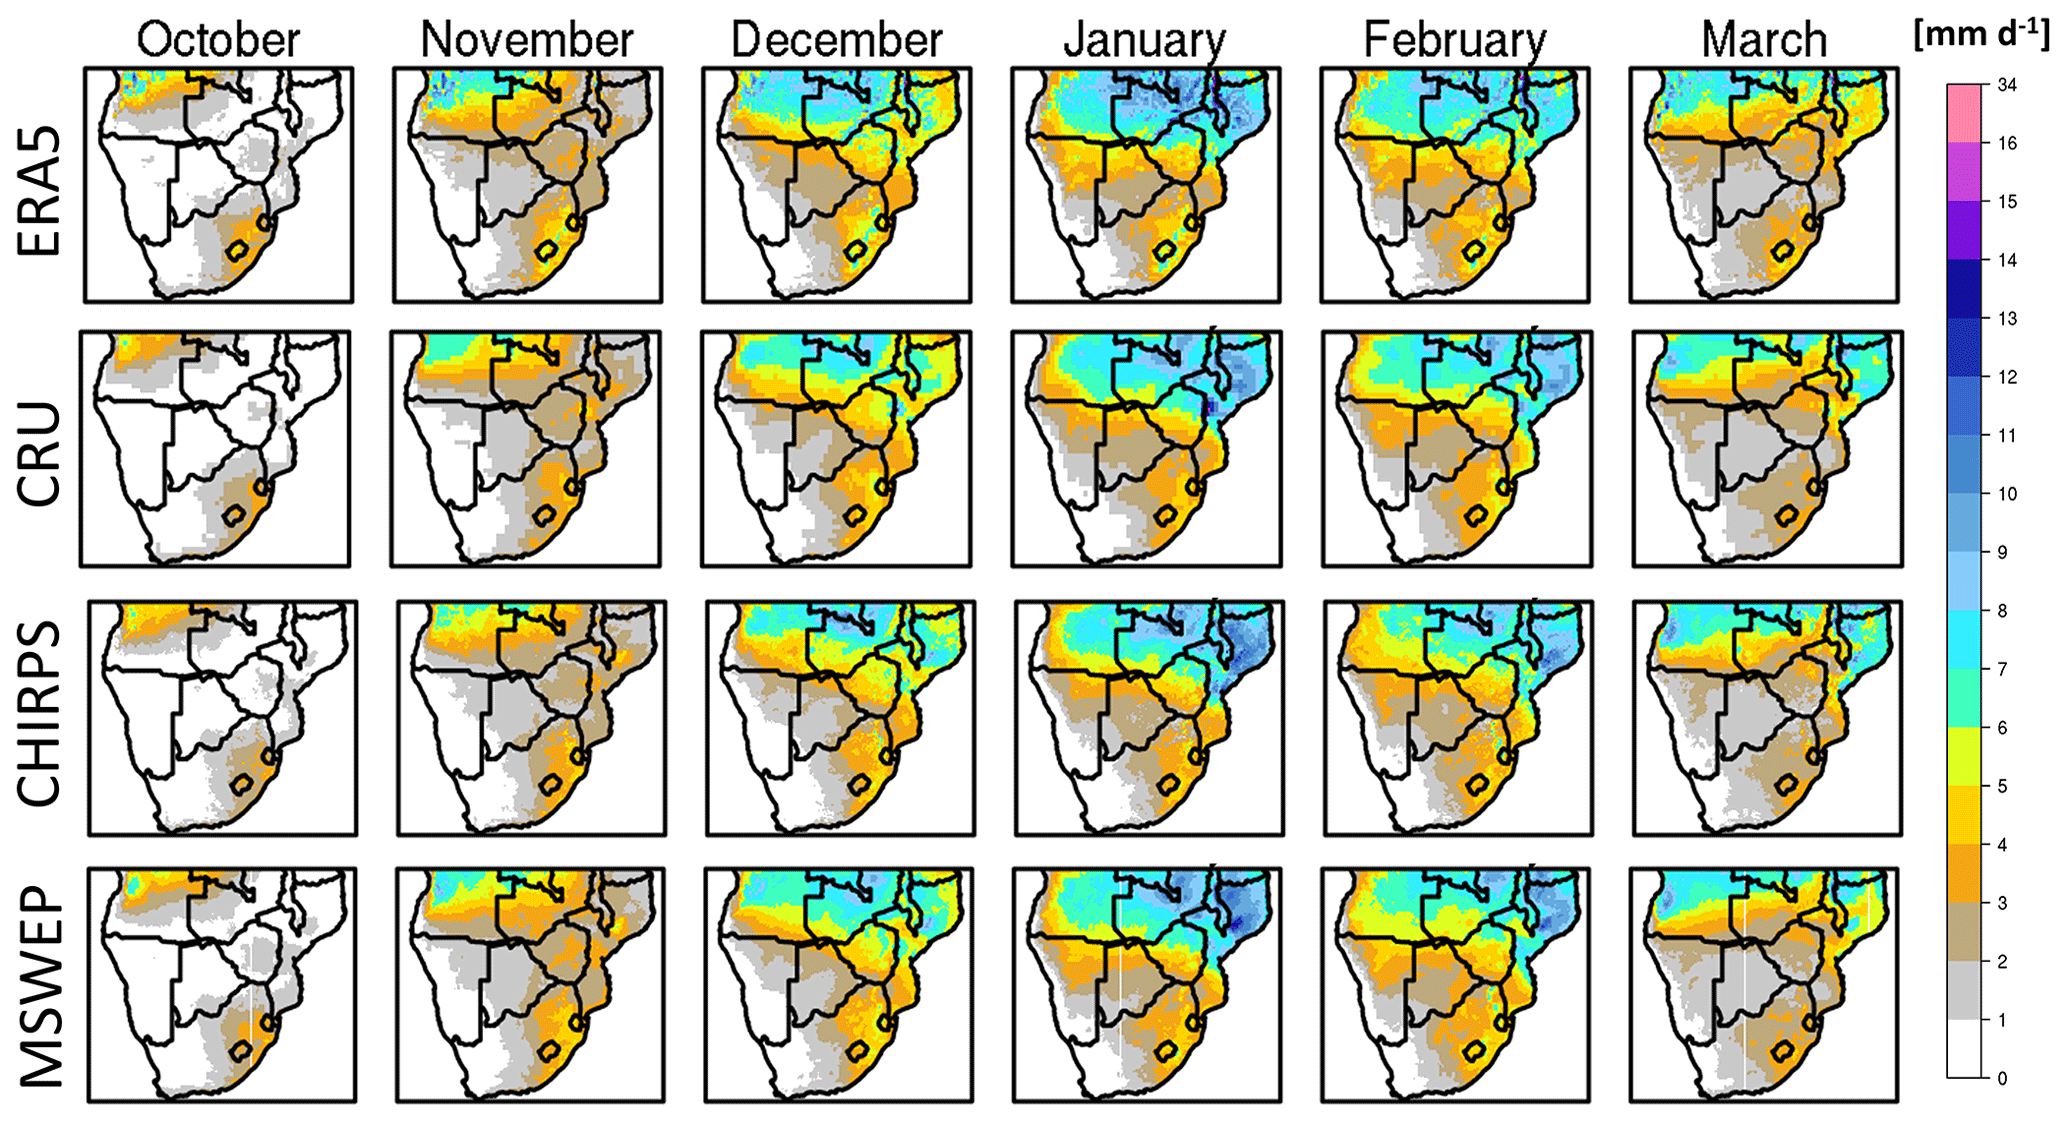
Figure 1Monthly mean precipitation climatology for the period 1985–2005.
Table 1Gauge-based, satellite, reanalysis, and merged precipitation products analysed over the study region using monthly mean precipitation for the period 1985–2005.
Our analysis is split into the following two sections: the qualitative part and the quantitative part. In the qualitative part, we aim to identify if RCMs exhibit systematic behaviour relative to their driving GCMs. For the quantitative part, we aim to quantify the degree to which monthly precipitation climatologies, biases, and climate change signals are affected by the RCMs or by the driving GCMs. For this purpose, we employ an ensemble of 19 RCM simulations driven by 10 GCMs and the driving GCMs that were used to provide the lateral boundary conditions to the RCMs. From the historical simulations we use the period 1985–2005, and from the projection simulations we use the period 2065–2095 under RCP8.5. All CORDEX-Africa simulations are available at ∼50 km horizontal resolution and are shown in Table 2, while the horizontal resolution for the driving GCMs is provided in Table 3.
Table 2Input RCM and GCM simulations used. The CORDEX-Africa simulations are given in the columns. The CMIP5 GCMs used as driving fields are given in the rows.
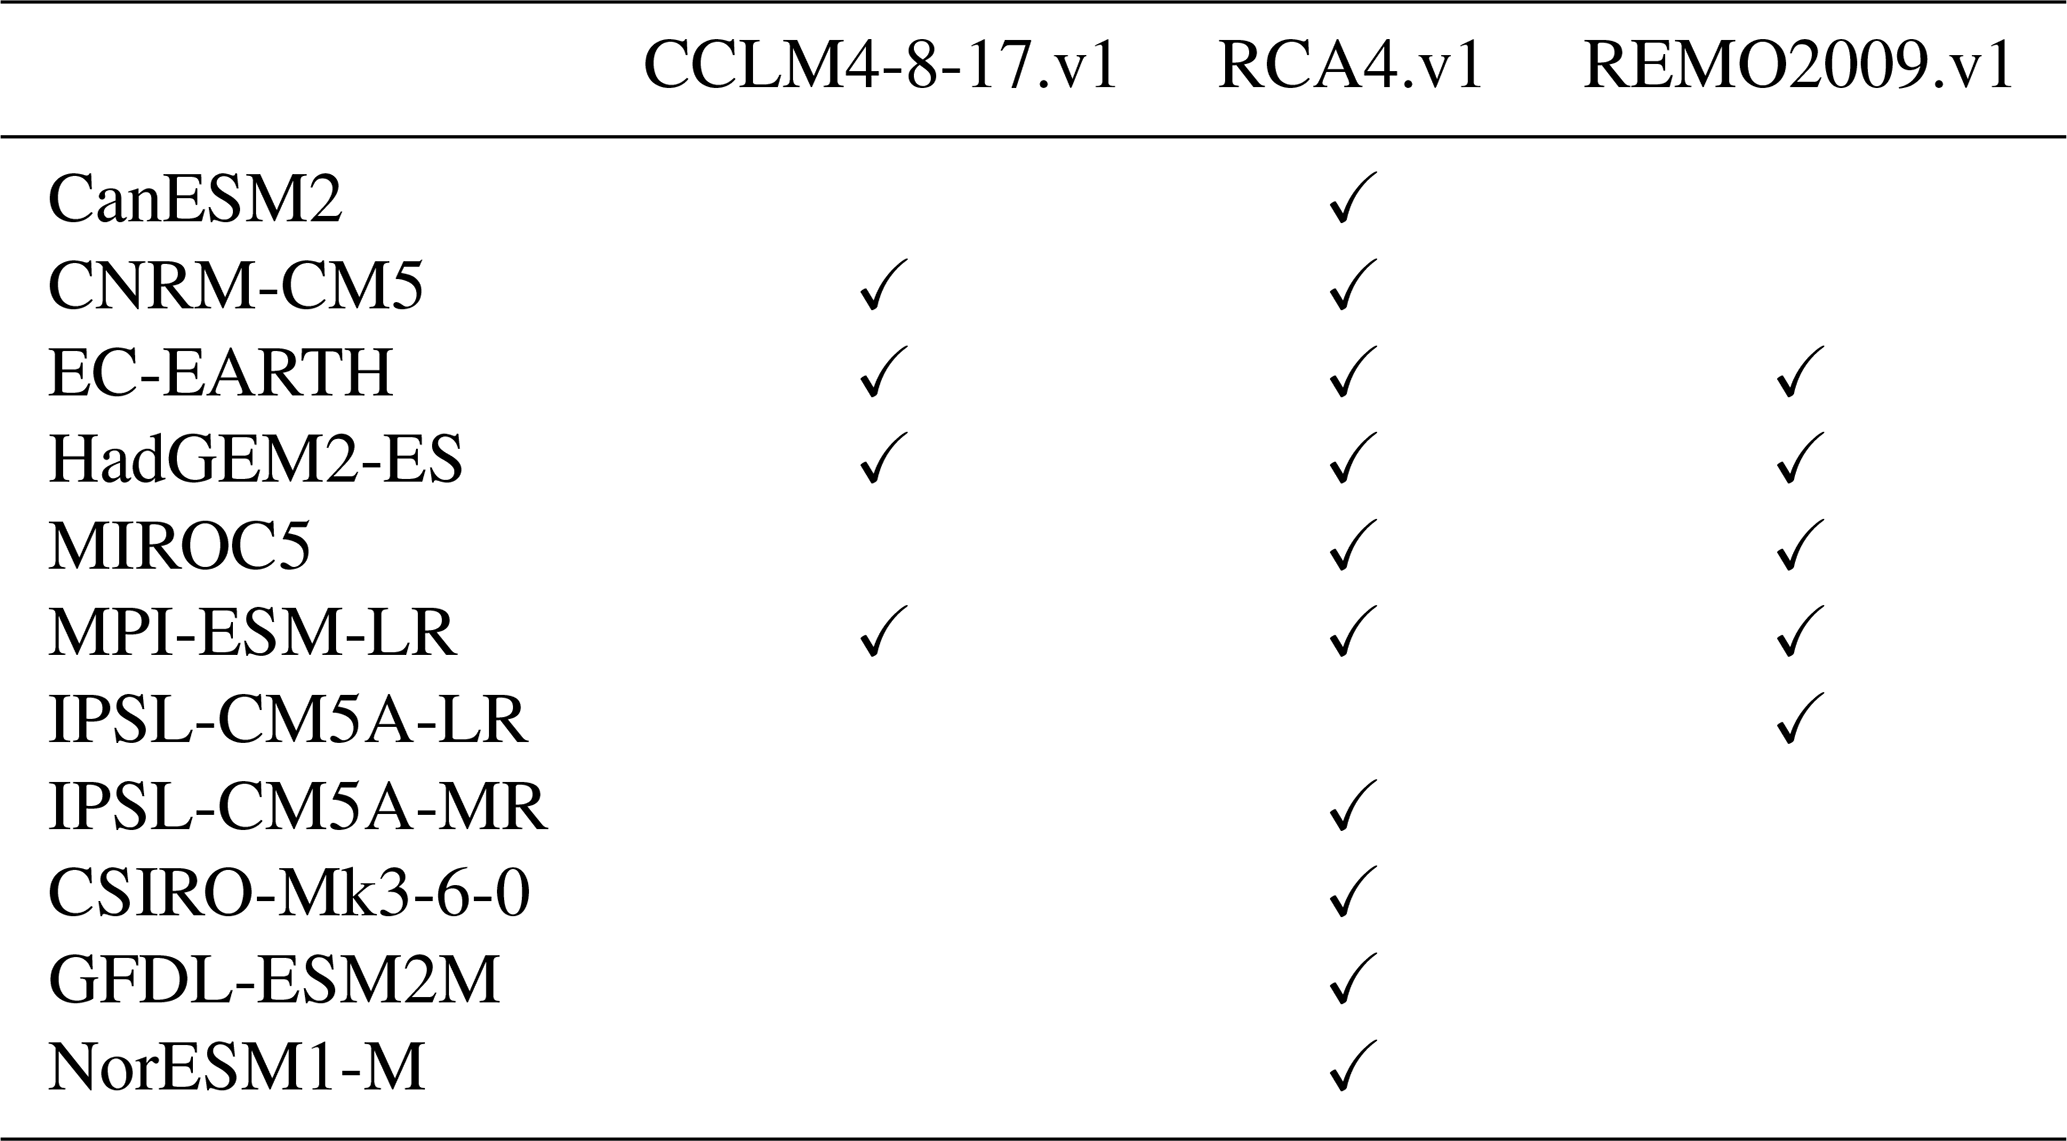
Table 3Horizontal resolution of the CMIP5 GCMs used as driving fields in the CORDEX-Africa simulations.
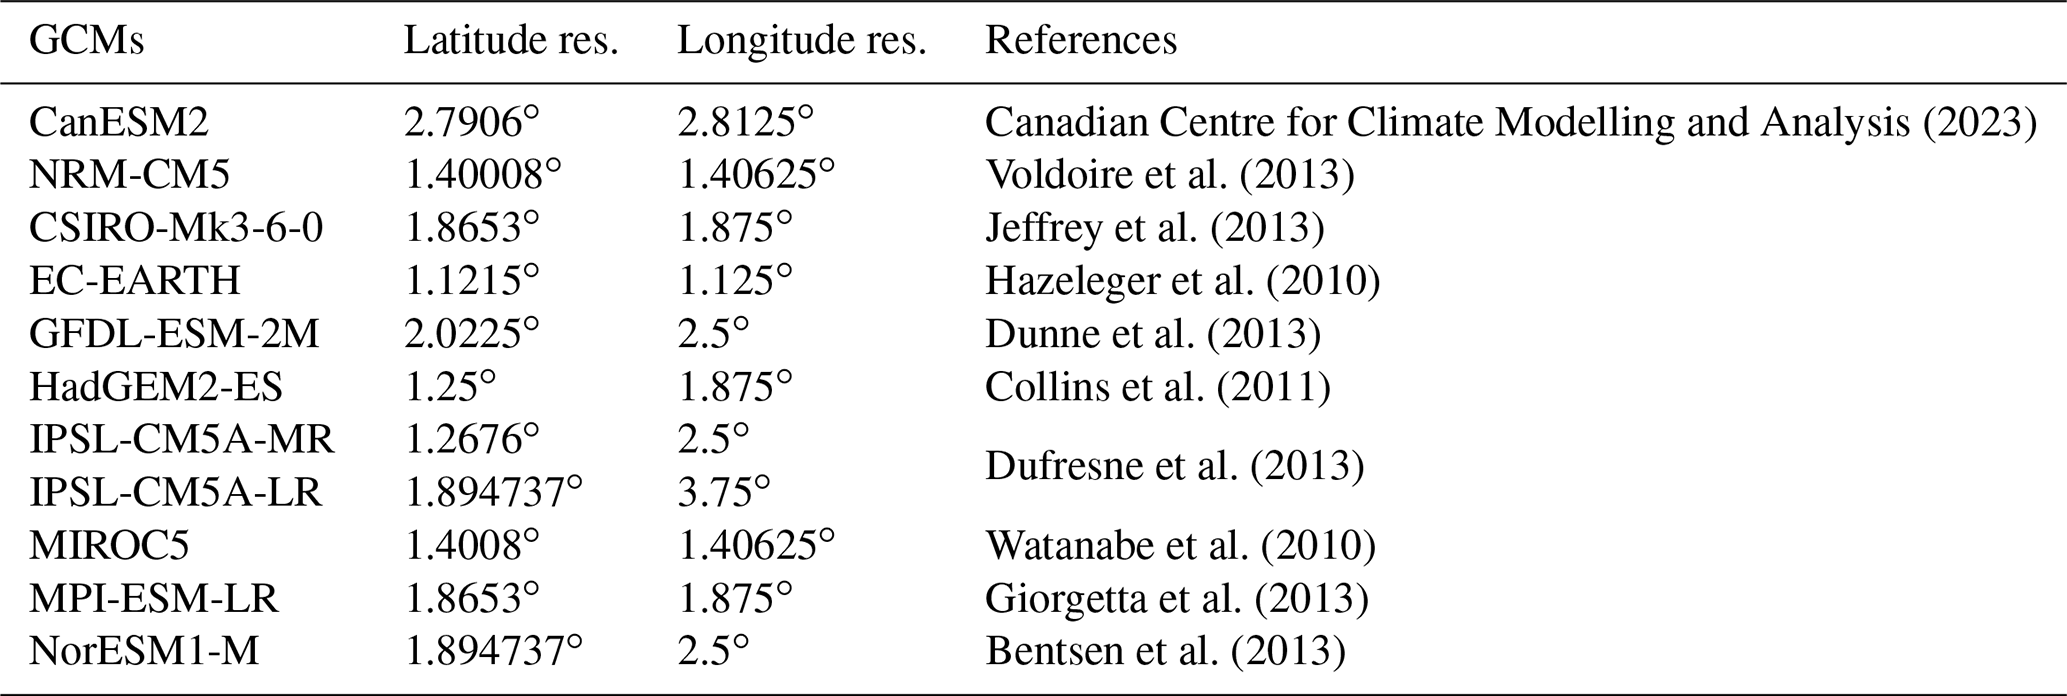
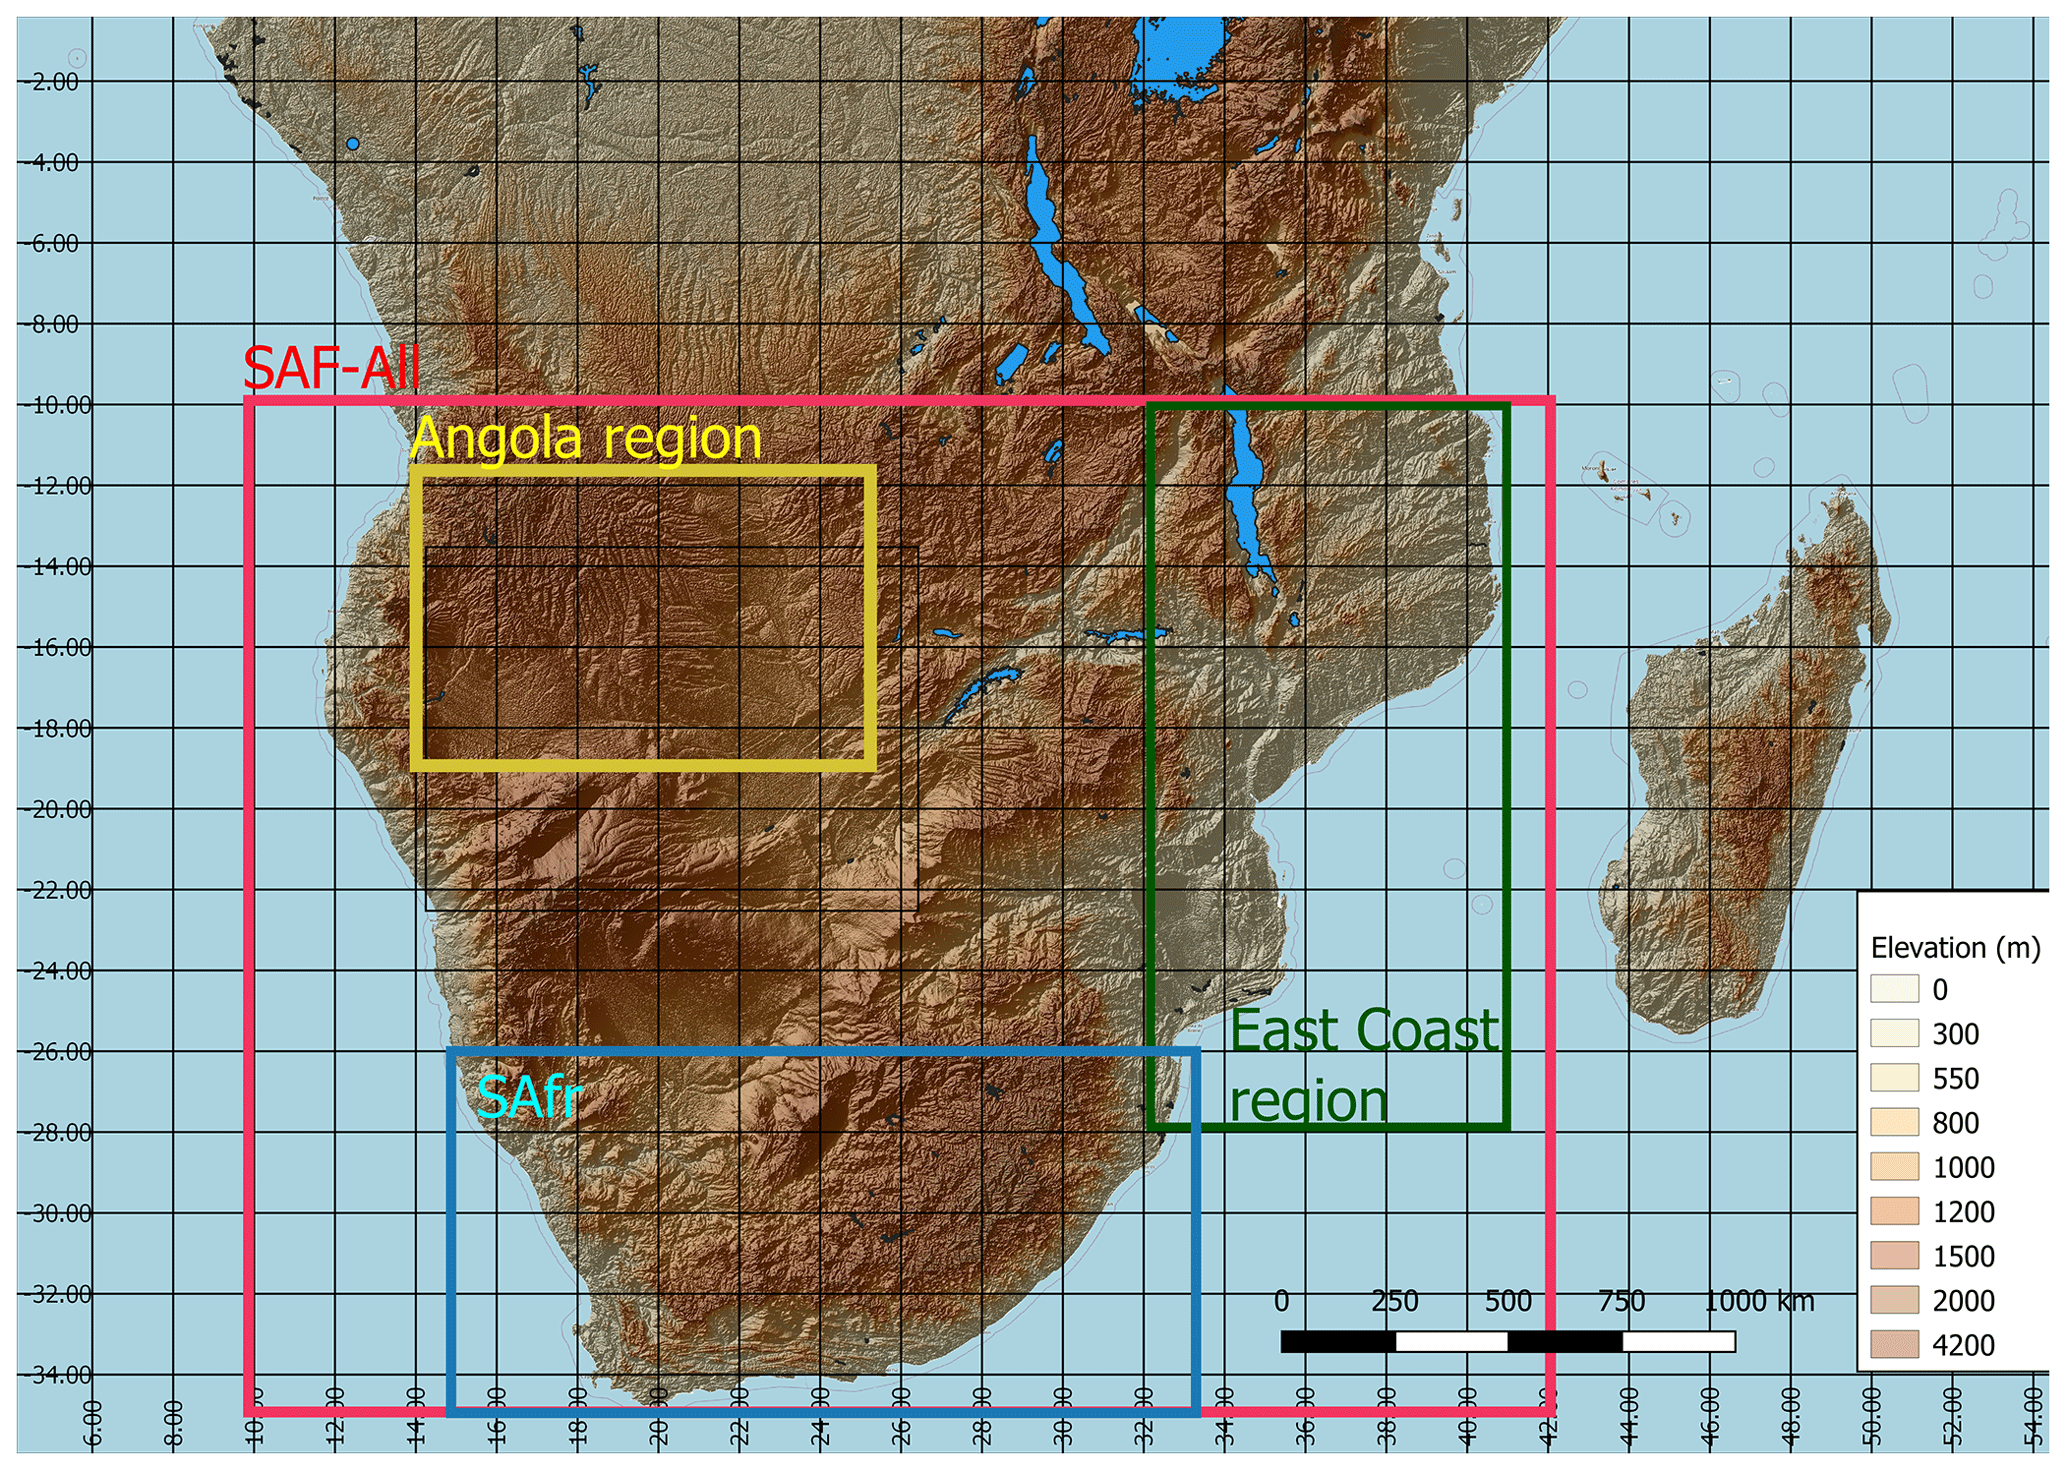
Figure 2Study region and subregions over southern Africa.
2.2 Methods
The study region and subregions considered are depicted in Fig. 2. The subregions are selected based on particular phenomena and processes that are of importance for the seasonal cycle of precipitation. More specifically, Region A (hereafter, SAF-All) encompasses the entire SAF region and is defined as the area extending from 10 to 35∘ S and from 10 to 42∘ E. Region B (hereafter, Angola region) was selected to capture the main region of interest with regards to the Angola Low (AL) pressure system (Howard and Washington, 2018) and covers the area extending from 11 to 19∘ S and from 14 to 25∘ E. Region C (hereafter, East Coast) covers the eastern coastline, Mozambique and parts of the surrounding countries and extends from 10 to 28∘ S and from 31 to 41∘ E. Lastly, we define the SAfr region, which covers much of South Africa and extends from 26 to 35∘ S and from 15 to 33∘ E.
One of the primary synoptic-scale features controlling precipitation over SAF is the Angola Low (AL) pressure system (Reason and Jagadheesha, 2005; Lyon and Mason, 2007; Crétat et al., 2019; Munday and Washington, 2017; Howard and Washington, 2018), which has a distinct seasonal cycle throughout the rainy season (October–March). This motivates its selection as a subregion for our study. The AL exhibits heat low characteristics during October–November and tropical low characteristics during December–February (Howard and Washington, 2018). This suggests that during October–November, since precipitation is thermally induced and thus tightly dependent on land–atmosphere interactions, it will be the RCMs that are dominant in controlling precipitation processes. As the rainy season progresses, the AL changes to a tropical low-pressure system, and its formation is controlled by the large-scale circulation that is characterized by easterly winds from the Indian Ocean that enter SAF via the Mozambique Channel. Since precipitation during December–February is caused by the tropical low phase of the Angola Low pressure system, which is the monthly aggregate of frequent transient low-pressure systems crossing southern African (Munday and Washington, 2017; Howard and Washington, 2018; Howard et al., 2019), we hypothesize that the impact of the driving GCMs during December–February is enhanced.
In addition, the wider area of Mozambique is a region where the majority of tropical cyclones and depressions make landfall over continental SAF. The occurrence of transient low-pressure systems is enhanced during the core of the rainy season (December–February), and thus we are interested in identifying whether the impact of the driving GCMs is dominant during December–February. Also, since according to Muthige et al. (2018) the number of tropical cyclones making landfall under RCP8.5 is expected to decline in the future, we are interested in examining whether the impact of the driving GCMs to the RCM simulations will be altered under future conditions. Hence, the East Coast region is used as a region indicative of the tropical cyclones and depressions making landfall. Lastly, we examine the area encompassing South Africa (hereafter, SAfr) due to its strong land–ocean gradients, complex topography, and strong seasonal variations in rainfall zones.
2.2.1 Monthly precipitation climatology and bias
In order to assess whether or not the RCMs improve the monthly precipitation climatologies relative to their driving GCMs, we employ a method initially described in Kerkhoff et al. (2015) and later employed by Sørland et al. (2018), which displays the RCM increment as a function of the GCM bias in scatterplot form. More specifically, the RCM increment is described as the difference between each RCM simulation and its driving GCM (RCM − GCM). The RCM increment is plotted against the GCM bias (GCM-OBS). This plot displays whether or not the RCM increment counteracts the GCM bias. If the RCM increment reduces the GCM bias, then points are expected to lie along the line (negative correlation). In contrast, if the RCM increment increases the GCM bias, then points are expected to lie along the y=x line (positive correlation). If the RCM increment and the GCM bias are independent, then points are expected to be scattered randomly.
2.2.2 Climate change signal
The climate change signal (CCS) is identified as the monthly mean difference between the future period (2065–2095) minus the historical period (1985–2005). As an exploratory method of inspecting the differences between each RCM simulation from its respective driving GCM for monthly precipitation during both the historical and the future period, we subtract the downscaled precipitation field (RCMDRI) from its driving (DRI) GCM, as in Eq. (1):
If DIFF >0 (monthly precipitation), then we assume that the RCM enhances precipitation, relative to its driving GCM, while if DIFF <0 then we assume that the RCM reduces precipitation, relative to its driving GCM. This method is employed in the qualitative part of the analysis.
2.2.3 Analysis of variance
Additionally, we employ an ANOVA decomposition (Déqué et al., 2007, 2012), in order to understand whether it is the RCMs or their respective driving GCMs that are responsible for controlling precipitation over the historical (1985–2005) period and the future period (2065–2095). For this purpose, we use two quantities, namely the “inter-RCM” variance and the “inter-GCM” variance, as in Déqué et al. (2012). More specifically, the inter-RCM variance is the variance between all the RCM simulations that are driven by the same GCM. Subsequently, all variances obtained for all driving GCMs are averaged.
The quantity Pj is the monthly precipitation obtained from all RCMs (j) that were driven by the same GCM. The quantity Pj is the mean monthly precipitation obtained by all RCMs (j) that share a common driving GCM. As a final step, the average of all variances is calculated.
Similarly, the inter-GCM variance describes the variance between all the GCMs that were used to drive a single RCM and then averaged over all the variances obtained for all driven RCMs. N refers to all available simulations contributing to either the inter-RCM or inter-GCM variance.
Likewise, the average of all variances is calculated.
Both inter-RCM and inter-GCM variances are normalized by the total variance obtained for all months, as in Vautard et al. (2021), so that all values for historical and projection runs and RCM and GCM simulations are comparable. A schematic of the process described above is provided in Fig. S1.
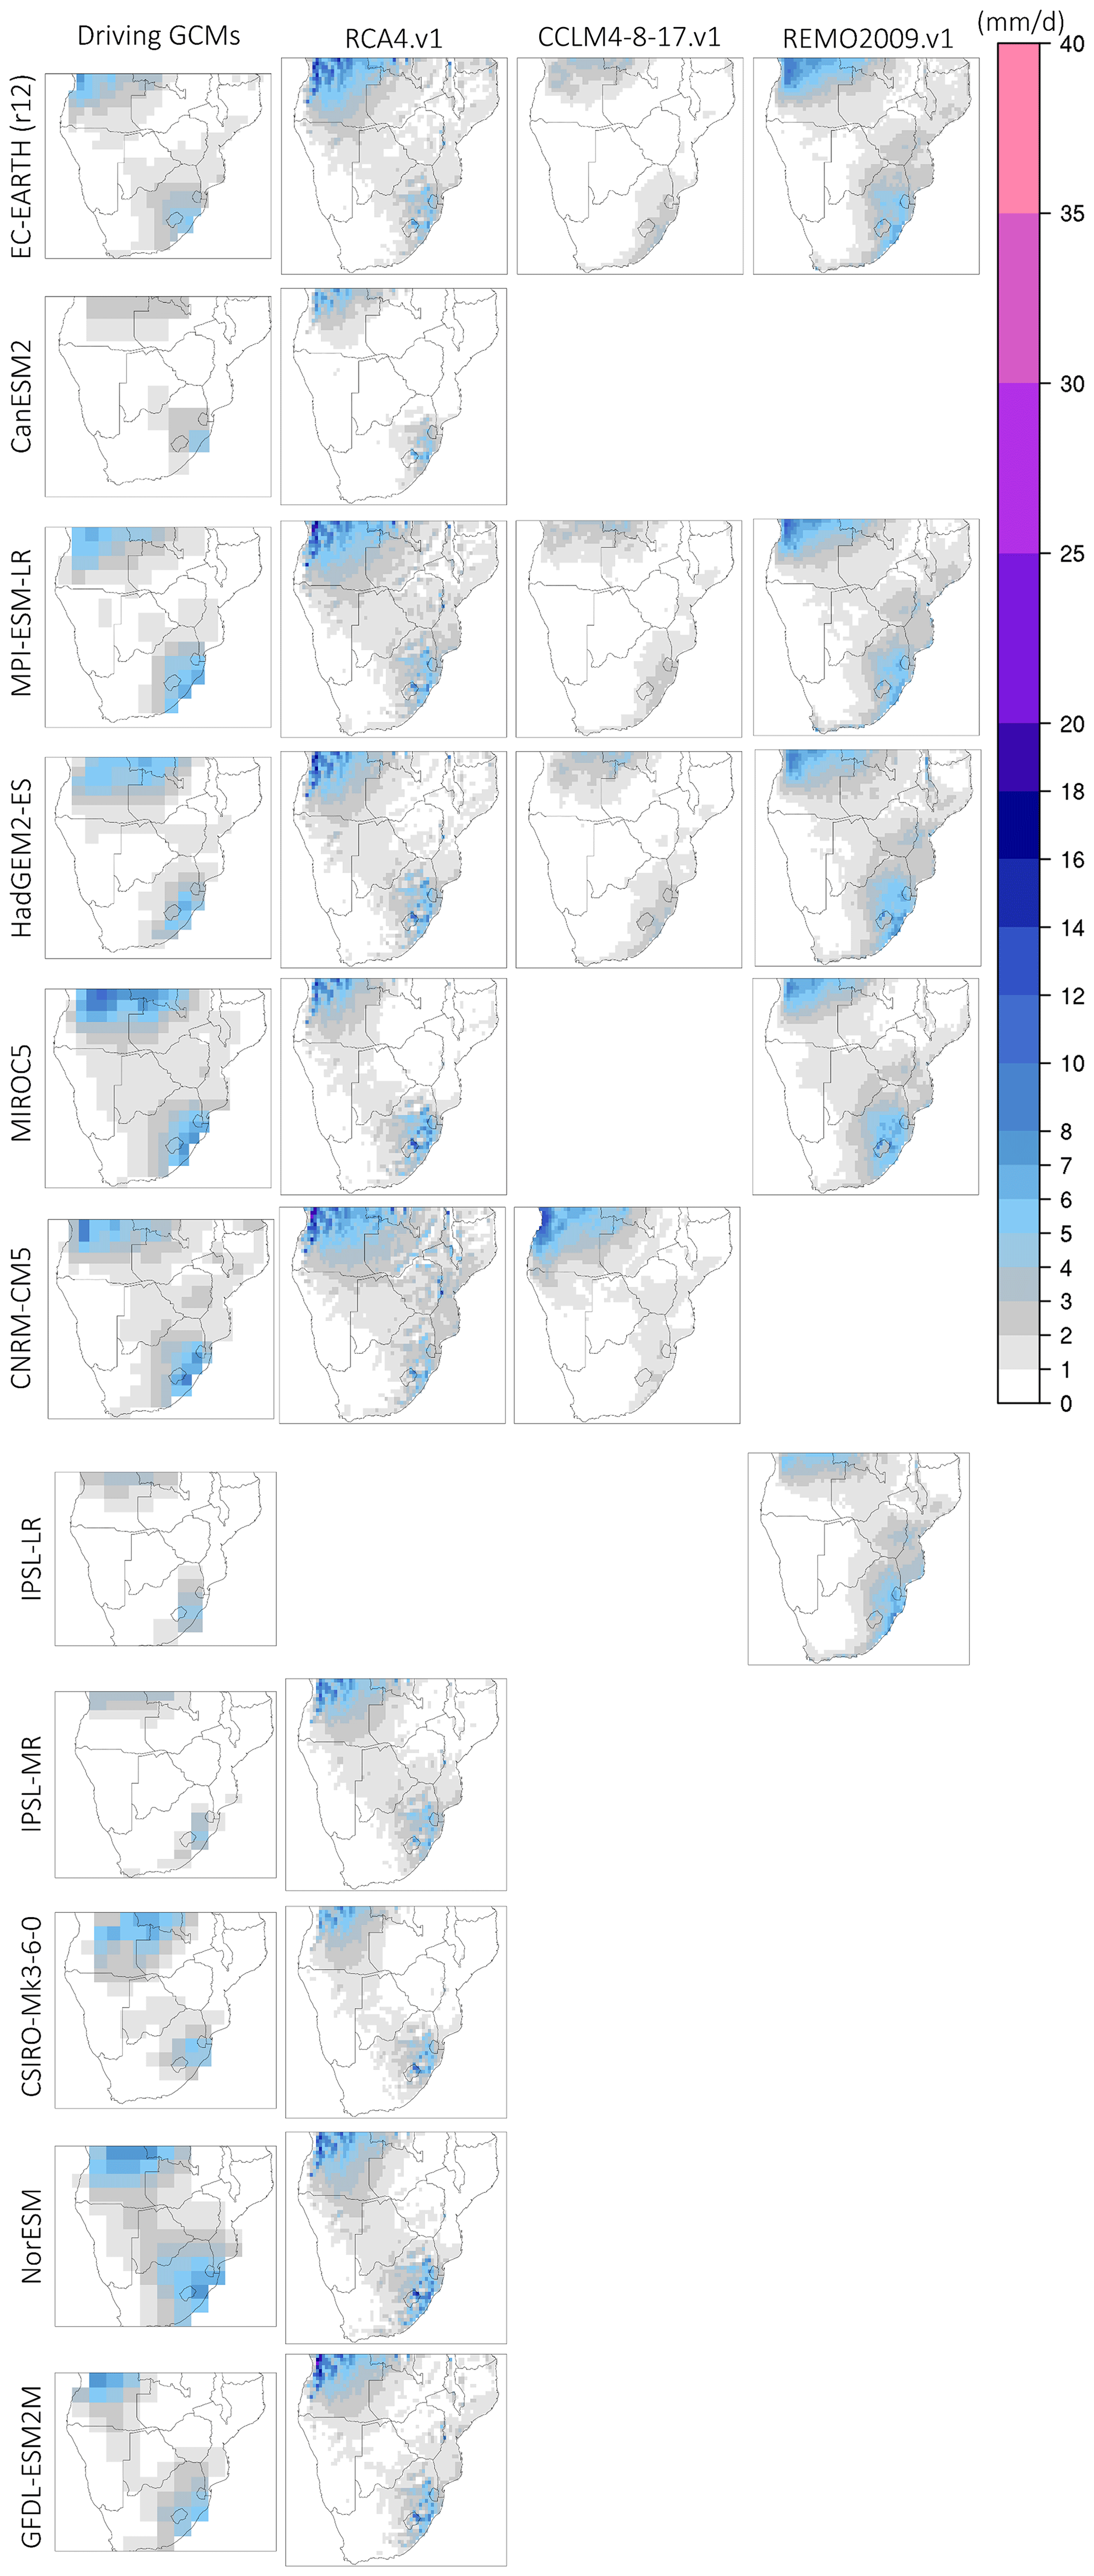
Figure 3Monthly precipitation climatologies (mm d−1) during October for the period 1985–2005. The first column (from the left) displays precipitation from the driving GCMs, and columns 2–4 display the downscaled precipitation output from RCA4.v1, CCLM4-8-17.v1, and REMO2009.v1.
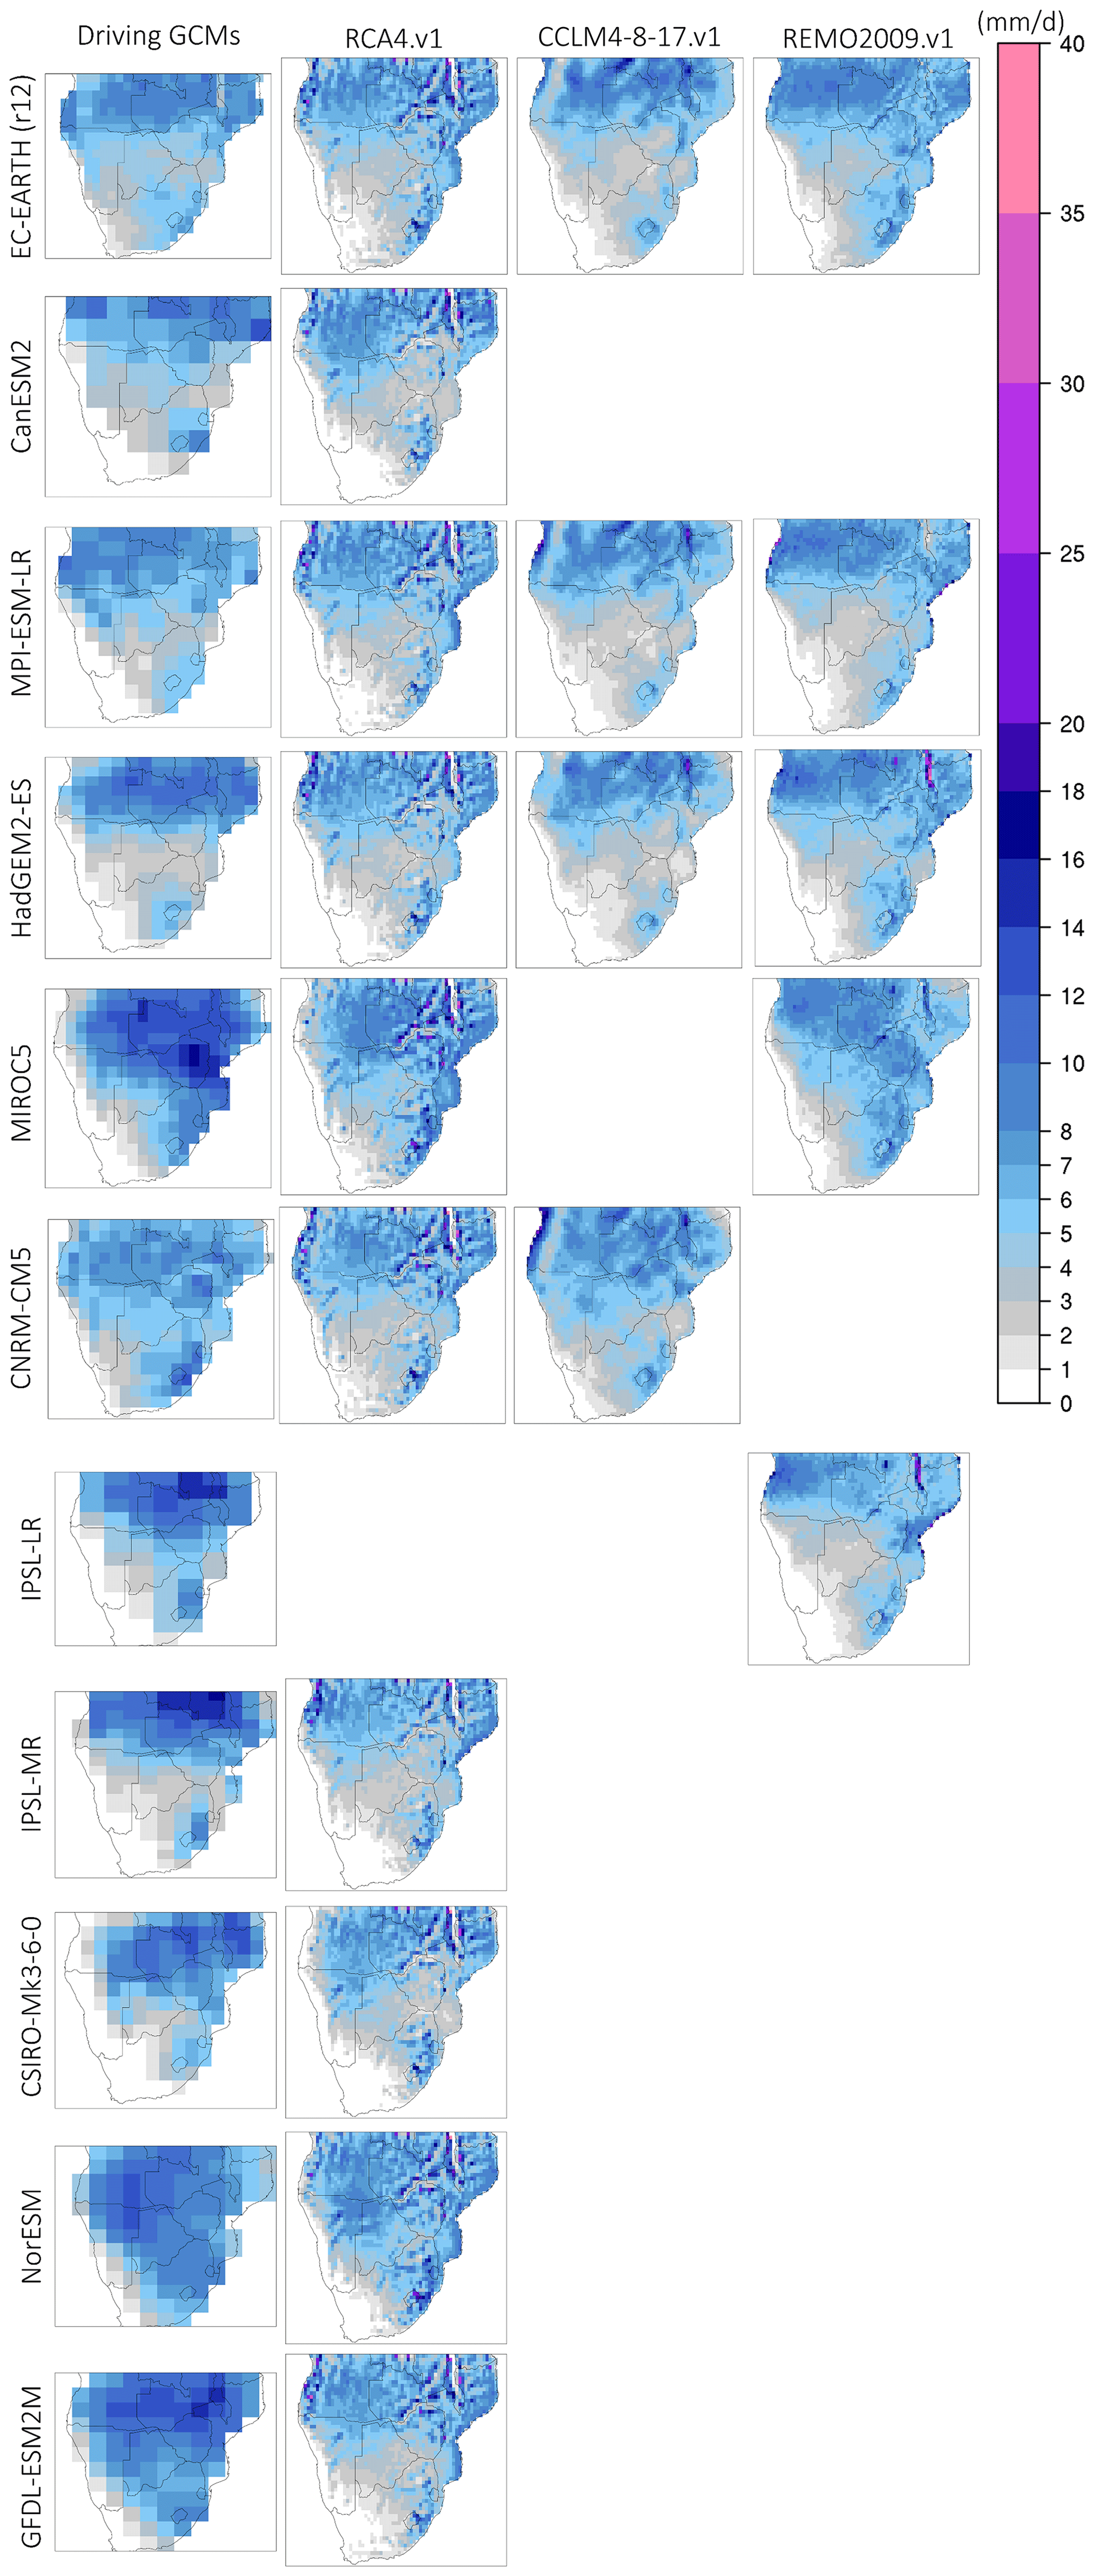
Figure 4Monthly precipitation climatologies (mm d−1) during January for the period 1985–2005. The first column (from the left) displays precipitation from the driving GCMs, and columns 2–4 display the downscaled precipitation output from RCA4.v1, CCLM4-8-17.v1, and REMO2009.v1.
The October and January precipitation climatologies for the period 1985–2005 are displayed in Figs. 3 and 4, respectively. We use October and January climatologies because these 2 months may be considered representative of the distinctive processes controlling precipitation over SAF (see Sect. 2.2). We avoid using seasonal means, since the temporal averaging of precipitation often obscures attributes that are better identified on a monthly level. The remaining months of the rainy season are shown in the Supplement. More specifically, we use October as it is the month that heralds the onset of the rainy season and is often associated with weak precipitation and convective processes that are mainly due to excess surface heating. Also, it is during October that the most intense formations of the heat low expression of the AL are observed. Likewise, we use January as it represents the core of the rainy season, with very strong large-scale precipitation, mainly from the southeastern (SE) part of SAF, through transient synoptic-scale low-pressure systems.
As is displayed in Fig. 3, precipitation during October occurs in the northwestern (NW) part and the SE part of SAF. Precipitation in the NW part is associated with the southward migration of the rainband (Nicholson, 2018), while precipitation over the SE part is associated with an early formation of the tropical temperate troughs (TTTs). As is evident from Fig. 3, CCLM4-8-17.v1 reduces precipitation amounts (approximately 4–5 mm d−1) in both the NW and SE parts of SAF relative to the lateral boundary forcing it receives. In contrast, RCA4.v1 systematically enhances precipitation amounts, regardless of the driving GCM. Also, precipitation according to RCA4.v1 displays a very localized spatial pattern with very strong spatial heterogeneity. This attribute is indicative of specific structural model biases related to how high-resolution elevation affects precipitation in RCA.v1 (Van Vooren et al., 2019). This is particularly evident in the mountainous region over coastal Angola. REMO2009.v1 also enhances precipitation amounts regardless of the driving GCM; however, this is in a much more spatially homogeneous way than RCA4.v1.
As is shown in Fig. 4, high precipitation amounts during January are observed over the northern and eastern regions of SAF. During January, differences among the driving GCMs become more pronounced; however, all models agree on the dry conditions observed over the southwestern (SW) part of SAF. With regard to the downscaled products, CCLM4-8-17.v1 produces high precipitation amounts over the central part of northern SAF but displays varying amounts of precipitation over the coastal parts, depending on the driving GCM. RCA4.v1 downscales precipitation in a very localized pattern and enhances precipitation over areas with steep terrain. Also, precipitation over the Lake Malawi region is particularly enhanced, regardless of the driving GCM. REMO2009.v1 displays similar precipitation amounts to its driving GCMs; however, it enhances precipitation over the coastal part of Angola and Mozambique and yields excess precipitation over Lake Malawi when it is driven by HadGEM2-ES and IPSL. The monthly climatologies for the rest of the rainy-season months are shown in the Supplement (Figs. S2–S5).
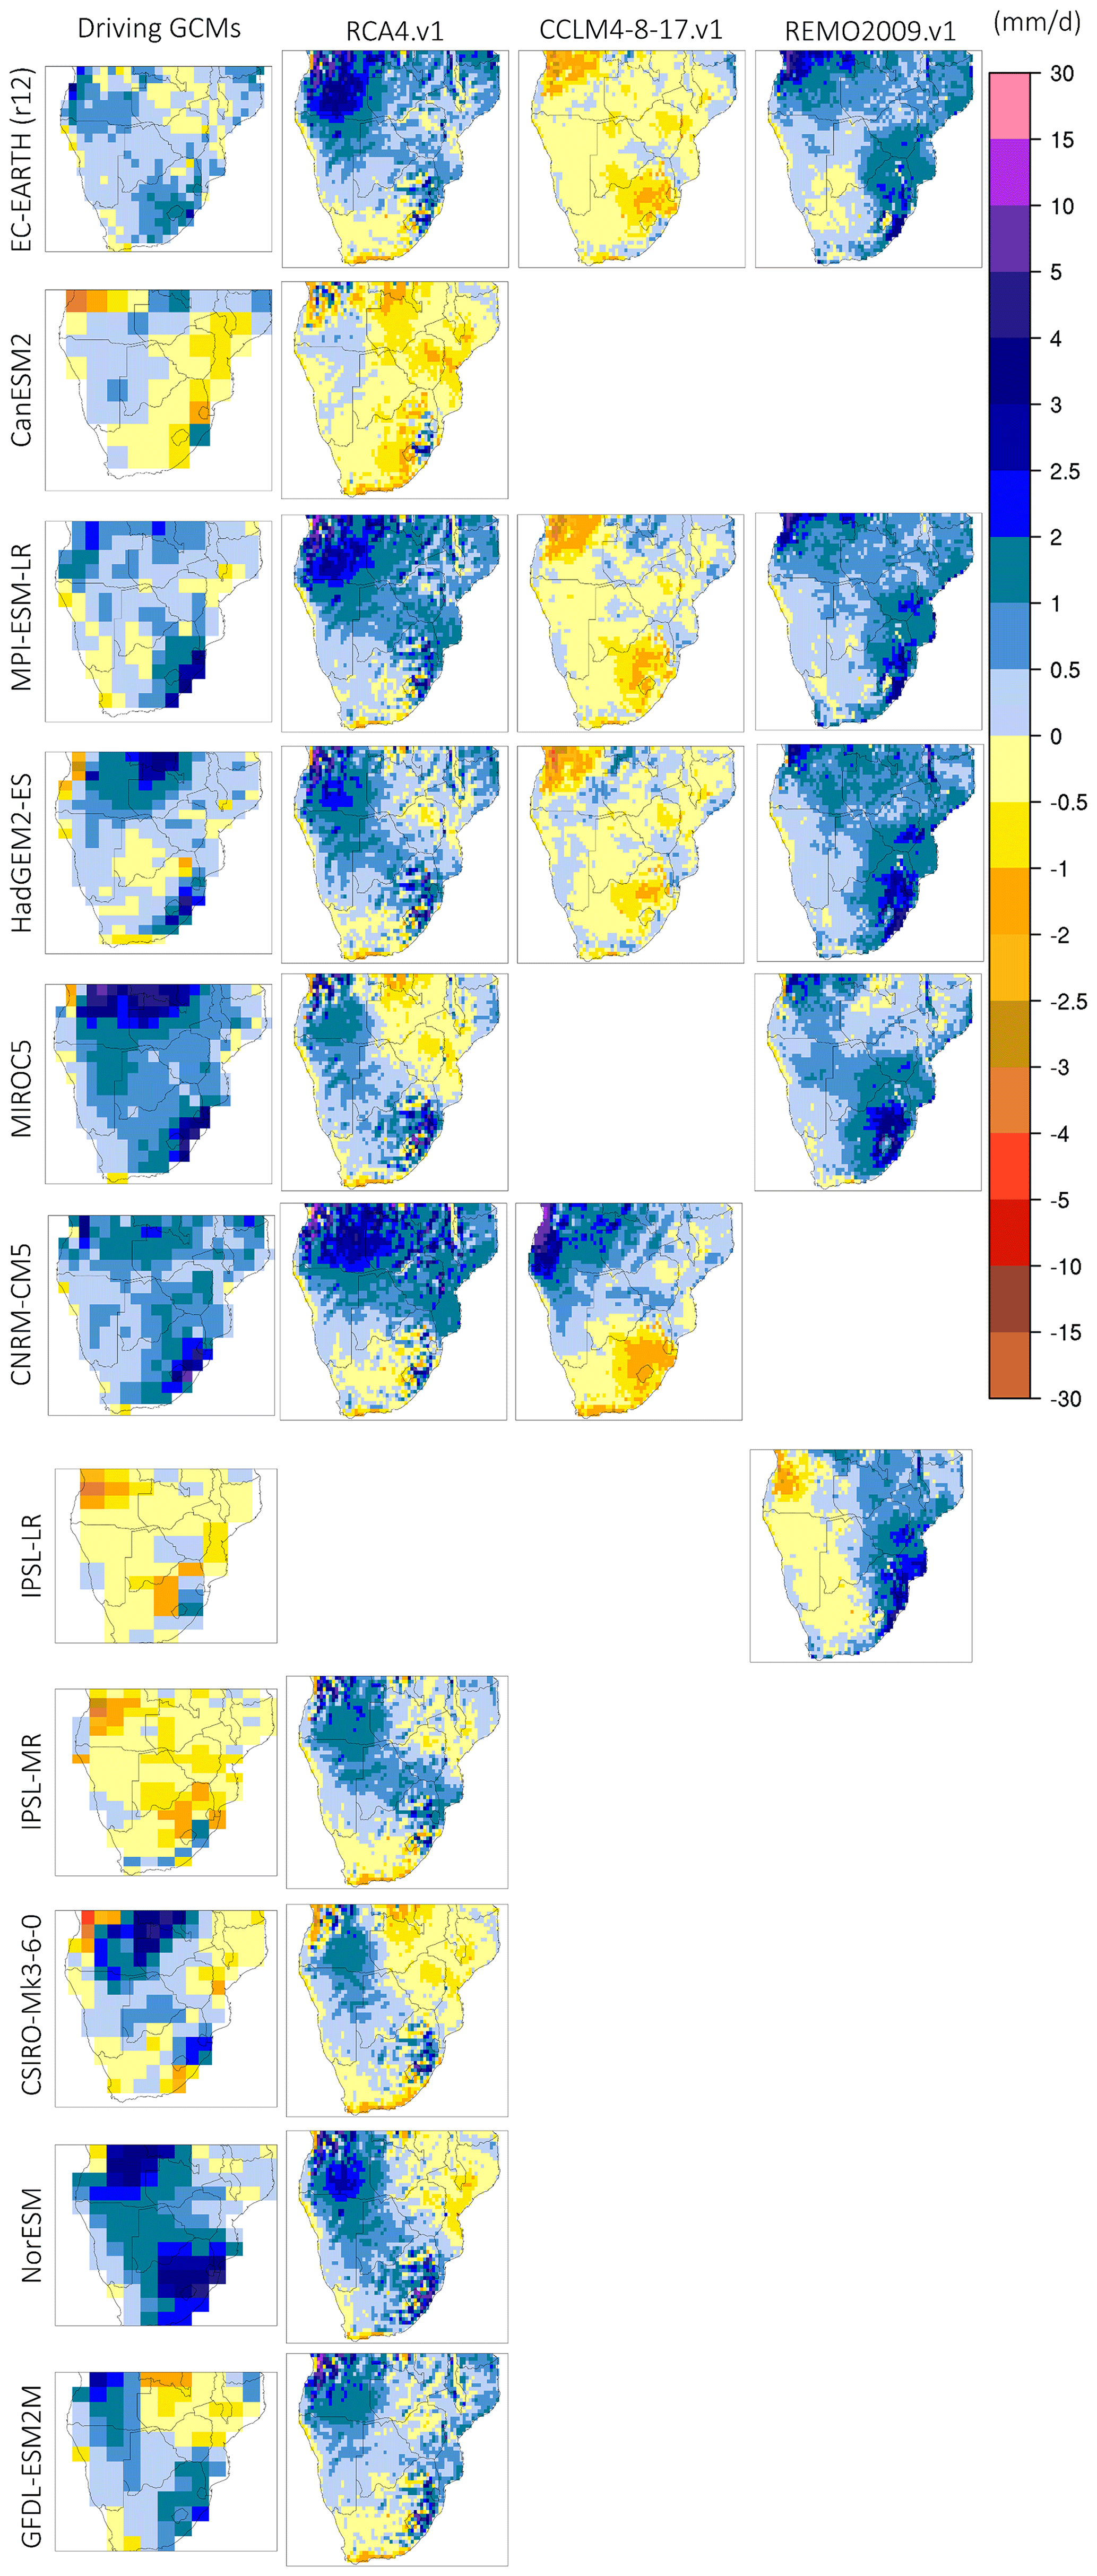
Figure 5Monthly precipitation bias (model–CHIRPS, in mm d−1) during October for the period 1985–2005. The first column (from the left) displays the biases in the driving GCMs, and columns 2–4 display the biases in the downscaled precipitation output according to RCA4.v1, CCLM4-8-17.v1, and REMO2009.v1.
In Fig. 5 the monthly precipitation bias for October over SAF is shown. Biases are calculated using the CHIRPS satellite rainfall product as a reference. With the exception of IPSL-CM5A (LR/MR) and CanESM2, all other GCMs display a consistent wet bias that ranges from 0.1 to 30 mm d−1 (in isolated areas), with most values over SAF falling between 0.1 and 3 mm d−1. Overall, the same pattern generally holds for RCA4.v1 and REMO2009.v1, while CCLM4-8-17.v1 displays a systematic dry bias that reaches 2 mm d−1, when forced with EC-EARTH, MPI-ESM-LR, and HadGEM2-ES. More specifically, concerning RCA4.v1, the region where the highest wet bias is observed is over the Angola region and over the NW parts of coastal Angola. The dry bias regions in RCA4.v1 are identified over the northeastern (NE) and southern parts of SAF and they rarely exceed −1.5 mm d−1.
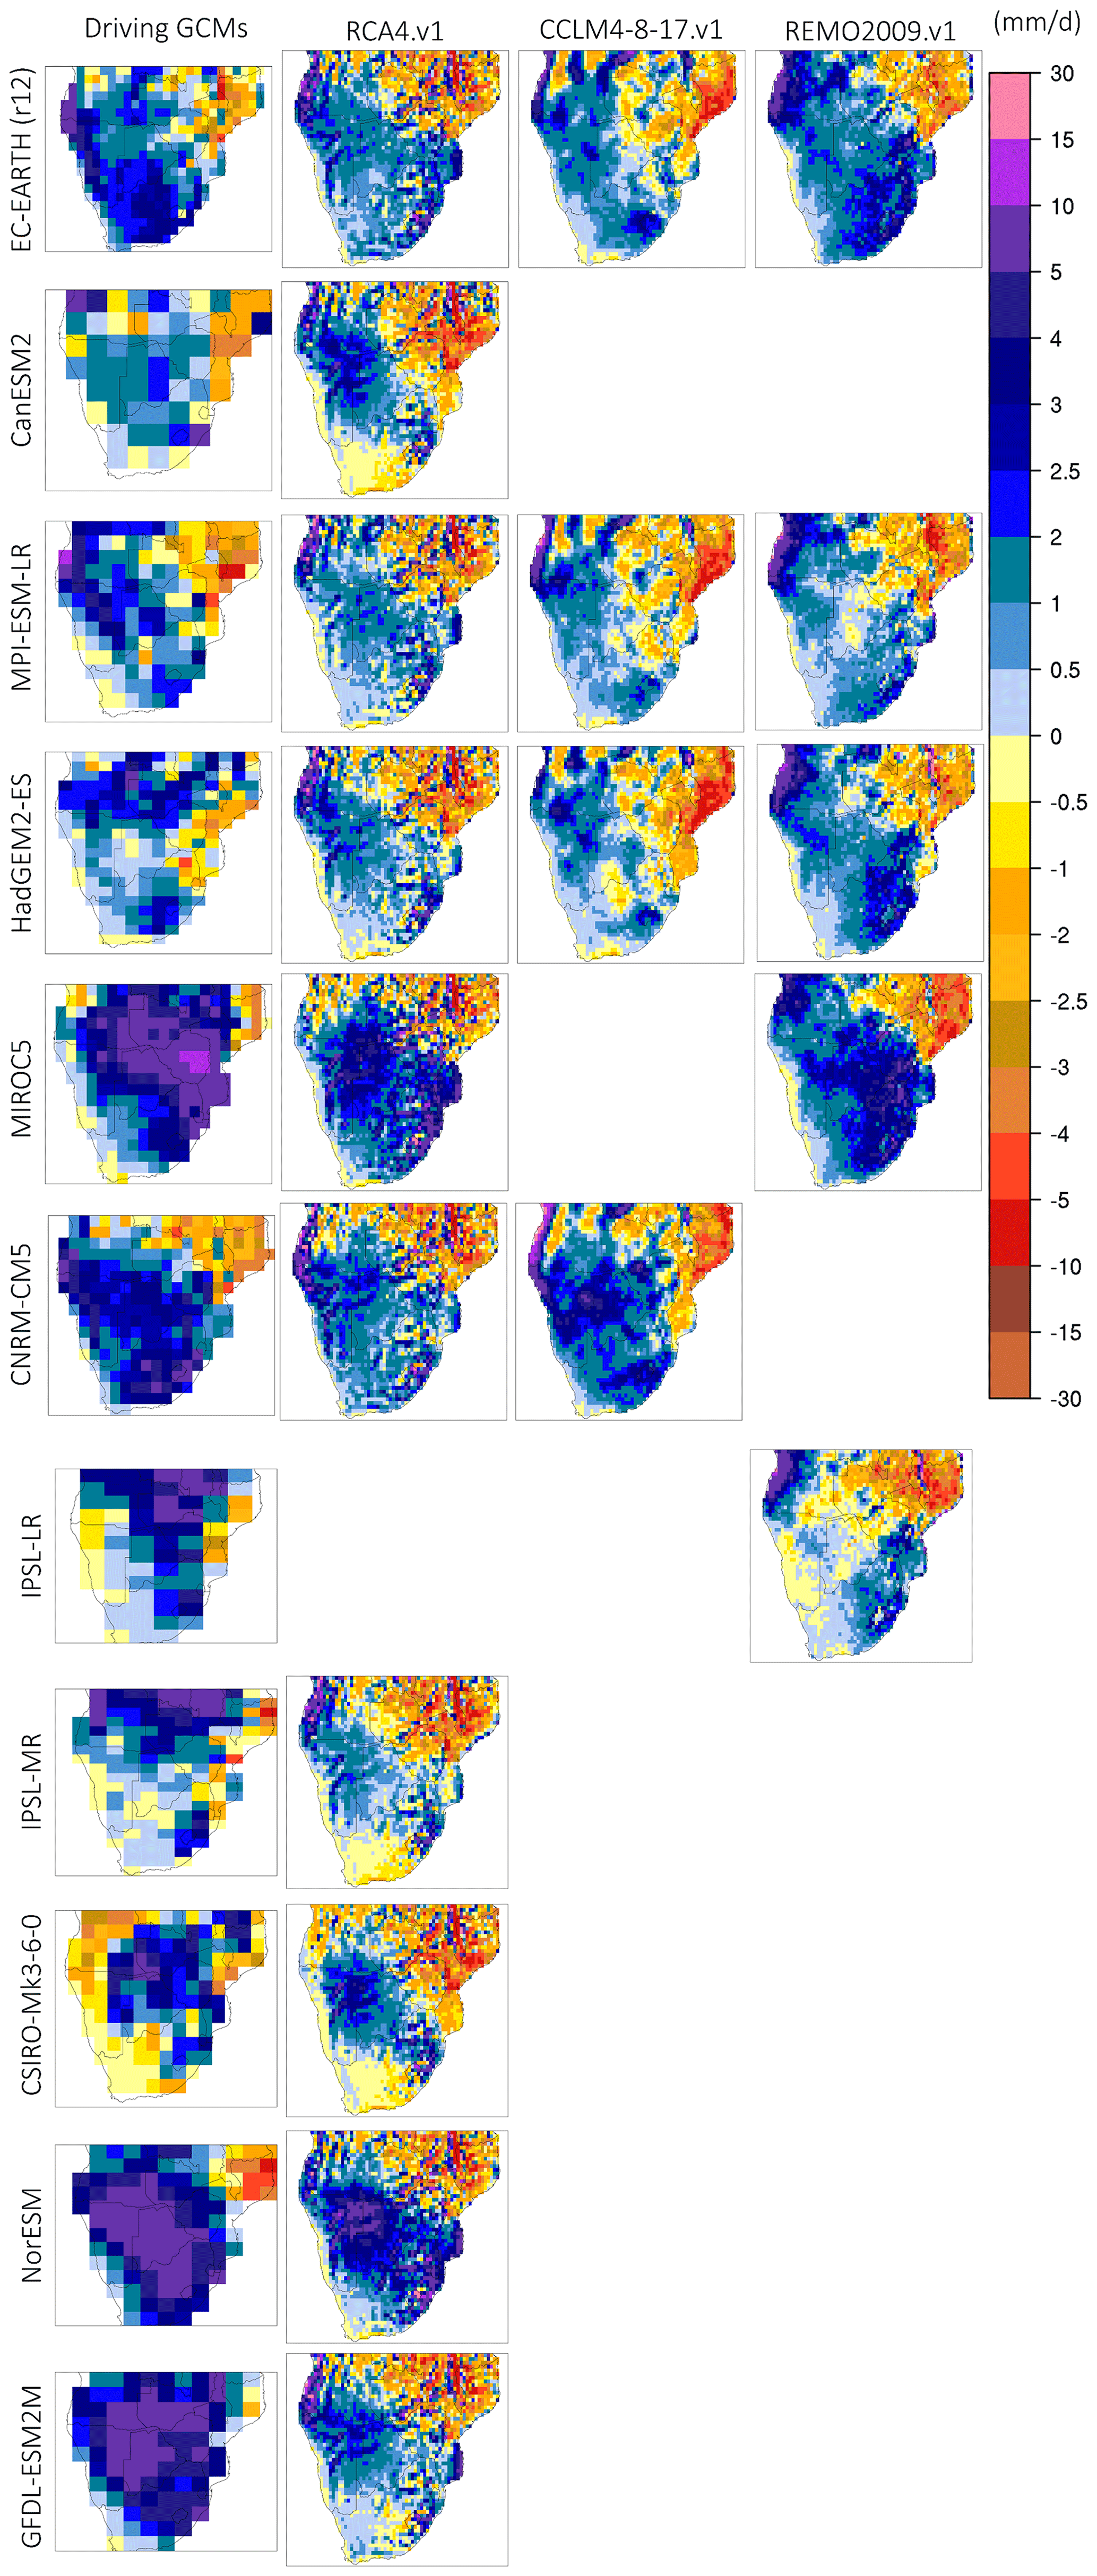
Figure 6Monthly precipitation biases (model–CHIRPS, in mm d−1) during January for the period 1985–2005. The first column (from the left) displays precipitation biases from the driving GCMs used, and columns 2–4 display the biases in the downscaled precipitation output according to RCA4.v1, CCLM4-8-17.v1, and REMO2009.v1.
The monthly precipitation biases for January over SAF are shown in Fig. 6. There is a prevailing wet bias identified in almost all GCMs that typically reaches 3–3.5 mm d−1; however, in MIROC5, NorESM, and GFDL-ESM2M the biases exceed 5 mm d−1 over a major part of SAF. Another feature that systematically appears in GCMs is a dry bias over the NE part of SAF. This bias pattern is also identified in almost all RCMs with a systematic wet bias over central and western SAF and a region of dry bias in the NE part. More specifically, in RCA4.v1 and REMO2009.v1, there is a dry bias over the NE and the southern coast of SAF, while in CCLM4-8-17.v1 the dry bias over the eastern region extends inland to cover almost the whole of Mozambique. Another interesting feature is identified around the Angolan coast, where wet biases exceed 5 mm d−1, while over an adjacent region there is a strip of dry biases that reaches 2 mm d−1. Considering the abrupt increase in elevation and the steep escarpment over the coastal Angola–Namibia region, this is possibly caused by local circulation driving excess moisture transport from the Atlantic Ocean and overly aggressive orographically triggered precipitation on the windward side of the topography (wet bias strip) that leads to dry conditions in the lee side (dry bias strip) (Howard and Washington, 2018). It is noted that the wet bias over the coastal region is identified in most of the RCA4.v1 simulations and in all REMO2009.v1 simulations; however, the dry bias in the lee side is seen in CCLM4-8-17.v1 only. The monthly precipitation biases for the rest of the rainy season months are shown in the Supplement (Figs. S6–S9). Monthly precipitation biases averaged over southern Africa (SAF-All), and the three subregions examined are displayed in Fig. S10.
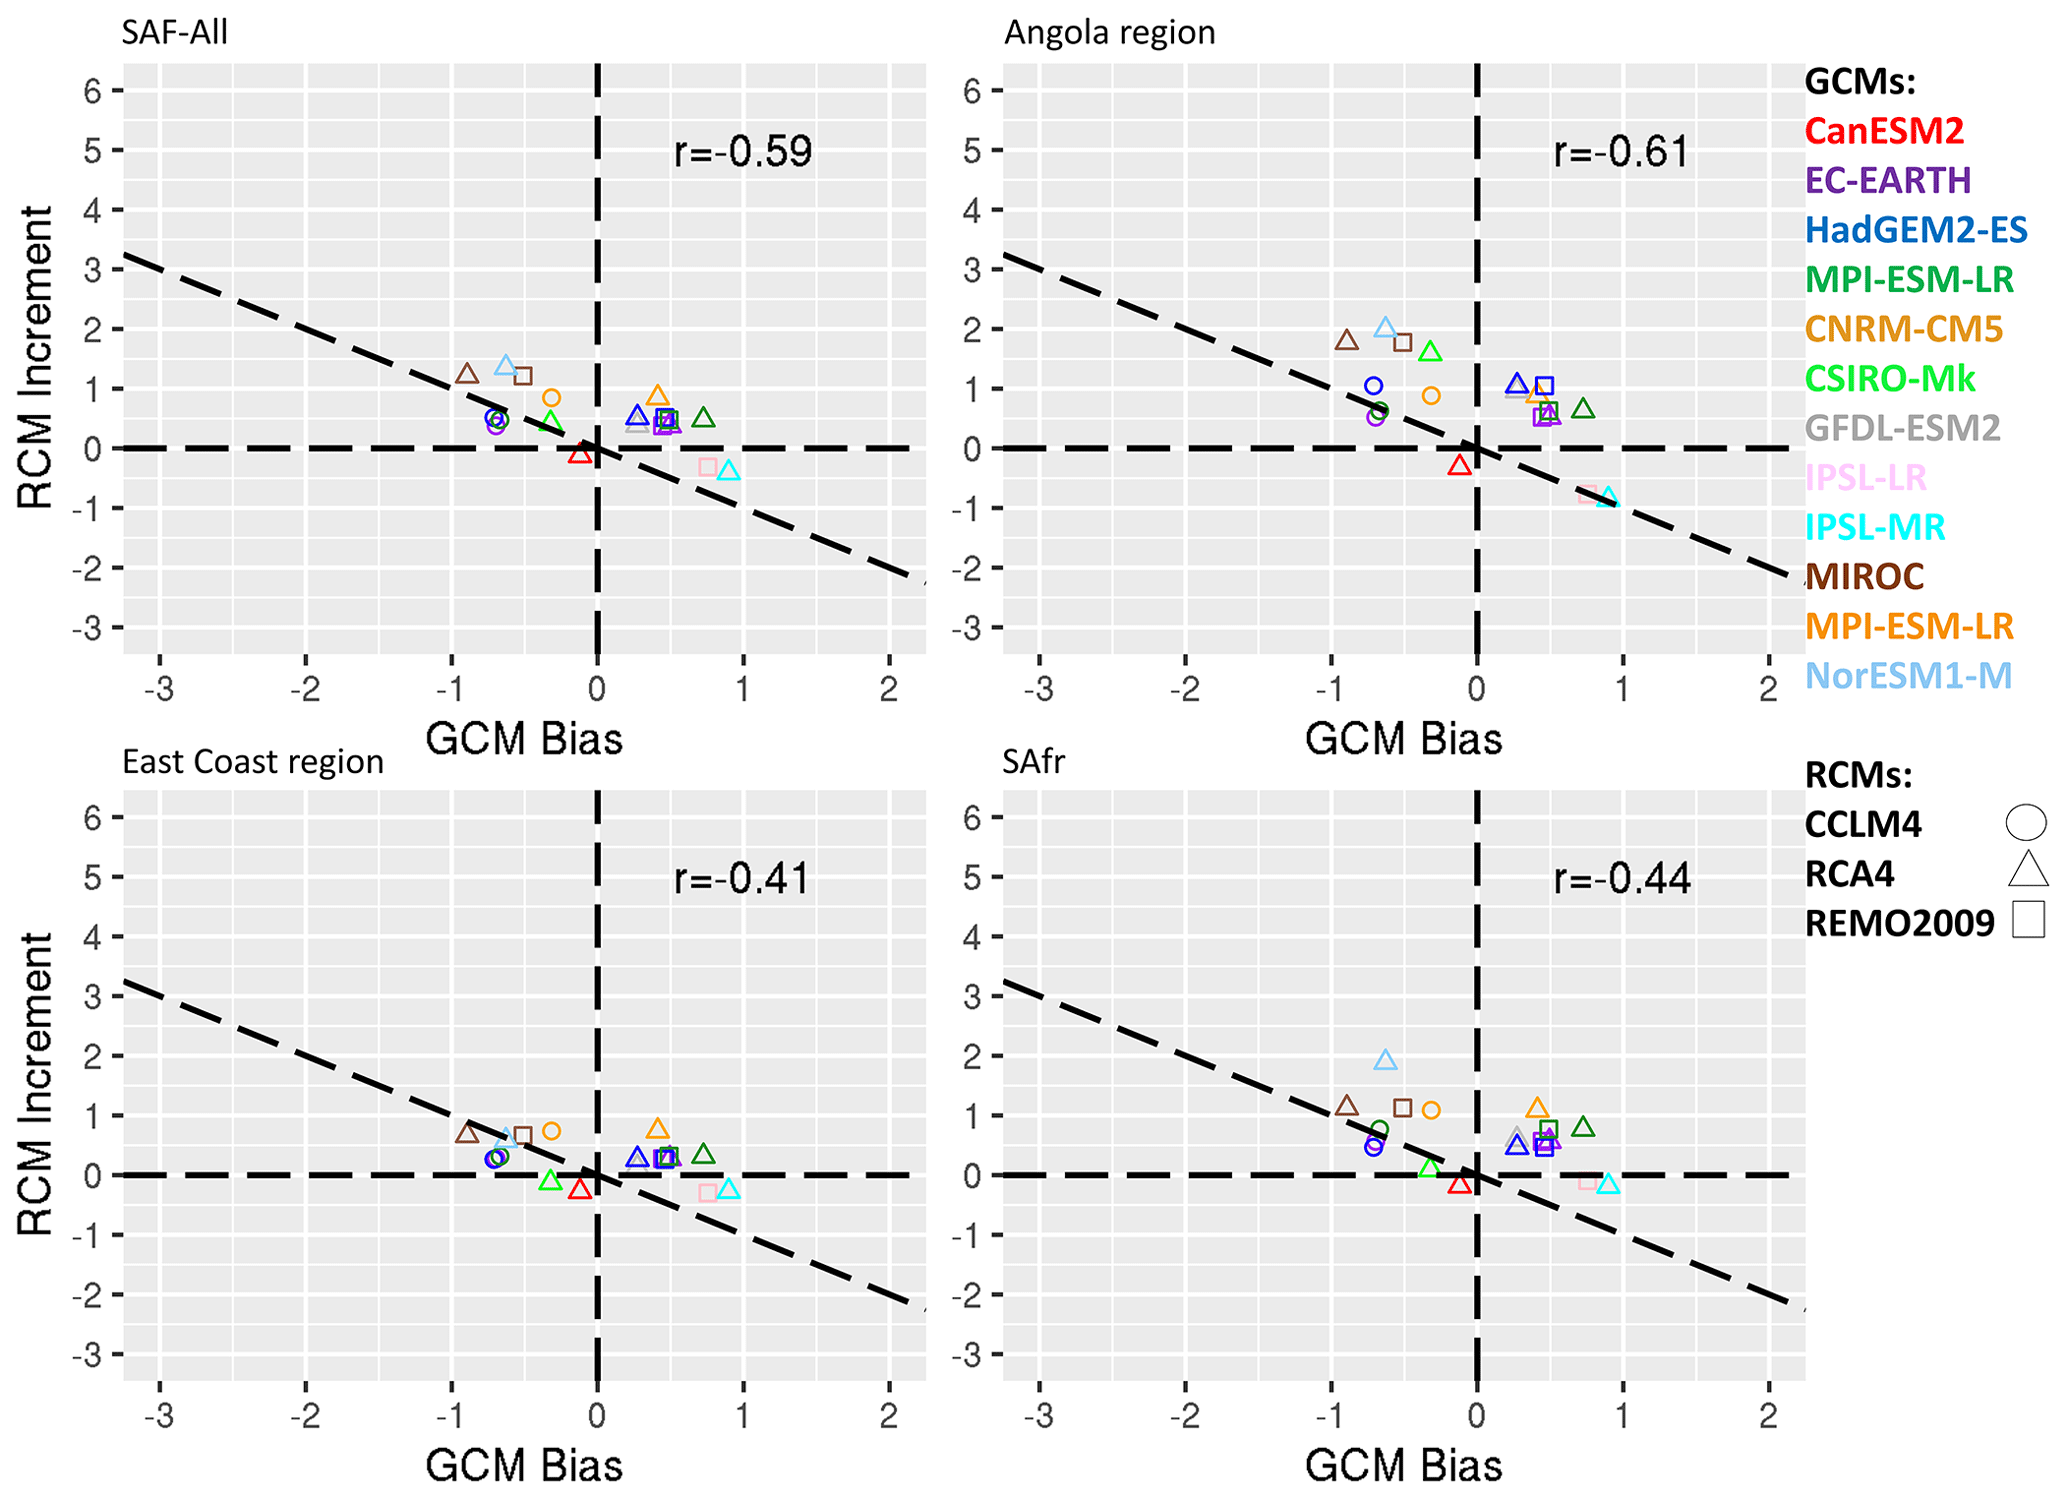
Figure 7Scatterplots of the RCM increment (RCM − GCM) for precipitation (mm d−1) as a function of the GCM bias (GCM-OBS) for October. Colours indicate the driving GCM, and shapes indicate the downscaling RCMs. The four panels indicate spatial averages over southern Africa (SAF-All region), the Angola region, the East Coast region, and the SAfr region, respectively.
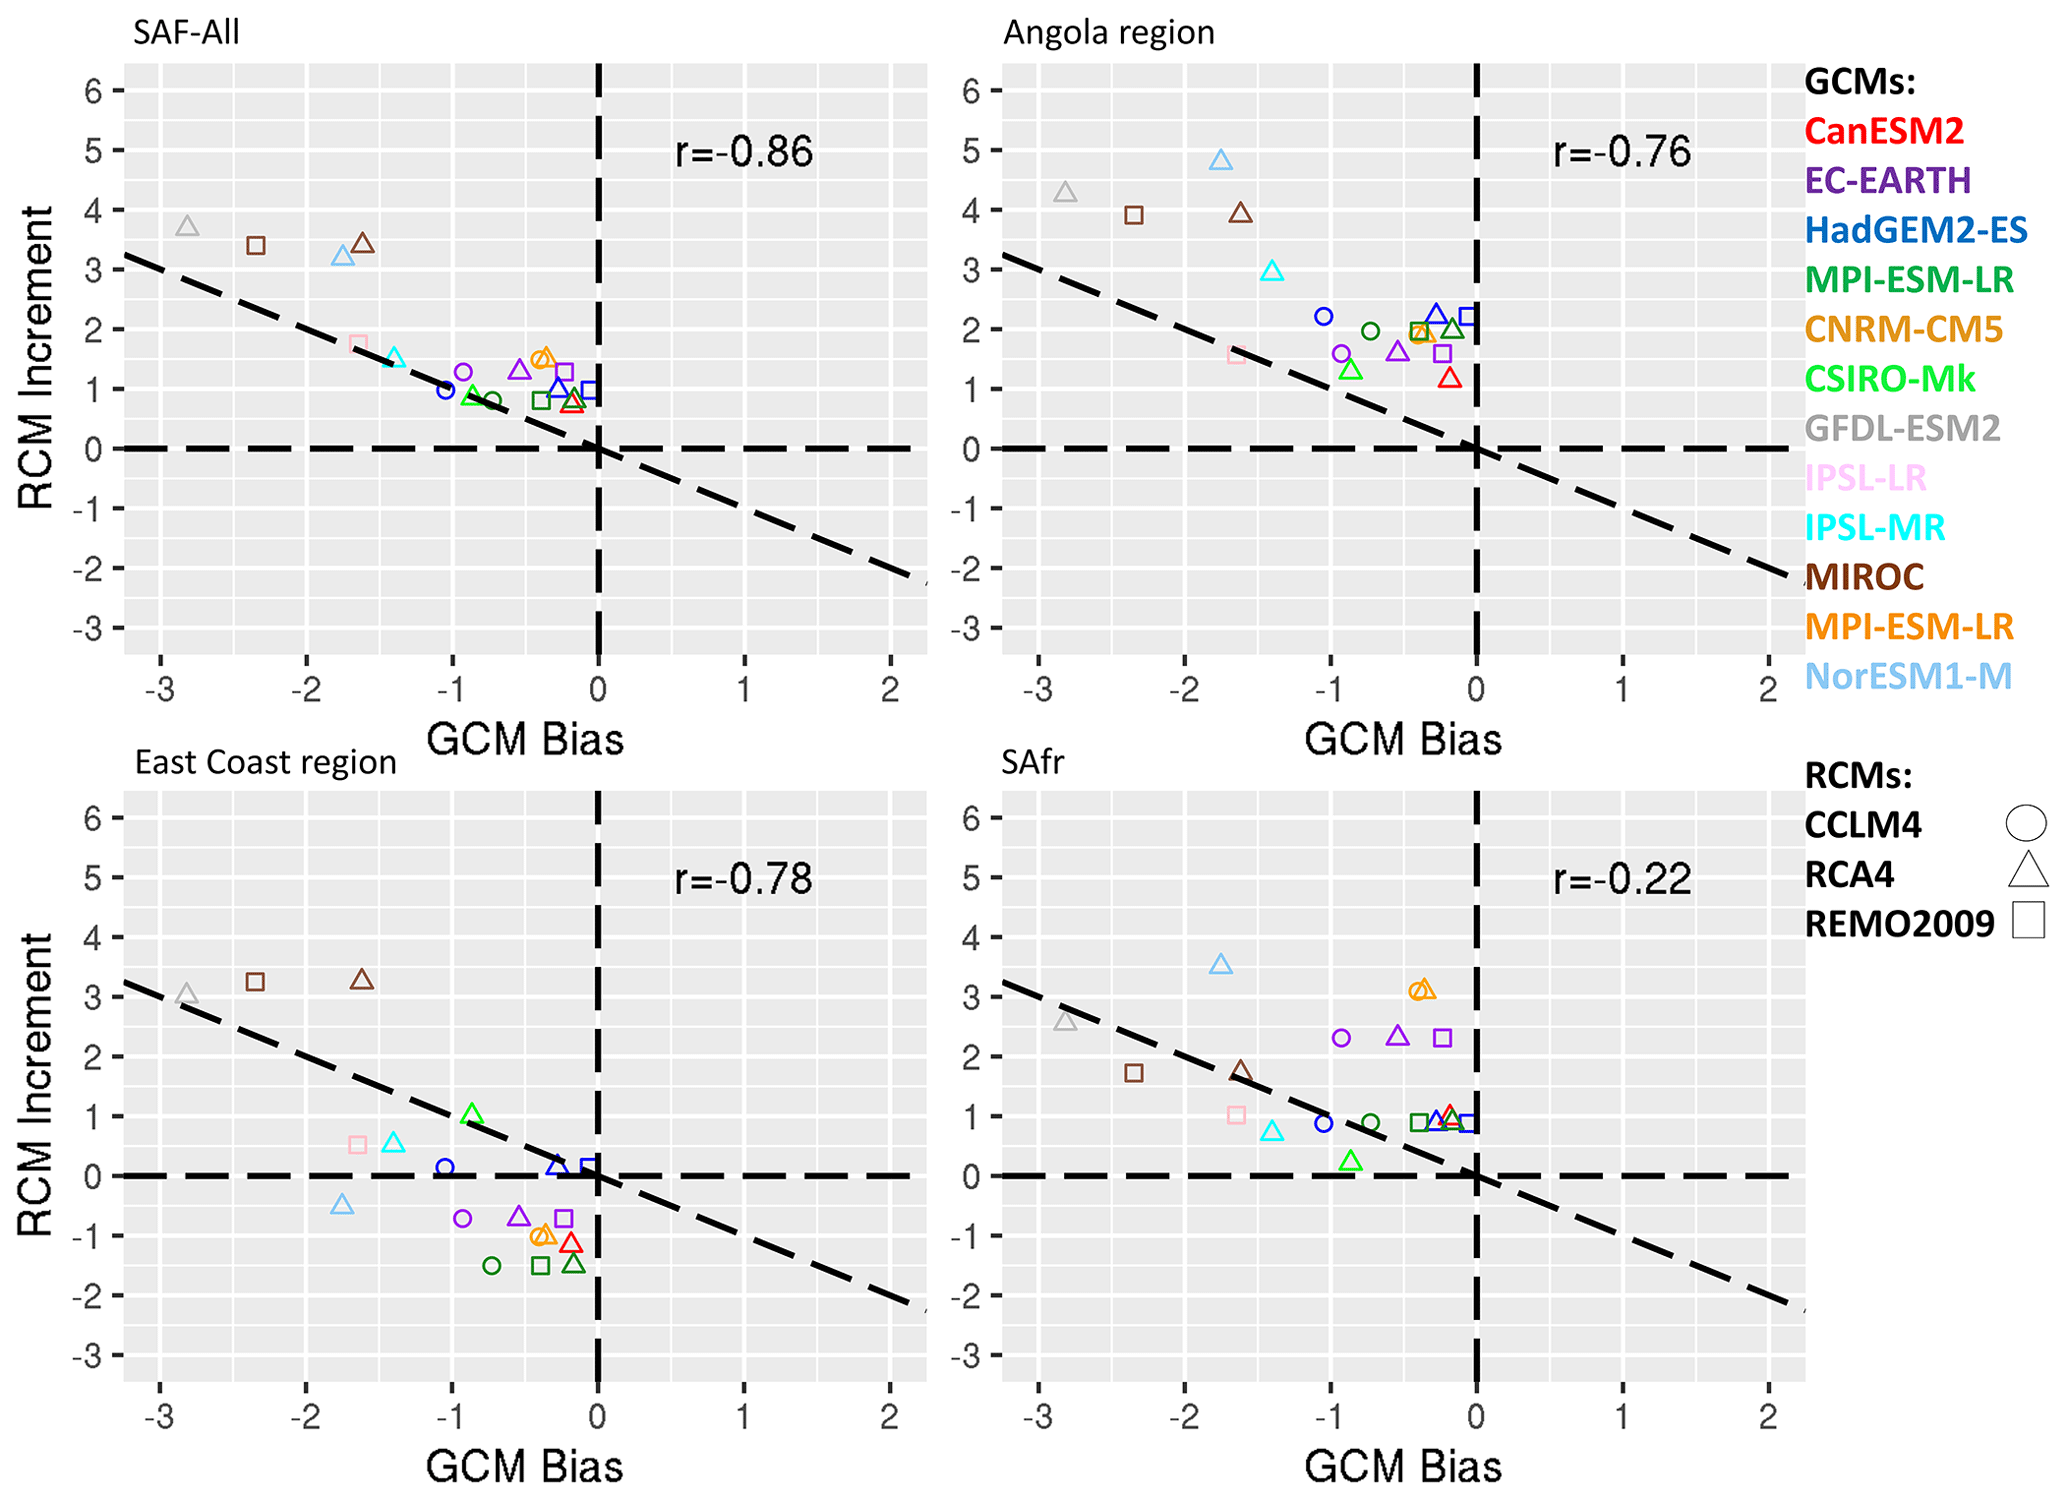
Figure 8Scatterplots of the RCM increment (RCM − GCM) for precipitation (mm d−1) as a function of the GCM bias (GCM-OBS) for January. Colours indicate the driving GCM, and shapes indicate the downscaling RCMs. The four panels indicate spatial averages over southern Africa (SAF-All region), the Angola region, the East Coast region and the SAfr region, respectively.
A more detailed look into specific subregions over SAF where certain climatological features and processes are at play can help us gain a more in-depth insight into how the precipitation biases are distributed during each month of the rainy season and whether or not the RCMs display any improvement relative to their driving GCMs. For this reason, we plot the RCM increments (RCM − GCM) as a function of the GCM biases (GCM-OBS). The results for October over SAF and the three subregions are displayed in Fig. 7. In general, all points are identified close to the line; hence, there is a tendency that RCMs systematically counteract GCM biases. There are nonetheless substantial differences between the four regions. For instance, over the SAF-All region the IPSL-MR GCM has a wet bias equal to almost 1 mm d−1, which is counteracted by RCA by an increment of −0.4 mm per month. Other RCA simulations when driven by HadGEM2-ES, CNRM-CM5, or EC-EARTH display an RCM increment similar to that of the GCM bias, hence RCMs mitigate the GCM bias. Over the Angola region most of the RCMs display an RCM increment that is nearly equal to the GCM bias. Similar conclusions are drawn for the East Coast and the South Africa regions. The RCM increments as a function of the GCM biases for January are shown in Fig. 8. For all regions except for the SAfr region points lie close to the line; hence, RCM increments counteract the GCM biases overall. The scatterplots for the rest of the months of the rainy season are shown in the Supplement (Figs. S11–S14). In general, although precipitation in RCMs is strongly dependent on the driving GCMs, the RCM increments are anticorrelated to the GCM biases. The anticorrelations are particularly strong for the December–March period of the rainy season over the SAF-All region and the Angola and East Coast subregions but not over the SAfr subregion (Fig. S15).
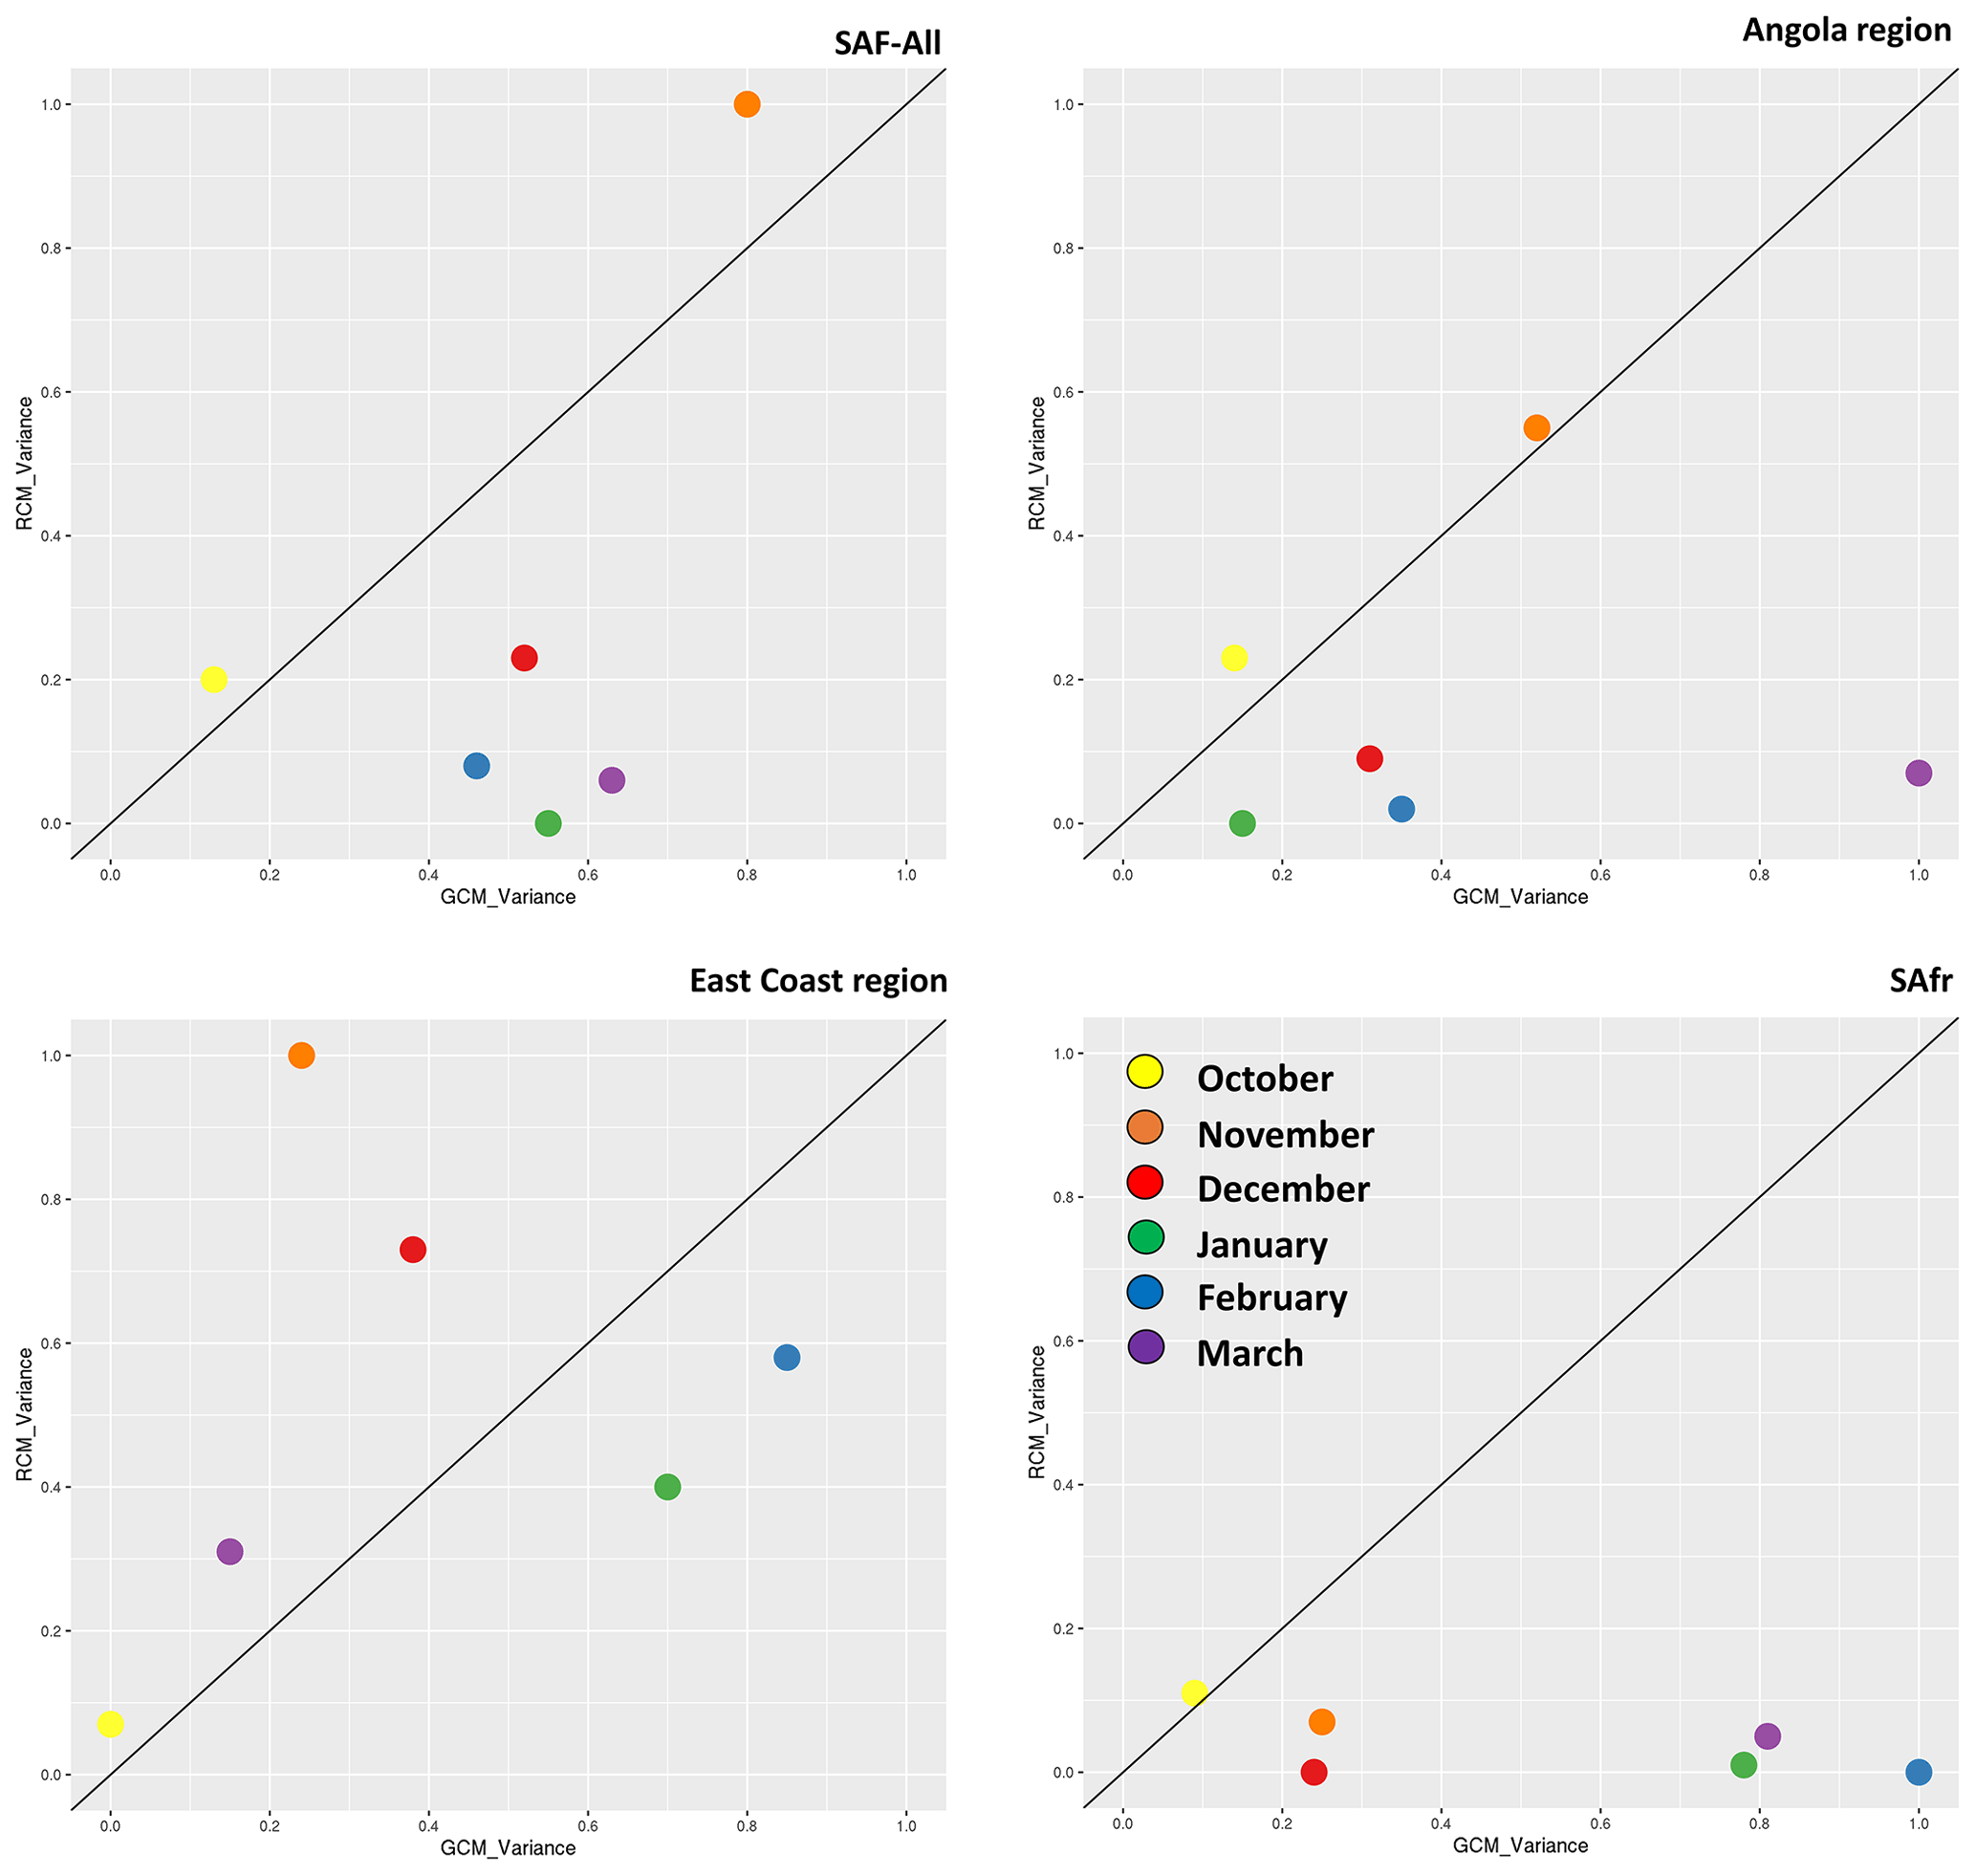
Figure 9Analysis of variance for monthly precipitation during 1985–2005 for southern Africa (SAF-All region) and the three sub-regions examined, namely the Angola region, East Coast region, and the SAfr region, respectively. The x and y axes display standardized precipitation variances.
In Fig. 9 the analysis of variance of all RCMs driven by the same GCM and of all GCMs driving the same RCM is shown. Values are spatially averaged for southern Africa and the three subregions examined (land grid points only) and refer to the period 1985–2005. In the SAF-All region, monthly precipitation during October and November is dominated by the RCMs, while during January–March, it is the GCMs that play a dominant role in formulating precipitation over SAF. This is indicative of the impact that RCMs exert on the formulation of precipitation during October–November–December and the fact that the contribution from the GCMs becomes secondary during January–February–March. The fact that the contribution of RCMs during October–November–December dominates can be attributed to the fact that precipitation during these months is the result of regional processes that are largely dependent on the coupling between the surface and the atmosphere. The land–atmosphere coupling is a characteristic resolved by the RCMs, through mechanisms simulated by land surface models, planetary boundary layer schemes, convection schemes, etc., making the contribution of the large-scale drivers from the GCM less important. However, during January–February–March we observe that the contribution from the RCMs is reduced, and it is the GCMs that control the monthly precipitation variability. This can be attributed to the fact that during January–February–March it is the large-scale circulation that modulates precipitation over SAF and that the GCMs control the transient synoptic-scale systems that enter SAF. Over the Angola region, the pattern is similar; however, October and November precipitation is closer to the diagonal, indicating an almost equal contribution by both RCMs and GCMs. While the December–February period moves closer to the diagonal, precipitation during March is mainly formulated by GCMs. Over the East Coast region, October remains equally influenced by both RCMs and GCMs; however, November and December are dominated by the influence of the RCMs. Over the SAfr region, precipitation for all months except October is influenced by GCMs.
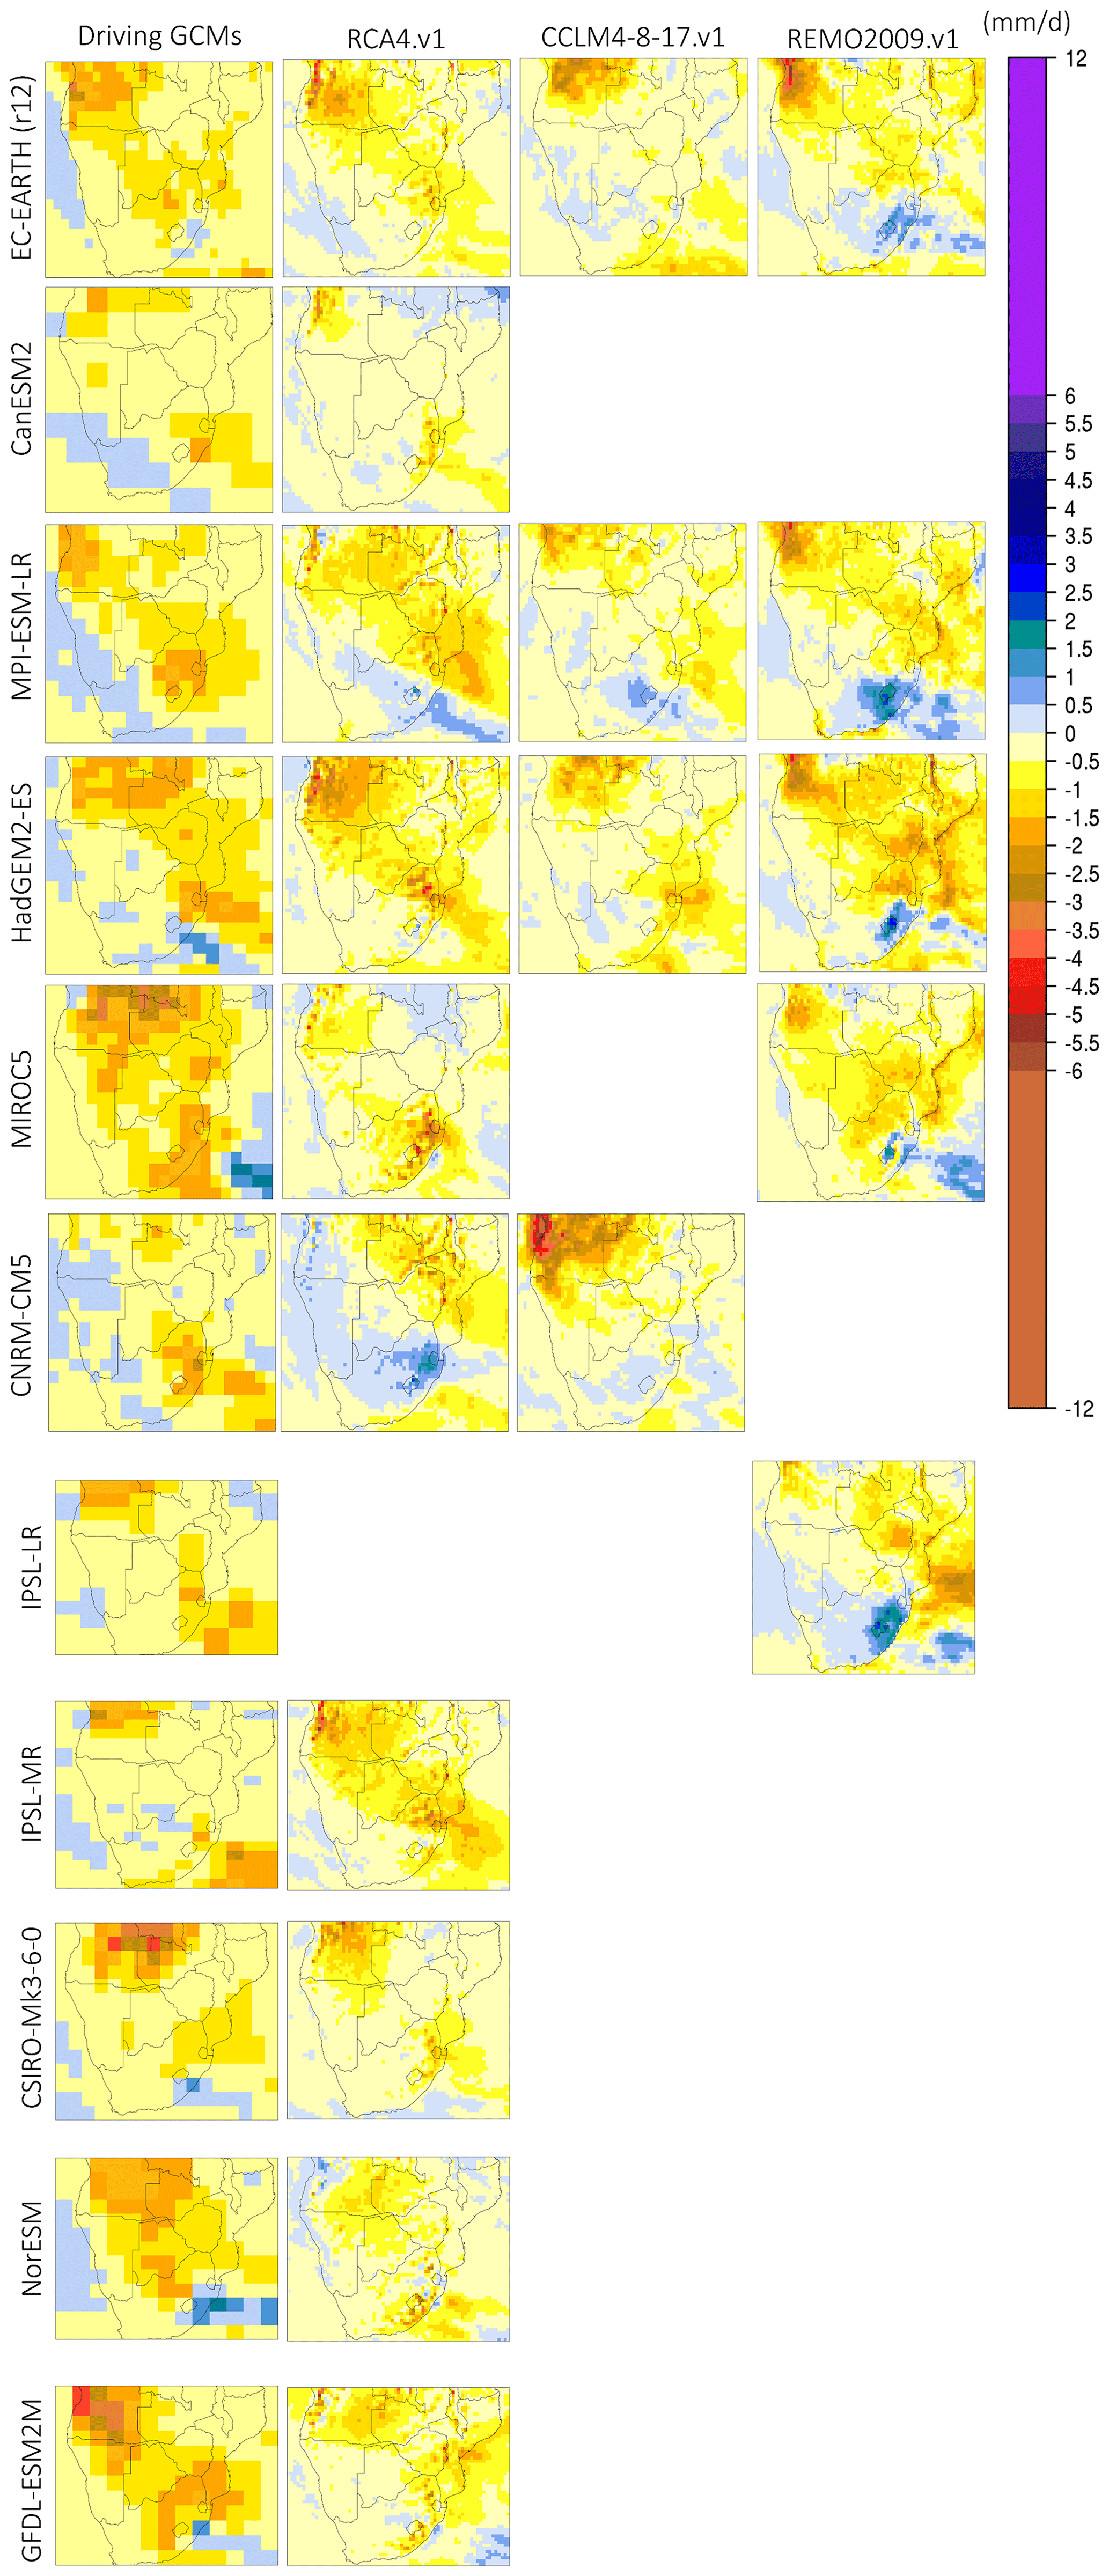
Figure 10Monthly precipitation change (future–present, in mm d−1) during October for the period 2065–2095 relative to 1985–2005. The first column (from the left) displays the precipitation change for the driving GCMs used, and columns 2–4 display the downscaled products according to RCA4.v1, CCLM4-8-17.v1, and REMO2009.v1.
In Fig. 10 the climate change signal for October precipitation over SAF is depicted. All GCMs agree that October precipitation will decline by approximately 2 mm d−1 over the regions that experience precipitation during this period, namely the NW and SE parts of SAF. In addition, some GCMs display a minor precipitation increase (0–0.5 mm d−1) over the SW part of SAF, while some others display a slightly larger (1.5 mm d−1) precipitation increase over the eastern parts of South Africa. Moreover, it is seen that the precipitation change signal is replicated by almost all the downscaling RCMs; nevertheless, there are some considerable differences between the RCMs and their driving GCM. More specifically, RCA4.v1 displays a larger reduction of the precipitation change signal relative to its driving GCM in almost all simulations, both in magnitude and in spatial extent. Precipitation changes in CCLM4-8-17.v1 seem to closely follow the driving GCMs, with a clear exception when CNRM-CM5 is used (the NW part of SAF experiences precipitation decline almost 4 mm d−1 larger than in the driving GCM). The case for when CCLM4-8-17.v1 is driven by CNRM-CM5 may be partly caused by the fact that the historical simulation had erroneously used lateral boundary conditions from a different simulation member of CNRM-CM5 (Vautard et al., 2021). In REMO2009.v1, a precipitation decline region is identified in the NW part of SAF, whereas a minor precipitation increase over eastern South Africa is identified. This pattern for REMO2009.v1 appears to be consistent, regardless of the driving GCM, which could be partly explained by the fact that precipitation during October is thermally driven, and thus the impact of the driving GCMs is not dominant. The precipitation increase in the SE part of SAF is seen over a localized region and could be associated with an increase in the precipitation caused by the Tropical Temperate Troughs (TTTs) (Ratna et al., 2013; Macron et al., 2014; Shongwe et al., 2014).
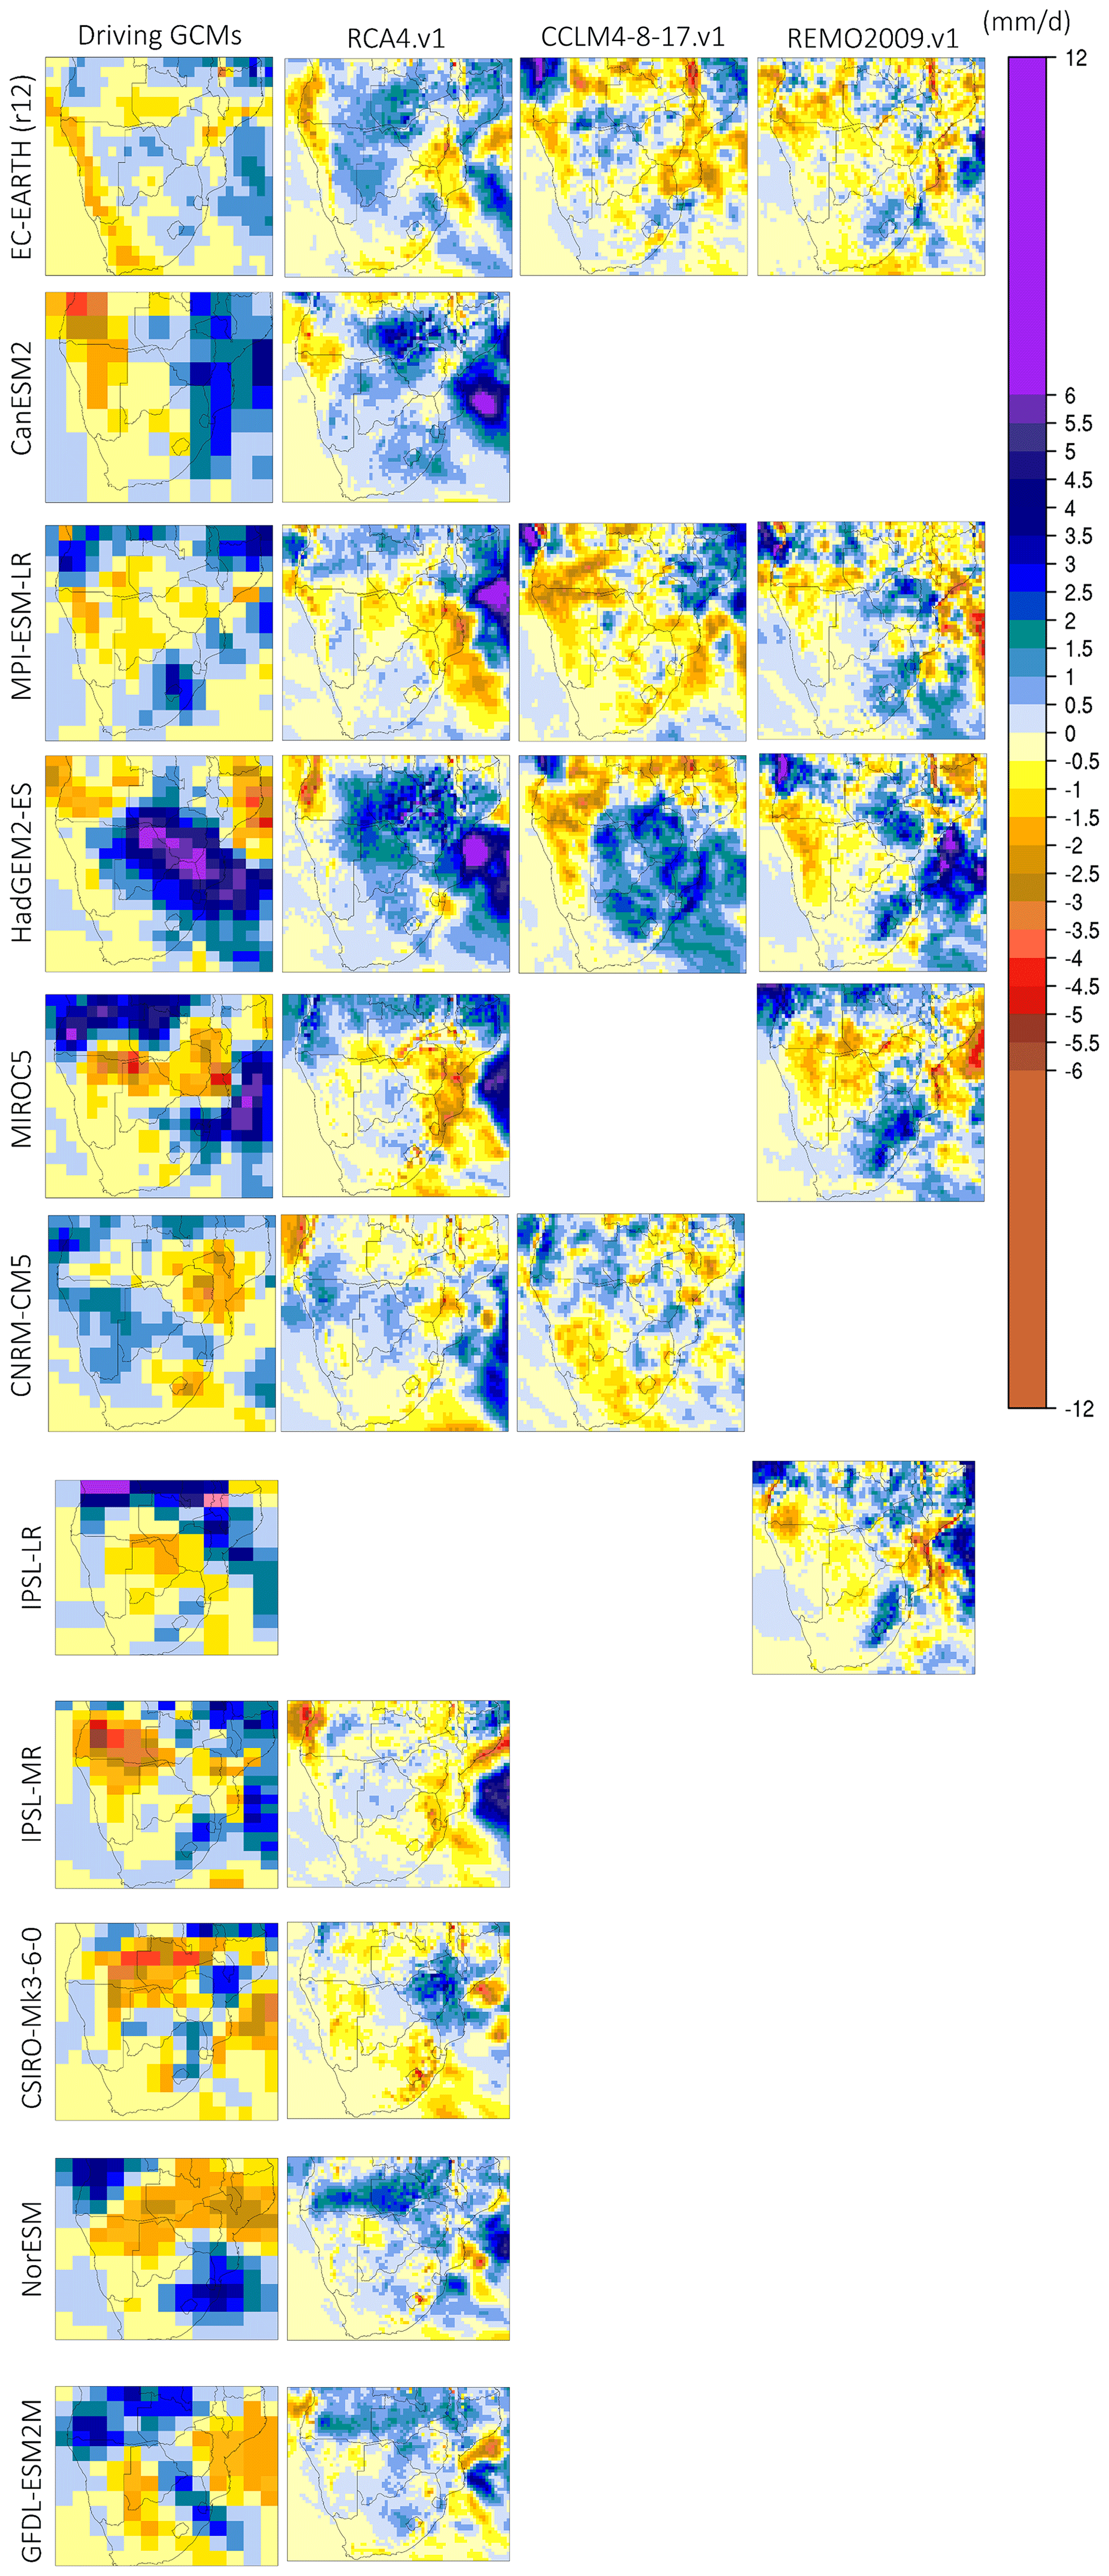
Figure 11Monthly precipitation change (future–present, in mm d−1) during January for the period 2065–2095 relative to 1985–2005. The first column (from the left) displays precipitation change for the driving GCMs used, and columns 2–4 display the downscaled products according to RCA4.v1, CCLM4-8-17.v1, and REMO2009.v1.
In Fig. 11 the climate change signal for precipitation during January is displayed. The precipitation change displays a very strong regional heterogeneity. It is also observed that although there is a strong precipitation change signal in all driving GCMs, not all RCMs downscale the signal uniformly. It is also notable that, even among the GCMs, there are substantial differences in the spatial extent and sign of the change. Nevertheless, there are some features that appear in most of the simulations. For instance, almost all GCMs project drying conditions over the SW part of SAF, especially the coastal zone. The precipitation decline is equal to −1 mm d−1. This could be explained by a consistent increase in frequency of the Benguela coastal low-level jet events (Lima et al., 2019; Reboita et al., 2019), causing oceanic upwelling and a subsequent reduction in precipitation. In addition, there are a subset of GCMs that identify a severe precipitation decline over the Angola region that reaches −5 mm d−1. Furthermore, in many GCMs a region of precipitation increase is identified, extending from central SAF towards SE SAF. This is particularly identifiable in HadGEM2-ES and the RCM simulations forced by it. The monthly precipitation changes for the rest of the rainy season months is shown in the Supplement (Figs. S16–S19).
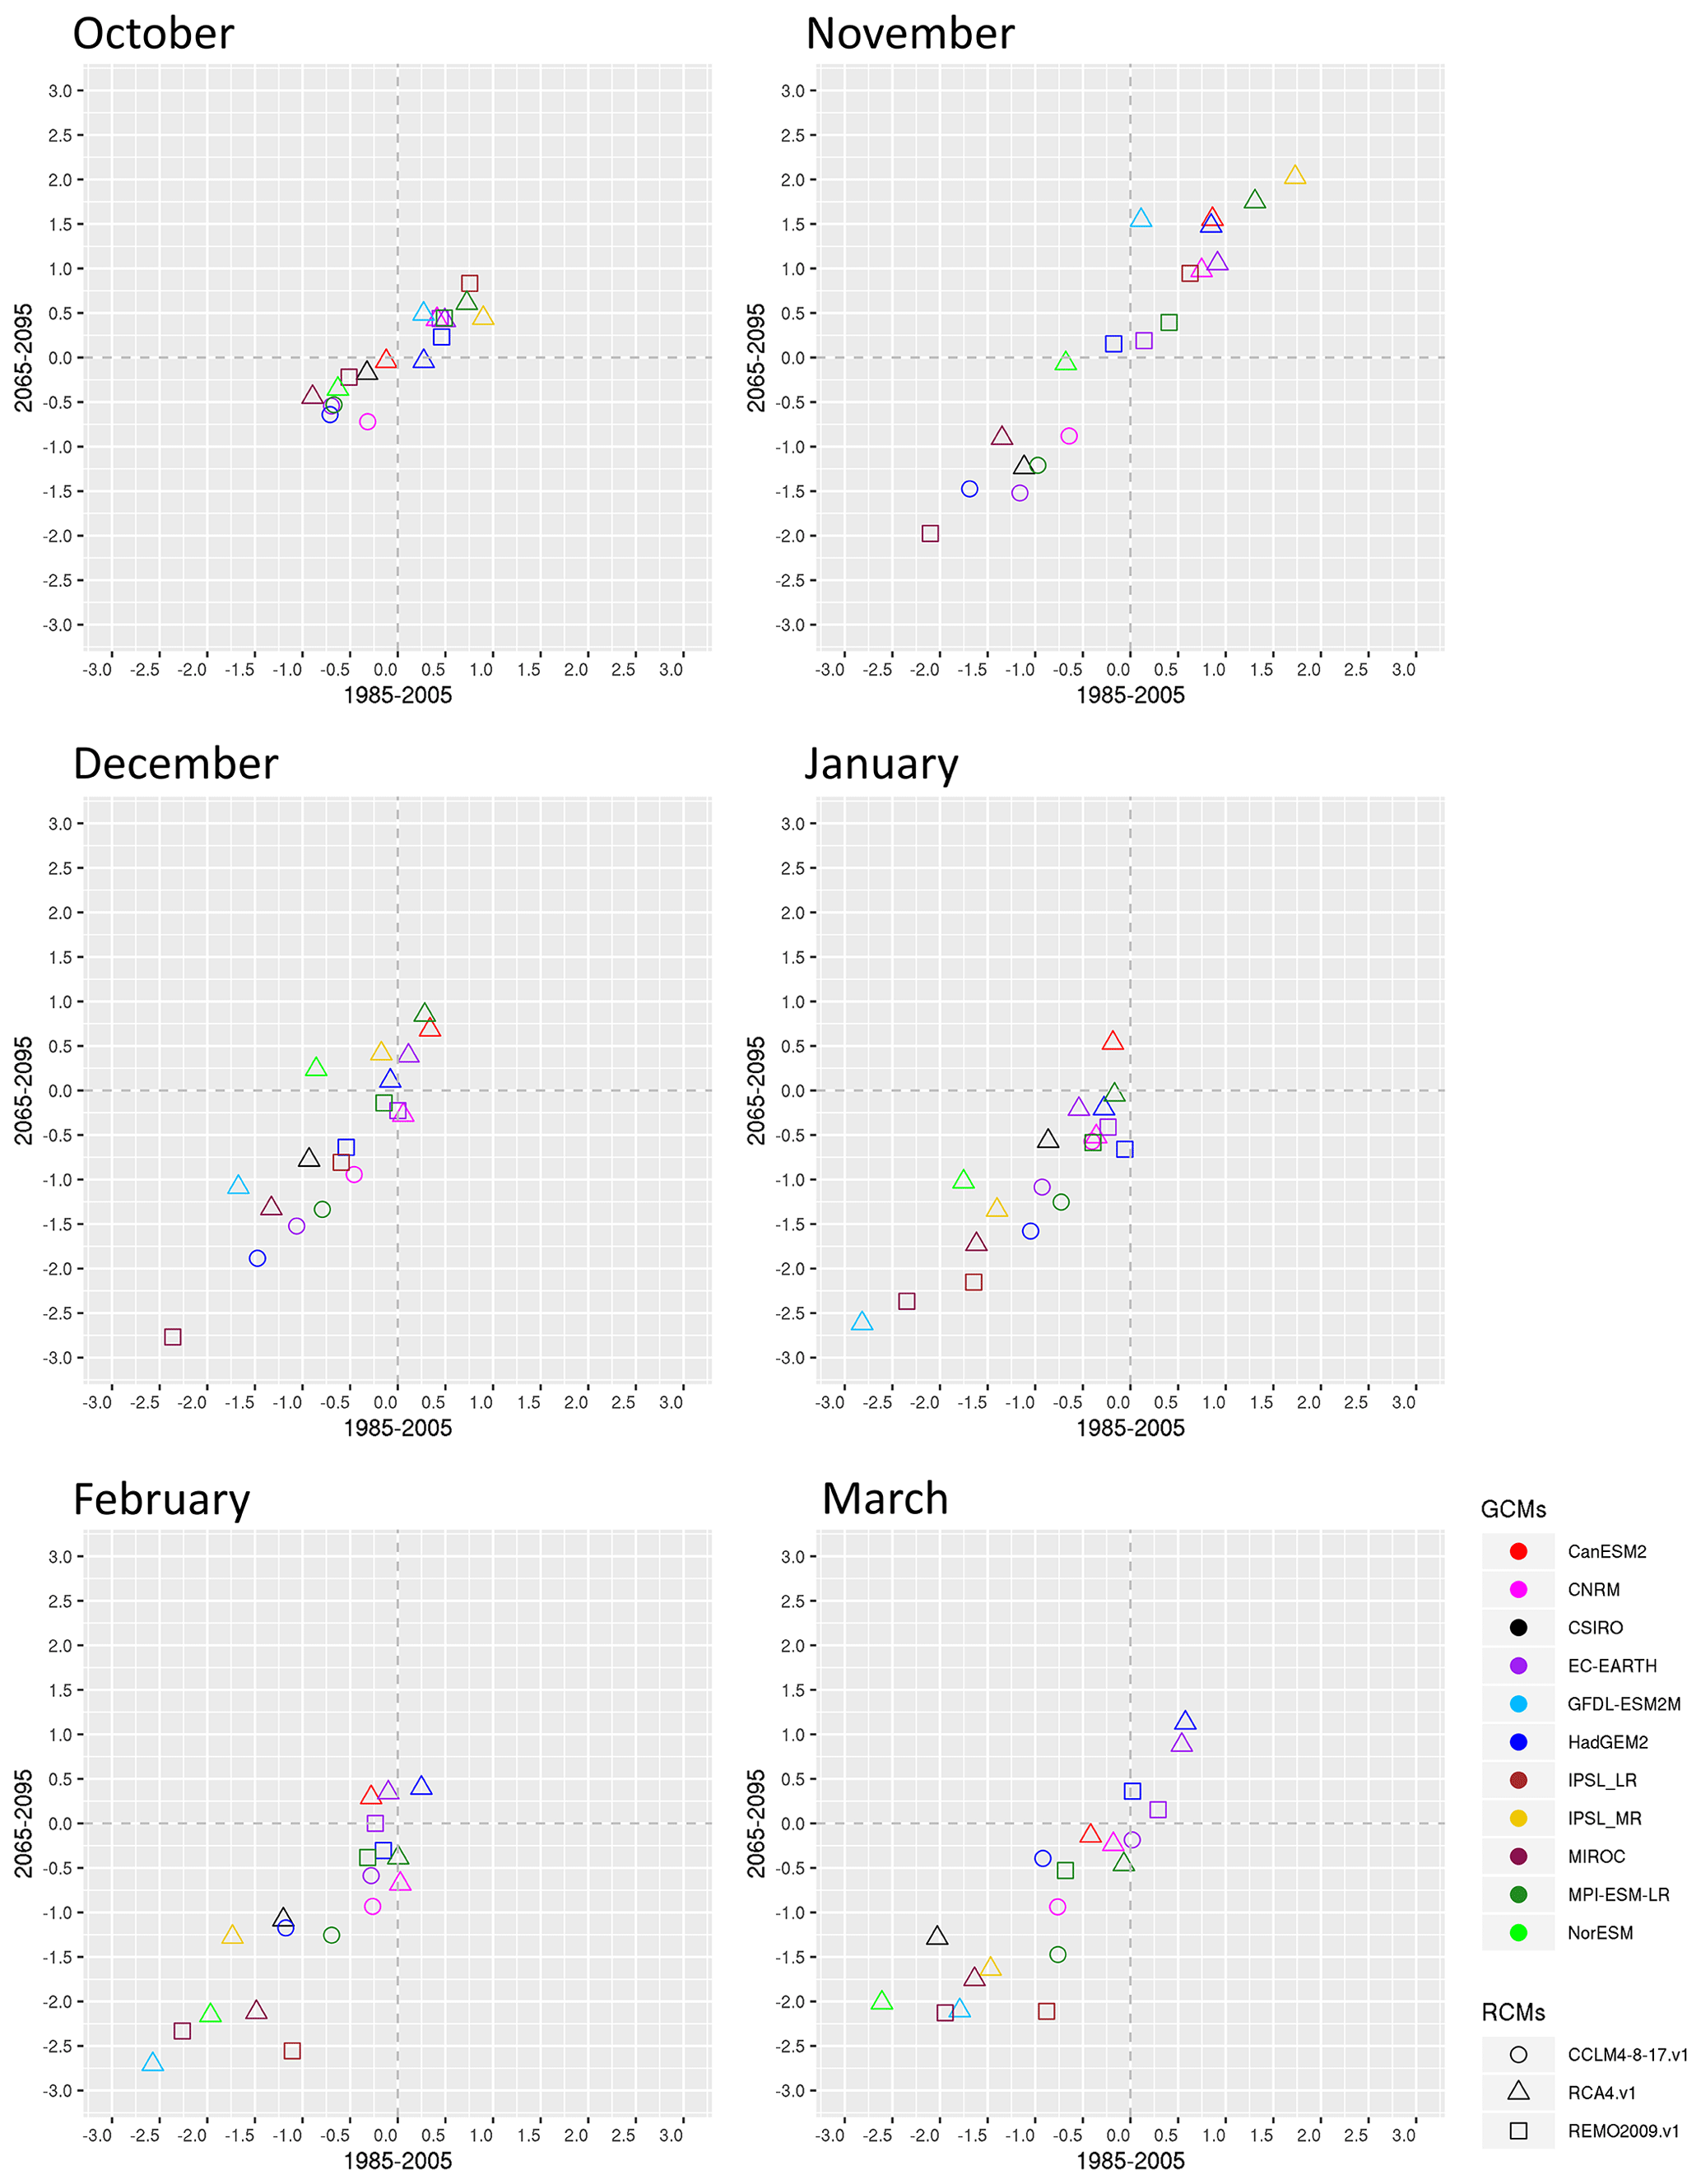
Figure 12Monthly RCMDRI–DRI spatial averages over southern Africa for the historical period (1985–2005) on the x axis and the future period (2065–2095) under RCP8.5 on the y axis.
In Fig. 12 the spatial average of the RCMDRI–DRI difference (DIFF) is shown for the whole of SAF (land grid points only). If DIFF >0, it indicates that the RCMs enhance precipitation relative to their driving GCM, while if DIFF <0 then RCMs reduce precipitation relative to their driving GCM. As is shown, DIFF values for October are symmetric around zero and do not exceed the range −1 to 1 mm d−1 for either the historical or future period. The DIFF values for November are also almost symmetric; however, their spread increases, reaching values that range between (−2) and 2 mm d−1. During both months, CCLM4-8-17.v1 always reduces precipitation amounts relative to the lateral boundary forcing it receives, regardless of the driving GCM or the period examined. During December, the precipitation reduction in all RCMs becomes more pronounced and reaches values equal to −3 mm d−1. In January, only one RCM enhances precipitation (∼0.5 mm d−1), with all the rest displaying precipitation reduction. During February and March, some positive DIFF values reappear for some simulations. Overall, there is a strong linear relationship between DIFF in 1985–2005 and DIFF in 2065–2095, which further implies that if an RCM is drier than its driving GCM during the historical period, then it will also retain this attribute during the future period. Nonetheless, we highlight that RCMs preserve precipitation change signal generated by the GCMs. Considering that one primary shortcoming of the GCMs over SAF is their wet bias and that RCMs systematically reduce this bias, we gain increased confidence that RCMs can be reliably used for assessments of future precipitation change.
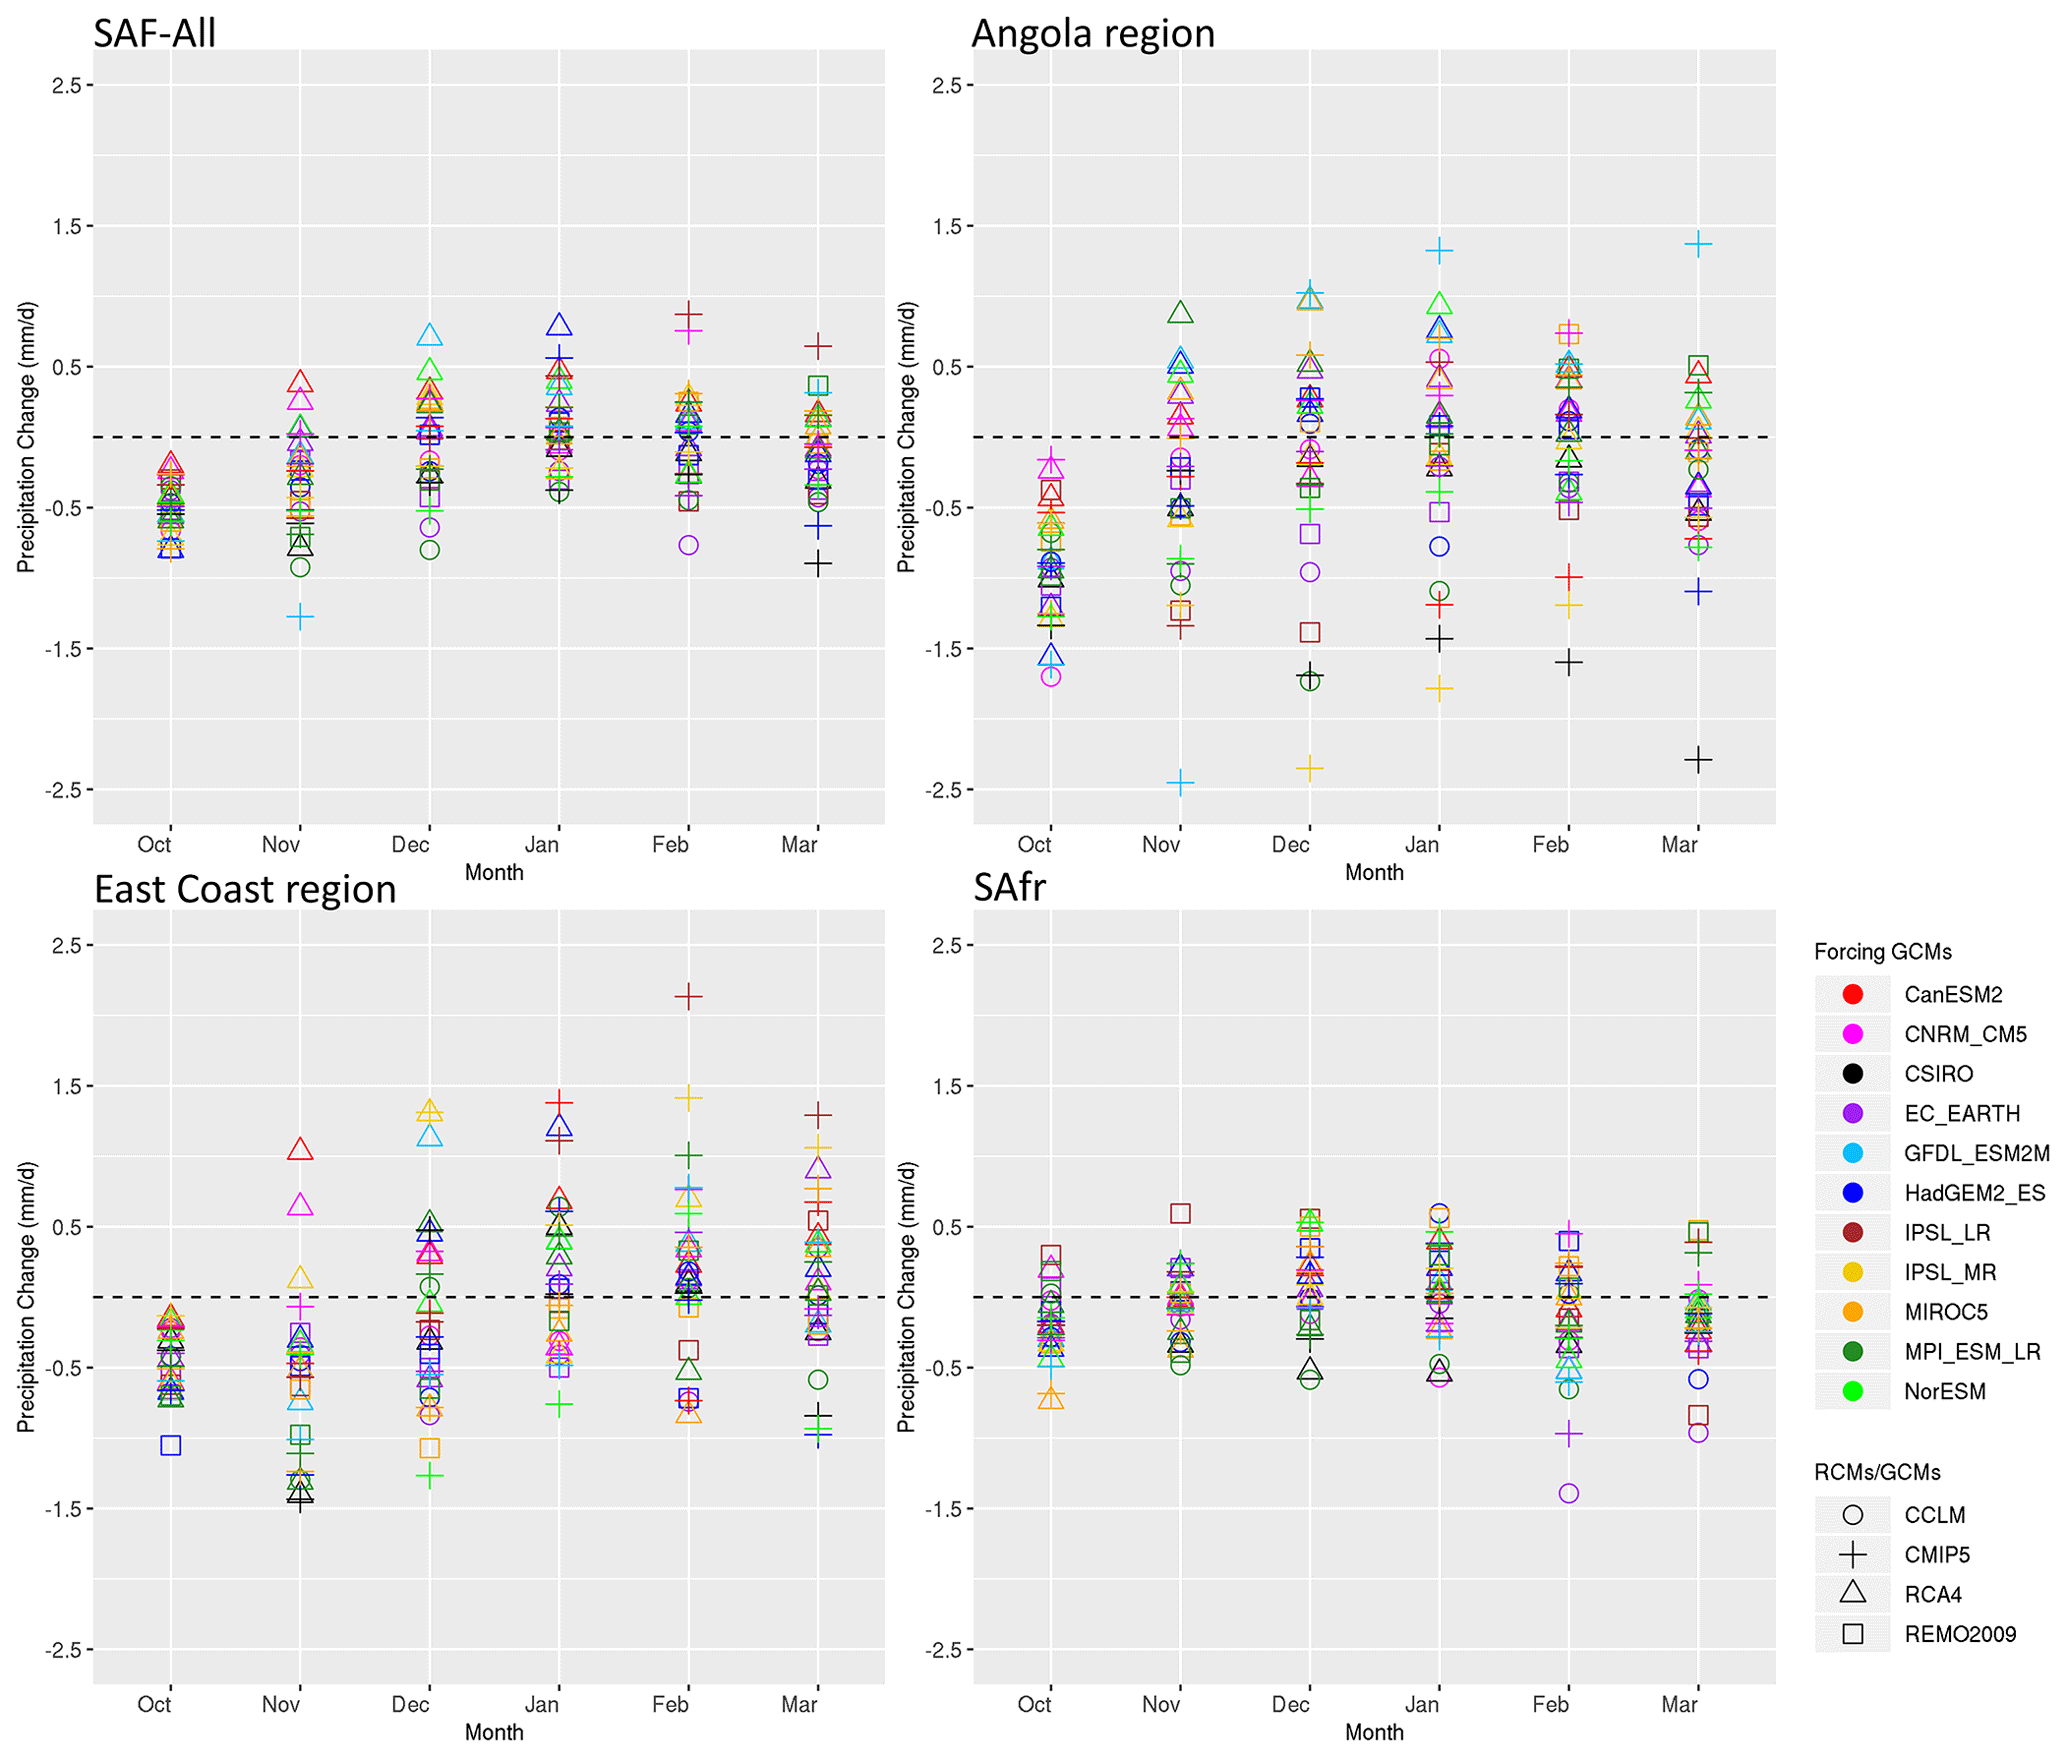
Figure 13Spatial average of the precipitation change signal (mm d−1) from RCMs and their driving GCMs relative to 1985–2005 for southern Africa and the three sub-regions examined.
In Fig. 13 the spatial average of the precipitation change signal from RCMs and their driving GCMs relative to 1985–2005 for SAF and the three subregions is displayed. Concerning SAF-All region, all models during October identify a precipitation reduction at the end of the 21st century that can reach −0.9 mm d−1. The precipitation decline signal is also identified during November, indicating a later onset of the rainy season over SAF, as it has already been shown for CMIP5 (Dunning et al., 2018). During December and January there is a variability in the spatial averages of the change signal that ranges from −0.8 to 0.8 mm d−1. A similar pattern is also seen for February and March. The distribution of the ensemble members for both RCMs and GCMs over the Angola and the East Coast subregions is similar to that of SAF-All region; however, over the Angola and the East Coast subregions precipitation change values display a considerably larger spread. Over the SAfr region the climate change signal is symmetric around 0 for all months, except March.
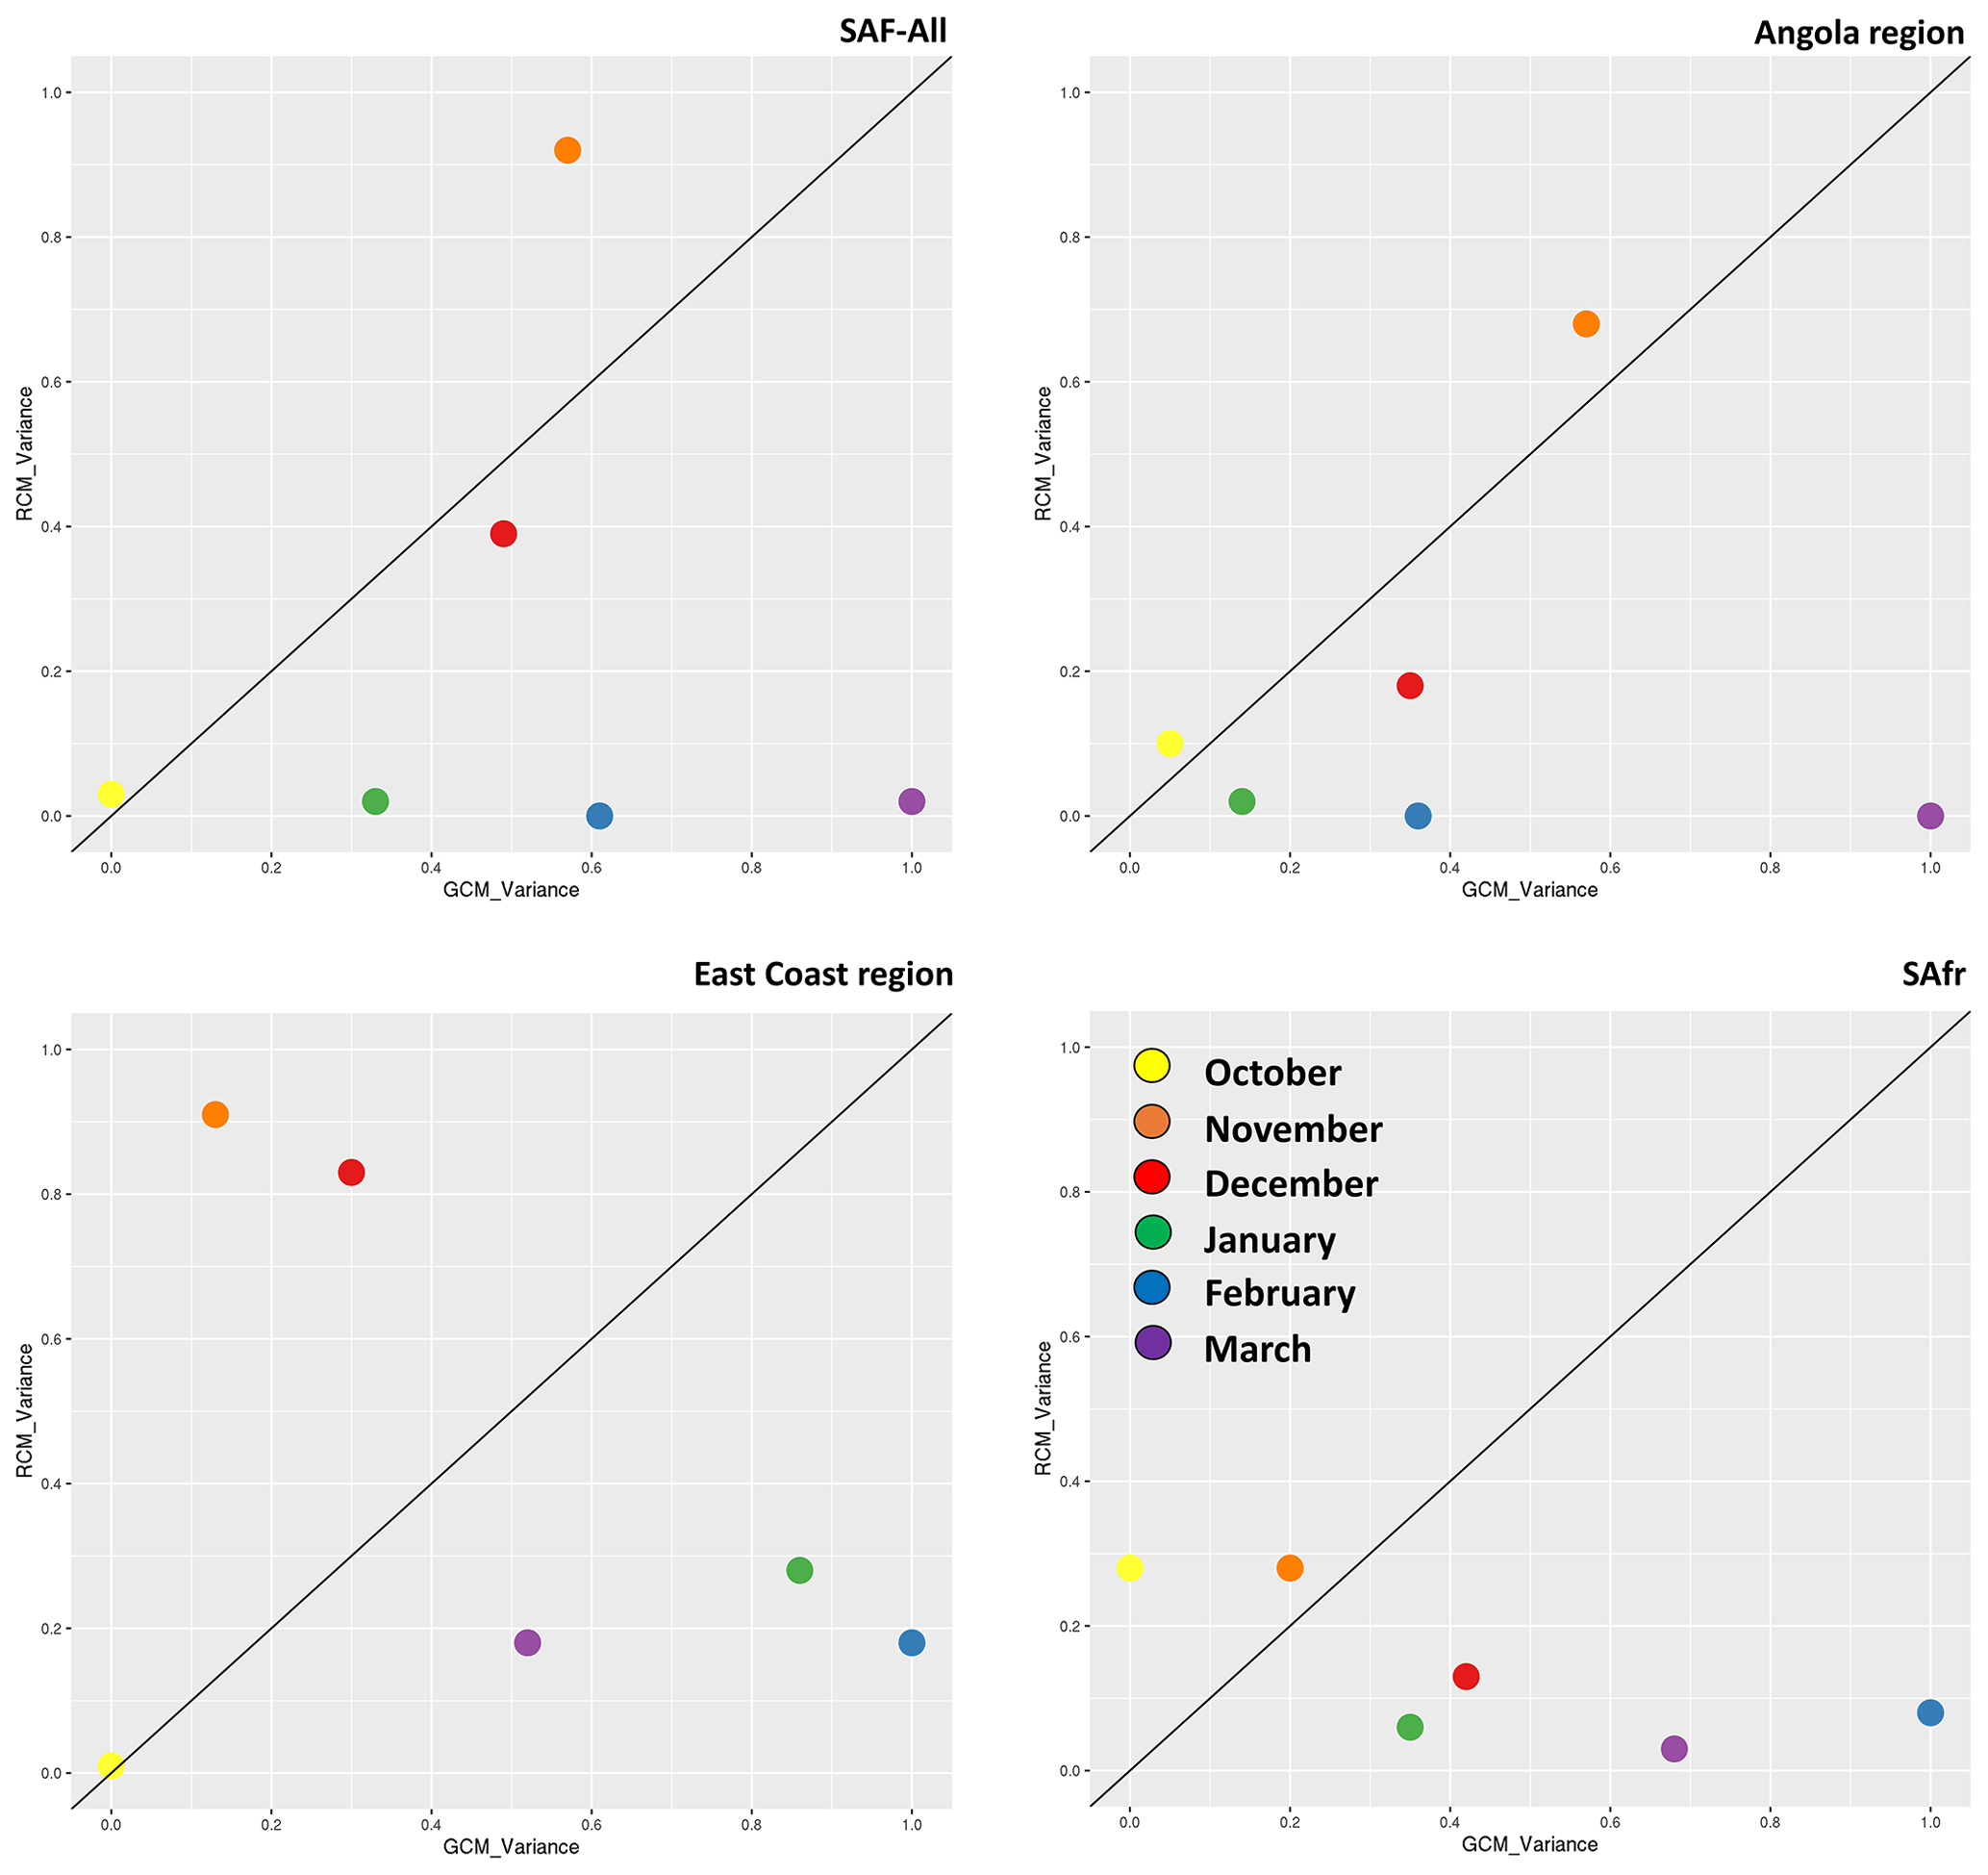
Figure 14Analysis of the variance of monthly precipitation during 2065–2095 for southern Africa (SAF-All region) and the three sub-regions examined, namely the Angola region, East Coast region, and the SAfr region, respectively. The x and y axes display standardized precipitation variances.
The impact of the RCMs and GCMs on monthly precipitation for the period 2065–2095 under RCP8.5 is shown in Fig. 14. The SAF-all region and the Angola subregion show a similar behaviour as in the historical period (Fig. 9); however, over the East Coast subregion, precipitation during March is more strongly dominated by GCMs. The same observation also holds over the SAfr subregion. In general, regional processes continue to dominate contributions to variability during October–November, while large-scale features dominate during December–March.
In this work we investigate whether it is the RCMs or the driving GCMs that control the monthly precipitation variability, monthly precipitation biases, and climate change signal over southern Africa and how these relationships vary from month to month throughout the rainy season. Our work examines monthly precipitation variance caused by the lateral boundary conditions and does not examine parameter and structural uncertainty separately in the multi-RCM and the multi-GCM ensembles analysed. More specifically, we use an ensemble of 19 RCM simulations performed in the context of CORDEX-Africa and their driving GCMs. According to the literature (Munday and Washington, 2018), precipitation in the CMIP5 simulations is characterized by a systematic wet bias over southern Africa. In the CORDEX-Africa RCM simulations there is also a persistent wet bias, especially during the core of the rainy season (December–January–February, DJF); however, it is of smaller magnitude and of smaller spatial extent. It is found that RCMs reduce monthly precipitation compared to their driving GCMs for both historical (1985–2005) and future periods (2065–2095) under RCP8.5.
The Angola region, which encompasses the activity of the Angola Low pressure system, displays the highest wet biases with regards to mean monthly precipitation among all subregions examined. The month with the largest wet biases (for the Angola region) is found to be November, while the month with the largest precipitation bias spread is found to be March. In all months except October, the CMIP5 GCMs display biases that are approximately 1–1.5 mm d−1 wetter than the wettest CORDEX-Africa RCM ensemble members. Over the East Coast region, representing the wider area over Mozambique, the bias signal is reversed after January, with most of the RCMs displaying a dry bias. Over the SAfr region, the majority of models display a consistent wet bias for all months of the rainy season. All models (CMIP5 and CORDEX-Africa) display an intense dry bias in the NE part of SAF, which can be related to the misrepresentation of the moisture transport entering the region from the Indian Ocean (Munday and Washington, 2018). In general, although RCMs display an improvement in precipitation biases relative to their driving GCMs, some bias patterns still persist even in RCMs, calling for a process-based evaluation of specific climatological features such as the formulation of the Angola Low and the transport of moisture from the NE part of SAF towards the central SAF.
More specifically, we found that CCLM4-8-17.v1 produces the smallest bias when the whole of SAF is examined; however, it displays a systematic dry bias over the East Coast region (greater Mozambique region); hence, CCLM4-8-17.v1 should be used with caution over eastern SAF, especially if it is exploited within drought-related climate services. Concerning RCA4.v1, we find a very regionally heterogeneous – almost pixelated – spatial pattern for precipitation, which can be attributed to the sharp topography used (Van Vooren et al., 2019). RCA4.v1, due to the large size of its ensemble, is optimal for analysing its behaviour under different driving GCMs. In general, we find that RCA4.v1 is more prone to follow the signal received from the driving GCMs, contrary to what is observed for CCLM4-8-17.v1. REMO2009.v1 presents a compromise between the behaviours of RCA4.v1 and CCLM4-8-17.v1.
It is highly recommended that when RCM simulations are used for the whole of SAF or a subregion thereof, the spread and statistical properties of all available RCMs and their driving GCMs should be examined, and an ensemble of RCMs should be employed based on their ability to reproduce key climatic features of the region of interest. Increasing evidence is provided that not all models are fit for constructing an ensemble mean (or median) for all regions (Her et al., 2019; Raju and Kumar, 2020; Tebaldi and Knutti, 2007). Lastly, a very important aspect when the calculation and characterization of biases is discussed for GCMs and RCMs is that biases are assessed based on a satellite- or gauge-based product, which are often erroneously regarded as “the ground truth” (Harrison et al., 2019; Alexander et al., 2020). Of course, the climate community is bound to work with the state-of-the-science products that are available; however, biases and errors in the “observational datasets” should be kept in mind when the biases of climate models are discussed. In this work we use the CHIRPS precipitation product, as it has been shown to outperform other satellite precipitation products (Toté et al., 2015; Ayehu et al., 2018; Dinku et al., 2018).
Concerning the climate change signal, there is a strong agreement among all GCMs and RCMs that precipitation during October will decrease by (−0.1)–(−1) mm d−1, a fact associated with a projected later onset of the rainy season, which is further linked with a northward shift of the tropical rain belt (Dunning et al., 2018; Lazenby et al., 2018). The topic of reduced early rainfall over southern Africa for the end of the 21st century under all emission scenarios and pathways has been examined extensively for the CMIP3 and CMIP5 GCM ensembles (Seth et al., 2011; Cook and Vizy, 2022; Lazenby et al., 2018; Howard and Washington, 2020). A common observation in all CMIP5 GCMs for the early rainy season by the end of the 21st century is that the instability over southern Africa reduces, the surface temperature increases, and the heat low phase of the Angola Low pressure system is strengthened (Howard and Washington, 2020). However, rainfall decline in the CMIP5 ensemble over southern Africa should be additionally considered in the context of the systematic precipitation biases already diagnosed in the historical simulations (Munday and Washington, 2018; Howard and Washington, 2020). Considering that the systematic wet precipitation bias is significantly reduced in the CORDEX-Africa ensemble relative to their driving CMIP5 GCMs (Karypidou et al., 2022), we gain confidence that future precipitation projections according to the CORDEX-Africa ensemble provide a more plausible future scenario. For the rest of the months, the results are variable, indicating the need for a multi-model approach when climate change impacts are assessed. A feature that is identified in some GCMs and transferred to the downscaling RCMs is a precipitation increase that extends from the central SAF region towards the southeast. This result is consistent with previous work that shows an increase in frequency of cyclones making landfall along the eastern seaboard of SAF (Muthige et al., 2018). Since tropical cyclones are a particular cause of severe flooding events over Mozambique, there is an urgent need for planning and mitigation strategies in the region.
Concerning precipitation variability and whether it is the RCMs or the driving GCMs that dominate monthly precipitation, we find that over the whole of SAF (SAF-All region), as expected, October and November are dominated by RCMs, while during December–March it is the GCMs that mainly formulate the precipitation climatologies. This is explained by the fact that after December there is a strong large-scale forcing, which is provided to the RCMs by the lateral boundary conditions given through the GCMs. The results for the historical period are comparable to that for future projections.
Lastly, it is imperative to highlight that the impact of the lateral boundary conditions on RCM simulations comprise only a portion of the potential sources of uncertainty in the CORDEX-Africa ensemble examined; therefore, attributing entirely the variance of RCM simulations to the driving GCMs would be erroneous. Therefore, we note that uncertainty in RCM simulations can have a plethora of sources that are mainly categorized as parameter or structural uncertainty (Günther et al., 2020; Howland et al., 2022). These types of uncertainty sources may relate to the parameterization schemes employed by each RCM or assumptions and numerical choices involved in the dynamics of each specific RCM. However, since within CORDEX-Africa only a limited number of variables are being made available to the community, it would be impossible to meticulously comment on all possible sources of uncertainty and assess the impact of their variance on monthly precipitation.
For the data processing and statistical analysis we used the R Project for Statistical Computing (https://www.r-project.org/; R Project, 2022), the Climate Data Operators (CDO) (https://doi.org/10.5281/zenodo.7112925; Schulzweida, 2022), and Bash programming routines. Processing scripts are available via Zenodo under the following DOI: https://doi.org/10.5281/zenodo.5569984 (Karypidou et al., 2021). CMIP5 and CORDEX-Africa precipitation data were retrieved from the Earth System Grid Federation (ESGF) portal (https://esgf-data.dkrz.de/projects/esgf-dkrz/, last access: 1 October 2021; ESGF, 2021). The Climate Hazards Group InfraRed Precipitation with Station data (CHIRPS) products were retrieved from the following site: https://www.chc.ucsb.edu/data/chirps (Funk et al., 2015).
The supplement related to this article is available online at: https://doi.org/10.5194/gmd-16-1887-2023-supplement.
MCK, SPS, and EK designed the research. MCK performed the analysis and prepared the manuscript. SPS, EK, LS, and GN edited the manuscript and provided corrections.
The contact author has declared that none of the authors has any competing interests.
Publisher's note: Copernicus Publications remains neutral with regard to jurisdictional claims in published maps and institutional affiliations.
This article is funded by the AfriCultuReS project “Enhancing Food Security in African Agricultural Systems with the Support of Remote Sensing”, (European Union's Horizon 2020 Research and Innovation Framework Programme under grant agreement no. 774652). The authors would like to thank the Scientific Support Centre of the Aristotle University of Thessaloniki (Greece) for providing computational and storage infrastructure and technical support. Maria Chara Karypidou was funded by the Hellenic Foundation for Research and Innovations under the second call for PhD candidates (application no. 1323). This work is dedicated to the beautiful memory of Anatoli Karypidou.
This research has been supported by the Horizon 2020 AfriCultuReS project (grant no. 774652) and the Hellenic Foundation for Research and Innovation (grant no. 1323).
This paper was edited by Chiel van Heerwaarden and reviewed by two anonymous referees.
Abiodun, B. J., Makhanya, N., Petja, B., Abatan, A. A., and Oguntunde, P. G.: Future projection of droughts over major river basins in Southern Africa at specific global warming levels, Theor. Appl. Climatol., 137, 1785–1799, https://doi.org/10.1007/s00704-018-2693-0, 2019.
Alexander, L. V., Bador, M., Roca, R., Contractor, S., Donat, M. G., and Nguyen, P. L.: Intercomparison of annual precipitation indices and extremes over global land areas from in situ, space-based and reanalysis products, Environ. Res. Lett., 15, 055002, https://doi.org/10.1088/1748-9326/ab79e2, 2020.
Ayehu, G. T., Tadesse, T., Gessesse, B., and Dinku, T.: Validation of new satellite rainfall products over the Upper Blue Nile Basin, Ethiopia, Atmos. Meas. Tech., 11, 1921–1936, https://doi.org/10.5194/amt-11-1921-2018, 2018.
Beck, H. E., Vergopolan, N., Pan, M., Levizzani, V., van Dijk, A. I. J. M., Weedon, G. P., Brocca, L., Pappenberger, F., Huffman, G. J., and Wood, E. F.: Global-scale evaluation of 22 precipitation datasets using gauge observations and hydrological modeling, Hydrol. Earth Syst. Sci., 21, 6201–6217, https://doi.org/10.5194/hess-21-6201-2017, 2017.
Beck, H. E., Wood, E. F., Pan, M., Fisher, C. K., Miralles, D. G., Dijk, A. I. J. M. van, McVicar, T. R., and Adler, R. F.: MSWEP V2 Global 3-Hourly 0.1∘ Precipitation: Methodology and Quantitative Assessment, B. Am. Meteorol. Soc., 100, 473–500, https://doi.org/10.1175/BAMS-D-17-0138.1, 2019.
Bentsen, M., Bethke, I., Debernard, J. B., Iversen, T., Kirkevåg, A., Seland, Ø., Drange, H., Roelandt, C., Seierstad, I. A., Hoose, C., and Kristjánsson, J. E.: The Norwegian Earth System Model, NorESM1-M – Part 1: Description and basic evaluation of the physical climate, Geosci. Model Dev., 6, 687–720, https://doi.org/10.5194/gmd-6-687-2013, 2013.
Boberg, F. and Christensen, J. H.: Overestimation of Mediterranean summer temperature projections due to model deficiencies, Nat. Clim. Change, 2, 433–436, https://doi.org/10.1038/nclimate1454, 2012.
Canadian Centre for Climate Modelling and Analysis: Climate model: second generation Canadian earth system model: https://www.canada.ca/en/environment-climate-change/services/climate-change/science-research-data/modeling-projections-analysis/centre-modelling-analysis/models/second-generation-earth-system-model.html, last access: 5 April 2023.
Casale, M., Drimie, S., Quinlan, T., and Ziervogel, G.: Understanding vulnerability in southern Africa: comparative findings using a multiple-stressor approach in South Africa and Malawi, Reg. Environ. Change, 10, 157–168, https://doi.org/10.1007/s10113-009-0103-y, 2010.
Christensen, O. B. and Kjellström, E.: Filling the matrix: an ANOVA-based method to emulate regional climate model simulations for equally-weighted properties of ensembles of opportunity, Clim, Dynam., 58, 2371–2385, https://doi.org/10.1007/s00382-021-06010-5, 2022.
Collins, W. J., Bellouin, N., Doutriaux-Boucher, M., Gedney, N., Halloran, P., Hinton, T., Hughes, J., Jones, C. D., Joshi, M., Liddicoat, S., Martin, G., O'Connor, F., Rae, J., Senior, C., Sitch, S., Totterdell, I., Wiltshire, A., and Woodward, S.: Development and evaluation of an Earth-System model – HadGEM2, Geosci. Model Dev., 4, 1051–1075, https://doi.org/10.5194/gmd-4-1051-2011, 2011.
Conway, D., van Garderen, E. A., Deryng, D., Dorling, S., Krueger, T., Landman, W., Lankford, B., Lebek, K., Osborn, T., Ringler, C., Thurlow, J., Zhu, T., and Dalin, C.: Climate and southern Africa's water–energy–food nexus, Nat. Clim. Change, 5, 837–846, https://doi.org/10.1038/nclimate2735, 2015.
Cook, K. H. and Vizy, E. K.: Hydrodynamics of regional and seasonal variations in Congo Basin precipitation, Clim. Dynam., 59, 1775–1797, https://doi.org/10.1007/s00382-021-06066-3, 2022.
Crétat, J., Pohl, B., Dieppois, B., Berthou, S., and Pergaud, J.: The Angola Low: relationship with southern African rainfall and ENSO, Clim. Dynam., 52, 1783–1803, https://doi.org/10.1007/s00382-018-4222-3, 2019.
Davies, H. C.: A lateral boundary formulation for multi-level prediction models, Q. J. R. Meteor. Soc., 102, 405–418, https://doi.org/10.1002/qj.49710243210, 1976.
Davies, H. C.: Limitations of Some Common Lateral Boundary Schemes used in Regional NWP Models, Mon. Weather Rev., 111, 1002–1012, https://doi.org/10.1175/1520-0493(1983)111<1002:LOSCLB>2.0.CO;2, 1983.
Déqué, M., Rowell, D. P., Lüthi, D., Giorgi, F., Christensen, J. H., Rockel, B., Jacob, D., Kjellström, E., de Castro, M., and van den Hurk, B.: An intercomparison of regional climate simulations for Europe: assessing uncertainties in model projections, Clim. Change, 81, 53–70, https://doi.org/10.1007/s10584-006-9228-x, 2007.
Déqué, M., Somot, S., Sanchez-Gomez, E., Goodess, C. M., Jacob, D., Lenderink, G., and Christensen, O. B.: The spread amongst ENSEMBLES regional scenarios: regional climate models, driving general circulation models and interannual variability, Clim. Dynam., 38, 951–964, https://doi.org/10.1007/s00382-011-1053-x, 2012.
Diffenbaugh, N. S. and Giorgi, F.: Climate change hotspots in the CMIP5 global climate model ensemble, Clim. Change, 114, 813–822, https://doi.org/10.1007/s10584-012-0570-x, 2012.
Di Luca, A., de Elía, R., and Laprise, R.: Potential for added value in temperature simulated by highresolution nested RCMs in present climate and in the climate change signal, Clim. Dynam., 40, 443–464, https://doi.org/10.1007/s00382-012-1384-2, 2013.
Dosio, A., Jones, R. G., Jack, C., Lennard, C., Nikulin, G., and Hewitson, B.: What can we know about future precipitation in Africa? Robustness, significance and added value of projections from a large ensemble of regional climate models, Clim. Dynam., 53, 5833–5858, https://doi.org/10.1007/s00382-019-04900-3, 2019.
Dufresne, J.-L., Foujols, M.-A., Denvil, S., Caubel, A., Marti, O., Aumont, O., Balkanski, Y., Bekki, S., Bellenger, H., Benshila, R., Bony, S., Bopp, L., Braconnot, P., Brockmann, P., Cadule, P., Cheruy, F., Codron, F., Cozic, A., Cugnet, D., de Noblet, N., Duvel, J.-P., Ethé, C., Fairhead, L., Fichefet, T., Flavoni, S., Friedlingstein, P., Grandpeix, J.-Y., Guez, L., Guilyardi, E., Hauglustaine, D., Hourdin, F., Idelkadi, A., Ghattas, J., Joussaume, S., Kageyama, M., Krinner, G., Labetoulle, S., Lahellec, A., Lefebvre, M.-P., Lefevre, F., Levy, C., Li, Z. X., Lloyd, J., Lott, F., Madec, G., Mancip, M., Marchand, M., Masson, S., Meurdesoif, Y., Mignot, J., Musat, I., Parouty, S., Polcher, J., Rio, C., Schulz, M., Swingedouw, D., Szopa, S., Talandier, C., Terray, P., Viovy, N., and Vuichard, N.: Climate change projections using the IPSL-CM5 Earth System Model: from CMIP3 to CMIP5, Clim. Dynam., 40, 2123–2165, https://doi.org/10.1007/s00382-012-1636-1, 2013.
Dunne, J. P., John, J. G., Shevliakova, E., Stouffer, R. J., Krasting, J. P., Malyshev, S. L., Milly, P. C. D., Sentman, L. T., Adcroft, A. J., Cooke, W., Dunne, K. A., Griffies, S. M., Hallberg, R. W., Harrison, M. J., Levy, H., Wittenberg, A. T., Phillips, P. J., and Zadeh, N.: GFDL’s ESM2 Global Coupled Climate–Carbon Earth System Models. Part II: Carbon System Formulation and Baseline Simulation Characteristics, J. Climate, 26, 2247–2267, https://doi.org/10.1175/JCLI-D-12-00150.1, 2013.
Dunning, C. M., Black, E., and Allan, R. P.: Later Wet Seasons with More Intense Rainfall over Africa under Future Climate Change, J. Climate, 31, 9719–9738, https://doi.org/10.1175/JCLI-D-18-0102.1, 2018.
ESGF: ESGF Node at DKRZ, https://esgf-data.dkrz.de/projects/esgf-dkrz/, last access: 1 October 2021.
Feser, F., Rockel, B., Storch, H. von, Winterfeldt, J., and Zahn, M.: Regional Climate Models Add Value to Global Model Data: A Review and Selected Examples, B. Am. Meteorol. Soc., 92, 1181–1192, https://doi.org/10.1175/2011BAMS3061.1, 2011.
Funk, C., Peterson, P., Landsfeld, M., Pedreros, D., Verdin, J., Shukla, S., Husak, G., Rowland, J., Harrison, L., Hoell, A., and Michaelsen, J.: The climate hazards infrared precipitation with stations – a new environmental record for monitoring extremes, Sci. Data, 2, 150066, https://doi.org/10.1038/sdata.2015.66, 2015 (data available at: https://www.chc.ucsb.edu/data/chirps, last access: 1 October 2021).
Giorgetta, M. A., Jungclaus, J., Reick, C. H., Legutke, S., Bader, J., Böttinger, M., Brovkin, V., Crueger, T., Esch, M., Fieg, K., Glushak, K., Gayler, V., Haak, H., Hollweg, H.-D., Ilyina, T., Kinne, S., Kornblueh, L., Matei, D., Mauritsen, T., Mikolajewicz, U., Mueller, W., Notz, D., Pithan, F., Raddatz, T., Rast, S., Redler, R., Roeckner, E., Schmidt, H., Schnur, R., Segschneider, J., Six, K. D., Stockhause, M., Timmreck, C., Wegner, J., Widmann, H., Wieners, K.-H., Claussen, M., Marotzke, J., and Stevens, B.: Climate and carbon cycle changes from 1850 to 2100 in MPI-ESM simulations for the Coupled Model Intercomparison Project phase 5, J. Adv. Model. Earth Sy., 5, 572–597, https://doi.org/10.1002/jame.20038, 2013.
Giorgi, F. and Gutowski, W. J.: Regional Dynamical Downscaling and the CORDEX Initiative, Annu. Rev. Environ. Resour., 40, 467–490, https://doi.org/10.1146/annurev-environ-102014-021217, 2015.
Günther, D., Hanzer, F., Warscher, M., Essery, R., and Strasser, U.: Including Parameter Uncertainty in an Intercomparison of Physically-Based Snow Models, Front. Earth Sci., 8, https://doi.org/10.3389/feart.2020.542599, 2020.
Harris, I., Osborn, T. J., Jones, P., and Lister, D.: Version 4 of the CRU TS monthly high-resolution gridded multivariate climate dataset, Sci. Data, 7, 109, https://doi.org/10.1038/s41597-020-0453-3, 2020.
Harrison, L., Funk, C., and Peterson, P.: Identifying changing precipitation extremes in Sub-Saharan Africa with gauge and satellite products, Environ. Res. Lett., 14, 085007, https://doi.org/10.1088/1748-9326/ab2cae, 2019.
Hazeleger, W., Severijns, C., Semmler, T., Ştefănescu, S., Yang, S., Wang, X., Wyser, K., Dutra, E., Baldasano, J. M., Bintanja, R., Bougeault, P., Caballero, R., Ekman, A. M. L., Christensen, J. H., Hurk, B. van den, Jimenez, P., Jones, C., Kållberg, P., Koenigk, T., McGrath, R., Miranda, P., Noije, T. van, Palmer, T., Parodi, J. A., Schmith, T., Selten, F., Storelvmo, T., Sterl, A., Tapamo, H., Vancoppenolle, M., Viterbo, P., and Willén, U.: EC-Earth: A Seamless Earth-System Prediction Approach in Action, B. Am. Meteorol. Soc., 91, 1357–1364, https://doi.org/10.1175/2010BAMS2877.1, 2010.
Her, Y., Yoo, S.-H., Cho, J., Hwang, S., Jeong, J., and Seong, C.: Uncertainty in hydrological analysis of climate change: multi-parameter vs. multi-GCM ensemble predictions, Sci. Rep., 9, 4974, https://doi.org/10.1038/s41598-019-41334-7, 2019.
Hersbach, H., Bell, B., Berrisford, P., Hirahara, S., Horányi, A., Muñoz-Sabater, J., Nicolas, J., Peubey, C., Radu, R., Schepers, D., Simmons, A., Soci, C., Abdalla, S., Abellan, X., Balsamo, G., Bechtold, P., Biavati, G., Bidlot, J., Bonavita, M., Chiara, G. D., Dahlgren, P., Dee, D., Diamantakis, M., Dragani, R., Flemming, J., Forbes, R., Fuentes, M., Geer, A., Haimberger, L., Healy, S., Hogan, R. J., Hólm, E., Janisková, M., Keeley, S., Laloyaux, P., Lopez, P., Lupu, C., Radnoti, G., Rosnay, P. de, Rozum, I., Vamborg, F., Villaume, S., and Thépaut, J.-N.: The ERA5 global reanalysis, Q. J. Roy. Meteor. Soc., 146, 1999–2049, https://doi.org/10.1002/qj.3803, 2020.
Howard, E. and Washington, R.: Characterizing the Synoptic Expression of the Angola Low, J. Climate, 31, 7147–7165, https://doi.org/10.1175/JCLI-D-18-0017.1, 2018.
Howard, E. and Washington, R.: Tracing Future Spring and Summer Drying in Southern Africa to Tropical Lows and the Congo Air Boundary, J. Climate, 33, 6205–6228, https://doi.org/10.1175/JCLI-D-19-0755.1, 2020.
Howard, E., Washington, R., and Hodges, K. I.: Tropical Lows in Southern Africa: Tracks, Rainfall Contributions, and the Role of ENSO, J. Geophys. Res.-Atmos., 124, 11009–11032, https://doi.org/10.1029/2019JD030803, 2019.
Howland, M. F., Dunbar, O. R. A., and Schneider, T.: Parameter Uncertainty Quantification in an Idealized GCM With a Seasonal Cycle, J. Adv. Model. Earth Syst., 14, e2021MS002735, https://doi.org/10.1029/2021MS002735, 2022.
IPCC and Stocker, T. F.: Climate Change 2013: The Physical Science Basis, Cambridge University Press, 2013.
Jeffrey, S., Rotstayn, L., Collier, M., Dravitzki, S., Hamalainen, C., Moeseneder, C., Wong, K., and Syktus, J.: Australia's CMIP5 submission using the CSIRO-Mk3.6 model, Austral. Meteorol. Oceanogr. J., 63, 1–13, https://doi.org/10.22499/2.6301.001, 2013.
Karypidou, M. C., Sobolowski, S. P., Katragkou, E., Sangelantoni, L., and Nikulin, G.: The impact of lateral boundary forcing in the CORDEX-Africa ensemble over southern Africa, Zenodo [code], https://doi.org/10.5281/zenodo.5569984, 2021.
Karypidou, M. C., Katragkou, E., and Sobolowski, S. P.: Precipitation over southern Africa: is there consensus among global climate models (GCMs), regional climate models (RCMs) and observational data?, Geosci. Model Dev., 15, 3387–3404, https://doi.org/10.5194/gmd-15-3387-2022, 2022.
Kerkhoff, C., Künsch, H. R., and Schär, C.: A Bayesian Hierarchical Model for Heterogeneous RCM–GCM Multimodel Ensembles, J. Climate, 28, 6249–6266, https://doi.org/10.1175/JCLI-D-14-00606.1, 2015.
Kim, Y., Rocheta, E., Evans, J. P., and Sharma, A.: Impact of bias correction of regional climate model boundary conditions on the simulation of precipitation extremes, Clim. Dynam., 55, 3507–3526, https://doi.org/10.1007/s00382-020-05462-5, 2020.
Lazenby, M. J., Todd, M. C., Chadwick, R., and Wang, Y.: Future Precipitation Projections over Central and Southern Africa and the Adjacent Indian Ocean: What Causes the Changes and the Uncertainty?, J. Climate, 31, 4807–4826, https://doi.org/10.1175/JCLI-D-17-0311.1, 2018.
Le Coz, C. and van de Giesen, N.: Comparison of Rainfall Products over Sub-Saharan Africa, J. Hydrometeorol., 21, 553–596, https://doi.org/10.1175/JHM-D-18-0256.1, 2020.
Lima, D. C. A., Soares, P. M. M., Semedo, A., Cardoso, R. M., Cabos, W., and Sein, D. V.: How Will a Warming Climate Affect the Benguela Coastal Low-Level Wind Jet?, J. Geophys. Res.-Atmos., 124, 5010–5028, https://doi.org/10.1029/2018JD029574, 2019.
Lloyd, E. A., Bukovsky, M., and Mearns, L. O.: An analysis of the disagreement about added value by regional climate models, Synthese, 198, 11645–11672, https://doi.org/10.1007/s11229-020-02821-x, 2021.
Luan, Y., Cui, X., and Ferrat, M.: Historical trends of food self-sufficiency in Africa, Food Sec., 5, 393–405, https://doi.org/10.1007/s12571-013-0260-1, 2013.
Luca, A. D., Argüeso, D., Evans, J. P., de Elía, R., and Laprise, R.: Quantifying the overall added value of dynamical downscaling and the contribution from different spatial scales, J. Geophys. Res.-Atmos., 121, 1575–1590, https://doi.org/10.1002/2015JD024009, 2016.
Lyon, B. and Mason, S. J.: The 1997–98 Summer Rainfall Season in Southern Africa. Part I: Observations, J. Climate, 20, 5134–5148, https://doi.org/10.1175/JCLI4225.1, 2007.
Macron, C., Pohl, B., Richard, Y., and Bessafi, M.: How do Tropical Temperate Troughs Form and Develop over Southern Africa?, J. Climate, 27, 1633–1647, https://doi.org/10.1175/JCLI-D-13-00175.1, 2014.
Masipa, T. S.: The impact of climate change on food security in South Africa: Current realities and challenges ahead, Jàmbá: J. Dis. Risk Stud., 9, 7, https://doi.org/10.4102/jamba.v9i1.411, 2017.
Maúre, G., Pinto, I., Ndebele-Murisa, M., Muthige, M., Lennard, C., Nikulin, G., Dosio, A., and Meque, A.: The southern African climate under 1.5 ∘C and 2 ∘C of global warming as simulated by CORDEX regional climate models, Environ. Res. Lett., 13, 065002, https://doi.org/10.1088/1748-9326/aab190, 2018.
Misselhorn, A. and Hendriks, S. L.: A systematic review of sub-national food insecurity research in South Africa: Missed opportunities for policy insights, PLoS One, 12, e0182399, https://doi.org/10.1371/journal.pone.0182399, 2017.
Moalafhi, D. B., Evans, J. P., and Sharma, A.: Influence of reanalysis datasets on dynamically downscaling the recent past, Clim. Dynam., 49, 1239–1255, https://doi.org/10.1007/s00382-016-3378-y, 2017.
Muthige, M. S., Malherbe, J., Englebrecht, F. A., Grab, S., Beraki, A., Maisha, T. R., and der Merwe, J. V.: Projected changes in tropical cyclones over the South West Indian Ocean under different extents of global warming, Environ. Res. Lett., 13, 065019, https://doi.org/10.1088/1748-9326/aabc60, 2018.
Munday, C. and Washington, R.: Circulation controls on southern African precipitation in coupled models: The role of the Angola Low, J. Geophys. Res.-Atmos., 122, 861–877, https://doi.org/10.1002/2016JD025736, 2017.
Munday, C. and Washington, R.: Systematic Climate Model Rainfall Biases over Southern Africa: Links to Moisture Circulation and Topography, J. Climate, 31, 7533–7548, https://doi.org/10.1175/JCLI-D-18-0008.1, 2018.
Nicholson, S. E.: The ITCZ and the Seasonal Cycle over Equatorial Africa, B. Am. Meteorol. Soc., 99, 337–348, https://doi.org/10.1175/BAMS-D-16-0287.1, 2018.
Nikulin, G., Jones, C., Giorgi, F., Asrar, G., Büchner, M., Cerezo-Mota, R., Christensen, O. B., Déqué, M., Fernandez, J., Hänsler, A., Meijgaard, E. van, Samuelsson, P., Sylla, M. B., and Sushama, L.: Precipitation Climatology in an Ensemble of CORDEX-Africa Regional Climate Simulations, J. Climate, 25, 6057–6078, https://doi.org/10.1175/JCLI-D-11-00375.1, 2012.
Pinto, I., Lennard, C., Tadross, M., Hewitson, B., Dosio, A., Nikulin, G., Panitz, H.-J., and Shongwe, M. E.: Evaluation and projections of extreme precipitation over southern Africa from two CORDEX models, Clim. Change, 135, 655–668, https://doi.org/10.1007/s10584-015-1573-1, 2016.
Pinto, I., Jack, C., and Hewitson, B.: Process-based model evaluation and projections over southern Africa from Coordinated Regional Climate Downscaling Experiment and Coupled Model Intercomparison Project Phase 5 models, Int. J. Climatol., 38, 4251–4261, https://doi.org/10.1002/joc.5666, 2018.
Raju, K. S. and Kumar, D. N.: Review of approaches for selection and ensembling of GCMs, J. Water Clim. Change, 11, 577–599, https://doi.org/10.2166/wcc.2020.128, 2020.
Rana, A., Nikulin, G., Kjellström, E., Strandberg, G., Kupiainen, M., Hansson, U., and Kolax, M.: Contrasting regional and global climate simulations over South Asia, Clim. Dynam., 54, 2883–2901, https://doi.org/10.1007/s00382-020-05146-0, 2020.
Ratna, S. B., Behera, S., Ratnam, J. V., Takahashi, K., and Yamagata, T.: An index for tropical temperate troughs over southern Africa, Clim. Dynam., 41, 421–441, https://doi.org/10.1007/s00382-012-1540-8, 2013.
Reboita, M. S., Ambrizzi, T., Silva, B. A., Pinheiro, R. F., and da Rocha, R. P.: The South Atlantic Subtropical Anticyclone: Present and Future Climate, Front. Earth Sci., 7, https://doi.org/10.3389/feart.2019.00008, 2019.
Reason, C. J. C. and Jagadheesha, D.: A model investigation of recent ENSO impacts over southern Africa, Meteorol. Atmos. Phys., 89, 181–205, https://doi.org/10.1007/s00703-005-0128-9, 2005.
R Project: The R Project for Statistical Computing, https://www.r-project.org/, last access: 10 October 2022.
Schulzweida, U.: CDO User Guide (2.1.0), Zenodo [code], https://doi.org/10.5281/zenodo.7112925, 2022.
Seth, A., Rauscher, S. A., Rojas, M., Giannini, A., and Camargo, S. J.: Enhanced spring convective barrier for monsoons in a warmer world?, Clim. Change, 104, 403–414, https://doi.org/10.1007/s10584-010-9973-8, 2011.
Shew, A. M., Tack, J. B., Nalley, L. L., and Chaminuka, P.: Yield reduction under climate warming varies among wheat cultivars in South Africa, Nat. Commun., 11, 4408, https://doi.org/10.1038/s41467-020-18317-8, 2020.
Shongwe, M. E., Lennard, C., Liebmann, B., Kalognomou, E.-A., Ntsangwane, L., and Pinto, I.: An evaluation of CORDEX regional climate models in simulating precipitation over Southern Africa, Atmos. Sci. Lett., 16, 199–207, https://doi.org/10.1002/asl2.538, 2014.
Sillmann, J., Kharin, V. V., Zhang, X., Zwiers, F. W., and Bronaugh, D.: Climate extremes indices in the CMIP5 multimodel ensemble: Part 1. Model evaluation in the present climate, J. Geophys. Res.-Atmos., 118, 1716–1733, https://doi.org/10.1002/jgrd.50203, 2013.
Sørland, S. L., Schär, C., Lüthi, D., and Kjellström, E.: Bias patterns and climate change signals in GCM-RCM model chains, Environ. Res. Lett., 13, 074017, https://doi.org/10.1088/1748-9326/aacc77, 2018.
Taylor, K. E., Stouffer, R. J., and Meehl, G. A.: An Overview of CMIP5 and the Experiment Design, B. Am. Meteorol. Soc., 93, 485–498, https://doi.org/10.1175/BAMS-D-11-00094.1, 2012.
Tebaldi, C. and Knutti, R.: The use of the multi-model ensemble in probabilistic climate projections, Philos. T. Roy. Soc. A, 365, 2053–2075, https://doi.org/10.1098/rsta.2007.2076, 2007.
Toté, C., Patricio, D., Boogaard, H., Van der Wijngaart, R., Tarnavsky, E., and Funk, C.: Evaluation of Satellite Rainfall Estimates for Drought and Flood Monitoring in Mozambique, Remote Sens., 7, 1758–1776, https://doi.org/10.3390/rs70201758, 2015.
Van Vooren, S., Van Schaeybroeck, B., Nyssen, J., Van Ginderachter, M., and Termonia, P.: Evaluation of CORDEX rainfall in northwest Ethiopia: Sensitivity to the model representation of the orography, Int. J. Climatol., 39, 2569–2586, https://doi.org/10.1002/joc.5971, 2019.
Vautard, R., Kadygrov, N., Iles, C., Boberg, F., Buonomo, E., Bülow, K., Coppola, E., Corre, L., van Meijgaard, E., Nogherotto, R., Sandstad, M., Schwingshackl, C., Somot, S., Aalbers, E., Christensen, O. B., Ciarlo, J. M., Demory, M.-E., Giorgi, F., Jacob, D., Jones, R. G., Keuler, K., Kjellström, E., Lenderink, G., Levavasseur, G., Nikulin, G., Sillmann, J., Solidoro, C., Sørland, S. L., Steger, C., Teichmann, C., Warrach-Sagi, K., and Wulfmeyer, V.: Evaluation of the Large EURO-CORDEX Regional Climate Model Ensemble, J. Geophys. Res.-Atmos., 126, e2019JD032344, https://doi.org/10.1029/2019JD032344, 2021.
Voldoire, A., Sanchez-Gomez, E., Salas y Mélia, D., Decharme, B., Cassou, C., Sénési, S., Valcke, S., Beau, I., Alias, A., Chevallier, M., Déqué, M., Deshayes, J., Douville, H., Fernandez, E., Madec, G., Maisonnave, E., Moine, M.-P., Planton, S., Saint-Martin, D., Szopa, S., Tyteca, S., Alkama, R., Belamari, S., Braun, A., Coquart, L., and Chauvin, F.: The CNRM-CM5.1 global climate model: description and basic evaluation, Clim. Dynam., 40, 2091–2121, https://doi.org/10.1007/s00382-011-1259-y, 2013.
Watanabe, M., Suzuki, T., O’ishi, R., Komuro, Y., Watanabe, S., Emori, S., Takemura, T., Chikira, M., Ogura, T., Sekiguchi, M., Takata, K., Yamazaki, D., Yokohata, T., Nozawa, T., Hasumi, H., Tatebe, H., and Kimoto, M.: Improved Climate Simulation by MIROC5: Mean States, Variability, and Climate Sensitivity, J. Climate, 23, 6312–6335, https://doi.org/10.1175/2010JCLI3679.1, 2010.
Wolski, P., Lobell, D., Stone, D., Pinto, I., Crespo, O., and Johnston, P.: On the role of anthropogenic climate change in the emerging food crisis in southern Africa in the 2019–2020 growing season, Global Change Biol., 26, 2729–2730, https://doi.org/10.1111/gcb.15047, 2020.
Wu, J. and Gao, X.: Present day bias and future change signal of temperature over China in a series of multi-GCM driven RCM simulations, Clim. Dynam., 54, 1113–1130, https://doi.org/10.1007/s00382-019-05047-x, 2020.