the Creative Commons Attribution 4.0 License.
the Creative Commons Attribution 4.0 License.
 | 05 Jan 2023
The Euro-Mediterranean Center on Climate Change (CMCC) decadal prediction system
Alessio Bellucci
Paolo Ruggieri
Panos J. Athanasiadis
Stefano Materia
Daniele Peano
Giusy Fedele
Riccardo Hénin
Silvio Gualdi
Decadal climate predictions, obtained by constraining the initial condition of a dynamical model through a truthful estimate of the observed climate state, provide an accurate assessment of near-term climate change and are a useful tool to inform decision-makers on future climate-related risks.
Here we present results from the CMIP6 (Coupled Model Intercomparison Project Phase 6) Decadal Climate Prediction Project (DCPP) decadal hindcasts produced with the operational CMCC (Euro-Mediterranean Center on Climate Change) decadal prediction system (DPS), based on the fully coupled CMCC-CM2-SR5 dynamical model. A 20-member suite of 10-year retrospective forecasts, initialized every year from 1960 to 2020, is performed using a full-field initialization strategy.
The predictive skill for key variables is assessed and compared with the skill of an ensemble of non-initialized historical simulations so as to quantify the added value of the initialization. In particular, the CMCC DPS is able to skillfully reproduce past climate surface and subsurface temperature fluctuations over large parts of the globe. The North Atlantic Ocean is the region that benefits the most from initialization, with the largest skill enhancement occurring over the subpolar region compared to historical simulations. On the other hand, the predictive skill over the Pacific Ocean rapidly decays with forecast time, especially over the North Pacific. In terms of precipitation, the skill of the CMCC DPS is significantly higher than that of the historical simulations over a few specific regions, including the Sahel, northern Eurasia, and over western and central Europe.
The Atlantic multidecadal variability is also skillfully predicted, and this likely contributes to the skill found over remote areas through downstream influence, circulation changes, and teleconnections. Considering the relatively small ensemble size, a remarkable prediction skill is also found for the North Atlantic Oscillation, with maximum correlations obtained in the 1–9 lead year range.
Systematic errors also affect the forecast quality of the CMCC DPS, featuring a prominent cold bias over the Northern Hemisphere, which is not found in the historical runs, suggesting that, in some areas, the adopted full-field initialization strategy likely perturbs the equilibrium state of the model climate quite significantly.
The encouraging results obtained in this study indicate that climate variability over land can be predictable over a multiyear range, and they demonstrate that the CMCC DPS is a valuable addition to the current generation of DPSs. This stresses the need to further explore the potential of the near-term predictions, further improving future decadal systems and initialization methods, with the aim to provide a reliable tool to inform decision-makers on how regional climate will evolve in the next decade.
- Article
(15680 KB) - Full-text XML
-
Supplement
(5151 KB) - BibTeX
- EndNote


Climate fluctuations are the end result of a number of processes acting on a multitude of timescales. Prior to the year 2000, century-scale climate change projections, initialized with a physical state of the climate system obtained from a long simulation of the preindustrial period and subject to prescribed anthropogenic and natural forcings, have been the only available product to inform decision-makers on future climate-related risks. A major limitation of non-initialized climate projections is their lack of information about the ongoing natural variability that may affect climate changes in the near future, which is, at least in part, linked to the current state of the Earth's climate system. Decadal predictions, obtained by constraining the initial condition of a dynamical model (coupled global circulation model/Earth system model) through a realistic estimate of the observed climate state, provide a more accurate assessment of climate change in the near-term (decadal) range, where both external and internal drivers contribute to the climate evolution (Smith et al., 2007; Kushnir et al., 2019).
Starting from the 2000s, initialized decadal predictions have been assessed in multiple projects, from the first pioneering efforts up to the fifth Coupled Model Intercomparison Project (CMIP5; Smith et al., 2007; Keenlyside et al., 2008; Pohlmann et al., 2009; Meehl et al., 2009; Doblas-Reyes et al., 2011), in which coordinated experiments allowed a multi-system comparison to reduce single-model uncertainties (Taylor et al., 2012; Bellucci et al., 2015b), contributing to the Intergovernmental Panel on Climate Change Fifth Assessment Report (AR5, chap. 11; Kirtman et al., 2013).
Years of coordinated research and development have led to an established experiment protocol that has overcome some of the limitations (e.g., limited ensemble size and initialization every 5 years) of the decadal prediction simulations produced in the CMIP5 framework. This protocol is extensively described in the CMIP6 (Coupled Model Intercomparison Project Phase 6) Decadal Climate Prediction Project (DCPP), a coordinated multimodel effort within the World Climate Research Programme (WCRP), which aims to investigate climate predictions, predictability, and variability from annual to decadal timescales (Boer et al., 2016). The DCPP is intended to make skillful forecasts and predictions on these timescales using state-of-the-art climate models and statistical approaches. The core of the DCPP is component A, which includes a set of retrospective forecasts (hindcasts). This framework has laid the groundwork for a number of single-model (Bethke et al., 2021; Bilbao et al., 2021; Kataoka et al., 2020; Robson et al., 2018; Sospedra-Alfonso et al., 2021; Xin et al., 2019; Yang et al., 2021; Yeager et al., 2018) and multimodel studies (Borchert et al., 2021a, b; Delgado-Torres et al., 2022).
Climate anomalies on annual-to-multidecadal timescales are determined from both the internal and the externally forced variability (Boer et al., 2016). External contributions derive from solar irradiance variations, volcanic aerosols, and anthropogenic activities, including land use, aerosols, and greenhouse gas emissions, accounting for the global warming trend. On the other hand, the oceans, and to a lesser degree the land surface, sea ice, and stratosphere (Bellucci et al., 2015a) and their interaction with the atmosphere, are the primary source of internal variability within the climate system on decadal timescales. Low-frequency fluctuations in the North Atlantic sea surface temperature (SST), known as the Atlantic multidecadal variability (AMV), affect the global climate through local impacts and remote teleconnections (e.g., Sutton and Hodson, 2005; Zhang and Delworth, 2005; Knight et al., 2006; Sun et al., 2015; Nicolì et al., 2020; Ehsan et al., 2020; Ruprich-Robert et al., 2021). The long-term AMV evolution is well captured in most state-of-the-art forecast systems and represents one of the primary sources of predictability and, possibly, of skill at a decadal timescale that is generally attributed to the initialization of the Atlantic meridional overturning circulation (AMOC; Zhang et al., 2019). Other predictability sources arise from the Pacific Ocean. Interestingly, decadal El-Niño–Southern Oscillation (ENSO) impacts may be modulated by the Interdecadal Pacific Oscillation (IPO), which features both the ENSO SST region and extends to other extratropical areas (Henley et al., 2015). In addition, the initial state of some land surface characteristics, stratosphere, snow cover, and sea ice may also impact the predictability of the climate system (e.g., Bellucci et al., 2015b; Meehl et al., 2021). The aforementioned initialized components provide additional predictability, for the atmospheric circulation and, in particular, for the North Atlantic Oscillation (NAO) affecting boreal winter climate over Europe (Smith et al., 2019; Athanasiadis et al., 2020; Dunstone et al., 2022).
In this paper, we present the decadal prediction system (DPS) developed at the Euro-Mediterranean Center on Climate Change (CMCC) using the CMCC-CM2-SR5 state-of-the-art climate model (Cherchi et al., 2019) and contributing to the CMIP6 DCPP project. In particular, the study aims to assess the skill in predicting the observed anomalies in key meteorological variables, thereby testing the ability of the DPS to simulate the main climate variations from annual to the decadal timescale.
The article is structured as follows: Sect. 2 provides details on the model configuration, the experimental protocol, the evaluation metrics, and the data used to check the benefits of the initialization. Section 3 presents results on the predictions' skill for key quantities and their evolution in time, using deterministic and probabilistic approaches, and assesses the evolution of some relevant model biases. Section 4 focuses on the skill for selected regional climate variability indices. Finally, Sect. 5 summarizes and discusses the main findings of the study and also draws some conclusions.
2.1 Description of the CMCC DPS model
The CMCC decadal prediction system is based on the CMCC-CM2-SR5 coupled model, shortly described below (see Cherchi et al., 2019, for additional details). The atmospheric component is the Community Atmosphere Model version 5 (CAM5) with a regular grid of 0.9–1.25∘ and 30 hybrid levels, including 17 levels below 200 hPa and extending up to 2 hPa. The finite-volume configuration has been chosen for the dynamical core. The ocean model is the Nucleus for European Modelling of the Ocean version 3.6 (NEMO v3.6), using a tripolar ORCA grid with a horizontal resolution of about 1∘ (with a varying latitudinal resolution ranging from ∘ near the Equator up to 1∘ at high latitudes) and 50 levels in the vertical. The sea ice component is the Community Ice CodE in its fourth version (CICE4). The DPS configuration of CICE4 uses a single category to characterize the sea ice thickness, for consistency with the respective reanalysis used for the initialization. The Community Land Model version 4.5 (CLM4.5) is used for the simulation of the land surface at the same horizontal grid used by the atmospheric component. Finally, the River Transport Model (RTM; Branstetter, 2001) routes liquid and ice runoff from the land surface model to the active ocean to simulate a closed hydrological cycle.
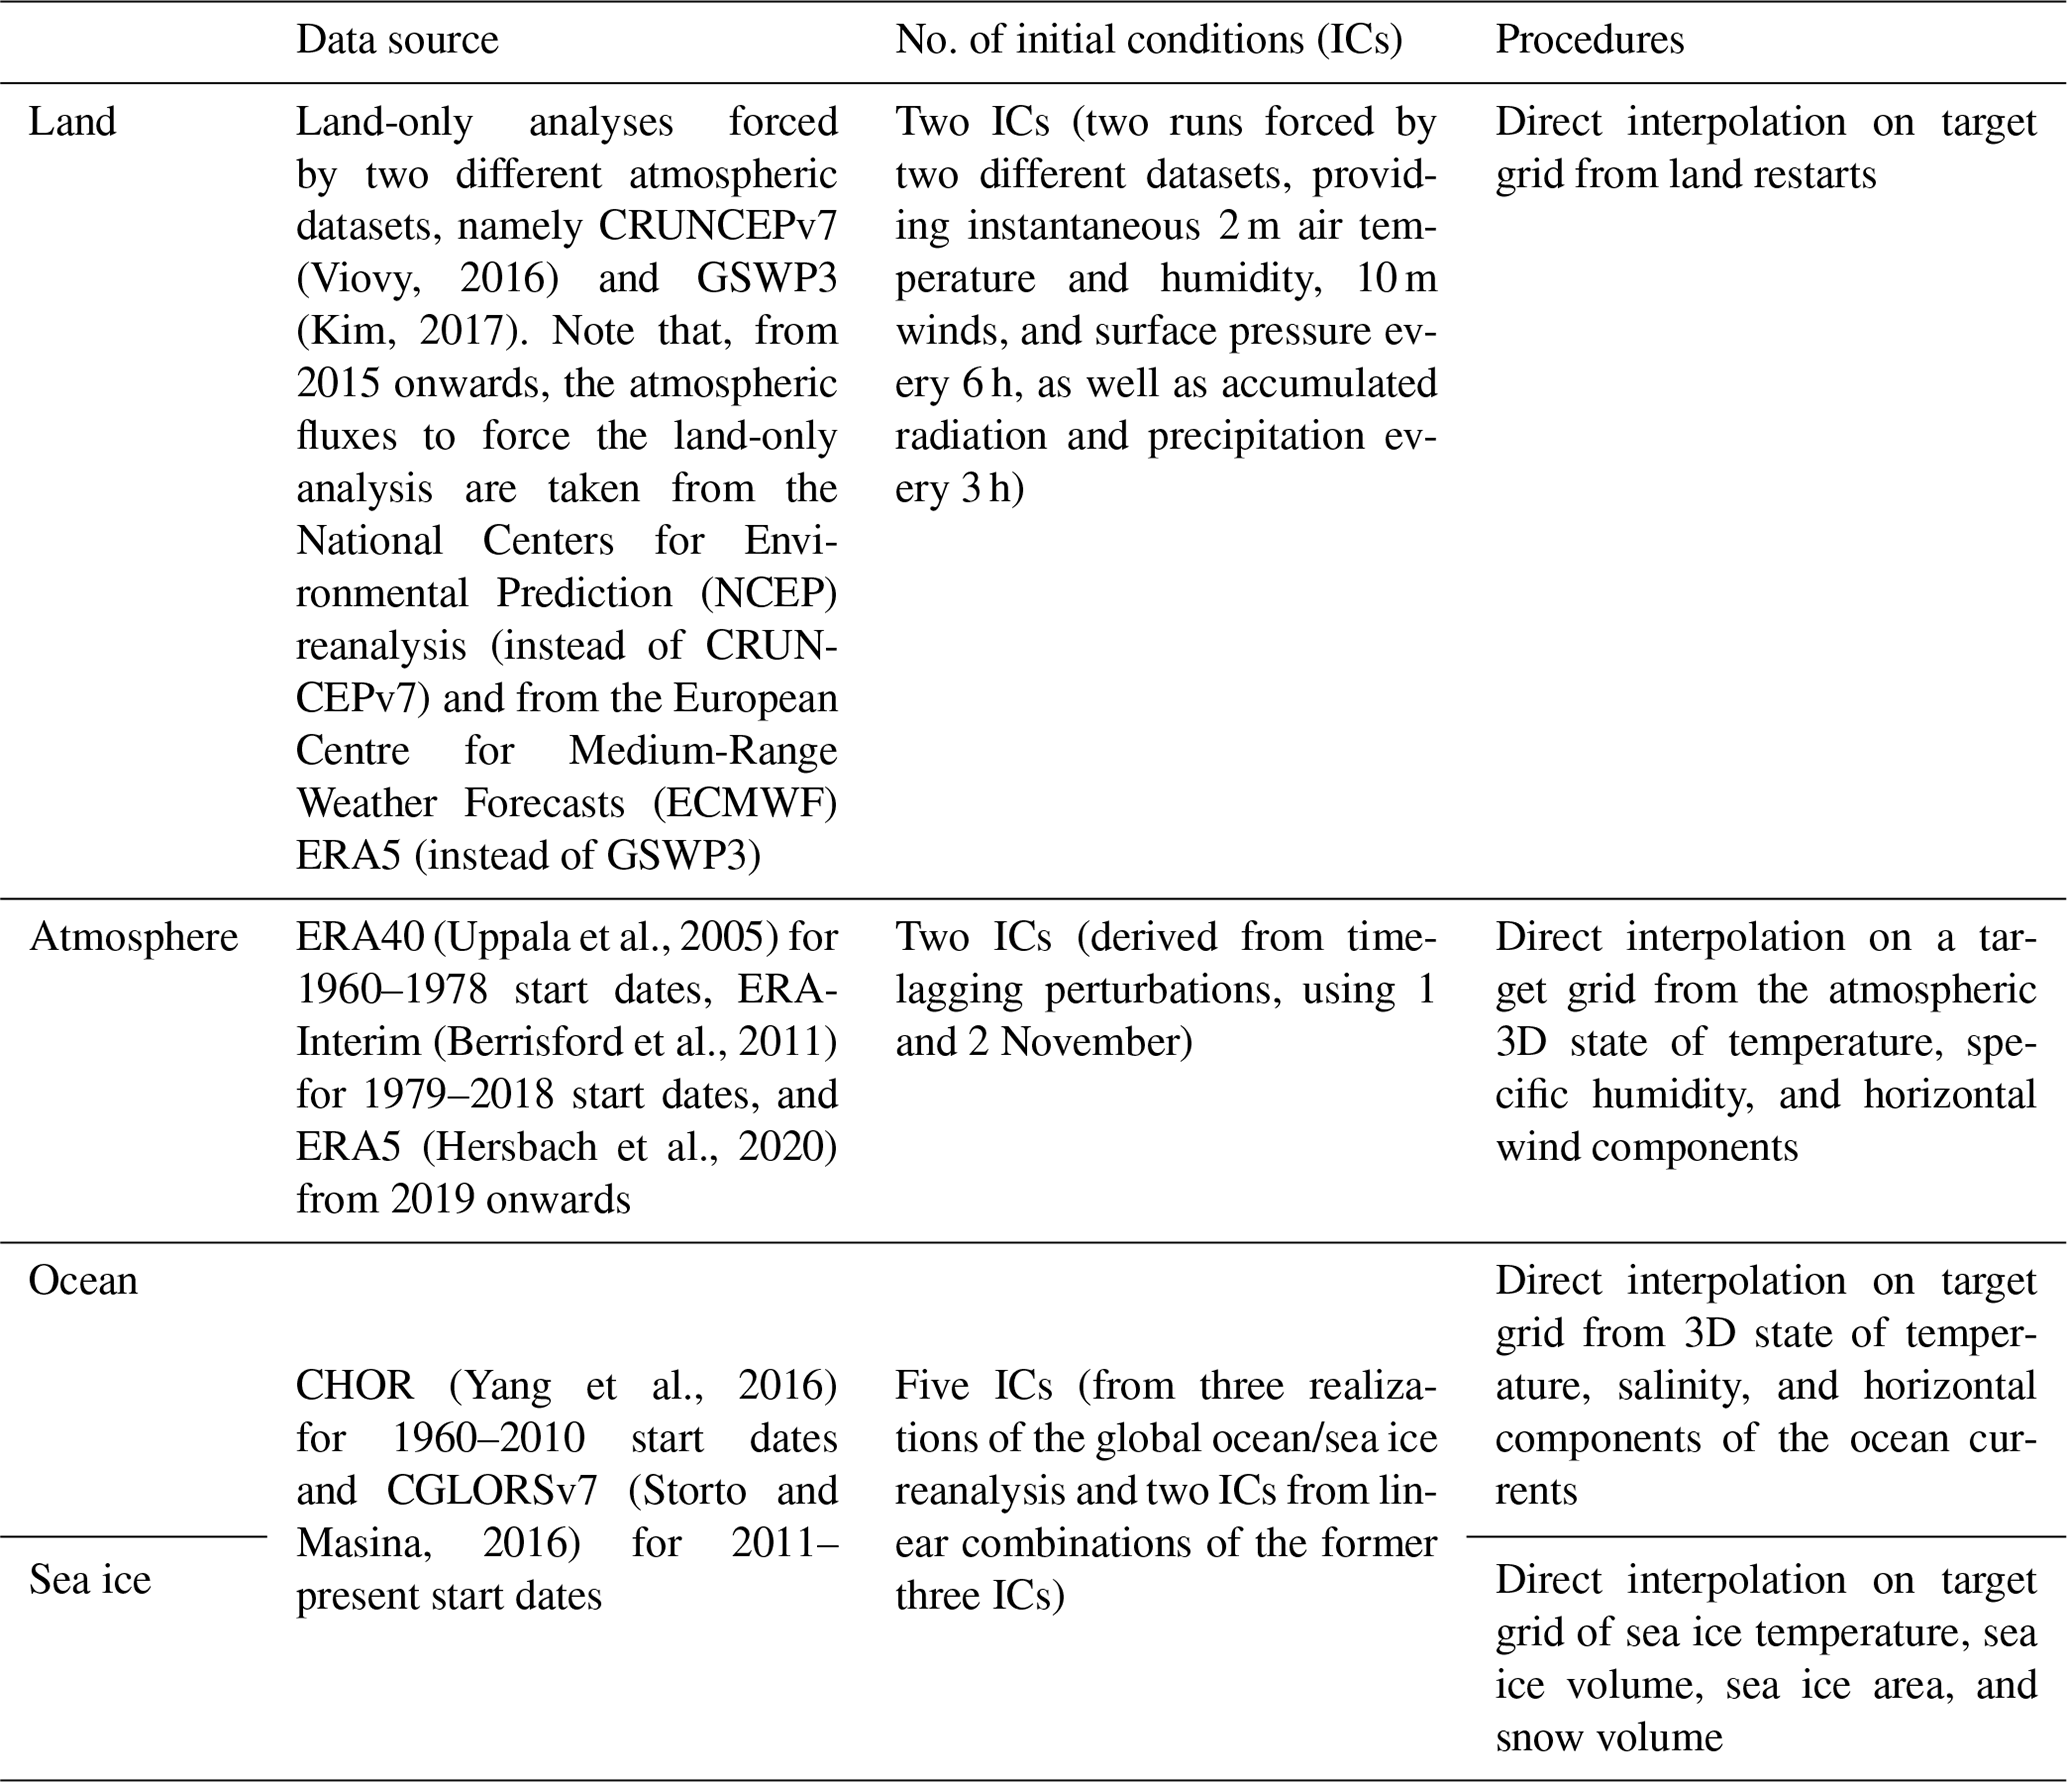
A suite of retrospective forecasts (hindcasts) consisting of 20-member ensembles of 10-year-long hindcasts, initialized every year from 1960 to 2020, has been completed, following the CMIP6 DCPP-A protocol (Boer et al., 2016). As summarized in Table 1, all the members are initialized on 1 November, starting from direct, full-field estimates of the observed state of the ocean, sea ice, land surface, and atmosphere, without any coupled assimilation runs. For each start date, two initial conditions for the atmosphere are obtained from the ERA-40 (1960–1978; Uppala et al., 2005), ERA-Interim (1979–2018; Berrisford et al., 2011), and ERA5 (2019 onwards; Hersbach et al., 2020) reanalyses, taking the atmospheric states of 1 and 2 November. The ocean, sea ice, and land surface states are initialized with an ensemble of global data assimilation products (ocean and sea ice) and analyses constrained with observed fluxes (land surface). Specifically, land surface is initialized using two different analyses obtained from a land-only configuration of the CLM4.5 land model integrated offline with two different atmospheric forcing datasets, namely CRUNCEP version 7 (Viovy, 2016) and GSWP3 (Kim, 2017). These datasets provide the land model with instantaneous 2 m air temperature and humidity, 10 m winds and surface pressure every 6 h, and accumulated radiation and precipitation every 3 h. Ocean initial states are derived from CHOR (for the period 1960–2010; Yang et al., 2016) and CGLORSv7 reanalysis (for the period 2011–2020; Storto and Masina, 2016) and are performed with a three-dimensional variational data assimilation system, a surface nudging, and a bias correction scheme. It is worth noting that the reanalysis is performed with the same ocean model used in the CMCC DPS (i.e., NEMO v3.6). An ensemble of five ocean initial states is used to initialize the ocean and sea ice components, where three initial estimates originate from global ocean reanalysis characterized by different assimilation strategies of SST and in situ profiles of temperature and salinity in a 0.5∘ configuration of the NEMO ocean model, while the remaining two initial states are derived through linear combinations of the former three initial states. The ocean initial states provide three-dimensional fields of temperature, salinity, and horizontal currents. The sea ice model has been initialized, starting from sea ice temperature, sea ice volume, sea ice area, and snow volume. Our full-field initialization approach is similar to the ones adopted by other DPSs (e.g., Bilbao et al., 2021; Sospedra-Alfonso et al., 2021) in which the a posteriori correction is applied, since the simulations deviate to their own model attractors. Other DPSs (e.g., Bethke et al., 2021; Brune and Baehr, 2020; Kataoka et al., 2020) are initialized using the observed anomalous variability superimposed on the model climatology to avoid the initial shock. Both the techniques are deemed valid in CMIP6 DCPP protocols (Boer et al., 2016) and present some drawbacks. For example, bias correction in the former may remove part of the variability signal, while the latter has the assumption that the model variability is independent from the model mean state. Nevertheless, several studies have proven that differences in skill are small and localized (Smith et al., 2013; Bellucci et al., 2015b; Volpi et al., 2017).
The time-evolving radiative forcings (including solar radiation, greenhouse gas concentrations, and anthropogenic and volcanic aerosols) are prescribed during the historical period (1960–2014) and follow the Shared Socioeconomic Pathways (SSPs) scenario of SSP2-4.5 (O'Neil et al., 2016) from 2015 onwards, which is in agreement with the CMIP6 DCPP protocol.
Table 1List of initial conditions used for the generation of the 20-member hindcast ensemble.
2.2 Verification data
Uninitialized historical simulations covering the 1850–2014 period are used to assess the added value of realistic model initialization in decadal predictions. We use a 10-member ensemble of historical simulations initialized with different states of a multi-century preindustrial climate simulation. Each member of the historical ensemble is extended until 2030 under the SSP2-4.5 scenario, thus allowing a fair comparison with the decadal forecast ensemble initialized in the year 2020. Since only 10 historical members are available, the 20-member hindcast ensemble has been scaled down using a random sub-sampling with 100 combinations in order to allow a fair comparison to the historical ensemble in the skill assessments.
The predictive skill for both initialized reforecasts and uninitialized projections is assessed against observational products. The temporal coverage of lead year 1 is 1961–2020, since not every observational product used in this study covers the year 2021 onwards. Lead years 1–5 and 6–10 consider, respectively, the periods 1961–2015 and 1966–2020. To verify the skill for SST, we rely on the Met Office Hadley Centre Sea Ice and Sea Surface Temperature (HadISST) dataset version 1.1 (Rayner et al., 2003), while, for 2 m air temperature (T2m), the CRU TS v4.05 dataset (Harris et al., 2021) is used. Precipitation is assessed by means of the GPCC Full Data Monthly Product Version 2020 (Schneider et al., 2020), while, for mean sea level pressure, the HadSLP2 dataset (Allan and Ansell, 2006) is used.
2.3 Verification metrics
Initializing decadal predictions from estimates of the observed states of the Earth system may generate spurious responses, since the climate model used to produce the simulations, after initialization, tends to drift towards its own attractor (mean climate), deviating from the observed climatology, which is a consequence of the model's systematic error (bias). This issue is particularly pronounced in the prediction systems adopting a full-field initialization strategy, as in the present case. The spurious drift can be removed a posteriori by subtracting a lead-time-dependent climatology at each grid point, assuming a constant drift throughout the time record (Goddard et al., 2013; Boer et al., 2016).
To evaluate the skill of the prediction system, both deterministic and probabilistic metrics are used. The anomaly correlation coefficient (ACC) and the mean square skill score (MSSS) are deterministic metrics, measuring the accuracy of the ensemble mean prediction in reproducing the observed variability over the 1961–2020 period targeted by the decadal reforecasts. More specifically, the ACC is a dimensionless measure evaluating the phase agreement between predicted and observed anomalies, ranging from −1 to 1 (Wilks, 2011). The MSSS, additionally, quantifies the magnitudes between the predicted and observed anomalies (Goddard et al., 2013). This metric evaluates the skill of the ensemble mean prediction with respect to a reference prediction.
Specifically, the MSSS is defined as follows:
where MSEHO (MSEPO) is the mean square error evaluated for the initialized (uninitialized) ensemble mean against observations. The MSSS takes a maximum value of one (1.0), while it does not have a lower limit. Positive MSSS values mean more accurate predictions in the initialized runs, and one may speculate that the opposite is also true. However, since the MSSS is not symmetric around zero, the positive and negative MSSS absolute values do not have the same meaning in terms of variance.
Probabilistic skill scores provide a useful complement to deterministic metrics in assessing the quality of a prediction system. In this study, relative operating characteristic (hereafter ROC) score maps have been assessed for the hindcasts (Kharin and Zwiers, 2003; Wilks, 2011). Each grid point in these maps shows the area under the ROC curve, equal to the probability of a certain anomaly to exceed a specific threshold. When the ROC score approaches the perfect forecast (i.e., equal to one), then the DPS is able to discriminate the occurrence of predetermined events. On the other hand, no skill emerges when the score is close to 0.5. Here, we have considered three equiprobable categories, i.e., upper tercile, lower tercile, and between lower and upper terciles (neutral). Note that the ROC score outcome is not dependent on forecast biases (i.e., calibration; Kharin and Zwiers, 2003).
The DPS's ability to reproduce the dominant climate variability patterns is also tested, focusing in particular on the North Atlantic and North Pacific sectors. Decadal variability in the Atlantic region is well described by the AMV, estimated as the detrended anomalies of SSTs area-weighted over the North Atlantic basin, following the definition adopted in Trenberth and Shea (2006). The skill in predicting the NAO index is also tested using the definition in Li and Wang (2003; Fig. S1 in the Supplement).
We characterize the low-frequency variability in the Pacific basin through the IPO, which is, in turn, expressed in terms of the IPO tripolar index (TPI), accounting for the difference between the averaged SST anomalies over the equatorial zone and over the extratropical lobes of the IPO (Henley et al., 2015). At shorter timescales, the ENSO prediction is evaluated through the Niño 3.4 index, representing the spatially averaged SST anomaly over the respective region of the equatorial Pacific.
The statistical significance is assessed with a one-tailed Student's t test (Wilks, 2011), accounting for autocorrelation in the time series (Eq. 30 from Bretherton et al., 1999). The anomalies of the observations and the historical simulations are computed with respect to their climatologies (reference period 1981–2010). In the initialized runs, the climatology for each forecast year is computed considering the highest possible number of initialization years. This approach allows us to maximize the statistical robustness, even if the skill may depend on the targeted verification years.
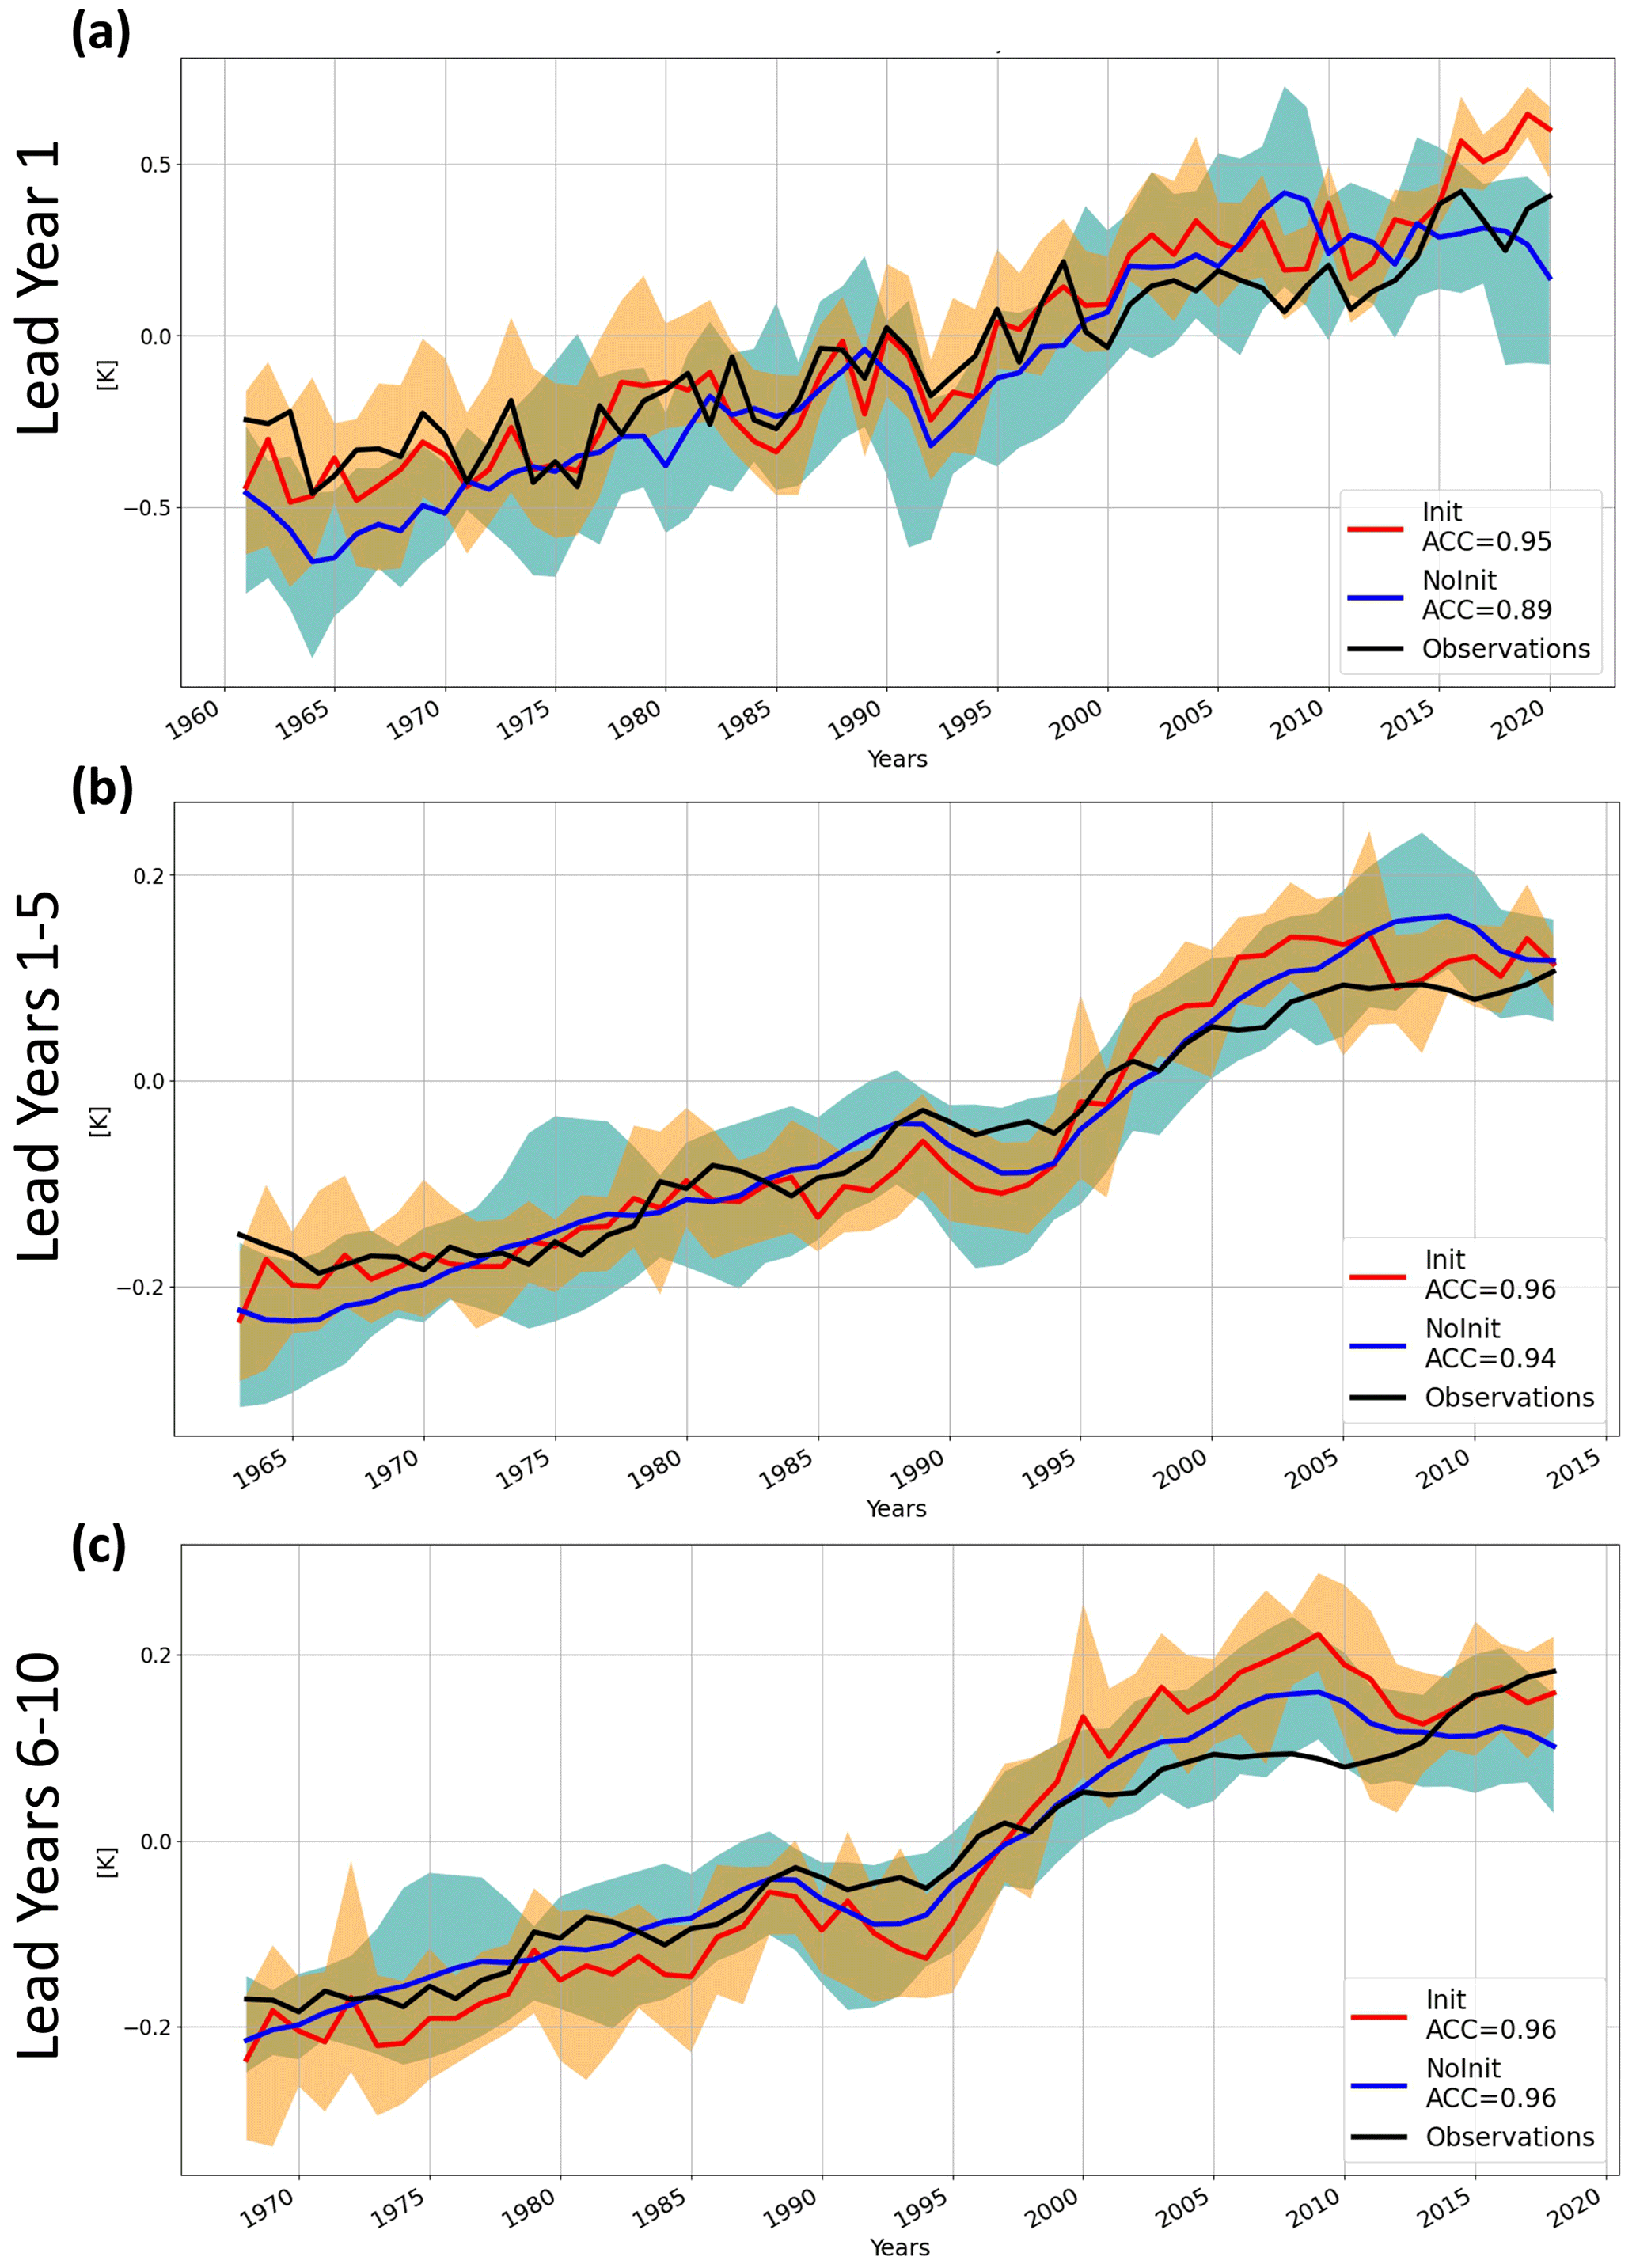
Figure 1Global mean near-surface temperature (T2m plus SST) annual average anomaly time series (K) for the hindcast (Init; in red), historical and SSP2 scenario (NoInit, in blue), and CRU TS v4.05 and HadISST1.1 (in black), for (a) forecast years 1, (b) 1–5, and (c) 6–10. The orange (cyan)-colored envelope denotes the intra-ensemble spread for Init (NoInit). The time series are centered at the lead year interval, e.g., 1963 corresponds to the 1961–1965 mean in panel (b).
3.1 Near-surface air temperature
Skill in predicting the global mean surface temperature (GMST; based on 2 m air temperature over land and SST over the ocean) is assessed against observed anomalies combining CRU TS v4.05 (Harris et al., 2020) over land and HadISST 1.1 for SSTs (Rayner et al., 2003). Figure 1 shows GMST for initialized hindcasts (in red; hereafter Init), non-initialized historical simulations (in blue; hereafter NoInit) and observations (in black).
At lead year 1, the initialized ensemble reproduces the observed GMST anomalies quite closely, showing a higher correlation (ACC = 0.95) compared to NoInit (ACC = 0.89), which is mainly explained by the strong impact of the imposed initial state at the beginning of the forecasts. Looking at the lead year range 1–5, Init still resembles the observed variability (ACC = 0.96) within a range of 0.05 ∘C. Even if NoInit displays relatively high correlation (ACC = 0.94), its skill is substantially due to the global warming trend driven by external forcings, and in this case, the anomaly time series does not reproduce the observed interannual variability. The time evolution of the near-surface temperature over the 6–10 lead year range exhibits comparable correlations for both initialized and historical ensembles (ACC = 0.96), indicating that the radiative forcing has a dominant role at longer lead times.
The ensemble spread envelope of predicted GMST (denoting maximum and minimum range of the members variability; shown in orange) encompasses the observations, especially at lead years 1 and 1–5, successfully capturing the multiyear variability, including the cooling effect of major volcanic eruptions, such as the El Chichón and Pinatubo eruptions that occurred in 1982 and 1991, respectively. The initialization contributes to the reduction in the Init ensemble spread, which is about half the envelope of the NoInit for lead year 1, due to the beneficial impact of synchronizing observed and model internal climate variability.
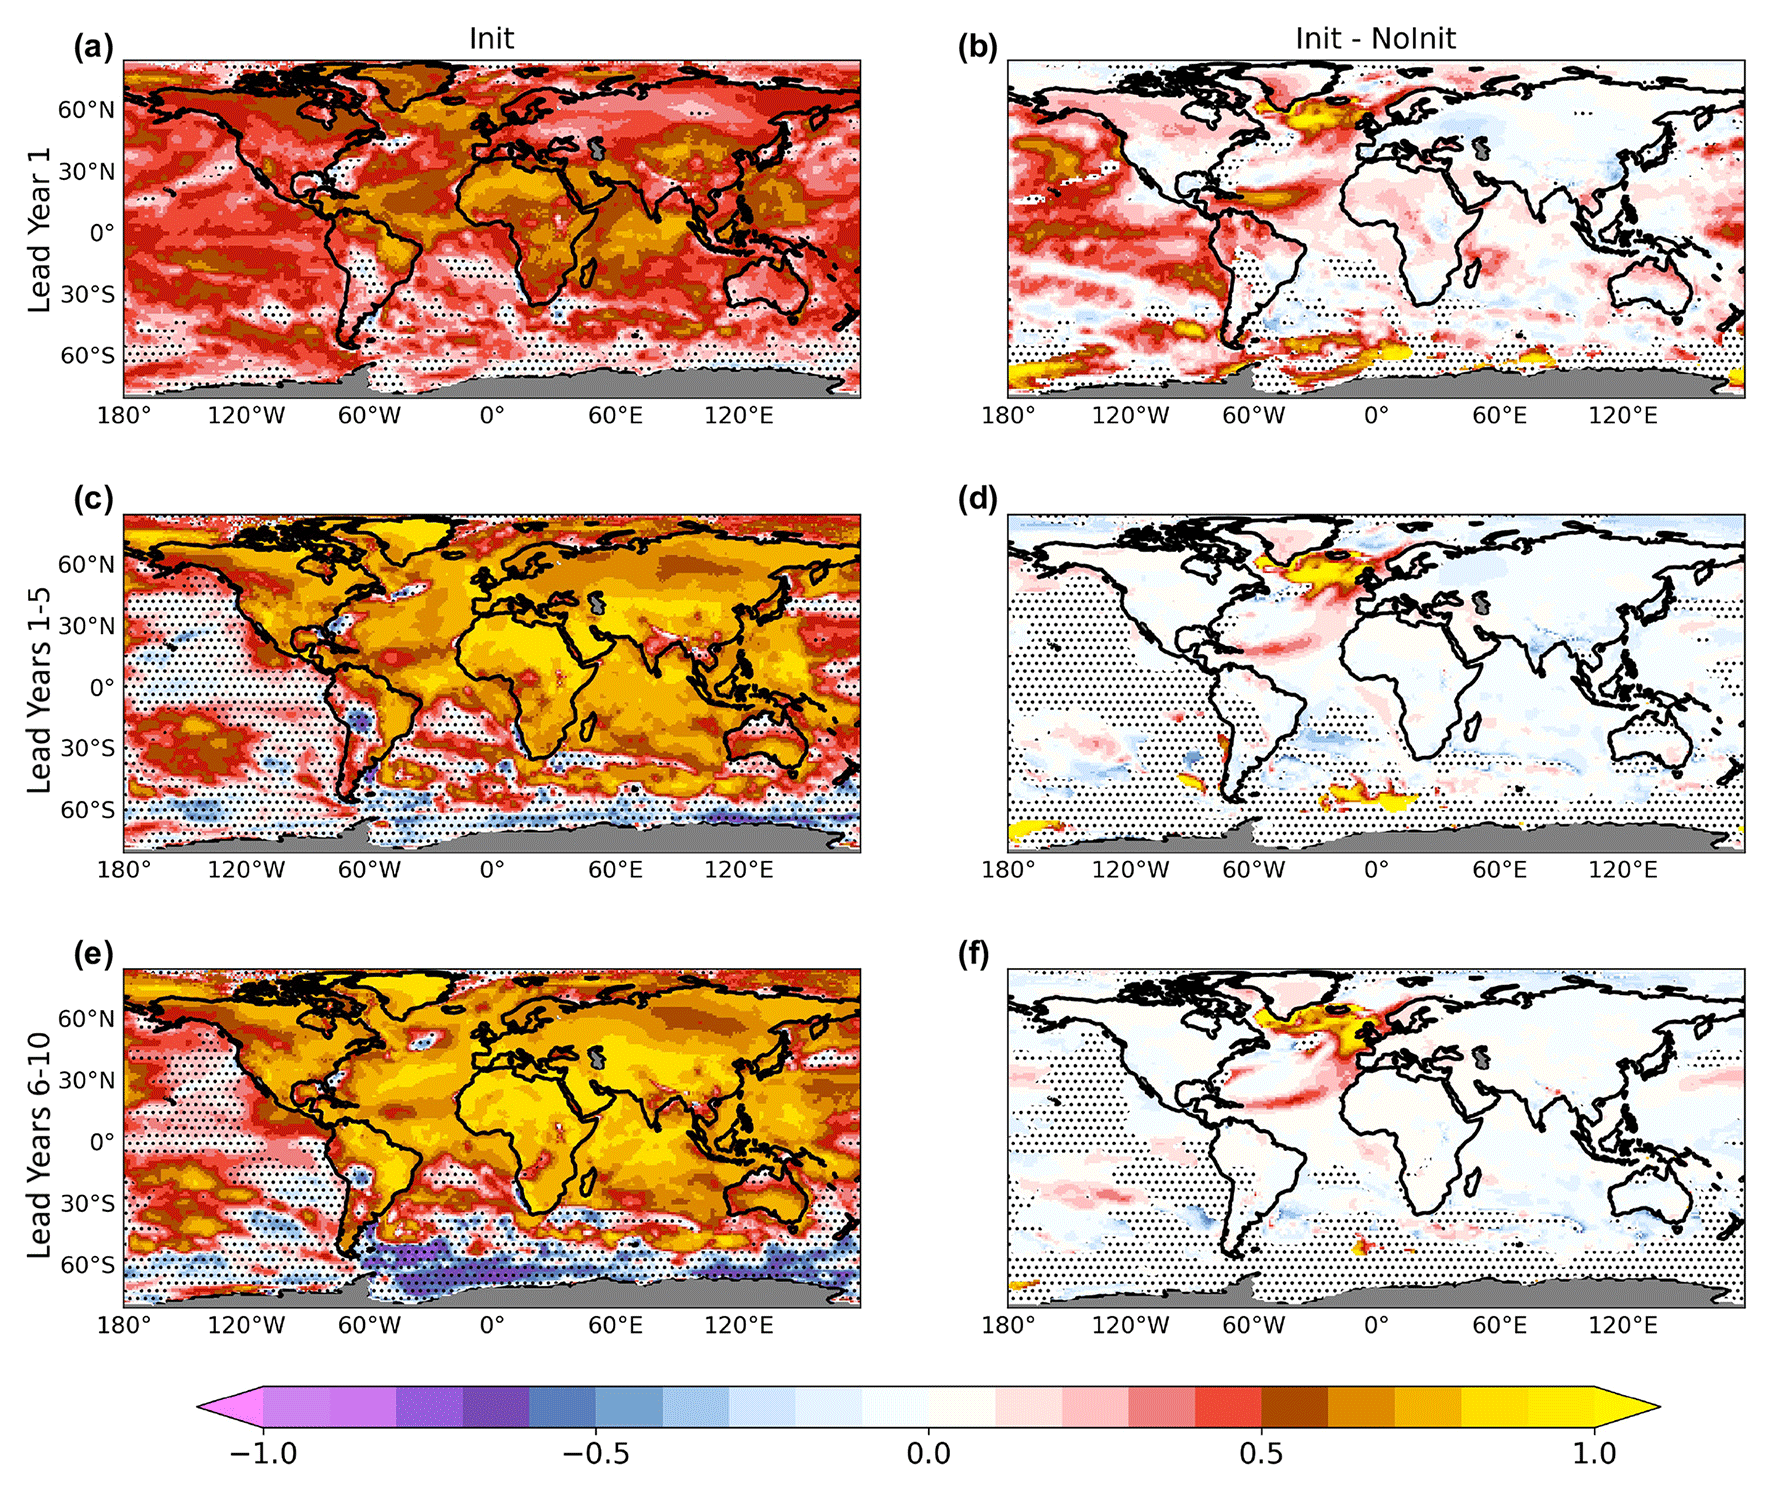
Figure 2Near-surface temperature (T2m plus SST) anomaly correlation coefficient (ACC) of the hindcast ensemble (Init; a, c, e) and its difference with the NoInit ensemble (Init − NoInit; b, d, f) for lead years 1 (a, b), 1–5 (c, d), and 6–10 (e, f). The stippling denotes points where 95 % statistical significance is not reached, according to a one-tailed t test. Effective degrees of freedom have been computed following Eq. (30) in Bretherton et al. (1999).
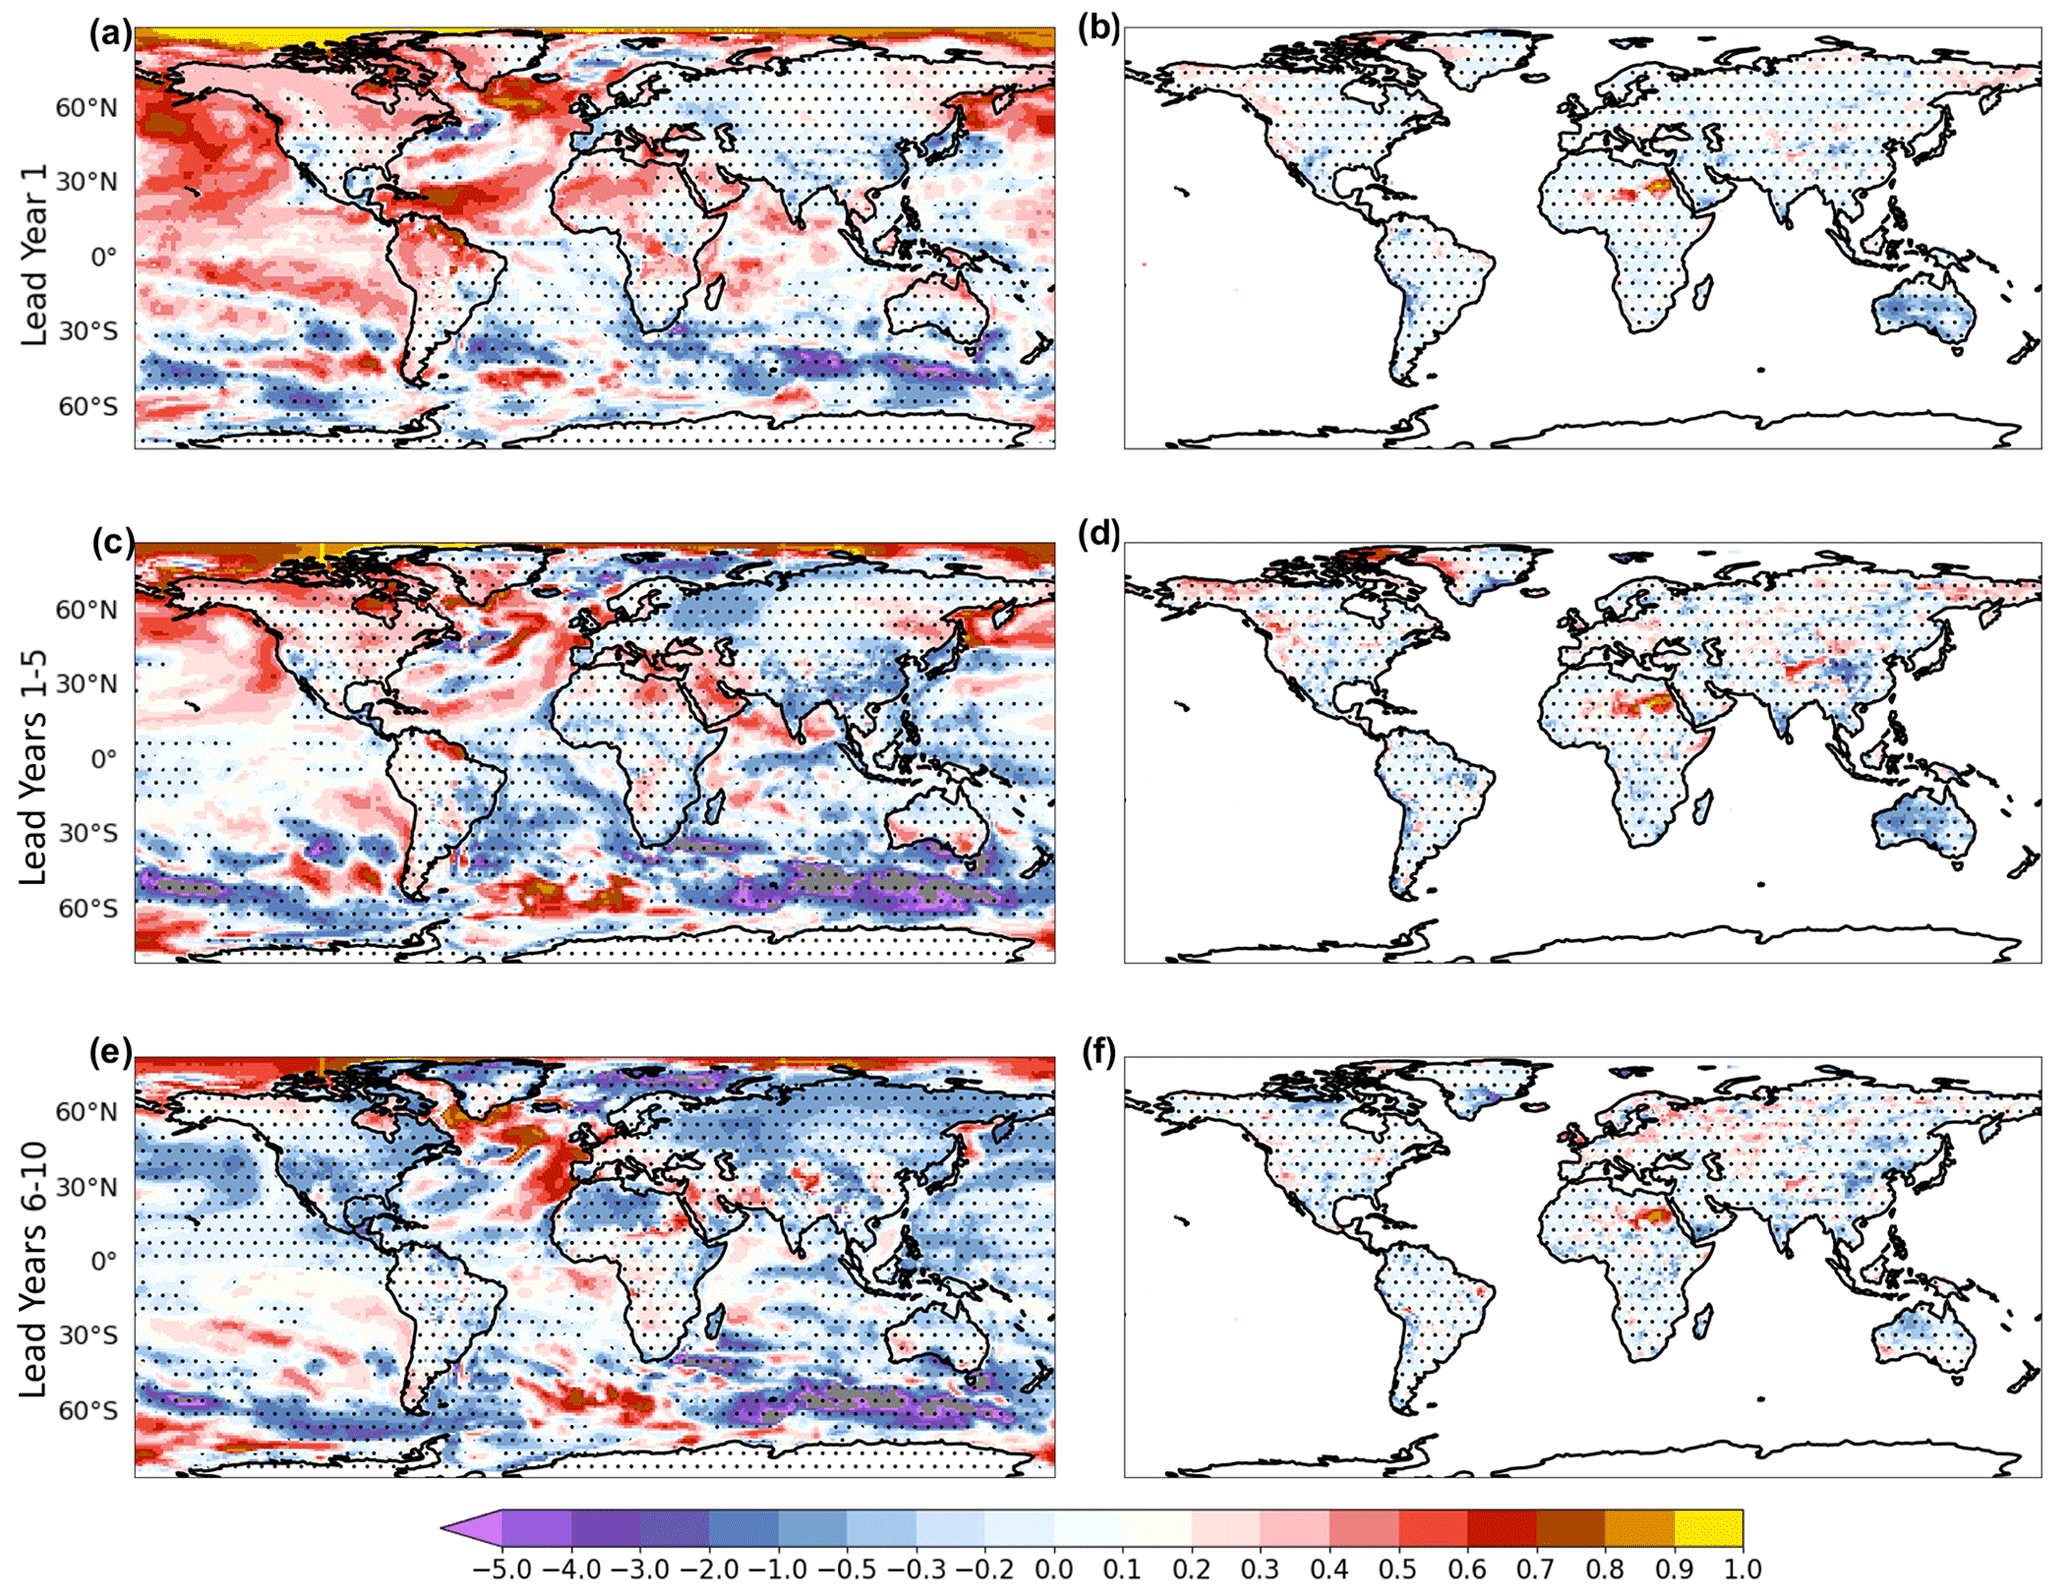
Figure 3Near-surface temperature (T2m plus SST; a, c, e) and precipitation (b, d, f) mean squared skill score (MSSS) of the hindcasts, using NoInit runs as the reference forecast to beat. Note that the color bar is not symmetric around zero. Stippling is used to indicate points where 95 % statistical significance is not reached, according to a one-tailed t test. Effective degrees of freedom have been computed following Eq. (30) in Bretherton et al. (1999).
3.2 Deterministic metrics
Predictive skill at the regional scale is assessed through ACC maps. Figure 2 shows ACC for annual surface temperatures evaluated at different lead year intervals and the corresponding differences with respect to NoInit. In order to remove the skill impact on different ensemble sizes, we compare the skill of the historical (10 available members) with the skill of random subsampling of the initialized run with 10 members out of the 20 available members. The MSSS maps provide further details on the skill improvement determined by initialization (Fig. 3), assessing the consistency between the magnitudes of the predicted and the observed anomalies (see Sect. 2.3).
At lead year 1, significant predictive skill is found over most of the globe, reaching the highest values (ACC = 0.80) over the tropical Indian Ocean, northern and equatorial Africa, northeastern part of South America, subpolar North Atlantic, and western tropical Pacific. Lack of skill, instead, characterizes the western subtropical North Atlantic, eastern Europe, central part of South America, and part of the western North Pacific and Southern Ocean. The added value of initialization (Fig. 2b) is particularly prominent over the tropical and the eastern subpolar North Atlantic and over the tropical and the extratropical North Pacific. In addition, Init exhibits higher skill (up to 0.5) over the North American continent, central Africa, and the Indian subcontinent. The corresponding MSSS pattern (Fig. 3a) clearly indicates that Init outperforms NoInit in reproducing the magnitude and the sign of the observed anomalies over approximately the same areas, showing improved ACC with respect to NoInit (Fig. 2b).
In the 1–5 lead year range, the skill is generally higher than for lead year 1, likely due to the effect of averaging over a longer interval (5 years) and to the emerging warming trend. In contrast, the skill undergoes a clear deterioration over the tropical and northern part of the Pacific Ocean when a multiyear range of prediction skill is considered (Fig. 2c). Significant skill is found over the continental areas of North America, Eurasia, Africa, and over the Maritime Continent. A large fraction of the skill seems to derive from the warming trend that increases predictability, at this lead year range, over land and over the Indian Ocean (Van Oldenborg et al., 2012). Over the North Atlantic Ocean, the emerging AMV footprint is recognizable, with high predictive skill associated with the typical horseshoe pattern emerging from the Init vs. NoInit comparison (Fig. 2d). This pattern is also noticeable in the relative MSSS map (Fig. 3c), suggesting improved predictability for the AMV tropical lobe, while the extratropical lobe may be affected by strong biases as it is characterized by high ACC values and neutral MSSS. Near-term prediction skill is improved especially over the eastern Mediterranean and the Arabian Peninsula (ACC = 0.3), reaching high correlation values (ACC = 0.90 in Fig. 2c) also reflected in the MSSS (Fig. 3c).
The pattern exhibited in the lead year range 6–10 is very similar to that shown in lead years 1–5, although some regional changes, such as those in eastern Europe and Siberian region, may be easily spotted. Areas with non-statistically significant skill cover part of the eastern Pacific Ocean (Fig. 2e). The generally higher skill attributable to initialization (Fig. 2f) is substantially consistent with the pattern obtained for the lead year range 1–5, even if it is not reproduced in the MSSS analysis (Fig. 3e), suggesting that surface temperature variations are not well captured.

Figure 4Same as Fig. 2 but for the ocean heat content integrated over the top 300 m depth.
To corroborate the skill analysis of surface temperature at decadal timescales, we assess the skill for the ocean heat content integrated over the top 300 m of the water column (hereafter OHC300). The ACC pattern computed for the OHC300 anomalies (Fig. 4) is similar to, and thus consistent with, the results obtained for the SST (Fig. 2). At lead year 1, significant ACC covers most parts of the oceans, except for the eastern Atlantic and Southern Ocean. The anomalies' values are also well captured north of 30∘ N. The OHC300 area exhibiting significant skill is reduced when higher lead time ranges are considered. At lead years 1–5 and 6–10, the ACC is significant over the tropical Pacific, excluding the equatorial band due to the poor long-term predictability of ENSO, as also found in other DPSs (e.g., Bilbao et al., 2021). Positive ACC values also cover part of the Indian Ocean and South and North Atlantic regions. The MSSS shows positive values mainly localized over the midlatitudes in the North Atlantic (Fig. S6) and is found to be quite consistent with SST MSSS (Fig. 3). The lack of skill over the subpolar gyre may be partly due to the erroneous representation of the AMOC in the DPS, altering the local ocean circulation and heat content. A complementary analysis reveals that the mean AMOC cell in the DPS is quite well reproduced in terms of structure although its maximum is located too far south (below 20∘ N) at lead year 1 (Fig. S3), as compared to other AMOC reconstructions based on different oceanic reanalyses (e.g., Karspeck et al., 2017). At lead years 1–5 and 6–10 the maximum moves northwards, due to the model adjustment towards its own climatology, resembling the structure reported in other studies (e.g., Tsujino et al., 2020). The initialization shock may lead to the AMOC slowdown up to lead year 2 (Figs. S4 and S5), underestimating the maximum by about 2 Sv at 26.5∘ N in the period covered by RAPID array (Moat et al., 2022). The slightly negative trend of the observed AMOC occurring during the last few decades is reproduced just at lead year 1 in the hindcasts (Figs. S4 and S5), while the simulated low-frequency variability is consistent with the observed one also at longer lead years.
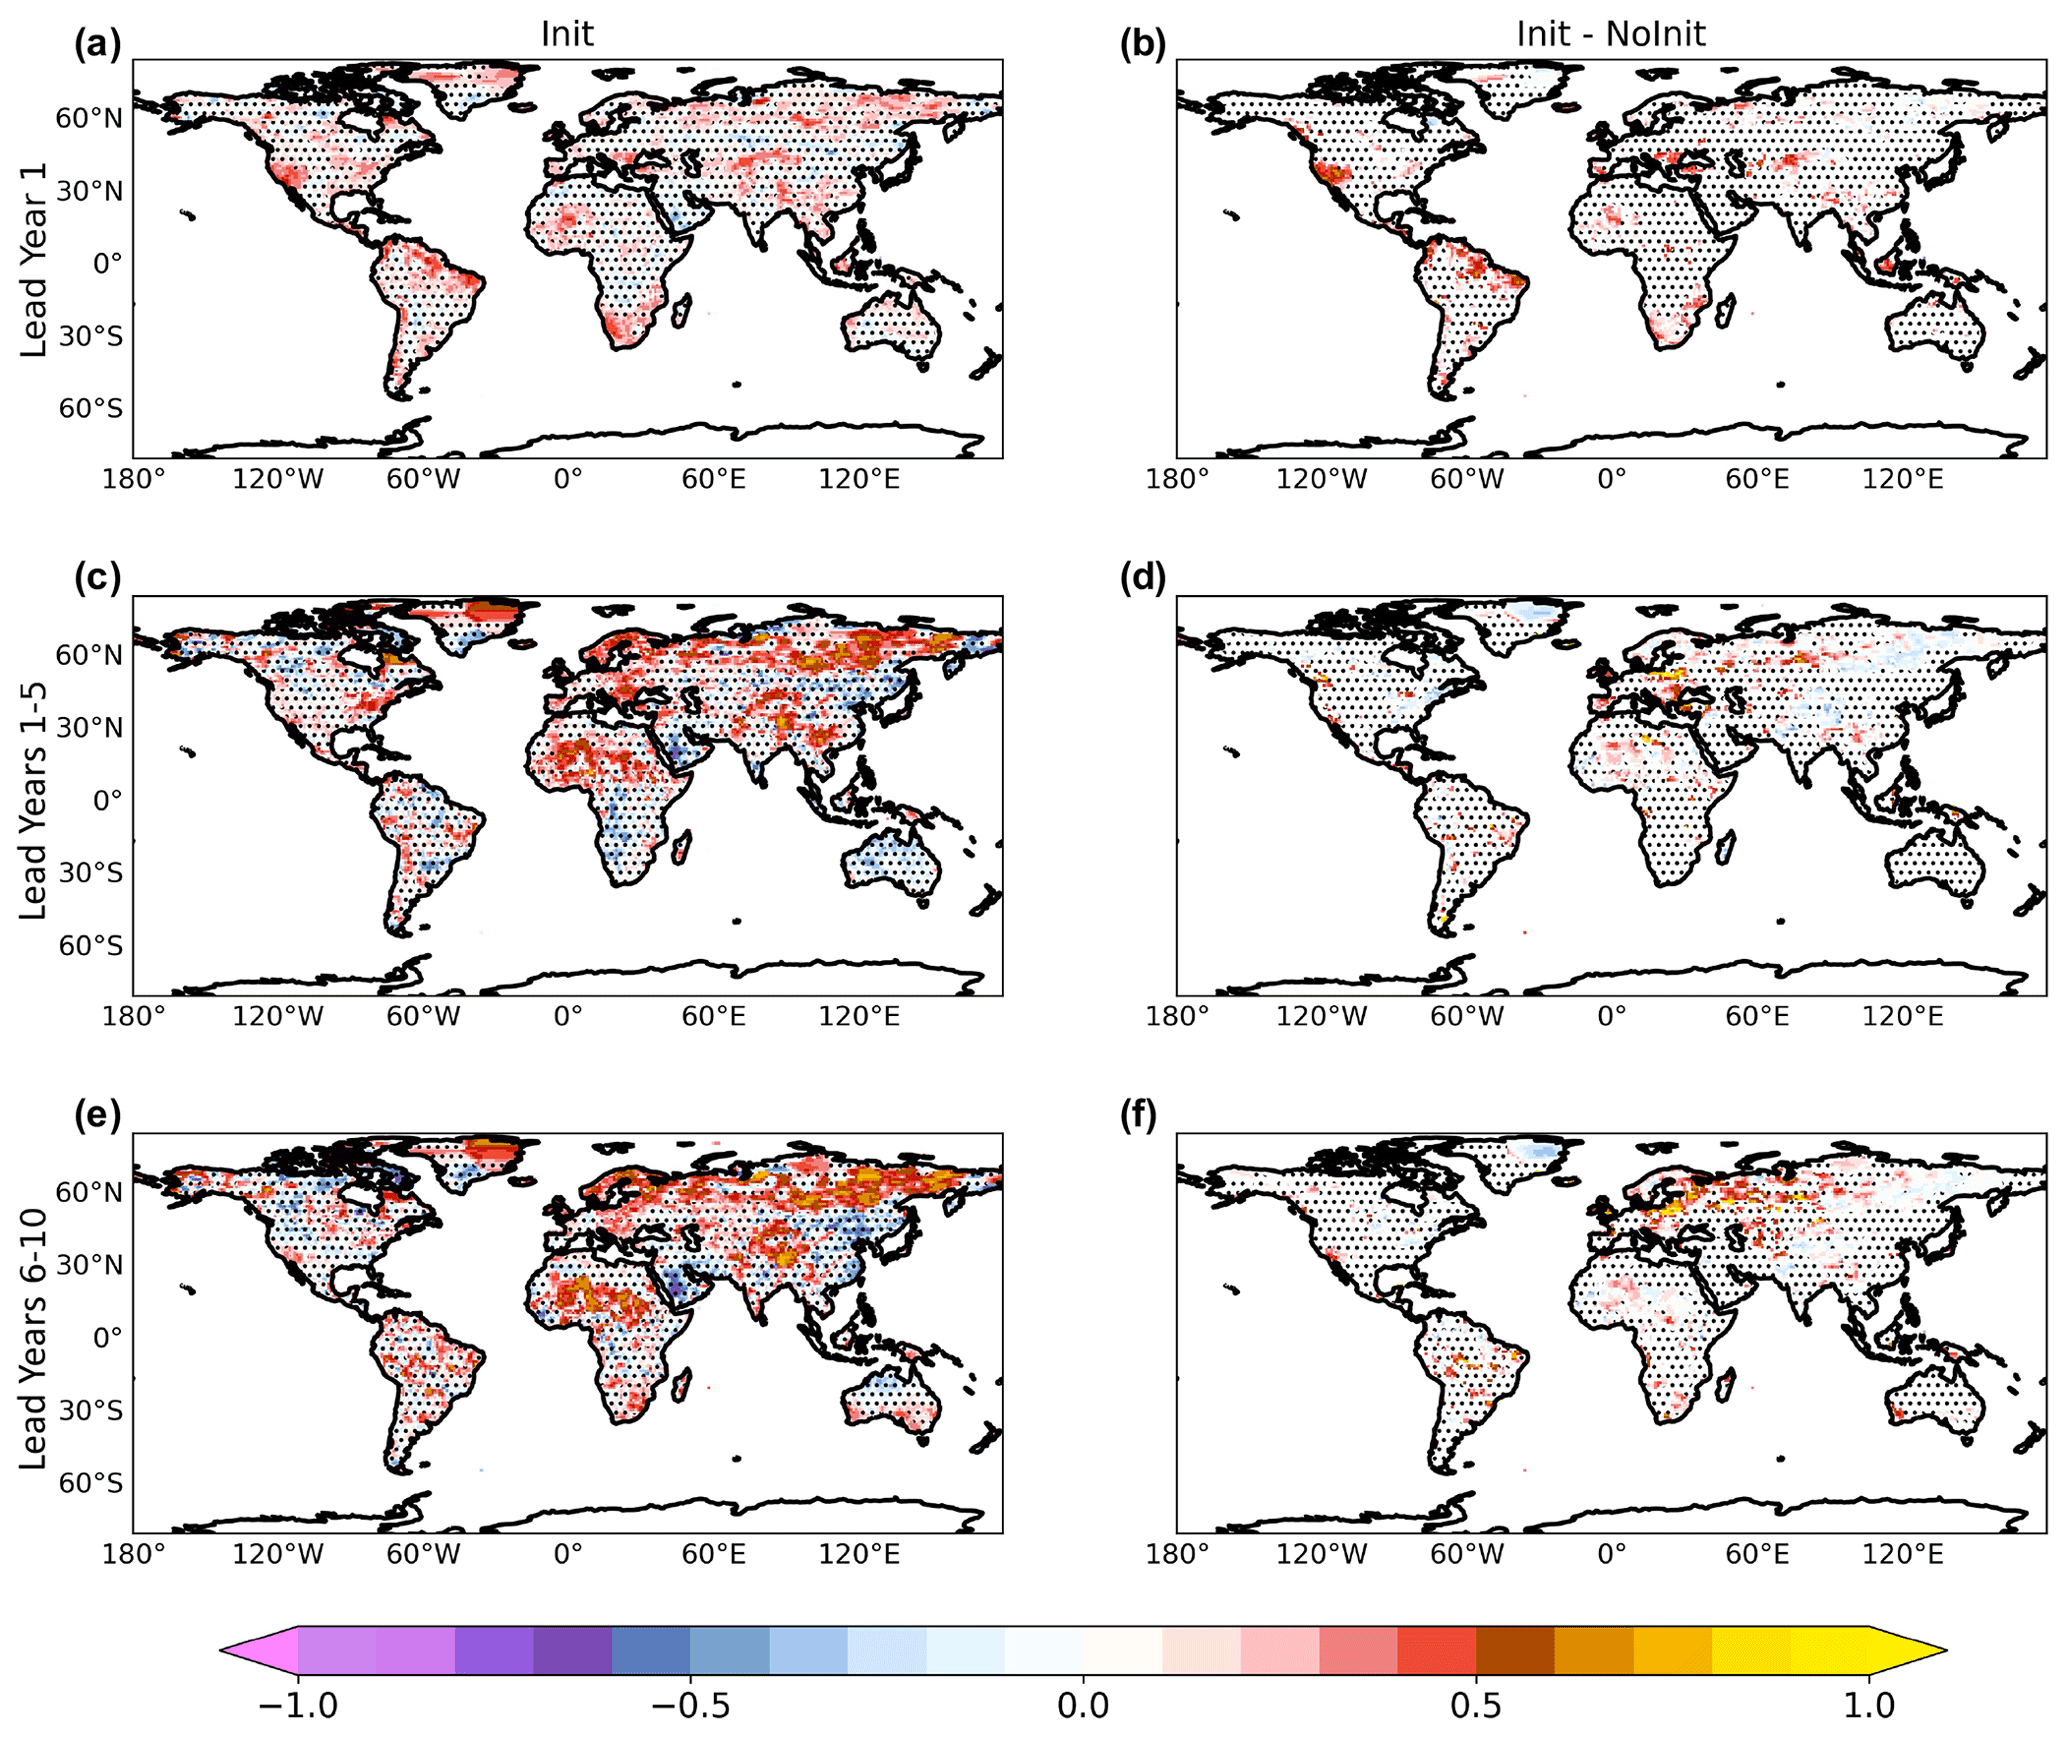
Figure 5Same as Fig. 2 but for the precipitation field.
Compared to surface temperatures, skill in precipitation is generally lower and less spatially coherent (Collins, 2002; Doblas-Reyes et al., 2013). At lead year 1, significant skill is found only in limited areas (Fig. 5a), including northeastern Brazil, southwestern U.S., southern Africa, eastern Australia, the Republic of Türkiye, and the Balkan peninsula, as reflected also by the MSSS values (Fig. 3b). For the lead year ranges 1–5 (Fig. 5c) and 6–10 (Fig. 5e), significant ACC values can be attributed to the northern part of the Eurasian continent, the Sahel, and Europe, including the Iberian Peninsula, the British Isles, and central Europe. However, comparing Init with NoInit reveals that the skill is largely due to trends in the radiative forcing, with slight improvements associated with initialization (Gaetani and Mohino, 2013; Bellucci et al., 2015b).
3.3 Mean bias assessment
The full-field strategy is used to initialize the forecasts, providing the best estimates of the observed state to each model component. It does have an important drawback in that it generates spurious, transient signals determined by the model's tendency to drift towards its own climatological mean state after being initialized from a realistic state around the observed climatology.
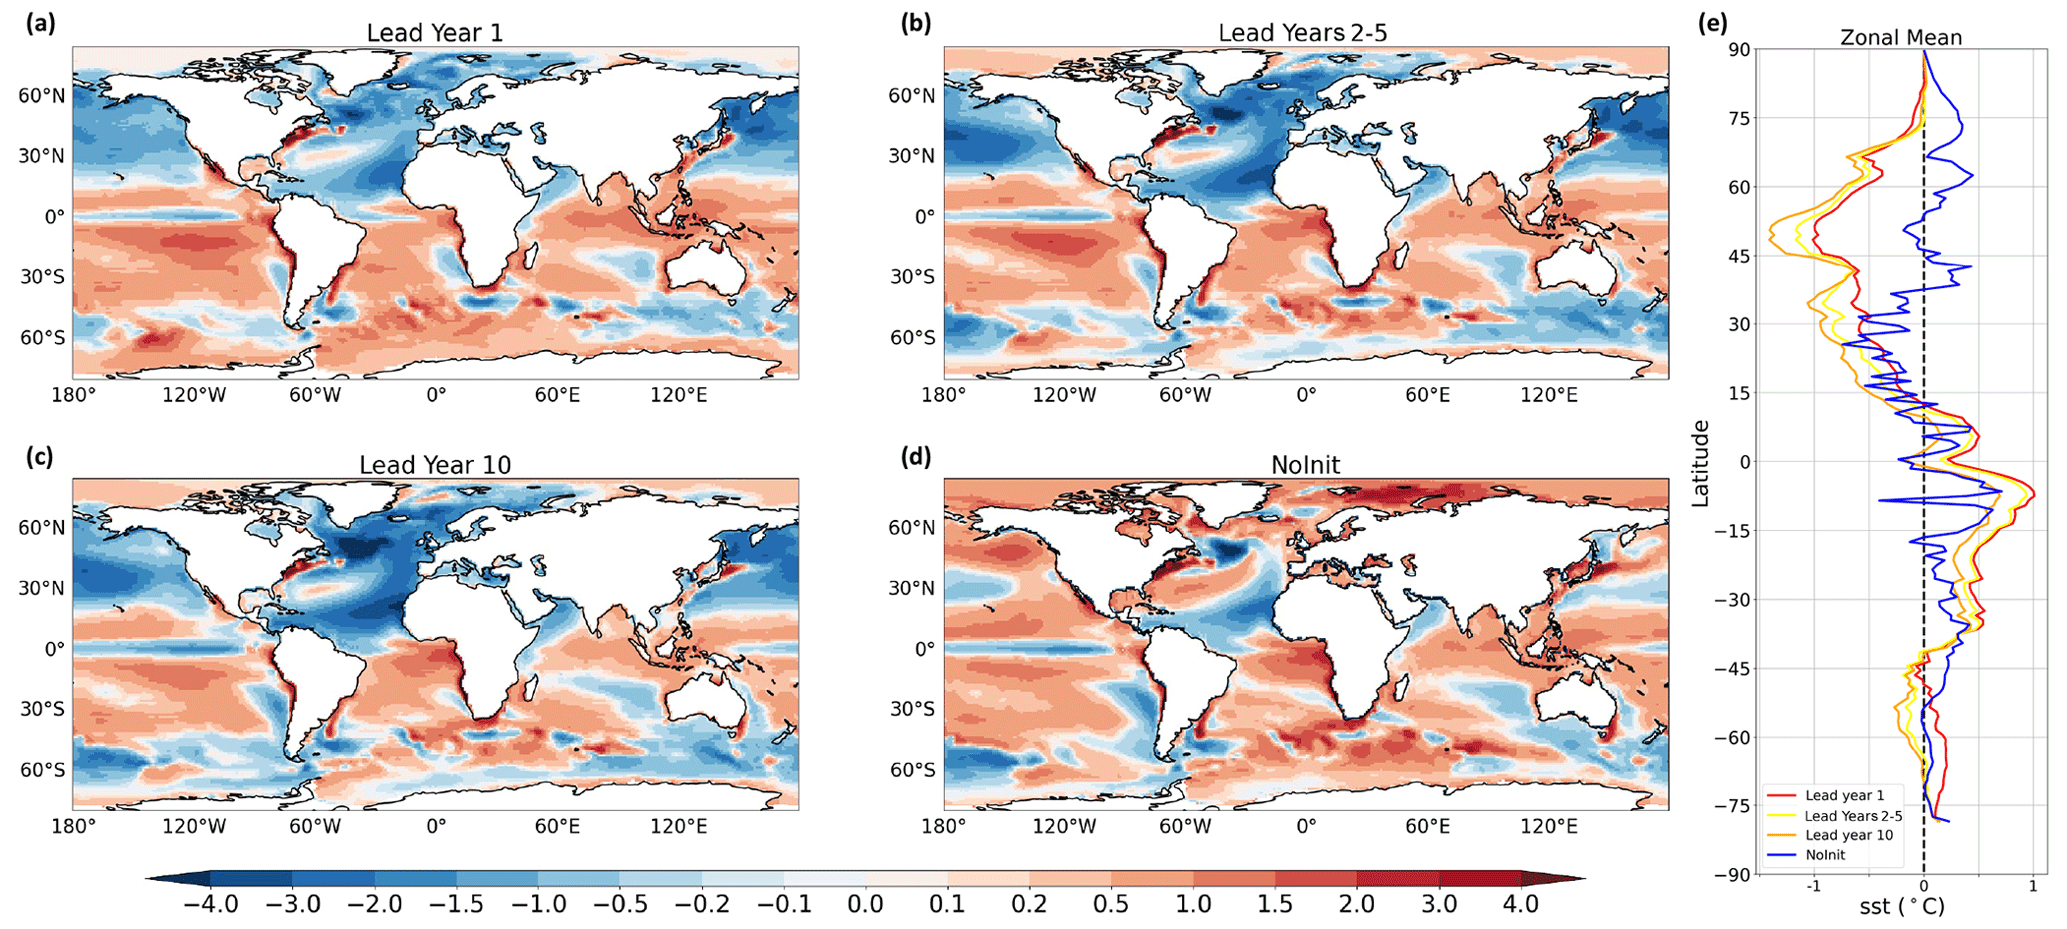
Figure 6Mean SST bias for (a) year 1, (b) years 2–5, (c) year 10, (d) NoInit runs, and (e) their zonal mean (scaled with the cosine of the latitude) with respect to the 1960–2020 period from the HadISST1.1 dataset (Rayner et al., 2003). The unit is degrees Celsius (∘C).
Following the recommendation of the International CLIVAR Project Office (ICPO, 2011), the mean bias is defined as the lead-time-dependent ensemble mean deviation from the observed mean state defined throughout the whole time record (1960–2020). Assessing the mean bias is an important part of evaluating decadal predictions. The time-dependent SST bias for decadal hindcasts (lead years 1, 2–5, and 10) and the bias in the historical simulations are shown in Fig. 6.
The SST bias in Init is very rapidly established during year 1, followed by a slower adjustment occurring in the following years, since the Init curves of zonal mean bias for lead years 1, 2–5, and 10 remain relatively close to each other (Fig. 6e). Bias patterns featured by Init and NoInit differ substantially over the Northern Hemisphere, with the former presenting a prominent cold bias, which is not found at all longitudes in NoInit. In the Southern Hemisphere, Init and NoInit are much more similar. This lack of agreement between Init and NoInit suggests that initialization likely perturbs the equilibrium state of the model climate quite significantly. Interestingly, the same kind of departures from the observed state have been found also in several other decadal prediction systems, including some contributing to the CMIP5 decadal prediction ensemble that adopted a full-field initialization strategy (Bellucci et al., 2015b). This fact indicates that the time adjustment period following the initialization shock typically exceeds 10 years over the subpolar North Atlantic.
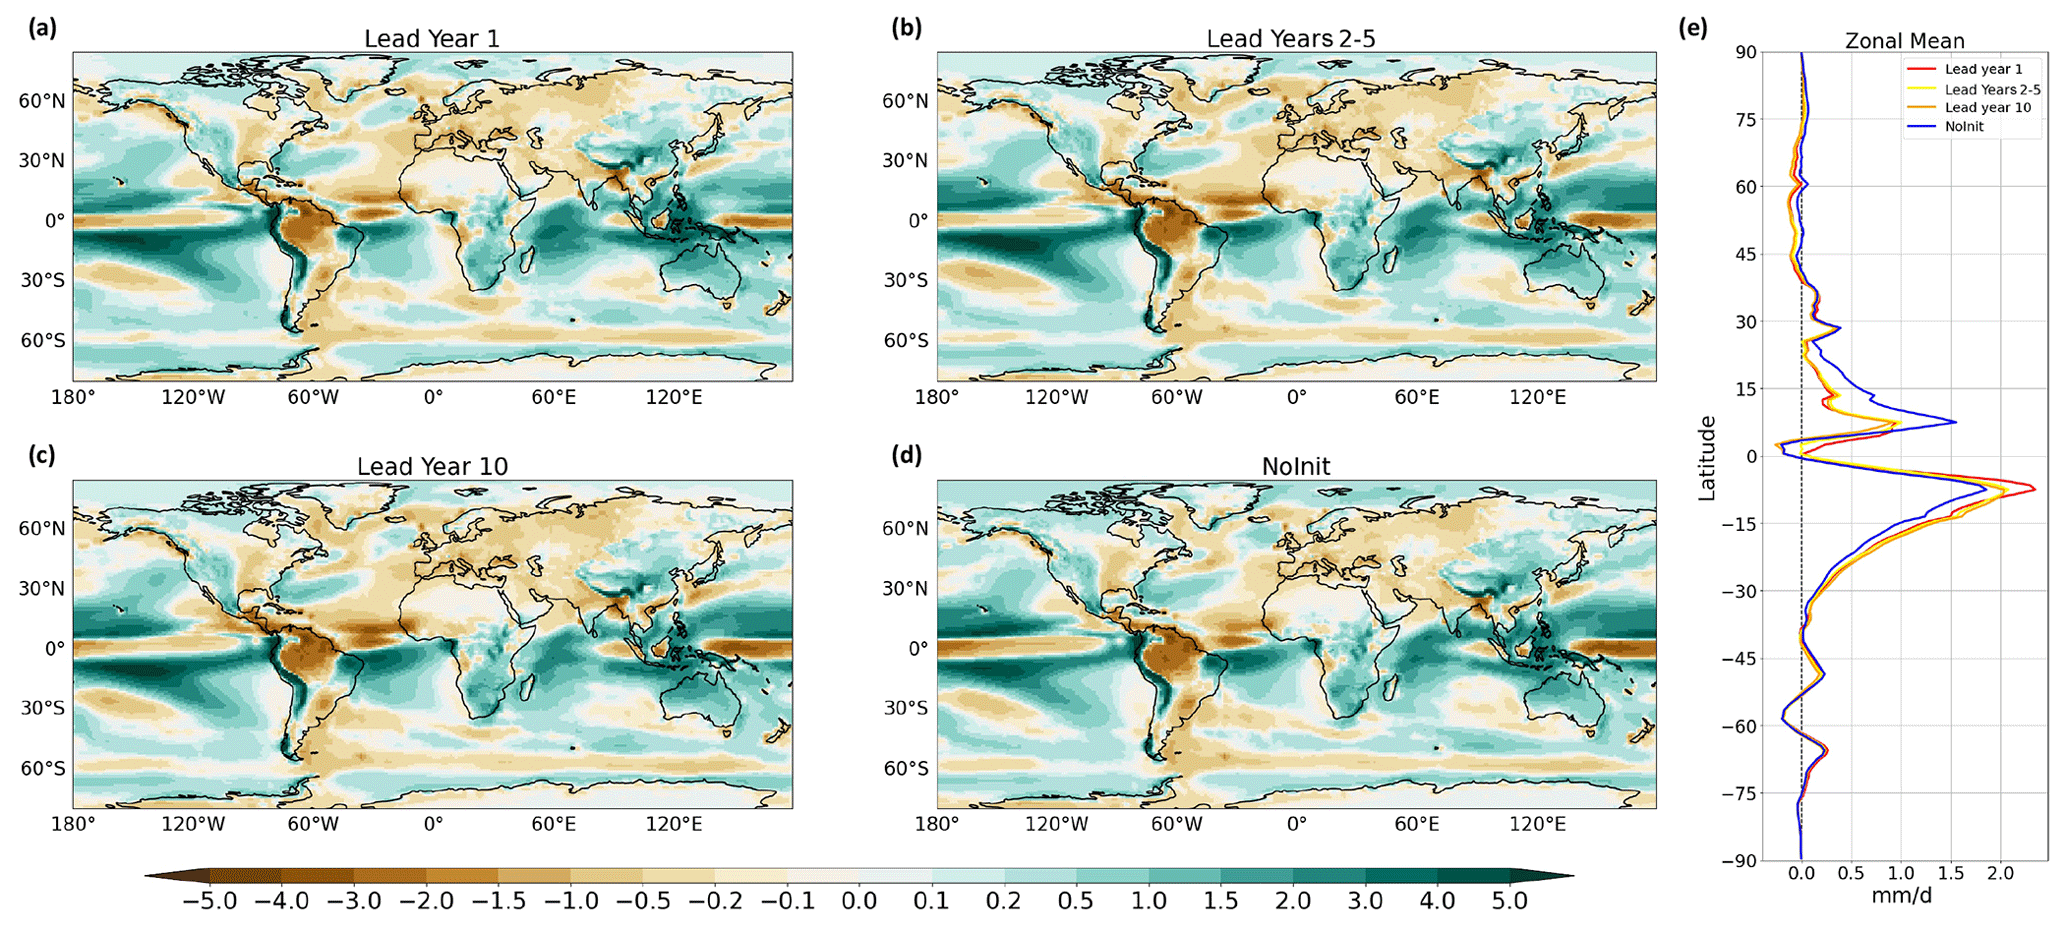
Figure 7Mean precipitation bias for (a) year 1, (b) years 2–5, (c) year 10, (d) NoInit runs, and (e) their zonal mean (scaled with the cosine of the latitude) with respect to the 1960–2020 period from GPCC dataset (Schneider et al., 2020). The unit is millimeters per day (mm d−1).
The Init bias for precipitation is comparable to the NoInit time mean bias (Fig. 7). Major departures occur in the tropical Pacific (20∘ S–20∘ N). Here, precipitation is overly strong in both Init and NoInit, especially south of the Equator, where the spurious occurrence of a southern ITCZ (Intertropical Convergence Zone) is a common bias in coupled models (Tian and Dong, 2020; Bellucci et al., 2010). The double ITCZ is enhanced by initialization, with a rainfall overestimation at lead year 1 (Fig. 7e). This may lead to an artificial increase in precipitation over the southwestern U.S. and drier conditions over the Mediterranean Sea (Dong et al., 2021), as seems to be the case for both the Init and NoInit. Finally, the Init bias for precipitation shows that no strong drift occurs outside the tropical zone, as the bias remains rather stable in lead time.
3.4 ROC score
The relative operating characteristic (ROC) score is used to assess the probabilistic properties of the ensemble Init (see Sect. 2.3). In this paper, the ROC score analysis focuses on near-surface temperature, because of its high predictability, and considers the occurrence of tercile categories.
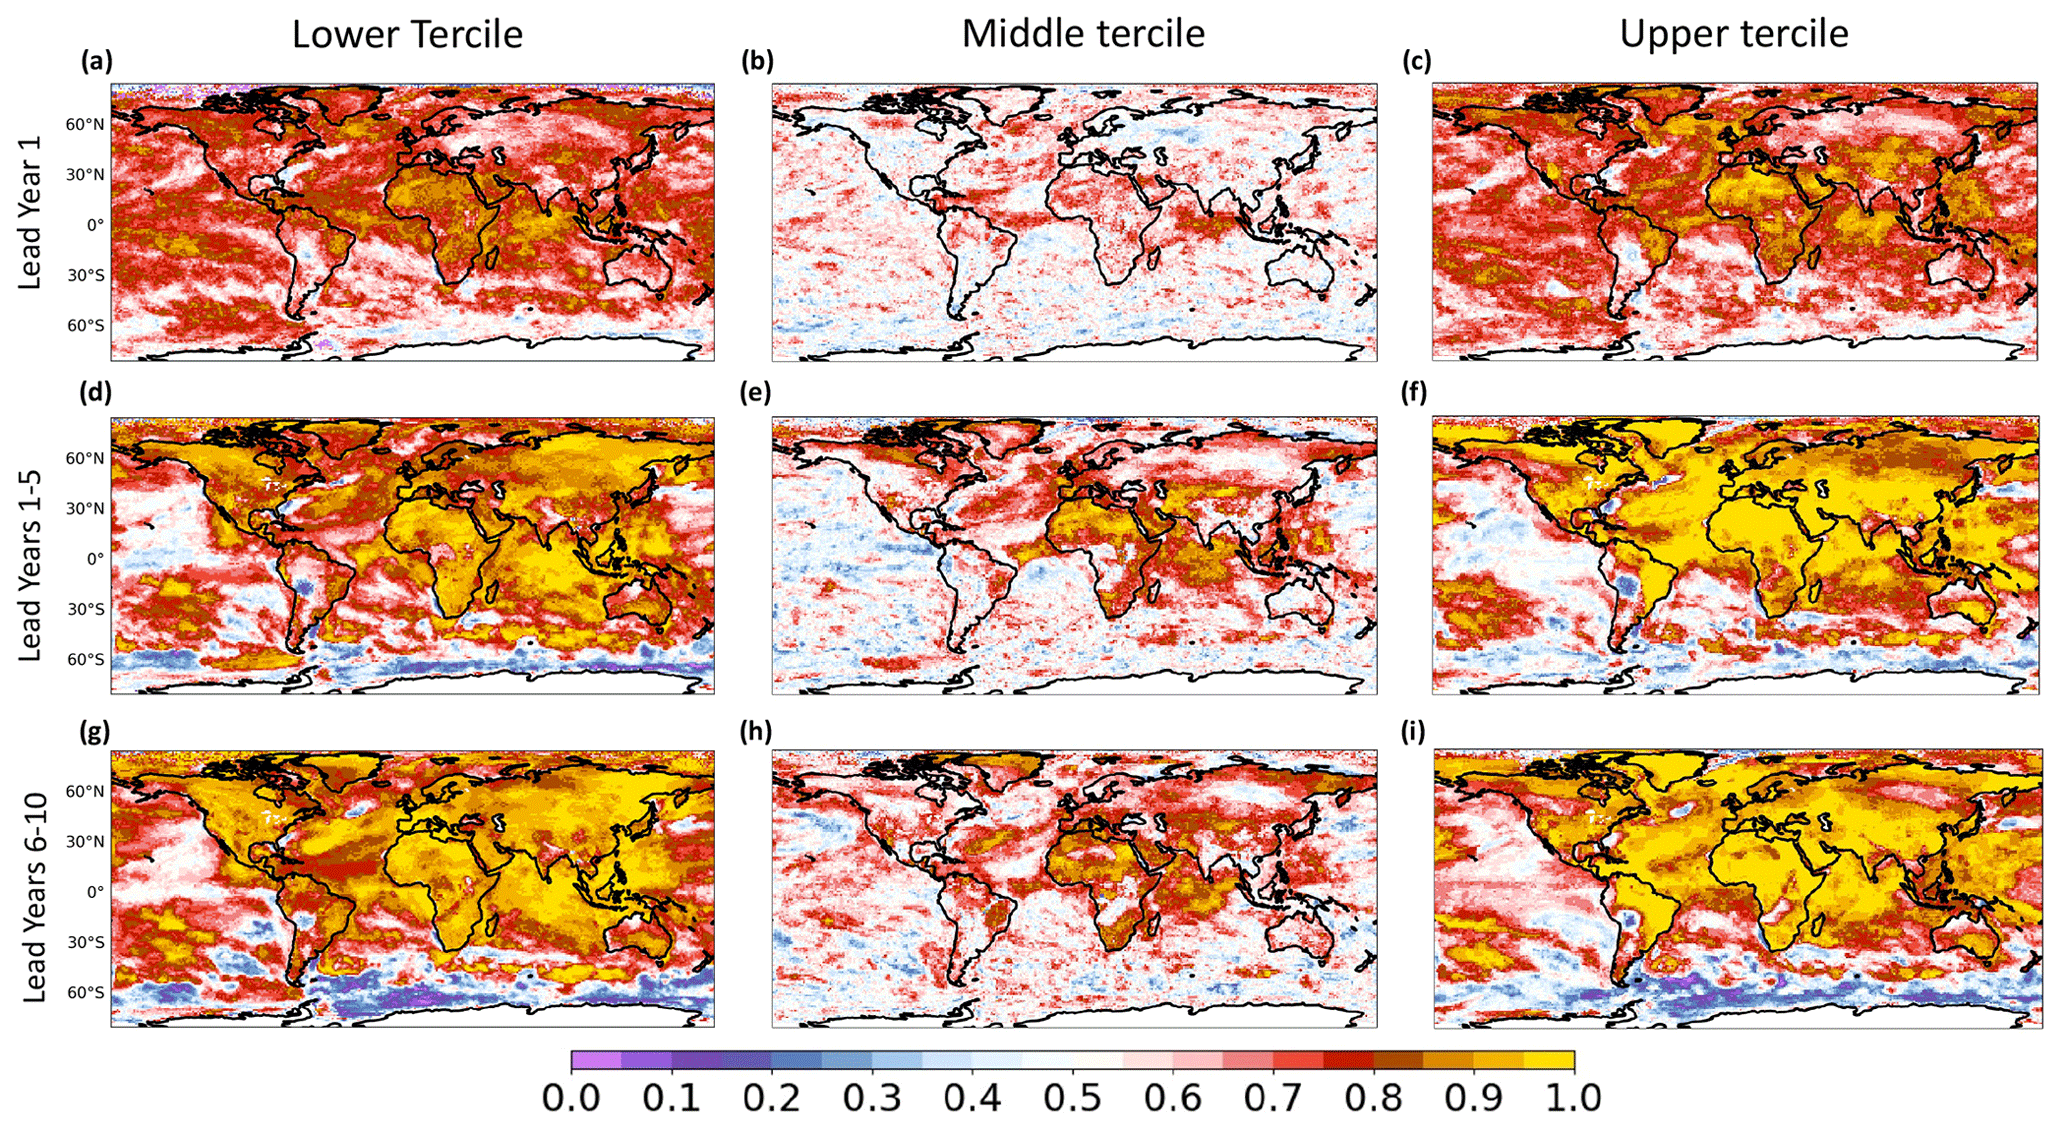
Figure 8Relative operating characteristic (ROC) for near-surface temperatures (T2m plus SST) for lead years 1, 1–5, and 6–10, considering three tercile categories, namely lower tercile (a, d, g), middle tercile (b, e, h), and upper tercile (c, f, i).
The Init reproduces below-tercile and above-tercile anomalies well (Fig. 8), featuring patterns similar to the ACC ones throughout the lead times (Fig. 2), which might represent an upper boundary of the ROC score (Wilks, 2011). Specifically, ROC scores are close to one over land, the western Pacific, and the North Atlantic for multiyear predictions (lead years 1–5 and 6–10), confirming the anomaly direction within the ensemble spread. Predictions of anomalies falling in the middle tercile category exhibit less skill compared to the lower and upper tercile cases. Nevertheless some skill emerges over Africa, the northern and eastern part of South America, the North Atlantic, and Indian Ocean. Comparing the ROC score for NoInit (Fig. S7), most of the difference occurs over the oceans (e.g., over the North Atlantic), the realm which is most sensible to the initialization at a decadal timescale.
Predictability of selected regional climate indices is investigated in this section, since they influence climate variability on global and regional scales through the action of teleconnections. The Atlantic Multidecadal Variability (AMV) represents the dominant climate variability pattern of the multidecadal SST fluctuations in the North Atlantic basin (Knight et al., 2005; Smith et al., 2012; O'Reilly et al., 2019).
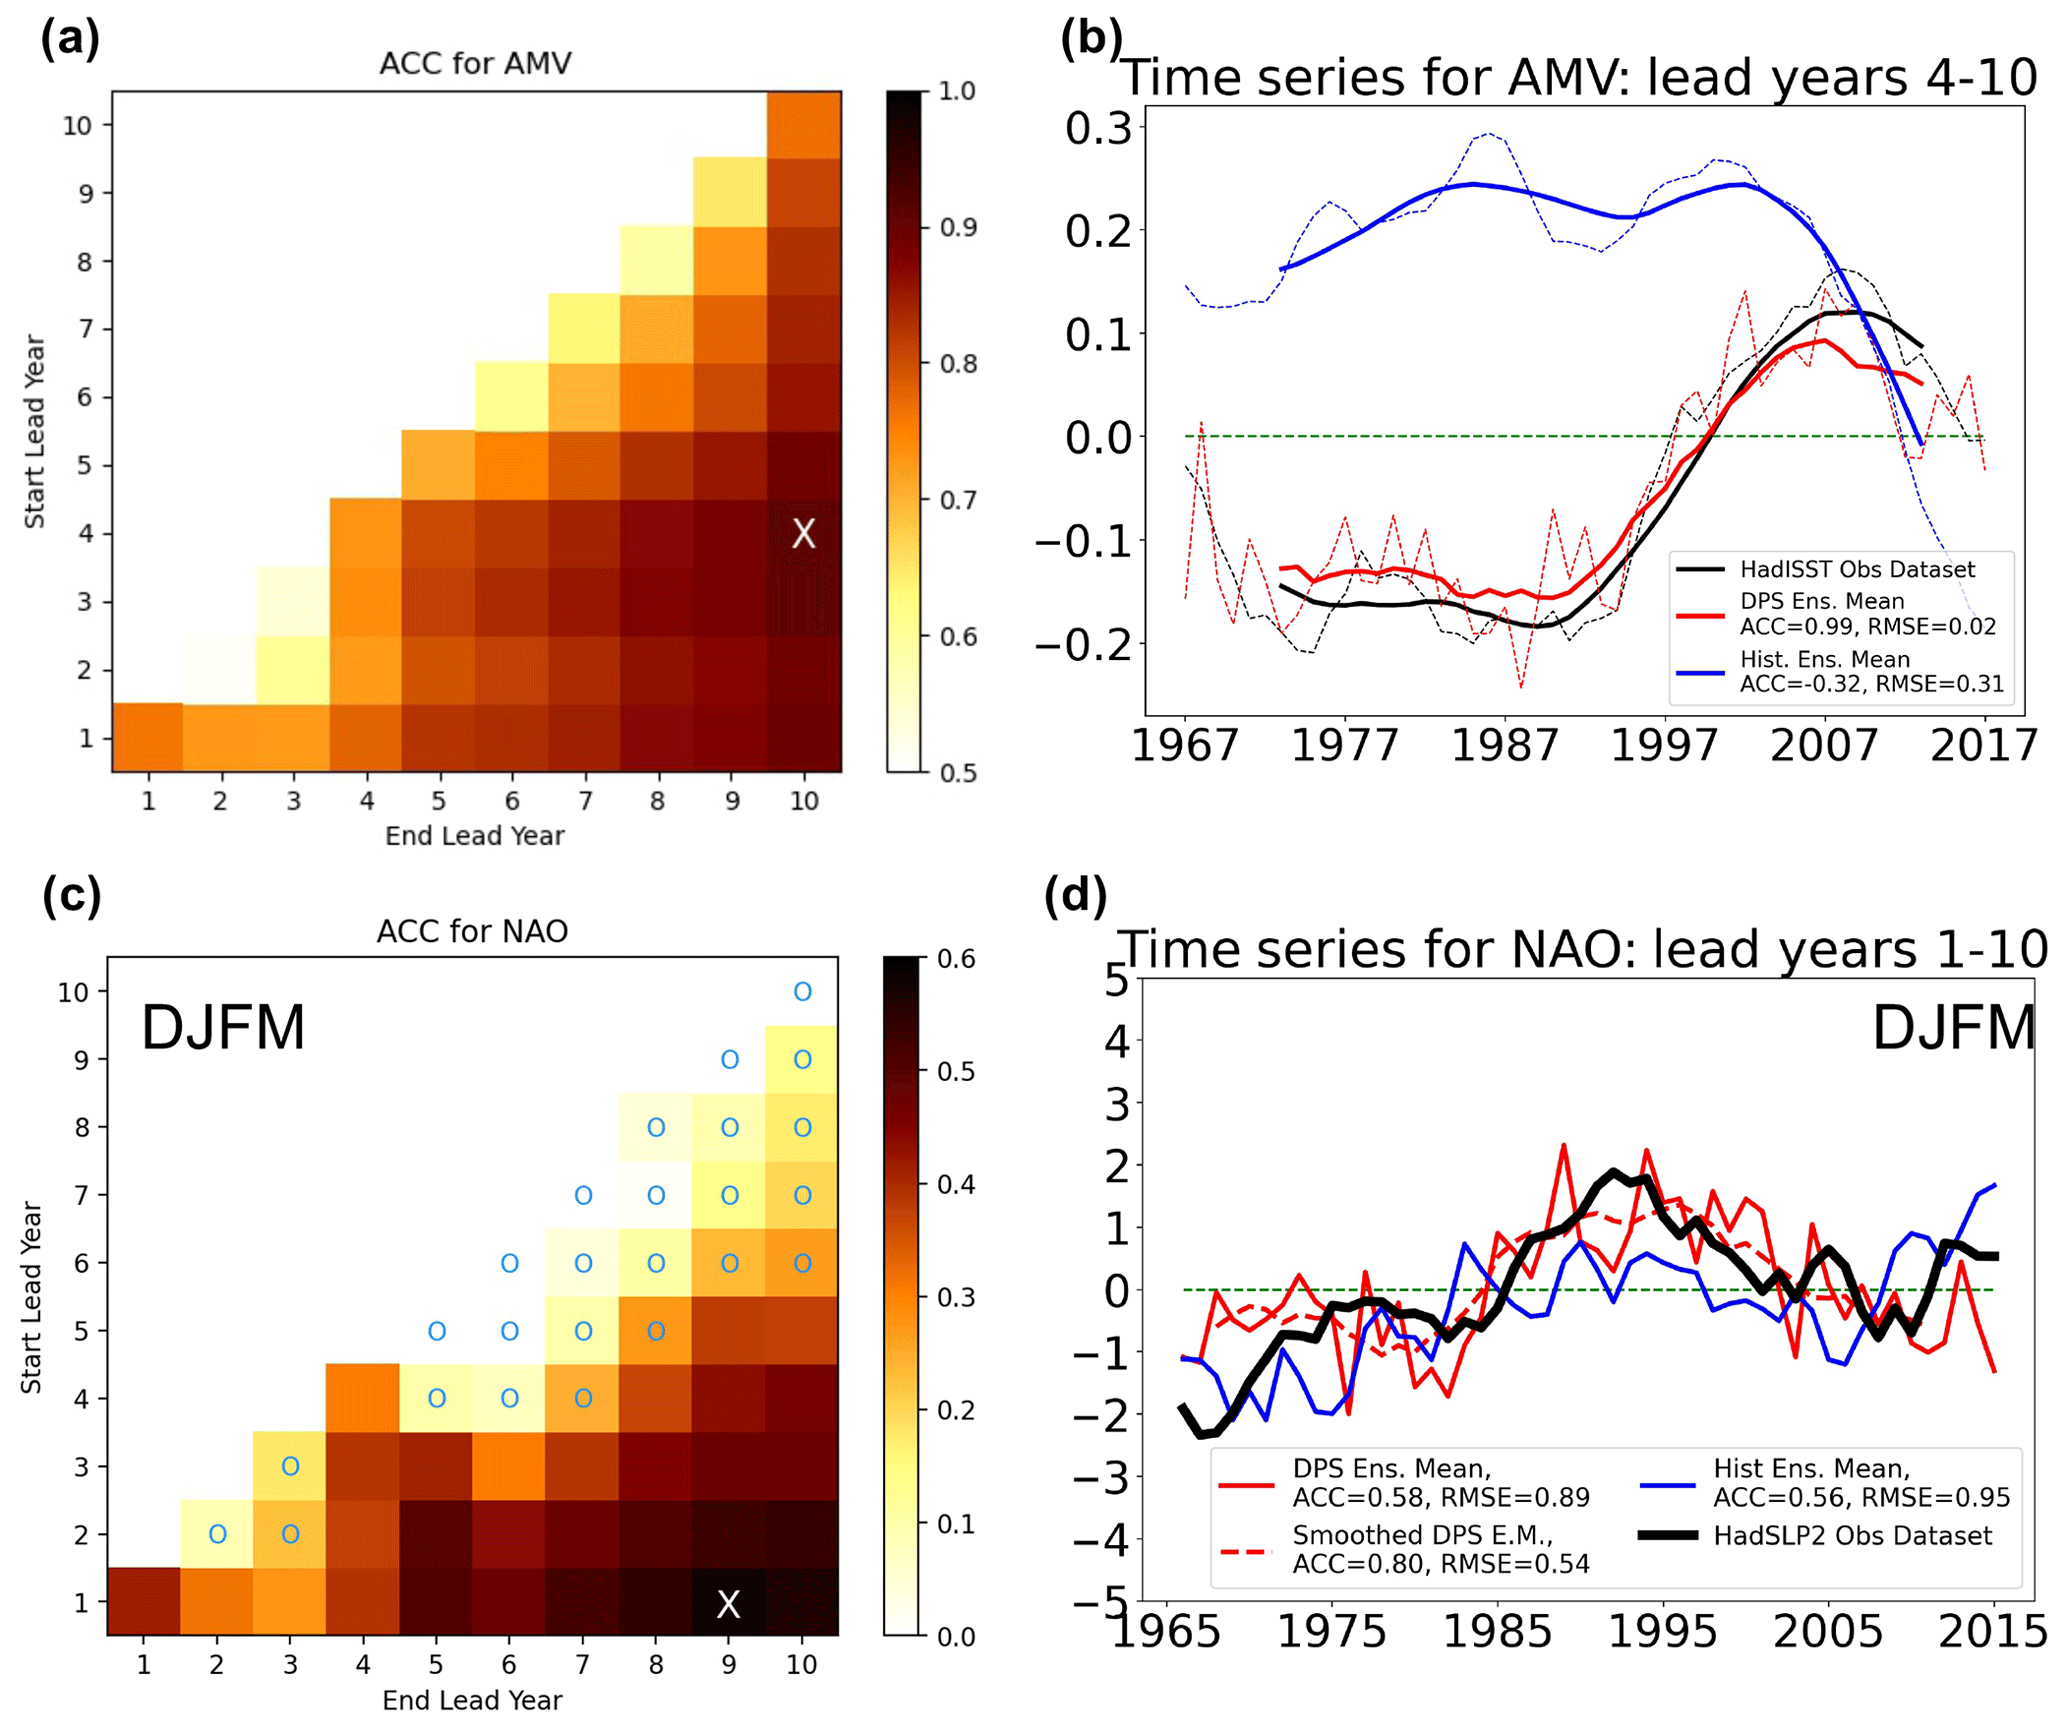
Figure 9(a) ACC for AMV index. The color bar ranges from 0.5 to 1. The cyan markers indicate statistically insignificant correlations. The white cross denotes the maximum value (ACC = 0.91). (b) Observed and predicted AMV index for lead years 4–10 (in which ACC is maximum). Panel (c) is the same as panel (a) but for the December–March (DJFM) NAO index. The color bar ranges from 0 to 0.6 (maximum ACC = 0.58). (d) Observed and predicted NAO index for lead years 1–9 (in which ACC is maximum).
Figure 9a shows the ACC for the AMV index for different lead time ranges, thus helping to identify the lead year range that exhibits the maximum skill (see Sect. 2.3). The largest ACC values are found for lead year ranges longer than 4 years (ACC >0.80), in agreement with previous works (Van Oldenborgh et al., 2012; García-Serrano and Doblas-Reyes, 2012), reaching a peak for the lead year range 4–10 (ACC = 0.91). At this lead year range, the AMV index in Init reproduces the observed low-frequency variability in the North Atlantic SST well, including the 1980s negative phase, the sharp increase during the 1990s, the peak occurring in the 2000s, and the subsequent decline (Fig. 9b), which is in opposition to NoInit. The AMV spatial pattern is also well captured by the DPS, as depicted in ACC of linearly detrended near-surface temperature (Fig. S2). ACC patterns in the North Atlantic reveal the AMV footprint, with correlations ranging from 0.50 (in the subtropics) to 0.91 (at high latitudes). It is worth noting that large ACC values of surface temperature are also found over regions linked to the AMV through remote teleconnections, i.e., the eastern Mediterranean region (Mariotti and Dell'Aquila, 2012; Bellucci et al., 2017), Arabian Peninsula (Van Oldenborgh et al., 2012; Ehsan et al., 2020), southern Eurasia (Li et al., 2021), and the western tropical Pacific (Kucharski et al., 2016; Sun et al., 2017), suggesting that the skillful AMV prediction has also non-local impacts in regions affected by the AMV teleconnection pattern.
The predictive skill for the NAO is also analyzed by focusing on the boreal winter season (see Sect. 2.3). Significant skill is primarily found for lead year ranges longer than 5 years (Fig. 9c), although lead year 1 (coinciding with the first winter season after initialization, which is essentially a seasonal forecast) also features significant skill (ACC = 0.42). The NAO predictive skill is maximum for the lead year range 1–9 (ACC = 0.58). At this lead year range, the observed NAO phases are well reproduced in Init (Fig. 9d), and in particular, starting from the satellite era, decadal hindcasts realistically simulate the growing trend of the 1980s and the following decline that occurred after 1995. The Init captures the NAO variability well, despite the limited ensemble size (ACC = 0.80, applying an 8-year running mean to the model index), while NoInit does not reproduce the right amplitude. The ratio of predictable component shows a rather low value (RPC = 2.15; estimated following Scaife and Smith, 2018), comparing NAO predictions with other state-of-the-art decadal prediction systems (Smith et al., 2020; Athanasiadis et al., 2020), suggesting that, in the CMCC DPS, the signal-to-noise ratio problem is somehow less impactful (Scaife and Smith, 2018).
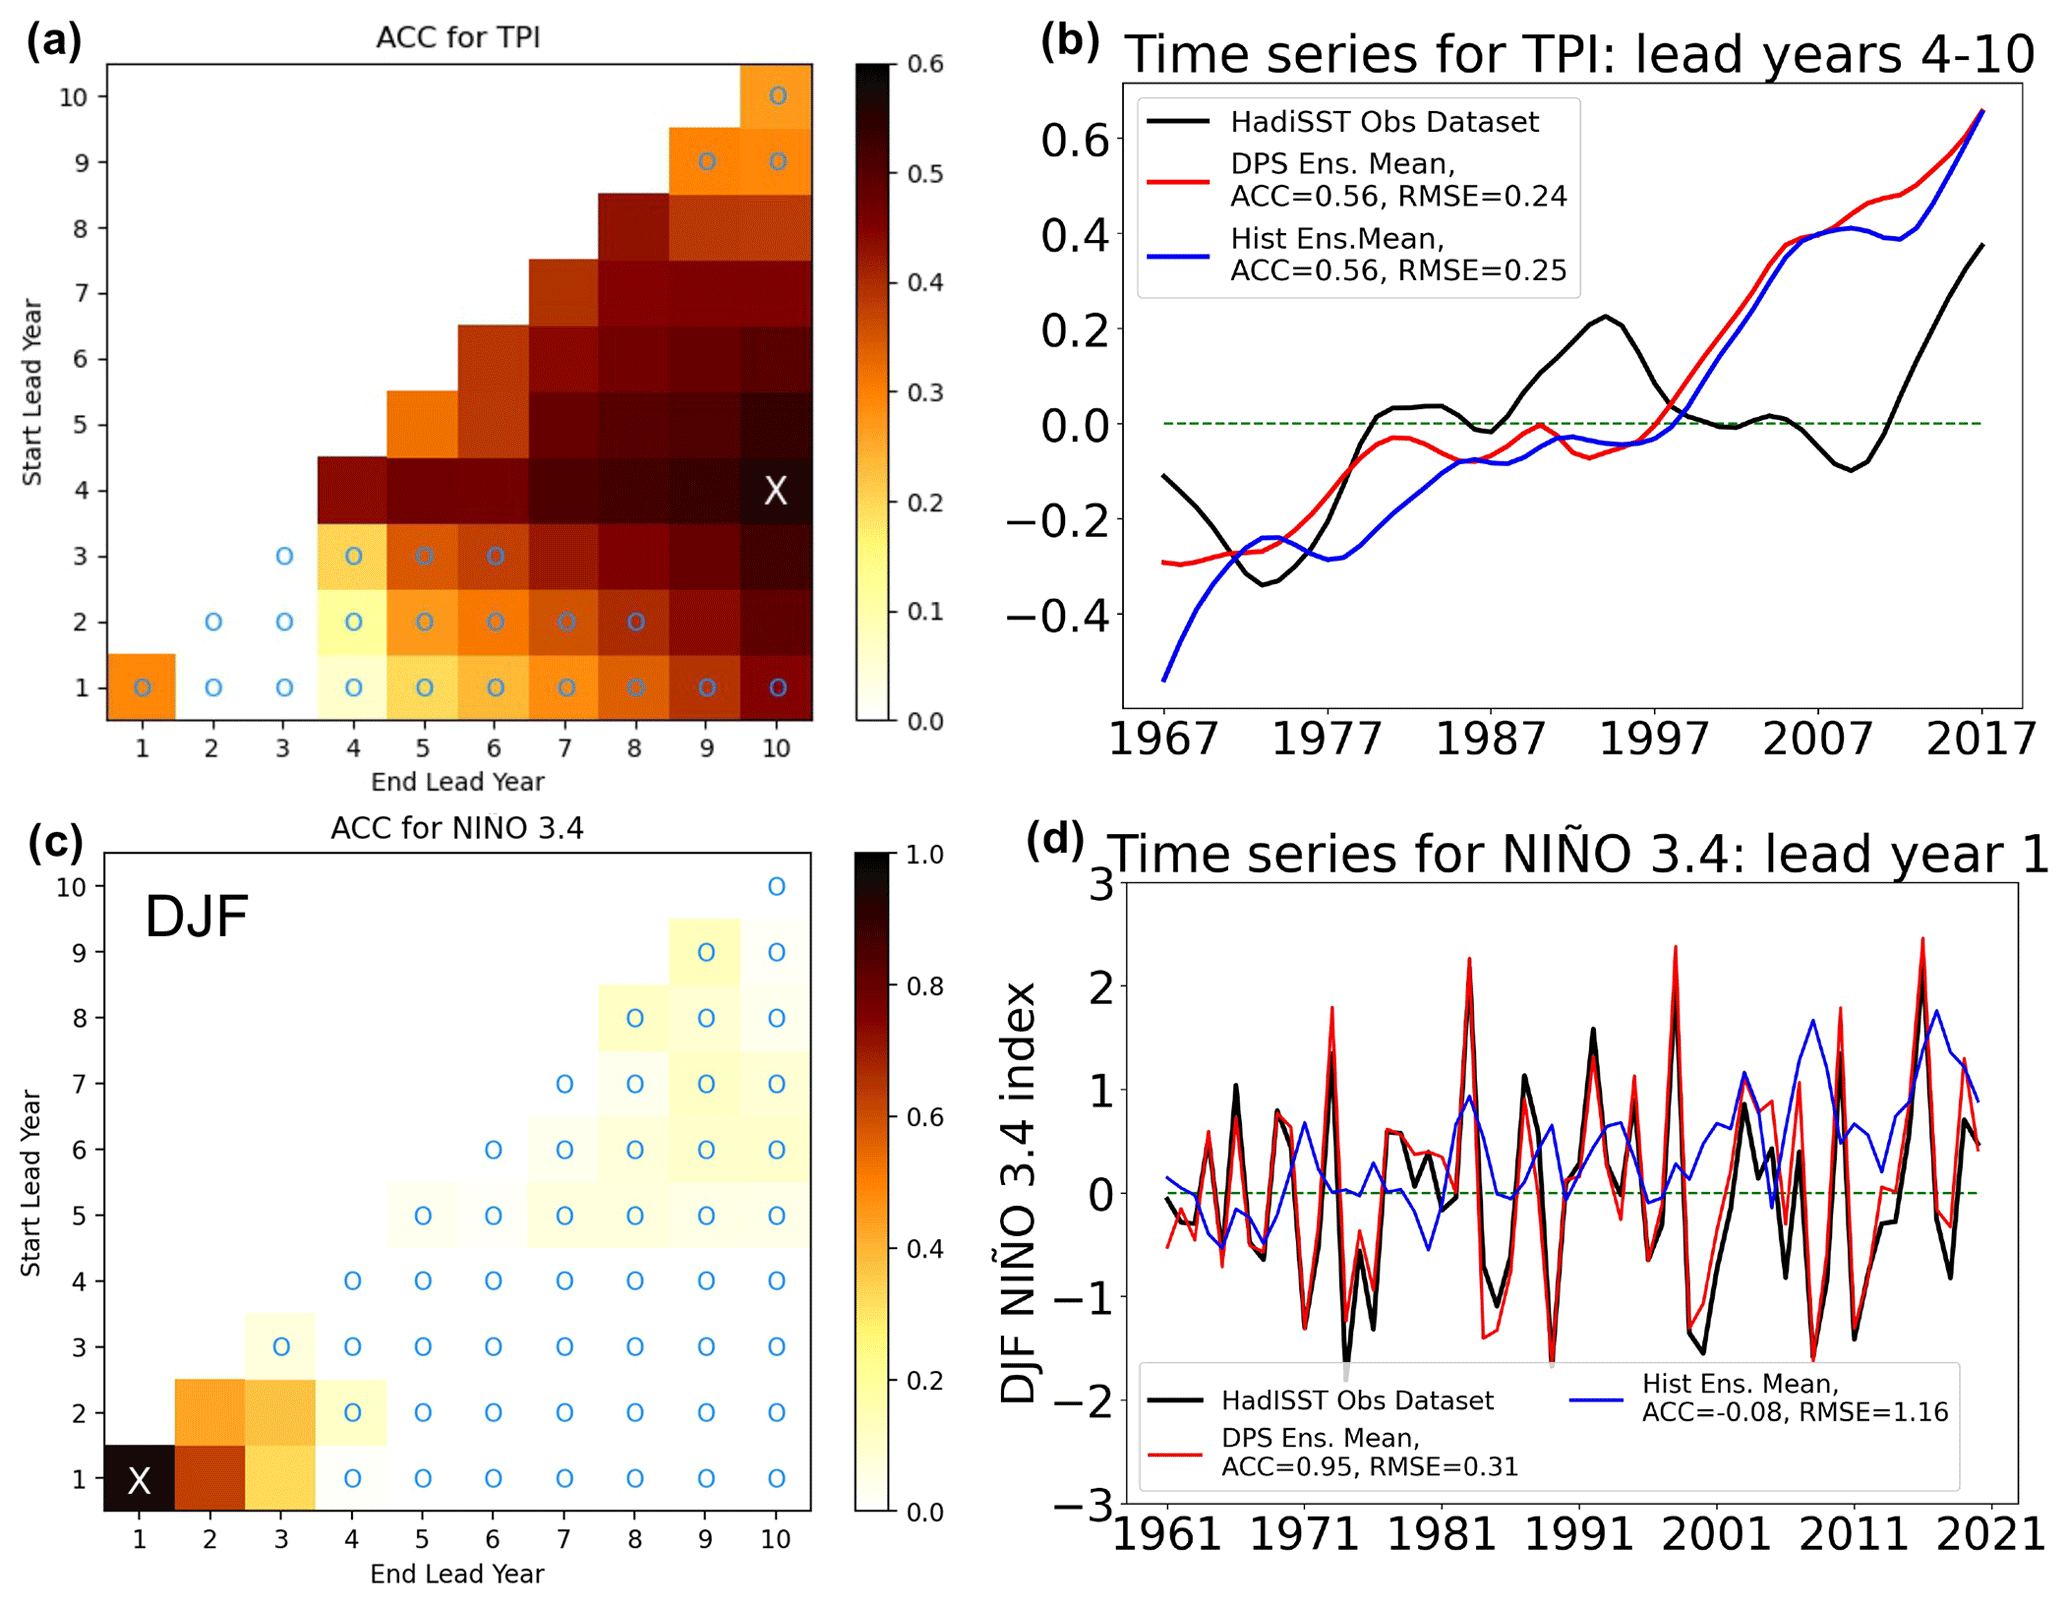
Figure 10(a) ACC for TPI index. The color bar ranges from 0 to 0.6. The cyan markers indicate statistically non-significant correlations. The white cross denotes the maximum value (ACC = 0.56). (b) Observed and predicted TPI index for lead years 4–10 (in which ACC is maximum). Panel (c) is the same as panel (a) but for the December–February (DJF) Niño 3.4 index. The color bar ranges from 0 to 1 (maximum ACC = 0.95). (d) Observed and predicted Niño 3.4 index for lead year 1 (in which ACC is maximum).
In the Pacific sector, the TPI is considered to be a proxy of the decadal variability (Power et al., 1999; Henley et al., 2015), accounting for both the equatorial and extratropical SST fluctuations (see Sect. 2.3). Figure 10a displays the Init ACC for TPI, with significant skill peaking at lead years 4–10 (ACC = 0.56). As one may expect, Init is not able to reproduce most of the variance in the Pacific Ocean due to the lack of skill over that domain, which is also inferable by the ACC and MSSS maps (Figs. 2 and 3, respectively). In fact, the TPI evolution for lead years 4–10 shows that the respective predicted and observed anomalies are broadly consistent until the late 1980s but significantly diverge afterwards (Fig. 10b), similar to the NoInit one. The emerging skill at higher lead years is probably due to the inclusion of off-equatorial SST, linked to the predictability of the Pacific decadal variability (Henley et al., 2015).
Decadal variability in the equatorial Pacific still remains widely unpredictable (Doblas-Reyes et al., 2013), with very limited predictability beyond lead year 2. We quantify the DJF (December–February) Niño 3.4 index prediction skill in Fig. 10c and d. As mentioned, the respective maximum occurs during the first winter season after initialization (ACC = 0.95; Fig. 10d), although there is some predictability up to lead year 3 (Fig. 10c).
In this paper, we analyzed the predictive capabilities of the CMCC DPS, using a set of 20-member hindcasts, initialized every year from 1960 to 2020, performed with the CMCC-CM2-SR5 coupled model and a full-field initialization strategy.
The study has highlighted the following main findings:
-
The DPS skillfully reproduces the observed variability in surface temperature (T2M over land and SST over the oceans) and upper-ocean heat content (Figs. 2 and 4, respectively), with a large fraction of the total skill stemming from long-term trends associated with changes in the external forcings (Van Oldenborgh et al., 2012). The North Atlantic Ocean is the region that benefits the most from initialization (ACC difference up to 0.80 in Fig. 2b, d, and f and MSSS close to 0.6 in Fig. 3), with the largest skill enhancement (compared to historical simulations) over the subpolar gyre region. As is still typical in decadal predictions, a lack of skill characterizes the whole Pacific Ocean over which significant ACC values are bound to lead year 1. The DPS correctly discriminates the occurrences of below-tercile and above-tercile surface temperature anomalies throughout different lead year intervals, with ROC scores close to one over land (Fig. 8).
-
Some climate variability patterns in the North Atlantic sector feature significant predictability. In particular, the observed AMV signal is skillfully predicted (ACC = 0.91, Fig. 9a), and this likely contributes to also obtaining significant skill in remote areas through downstream influence, circulation changes, and teleconnections. Over the tropical Pacific Ocean, ENSO variability exhibits high values of ACC bound to the first winter after initialization (ACC = 0.95). Moreover, the TPI shows higher predictive skill on longer timescales, despite the low skill that the DPS exhibits over most of the Pacific Ocean.
-
Considering its relatively small ensemble size, the CMCC DPS exhibits an exceptionally high skill for the winter NAO on a multiyear-to-decadal scale (ACC_LY1-9 = 0.58 with 20 members). This is accompanied by a rather low ratio of predictable component (RPC = 2.15; estimated following Scaife and Smith, 2018), comparing NAO predictions with other state-of-the-art decadal prediction systems (Smith et al., 2020; Athanasiadis et al., 2020). This result suggests that, in the CMCC DPS, despite certain obstinate systematic biases, the signal-to-noise ratio problem (Scaife and Smith, 2018) is somehow less severe.
-
Regarding precipitation, the CMCC DPS shows limited skill, with statistically significant correlations only over specific areas, a feature shared with other state-of-the-art decadal prediction systems. Indeed, significant skill is only found over Sahelian Africa, northern Eurasia, and over the western and central Europe, with ACC values up to 0.50 (Fig. 5). This spatially confined skill may derive from the AMV, which is known to be a source of predictability for these regions, influencing rainfall variability on annual-to-decadal timescales (Doblas-Reyes et al., 2013; Ehsan et al., 2020; Ruggieri et al., 2021). On the other hand, no significant skill for precipitation is found over the rest of the globe, probably also due to the relatively small size of our ensemble (Yeager et al., 2018) and to the very high spatial variability (Goddard et al., 2013) and the absence of a strong trend in precipitation (Gaetani and Mohino, 2013; Bellucci et al., 2015b). Improvements compared to the historical simulations are bound to some regional features, suggesting no substantial benefits from initialization in terms of precipitation skill.
Systematic errors also affect the forecast quality. The strong cold bias occurring over the Northern Hemisphere tends to produce an initialization shock and a subsequent drift, typical of the full-field initialization (He et al., 2017) approach used in the CMCC DPS. Admittedly, AMOC is particularly affected by the initialization strategy (Fig. S3), with the full-field approach inducing a long-term adjustment due to the bias in the representation of the large-scale ocean circulation (Polkova et al., 2014). In this context, another sensitive region is the equatorial Pacific in which full-field initialization seems to give the strongest benefit in skill compared to anomalous initialization (Bellucci et al., 2015b). From another perspective, model errors may be mitigated by enhancing spatial resolution (both horizontal and vertical) in the oceanic and atmospheric model components, since a coarse resolution limits a realistic representation of key physical processes (e.g., realistic SST front in the Gulf Stream region), impacting the atmospheric circulation downstream (Athanasiadis et al., 2022; Famooss Paolini et al., 2022). For instance, an eddy-permitting ocean model (i.e., 0.25∘ horizontal resolution) in a fully coupled system led to improved decadal predictions over the whole equatorial zone (Shaffrey et al., 2017). Moreover, increasing the ensemble size is expected to further increase the skill by allowing the predictable signal to emerge more clearly from the chaotic variability (Athanasiadis et al., 2020).
Interestingly, the results obtained from the CMCC DPS are broadly consistent with similar assessments from other CMIP6 decadal prediction systems (Bethke et al., 2021; Bilbao et al., 2021; Kataoka et al., 2020; Robson et al., 2018; Sospedra-Alfonso et al., 2021; Xin et al., 2019; Yang et al., 2021; Yeager et al., 2018) and multimodel studies (Borchert et al., 2021a, b; Delgado-Torres et al., 2022). In particular, most of the DPSs feature high predictive skill over the Atlantic Ocean, the Indian Ocean, and continental areas, where a large fraction of predictability stems from the external forcings. The added value of initialization is most noted over the subpolar gyre and the subtropical Atlantic (in most of the DPSs), confirming these areas as being those in which decadal predictions benefit the most from realistic initialization. The non-significant skill found over the Southern Ocean is considered to be, at least in part, due to the lack of oceanic observations in that region that prevents the accurate estimate of the initial state of the ocean. The predictive skill of the Pacific Ocean rapidly decays with forecast time, especially over the North Pacific, arguably due to the limited predictability of ENSO beyond the first forecast year and the consequent strong influence over the North Pacific (unpredictable ENSO-driven variability).
We remind readers that the CMCC DPS provides decadal forecasts (operationally since 2021) for the annual release of the WMO (World Meteorological Organization) Global Annual to Decadal Climate Update, a multimodel assessment of the near-term climate for societal applications (Hermanson et al., 2022). At the same time, the CMCC DPS makes a significant contribution to the grand ensemble CMIP6 DCPP-A hindcasts.
In conclusion, this study has corroborated the idea that the climate system has a significant degree of multiyear predictability over land, and in this context, the CMCC DPS represents a valid element in the fleet of the state-of-the-art DPSs. The potential of near-term predictions deserves to be further investigated, in addition to the development of future decadal systems and improved initialization methods, with the aim of providing a useful tool able to inform decision-makers on the evolution of the next decade's climate.
The code relative to the CMCC-CM2-SR5 climate model used for DPS is available in the Zenodo repository (Nicolì et al., 2022; https://doi.org/10.5281/zenodo.6810749). The NoInit data can be accessed at https://doi.org/10.22033/ESGF/CMIP6.3825 (Lovato and Peano, 2020). The Init data can be accessed at https://doi.org/10.22033/ESGF/CMIP6.3751 (Nicolì, 2020). HadISST was downloaded from https://www.metoffice.gov.uk/hadobs/hadisst/ (last access: 30 May 2022, Rayner et al., 2003). CRU TS4.05 was downloaded from https://catalogue.ceda.ac.uk/uuid/c26a65020a5e4b80b20018f148556681 (last access: 30 May 2022, Harris et al., 2021). The GPCC Full Data Monthly Product version 2020 at 1∘ for horizontal resolution was downloaded from https://opendata.dwd.de/climate_environment/GPCC/html/fulldata-monthly_v2020_doi_download.html (last access: 30 May 2022, Schneider et al., 2020). HadSLP2 was downloaded from https://www.metoffice.gov.uk/hadobs/hadslp2/ (last access: 30 May 2022, Allan and Ansell, 2006). ERA40 was downloaded from https://apps.ecmwf.int/datasets/data/era40-moda/levtype=sfc/ (last access: 30 May 2022, Uppala et al., 2005). CRUNCEP version 7 was downloaded from https://rda.ucar.edu/datasets/ds314.3/#!description (last access: 30 May 2022, Viovy, 2016). GSWP3 was downloaded from https://svn-ccsm-inputdata.cgd.ucar.edu/trunk/inputdata/atm/datm7/atm_forcing.datm7.GSWP3.0.5d.v1.c170516/ (last access: 30 May 2022, Kim, 2017). Oceanic and sea ice initial conditions from NEMO CHOR (Yang et al., 2016) and CGLORSv7 (Storto and Masina, 2016) analyses are available in the Zenodo repository (https://doi.org/10.5281/zenodo.6866295; Nicolì and Ruggieri, 2022).
The supplement related to this article is available online at: https://doi.org/10.5194/gmd-16-179-2023-supplement.
AB, PR, and DN conceived the study, set up the model, and led the analysis. PR prepared the initial conditions. DN performed the decadal predictions. GF contributed to the production of the decadal predictions. DP and SM performed the land analysis for the land initial conditions. RH performed the historical and scenario simulations. All the authors contributed to the discussion and interpretation of the results. DN prepared the paper, with contributions from all co-authors.
The contact author has declared that none of the authors has any competing interests.
Publisher's note: Copernicus Publications remains neutral with regard to jurisdictional claims in published maps and institutional affiliations.
The authors would like to sincerely thank Sebastian Brune and an anonymous reviewer, for their helpful and constructive comments that contributed to improving the paper.
This research has been supported by the Horizon 2020 (EUCP; grant no. 776613).
This paper was edited by Riccardo Farneti and reviewed by Sebastian Brune and one anonymous referee.
Allan, R. and Ansell, T.: A new globally complete monthly historical gridded mean sea level pressure dataset (HadSLP2): 1850–2004, J. Climate, 19, 5816–5842, 2006.
Athanasiadis, P. J., Yeager, S., Kwon, Y. O., Bellucci, A., Smith, D. W., and Tibaldi, S.: Decadal predictability of North Atlantic blocking and the NAO, NPJ Clim. Atmos. Sci., 3, 1–10, 2020.
Athanasiadis, P. J., Ogawa, F., Omrani, N. E., Keenlyside, N., Schiemann, R., Baker, A. J., Vidale, P. L., Bellucci, A., Ruggieri, P., Haarsma, R., Roberts, M., Roberts, C., Novak, L., and Gualdi, S.: Mitigating Climate Biases in the Midlatitude North Atlantic by Increasing Model Resolution: SST Gradients and Their Relation to Blocking and the Jet, J. Climate, 35, 3385–3406, 2022.
Bellucci, A., Gualdi, S., and Navarra, A. J. J. O. C.: The double-ITCZ syndrome in coupled general circulation models: The role of large-scale vertical circulation regimes, J. Climate, 23, 1127–1145, 2010.
Bellucci, A., Haarsma, R., Bellouin, N., Booth, B., Cagnazzo, C., van den Hurk, B., Keenlyside, N., Koenigk, T., Massonnet, F., Materia, S., and Weiss, M.: Advancements in decadal climate predictability: The role of nonoceanic drivers, Rev. Geophys., 53, 165–202, 2015a.
Bellucci, A., Haarsma, R., Gualdi, S., Athanasiadis, P. J., Caian, M., Cassou, C., Fernandez, E., Germe, A., Jungclaus, J., Kröger, J., Matei, D., Müller, w., Pohlmann, H., Salas y Melia, D., Sanchez, E., Smith, D., Terray, L., Wyser K., and Yang, S.: An assessment of a multi-model ensemble of decadal climate predictions, Clim. Dynam., 44, 2787–2806, 2015b.
Bellucci, A., Mariotti, A., and Gualdi, S.: The role of forcings in the twentieth-century North Atlantic multidecadal variability: The 1940–75 North Atlantic cooling case study, J. Climate, 30, 7317–7337, 2017.
Berrisford, P., Kållberg, P., Kobayashi, S., Dee, D., Uppala, S., Simmons, A. J., Poli, P., and Sato, H.: Atmospheric conservation properties in ERA-Interim, Q. J. Roy. Meteor. Soc., 137, 1381–1399, https://doi.org/10.1002/qj.864, 2011.
Bethke, I., Wang, Y., Counillon, F., Keenlyside, N., Kimmritz, M., Fransner, F., Samuelsen, A., Langehaug, H., Svendsen, L., Chiu, P.-G., Passos, L., Bentsen, M., Guo, C., Gupta, A., Tjiputra, J., Kirkevåg, A., Olivié, D., Seland, Ø., Solsvik Vågane, J., Fan, Y., and Eldevik, T.: NorCPM1 and its contribution to CMIP6 DCPP, Geosci. Model Dev., 14, 7073–7116, https://doi.org/10.5194/gmd-14-7073-2021, 2021.
Bilbao, R., Wild, S., Ortega, P., Acosta-Navarro, J., Arsouze, T., Bretonnière, P.-A., Caron, L.-P., Castrillo, M., Cruz-García, R., Cvijanovic, I., Doblas-Reyes, F. J., Donat, M., Dutra, E., Echevarría, P., Ho, A.-C., Loosveldt-Tomas, S., Moreno-Chamarro, E., Pérez-Zanon, N., Ramos, A., Ruprich-Robert, Y., Sicardi, V., Tourigny, E., and Vegas-Regidor, J.: Assessment of a full-field initialized decadal climate prediction system with the CMIP6 version of EC-Earth, Earth Syst. Dynam., 12, 173–196, https://doi.org/10.5194/esd-12-173-2021, 2021.
Boer, G. J., Smith, D. M., Cassou, C., Doblas-Reyes, F., Danabasoglu, G., Kirtman, B., Kushnir, Y., Kimoto, M., Meehl, G. A., Msadek, R., Mueller, W. A., Taylor, K. E., Zwiers, F., Rixen, M., Ruprich-Robert, Y., and Eade, R.: The Decadal Climate Prediction Project (DCPP) contribution to CMIP6, Geosci. Model Dev., 9, 3751–3777, https://doi.org/10.5194/gmd-9-3751-2016, 2016.
Borchert, L. F., Koul, V., Menary, M. B., Befort, D. J., Swingedouw, D., Sgubin, G., and Mignot, J.: Skillful decadal prediction of unforced southern European summer temperature variations, Environ. Res. Lett., 16, 104017, https://doi.org/10.1088/1748-9326/ac20f5, 2021a.
Borchert, L. F., Menary, M. B., Swingedouw, D., Sgubin, G., Hermanson, L., and Mignot, J.: Improved decadal predictions of North Atlantic subpolar gyre SST in CMIP6, Geophys. Res. Lett., 48, e2020GL091307, https://doi.org/10.1029/2020GL091307, 2021b.
Branstetter, M. L.: Development of a parallel river transport algorithm and applications to climate studies, The University of Texas at Austin, 2001.
Bretherton, C. S., Widmann, M., Dymnikov, V. P., Wallace, J. M., and Bladé, I.: The effective number of spatial degrees of freedom of a time-varying field, J. Climate, 12, 1990–2009, 1999.
Brune, S. and Baehr, J.: Preserving the coupled atmosphere–ocean feedback in initializations of decadal climate predictions, Wiley Interdisciplinary Reviews: Climate Change, 11, e637, https://doi.org/10.1002/wcc.637, 2020.
Cherchi, A., Fogli, P. G., Lovato, T., Peano, D., Iovino, D., Gualdi, S., Masina, S., Scoccimarro, E., Materia, S., Bellucci, A., and Navarra, A.: Global mean climate and main patterns of variability in the CMCC-CM2 coupled model, J. Adv. Model. Earth Sy., 11, 185–209, https://doi.org/10.1029/2018MS001369, 2019.
Collins, M.: Climate predictability on interannual to decadal time scales: The initial value problem, Clim. Dynam., 19, 671–692, 2002.
Delgado-Torres, C., Donat, M. G., Gonzalez-Reviriego, N., Caron, L.-P., Athanasiadis, P. J., Bretonnière, P.-A., Dunstone, N. J., Ho, A.-C., Nicolì, D., Pankatz, K., Paxian, A., Pérez-Zanón, N., Samsó Cabré, M., Solaraju-Murali, B., Soret, A., and Doblas-Reyes, F. J.: Multi-model forecast quality assessment of CMIP6 decadal predictions, J. Climate, 35, 4363–4382, 2022.
Doblas‐Reyes, F. J., Balmaseda, M. A., Weisheimer, A., and Palmer, T. N.: Decadal climate prediction with theEuropean Centre for Medium‐Range Weather Forecasts coupled forecast system: Impact of ocean observations, J. Geophys. Res., 116, D19111, https://doi.org/10.1029/2010JD015394, 2011.
Doblas-Reyes, F. J., Andreu-Burillo, I., Chikamoto, Y., García-Serrano, J., Guemas, V., Kimoto, M., Mochizuki, T., Rodrigues, L. R. L., and Van Oldenborgh, G. J.: Initialized near-term regional climate change prediction, Nat. Commun., 4, 1–9, 2013.
Dong, L., Leung, L. R., Lu, J., and Song, F.: Double-ITCZ as an emergent constraint for future precipitation over Mediterranean climate regions in the North Hemisphere, Geophys. Res. Lett., 48, e2020GL091569, https://doi.org/10.1029/2020GL091569, 2021.
Dunstone, N., Lockwood, J., Solaraju-Murali, B., Reinhardt, K., Tsartsali, E. E., Athanasiadis, P. J., Bellucci, A., Brookshaw, A., Caron, L.-P., Doblas-Reyes, F. J., Früh, B., González-Reviriego, N., Gualdi, S., Hermanson, L., Materia, S., Nicodemou, A., Nicolì, D., Pankatz, K., Paxian, A., Scaife, A., Smith, D., and Thornton H. E.: Towards useful decadal climate services, B. Am. Meteorol. Soc., 103, E1705–E1719, https://doi.org/10.1175/BAMS-D-21-0190.1, 2022.
Ehsan, M. A., Nicolì, D., Kucharski, F., Almazroui, M., Tippett, M., Bellucci, A., Ruggieri, P., and Kang, I.-S.: Atlantic Ocean influence on Middle East summer surface air temperature, NPJ Clim. Atmos. Sci., 3, 1–8, 2020.
Famooss Paolini, L., Athanasiadis, P. J., Ruggieri, P., and Bellucci, A.: The atmospheric response to meridional shifts of the Gulf Stream SST front and its dependence on model resolution, J. Climate, 35, 6007–6030, 2022.
Gaetani, M. and Mohino, E.: Decadal prediction of the Sahelian precipitation in CMIP5 simulations, J. Climate, 26, 7708–7719, 2013.
García-Serrano, J. and Doblas-Reyes, F. J.: On the assessment of near-surface global temperature and North Atlantic multi-decadal variability in the ENSEMBLES decadal hindcast, Clim. Dynam., 39, 2025–2040, 2012.
Goddard, L., Kumar, A., Solomon, A., Smith, D., Boer, G., Gonzalez, P., Kharin, V., Merryfield, W., Deser, C., Mason, S. J. Kirtman, B. P., Msadek, R., Sutton, R., Hawkins, E., Fricker, T., Hegerl, G., Ferro, C. A. T., Stephenson, D. B., Meehl, G. A., Stockdale, T., Burgman, R., Greene, A. M., Kushnir, Y., Newman, M., Carton, J., Fukumori, I., and Delworth, T.: A verification framework for interannual-to-decadal predictions experiments, Clim. Dynam., 40, 245–272, 2013.
Harris, I., Osborn, T. J., Jones, P., and Lister, D.: Version 4 of the CRU TS monthly high-resolution gridded multivariate climate dataset, Sci. Data, 7, 1–18, 2020.
Harris, I. C., Jones, P. D., and Osborn, T.: CRU TS4.05: Climatic Research Unit (CRU) Time-Series (TS) version 4.05 of high-resolution gridded data of month-by-month variation in climate (January 1901–December 2020), NERC EDS Centre for Environmental Data Analysis, University of East Anglia Climatic Research Unit, 2021.
He, Y., Wang, B., Liu, M., Liu, L., Yu, Y., Liu, J., Li, R., Zhang, C., Xu, S., Huang, W., Liu, Q., Wang, Y., and Li, F.: Reduction of initial shock in decadal predictions using a new initialization strategy, Geophys. Res. Lett., 44, 8538–8547, 2017.
Henley, B. J., Gergis, J., Karoly, D. J., Power, S., Kennedy, J., and Folland, C. K.: A tripole index for the interdecadal Pacific oscillation, Clim. Dynam., 45, 3077–3090, 2015.
Hermanson, L., Smith, D., Seabrook, M., Bilbao, R., Doblas-Reyes, F., Tourigny, E., Lapin, V., Kharin, V. V., Merryfield, W., J., Sospedra-Alfonso, R., Athanasiadis, P., Nicolì, D., Gualdi, S., Dunstone, N., Eade, R., Scaife, A., Collier, M., O'Kane, T., Kitsios, V., Sandery, P., Pankatz, K., Früh, B., Pohlmann, H., Müller, W., Kataoka, T., Tatebe, H., Ishii, M., Imada, Y., Kruschke, T., Koenigk, T., Karami, M. P., Yang, S., Tian, T., Zhang, L., Delworth, T., Yang, X., Zeng, F., Wang, Y., Counillon, F., Keenlyside, N., Bethke, I., Lean, J., Luterbacher, J., Kolli, R. K., and Kumar, A: WMO global annual to decadal climate update: a prediction for 2021–25, B. Am. Meteorol. Soc., 103, E1117–E1129, 2022.
Hersbach, H., Bell, B., Berrisford, P., Hirahara, S., Horányi, A., Muñoz-Sabater, J., Nicolas, J., Peubey, C., Radu, R., Schepers, D., Simmons, A., Soci, C., Abdalla, S., Abellan, X., Balsamo, G., Bechtold, P., Biavati, G., Bidlot, J., Bonavita, M., De Chiara, G., Dahlgren, P., Dee, D., Diamantakis, M., Dragani, R., Flemming, J., Forbes, R., Fuentes, M., Geer, A., Haimberger, L., Healy, S., Hogan, R. J., Hólm, E., Janisková, M., Keeley, S., Laloyaux, P., Lopez, P., Lupu, C., Radnoti, G., De Rosnay, P., Rozum, I., Vamborg, F., Villaume, S., and Thépaut., J.: The ERA5 global reanalysis, Q. J. Roy. Meteor. Soc., 146, 1999–2049, 2020
ICPO (International CLIVAR Project Office), Data and bias correction for decadal climate predictions, International CLIVAR Project Office, CLIVAR Publication Series No. 150, 6 pp., 2011.
Karspeck, A. R., Stammer, D., Köhl, A., Danabasoglu, G., Balmaseda, M., Smith, D. M., Fujii, Y., Zhang, S., Giese, B., Tsujino, H., and Rosati, A.: Comparison of the Atlantic meridional overturning circulation between 1960 and 2007 in six ocean reanalysis products, Clim. Dynam., 49, 957–982, 2017.
Kataoka, T., Tatebe, H., Koyama, H., Mochizuki, T., Ogochi, K., Naoe, H., Imada, Y., Shiogama, H., Kimoto, M., and Watanabe, M.: Seasonal to decadal predictions with MIROC6: Description and basic evaluation, J. Adv. Model. Earth Sy., 12, e2019MS002035, https://doi.org/10.1029/2019MS002035, 2020.
Keenlyside, N. S., Latif, M., Jungclaus, J., Kornblueh, L., and Roeckner, E.: Advancing decadal-scale climate prediction in the North Atlantic sector, Nature, 453, 84–88, 2008.
Kharin, V. V. and Zwiers, F. W.: On the ROC score of probability forecasts, J. Climate, 16, 4145–4150, 2003.
Kim, H. J.: Global Soil Wetness Project Phase 3 Atmospheric Boundary Conditions (Experiment 1), Data Integr. Anal. Syst. [data set], https://doi.org/10.20783/DIAS.501, 2017.
Kirtman, B., Power, S., Adedoyin, J., Boer, G., Bojariu, R., Camilloni, I., Doblas-Reyes, F., Fiore, A., Kimoto, M., Meehl, G., Prather, M., Sarr, A., Schär, C., Sutton, R., van Oldenborgh, G., Vecchi, G., and Wang, H.: Near-term Climate Change: Projections and Predictability, book section 11, Cambridge University Press, Cambridge, United Kingdom and New York, NY, USA, 953–1028, https://doi.org/10.1017/CBO9781107415324.023, 2013.
Knight, J. R., Allan, R. J., Folland, C. K., Vellinga, M., and Mann, M. E.: A signature of persistent natural thermohaline circulation cycles in observed climate, Geophys. Res. Lett., 32, L20708, https://doi.org/10.1029/2005GL024233, 2005.
Knight, J. R., Folland, C. K., and Scaife, A. A.: Climate impacts of the Atlantic multidecadal oscillation, Geophys. Res. Lett., 33, L17706, https://doi.org/10.1029/2006GL026242, 2006.
Kucharski, F., Parvin, A., Rodriguez-Fonseca, B., Farneti, R., Martin-Rey, M., Polo, I., Mohino, E., Losada, T., and Mechoso, C. R.: The teleconnection of the tropical Atlantic to Indo-Pacific sea surface temperatures on inter-annual to centennial time scales: a review of recent findings, Atmosphere, 7, 29, https://doi.org/10.3390/atmos7020029, 2016.
Kushnir, Y., Scaife, A. A., Arritt, R., Balsamo, G., Boer, G., Doblas-Reyes, F., Hawkins, E., Kimoto, M., Kolli, R. K., Kumar, A., Matei, D., Matthes, K., Müller, W. A., O'Kane, T., Perlwitz, J., Power, S., Raphael, M., Shimpo, A., Smith, D., Tuma, M., and Wu, B.: Towards operational predictions of the near-term climate, Nat. Clim. Change, 9, 94–101, 2019.
Li J. and Wang, J. X.: A new North Atlantic Oscillation index and its variability, Adv. Atmos. Sci., 20, 661–676, 2003.
Li, J., Li, F., He, S., Wang, H., and Orsolini, Y. J.: The Atlantic multidecadal variability phase dependence of teleconnection between the North Atlantic Oscillation in February and the Tibetan Plateau in March, J. Climate, 34, 4227–4242, 2021.
Lovato, T. and Peano, D.: CMCC CMCC-CM2-SR5 model output prepared for CMIP6 CMIP historical, Earth System Grid Federation [data set], https://doi.org/10.22033/ESGF/CMIP6.3825, 2020.
Mariotti, A. and Dell'Aquila, A.: Decadal climate variability in the Mediterranean region: roles of large-scale forcings and regional processes, Clim. Dynam., 38, 1129–1145, 2012.
Meehl, G. A., Goddard, L., Murphy, J., Stouffer, R. J., Boer, G., Danabasoglu, G., Dixon, K., Giorgetta, M. A., Greene, A. M., Hawkins, E., Hegerl, G., Karoly, D., Keenlyside, N., Kimoto, M., Kirtman, B., Navarra, A., Pulwarty, R., Smith, D., Stammer, D., and Stockdale, T.: Decadal prediction: can it be skillful?, B. Am. Meteorol. Soc., 90, 1467–1486, 2009.
Meehl, G. A., Goddard, L., Murphy, J., Stouffer, R. J., Boer, G., Danabasoglu, G., Dixon, K., Giorgetta, M. A., Greene, A. M., Hawkins, E., Hegerl, G., Karoly, D., Keenlyside, N., Kimoto, M., Kirtman, B., Navarra, A., Pulwarty, R., Smith, D., Stammer, D., and Stockdale, T.: Initialized Earth System prediction from subseasonal to decadal timescales, Nat. Rev. Earth Environ., 2, 340–357, 2021.
Moat, B. I., Frajka-Williams, E., Smeed, D. A., Rayner, D., Johns, W. E., Baringer, M. O., Volkov, D., and Collins, J.: Atlantic meridional overturning circulation observed by the RAPID-MOCHA-WBTS (RAPID-Meridional Overturning Circulation and Heatflux Array-Western Boundary Time Series) array at 26N from 2004 to 2020 (v2020.2), British Oceanographic Data Centre – Natural Environment Research Council, UK, https://doi.org/10.5285/e91b10af-6f0a-7fa7-e053-6c86abc05a09, 2022.
Nicolì, D.: CMCC CMCC-CM2-SR5 model output prepared for CMIP6 DCPP dcppA-hindcast, Earth System Grid Federation [data set], https://doi.org/10.22033/ESGF/CMIP6.3751, 2020.
Nicolì, D. and Ruggieri, P.: Ocean and sea-ice initial conditions for CMCC DPS, Zenodo [data set], https://doi.org/10.5281/zenodo.6866295, 2022.
Nicolì, D., Bellucci, A., Iovino, D., Ruggieri, P., and Gualdi, S.: The impact of the AMV on Eurasian summer hydrological cycle, Sci. Rep.-UK, 10, 1–11, 2020.
Nicolì, D., Bellucci, A., Ruggieri, P., Athanasiadis, P., Materia, S., Peano, D., Fedele, G., and Gualdi, S.: CMCC-CM2-SR5 code for CMIP6 DCPP-A, Zenodo [code], https://doi.org/10.5281/zenodo.6810749, 2022.
O'Neill, B. C., Tebaldi, C., van Vuuren, D. P., Eyring, V., Friedlingstein, P., Hurtt, G., Knutti, R., Kriegler, E., Lamarque, J.-F., Lowe, J., Meehl, G. A., Moss, R., Riahi, K., and Sanderson, B. M.: The Scenario Model Intercomparison Project (ScenarioMIP) for CMIP6, Geosci. Model Dev., 9, 3461–3482, https://doi.org/10.5194/gmd-9-3461-2016, 2016.
O'Reilly, C. H., Zanna, L., and Woollings, T.: Assessing external and internal sources of Atlantic multidecadal variability using models, proxy data, and early instrumental indices, J. Climate, 32, 7727–7745, 2019.
Pohlmann, H., Jungclaus, J. H., Köhl, A., Stammer, D., and Marotzke, J.: Initializing decadal climate predictions with the GECCO oceanic synthesis: Effects on the North Atlantic, J. Climate, 22, 3926–3938, 2009.
Polkova, I., Köhl, A., and Stammer, D.: Impact of initialization procedures on the predictive skill of a coupled ocean–atmosphere model, Clim. Dynam., 42, 3151–3169, 2014.
Power, S., Casey, T., Folland, C., Colman, A., and Mehta, V.: Inter-decadal modulation of the impact of ENSO on Australia, Clim. Dynam., 15, 319–324, 1999.
Rayner, N., Parker, D. E., Folland, C. K., Horton, E. B., Alexander, L. V., and Rowell, D. P.: The global sea-ice and sea surface temperature (HadISST) data sets, J. Geophys, Res., 108, 2–22, 2003.
Robson, J., Polo, I., Hodson, D. L., Stevens, D. P., and Shaffrey, L. C.: Decadal prediction of the North Atlantic subpolar gyre in the HiGEM high-resolution climate model, Clim. Dynam., 50, 921–937, 2018.
Ruggieri, P., Bellucci, A., Nicolì, D., Athanasiadis, P. J., Gualdi, S., Cassou, C., Castrucci, F., Danabasoglu, G., Paolo Davini, P., Dunston, N., Eade, R., Gastineau. G., Harvey, B., Hermanson, L., Qasmi, S.,, Ruprich-Robert, Y., Sanchez-Gomez, E., Smith, D., Wild, S., and Zampieri, M.: Atlantic multidecadal variability and North Atlantic jet: a multimodel view from the decadal climate prediction project, J. Climate, 34, 347–360, 2021.
Ruprich-Robert, Y., Moreno-Chamarro, E., Levine, X., Bellucci, A., Cassou, C., Castruccio, F., Davini, P., Eade, R., Gastineau, G., Hermanson, L., Dan Hodson, D., Lohmann, K., Lopez-Parages, J., Monerie, P.-A, Nicolì, D., Qasmi, S., Roberts, C. D., Sanchez-Gomez, E., Danabasoglu, G., Dunstone, N., Martin-Rey, M., Msadek, R., Robson, J., Smith, D., and Tourigny, E.: Impacts of Atlantic multidecadal variability on the tropical Pacific: a multi-model study, Npj Clim. Atmos. Sci., 4, 1–11, 2021.
Scaife, A. A. and Smith, D.: A signal-to-noise paradox in climate science, npj Clim. Atmos. Sci., 1, 1–8, 2018.
Schneider, U., Becker, A., Finger, P., Rustemeier, E., and Ziese, M.: GPCC Full Data Monthly Product Version 2020 at 1.0∘: Monthly land-surface precipitation from rain-gauges built on GTS-based and historical data, Deutscher Wetterdienst, https://opendata.dwd.de/climate_environment/GPCC/html/fulldata-monthly_v2020_doi_download.html (last access: 30 May 2022), 2020.
Shaffrey, L. C., Hodson, D., Robson, J., Stevens, D P., Hawkins, E., Polo, I., Stevens, I., Sutton, R. T., Lister, G., Iwi, A., Smith, D., and Stephens, A.: Decadal predictions with the HiGEM high resolution global coupled climate model: description and basic evaluation, Clim. Dynam., 48, 297–311, 2017.
Smith, D. M., Cusack, S., Colman, A. W., Folland, C. K., Harris, G. R., and Murphy, J. M.: Improved surface temperature prediction for the coming decade from a global climate model, Science, 317, 796–799, 2007.
Smith, D. M., Scaife, A. A., and Kirtman, B. P.: What is the current state of scientific knowledge with regard to seasonal and decadal forecasting?, Environ. Res. Lett., 7, 015602, https://doi.org/10.1088/1748-9326/7/1/015602, 2012.
Smith, D. M., Eade, R., and Pohlmann, H.: A comparison of full-field and anomaly initialization for seasonal to decadal climate prediction, Clim. Dynam., 41, 3325–3338, 2013.
Smith, D. M. Eade, R., Scaife, A. A., Caron, L.-P., Danabasoglu, G., DelSole, T. M., Delworth, T., Doblas-Reyes, F. J., Dunstone, N. J., Hermanson, L., Kharin, V., Kimoto, M., Merryfield, W. J., Mochizuki, T., Müller, W. A., Pohlmann, H., Yeager, S., and Yang, X.: Robust skill of decadal climate predictions, Npj Clim. Atmos. Sci., 2, 1–10, 2019.
Smith, D. M., Scaife, A. A., Eade, R., Athanasiadis, P., Bellucci, A., Bethke, I., Bilbao, R., Borchert, L. F., Caron, L.-P., Counillon, F., Danabasoglu, G., Delworth, T., Doblas-Reyes, F. J., Dunstone, N. J., Estella-Perez, V., Flavoni, S., Hermanson, L., Keenlyside, N., Kharin, V., Kimoto, M., Merryfield, W. J., Mignot, J., Mochizuki, T., Modali, K., Monerie, P.-A., Müller, W. A., Nicolì, D., Ortega, P., Pankatz, K., Pohlmann, H., Robson, J., Ruggieri, P., Sospedra-Alfonso, R., Swingedouw, D., Wang, Y., Wild, S., Yeager, S., Yang, X., and Zhang, L.: North Atlantic climate far more predictable than models imply, Nature, 583, 796–800, 2020.
Sospedra-Alfonso, R., Merryfield, W. J., Boer, G. J., Kharin, V. V., Lee, W.-S., Seiler, C., and Christian, J. R.: Decadal climate predictions with the Canadian Earth System Model version 5 (CanESM5), Geosci. Model Dev., 14, 6863–6891, https://doi.org/10.5194/gmd-14-6863-2021, 2021.
Storto, A. and Masina, S.: C-GLORSv5: an improved multipurpose global ocean eddy-permitting physical reanalysis, Earth Syst. Sci. Data, 8, 679–696, https://doi.org/10.5194/essd-8-679-2016, 2016.
Sun, C., Li, J., and Zhao, S.: Remote influence of Atlantic multidecadal variability on Siberian warm season precipitation, Sci. Rep.-UK, 5, 1–9, 2015.
Sun, C., Kucharski, F., Li, J., Jin, F. F., Kang, I. S., and Ding, R.: Western tropical Pacific multidecadal variability forced by the Atlantic multidecadal oscillation, Nat. Commun., 8, 1–10, 2017.
Sutton, R. T. and Hodson, D. L.: Atlantic Ocean forcing of North American and European summer climate, Science, 309, 115–118, 2005.
Taylor, K. E., Stouffer, R. J., and Meehl, G. A.: An overview of CMIP5 and the experiment design, B. Am. Meteorol. Soc., 93, 485–498, 2012.
Tian, B. and Dong, X.: The double-ITCZ bias in CMIP3, CMIP5, and CMIP6 models based on annual mean precipitation, Geophys. Res. Lett., 47, e2020GL087232, https://doi.org/10.1029/2020GL087232, 2020.
Trenberth, K. E. and Shea, D. J.: Atlantic hurricanes and natural variability in 2005, Geophys. Res. Lett., 33, L12704, https://doi.org/10.1029/2006GL026894, 2006.
Tsujino, H., Urakawa, L. S., Griffies, S. M., Danabasoglu, G., Adcroft, A. J., Amaral, A. E., Arsouze, T., Bentsen, M., Bernardello, R., Böning, C. W., Bozec, A., Chassignet, E. P., Danilov, S., Dussin, R., Exarchou, E., Fogli, P. G., Fox-Kemper, B., Guo, C., Ilicak, M., Iovino, D., Kim, W. M., Koldunov, N., Lapin, V., Li, Y., Lin, P., Lindsay, K., Liu, H., Long, M. C., Komuro, Y., Marsland, S. J., Masina, S., Nummelin, A., Rieck, J. K., Ruprich-Robert, Y., Scheinert, M., Sicardi, V., Sidorenko, D., Suzuki, T., Tatebe, H., Wang, Q., Yeager, S. G., and Yu, Z.: Evaluation of global ocean–sea-ice model simulations based on the experimental protocols of the Ocean Model Intercomparison Project phase 2 (OMIP-2), Geosci. Model Dev., 13, 3643–3708, https://doi.org/10.5194/gmd-13-3643-2020, 2020.
Uppala, S.M., Kållberg, P. W., Simmons, A. J., Andrae, U., Bechtold, V. D. C., Fiorino, M., Gibson, J. K., Haseler, J., Hernandez, A., Kelly, G. A., Li, X., Onogi, K., Saarinen, S., Sokka, N., Allan, R.P., Andersson, E., Arpe, K., Balmaseda, M. A., Beljaars, A. C. M., Berg, L. V. D. , Bidlot, J., Bormann, N., Caires, S., Chevallier, F., Dethof, A., Dragosavac, M., Fisher, M., Fuentes, M., Hagemann, S., Hólm, E., Hoskins, B. J., Isaksen, L., Janssen, P. A. E. M., Jenne, R., Mcnally, A. P., Mahfouf, J.-F., Morcrette, J.-J., Rayner, N. A., Saunders, R. W., Simon, P., Sterl, A., Trenberth, K. E., Untch, A., Vasiljevic, D., Viterbo, P., and Woollen, J.: The ERA-40 re-analysis, Q. J. Roy. Meteor. Soc., 131, 2961–3012, 2005.
Van Oldenborgh, G. J., Doblas-Reyes, F. J., Wouters, B., and Hazeleger, W.: Decadal prediction skill in a multi-model ensemble, Clim. Dynam., 38, 1263–1280, 2012.
Viovy, N.: CRUNCEP Version 7 - Atmospheric Forcing Data for the Community Land Model, Research Data Archive at the National Center for Atmospheric Research, Computational and Information Systems Laboratory, Boulder, Colorado, http://rda.ucar.edu/datasets/ds314.3/ (last access: 18 October 2022), 2016.
Volpi, D., Guemas, V., Doblas-Reyes, F. J., Hawkins, E., and Nichols, N. K.: Decadal climate prediction with a refined anomaly initialisation approach, Clim. Dynam., 48, 1841–1853, 2017.
Wilks, D. S. (Ed.): Statistical methods in the atmospheric sciences, vol. 100, Academic press, ISBN 9780123850225, 2011.
Xin, X., Wei, M., Li, Q., Zhou, W., Luo, Y., and Zhao, Z.: Decadal prediction skill of BCC-CSM1.1 with different initialization strategies, J. Meteorol. Soc. Jpn. Ser. II, 97, 733–744, 2019.
Yang, C., Masina, S., and Storto, A.: Historical ocean reanalyses (1900–2010) using different data assimilation strategies, Q. J. Roy Meteor. Soc., 143, 479–493, https://doi.org/10.1002/qj.2936, 2016b.
Yang, X., Delworth, T. L., Zeng, F., Zhang, L., Cooke, W. F., Harrison, M. J., Rosati, A., Underwood, S., Compo, G. P., and McColl, C.: On the Development of GFDL's Decadal Prediction System: Initialization Approaches and Retrospective Forecast Assessment, J. Adv. Model. Earth Sy., 13, e2021MS002529, https://doi.org/10.1029/2021MS002529, 2021.
Yeager, S. G., Danabasoglu, G., Rosenbloom, N. A., Strand, W., Bates, S. C., Meehl, G. A., Karspeck, A. R., Lindsay, K., Long, M. C., Teng, H., and Lovenduski, N. S.: Predicting near-term changes in the Earth System: A large ensemble of initialized decadal prediction simulations using the Community Earth System Model, B. Am. Meteorol. Soc., 99, 1867–1886, 2018.
Zhang, R. and Delworth, T. L.: Simulated tropical response to a substantial weakening of the Atlantic thermohaline circulation, J. Climate, 18, 1853–1860, 2005.
Zhang, R., Sutton, R., Danabasoglu, G., Kwon, Y., Marsh, R., Yeager, S. G., Amrhein, D. E., and Little, C. M.: A review of the role of the Atlantic meridional overturning circulation in Atlantic multidecadal variability and associated climate impacts, Rev. Geophys., 57, 316–375, 2019.