the Creative Commons Attribution 4.0 License.
the Creative Commons Attribution 4.0 License.
 | 21 Oct 2022
Impacts of the ice-particle size distribution shape parameter on climate simulations with the Community Atmosphere Model Version 6 (CAM6)
Wentao Zhang
Chunsong Lu
The impacts of the ice-crystal size distribution shape parameter (μi) were considered in the two-moment bulk cloud microphysics scheme of the Community Atmosphere Model Version 6 (CAM6). The μi's impact on the statistical mean radii of ice crystals can be analyzed based on their calculating formulas. Under the same mass (qi) and number (Ni), the ratios of the mass-weighted radius (, not related to μi) to other statistical mean radii (e.g., effective radiative radius) are completely determined by μi. Offline tests show that μi has a significant impact on the cloud microphysical processes owing to the μi-induced changes in ice-crystal size distribution and statistical mean radii (excluding ). Climate simulations show that increasing μi would lead to higher qi and lower Ni in most regions, and these impacts can be explained by the changes in cloud microphysical processes. After increasing μi from 0 to 5, the longwave cloud radiative effect increases (stronger warming effect) by 5.58 W m−2 (25.11 %), and the convective precipitation rate decreases by −0.12 mm d−1 (7.64 %). In short, the impacts of μi on climate simulations are significant, and the main influence mechanisms are also clear. This suggests that the μi-related processes deserve to be parameterized in a more realistic manner.
- Article
(4939 KB) - Full-text XML
- BibTeX
- EndNote


Clouds are an integral part of the Earth's radiation budget and global water cycle (Liou, 1986; Luo and Rossow, 2004; Bony et al., 2015; Zhou et al., 2016). Since cloud microphysical processes occur at scales that are much smaller than the resolution of commonly used atmospheric models, it remains a significant challenge for atmospheric models to represent cloud-related processes, especially ice-phase cloud microphysical processes (Mitchell et al., 2008; Spichtinger and Gierens, 2009; Wang and Penner, 2010; Erfani and Mitchell, 2016; Paukert et al., 2019; Morrison et al., 2020; Proske et al., 2022). Because it is impossible for commonly used atmospheric models (excluding the ideal model with the recently developed Lagrangian-particle-based scheme) to individually describe cloud particles (e.g., cloud droplets or ice crystals), only the macrostatistical features of cloud particles are represented in cloud microphysics schemes. From the outset, the development of cloud microphysics schemes has resulted in two distinct categories: bulk microphysics parameterization and spectral (bin) microphysics (Milbrandt and Yau, 2005; Khain et al., 2015). The spectral (bin) approach explicitly represents the cloud particle size distributions (PSDs) using tens to hundreds of bins. The computational cost of this approach is very high because of the massive interactions among different bins. The bulk microphysics scheme represents the PSDs by a semiempirical distribution function. Compared to the spectral (bin) scheme, the bulk microphysics scheme has high computational efficiency and has been widely used in climate models (Morrison et al., 2005; Lohmann et al., 2007; Salzmann et al., 2010; Gettelman and Morrison, 2015).
In the bulk cloud microphysics schemes used for climate models, the PSD is usually described by the gamma distribution function with three parameters, namely, the intercept parameter (N0), the slope parameter (λ), and the spectral shape parameter (μ) (Khain et al., 2015; Morrison et al., 2020). Note that the commonly used two-moment bulk microphysics scheme predicts only the mass and number of cloud particles, which cannot constrain these three parameters (i.e., N0, λ, and μ). Therefore, one of these three parameters (typically μ) must be determined from an empirical formula or set to a given value (e.g., Morrison and Gettelman, 2008; Barahona et al., 2014; Eidhammer et al., 2017). For instance, the μ(μi) of ice crystals (ICs; only represent cloud ice in this study) in the two-moment bulk stratiform cloud microphysics scheme developed by Morrison and Gettelman (2008) (hereafter “MG scheme”) is set to zero (i.e., the μi is ignored). In recent years, offline tests and short-term simulations (a few days or less) with high-resolution atmospheric models (e.g., cloud-resolving models and mesoscale models) have shown that μi has a significant impact on cloud microphysical processes and synoptic systems (Milbrandt and Yau, 2005; Milbrandt and McTaggart-Cowan, 2010; Loftus et al., 2014; Khain et al., 2015; Milbrandt et al., 2021). Unlike short-term simulations, climate simulations pay more attention to the equilibrium states or quasi-equilibrium states because the feedback processes become important (Sherwood et al., 2015; King et al., 2020). However, in terms of climate simulations, few studies have focused on the influence of μi.
In this study, in order to investigate the impacts of μi on climate simulations with the Community Atmosphere Model version 6 (CAM6) model, the impacts of μi were considered in the MG scheme by a tunable parameter. There were two major motivations behind this work. First, are the impacts of μi notable? If yes, it is necessary for climate models to represent the μi and μi-related processes in a more realistic manner. And second, what are the main mechanisms for these impacts? These would be helpful to understand the climate simulations with the impacts of μi. This paper is organized as follows: the modified MG scheme and experimental setup are described in Sect. 2; cloud microphysical process offline tests and CAM6 model simulation results are analyzed in Sect. 3; and finally, the summary and conclusions are provided in Sect. 4.
2.1 The modified MG scheme
The CAM6 model, which is the atmospheric component of the Community Earth System Model Version 2.1.3 (CAM6; Bogenschutz et al., 2018; CESM2, Danabasoglu et al., 2020), was used in this study. It is noteworthy that the treatments of clouds in climate models are usually divided into two categories: convective cloud schemes with simplified cloud microphysics and larger-scale stratiform cloud schemes with relatively detailed cloud microphysics. In the CAM6 model, the convective cloud scheme does not consider the PSD of ICs (Zhang and McFarlane, 1995; Zhang et al., 1998; Bogenschutz et al., 2013; Larson, 2017). The stratiform cloud microphysics was represented by the updated MG scheme with prognostic precipitation (Gettelman and Morrison, 2015). In both versions of the MG scheme, the ICs are assumed to be spherical, and the PSD of ICs is described by the gamma distribution function:
where is the number density (i.e., of the ICs with diameter D. N0i, λi, and μi (nonnegative values) are the intercept parameter, the slope parameter, and the spectral shape parameter, respectively. Given that μi is known, N0i and λi can be determined by the local in-cloud IC mass and number mixing ratio (qi and Ni, prognostic variables in units of kg kg−1 and kg−1, respectively).
where the IC bulk density (ρi) is 500 kg m−3, and μi is zero in the default MG scheme. is the gamma function. It is noteworthy that the kth moment of this size distribution (Mk) is found by integrating the distribution in this form: (Eidhammer et al., 2014). Furthermore, the recursive property of the gamma function (i.e., ) is also used for the following formula derivation.
Equations (2) and (3) also indicate that, under the same qi and Ni, changes in μi could impact the other two parameters regarding the PSD of ICs (i.e., N0i and λi). Meanwhile, the number-weighted radius () related to the IC deposition/sublimation process, the effective radiative radius () used for the radiative transfer scheme, and other statistical mean radii might be influenced. To better understand the influence of μi on the ice-phase cloud microphysical processes, the equations for calculating the statistical mean radii are introduced first. The mass-weighted radius () is calculated from Eq. (4). The number-weighted radius (), which is the so-called mathematical mean value, is calculated from Eq. (5). The area-weighted radius () is calculated from Eq. (6). , which is defined as the cross-section-weighted radius (Schumann et al., 2011; Wyser, 1998), is calculated from (Eq. 7). Note that can be calculated by qi and Ni (the last term of Eq. 4, without μi), and the other statistical mean radii (e.g., , , and ) can be calculated by and μi (Eqs. 5–7). In other words, the ratios of the other statistical mean radii (e.g., , , and ) to are functions of μi. For nonnegative μi values, Eqs. (5) and (6) indicate that and are always less than . This can be explained by the physical reason that larger ICs contribute more to than to and . Similarly, is always greater than (Eq. 7). Furthermore, Eqs. (5), (6), and (7) also indicate that with increasing μi, , , and approach . In Sect. 3.1, more analyses are provided by offline tests.
Because μi is zero in the default MG scheme, the equations for the cloud microphysical processes are simplified by omitting μi (Morrison and Gettelman, 2008; Gettelman and Morrison, 2015). In this study, these equations are modified to consider the impact of μi (i.e., nonzero μi). In the default MG scheme, there are three cloud microphysical processes, which are related to the PSD of ICs. They consist of the deposition/sublimation of ICs, the autoconversion of IC to snow, and the mass-weighted and number-weighted IC fall velocities ( and ), respectively. Table 1 shows the original and modified equations for these cloud microphysical processes. The d (i.e., the time derivative of qi) caused by the deposition/sublimation process (including the Wegener-Bergeron process in mixed-phase clouds) is calculated from d), where Si, Tp, and τi are the ice supersaturation, a psychrometric correction to account for the release of latent heat, and the supersaturation relaxation timescale, respectively (Morrison and Gettelman, 2008). Among them, τi is related to μi. In the original equation of τi (Table 1, left column), N0i=λiNi (Eq. 3) and at μi=0 (Eq. 5). Therefore, the original equation for τi can be rewritten as the modified equation (Table 1, right column). The modified equation indicates that τi is inversely proportional to , which is consistent with the equation obtained by Korolev and Mazin (2003). This modified equation also indicates that, under the same qi and Ni ( is also fixed), μi can affect τi (i.e., the IC deposition/sublimation process) via the influence on . In the MG scheme, ICs with radii greater than the threshold (Rcs) are considered to be snow. Correspondingly, the mass and number of ICs converted to snow (qiauto and Niauto) are represented by the integration of those ICs with radii greater than Rcs. Therefore, the incomplete gamma function, (, is used to calculate qiauto and Niauto (right column). It is necessary to note that, at μi=0, the modified equations for qiauto and Niauto can be rewritten as the original equations (i.e., omitting μi, left column) based on a property of the incomplete gamma function (i.e., , where s is a positive integer). Based on the diameter–fall speed relationship, V=aDb (a and b are empirical coefficients), and the properties of the gamma function, μi is considered in the equations for mass-weighted and number-weighted terminal fall speeds ( and , Table 1).
Table 1Equations for calculating the μi-related cloud microphysical processes*.
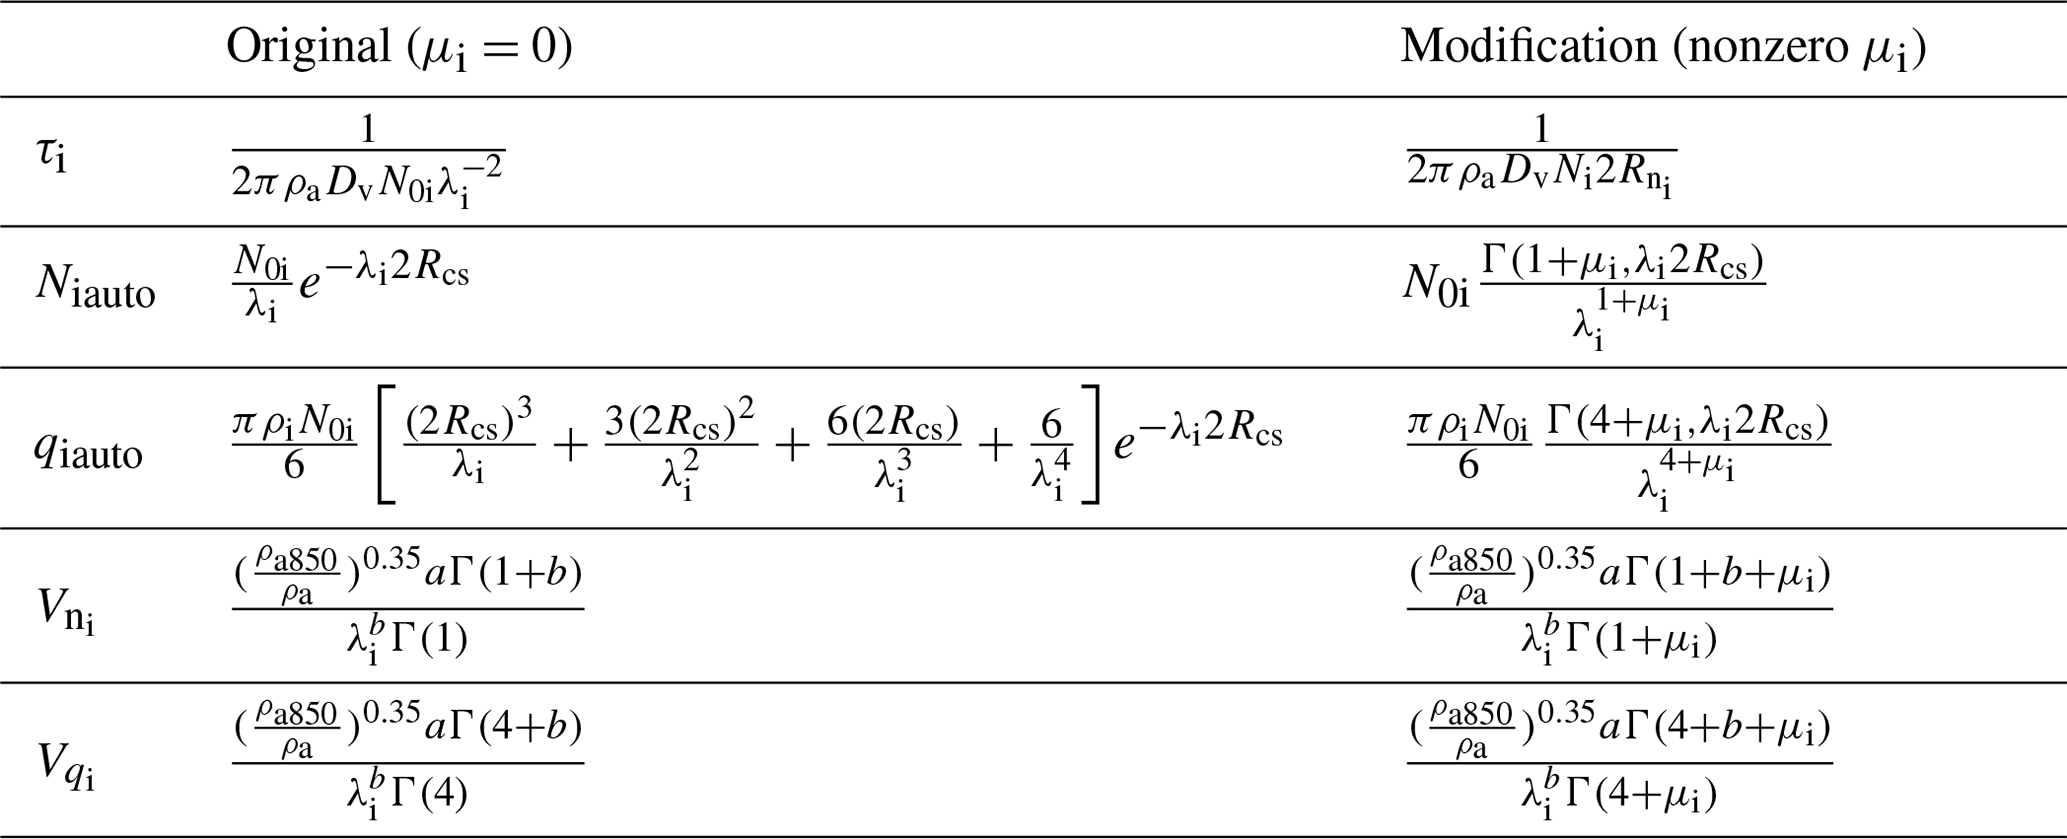
* where Dv is the diffusivity of water vapor in air (Dv is calculated as a function of temperature and pressure, Dv=8.794 × 10), Rcs is the threshold radius for the autoconversion of IC to snow (Rcs=100 µm), ρa is the air density, ρa850 is the reference air density at 850 hPa, and a and b are empirical coefficients (a=700 m1−b s−1, b=1).
2.2 CAM6 experimental design
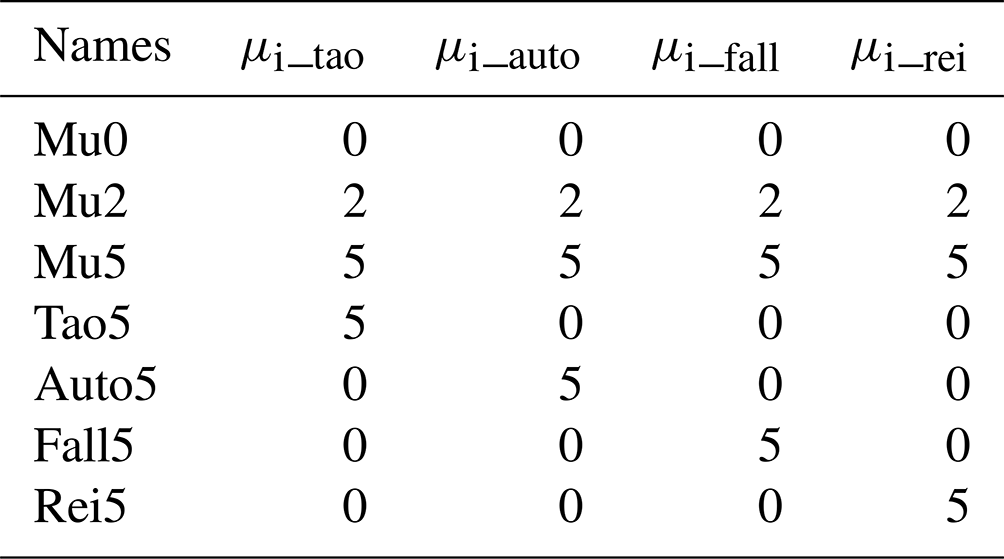
Observational studies have shown that μi is less than 5 under most conditions (Heymsfield, 2003; McFarquhar et al., 2015). This study focuses only on investigating the influence of μi. There are four μi-related processes (i.e., the radiative transfer process and three cloud microphysical processes) in the modified CAM6 model. Note that μi can be set to different values for different processes with the advantage of model simulations. Seven experiments were conducted in this study (Table 2). The Mu0 experiment is considered to be the reference experiment because μi is set to zero for all of the μi-related processes. The μi is set to 2 for all of the μi-related processes in the Mu2 experiment, and the μi is set to 5 for all of the μi-related processes in the Mu5 experiment. The comparison between the Mu2 (or Mu5) and Mu0 experiments shows the influence of μi on climate simulations. Furthermore, to investigate the influence of each μi-related process, an additional four experiments, namely, Tao5, Auto5, Fall5, and Rei5, were conducted. It is also necessary to investigate negative μi because negative μi has also been reported by observational studies. However, the bulk cloud microphysics schemes usually constrain μi to be nonnegative (see Appendix A). Therefore, only nonnegative μi was investigated. In this study, for ease of expression, “Δ” is used to denote the difference from the Mu0 experiment (e.g., ΔTao5 = Tao5 − Mu0). Without specification, the comparisons between model simulations are relative to the Mu0 experiment. When analyzing a cloud property variable (e.g., qi), it is necessary to know which experiment the variable comes from. To show this information, the experiment name is added as a superscript. For example, the qi from the Mu5 experiment is denoted as , the difference in qi between the Mu5 and Mu0 experiments is denoted as , and the relative change of qi from the Mu5 experiment is denoted as .
In this study, all experiments were atmosphere-only simulations (i.e., sea surface temperature and sea ice are prescribed) with a horizontal resolution of 1.9∘ latitude × 2.5∘ longitude and 32 vertical layers. All experiments ran for 11 model years, and the last 10 years was used for the analyses. In addition, the standard deviation calculated from the averages of each year (i.e., 10 averages) was used to check the statistical significance of the multiyear average (i.e., 10-year average).
Table 2The values of μi in all experiments conducted in this study. μi_tao, μi_auto, μi_fall, and μi_rei indicate the μi used for calculating the IC deposition/sublimation (tao), autoconversion of IC to snow (auto), IC fall velocity (fall), and the used for the radiation scheme (rei), respectively.
3.1 Offline tests
To better understand the impact of μi on climate simulations, the impacts of μi on the IC PSD and μi-related cloud microphysical processes are first illustrated by offline tests. In these offline tests, the impact of μi was analyzed at a given (i.e., the ratio of qi to Ni is fixed).
Equations (1), (2), and (3) indicate that the normalized IC size distribution (i.e., the relative contributions of each bin) can be calculated from and μi. Figure 1 shows the impact of μi on the normalized PSDs of ICs. Under the same μi, the shapes of the PSDs (i.e., the relative number or mass contributions of each bin) with µm (small IC scenario) are the same as those with µm (large IC scenario). In other words, the shape of the PSD is completely determined by μi (i.e., spectral shape parameter). As expected, the PSDs move toward larger radii with increasing . As introduced in the study of Milbrandt et al. (2021), the PSD becomes narrow with increasing μi. Note that, in terms of number, the contributions of the smaller size bins significantly decrease with increasing μi. Unlike the number contributions, the mass contributions of the larger size bins significantly decrease with increasing μi because the mass contribution is more sensitive to the IC radius. Under the large IC scenario (i.e., µm), the mass contribution of the ICs with radii greater than Rcs is significantly decreased with increasing μi. The above analyses suggest that the cloud microphysical processes that depend on the PSD of ICs (e.g., autoconversion of IC to snow) might be significantly influenced by μi.
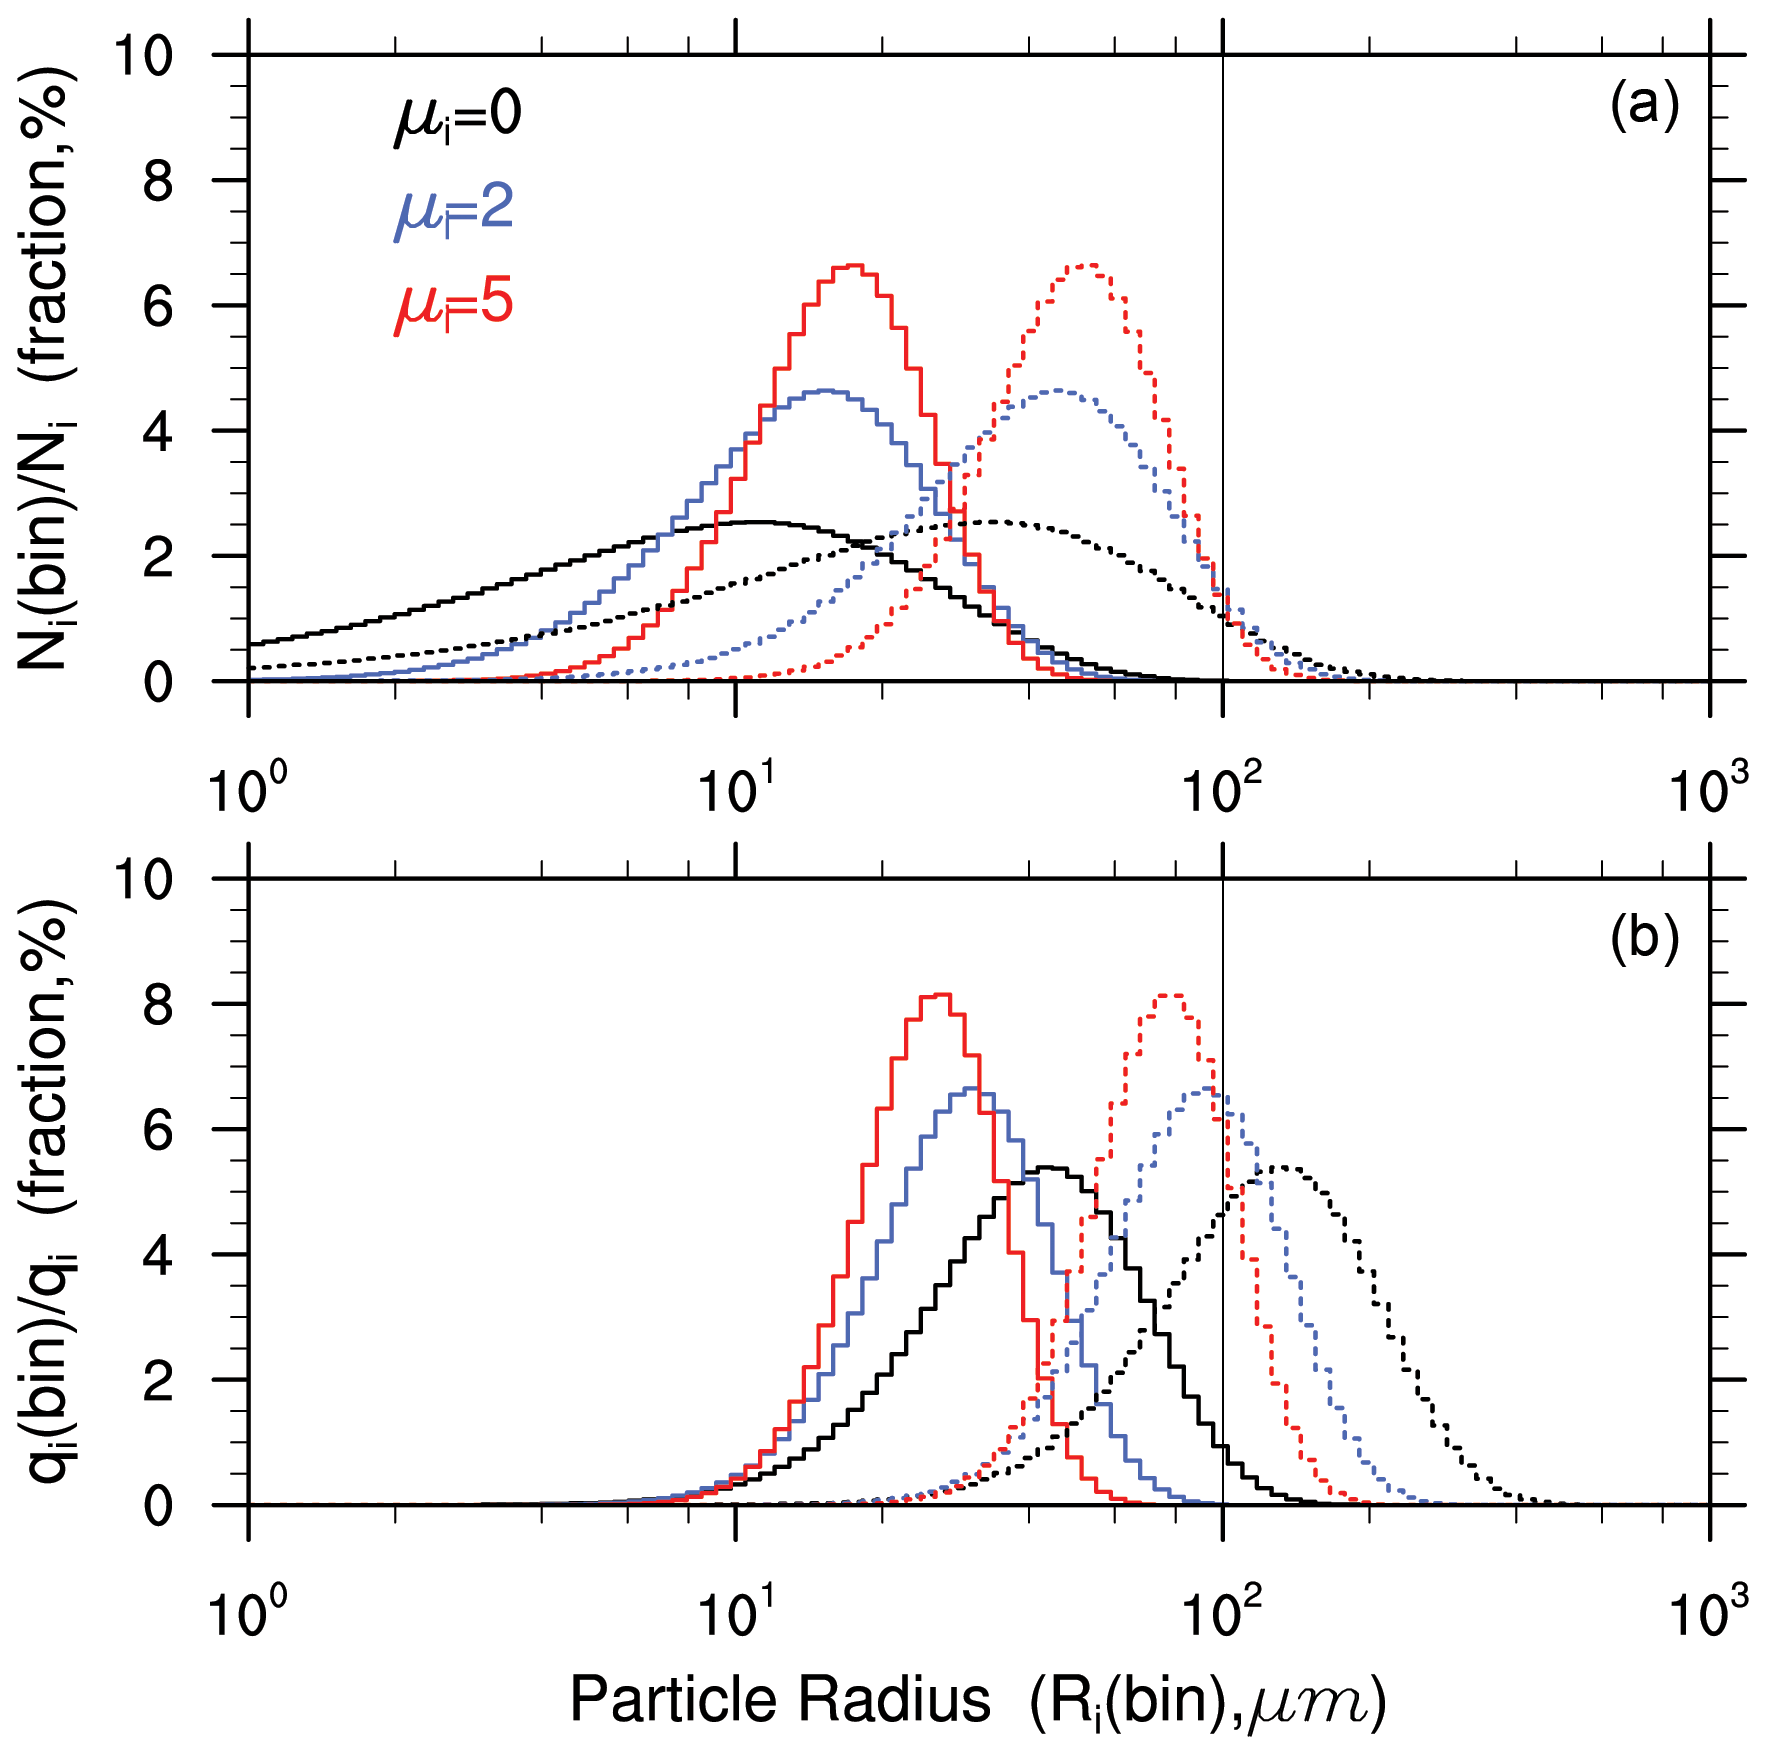
Figure 1The relative number (a) and mass (b) contributions from each radius bin of ICs. Each bin width is the same based on the logarithm of the particle radius. Ni and qi are the total number and mass of ICs, respectively. A total of 100 bins were used here. The solid lines indicate the normal IC scenario (i.e., µm), and the dotted lines indicate the large IC scenario (i.e., µm). The vertical black line indicates the Rcs that was used for the autoconversion of IC to snow (Rcs=100 µm).
The offline tests were performed for the μi-related cloud microphysical processes and statistical mean radii (Table 3). As introduced in Sect. 2.1, , , and can be calculated from and μi. Both and significantly increase with increasing μi (Table 3). This is in agreement with their calculation equations (Eqs. 5, 6). is approximately half of at μi=0 (i.e., and ), while is close to at μi=5 (i.e., and ). According to the calculation equation of (Eq. 7), decreases with increasing μi. The ratios of to at μi=0, 2, and 5 are 1.65 (i.e., and ), 1.28 (i.e., and ), and 1.15 (i.e., and ), respectively. It is necessary to point out that with increasing μi, , , and approach (Table 3) because the PSD of ICs becomes narrow (Fig. 1). As expected, τi decreases with increasing μi (Table 3) because τi is inversely proportional to (Table 2). The decrease in τi suggests that the d caused by the deposition/sublimation process is accelerated (Morrison and Gettelman, 2008). Compared to the with μi=0 (i.e., s−1 and 10. s−1), the with μi=2 ( and s−1) and μi=5 ( s−1 and s−1) increase by 39.10 % and 56.72 %, respectively. This is consistent with the previous finding (ICs vapor deposition process is obviously accelerated by increasing μi) reported by Mitchell (1991). In Table 3, and indicate the portion of ICs that convert to snow in terms of number and mass, respectively. Under the small IC scenario (i.e., µm), regardless of the value of μi, both and are very small (< 2 %, Table 3) because there are few ICs with radii greater than Rcs (Fig. 1). Under the large IC scenario (i.e., µm), there is a considerable portion of ICs with radii greater than Rcs, especially the mass contribution (Fig. 1). The at μi=0, 2, and 5 is 64.08 %, 36.54 %, and 18.40 %, respectively (Table 3). This suggests that the autoconversion of IC to snow becomes difficult with increasing μi. Compared with the considerable values for , the is relatively small (i.e., 4.84 % at μi=0, 4.23 % at μi=2, and 2.63 % at μi=5). Therefore, the of the residual ICs (Rqi_afterauto; 43.36 µm at μi=0, 52.31 µm at μi=2, and 56.57 µm at μi=5) is obviously lower than the original (60 µm). During the falling process, it is inevitable that is greater than because larger ICs with faster falling contribute more in the . Thus, larger ICs appear preferentially in the lower model layers. This is called the size-sorting mechanism (Milbrandt and Yau, 2005). decreases with increasing μi, while increases with increasing μi (Table 3). This could also be explained by their calculation equations (the corresponding derivations are similar to those for , , and , not shown). With increasing μi, the difference between and decreases (Table 3) because the PSD of ICs becomes narrow (Fig. 1). As a result, the size-sorting process becomes slow. For instance, there are many ICs with µm in a model layer. The height of each model layer is 200 m. After one model time step (10 min), some ICs fall into the lower layer. For μi=0, the of the ICs that are still in the model layer (Rqi_leftover) is 42.11 µm, and the of the ICs in the lower layer () is 95.24 µm. For μi=2, Rqi_leftover is 52.45 µm, and Rqi_lowerlayer is 75.60 µm. For μi= 5, Rqi_leftover is 55.81 µm, and Rqi_lowerlayer is 68.68 µm. It is clear that the difference in between these two adjacent layers that is caused by the sedimentation process (i.e., the difference between Rqi_leftover and Rqi_lowerlayer) becomes small with increasing μi. In short, the above analyses clearly suggest that μi has a significant impact on the cloud microphysical processes and statistical mean radii of ICs.
Table 3Offline tests* for the cloud microphysical processes and statistical mean radii at µm (left) and µm (right).
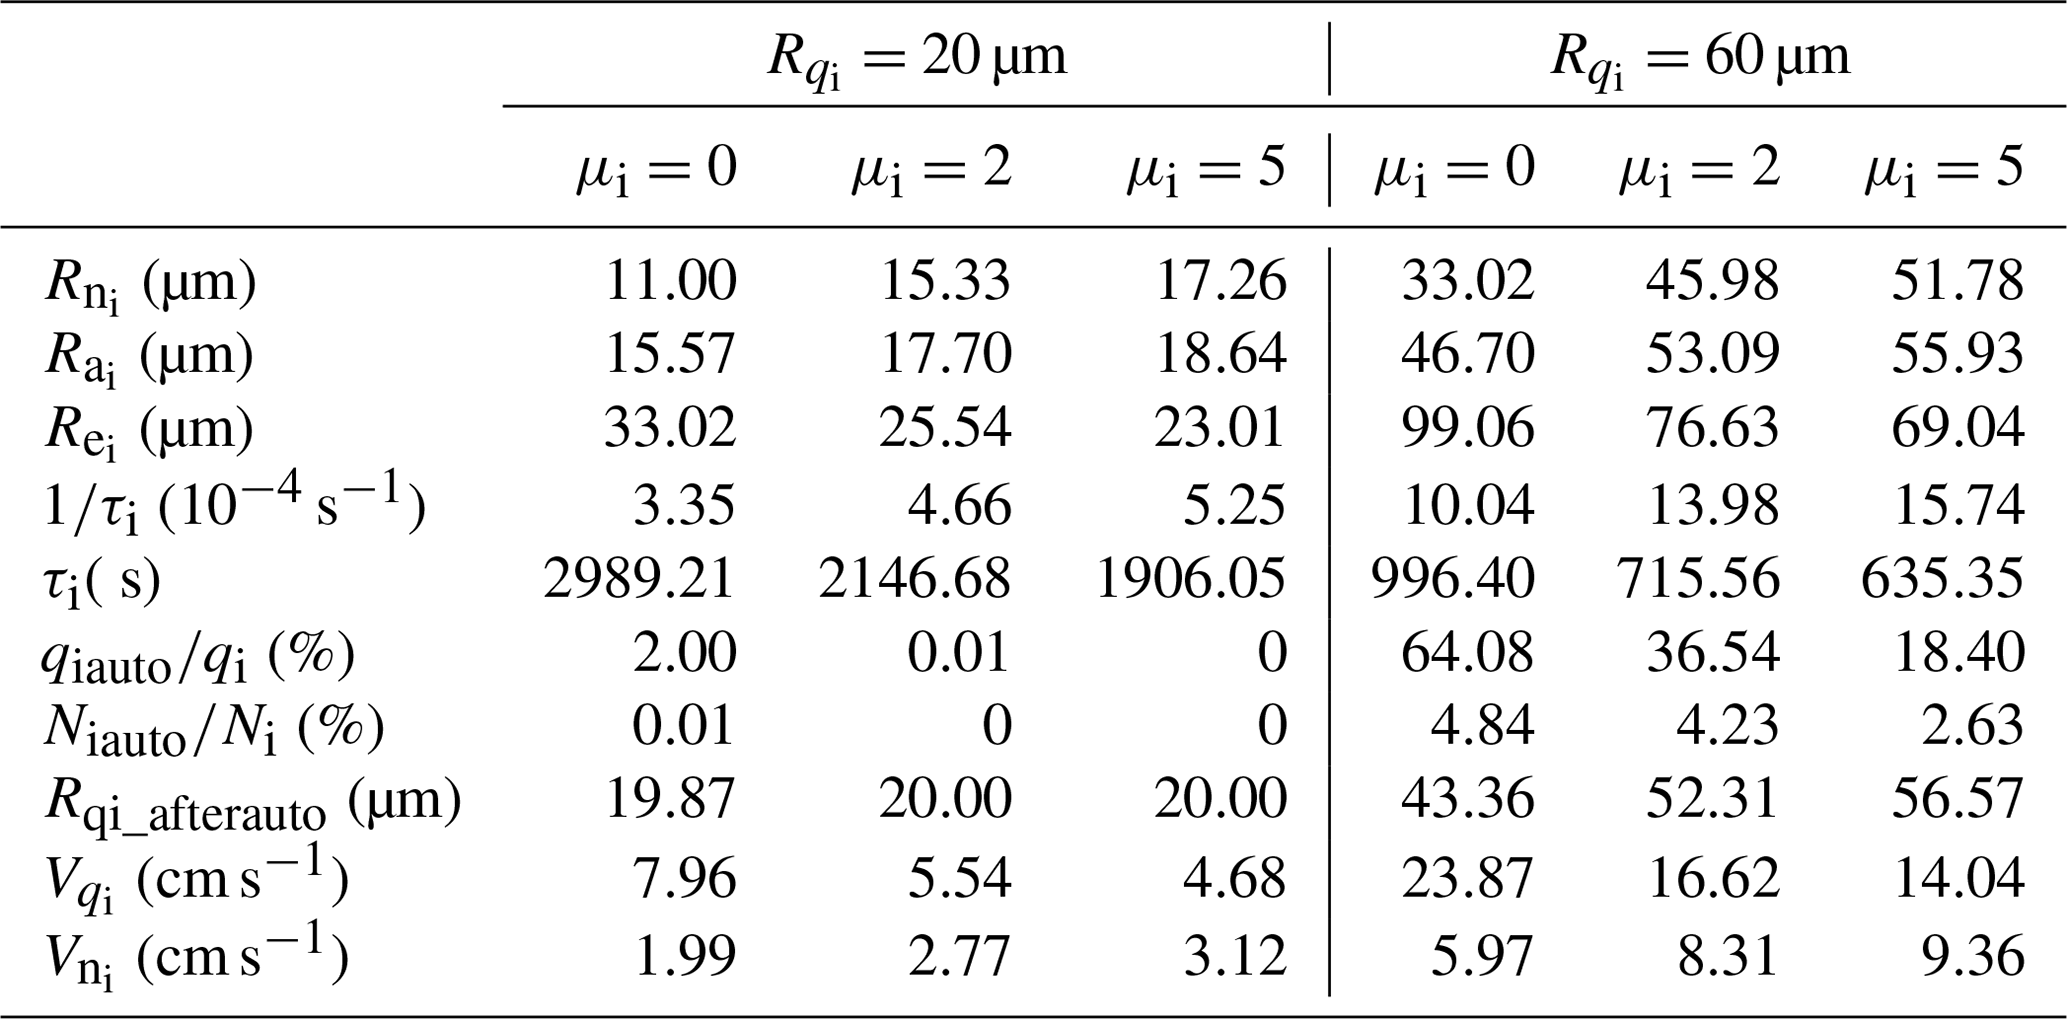
* Note τi is calculated at T=220 K, P=330 hPa, and Ni=105 kg−1 (∼ 50 L−1). and are calculated at T=220 K and P=330 hPa.
3.2 CAM6 simulations
During the evolution of stratiform clouds, the properties of ice clouds (e.g., qi, Ni, and , including mixed-phase clouds) largely determine the ice-phase cloud microphysical processes. Meanwhile, these cloud microphysical processes in turn change the cloud properties. They interact as both cause and effect and finally reach equilibrium climate states. To facilitate the subsequent analyses, the cloud properties and μi-related cloud microphysical processes are shown together in one figure. For ease of expression, “δ” is used to denote the changes in cloud properties that are caused by the cloud microphysical process during one model time step (tendency × one time step). For example, the changes in qi and Ni that are caused by the sedimentation process during one model time step are denoted as δqised and δNised, respectively.
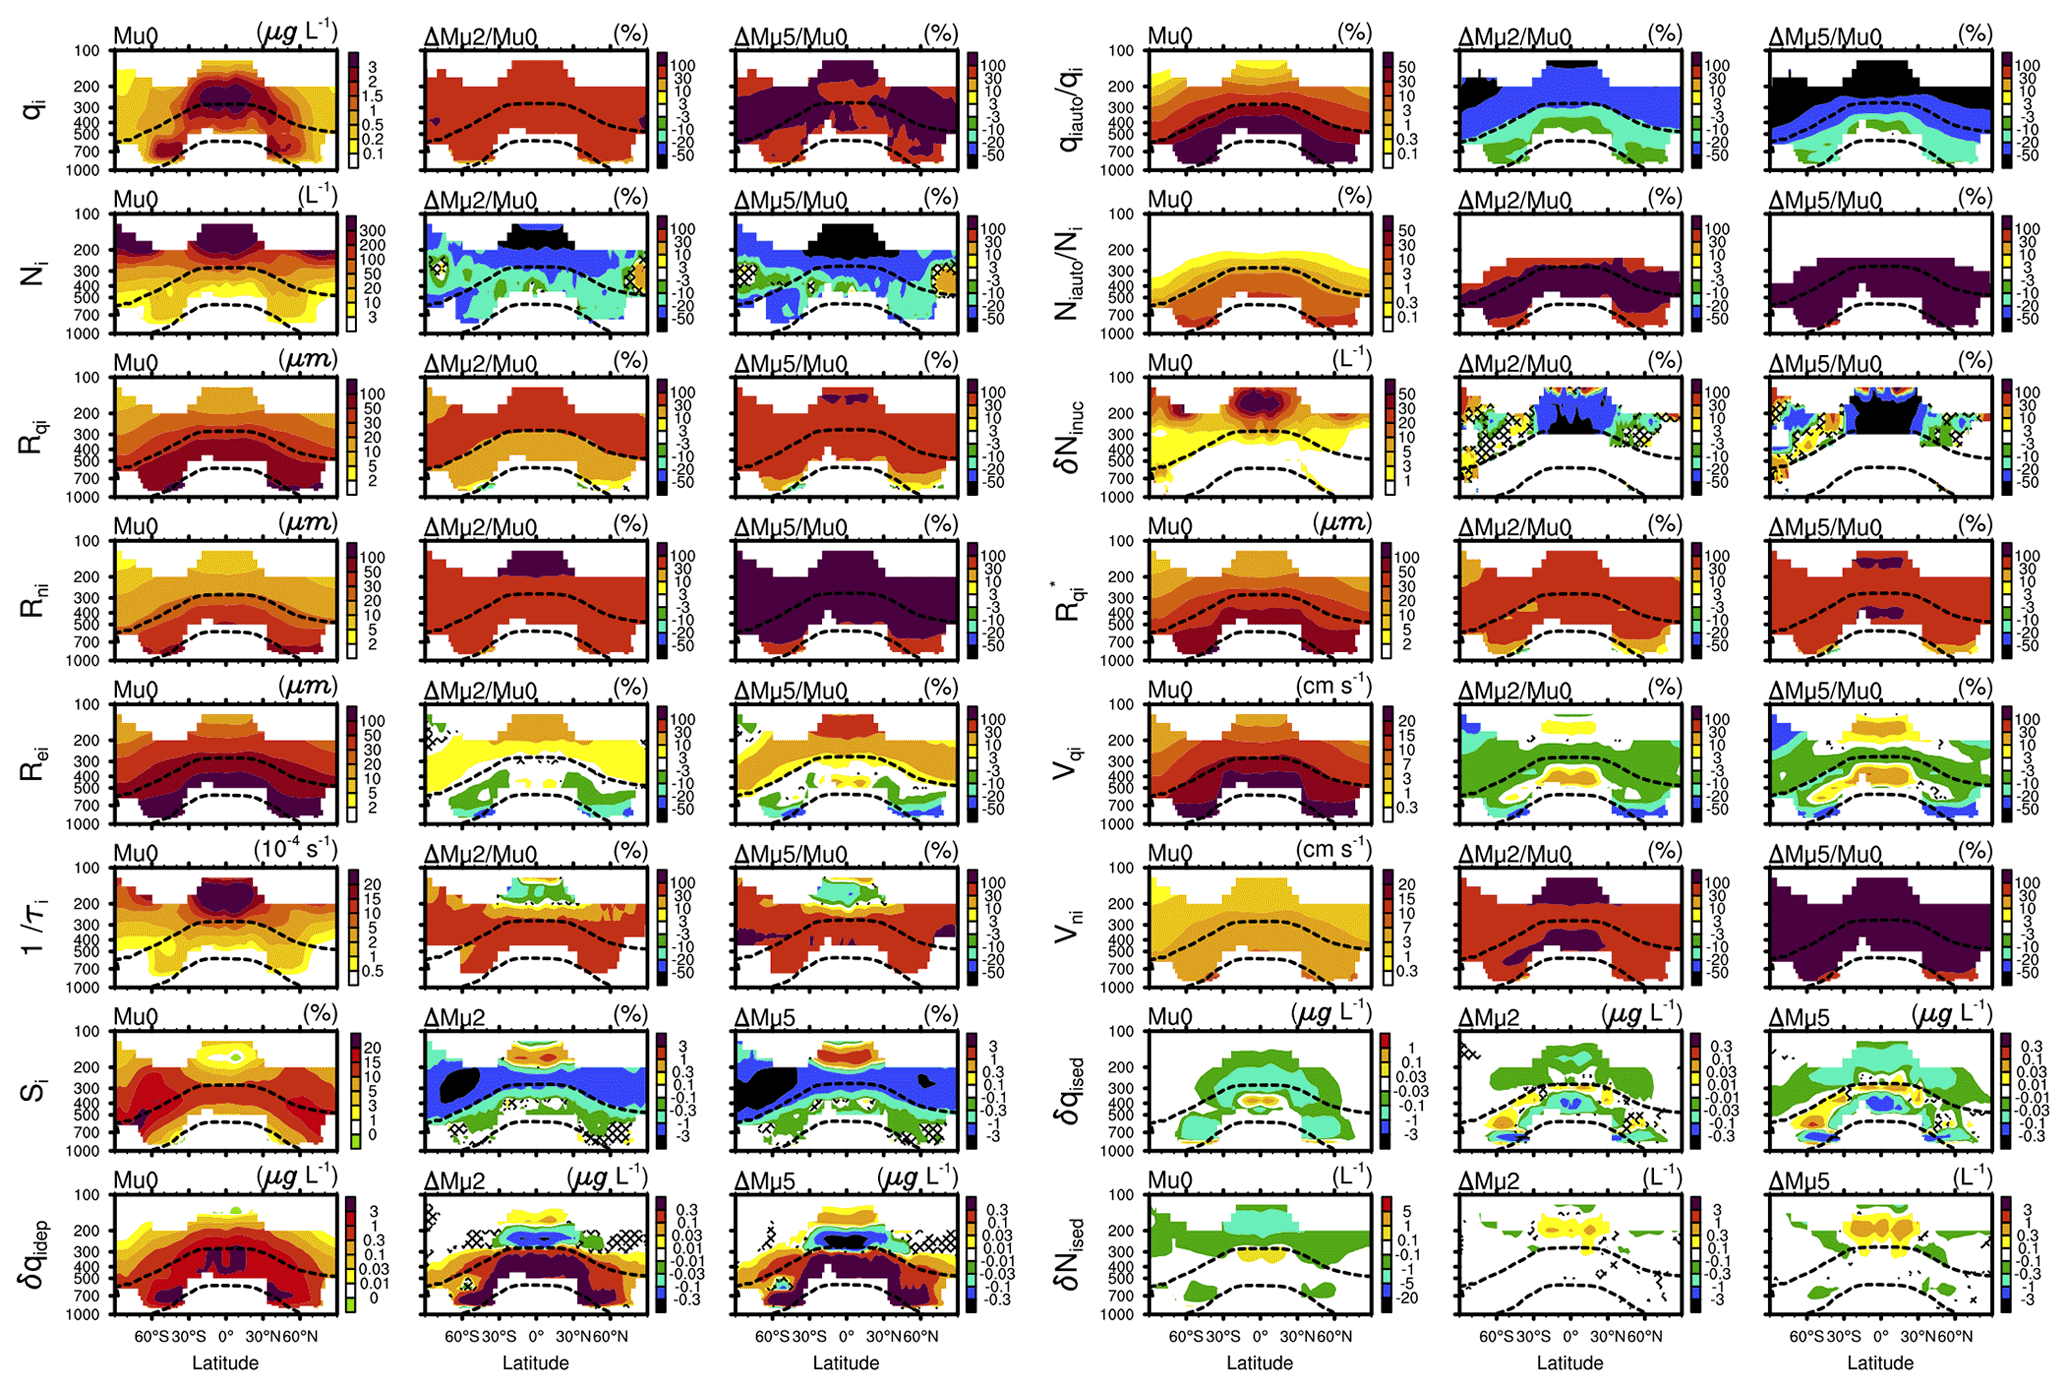
Figure 2Annual zonal mean in-cloud variables from the Mu0 (first and fourth columns), ΔMu2 (second and fifth columns), and ΔMu5 (third and sixth columns) experiments. Shown are the ICs' mass mixing ratio (qi) and number density (Ni), mass-weighted and number-weighted radii ( and ), effective radius (), reciprocal of the supersaturation relaxation timescale (), ice supersaturation (Si), change in qi caused by deposition/sublimation process (δqidep), portion of ICs that are converted to snow in terms of mass and number ( and ), newly formed IC number density from the nucleation process (δNinuc), the updated mass-weighted radius () used for calculating the sedimentation process, mass-weighted and number-weighted fall velocities (and ), and changes in qi and Ni that are caused by the sedimentation process (δqised and δNised). Except for δqidep, δqised, δNinuc, and δNised, the other variables are shown as their relative changes (i.e., ΔMu2Mu0 and ΔMu5Mu0). The y axis indicates the atmospheric pressure (unit: hPa). The two dashed black curves are the 0 and −37∘ isotherms. All results are sampled from model grids where the ice cloud fraction is greater than 1 %. The shading indicates that the differences between two experiments are not significant at the 95 % level based on Student's t test.
Figure 2 shows the model results from the Mu0, Mu2, and Mu5 experiments. The is larger in the upper tropical troposphere (> 3 µg L−1) and relatively larger in the lower troposphere over middle latitudes in both hemispheres (> 1 µg L−1). The spatial pattern of is generally in agreement with the satellite retrieval data (Li et al., 2012). Higher (> 200 L−1) can be found in the tropopause region, where homogeneous freezing produces a large number of ICs (not shown) due to sufficient soluble aerosol particles, higher subgrid vertical velocity, and lower temperature (Shi et al., 2015). All statistical mean radii (i.e., , , and ) decrease with an altitude increase. One possible reason is that it is hard for ICs to grow big in the upper troposphere because there the water vapor density is very low (lower temperature). Furthermore, the size-sorting effect (i.e., sedimentation process) could also be a contributor to this phenomenon (Milbrandt and Yau, 2005; Khain et al., 2015). As expected, is less than , and is larger than . After considering the impact of μi (i.e., μi=2 or 5), the ΔMu2 and ΔMu5 experiments show that qi is significantly increased, while Ni is significantly decreased. The is 30 %–100 % in nearly all regions, and the reaches even higher levels (> 100 %) in most regions. Both and are 20 % above the −37∘ isotherm and even reach −50 % in the upper tropical troposphere. Consistent with the increase in qi and the decrease in Ni, the significantly increases. The is 30 %–100 % above the −37∘ isotherm, and the is 30 %–100 % in most regions and even reaches 100 % in a few regions of the upper tropical troposphere. Because increases with increasing μi at a fixed value (Sect. 3.1), the relative increases in from the ΔMu2 and ΔMu5 experiments (i.e., and ) are obviously higher than the relative increases in (i.e., and ). The is > 100 % in some regions, and the is > 100 % in most regions. Compared with the relative increases in , the relative increases in from the ΔMu2 and ΔMu5 experiments are obviously reduced or even negative because decreases with increasing μi at a fixed value (Sect. 3.1). Overall, the impacts of μi on qi and Ni are notable. The changes in the statistical mean radii (i.e., , , and ) can be explained by the changes in qi, Ni, and μi.
This paragraph analyzes the interaction between the ice cloud properties (qi, Ni, and) and the IC deposition/sublimation process and the influence of μi on this interaction. Since is proportional to (Table 1), the is larger in the upper tropical troposphere (> s−1) due to the high (> 200 L−1). Both the ΔMu2 and ΔMu5 experiments show that the increases in most regions because the relative increase in (i.e., and ) is stronger than the relative decrease in Ni (i.e., and ). However, the is slightly decreased in some regions of the upper tropical troposphere because the relative decrease in Ni is remarkable (50 %) in these regions. The δqidep which indicates the change in qi caused by the deposition/sublimation process is mainly determined by the and in-cloud ice supersaturation (Si) (Morrison and Gettelman, 2008). Except for a very small region, the annual zonal mean is positive. This is consistent with the deposition events being much more frequent than sublimation events (not shown). When Si>0, ice supersaturation (i.e., Si>0) towards ice saturation (i.e., Si=0) occurs because the water vapor is consumed by δqidep (Korolev and Mazin, 2003; Krämer et al., 2009). The is lower (< 3 %) in the upper tropical troposphere due to the high (> s−1). Both the ΔMu2 and ΔMu5 experiments show that Si is increased in the upper tropical troposphere due to the decreasing , and Si is decreased in the other regions due to the increasing . It is noteworthy that the and in the mixed-phase cloud layers are obviously weaker than those in the pure ice cloud layers (i.e., above the −37∘ isotherm). This is consistent with the fact that the Si is relatively stable in mixed-phase clouds because liquid droplets are often present. The is generally decreased with the altitude because the saturated vapor pressure significantly decreases with decreasing air temperature. The comparison between δqidep and qi suggests that δqidep is an important source of qi. The and are greater than 0.1 µg L−1 in most mixed-phase cloud layers due to the strongly increasing and relatively stable Si values. This suggests that the increasing μi could lead to a higher equilibrium state of qi in the mixed-phase cloud layers via the deposition process. The and are negative between 200 and 300 hPa, mainly because the and are negative, and the and are relatively small. The and are positive above 100 hPa, mainly because the and are positive. These results indicate that the impact of μi on δqidep becomes complex above the −37∘ isotherm, where Si is more susceptible to and δqidep. Meanwhile, the impact of μi on δqidep also becomes weak above the −37∘ isotherm because the feedback processes (i.e., the interaction between Si and δqidep) become important. In short, the μi-induced changes in the deposition/sublimation process (i.e., and δqidep) can be largely explained by the changes in Ni and . One reason for the higher qi in the mixed-phase cloud layers from the Mu2 and Mu5 experiments is that δqidep increases with increasing μi.
This paragraph analyzes the interaction between the ice cloud properties (qi, Ni, and ) and the autoconversion process of IC to snow (hereafter “the autoconversion process”) and the influence of μi on this interaction. Both and are decreased with the altitude because the is decreased with the altitude. As expected, the is considerable and much larger than the . It is clear that the autoconversion process is an important sink of qi. However, the autoconversion process is not an important sink of Ni because the is very small. Both the ΔMu2 and ΔMu5 experiments show that the is significantly decreased because the autoconversion process obviously becomes difficult at higher μi values (offline tests, Sect. 3.1). The difficult autoconversion process leads to an equilibrium state with higher qi and larger . Because of the larger , the from the Mu2 and Mu5 experiments is significantly increased. The increasing from the Mu2 and Mu5 experiments might be a main reason for the decrease in Ni in the mixed-phase cloud layers. However, the remarkable decrease in Ni (mostly in the pure ice cloud layers) from the Mu2 and Mu5 experiments is mainly due to the ice nucleation process. In the MG scheme, the newly formed IC number density (excluding the ICs in mixed-phase clouds) is calculated by a physically based ice nucleation parameterization (Liu and Penner, 2005). Because the autoconversion process becomes difficult in the Mu2 and Mu5 experiments, the in-cloud ICs should have longer lifetimes and larger radii. As a result, δNinuc, which denotes the newly formed IC number density from the nucleation process, significantly decreases in the Mu2 and Mu5 experiments (Fig. 2). The main reason is that the preexisting ICs would hinder the subsequent ice nucleation process (especially for homogeneous freezing), owing to the depletion of water vapor via deposition growth (Barahona et al., 2014; Shi et al., 2015). δNinuc is the main source of Ni. Therefore, both the ΔMu2 and ΔMu5 experiments show that Ni is significantly decreased. In short, the increase in μi causes the autoconversion process to be difficult and then leads to a higher equilibrium state of qi and . Meanwhile, Ni is significantly decreased due to the higher equilibrium state of qi and (i.e., the stronger suppression effect of the preexisting ICs on the ice nucleation process).
This paragraph analyzes the interaction between the ice cloud properties and the IC sedimentation process and the influence of μi on this interaction. The sedimentation process is the last cloud microphysical process in the MG scheme. The IC fall velocity is calculated based on the updated cloud properties (i.e., the other cloud microphysical processes at this model time step have been considered). Here, denotes the updated , which includes the changes caused by the deposition/sublimation and autoconversion processes at this model time step. In the mixed-phase cloud layers, the is slightly less than the because the sedimentation process has not occurred. After considering the impacts of μi on the cloud microphysical processes introduced above, the relative increases in from the ΔMu2 and ΔMu5 experiments (i.e., and ) are higher than the relative increase in . As expected, both and decrease with an altitude increase, and the is obviously larger than the . Although the and are positive, the and are negative in most regions because decreases with increasing μi (offline tests, Sect. 3.1). However, both and are positive in some layers over the tropics and subtropics, where the and are relatively higher. Because increases with increasing μi at a fixed value (offline tests, Table 3) and the from the Mu2 and Mu5 experiments are increased, the relative increases in from the ΔMu2 and ΔMu5 experiments are remarkable. The is > 100 % in some regions, and the is > 100 % in most regions. δqised is mainly determined by the gradient of in the vertical direction. Actually, the newly updated qi between the substeps of the sedimentation process is used for calculating δqised. Similarly, δNised is mainly determined by the gradient of in the vertical direction. Furthermore, the ICs that fall into the clear portions of the lower model layer sublimate instantly. Therefore, both and are negative in most regions. This is consistent with sedimentation being a sink of clouds. The δqised from the Mu2 and Mu5 experiments (i.e., and ) decreases (negative, stronger sink) in most regions, mainly because of the increasing and higher qi. The δNised from the Mu2 and Mu5 experiments (i.e., and ) increases (positive, weaker sink) in a few layers over the tropics. This is mainly due to the changes in the vertical gradient of Ni. Both the ΔMu2 and ΔMu5 experiments show that the changes in δqised and δNised are generally weaker than the changes in δqidep, δqiatuo (i.e., ), and δNinuc. In short, the fall velocities (i.e., and ) and their impacts on ice clouds (i.e., δqised and δNised) are mainly determined by the cloud properties (i.e., qi, Ni, , and ). Although the sedimentation process is also a main factor that determines the cloud properties, the changes in the sedimentation process that are caused by the increasing μi are not as strong as those in the deposition/sublimation, autoconversion, and nucleation processes.
Based on the analyses presented above, it can be concluded that increasing μi would lead to a climate equilibrium state with higher qi and lower Ni in most regions. The changes in the statistical mean radii (i.e., , , and ) and ice-phase cloud microphysical processes (i.e., δqidep, , , δNinuc, δqised, and δNised) are mainly determined by the higher qi, lower Ni, and increasing μi. On the other hand, the higher qi and lower Ni can largely be explained by the changes in the ice-phase cloud microphysical processes (i.e., δqidep, , and δNinuc) that are caused by the increasing μi. Furthermore, the ΔMu2 and ΔMu5 experiments show very similar spatial patterns for the μi-induced changes. This suggests that the impact of μi on the simulated climate equilibrium state is stable.
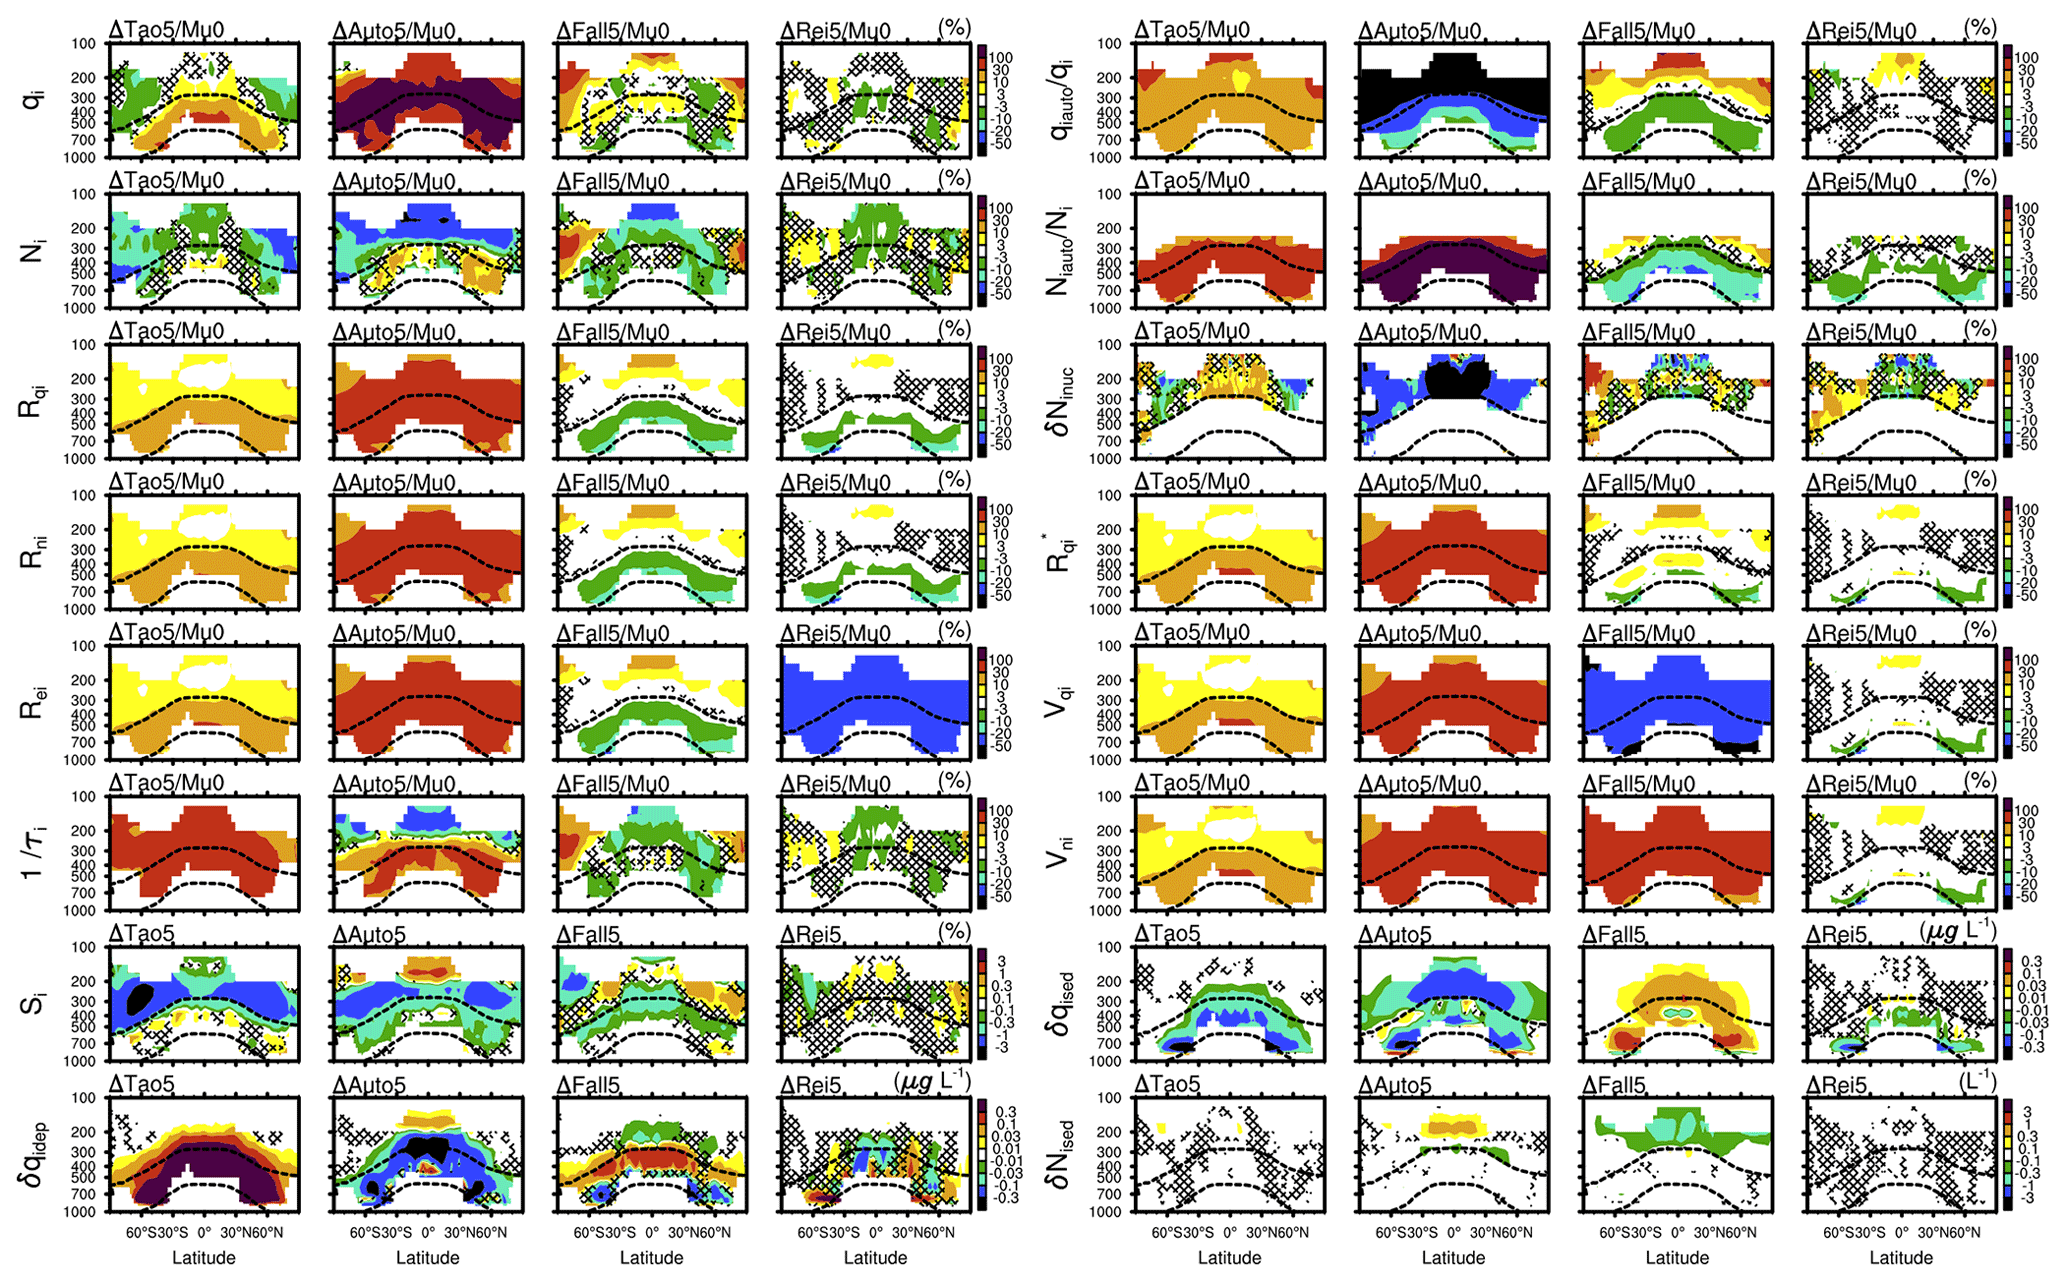
Figure 3Similar to Fig. 2 but for the ΔTao5, ΔAuto5, ΔFall5, and ΔRei5 experiments. Except for the , all statistical mean radii are calculated with μi=0.
Figure 3 shows the changes in the simulated climate equilibrium states that are caused by each individual μi-related process. The from the Tao5 experiment is significantly increased (). Similar to the ΔMu2 and ΔMu5 experiments, this increasing could lead to a higher equilibrium state of qi in the mixed-phase cloud layers () via the deposition/sublimation process (). However, this increasing leads to lower qi and lower Ni in most of the pure ice cloud layers. The main reason might be that the ICs grow faster and their lifetimes become shorter (Mitchell, 1991; DeMott et al., 2010; Storelvmo et al., 2013). The from the Auto5 experiment is significantly decreased (). This could lead to a higher qi in nearly all regions () and a lower Ni in the pure ice cloud layers (). The mechanism is the same as that introduced based on the ΔMu2 and ΔMu5 experiments. It is noteworthy that the Ni from the Auto5 experiment is slightly increased in some mixed-phase cloud layers. The main reason might be that the accretion of Ni by snow is significantly decreased in the mixed-phase cloud layers (not shown) due to the difficult autoconversion process. The from the Fall5 experiment is significantly decreased (), and the sink term of qi due to sedimentation becomes weaker (i.e., positive ) in most regions. Unlike the , the from the Fall5 experiment obviously increases (), and the sink term of Ni due to sedimentation becomes stronger (i.e., negative ) in the pure ice cloud layers. These might be the main reasons for the increase in qi and the decrease in Ni in the pure ice cloud layers over the tropics ( and ). It is interesting to note that the , , and from the Fall5 experiment all increase in pure ice cloud layers (i.e., upper layers) and decrease in mixed-phase cloud layers (i.e., lower layers). This can be explained by the μi-induced weaker size-sorting mechanism (Sect. 3.1). The from the Rei5 experiment () is significantly decreased. Because the change of does not directly affect the cloud microphysical processes, the changes in cloud properties from the ΔRei5 experiment are not statistically significant in most regions. Taken overall, the above analyses clarify the mechanism of μi's impacts. Increasing μi in autoconversion impacts pure ice clouds the most (i.e., significantly increased qi and significantly decreased Ni in the pure ice cloud layers). Furthermore, increasing μi in autoconversion also leads to a much higher qi in the mixed-phase cloud layers. Increasing μi in deposition/sublimation can also lead to a higher qi in the mixed-phase cloud layers. Increasing μi in sedimentation can lead to a higher IC radius in the upper layers and lower IC radius in the lower layers. The impacts from sedimentation and deposition/sublimation are obviously weaker than those from autoconversion. The changes caused by increasing μi in the radiative process (i.e., ) are relatively chaotic.
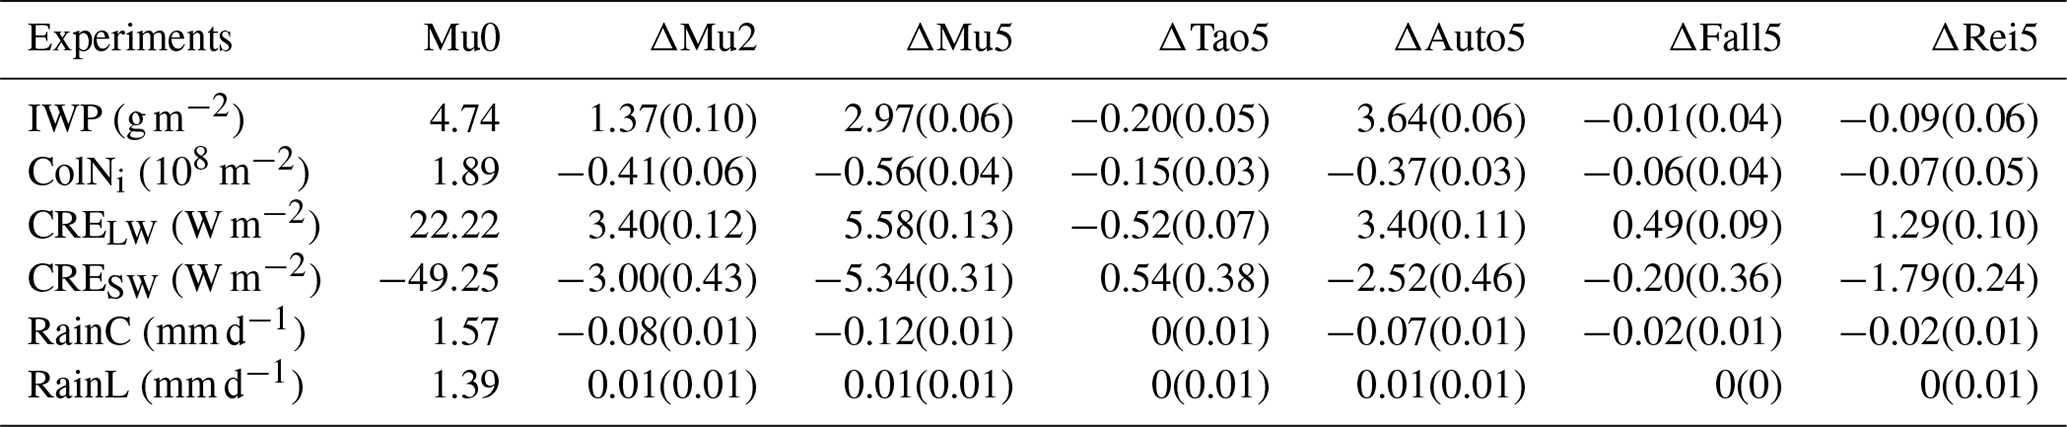
The above analyses focus on cloud properties and cloud microphysical processes (i.e., in-cloud variables). This paragraph discusses the impacts of μi on radiation and precipitation. The annual zonal mean distributions of the ice water path (IWP), column Ni (ColNi), longwave (CRELW) and shortwave (CRESW) cloud radiative effects, and convective (RainC) and large-scale (RainL) precipitation rates are shown in Fig. 4, and the corresponding global annual mean values are listed in Table 4. The comparison of the Mu0, Mu2, and Mu5 experiments shows that the zonal mean IWPs over all latitudes clearly increase with increasing μi. This is consistent with the changes in in-cloud qi (Fig. 2). The comparison of the ΔMu5, ΔTao5, ΔAuto5, ΔFall5, and ΔRei5 experiments shows that the μi-induced increases in IWP are mainly provided by the autoconversion process. Compared to the Mu0 experiment, the ColNi from the Mu2 and Mu5 experiments obviously decreases over tropical regions. It is clear that the autoconversion process is also the main contributor to the decreases in ColNi (Fig. 4, right column). Compared to the Mu0 experiment, both CRELW and CRESW from the Mu2 and Mu5 experiments are obviously enhanced, mainly because of the increasing IWPs. It is clear that the enhancements of CRELW and CRESW are also mainly contributed to by the autoconversion process (Fig. 4). Both the CRELW and CRESW from the Rei5 experiment are also obviously enhanced in terms of their zonal mean values (Fig. 4) and global mean values (Table 4, CRE.29 W m−2 and CRE1.79 W m−2). This suggests that the impact of μi on could lead to considerable changes in the Earth's radiation budget. Compared to the impacts of μi on radiation, the impact on large-scale precipitation (i.e., RainL) is not statistically significant (Fig. 4, left column). However, the convective precipitation from the ΔMu5 experiment (i.e., RainCΔMu5) is significantly reduced over the tropics and subtropics (Fig. 4, right column). The reason is that the increase in ice clouds (i.e., qi) increases atmospheric stability via the radiative budget and then leads to weaker convective precipitation (Andrews et al., 2010; Wang et al., 2014). Overall, the impacts of μi on radiation and precipitation are considerable. The global mean CRE, CRE, and RainCΔMu5 are 5.58 W m−2, −5.34 W m−2, and −0.12 mm d−1, respectively. These changes are mainly contributed to by the autoconversion process. Furthermore, the comparisons between the ΔMu2 and ΔMu5 experiments (Fig. 4 and Table 4) show that, in most cases, the μi-induced changes are enhanced with increasing Δμi. This suggests that, in terms of the zonal mean and global mean values, the impacts of μi are relatively stable.
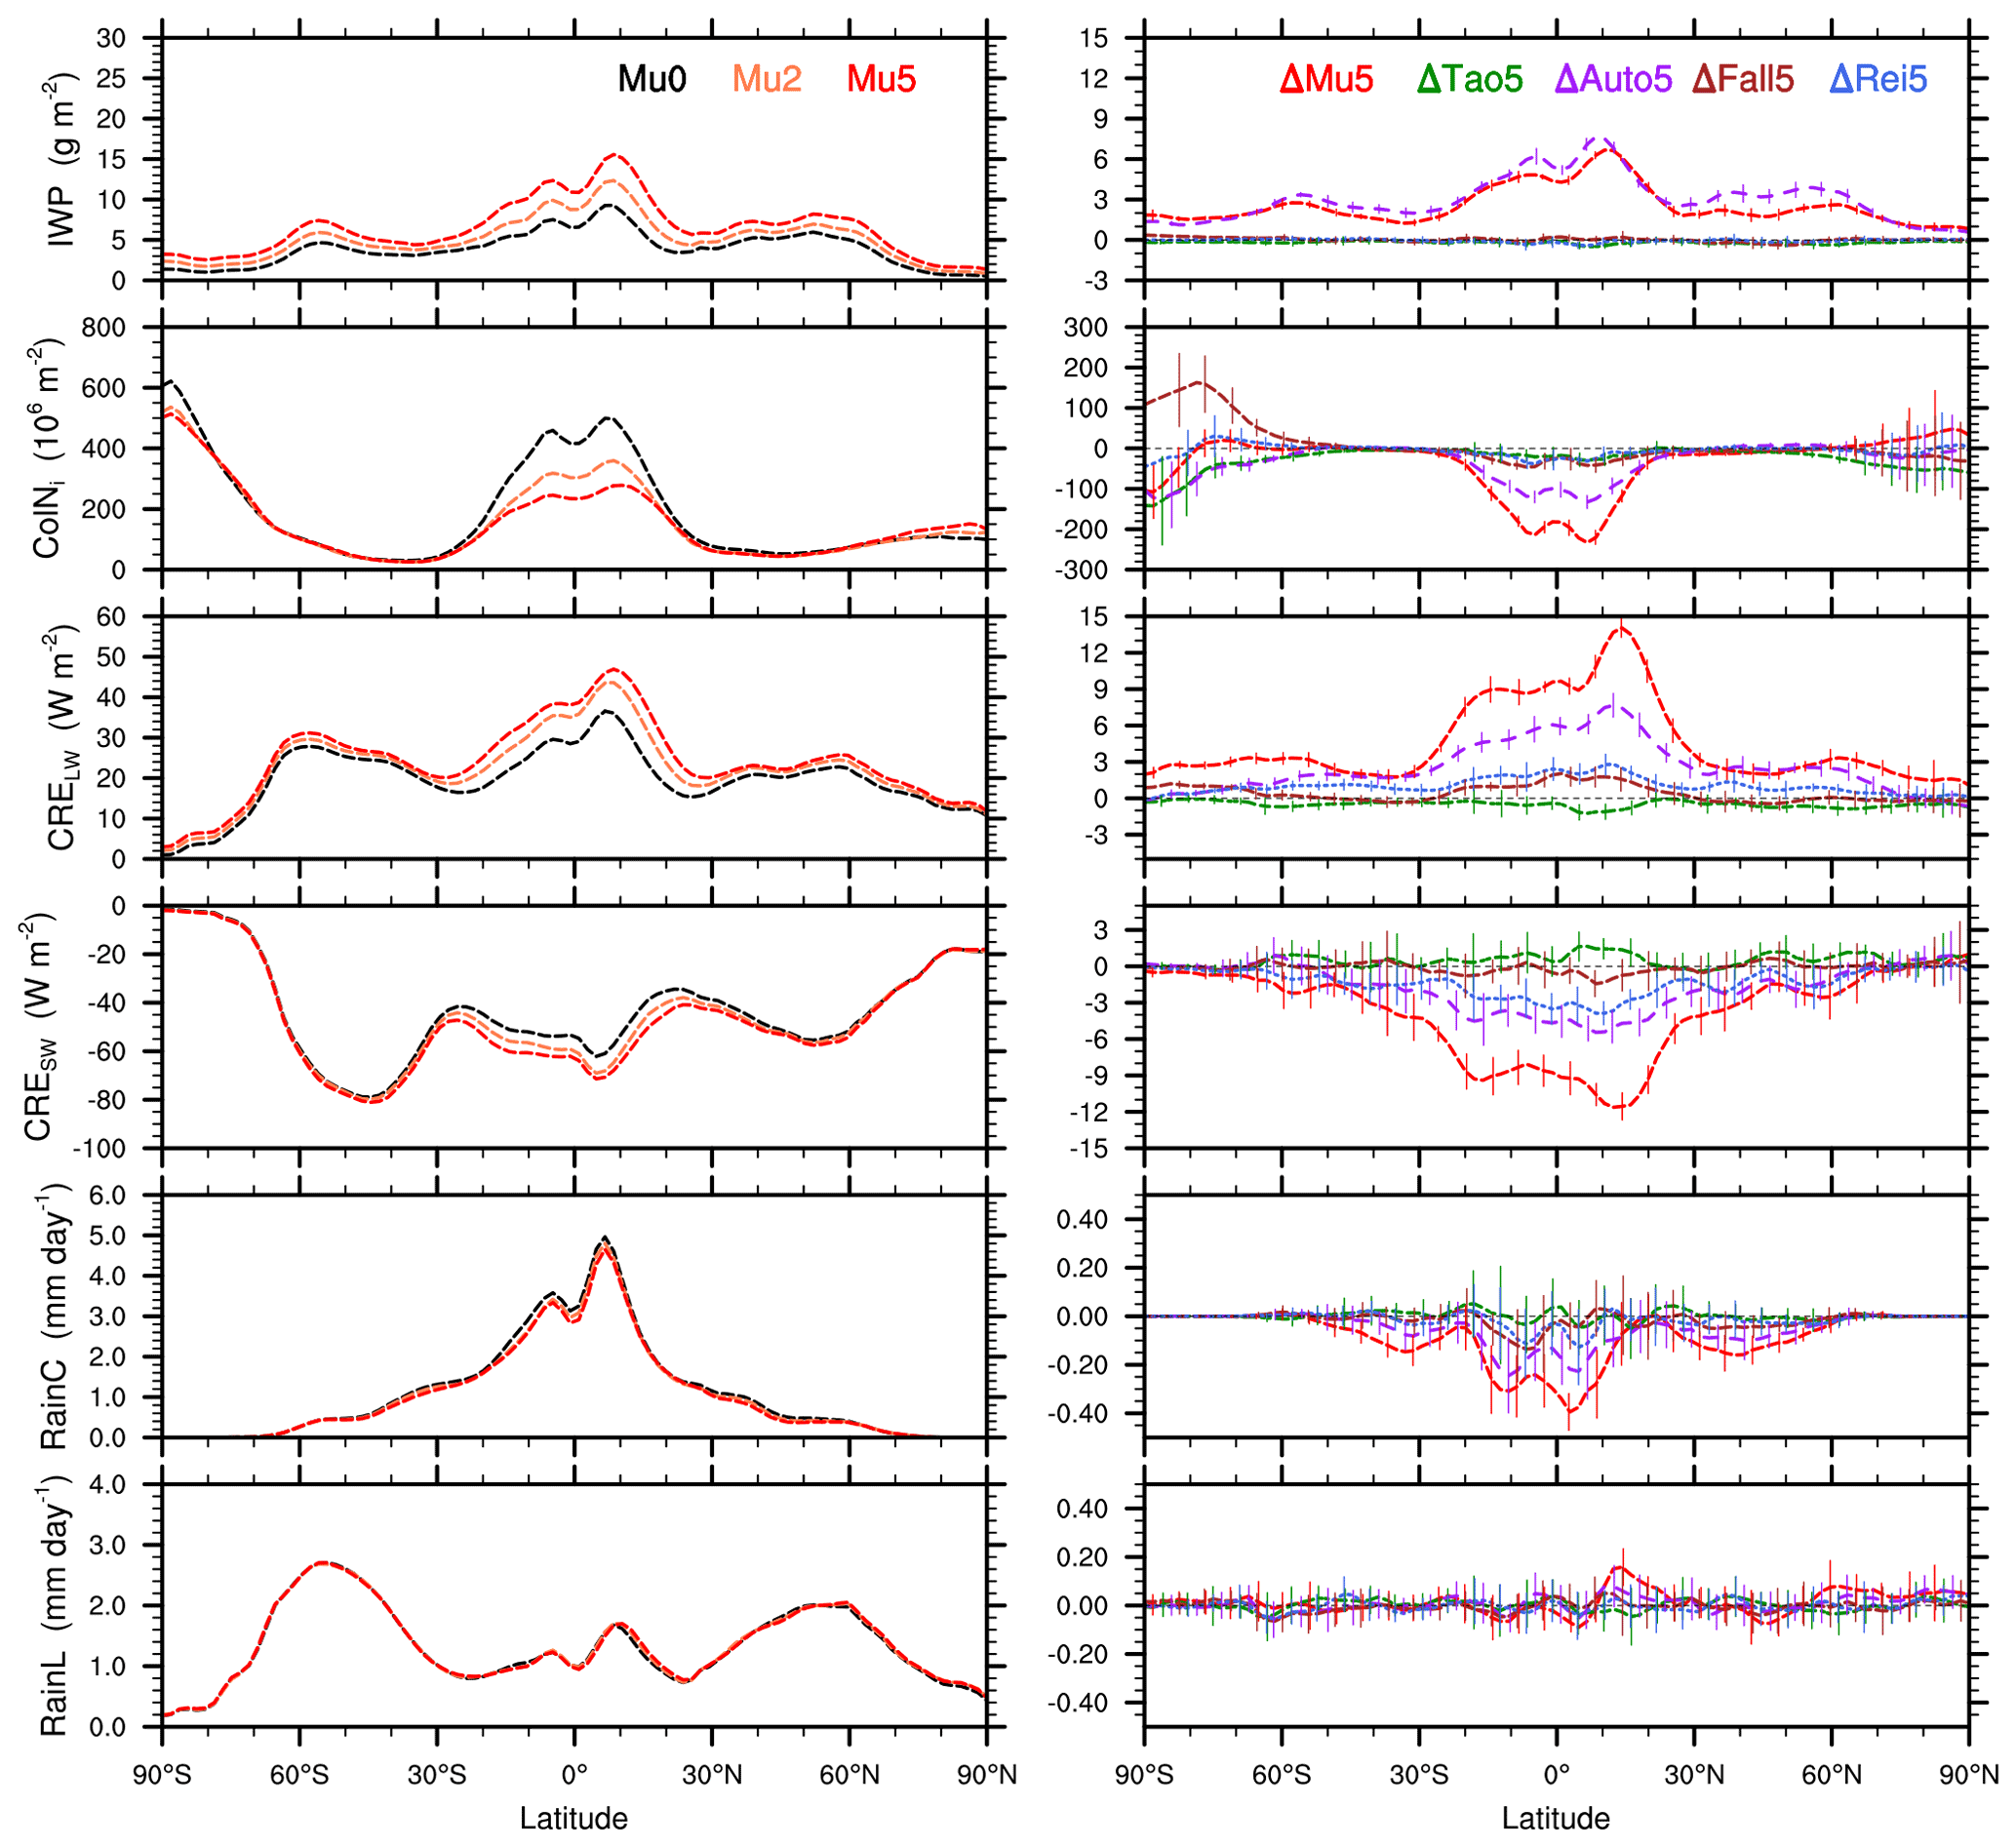
Figure 4Annual zonal mean distributions of the ice water path (IWP), column Ni (ColNi), longwave and shortwave cloud radiative effects (CRELW and CRESW), and convective and large-scale precipitation rates (RainC and RainL). In the right panel (i.e., Δ), the vertical bars overlying these lines indicate the ranges of 2 standard deviations from the difference of each of 10 years at different latitudes.
Table 4The global annual mean variables are shown in Fig. 4. The corresponding standard deviations calculated from the difference of each year for 10 years are shown in brackets.
This paper investigates the impacts of μi on climate simulations with the CAM6 model. To achieve this, the two-moment bulk cloud microphysics scheme used in CAM6 was modified to consider the μi's impacts by a tunable parameter. After that, the impacts of μi on the IC size distribution and μi-related cloud microphysical processes are illustrated first by calculation equations and offline tests, and the impacts of μi on the climate simulations are then analyzed with the CAM6 model.
The impacts of μi on the IC size distribution and various statistical mean radii are clearly explained by the calculation equations. can be calculated from qi and Ni, and the normalized IC size distribution (i.e., the relative contributions from each bin) can be calculated from and μi. The impact of μi on mass-weighted size distribution is obviously different from that on the commonly used number-weighted size distribution (Fig.1). Unlike the number contributions, the mass contributions of the larger size bins significantly decrease with increasing μi because the mass contribution is more sensitive to the IC radius. In the bulk cloud microphysics scheme, the physical processes are calculated based on various statistical mean radii. The ratios of the other statistical mean radii (i.e., , , and ) to are functions of μi. At μi≥0, and are always less than , whereas is always greater than . The differences among these statistical mean radii become small with increasing μi, which is consistent with the narrower size distribution determined by higher μi values.
The impacts of μi on the μi-related cloud microphysical processes are clearly illustrated by the offline tests. Under the same qi and Ni ( is also fixed), the IC deposition/sublimation process is considerably accelerated with increasing μi because the used for calculating deposition/sublimation is increasing with increasing μi. Under the same is much less than the snow radius), the autoconversion of IC to snow obviously becomes difficult with increasing μi because the portion of ICs with radii greater than the threshold (> Rcs) decreases under the narrow size distribution. A major effect of IC sedimentation is size-sorting because is greater than , and μi plays an important role in determining the rate of size-sorting (Milbrandt and Yau, 2005). In this study, the offline tests clearly show that the difference in IC radius between two adjacent model layers caused by sedimentation becomes small with increasing μi because the difference between and becomes small (i.e., the size-sorting rate becomes slow).
The climate simulations show that the impacts of μi on the ice cloud properties are notable, and the main corresponding mechanisms are clear. After increasing μi from 0 to 2 and 5, qi significantly increases, while Ni significantly decreases. The accelerated deposition process contributes to the higher qi in the mixed-phase cloud layers where the ice supersaturation (Si>0) is relatively stable. The difficult autoconversion process leads to longer IC lifetime and higher qi. Meanwhile, Ni significantly decreases because the newly formed IC number density is significantly decreased, owing to the longer IC lifetime and higher qi. The experiments with only one modified μi-related process make the mechanisms of μi's impacts more clear. Autoconversion contributes the most. The μi also has considerable impacts on radiation and precipitation. After increasing μi from 0 to 5, the global mean CRELW is increased (stronger warming effect) by 5.58 W m−2 (25.11 %). Meanwhile, the CRESW is decreased (less cooling effect) by −5.34 W m−2 (10.84 %). The enhancement of the cloud radiative effects is largely provided by the higher equilibrium state of qi. The considerably stronger CRELW could increase the atmospheric stability and then lead to weaker convective precipitation (Andrews et al., 2010; Wang et al., 2014). As expected, after increasing μi from 0 to 5, the global mean RainC is decreased by −0.12 mm d−1 (7.64 %). In short, the impacts of μi on climate simulations are significant. This suggests that the μi (i.e., the PSD of ICs) and μi-related cloud microphysical processes deserve a more realistic representation in climate models, especially for cloud schemes with autoconversion. Fortunately, there have been some studies that can help to address this issue. For example, μi is described by an empirical formula (Eidhammer et al., 2017), μi is predicted in a three-moment cloud scheme (Milbrandt et al., 2021), and single-ice-category cloud schemes could obviate the need for autoconversion process (e.g., Morrison and Milbrandt, 2015; Eidhammer et al., 2017; Zhao et al., 2017).
This study only focuses on the impacts of μi; the default tunable parameters (except for μi) are used in all the simulations. After improving the representation of μi-related processes, further model tuning and analyses are required based on the updated cloud scheme. Therefore, this study does not estimate which value of μi could lead to a better simulation. Finally, it is necessary to point out that the main mechanism for μi's impacts introduced in this study (i.e., autoconversion becomes difficult with increasing μi) is not applicable to climate simulations with the single-ice-category cloud scheme. However, similar to the μi's impact on autoconversion, the interaction between small ICs and large ICs (e.g., the accretion of small ICs by large ICs) should become weaker with increasing μi (i.e., narrower size distribution). Therefore, we can speculate that the impacts of μi on climate simulations with the single-ice-category cloud scheme may still be worth noting.
Here, we show the PSDs represented by gamma functions of the form N0Dμe−λD firstly and then discuss the reason why bulk cloud microphysics schemes usually constrain μ to be nonnegative.
Figure A1 shows that the PSDs are relatively wide with negative μ. Under negative μ, the particle number densities (N′) are increased with decreasing D and become very large at D<1 µm (Fig. A1 left). In the real world, the cloud particles are usually not less than 1 µm. It is necessary to point out that the contribution from small particles (e.g., D<50 µm) is usually neglected for getting the gamma-fitted PSD from observations (Heymsfield, 2003). For instance, when only considering the particles over sizes (D) from as small as 10 µm to as large as 2000 µm (measured particle size), the uncertainty from the extrapolation below 50 µm is negligible in the linear space of particle size (Fig. A1 right). Therefore, some gamma-fitted PSDs from observations might show negative μ values (e.g., Heymsfield, 2003; Heymsfield et al., 2013; Schmitt and Heymsfield, 2009).
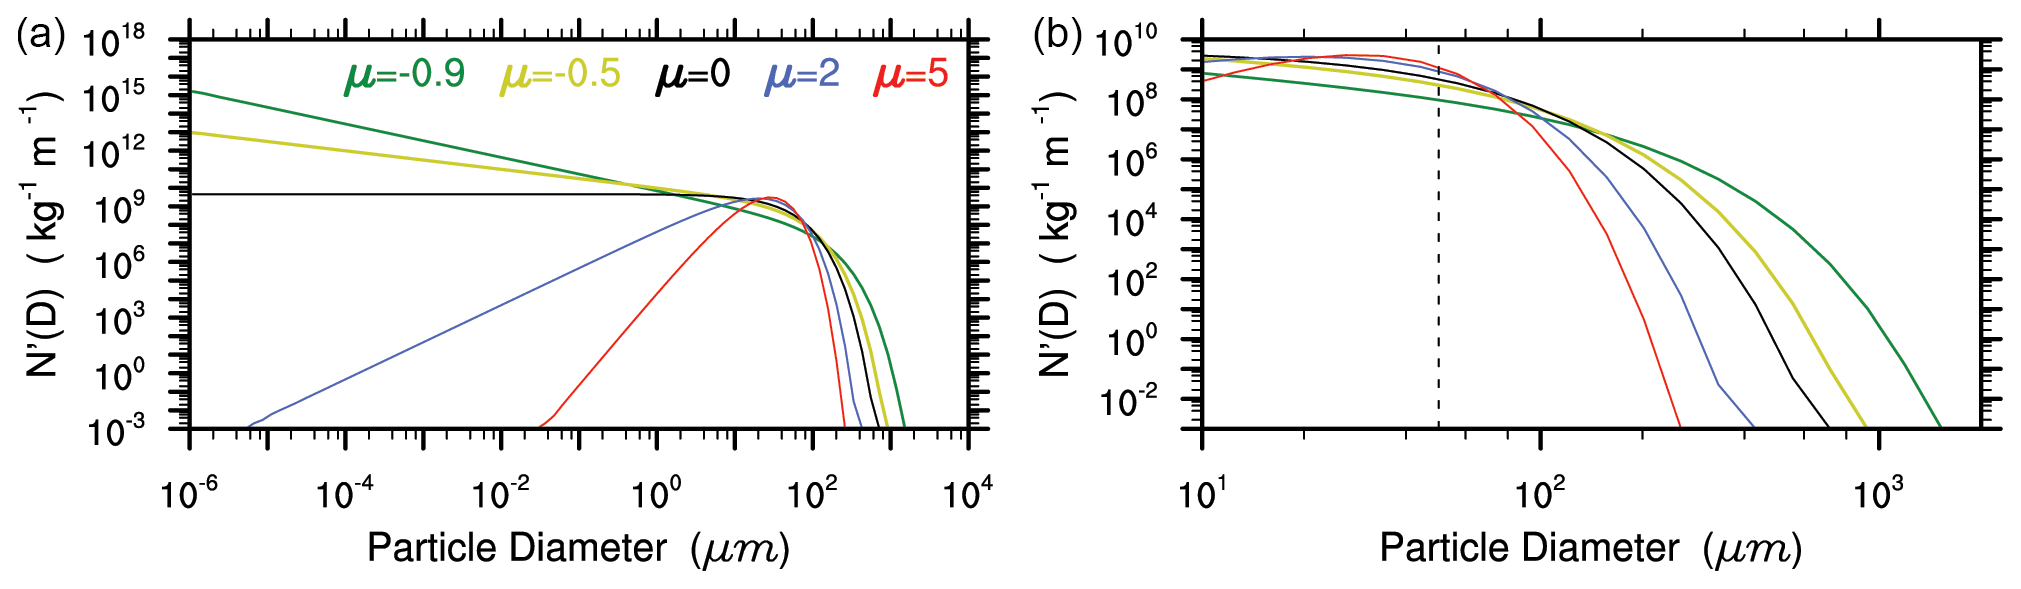
Figure A1The particle number densities (N′, which is a function of D) calculated from the gamma distributions with various μ values. Here, the total particle number and mass-weighted diameter are set to 105 kg−1 (∼50 L−1) and 40 µm, respectively. Note different markers in the y axis and x axis between the left column and right column. The vertical black line indicates D=50 µm.
Unlike the gamma-fitted PSDs from observations (small particles might be neglected), the gamma functions used in bulk cloud microphysics schemes represent the particles with diameter from 0 to ∞ (hereafter “mathematical size range”). For instance, the other two gamma distribution parameters (N0 and λ) used in the bulk cloud scheme are calculated by the particle's mass (q) and number (N) and some gamma functions of μ (, ). Because the gamma function, , is used for deriving these calculation formulas, the q and N in these calculation formulas indicate the mass and number of particles from the mathematical size range (i.e., 0 to ∞). Furthermore, the μ must be greater than −1 in these two calculation formulas because the negative integer and zero are the singularity of the gamma function. Under negative μ (; the N′ is very large at D<1 µm, Fig. A1 left), more attention should be paid to using the gamma function because it integrates from 0 to ∞. Figure A2 shows the relative number contributions from each radius bin of ICs under different . Table A1 lists the contributions of ICs with a radius from 1 to 1000 µm (hereafter “realistic size range”) to the total number (i.e., the Ni from the mathematical size range). At μi≥0 (i.e., μi=0, 2, and 5), the number contributions are mostly from the realistic size range except for one case (μi=0 and µm). Under the small IC scenario (i.e., µm) and 0.5, the number of ICs from the realistic size range only contributes to the total number. At 0.9, the contributions of ICs from the realistic size range cannot reach , even for the large IC scenario (i.e., µm). In other words, under negative μi, the gamma distribution functions (mathematical size range) used in the bulk cloud schemes might be not suited for representing realistic ICs (realistic size range). Therefore, our study only evaluates the impacts of changing μi from 0 to 2 and 5.

Figure A2The relative number contributions from each radius bin of ICs under different . A total of 100 bins were used here. Each bin width is the same based on the logarithm of the particle radius.
Table A1The contributions of ICs from the realistic size range (i.e., 1–1000 µm) to the total number.
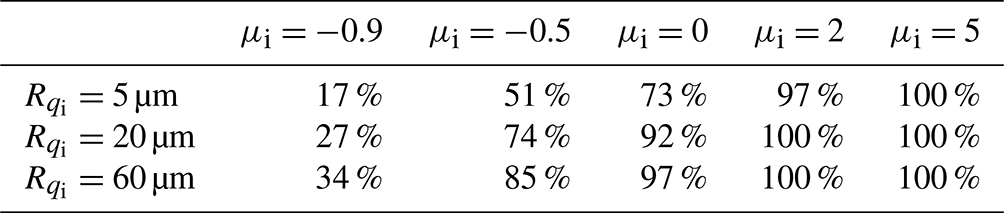
* The PSDs of ICs are represented by gamma functions with a range from 0 to ∞. The contributions given are only approximate because the value of the incomplete gamma function is not very accurate.
The CAM6 model used in this study is the atmospheric component of the Community Earth System Model version 2.1.3 (CESM2.1.3). The CESM2.1.3 is a release version of CESM2. The model code, scripts, and input data are freely available through a public GitHub repository (https://escomp.github.io/CESM/versions/cesm2.1/html/downloading_cesm.html CESM Working Groups of National Center for Atmospheric Research (NCAR), 2022). More details about model workflow can be found in the corresponding quick-start guide. The modified model code, model run control scripts, and simulation results post-processing scripts covering every data processing action for all the model results reported in the paper are available online at https://doi.org/10.5281/zenodo.6409156 (Zhang et al., 2022). The FORTRAN code for offline tests is also archived at the same location. Furthermore, the NCL scripts and data used to make every figure are also available at the above DOI.
XS designed this study. WZ and XS designed the CAM6 model experiments and developed the modified model code. XS and WZ analyzed the results and wrote the original paper. All authors contributed to improving and reviewing the manuscript.
The contact author has declared that none of the authors has any competing interests.
Publisher's note: Copernicus Publications remains neutral with regard to jurisdictional claims in published maps and institutional affiliations.
The authors would like to thank Yuxi Zeng and Jiaojiao Liu for checking the English expressions of an earlier draft of this paper. The model simulation was conducted at the High Performance Computing Center of Nanjing University of Information Science & Technology.
This research has been supported by the National Key Research and Development Program of China (grant no. 2017YFA0604001) and the National Natural Science Foundation of China (grant no. 41775095).
This paper was edited by Simon Unterstrasser and reviewed by two anonymous referees.
Andrews, T., Forster, P. M., Boucher, O., Bellouin, N., and Jones, A.: Precipitation, radiative forcing and global temperature change, Geophys. Res. Lett., 37, L14701, https://doi.org/10.1029/2010GL043991, 2010.
Barahona, D., Molod, A., Bacmeister, J., Nenes, A., Gettelman, A., Morrison, H., Phillips, V., and Eichmann, A.: Development of two-moment cloud microphysics for liquid and ice within the NASA Goddard Earth Observing System Model (GEOS-5), Geosci. Model Dev., 7, 1733–1766, https://doi.org/10.5194/gmd-7-1733-2014, 2014.
Bogenschutz, P. A., Gettelman, A., Morrison, H., Larson, V. E., Craig, C., and Schanen, D. P.: Higher-order turbulence closure and its impact on climate simulations in the Community Atmosphere Model, J. Climate, 26, 9655–9676, https://doi.org/10.1175/jcli-d-13-00075.1, 2013.
Bogenschutz, P. A., Gettelman, A., Hannay, C., Larson, V. E., Neale, R. B., Craig, C., and Chen, C.-C.: The path to CAM6: coupled simulations with CAM5.4 and CAM5.5, Geosci. Model Dev., 11, 235–255, https://doi.org/10.5194/gmd-11-235-2018, 2018.
Bony, S., Stevens, B., Frierson, D. M. W., Jakob, C., Kageyama, M., Pincus, R., Shepherd, T. G., Sherwood, S. C., Siebesma, A. P., Sobel, A. H., Watanabe, M., and Webb, M. J.: Clouds, circulation and climate sensitivity, Nat. Geosci., 8, 261–268, https://doi.org/10.1038/ngeo2398, 2015.
CESM Working Groups of National Center for Atmospheric Research (NCAR): Community Earth System Model, https://escomp.github.io/CESM/versions/cesm2.1/html/downloading_cesm.html, CESM Working Groups of National Center for Atmospheric Research (NCAR) [code], last access: 9 May 2022.
Danabasoglu, G., Lamarque, J.-F., Bacmeister, J., Bailey, D. A., DuVivier, A. K., Edwards, J., Emmons, L. K., Fasullo, J., Garcia, R., Gettelman, A., Hannay, C., Holland, M. M., Large, W. G., Lauritzen, P. H., Lawrence, D. M., Lenaerts, J. T. M., Lindsay, K., Lipscomb, W. H., Mills, M. J., Neale, R., Oleson, K. W., Otto-Bliesner, B., Phillips, A. S., Sacks, W., Tilmes, S., van Kampenhout, L., Vertenstein, M., Bertini, A., Dennis, J., Deser, C., Fischer, C., Fox-Kemper, B., Kay, J. E., Kinnison, D., Kushner, P. J., Larson, V. E., Long, M. C., Mickelson, S., Moore, J. K., Nienhouse, E., Polvani, L., Rasch, P. J., and Strand, W. G.: The community earth system model version 2 (CESM2), J. Adv. Model. Earth Sy., 12, e2019MS001916, https://doi.org/10.1029/2019MS001916, 2020.
DeMott, P. J., Prenni, A. J., Liu, X., Kreidenweis, S. M., Petters, M. D., Twohy, C. H., Richardson, M. S., Eidhammer, T., and Rogers, D. C.: Predicting global atmospheric ice nuclei distributions and their impacts on climate, P. Natl. Acad. Sci. USA, 107, 11217–11222, https://doi.org/10.1073/pnas.0910818107, 2010.
Eidhammer, T., Morrison, H., Bansemer, A., Gettelman, A., and Heymsfield, A. J.: Comparison of ice cloud properties simulated by the Community Atmosphere Model (CAM5) with in-situ observations, Atmos. Chem. Phys., 14, 10103–10118, https://doi.org/10.5194/acp-14-10103-2014, 2014.
Eidhammer, T., Morrison, H., Mitchell, D., Gettelman, A., and Erfani, E.: Improvements in global climate model microphysics using a consistent representation of ice particle properties, J. Climate, 30, 609–629, https://doi.org/10.1175/jcli-d-16-0050.1, 2017.
Erfani, E. and Mitchell, D. L.: Developing and bounding ice particle mass- and area-dimension expressions for use in atmospheric models and remote sensing, Atmos. Chem. Phys., 16, 4379–4400, https://doi.org/10.5194/acp-16-4379-2016, 2016.
Gettelman, A. and Morrison, H.: Advanced two-moment bulk microphysics for global models. Part I: Off-line tests and comparison with other schemes, J. Climate, 28, 1268–1287, https://doi.org/10.1175/jcli-d-14-00102.1, 2015.
Heymsfield, A. J.: Properties of tropical and midlatitude ice cloud particle ensembles. Part II: Applications for mesoscale and climate models, J. Atmos. Sci., 60, 2592–2611, https://doi.org/10.1175/1520-0469(2003)060<2592:Potami>2.0.Co;2, 2003.
Heymsfield, A. J., Schmitt, C., and Bansemer, A.: Ice cloud particle size distributions and pressure-dependent terminal velocities from in situ observations at temperatures from 0 to −86 ∘C, J. Atmos. Sci., 70, 4123–4154, https://doi.org/10.1175/JAS-D-12-0124.1, 2013.
Khain, A. P., Beheng, K. D., Heymsfield, A., Korolev, A., Krichak, S. O., Levin, Z., Pinsky, M., Phillips, V., Prabhakaran, T., Teller, A., van den Heever, S. C., and Yano, J. I.: Representation of microphysical processes in cloud-resolving models: Spectral (bin) microphysics versus bulk parameterization, Rev. Geophys., 53, 247–322, https://doi.org/10.1002/2014rg000468, 2015.
King, A. D., Lane, T. P., Henley, B. J., and Brown, J. R.: Global and regional impacts differ between transient and equilibrium warmer worlds, Nat. Clim. Change, 10, 42–47, https://doi.org/10.1038/s41558-019-0658-7, 2020.
Korolev, A. V. and Mazin, I. P.: Supersaturation of water vapor in clouds, J. Atmos. Sci., 60, 2957–2974, https://doi.org/10.1175/1520-0469(2003)060<2957:Sowvic>2.0.Co;2, 2003.
Krämer, M., Schiller, C., Afchine, A., Bauer, R., Gensch, I., Mangold, A., Schlicht, S., Spelten, N., Sitnikov, N., Borrmann, S., de Reus, M., and Spichtinger, P.: Ice supersaturations and cirrus cloud crystal numbers, Atmos. Chem. Phys., 9, 3505–3522, https://doi.org/10.5194/acp-9-3505-2009, 2009.
Larson, V. E.: CLUBB-SILHS: A parameterization of subgrid variability in the atmosphere, arXiv [preprint], https://doi.org/10.48550/arXiv.1711.03675, 2017.
Li, J.-L. F., Waliser, D. E., Chen, W.-T., Guan, B., Kubar, T. L., Stephens, G. L., Ma, H.-Y., Min, D., Donner, L. J., Seman, C. J., and Horowitz, L. W.: An observationally-based evaluation of cloud ice water in CMIP3 and CMIP5 GCMs and contemporary reanalyses using contemporary satellite data, J. Geophys. Res., 117, D16105, https://doi.org/10.1029/2012JD017640, 2012.
Liou, K.: Influence of cirrus clouds on weather and climate processes: A Global Perspective, Mon. Weather Rev., 114, 1167–1199, https://doi.org/10.1175/1520-0493(1986)114<1167:IOCCOW>2.0.CO;2, 1986.
Liu, X. H. and Penner, J. E.: Ice nucleation parameterization for global models, Meteorol. Z., 14, 499–514, https://doi.org/10.1127/0941-2948/2005/0059, 2005.
Loftus, A. M., Cotton, W. R., and Carrió, G. G.: A triple-moment hail bulk microphysics scheme. Part I: Description and initial evaluation, Atmos. Res., 149, 35–57, https://doi.org/10.1016/j.atmosres.2014.05.013, 2014.
Lohmann, U., Stier, P., Hoose, C., Ferrachat, S., Kloster, S., Roeckner, E., and Zhang, J.: Cloud microphysics and aerosol indirect effects in the global climate model ECHAM5-HAM, Atmos. Chem. Phys., 7, 3425–3446, https://doi.org/10.5194/acp-7-3425-2007, 2007.
Luo, Z. and Rossow, W. B.: Characterizing tropical cirrus life cycle, evolution, and interaction with upper-tropospheric water vapor using Lagrangian trajectory analysis of satellite observations, J. Climate, 17, 4541–4563, https://doi.org/10.1175/3222.1, 2004.
McFarquhar, G. M., Hsieh, T.-L., Freer, M., Mascio, J., and Jewett, B. F.: The characterization of ice hydrometeor gamma size distributions as volumes in N0–λ–μ phase space: Implications for microphysical process modeling, J. Atmos. Sci., 72, 892–909, https://doi.org/10.1175/jas-d-14-0011.1, 2015.
Milbrandt, J. A. and McTaggart-Cowan, R.: Sedimentation-induced errors in bulk microphysics schemes, J. Atmos. Sci., 67, 3931–3948, https://doi.org/10.1175/2010jas3541.1, 2010.
Milbrandt, J. A. and Yau, M. K.: A multimoment bulk microphysics parameterization. Part I: Analysis of the role of the spectral shape parameter, J. Atmos. Sci., 62, 3051–3064, https://doi.org/10.1175/jas3534.1, 2005.
Milbrandt, J. A., Morrison, H., Dawson II, D. T., and Paukert, M.: A triple-moment representation of ice in the Predicted Particle Properties (P3) microphysics scheme, J. Atmos. Sci., 78, 439–458, https://doi.org/10.1175/jas-d-20-0084.1, 2021.
Mitchell, D. L.: Evolution of Snow-Size Spectra in Cyclonic Storms. Part II: Deviations from the Exponential Form, J. Atmos. Sci., 48, 1885–1899, https://doi.org/10.1175/1520-0469(1991)048<1885:EOSSSI>2.0.CO;2, 1991.
Mitchell, D. L., Rasch, P., Ivanova, D., McFarquhar, G., and Nousiainen, T.: Impact of small ice crystal assumptions on ice sedimentation rates in cirrus clouds and GCM simulations, Geophys. Res. Lett., 35, L09806, https://doi.org/10.1029/2008gl033552, 2008.
Morrison, H. and Gettelman, A.: A new two-moment bulk stratiform cloud microphysics scheme in the community atmosphere model, version 3 (CAM3), Part I: Description and numerical tests, J. Climate, 21, 3642–3659, https://doi.org/10.1175/2008jcli2105.1, 2008.
Morrison, H. and Milbrandt, J. A.: Parameterization of cloud microphysics based on the prediction of bulk ice particle properties. Part I: Scheme description and idealized tests, J. Atmos. Sci., 72, 287–311, https://doi.org/10.1175/jas-d-14-0065.1, 2015.
Morrison, H., Curry, J. A., and Khvorostyanov, V. I.: A new double-moment microphysics parameterization for application in cloud and climate models. Part I: Description, J. Atmos. Sci., 62, 1665–1677, https://doi.org/10.1175/jas3446.1, 2005.
Morrison, H., van Lier-Walqui, M., Fridlind, A. M., Grabowski, W. W., Harrington, J. Y., Hoose, C., Korolev, A., Kumjian, M. R., Milbrandt, J. A., Pawlowska, H., Posselt, D. J., Prat, O. P., Reimel, K. J., Shima, S.-I., van Diedenhoven, B., and Xue, L.: Confronting the challenge of modeling cloud and precipitation microphysics, J. Adv. Model. Earth Sy., 12, e2019MS001689, https://doi.org/10.1029/2019MS001689, 2020.
Paukert, M., Fan, J., Rasch, P. J., Morrison, H., Milbrandt, J. A., Shpund, J., and Khain, A.: Three-moment representation of rain in a bulk microphysics model, J. Adv. Model. Earth Sy., 11, 257–277, https://doi.org/10.1029/2018MS001512, 2019.
Proske, U., Ferrachat, S., Neubauer, D., Staab, M., and Lohmann, U.: Assessing the potential for simplification in global climate model cloud microphysics, Atmos. Chem. Phys., 22, 4737–4762, https://doi.org/10.5194/acp-22-4737-2022, 2022.
Salzmann, M., Ming, Y., Golaz, J.-C., Ginoux, P. A., Morrison, H., Gettelman, A., Krämer, M., and Donner, L. J.: Two-moment bulk stratiform cloud microphysics in the GFDL AM3 GCM: description, evaluation, and sensitivity tests, Atmos. Chem. Phys., 10, 8037–8064, https://doi.org/10.5194/acp-10-8037-2010, 2010.
Schmitt, C. G. and Heymsfield, A. J.: The size distribution and mass-weighted terminal velocity of low-latitude tropopause cirrus crystal populations, J. Atmos. Sci., 66, 2013–2028, https://doi.org/10.1175/2009JAS3004.1, 2009.
Schumann, U., Mayer, B., Gierens, K., Unterstrasser, S., Jessberger, P., Petzold, A., Voigt, C., and Gayet, J.-F.: Effective radius of ice particles in cirrus and contrails, J. Atmos. Sci., 68, 300–321, https://doi.org/10.1175/2010jas3562.1, 2011.
Sherwood, S. C., Bony, S., Boucher, O., Bretherton, C., Forster, P. M., Gregory, J. M., and Stevens, B.: Adjustments in the forcing-feedback framework for understanding climate change, B. Am. Meteorol. Soc., 96, 217–228, https://doi.org/10.1175/bams-d-13-00167.1, 2015.
Shi, X., Liu, X., and Zhang, K.: Effects of pre-existing ice crystals on cirrus clouds and comparison between different ice nucleation parameterizations with the Community Atmosphere Model (CAM5), Atmos. Chem. Phys., 15, 1503–1520, https://doi.org/10.5194/acp-15-1503-2015, 2015.
Spichtinger, P. and Gierens, K. M.: Modelling of cirrus clouds – Part 1a: Model description and validation, Atmos. Chem. Phys., 9, 685–706, https://doi.org/10.5194/acp-9-685-2009, 2009.
Storelvmo, T., Kristjansson, J. E., Muri, H., Pfeffer, M., Barahona, D., and Nenes, A.: Cirrus cloud seeding has potential to cool climate, Geophys. Res. Lett., 40, 178–182, https://doi.org/10.1029/2012GL054201, 2013.
Wang, M. and Penner, J. E.: Cirrus clouds in a global climate model with a statistical cirrus cloud scheme, Atmos. Chem. Phys., 10, 5449–5474, https://doi.org/10.5194/acp-10-5449-2010, 2010.
Wang, M., Liu, X., Zhang, K., and Comstock, J. M.: Aerosol effects on cirrus through ice nucleation in the Community Atmosphere Model CAM5 with a statistical cirrus scheme, J. Adv. Model. Earth Sy., 6, 756–776, https://doi.org/10.1002/2014MS000339, 2014.
Wyser, K.: The effective radius in ice clouds, J. Climate, 11, 1793–1802, https://doi.org/10.1175/1520-0442(1998)011<1793:Teriic>2.0.Co;2, 1998.
Zhang, G. J. and McFarlane, N. A.: Sensitivity of climate simulations to the parameterization of cumulus convection in the Canadian climate centre general circulation model, Atmos.-Ocean, 33, 407–446, https://doi.org/10.1080/07055900.1995.9649539, 1995.
Zhang, G. J., Kiehl, J. T., and Rasch, P. J.: Response of climate simulation to a new convective parameterization in the National Center for Atmospheric Research Community Climate Model (CCM3), J. Climate, 11, 2097–2115, https://doi.org/10.1175/1520-0442(1998)011<2097:Rocsta>2.0.Co;2, 1998.
Zhang, W., Shi, X., and Lu, C.: Model code, data, and plot scripts for the paper “Impacts of Ice-Particle Size Distribution Shape Parameter on Climate Simulations with the Community Atmosphere Model Version 6 (CAM6)”, Zenodo [data set and code], https://doi.org/10.5281/zenodo.6409156, 2022.
Zhao, X., Lin, Y., Peng, Y., Wang, B., Morrison, H., and Gettelman, A.: A single ice approach using varying ice particle properties in global climate model microphysics, J. Adv. Model. Earth Sy., 9, 2138–2157, https://doi.org/10.1002/2017MS000952, 2017.
Zhou, C., Zelinka, M. D., and Klein, S. A.: Impact of decadal cloud variations on the Earth's energy budget, Nat. Geosci., 9, 871–874, https://doi.org/10.1038/ngeo2828, 2016.
- Abstract
- Introduction
- Model and experiments
- Results and analysis
- Summary and conclusions
- Appendix A: The limitation in the use of gamma functions for representing ice-phase PSDs in bulk cloud microphysics schemes
- Code and data availability
- Author contributions
- Competing interests
- Disclaimer
- Acknowledgements
- Financial support
- Review statement
- References