the Creative Commons Attribution 4.0 License.
the Creative Commons Attribution 4.0 License.
 | 09 Sep 2022
FORCCHN V2.0: an individual-based model for predicting multiscale forest carbon dynamics
Jing Fang
Herman H. Shugart
Yunkun Song
Fucheng Lv
Process-based ecological models are essential tools to quantify and predict forest growth and carbon cycles under the background of climate change. The accurate description of phenology and tree growth processes enables an improved understanding and predictive modeling of forest dynamics. An individual tree-based carbon model, FORCCHN2 (Forest Ecosystem Carbon Budget Model for China version 2.0), used non-structural carbohydrate (NSC) pools to couple tree growth and phenology. This model performed well in reducing uncertainty when predicting forest carbon fluxes. Here, we describe the framework in detail and provide the source code of FORCCHN2. We also present a dynamic-link library (DLL) package containing the latest version of FORCCHN2. This package has the advantage of using Fortran as an interface to make the model run fast on a daily step, and the package also allows users to call it with their preferred computer tools (e.g., MATLAB, R, Python). FORCCHN2 can be used directly to predict spring and autumn phenological dates, daily carbon fluxes (including photosynthesis, aboveground and belowground autotrophic respiration, and soil heterotrophic respiration), and biomass on plot, regional, and hemispheric scales. As case studies, we provide an example of FORCCHN2 running model validations in 78 forest sites and an example model application for the carbon dynamics of Northern Hemisphere forests. We demonstrate that FORCCHN2 can produce a reasonable agreement with flux observations. Given the potential importance of the application of this ecological model in many studies, there is substantial scope for using FORCCHN2 in fields as diverse as forest ecology, climate change, and carbon estimations.
- Article
(3864 KB) - Full-text XML
-
Supplement
(39978 KB) - BibTeX
- EndNote


Forests contribute an enormous carbon flux to terrestrial ecosystems (Pan et al., 2011; Keenan and Williams, 2018). Thus, accurate estimation and prediction of forest dynamics both play an important role in understanding the carbon cycle in the background of global change (Beer et al., 2010; Harris et al., 2021). Over the past few decades, process-based ecological models have often been considered effective tools for evaluating forest dynamics at multiple scales (Friedlingstein et al., 2020).
Even though ecological models are widely used in the prediction of forest dynamics, large uncertainties remain (Huntzinger et al., 2012; Friedlingstein et al., 2020). Some of these uncertainties can be attributed to the lack of effective phenological parameterization in the models and the neglect of autumn phenology modeling (Raczka et al., 2013), both of which need to be based on an improved understanding and coupling of mechanisms regulating forest phenology (Piao et al., 2019). Furthermore, the previous models assumed that the reserve carbon of trees acts merely as a carbon buffer pool between sink and source (Schiestl-Aalto et al., 2015). Recent studies considered the stored carbon as non-structural carbohydrates (NSCs), which may have an active role in tree growth and carbon dynamics (Martínez-Vilalta et al., 2016; Piper, 2020). For example, trees rely on NSCs to resume growth after the non-growing season (Furze et al., 2019). The individual tree-based model, FORCCHN (Forest Ecosystem Carbon Budget Model for China) version 2.0 (FORCCHN2), has been developed to treat these considerations by integrating two NSC pools (NSC active pool and NSC slow pool) and optimizing phenological parameters (Fang et al., 2020a; Fang et al., 2021). FORCCHN2 has improved performance for predicting forest carbon sinks compared to other models in North American forests (Fang et al., 2020b).
This model provides temporal predictions of individual tree growth processes, as well as spatially explicit estimations of carbon dynamics on biomass, photosynthesis, autotrophic respiration, and heterotrophic respiration (Fang et al., 2020b). The latest version can capture forest carbon dynamics, but current runs of FORCCHN2 have limitations that prevent a seamless integration of the model into a data-oriented software environment (e.g., MATLAB, R, Python). FORCCHN2 and its previous versions were originally designed for the daily calculation of individual trees in a given plot and implemented in Fortran (Ma et al., 2017; Zhao et al., 2019; Fang et al., 2020a). Fortran ensures calculation efficiency and shortens the model runtime, but the model code and the implementation are not designed for the end users with appropriate help and instruction files. Moreover, until now FORCCHN2 has only been validated and applied in North America, and there has been no comprehensive publication describing the model itself and no hemispheric-scale validation using this model.
Here, we present a dynamic-link library (DLL) package aimed to provide a flexible and user-friendly interface for implementing the newest version of FORCCHN2. Meanwhile, we provide the source code and a detailed description of this model and demonstrate that FORCCHN2 can predict realistic and stable carbon dynamics in hemispheric-scale forests. With the package, users can conveniently run model predictions on individual, plot, regional, continental, and hemispheric scales according to their computer tools. This package is compiled by Fortran 95 and thus can keep the high calculation efficiency. We also demonstrate the functionality of FORCCHN2 with a usage example, perform a model validation at carbon flux sites, apply the model on a hemispheric scale (i.e., the Northern Hemisphere), and provide an open-access dataset of carbon outputs across the Northern Hemisphere.
FORCCHN2, an individual tree-based carbon dynamic model, predicts the daily processes of NSC, photosynthesis, growth, phenophase, vegetation (autotrophic) respiration, and soil dynamics in forests (Fig. 1 and Methods S1–S2). This model is driven by daily climate data and uses the leaf area index (LAI) to initialize the vegetation information (i.e., tree number, diameter at breast height (DBH), height, and biomass) over a fixed area (Method S3).
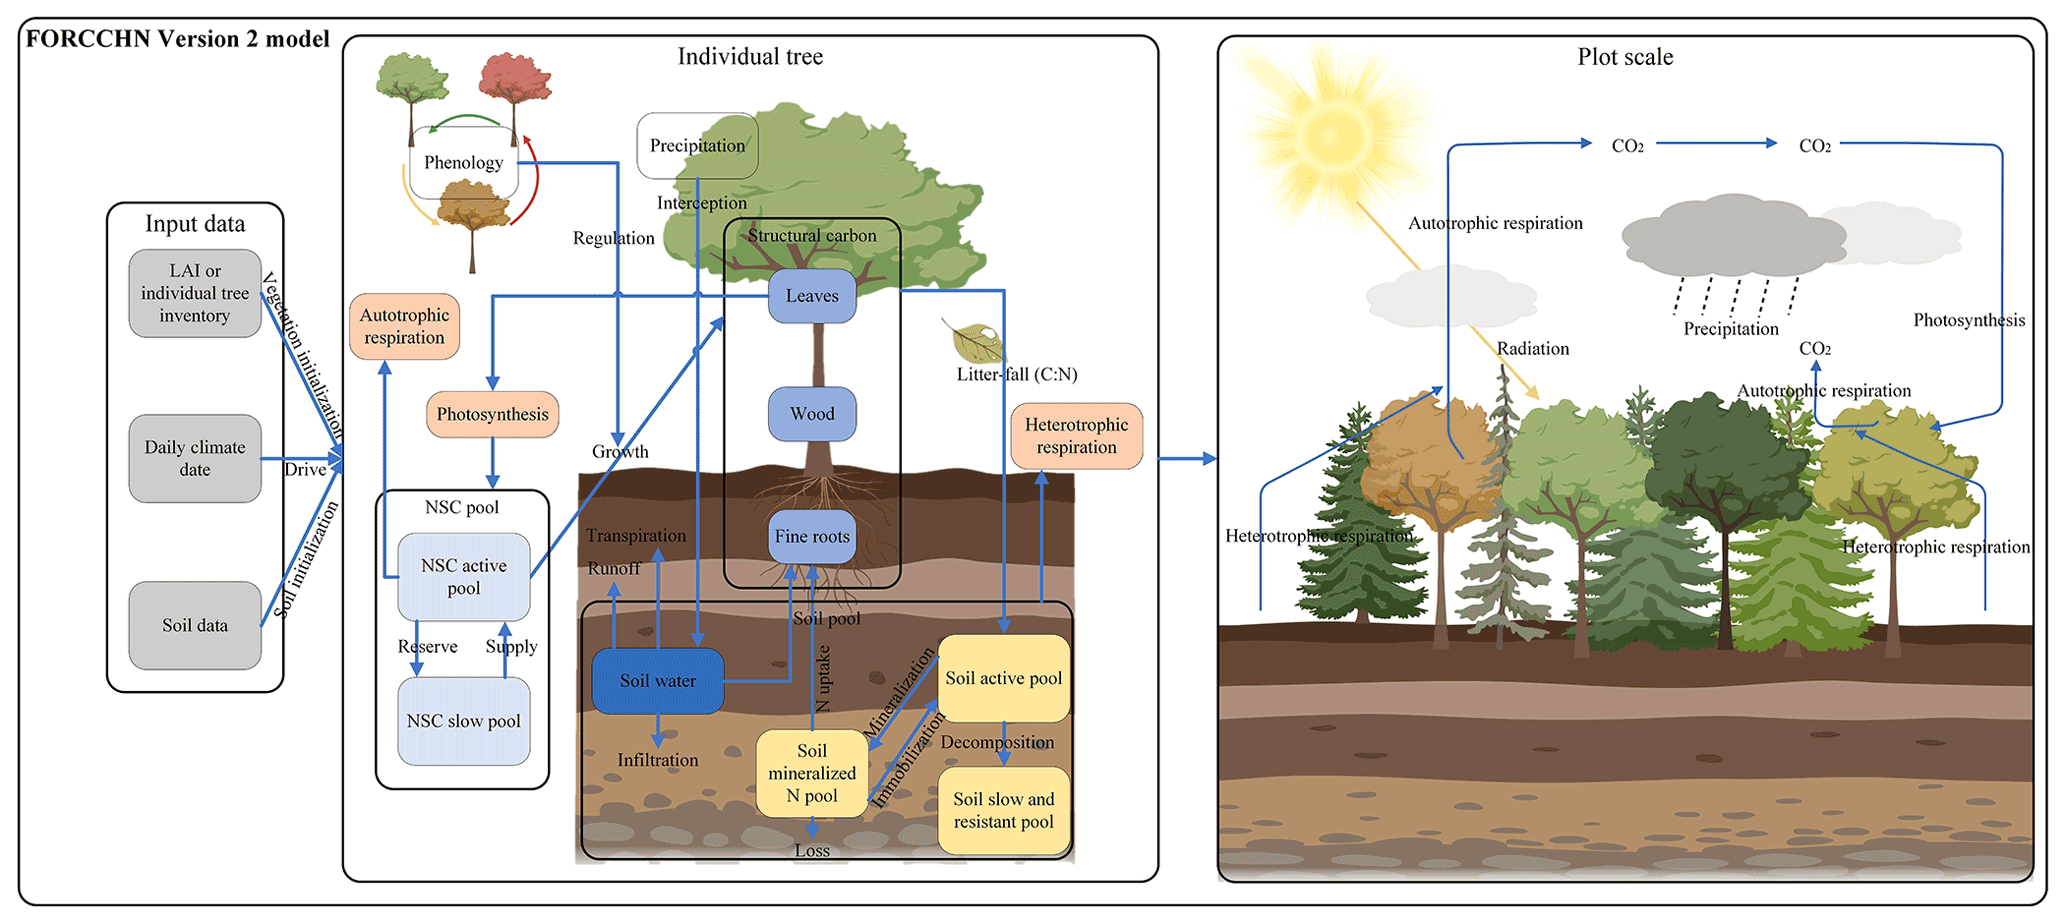
Figure 1Schematic representation of FORCCHN2. LAI is leaf area index, NSC is non-structural carbohydrates, C is carbon, and N is nitrogen.
For an individual tree, the NSC produced by photosynthesis is considered the substrate supply for vital activities, such as participating in autotrophic respiration and forming structural carbon pools (i.e., leaves, wood, and fine roots) through growth (Sala et al., 2012; Richardson et al., 2013). The NSC production is limited by external environmental factors (e.g., water, temperature, CO2), and the NSC consumption for the growth of each structural carbon pool (i.e., leaves, wood, and fine roots) is regulated by phenology factors and daily climate (Schiestl-Aalto et al., 2015; Delpierre et al., 2019). The phenophase of spring and autumn in FORCCHN2 is controlled by heat and chilling requirements, respectively (Fang et al., 2022b). The spring phenophase is decided by the effective temperature with the thermal time model (Eqs. 39–40), and the autumn phenophase is decided by the effective temperature and photoperiod with the cold degree-day model (Eqs. 41–42). The model divides NSC into an active NSC pool and a slow NSC pool. The active pool provides the essential NSC consumption for daily activities; the slow pool is an NSC storage pool providing the necessary NSC for requirements when the contemporaneous active pool is insufficient, such as maintaining vegetation respiration during the non-growing and early growing seasons. These NSC pools allow trees to be dead if the NSC storage drops below zero.
Dynamic changes of NSC production, allocation and consumption drive change in the NSC active pool (NSCactive, kg C) at a daily time step. The NSC slow pool (NSCslow, kg C) is defined as the NSC storage pool. The changes in the daily active pool and yearly slow pool are
where t is the day of the year, y is the yth year, j is each part of the tree (i.e., leaf, fine roots, and wood), GPP is gross primary productivity (kg C), R is the maintenance respiration (kg C), RG is the growth respiration (kg C), G is the carbon demand of growth (kg C), and NSCactive,y is the size of NSC active pool at the end of yth year (kg C). The NSC active pool is initialized to zero on the first day of the next year. The calculation of GPP, maintenance respiration, growth respiration, and growth processes can be found in Methods S1 and S2.
For the relationship between an individual tree and its neighbors, the model uses a distance-independent gap model to describe the light competition. To simplify the physiological and ecological parameters, each individual tree is assumed to belong to a plant functional type (PFT) instead of specific tree species (Table S2). The PFT of one tree is decided by tree species when using the inventory data or is estimated by forest types and random functions when using the satellite data. The phenological parameters are parameterized by the local climate and observed phenological time in the first year (Eqs. S43–S45). A part of structural carbon pools is then transferred into the soil pools by litterfall. The main soil processes in FORCCHN2 are soil organic matter (SOM) decomposition, N mineralization, and water dynamics. According to these attributes, soil pools include aboveground and belowground metabolic and structural pools; fine and coarse woody litter pools; and active, slow, and resistant SOM pools (Table S4). In addition to these pools, the soil nitrogen pool also includes the inorganic nitrogen pool.
After each time step, the predicted vegetation and soil statements are converted into output variables such as biomass and carbon fluxes. The carbon fluxes on the plot scale include GPP (kg C m−2), net primary productivity (NPP, kg C m−2), and net ecosystem productivity (NEP, kg C m−2). The NPP of a given plot at the daily step is determined by the GPP, R (kg C m−2), and RG (kg C m−2). The NEP of a given plot at the daily step is determined by the GPP, R, RG, and soil respiration (RS, kg C m−2):
where n is the nth tree of the plot.
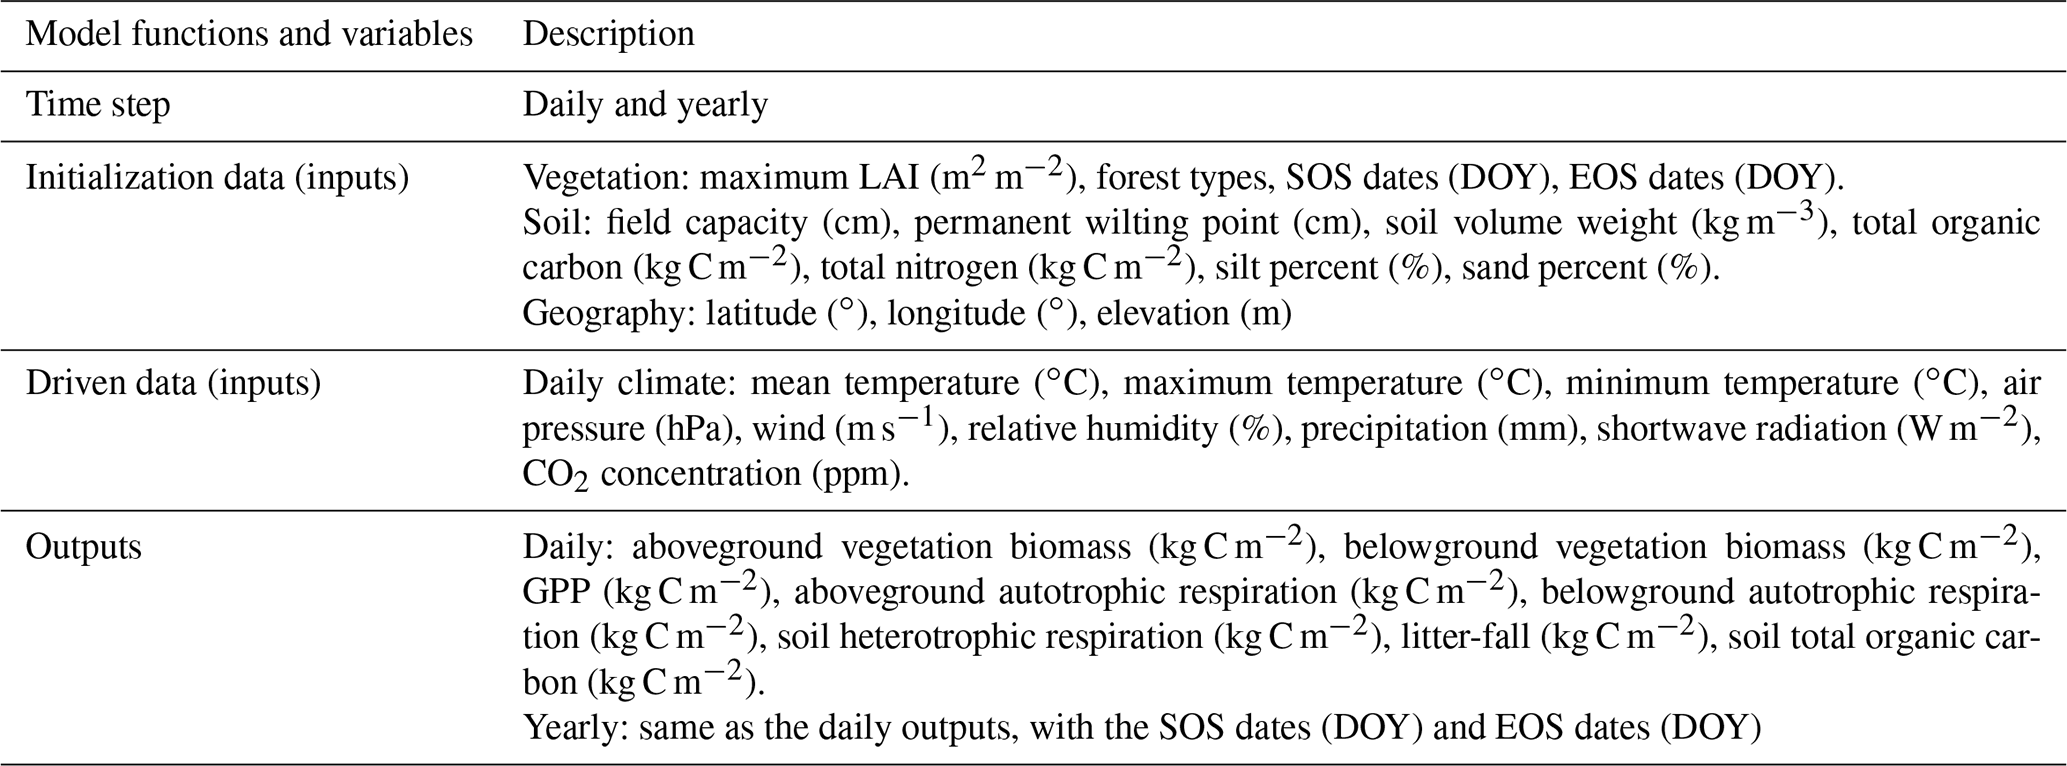
A more detailed description, including inputs, outputs, calculation processes, and parameter sets of FORCCHN2, can be found in Table 1, Methods S1–S3, and Tables S2–S5.
Table 1Description of functions and variables in FORCCHN2. A detailed explanation of functions and variables can be found in the FORCCHN2 DLL package documentation. SOS is the start time of leaf growth, EOS is the end time of leaf growth, DOY is the day of the year, and GPP is gross primary productivity.
Here, we provide an integrated DLL package (“FORCCHN2.dll”) to simplify the usage of FORCCHN2. This file is highly flexible and allows users to adapt model runs to their own computer language (e.g., MATLAB, R, Fortran, Python). Except for the model inputs, using only one command can call the calculation of the model. We provide users with 32 and 64 bit DLL packages to choose the most suitable version.
We take the Harvard Forest (a deciduous broadleaf forest in the eastern United States) and use MATLAB as an example run to demonstrate the functionality of FORCCHN2 (the code of this example can also be accessed via https://github.com/JingF1/FORCCHN2_ model.git, last access: 14 March 2022). First, we install and load the following package.
-
>>name1=('XXX');%load path of the FORCCHN2 DLL package
-
>>name2=[name1,'FORCCHN2_64.dll'];%input 64-bit or 32-bit DLL file
-
>>name3=[name1,'FORCCHN2.h']; %input header file
-
>>loadlibrary(name2,name3);%load the DLL package
Following this, we input the data of Harvard Forest during 1991–2012. The inputs include the year information, the initialization data (i.e., geography, vegetation, and soil data), and the driven data (i.e., climate data). The more detailed information and format of these input data can be found in the example code (“FORCCHN2_run_example.m”).
After inputting all data, we predict the dynamics of this forest for a period of 22 years. We can choose four output results of FORCCHN2.
-
>>[fj,yxc,dayout,yearout] = calllib('FORCCHN2_64','forcchn2',fj,yxc,dayout,yearout,ntrees,ny0,ny,ndays,lat,lon,ele,tmax,tmin,tmean,pho,prec,ra,rh,wind,sfc,pwp,vw,sc0,sn0,silt,sand,class1,evergr0,deci0,lai0,co2);% run model with DLL file
-
>>unloadlibrary FORCCHN2; %unload the DLL package
Here, the four outputs are as follows: “fj” is the phenology dates, which include the start time of leaf growth (SOS) and the end time of leaf growth (EOS); “yxc” is the allocation parameter of each soil pool, which can be used as input instead of the initial soil allocation parameters; “dayout” is the daily carbon dynamics, which includes aboveground and belowground biomass, gross primary productivity (GPP), aboveground and belowground respiration, soil heterotrophic respiration, litterfall biomass, and soil carbon; and “yearout” is the yearly carbon dynamics.
The comparison between model simulations and external observations is considered a rigorous model test (Houlahan et al., 2017). Among the various observation methods, the eddy covariance (EC) technique can provide high-frequency and accurate measurements of relevant data (Keenan and Williams, 2018). The FLUXNET2015 dataset (Pastorello et al., 2020; https://fluxnet.org/, last access: March 2012) from the EC tower is an ideal dataset to validate FORCCHN2 in predicting carbon flux dynamics. This dataset is developed by using the EC technique to measure the net ecosystem CO2 exchange (NEE, which is equal to the negative of NEP) directly in the footprint of the EC tower. The variable USTAR threshold (VUT) mean values of FLUXNET2015 are used in this work. We extracted the flux data from the mean value of the nighttime and the daytime methods. The nighttime method uses nighttime NEE data to parameterize a respiration–temperature model that is then applied to the whole dataset to estimate ecosystem respiration (ER). The vegetation GPP is then calculated as the difference between ER and NEE (Lasslop et al., 2010). The daytime method uses daytime and nighttime NEE data to parameterize a model with one component based on a light response curve and vapor pressure deficit for GPP and a second component using a respiration–temperature relationship similar to the nighttime method (Pastorello et al., 2020). Due to the different phenological phasing in the Northern Hemisphere and Southern Hemisphere, our predictions focus on the Northern Hemisphere. We chose the 78 active forest sites with continuous daily observations in the Northern Hemisphere (i.e., a total of 232 664 observations). These sites cover the most forest types, including the evergreen broadleaf forest (EBF), evergreen needleleaf forest (ENF), deciduous broadleaf forest (DBF), and mixed forest (MF). The distribution of the sites (and other information) is shown in Fig. S1 and Table S1. We also extract the climate data from the FLUXNET2015 dataset to drive the model. Soil data are taken from the Harmonized World Soil Database (HWSD) V1.2 (https://www.fao.org/soils-portal/data-hub/soil-maps-and-databases/harmonized-world-soil-database-v12/en/, last access: 13 January 2022.).
We predict the daily carbon flux at the 78 forest sites and then validate the predictions with the observations. As the overall performance, Fig. 2 shows the direct daily comparison between predictions and observations. Overall, the model had the best performance in capturing GPP dynamics, followed by ER and NEP (i.e., the predicted GPP has the highest R). In FORCCHN2, we use the phenology model and the optimized phenological parameters to predict the leaf growth, which could improve the predicted performance of GPP (Fang et al., 2020b). We did the statistics for the results at all sites. The validation statistics include the correlation coefficient (R), model efficiency (E, calculated by Eq. S60), root-mean-square error (RMSE), mean absolute error (MAE), and bias (calculated by Eq. S61). The calculation of each statistic can be found in Method S4. Each site had one group of statistics. Figure 3 shows that FORCCHN2 could reproduce the daily dynamics of the carbon flux in all sites, particularly for predicting daily GPP (median of all sites: R=0.86, E=0.62, RMSE = 2.29 g C m−2 d−1, MAE = 1.61 g C m−2 d−1). The predicted ER performs worse than GPP (i.e., the median of R and E from the predicted ER is less than GPP) but shows a high correlation with the observed ER (median: R=0.83, E=0.25, RMSE = 1.46 g C m−2 d−1, MAE = 1.04 g C m−2 d−1). NEP results had the lowest performance for all flux variables (median: R=0.61, , RMSE = 1.91 g C m−2 d−1, MAE = 1.43 g C m−2 d−1). The highest uncertainty in predicting NEP may be because of the compounding effect of GPP and ER errors (Balzarolo et al., 2014). In terms of bias, FORCCHN2 overestimates the GPP and ER (median bias of 0.49 and 0.56 g C m−2 d−1, respectively) but slightly underestimates the NEP (median bias of −0.14 g C m−2 d−1). For the different forest types, the predictions present well in DBF and MF (R=0.84 and 0.57, E=0.53 and 0.64, respectively), whereas the lowest performance is found in EBF (R=0.61, E=0.31). These results are consistent with the previous studies: EBF reveals subtle changes in the leaf phenology and thus increases the difficulty of modeling photosynthesis (i.e., GPP) (Raczka et al., 2013; Yuan et al., 2014; Piao et al., 2019).
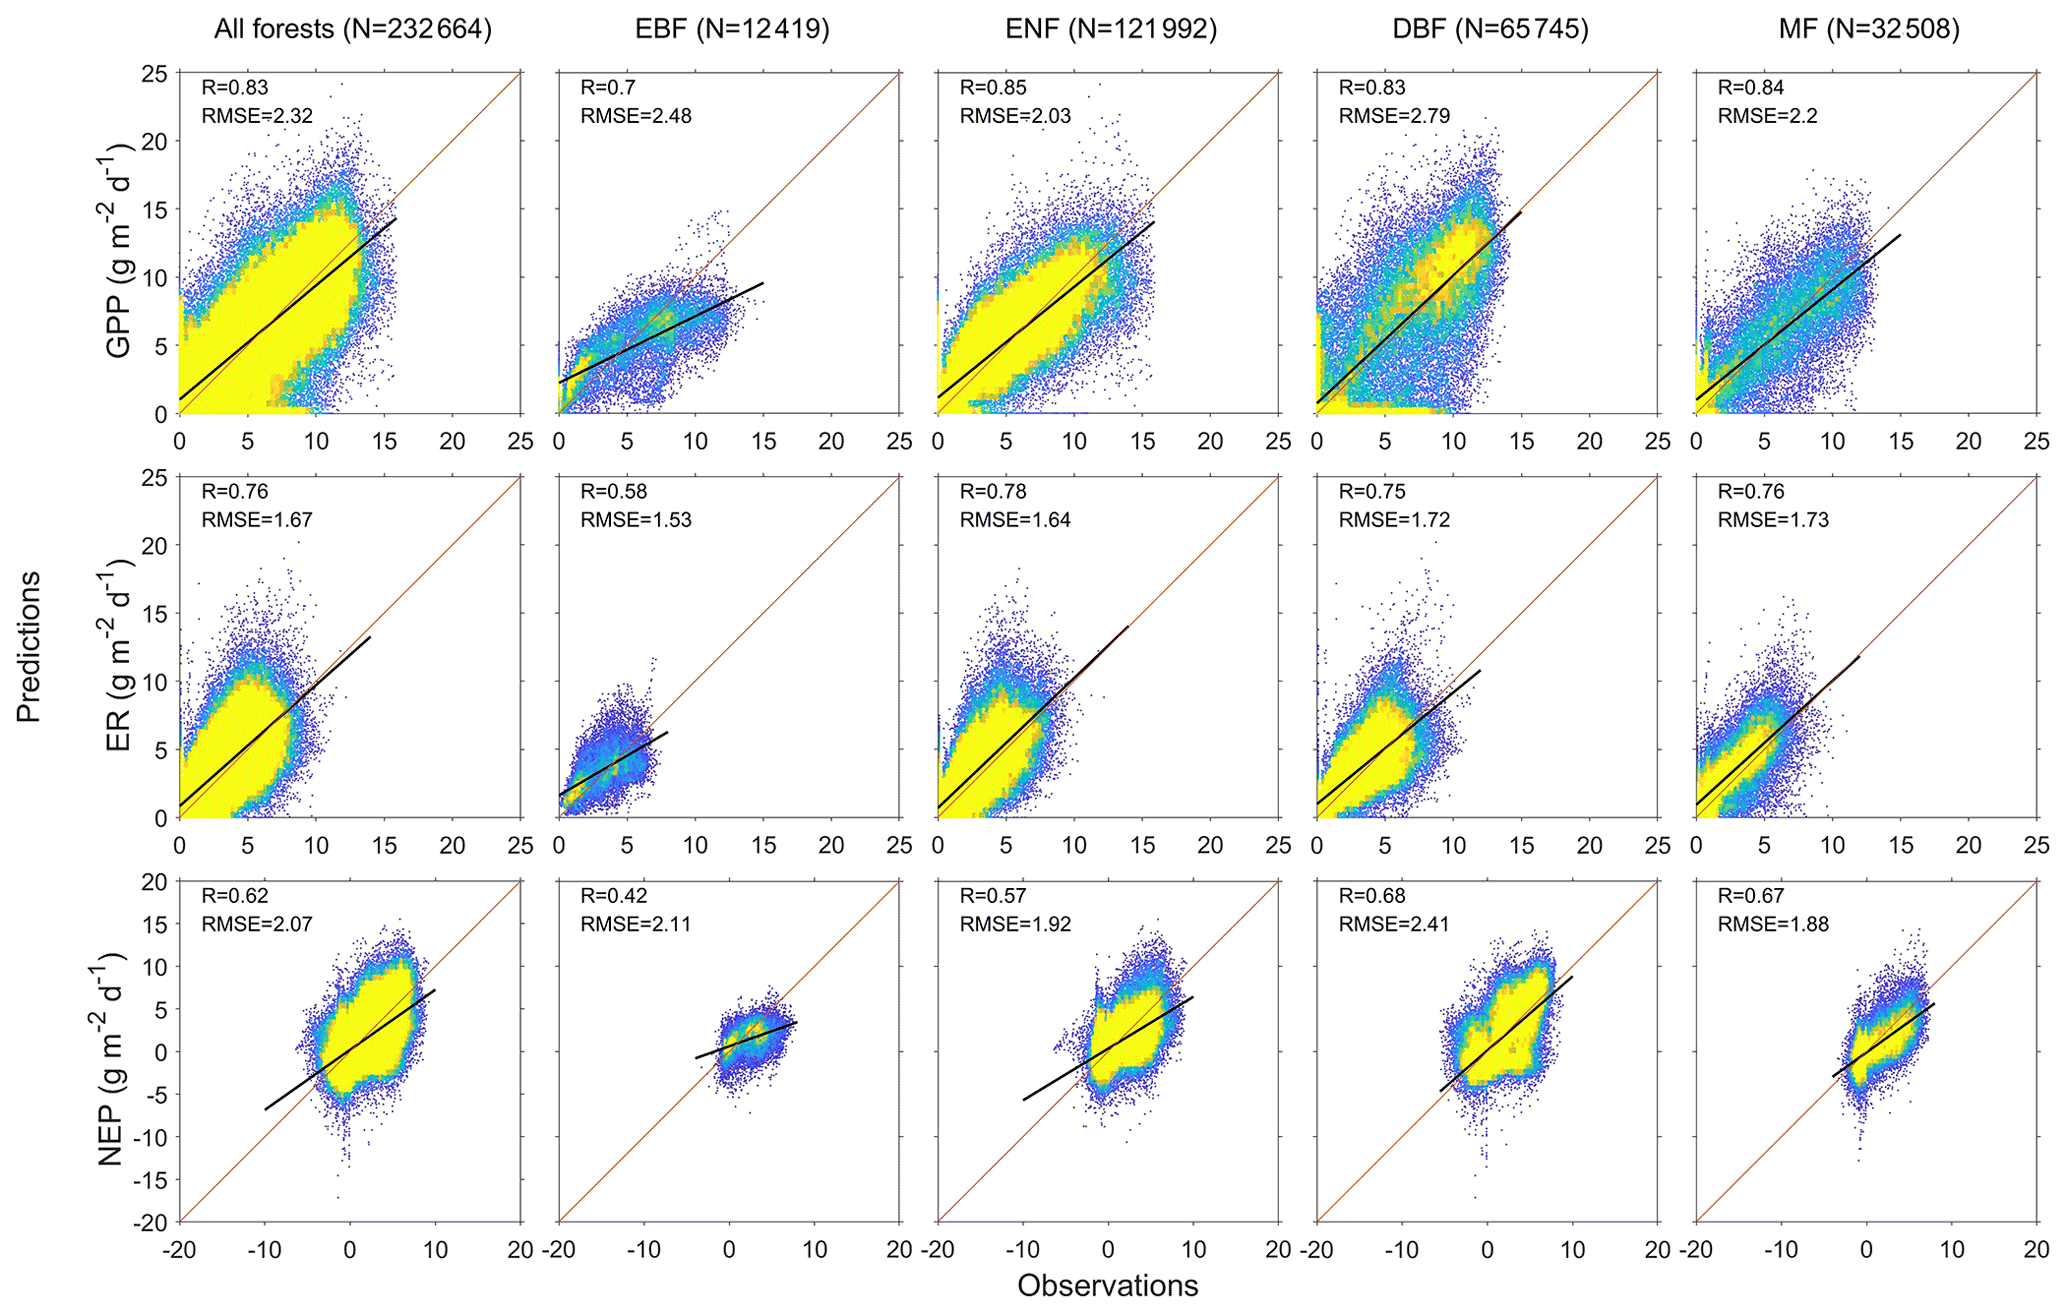
Figure 2Heat plots showing the relationship between predictions and observations of daily gross primary productivity (GPP), ecosystem respiration (ER), and net ecosystem productivity (NEP) of the studied EC sites. N is the total days of all sites, R is the correlation coefficient, and RMSE is the root-mean-square error (g C m−2 d−1). EBF is evergreen broadleaf forest, ENF is evergreen needleleaf forest, DBF is deciduous broadleaf forest, and MF is mixed forest. Diagonal lines are 1:1 lines, indicating perfect agreement between predicted and observed fluxes. Black lines represent the linear regression. Colors indicate the percentage of pixels in each bin area (yellow is the densest).
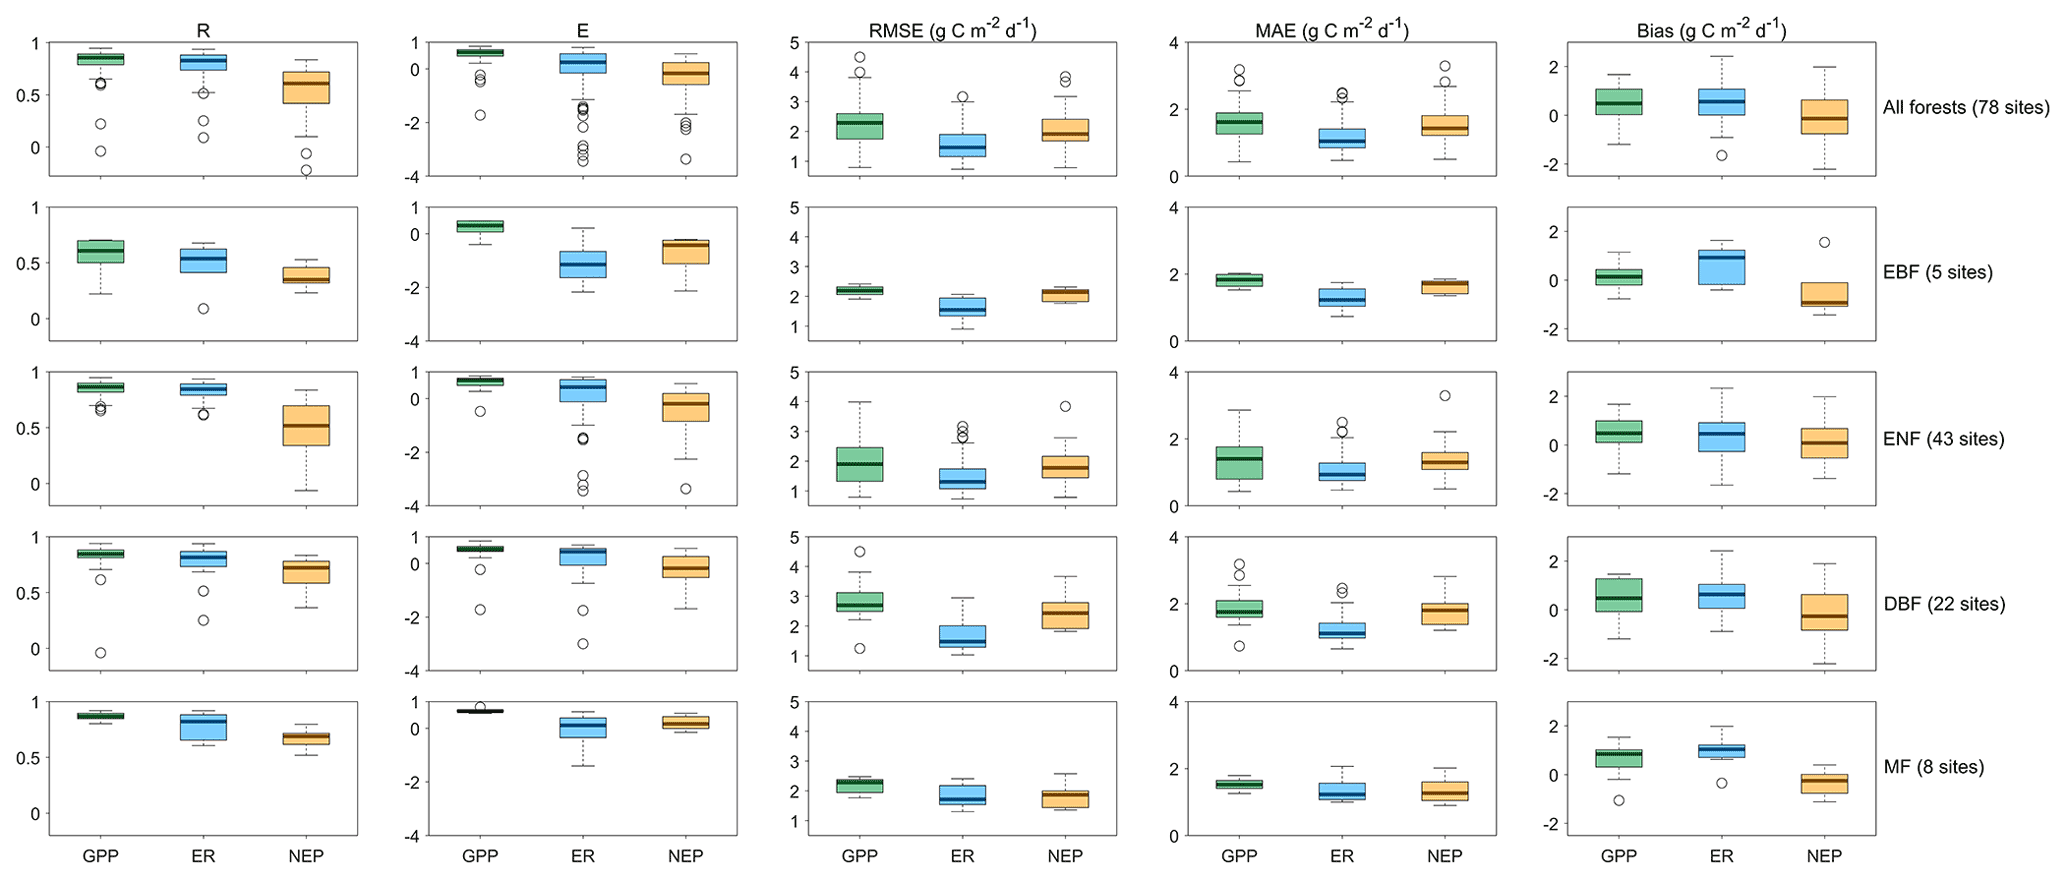
Figure 3The statistical results of daily gross primary productivity (GPP, green), ecosystem respiration (ER, blue), and net ecosystem productivity (NEP, tan) observations versus predictions in the studied EC sites. R is the correlation coefficient, E is the model efficiency, RMSE is the root-mean-square error, and MAE is the mean absolute error. EBF is evergreen broadleaf forest, ENF is evergreen needleleaf forest, DBF is deciduous broadleaf forest, and MF is mixed forest.
As a case application on large scale, we predict the carbon dynamics in the Northern Hemisphere forests during 1980–2016 (spatial resolution of 0.5 × 0.5∘). For the Northern Hemisphere, we use the Simple Biosphere (SiB) model of the International Satellite Land Surface Climatology Project (ISLSCP II) to represent forest types (Fig. S1, https://daac.ornl.gov/ISLSCP_II, last access: 29 September 2009) (Friedl et al., 2010). The LAI data are extracted from the Global Land Surface Satellite (GLASS) product (http://www.glass.umd.edu/Download.html, last access: March 2020). The climate data are from the daily analysis of ERA-Interim from the European Centre for Medium-range Weather Forecasts (ECMWF) dataset (Hersbach et al., 2020). Soil data are taken from the HWSD V1.2.
Figure 4 reported the spatial distribution of 37-year-averaged GPP, aboveground and belowground autotrophic respiration, soil heterotrophic respiration, net primary productivity (NPP), and net ecosystem productivity (NEP) for forest areas. All results show a similar spatial pattern, with the largest fluxes occurring around the Equator, such as the northern part of the Amazon and central African tropical rainforests. Monsoonal subtropical regions, such as South Asia and eastern North America, show the largest fluxes, while the northern forests near the Arctic Circle had the smallest fluxes. Overall, our predictions demonstrate that the forests in Northern Hemisphere had a huge carbon sink potential by the vegetation (i.e., NPP = 16.76 Pg C yr−1 or 61.45 Gt CO2 yr−1) and the total ecosystem (NEP = 3.19 Pg C yr−1 or 11.70 Gt CO2 yr−1) during 1980–2016, which is within the range of the newest estimation of forest carbon sinks (Harris et al., 2021). As a comparison, we use the aboveground biomass (AGB) from the GLASS product (a satellite-derived product, http://www.glass.umd.edu/Download.html, last access: August 2020) and the carbon fluxes from the FluxCom dataset (https://www.bgc-jena.mpg.de/geodb/projects/Data.php, last access: September 2020) to test our predictions (Figs. S2 and S3). Both predictions and GLASS observations present the tropical forests as having the highest AGB and the boreal forests as having the smallest AGB (Fig. S2). In terms of carbon fluxes (i.e., GPP, ER, and NEP), the resulting spatial pattern is consistent with the FluxCom dataset (Fig. S3). However, the GPP and ER derived from FORCCHN2 for some boreal forests are approximately 0.5 kg C m−2 yr−1 smaller, and for parts of eastern North America they are approximately 0.5 kg C m−2 yr−1 larger than those of FluxCom GPP and ER, respectively. Compared to the FluxCom NEP, the model overestimates NEP in some tropical forests and underestimates NEP in some boreal forests.
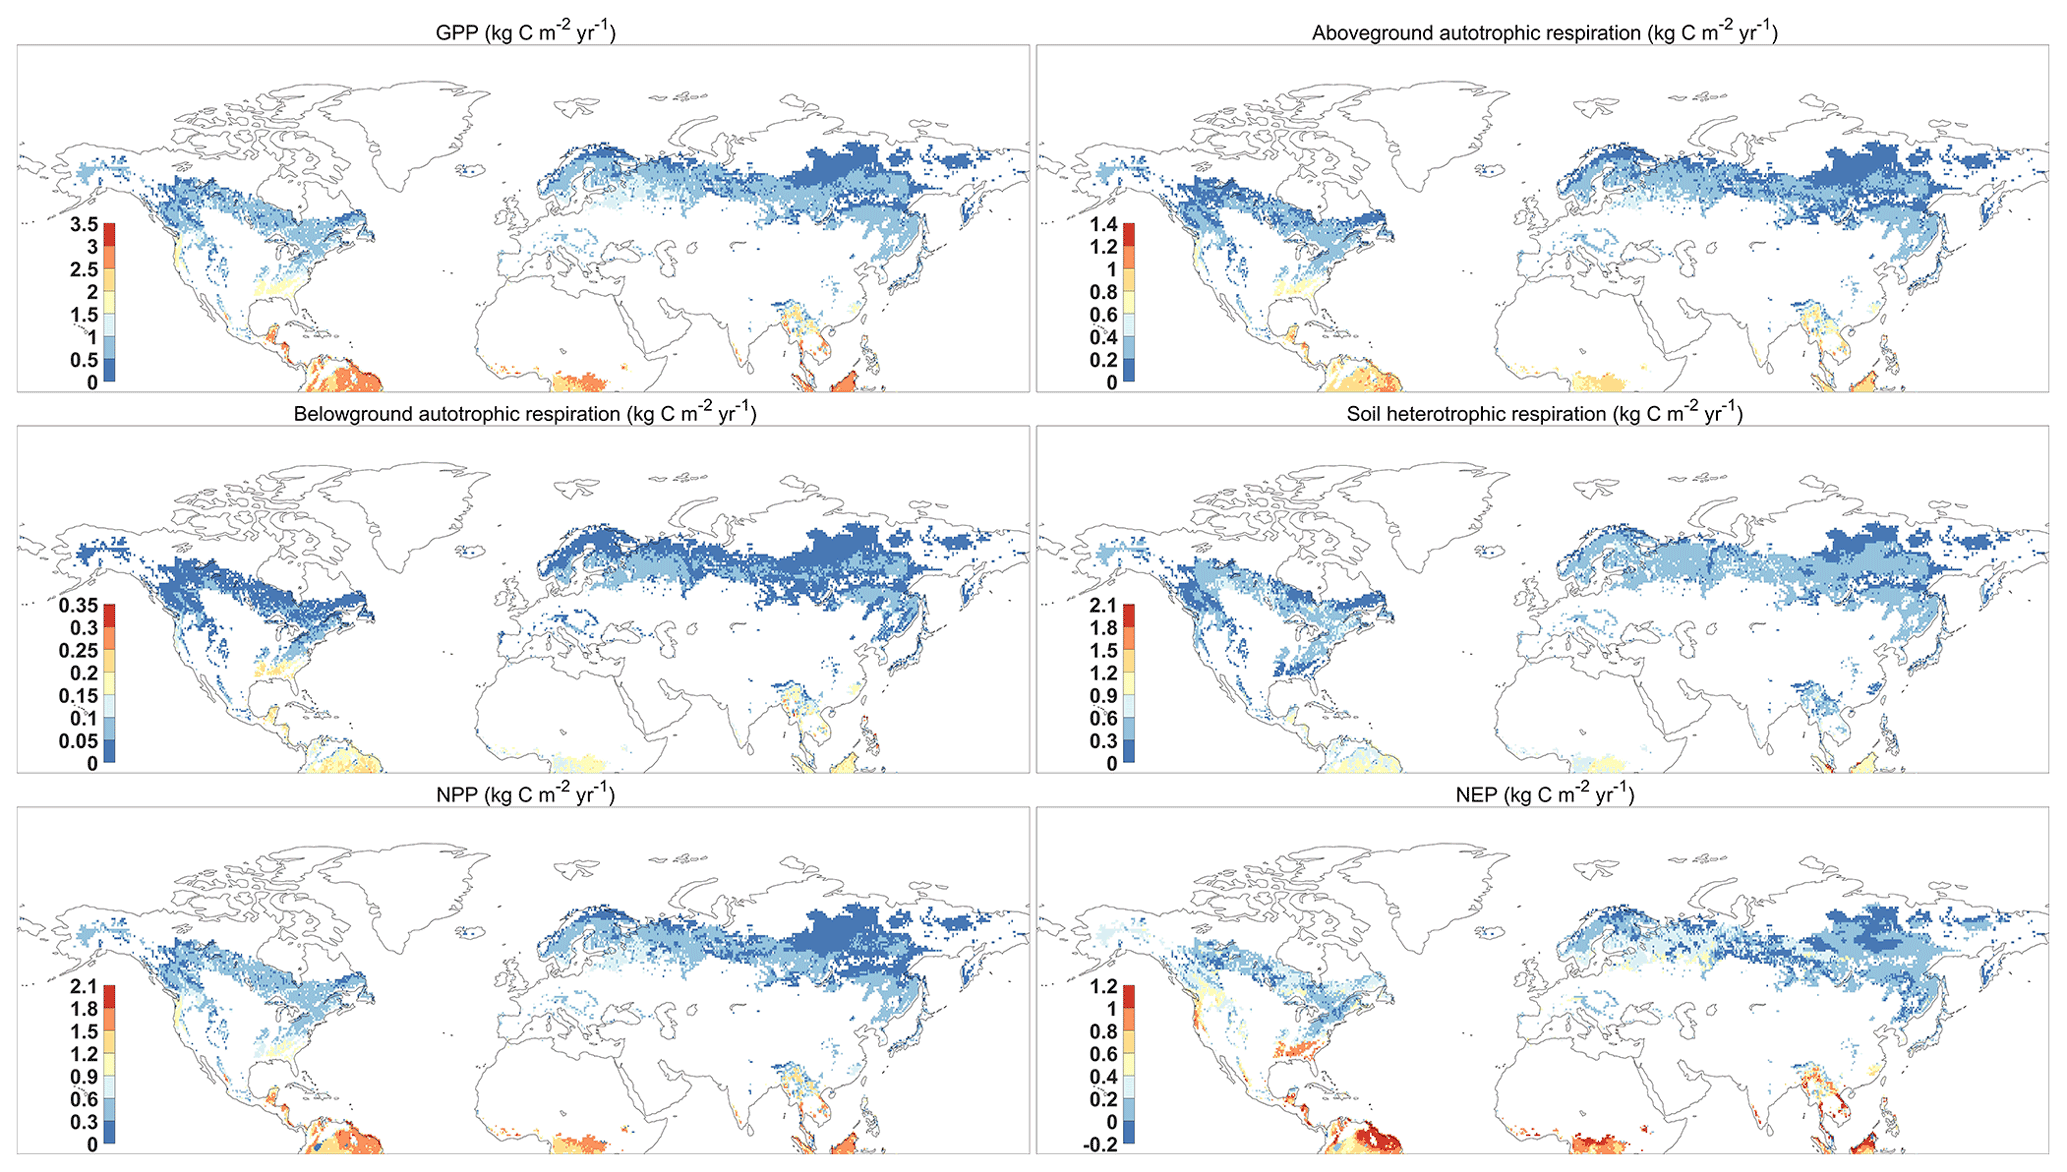
Figure 4The spatial distribution of mean GPP (gross primary productivity), aboveground and belowground autotrophic respiration, soil heterotrophic respiration, NPP (net primary productivity), and NEP (net ecosystem productivity) predicted by FORCCHN2 for forest ecosystems of the Northern Hemisphere during 1980–2016. The spatial resolution is 0.5∘ × 0.5∘.
The predicted carbon results including the variables of “dayout” and “yearout” in this case (i.e., Northern Hemisphere forests) are deposited in an open-access repository (Fang, 2022: https://doi.org/10.6084/m9.figshare.18318722.v1).
We developed FORCCHN2 and designed the corresponding DLL package with the intention to simplify the input and processing of the model and make it more accessible to ecologists interested in the forest ecosystem, climate change, carbon cycle, and modeling. This package provides convenient access and allows high computational efficiency with the Fortran-language-based model predicting the daily dynamics of individual trees. With this new package, we have demonstrated the workflow, functions, and applications of FORCCHN2.
In addition, FORCCHN2 is tested at 78 flux sites, and it is then applied in predicting the carbon dynamics of all Northern Hemisphere forests (1980–2016). Our assessment indicated that FORCCHN2 is able to satisfactorily predict carbon dynamics. While we provided publicly available data in the Northern Hemisphere with 0.5∘, our hope is that end users can offer a wide range of applications and analyses of FORCCHN2, such as providing the new dataset with finer resolution and estimating future changes of forest carbon fluxes. We are also open to further suggestions on enhanced functions that ecologists may find helpful in subsequent model versions.
The source code, instructions, and example run, together with FORCCHN2 DLL package, are publicly available via https://doi.org/10.5281/zenodo.6351153 (Fang et al., 2022a). The datasets predicted by FORCCHN2, including the 37-year (1980–2016) GPP, aboveground and belowground autotrophic respiration, and soil heterotrophic respiration for Northern Hemisphere forests (0.5∘ × 0.5∘), are publicly available via https://doi.org/10.6084/m9.figshare.18318722.v1 (Fang, 2022).
The supplement related to this article is available online at: https://doi.org/10.5194/gmd-15-6863-2022-supplement.
JF planned the project. XY and JF conducted the modeling. XY, JF, YS, and FL contributed to data collection. HHS and JF contributed to data analysis and interpretation of the results. HHS, FL, and JF took the lead in writing the manuscript. JF implemented feedback and got approval from all co-authors.
The contact author has declared that none of the authors has any competing interests.
Publisher's note: Copernicus Publications remains neutral with regard to jurisdictional claims in published maps and institutional affiliations.
This study is supported by the National Natural Science Foundation of China (32101349, 32171599). This study also is supported by the Key Program of the National Natural Science Foundation of China (32130069) and the National Key Research and Development Program of China (grant 2019YFC0606904).
This research has been supported by the National Natural Science Foundation of China (grant nos. 32101349 and 32171599). This research also has been supported by the Key Program of the National Natural Science Foundation of China (grant no. 32130069) and the Key Research and Development Program of China (grant no. 2019YFC0606904).
This paper was edited by Tomomichi Kato and reviewed by two anonymous referees.
Balzarolo, M., Boussetta, S., Balsamo, G., Beljaars, A., Maignan, F., Calvet, J.-C., Lafont, S., Barbu, A., Poulter, B., Chevallier, F., Szczypta, C., and Papale, D.: Evaluating the potential of large-scale simulations to predict carbon fluxes of terrestrial ecosystems over a European Eddy Covariance network, Biogeosciences, 11, 2661–2678, https://doi.org/10.5194/bg-11-2661-2014, 2014.
Beer, C., Reichstein, M., Tomelleri, E., Ciais, P., Jung, M., Carvalhais, N., Rödenbeck, C., Arain, M. A., Baldocchi, D., Bonan Gordon, B., Bondeau, A., Cescatti, A., Lasslop, G., Lindroth, A., Lomas, M., Luyssaert, S., Margolis, H., Oleson Keith, W., Roupsard, O., Veenendaal, E., Viovy, N., Williams, C., Woodward, F. I., and Papale, D.: Terrestrial Gross Carbon Dioxide Uptake: Global Distribution and Covariation with Climate, Science, 329, 834–838, https://doi.org/10.1126/science.1184984, 2010.
Delpierre, N., Lireux, S., Hartig, F., Camarero, J. J., Cheaib, A., Čufar, K., Cuny, H., Deslauriers, A., Fonti, P., Gričar, J., Huang, J.-G., Krause, C., Liu, G., de Luis, M., Mäkinen, H., del Castillo, E. M., Morin, H., Nöjd, P., Oberhuber, W., Prislan, P., Rossi, S., Saderi, S. M., Treml, V., Vavrick, H., and Rathgeber, C. B. K.: Chilling and forcing temperatures interact to predict the onset of wood formation in Northern Hemisphere conifers, Global Change Biol., 25, 1089–1105, https://doi.org/10.1111/gcb.14539, 2019.
Fang, J.: Daily and annual carbon flux predicted by FORCCHN2 model, Figshare [data set], https://doi.org/10.6084/m9.figshare.18318722.v1, 2022.
Fang, J., Lutz, J. A., Shugart, H. H., and Yan, X.: A physiological model for predicting dynamics of tree stem-wood non-structural carbohydrates, J. Ecol., 108, 702–718, https://doi.org/10.1111/1365-2745.13274, 2020a.
Fang, J., Lutz, J. A., Wang, L., Shugart, H. H., and Yan, X.: Using climate-driven leaf phenology and growth to improve predictions of gross primary productivity in North American forests, Global Change Biol., 26, 6974–6988, https://doi.org/10.1111/gcb.15349, 2020b.
Fang, J., Lutz, J. A., Shugart, H. H., Yan, X., Xie, W., and Liu, F.: Improving intra- and inter-annual GPP predictions by using individual tree inventories and leaf growth dynamics, J. Appl. Ecol., 58, 2315–2328, https://doi.org/10.1111/1365-2664.13960, 2021.
Fang, J., Shugart, H. H., Liu, F., Yan X., Song, Y., and Lv, F.: FORCCHN2 model (v2.0.1), Zenodo [code], https://doi.org/10.5281/zenodo.6351153, 2022a.
Fang, J., Lutz, J. A., Shugart, H. H., Wang, L., Liu, F., and Yan, X.: Continental-scale parameterization and prediction of leaf phenology for the North American forests, Global Ecol. Biogeogr., 31, 1603–1615, https://doi.org/10.1111/geb.13533, 2022b.
Friedl, M. A., Strahler, A. H., and Hodges, J.: ISLSCP II MODIS (Collection 4) IGBP Land Cover, 2000–2001, ORNL DAAC, Oak Ridge, Tennessee, USA [data set], https://doi.org/10.3334/ORNLDAAC/968, 2010.
Friedlingstein, P., O'Sullivan, M., Jones, M. W., Andrew, R. M., Hauck, J., Olsen, A., Peters, G. P., Peters, W., Pongratz, J., Sitch, S., Le Quéré, C., Canadell, J. G., Ciais, P., Jackson, R. B., Alin, S., Aragão, L. E. O. C., Arneth, A., Arora, V., Bates, N. R., Becker, M., Benoit-Cattin, A., Bittig, H. C., Bopp, L., Bultan, S., Chandra, N., Chevallier, F., Chini, L. P., Evans, W., Florentie, L., Forster, P. M., Gasser, T., Gehlen, M., Gilfillan, D., Gkritzalis, T., Gregor, L., Gruber, N., Harris, I., Hartung, K., Haverd, V., Houghton, R. A., Ilyina, T., Jain, A. K., Joetzjer, E., Kadono, K., Kato, E., Kitidis, V., Korsbakken, J. I., Landschützer, P., Lefèvre, N., Lenton, A., Lienert, S., Liu, Z., Lombardozzi, D., Marland, G., Metzl, N., Munro, D. R., Nabel, J. E. M. S., Nakaoka, S.-I., Niwa, Y., O'Brien, K., Ono, T., Palmer, P. I., Pierrot, D., Poulter, B., Resplandy, L., Robertson, E., Rödenbeck, C., Schwinger, J., Séférian, R., Skjelvan, I., Smith, A. J. P., Sutton, A. J., Tanhua, T., Tans, P. P., Tian, H., Tilbrook, B., van der Werf, G., Vuichard, N., Walker, A. P., Wanninkhof, R., Watson, A. J., Willis, D., Wiltshire, A. J., Yuan, W., Yue, X., and Zaehle, S.: Global Carbon Budget 2020, Earth Syst. Sci. Data, 12, 3269–3340, https://doi.org/10.5194/essd-12-3269-2020, 2020.
Furze, M. E., Huggett, B. A., Aubrecht, D. M., Stolz, C. D., Carbone, M. S., and Richardson, A. D.: Whole-tree nonstructural carbohydrate storage and seasonal dynamics in five temperate species, New Phytol., 221, 1466–1477, https://doi.org/10.1111/nph.15462, 2019.
Harris, N. L., Gibbs, D. A., Baccini, A., Birdsey, R. A., de Bruin, S., Farina, M., Fatoyinbo, L., Hansen, M. C., Herold, M., Houghton, R. A., Potapov, P. V., Suarez, D. R., Roman-Cuesta, R. M., Saatchi, S. S., Slay, C. M., Turubanova, S. A., and Tyukavina, A.: Global maps of twenty-first century forest carbon fluxes, Nat. Clim. Change, 11, 234–240, https://doi.org/10.1038/s41558-020-00976-6, 2021.
Hersbach, H., Bell, B., Berrisford, P., Hirahara, S., Horányi, A., Muñoz-Sabater, J., Nicolas, J., Peubey, C., Radu, R., Schepers, D., Simmons, A., Soci, C., Abdalla, S., Abellan, X., Balsamo, G., Bechtold, P., Biavati, G., Bidlot, J., Bonavita, M., De Chiara, G., Dahlgren, P., Dee, D., Diamantakis, M., Dragani, R., Flemming, J., Forbes, R., Fuentes, M., Geer, A., Haimberger, L., Healy, S., Hogan, R. J., Hólm, E., Janisková, M., Keeley, S., Laloyaux, P., Lopez, P., Lupu, C., Radnoti, G., de Rosnay, P., Rozum, I., Vamborg, F., Villaume, S., and Thépaut, J.-N.: The ERA5 global reanalysis, Q. J. Roy. Meteor. Soc., 146, 1999–2049, https://doi.org/10.1002/qj.3803, 2020.
Houlahan, J. E., McKinney, S. T., Anderson, T. M., and McGill, B. J.: The priority of prediction in ecological understanding, Oikos, 126, 1–7, https://doi.org/10.1111/oik.03726, 2017.
Huntzinger, D. N., Post, W. M., Wei, Y., Michalak, A. M., West, T. O., Jacobson, A. R., Baker, I. T., Chen, J. M., Davis, K. J., Hayes, D. J., Hoffman, F. M., Jain, A. K., Liu, S., McGuire, A. D., Neilson, R. P., Potter, C., Poulter, B., Price, D., Raczka, B. M., Tian, H. Q., Thornton, P., Tomelleri, E., Viovy, N., Xiao, J., Yuan, W., Zeng, N., Zhao, M., and Cook, R.: North American Carbon Program (NACP) regional interim synthesis: Terrestrial biospheric model intercomparison, Ecol. Model., 232, 144–157, https://doi.org/10.1016/j.ecolmodel.2012.02.004, 2012.
Keenan, T. F. and Williams, C. A.: The Terrestrial Carbon Sink, Annu. Rev. Env. Resour., 43, 219–243, https://doi.org/10.1146/annurev-environ-102017-030204, 2018.
Lasslop, G., Reichstein, M., Papale, D., Richardson, A. D., Arneth, A., Barr, A., Stoy, P., and Wohlfahrt, G.: Separation of net ecosystem exchange into assimilation and respiration using a light response curve approach: critical issues and global evaluation, Global Change Biol., 16, 187–208, https://doi.org/10.1111/j.1365-2486.2009.02041.x, 2010.
Ma, J., Shugart, H. H., Yan, X., Cao, C., Wu, S., and Fang, J.: Evaluating carbon fluxes of global forest ecosystems by using an individual tree-based model FORCCHN, Sci. Total Environ., 586, 939–951, https://doi.org/10.1016/j.scitotenv.2017.02.073, 2017.
Martínez-Vilalta, J., Sala, A., Asensio, D., Galiano, L., Hoch, G., Palacio, S., Piper, F. I., and Lloret, F.: Dynamics of non-structural carbohydrates in terrestrial plants: a global synthesis, Ecol. Monogr., 86, 495–516, https://doi.org/10.1002/ecm.1231, 2016.
Pan, Y., Birdsey Richard, A., Fang, J., Houghton, R., Kauppi Pekka, E., Kurz Werner, A., Phillips Oliver, L., Shvidenko, A., Lewis Simon, L., Canadell Josep, G., Ciais, P., Jackson Robert, B., Pacala Stephen, W., McGuire, A. D., Piao, S., Rautiainen, A., Sitch, S., and Hayes, D.: A Large and Persistent Carbon Sink in the World's Forests, Science, 333, 988–993, https://doi.org/10.1126/science.1201609, 2011.
Pastorello, G., Trotta, C., Canfora, E., Chu, H., Christianson, D., Cheah, Y.-W., Poindexter, C., Chen, J., Elbashandy, A., Humphrey, M., Isaac, P., Polidori, D., Reichstein, M., Ribeca, A., van Ingen, C., Vuichard, N., Zhang, L., Amiro, B., Ammann, C., Arain, M. A., Ardö, J., Arkebauer, T., Arndt, S. K., Arriga, N., Aubinet, M., Aurela, M., Baldocchi, D., Barr, A., Beamesderfer, E., Marchesini, L. B., Bergeron, O., Beringer, J., Bernhofer, C., Berveiller, D., Billesbach, D., Black, T. A., Blanken, P. D., Bohrer, G., Boike, J., Bolstad, P. V., Bonal, D., Bonnefond, J.-M., Bowling, D. R., Bracho, R., Brodeur, J., Brümmer, C., Buchmann, N., Burban, B., Burns, S. P., Buysse, P., Cale, P., Cavagna, M., Cellier, P., Chen, S., Chini, I., Christensen, T. R., Cleverly, J., Collalti, A., Consalvo, C., Cook, B. D., Cook, D., Coursolle, C., Cremonese, E., Curtis, P. S., D'Andrea, E., da Rocha, H., Dai, X., Davis, K. J., Cinti, B. D., Grandcourt, A. d., Ligne, A. D., De Oliveira, R. C., Delpierre, N., Desai, A. R., Di Bella, C. M., Tommasi, P. d., Dolman, H., Domingo, F., Dong, G., Dore, S., Duce, P., Dufrêne, E., Dunn, A., Dušek, J., Eamus, D., Eichelmann, U., ElKhidir, H. A. M., Eugster, W., Ewenz, C. M., Ewers, B., Famulari, D., Fares, S., Feigenwinter, I., Feitz, A., Fensholt, R., Filippa, G., Fischer, M., Frank, J., Galvagno, M., Gharun, M., Gianelle, D., Gielen, B., Gioli, B., Gitelson, A., Goded, I., Goeckede, M., Goldstein, A. H., Gough, C. M., Goulden, M. L., Graf, A., Griebel, A., Gruening, C., Grünwald, T., Hammerle, A., Han, S., Han, X., Hansen, B. U., Hanson, C., Hatakka, J., He, Y., Hehn, M., Heinesch, B., Hinko-Najera, N., Hörtnagl, L., Hutley, L., Ibrom, A., Ikawa, H., Jackowicz-Korczynski, M., Janouš, D., Jans, W., Jassal, R., Jiang, S., Kato, T., Khomik, M., Klatt, J., Knohl, A., Knox, S., Kobayashi, H., Koerber, G., Kolle, O., Kosugi, Y., Kotani, A., Kowalski, A., Kruijt, B., Kurbatova, J., Kutsch, W. L., Kwon, H., Launiainen, S., Laurila, T., Law, B., Leuning, R., Li, Y., Liddell, M., Limousin, J.-M., Lion, M., Liska, A. J., Lohila, A., López-Ballesteros, A., López-Blanco, E., Loubet, B., Loustau, D., Lucas-Moffat, A., Lüers, J., Ma, S., Macfarlane, C., Magliulo, V., Maier, R., Mammarella, I., Manca, G., Marcolla, B., Margolis, H. A., Marras, S., Massman, W., Mastepanov, M., Matamala, R., Matthes, J. H., Mazzenga, F., McCaughey, H., McHugh, I., McMillan, A. M. S., Merbold, L., Meyer, W., Meyers, T., Miller, S. D., Minerbi, S., Moderow, U., Monson, R. K., Montagnani, L., Moore, C. E., Moors, E., Moreaux, V., Moureaux, C., Munger, J. W., Nakai, T., Neirynck, J., Nesic, Z., Nicolini, G., Noormets, A., Northwood, M., Nosetto, M., Nouvellon, Y., Novick, K., Oechel, W., Olesen, J. E., Ourcival, J.-M., Papuga, S. A., Parmentier, F.-J., Paul-Limoges, E., Pavelka, M., Peichl, M., Pendall, E., Phillips, R. P., Pilegaard, K., Pirk, N., Posse, G., Powell, T., Prasse, H., Prober, S. M., Rambal, S., Rannik, Ü., Raz-Yaseef, N., Rebmann, C., Reed, D., Dios, V. R. d., Restrepo-Coupe, N., Reverter, B. R., Roland, M., Sabbatini, S., Sachs, T., Saleska, S. R., Sánchez-Cañete, E. P., Sanchez-Mejia, Z. M., Schmid, H. P., Schmidt, M., Schneider, K., Schrader, F., Schroder, I., Scott, R. L., Sedlák, P., Serrano-Ortíz, P., Shao, C., Shi, P., Shironya, I., Siebicke, L., Šigut, L., Silberstein, R., Sirca, C., Spano, D., Steinbrecher, R., Stevens, R. M., Sturtevant, C., Suyker, A., Tagesson, T., Takanashi, S., Tang, Y., Tapper, N., Thom, J., Tomassucci, M., Tuovinen, J.-P., Urbanski, S., Valentini, R., van der Molen, M., van Gorsel, E., van Huissteden, K., Varlagin, A., Verfaillie, J., Vesala, T., Vincke, C., Vitale, D., Vygodskaya, N., Walker, J. P., Walter-Shea, E., Wang, H., Weber, R., Westermann, S., Wille, C., Wofsy, S., Wohlfahrt, G., Wolf, S., Woodgate, W., Li, Y., Zampedri, R., Zhang, J., Zhou, G., Zona, D., Agarwal, D., Biraud, S., Torn, M., and Papale, D.: The FLUXNET2015 dataset and the ONEFlux processing pipeline for eddy covariance data, Scientific Data, 7, 225, https://doi.org/10.1038/s41597-020-0534-3, 2020.
Piao, S., Liu, Q., Chen, A., Janssens, I. A., Fu, Y., Dai, J., Liu, L., Lian, X., Shen, M., and Zhu, X.: Plant phenology and global climate change: Current progresses and challenges, Global Change Biol., 25, 1922–1940, https://doi.org/10.1111/gcb.14619, 2019.
Piper, F. I.: Decoupling between growth rate and storage remobilization in broadleaf temperate tree species, Funct. Ecol., 34, 1180–1192, https://doi.org/10.1111/1365-2435.13552, 2020.
Raczka, B. M., Davis, K. J., Huntzinger, D., Neilson, R. P., Poulter, B., Richardson, A. D., Xiao, J., Baker, I., Ciais, P., Keenan, T. F., Law, B., Post, W. M., Ricciuto, D., Schaefer, K., Tian, H., Tomelleri, E., Verbeeck, H., and Viovy, N.: Evaluation of continental carbon cycle simulations with North American flux tower observations, Ecol. Monogr., 83, 531–556, https://doi.org/10.1890/12-0893.1, 2013.
Richardson, A. D., Carbone, M. S., Keenan, T. F., Czimczik, C. I., Hollinger, D. Y., Murakami, P., Schaberg, P. G., and Xu, X.: Seasonal dynamics and age of stemwood nonstructural carbohydrates in temperate forest trees, New Phytol., 197, 850–861, https://doi.org/10.1111/nph.12042, 2013.
Sala, A., Woodruff, D. R., and Meinzer, F. C.: Carbon dynamics in trees: feast or famine?, Tree Physiol., 32, 764–775, https://doi.org/10.1093/treephys/tpr143, 2012.
Schiestl-Aalto, P., Kulmala, L., Mäkinen, H., Nikinmaa, E., and Mäkelä, A.: CASSIA – a dynamic model for predicting intra-annual sink demand and interannual growth variation in Scots pine, New Phytol., 206, 647–659, https://doi.org/10.1111/nph.13275, 2015.
Yuan, W., Cai, W., Xia, J., Chen, J., Liu, S., Dong, W., Merbold, L., Law, B., Arain, A., Beringer, J., Bernhofer, C., Black, A., Blanken, P. D., Cescatti, A., Chen, Y., Francois, L., Gianelle, D., Janssens, I. A., Jung, M., Kato, T., Kiely, G., Liu, D., Marcolla, B., Montagnani, L., Raschi, A., Roupsard, O., Varlagin, A., and Wohlfahrt, G.: Global comparison of light use efficiency models for simulating terrestrial vegetation gross primary production based on the LaThuile database, Agr. Forest Meteorol., 192–193, 108–120, https://doi.org/10.1016/j.agrformet.2014.03.007, 2014.
Zhao, J., Ma, J., and Zhu, Y.: Evaluating impacts of climate change on net ecosystem productivity (NEP) of global different forest types based on an individual tree-based model FORCCHN and remote sensing, Global Planet. Change, 182, 103010, https://doi.org/10.1016/j.gloplacha.2019.103010, 2019.