the Creative Commons Attribution 4.0 License.
the Creative Commons Attribution 4.0 License.
 | 01 Apr 2022
Added value of EURO-CORDEX high-resolution downscaling over the Iberian Peninsula revisited – Part 2: Max and min temperature
João António Martins Careto
Pedro Miguel Matos Soares
Rita Margarida Cardoso
Sixto Herrera
José Manuel Gutiérrez
In the recent past, an increase in computation resources led to the development of regional climate models with increasing domains and resolutions, spanning larger temporal periods. A good example is the World Climate Research Program – Coordinated Regional Climate Downscaling Experiment for the European domain (EURO-CORDEX). This set of regional models encompasses the entire European continent for a 130-year common period until the end of the 21st century, while having a 12 km horizontal resolution. Such simulations are computationally demanding, while at the same time not always showing added value. This study considers a recently proposed metric in order to assess the added value of the EURO-CORDEX hindcast (1989–2008) and historical (1971–2005) simulations for the maximum and minimum temperature over the Iberian Peninsula. This approach allows an evaluation of the higher against the driving lower resolutions relative to the performance of the whole or partial probability density functions by having an observational regular gridded dataset as a reference. Overall, the gains for maximum temperature are more relevant in comparison to minimum temperature, partially due to known problems derived from the snow–albedo–atmosphere feedback. For more local scales, areas near the coast reveal higher added value in comparison with the interior, which displays limited gains and sometimes notable detrimental effects with values around −30 %. At the same time, the added value for temperature extremes reveals a similar range, although with larger gains in coastal regions and in locations from the interior for maximum temperature, contrasting with the losses for locations in the interior of the domain for the minimum temperature.
- Article
(7394 KB) - Full-text XML
- Companion paper
-
Supplement
(1911 KB) - BibTeX
- EndNote


Climate change due to anthropogenic actions is one of the major challenges for the 21st century. Over the years, with increasing public attention and motivated by the Intergovernmental Panel on Climate Change (IPCC), tools were developed for assessing past, present, and future climate conditions: so-called global climate models (GCMs). However, while GCMs can capture the decadal variability and the overall large-scale circulations of the atmosphere and ocean (Meehl et al., 2007; Randall et al., 2007; Stocker et al., 2014), they reveal shortcomings, particularly at the local scales. These uncertainties are usually derived from the GCM low resolution, and thus there is a need for parameterization of small-scale processes (Prein et al., 2015). Due to these drawbacks, statistical and dynamical downscaling techniques were developed (Giorgi and Bates, 1989; McGregor, 1997; Wilby et al., 1998; Khan et al., 2006; Christensen et al., 2007; Rummukainen, 2010), thus establishing a new way of assessing climate at smaller scales. The latter makes use of regional climate models (RCMs), which are an important tool in the representation of climate, since they are able to produce physically consistent regional and local circulations (Giorgi and Mearns, 1991, 1999; Leung et al., 2003; Laprise, 2008; Soares et al., 2012a, b; Cardoso et al., 2013; Rios-Entenza et al., 2014; Soares et al., 2014), nowadays with resolutions of tenths of kilometres down to convection-permitting scales. The added value can be defined as the capability of a higher-resolution RCM to improve the representation of individual variables and processes in comparison to the driving or lower-resolution simulations, with observations as a reference (Di Luca et al., 2012, 2013). Yet, increasing resolutions also imply growing computational costs, and these simulations do not always reveal added value (Prein et al., 2013, 2015, 2016; Torma et al., 2015; Rummukainen, 2016; Soares and Cardoso, 2018; Cardoso and Soares, 2021; Careto et al., 2022).
During the 21st century, the increase in computational resources has enabled the emergence of higher resolutions, higher temporal ranges, and larger domains for RCM simulations (Prein et al., 2015). This evolution can be seen from the 50 km of the PRUDENCE project (Christensen and Christensen 2007) down to 25 km from the ENSEMBLES project (van der Linden and Mitchell, 2009) and the more recent World Climate Research Program – Coordinated Regional Climate Downscaling Experiment for the European domain (EURO-CORDEX, Jacob et al., 2014, 2020) with its 12 km of horizontal resolution. Other examples are ideal case studies using high-resolution simulations at the kilometre scale (Hohenegger et al., 2009; Froidevaux et al., 2014; Imamovic et al., 2017; Kirshbaum et al., 2018) and the recent CORDEX flagship pilot studies on convection (Coppola et al., 2020; Ban et al., 2021; Pichelli et al., 2021). Nevertheless, the EURO-CORDEX simulations are a benchmark, covering the entire European continent, while spanning a large period and with a relatively high resolution.
EURO-CORDEX simulations are composed of a hindcast driven by the ERA-Interim reanalysis (Dee et al., 2011) and a GCM–RCM downscaling experiment, wherein models are forced by the IPCC Coupled Model Intercomparison Project Phase 5 (CMIP5) GCMs. Most studies focus their assessment on the precipitation variable. However, in the recent past, these simulations have been extensively evaluated, and important gains were found for variables such as temperature (Vautard et al., 2013, 2020; Kotlarski et al., 2014; Soares and Cardoso, 2018; Ciarlo et al., 2020; Herrera et al., 2020; Cardoso and Soares, 2021; Careto et al., 2022). Vautard et al. (2013) evaluated temperature for the hindcast simulations, finding an overestimation of extreme temperatures and heatwaves for summertime over the Mediterranean and an underestimation over Scandinavia. These differences were attributed to the convection and microphysics schemes, which affect the flux partitioning and consequently the temperature. Moreover, despite the improvements, namely over coastline areas, the use of higher resolution did not show clear improvements in the representation of heatwaves. More recently, Vautard et al. (2020) assessed the historical EURO-CORDEX models, reporting colder, humid, and more windy biases relative to observations, with joint liability across GCMs and RCMs. The authors also reported that no model stands out for all metrics considered. Also, Kotlarski et al. (2014) assessed the summertime and wintertime temperature, precipitation, and mean sea level pressure from the hindcast simulations for the 12 and 50 km resolution, reporting a cold and humid bias over most of Europe and most seasons, together with a summer dry and warm bias in southern Europe. Yet the models were still able to capture the space–time variability of the European climate. Herrera et al. (2020) assessed the hindcast models for the Iberian Peninsula against three observational datasets. While the models can reproduce the spatial pattern and variability, there is a dependence on the observational dataset considered. Nevertheless, the results reveal higher agreement for temperature than for precipitation, decreasing for the extremes. The historical period simulations were also assessed for specific regions (Smiatek et al., 2016; Lhotka, 2018; Cardoso et al., 2019). Smiatek et al. (2016) assessed precipitation and temperature for an alpine region, reporting a cold bias together with a more humid summer and winter. The authors describe the models as revealing no significant gains in comparison with previous experiments. On the other hand, Lhotka (2018) investigated the capability of EURO-CORDEX models to simulate heatwaves over central Europe, reporting overall difficulty by models reproducing these extremes. For Portugal, the temperature was evaluated in Cardoso et al. (2019); models can correctly describe the main orographic and coastal-related gradients, but a cold bias is present for most RCMs. Nevertheless, the authors built a multi-model ensemble, which was able to outperform the individual models.
A common issue across all RCMs is related to the snow–albedo–temperature feedback through a misrepresentation of the surface energy balance (García-Díez et al., 2015; Minder et al., 2016; Terzago et al., 2017). Uncertainties in the snow depth, melt, and cover could have a potential impact on surface air temperatures around 0 ∘C. Biases in the albedo representation lead to positive feedback, thus enhancing overly cold temperatures during winter.
To assess the added value of the EURO-CORDEX high-resolution models against their forcing counterparts, Soares and Cardoso (2018) were the first to propose a new metric in order to gauge the quality of a simulation relative to the probability density functions (PDFs). They used a distribution added value (DAV) to characterize the gains or losses of higher-resolution simulations for precipitation for several hindcast simulations by comparing the high 12 km and the low 50 km resolutions with the station-based dataset ECAD (Klein Tank et al., 2002; Klok and Klein Tank, 2009) as a reference. The added value was shown, particularly for extreme precipitation, although the highest resolution did not always display the most significant gains. Ciarlo et al. (2020) used a similar probability-density-function-based metric to assess the added value of all available EURO-CORDEX and CORDEX-CORE (Gutowski et al., 2016) simulations for precipitation. Although added value of the high-resolution simulations is found, particularly for the tail end of the distributions, the authors also reported a significant uncertainty derived from the observational datasets. More recently, Careto et al. (2022) revisited the added value from EURO-CORDEX by implementing a methodology similar to this work over the Iberian Peninsula, considering the highest-resolution observational dataset to date. In Di Luca et al. (2013), sites located near the coast showed relevant gains. Cardoso and Soares (2021) assessed the temperature with the DAV metric for the lower- (50 km) and higher-resolution (12 km) hindcast simulations, with the E-OBS regular dataset as a reference. The authors reported difficulty obtaining added value, partly due to the assimilation of observations into the ERA-Interim. Still, gains are reported for the Mediterranean and British Isles, while losses are found for regions of complex terrain. Nevertheless, the authors found added value, particularly for maximum temperature extremes.
The DAV metric relies on comparisons from high- and low-resolution models with observations regarding their PDFs, thus evaluating the gains or losses of RCMs against their driving ERA-Interim or GCM counterparts. DAVs is a versatile metric able to be applied to either the entire PDF or to PDF sections, such as those related to extremes. In this study, DAVs will be used to assess the performance of maximum and minimum temperature for the Iberia Peninsula for all available hindcast (1989–2008) and historical (1971–2005) EURO-CODEX simulations. This assessment uses the Iberian Gridded Dataset (IGD, Herrera et al., 2019b) as a reference. The IGD is a high-resolution dataset built from an extensive station network, covering the Iberian Peninsula for the 1971–2015 period. Here, a new and unprecedented way of assessing the EURO-CORDEX simulations against observations at a similar scale is considered. The next section introduces the data and a description of the methods considered. The results and discussion are presented in the following section. Finally, the main conclusions are drawn in the last section.
2.1 Iberian Gridded Dataset
Recently, Herrera et al. (2019a, b) proposed a new regular gridded dataset, with a spatial resolution of 0.1∘, based on a quality-controlled observational network for the Iberian Peninsula. It includes 3486 and 275 stations for precipitation and temperatures, respectively. This dataset was built for the variables daily precipitation as well as maximum, minimum, and mean temperature, spanning a total of 45 years from 1971 until the end of 2015. The authors compared this new dataset with version 17 of the E-OBS, reporting its ability to reproduce the mean and extreme precipitation and temperature regimes more realistically. Moreover, for temperature, the two observational datasets are comparable. The authors also compared the IGD with the ensemble version of the E-OBS (v17e) with a new probabilistic intercomparison analysis, concluding that both datasets are statistically different, i.e. fall outside the observational uncertainty of E-OBS as given by the standard deviation of the ensemble.
2.2 EURO-CORDEX
The main objective from CORDEX is to generate a coordinated ensemble of high-resolution regional climate projections to provide, at a user-relevant scales, climate data for all regions from the world, supporting climate change impact and adaptation research (Giorgi et al., 2009; Gutowski et al., 2016). EURO-CORDEX (Jacob et al., 2014, 2020) is a branch from the international CORDEX initiative and consists of producing simulations at three different resolutions (50, 25, 12 km) covering all of Europe. Two types of simulations were produced. First, a hindcast was performed for the 1989–2008 period driven by the ERA-Interim reanalysis (Dee et al., 2011). Second, a historical scenario simulation was performed, driven by the Intergovernmental Panel on Climate Change Coupled Model Intercomparison Project Phase 5 (IPCC-CMIP5) GCMs covering the 1971–2100 period. Of these, only the historical (1971–2005) will be considered. All simulations are available at the Earth System Grid Federation portal (Williams et al., 2011; https://esgf.llnl.gov/, last access: 29 April 2021).
The information regarding the simulations for the hindcast is summarized in Table S1 in the Supplement and for the historical in Table S2. For all the simulations, the added value is computed for a common Iberian Peninsula domain, shown in Fig. 1, where a conservative interpolation (Schulzweida et al., 2021) of RCMs into the regular resolution of observations is first carried out. On the other hand, the observations were interpolated into each low-resolution GCM (see Table S2 for each GCM resolution) or ERA-Interim grid (0.75∘). For temperature, a constant lapse rate of −6.5 ∘C km−1 was considered for the interpolation. First, for each dataset, the effect of orography was removed by adiabatically adjusting the temperatures to mean sea level. After the horizontal interpolations, the temperature is adiabatically adjusted once again to the orography from the target resolution, considering the same lapse rate.
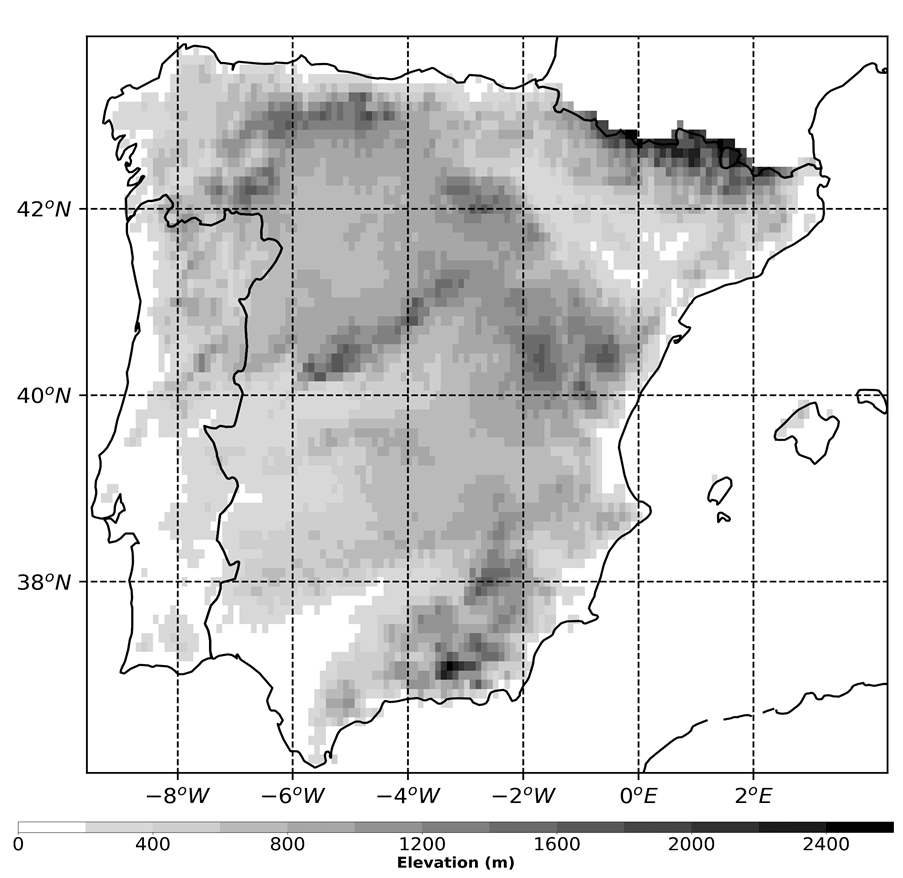
Figure 1Orography from the Iberian Gridded Dataset for the Iberian Peninsula at 0.1∘ horizontal resolution.
2.3 Distribution added value (DAV)
Soares and Cardoso (2018) recently proposed a distribution added value (DAV) metric, which allows one to assess the performance of downscaling low-resolution GCMs or reanalysis in terms of Probability density functions (PDFs). The DAV metric is based on a PDF skill score proposed by Perkins et al. (2007), which measures the similarity between two PDFs. The first step is to build a PDF for each dataset. For maximum and minimum temperature, bins with a width of 1 ∘C were chosen, and the number of events is added for each bin. Next, each bin is divided by the sum of all events, thus resulting in an empirical relative frequency distribution. With this approach, one can more accurately compare the results across the different datasets as changes are more directly identified (Gutowski et al., 2007). Next, the Perkins score is given by the sum of the minimum bin value between the model and the observational PDF:
where n is the PDF's number of bins, m denotes the high- or the low-resolution model, and obs is the observational PDF. For both temperatures, the limits are bounded between −50 and 60 ∘C, encompassing all of the observational temperature range. With the scores for all simulations, the DAVs are given by the normalized difference between the high-resolution model Perkins skill score and the lower-resolution GCM or reanalysis Perkins skill score:
with the subscript hr depicting the high resolution (RCM) and lr the low resolution (GCM or reanalysis). Thus, DAV represents the percentage of gains or losses with respect to PDFs between the high- and low-resolutions models. If for a particular bin there are no data from either model or observations, then by definition the contribution of that bin would be 0. Moreover, an advantage of this metric is its ability to be computed not only for the entire PDF but also for PDF sections, thus enabling an assessment for extremes. In this work, the extremes are also evaluated; for maximum temperature, values above the observational 90th percentile are considered, while for minimum temperature, values below the observational 10th percentile are taken into account. Therefore, a new relative frequency PDF is built only from the extremes.
For the assessment of the DAVs of temperatures, two approaches are considered. A first regional approach is for the entire Iberian Peninsula, whereby the PDFs are built by pooling together all data, thus returning a representative result for the whole domain. The second approach is composed of a spatialization of the DAVs, whereby all data from within each individual low-resolution grid cell are pooled together, thus computing individual percentiles and PDF sets.
3.1 Hindcast simulations (1989–2008)
All PDFs shown in Fig. S1, either at the regular 0.1∘ resolution or ERA-Interim resolution, reveal similarities to observations, anticipating the overall difficulty of the RCMs to obtain added value. The temperature PDF approximately follows a Gaussian normal distribution, and thus small changes in the mean or standard deviation could have major impacts on the DAV results. This effect is particularly relevant for TASMIN, wherein all PDFs overlap more reasonably than in comparison to TASMAX.
Figure 2a displays the results for the TASMAX considering the whole PDF. At the annual scale, all models except DHMZ reveal positive DAVs. GERICS, IPSL, and MPI reveal percentages above 7.8 %. In fact, in Cardoso and Soares (2021) the IPSL model also has higher gains for the Iberian Peninsula. The same models which display smaller DAVs below 3 % at the annual scale also reveal lower percentages for winter, with four RCMs having a small detrimental effect. These negative values for winter are enough to condition the yearly DAVs, since in spring and summer there is a higher added value for six and nine models, respectively. From these, GERICS, IPSL, and MPI stand out with gains above 19 % for both seasons, which is reflected in more noticeable DAVs at the annual scale. As for autumn, almost all models reveal some added value, although not as large as for spring or summer. For ICTP, this RCM also displays a performance similar to the driving simulation. In fact, this model also revealed neutral DAVs for spring, although with gains around 10 % for summer and small losses for winter. Another model with limited gains, but throughout the year, is the DHMZ, which despite the positive seasonal DAVs, shows a small detrimental effect at the annual scale. The PDFs in Fig. S1 from the high-resolution models have a close representation relative to the IGD. Particularly for the winter season, the already tightly packed PDFs reveal more difficulty for the higher resolution to obtain added value in comparison to the other seasons. These results are in line with Herrera et al. (2020), who evaluated the annual and seasonal means as well as variability for a set of hindcast simulations. For temperature, the authors obtained small spatial biases and small standard deviation ratios between the models and the IGD.
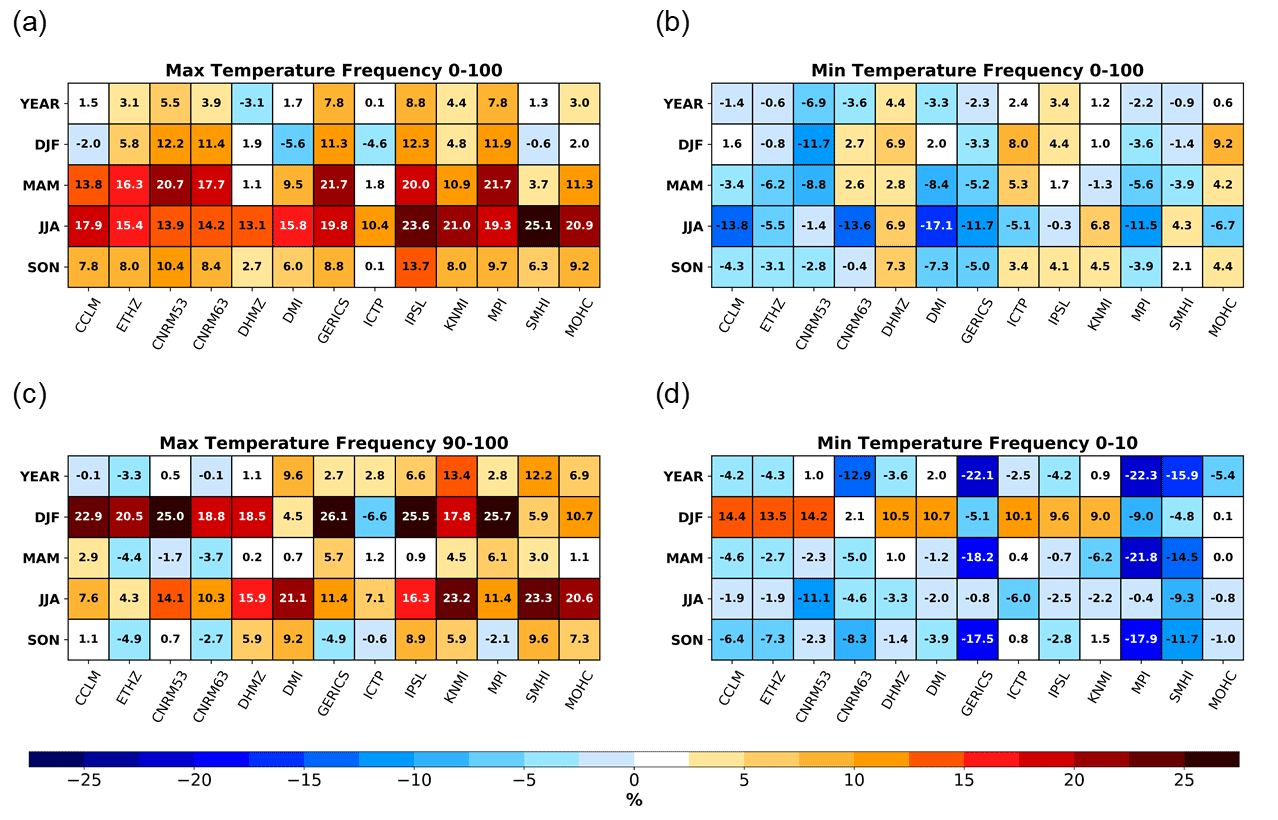
Figure 2Yearly and seasonal distribution added values (DAVs) of the Iberian Peninsula between the RCMs and the ERA-Interim reanalysis for the 1989–2008 period taken from the hindcast EURO-CORDEX simulations, with the IGD regular dataset as a reference for (a) maximum daily temperature considering the whole PDF, (b) minimum daily temperature considering the whole PDF, (c) maximum daily temperature extremes only considering the values above the observational 90th percentile from maximum temperatures, and (d) minimum temperature extremes only considering the values below the observational 10th percentile from minimum temperatures. All RCM data were previously interpolated to 0.1∘ regular resolution from the observations, while the observations were interpolated into the ERA-Interim resolution.
In the opposite sense, TASMIN displays an overall loss of value for the high-resolution simulations against the driving ERA-Interim reanalysis (Fig. 2b). The results here are a reflection of the smaller differences between the reanalysis and the IGD due to the incorporation of temperature observations into ERA-Interim (Prömmel et al., 2010), together with the overestimation of the temperature bins around 0 ∘C for the RCMs (Fig. S1 right side). The RCMs reveal issues related to the snow cover, depth, and melt, which impacts the snow–albedo feedback and consequently the flux partitioning at the surface (García-Díez et al., 2015; Minder et al., 2016; Terzago et al., 2017). The higher resolutions are able to represent the mountain ridges and valleys in more detail. However, this causes an overestimation of the snow depth in high altitudes and an underestimation at the lower altitudes (Tergazo et al., 2017). These biases, through the snow–albedo feedback, cause an underestimation (overestimation) of temperature at higher (lower) altitudes, not only for winter, but also for springtime due to an extended (reduced) snowmelt period (Minder et al., 2016). In the Iberian Peninsula there are not many locations with a significant amount of snow. In fact, the PDFs of the RCMs for TASMIN in Fig. S2 reveal a slight shift to the right for all seasons, indicating an overestimation of minimum temperature. Therefore, the issues related to snow and the smaller differences between all PDFs at the low resolution anticipate overall difficulty obtaining added value for the minimum temperature. Accordingly, 8 out of 13 RCMs in Fig. 2b for the annual scale reveal some losses, especially CNRM53 with −6.9 %. These detrimental effects come from the losses of the individual seasons. While for TASMAX, summer had some of the highest scores in Fig. 2a, only three models show added value in Fig. 2b. The other 10 RCMs reveal detrimental effects; of these, five reveal losses up to −11 %. For the other seasons, the values are not so different, with the majority of RCMs displaying losses up to −11.7 % for CNRM53 in winter. In fact, this RCM, together with ETHZ, GERICS, and MPI, reveals the worst performance throughout the year in comparison to the driving simulation. Despite the overall lower values for TASMIN, five models are still able to display at least two seasons with added value. Only DHMZ reveals a different result by obtaining positive percentages at the annual and seasonal scale.
Figure 2c shows the TASMAX extremes; only data above the observational 90th percentile set for the maximum temperatures are considered. The overall picture is different from Fig. 2a. At the annual scale five RCMs display DAVs ranging from −3.3 % to 1.1 %, while the other eight models reveal added value, particularly DMI, KNMI, and SMHI. For winter, nine models show very noticeable added value, with percentages above 17.8 %. As before, the ICTP RCM stands out due to the negative DAVs of −6.6 %. Similar to winter, the summer also shows higher gains for seven RCMs, ranging from 14.1 % to 23.3 %. For this season, the land–atmosphere feedback plays a major role, affecting the representation of convective clouds, since these are more locally driven for this time of the year, thus possibly affecting TASMAX (Knist et al., 2020). Therefore, high-resolution simulations, together with improvements in the representation of convection activity, result in added value for temperature and for precipitation (Careto et al., 2022), since most precipitation during this season is convective (Azorin-Molina et al., 2014). The DAVs for spring and autumn are, however, more limited, ranging from −4.9 % to 9.6 %; five RCMs for spring and three for autumn reveal neutral DAVs, representing a performance similar to the driving ERA-Interim in terms of the Perkins skill score. ETHZ and CNRM63 RCMs display negative DAVs for both spring and autumn.
Similar to Fig. 2c, the TASMIN extreme DAVs are computed only from the values below the 10th observational percentile from minimum temperatures, which revealed notable losses. In this case, four RCMs display detrimental effects, namely GERICS and MPI with losses higher than −22 %. In fact, these two RCMs, together with SMHI, also reveal negative DAVs for the individual seasons, particularly spring and autumn. From all seasons, only winter has a somewhat high added value for eight RCMs, with values around 10 % up to 14 %. For this season, the 10th percentile threshold is well below 0 ∘C, implying a limited influence from the problems related to snowmelt in the models. For the other seasons and models, the performance of the RCMs is close to the driving simulations, hence the nearly neutral percentages. The exception is CNRM53 for summer with −11.1 %. For spring and autumn, the 10th percentile threshold is positive and near 0 ∘C, which means a strong influence from these problematic bins. On the other hand, for summer the cut-off threshold is well above 0 ∘C, but at the same time there is little to no snow within the domain during this season.
Figure S2 in the Supplement shows a similar metric, with all RCM and driving ERA-Interim data first interpolated into the IGD resolution. The same orographic correction was implemented together with the interpolation procedures. The results shown in Fig. S2 reveal overall negative DAVs in comparison to Fig. 2. Despite the differences, the RCMs still display similar inter-model variability, particularly for both TASMAX and TASMAX extremes (Fig. S2a and b). The main differences between the two approaches occur for TASMIN (Fig. S2b), with the vast majority of RCMs and seasons displaying more evidently detrimental effects with this second methodology. As for the TASMIN extremes, while in Fig. 2d winter had most models showing noteworthy gains, in Fig. S2d the annual scale and all the seasons either display neutral DAVs or high losses. With this approach the high-resolution orography is incorporated into ERA-Interim. This fact results in substantially improving the low-resolution PDF, hence the lower values. However, since ERA-Interim is downscaled, not only are spurious values introduced, but they are also enhanced due to the orography change, increasing the uncertainty associated with this second approach.
Figure 3 shows the same DAV metric as in Fig. 2, but instead of pooling together all values from the Iberian Peninsula, only the data within each low-resolution grid cell are considered, thus having its own independent percentile set and PDFs. The spatial DAVs for TASMAX considering the whole PDF are shown in Fig. 3a; the gains are mostly focused on coastal sites, particularly over the Mediterranean. Previous works such as Di Luca et al. (2013), Vautard et al. (2013), and Cardoso and Soares (2021) also show added value at coastal sites, namely for the Mediterranean coast, mostly due to a better representation of the land–sea boundary and associated differential warming, as well as due to improvements in the representation of breezes. The overall results correlate well with those shown in Fig. 2a; i.e. models with the most points with added value will inevitably reveal gains at the Iberian Peninsula scale and vice versa. At the annual scale, relevant gains of about 25 %, particularly in the Balearic Islands, are shown in coastal areas, while the gains are limited in points of the interior, where, for instance, the negative values for DHMZ dictate the losses found in Fig. 2a. RCMs such as GERICS, IPSL, or MPI, which reveal slightly positive DAVs for most points, have the highest score for the entire Iberian Peninsula (Fig. 2a). Seasonally the picture is different. Summer is revealed to have the largest differences between the coast side and the interior. Still, all models have notable gains over central Spain and losses over Portugal. Winter shows six models with negative DAVs throughout the domain, namely DMI and ICTP. In the opposite sense, the other RCMs for winter display higher added value throughout the entire domain. Spring also emerges with some gains for 10 RCMs, contrasting with autumn, when models reveal a performance similar to the driving simulation. The exception for autumn is Gibraltar due to a relevant detrimental effect. In fact, in the other seasons and at the annual scale, Gibraltar has a large negative DAV.

Figure 3Yearly and seasonal spatial distribution added values (DAVs) of the Iberian Peninsula between the RCMs and the ERA-Interim reanalysis for the 1989–2008 period taken from the hindcast EURO-CORDEX simulations, with the IGD regular dataset as a reference for (a) maximum daily temperature considering the whole PDF, (b) minimum daily temperature considering the whole PDF, (c) maximum daily temperature extremes only considering the values above the observational 90th percentile from maximum temperatures for each ERA-Interim grid point, and (d) minimum daily temperature extremes only considering the values below the observational 10th percentile from minimum temperatures for each ERA-Interim grid point. All RCM data were previously interpolated to 0.1∘ regular resolution from the observations, while the observations were interpolated into the ERA-Interim resolution.
While the maximum temperature revealed some widespread gains, the picture for TASMIN in Fig. 3b is quite different, still correlating well with the results for the regional overview (Fig. 2b). The DAVs for minimum temperature reveal losses in the interior for all timescales, while a positive added value occurs at coastal sites. At the seasonal scale, RCMs such as CCLM and CNRM63 DMI for summer or CNRM53 for winter, which reveals detrimental effects in locations from the interior, also show noteworthy losses in Fig. 2b. An exception is the MOHC RCM for summer; despite the high losses for the southern region of the peninsula, the larger gains in points over the north and Balearic Islands are able to even out the results obtained at a regional scale.
The TASMAX extremes (Fig. 3c) reveal more variability in comparison to Fig. 3a. Still, good agreement with the Iberian Peninsula DAVs (Fig. 2c) is found for almost all seasons. At the annual scale, the lower values for the five RCMs identified in Fig. 2c are due to losses located over Portugal and northern Spain, while the other models reveal larger gains in the central regions of Spain. For winter, Fig. 2c reveals most models with maximum DAVs, except in four RCMs. This high added value for this season comes from the widespread positive percentages over the domain and some coastal points (Fig. 3c). The models with lower values in the regional overview reveal a detrimental effect for most of the peninsula, masking the added value for points located near the coast. For spring, although there is widespread positive added value for the entire domain, the results show the opposite in Fig. 2c. These differences highlight the fact that the results in Fig. 2 are not a spatial mean from the DAVs in Fig. 3, and care must be taken in the comparison. For summer, the spatial variability for all RCMs is higher in comparison to winter and spring. For this case, larger added values are found over a north–south stripe located at the centre of the peninsula, surrounded by a mix of negative and positive DAVs. The same pattern can be seen for autumn for nine RCMs, although it is limited to the southern half of the domain. Similar to spring, autumn also shows lower DAVs in Fig. 2c. These lower values in the regional DAVs are derived from the losses over Portugal and northern Spain. However, the other RCMs, apart from ICTP, all reveal added value throughout the domain, corroborating the results in Fig. 2c.
The next panel shows the results for the TASMIN extremes (Fig. 3d). In Fig. 2d, the annual, spring, summer, and autumn values reveal losses. However, in Fig. 3d, the models do not reveal such detrimental effects, with neutral DAVs in the interior and larger gains for locations near the coast. The exceptions are GERICS, MPI, and SMHI with noteworthy losses at the annual scale and in winter and autumn, in agreement with Fig. 2d. As for winter, eight RCMs reveal noticeable added value not only for coastal sites but also for points scattered in the interior. In fact, these same eight RCMs also show larger gains for the Iberian Peninsula DAVs in Fig. 2d.
3.2 Historical (1971–2005)
This section presents the results obtained by applying the DAVs to all available historical simulations from EURO-CORDEX for the same Iberian Peninsula domain. In the Supplement Figs. S3 and S4 show the PDFs for all considered high- and low-resolution simulations. Although with a longer time span relative to the hindcast simulations, all PDFs still reveal a representation close to each other and to the observations in terms of location and shape parameters, indicating a good overlapping of all PDFs. Once again, this fact could anticipate an overall difficulty of models displaying added value. Moreover, the same issues found in the hindcast simulations due to snowmelt, snow cover, and snow depth are still present in this case, not only for the high resolution but also for the driving GCMs as well. However, for the lower resolutions, these uncertainties are not as pronounced as in the higher resolutions, since the ability of GCMs to reproduce the orographic features is reduced. Moreover, as with precipitation (Careto et al., 2022), the GCM–RCM pairs reveal higher variability in comparison with the ERA-Interim-driven models.
Figure 4a shows the results of DAVs for TASMAX by considering the whole PDF. At the annual scale, there is some added value, particularly for models driven by IPSL, MPI1, NCC, and NOAA GCMs, peaking at 21.5 % for NCC–GERICS. Regarding the seasonal added value, 21 GCM–RCM pairs, namely models forced by ICHEC, IPSL, and MPI, reveal noteworthy added value for either summer or winter, with gains well above 30 %. At the same time, for the same models, if summer reveals positive values, winter reveals some losses or neutral values and vice-versa. These losses can be noticeable, almost reaching −10 %. Other pairs, such as IPSL_MR–IPSL, MPI1–ICTP, and MPI1–DMI, also reveal this behaviour, although with more limited gains. Nevertheless, for the intermediate seasons, the same GCM–RCM pairs mostly display added value, particularly for spring. On the other hand, RCMs driven by the CNRM GCM reveal an absence of added value. Apart from isolated gains, only GERICS displays gains throughout the year. The other 14 pairs also show relevant gains for all seasons, with ICHEC2–IPSL, IPSL_–GERICS, and MPI1–MPI standing out with values above 25 %. For the MOHC-driven models, only the autumn displays lower values in comparison with the other seasons. In a similar sense, all models driven by the NCC GCM reveal high added values for the first half of the year, yet the second half shows limited gains, particularly summer.
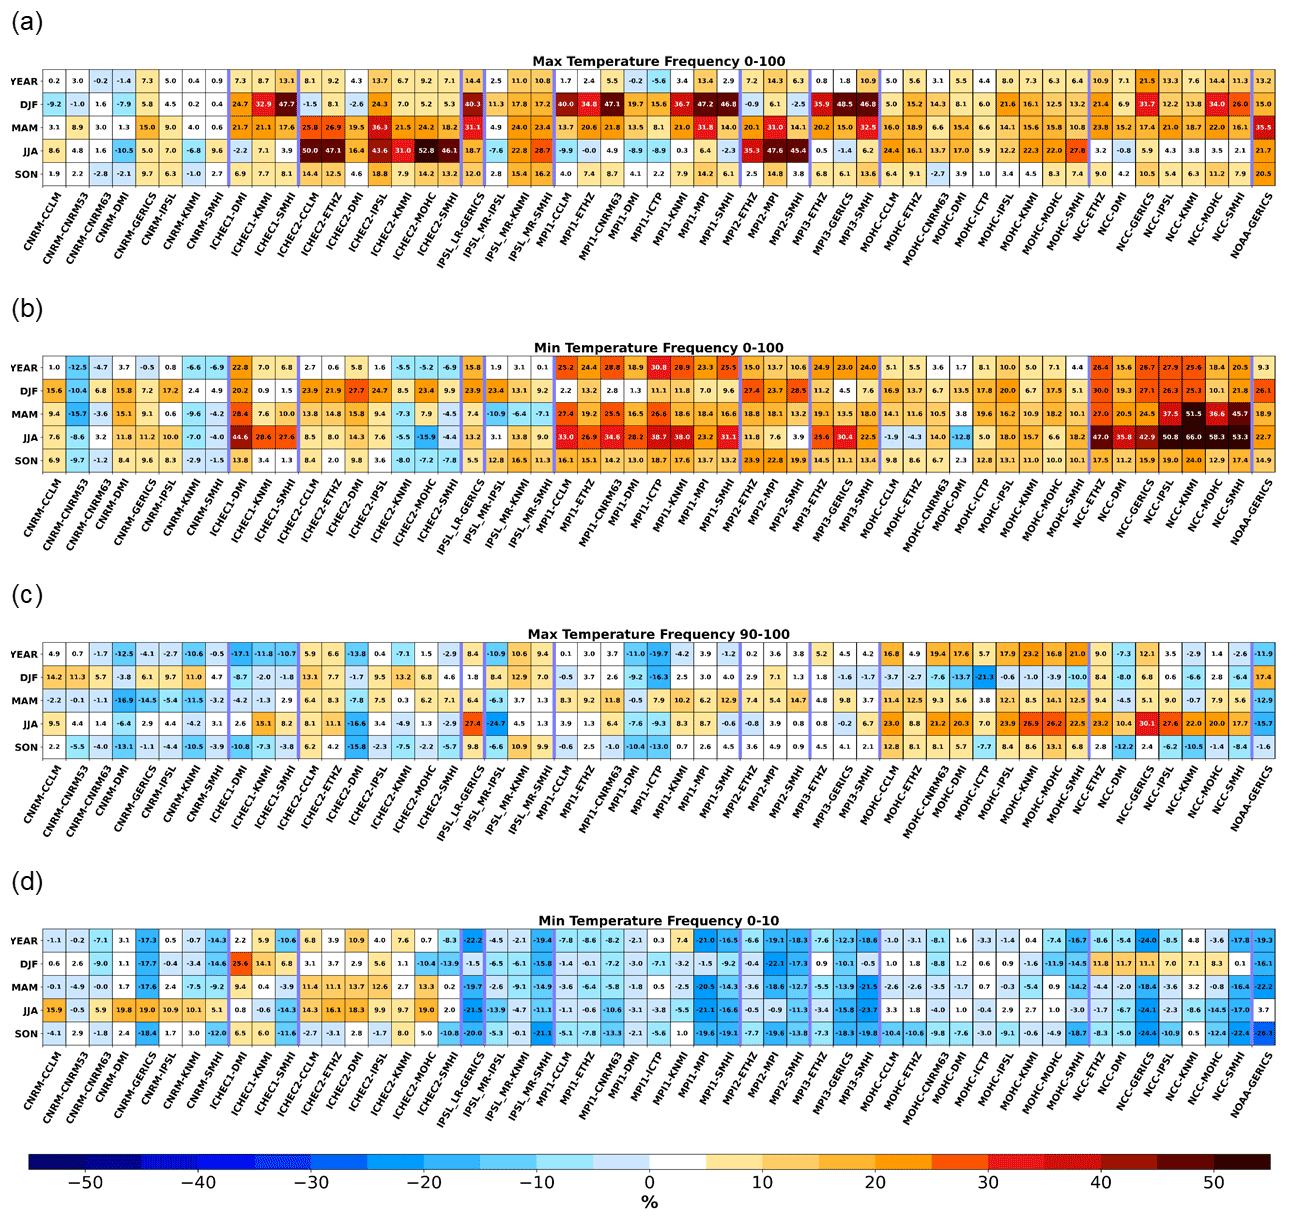
Figure 4Yearly and seasonal distribution added values (DAVs) of the Iberian Peninsula between the RCMs and the CMIP5 GCMs for the 1989–2008 period taken from the historical EURO-CORDEX simulations, with the IGD regular dataset as a reference for (a) maximum daily temperature considering the whole PDF shown in the left panels of Fig. S3, (b) minimum daily temperature considering the whole PDF shown in the right panels of Fig. S3, (c) maximum daily temperature extremes only considering the values above the observational 90th percentile from maximum temperatures, and (d) minimum daily temperature extremes only considering the values below the observational 10th percentile from minimum temperatures. All RCM data were previously interpolated to 0.1∘ regular resolution from the observations, while the observations were interpolated into each CMI5 GCM resolution. The thick blue lines separate the RCMs driven by a different GCM.
The overall results for RCMs driven by the same GCM are similar for most cases, while no connection is found between models forced by different GCMs. This lack of connection was also reported in Careto et al. (2022) for the EURO-CORDEX precipitation. Still, the lower DAVs for some GCM groups might be related to the quality of the driving simulation itself, namely across the lateral boundary forcing zone. Following Brands et al. (2013), from all GCMs considered, MPI and MOHC outperform the others for these regions. However, RCMs driven by either GCM still exhibit higher added value in some cases, while CNRM-driven models have losses. In fact, the CNRM GCM in McSweeney et al. (2015) reveals a good performance, together with NOAA, MOHC, and MPI. Yet, most RCMs driven by the last three GCMs have notable added value. Moreover, the same authors state that IPSL_MR and NCC have an intermediate performance, while ICHEC and IPSL_LR stand out with a poorer performance. Also, Jury et al. (2015) identify IPSL_MR GCM as having a poor performance, particularly for upper-air variables over the forcing region of the EURO-CORDEX RCMs.
For temperature, the effect of the orographic correction with a constant lapse rate in the interpolation may also be a relevant factor affecting the individual DAV. In the end, the scores obtained for the low resolution might dictate the ability of RCMs to improve the signal. For instance, at the annual scale, the RCMs driven by GCMs with a high Perkins skill score, such as CNRM with 0.84, reveal lower DAVs in comparison with other pairs. At the same time, RCMs forced by GCMs also with high scores, such as MOHC with 0.85 or NCC with 0.86, still reveal noteworthy added value. This suggests that other factors may play a relevant role, such as how well the low resolutions depict storm tracks. An RCM driven by a low resolution, which reveals such biases, will not be able to correct this signal. In fact, following Zappa et al. (2013) ICHEC and MOHC GCMs reveal a correct placement of the storm tracks relative to the ERA-Interim reanalysis. On the other hand, CNRM has a placement that is too far southward, while the other models tend to have a storm track that is too zonal.
Contrary to the results shown in the hindcast, TASMIN for the EURO-CORDEX historical simulations mostly reveals positive values (Fig. 4b). For this case, both the low- and high-resolution models are affected by the same problems related to snow (García-Díez et al., 2015; Terzago et al., 2017), namely at the annual scale and in the colder seasons. The inter-model variability for TASMIN is higher in comparison to TASMAX in Fig. 4a, with values ranging from −17.3 % to 66 %. At the annual scale, most models reveal added value, except for CNRM-driven RCMs and some models forced by ICHEC2, IPSL_LR, and MOHC. Seasonally, the pairs with notable gains for the annual scale also show higher added values. From these, NCC-driven models are highlighted, with larger gains for spring and summer, although winter and autumn also reveal added value around 20 %. Moreover, four GCM groups display added value for at least one season, with percentages above 30 %. On the other hand, three RCMs forced by CNRM and another three by ICHEC2 have noticeable losses, namely CNRM–CNRM53 for winter and spring and ICHEC2–MOHC for summer.
From the PDFs in Fig. S4, one can infer the large gains found for TASMIN and for TASMAX in Fig. 4. In Fig. S4, the GCMs tend to underestimate maximum temperature, while minimum temperature is overestimated. Moreover, the variability from the GCMs is lower in comparison to the observations. For the high-resolution models, these issues are partly corrected, hence the added value (Fig. S3). However, for maximum temperature, the RCMs still tend to underestimate TASMAX. As for TASMIN, the issues related to snow–albedo feedback are more evident for the high-resolution models (Minder et al., 2016), enhanced by the higher definition of topographic features. On the contrary, the RCMs reveal a closer mean and standard deviation relative to the IGD. Nevertheless, these issues might cause an overall underestimation of the mean for TASMIN. Cardoso et al. (2019) for Portugal and Vautard et al. (2020) for the Iberian Peninsula also found a cold bias for mean temperature from the historical RCMs. These biases were also present in the forcing models, matching the results found here.
The next panel shows the results for the TASMAX extremes (Fig. 4c). The added value is limited in comparison to Fig. 4a, with more models revealing detrimental effects at the annual scale and for at least three seasons. In fact, 12 GCM–RCM pairs reveal this pattern, sometimes with losses surpassing −10 %, which is capped at −24.7 % for IPSL_MR–IPSL at the summer season. Yet, 26 pairs reveal positive DAVs for at least three seasons, with a focus on either winter or summer, whose values range from approximately 5 % to 30 %. For the hindcast simulations (Fig. 2c), only the winter and summer seasons have added value, whereas the values for spring and summer were limited and sometimes negative. MOHC-driven models also reveal large gains for summer that are well above 20 % in most cases. Moreover, in some cases, the results for the TASMAX extremes differ; noticeable added value occurs for seasons whose models had a worse performance in Fig. 4a. This behaviour is particularly evident for models driven by ICHEC or NCC GCMs. Also, pairs that have higher gains in Fig. 4a reveal either an absence or a loss of value, occurring namely for MPI1- and MPI3-driven models for the winter and summer season for RCMs forced by MPI2.
Contrary to the previous cases, there is an overall detrimental effect for the cold extremes (Fig. 4d), in line with the results shown in the hindcast simulations (Fig. 2d). These losses are associated with the known problems derived from the snow–albedo–atmosphere feedback; however, in this case, the low-resolution GCMs are also somewhat affected. Still, 15 out of 53 GCM–RCM pairs reveal losses at the annual scale higher than −10 %, whose effects are also extended for the individual seasons. Only a few RCMs still display added values on the order of 10 %. From these, models forced by CNRM for the summer season are highlighted, as are models driven by NCC for winter.
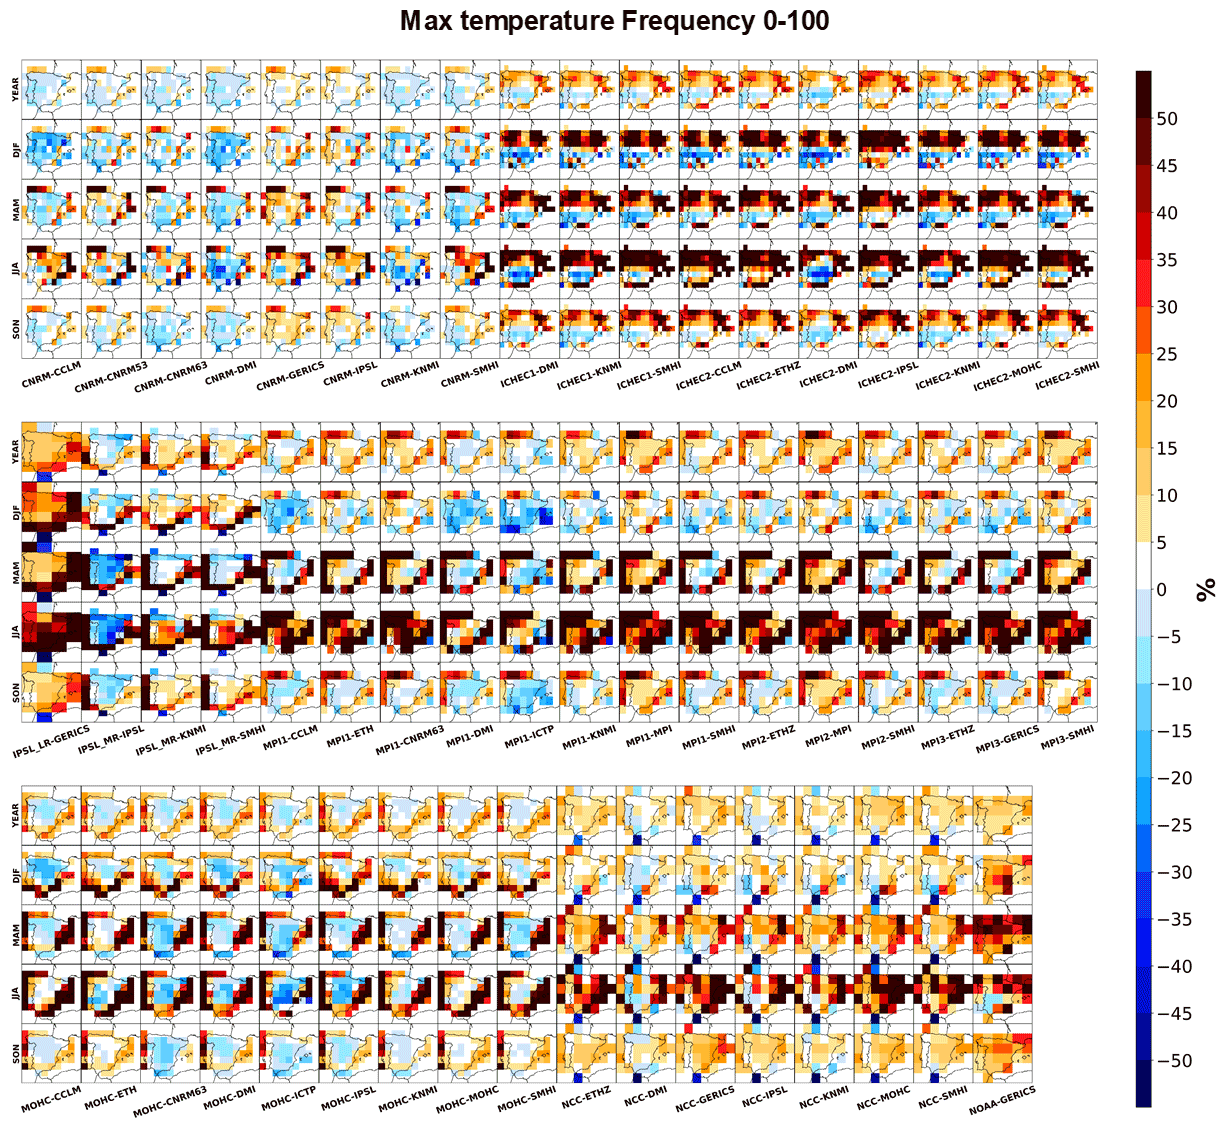
Figure 5Yearly and seasonal distribution added values (DAVs) of the Iberian Peninsula for the historical (1971–2005) EURO-CORDEX RCMs, with the IGD as a reference for the maximum daily temperature, considering the whole PDF. All RCM data were previously interpolated to 0.1∘ regular resolution from the observations, while the observations were interpolated into each CMI5 GCM resolution.
As with the hindcast simulations and in Careto et al. (2022) for the EURO-CORDEX precipitation variable, a second method was implemented (Fig. S5), whereby all high- and low-resolution models are interpolated into the IGD resolution. The interpolation of the IGD reduces the variability, and thus the probability of extremes is lower. By interpolating the low-resolution GCMs with an orography correction, the results are substantially improved, thus increasing the score of the GCMs and reducing the DAVs. In fact, this is precisely what occurs for TASMAX and TASMIN in Fig. S5a and b, where the overall DAVs are lower, although still agreeing with Fig. 4 for the most part. As for the extremes (Fig. S5c and d), the results reveal a range similar to Fig. 4, but some differences arise. For instance, for the TASMAX extremes, despite revealing lower gain in comparison to Fig. 4c, IPSL_LR–GERICS clearly displays large added value throughout the year. As for the TASMIN extremes, the results correlate well with those displayed in Fig. 4d, although with more pronounced losses. Similar to ERA-Interim, downscaling the GCMs this way causes spurious values, increasing the uncertainty associated with the DAVs.
The next set of figures displays the DAV results from Fig. 4 but extended for a spatial overview (Figs. 5 to 8). Overall, as with the hindcast (Fig. 3), the added value is more focused over the coastal regions, primarily due to the better representation of land–ocean boundaries (Di Luca et al., 2013; Vautard et al., 2013; Cardoso and Soares, 2021). Still, all figures reveal good agreement with the DAVs shown in Fig. 4 by considering the entire Iberian Peninsula. Moreover, as with hindcast, the results from Fig. 4 are not a mean obtained from the spatial DAVs in Figs. 5 to 8 but a result of pooling together all the information from within each low-resolution grid point instead of pooling together the information from the entire domain.

Figure 6Yearly and seasonal distribution added values (DAVs) of the Iberian Peninsula for the historical (1971–2005) EURO-CORDEX RCMs, with the IGD as a reference for the minimum daily temperature, considering the whole PDF. All RCM data were previously interpolated to 0.1∘ regular resolution from the observations, while the observations were interpolated into each CMI5 GCM resolution.
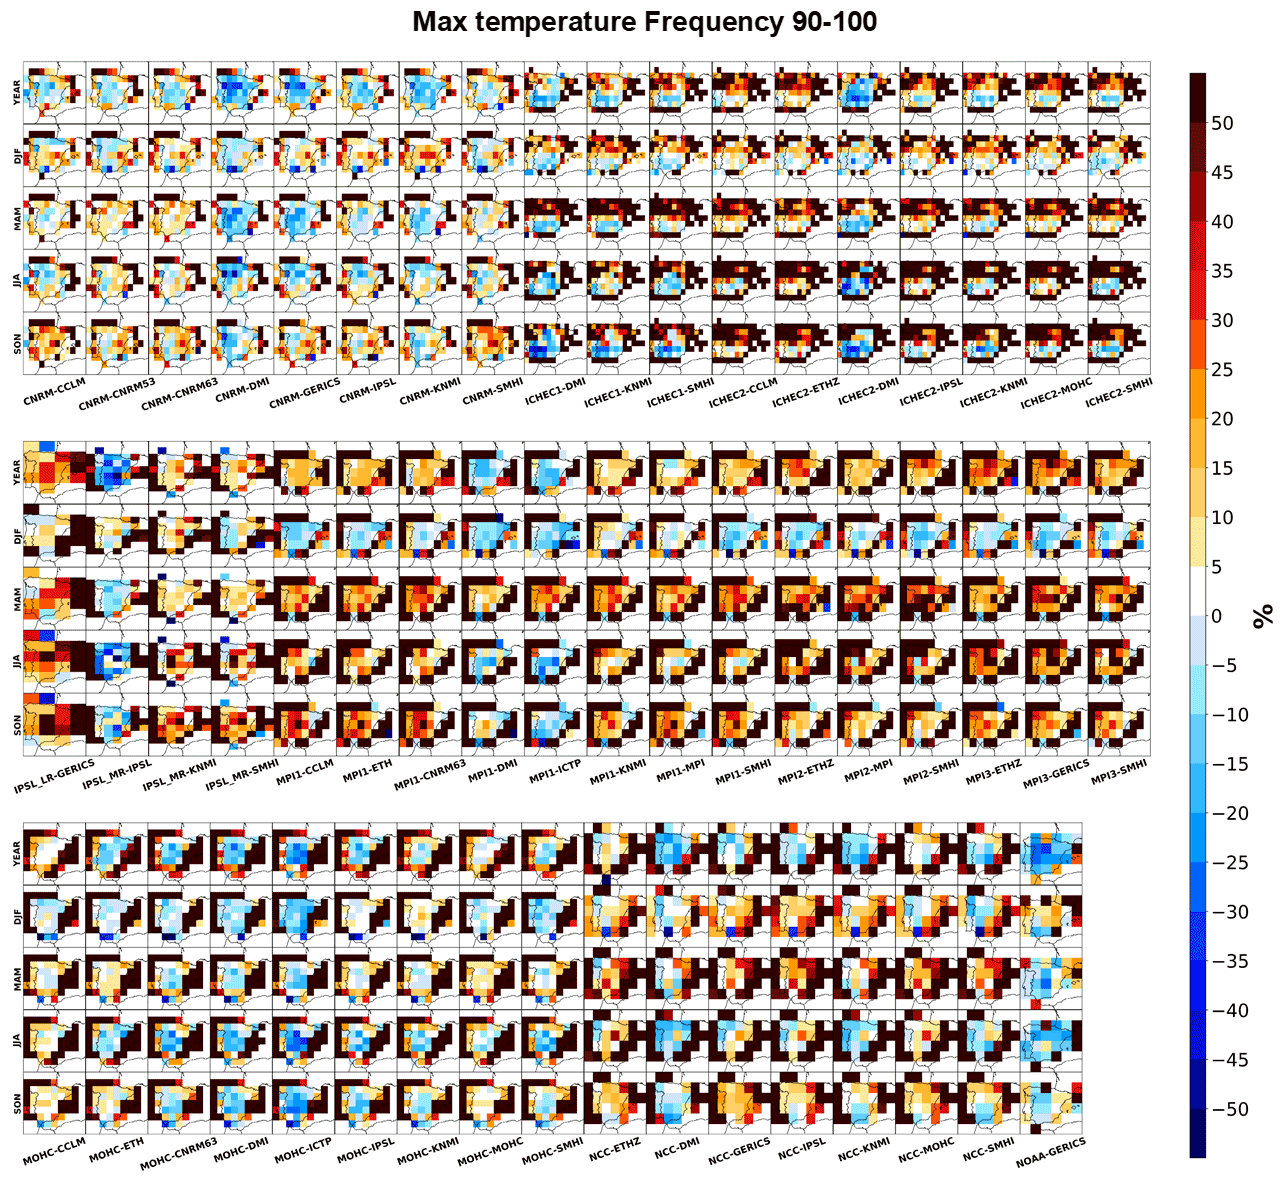
Figure 7Yearly and seasonal distribution added values (DAVs) of the Iberian Peninsula for the historical (1971–2005) EURO-CORDEX RCMs, with the IGD as a reference for the maximum daily temperature, only considering the values above the observational 90th percentile from maximum temperatures for each GCM grid box. All RCM data were previously interpolated to 0.1∘ regular resolution from the observations, while the observations were interpolated into each CMI5 GCM resolution.
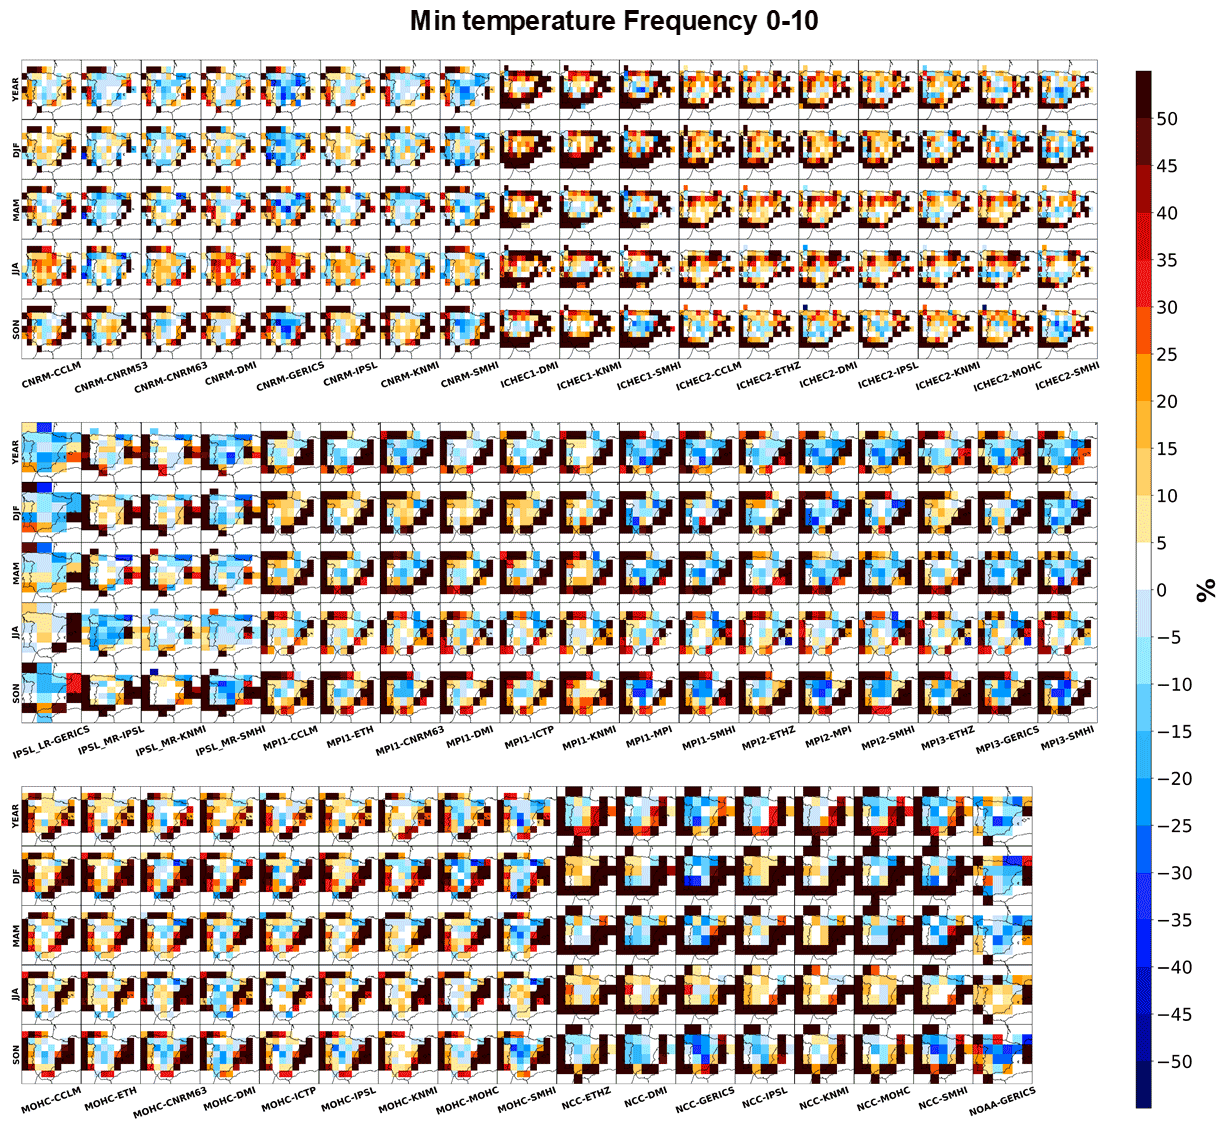
Figure 8Yearly and seasonal distribution added values (DAVs) of the Iberian Peninsula for the historical (1971–2005) EURO-CORDEX RCMs, with the IGD as a reference for the minimum daily temperature, only considering the values below the observational 10th percentile from maximum temperatures for each GCM grid box. All RCM data were previously interpolated to 0.1∘ regular resolution from the observations, while the observations were interpolated into each CMI5 GCM resolution.
Figure 5 displays the results for TASMAX. For CNRM, the gains are more focused on spring and summer and are particularly evident near the coast. However, notable losses still occur for most of the interior of the Iberian Peninsula for all seasons, namely for winter and summer. As for ICHEC-driven RCMs, both reveal very high added value in the northern half of the domain. From this group, the ICHEC2–IPSL RCM is highlighted, which reveals positive added value throughout the year and for the entire domain, resulting in an overall good performance in Fig. 4a. IPSL-LR–GERICS also reveals a noteworthy added value, apart from a point located over Gibraltar, correlating well with the results shown in Fig. 4a. On the other hand, IPSL_MR, MPI, and MOHC-driven RCMs reveal similar behaviours among themselves, with gains focused in coastal areas. This occurs primarily for spring and summer, resembling the DAVs for the models forced by CNRM, although with a higher amplitude. Differently to most of the previous cases, the models driven by NCC display gains for the entire domain, with losses over Gibraltar, like IPSL-LR–GERICS.
The spatialization of TASMIN is shown in Fig. 6, revealing a similar pattern as in Fig. 5, with gains at the coast and detrimental effects in the interior, although displaying a stronger contrast. Depending on the strength of these detrimental effects, the results for Fig. 4b might reveal neutral effects or even losses. For instance, the large losses found for CNRM–CNRM53 for all timescales or IPSL-MR–IPSL for spring effectively impacted the regional overview.
Figures 7 and 8 show the results for the extremes for TASMAX and TASMIN, respectively. For the maximum temperature extremes related to heatwaves, the gains over the coastal regions are even more relevant than in Fig. 5. Nevertheless, the losses found for the interior are able to even out these gains, leading to the limited added value in Fig. 4c. In a way, these limited DAVs in the interior of the domain are the values that determine if a specific model shows added value in the DAVs considering all of Iberia. This is particularly relevant for the TASMIN extremes. Fig. 4d displays most pairs with a detrimental effect for the entire domain. However, higher gains are still found for the coastal regions in almost all cases. The importance of the spatial overview is highlighted here. While a particular model reveals losses for the whole domain, this fact might not be true at a more local scale.
In this work a distribution added value metric proposed by Soares and Cardoso (2018) is used to gauge the added value of higher-resolution simulations confronting each low-resolution driving GCM or ERA-Interim, with the IGD observations over the Iberian Peninsula as a baseline. The DAVs were applied to the EURO-CORDEX hindcast (1989–2008) and historical (1971–2005) simulations for the variables maximum and minimum temperatures. Overall, the high-resolution models are able to provide some added value, particularly for TASMAX. On the other hand, minimum temperature reveals some difficulties obtaining added value for the hindcast simulations, mainly when the whole PDF is considered and also for the extremes in the historical simulations, partly due to problems associated with the snow–albedo–atmosphere feedback, derived from uncertainties related to snow cover, depth, and melt (García-Díez et al., 2015; Minder et al., 2016; Terzago et al., 2017). These uncertainties substantially affect the PDFs from the RCMs around 0 ∘C by overestimating the frequency of events in comparison with the observations. This poor representation has a more significant impact on the hindcast simulations; the ERA-Interim reanalysis does not reveal these kinds of issues due to the incorporation of temperature observations (Prömmel et al., 2010). Nevertheless, the finer details from the downscaling allow more spatial variability of temperature, which in the end could result in added value. This fact is particularly relevant for coastal regions, where the improvements of the boundary between ocean and land result in larger gains in comparison to points located in the interior. For the maximum and minimum temperature extremes, the results are more limited. Still, for the TASMAX extremes, winter and summer reveal evident added value, contrasting with the neutral or negative DAVs for spring and autumn. As for the TASMIN extremes, depending on the season, the DAVs depend more on the season. For instance, the 10th percentile for winter is too low, not incorporating the problems around 0 ∘C, thus revealing some added value. The opposite occurs for spring and autumn, which revealed more neutral values. As for summer the temperatures are too high for snow in most parts of the territory, yet the models still revealed losses.
For the historical simulations, no connection is found between each GCM downscaling group, while the results for multiple RCMs forced by the same GCM reveal a similar range. Each driving simulation has its own resolution and performance, which could impact the added value from the higher resolution as in Careto et al. (2022) for precipitation. However, the interpolation with the orographic correction considering a constant lapse rate might in the end have a more significant impact on the performance of the individual GCMs and RCMs. Moreover, other factors such as the parameterizations of smaller-scale processes and the representation of feedback systems can have a major impact on how a variable represents reality. Another factor that may play a major role is related to how well GCMs represent storm tracks. If a GCM is not able to properly represent storm tracks, then the downscaling RCMs will inherent these issues.
Similar to the hindcast simulations, the gains of the historical spatial DAVs are also more focused in coastal regions. Models which reveal more substantial gains and neutral or slightly positive DAVs in the interior tend to have higher values at the Iberian Peninsula scale, although care must be taken when comparing the spatial and regional DAVs as both follow slightly different approaches. Still, the two methods correlate well, primarily for the whole PDF case. As for the extremes, the different thresholds for each individual point make a direct comparison difficult.
A second methodology was also implemented, following the secondary results in Careto et al. (2022). In this case, all data are interpolated with an orographic correction to the resolution from the observations. The interpolation from the high-resolution observations to each of the low-resolution model grids degrades the observational PDF. However, by downscaling the driving low resolution with an orographic correction considering a constant lapse rate, unrealistic values can be generated, not only due to the interpolation, but also derived from the higher-resolution orography. This method substantially improves the representation of temperature at the cost of not considering land–atmosphere feedbacks, thus resulting in a larger uncertainty. In fact, for this case, the low-resolution scores are improved, resulting in an overall lower DAV.
The higher-resolution EURO-CORDEX models do reveal some added value for temperature. In many situations the RCMs can improve the lower-resolution signal, all relative to the observational dataset considered. For instance, in the historical simulations, the high resolution mitigates the annual and seasonal biases from the GCMs due to a better representation of the observable PDF. On the other hand, the problems found for the RCMs, particularly for the hindcast simulations, do affect the DAVs negatively, as revealed by the negative values found. Nevertheless, the higher resolution, together with a finer representation of the local topography, improved coastal resolution and consequently land–sea contrasts and local feedback systems, which ultimately leads to added value.
All model and observational datasets are publicly available. The regional and global model data are available through the Earth System Grid Federation portal (Williams et al., 2011; https://esgf.llnl.gov/, last access: 29 April 2021). The ERA-Interim reanalyses is avaiable at the ECMWF portal after registration (https://apps.ecmwf.int/datasets/data/interim-full-daily/levtype=sfc/, last access: 29 April 2020). The Iberia01 dataset is publicly available through the DIGITAL.CSIC open science service (Herrera et al., 2019a, https://doi.org/10.20350/digitalCSIC/8641).
The supplement related to this article is available online at: https://doi.org/10.5194/gmd-15-2653-2022-supplement.
JAMC computed all results and developed the paper with contributions from all co-authors. PMMS and RMC developed the metric on which this paper is based. SH, JMG, PMMS, and RAMC previously developed the observation-based Iberian Gridded Dataset.
The contact author has declared that neither they nor their co-authors have any competing interests.
Publisher's note: Copernicus Publications remains neutral with regard to jurisdictional claims in published maps and institutional affiliations.
The authors would like to thank all the individual participating institutes listed in Tables S1 and S2 and the Earth System Grid Federation infrastructure for providing all the model data used in this study. The authors also acknowledge the Iberian Gridded Dataset (IGD) http://hdl.handle.net/10261/183071 (last access: 28 January 2021).
João António Martins Careto is supported by the Portuguese Foundation for Science and Technology (FCT) with the doctoral grant SFRH/BD/139227/2018 financed by national funds from the MCTES within the Faculty of Sciences, University of Lisbon. Pedro Miguel Matos Soares would like to acknowledge the financial support of FCT through the project EEA-Financial Mechanism 2014–2021 and the Portuguese Environment Agency through Pre-defined Project-2 National Roadmap for Adaptation XXI (PDP-2). Rita Margarida Cardoso is supported by the FCT under the project LEADING (PTDC/CTA-MET/28914/2017). This work was also supported by project FCT UIDB/50019/2020 – Instituto Dom Luiz (IDL).
This paper was edited by Augustin Colette and reviewed by two anonymous referees.
Azorin-Molina, C., Tijm, S., Ebert, E. E., Vicente-Serrano, S. M., and Estrela, M. J.: Sea breeze thunderstorms in the eastern Iberian Peninsula. Neighborhood verification of HIRLAM and HARMONIE precipitation forecasts, Atmos. Res., 139, 101–115, https://doi.org/10.1016/j.atmosres.2014.01.010, 2014.
Ban, N., Caillaud, C., Coppola, E., Pichelli, E., Sobolowski, S., Adinolfi, M., Ahrens, B., Alias, A., Anders, I., Bastin, S., and Belušić, D.: The first multi-model ensemble of regional climate simulations at kilometer-scale resolution, Part I: Evaluation of precipitation, Clim. Dynam., 57, 275–302, https://doi.org/10.1007/s00382-021-05708-w, 2021.
Brands, S., Herrera, S., Fernández, J., and Gutiérrez, J. M.: How well do CMIP5 Earth System Models simulate present climate conditions in Europe and Africa?, Clim. Dynam., 41, 803–817, https://doi.org/10.1007/s00382-013-1742-8, 2013.
Cardoso, R. M., and Soares, P. M. M.: Is there added value in the EURO-CORDEX hindcast temperature simulations? Assessing the added value using climate distributions in Europe, Int. J. Climatol., 1–16, https://doi.org/10.1002/joc.7472, 2022.
Cardoso, R. M., Soares, P. M. M., Miranda, P. M. A., and Belo-Pereira, M.: WRF high resolution simulation of Iberian mean and extreme precipitation climate, Int. J. Climatol., 33, 2591–2608, https://doi.org/10.1002/joc.3616, 2013.
Cardoso, R. M., Soares, P. M., Lima, D. C., and Miranda, P. M.: Mean and extreme temperatures in a warming climate: EURO CORDEX and WRF regional climate high-resolution projections for Portugal, Clim. Dynam., 52, 129–157, https://doi.org/10.1007/s00382-018-4124-4, 2019.
Careto, J. A. M., Soares, P. M. M., Cardoso, R. M., Herrera, S., and Guttiérrez, J. M.: Added value of EURO-CORDEX high-resolution downscaling over the Iberian Peninsula revisited – Part 1: Precipitation, Geosci. Model Dev., 15, 2635–2652, https://doi.org/10.5194/gmd-15-2635-2022, 2022.
Christensen, J. H. and Christensen, O. B.: A summary of the PRUDENCE model projections of changes in European climate by the end of this century, Climatic Change, 81, 7–30, https://doi.org/10.1007/s10584-006-9210-7, 2007.
Christensen, J. H., Hewitson, B., Busuioc, A., Chen, A., Gao, X., Held, I., Jones, R., Kolli, R. K., Kwon, W.-T., Laprise, R., Magaña Rueda, V., Mearns, L., Menéndez, C. G., Räisänen, J., Rinke, A., Sarr, A., and Whetton, P.: Regional climate projections, in: Climate Change 2007: The Physical Science Basis. Contribution of Working Group I to the Fourth Assessment Report of the Intergovernmental Panel on Climate Change, edited by: Solomon, S., Qin, D., Manning, M., Chen, Z., Marquis, M., Averyt, K. B., Tignor, M., and Miller, H. L., Cambridge University Press, Cambridge, UK and New York, NY, TRN: GB07CC205, 2007.
Christensen, O. B., Drews, M., Christensen, J. H., Dethloff, K., Ketelsen, K., Hebestadt, I., and Rinke, A.: The HIRHAM regional climate model, Version 5 (beta), https://www.dmi.dk/fileadmin/Rapporter/TR/tr06-17.pdf (last access: 29 April 2021), 2007.
Ciarlo, J. M., Coppola, E., Fantini, A., Giorgi, F., Gao, X., Tong, Y., Glazer, R. H., Alavez, J. A. T., Sines, T., Pichelli, E., and Raffaele, F.: A new spatially distributed added value index for regional climate models: the EURO-CORDEX and the CORDEX-CORE highest resolution ensembles, Clim. Dynam., 57, 1403–1424, https://doi.org/10.1007/s00382-020-05400-5, 2020.
Coppola, E., Sobolowski, S., Pichelli, E., Raffaele, F., Ahrens, B., Anders, I., Ban, N., Bastin, S., Belda, M., Belusic, D., and Caldas-Alvarez, A.: A first-of-its-kind multi-model convection permitting ensemble for investigating convective phenomena over Europe and the Mediterranean, Clim. Dynam., 55, 3–34, https://doi.org/10.1007/s00382-018-4521-8, 2020.
Dee, D. P., Uppala, S. M., Simmons, A. J., Berrisford, P., Poli, P., Kobayashi, S., Andrae, U., Balmaseda, M. A., Balsamo, G., Bauer, D. P., and Bechtold, P.: The ERA-Interim reanalysis: Configuration and performance of the data assimilation system, Q. J. Roy. Meteor. Soc., 137, 553–597, https://doi.org/10.1002/qj.828, 2011.
Di Luca, A., de Elía, R., and Laprise, R.: Potential for added value in precipitation simulated by high-resolution nested regional climate models and observations, Clim. Dynam., 38, 1229–1247, https://doi.org/10.1007/s00382-011-1068-3, 2012.
Di Luca, A., de Elía, R., and Laprise, R.: Potential for small scale added value of RCM's downscaled climate change signal, Clim. Dynam., 40, 601–618, https://doi.org/10.1007/s00382-012-1415-z, 2013.
Froidevaux, P., Schlemmer, L., Schmidli, J., Langhans, W., and Schär, C.: Influence of the background wind on the local soil moisture–precipitation feedback, J. Atmos. Sci., 71, 782–799, https://doi.org/10.1175/JAS-D-13-0180.1, 2014.
García-Díez, M., Fernández, J., and Vautard, R.: An RCM multi-physics ensemble over Europe: multi-variable evaluation to avoid error compensation, Clim. Dynam., 45, 3141–3156, https://doi.org/10.1007/2Fs00382-015-2529-x, 2015.
Giorgi, F. and Bates, G. T.: The climatological skill of a regional model over complex terrain, Mon. Weather Rev., 117, 2325–2347, https://doi.org/10.1175/1520-0493(1989)117<2325:TCSOAR>2.0.CO;2, 1989.
Giorgi, F. and Mearns, L. O.: Approaches to the simulation of regional climate change: a review, Rev. Geophys., 29, 191–216, https://doi.org/10.1029/90RG02636, 1991.
Giorgi, F. and Mearns, L. O.: Introduction to special section: Regional climate modeling revisited, J. Geophys. Res.-Atmos., 104, 6335–6352, https://doi.org/10.1029/98JD02072, 1999.
Giorgi, F., Jones, C. and Asrar, G. R.: Addressing climate information needs at the regional level: the CORDEX framework, World Meteorological Organization (WMO) Bulletin, 58, 175–183, 2009.
Gutowski Jr., W. J., Takle, E. S., Kozak, K. A., Patton, J. C., Arritt, R. W., and Christensen, J. H.: A possible constraint on regional precipitation intensity changes under global warming, J. Hydrometeorol., 8, 1382–1396, https://doi.org/10.1175/2007JHM817.1, 2007.
Gutowski Jr., W. J., Giorgi, F., Timbal, B., Frigon, A., Jacob, D., Kang, H.-S., Raghavan, K., Lee, B., Lennard, C., Nikulin, G., O'Rourke, E., Rixen, M., Solman, S., Stephenson, T., and Tangang, F.: WCRP COordinated Regional Downscaling EXperiment (CORDEX): a diagnostic MIP for CMIP6, Geosci. Model Dev., 9, 4087–4095, https://doi.org/10.5194/gmd-9-4087-2016, 2016.
Herrera, S., Cardoso, R. M., Soares, P. M. M., Espírio-Santo, F., Viterbo, P., and Gutiérrez, J. M.: “Iberia01: Daily gridded (0.1º resolution) dataset of precipitation and temperatures over the Iberian Peninsula”, DIGITAL.CSIC [data set], https://doi.org/10.20350/digitalCSIC/8641, 2019a.
Herrera, S., Cardoso, R. M., Soares, P. M., Espírito-Santo, F., Viterbo, P., and Gutiérrez, J. M.: Iberia01: a new gridded dataset of daily precipitation and temperatures over Iberia, Earth Syst. Sci. Data, 11, 1947–1956, https://doi.org/10.5194/essd-11-1947-2019, 2019b.
Herrera, S., Soares, P. M., Cardoso, R. M., and Gutiérrez, J. M.: Evaluation of the EURO-CORDEX Regional Climate Models Over the Iberian Peninsula: Observational Uncertainty Analysis, J. Geophys. Res.-Atmos., 125, e2020JD032880, https://doi.org/10.1029/2020JD032880, 2020.
Hohenegger, C., Brockhaus, P., Bretherton, C. S., and Schär, C.: The soil moisture–precipitation feedback in simulations with explicit and parameterized convection, J. Climate, 22, 5003–5020, https://doi.org/10.1175/2009JCLI2604.1, 2009.
Imamovic, A., Schlemmer, L., and Schär, C.: Collective impacts of orography and soil moisture on the soil moisture-precipitation feedback, Geophys. Res. Lett., 44, 11682–11691, https://doi.org/10.1002/2017GL075657, 2017.
Jacob, D., Petersen, J., Eggert, B., Alias, A., Christensen, O. B., Bouwer, L. M., Braun, A., Colette, A., Déqué, M., Georgievski, G., and Georgopoulou, E.: EURO-CORDEX: new high-resolution climate change projections for European impact research, Reg. Environ. Change, 14, 563–578, https://doi.org/10.1007/s10113-013-0499-2, 2014.
Jacob, D., Teichmann, C., Sobolowski, S., Katragkou, E., Anders, I., Belda, M., Benestad, R., Boberg, F., Buonomo, E., Cardoso, R. M., Casanueva, A., Christensen, O. B., Christensen, J. H., Coppola, E., De Cruz, L., Davin, E. L., Dobler, A., Domínguez, M., Fealy, R., Fernandez, J., Gaertner, M. A., García-Díez, M., Giorgi, F., Gobiet, A., Goergen, K., Gómez-Navarro, J. J., Alemán, J. J. G., Gutiérrez, C., Gutiérrez, J. M., Güttler, I., Haensler, A., Halenka, T., Jerez, S., Jiménez-Guerrero, P., Jones, R. G., Keuler, K., Kjellström, E., Knist, S., Kotlarski, S., Maraun, D., van Meijgaard, E., Mercogliano, P., Montávez, J. P., Navarra, A., Nikulin, G., Noblet-Ducoudré, N., Panitz, H. J., Pfeifer, S., Piazza, M., Pichelli, E., Pietikäinen, J. P., Prein, A. F., Preuschmann, S., Rechid, D., Rockel, B., Romera, R., Sánchez, E., Sieck, K., Soares, P. M. M., Somot, S., Srnec, L., Sørland, S. L., Termonia, P., Truhetz, H., Vautard, R., Warrach-Sagi, K., and Wulfmeyer, V.: Regional climate downscaling over Europe: perspectives from the EURO-CORDEX community, Reg. Environ. Change, 20, 51, https://doi.org/10.1007/s10113-020-01606-9, 2020.
Jury, M. W., Prein, A. F., Truhetz, H., and Gobiet, A., Evaluation of CMIP5 models in the context of dynamical downscaling over Europe, J. Climate, 28, 5575–5582, https://doi.org/10.1175/JCLI-D-14-00430.1, 2015.
Khan, M. S., Coulibaly, P., and Dibike, Y.: Uncertainty analysis of statistical downscaling methods, J. Hydrol., 319, 357–382, https://doi.org/10.1016/j.jhydrol.2005.06.035, 2006.
Kirshbaum, D. J., Adler, B., Kalthoff, N., Barthlott, C., and Serafin, S.: Moist orographic convection: Physical mechanisms and links to surface-exchange processes, Atmosphere, 9, 80, https://doi.org/10.3390/atmos9030080, 2018.
Klein Tank, A. M. G., Wijngaard, J. B., Können, G. P., Böhm, R., Demarée, G., Gocheva, A., Mileta, M., Pashiardis, S., Hejkrlik, L., Kern-Hansen, C., and Heino, R.: Daily dataset of 20th-century surface air temperature and precipitation series for the European Climate Assessment, Int. J. Climatol., 22, 1441–1453, https://doi.org/10.1002/joc.773, 2002.
Klok, E. J. and Klein Tank, A. M. G.: Updated and extended European dataset of daily climate observations, Int. J. Climatol., 29, 1182–1191, https://doi.org/10.1002/joc.1779, 2009.
Knist, S., Goergen, K., and Simmer, C.: Evaluation and projected changes of precipitation statistics in convection-permitting WRF climate simulations over Central Europe, Clim. Dynam., 55, 325–341, https://doi.org/10.1007/s00382-018-4147-x, 2020.
Kotlarski, S., Keuler, K., Christensen, O. B., Colette, A., Déqué, M., Gobiet, A., Goergen, K., Jacob, D., Lüthi, D., van Meijgaard, E., Nikulin, G., Schär, C., Teichmann, C., Vautard, R., Warrach-Sagi, K., and Wulfmeyer, V.: Regional climate modeling on European scales: a joint standard evaluation of the EURO-CORDEX RCM ensemble, Geosci. Model Dev., 7, 1297–1333, https://doi.org/10.5194/gmd-7-1297-2014, 2014.
Laprise, R.: Regional climate modelling, J. Comput. Phys., 227, 3641–3666, https://doi.org/10.1016/j.jcp.2006.10.024, 2008.
Leung, L. R., Mearns, L. O., Giorgi, F., and Wilby, R. L.: Regional climate research: Needs and opportunities, B. Am. Meteorol. Soc., 84, 89–95, 2003.
Lhotka, O., Kyselý, J., and Plavcová, E.: Evaluation of major heat waves' mechanisms in EURO-CORDEX RCMs over Central Europe, Clim. Dynam., 50, 4249–4262, https://doi.org/10.1007/s00382-017-3873-9, 2018.
McGregor, J. L.: Regional climate modelling, Meteorol. Atmos. Phys., 63, 105–117, https://doi.org/10.1007/BF01025367, 1997.
McSweeney, C. F., Jones, R. G., Lee, R. W., and Rowell, D. P.: Selecting CMIP5 GCMs for downscaling over multiple regions, Clim. Dynam., 44, 3237–3260, https://doi.org/10.1007/s00382-014-2418-8, 2015.
Meehl, G. A., Stocker, T. F., Collins, W. D., Friedlingstein, P., Gaye, A. T., Gregory, J. M., Kitoh, A., Knutti, R., Murphy, J. M., Noda, A., and Raper, S. C.: Global climate projections In Climate Change 2007: The Physical Science Basis, Contribution of Working Group I to the Fourth Assessment Report of the Intergovernmental Panel on Climate Change, edited by: Solomon, S., Qin, D., Manning, M., Chen, Z., Marquis, M., Averyt, K. B., Tignor, M., Miller, H. L., Cambridge University Press, Cambridge, UK and New York, NY, TRN: GB07CC205, 2007.
Minder, J. R., Letcher, T. W., and Skiles, S. M.: An evaluation of high-resolution regional climate model simulations of snow cover and albedo over the Rocky Mountains, with implications for the simulated snow-albedo feedback, J. Geophys. Res.-Atmos., 121, 9069–9088, https://doi.org/10.1002/2016JD024995, 2016.
Perkins, S. E., Pitman, A. J., Holbrook, N. J., and McAneney, J.: Evaluation of the AR4 climate models’ simulated daily maximum temperature, minimum temperature, and precipitation over Australia using probability density functions, J. Climate, 20, 4356–4376, https://doi.org/10.1175/JCLI4253.1, 2007.
Pichelli, E., Coppola, E., Sobolowski, S., Ban, N., Giorgi, F., Stocchi, P., Alias, A., Belušić, D., Berthou, S., Caillaud, C., and Cardoso, R. M.: The first multi-model ensemble of regional climate simulations at kilometer-scale resolution part 2: historical and future simulations of precipitation, Clim. Dynam., 56, 3581–3602, https://doi.org/10.1007/s00382-021-05657-4, 2021.
Prein, A. F., Gobiet, A., Suklitsch, M., Truhetz, H., Awan, N. K., Keuler, K., and Georgievski, G.: Added value of convection permitting seasonal simulations, Clim. Dynam., 41, 2655–2677, https://doi.org/10.1007/s00382-013-1744-6, 2013.
Prein, A. F., Langhans, W., Fosser, G., Ferrone, A., Ban, N., Goergen, K., Keller, M., Tölle, M., Gutjahr, O., Feser, F., and Brisson, E.: A review on regional convection-permitting climate modeling: Demonstrations, prospects, and challenges, Rev. Geophys., 53, 323–361, https://doi.org/10.1002/2014RG000475, 2015.
Prein, A. F., Gobiet, A., Truhetz, H., Keuler, K., Goergen, K., Teichmann, C., Maule, C. F., Van Meijgaard, E., Déqué, M., Nikulin, G., and Vautard, R.: Precipitation in the EURO-CORDEX 0.11∘ and 0.44∘ simulations: high resolution, high benefits?, Clim. Dynam., 46, 383, https://doi.org/10.1007/s00382-015-2589-y, 2016.
Randall, D. A., Wood, R. A., Bony, S., Colman, R., Fichefet, T., Fyfe, J., Kattsov, V., Pitman, A., Shukla, J., Srinivasan, J., and Stouffer, R. J.: Climate models and their evaluation. In Climate change 2007: The physical science basis. Contribution of Working Group I to the Fourth Assessment Report of the Intergovernmental Panel on Climate Change, edited by: Solomon, S., Qin, D., Manning, M., Chen, Z., Marquis, M., Averyt, K. B., Tignor, M., and Miller, H. L., Cambridge University Press: Cambridge, UK and New York, NY, TRN: GB07CC205, 2007.
Prömmel, K., Geyer, B., Jones, J. M., and Widmann, M.: Evaluation of the skill and added value of a reanalysis-driven regional simulation for Alpine temperature, Int. J. Climatol., 30, 760–773, https://doi.org/10.1002/joc.1916, 2010.
Rios-Entenza, A., Soares, P. M. M., Trigo, R. M., Cardoso, R. M., and Miguez-Macho, G.: Precipitation recycling in the Iberian Peninsula: spatial patterns and temporal variability, J. Geophys. Res.-Atmos., 119, 5895–5912, https://doi.org/10.1002/2013JD021274, 2014.
Rummukainen, M.: State-of-the-art with regional climate models, Wires Clim. Change, 1, 82–96, https://doi.org/10.1002/wcc.8, 2010.
Rummukainen, M.: Added value in regional climate modeling, Wires Clim. Change, 7, 145–159, https://doi.org/10.1002/wcc.378, 2016.
Schulzweida, U.: Climate Data Operators, User's Guide, Version 1.1.9, Max-Planck Institute for Meteorology, Hamburg, Germany, https://code.mpimet.mpg.de/projects/cdo/embedded/cdo.pdf, last access: 29 April 2021.
Smiatek, G., Kunstmann, H., and Senatore, A.: EUROCORDEX regional climate model analysis for the Greater Alpine Region: Performance and expected future change, J. Geophys. Res.-Atmos., 121, 7710–7728, https://doi.org/10.1002/2015JD024727, 2016.
Soares, P. M. and Cardoso, R. M.: A simple method to assess the added value using high-resolution climate distributions: application to the EURO-CORDEX daily precipitation, Int. J. Climatol., 38, 1484–1498, https://doi.org/10.1002/joc.5261, 2018.
Soares, P. M., Cardoso, R. M., Miranda, P. M., de Medeiros, J., Belo-Pereira, M., and Espirito-Santo, F: WRF high resolution dynamical downscaling of ERA-Interim for Portugal, Clim. Dynam., 39, 2497–2522, https://doi.org/10.1007/s00382-012-1315-2, 2012a.
Soares, P. M., Cardoso, R. M., Miranda, P. M., Viterbo, P., and Belo-Pereira, M.: Assessment of the ENSEMBLES regional climate models in the representation of precipitation variability and extremes over Portugal, J. Geophys. Res.-Atmos., 117, D07114, https://doi.org/10.1029/2011JD016768, 2012b.
Soares, P. M., Cardoso, R. M., Semedo, Á., Chinita, M. J., and Ranjha, R.: Climatology of the Iberia coastal low-level wind jet: weather research forecasting model high-resolution results, Tellus A, 66, 22377, https://doi.org/10.3402/tellusa.v66.22377, 2014.
Smiatek, G., Kunstmann, H., and Senatore, A.: EURO-CORDEX regional climate model analysis for the Greater Alpine Region: Performance and expected future change, J. Geophys. Res.-Atmos., 121, 7710–7728, https://doi.org/10.1002/2015JD024727, 2016.
Stocker, T. F., Qin, D., Plattner, G. K., Tignor, M. M., Allen, S. K., Boschung, J., Nauels, A., Xia, Y., Bex, V., and Midgley, P. M. (Eds.): Climate Change 2013: The physical science basis. contribution of working group I to the fifth assessment report of IPCC the intergovernmental panel on climate change, Cambridge University Press, Cambridge, United Kingdom and New York, NY, USA, https://doi.org/10.1017/CBO9781107415324, 2014.
Terzago, S., von Hardenberg, J., Palazzi, E., and Provenzale, A.: Snow water equivalent in the Alps as seen by gridded data sets, CMIP5 and CORDEX climate models, The Cryosphere, 11, 1625–1645, https://doi.org/10.5194/tc-11-1625-2017, 2017.
Torma, C., Giorgi, F., and Coppola, E.: Added value of regional climate modeling over areas characterized by complex terrain – Precipitation over the Alps, J. Geophys. Res.-Atmos., 120, 3957–3972, https://doi.org/10.1002/2014JD022781, 2015.
van der Linden, P. and Mitchell, J. E.: ENSEMBLES: Climate Change and its Impacts: Summary of research and results from the ENSEMBLES project, Met Office Hadley Centre, FitzRoy Road, Exeter EX1 3PB, UK, 160 pp., 2009.
Vautard, R., Gobiet, A., Jacob, D., Belda, M., Colette, A., Déqué, M., Fernández, J., García-Díez, M., Goergen, K., Güttler, I., and Halenka, T.: The simulation of European heat waves from an ensemble of regional climate models within the EURO-CORDEX project, Clim. Dynam., 4, 2555–2575, https://doi.org/10.1007/s00382-013-1714-z, 2013.
Vautard, R., Kadygrov, N., Iles, C., Boberg, F., Buonomo, E., Buelow, K., Coppola, E., Corre, L., van Meijgaard, E., Nogherotto, R., Sandstad, M., Schwingshakl, C., Somot, S., Aalbers, E. E., Christensen, O., Ciarlo, J., Demory, M.-E., Giorgi, F., Jacob, D., Jones, R. G., Keuler, K., Kjellström, E., Lenderink, G., Levavasseur, G., Nikulin, G., Sillmann, J., Solidoro, C., Sørland, S., Steger, C., Teichmann, C., Warrach-Sagi, K., and Wulfmeyer, V.: Evaluation of the large EURO-CORDEX regional climate model ensemble, J. Geophys. Res.-Atmos., 126, 1–28, https://doi.org/10.1029/2019JD032344, 2020.
Wilby, R. L., Wigley, T. M. L., Conway, D., Jones, P. D., Hewitson, B. C., Main, J., and Wilks, D. S.: Statistical downscaling of general circulation model output: A comparison of methods, Water Resour. Res., 34, 2995–3008, https://doi.org/10.1029/98WR02577, 1998.
Williams, D. N., Taylor, K. E., Cinquini, L., Evans, B., Kawamiya, M., Lautenschlager, M., Lawrence, B., Middleton, D., and ESGF Contributors: The Earth System Grid Federation: Software framework supporting CMIP5 data analysis and dissemination, ClIVAR Exchanges, 56, 40–42, http://centaur.reading.ac.uk/25732/1/WilEA11_CE.pdf (last access: 29 April 2021), 2011.
Zappa, G., Shaffrey, L. C., and Hodges, K. I.: The ability of CMIP5 models to simulate North Atlantic extratropical cyclones, J. Climate, 26, 5379–5396, https://doi.org/10.1175/JCLI-D-12-00501.1, 2013.